
by Greg Goodman
Update added at end of article
Running means are often used as a simple low pass filter (usually without understanding its defects). Often it is referred to as a “smoother”.
In fact it does not even “smooth” too well either since it lets through enough high frequencies to give a spiky result.
Running means are fast and easy to implement. Since most people have some understanding of what an average does, the idea of a running average seems easily understood. Sadly it’s not that simple and running averages often cause serious corruption of the data.
So it smooths the data to an extent, but what else does it do?
The problem with an evenly weighted average is that the data is effectively masked by a rectangular window. The frequency response of such a rectangular window is the sinc function [1] and thus the effect on the frequency content of the data is to apply the sinc function as a frequency filter. The sinc function oscillates and has negative lobes that actually invert part of the signal it was intended to remove. This can introduce all sorts of undesirable artefacts into the data.
An example of one of the problems can be seen here:

Figure 1 Comparing effects of different filters on a climate data time series ( 60 month running mean vs 30m triple running mean [blue] ).
It can be noted that the peaks and troughs in the running mean are absolutely wrong. When the raw data has a peak the running mean produces a trough. This is clearly undesirable.
The data is “smoother” than it was but its sense is perverted. This highlights the difference between simply “smoothing” data and applying appropriately chosen low-pass filter. The two are not the same but the terms are often thought to be synonymous.
Some other filters, such as the gaussian, are much more well behaved, however a gaussian response is never zero, so there is always some leakage of what we would like to remove. That is often acceptable but sometimes not ideal.

figure 2 showing the magnitude of the frequency response. However, it should be noted that the sign of every other lobe of running mean is negative in sign, actually inverting the data.
Below is a comparison of two filters ( running mean and gaussian ) applied to some synthetic climate-like data generated from random numbers. Click to see the full extent of the graph.

Figure 3. Showing artefacts introduced by simple running mean filter.
As well as the inversion defect, which is again found here around 1970, some of the peaks get bent sideways into an asymmetric form. In particular, this aberration can be noted around 1958 and 1981. In comparing two datasets in order to attribute causation or measure response times of events, this could be very disruptive and lead to totally false conclusions.
Another solution is to improve the running mean’s frequency response.
The sinc function has the maximum of the troublesome negative lobe at πx=tan(πx). Solving this gives x=1.3371…..
Now if a second running mean is passed after the first one with a period shorter by this ratio, it will filter out the the inverted data…. and produce another, smaller, positive lobe.
A similar operation will kill the new lobe and by this stage any residual problems are getting small enough that they are probably no longer a problem.
The triple running mean has the advantage that it has a zero in the frequency response that will totally remove a precise frequency as well letting very little of higher frequencies through. If there is a fixed, known frequency to be eliminated, this can be a better choice than a gaussian filter of similar period.
The two are shown in the plot above and it can be seen that a triple running mean does not invert the peaks as was the case for the simple running mean that is commonly used.
Example.
With monthly data it is often desirable to remove an annual variation. This can be approximated by the 12,9.7 triple RM shown:
12 / 1.3371 = 8.9746
12 / 1.3371 / 1.3371 = 6.712
It can be seen the second stage is pretty accurate but the final one is rather approximate. However, the error is not large in the third stage.
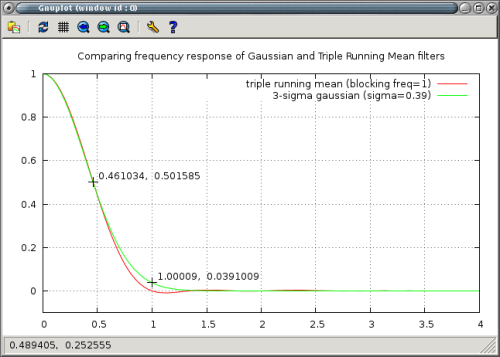
Figure 4. Comparing frequency response of gaussian and triple running mean filters.
A similar operation on daily data would use: 365, 273, 204
365.242 / 1.3371 = 273.29
365.242 / 1.3371 / 1.3371 = 204,39
Another advantage is that the data from r3m filter really is “smooth” since it does not let past some high frequencies that a simple running mean does. If the aim is simply to “smooth” the data, rather than target a specific frequency, a r3m filter with half the nominal width often gives a smoother result without losing as much information, as was shown in figure 1.
This defect in the smoothing can be seen in the example plot. For example, there is a spike near 1986 in the simple running mean. Worst of all this is not even a true spike in the data that is getting through the filter, it is an artefact.
Another example is the official NOAA [2] presentation of sun spot number (SSN) taken from SIDC [3], examined here:
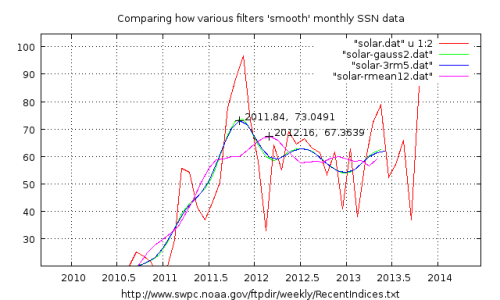
In 2004, Svalgaard et al published a prediction of the cycle 24 peak [4]. That prediction has proved to be remarkably accurate. It would be even more remarkable if SIDC were to apply a “smoothing” filter that did not invert and displace the peak and reduce its value.
Using direct polar field measurements, now available
for four solar cycles, we predict that the approaching solar cycle 24 (~2011 maximum) will have a peak smoothed monthly sunspot number of 75 ± 8, making it potentially the smallest cycle in the last 100 years.
SIDC processing converts a later trough into the peak value of cycle 24. The supposed peak aligns with the lowest monthly value in the last 2.5 years of data. Clearly the processing is doing more than the intended “smoothing”.
The filter used in this case is a running mean with the first and last points having reduced weighting. It is essentially the same and shares the same defects. Apparently the filter applied to SIDC data was introduced by the Zürich observatory at the end of the 19th century when all these calculations had to be done by hand ( and perhaps the defects were less well understood ). The method has been retained to provide consistency with the historical record. This practise is currently under review.
While it may have been a reasonable compromise in 19th century, there seems little reason other than ignorance of problems for using simple running mean “smoothers” in the 21st century.
Conclusion
Referring to a filter as a “smoother” is often a sign that the user is seeking a visual effect and may be unaware that this can fundamentally change the data in unexpected ways.
Wider appreciation of the corruption introduced by using running mean filters would be beneficial in many fields of study.
Refs.
[1] Plot of sinc function http://mathworld.wolfram.com/SincFunction.html
[2] NOAA/Space Weather Prediction Centerhttp://www.swpc.noaa.gov/SolarCycle/index.html
[3] SIDC sunspot data: http://sidc.oma.be/sunspot-data/
SIDC readme: http://sidc.oma.be/html/readme.txt
SIDC applies a 13 point running mean with first and last points weighted 50%. This is a slight improvement on a flat running mean but shares the same tendancy to invert certain features in the data.
[4] Svalgaard, L.,E. W. Cliver, and Y. Kamide (2005), Sunspot cycle 24: Smallest cycle in 100 years?, Geophys. Res. Lett., 32, L01104, doi:10.1029/
2004GL021664.http://www.leif.org/research/Cycle%2024%20Smallest%20100%20years.pdf
Appendix
Scripts to automatically effect a triple-running-mean are provided here: http://climategrog.wordpress.com/2013/11/02/triple-running-mean-script/
Example of how to effect a triple running mean on Woodfortrees.org : http://www.woodfortrees.org/plot/rss/from:1980/plot/rss/from:1980/mean:60/plot/rss/from:1980/mean:30/mean:22/mean:17
Example of triple running mean in spread sheet: https://www.dropbox.com/s/gp34rlw06mcvf6z/R3M.xls
Biosketch: Greg Goodman (gg) has a graduate degree in applied physics, professional experience in spectroscopy, electronics and software engineering, including 3-D computer modelling of scattering of e-m radiation in the Earth’s atmosphere. Greg’s previous posts at Climate Etc.:
JC note: This post was sent to me via email. As with all guest posts, please keep your comments relevant and civil.
UPDATE
[Update]
The main object of this article was to raise awareness of the strong, unintentional distortions introduced by the ubiquitous running mean “smoother”.
Filter design is a whole field of study in itself, of which even an introduction would be beyond the scope of this short article. However, it was also an aim to suggest some useful replacements for the simple running-average and to provide implementations that can easily be adopted. To that end a small adjustment has been made to the r3m.sh script provided and another higher quality filter is introduced:
http://climategrog.wordpress.com/?attachment_id=659
A script to implement a low-pass Lanczos filter is provided here:
http://climategrog.wordpress.com/2013/11/28/lanczos-filter-script/
An equivalent high-pass filter is provided here:
http://climategrog.wordpress.com/2013/11/28/lanczos-high-pass-filter/
High-pass filters may be used, for example, to isolate sub-annual variability to investigate the presence or absense of a lunar infulence in daily data.
An example is the 66 day filter used in this analysis:
http://climategrog.wordpress.com/?attachment_id=460
The following points arose in discussion of the article.
Vaughan Pratt points out that shortening the window by a factor of 1.2067 (rather than 1.3371 originally suggested in this article) reduces the stop-band leakage. This provides a useful improvement.
Further optimisation can be attained by reducing negative leakage peaks at the cost of accepting slightly more positive leakage. Since the residual negative peaks are still inverting and hence corrupting the data, this will generally be preferable to simply reducing net residuals irrespective of sign.
The “asymmetric” triple running-mean is shown in the comparison of the frequency responses along with a Lanczos filter, here:
http://climategrog.wordpress.com/?attachment_id=660
The Pratt configuration and the “asymmetric 3RM” result in identical results when set to remove the annual cycle from monthly data. Both result in a choice of 8,10 and 12 month windows.
These difference will have an effect when filtering longer periods or higher resolutions, such as daily data.
If this is implemented in a spreadsheet, it should be noted that each average over an even interval will result in a 0.5 month shift in the data since it is not correctly centred. In a triple running-mean this results in 1.5 months shift with respect to the original data.
In this case the 1.3371 formula originally suggested in the article, giving 12,9,7 month averages and producing just one 0.5 month lag, may be preferable.
None of these issues apply if the scripts provided accompanying the article are used, since they all correctly centre the data.
A more technical discussion of cascading running-mean filters to achieve other profiles can be found in this 1992 paper, suggested by Pekka Pirilä and should serve as a starting point for further study of the technique.
http://www.cwu.edu/~andonie/MyPapers/Gaussian%20Smoothing_96.pdf

Very clear and useful, thanks. A long overdue post. Many of us look at these graphs and and read comments between various posters knowledgeable about statistics, but for me it all seemed to be a form of black magic. This sort of educate the masses post that helps those of us who got turned off statistics at school but who now want to learn more to help us understand climate posts and arguments better, is most welcome.
Nothing is better than actual real data.
I don’t care how you smooth the data if you also give me the actual data without smoothing.
That seems too simple a statement. Is it inherently better to have just “actual real data” if your analytical purpose is to look at temperature trends for an hour, a day, a week, a month, a season, a year?
While I agree in principal, just give me the data, it is quite possible that intelligent use of filtering (not visual “smoothing”) may be necessary.
If you want to study small inter-annual change tenths of degree per century, in the presence of a strong annual cycle. ~10K S/N will be very low and the annual signal will swamp many techniques. (eg FFT) and degrade the accuracy.
So, yes simplistic to the point of being ill-informed.
The actual data is temperature, in air above land or below water – somehow those are deemed comparable. What we get is temperature anomaly from something determined to be the “usual”, with historical data which has been adjusted to account for purported errors due to changes in measuring methods.
So we are trying to compare historical temperature anomaly, smoothed, with a GCM output which includes internal random number generation, manipulated to an anomaly, then smoothed.
Surely it is a complete shamozzle. Is it time some new started completely from scratch? I read somewhere people like John Chirsty suggesting global temperature anomaly is the wrong thing to use to measure global warming – some other measure of energy was more appropriate.
I spent 1963 to 2007 working with data fore NASA spaceflight programs and I can do my own analysis of data. If I get something that has been messed with before I get it, I can never know what they did to the data to support their Bias, whatever it was and never know what the actual data showed. I am left with Hockey Stick Output or Worse.
Do your filtering or tricks or whatever and show me the output, but give me the Actual data so I can see if you screwed up or lied or just did not understand, there is a huge lot of just do not understand.
Fully agree on that. If we had daily data rather than deseasonalised year averages of anomalies of monthly averages, I’m sure we’d have made a lot more progress, long ago.
I’m glad you found it clear, it’s always difficult explaining something you know well to others who have a different background.
This is signal processing more that stats, but one thing I should have added is that averaging is a valid way to reduce the amplitude gaussian distributed (ie random) noise. It is not valid in the presence of cyclic variations. That is why averages (running or otherwise don’t work too well).
Greg
It would be interesting to use the same sample-say your first wood for trees graphic-and graph it according to the 4 or 5 different methods commonly used.
Would the end results all look reasonably alike or totally different?
tonyb
Could you be more specific about the 4 or 5 different methods commonly used? I can’t really answer an undefined question.
As a follow up, taking the average (of 12 readings for example) is the same as doing a running mean and then sub-sampling every twelfth point.
Re-sampling without passing an anti-aliasing filter is a second error.
To accurately sub-sample data, the correct procedure is to pass a 2*N month filter (eg 3RM or gaussian) then take every Nth point.
ie for monthly data, to reduce monthly to annual data series 24 month filter, then take every 12th point.
I can’t recall ever seeing that being done on climate data. :(
There’s much good information in the post, but some warnings may also be appropriate here.
Every manipulation of data has its own weaknesses. Some are found useful in certain set of applications, but none is good in all applications.
Using disjoint averages has the advantage that no autocorrelation is introduced by the manipulation (some may exist in the original data), but it may have other problems. Using a 24 month 3RM or a gaussian of a similar width and picking every 12th point does introduce extra autocorrelation and does weight differently each monthly value. The whole series weights some months more than other months. That may be acceptable in some applications, but certainly not always.
The spectral properties of the filter are again very important in some applications, but of little importance in others.
The specific filter presented in the post has the advantage that one of the steps is taking average over the full year, i.e. over the known period of climatic data, but it has the disadvantage common to all filters that it introduces autocorrealtions over a period of 26 months. This may be a more important negative factor than the positive significance of good spectral properties. This may also lead to misleading visual impression of significance as the smoothness of the resulting curve may often be interpreted to indicate that some visible features would be significant even when they are just normal noise.
Pekka, How do you determine if the 26 month autocorrelation is due to methods or inherent to the system? I have been using a 27month smooth instead of 12/13 month since there should be a 27-30 month internal cycle, aka QBO.
All filters should be understood to distort the original data. The point is to fully understand what they are doing to the data and determine whether this distortion is the desired (or at least acceptable) result.
How one interprets the result is what can be misleading.
It is true that gaussian low-pass does such a good job of “smoothing” the data that a naive viewer could imagine sinusoidal curves everywhere. When you try to identify exactly what frequencies are there you may find there aren’t any!
That is not because gaussian is “misleading”, it what happens when you chose to remove higher frequencies and you do so effectively. The error is in the eye ( or the mind ) of the beholder, not in the data nor the filter.
” … it has the disadvantage common to all filters that it introduces autocorrealtions over a period of 26 months. This may be a more important negative factor than the positive significance of good spectral properties. ”
Sure, any convolution filter will increase autocorrelation, almost by definition. Could you give an example where this is more of a negative than selecting a filter that does not introduce outrageous artefacts.
I find it hard to imagine but that may be due to a limited domain of application. Always willing to learn.
The issue is that much of the data that spans years already includes filtering of some sort. The providers of the data routinely do this because the seasonal variation on certain parameters can nearly swamp the multi-year trends that we are interested in for climate studies.
As an example, from the residual fit of a CSAT model, I can still detect a weak yearly signal at the 12-month value in this power spectrum.
http://img6.imageshack.us/img6/353/cuwn.gif
In this case, the GISS temperature filtering is likely not a sync and some of the yearly seasonal modulation has bled through.
So when we do another filter of the already filtered data, we should realize that we are often actually doing a 12-12 double convolution.
As a contrast, the Mauna Loa data is provided as is, and this is nice because we can look at what the seasonal contribution looks like — particularly if we take the derivative, which isolates the seasonal contribution from the convolution integral of the anthropogenic forcing.
http://woodfortrees.org/plot/esrl-co2/derivative
No data is “as is” ;)
MLO is monthly average, which is a problem if there is lunar effect around 27 days.
If you ask real nice, they may give you a copy of daily. I think Tim Channon said they even gave him some raw hourly data to check.
After QA removes days when the wind is blowing in the wrong way there are quite a lot of gaps, so an average is one solution. However, some months it’s a lop sided average. No nice answers.
Glad you’re getting into dCO2.
d/dt(CO2) is interesting, especially w.r.t. AO and SST.
http://climategrog.wordpress.com/?attachment_id=231
http://climategrog.wordpress.com/?attachment_id=233
WHT says
Hell, it goes much further than that. Take satellite temperatures.
UAH/RSS include multiple polar-orbiting satellites. Let’s assume for pretend that they are all perfectly cross calibrated and any individual temperature reading needs no adjustment.
Each polar orbiting satellite makes 16 orbits a day or something like that (per wiki), going over the poles roughly every 90 minutes. Each image covers a small portion of the area under that orbit, all at different positions and different times of day. The orbits all move a little bit with respect to the earth’s axis every day and so need a diurnal drift correction (because on different days they will pass over different parts of the earth at different times).
Even back before the Aqua satellite’s Channel 5 failed, each daily absolute temperature reading was a spatial and temporal patchwork quilt.
You apply some sort of spatio-temporal “filter” to get a daily reading. You apply another one to include multiple satellites. You apply one to get a monthly absolute value. You apply another, seasonal one (WHTs point) to get to an anomaly.
Right, you have to stay on top of this to debunk all that bizarre theorizing that is coming out of the Murry Salby camp, currently being pushed by Lord Monkton and company at WUWT.
Current day CO2 growth is predominately an anthropogenic process, with a moderate positive feedback caused by the outgassing from warming water temperatures. That is why the derivative features pop out, mainly from seasonal variations, but a slight addition from the long-term trend.
So far I have seen anything written from Salby, so I reserve judgement until he goes public with something concrete that can be verified or falsified. The world tour of lectures is starting to seem a bit hollow in the absence of a written work.
I left comments on conundrum about you model but you don’t seem to be following it any more.
I think that is right approach though frankly the result was unconvincing.
coming here and making assertive statements of fact is as convincing as a Salby lecture. ;)
After I did the analysis, I realized that one of Keeling’s students studied the outgassing of other gases such as Argon using the same kind of phase plots that I was looking at.
http://bluemoon.ucsd.edu/publications/tegan/Blaine_thesis.pdf
The only question is how much of the seasonal and secular outgassing is due to the ocean warming and how much due to biotic processes. The reason people aren’t that excited about this overall is that these are second-order processes in contrast to the first-order growth of anthropogenic CO2. And it is definitely not a negative feedback.
Webby
You wrote:
“Outgassing from warmer water temperatures” would men less CO2 in the ocean as it slowly warms, yet we have this panic about “ocean acidification” from more CO2 in the ocean.
Which one is it, Webby?
And why is it that the fraction of the CO2 emitted by humans which remains in the atmosphere has decreased since Mauna Loa measurements started in the late 1950s – by around 1% point per decade or ~5% in total (rather than increased due to warmer oceans)?
This tells us that something is gobbling up that extra CO2 – and it is very unlikely to be the slightly warmer ocean.
Increased plant growth?
Hmmm.
Max
manaker, it must have been you that posted a graph of that recently , could you link it again, please.
BTW ocean _could_ be absorbing a greater proportion if the system is getting further away from equilibrium, even though warming tends in the other direction.
manacker, while your argument nails Salby, it doesn’t apply to conventional chemistry where the ratio of CO2 in the water versus air is what is controlled. Hence more in the air means more in the water, but this ratio changes with temperature, so the fraction absorbed by water is less when it is warmer. This reduction is fraction can be seen as outgassing, but the net flow is still in, hence acidification.
thanks Jim.
a lot people seem to have trouble seeing how oceans can outgas and absorb at the same time. The two effects are superimposed and can be modelled separately.
Biosphere will be acting as neg f/b also a Max says.
My background, as a young man, was business management of a number of international offices via a dozen or so metrics reported weekly. On the upside , never ever was data allowed to be manipulated, smoothed, averaged, gaussed, krigged, or anything else. If I wanted to look at more data, I called for two-year or five-year graphs, scaled appropriately. I always insisted on graphs with no trend lines overlaid. (This all was in the days before it became so easy to have computers represent and misrepresent, on command, any time series one cared to construct.) The metrics had to be something that could actually be counted or measured directly. It worked, to some degree, as long as the reported data was not falsified at the origin.
GG is absolutely right, once the data has been touched and changed in any way, it has been corrupted.
CliSci has seen long ongoing, still unsettled, scientific arguments and conflicts over “data” that was long ago corrupted by ad-hoc computation and manipulation (smoothing, averaging. mean finding–all for intended good, of course, but now original data is either lost forever or out of ready view) — instead of actual measurements. For example, C&W just recomputed Arctic and Global Average Surface Temperatures by a new method of supplying “imaginary” temperature data for areas in which temperature was not measured — and then CliSci starts arguing about the imaginary new data set of the imaginary GAST data set, itself made up of overly computed (corrupted) imaginary (computed, not measured) data.
Only the real actually-measured data is DATA. Averaged data is no longer *real* data, but slips into the realm of the imaginary–in that it exists only in our minds.
The idea that finding the means of data sets themselves made up of found means and then averaging the results in some new and unique way does not, in my opinion, represent scientific advance.
Kip Hansen, you are a Dilbert-like caricature of a boss. If I worked for you , I would dump a bunch of diffraction pattern data or other unprocessed spectroscopic data on your desk and let you figure it out. ha ha.
Can anyone here interpret this from WebHub etc for me? (or is it just babbling?)
“Kip Hansen, you are a Dilbert-like caricature of a boss. If I worked for you , I would dump a bunch of diffraction pattern data or other unprocessed spectroscopic data on your desk and let you figure it out. ha ha.”
A rough interpretation:
> If I worked for you , I would dump a bunch of diffraction pattern data or other unprocessed spectroscopic data on your desk and let you figure it out.
“Your comment makes little sense in a situation with lots of noise.”
***
> you are a Dilbert-like caricature of a boss. ha ha.
“You’re a joke. I don’t like you.”
Hope this helps.
The irony is that consensus climate science is a Dilbert boss.
=============
On the Internet, everybody is either somebody else’s Dilbert boss or Dogbert.
Truthfully, I’m flattered.
I don’t think I’ve ever met Mr. WebHubetc and he already doesn’t like me….which may be good.
He doesn’t have to worry about me being his boss — one, I’m retired from business management (about 30 years ago) and two, people with his communications style didn’t last long in my outfit (about three days was the record, I think.)
Kip, you would last 0 hours at a research lab such as IBM Watson, considering that you pull stunts like your post at WUWT comparing climate science to magic tricks.
http://wattsupwiththat.com/tag/magic/
Mr. WebHubetc ==> How in the world did your guess? I did work at IBM at the research group in Hawthorne, in the Advanced Internet Technologies Group — great fun! We built the first massively interactive massively scalable mega-volume web sites for the Olympic Games and the Tennis Grand Slams, Masters Golf Tournament, etc.
[[ And we did jettison people from our unit for having attitudes like those you have exhibited here towards me. ]]
Kip Hansen, So you were a coder, LOL.
I spent time there doing published science.
No wonder you troll these sites, bitter about the PhDs around you actually publishing interesting material. I remember the lab techs and their bitterness.
WebHubetc ==> So, give me your name and I’ll look up your work — maybe it will be interesting.
My one lousy IBM patent is still making Big Blue lots of money.
I will let you seethe, LOL.
I have nothing but good things to say about the scientists with advanced degrees who are dedicated to figuring out how the natural world works.
No magic, just a lot of hard work.
Typical religious zealot, adopting a holier than thou attitude.
Forgive my disbelief, WebHubetc. None of the real PhD’d research scientists I knew had the emotional attributes of your average ‘tweenage schoolyard bully, and even if they did, they had the good sense not to proudly display the fact in public, as you have done.
Thanks , I’ll have a look at that later.
If you are going to take an average, use a prime-number of points, 13 is way better than 12.
Any particular reason?
@DM: If you are going to take an average, use a prime-number of points, 13 is way better than 12.
@GG: Any particular reason?
One reason would be that primes always have succinct certificates. Google “succinct certificate” for more details.
Gregg, which highlights the joys of paleo. Every paleo proxy has some type of natural smoothing but the directions aren’t on the box. With a proxy that has greater than 60 year natural smoothing you get the negative lobes even if you “slice” the proxy to high frequency resolution. You end up getting stuck with trial and error smoothing to hopefully find the “right” correlation.
To some flat is the “right” correlation.
Very amusing Capt.
Rest assured nature won’t be applying “box-car” smoothers. It may be more like gaussian low-pass if you like or more likely an exponential decayed response in the case of linear relaxation processes.
Tree rings look to be Gaussian and should be Gaussian, but the health of a tree is determined early so they can be skewed, ex. split bark. Solar reconstructions a very likely skewed as are most others where instrumentation improves with technology and proxy quality degrades with age.
‘There is a lot of statistical power to manipulate and make the data say what it needs to say’.
H/t Robert Way, and his insouciant grasp of the truth.
==========
“statistical power”
Layman’s term for “you can make sh*t up.”
Andrew
Cappy, nature can’t violate causality so that it can’t do a symmetric widowing function which could prevent a lagged temporal shift. And nature can’t do an artificially square window filter either. Only man can do this kind of stuff with post-data processing.
This is a CSALT model of the GISS temperature series that uses a triple-running mean which is the convolution of three filters of widows of 12 months, 9 months, and 7 months.
http://img38.imageshack.us/img38/8953/k7tg.gif
The plain window of 12-months is here
http://img163.imageshack.us/img163/1753/z4a.gif
Note that the value of R increases for the triple-running mean but loses some of the details that the 12-month filter retains. Not surprising because the overall window size is increased.
The CSALT model accurately captures the time-series from 1880 to the present day by incorporating only energy parameters, including a stadium wave component.
“Note that the value of R increases for the triple-running mean but loses some of the details that the 12-month filter retains. ”
No, this is not retaining detail, it’s artefacts. Most of the h.f. that it lets’ through gets inverted. The R value tells you what is getting through is not helping.
Look around 2004 and 1968 typical invertion.
This is a complete picture of the difference between a rectangular 12-month filter and a 12-9-7 triple-running mean operating on the CSALT model, including the power spectrum on the residual
http://img819.imageshack.us/img819/6976/zcr.gif
The triple-running mean clearly removes the sync artifacts as is seen in the smooth PSD but I can’t really see any inversions at 2004 and 1968 which may not also be in the model. There might actually be structure around 1995 and 2000 that the triple-running mean filter is removing?
The issue is what is real versus what is an artifact. I think it works both ways. One can remove something that is real by filtering, just as one can introduce an artifact by using the wrong kind of filter.
One objective behind the CSALT model is to discern the attribution of global warming to the CO2 control knob. Anything we can do to remove spurious noise and other artifacts is a good thing. That’s why I think these discussions are useful.
You are correct what I saw around ’68 is in both so the detail is just below what was supposed to be filtered out.
The SPD of residuals makes it pretty clear though, there is some horrible periodicity right across the spectrum that is clearly the artefacts of the filtering used.
[BTW is sinc not sync ;) ]
There a two main lobes that fail in RM, the first is negative that we’ve covered, the second is simple positive leakage. This is why you are seeing some detail getting through. You can see from R that it’s not really doing any good.
What do you mean by that? With the 12-month window the R is 0.979 and with the 12–9-7 the R is 0.983. So I can guess that the R is simply improving with the marginally greater amount of filtering occurring, and it is not actually improving the model fit by much.
Now see what happens if I place a 5-year lag filter on both model and data in this chart:
http://imageshack.us/a/img802/1947/eli.gif
Note that the R goes from 0.979 to 0.998.
That increase to a nearly unity R is mainly an artifact of the underlying trend, but the R does act as a great discriminator to tuning the model, and moreover in comparing multiple models as to which performs better.
Apples and oranges. 12mo RM vs 12mo R3M tells you that you impression that the detail was somehow better was erroneous. It was a “slightly” less good fit.
Obviously neither of those results are comparable to slugging it with a 5 year anything filter.
It was interesting to apply this to you CSALT model. All I see by eye is that it marginally reduced the h.f. leakage but your SPD of residual was a very good demonstration of the less visually obvious distortions that are occurring.
A valuable addition to the discussion.
But Webby, don’t you get that the time/temp series you match to has no physical meaning?
One point that I believe is worth making is that it is possible to extend any low pass filter much further than the 3 poles described above and thus turn it into a full bandpass filter.
If you continue to add stages to the above 3 pole running average you also continue to remove the high pass, digital, artefacts as described (caused in effect by the beating of the initial square wave sampling with the input signal) and thus derive the classic audio/radio analysis circuit in digital form.
The advantage is that it does not require any knowledge or assumptions about data distribution within any given ‘window’ (as it is square wave sampling). This in my mind beats other methodologies which either assume repetitive patterns outside the window or data distributions within it.
RichardLH, “One point that I believe is worth making is that it is possible to extend any low pass filter much further than the 3 poles described above and thus turn it into a full bandpass filter.”
Right and you get a timing shift that can be corrected with a lag. In nature you have similar smoothing with different lags that if considered give you one picture and if not considered give you a flat shaft.
No timing shifts if you use centred outputs for the means.
Correct, using a symmetric convolution kernel will ensure there is no lag.
Physical processes that cause a lag are more likely to be relaxation type responses. This can be modelled by an asymmetric kernel.
Try a 7,9,13 and 27 month running mean comparison with monthly SST data. I am getting a shift. There shouldn’t be a shift, but since the data is already smoothed/averaged, there is a shift that may be due to processing or natural autocorrelation, don’t know.
The running mean calculation of 7mo needs to be centred on 4th point. If you do that, there will be no shift but there may be distortion. See the example in the article of how RM will bend peaks if there is a difference of level each side.
Greg, “The running mean calculation of 7mo needs to be centred on 4th point. If you do that, there will be no shift but there may be distortion. See the example in the article of how RM will bend peaks if there is a difference of level each side.”
Right,I have them properly centered and checked with a random series. What started me on this is seasonal cycles associated with baseline selection. Volcanoes tend to suppress peak solar months which seem to cause the distortion/shift plus NH peaks tend to be larger due to amplification increasing the distortion/shift. The impact is small relative to the signal, but once you start trying to tease out more information with uncertainties like 0.011C, it gets to be comical IMHO.
Post a graph showing what you are seeing. No point is describing it in words. It may be interesting but I’d need to see to comment.
Greg,
https://lh6.googleusercontent.com/-v6jlhP0_HuI/Uo-IKhBJ5CI/AAAAAAAAKk0/lEna71fIxmo/w877-h479-no/baseline+choices.png
Northern SST with 1910-1922 versus 2000-2012 baseline/seasonal cycle. That is of course an exaggeration, and a full period baseline would be preferred, but trying to tease out volcanic impact it can get to be a pain. Plus you have the added wonder of 30N-60N amplification.
Sorry, I’m not really following what you doing/showing here.
Is this temp anom with annual cycle removed based on two different periods. That would seem to make sense with the main plots.
So you have SST – (annual 12m cycle1) and SST – (annual 12m cycle2)
take the diff and you get (annual 12m cycle1) -(annual 12m cycle2) repeated 160 times.
That seems to be you blue line. Where’s the problem?
Greg, “That seems to be you blue line. Where’s the problem?”
If you use the whole time series there is no problem. However, there is that “dimple” that depends on baseline selection which impacts shorter term comparisons like the 1997 to present pause. There is more pause with a satellite era baseline than there is with a 1951-1980 era baseline that had more volcanic influence. There is also different warmest years ever dependent on baseline selection and since the variance changes different 3 sigma years.
In a more normal world, most would realize the limits of the time series and not attempt to get unrealistic error margins.
Actual data represents what did actually happen.
Filtered date represents something that did not actually happen.
This is only useful if it supports your flawed theory and the actual data does not support your flawed theory.
It is true that both gaussian , R3M and even simple box-car all start attenuation even at highest frequencies. Some more complex filters are flatter but this is usually at the expense of pass band ripple.
Sadly , the is no ideal. You need to have some idea of the properties of each filter and chose the one that does best what you need with the least ‘collateral damage’.
Greg: The point I was trying to make is that all higher order filters make assumptions about data distributions inside and/or outside of the ‘window’.
A bandpass filter constructed out of running means has the lowest such assumptions AFAIK.
“If you torture data long enough, it will confess” Ronald Coase
I’ve never understood why so many people like running means. If I want to “smooth” data, I typically average it over a fixed period. For example, average all the data for each year of the UAH data. Then you end up with a point for each year. Does that introduce any spurious values?
Maybe. Probably. But you are always throwing information away with techniques that make the data ‘easier on the eye’.
Only if you don’t plot the original data as well which is therefore not a function of the filter but of the user of the filter.
Jim: “Does that introduce any spurious values?”
In effect what you are doing is sub-sampling a single stage running mean with the similar artefacts as described above.
OK, can you explain how that happens? The data for each average comes only from that period, not outlying periods as in the running average. The effect should be to only remove higher frequencies. I guess if you are looking for a continuous curve, this wouldn’t work, but for correlations, sets of points work just fine.
I covered that briefly above. There’s fuller account in a reply to Pekka , yesterday:
http://judithcurry.com/2013/11/15/interpretation-of-uk-temperatures-since-1956/#comment-416100
All about re-sampling data without anti-alias filter.
But that’s my point. Taking an average over a fixed interval will not resample any point. So, you take the year one data, average it, then plot that point. You take the second year’s data, average it, then plot a point for the second year. There is no resampling, which is, if I understand it, selecting a subset of the data. What I’m describing uses all the data.
When you take an annual average you _are_ selecting a subset of the data. Did you read the link?
But my point was I am not excluding any data (that would be a subset of the entire set.) I’m using all the data available. Also, I’m not using any of the original data twice. I still don’t see how spurious signal can be produced by this method. Their are no negative excursions of the filter as there is with the sinc function.
I would expect the correlation to change since some of the noise has been eliminated, so we wouldn’t be correlating (random) noise with noise.
Jim you are just repeating yourself.
N-point average is _identical_ to N-point RM with N-point subsampling. ie you are using N point anti-alias instead of 2N and you are using a crap filter at that.
Averaging will reduce gaussian distributed noise , it will NOT correctly remove cyclic signals.
Repeating yourself again without trying understand and address that will not make you correct.
OK Greg. I don’t understand. What do you mean when you say it won’t remove cyclic signals. Exactly what cyclic signals are you trying to remove and why are you trying to remove them if they are actual signal?
If you are to sub-sample the data by averaging you are implicitly assuming that there is nothing but random noise since that is what averaging will reduce in an unbiased way.
You seem to have got the impression that averaging is always good and always unbiased. This is a common but completely erroneous idea.
If you have say, a lunar influence of 27.55d period and average every 30d period you will remove most of it (which may be an unintentional mistake) but some fraction will remain. Sometimes it will be from the low end, later from the high end. Wnen you work it out you will have created a false cycle of 674days = 1.85 years.
1/[(1/27.55 – 1/30 )/2] = 674
This is what is called an alias.
Now recall the recent thread about Euan and Clive Best’s refused paper on Tmax and cloud in UK Met Office station data? Well I’ve been digging.
http://climategrog.wordpress.com/?attachment_id=647
You have just asked a question that pointed me to what I was looking for!
That strong spike is the lunar signal. Thank you very much Jim2. You have made a contribution to our understanding of climate today ;)
I think I found the lunar signal in the CSALT residual as well
http://img585.imageshack.us/img585/505/qlb.gif
GG said: If you are to sub-sample the data by averaging you are implicitly assuming that there is nothing but random noise since that is what averaging will reduce in an unbiased way.
This isn’t strictly true. Much climate instrumental data is gathered over the year and as such contains seasonal variations which aren’t random. Averaging the data over the year removes the seasonal signal.
I’m not sure I agree with you that a single running mean over 12 units, then sub-sampling every twelve will retain the same aliasing characteristic as the sinc function. After you do the subsample, it is no longer a running mean.
At any rate, Greg, I think the real takeaway here is that how you process the data depends on what you want out of it. I think we may have been talking past each other to some extent.
I do see what you mean WRT to the lunar example.
A fix mean can’t have all the distortions of the RM since it is only one point. But that one point you get from the average is mathematically identical to one of the N values of the RM, even if you don’t calculate the other N-1.
It is just a case of luck whether you get a peak instead of a trough, vice versa, or you get lucky and get a point which is about right.
Look at the SSN example. If you decide to sample each year centred on October you’d get slight trough value when in fact it’s the peak of the whole cycle and a strong local peak.
So potentially it has all the distorted values of RM and you take a blind draw.
The thing is, you just don’t know.
Is it Greg Goodwin as in the biosketch or Greg Goodman as in the name at the top of the article?
tonyb
yikes name mix up
Judith
Just send the large editors fee to the usual place
tonyb
A tweet from Matt Briggs:
And on the same subject…(Most) Everything Wrong with Time Series http://wmbriggs.com/blog/?p=9668
Do not smooth times series, you hockey puck!
http://wmbriggs.com/blog/?p=195
I send a email to Mr Briggs explaining what was wrong with his simplistic and ill-informed article. I got a curt and dismissive response: “Thanks”.
There should be one of those psychology tests for statisticians based on smoothing choices. Could reveal wonders about their early childhood.
That I like more that “hockey puck”. Some very good points.
more _than_ ..
I applaud Greg Goodman for this discussion. Though I note, there’s some quite charged language concerning what is, after all, largely a matter of taste and interpretation.
Why is it ‘clearly’ undesirable for a small but tall spike local to the bottom of a larger shallower dip to be smoothed by a running mean filter so the net of the longer term trend is shown? That isn’t clear at all. It doesn’t make the peaks and troughs ‘wrong’; it presents a cleaner image of the longer-timescale peaks and troughs by removing the noise of the shorter timescale. It’s wrong for some uses, but suited well to other intentions, and these may both well be honest and — in the narrow application of specific questions — correct.
A filter can’t corrupt data. It can bias the presentation of the data, but then that’s exactly the function of a filter: to bias the presentation of data toward a different time scale (in the case of running means), or some other type of judgement applied by the interpreter to the raw data.
That an uninformed or thoughtless interpreter may introduce an unwanted bias by applying a poorly understood filter is not ‘corruption’, it’s just ignorance. That an interpreter can purposely subvert data by applying a filter to fool the audience of a presentation is a question of the audience defending itself from its own gullibility by understanding what influences a filter can have.
I myself prefer to use prime bisection running means (or in GG’s parlance “double running mean”; take the period of the mean, bisect it into the two nearest most prime numbers that sum to the mean period, take the mean of the mean: http://www.woodfortrees.org/plot/hadcrut4gl/mean:384/plot/hadcrut4gl/mean:191/mean:193 for example) as it somewhat improves fidelity and has the virtue of simplicity, though this filter too has its drawbacks.
Using filtered data as if it were raw in later calculations and presentations, leads to some of the same problems as corrupted data; the predictability of these effects sets filter bias apart from corruption, however, in my view.
There’s no data in WfT that is actual raw, unprocessed observation, I believe. All of it has some intermediate — though apparently legitimate — processing before WfT gets to it.
Granted, more elegant use of filters is desirable, as is noting which filters have been used (some of the filters applied have been buried very deeply by the time we get to the presentation) and their pros and cons, and the rationale for their selection. In a technically sophisticated audience, such as the readership of peer-reviewed journals, sometimes this nicety is not observed (though by and large, it most often is done much better in the technical media than in, for example, Fox News).
Thanks for reminding us of this topic.
“Why is it ‘clearly’ undesirable for a small but tall spike local to the bottom of a larger shallower dip to be smoothed by a running mean filter so the net of the longer term trend is shown? That isn’t clear at all.”
You don’t seem to have understood what is happening. Look at the examples in the article.
The simple running mean in example in figure 1 is so out of phase with the cleanly filtered signal it looks like a strand of DNA !
Are you suggesting that is in some cases a good thing?
Greg Goodman (November 22, 2013 at 11:15 am) addressing Bart R (November 22, 2013 at 10:59 am):
“You don’t seem to have understood what is happening.”
Bart understands just fine.
Greg Goodman | November 22, 2013 at 11:15 am |
Rather, I understand from my context, which is different from your context.
Yes, I am suggesting that in some cases either the exact phase is unimportant to the context of the discussion (and being out of phase is thus benign), or being out of phase reveals something about the nature of the phase that is obscured by seeking to emphasize frequency response, and thus the virtue of capturing the phase is itself wrong.
This is not a matter of personality or personal preferences, so much as of the context of the conversation. Perhaps ‘taste’ was an ambiguous term for me to introduce, in that a taste for one context over another is what I meant, not a taste for one method over another. I agree, when it comes to such analyses, it’s about the math of the method within the context, not the the personal preference of methods inapplicable to contexts.
So yes, if you are seeking frequency response (in global climate?! why!?) without on data, you have nailed methodological concerns. And as soon as you establish that this is about finding oscillating patterns with a fixed period.. which no one has yet done, for any weather data for any period longer than a year since the breakdown of the Hale cycle’s correlation with global temperatures half a century ago.. you’ll be applying a method well worth looking at for results. However, there are other, better methods for illuminating the signal of such responses, and they’ve been discussed at Climate Etc before.
“Yes, I am suggesting that in some cases either the exact phase is unimportant to the context of the discussion (and being out of phase is thus benign), or being out of phase reveals something about the nature of the phase that is obscured by seeking to emphasize frequency response, and thus the virtue of capturing the phase is itself wrong.”
Thanks Bart, there have been several comments in that vein, all equally vague.
Can you provide a concrete example of this. Note we are talking not about missing the “exact phase” but signals getting a full 180 degrees: sign inversion.
“Yes, I am suggesting that in some cases either the exact phase is unimportant to the context of the discussion (and being out of phase is thus benign), or being out of phase reveals something about the nature of the phase that is obscured by seeking to emphasize frequency response, and thus the virtue of capturing the phase is itself wrong.”
When the math model looks nothing like the data, you do learn a lot. You learn that your math model is worse than useless.
That means that the context of the discussion has nothing to do with what goes on in nature. It means the discussion only has to do with what is wrong with the model.
Greg Goodman | November 22, 2013 at 4:42 pm |
An example?
Certainly.
Time-varying trends with no fixed frequency. Concrete enough?
Specifically, if there is no oscillation in the global temperature data, we do not expect to have a phase to be inverted, and it is begging the question to assert phase inversion when all that has happened is an extremum has been locally truncated.
And as you mention vagueness, which I’d noticed in the discussion, could you provide a few clear definitions, actual figures, and examples of your own for the following:
As you are discussing frequency response, what frequency exactly do you refer to, and what is its underlying physical mechanism?
You refer to a base frequency (presumably of a system variable?). Again, what base frequency exactly, for what system exactly, and what mechanism creates this frequency?
Are you asserting that climate is globally time-invariant? On what basis? Alternatively, what are your stability criteria?
“Time-varying trends with no fixed frequency. Concrete enough?”
No, not really, I asked for a example to demonstrate your claim where this could be “leveraged” and was beneficial. You reply : wiggle line.
@ Pope
It’s not a model. Suggestion: Refine your conception of what’s being discussed.
@ Vaughn
You are right that It is not a real Model because it does not match actual real data, but they make the claims that it is a real model.
Bart : As you are discussing frequency response, what frequency exactly do you refer to, and what is its underlying physical mechanism?
Create a completely synthetic varying data series with no repetitive (cyclic) variations at all. Now transform this series into the frequency domain. There will be lumps and bumps, maybe even spikes. Some may be artifacts, but most will relate to real frequency components that are required to (re)create the original waveform. The more “high” frequencies you remove, the “slower” the edges (transitions) and the more “shifted” (delayed) the transitions when you then go back and examine the time series. This is true if you do the filtering in the frequency domain OR the time domain – it’s a basic characteristic of time series data that the waveform it describes requires a bandwidth proportional to how fast you are prepared to allow the resulting data to change. Faster changes require higher frequencies.
So to answer your questions:
the frequency referred to will be defined by the time series itself and;
the underlying physical mechanism that “creates” the data (and any cyclic patterns in it) is irrelevant to how filters distort time series data.
You are trying to dismiss these concerns as the concerns of “cycle chasers”, but they are most definately NOT – they are real artifacts introduced by filtering the data. If you are not aware of these artifacts, you can easily be misled by opportunists, scammers and the just plain ignorant preying on your ignorance.
Bart R would be an interesting subject for the smoothing psych test
then Bart can reply.
Greg Goodman | November 22, 2013 at 5:18 pm |
..which I have, and which your own replies have been nonresponsive.
What you said was “Can you provide a concrete example of this.” What you said was, to give context, “Are you suggesting that is in some cases a good thing?”
You mentioned no leverage. You mentioned no beneficial. I mentioned benign, which wiggle line is. It’s far better to show a less-processed mean that adequately reflects the trend of interest than to pretend to an underlying trend that just isn’t there by overprocessing.
And speaking of wiggling, where are your answers to my questions?
Your arguments rest on a ton of unstated assumptions, and become entirely moot if even one of them is not satisfied. Please, clarify your premises, and show evidence your methods are appropriate to the case.
What I have presented here is pure, abstract maths. Some examples were provided showing the effects on real world data as illustrations.
The frequency can be spacial as in image processing temporal or anything, it’s a mathematical result that is independent of any application. You may wish to pick holes in some application, it does not change the maths or the data processing theory.
Indeed “leverages” was Paul Vaughan, I was confusing the two of you because you are making similar arguments. Apologies.
Bart R –
Your prime bisection running mean is pretty cool. Here’s how I would emulate it with 3RM: http://www.woodfortrees.org/plot/hadcrut4gl/mean:191/mean:193/plot/hadcrut4gl/mean:166.4/mean:124.5/mean:93.1
Notice how both methods use identical number of samples and the series naturally start and end on the same month.
Oh, that’s what he meant (verbal descriptions of maths is often imprecise).
It’s basically just a two-pole running mean. Separation of 2 in 191 is negligible, for 12m it would be 5 and7. That’s a significant split. Don’t see why a filter would be required to change it profile. The “nearest either side” bit seems rather arbitrary.
blueice2hotsea | November 22, 2013 at 7:44 pm |
Yes, you have it.
Though it appears the reason for selecting as prime a duo (or triple) has been missed.
The problem with trendology when you don’t know if there is an underlying periodic pattern is to avoid accidentally producing one. For example, if you chose 12 and 48, for some reason, on a 5-year (60 months = 12 + 48) moving average, you can pretty much bet you will on enough data create a false oscillation.
This overlay is visible in http://www.woodfortrees.org/plot/hadcrut4gl/mean:96/mean:24/mean:12 for example; note the artificially constructed regular sawtooth pattern on sections of the curve.
So a difference of 2 in 191 is, indeed, significant.
Bart R –
You are correct that I do not get the significance of ‘primes’ and ‘a difference of two’.
Using your chosen example, 193/191 is nearly identical to 200/184.
On the other hand, Greg Goodman has given a clear explanation of 3RM that is starting to sink in.
blueice2hotsea | November 23, 2013 at 12:31 pm |
Yes, on 191/193, vs 200/184, the difference is small.
Yes, 3RM is ‘better’ than RM*, in particular if you have a time-invariate modulation.. unless it isn’t ‘better’, which can happen in special cases.
Note that the data in HadCRUT is already processed into months from raw daily local extrema figures, themselves taken with special processing rules. If by chance the grouping of this data were just exactly biasing in some way that we ignored on post-processing, we might get artefacts, as Greg has pointed to in his examples for time-invariate cases.
We know that the Earth is heavily asymmetric North/South with regards warming effects due to the difference in distribution of land and oceans; for this reason we account for the cyclic annual patterns of the planet’s temperatures by restricting ourselves to periods of consideration that are 12 months long. Thus, 360 or 372 or 384 are more valid moving windows than 366 or 378 or 390 months.
However, suppose the monthly grouping relied heavily on 30-day months in pre-processing, and suppose there were some artefact in the data due this specific duration. Then 360 or 390 might emphasize the artefact in residuals for some types of filters. 200 and 184 are relatively prime both with regards each other and with regard to 30, as well as with regard to 12, and so even though neither is 200 nor 184 is a prime number, they are both ‘prime’ enough for our needs, in avoiding harmonic effects.
The 96-48-12 example shows the sort of sawtooth artefact that might mislead the eye quite well.
*Kneel | November 23, 2013 at 9:20 pm | has a good point, but it is overstated. Cycle-chasers can exploit overprocessed presentations to point at and declaim, “See, see, a cycle!” when it’s just a component of processing a curve.
That’s a problem with the cycle-chasers, not with the processing. Either way, there will be artefacts or outcomes of the processing that must be taken into account when interpreting. One the one side, you get lobes; on the other, you get suggestions of periodicity that evaporate if the same processing is extended to more data. It’s a judgment call.
Honestly, I prefer three pass moving average over two pass. I just can’t be bothered going through all the math to explain my choice when I present the results, and especially to justify each pass explicitly. Every additional pass introduces more of the opinion of the author; every pass ‘hides the decline’ in some way that a good presenter explicitly explains in the narrative. Rather a good honest artefact everyone knows is there and a nuisance than an omission hidden by fancy rote mathematics on a poorly-appreciated dataset.
Bisector is new to me but it’s arbitrary. The split of the two becomes negligible for longer filters, so the freq resp. profile will change depending on central frequency. That’s mad.
Also the bisector is near twice the freq, so badly misses the problematic negative lobe at 1.3371 * base freq.
Doing it again, nearly the same does not help.
This is not a question of personal preference. It’s maths. Freq resp can be calculated and an informed decision made on predetermined criteria.
Person preference comes in when you decide if you want to be rigorous or sloppy, informed or ignorant, not on the qualities of the filters.
My background is aerospace guidance, navigation and controls
If one has a time history of data one can use future data as well as past data to remove unwanted frequency content without signal distortion. For example if one wants an estimate at X(n) one can average five points before as well as five old points. In Navigation parlance this is know and smoothing. Filtering is where one doesn’t have future data. This technique removes the phase lag from the filtered signal.
The Navigation folks have developed the extended Kalman filter/smother for bending data with uncertainly. One uses the known dynamics and noise statistics to estimate states. Since the navigation dynamics is pretty well know this works well. (Urban legend says the Kalman filter enabled the moon landing). The Kalman filter also provides information on the uncertenty in the form of a covariance. If one doesn’t know the dynamics of the error statistics it will lead to bad estimates.
Some things I teach new engineers
Dr. Nyquist was an optimist. One should sample data at least 5-10 times faster than the highest frequency present. The Nyquist theorem states one need to sample at least twice as fast as the highest frequency content in the signal. If frequency content is more than twice the frequency it will appear as lower frequency data. Most people understand this for time sampled data but it is also true for spatial (space sampling) data. People looking at traveling waves need to be aware of this,
Filtering data with irregular sampling times can lead to all sorts of distortions and invalidates the linear time inerrant assumption that sampling theory is base on. A frequency response analysis that Judith present has to be taken with a large grain of salt if the data has different sampling rates.
One should always examine the impulse and frequency response to a filter to understand what it is doing to the signal. For example one often sees Butterworth filter being used. It has a maximally flat frequency response but in the time response it will overshoot and may produce a change in sign of data the that is not present
Thanks you for a knowledgeable comment .
“Dr. Nyquist was an optimist. One should sample data at least 5-10 times faster than the highest frequency present. ”
I think that is supposed to be a theoretical minimum of sampling frequency not a recommend optimum of how much to oversample. ;)
I agree the Nyquist theorem is a minimum and doesn’t address practice.
Consider the implications of Nyquist on sampling maximum daytime temperatures. Samples are near once a day with a significant frequency content at 1 per day. Could easily see a 6 month temperature period signal that was caused by under sampling.
678days = 1.855 years.
1/[(1/27.56 – 1/30 )/2] = 678
http://climategrog.wordpress.com/?attachment_id=647
Way cool correlation between mat T and heating hours but…
is caused by dynamic interaction leading to modulation or is cased by sampling aliasing
I’ve emailed John Kennedy of Met Office to enquire whether daily data can be provided for some of the M.O. stations.
He has not replied yet but he seems to a genuine and enquiring scientist so hopefully he will get back to me.
The best way to nail down the magnitude of these effects would be examine daily data. We can only see the presence of the alias , try to back track to estimate magnitude would be rather uncertain.
Good day to invoke John Kennedy. Free the daily data.
==========
> Urban legend says the Kalman filter enabled the moon landing.
Too bad. But still:
yes willard kalman filters are very cool.
so for example, if i were invisible and stealthy and Cripwell tried to see me with a radar and I got AOA on him. and I know the general physics of his platform, then…
i can punch him in the snot locker just for looking at me.
or if he looked at my buddy, and my buddy tells me everything he sees,
I can also knock him out.
And Cripwell would wonder how he he got shot down when he was trying to measure where I was, but i was only guessing where he was.
http://ieeexplore.ieee.org/xpl/login.jsp?tp=&arnumber=995410&url=http%3A%2F%2Fieeexplore.ieee.org%2Fxpls%2Fabs_all.jsp%3Farnumber%3D995410
Intersting thing about Kalman filters is that the real error seems to bounce around 1 sigma and dosen’t get pushed is lower. Not to surpising beacasue the weighting is L2 and not much penelty for valuse less then 1 sigma
Some push these filters beyond simulations:
http://www.ncbi.nlm.nih.gov/pmc/articles/PMC3107447/
Being to emulate the Earth would be any Earth holodeck.
Being able to emulate the Earth would beat any Earth holodeck, that is.
Kalman filter/smother for bending data with uncertainly.
If you have valid input, Kalman filters, properly programed, can lead you down a good path.
If you have invalid input, Kalman filters will always lead you down the wrong path.
If you are wrong for 17 years, you are on the wrong path.
A proper Kalman filter would look at actual data and make adjustments to better stay on track. Climate Model output goes exponentially out of bounds from actual data.
An excellent smoothing filter is (.25, .5,.25) cascaded repeatedly to achieve the desired smoothness.
The ampltiude spectrum decays smoothly and monotonically to zero at Nyquist. Unlike a rectangular filter, this is zero phase, so it doesn’t have those bumps in the amplitude spectrum marking a 180 degree phase shift. And unlike a Gaussian filter, it is finite and so does not requuire truncation.
Iterative binomial approximates Gaussian.
thanks for summarising my reply below Paul.
The triple running mean also approximates gaussian. For most non-periodic data the difference between the triple running mean and gaussian of the same width is unnoticeable. The main difference is that triple running mean cancels exactly periodic signals that correspond to the three running means.
The gaussian distribution has infinite tails but they are so weak that they make seldom any difference.
In the specific case of 12, 9, and 7 month means the gaussian of the same variance has a central weight that’s about 6% higher, between one and two standard deviations from the center the weigth is correspondingly a little lower, and in the tails it has still a contribution of about 0.6% from values outside the range included in the 3RM.
Perhaps we can agree that discussion trees corrupt orderly discussion.
I like them. I think they clarify the chain. I wish there were infinite nesting.
Or in this case, truncated Gaussian approximates iterative binomial, for it is iterative binomial which has near-perfect smoothing properties and the truncated Gaussian which falls short, especially, as I said below, for mild smoothing.
That’s basically a binomial filter. If you cascade it enough it eventually becomes the same as the gaussian. (mutters something about central limit theorem).
You truncate it by deciding when you stop cascading it, so it’s no different.You need to work out how much error you have at where you stop as you need to decide where to truncate the gaussian (3 sigma is <1% IIRC).
"… to achieve the desired smoothness."
Sounds like you are looking for a visual "smoother" not designing a filter.
Yes it is different than a truncated Gaussian filter.
The two properties I mentioned — decaying monotically to Nyquist and having zero phase — do not hold for a truncated Gaussian filter but do hold for the cascaded three-point filter.
These differences become particulalry apparent for mild smoothing (cascading only a few times).
This was a good focused post, with good discussion. Every smoother has liabilities that may make the result misleading in particular cases, so one must at minimum look at a few smoothers that have different liabilities. For modeling, I think you ought to use the “rawest” data you can get, but most available data sets have some input from “pre-processing.”
Yes , this has been the most convivial and well-mannered discussion I can recall here. ( Maybe because we haven’t heard from Fred Singer yet ;) )
You’ve simply blown out the innumerate dilettantes.
=============
The most convivial discussion may have been this one:
http://judithcurry.com/2012/12/04/multidecadal-climate-to-within-a-millikelvin/
LOL,
Interestingly Pratt used the triple RM in his spreadsheet. That was why my initial comment on that thread was a complement about his good use of filters. However, it quickly became apparent that he didn’t understand much about filters and had been give this one by someone else who did.
Since this filter is pretty standard in real time audio processing and one of his students went on to set up a business identifying songs by real time audio processing, I have a clue who that may have been.
It’s a shame he did not get his spreadsheet to work on OpenOffice/LibreOffice, I would have used it to provide the implementation for this article.
I know Fred Singer and I have never known him to not be well-mannered.
I guess some consider anyone not well mannered if they disagree with consensus.
Oh, I’m sure he’s gentleman face to face but I’ve seen him post some pretty outrageous comments here, totally unprovoked.
Something along the lines of calling some a piece of stinking excrement for no good reason on one occasion. On many times he comes across like he’s drunk.
People often allow themselves to act in ways online that they would not have the nerve to do in person.
> I’ve seen him [Fred Singer] post some pretty outrageous comments here, totally unprovoked.
Citation needed.
Greg
” I’ve seen him post some pretty outrageous comments here, totally unprovoked”
That is a matter of how much we are typically soaking up non-verbal communication and the normal power of societal norms. Writing and reading is rather dehumanizing, in he truest sense.
People type things they would never say face-to-face, they miss cue’s that they would get from face reading and posture.
I would like to see links to the Fred Singer Posts you refer to.
If Fred Singer was disturbed enough to post something that was not well mannered, it most likely must have been about something that was extremely Alarmist and not reasonable.
I don’t remember Fred Singer commenting here. But maybe some of kim’s horrifying accounts of International Falls spreading out over the entire earth like a terrifying plague brought out an angry Fred.
Nice post.
@willard: The most convivial discussion may have been this one:
The memory of an elephant. :)
@GG: Something along the lines of calling some a piece of stinking excrement for no good reason on one occasion. On many times [Singer] comes across like he’s drunk.
Has Singer ever had occasion to lash out at Goodman in this manner?
If so I could understand Goodman’s reciprocation.
If not then I have to turn to another explanation: Goodman has borderline personality disorder.
That aside, Goodman’s post here demonstrates considerable improvement in his understanding of filters since last December. I would have let it go at that had he not written the following.
@GG: However, it quickly became apparent that [Pratt] didn’t understand much about filters and had been give this one by someone else who did.
It quickly became apparent after a few exchanges with Goodman last December that he was clueless about filters at the time. He couldn’t even keep straight the difference between an impulse response and a frequency response, and kept inappropriately interchanging the units for each.
A few months after he’d had some time to think about the filter I’d designed (which certainly did not come from “someone else”), he posted an account of it online with no acknowledgement of the fact that he’d gotten it from me.
His justification now for doing so would appear to be that I’m such a moron that I could not possibly have come up with it myself, therefore I must have gotten it from someone else, therefore I do not deserve any acknowledgement for it.
As far as I’m concerned, when it comes to honesty in attribution Goodman is morally bankrupt.
Ironically it was he who repeatedly called me a liar throughout those exchanges back in December. As far as I could tell his justification for doing so was that he believed differently from me and that therefore I was a liar.
@PP: The triple running mean also approximates gaussian.
Exactly so. I tried explaining this to Goodman last December, but it didn’t sink in at the time, and judging by his post it still hasn’t.
In the meantime, for exactly this reason I’ve stopped using the “triple running mean” (which I did develop on my own, though I don’t claim no one ever thought of it before) and forked out the $29.99 Mathworks was asking for their wavelet package. So far the main wavelets I’ve found useful for climate purposes are the 0th and 2nd derivatives of the Gaussian. The latter is called the Ricker wavelet outside the US and the Mexican Hat wavelet inside. (Why not the “ondicula sombrero charro” in Mexico?)
As Pekka points out, the former is close enough to the “triple running mean” for government work whether Finland, the US, or the UK.
Real, Properly Verified Data is Real Data.
Messed with or adjusted or processed data often just reflects the bias of the people who made the “adjustments”
They knew what they wanted to support and made the output show what they wanted and the output is not still real data.
Smoothing results in a loss of information. So, we lose degrees of freedom. This is of course is a big problem because we already lose degrees of freedom with parameterization.
We use parameters to force GCMs to capture reality –i.e., their use helps turn events of a large scale into something we can deal with (given the limitations in computer power and our lack of a clear understanding about how forces are related). The parameters are continually tuned make models to agree with empirical observations.
And, as we have seen, models constructed in this fashion fail validation. The reason the projections of GCMs fail is because the models are simply a representation of reality. GCMs in no way actually capture the relationships between forces that give rise to reality.
Statistically, the degrees of freedom based on the observational data are reduced by such tuning to the extent that the resultant models have no real-world validity. Manipulating the observational data simply magnifies the problem.
GCMs are nothing but toys and that probably will always be the case. We cannot assume we even know what all the forces are that influence the weather (and by extension, the climate). And, even if we did and knew how all were related to each other, there wouldn’t be enough computing power on Earth to resolve a model that included all of this information.
We use parameters to force GCMs to capture reality
THAT HAS NOT HAPPENED YET!
–i.e., to capture reality like photographs of junk at an exhibition, as in the way Vik Muniz arranges everyday garbage to reveal a provocative image: a reality that is here today and gone tomorrow, if not for being frozen in time by its creator.
It’s worth noting that smoothing/filtering of a noisy signal always results in some form of temporal distortion of signal accuracy. Your recent data is always less meaningful than your older data.
2 things I don’t at all find helpful:
__
1. conflating moving average with running mean.
A running mean window is anchored at the left end and grows with sample size. A moving average kernel stays the same width and slides.
Misapplication of the term “running mean” is impossible to control since it’s so widespread, so the best one can do is mention the distinction that’s necessary to teach central limit theorem (as I do here).
__
2. attempting to make a misleading overgeneralization suggesting simple moving averages have no good use whatsoever in any context whatsoever based solely on an evaluation of them in one very specific, narrow context.
There are contexts in which a “fair” averaging scheme in needed — for example to simplify interpretation or to pinpoint the frequencies of cross-scale spatiotemporal phase reversals. (The lobes that have been mischaracterized as universally bad & hazardous bring easy opportunities that are leveraged productively in some algorithms — an adaptive example of cleverly turning a supposed disadvantage into a useful advantage.)
Smoothing doesn’t corrupt data, but certainly a sound case can be made that smoothed data need to be interpreted properly. The same case can be made for any statistics.
When a smoothing peak falls on a data valley, this is only a problem if it is misinterpreted.
CERTAINLY it’s a valid concern that climate discussion audiences will misinterpret MOST stats. This is a function of the low level of functional numeracy of the audience.
The solution isn’t to attack the method. The solution is better education, deep independent awareness, and more careful interpretation.
A method should not be judged solely on its strengths and weaknesses in a single, very specific, narrow context.
Greg always judges simple moving averages on a single, exceptionally narrow criterion. He has only a single type of analysis in mind (the kind of analysis that interests him). That limits the range of discoveries he can make.
The topic of data analysis more generally is highly worthwhile, but the repeated attempts to dumb down discussion of data analysis aren’t helpful. Belabored discussion in dumbed-down terms has no utility.
A final caution: Briggs has no credibility on aggregation criteria fundamentals. When people point to his never-ever-smooth-under-any-circumstances rant, it underscores their deep ignorance & comical gullibility. (It also raises suspicions about motives; I drop this as quickly as I mention it due to the blog rules at CE.)
I do not wish to discuss any of this further. Please respect this wish.
asserting that briggs has no credibility (argument by assertion) is funny.
Briggs analysis is backed up by actual examples. Your assertions are backed up by…. nada.
Show some experiments with synthetic data where your claims are supported. Otherwise, #Si
The truth according to Mosher:
2+2=5
Steven Mosher, we have nothing further to discuss today, tomorrow, or any other day.
P.V. 2 things I don’t at all find helpful:
__
1. conflating moving average with running mean.
Triple Running Mean is a weighted moving average where the closest samples are weghted 3x, the middle samples 2x and the most distant 1x.
Please elaborate on my conflation. thanks.
“CERTAINLY it’s a valid concern that climate discussion audiences will misinterpret MOST stats. This is a function of the low level of functional numeracy of the audience.”
The numeracy of the audience is not the problem in climate “science”.
There is no doubt that a running average destroys data and distorts the shape of the temperature curve. In particular, the height of El Nino peaks is reduced according to the width of the peak and this may give a wrong impression of where the curve is going. To avoid this I use a semi-transparent magic marker (or its computer equivalent) as explained in my book “What Warming?” You should have sufficient resolution to see the raw shape of the curve which means enough to show the fuzz surrounding the curve. The fuzz is not noise but is caused by global cloudiness variations and has a maximum amplitude. Real noise is comprised of large spikes sticking out of that fuzz. This was the clue I used that allowed me to identify some non-random noise in GISTEMP data. It turned out that theses noise spikes, all of which occurred during the first month of a year, were also present in HadCRUT and NCDC databases, all at the exact same locations as in GISTEMP. There is no doubt that they were put there by an out-of-control computer program that was used to process these data for reasons we were never told. About a dozen or more of them are easily identifiable in the interval between 1979 and 2010. I did not check the data before 1979 when the satellite era begins but someone should check to see how far back this data manipulation extends. Also, data guardians, whose product we now know is contaminated, owe us an explanation of how and why the data were processed and why they lost control of their software that created the spikes. Some of them are large enough to locally twist the curve out of shape.
The point I as trying to make is that Gaussian sampling also has a preconception about the data it is looking at. I think that looking at how the weighting of the data in any sampling window might effect any conclusions you draw is important. Those assumptions you may be otherwise be hiding from yourself.
“The point I as trying to make is that Gaussian sampling also has a preconception about the data it is looking at.”
You’ve said that three times and seem sure of it. Perhaps you could specific about what these “preconceptions” and how they affect the choice of filter.
If you look at how the components that go to make up the Gaussian window are weighted when creating the output value, they are not treated the same. They have a normal or similar distribution of weights which tends to favour input signals that have a sine wave or similar response. (as does the more simplistic filter suggested by Rabbit).
The advantage of square wave sampling is that it does not care about wave shape, only the frequency implied by the window width.
It is very difficult to come up with a filter that has equal internal weighing (thus assumes nothing about input wave shape) and equally does not use samples outside of the window thus allowing for fast response. No overshoot on any signal input shape is also very desirable.
A multi pole running mean bandpass manages to achieve very good results with little distortions or assumptions.
” They have a normal or similar distribution of weights which tends to favour input signals that have a sine wave or similar response. ”
In what way do they favour a sine wave? An input does not have a “response” what are you referring to?
“The advantage of square wave sampling is that it does not care about wave shape, only the frequency implied by the window width.”
OH it doesn’t care. It will screw around with anything you give it.
That’s exactly what a low-pass filter does.
What you really mean is smoothing can corrupt a signal. No data was actually harmed during the smoothing process.
Paul Vaughan:
“There are contexts in which a “fair” averaging scheme in needed — for example to simplify interpretation or to pinpoint the frequencies of cross-scale spatiotemporal phase reversals. (The lobes that have been mischaracterized as universally bad & hazardous bring easy opportunities that are leveraged productively in some algorithms — an adaptive example of cleverly turning a supposed disadvantage into a useful advantage.)”
You saying there are some circumstances in which a crap filter which inverts part of the data is useful. Without hiding behind fancy words and your usual vague, hit and run comments, perhaps you can show clearly how this can “leveraged”. I’d be interested to see that demonstrated, if it is the case.
==
Important: Where do you think the forefathers of spectral analysis started??
==
Several years ago I illustrated how to use simple moving averages to trace the QBO period. It’s child’s play.
I gave plenty of other illustrations of the method in 2008 (mostly astronomical data from NASA Horizons).
It’s so simple it needs no explanation. It doesn’t need to be discussed. Just do it and see for yourself.
If your quantitative intuition is not that good, maybe consider taking the approach Judy Curry took when Tomas Milanovic visited: she did not overstate her authority in his areas of natural expertise.
Methods aren’t things one should learn from a book or select from a list; rather they are things one should easily & intuitively develop independently from scratch as necessary.
Let us dream of effortless, efficient communication on higher planes of consciousness rather than waste unnecessary words unwisely appeasing dark agents of politically motivated dumbing down.
I advise you to drop your futile campaign against the moving average staple. Use the time saved to soar in harmony to new heights you could never reach while incessantly dragged down by the tiresome burdens of political communication.
I wish you efficient, quarrel-free exploration…
Greg. Are there any cases where filtering data confers some advantage or another before running a Fourier transform on it?
Generally the opposite. It’s easiier to take the FT of spectrally white data. The windowing effect is reduced. As a trival example, it is dead simple to take the FT of a single spike with no windownig effects. Smearing out the spike with a smoothing filter negates this.
Having said that, might it be advantageous to whiten spectrally colored data before before taking its FT?
I assume you are asking Greg. I am here to learn a little.
If you have a very strong annual signal for example it will drown out the rest, effectively scaling down the rest of the spectrum, perhaps by two orders of magnitude. FFT is sensitive to rounding errors since there is a massive amount of repetitive calculation. (FFT is usually programmed in double precision numbers). This can lead to inaccuracies in the rest of the calculation.
Secondly FFT needs to “window” the data avoid spurious effects from wrapping the data. All this windows themselves produce ringing either side of peaks (some are better than others in this respect).
If there is a hugely strong cycle, it’s peak can leave a broad cast of artefacts that render adjacent parts of the spectrum useless.
You can get some feel of the problem here. This is Kaisier Bessel window which is a lot cleaner than most.
http://climategrog.wordpress.com/?attachment_id=647
@GG: FFT is sensitive to rounding errors since there is a massive amount of repetitive calculation. (FFT is usually programmed in double precision numbers). This can lead to inaccuracies in the rest of the calculation.
Reminds me of those puzzles where you’re supposed to find all the things wrong in this picture.
1. How does a fast algorithm find time to do a “massive” amount of “repetitive calculation”? (The first “F” in FFT stands for “fast’. I spent a decade teaching the FFT at MIT in the 1970s, I have a pretty good idea of its precision.)
2. How does double precision affect this? Even when FFT is programmed in single precision the result is very accurate for any conceivable climate-related purposes.
3. In future write “double precision”. “Double precision numbers” sounds like you’re talking to a kindergarten class.
Is this the state of the art on Climate Etc?
WebHubTelescope (@WHUT) | November 22, 2013 at 2:17 pm |
I think I found the lunar signal in the CSALT residual as well
http://img585.imageshack.us/img585/505/qlb.gif
===
Interesting. Could you extract the exact value of that pair of peaks and covert wn to period in years?
Same multiple as you are seeing, 1.85
The wavenumber is shown in the inset.
2048/92/12=1.855 : bang on! 27.56 aliased with 30.
I was asking about the one next to it and the other about 120 to guess by eye.
The 1.855 is there but it is a weak factor. The stronger effects were the annual and biannual factors that I could nearly null out with phased sine waves
http://img28.imageshack.us/img28/6914/ozf.gif
And even these factors are very small because they were likely filtered to some degree, but not perfectly, and so what I am seeing is the residual of the residue.
I’m surprised. No one has mentioned the NODC’s pentadal filtering that magically increases the trend of their ocean heat content data.
That is magic isn’t it? Amazing how the accuracy in the 1950s is just as good as ARGO.
The trouble with all this filtering is that all of them are linear time invariant filters.
Now, the climate system is obviously non linear, but is it time invariant?
Multiplication of operators (describing systems) is not commutative in general. A system is said to be time invariant, if its operator happens to commute with the time delay operator, but that’s a special case. Is it applicable to the climate system?
Not so much.
Think about it this way. Filters (linear time invariant systems) do commute with each other, as they have a common orthonormal base, eigenfunctions of time delay operators, screws, basically. On the other hand, one would not expect the climate system to commute with any low pass filter. That would mean if it were subject to a low pass filtered version of a specific forcing, its response would be identical to a low pass filtered response to the unfiltered forcing. That would never happen, I am afraid, what is more, it is not even testable.
That is a relevant point, a lot of the basics, like proper sampling, proper filtering, illegitimate OLS to scatter-plots ….. all seem to get ignored. Those are poor practice that can be corrected.
However, if you take away filters, FFT (also linear assumption) and take away all the ‘linear over a small perturbation’ approximations , what do have ? Nada.
We just wrap up the rug, the tell the public and politicians the game’s off, we have no tools fit for analysing climate data.
So somewhere we have to make assumption and try to get a first order approximation understanding. But you have a valid, point we should keep it in mind that we are bending the rules and be on guard that it may produce false or distorted results.
We just wrap up the rug, the tell the public and politicians the game’s off, we have no tools fit for analysing climate data.
We have a brain in our head on top of our body. That brain, computer, can look at actual data for the past ten thousand years, for the past 870 thousand years and the past 650 million years and analyze the data. Temperature is bounded in increasingly tighter bounds as the Polar Ice Cycles developed and mutated.
Current Climate Models are worse than useless, but we still have a brain and we can look at and understand data.
In what way does 60-month running mean compare with 30:22:17 month running mean?
I get almost the same as 30:22:17 by running a 37-month running mean, for instance:
http://www.woodfortrees.org/plot/rss/from:1980/plot/rss/from:1980/mean:37/plot/rss/from:1980/mean:30/mean:22/mean:17
And when I scale 30:22:17 up by appropriate factor to 48:36:27, the result differs way less, too. Although I admit it does not recreate the trough:
http://www.woodfortrees.org/plot/rss/from:1980/plot/rss/from:1980/mean:60/plot/rss/from:1980/mean:48/mean:35/mean:27
Although of course there’s no dispute the 3-pass filter is a decent approximation of gaussian filter, while it is way easier to calculate.
It is obvious that the spike in 1998 isn’t noise, it is a damned signal. Smoothing it just makes it wider and squatter.
Why destroy information?
Love to see a cardiologist smooth an EEG.
EEEECK!
======
Smooth operator.
+1
Comparing 60 with 30 is an underhanded trick aimed at sleepy audience members.
I’m not sure why you are comparing 30,22,27 to 37 and 48.35.27 to 60 but you have shown the same issues. Especially the latter plot shows complete phase reversal in the detail with troughs where there should be peaks and vice versa.
I get the impression that way too many people are looking at messed up output from programs and models that mess with the data using biases based on flawed theory and very few people are looking at and thinking about real actual data.
Base your thoughts and theories on real actual data.
If you have a model or theory that has output that does not match real actual data, IT IS WRONG!
GG. OK, I think I didn’t fully understand the goal of filtering. It appears the problem you are tying to solve is to decompose the signal into its component frequencies, then attempt to identify the source of a given frequency. Is that correct?
If so, can’t you just run an FT, then subtract out the larger magnitude frequencies from the original signal, then run the FT again on the resulting signal?
OK, a third question. How would you know the phase of the larger amplitude signal in order to subtract it correctly?
There are many reason to filter. The point of the article was to point out the distortions of a ubiquitous filter that many using it seem unaware of and provide a couple of alternatives that do better.
If you want a (visual) “smoother” RM does not do a very good job, if you want a low-pass filter it’s a really rank choice.
Thanks, Greg, I enjoyed the post.
Never mind the third question. I had forgotten FT yields phase also.
Greg Goodman said:
“Since most people have some understanding of what an average does, the idea of a running average seems easily understood.”
______
I’m not so sure most people have a good understanding of the different kinds of averages, and how taken alone, any kind of average, be it mean, median or mode, can be misleading. Lot’s of things in statistics can be misleading if you don’t know exactly what they are.
Since most people have _some_ understanding
the idea of a running average _seems_ easily understood.
Yes, I saw the qualifiers, and if you are referring to the people who post here, you may be right. But I’m not sure “most people ” everywhere do have “some understanding” of what an average does. Moreover, I’m not sure just some understanding of an average makes it easy to understand a running average.
There used to be a musical group called the Average White Band, and I guess “average” in the title meant they weren’t good or bad, typical or atypical, but somewhere in between. My impression is average people believe average means in between and near the middle, and I doubt the average person knows how to calculate a mean. But I could be wrong.
Strike my “typical” in the post above.
Running mean, or moving average, smoothing as typically applied to climatological data is nowhere near as onerous as is implied here. The usual purpose is to remove diurnal and/or annual cycles, which such smoothing does very effectively with a highly compact convolution kernel. To obtain similarly fast roll-off of frequency response, the kernel of other low-pass FIR filters (binomial, etc.) is usually much longer–an important consideration when dealing with short time series. There is usually little power to be inverted by the negatve side-lobe.
In general:
Agree.
In the most important, specific context:
Choice of Gaussian vs. simple moving average doesn’t change insights from Dickey & Keppenne’s (1997) Figure 3a&b.
” There is usually little power to be inverted by the negatve side-lobe.”
Oh yeah? How do you define “usually” and how to you before you do the filtering (with a non-distorting filter) to find out.
Like many newcomers to geophysical signal analysis, apparently you’re unaware that proper power spectrum analysis of the raw data reveals the spectral content in all frequency bands prior to ANY filtering. Filtering schemes are prescribed ex post , not ex ante. This lapse is one of many that often permeates your frequent postings as a self-styled signal analyst.
The example chosen by Goodman betrays its origin by carrying the label “audio” when it is easily recognizable as historic climate data. As such. it was probably already filtered by being year long averages from many stations around the world. Thus if you wanted to calculate the standard deviation due to sampling error at the stations. you would be unable to do so. Anyway the objective of choosing a filter is not just to reject high frequencies as an inertial low pass filter would, but to reject a particular frequency, such as the 11 year sunspot cycle. The 11 year central moving average filter from the Australian BOM does exactly that and is used in my theoretical climate model underlined above. It does have the disadvantage for the researcher of always being 5.5 years behind knowing the current filtered temperature,
Still having trouble finding the “audio” label Biggs. Perhaps you could clarify.
Greg: If you go to the http site immediately below the figure you will see the waveform referred to as “audio waveform”; It is possible, of course, that a filter formula suitable for music can be used in climate research but it does require some justification.,
OMG Alex, that’s what you’re on about.
What you saw is a _link_ that let’s you listen to the data as audio (not sure why BTW) , it is RSS lower tropo air temp. ie climate data.
If you’d been more specific I could have corrected you straight away.
The filter presented here is a mathematical abstraction, it’s properties are perfectly general and not linked to any specific application.
What is Biggs talkng about ? First mention of “audio’ in this page is comment by RichardH.
“objective is… to reject a particular frequency, such as the 11 year sunspot cycle. ”
Fine, but do you really need to invert anything around 8.2 years to achieve that? No you don’t.
Since the world authorities assure us there is not the slightest possibility of solar variation making a detectable impact on climate it seems an odd idea to try to remove it.
Exactly, if he was in front of me he would probably not start his comment with “Goodman betrays…..” . I responded in kind, as I do in person.
Looks like the thread has run it’s useful course and those with hand waving claims about how a crappy filter is sometimes really useful seem bereft of more mathematical demonstrations of their ideas.
Thanks again to Jim2 for helping me see the significance of 1.85 alias and to WHT for finding similar. His SPD of residuals was a further demonstration of how runny means can infect a method and induce spurious frequencies into the results.
> [M]ore mathematical demonstrations of their ideas.
That would have been a great idea.
Too bad we’re left with a semiotical conclusion instead, i.e. “referring to a filter as a “smoother” is often a sign […]”.
The stronger effects were the annual and biannual factors that I could nearly null out with phased sine waves
http://img28.imageshack.us/img28/6914/ozf.gif
The annual wave was 360 days while the biannual wave was exactly 6 months.
360 days? That’s suspect. Any idea which dataset it’s coming from?
Exactly, if he was in front of me he would probably not start his comment with “Goodman betrays…..” . I responded in kind, as I do in person.
Looks like the thread has run it’s useful course and those with hand waving claims about how a crappy filter is sometimes really useful seem bereft of more mathematical demonstrations of their ideas.
Thanks again to Jim2 for helping me see the significance of 1.85 alias and to WHT for finding similar. His SPD of residuals was a further demonstration of how runny means can infect a method and induce spurious frequencies into the results.
Forget this repeat comment, finger trouble ;)
WTF? WordPress is posting this comment ANYWHERE except where I post it.
WHT, I’ve been thinking about you 360 peak. This seems most obviously to be 12*30 days. You managed to knock about half of that peak out by subtracting. What’s the other residual peak ? Is it 31*12 by any chance.
It would be interesting to see which dataset introduces this 360 peak.It should be fairly easy to identify the source by elimination or by running your spectral analysis on each input.
BTW I was in error about the 1.85 year peak being an alias, I applied the wrong formula, the alias would be at half that value. Even the alias will likely be weak when that close to the averaging period. We really need daily scale datasets to detect lunar signals.
> WordPress is posting this comment ANYWHERE except where I post it.
Judy deleted a comment on the subthread where you want to post, Greg.
If you have the chance, please answer Vaughan and Nullius. They might be able to follow your formal black magic. (BartR too, but that’s a secret.)
It would appear that posting which is not a direct reply to an existing comment does end up almost anywhere. That’s what happened with my last unthreaded post to you (which you may have missed or otherwise thought of no value – difficult to tell :-)).
Oh, wait. Stop the press. It does matter now we need to explain the cooling (sorry ‘hiatus’) but still didn’t cause the warming, that was human caused. 97% of climate scientists are agreed,
Greg –
You specialize in attention to detail in recognizing patterns.
Statement one:
Statement two:
Do you no see the difference?
Joshua, There’s no difference – both statements were equally sarcastic.
hmmmm.
Sarcastic?
How do you know when something is sarcastic as compared to when it is just flat out wrong, and a mistake the reflects a tribal agenda?
I would explain it to you, except you probably wouldn’t understand.
Sorry – here:
http://judithcurry.com/2013/11/22/data-corruption-by-running-mean-smoothers/#comment-416811
“I would explain it to you, except you probably wouldn’t understand.”
Yeah, probably. But maybe of the off chance that I could understand (I did eat my Wheaties today), why don’t you give it a shot.
J, of course it’s the sun. The question is how is it the sun, and there is no need to sacrifice maidens. It just needs to be studied, while we bask in our enhanced carbon world.
=================
kim –
Please explain the contradiction.
“Since the world authorities assure us there is not the slightest possibility of solar variation making a detectable impact on climate […]”
Let’s not mince words: Suggestion by authorities that the sun has no effect on climate is criminal. I would love to get them on the stand in a court of law under oath and ask them some very pointed questions. We would learn just how far their noble cause corruption goes. Specifically, we would learn whether they are willing to lie under oath. We could deduce this in black & white logic (no shades of uncertain grey, as we have rigidly constrained proof). My suspicion is that they see their cause as being far above the rule of law and that they would lie without hesitation. We are dealing with dark characters. People have underestimated how dark. I speculate that they are using a manipulative strategy of trying to appear helpful & knowledgeable 95% of the time so that they can buy enough social support to get away with cold outright tactically calculated lying the 5% of the time that’s crucially strategic for their cause. I believe they would maintain the lies under oath. One cannot effectively & efficiently deal with such darkly deviant characters in the usual, straightforward manner. Where the simple light of 1+1=2 is not and will not be admitted, one faces the twisted exercise of managing darkness and all that goes on there. I do mean criminal. We’re dealing with criminals whose operations are based in darkness. It’s senselessly naive to think dark criminal operations will be curbed by nothing more than protracted debate & discussion. The first thing that has to go in the skeptic community is the pervasive extreme naivety.
Please send such comments directly to Lew, Paul.
Paul –
Let’s look past your alarmism for a moment, and discuss your veracity.
Which authorities would that be that say that “the sun has no effect on climate?”
Maybe you can consult with Greg and come up with some names?
http://judithcurry.com/2013/11/23/week-in-review-5/#comment-417611
Greg: I am not saying that sunspots have a detectable effect on climate, but if you are trying to construct a model, as I was. from the basic temperature data, it makes it easier to remove them. That is why I choose 11 year centre point averaging which seems to be about right to remove random effects. although not critical. I have seen other contributors to this site use 60 year smoothing: that is far too much and removes real data.
> I responded in kind, as I do in person.
Which proves your test cuts no ice.
Your 9:12 pm response to Biggs was more to the point than your 7:53 pm one, FYI.
phatboy –
This statement seems to imply that recognizing that the sun affect the climate has only taken place in response to the “pause” (you know, the pause that “skeptics” wrongly call a “pause in global warming”).
Is that implication sarcastic or just flat out wrong and reflective of a tribal agenda?
Running means are often used as a simple low pass filter (usually without understanding its defects). Often it is referred to as a “smoother”.
I’d say you mean sometimes without understand its defects.
All transmitted digital data is subject to potential errors, Applying filters, or error correction, can remove these to all intents and purposes. Digital images are much sharper (usually) than their old analogue counterparts. But apply too much filtering and the information can be lost completely.
Using Excel its quite easy to graph a mathematical function. Like a sine wave, for example, which will be smooth. Then it is possible can add an error to each point using the random number generator. Finally you can use one of Excel’s smoothing routines which will remove most , if not all, of the noise. Its not too difficult to see when the smoothing is either too much or too little, but I’m not sure if it is possible to show mathematically what that needs to be.
I guess it depends on what message you are trying to convey?
http://www.woodfortrees.org/plot/hadsst3gl/mean:103/mean:127/mean:167/plot/hadsst3gl/mean:23/mean:27/mean:29/plot/sidc-ssn/mean:241/mean:281/mean:331/scale:0.0125/offset:-.8/from:1850
maks , Yes, very interesting link.
Peter, it is rather a trivial task to remove noise from a known signal.
What is not so easy is to remove noise from a data-set, to reveal the signal in all its glory, if you don’t know what the signal is.
What is not so easy is to remove noise from a data-set, to reveal the signal in all its glory
and if noise is the mechanism that forces entrainment ?
http://www.scholarpedia.org/article/Stochastic_resonance
maksimovich , interesting, thanks.
OK That’s true. It is more difficult but not impossible.
I think we would all agree that, an assessment of global warming, on a daily basis was too short a time. Maybe a century would be too long. Yearly is also somewhat on the short side. Intuitively I’d say a decade would be about right but I must admit that I don’t have any mathematical evidence to back that up.
“Its not too difficult to see when the smoothing is either too much or too little”
“Too much for what”. Can you see that you are introducing a spurious signal, no.
And what does ‘one of Excel’s smoothing routines ‘ do to your data? Oh, I don’t know but it’s _looks_ smoother.
That may be fine for economics when the results are usually wrong anyway but it is not acceptable in science and engineering.
Greg, this is a better illustration of what I mean by the impact of baseline and seasonal cycle removal choices.
https://lh5.googleusercontent.com/-038PBWKxOKc/UpAPpFk1DVI/AAAAAAAAKlI/9t8qqEOsWnw/w767-h437-no/baseline+choices+SH.png
Since the Antarctic data started in the late 50s the inclusion has cause some issues in the SH temperature series due to the short baseline period. By using the full ERSST SH data period for a baseline and removing the full seasonal cycle instead of the transition period 1951-1980 you get a different look. I am not saying it is right, just that the variance of the SH don’t look right.
Now if you have all the daily data that would be a different story, but with the monthly data?
OK, other things call.
don’t expect such close input from now on.
Thanks for a generally agreeable and productive thread.
A model. This one useful.
=====
Indeed:
http://judithcurry.com/2013/11/22/data-corruption-by-running-mean-smoothers/#comment-417213
Greg: I apologise if what I said came across as critical of your work. I too believe that a minimum 3 pole cascaded running average is a useful filter. I prefer it to things like Gaussian because, like all filters, that suffers from being sensitive to having a peak in its output that is the cross product of its sampling algorithm with the input signal.
That is what I was trying to show.
I obviously failed.
I also believe that using low pass filters cascaded into a bandpass configuration allows them to be used in the typical energy distribution in time form that most audio and radio engineers would recognise.
This allows the signal to be decomposed in time in a similar way to FFTs but without the computational complexity or signal length that FFTs require.
No harm in being critical if you have a valid point and can back it up. I wasn’t objecting to your comments but I was having trouble understanding the point you trying make. It seemed like you were pointing to something that I was unaware of and that interested me.
Perhaps you were just saying the same thing in a different way.
So far I’ve refrained from using the term “plagiarism” on the ground that it should not be used lightly. However after consideration of Goodman’s post including its references I’ve come to the conclusion that we have a clear-cut case of plagiarism here.
What Goodman has called a “triple running mean filter” is exactly what I presented at AGU last December (or here if that link gives trouble). The concept is described in the text below Figure 5.
I also presented it in my Climate Etc. post of December 4 last here, see the two paragraphs following Figure 5 there.
The post also linked to the Excel spreadsheet from which all 11 figures of the poster were obtained, accessible via the tabs at the bottom. The supporting filter technology starts at cell P219 of the spreadsheet’s main (first) sheet. Impulse and frequency responses of the “triple running mean filter” are plotted starting at cell AA241, in both graphical and tabular (AN240 and U258) forms.
A few days later (Dec. 9), Goodman noticed the filter and commented on aspects of it here. My immediately following reply addressed what I felt then were the main relevant points about the approach. Extensive discussion of the filter (among other topics) followed.
Six months later Goodman described the filter at his own blog. He did not attribute it to anyone.
Now it is the custom when publishing anything that if you don’t attribute something then either it is reasonably well known (you would not need to attribute Quicksort when describing the method) or you’re claiming it as your own. That is the standard used when judging claims of plagiarism.
In this thread Goodman tried to claim,
it quickly became apparent that [Pratt] didn’t understand much about filters and had been give this one by someone else who did. Since this filter is pretty standard in real time audio processing and one of his students went on to set up a business identifying songs by real time audio processing, I have a clue who that may have been.
He’s referring there to my Ph.D. student Keyvan Mohajer and conjecturing on no evidence whatsoever that Mohajer told me about this approach. Needless to say this is merely adding insult to injury.
He also claims, again with no evidence whatsoever, that my filter is “pretty standard in real time audio processing.” Here Goodman is simply trying to avoid the charge of plagiarism by claiming that the method is well known, which would be entirely reasonable if it were true. The method in question uses a second and third running mean to hit two points in the first side lobe created by the first running mean in order achieve the very flat response I tabulated and graphed in cells Y278:Y313 of the main sheet of my spreadsheet.
Even if it were true that this method is “pretty standard”, it is clear that Goodman learned the technique from me, and is now blustering about how I must have got it from someone else in order to avoid crediting me for the method.
Well, I confess! I obtained the method from a certain someone who posted here on Climate Etc. a year earlier, on November 6, 2011 to be precise. That certain someone described how to use WoodForTrees’ Mean feature to push down at one point on the side lobe created by a previous use of Mean, exactly as described in Goodman’s post above in his “Example of how to effect a triple running mean on Woodfortrees.org”, as follows.
If instead of using Mean n twice you use Mean n and Mean 2n/3, the
latter flattens the lobe between 3n and 3n/2 (the 2nd harmonic of 3n)
even better but without taking out as much of the frequencies below
period 3n. For example you might use Mean 30 in conjunction with Mean
20, or Mean 54 with Mean 36. This kind of pairing makes for quite a
nice filter. More elaborate filters can be constructed along the same
lines with as many Mean’s as you want. The fact that they all commute
simplifies the space to be explored. It is highly unlikely that you’ll
ever see much benefit from using more than three Means; I’ve never had
occasion to explore beyond two.
My improvement over this a year later was to “explore beyond two” by pushing down on two points in the same side lobe in order to get an even flatter frequency response, exactly what Goodman is now calling a triple running mean filter.
So who was that “certain someone” that I got the idea from a whole year earlier?
Well it was the author of this post tilted “Harmony of the climate.” Click on the link and you’ll discover the identity of the idea’s true inventor, at least as far back as anyone here has been able to trace the idea anyway. (And no the author was not Keyvan Mohajer.)
What raised my own suspicions was that Goodman was referring to it as a “triple-running mean”, yet I could find only 4 cites in Google scholar to that phrase. Now we know the story.
In the spirit of the Pratt Parser, I will call the triple-running mean the Pratt Window in my CSALT interface.
Life’s too short for plagiarism disputes. Lots of people outside formal academia don’t bother with references – it’s a bit different if an *explicit* claim of priority or originality is made.
Regarding the ‘triple running mean’ filter, you might be interested (if you don’t know already) in the cascaded integrator-comb filters, which are equivalent to a cascade of (identical) running means. Someone might have tried a variant with different widths cascaded together. It seems like an obvious thing for anyone to try, but I don’t know of any specific examples.
I was playing around in R, a bit. Is this the sort of function you mean?
# #################
# Define useful functions
sinc = function(x) {sin(pi*x)/(pi*x)}
dB = function(x) {10*log10(x)}
plsinc = function(lst,x,maxlen) {
res=rep(0,length(x)) # create zero vector of right length
for(a in lst) { # loop through list of multipliers
res = res + sinc(a*x) # add sinc function values to result
}
res_dB = dB(res^2) # power in dB
max_fn = max(res_dB,na.rm=T) # max of function
max_sl = max(res_dB[1:maxlen],na.rm=T) # max sidelobe
label_lst = paste(lst,collapse=”,”) # make list of multipliers
# chart label
label=paste(“Mults=(“,label_lst,”) sidelobes=”,signif(max_sl – max_fn,4),”dB”,sep=””)
# plot the chart
plot(x,res_dB-max_fn,type=”l”,ylim=c(-90,10),main=label)
abline(h=max_sl – max_fn)
return(max_sl – max_fn) # return sidelobe level
}
# Domain is (-20,+20)
x=seq(-20,20,0.01)
# Plot an example
plsinc(c(1,1.6375,2.088),x,1931)
@NiV: Life’s too short for plagiarism disputes.
I take it you don’t edit Wikipedia articles. ;)
@NiV: Someone might have tried a variant with different widths cascaded together. It seems like an obvious thing for anyone to try, but I don’t know of any specific examples.
That was how I felt last December. In the meantime I’ve seen exactly zero evidence to suggest that anyone has had my idea of pushing down on the first side lobe at two points, which is the technique Goodman is calling “triple running mean” (apparently without first checking whether the term is already in use, which it is but not with that meaning).
If this were a well-known technique in audio processing as Goodman claims, then the optimal values for the ratios would be known by now, since it’s an obvious question to ask. My AGU poster did the best it could with the limited resolution available (21, 17, and 13 were the three periods I used to filter out the Hale cycle which is as close to optimal as possible for integer widths, which is what one is constrained with moving average filters). Goodman asked it himself but got a wildly suboptimal answer, much worse than in my poster, inspiring little confidence in his grasp of the underlying principles of the method described in my poster (more on this below).
Your R program is the right idea. Very minor point: what does your sinc function deliver at 0? It should be 1 but you’re dividing by zero there. If it were 1 then max_fn would always be 10*log10(1) = 0 so I’m not sure what role you thought max_fn would play..
More importantly, why are you adding sinc’s together instead of multiplying them? I have no idea what adding them would mean but that’s not how frequency responses are computed.
Thirdly why are you computing sinc(a*x)? Shouldn’t that be sinc(x/a)?
Fourth, why 1931 when one would expect 1900? 1931 picks up some of the initial rolloff before hitting the zero at sinc(1), whereas 1900 stops exactly at the end of the first side lobe on the negative side.
Try it again and see what you get with Goodman’s suggestion of c(1,1.3371,1.7878). Then compare with c(1,1.2067,1.5478). Should be about a factor of about three better (smaller) in amplitude, so 9 in power, so a tad less than 10 dB improvement.
You can get a more visual idea of just how far from optimal Goodman’s choice of ratios is from this graph plotting the amplitude of the first side lobe in each case.
Apparently Goodman never looked at the filter section on the first page of my spreadsheet from last December or he’d have noticed that I was getting a nice flat response at cell Y279, never going over 0.4%. Goodman’s ratios give his version a leakage of 0.9% in that area of the frequency response, about 10 dB worse than mine in your way of looking at it (physicists tend to use amplitudes). I get the impression he doesn’t have strong intuitions about how my F3 filter is supposed to work, his post here about it notwithstanding.
In your CSALT interface, Web, why “Window”? Wouldn’t “Filter” be more descriptive?
The uses of “triple running mean” that I’ve seen in the literature prior to 2013 refer either to a single running mean with a window size of 3 samples (what WoodForTrees gives when you select Mean and enter 3) or to three moving averages with quite different window sizes, e.g. 5, 10 and 20 such as here.
Meanwhile I ran across something puzzling on Wikipedia. The article on Moving Average was edited on Nov. 10 by an anonymous editor with IP address 82.149.161.108 (in Georgsmarienhütte, Germany, perhaps?) who cited Goodman’s blog as the source for the editor’s claim that “This solution [triple running mean] is often used in real-time audio filtering since it is compuationally quicker than other comparable filters such as a gaussian kernel.”
However Goodman’s blog does not mention audio, and the first time Goodman claimed any such thing here was on Nov. 22. It would be interesting to know where this editor got the information about real-time audio if not from Goodman personally. I seriously doubt it appears anywhere else older than Goodman’s May 2013 blog post. It seems very likely Goodman simply made this up.
Wikipedia also gives Goodman’s number of 1.3371 as the right ratio to decrease the window size each time. Clearly neither Goodman nor the editor understood the spreadsheet supporting my poster, which gives 0.4% as the maximum passed by my F3 past the cutoff, see cell Y279 on the main sheet. 1.3371 gives 0.9% which is considerably worse. More on this in my reply just above to NiV.
If there were any truth to Goodman’s claim that my technique is well-known to audio engineers he would not have had to try and guess what the right numbers were since the audio engineers would long ago have figured them out and he could have simply looked them up. Instead he tried to work them out himself, which turned out to be above his pay grade.
First time I read your comment, Vaughan, I read “in your CSALT face”.
Oh, and this:
https://twitter.com/nevaudit/status/404976513805594624
wins.
Vaughan Pratt: Here Goodman is simply trying to avoid the charge of plagiarism by claiming that the method is well known, which would be entirely reasonable if it were true. The method in question uses a second and third running mean to hit two points in the first side lobe created by the first running mean in order achieve the very flat response I tabulated and graphed in cells Y278:Y313 of the main sheet of my spreadsheet.
I heard of repeated running means and repeated running medians decades ago. At the times, choices like “running mean of 3 repeated”, and other lengths like 5, 7 and means vs. medians were justified post-hoc by whichever produced the most reliable results in context, partly because the transfer functions for the running medians can’t be computed analytically, and the running medians are more robust to the “epsilon contamination” that sometimes occurs. Some nomenclature like “3R3” for “3 running means of length 3” was in the papers I read. I have not saved a good searchable bibliography from those days, early 80s, but my recollection is that at least some of the papers were authored by statisticians at ATT Bell Labs.
Here is a paper by Colin Mallows, 1980, addressing some ideas of John Tukey: http://projecteuclid.org/DPubS?service=UI&version=1.0&verb=Display&handle=euclid.aos/1176345067
Vaughan, I will change it to the Pratt filter instead of Pratt window on your suggestion.
I typically have referred to it as a window function in the time domain and a filter in the frequency domain. So the Pratt filter would be the convolution of three box windows operating in the time domain or the multiplication of three sincs in the frequency domain.
@WHT: So the Pratt filter would be the convolution of three box windows operating in the time domain or the multiplication of three sincs in the frequency domain.
Certainly not. Cascaded box filters have been known for decades, and are even named for someone though Google was unable to remind me of his name just now. An n+1 point binomial filter is identical to a cascade of n 2-point box filters and its impulse response or kernel tends in the limit to a Gaussian. And so on.
The novelty in my method (assuming no one thought of it before) is to choose suitable points in the first side lobe as the window widths for the subsequent box filters.
Here are the optimal such choices for up to 5 filters, when the first filter’s side lobe is hit by the remaining filters, each of whose windows will be shorter than that of the first by a factor in the open interval (1,2).
The corresponding maximal leakage past the filter’s cutoff is given as both an amplitude in % of signal, and as a power in dB as NiV was doing in his R program.
2: 1.3937 Leakage 2.5% or -31.9 dB
3: 1.2067, 1.5478 Leakage 0.31% or -50.1 dB
4: 1.1252, 1.3440, 1.6275 Leakage 0.039% or -68.3 dB
5: 1.0832, 1.2343, 1.4352, 1.6757 Leakage 0.0047% or -86.5 dB
If this determination of the optimal points has not previously been done then it’s a safe bet this is new stuff.
I found these numbers numerically. If there exists a closed form formula for them that would be of additional interest.
At the risk of repetition, I assumed everyone understood that the width of each of the windows was implicit in Vaughan’s formulation.
The declarative DSL that I use in the CSALT model encodes the Pratt filter like this:
A window Temperature*12,
B window A*9,
C window B*7.
Temperature series transformed to C.
Each of the window operators does a symmetric convolution with automatic scaling.
One caveat worth keeping in mind about cascading box filters is that although the frequency response above the cutoff frequency is flatter, the 50% point (where the power is down 6dB) moves progressively lower in frequency with more filters.
This plot shows the frequency responses of 1 through 5 cascaded box filters using window widths optimized as above for flatness of the frequency response above the cutoff (at 1).
With one filter the response (which in that case is just the sinc function) is down 50% at 0.603 of the cutoff frequency. At five filters it’s down to 0.349 of the cutoff frequency.
> Exactly, if he was in front of me he would probably not start his comment with “Goodman betrays…..”
Biggs started his comment with:
Sounds like a nit to me.
***
Anyway. If you take offense with such a comment, imagine something like:
I see no reason to expect you’d not express yourself with the same condescension facing anyone, even someone who made you look bad in a previous exchange.
***
BTW, I’m not sure I can reconcile your “he didn’t understand much about filters and your “You are clearly pretty skilled in dsp and filter design and fully aware windowing issues” here:
http://judithcurry.com/2012/12/04/multidecadal-climate-to-within-a-millikelvin/#comment-275967
***
Anyway. I’m just posting it here to honour your habit of punting at the end of the thread.
***
[1] Who is Keyvan Mohajer?
http://judithcurry.com/2012/12/04/multidecadal-climate-to-within-a-millikelvin/#comment-277835
Although Willard posted the link to this comment
http://judithcurry.com/2012/12/04/multidecadal-climate-to-within-a-millikelvin/#comment-277835
in response to the question “[1] Who is Keyvan Mohajer?”, by coincidence that comment (which inter alia answers that question) was mainly in response to Goodman’s remarkable claim,
@GG: Sorry this is absolute nonsense. I might buy attenuations of higher freqs but if you have ZERO fundamental your idea has no ‘fond’ or foundation.
I imagine Goodman would be shocked to learn that the telephone company chops out the fundamental frequency of human voices, at least for typical males. At some point they realized that only the higher harmonics needed to be transmitted for adequate intelligibility if not hifi. Wikipedia has had an article
https://en.wikipedia.org/wiki/Missing_fundamental
on this topic since 2003. The article claims “Most common telephones cannot reproduce sounds lower than 300 Hz” but even a high fidelity telephone can’t because those sounds were removed long before the signal arrived at the house.
> [B]y coincidence that comment (which inter alia answers that question) was mainly in response to Goodman’s remarkable claim […]
Coincidence?
You be the judge!
;-)
Now that the guest poster has declared the primary discussion at an end. let me as a layman say that statistics as a substitute for data leaves me cold, no matter which side is asserting it.
The main problem with temp data, paleo etc. is not the wrong filters, the wrong assumptions, the wrong smoothers. The problem is the data sucks. Like a black hole.
You can argue all you want that this statistical legerdemain or that gives you a better picture of what unmeasured data over vast areas of the Earth – land sea and air, and over millenia and more of time, should be. But the measurements themselves are so sparse, inaccurate and imprecise that it is all a guessing game.
And yes, sometimes “we don’t know” is the ONLY right answer, when the question is – Should we reorder the entire world economy based on this artificial data.
What would be really funny, would be to see those stupid voters being told about all of the assumptions and “statistical” analysis that goes into the scary CAGW reports
Instead of:
“HOTTEST DECADE EVER!”,
You could have
“Highest estimated running mean, by a tenth of a degree, based on krigged, guesstimated anomalies, infilling and modeler assumptions, we think.”
Not as catchy I guess. They’d be better off just publishing a pic of a dead polar bear and a hockey stick. Oh wait….
GaryM
We have arrived at the somewhat Orwellian situation (two legs good four legs bad) whereby numerical data of any kind, no matter how tortured, is considered by some to be preferable to historical ‘anecdotal’ data which has not been altered.
tonyb
tonyb,
Leave out the “somewhat”, and I’m with ya 100%. :-)
Mosomoso
Yes, the cricket is going well for us. After robust adjustment and kriging the smoothed average using a Gaussian filter, England are 550 for 1 and just need another 3 runs to win.
tonyb
Hmm. Big ask to get that run chase target in two days. Best the Poms can hope for is a draw, with some help from a tropical rainstorm or two? ;)
Peter
You need to stop looking at that old fashioned historical data (AKA The score board) and get with the program by accepting my robustly adjusted figures which demonstrates a stunning win for our side.
tonyb
Tony, some Indian bookmakers wanted me to give them your address. I’m not sure if they want to give you a job or do a job on you. Since I can’t remember if we Oceanians are at war with Eurasia or Eastasia this week, I thought I’d better tell ’em nothing.
Good news! There’s a 20% chance that your one dismissed batsman is actually a South African. And the BoM is prepared to forecast two days of torrential rain if you stop the anecdotes.
What’s more, a super-computer is presently working on making drawn test matches from forecasts rather than actual rainfall. Of course, the usual old dinosaur conservatives are opposing this obvious advance. They never think of their grandchildren!
Mosomoso
I would normally agree that using BOM forecasts is going to be better than waiting for the actual data -in the form of real world play or real world rain-to arrive in that tedious old fashioned ‘dinosaur’ manner.
Consequently I would have been prepared to accept the more modern method of interpreting data you suggest if the wikipedia page had not already been amended that shows a crushing victory for our side.
I’d like to cooperate but my hands are tied.
(with ap0logies to Greg for these apparent off topic comments but interpreting data is the subject of this thread)
tonyb
How to adress that r3m will narrow the time range? I mean, if I want to improve a 12m running mean, the 12m running mean will cut 6m at each end. But, if I then reiterate with a 9m running mean, then with a 7m running mean, I will first lose an additional 4.5m of smoothed data at each end, then another 3.5m. So if my input is only a few years, and I need a 12m smoothing to remove seasonal changes, little or nothing will remain after r3m has done its job.
Or am I missing something?
What you’re missing is sufficient data
Precisely, and in climate science that’s easily amended by modelling or proxies. :)
That particular problem will sort itself out in time :-)
the problem is you need a wider window to provide a decent filter, whatever way you go, there’s no free lunch. The truncation of data at the ends is one disadvantage with these weighted average (convolution) filters.
If you just want “smoothing” a r3m of half the width will look as smooth or smoother.
If you only have very short datasets in relation to the period you need to remove, or you absolutely need to include the most recent years in the result, subtracting out the average cycle may be of more use.
It’s pretty crude and is not very good when that annual cycle gets bigger/smaller as for example with post 2007 arctic ice, but if you have long enough data for the cycle to change you probably have enough to run a filter, so the two solutions fit different needs.
Greg-
Kudos to you. The patience you have exhibited and your willingness to address all the comments are remarkable.
Agreed!!!
Thank you Greg. From my point of view, old, retired, non-scientist who has been hanging around here for several years, the best, most responsive by author, and most valuable guest post ever.
And half the people here will still fail to understand that a huge percentage of the oh so important wiggles in published ‘climate trend data’ are actually artifacts of the ‘processing’ that was done to identify the underlying one micro degree/mega year CO2 driven temperature rise that is going to kill us all unless Something Is Done Right Away. And that the actual data was killed and buried during the processing.
Simple solution is to use a Butterworth filter. This addresses all the issues raised but has a nominal phase shift that may need to be addressed.
1) forward FFT
2) apply filter (the complex terms)
3) back FFT
This can all be done in Excel.
Now try using it with very short signal captures such as those in climate data. Does terrible things to the output which vary depending on the length of signal you apply.
Greg said on http://climategrog.wordpress.com/?attachment_id=647
“It may be coincidental but the first triplet has a modulating frequency that matches the orbital period of Jupiter to 4 significant figures.
pJ = 11.8624 years”
So Jupiter may control some percentage / timing of our sunshine. Can you elucidate on that for us ? In practical terms what does that mean, is there a pattern of varying sunlight other than the normal winter summer situation ?
Also,what was the significance of 1.85, is that an artefact of signal processing ? or an external input the source of which is as yet unknown ?
Nonsense. It effectively removes noise. The cutoff can be as sharp or as soft as you choose.
And, depending on how sharp or soft the cutoffs are there are larger or smaller ‘rings’ or overshoots in the output. Same happens with long or short sample lengths.
Try using a simple square wave as the input signal and see what output you get.
Then consider how those overshoots do not actually disappear even if the input signal is pure white noise.
Been round this particular problem many, many times down history with the analysis of analogue signal data.
As Greg correctly points out, every filter of every type has a particular characteristic it imposes on the output.
The question is do you understand and accept that or try and ignore it.
Yes and one can contrive any scenario to highlight a weakness in any filter. As I said there are issues that need to be assessed afterwards. One of these, phase shift, can be readily identified and fixed. The key here is processing as in changing the nature of the data (or rather signal). The result is a corruption by design which is why I think the title is a misnomer or I’ll defined – you’re viewing augmented, post-processed data.
I feel ill.
=====
Much better: I hear your ‘ill’.
===============
Did you mean: YOU’RE I’ll?
in lieu of an open thread I thought I would just comment on the lack of pause in global warming despite a sharp drop in solar output
http://www.woodfortrees.org/plot/hadcrut4gl/mean:132/from:1950/plot/sidc-ssn/mean:132/normalise/from:1950/scale:0.5/offset:-0.2
wouldn’t the fringe hypothesis of natural climate change predict the world to have started cooling by now or at least stopped warming?
Of course this doesn’t prove anything but it is food for thought.
iolwot
Last time you mentioned the pause I sent you two pdf’s from the Met office on this very subject confirming it and mentioned I was there just a couple of weeks ago and spoke to a couple of their scientists working on ‘the pause,’ in between discussing CET
They admit it as a fact. Unless you have got much better information than the Met Office scientists (and I thought THAT was the sceptics job) perhaps you can clarify why you are a ‘denier’ of this very simple fact?
tonyb
Its been cooling slightly for the last 6 years, so the combination of increasing co2, the current solar high and the approx ten year buffer from the last solar high and a warm AMO have not been enough to maintain temperatures. That slight drift downward should steepen over the next 6 years or so, with perhaps a more marked change at about 2020 when the AMO should turn negative and sunspots go reduce or go missing. But we’ll see, time will tell. Hadcrut 4 is not a credible data set.
@JM: Hadcrut 4 is not a credible data set.
Science can only work with the best data it has. The world awaits your more credible data set with bated breath. (Or baited breath for those waiters who’ve just been eating fish.)
And when I say “can” I mean “will”. Try and stop us.
Please Greg can you make sense of this?
If the real data varies on daily cycles by anywhere from 0 to 10 degrees and the variation of an annual cycle is another 10 to 25 degrees both with random variation, then what would be the statistical likelihood of being able to make a hundred year prediction of a systematic change of 2 degrees based on 34 years of reliable data?
I have to agree with the idea of this post.
The object of a filter is remove components in a signal that are irrelevent to the components that are of interest. Clearly, if there is a high frequency transient in a signal and one assumes that the “noise” is high frequency, one will attenuate the transient.
Obviously, if the filter removes any correlated components that are not noise (i.e. uncorrelated) it will affect the auto or cross correlation functions derived from the signals in question and in general increase the serial correlation.
With short records, one is of course left with the start-up and switch-off transients (if using zero phase filters) but this can be handled.
I have always wondered why climate scientists do not design filters that are appropriate to the data as opposed to using crude finite impulse response filters. Inappropriate filtering and decimation can have significant effects on signal quality.
http://judithcurry.com/2011/10/18/does-the-aliasing-beast-feed-the-uncertainty-monster/
@RCS: I have always wondered why climate scientists do not design filters that are appropriate to the data as opposed to using crude finite impulse response filters
How do you distinguish “crude” from “not-crude.” And what is the cost-benefit tradeoff between them?
As far as FIR filters are concerned, who do you know who has derived even one tiny epsilon of benefit from infinite impulse response filters? FIR filters are the stock-in-trade of wavelet theory, and for good reason: they are practical!
I do agree however that the filters should be appropriate to the data. A post on this topic would be far more useful than the post currently under discussion..
The emphasis is on crude!
GG – A admire the fact that you are willing to stick it out and respond to all comers here.
You are, of course, absolutely right — along with Pekka — all smoothed data is corrupted data. You may need the corrupted data, but you’d better really really understand exactly how you’ve corrupted it and must never pretend it is the real data itself.
Anyway, three cheers!
Thanks, understanding what a filter does (and realising a “smoother” is a filter) is the main point.
GG ==> I use “corrupted” in a more classical sense — not in the sense of an “intentional poisoning” or “degrading” ==> it is corrupted as it has been transformed into something it was not — it certainly is not the original data any longer and it may now have features that are not scientifically consistent with the original data set. I agree 100% that it is the understanding, at a deep level, of what a filter actually does that is important. I fear that many of our younger researchers, having grown up with computers at their fingertips, see only the graphical results of these transformations==>some I fear keep fiddling until they see one they “like”.
Overall, I have a slightly different takes on this, and will probably write up myself, veering off into the mistakes that can be made when data is heavily smoothed and then used as input into another processed which is then heavily smoothed, repeatedly, then end result then treated as if it had the same, or even greater, value than actually measured original data.
Thanks for your good work here.
@KH: You are, of course, absolutely right — along with Pekka — all smoothed data is corrupted data. You may need the corrupted data, but you’d better really really understand exactly how you’ve corrupted it and must never pretend it is the real data itself.
Gosh, here it is 11 months after I posted the conclusions of my AGU poster here and people still have not grasped the point of Figure 11 of my poster.
The point of filtering is not to hide data. It is to separate it into spectral components whose sum is the original data. This is what Figure 11 did. One cannot claim that information is lost when the original data can be recovered as the sum of the components. One can only complain that there are better analyses.
Fourier analysis is one way of going about this, but for many practical reasons it is far from the best. There are much better ways to analyse data as a sum of different components.
How can an analysis of this sort “hide the data” when that data can be recovered to five decimal digits of accuracy simply by adding the components of the analysis?
Apparently the concept is much harder to grasp than I’d realized a year ago.
Sorry, here’s the correct (I hope) link for Figure 11 of my AGU Fall Meeting 2013 poster.
Ok, I’m mystified. Try this link.
http://clim.stanford.edu/Fig11.jpg
For reasons I don’t understand, WordPress keeps sticking “judithcurry.com/2013/11/22/data-corruption-by-running-mean-smoothers/” after http:// in the URL I’m trying to post. Wonder if it will do it with the above.
Phew, that worked. Still mystified though.
I don’t know exactly how you’re formatting your comments, but if you insert a URL between the quote marks for the href in an anchor tag that lacks the protocol type (e.g. “http://”), the browser (and, I suspect the comment formatting software) will assume that you’re using the current URL as a base reference, and tack it onto the beginning.
This is easy to do: depending on where you get your URL’s, they often begin with the domain (e.g. “www.stanford.edu” or “clim.stanford.edu”). If you insert them directly in the href parameter of the anchor tag in your comment, they will be tacked onto the end of the URL of the post you’re commenting on (without the hashtag or anything after). Thus, when your URL is missing the “htttp://”, you need to manually insert it.
I’d give examples, but the comment formatting software would probably mess them up, making things more confusing. But see any online HTML reference.
One cannot claim that information is lost
Fig 11 link is 404 not found (lost)
Sorry about that, see above. I’d take the blame if only I knew what I’d done wrong. Mystified.
Vaughn ==> To make a link work here, you will need to start with http://
then the domain name (usually http://www.domain-name.com/org/or/net — but in your case http://clim.stanford.edu/whatever) . You eventually found this solution yourself. Using anything else, or whatever you used originally, is apparently considered by WordPress to be a “relative link” — relative to this particular post’s root.
Oh, of course. Thanks, Kip. I’ve made that mistake before, silly of me not to recognize the symptom.
Vaughn ==> I have no opinion bout your earlier post of your AGU poster.
My comment is about smoothing being a corruption (of sorts) of the data and the need to truly understand what one has done in the process — with a caution not to believe that one’s transformation necessarily leads to a better understanding. I don’t believe I mentioned “hiding data” and don’t believe smoothing hides data — but it certainly throws a lot away!
Again, I have no opinion about your transformations, your “separat[ing] it into spectral components whose sum is the original data”. Of course it may, if the separation is sound and based on true physical properties.
What Vaughan did was to use smoothing as a method for separating the low frequency signal from the residual and to retain both. Nothing is lost in that, but the usefulness of the separation varies from case to case.
What most of the others have been discussing is to retain only the smoothened data loosing the information in the residual. That may involve many intentional and unintentional effects that mislead people who look at the outcome.
The number of highly misleading smoothened graphs of large variety linked to in comments on this site is huge. I’m sure that the commenter is very often as or more confused than others who look at those graphs.
Pekka, “The number of highly misleading smoothened graphs of large variety linked to in comments on this site is huge.”
Any site really. Graphs are just a way of communicating your opinion. Remove everything you don’t understand or care for and what is left is your opinion. No information is lost, it is just the inconvenient parts are not displayed.
Pekka == I am a confirmed practician — only practical stuff, like blue water sailing, a little crypto, web infomatics, dabbled in chaoticial systems, etc.
Dissecting the data into components as Vaughn has done may be a wonderful thing and may be truly enlightening in some cases — don’t know. But if I had a data set, I would want to be very sure that the components I broke it into actually informed me of something real — not just interesting in a mathematical or statistical sense.
That’s all my comment is meant to imply — the understanding needs to be there, both before and after any data transformation.
Thanks for helping me understand.
@Kip Hansen if I had a data set, I would want to be very sure that the components I broke it into actually informed me of something real — not just interesting in a mathematical or statistical sense.
Not everyone has the same interests, Kip. I find it interesting that the component I labeled SOL in my analysis is remarkably well correlated with the solar cycle, both in frequency and phase. It tells me for example that HadCRUT3 is very unlikely to be merely a random walk as some people claim to have proved using statistical methods.
If a sentence were being typed in Romanized Linear B on your computer screen by some remote typist and you were informed that a monkey was doing the typing, you might find that easy to accept. But would you find it equally easy to accept if it were grammatically correct English?
I also infer that that the historical temperature measurements, however inaccurate they may be, are not so inaccurate as to mask physical phenomena. I can therefore expect similar or better accuracy for longer-term physical phenomena since they will be defined by even more samples.
Vaughn — That’s for your explanation of your work ….you are right, we are all interested in different things. You shouldn’t assume that just because I read and/or comment here that I am particularly interested in the ongoing squabble about the GAST data sets. Liked your poster, though.
@KH: Liked your poster, though
Thanks! In the meantime I’ve overhauled it some, it will be interesting to see whether the overhauling generates more criticism or less. Later, rinse and repeat.
But you and I are from the generation Planck had in mind when he said “Science advances one funeral at a time.” Should we be paying more attention to the 20-somethings who hang out on Climate Etc.?
Vaughan Pratt said:
The temperature is not a random walk, but the forcings can be just about anything.
This is the lastest fit for the CSALT model. I incorporated the 12-9-7 Pratt filter on GISS data, and left the model parameters unfiltered
http://img199.imageshack.us/img199/5215/ua63.gif
This gets rid of the seasonal noise and leaves the rest of the data moderately smoothed.
Can anyone guess which is the data and which is the model? Two colors to choose from.
Lucia and company are wasting their time trying to apply ARIMA techniques, etc on the temperature time series itself. The residual after an R=0.99 is approaching white noise..
Pekka Pirila said
Got that right. This CSALT fit only uses the Pratt 12-9-7 monthly filter
http://img199.imageshack.us/img199/5215/ua63.gif
The residual of the model fit has a frequency spectrum that is approaching flat.
Most of the people that are doing the smoothing incorrectly are the kranks that use filtering to mislead and thus convince rubes that the accepted climate science is wrong.
Vaughn ==> I’m afraid so — my short answer is that we should respect the enthusiasm of the younger generation and acknowledge that many of them have fine sharp discerning minds. We should also reserve our sense of caution in light of our lifelong (or long life..) experience of how easily youth is led astray by intellectual chimeras. I shudder when I look back at some of the nonsense I was “sure” was true when I was 22 . We have seen many scientific/intellectual fads rise and fall in our time — some are still rising and have yet to fall. Unfortunately – only time will tell. (and we may not have that much time left!). My approach has been to try to help re-focus attention on the basics–over and over and over.
@KH: My approach has been to try to help re-focus attention on the basics</I
Mine too. Way to go!
There are two separate issues – what the filter does to the shape of the data, and what the filter does to the accuracy of the data. Talk of “corruption” and outputs being “wrong” is referring to accuracy, but for this to have a clear meaning requires that we include information that has not, so far as I can see, been discussed here.
One of the most widely used applications of filtering/smoothing is in the situation where we have a low-frequency narrow band signal added to high frequency or broad band noise – applying a low pass filter attenuates the high frequencies from the sum, which removes a lot more noise than it does signal, thus improving the ‘accuracy’ (closeness to the signal) of the result.
But this application makes no sense unless you have clearly defined what you mean by ‘signal’ and ‘noise’. If you consider it all signal, then smoothed data is of course less accurate. If the signal you want is actually at the high frequencies, then smoothing is worse than bad. All the discussion above is based around an implicit and unstated assumption of low frequency signal/high frequency noise, that misses the essential point.
When filtering, you must first identify the frequency spectra of signal and noise separately, then design your filter to attenuate those frequencies for which the noise is bigger than the signal. Then because you are always removing more noise than signal, the result will be more accurate. However, you must be aware of what this does to your signal – those frequencies where the signal has significant power, but where it is drowned out by the noise, are lost in the processing, so the signal will be distorted in certain specific ways. You need to know what they are so you don’t try to draw conclusions based on those aspects.
All the comments on the merits of this or that filter are empty without a discussion of the characteristics of the signal you’re trying to extract.
The question of whether the negative lobes of the sinc function are “wrong” depends on whether the signal in this part of the spectrum is considered ‘signal’ or ‘noise’. If they’re signal, then inverting it is worse than just deleting it. If they’re noise, then it doesn’t matter which way up the noise appears, all that matters is its amplitude. The sinc response is then poor simply because the sidelobes are too big, rather than them inverting stuff. The primary advantage of the moving average is that it is an extremely simple way of getting an exact null at a desired frequency. But there are better ways of doing that. Simplest of these would be to smooth with a moving average, and then use a Gaussian filter – the moving average nulls the frequency, then the Gaussian gets rid of the sidelobes. But it’s still not ideal. A further improvement could to use a sinc-shaped filter to get a square-topped frequency response, passing through all the data for which signal is greater than noise. It depends.
Agreed!!!
@NiV: A further improvement could to use a sinc-shaped filter to get a square-topped frequency response, passing through all the data for which signal is greater than noise. It depends.
Quite right. The exact width and rolloff of each band determines the rate at which the side lobes decay. If you want a modestly square octave-wide frequency response you can get this using the Mexican hat wavelet, aka the Ricker wavelet, which decays the side lobes relatively quickly.
Although it’s far from obvious from the way I described the filters in my AGU spreadsheet, this is in fact how the four filters (serving to separate four octaves) actually worked in cascade. To see this, download my spreadsheet and set columns AN52:AN212 to zero. (Enter 0 in AN52, select the range AN52:AN212, and type ^D.) Now enter 0.4 in AN130. This will serve as the impulse (scaled to 0.4 so as not to require rescaling the plots), allowing you to observe the impulse response at each of the subsequent filters.
There are four outputs to observe, which can be seen graphically two at a time in respectively Figures 9 (SOL, accessed via the tabs at the bottom) and 12 (DEC). All four plots are of approximate Mexican hat wavelets of progressively decreasing width as you go up in frequency, an octave (more or less) at a time.
Nowadays I skip all this cascading stuff and just work directly with the wavelets needed for any given band.
@NiV: But this application makes no sense unless you have clearly defined what you mean by ‘signal’ and ‘noise’.
A point that I had hoped would be evident from my poster, but which in hindsight clearly wasn’t, is that it made no distinction between signal and noise but treated all frequency bands in the signal as equally important. I discarded none. The last figure, Figure 11, collects all the bands into three main groups, namely MUL (multidecadal), SOL (solar), and DEC (decadal). Their sum is exactly HadCRUT3. I discarded nothing!
I too use filters to decompose the signal into separate frequency bands and in the process keep all of the data.
This sort of analysis seems to be misunderstood a lot.
As you say, it is possible to re-create the input by adding together all of the outputs so nothing is lost. Possibly miss-assigned but that is another story.
RLH: This sort of analysis seems to be misunderstood a lot.
You can say that again. And probably should. :)
RLH: Possibly miss-assigned but that is another story.
Exactly so! A complete analysis (complete in the sense that you can recover the original signal exactly as the sum of the components) replaces the complaint about discarding information with complaints about inappropriate associations of components with phenomena. One might attribute 100% of an exponential rise to CO2, for example.
Pingback: Weekly Climate and Energy News Roundup | Watts Up With That?
WHT, I’ve been thinking about you 360 peak. This seems most obviously to be 12*30 days. You managed to knock about half of that peak out by subtracting. What’s the other residual peak ? Is it 31*12 by any chance.
It would be interesting to see which dataset introduces this 360 peak.It should be fairly easy to identify the source by elimination or by running your spectral analysis on each input.
BTW I was in error about the 1.85 year peak being an alias, I applied the wrong formula, the alias would be at half that value. Even the alias will likely be weak when that close to the averaging period. We really need daily scale datasets to detect lunar signals.
Damn, I’m having trouble with WordPress today. What I was trying to post here was this:
WHT, I’ve been thinking about you 360 peak. This seems most obviously to be 12*30 days. You managed to knock about half of that peak out by subtracting. What’s the other residual peak ? Is it 31*12 by any chance.
It would be interesting to see which dataset introduces this 360 peak.It should be fairly easy to identify the source by elimination or by running your spectral analysis on each input.
BTW I was in error about the 1.85 year peak being an alias, I applied the wrong formula, the alias would be at half that value. Even the alias will likely be weak when that close to the averaging period. We really need daily scale datasets to detect lunar signals.
There seems to be a lot of discussion on types of filters. This seems to be one step removed from the central points, which are 1) Any kind of filtering introduces a loss of resolution in the output data. 2) You have to know exactly what you are looking for before you can design a suitable filter to find it. So called “matched filters” are used in other disciplines to recover signals down in the noise, but that only works because the characteristics of the data are known beforehand.
If you don’t know what you are looking for, how can you say that the filter used isn’t distorting the results ?…
Chris
Greg: Do you see any merit in using cascaded filters in a bandpass configuration to assign the signal into frequency bands for further analysis?
I believe that this is a useful method but no one else seems to agree.
There has been discussion on the history of filters like the discussed by Greg Goodman here Vaughan Pratt previously.
I wonder what papers like
W. M. Wells, III, “Efficient synthesis of Gaussian filters by cascaded
uniform filters,” IEEE Trans. Pattern Anal. Machine Intell., vol. PAMI-8,
no. 2, pp. 234–239, Mar. 1986.
and
R. Andonie and E. Carai, “Gaussian smoothing by optimal iterated
uniform convolutions,” Comput. Artificial Intell., vol. 11, no. 4, pp.
363–373, 1992.
are about.
@PP: I wonder what papers like [Wells] and [Andonie, Carai] are about.
Haven’t looked at Andonie, Carai but here’s my take on Wells, by section (I-IV).
I: Motivates 1D Gaussian filters in terms of separable 2D Gaussian filters for image processing. (Wells was at SRI.)
II: Considers algorithms for 1D Gaussian filters
III: Narrows attention to cascaded box filters, motivated by their efficiency (one addition and one subtraction per sample per box filter). He first analyzes the case where all the filters are the same width, then as an extension analyzes when they form an almost-geometric progression with ratio alternating between 3/4 and 2/3 (so starting at width 48 the sequence is 48, 32, 24, 16, 12, 8, 6, 4, 3, 2).
IV: Application Issues. Counts arithmetic operations in implementation.
(As a side note, in his almost-geometric extension I was unable to dupllcate his claimed Highest Sidelobe Levels (HSSL). Where he got -35.9 dB and -34.5 dB for respectively (4, 3, 2) and (6, 4, 3, 2) I got -39.4 dB and -36.7 dB. If anyone feels like checking this I’d love to know why the difference.)
What’s important about these progressions is that by starting with (4, 3, 2) one can peel off the highest frequency, then work down half an octave at a time to peel off all the other bands at a cost of only 1 addition and 1 subtraction per sample per band, namely using a box filter of width 6 for the next band, then 8, then 12, and so on. From n samples the approach produces log n bands at cost O(n) each for a total cost of O(n log n). Same cost as FFT but with only additions and subtractions and also with a lower constant of proportionality.
(Back in 1998 as part of the work I was doing on speech I implemented a variant of this which downsampled with decreasing frequency to give an O(n) running time, again with only additions and subtractions. This was in the manner of scale invariant wavelets but with no multiplications as for Wells so that it could be used in low power devices like hearing aids.)
One would not however use (48, 32, 24, 16, …) all the way down if the only purpose were to build a low pass filter passing less than period 48 Using just (48, 32) would be essentially what I proposed in my “Harmony of the Climate” article here in Nov. 2011, namely the second filter (32) hitting the middle of the first side lobe of the first filter (48). Little benefit would be gained going to (48, 32, 24) since 24 would hit a zero created already by 48. (48, 40, 31) on the other hand would use 40 and 31 to thoroughly flatten 48’s first side lobe, not something Wells seems to have considered.
The rather nice thing about using the 1.3371 inter stage multiplier (that is required by the sinc function) is that it leaves the harmonics of the precisely filtered values untouched.
Thus you get to keep the 24, 36 , 48 month values when filtering on 12 months.
@RLH: Thus you get to keep the 24, 36 , 48 month values when filtering on 12 months.</I
How could that be? Wouldn't the second stage attenuate these?
Also those aren't harmonics. If you started by filtering 12 months, the harmonics would have periods of 6, 4, 3, 2.4, 2, … months.
I looked briefly at Andonie and Carai. Their optimality criterion is a balance between computational efficiency and closeness to a Gaussian. This is different from minimizing the HSSL (highest side lobe level) which was the goal of F3 in my AGU poster.
My problem with Gaussian is that it is sensitive to the wave shape within the sampling window. The advantage of cascaded running means is that the sampling is square wave thus being insensitive to wave shape within the sampling window.
The addition of ‘noise’ (or rather the difference in weather patterns between sample areas) means that wave shape can easily be created by that noise rather than it really being present in the signal.
This can, I believe, mislead then rather than inform.
The problem with FFTs are that as far as I know most longer natural patterns which are constrained by the 12 month cycle tend to distribute in half wave rather than full wave patterns. FFTs are pretty poor at seeing this sort of garbled pattern as I understand them.
Do you have a recommended way of bandpass filtering climate data?
@RLH: My problem with Gaussian is that it is sensitive to the wave shape within the sampling window. The advantage of cascaded running means is that the sampling is square wave thus being insensitive to wave shape within the sampling window.
Richard, do you have an example illustrating your problem, so we can see how bad it can get?
The (big) difference between one box filter and three can be seen at these smoothings of NOAA ESRL’s AMO index for 1856-now. ESRL uses one box filter giving the rather ragged blue curve. My F3 filter from my AGU 2012 presentation (same as in Goodman’s post here but using 1.2067,1.5478 in place of Goodman’s recommendation of 1.3371,1.7878) is the green curve (under the red curve when not visible).
The (tiny) difference between three box filters and Gaussian can be seen by comparing the green and red curves: the red (Gaussian) has a tiny bit more leakage. Goodman’s version of my filter is midway between the green and red, having less leakage than the Gaussian but more than mine.
As I’m not seeing a huge difference between the green and red curves I’m inclined to go with the Gaussian simply because people know what you’re talking about. No one knows what “triple running mean” means because it’s been used with various meanings in the past, all different from a cascade of three box filters optimizing the HSSL. “F3” at least doesn’t have that problem, but it has zero name recognition. If Gaussian gives practically the same thing why not use that so your audience knows what you’re referring to?
@RLH: Do you have a recommended way of bandpass filtering climate data?
What width of band? If about an octave then a Ricker wavelet, aka Mexican hat wavelet, should do the job nicely.
For narrower than an octave you could use a wavelet with slower side lobe decay than a Ricker wavelet. Or you could use the sequence g_1, g_2, g_3, … from Wells’ paper that Pekka pointed to:
W. M. Wells, III, “Efficient synthesis of Gaussian filters by cascaded
uniform filters,” IEEE Trans. Pattern Anal. Machine Intell., vol. PAMI-8,
no. 2, pp. 234–239, Mar. 1986.
Wells’ method yields bands about half an octave wide and is blazingly fast if that’s an issue (unlikely for climate data unless you’re building a large scale GCM).
@RLH: The rather nice thing about using the 1.3371 inter stage multiplier (that is required by the sinc function) is that it leaves the harmonics of the precisely filtered values untouched.
Not sure what that means. What is a “harmonic of a value?” The harmonics of a periodic or quasiperiodic waveform are its integer multiple frequencies. A single box filter of width w completely removes all the harmonics of a waveform with period w. How does the Goodman constant 1.3371 bear on that?
The precisely removed values by cascading box filters are, because of the 1.3371 inter stage multiplier, not the harmonics. Those are at a power of 2 to the filtered values.
Thus you get to keep any 4 year signal, for instance, intact as opposed to removing it. Why 4 years? Well consider that the true solar year is 1461 days, not 365. This is a small difference but ignoring it means that you are 8 hours out every year otherwise and I assume that everybody ‘knows’ that TOD (Time of Day) corrections are considered quite important elsewhere.
Just being consistent.
As to why I consider Gaussian a poor choice is that a simple square wave input reveals overshoots in the output.
In Audio (which is a field I am more comfortable in) these sort of ‘rings’ in the output signal are considered very bad and to be minimised if at all possible. The cascaded box filter has a nice, non overshoot, output characteristic on the same input which has proved to be much more acceptable in analogue terms.
And don’t get me started on using non monatomic sampling frequencies (such as months) when digitising analogue waveforms or down sampling in anyway if you require fidelity in the results.
In computing (which is my main field of expertise) these sort of data reduction exercises are frowned on as producing unnecessary artefacts which computing power has removed.
Sorry, just to be clear, I was talking about the sub-harmonics rather than the harmonics.
I like to use this filter as a cascaded box filter set extended out to the full width of the data, with as many stages as the data width will support and starting at 7 months or below on monthly data, thus 7, 9, 12, 16, 21, 28, 37,49, 66,…… Removes the need for yearly normals as it precisely removes the 12 month (and below) signals but preserves the sub-harmonics of the yearly signal, 24, 36, 48, etc.
This gives a rather nice bandpass splitter circuit with very few computing artefacts in the various bands (assuming you skip the first 2 stages anyway). Thus you can compare (subtract) the output from one stage from the previous stage and get a nice view of the energy present in that ‘window’. Extends out to the full data set and can either have DC (0) or a ramp (CO2 related? :-) ) as the final stage.
I tend to think from the full data width downwards hence my possibly confusing use of ‘harmonics’. Sorry.
As to when this was first discovered, all I can state is that I was using this sort of analogue to digital conversion and digital filter way back when 4MHz Z80 were all we had and A to D convertors that would run at high sampling speeds were very, very expensive. As you note only 1 add and 1 subtract per filter stage which made it very practical even with slow processors.
Used it as a demodulator circuit with the sampling frequency chosen to place one or two of the bandpass outputs in the areas required.
Performed very effectively and could see signal way down into the noise.
Didn’t have your higher maths understanding or explanations but just practical experience and necessity.
@RLH: Sorry, just to be clear, I was talking about the sub-harmonics rather than the harmonics.
Yes, that makes more sense. But a single box filter removes exactly 100% of its subharmonics, so how can cascading improve on that?
@RLH: Thus you get to keep any 4 year signal, for instance, intact as opposed to removing it.
How intact? According to the frequency responses plotted here, all subharmonics are attenuated to some degree, even if you use a better constant than 1.3371.
@RLH: As to why I consider Gaussian a poor choice is that a simple square wave input reveals overshoots in the output
That’s very interesting. Do you have an example showing this? I’ve never seen a Gaussian give even a tiny overshoot.
@RLH: The precisely removed values by cascading box filters are, because of the 1.3371 inter stage multiplier, not the harmonics.
What does the Goodman constant 1.3371 have to do with reality? How do you know he didn’t find his eponymous constant in a table of random numbers? Question authority!
Hi Judith,
Interesting post, but it just confirms my opinion. I have a son who is a Pure Maths Number Theroist and another that studyed Theroetcial Physics. I am a Computer Scientist which makes me also a kind of applied mathematican. But despite this mathematical background, I am not a statistician.
I have learned (initially from Steve McIntyre ) that I want to se raw data and then the statistical technique appllied over the top to compare.
I then want somebody that I can trust, to do the statisticall analysis. And there are not many people that I trust.
It is a sad refelection on Climate Sciense that I have come to this conclusion.
/ikh
@ikh: It is a sad refelection on Climate Sciense that I have come to this conclusion.
How is this a property of climate science? Do you find its conclusions unbelievable but those of relatively or quantum mechanics believable? And if so why the difference?
Dr. Pratt, I lost one of your comments that I found interesting in the jumble so I will just bring things down here. One of my issues has be the treatment of the data before folks get a chance to smooth things especially the seasonal cycle. Since you mention how pitifully weak the AMO is with respect to the PDO I decided to combine my issues in this post.
http://redneckphysics.blogspot.com/2013/11/the-atlantic-multi-decadal-oscillation.html
Fish stock oscillations aren’t really climate indicators.
Responded at your site, capn. NOAA’s ESRL smooths their AMO index with a 120-month (10-year) running mean. This graph plots that along with what one gets using my F3 filter and also with a more conventional gaussian filter. One can see a little high-frequency leakage with the latter, though it is hardly large enough to make a big deal about. The leakage with ESRL’s 120-month running mean is very obvious, not sure why they use that rather than a gaussian filter (or a 21-point binomial filter which is essentially the same thing).
Right and that graph for the AMO only gives you about +/- 0.2C then if you consider the 30N-60N amplification you have about +/- 0.38 C. Still the AMO is more likely a good “Weather oscillation”, not a “climate oscillation” since there is likely a longer term general trend which would be more relevant than assuming the AMO is truly an oscillation or will end up zeroing out over any meaningful time scale.
Goodman deserves recognition for the discovery of his constant 1.3371… I suggest naming it the Goodman constant, by analogy with the Euler-Mascheroni constant 0.57721… The Wikipedia article Moving Average should refer to it as such.
Goodman’s constant is related to Santmann’s constant 1.43029665312 which can be found at the bottom of this page.
Neither one is optimal for a cascade of two box filters, though their mean, 1.384, is close to the optimum 1.3937 that I mentioned above in the context of optimum values for other numbers of box filters cascaded in this way.
Vaughan: Do you have a list of inter stage values for box filters that you would recommend along with the rounding errors that each stage will give (as you have to use integer values rather than the true fractional ones) when extended to the full series.
I like to use these sort of filter series as a bandpass splitter as you know and discovered this set when using a 16 times multiplier of an underlying bit stream in a decoder as mentioned before.
I have never looked into the exact dB for the sub-harmonics which came from decoding square wave bit streams with long or short sections of 1s or 0s. It was just a very simple circuit that filled the need at the time (and created a very good UART for retrieving such a bit stream from a noisy input).
The reason for a bandpass splitter circuit in climate data is that it helps assign the power in some time series into buckets that demonstrate what the overall frequency/power distribution is without any pre-conceptions about likely band values.
If the buckets are not based on simple multiples of the yearly signal (12 months) then any longer yearly multiples are not notched out which is useful, i.e. not powers of 2
The first time a series based on a formula of
next=ROUND(previous*1.3371,0) (in Excel for example for each stage)
gives a yearly multiple is at 42 years (504 months) if talking about months as the sample rate.
3 4 5 7 9 12 16 21 28 37 49 66 88 118 158 211 282 377 504 674 901
Also the inter stage rounding errors for 1.3371 are quite low being at 0.04 for 12 months from the 9 month previous stage.
Other series will give different values.
I am genuinely interested in any series which will allow this sort of bandpass analysis and you seem to have at your disposal the higher maths that may provide a better sequence than the one I am currently using.
Excellent question, Richard. If you’re planning on producing a lot of bands, some variant of the scheme in Well’s 1986 paper that Pekka found,
W. M. Wells, III, “Efficient synthesis of Gaussian filters by cascaded
uniform filters,” IEEE Trans. Pattern Anal. Machine Intell., vol. PAMI-8,
no. 2, pp. 234–239, Mar. 1986.
might be useful for you. In his Extensions section (page 237) he talks about starting with g1 = b2*b3*b4 and then continuing with
g2 = g1*b6
g3 = g2*b8
g4 = g3*b12
and so on where i in each bi is always a power of 2 optionally multiplied by 3. If this doesn’t meet your needs then we’d have to look into why not.
are all these filters actually needed or helpful ?
I mean that in a “statistical” sense – what do we actually gain from all these complex filters
How do we know that if we apply N diff filters (N>20) we will get one that has an interesting result ?
Hasn’t the dsp (shannon like) community and the space sci community and the geology community already done the work we need ?
why are we re inventing the wheel ?
Greg is right that too many people settle for a simple running mean, whose frequency response you would not wish on your worst enemy because of the nasty side lobes.
The frequency response starts to look more reasonable as you cascade filters because the side lobes die down.
There are no side lobes with a perfect Gaussian filter, though there are very tiny ones with any finite-impulse-response (FIR) approximation to one. For a low-pass filter you could do a lot worse than a Gaussian filter.
For a band-pass filter, a simple approach is a Mexican hat or Ricker filter. The scheme I mentioned just above in Wells’ 1986 paper is excellent if you need a lot of bands each covering half an octave.
Most systems that arise in climate science seem to have too low a Q to benefit from the more sophisticated filters developed in wavelet theory.
These are not the complex filters , these are the simple ones !
The aim of this article is not to re-invent the wheel, but to point out to some (especially in the climate community but you can probably include geologists if you wish) that they are using square wheels and that some other profile may be more suitable.
Wheels have many different shapes and forms depending upon the job required of them. Some have teeth, some are eccentric, some have complex profiles. The task is to define what you want it to do, chose a profile that is suitable and assess how well it fits your criteria.
Using square wheels for everything, saying they are really brilliant because all of the sides are _exactly_ equal, may be missing the point.
PS using square wheels because it’s about all you are capable of doing in a spreadsheet doesn’t cut it either.
Vaughan: For some reason I cannot thread a response to you in this here now. There is no ‘reply’ listed for me on your response to my question above. So I’ll do it here at the end (and apologise to any who find that awkward).
The idea of using a bandpass splitter is that you can split the signal into bands that allow for the power/frequency distribution in the signal to be determined.
The idea of staying away from simple octave bands (such as from any use of powers of 2) is that small deviations in the signal timing around those octaves then can then distribute badly in the output. This can then produce beat patterns in the output. Using non octave based frequency bands mitigates against that possibility.
Mostly the signal is highly constrained by the yearly pattern hence my interest in not affecting the octaves if possible. I find that, in natural semi chaotic systems, combinations of 2, 3 and 4 ‘half cycles’ can be spread out to make, say, an overall 12 year patterns and longer and provide the required energy distributions for these longer pattern and so on. Splitting on the octave (and any noise) can easily hide this. It also means that FFTs (which require full wave signals to be present in the input being based on sin/cos) are less useful.
The reason for using a minimum three stage running mean is that the maths are very simple unlike any Gaussian or other sample weighed function and thus mathematical verification of the results are easy to achieve. Also the question of required precision in intermediate terms is unlikely to arise. As you (and Greg) have correctly observed cascading running means (provided you use more than three stages anyway) achieves an acceptable result without the complications otherwise needed. Occam’s razor really.
I very much doubt that using your suggested functions as a bandpass splitter circuit would produce actual results in the bandpass outputs that differ much from mine. I would be interested in any examples that show me that is not the case.
Also the points about the precise actual inter stage value can become kinda moot when one considers that it is the integer value we are dealing with rather than the fractional one.
next=ROUND(previous*1.3371,0)
and
next=ROUND(previous*1.3333,0)
are identical up to 66/65 months
1.3333 3 4 5 7 9 12 16 21 28 37 49 65
1.3371 3 4 5 7 9 12 16 21 28 37 49 66
I prefer to look at the rounding errors that occur between each stage and try and minimise them. 1.3371 is nice in that sense as the 9 to 12 month rounding error is very small and the 12 month figure is the one I am really interested in getting correct..
The way I use this all then is to plot ALL of the outputs from each of the stages as well as the input signal on a single graph. I prefer to use a simple ‘points only’ graph as I believe that adding lines creates visual noise that is not really present in the input data.
Scroll up to the last available ‘reply’, then cross your fingers in the special way.
=========
@RLH: But this is what I see for you in this thread. No ‘Reply’ field available.
Reply to yourself and your comment will then appear at the end of the list of replies to you, none of which will have a reply field. Everyone participating in that subthread will be doing the same thing, namely replying to your top level comment. (For some reason nesting appears to have gone down to one deep in this thread—maybe WordPress is confused about where we really are in the nesting.)
next=ROUND(previous*1.3371,0) and next=ROUND(previous*1.3333,0) are identical up to 66/65 months
But 1.3371 and 1.3333 themselves are essentially identical: they make no perceptible difference to F3’s frequency response.
Furthermore both are far from any number relevant to the F3 approach. First, 1.3371 is nowhere near the solution to πx = tan(πx) which is 1.43029665312 (which you can Google for, see the Aug. 26, 2007 result). I have no idea where Greg got it from.
Second, 1.4303 is considerably worse even than 1.3371 for this purpose. As can be seen from this graph the leakage using 1.3371 is 3 times worse in amplitude (9 times worse in power) than if you use the optimal values for an F3 filter, namely 1.2067 then 1.5478; using 1.4303 would only widen that gap. (The optimum for an F2 filter is 1.3937, the optimum for an F4 filter is 1.1252, then 1.3440, then 1.6275. The improvements as you go from F1 to F5 are plotted here, with the inset showing F5 looking perfectly flat and just barely distinguishable from F4. F1 is your basic running mean or box filter)
Bottom line: if you were happy with 1.3371 for an F3 filter then you will be considerably happier yet with any constant in the range 1.18 to 1.24 that gives you the integer you’re looking for.
If that range still is insufficient to give you an integer let me know and I’ll look further into your question of which integers are optimal for F3 filters. What’s your largest starting integer?
In my next reply I’ll repeat Figure 4 of Greg’s post (the one comparing F3 with Gaussian) but with σ = 0.357, which gives a fairer comparison of the relative merits of F3 and Gaussian than Greg’s choice of σ = 0.39.
This graph compares optimal F3 (much better than F3 with 1.3371) with Gaussian with σ = 0.357. (Figure 4 of the OP compares with 0.39 which is a bit of a strawman comparison.) The red curve plots their ratio, F3/Gaussian.
Up to frequency 0.65, F3 has a very slightly flatter frequency response than Gaussian, with both being down to about 50% at frequency 0.45. So F3 is very slightly better in the band 0-0.6.
From 0.65 to 1.0 the Gaussian passes more than F3, 2.5 times more at frequency 0.9. So Gaussian is better in that band, though both are rejecting a lot there.
At frequency 1.0 F3 is rejecting 100% while Gaussian is still passing 2%.
From 1.0 to 1.22 F3 rejects more than 3 times more strongly than Gaussian. But from 1.25 onwards, Gaussian rejects better than F3 except exactly at 1.5478, 2.0, etc. (the steepness of the red curve tells you how extremely narrow the regions are where F3 beats Gaussian).
So if it’s more important to reject in the band 1.0 – 1.25 than to pass the band 0.8 – 1, F3 should be your choice. Otherwise Gaussian may be better. Other than these small differences there’s not much to distinguish them.
Further reduction of σ to 1/3 (0.333) reduces the Gaussian’s 2% pass figure at frequency 1.0 to 1%, at the cost of the Gaussian passing only 80% of what F3 passes at frequency 0.6 (where F3/Gaussian peaks), i.e. more distortion of what’s passed.
kim | December 2, 2013 at 7:22 am |
Scroll up to the last available ‘reply’, then cross your fingers in the special way.
=========
But this is what I see for you in this thread. No ‘Reply’ field available.
————————–
but for the thread above that
Greg Goodman | December 1, 2013 at 1:51 pm | Reply
PS using square wheels because it’s about all you are capable of doing in a spreadsheet doesn’t cut it either.
==========
Reply field as expected.
————————————————
So I am not sure what is wrong/different (or did you skip the /sarc tag :-).
Vaughan: Not easy to give a largest value as that is determined by the data length, which varies from data set to data set (and with time of course :-).
The smallest value I normally use is 7 as that gives me a three stage filter to 12, i.e. 7, 9, 12. In mathematical terms I suppose the smallest value that would make sense would be 3 and then go the whole way up from there in a full ‘n’ stage filter bank but that seems to be just too much trouble.
So for all the 0.1 step inter stage multiplier values for three stages to 12 that gives me the below (if only using the nearest integer values that a monthly sampled data set implies)
1.2 8 10 12
1.3 7 9 12
1.4 6 9 12
1.5 5 8 12
1.6 5 8 12
1.7 4 7 12
1.8 4 7 12
1.9 3 6 12
2.0 3 6 12
Which would you suggest is the best row from that set (and why if that is possible)? The reason I originally chose 9, 12 and 16 for the first time I had reason to visit this question (my very simple 3 stage digital filter as mentioned before) was to do with starting above the half bit, i.e. 8 (and with some input about filters from a very respected audio designer who was my Uncle). That was a long time ago and for a different question as well so not necessarily a correct place to start in climate data:-(.
When Greg came along and suggested that these were mathematically ‘good’ values I noted the co-incidence with my previous values and went from there really. Similar point about starting above the ‘half year’ though.
The outputs from the subtraction of one stage from the next (which is what a bandbass splitter circuit requires) is much the same regardless of how you create the actual bands. All you get is some finer resolution bands at larger timescales which may prove interesting. These are ‘single edge’ cascaded filters not normal independent bandpass ones tuned to some centre value of course.
It then ends up as a set of cascaded low pass filters with tap points for the various outputs. The sort of energy distribution analysis that is common throughout audio and radio when measuring the response of variable input when applied to complex loads.
I can see no reason why the same time/energy analysis cannot be applied to climate.
This is my attempt to do so. I am interested in improving my circuit if there is sound reasoning for it..
Not sure if this answers your question, but this graph plots the frequency response within the first side lobe of the 12-point box filter for each of the six different F3 parameters in your list. The blue one, 8 10 12, looks pretty good in general. But if you have specific frequencies you’re trying to reject it’s possible (but unlikely) that one of the others might do a slightly better job.
Vaughan: Thanks for that plot. As you say 8, 10, 12 looks like it may well be a better fit. That does appear to produce the smallest side lobes. That also seems to fit with your preferred value of 1.2067 which you mention up thread and is effectively very close to a fifth of an octave filter spacing. Tighter than I would have first thought was sensible.
I have always tried to stay away from octaves and their (sub) multiples but that may well be just prejudice on my behalf.
I’ll do some plots and see how that effects my bandpass splitter outputs.
I’ll also do some checks with the 28 day filters which I like to apply ahead of any monthly sub-sampling on daily data. Seems to preserve resolution better.
I find it strange that climate people always seem to want to sub-sample then filter rather than the other way round.
Richard: “I’ll also do some checks with the 28 day filters which I like to apply ahead of any monthly sub-sampling on daily data. Seems to preserve resolution better.”
No. You need to filter at twice that _minimum_ ie 60 days before re-sampling to avoid aliasing. That is DSP 101.
I would ask why you want to sub-sample anyway and why chose 28 days as the re-sampling period? If you have the good fortune to have daily resolution keep it ! There is a lunar influence on a number of climate variables. What the current cliché of monthly averaging does is removes most of it and distorts and aliases what’s left. They then further mangle the signal by calculating annual “climatologies” to subtract.
It’s hardly surprising so little progress has been made in the last 30 years.
“I find it strange that climate people always seem to want to sub-sample then filter rather than the other way round.”
Quite simply a profound lack of understanding of what they are doing for the most part, I suspect. Climatology seems to have evolved in its own little eco-friendly bubble, devoid for a large part with any ‘contamination’ from the outside world and existing bodies of knowledge in other fields.
Many of their methods seem to be ad hoc solutions dreamt up on a Friday afternoon over coffee. They have no grounding in stats, no grounding in DSP and apparently see no reason to consult with those that do have knowledge of those areas.
This is what Wegman Report pointed out. Rather than address the problem they preferred to attack Wegman.
PS , if you really have a problem with data volume, a shorter re-sampling would probably be sufficient. Resample at 5 or 10 day intervals.
There is also a 14 day lunar influence as we see in neap tides. It may be expected that this has a homologue in the atmospheric tides. To avoid obliterating any longer term variation in these effects, which could have a bearing on decadal scale climate patterns we need to avoid destroying the signal at the first hurdle.
So far that seems to be exactly what is happening by arbitrarily selecting an _irregular_ calendar month as a convenient round number.
I
Greg: I rather do know about sampling theorem you know. A 28 day low pass filter just removes those signals below that value. I could go for a 14 day one to correspond to the ‘minimum twice the frequency requirement’ but if you look at the actual values produced it turns out that is not required. The low pass filter is deliberately set around the what would more accurately called a ‘grouping’ rather than a true ‘sample’ in Nyquist terms as it is the average for the ‘month’ that is then derived rather than a single point sample.
I would go for the pure 28 output and keep the full daily resolution and possibly only consider a sub-sample based on quarter year (Solstice/Equinox) but that is too far off what most of the available data is in.
Would probably be more ‘scientific’ though.
Greg: I accept most of your points about months. A lousy way to sample any signal. I also strongly object to using 365 (and forget the remainder) ‘normals’ as the true solar year is 1461 days and it is very likely that that signal will show up in the data somewhere and at some magnitude.
“I could go for a 14 day one to correspond to the ‘minimum twice the frequency requirement’ but if you look at the actual values produced it turns out that is not required. ”
Richard, you seem to have that backwards. What you need to do is LP filter at 60d to ensure that anything that remains has at least two 30d samples per cycle.
ie that your new sampling freq is twice that of the highest freq remaining in the data.
Greg: No I don’t have it backwards. We are talking about integrals over the month, not point samples of the resultant curve in the Nyquist sense. To create a good monthly integral you can low pass the data with a filter below the required interval without compromising the data integrity at that integral. Thus a low pass of 28 days will remove all the ‘weather noise’ below that in length and produce a smoothed but still daily sampled output which can then be summed into a monthly (albeit non monatomicly sampled) figure.
How low a pass filter should we use. Well that depends on how long the weather systems are in days. If any weather system is longer than 28 days that will still leak into the output.
I do take the point about Lunar signals in the data. You could argue that 7 days might be a good starting point if looking for them so that any such signal would be preserved (or at least sliced into 4 parts). But, again, if you preserve the daily sampling rate which moving averages allows, then Nyquist problems tend to disappear. Unfortunately weather systems and any Lunar pattern are likely to very close together in time terms so distinguishing between them will be hard.
It’s remarkable how far the discussion goes here without anyone realizing that an M-term discrete moving average has the frequency-response function
H(f) = sin(pifM)/[Msin(pif) for f<=0.5
rateher than the sinc function.
The main point of the article (and the alternative filters suggested) focuses on the distorting effects of the finite rectangular window, The effect of convolution with that is the sinc function and gives rise to the negative lobes described.
Could you point to a derivation of the transfer function you showed?
@John S.It’s remarkable how far the discussion goes here without anyone realizing that an M-term discrete moving average has the frequency-response function
Is the difference big enough to matter in these applications, John? In general the main difference will be a small one in side lobe ceil(M/2)-1, which for M > 4 is dominated by the first side lobe anyway. Even for M = 2, which has no side lobes for f < 0.5, the difference is negligible except around f = 0.3 where sinc underestimates by about 20% but that's in the pass band so it's irrelevant to rejection.
The worst case is surely M = 3 where sinc underestimates the first side lobe by 36% at f = 0.5, in the middle of the first side lobe:
sinc(M/2) = -.21331
sin(pi*M/2)/(M*sin(p/2)) = -1/3.
M = 4 may be worth attention, but not much beyond that I would have thought, at least in these applications.
The rather elementary derivation of the frequency response of an M-term MA can be found in most introductory texts on DSP, e.g., Hamming’s “Digital Filters.” The difference between the periodic correct form and the aperiodic sinc function is significant not only analytically, but also practically. IIRC, the first negative side-lobe of sinc is ~34%, whereas the correct result is invariably smaller for all M.
@JS: The rather elementary derivation of the frequency response of an M-term MA can be found in most introductory texts on DSP, e.g., Hamming’s “Digital Filters.”
Yes, it’s just a matter of summing a finite geometric progression. (Found it in Williams, “Designing Digital Filters.”)
The difference between the periodic correct form and the aperiodic sinc function is significant not only analytically, but also practically. IIRC, the first negative side-lobe of sinc is ~34%, whereas the correct result is invariably smaller for all M.
Maybe I’ve made a mistake somewhere but I’m not seeing much difference at M = 9, as can be seen here. The first negative side lobe of sinc goes down to −0.21723 while sin(πfM)/(Msin(πf)) is just a tad lower at −0.22653. This is at f = 0.15892 (so Mf = 1.4303). This can be verified with
sinc(1.4303) = −0.21723
sin(pi*1.4303) = −0.97612
sin(pi*0.1589) = 0.47878
−0.97612/(9*0.47878) = −0.22653
(Showing the work in case it’s obvious what I did wrong.)
I am not sure that the small differences you are talking about matter given that there are only a limited set of integer values that can be chosen for Vaughan’s F3 (or Greg’s one for that matter). All this talk about fractional differences seems to miss that step.
Can you come up with an integer series of monthly values that is better than 8, 10, 12 for a 12 month low pass filter that Vaughan provided?
What values would you also suggest for 48 months, 192 months and 768 months (as integer values)?
These correspond to a 1, 4, 16 and 64 year low pass filter bank (double octave).
@RLH: I am not sure that the small differences you are talking about matter given that there are only a limited set of integer values that can be chosen for Vaughan’s F3 (or Greg’s one for that matter).
Whether there’s a small or large set of integer values, John’s point that we should be using the exact FIR formula instead of the sinc function, which is exact only in the IIR limit, is quite correct. Furthermore I probably should have used the exact formula in my plots just as a matter of good form.
John is quite right about “The difference between the periodic correct form and the aperiodic sinc function is significant not only analytically, but also practically.” In particular as f = 0.5 is approached, the correct answer becomes π/2 times as large as sinc. At f = 0.5 this is particularly noticeable with odd M because f = 0.5 is in the middle of a side lobe; for even M you have to back up half a lobe (is better than no lobe) for that ratio to matter.
However for all but M less than 7 or so, at the first side lobe, which is the only one we care about, the difference is much less. Moreover comparisons between alternative filters are essentially unaffected by whether one uses the correct form or sinc.
So while John is technically correct, for the purpose of choosing parameters for F3 (or F2 or F4 etc.) filters the difference has impact at all.
“has impact at all” –> “has no impact at all”
Vaughan; So what you are saying is that regardless of the exact formula used to derive the underlying curve that is used, the best sequence for an monthly integer based F3 filter for 12 months is 8, 10 and 12 and that it produces almost exactly the same output as a more complex Gaussian or other higher order filter?
Details of the frequency space response may be important, when the data being filtered contains periodic signals. There are some very strong and several much weaker periodic signals in the Earth system (24 hours, year, lunar periods, Jupiter period, Milankovic cycles, etc.
In almost all cases it’s important to take the diurnal and annual periods into account implicitly or explicitly, but the other periods are seldom significant. Therefore a rather crude F3 filter and a Gaussian filter approximated by the F3 filter give in very many cases almost identical results.
That’s true even when the data contains a quasiperiodic signal, whose period varies significantly like the solar 11-year (or 22-year) cycle as an example.
Pekka: This was a very specific question about a 12 month filter not a wider question about other longer time period signals.
@John S. There is little practical advantage to elaborate cascading.
One plausible argument for synthesizing Gaussian and other filters by cascading uniform filters is that each stage costs only an addition and a subtraction per sample. However one needs a lot of climate data before this benefit is realized, especially given the speed of today’s computers.
My AGUFM2012 presentation used a 21-year running mean filter merely as an easy way to take out the strong 21-year signal in HadCRUT3. The Excel per-cell expression for this is trivial: basically AVERAGE(WINDOW) as one would expect. It was then natural to cascade that with the 17 and 13 year running mean filters in two subsequent columns every cell of which contained the same expression to take out those other high frequencies not harmonics of the 21-year signal. A cascade of filters in Excel is simply a block of cells all containing the same expression. Each stage is parametrized by a constant m determining the window size 2m+1 on a row above the data aligned with that stage, which is why the different stages can all have the same expression.
However in hindsight a Gaussian, aka G_0, would have worked just as well for my purposes, so that’s what I’ve replaced F3 with in the meantime. And for band-pass I use a Ricker or Mexican hat wavelet, G_2 as the second derivative of G_0, which delivers results indistinguishable from the cascade of filters that produced the HALE, TSI, ENSO and BIENNIAL (tabs 9 and 12 on my 2012 spreadsheet). For narrower bands one can go to G_4 or higher derivatives of the Gaussian though so far I haven’t needed this.
These two choices, G_0 and G_2, have the additional advantage of maximizing the number of people in the audience who are likely to grasp right away what you’re doing and with what, provided you call them “Gaussian” and “Mexican hat”. (“Mexican hat” will be recognized by everyone who recognizes “Ricker” but the converse is less likely.) Of course everyone knows what a running mean filter is, though the fact that cascading them converges to a Gaussian seems to be less well known.
Clearly, my recollection about the size of the first negative side lobe of sinc is off by a normalization factor of pi/2. Nevertheless, the essential difference remains that sinc always has the same-sized side lobes irrespective of the cut-off frequency, whereas the correct FIR response exhibits lobes critically dependent upon M.
Cascaded MA kernels, such as favored by Pratt for low-pass filtering. are unlikely to find wide acceptance. They are demonstrably suboptimal not only in terms of side-band suppression, but also in terms of response roll-off and noise reduction for the effective FIR kernel width. The ease of implementing variously tapered MAs and the empirical fact that there is usually little spectral content found near the negative side-bands (e.g., ~9 month oscillations) militates against their use for the usual climatological purposes of decimating data and/or removing diurnal or annual periodicities. There is little practical advantage to elaborate cascading.
I would love to see a worked out algorithm (with monthly weightings if possible) for a low pass filter that works on a monthly sampled input and with a 12 month cut off point in frequency terms. One that is simple to implement but does not have the supposed ‘bad;’ characteristics that an F3 one does.
This is precisely what is required for most climate data.
The difficulty is that we have an already integer sampled (and poorly so as per Greg’s point) temperature sequence with only 12 samples to the required cut off point.
Does kinda make it challenging.
John S. “the empirical fact that there is usually little spectral content found near the negative side-bands (e.g., ~9 month oscillations) militates against their use ”
A totally spurious comment.
There is no need for a regular ” ~9 month oscillation” . Any change on that time-scale even it only happens once will be inverted. So it is not only a poor filter with a lot of leakage, it is corrupting the signal within the band that it is intended to remove.
That you bring its use in decimation in climatology is curious since I do not recall ONE instance of seeing correct anti-aliasing being applied in a climatology paper let alone specifically choosing a RM to do it (and I doubt this is simply a sampling error).
I think anyone with enough understanding to correctly re-sample data would not chose such a crap filter to do it.
The problem is that most decimation in climatology seems to be done by simple monthly averaging. This skilfully combines all the problems of frequency and phase distortion of RM with those of re-sampling data without an anti-alias filter.
The comment about roll-off is valid (as is VP’s comment about attenuation of all frequencies in the pass band) , which is why I added the Lanczos filter to the suggested alternatives.
What’s totally spurious is the resort to a pathological example, while ignoring the general case. No competent analyst would use a 13-month MA for anything but visual display purposes. That it may exhibit wiggles opposite in phase to the raw data should be obvious from the correct response function. What is not so obvious, however, is that the power density of UAH global monthly anomalies at sub-annual frequencies is down to a “noise-floor” ~50 times lower than the multi-yearly spectral peak.
So your “preferred” solution is to _assume_ that your data fits the description of some undefined “general case” and then proceed with a defective method that will “probably” be alright visually.
OK John, you get the job. You clearly are qualified to be a climate researcher.
Greg:
Snide remarks hardly conceal your miscomprehension about determining the magnitude of side-band aliasing in decimating monthly average temperature data when its power spectrum density is known. In such a case, the aliasing effect can be determined unequivocally! Despite the non-negligible side-bands, the effect is usually negligible, only rarely extending beyond the third significant digit. Using longer, more optimal kernels involves sacrificing more data to end-effects.
So here’s a challenge to all who wish. Take a temperature series at monthly resolution and with a fairly short history. I would suggest the UAH Global column from Dr Spencer site. http://www.nsstc.uah.edu/data/msu/t2lt/uahncdc_lt_5.6.txt
Plot the series and a 12 month low pass filtered sequence of the same on a single graph. Show your workings. Demonstrate the relative advantage of your preferred methodology over a simple F3 with 8, 10 and 12 as the parameters.
Only if you wish :-)
Good example. Look at the latest graph on Dr. Spencer’s site
http://www.drroyspencer.com/
Now look at the years 2011,2012 and note now the peaks in the data correspond to troughs in his 13mo running mean. The same effect as I showed in the article using SSN.
I’ve provided the method as well scripts to implement other filters. Why don’t _you_ try your own test?
Greg: So OK I have tried with both Vaughan’s F3 with 8, 10 and 12 and your ‘running mean’ with 7, 9 and 12. Both seem to produce almost identical output curves. I rather suspect that a Gaussian will produce pretty much identical results also, as will most other more complex filters.
I also suspect that artefacts above the central point (i.e. above 12 months) will be very low in all the cases. I also suspect that leakage of signals from below the central point would also be low.
I do agree that any of the above will be better that a simple 12 month single stage filter that is often used in climate work.
The question is if the large amount of extra mathematics (for the complex versions) will produce significantly more accurate results given that only 12 samples are available below the 12 month centre point and how fast or slow the roll offs (in dB/Octave?) of the band will be to get filters without significant overshoot/leakage in the output.
That was the point of the challenge.
@RLH: So OK I have tried with both Vaughan’s F3 with 8, 10 and 12 and your ‘running mean’ with 7, 9 and 12. Both seem to produce almost identical output curves. I rather suspect that a Gaussian will produce pretty much identical results also
Yes.
as will most other more complex filters.
No, see Greg’s remark about Lanczos as just one example.
The question is if the large amount of extra mathematics (for the complex versions) will produce significantly more accurate results given that only 12 samples are available below the 12 month centre point and how fast or slow the roll offs (in dB/Octave?) of the band will be to get filters without significant overshoot/leakage in the output.
Unless you’re very comfortable analyzing digital filters analytically, which has evolved a locally optimal tool set, your best bet is probably to use whatever turns out to work best for you. The downside is the wide range of options. Moreover the subject of digital filters seems to have morphed into wavelet theory these days, complicating your life with even more choices with yet more criteria to meet, or not as you see fit.
I do understand that digital filter theory is wide and extensive. The problem is more to do with the very limited samples that are available when considering a yearly filter on monthly sampled data. I get the strong impression that what we are discussing is some weighting set applied to those 12 month samples with an included, equally weighted set, above the 12 month point.
What I suppose I am trying to do is unwrap the algorithms to create a one pass weighting set that is simple to apply and has the narrowest weighting range,
Basically some form of Binomial filter with sharp edges. That would appear to be what your F3 filter devolves to. I suspect that Gaussian, Lanczos and other filter sets will devolve into also given the very narrow range 12 sample input if the algorithms are fully unwrapped.
The preferred practical method for smoothing monthly average data is to apply a simple trapezoidal taper to a 12-month MA, i.e., use a 13-term kernel whose 11 inner weights are uniformly 1/12 and whose end weights are 1/24. This kernel still eliminates the annual cycle exactly, sharply reduces side bands, and allows “centering” of the output. It may be used equally well for decimation of monthly data into yearly averages, although I prefer to subsample semi-anually to examine possible aliasing. In hundreds of vetted station records around the globe, I have yet to find an example where side-band aliasing was very significant.
This recommendation is entirely a practical matter, with no claim of optimality attached.
“What I suppose I am trying to do is unwrap the algorithms to create a one pass weighting set that is simple to apply and has the narrowest weighting range,”
Richard, look at the scripts provided with the article. Those are the “one step” solutions. You could try to program that as a spreadsheet function I suppose, though I don’t find spreadsheets a very suitable tool for this kind of work.
In any case, you cannot make a decent annual filter with a 12 point window, no matter how hard you try.
Both triple RMs and gaussian need about 3 years either side. 3-lobe Lanczos, which is starting to look like a good filter with a flat pass band needs over 6 years each side.
The preferred practical method for smoothing monthly average data is to apply a simple trapezoidal taper to a 12-month MA, i.e., use a 13-term kernel whose 11 inner weights are uniformly 1/12 and whose end weights are 1/24.
This is the same thing as a 12-2 F2 filter. On monthly data this performs a 2-,month running mean followed by (or preceded by, it commutes) a 12-month running mean. The 2-month one takes care of signals around the Nyquist frequency of period 2 months but only shaves a few percent off the 12-month’s first side lobe centered on 12/1.43 = 8.4 months.
Although both 12 and 2 are even, by sending their respective outputs in opposite directions the offsets cancel resulting in centered outputs. This trick works whenever there are an even number of even-term uniform filters in the cascade.
Vaughn:
Yes, the 13-point trapezoidal kernel can be generated by convolving 12-point and 2-point MAs. There’s always a trade-off between suppressing the side-lobes more strongly at the expense of more weights and greater attenuation of pass-band frequencies. Whereas in some applications this is imperative, world-wide experience with monthly temperature data militates against that.
Vauhan: Do you have R, C++ or C# source examples of how to create Gaussian and Lanczos filters on a data stream so that I can compare the actual differences in the outputs for the UAH series as above?
Richard, why don’t you use the awk scripts I provided? Some version of awk is available for free for all major platforms.
Also the code is pretty trivial, it should be easy enough to translate if you prefer to work in C.
Yes I can do the translation and will. I just find that using what is essentially an automated text manipulation tool to do scientific work a little odd.
R would seem to be the choice of most in the field but C++ and C# are my home territory.
Greg: Hey ho! Turns out that translating a language that allows negative offsets in an array is not quite as trivial as all that (and being then sure that the logical/outcome is the same anyway) but….
Greg: Can you also give a example to what your input text stream layout looks like as awk operates on text fields within a text line and without that info it is a bit difficult to determine what your program logic is actually doing?
Richard, I hope I’ve hit the right “reply” link here.
The scripts operate on two columns of data. In this context a floating point date and a data column, SST, CO2 or whatever you are dealing with.
I’ve just added comments to the top of the scripts to that effect.
# operates on files with two columns of numeric data
# eg date as integer year or floating point decimal
It is probably helpful to state that explicitly so thanks for raising the question.
I have a whole bunch of awk scripts to handle the never ending variety to formats people find to represent dates and convert them all to floating point. There’s always a bit of foot-slogging work to knock it into a usable format.
Since most climate data is available in some kind of human readable ASCII, awk is an obvious choice for parsing it all. Once you’re in there, it has decent precision maths and handy things like coping with negative array indices ;) So I find it does this sort simple maths nicely as well as parsing the text.
The only gripe I have is its inconsistent handling of NaN values but all these convolution filters require continuous, evenly spaced data anyway, so it’s not really an issue here.
This isn’t place for an awk tuto’ but basically there’s a BEGIN block where I parse and check command line parameters and input filenames, then it goes through the input file, one line at a time, executing the main block for each line. Hopefully there are enough comments to decrypt it even if you’re not familiar with awk. Syntax a pretty C-like as you will have already guessed.
HTH
eg. ICOADS SST
1848.45833333 19.17737000
1848.54166667 19.17894000
1848.62500000 19.00039000
1848.70833333 19.07334000
1848.79166667 18.88981000
1848.87500000 18.88921000
1848.95833333 18.63873000
1849.04166667 18.52242000
1849.12500000 18.58018000
1849.20833333 18.67662000
Greg: Yes I do understand awk (or at least I can read it) but, as you also observe, negative indexed arrays are a bitch to deal with in ‘normal’ computer languages.
I also get that the scripts are creating an array of weights and then applying them to the data. Me, I would prefer to have NAN as outputs ahead and behind data so that they can be plotted on the same graph with the same timescale but YMMV.
The fact is that things like R are very good at statistics and graphing and it prefers NAN as an input and I just tend to write simple C# apps to transform textural data such as making wide format like CET into single column or splitting multiple columns into single files.
It might be worth while just uncommenting the lines that print out the array weights as those are then constants which can be used almost anywhere in any language.
It is, after all, two steps. Create the weights and then apply those weights to the input stream.
I did wonder what the equivalent weighting set for Gaussian, and F3 (1.2067) would be :-)
@RLH: Vauhan: Do you have R, C++ or C# source examples of how to create Gaussian and Lanczos filters on a data stream so that I can compare the actual differences in the outputs for the UAH series as above?
Apologies but AGU FM2013 is starting momentarily which will take me out of action until Saturday. Would have been happy to add anything needed to the awk scripts Greg’s already offered you, but that will have to wait. Hopefully you’ll have everything you need by the time the AGU meeting is over.
@RLH: I did wonder what the equivalent weighting set for Gaussian, and F3 (1.2067) would be :-)
While they’re extremely close they’re not identical and there’s a tradeoff. If you want the Gaussian filter to pass only 1% at f = 1.0, which in practice is about as good as it gets with F3 anyway, use σ=1/3. The penalty is about 20% more attenuation around f = 0.5, creating somewhat more distortion.
If however you want your Gaussian to distort no worse than F3, you have to suffer around 2% being passed at f = 1.0, although this difference has pretty much entirely dropped off by f = 1.2. This is achieved with σ around 0.36 — I’d suggested 0.357 above though anything around there should do.
Vaughan: Hope you had a good meeting. Would you care to provide plots and constant values for the weights rather than mathematical descriptions. I realise it is a pain but if they are provided as a set of array constants the results can be much more easily applied on a whole range of computer languages without the potential errors that code translation can create.
I suppose that uncommenting Greg’s line that does it would suffice and I may well get round to that rather than the translation. Having the constants would confirm that my code translation was correct as well :-).
In the way that I am using these low pass filters the tiny distortions that each give is less important than you worry about.
The nice thing about a bandpass splitter circuit is that it is an almost flat topped filter – almost the opposite end to the highly tuned filters around a single frequency.
Sure it only says that energy is present in a range (from 12 months to 4 years for instance) without any idea as what the exact frequency is within that range but it provides a starting point for further examination.
Provided that the mixed components that exist in the signal are well separated it can provide very good information.
Run at octave width the bands almost overlap but still provide separation or one can also sweep it down the scale to get a more precise idea of any underlying components.
My initial work has been to use two bands, at 12 months and 4 years, on the UAH Global data and plot all the outputs on a single graph.
Gives some interesting food for thought :-)
Reducing the first and last points is minimal concession which just about recognised the problem without fixing it.
This is _precisely_ the filter used on the SSN data which I used as an example. SIDC themselves recognise this as defective and it is only still used for “historical” comparability with work done in the 19th century!
If that is your idea of a “preferred” solution you have some catching up to do. ;)
” It may be used equally well for decimation of monthly data into yearly averages”
OMG here we go again. Using a 12 mo filter (even an ideally perfect one that does not exist) is NOT sufficient for re-sampling at 12 mo intervals. Period.
“I have yet to find an example where side-band aliasing was very significant.”
And how would you know if it was ? Since you don’t know what the original signal is before you start the analysis, you can’t know where to look for the aliases.
Climate data is both highly complex and noisy. There is no way to tell whether inter-annual “cycles” are a true signal or an alias or whether a true cyclic signal has been destroyed or corrupted into something else that no longer correlates with its causal variable.
The only way to resolve (or at least minimise) the problem is to adopt proper signal processing methods.
If climate science has failed to find anything other than a centennial scale rise in two variables after 30 years of effort and huge expenditure, it is in large part due to the sub-highschool level of competence in data processing that has ensured any other signals have been thoroughly scrambled.
Your comments neatly summarise the problem.
Greg: Do you have R, C++ or C# versions of your awk scripts for Lanczos filters to hand or shall I do the conversions myself? I am particularly interested in 12 month, 28 day and 365 day low pass filters..
In light of your demonstrated inability to distinguish between the response characteristics of continuous-time vs. discrete-time averaging, your sermonization here rings hollow.
+1
In view of your demonstrated ability it to be out by a factor of two pi could you remind us of the magnitude of the correction once you get the numbers right?
This would have been a fair comeback if you’d been the one to point out the factor. However (a) you weren’t and (b) you’ve exaggerated it (the factor was pi/2 and even then only well below f = 0.5 — 2 pi would indeed have been outrageous).
John was quite right about the pi/2 difference from sinc in the vicinity of f = 0.5. That he misremembered that this factor decreased as f tended to zero was the sort of mistake any of us could have made long after moving on to other things.
That fact the S/N ratio in climate data is very low is not a reason to dismiss any effects as being in the “noise floor” and to stop trying to understand climate.
Many areas of science and engineering have to deal with such situations and it calls for impeccable methods and care to detail. It does not justify using sloppy methods and crap filters which simply ensure you will never advance understanding of the system under study. That is not the “preferred” method.
Greg: Having visited your filter pages at
http://climategrog.wordpress.com/2013/11/28/lanczos-high-pass-filter/
and
http://climategrog.wordpress.com/2013/11/28/lanczos-filter-script/
I think there is some terminology needed to be sorted out.
In normal audio terms that I am used to a high pass filter with a given central frequency at, say 50Hz, would pass (not attenuate) all frequencies above 50Hz and attenuate (not pass) those frequencies below 50Hz down to DC.
A low pass filter would perform the opposite, attenuate those frequencies above 50Hz and pass those frequencies below 50Hz down to DC.
You seem to be, at least to the casual observer, mixing up two terms, frequency and period, and hence reversing to my mind what might be considered the normal usage.
Thus you are describing the ‘high pass filter’ as passing (not attenuating) all those signals with periods longer than a year, i.e. lower in frequency than a year.
Your graphs do make this clear on inspection but the wording might need some clarification I believe.
Greg: I suppose what I meant to say was making the graphs as period rather than frequency might make things clearer as most data series are period based, not frequency.
And I have got this far in translating the awk into C# to create the weights to apply (just the default parameter set to start with).
static void Main(string[] args)
{
int ULobes = 3;
int Width = 15;
double Lobes = (ULobes – 0.5) * 2.0; // 5
int LanczosKernelWidth = (int) (Lobes * Width); // 75
int HalfWindowWidth = LanczosKernelWidth / 2; // 37
// calculate normalised kernel coefficients
double[] ArrayOfWeights = new double[LanczosKernelWidth]; // [75]
double TotalWeights = 0.0;
for (int j = 0; j <= HalfWindowWidth; j++)
{
double value = Sinc(Math.PI * j / HalfWindowWidth) * Sinc(Lobes * 2 * Math.PI * j / LanczosKernelWidth);
ArrayOfWeights[HalfWindowWidth + j] = value;
ArrayOfWeights[HalfWindowWidth – j] = value;
TotalWeights += value;
}
TotalWeights = 2 * TotalWeights – ArrayOfWeights[HalfWindowWidth];
for (int j = 0; j <= LanczosKernelWidth; j++)
{
ArrayOfWeights[j] /= TotalWeights;
}
}
@RLH: You seem to be, at least to the casual observer, mixing up two terms, frequency and period, and hence reversing to my mind what might be considered the normal usage.
Boy does that ring a bell!
Richard, you might enjoy the discussion between Greg and me in my original post about the F3 filter etc. last December. Start about here and read forwards, or backwards if you want more context.
http://judithcurry.com/2012/12/04/multidecadal-climate-to-within-a-millikelvin/#comment-277331
Notice my reference to Gaussians, in particular that truncating at 2σ is too low (i.e. if you were using σ = 1/3 then you’d be truncating the F3 impulse response way to low, but truncating at 3σ, i.e. at f = 1.0, is not so bad).
Greg’s remark a bit further down, “Since you have already stated the bandpass ripple on F3 is greater than that the clear answer is that you need THE FULL KERNEL WINDOW with no cropping to even get close to 1% on the overall result where you use it three times. ” made no sense to me, then or now. Notice his demands for me to apologize, which from the present thread seems to be par for the course for him.
Further down you’ll find my question, “That too greatly puzzled me. How is an impulse response a frequency plot?” I still don’t know whether Greg eventually sorted this out. Admittedly if I’d been in his shoes I’d have been embarrassed to have to admit I’d mixed up impulse responses and frequency responses. A year later you’d think he’d have sorted this out by now.
“I did wonder what the equivalent weighting set for Gaussian, and F3 (1.2067) would be :-)”
You can readily use the r3m.sh script (that calls a simple running mean three times) to do any variation on that theme, There are two factors k1 and k2 . So use VP’s 1.2067 and 1.2067^2 or the asymmetric values that I prefer for suppressing neg. lobes (comes out identical to VP’s values on 12 months ie 12,10,8)
If you want to combine it to a one-stage op.. just convolute each stage’s weighting with the next , ensuring enough length for the final result without running out of space.
I would have thought the best to do in C is simple RM as one proc and then call it thrice as I do in r3m.sh
Most (all?) of the scripts have a commented out line in the END block to dump the array of weights. That should allow easy verification that you are producing the same thing.
Script for gaussian low-pass, to complete those discussed in article…
http://climategrog.wordpress.com/2013/12/08/gaussian-low-pass-script/
Greg: I think there is an error in your code
…
# calculate normalised gaussian coeffs
for (tot_wt=j=0;j<=gw;j++) {tot_wt+=gwt[-j]=gwt[j]=exp(-j*j/two_sig_sqr)/ root2pi_sigma};
tot_wt=2*tot_wt-gwt[0];
…
Last line should be
tot_wt=2*tot_wt-gwt[gw];
shouldn't it to be consistent with the Lanczos code?
Greg: Sorry, my mistake, that is only because I am using normal arrays whereas you are using 0 for the centre. Damn code conversions. Ignore the above.
Greg: Now I have a program I can think through the limitations that using it implies (that’s just the way my mind works – been doing things that way for too long I suppose:-).
All the filters described can be/are implemented as an array of weights (kernel) of a particular width applied sequentially to a data stream. The various filters devolve to a set of weights of given widths.
The originally suggested ‘running mean’ has a width of 35. Vaughan’s F3 has a width of 41. Lanczos has a width of 75. Presumably Gaussian has a width somewhere between 41 and 75 (perhaps Vaughan can supply it?).
These arrays are then filled in with what appears to be a normal distribution with a particular Q mirrored around the centre.
The implications of this are that there is a minimum frequency that the above filters can detect in a data stream of a given length.
That is, stream length – kernel width to give a single resolved sine wave (or other wave shape for that matter).
Thus for a data stream such as UAH, with a monthly stream length of 413 months to date, a Lanczos low pass filter cannot ‘see’ cycles any longer than 413-75 months which is 28 years or so.
No doubt this is expressed somewhere in digital filter terminology by someone before, I had just not thought it through for myself.
It also means that attempts to look for narrow frequency bands on such short data streams are doomed to failure as the implied kernels for them will probably be larger than the stream can supply. Otherwise you are infilling the ends of the stream with 0 or noise or something whether you realise it or not.
@RLH: Vaughan’s F3 has a width of 41.
If you’re referring to my 21-17-13 F3 filter in my spreadsheet, I get 49. This can be confirmed from the 49 cells cells AQ246:AQ294 of my millikelvin spreadsheet. How’d you get 41?
Presumably Gaussian has a width somewhere between 41 and 75 (perhaps Vaughan can supply it?).
In theory, infinite. In practice, 21-27 depending on the quality of the periods in your signal.
In theory a Gaussian G_0 is infinitely wide, as are all its derivatives G_1, G_2, … (The point of the derivatives is to get narrower bands.) As Greg and I discussed last December in my millikelvin post, in practice one truncates G_0 (and its derivatives). MATLAB’s wavelet package offers all the even derivatives of the Gaussian but offers you an extra parameter allowing you to truncate them where you want.
A 21-point binomial, or for that matter an 11-point binomial, is close enough to G_0 for government work, but unlike the theoretical G_0 has finite support. But those too can be usefully truncated as their tails are tiny.
Bottom line: suck it and see. There is no right answer.
No I was using 8, 10,12 but I may well have counted wrong.
The point I was trying to make is that at the end all of these devolve into a kernel of some width and weighting that is drawn over the data set.
I also noted when I looked at them but did not mention was that some of the weightings are so small as to be irrelevant given that most of the data is actually no more accurately available than 0.01C at best and often only 0.1C.
So what would you consider to be the contents of a reasonable Gaussian 12 month kernel (preferably as a set of constants for widest possible use without translations)?
Vaughan: Let me be specific then. Climate data is only available to 0.01C accuracy and the results equally only need to be to 0.01C resolution.
Given those two limits what 12 month Gaussian window kernel size would be best?
If you’re specifying 12mo with the aim of removing a strong annual cycle I would say don’t use gaussian , use a cascaded RM (both VP’s coeffs and my asymmetric version give identical choice when limited to monthly data : 12,10,8. )
Lanczos is a superior filter but you cannot target the zero to hit bang on 12mo when using coarsely sampled monthly data and it does have a broader kernel if you are worried about losing the ends of the data.
Talking of 0.01 is not helpful , it is the proportional error that you need to consider. Further truncating the kernel and thus introducing more artefacts is not a good idea. 3-sigma gaussian truncates the tail when it is below 1%. That’s good enough for a lot of situations. However, adding greater error right across the data just to gain a few more monthly data points at the end seems like a bad idea.
I’m not always worried about being hard-line about removing absolutely ALL the 12mo signal. Often just preventing it swamping the rest of the signal is enough (eg for FFT) , a little leakage is acceptable. In this case the flat pass band and steeper roll-off of Lanczos, may make it a good option.
It’s horses for courses. Don’t look for a one-size-fits-all solution.
If you want to stamp out 12mo signal on monthly data (12,10,8) triple running mean is good. If you want to decimate to annual use (24,21,15)
Well as I thought I had made clear many times the characteristics I am looking for are to split the input data series into double octave bandpass sets by cascading low pass filters and differencing their outputs. Such that wave shapes in the 1-4 year, 4-16 year, 16-64 and greater than 64 year ranges are output with least distortion.
This is often done in audio and other analogue disciplines. Just repeating that work in Climate.
Richard: “You seem to be, at least to the casual observer, mixing up two terms, frequency and period, and hence reversing to my mind what might be considered the normal usage.”
Why do you conclude that a graph labelled “high-pass” that has an x-axis labelled as frequency and showing an amplitude of unity at higher values of frequency and attenuating down to zero a zero frequency is somehow “mixing up” frequency and period?
However, on viewing the graphs I do notice that there is an error in the way the units are written on the x-axis.
“frequency / year” should be “frequency / (per year)” or “frequency / (year^-1) or something similar.
There is no confusion (except on your part) between freq and period. Low-pass filters are marked as low-pass and are correctly plotted, as are the high-pass ones. Axes marked as “frequency” are, not surprisingly, frequency plots not period plots.
It’s not possible to replace a graph on wordpress, so I’ll add a note about the units to save anyone else from getting confused by that.
Greg: Yes I realise I expressed myself badly. Sorry. What I suppose would make it clearer is to add a frequency plot as well as your period plot so that people who are used to seeing frequency plots (such as those like me who have an audio background) would understand it all quicker.
The words are, as you say, correct.
Greg: Or as you suggest have a different label on the x axis. Sorry once again.
Richard, where are these “period plots” you are referring to ??
Greg: Just me still explaining things badly. I suppose it all comes down to being used to seeing things on log horizontal plots with dB vertically rather than linear scale on both axis. Not your fault, mine.
This kind of breakthrough is why I wish I understood statistics better.
==========
Marilyn vos Savant seems to be good at statistics, kim, at least up to the Monty Hall problem level. However she seems not to have a poetic bone in her body, not to mention being clueless about physics. Would you rather be like her or like you?
Greg:
Nothing that you present here is in any way original, particularly
revealing, or an unexamined aspect of digital data analysis. The proper
frequency reponse of MAs, cascaded or not, as well as of Lanczos, Kaiser,
Butterworth and Chebychev filters has been well-known for half a century.
Each of those filters has its proper and improper uses, and there are many trade-offs involved in any practical application.
The only novelty is your misguided notion that “[s]ince you don’t know what
the original signal is before you start the analysis, you can’t know where
to look for the aliases.” The whole beauty of frequency-domain analysis
lies in revealing the spectral content of the original data and the effects
of any linear operator upon it. Aliasing into any baseband frequency f
always takes place entirely predictably through the summation of spectral
content at the alias freqencies 2k*fnyq +/-f (for all positive integers k),
where fnyq is the Nyquist frequency. If there is negligible spectral
content at all alias frequencies–as revealed by power spectrum analysis of
the original (raw or filtered) data–then the baseband after decimation
remains relatively uncontaminated by aliasing.
My whole point about the power density of raw monthly average UAH anomalies
being down to the relatively flat “noise floor” at the intra-annual
frequencies bears precisely upon that point. It is not a comment upon the
S/N ratio per se, as you mistakenly assume in writing: “That fact the S/N
ratio in climate data is very low is not a reason to dismiss any effects as
being in the “noise floor” and to stop trying to understand climate.” There
can hardly be any intelligent understanding of climate without thorough
analysis of the spectral structure of temperature time-series. Unbeknownst
to you, that matter has been quite thoroughly examined many decades ago
using sampling rates as high as 1 minute. Although problems can arise in
determining accurate daily and monthly averages, your false alarm about
smoothing monthly data is patently based upon real-world inexperience and
lack of deeper analytic insight.
Harsh. Had I not already taken John’s side I’d be taking Greg’s.
And for those who so quickly jump to DSP as the ‘answer to everything’ consider visualising the kernels that the DSP algorithms will create and how those kernels will then be drawn through the painfully short data series available may show the limitations that is also brings.
One of the reasons why I believe that searching for narrow (single cycle!) frequencies with FFTs in a short data set is doomed to failure at the start.
Sorry Vaughan: Moved one too many Replies up to answer, This was not aimed at you but was supposed to be below my contribution below.
“Nothing that you present here is in any way original, particularly
revealing, or an unexamined aspect of digital data analysis….
Each of those filters has its proper and improper uses, and there are many trade-offs involved in any practical application.”
I nowhere suggested any of this was new to the world of signal processing. The aim was to highlight the defects of what seems for many to be the de-facto “smoother”. The very use of that term itself suggests ignorance of the issues involved rather than an informed and carefully balanced trade-off decision about what filter to use.
You, yourself suggested that a monthly MA is suitable for decimating monthly to annual data, which is plain wrong.
“Unbeknownst to you, that matter has been quite thoroughly examined many decades ago using sampling rates as high as 1 minute. ”
Well since you don’t provide anything more credible than you own assertion that someone , somewhere once did it correctly and you don’t even say what they found, there is no reply I can make to that other then to note the irrelevance of such a statement.
RC Saumarez recently showed in an article on this site that HadCRUT data was very likely showing evidence of aliasing.
I showed that HadSST destroys a strong signal at around 9 years present in ICOADS SST. here:
http://climategrog.files.wordpress.com/2013/03/icoad_v_hadsst3_ddt_n_pac_chirp.png
I note in passing the part of the Hadley reprocessing involves applying short window running averages across adjacent grid cells thus effectively applying both a spacial and temporal distortion. This operation is repeated indefinitely until it “converges”.
The resulting 5 day interval time series is then re-sampled at monthly intervals by simple averaging, without an anti-alias step.
It would appear that one result of that is the removal of the circa 9y peak
There is an appalling lack of lack of knowledge of basic data processing methodology evident in climate science even at the highest levels.
There are two main reasons for the use of simple running average, ignorance and laziness. The latter may involve a trade-off .
“You, yourself suggested that a monthly MA is suitable for decimating
monthly to annual data, which is plain wrong.”
Nonsense! What I suggested is that a 13-month trapezoidal filter is
preferrable to a 13-month MA for display purposes and can be used
effectively for SEMI-decimation. Unlike full decimation, which aliases the
higher-frequency half of the main lobe of the filter response into the
baseband, semi-decimation aliases only the rapidly decreasing side-bands.
It also provides better anti-aliasing protection at the near-zero
frequencies, which are of greatest climatological interest. Even full
decimation, however, leaves those frequencies relatively unscathed. In any
event, your surmise that aliasing somehow “destroys a strong 9yr signal” is
utterly illogical. Aliasing can only add–never subtract–spectral
content in the baseband.
What was learned many decades ago about the spectral structure of
intra-annual temperature variations is scarcely made “irrelevant” by the
general unavailability of the technical reports. Those variations are chaotic, with relatively featureless, nearly flat power densities. It is precisley such “noisy” data that MAs are particularly effective in suppressing. Were it not for the amateurish practice of plotting your spectra as a function of period, you could get a glimpse of the relative insignificance of the “noise floor” yourself, by utilizing of the Parseval relationship. That might persuade you from further riding the academic hobby horse of side-band reduction.
Hmmm. Name calling rarely helps in clarifying things.
I think that all can agree that decimation (sub-sampling) without some form of anti-alias filter is bad. In any form of signal processing, analogue or digital.
Therefore Greg is correct that the normal practice of monthly and yearly summaries by simple averages over those periods is a lot less than ideal.
From the discussions above it would appear that low pass filters of 28 days and 365 days/12 months would be a better solution to summarise data. It looks like Gaussian is a preferred candidate over cascaded running means (though a three stage one of those does produce an answer that is very close to Gaussian also).
Greg is quite rightly complaining that the obvious statistical limitations of simple averages are overlooked by most of climate science. The fact that it is demonstrates that most climate scientists have little understanding of the implications of the tools they so casually use.
Greg: So for a 12 month/17 point Gaussian kernel I get the below.
/* A Gaussian kernel of size 17 can be constructed with the below (which should be more easily translatable into most other computer languages).
*/
int GaussianKernelSize = 17;
double[] [GaussianKernel = new double[GaussianKernelSize];
[GaussianKernel[0] = 0.004;
[GaussianKernel[1] = 0.009;
[GaussianKernel[2] = 0.018;
[GaussianKernel[3] = 0.033;
[GaussianKernel[4] = 0.055;
[GaussianKernel[5] = 0.081;
[GaussianKernel[6] = 0.107;
[GaussianKernel[7] = 0.126;
[GaussianKernel[8] = 0.134;
[GaussianKernel[9] = 0.126;
[GaussianKernel[10] = 0.107;
[GaussianKernel[11] = 0.081;
[GaussianKernel[12] = 0.055;
[GaussianKernel[13] = 0.033;
[GaussianKernel[14] = 0.018;
[GaussianKernel[15] = 0.009;
[GaussianKernel[16] = 0.004;
Assuming I haven’t made any errors anyway!
This can then be applied to any input data stream with ‘NaN’ or ‘not a number’ being output for the first and last 8 rows of the input stream to get a similar output stream length.
You will want to use full f.p. precision , not 2 or 3 sig figs. Also the algo is not so complicated, it seems pointless to work with a table like that which is specific to one period.
Greg: I do understand that full floating point precision can be needed but as the input data sets are only to 0.01C precision (at best) and the data range is can be as low as 0.6C to -0.6C (and has a maximum for most sets of +-30C) the available input digitisation limits the precision needed I think but adding the extra decimal point is not difficult.
This is very specific for a 12 month filter and only has 17 steps hence the shift to constants. I do understand that the algorithm allows for a wider range of choices but that also requires a wider range of source code examples.
int GaussianKernelSize = 17;
double[] GaussianKernel = new double[GaussianKernelSize];
GaussianKernel[0] = 0.0038;
GaussianKernel[1] = 0.0088;
GaussianKernel[2] = 0.0181;
GaussianKernel[3] = 0.0333;
GaussianKernel[4] = 0.0549;
GaussianKernel[5] = 0.0810;
GaussianKernel[6] = 0.1070;
GaussianKernel[7] = 0.1264;
GaussianKernel[8] = 0.1336;
GaussianKernel[9] = 0.1264;
GaussianKernel[10] = 0.1070;
GaussianKernel[11] = 0.0810;
GaussianKernel[12] = 0.0549;
GaussianKernel[13] = 0.0333;
GaussianKernel[14] = 0.0181;
GaussianKernel[15] = 0.0088;
GaussianKernel[16] = 0.0038;
” It looks like Gaussian is a preferred candidate over cascaded running means (though a three stage one of those does produce an answer that is very close to Gaussian also).”
There are cases where a well designed cascaded RM can be better than gaussian for certain needs like removing a precise period (annual for ex).
ie not just “close” but better.
This is the sort of thing you sort out once then you use a better filter. Once you have your filter it’s absolutely no more effort to use one kernel than another.
It is conceivable that there are very specific cases when you really need to run as close to the end as possible where the compact kernel of a straight RM might mean you want to go to the bother of doing spectral analysis to determine that there is sufficiently little spectral content in the negative lobes and go with that as a solution. Though I cannot recall ever seeing that documented as being used. It sounds far-fetched to me. More like an ad hoc excuse for using a poor filter than a deliberate initial strategy.
Well on that basis and as Vaughan said a 49 kernel width for an F3, a Gaussian of width 17 would be able to get closer to the ends which kinda shoots that point in the foot.
We are predominantly talking about a 12 month filter. That is probably the most abused in climate science.
What is needed is a simple algorithm that can be applied to a data stream. I’ll take my 19 lines of code/constants (which can be simply translated into almost all computer languages) over your 10 lines of compacted, geek only readable algorithm any day. If you are going to do it like that at least have the decency to include some comment lines so that people do not have to unravel the code line by line to get what the actual meaning is.
I have spent way too much of my life working out exactly what it meant by some set of code and figuring out why it does not do exactly what the author intended it should.
More verbose code and documentation and communication would have helped in almost all cases.
Richard, this article was intended to highlight an issue. I was not intended to be even an introductory tuto on filter design and optimisation. Neither is it a lesson in programming or porting programs.
I had the “decency” to provide working scripts for several alternative filters, written in a language that is available free of charge on all major platforms.
I’m not going to try to explain how to install software for everyone’s fave computer system or explain to them how to run it. Neither do I have the time the help those struggling to port it to some other language.
I have other things to do.
Greg: Ok. So one final question. What Lanczos filter parameters would you suggest that completely remove any 12, 48 and 96 month cycles?
I have looked at the Gaussian you provide and the 17 wide kernel leaks too much below 12 months for my needs.
You cannot do that with a Lanczos filter.
Every filter that removes completely those cycles is either the 96 month moving average filter or a convolution of that and any other filter. Other goals that you have determine what the other filter should be (if any).
I don’t know where you got idea of a 17mo gaussian kernel from. That will have a sigma of about 3mo and will be comparable to a 6mo RM.
VP has already commented on what gaussian widths are closest to eliminating 12mo , so I’m not wasting time repeating it.
You will find the equiv gaussian somewhat longer than a cascaded RM.
Greg: From the awk script you supply on your page for a Gaussian low pass filter
http://climategrog.wordpress.com/category/scripts/
Gaussian low-pass filter
…
“# eg. window=2*gw-1 – 5 pts for sigma=1; 11pts for sig=2; 3 sig=17”
…
[code]
gw=3*sigma-1; # gauss is approx zero at 3 sigma, use 3 sig window
# eg. window=2*gw-1 – 5 pts for sigma=1; 11pts for sig=2; 3 sig=17
[/code]
OK Richard. I can see how that comment may have confused you.
The trouble is these comments are primarily my notes, that I try to audit to ensure they make sense to the outside world before publishing. This gauss.awk that I (hastily) added a few days ago seems to have got less auditing. Sorry for confusion.
Basically 3-sigma is the one of interest.
If you want something similar to 12mo 3RM, use sigma=6mo like I suggested above somewhere.
That will have a kernel running -17..0.+17 ie 35 values in the kernel.
Like I said, that’s a little wider than a (12,10,8) triple RM
I need to add something to the header to make is clearer how to use it. So thanks for pointing that out.
Greg: No problem. I have, as I said, spent all of my working life picking up the smallest details that help me find the problems with my own and others code in many languages.
This can lead me to wrong conclusions if I assume that the authors of the code were meticulous in their work.
John S. | November 23, 2013 at 5:23 pm |
“Like many newcomers to geophysical signal analysis, apparently you’re unaware that proper power spectrum analysis of the raw data reveals the spectral content in all frequency bands prior to ANY filtering. Filtering schemes are prescribed ex post , not ex ante. This lapse is one of many that often permeates your frequent postings as a self-styled signal analyst.”
Like many new-comers to DSP you fail to realise that with an annual cycle about two orders of magnitude greater than any long term signal, if you do frequency analysis without initially filtering to remove it, the results will likely be garbage and _look like_ random unstructured “noise”.
There are many problems such as windowing artefacts and sensitivity to accumulating errors in the intensive calculations involved in spectral analysis, that will destroy any chance of finding anything meaningful if you do not remove the annual cycle first.
John S. | December 6, 2013 at 7:26 pm |
“What’s totally spurious is the resort to a pathological example, while ignoring the general case. No competent analyst would use a 13-month MA for anything but visual display purposes. ”
Which actually underlines my point that there is a lot of incompetent analysis going on that this problem needs attention.
I’m not sure which case you regards a “pathological” but it would not make much sense to chose data where it did not matter to illustrate the point. The SIDC data (if that’s what you meant) does show the extent to which the data can be perverted and lead to false conclusions being drawn. In this case, one of the key parameters sought is the timing of the maximum.
John S. | December 6, 2013 at 7:49 pm |
“The preferred practical method for smoothing monthly average data is to apply a simple trapezoidal taper to a 12-month MA, i.e., use a 13-term kernel whose 11 inner weights are uniformly 1/12 and whose end weights are 1/24. This kernel still eliminates the annual cycle exactly, sharply reduces side bands, and allows “centering” of the output. It may be used equally well for decimation of monthly data into yearly averages, although I prefer to subsample semi-anually to examine possible aliasing.”
So I stand corrected that it was 13mo with the ‘first and last’ tweak not the 12mo RM, but you DID explicitly say it was suitable for 12mo decimation, which was my point. That applies just as well to 13mo as to 12mo in that it is ignoring the need to anti-alias the data.
John S. | December 10, 2013 at 10:30 pm |
“Nonsense! What I suggested is that a 13-month trapezoidal filter is
preferrable to a 13-month MA for display purposes and can be used
effectively for SEMI-decimation.”
“…may be used equally well for decimation of monthly data into yearly averages,”
I note that in trying to refute what I said you rather disingenuously forgot the mention that part and reiterate just the semi-annual case where it would fulfil the requirement. Cute.
John S.
“What was learned many decades ago about the spectral structure of
intra-annual temperature variations is scarcely made “irrelevant” by the
general unavailability of the technical reports.”
I did not say what was learned decades ago was irrelevant (since you provide not the slightest inkling of how to find what you are referring to )
I said the comment was irrelevant because it was an assertion so vague it did not even clearly state what it was asserting.
” That might persuade you from further riding the academic hobby horse of side-band reduction.”
My hobby horse is that using correct data processing methods like decent filters and correct re-sampling procedures does not cost anything (except special in cases where the last couple of years is of tantamount importance ) and is usually the result of ignorance rather than designed.
At the outset of my comments here, I wrote: “Running mean, or moving
average, smoothing as typically applied to climatological data is nowhere
near as onerous as is implied here. The usual purpose is to remove diurnal
and/or annual cycles, which such smoothing does very effectively with a
highly compact convolution kernel.”
It is utterly dishonest to pretend that I’m unaware of the paramount
importance of removing these strictly periodic components, orders of
magnitude greater than the sought-after “climate signal,” from the raw
data. My subsequent comment is plainly predicated upon such removal and
addresses your naive question of how can the power of ~9mo components
inverted by the first negative side-band of the 12mo MA be determined. The squared magnitude of the proper frequency response function (which is only ~4% at the greatest side-lobe) resolves that question completely in
undecimated monthly data. The “noise-floor” that you would mis-attribute to
spectral leakage–and whose inconsequential power density you blithely continue to ignore–is a persistent feature of real-world temperature data.
There’s nothing “cute” at all about examining the spectrum of semi-decimated monthly data before deciding, ex-post, whether full decimation MAY be harmlessly made. The 13mo trapezoidal filter usually provides entirely adequate anti-aliasing protection, very high noise supression, while always completely eliminating the annual cycle. You simply cannot get the latter performance from filters that emulate the ideal low-pass response more closely.
With every comment you make, it becomes more obvious that you have no practical experience with the “decent” filters that you so sanctimoniously espouse. And the fact that you botch so many basic things (evident, inter alia, in the non-unity frequency responses at f = 0 in your Fig.2 plots and your reliance upon misplotted raw periodograms in spectrum analysis) renders your bald pretensions to DSP expertise quite amusing. Having had my fill of chuckles here, I’m done with this misguided thread.
“There’s nothing “cute” at all about examining the spectrum of semi-decimated monthly data before deciding…”
What I described as “cute” was your attempt to refute my criticism and justify your earlier comments my selectively mis-quoting yourself and leaving out the part your got wrong which was precisely the part I commented on.
I agree there is nothing wrong with looking at the spectral content of the data. Indeed that’s something I do quite a lot of. However, since we are agreed that it is necessary to remove the strong annual cycle in order to do that effectively, it does not avoid the need for a well constructed filter.
The other side of this, that you also ignored last time I wrote it, is that it represents a huge effort to examine whether the distortions of a running mean “matter”. It is obviously more appropriate to use a better filter ( a solution you do once then apply with the same ease as a runny mean ) than to go to great lengths to work out whether a crap filter is “OK because…”.
“compact kernel” is only relevant in special cases where the last couple of years are of tantamount importance.
“The “noise-floor” that you would mis-attribute to
spectral leakage…”
Garbage. What I said is that that sloppy processing could well be destroying legitimate climate signals and rendering them indistinguishable from the noise floor.
” I’m done with this misguided thread.”
Thanks, you have raised some legitimate points. If you could discuss things without trying to rewrite what both yourself and others had said to avoid loosing face, you could probably have contributed more usefully.
thanks, nonetheless, it’s often more productive to argue with those who disagree.
oops, didn’t close the bold tag properly. I meant to highlight just your phrase: “It may be used equally well for decimation of monthly data into yearly averages”
Greg: Vaughan: Let me ask the question in a more specific way then.
What would you recommend as the Gaussian and Lanzcos kernel widths that would best correspond to a triple running mean low pass filter based on 12, 48 and 96 months using a 1.2067 inter stage multiplier and as a better replacement with less side effects to those that I am using at the present?
i.e. what are the kernel widths you are using in your various plots above?
If I use gauss.awk it’s usually with sigma=6 to suppress annual, though I generally prefer r3m.sh because it’s more precise.
If I want a high-pass I use lanczos since it has at least some flat pass-band.
To improve on this simple presentation of the UAH data to date :-)
http://snag.gy/iychw.jpg
Yes, that looks better than Dr Spencer’s 13mo RM. I’ve suggested he change it but it’s his corner. Like many he seems happy with peaks in the place of troughs.
BTW, you really need something more explicit than “4 years” , 4 year what?!
Equally “projected” is dubious however you do it, not even saying how is bad.
check to ensure you are correctly centring the data, you seem to my eye to have a slight lag. Is this 12,10,8 RM by any chance. I pointed out at the end of the article discussing using spreadsheets that even numbered RM will introduce a 0.5mo lag. Three times is 1.5 which looks like what I’m seeing. (Just guessing by eye).
My scripts log the date at a centred value so don’t do this. You may want to check you code.
Greg: Yes 8,10,12 and they are offset slightly as you say. Does not really effect things though.
The projected values are done by the usual method of infilling the required ‘future’ values by a constant, in this case one derived from the last valid 4 year (48 months) filter output. Much the same as the similar CET 21 point polynomial does (though they use the last actual figure).
This does mean they will twitch around slightly when the ‘real’ figures arrive but….
I’ll do a plot with Gaussian sigma 6 and see what the actual differences are. Small I expect.
Well the output is barely different to my 8,10,12 running mean so probably not worth the bother with the extra maths.
Corrected for the slight offset you noted.
http://snag.gy/N4pUQ.jpg
Now all that has to be done is sit and wait for more data :-)
You know, maybe you guys need to just find daily data, instead of already digested monthly or yearly data.
Oh, most certainly. In reality, where such data does exist, you often need to beg, steal, FIOA or pay large sums just for the pleasure.
Some stuff like AO index and Arctic ice coverage is freely available as daily and that’s informative.
If only it were always the case. ;)
If you can find me a source for daily UAH data then I would be eternally grateful.
I still don’t know what you’ve plotted but it looks a lot better.
It may seem like a knit but when you start looking for correlations and lags it starts to matter a lot. ;)
Sorry, did not see your explanation. Put it on the graph ;)
I have a copy of “Global Summary of Days” which is surface station data, goes back to 1929, but the number of samples taken doesn’t really get high enough till 1950, 1940 is the earliest that I even bother with. If you follow the link in my name, I have a number of pages where I created some graphs. Look through that, there’s an email address there, I’d be glad to provide what I can.
I also found this place, NCAR Climate Data Center that might have some of the other data you’d find useful.
Micro, I’m having diff finding your contact on that site, do I need to register or something.?
Does the data you have include the daily data from UK Met Office stations (Durham and Oxford for example) ?
I think if you click on my name there, it’ll take you to a page with a email option.
I got a copy of the CRU data, and they had almost an identical station list. On a number of the charts there’s a google maps link, each map has the complete list of station for that average. Here’s the global map you’ll have to switch from page to page until you find the UK, it’s a feature of google maps when you have a lot of pins.
I looked at that before and I needed a login. Anyhow, that site is chronically slow right now, like a minute on every click :(
Drop me a token msg and I’ll get back to you:
http://climategrog.wordpress.com/about/
Oxford and Durham are on the map so it looks like the same sites are available. What I was particularly interested in was Tmin, Tmax and the sun-hours from the UK sites.
I was following up on Euan and Clive Best’s refused paper and had to put it to one side for lack of daily data, just when it was looking interesting.
If you have the daily data, it would be great.
Try http://www.cru.uea.ac.uk/cru/data/crutem/ge/crutem4-2013-03/N52.5W002.5/038900_data.txt for the Oxford data
When I got a copy of CRU’s data it was “baby food”, nothing but an filtered digested annual temps, which I consider useless.
Sorry that was the monthly. Try http://www.metoffice.gov.uk/climate/uk/stationdata/oxforddata.txt for the daily info
“If you can find me a source for daily UAH data then I would be eternally grateful.”
don’t think there’s anything public. Try emailing John Christy, He’s quite responsive.
Greg: The plot is quite simple. The monthly values from UAH and a 12 month and 48 month low pass filtered output of the same all on the same graph (with the projected extensions) and a linear trend line.
I use the 48 month low pass as an arithmetic alternative to other forms of curve fitting because it is just the data with very little massaging.
For simple monitoring of future UAH output against basic projections of the same to date. If it does not get back to the linear trend line soon then AWG is in deep trouble.
I had not thought to email John Christy as I am sure he gets bothered way too much already but it may well be worth trying at least once. What I would really love is the 12 month normal that they base the anomaly on as then it would be possible to reconstruct the absolute values.
Getting daily data might knock some of the alias artefacts that may well be present in the data but, given that I am 12 month low pass filtering already, any such side effects should be well taken care of (I hope).
“Getting daily data might knock some of the alias artefacts that may well be present in the data but, given that I am 12 month low pass filtering already, any such side effects should be well taken care of (I hope).”
Sadly, it does not work like that. Once an alias, always an alias.
You can’t un-corrupt the data retrospectively unless you have enough information to know what the cause was, in which case you just go back and do it right.
http://www.nsstc.uah.edu/public/outgoing/outgoing/msu/t2lt/
Daily zonal data (tropics ex tropics etc) . dig and you’ll find the climatology file to add back in for absolutes
Gerg: That directory also appears to be aliased at http://www.nsstc.uah.edu/data/msu/t2lt/ as I use that to download the uahncdc_lt_5.6.txt data file that is the basis of the graph I showed.
Still unable to work out which of those files (or anywhere else in those directory trees) is the climatology file though :-(
“Still unable to work out which of those files ….”
At a guess I’d say it’s the smallest one with 366 lines in it.
If the worst comes to the worst you could try reading the README ;)
IIRC the bit on formats and file names is a fairly way down.
Greg: Yes, I had tried to wade through the readme(s) but obviously failed to persevere to the extent required to pick out the right answer. This sort of ‘I know the right answer but you will have to figure it out for yourself, I am not going to provide it to you’ type of guessing game shows a significant inability to be a mentor. I do hope your day job is not in education.
You could have just said. “It is the http://www.nsstc.uah.edu/data/msu/t2lt/tltdayac8110_5.5 file that you need” you know. (At least that appears to be the file I need given the breadcrumb clues you provided. I will visit the readme with more diligence to determine the file and field formats as you suggest).
Anyway that is enough testiness on my behalf for now. Apologies in advance if it has rubbed you up the wrong way.
Any thoughts on your advice as to how to simply create bandpass filters? As you know I have been using cascaded triple running means and subtracting one stage from the next. I wonder if you have any insights as to a better method?
“This sort of ‘I know the right answer but you will have to figure it out for yourself, I am not going to provide it to you’ type of guessing game shows a significant inability to be a mentor. ”
It’s not at all that, Richard, It’s: I’ll take some time to point you in the right direction but I’m not going to do you leg work for you. You will need to read the doc to find out what day 366 is and how to use it. I can’t remember and I’m not going to read it all again so that I can spoon feed you.
Once I’d told you to look for the smallest file it would take you about 2s, so I did not think it necc to post a link.
If I was getting paid as an educator I may have more time. As it is I’m taking time of the climate work I’m trying to do, to help you along. If I was trying “show ability as a mentor” I would likely have be more hard line and just asked you why you had not read the doc before posting questions about how you could not work out what file it was.
But I’m not, so I didn’t ;)
Greg: Fine by me.
So your thoughts on bandpass filters?
And any thoughts on these two simple presentations based on your work on triple running means?
http://www.woodfortrees.org/plot/hadcrut4gl/plot/hadcrut4gl/mean:180/mean:149/mean:123
http://www.woodfortrees.org/plot/uah/mean:90/mean:74/mean:62/plot/uah
You seem to be using VP ratio (which is fine) but probably unnecessarily heavy filtering.
Here, I’ve used my asymmetric ratios and a slightly shorter base period.
As you can see here
http://climategrog.wordpress.com/2013/03/01/61/
… many ocean basins have a peak at or just below 13y , so I took 13y as the base period to block:
http://www.woodfortrees.org/plot/hadcrut4gl/mean:156/mean:136/mean:86/plot/hadcrut4gl/mean:156
http://www.woodfortrees.org/plot/hadcrut4gl/mean:156/mean:136/mean:86/plot/hadcrut4gl/mean:156/plot/hadcrut4gl/mean:84/mean:73/mean:46
Firstly we can see the amount of crud that a simple RM lets through, much of which is inversion artefacts rather than just stop-band leakage.
We see around 1880, 1900 and 1960 the old RM peaks-for-troughs corruption.
The 15y RM is comparable to 7y cascaded RM if you just want a “smoother”. This makes the “compact kernel” argument rather moot, since you can have a better, non corrupted result with about the same amount of truncation and it is a _lot_ “smoother”.
Also it is interesting how linear the rise and fall sections are with the 13y filtering.
BTW, I don’t consider I’ve done any “work” on this , I’m just highlighting a problem.
This Is not smoothing or any such thing. This is natural cycle discovery by using (very) wide band filters.
It is demonstrating there is a clear ~60 year cycle in the temperature data (and indicating that it is likely to be also present in the UAH data but that record length is not yet long enough for it to be determined precisely).
My previous graph showed that there is a strong >1 year and <4 year component also.
The problems with trying to find any such cycles with narrow band filters (of any sort) is that the 'noise' and short signal length become the dominant terms making such usage problematic, to my mind at least.
I have always agreed with you that common climate science usage of decimating 12 month averages is bad.
You might like to consider running the above 15 year triple mean (or an equivalent Gaussian) on the data from the ocean basins as well. I think you will find strong ~60 year cycles there also. (I know it is 7.5 year on short data lengths but that is all there is).
Now you could try a 55-75 year narrow band filter instead but….
In the 13y version I did , there is just a hint of something around 20y , stronger earlier than now.
I think the almost linear rise and fall is (roughly) 60 and 30 . This 2:1 ratio can cause a triangular form similar to the 12mo + 6mo combo in the MLO CO2 record.
http://climategrog.wordpress.com/?attachment_id=721
If you now have working filters you could try the 13y result with some form of cascaded 3RM then try to fit a model. quadratic + cos 60 + cos 30. That would give some idea of the relative magnitude of the cyclic components. Clearly they do not account for the whole thing.
Alternatively you could take the differential (first difference of TS) then fit linear plus the two cos. Then do the same thing ignoring the cycles and see how much error ignoring the periodicity makes to how fast the quadratic rises.
see how the long term compares with this:
http://climategrog.wordpress.com/?attachment_id=523
You obviously believe much more than I do that with only two cycles of ~60 years visible in the record you can assume anything about likely waveshape and/or other cyclic components within one octave from the fundamental.
About all one can reliably do (to my mind anyway) is deduce that a cycle exists. Anything much beyond that is speculation.
I’m not assuming anything at all. That record can be modelled reasonably accurately in the way I suggest, that’s all.
If you fit that kind of model I think you will find that the fitting errors are relatively small.
I said nothing about whether I thought the record was an accurate reflection of true SST+land, whether Hadley centre have improved or corrupted the data with all the “bias corrections” and don’t even want to consider that the climate warriors at CRU have done to the data before losing it so no one can check their work. You chose to discuss HadCRUT, not me.
I certainly made no assumptions about whether the fitted circa 60/30 cycles existed in climate before 1850, whether they vary over time, and whether they will still be there in the future.
You seem to be making a lot of assumptions about what I’m assuming.
“About all one can reliably do (to my mind anyway) is deduce that a cycle exists. ”
Well if you can’t say what a cycle is, you can hardly say it exists. That’s a pretty silly statement.
Greg: We have two samples of some cycle ~60 years in length (with noise and uncertainty mixed in). TWO. It is very unlikely to be a simple sine wave in shape. The unknowns (and the unknown unknowns :-) make it very problematic to be certain about much beyond its existence at ~60 years at present. Of course you can model it. You can model it as a sine wave. You can model it as a triangular wave. You can model it as almost anything with a wriggle in it of the correct length. The challenge is in being able to figure out just which it really is.
There also appears to be some cycle >100 years in length mixed in (if you don’t make some naïve assumptions about linear trends up from some little Ice Age starting point). Now with all that and given the shortness of the record I stand by my observation that being certain about much beyond stating that it is ~60 years is probably showing prejudice rather that fact.
So with a record length of say 150 years (and assuming a data accuracy that is constant over that entire record), how long a cycle do you recon you can reliably determine (with phase and magnitude)?
This is going off into a whole other discussion I don’t want to spend time on, I’m afraid.
Your WTF.org plot illustrated that RM distorts peaks and also is not even a good smoother, with a 3RM of similar kernel width providing substantially better smoothing without the distortions and spiky result.
I’m going to have to leave it there, I think.
Sure. No problem. I agree that RM is bad. I agree that RM3 has a near Gaussian output and is much better (and computationally much simpler) . I note that it is futile to look for cycles that are longer than approx. 1/2 the record length. I note that using a bandpass filter that removes the strong 1 and < 4 year components in most climate data series allows longer cycles to be better investigated.
Thanks for your replies.
“Selectively misquoting yourself” is a lame fantasy, predicated upon your failure to distinguish the functional difference between MAY and CAN in my distinct statements about full and semi-decimation with the trapezoidal filter. Ironically enough, it’s you who engaged such self-misquotation when you changed “a monthly MA” on Dec10 2:33am to the later “12mo RM.” Intelligent readers will decide who’s trying to saver face here on substantive technical issues.
Oh, you still here, I thought you’d gone home.
John S. | December 6, 2013 at 7:49 pm |
“The preferred practical method for smoothing monthly average data is to apply a simple trapezoidal taper to a 12-month MA, i.e., use a 13-term kernel whose 11 inner weights are uniformly 1/12 and whose end weights are 1/24. This kernel still eliminates the annual cycle exactly, sharply reduces side bands, and allows “centering” of the output. It may be used equally well for decimation of monthly data into yearly averages, although I prefer to subsample semi-anually to examine possible aliasing.”
So your latest attempt to disown this wriggle out without admitting being wrong appears to be that a 12mo MA may [b] ( or may not ) [/b] be used equally well for decimation….
Is that a correct interpretation of your “predicated” position?
No matter how you twist the meaning of my words, I stand behind the CONDITIONAL statement that the 13-mo trapezoidal smoothing filter “MAY be used” to decimate monthly data–PROVIDED that the aliased power, as shown by the power density spectrum of the smoothed monthly or even SEMI-decimated data, is negligible. Apparently, you’re unaware of the multi-octave “noise floor” ion the spectrum of monthly UAH anomalies. The trapezoidal smoothing differs from matched binomila filtering of such data differs only in inconsequential wiggles.
So you’re saying that as long as there is nothing there to cause an aliasing problem, you MAY use a distorting, leaky filter. Brilliant. in that case you don’t need an anti-alias anyway.
Neither does this get around the need to do a full spectral analysis to discover whether a crap filter is good enough. Plus the fact that to effectively do the spectral analysis you need to filter out the annual cycle , presumably without distorting the spectrum you are trying to assess. Chicken, meet egg.
That is a ridiculously contrived method to avoid admitting your initial statement was wrong. Which is why you selectively mis-quoted yourself neatly missing the 12 month part hoping no one would notice.
A more logical and appropriate method would be to use a better filter in the first place that does not require detailed spectral analysis before it’s every use.
BTW your “preferred” 13mo filter is an 11mo RM convolved with a 2mo RM so it does not have the precise zero pass at 12mo that you thought was such an impressive over-riding advantage in the first place.
It is strange that you invest such effort in suggesting a very specific two stage RM is “the preferred” solution but a much better performing, generalised, three stage filter is a waste of time.
I again, draw your attention to the SIDC sunspot data I showed in the article which used PRECISELY the filter you are now espousing as the “preferred solution”.
SIDC recognise that it is defective and only retain it for historical compatibility with 19th century calculations. You seem to see it as the way forward for the 21st.
ALL intelligent prescriptions of sampling or sub-sampling rates of
continuous-time signals are made ex-post, not ex-ante, with indispensable
recourse to power spectrum analysis. In practice, specific data are known
empirically to fall off to a “noise floor” beyond some high frequency.
Experienced professionals rely upon such acquired spectral knowledge to
prescribe anti-aliasing filters and sub-sampling rates for the entire CLASS
of such specific data, not necessarily each individual MEMBER. Decimation
on such basis is done even in some mission-critical military applications,
where no resources are spared to improve performance.
Contrary your claim, the 13mo trapezoidal filter is indeed the convolution
of the 12mo MA weights [sic!] with those of the 2mo MA. As is readily
evident from its Z-transform, the frequency response is exactly zero at
12mo and all higher harmonics. And contrary to your “brilliant” surmise,
it’s the combination of the POWER transfer of that filter AND the deep noise
floor of monthly temperature anomalies that makes even full decimation into
yearly averages usually acceptable in practice. Inasmuch as the yearly
average figures indispensably into the calculation of truly long-term
temperature means, the practical motivation for such processing is quite
obvious. This advantage goes quite beyond the simple matter of sacrificing
less valuable data to end-effects.
Precious little is gained in suppressing side-lobe aliasing with far
lengthier kernels when the reduction amounts only to ~O.01K rms in
band-limited wiggles which do NOT alias appreciably into the lowest
frequencies. Only if frequencies close to the QBO were of great interest
would side-lobe reducing filters be required. Greatest climatological
interest, however, lies at the opposite end of the spectrum.
I will not waste more time here on your inept notions and pretentious
prattle.
John: Your comments would demonstrate significantly more weight if you had provided Bode plots (as Vaughan did when demonstrating the advantages of the 1.2067 inter stage multiplier) of the two competing filters in question to support your case. Care to do so? Would you also care to elucidate as to why your preferred choice is so much better than Gaussian given that RM3[1.2067] very closely approximates to that?
Would you (John S.) care to explain why an almost arbitrary two pole variant is “the preferred” solution, yet a carefully designed three pole one not “preferred”?
Since John no longer has any time to attempt to justify his “inept notions ” , may be this will help visualise how ineffective the “taper” tweak is at correcting the flat running mean:
http://climategrog.wordpress.com/?attachment_id=741
John S. describes this as “the preferred” solution without saying preferred by who or against what criteria it is deemed to be preferable.
Like I said, you may as well not bother. It just recognises there is a problem without fixing it.
Richard:
I do not maintain a web-site for displaying plots. But I can post the numerical values of the amplitude response of the 13mo trapezoidal filter when I return to my office tomorrow.
My preference for that filter over others is based primarily on the behavior in the pass-band, where the transmission is very appreciably greater than that of triply cascaded, annual-cycle annihilating MAs, and upon the compactness of the kernel, which reduces end-loss by a factor near 3. In the case of UAH global anomalies, only 0.0024 of total variance of filter output lies at frequencies above the annual cycle. I cheerfully accept the inconsequential side-band leakage and potential polarity reversal of higher-frequency low-variance wiggles.
On the other hand, gaussian or binomial filters that nearly match the pass-band response of the trapezoidal filter don’t eliminate the annual cycle completely. While this is relatively a minor problem when monthly anomalies are the input, it presents a huge problem with actual monthly temperatures.
tinypic.com ;)
Richard:
Here is the amplitude response of the 13-pt trapezoidal filter along with
that of a closely matching binomial filter of 55-pts(of which only 41 are
numerically significant):
Index MA12*MA2 BIN55
0 1 1
1 0.983407 0.981663
2 0.934634 0.92862
3 0.856628 0.846436
4 0.754058 0.743318
5 0.632979 0.628786
6 0.500395 0.512243
7 0.363755 0.401764
8 0.230443 0.303275
9 0.107262 0.220243
10 0 0.153803
11 -0.086935 0.103228
12 -0.150751 0.066549
13 -0.190383 0.041183
14 -0.206466 0.024445
15 -0.201184 0.013907
16 -0.178009 0.007576
17 -0.141345 0.003948
18 -0.096133 0.001966
19 -0.047428 0.000934
20 0 0.000423
21 0.042022 0.000183
22 0.075426 0.000075
23 0.098094 0.000029
24 0.109085 0.000011
25 0.108602 0.000004
26 0.097871 0.000001
27 0.078936 0
28 0.0544 0
29 0.027136 0
30 0 0
31 -0.024437 0
32 -0.044104 0
33 -0.05758 0
34 -0.064179 0
35 -0.063944 0
36 -0.057582 0
37 -0.046335 0
38 -0.031809 0
39 -0.01578 0
40 0 0
41 0.013982 0
42 0.024958 0
43 0.032157 0
44 0.035286 0
45 0.034518 0
46 0.030423 0
47 0.023874 0
48 0.015915 0
49 0.007628 0
50 0 0
51 -0.006182 0
52 -0.010411 0
53 -0.012495 0
54 -0.012553 0
55 -0.010971 0
56 -0.00833 0
57 -0.005306 0
58 -0.002567 0
59 -0.000674 0
60 0 0
The frequency index k identifies k*Nyquist/60 over the entire baseband.
Both filters produce zero phase delay when their output is properly
centered.
Clearly, there are 6 side-bands beyond the annual frequency at k = 10, which diminish quickly due to MA2 in the higher frequency portion–a feature entirely concealed in GG’s half-truthful response comparison. The ~.01K rms discrepancy between the two filter outputs when applied to UAH monthly anomalies is due as much to the failure of the binomial filter to zero-out completely the annual components (produced by always imperfect “anomalization”) as by miniscule signal components passed by the side-bands of the trapezoidal filter.
Nothing resembling such response matching is evident in GG’s highly
misleading smoothing comparison in his Figure 3. If you apply both
filters to actual monthly temperature data, instead anomalies, you’ll find
that only the output of the binomial filter increases very sharply. And if
you resort to more optimal filters (such as Lanczos) with their
impractically long kernels to suppress the annual cycle, you’ll find a
smaller discrepancy with the trapezoidal filter than with all others
considered here.
It is foolish to sacrifice greater transmission in the pass-band and/or the
zero-out property of the trapezoidal filter for practically inconsequential
gains in smoothness from side-band suppression. Oversmoothing of the
signal by triply cascaded MAs leads to inevitable magnitude distortions of
important pass-band signal components and misleading indications of
low-frequency spectral structure in typically short temperature records.
That is letting the tail wag the dog when considering practical trade-offs.
Apologies for tab suppression in my table by WordPress.
Correction: My comment should read 5 side-bands, not 6.
It occurs to me that a role for the 13-point trapezoidal filter (the 12 2 F2 filter in my terminology) is to reduce discontinuities in the first derivative of the output.
A discontinuous input such as a step function of height h is filtered by an n-point uniform filter to a ramp of length n. This reduces the discontinuity in the original signal by a factor of n, namely by distributing it over n points.
However if one defines the slope between two consecutive points of the output as the rise there, the slope changes discontinuously from 0 to h/n at the ramp start, remains at a steady h/n during the slope, and discontinuously changes back to 0 at the ramp end.
With the 13-point trapezoidal filter, as the ramp is entered the slope goes from 0 to h/2n to h/n, a more gentle rise. This is mirrored at ramp end as the slope goes from h/n to h/2n to 0.
While this view is equivalent to the filtering action of the 2-point component of the 2 12 F2 filter, which filters out the high frequencies associated with sharp edges in the octave on the low side of the Nyquist frequency, it is presented in the time domain instead of the frequency domain. The options of viewing the effect of the 2-point box filter as a component of this cascade in either the frequency or the time domain caters equally to those more comfortable in one domain than the other.
Vaughan:
Agreed. Also, there is the lag domain of the acf to consider. Nor should the practical advantage of enabling EXACT centering of output on the input be overlooked.
I’m surprised, however, that no one here has commented on the absolutely monotonic, fairly rapid decay of the binomial filter response to zero. Such filters have been used in bona fide climatological analyses for many decades.
Binomial was mentioned several times. Once you have enough poles in it to get a reasonably smooth response , it’s quite close to gaussian.
http://judithcurry.com/2013/11/22/data-corruption-by-running-mean-smoothers/#comment-416553
This is all great work on filtering but remember that the climate signal even at 2 to 3 year resolution can often be attributed to forcings that have the same resolution. And we do not necessarily want to filter those factors out haphazardly.
The general idea behind the best of the modern-day filters is to include a model of the noise and other nuisance factors so that we can better resolve the signal of interest, i.e. in our case, the real global warming forcing signal.
http://contextearth.com/2013/12/18/csalt-model-and-the-hale-cycle/
@John S.: I’m surprised, however, that no one here has commented on the absolutely monotonic, fairly rapid decay of the binomial filter response to zero.
The n-point binomial filter is simply a Gaussian discretized to n points. As such its decay is just that of a Gaussian.
The main page of the spreadsheet accompanying my millikelvin post a year ago tabulates all eleven n-point binomial filters for odd n from 1 to 21 in block P225:Z247. (The one-point binomial filter is the convolution unit in the sense that convolving with it is a NOP.) The rapid decay is easily seen there.
This was ridiculously easy to program: The only command I typed was
=AVERAGE(P225,AVERAGE(P224,P226))
in cell Q225. I then dragged it down and across to fill Q225:Z247, and cleared the column P225:P247 to zeros. At that point all eleven filters were zero. I then created all eleven filters simultaneously simply by entering 1 in cell P236. If you download the spreadsheet and set that cell back to 0 you’ll see them all disappear again.
Before AGU the spreadsheet included some discussion of filters as well as various plots, in particular overlays of a few n-point binomial filters on a Gaussian scaled by powers of 2 to show how they were all discretizations of the same Gaussian. However when AGU rolled around I deleted a lot of that material as excess clutter.
Forgot to mention that if you include the even-n n-point Gaussian filters along with the odd ones, the table is exactly Pascal’s triangle.
Vaughan:
Although “rabbit” first mentioned the monotonic decay of binomial filters on this thread, and I showed how rapid that decay is at high order, their analytic properties continue to be misapprehended. They are always intrinsically and precisely FIR filters. They are NOT, as you claim, simply an approximation to gaussian filters. The latter are intrinsically IIR filters, which upon truncation produce some side-lobes in response. The much belabored issue of side-band suppression thus is rendered totally irrelevant with binomial filters.
BTW, with the response of BIN55 down effectively to zero at my k=20, it should be evident that there is NO aliasing to speak of when its output is decimated quarterly. This of course assumes that the input is monthly average data–not instantaneously recorded values sampled monthly.
Although there many other amateurish mistakes made here by various commenters, I can only spare time to address the above.
Merry Christmas to all and to all a goodnight!
You are correct, the primitive improvement of the “tapered” version does have a zero at 12mo.
” In practice, specific data are known empirically to fall off to a “noise floor” beyond some high frequency. Experienced professionals rely upon such acquired spectral knowledge to prescribe anti-aliasing filters and sub-sampling rates for the entire CLASS.”
So. said unidentified and hence unverifiable “experienced professionals” who are obviously correct because they are “experienced professionals” (appeal to authority) have acclaimedly looked at some (unspecified) specific examples of climate data and then draw generalised conclusions that they apply to anything they can CLASS as climate data.
Like the last time you tried to justify your ideas by such hand-waving assertions, you give no indication of what or who you are actually referring to. In fact this seems to be a repetition of what you were trying to refer to last time and were unable to back up. It is just as irrelevant this time in absence of something that can be examined.
” Only if frequencies close to the QBO were of great interest
would side-lobe reducing filters be required. Greatest climatological
interest, however, lies at the opposite end of the spectrum.”
Ah, at last, some recognition that it might matter.
Since we don’t understand what QBO is or what causes it, assuming it is not of “greatest climatological interest” so it does not matter if it is corrupted seems somewhat premature.
The logical conclusion of this argument is that all short term variation is “internal variability” that will average out and can be ignored, distorted, corrupted. Long term variation is thus AGW QED.
This is precisely the group-thinking and tunnel vision that has meant the last 25-30 of climate research has largely been squandered trying to prove a forgone conclusion.
Until we identify, quantify and understand the shorter term variations, their interactions and resonances, we can not hope to understand how much of the longer term signal can be tentatively be attributed to AGW.
If we wish to wave the stochastic wand at the problem the whole record can be written off as indistinguishable from some ARMA model as the UK Met Office was recently forcing into admitting in a parliamentary reply.
So either we start applying some rigorous data processing and try to decrypt the data as best we can or we conclude there is nothing of interest and stop imagining the end of the world as we know it.
Non filtered monthly averages already pretty much destroys any lunar based signals. You would then conclude there’s nothing there but ‘noise floor’. This apparently then justifies further mangling the data with crap filters and avoids the need for anti-alias when resampling.
Despite this both N Scafetta and BEST recent paper (of which our host was a co-author) find a 9.1 +/-0.1 year cycle that Scafetta shows is of lunar origin. This is an invitation to go back and have a more thorough look at the data on sub-monthly scale, not to justify further corruption of it.
If your claim of what “experienced professionals” do is accurate, that may go a long way to explaining the abject failure of climate science over the last quarter of a century.
An experienced professional is someone who:
1) Is thoroughly familiar with the response characteristics of instruments,
vagaries of their deployment in the field, and the spectral structure of the
data they produce. In particular, he knows the noise floor of each data
class.
2) Has wide-based practical experience in utilizing various digital filters,
whose correct z-transform response function he computes for the entire
baseband, not just a portion of it.
3) Recognizes when side-band inversion and possible aliasing of MAs is–or
is not–a problem of practical consequence.
4) Knows analytically that the raw periodogram (DFT magnitude squared) of a time series has only chi-square 2-degrees of freedom confidence and is an inconsistent estimator of the power density spectrum; he plots it as
function of frequency to maintain the Parseval relationship between total
variance and the integral of spectral density.
5) Doesn’t consider proper PSD estimation with more respectable confidence limits a laborious big deal.
6) Doesn’t presume that those who filtered a particular class of data long
before him are “ignorant” of what he knows ex ante about filters.
7) Doesn’t completely botch elementary matters, such as the count of finite
convolution products.
8) Comprehends what is being said or implied in a technical discusion,
without need for much elaboration.
Guess whom that functional description patently excludes!
9) Has ready means to visualise the difference in frequency response of two filters he wishes to consider before prononcing one “the preferred” solution then hiding behind “I’ll post numbers tommorrow” or “I don’t maintain a web site for displaying graphs”….
hint: http://climategrog.wordpress.com/?attachment_id=741
10) Does not dismiss datasets that highlight a problem as “pathalogical” as an excuse to refute the problem.
11) Does not pick on one dataset with favourable spectral capacity to paper over incorrect claims he made about the need to correctly filter data before resampling.
12) Does not rely on vague comments about undefined “classes” of data as thought it establishes an argument just by saying “classes”.
13) Does not try to edit his own words to remove an incorrect statement in reply to an criticism of the redacted part.
14) Does not make claims in a deliberately vague way so as to render them unfalsifiable and then carry on as though he’s proved the point.
Enough of the pissing contest. If you have a technical point to make about filters make it directly rather than trying to prove you are always right anyway because you are an expert and therefore we should all believe your hand waving comments without question.
I’m still wating for something justifying your claims that frequency content was check down to daily level years ago (on what ?). This seems to be behind your recurrent references and assumptions about “classes” of data, but again this has been nothing but handwaving up until now.
@GG: Until we identify, quantify and understand the shorter term variations, their interactions and resonances, we can not hope to understand how much of the longer term signal can be tentatively be attributed to AGW.
I’m not sure I understand the reasoning behind this claim. One can be listening to Beethoven on 88.5 MHz while heavy metal is being played on 90.3 MHz and not hear any trace of the latter, which has zero influence on the former.
There seems to be a belief in certain circles that high-frequency oscillations can mask low-frequency ones and/or create them. I don’t understand why that should be true, nor where this belief originated.
For example Bob Tisdale seems to believe that the 7-year or so ENSO events and episodes can create much longer term effects. I think of this as Tisdale’s ratchet theory of the ENSO: somehow ENSO is ratcheting up the temperature. How this ratchet works is never explained by Tisdale, it simply happens somehow.
If you see a 20-year cycle in global temperature that is phase-locked to the Sun’s magnetic Hale cycle, are you going to say that we cannot hope to understand whether there’s any likelihood of a connection with the Sun until we understand how ENSO and other subdecadal phenomena work?
Somewhat unrelated to most of the discussion of this thread I remind one concrete case where the use of 12 month moving averages led to publishing a spurious result in a journal article.
Knox and Douglass looked at the Argo OHC data over the period July 2003 – June 2008. They looked at the data in several different ways, but gave most emphasis for results obtained by first calculating the moving average and then fitting a straight line to the moving average. The OHC has a rather strong seasonal component with a warm spring and a cool autumn. Looking at the data correctly didn’t show any trend at nearly significant level (this was one of their alternative methods), but using 12 moving average values for each year led to the bleeding through of the regular seasonal variability to the trend, and to the totally spurious conclusion of a cooling trend at a statistically significant level. They didn’t realize their error in spite of the discrepancies between their two methods.
Smoothing the 12 month MA further with an additional 2 month MA would not have helped in this case, the error had been essentially as large.
The moral of this is that using filtered data in further analysis is really prone to error unless the author really understands what he’s doing.
Pekka: I do wish that we could get away from using linear trends in climate science by everybody. This unacknowledged adding of a ‘z’ wave to the data (what you are effectively doing is adding a term that looks like a z on its side, length of the data record, height of the trend over that record and with two flat portions outside of the record and about record length long both before and afterwards to the record).
Plus, if the actual data supports some real cyclic trend then a simple linear slope can easily add a downwards ‘tick’ at the start of the record and an upwards ‘springboard’ at the end. That way ‘hockey sticks’ lie :-).
Rchard,
With enough data, more can be concluded, little data may carry just enough information to allow for estimating one parameter with the support of some assumptions like the shape of the functional form needed to relate just one parameter to the values. If we are furthermore interested in a monotonous change, and if we don’t have solid arguments for some other functional form, then it’s difficult to imagine anything significantly better than the linear trend.
Thanks for that example. This idea of running mean is now so ubiquitous that it seems to get used without any reflection as to what it actually does as a filter.
But a linear trend applied over just the width of the record is always going to mislead (yourself and others). What assumptions are made about what happened before the record? What about the future (after the record)?
Do we assume that the trend continues downwards before the record. Even if this is shown to be not true by other related information (with a longer data history)? Do we fill in the prior record with a ‘zero’ balanced around the average of the whole of the record? Do we fill it in with a horizontal line drawn through the earliest/latest available sample? And similar assumptions have to be made about the future as well as the past. Hence the ‘z’ wave I am talking about.
Richard,
Value of the linear trend is only one summarizing number to tell about the data. When a confidence interval is given for that value, it’s important to know what’s the basis the interval is based on. Is it based on the data points alone, and if so, how the autocorrelations are taken into account. A better alternative may be that metadata is available and tells about the accuracy of each data point and that this information forms the basis for the determination of the uncertainty range.
Assuming that all the above has been done correctly we have one descriptive number (with an uncertainty range) that tells about the data. It’s a completely separate step to conclude that this number can be used in some way in predicting what happens in the future. One single number by itself does not justify that, but there may be other arguments for that.
Predicting future means always that a model is used, however simple or complex, Empirical data and data-analysis may help in fixing one or more parameters in that model. To get most out of the data in that, the methods of data analysis must be chosen based on this particular use of the data. One common choice is that maximum likelihood analysis is used to determine directly the model parameters from the data. Other choices are better in other cases.
A very common case is a time series of temperatures over some period. It’s always possible to calculate, whether there’s a linear trend in the data set. If the accuracy of the measurements is good that tells also, whether there has been a trend in the actual phenomenon that has been observed like the temperature at one point or a specific summarizing combination (called average) of temperatures at many locations. Even a small trend is a certain trend by this definition, statistical confidence limits are very narrow, if the measurements are accurate. When the statistical significance is discussed something completely different is usually meant: Does the data give evidence on a underlying more persistent trend? The correct answer for that cannot be given by the data alone, as the real meaning of that question is dependent on a specific set of models. The question is not well defined without such a specific set. When the set is specified, the data can be used to tell on the relative likelihood of the members of that set. (This is Bayesian reasoning.)
Pekka: I thank you for long and interesting reply which appears to have missed the point I was making.
If one applies a linear trend to the whole of a data record of a given length you are implying one of three (there are more but these will do to start with) cases about the data both before (and after) the record itself.
1. The data before the record should be set to the average of the data in the record. The ‘DC’ referenced example.
2. The data before the record should be set to the earliest available sample. The ‘DC with an offset’ referenced example.
3. The data was declining at the same rate before the record as it rises in the record and the inflexion point was at the start of the record. The ‘saw tooth cycle of record length and magnitude’ example.
To determine what you do with data after the record (i.e. in the future) you need to give very reasoned logic as to why you treat that differently to the data before the record. Therefore logically you need to repeat 1, 2 or 3 as given above depending on which you chose previously.
You are then at liberty to try and see what cycles or other analysis is demonstrated by the data in whole of the record (or else confine yourself to utterances about a smaller and smaller sub-set of the record) as being ‘fact’.
Richard,
I understood your worry, and tried to answer it by telling in more general terms on what data can tell and how it can be used correctly.
How to handle the ends of filtered data is in my view not a problem for actual data analysis, as no data analysis should be done using data that’s significantly affected by such choices. It’s a problem in presenting visually data smoothened by filtering. When the total data period is relatively short in comparison to the base for filtering, it does make sense to extend the period of filtered data shown. That makes sense also for the reason that the first and last data points of the original data have less weight in the filtered data, when it’s cut at the point where using the filter normally becomes impossible. (This is the technical reason for the erroneous trend determination of Knox and Douglass.)
No solution for handling the end points is faultless, and as I discussed above that includes also the choice of showing only points that are obtained by the full filter. My own preference is to device some kind of asymmetrical suitably adjusted filter, when the full filter cannot be used. The new points obtained by that method are not any more evenly spaced on the x-axis as they are not produced by a symmetrical filter that has been moved by one step. This approach allows for giving full weight for every original data point and placing each resulting filtered value at a position that would present correctly any linear trend in the period near the end. Nonlinear dependencies will not be presented correctly, but it’s common that they are not important over the base period of the filter.
One example of the outcome of my approach is given in this comparison of data and model. This is from the discussion of Vaughan Pratt’s analysis one year ago on this site.
Pekka: There are very few climate data sets that extend beyond 150 years in length, most are significantly shorter.
If you confine your examinations to trends/cycles that are less than ~75 years (to be generous) on that data then all should be well.
To take a data set that is, say only 30 years long, and apply any linear trend to it without seriously considering how you should infill data prior to the record (and hence affect and such linear trend) is, to my mind, very bad.
And if you then extend that trend into the future you are most probably fooling yourself and others.
But this is routinely done throughout climate science.
The problems in extrapolation are among the main reasons for using climate models in making predictions (or conditional scenario dependent predictions called projections).
All the arguments that give some specific values for the number of years that are needed to verify a trend or lack of trend have been rather stupid. So many other factors and choices contribute to the needed period that no fixed number is correct.
I have written in many times before the following, and I do it once more:
There’s a lot of data that tells about climate changes, both natural variability and AGW, but that data is too sparse for being used in a straightforward manner. it gives evidence on the strength of AGW, but we lack formal methods that would tell objectively, how strong the evidence is.
Similarly we can say about the models both that they get quite a lot right and that they also fail on many points. Data tells on both the successes and the failures, but cannot tell objectively, how much skill the models really have in making projections either directly or with the help of some method of scaling that brings the models to better agreement with past data.
Right now we seem to have two alternatives for most realistic projections:
– models scaled in some way to agree better with past data (one alternative is to scale the increase in CO2 concentration), and
– extrapolating data using models to tell, how the extrapolation should be done.
The outcome should be essentially the same for warming using both approaches, but the first might tell more about other changes. Unfortunately the skill is even more in doubt concerning most other and more detailed results.
Pekka: The data (as opposed to models) supports that there are ~60 year cycles in the climate record. There is also an implied ~100+ year cycle in the data (assuming that you allow that there was a ‘Little Ice Age’ and that it was warmer before then). Shorter cycles are 1 year and <4 year. Cycles other than those are difficult to assess reliably as the exact wave shape for the cycles that are easy to identify cannot be precisely determined.
The magnitude of all of the cycles (particularly the longer ones) is difficult to assess. The presence (or absence) of cycles close to the easy to identify ones is also difficult to determine.
If we are to assume that any portion of the data records to date (other than trivial sub-sections of that data) can be determined by linear trends then we lose sight of what we actually know and thus probably fool ourselves.
Richard,
There are clearly phenomena that the models cannot explain. One of them is the apparent cycle of about 60 years. (I write apparent, because the evidence for real cyclicity is not strong, thus the nature of that variability is unknown.) The nature of the longer term variability is also unknown. There may be unknown forcings, or it may also be largely internal variability.
All these factors contribute to the uncertainties, but some basis is left for making projections or adjusting models. That leads to results that can be described as most likely. Making plausible arguments on the maximal strengths of the unknown factors, some confidence limits can be presented. Confirming the validity of these conclusions using some well defined objective method is, however, not possible.
From the point of view of science itself presenting this kind of projections is not necessary nor well justified. When decision makers ask for advice, presenting best estimates makes sense even when uncertainties are this large. The uncertainties must be acknowledged, but decisions are all the time made under uncertainty, and making decisions cannot be avoided, when postponing final decisions is counted also as a decision.
Pekka: Well this says a ~60 cycle is present (in HadCRUT4 anyway).
http://www.woodfortrees.org/plot/hadcrut4gl/plot/hadcrut4gl/mean:180/mean:149/mean:123
It is also to show that there is an ~100+ year cycle (as opposed to a linear trend) in the same data.
The inability of the models to show such cycles is a problem.
And GISTEMP says it is there also
http://www.woodfortrees.org/plot/gistemp/plot/gistemp/mean:180/mean:149/mean:123
RichardH, “The inability of the models to show such cycles is a problem.”
Perhaps if more of the models could get meridional heat transport to flow in the right direction that would help.
“The wind-driven gyre heat transport is northward in observations at 26.5°N, whereas it is weakly southward in both models, reducing the total MHT.”
http://journals.ametsoc.org/doi/abs/10.1175/JCLI-D-12-00081.1
Richard,
It’s very common that non-periodic variability leads to apparent periodicity over 2-3 “periods”. Thus HadCRTUT4 cannot tell that there is inherent periodicity, it can only tell that such a periodicity is possible. Different temperature data series tell about the same temperature history, thus finding the same periodicity in all of them does not prove anything more.
By “apparent periodicity” I meant that it’s in the data, but we don’t know whether that’s just accidental or of deeper significance.
The inability of the models to demonstrate a lot of things means that there are most definitely a whole load of things that need further ‘tweaking’. One could probably spend a lifetime trying to discover what these things were and their overall effect :-).
I’ll just stick with the data and ask questions about that (and maybe let IT suggest what the future might bring)..
Pekka: By “apparent periodicity” I meant that it’s in the data, but we don’t know whether that’s just accidental or of deeper significance.
===
The same can presumably be said of the apparent trend.
Pikka: I know that it shows up in a lot of the data series. I also know that it stems from the basically the same roots so that is hardly surprising.
Sure we cannot, because the data does not allow, assume that it is a regular cycle beyond the two cycles that we can see. We also cannot assume that it is not a continuous cycle either.
We do know that there are very long cycles in the data. We cannot assume they do not exist either (just because it is convenient to do so).
I rather suspect that the next few years may well make it more difficult to ignore these natural cycles in the data.
I have already made a prediction (based on natural cycles) that next year’s UAH figures will be lower on average than this years. Time will prove or disprove that.
Greg,
The same can be said about all observations that:
– are not predicted independently of the data
– can be described in a natural way by a small number of parameters
What makes the observed warming from 1970s significant is that it was predicted before any real sign of the warming due to the increase in CO2 had been observed. Both its general timing and magnitude are consistent with the best scientific understanding of that time developed originally by Manabe and his coworkers.
Pikka: Go on then, how would you predict this graph will extend to the right?
http://snag.gy/N4pUQ.jpg
Richard,
Based on the past successes and past failures of the climate models, and also based on the plausible 60 year near periodicity, my personal guess is that the hiatus starts to be over in a few years and that warming starts gradually to build pace. We had the phase of rapid warming from 1975 to 2000, thus the maximum rate of warming may still be some 20 years in the future, but I would expect that the transition towards that starts much sooner.
Because the expected rate is still rather low for many years, additional factors like solar activity may have a relatively strong relative effect for a while.
Pekka: So take the time to go on record. Take a crayon (or your favourite drawing app) and draw in what you expect It to do. I’m on record that next year the figures for UAH will be. on average, lower than this year. Do you agree or differ from that?
To give you some guidelines I have indicated what a linear trend model and a pause model would predict.
Which do you think it will be closer to, next year, in 2, and 5 years?
Richard,
For periods as short as one or two years things like ENSO state dominate. Even that’s known to be difficult to predict for best experts, i don’t have any handle on that. Thus I don’t make any guesses on what happens next year.
I did make some guesses for next 30 years or so, but even those are just guesses based more on gut feeling than analysis.
Pekka: You might like also to consider how this informs your choices.
http://www.woodfortrees.org/plot/hadcrut4gl/plot/hadcrut4gl/mean:180/mean:149/mean:123/plot/hadcrut4gl/mean:720
Pekka: Not stating what you expect for 2020 is like not having any confidence in anything (other than probably dying before you can be proved wrong :-( if all you can be in any way be confident about is 30 years away).
Pekka: PDO and AMO with similar filtering also show the ~60 year cycle so that is one less uncertainty (or not).
http://www.woodfortrees.org/plot/jisao-pdo/plot/jisao-pdo/mean:180/mean:149/mean:123
http://www.woodfortrees.org/plot/esrl-amo/plot/esrl-amo/mean:180/mean:149/mean:123
One of the main problems in communicating on climate change is that natural variability has been so large relative to AGW so far, and may well be for some time (perhaps two or three decades) to come. Some climate scientists have tried to strengthen their message by making bold forecasts on time scales too short to make the likelihood of success much higher than 50%.
Up to 1998 that worked too well as the temperature rise was even faster than predicted, after 2000 the problems of that approach have become clear. It’s better to predict only quantities for which the success is well more likely than 50%, and to present other projections making it very clear that uncertainties are too large for considering that as a prediction.
By the above I don’t mean that the overall warming had been too low for being recognizable, it has not, but that’s nearly the only thing that’s so obvious. People do not live in global average. The warming they see on local level is not as obvious as variability is so much stronger at local level. Changes in other weather phenomena are even more difficult to identify.
I’m sure the similarity in the cycle of PDO and temperatures is not accidental. They are related, but that does nor explain either one, nor make the real periodicity any more certain.
Pekka: So as far as I can figure it out your position is that as the models are not able to demonstrate that a strong ~60 year cycle was present in their simulations of the data, then there will be no ~60 year component in the data going forward.
It is pure co-incidence that the signal shows up in the various data sources.
We can safely make a statement that such a natural cycle does not exist, it is all just chance and noise.
We can also state that their is no ~100+ year cycle either, even though it would explain the known history before the Little Ice Age.
My personal feeling is that there is a 60 year cycle that’s close to periodic, but that’s just a feeling, not something that can be proven from the data.
Pekka: So how many cycles at ~60 years would you like for it to be ‘proved’?
Richard,
The real question is: “How much variability is explained, and how many degrees of freedom are used in the explanation?” The count of degrees of freedom must reflect all choices that have been made in search of the explanation.
In testing specifically for a periodic effect Fourier transform is a good tool. If the Fourier transform contains a very sharp and high peak, that’s strong evidence for a periodic component, but a broad maximum has little evidential power. Making this comment quantitative requires that both the width and the height of the peak are considered and compared with the rest of the frequency spectrum.
As soon as the period is allowed to vary a little the evidence gets much weaker. Three full cycles of constant amplitude and period and a residual similar to what’s seen in the fits to present data, would probably be significant at some level, but only a full analysis can tell for sure. Something that looks superficially cyclic would need more cycles than three unless the interpretation is supported by a verified and well understood mechanism known to have quasiperiodic behavior.
Pekka: And Fourier transforms suffer from just the ‘z wave’ problem that I mentioned. That is how you in fill the data before and after the record in order to get a record length long enough to perform your transforms on.
If you can manage to convince yourself that you can have an assumed ‘flat’ data set before the record and a ‘rising’ data set after the record then logic is not likely to be your strong point.
This is all very similar to ‘start-up’ problems with analogue circuits presented with short time series data. Translated into the digital world. Plus c’est la même chose.
Richard,
There are many different things that can be done with a data set. Proper methods are different, and interpretation of the results may be even more different.
– calculating some indicator values to summarize features of the data set (examples: average, linear trend, ..)
– using the data to test a hypothesis
– using the data to estimate parameter values for a predefined model assumed to be right
– trying to find from the data structure to serve as hint for possible previously unknown phenomena
When I discuss one of these alternatives, and you read the text as referring to another, misunderstanding is unavoidable. I try to tell, what I’m writing about, when that’s not obvious. Note those specifications carefully.
I would never fill the data set at the ends (and very reluctantly in the middle) when it’s used for further analysis. The tools must be chosen or developed to work using only the actual data. Some of my points were based on the knowledge that a short data period leads to broad maximums in the Fourier spectrum, when the amount of noise is not very small.
Pekka: Then the analysis available to you, given the data sets are only some 150 years long is very, very limited. By any method you would seem to support anyway.
@PP: I would never fill the data set at the ends (and very reluctantly in the middle) when it’s used for further analysis.
Reasoning under uncertainty is a fascinating subject. The data themselves are uncertain to begin with, and all massaging of them introduces additional uncertainty. The uncertainty of what lies beyond the ends of the data extends into the data when averaging up to the ends and beyond, aka hindcasting and forecasting, extrapolation, or whatever.
When watching a strongly periodic signal there is less uncertainty about what lies beyond the ends than with an apparently random signal. If however the apparently random signal is actually pseudorandom and you have both the code and the seed, there is zero uncertainty for you about what lies beyond, while those lacking either one of the code or the seed remain completely in the dark about what lies beyond.
But that’s an extreme case. In between, much money is made on Wall St by those with a firm grasp of uncertainties as applied to the stock market, which to the average bystander looks hopelessly random. Likewise some people do better than others on predicting the outcome of horse races. Not perfectly, just better. (I’ve personally known two who succeeded long-term at this, in respectively Australia and the US.)
Whether mining for bitcoins could be accelerated by consideration of uncertainties is a very interesting question. Anyone who comes up with even a halfway-decent probabilistic algorithm for mining bitcoins could walk away with the rest of that currency’s Fort Knox.
“… if we don’t have solid arguments for some other functional form, then it’s difficult to imagine anything significantly better than the linear trend.”
In a lot of cases there is enough to justify more than a single linear trend but if it’s really that bad, there will be a fairly significant uncertainty in the fit.
A lot of the problem seems to be that a linear fit is invariably followed by “and if this trend continues” (implication that this is the null hypothesis) “then by the year 2100……”.
Linear relationships may be fine for well designed and controlled lab experiment. With the multitude of overlaid and interacting signals in climate data less so.
Unless we can sufficiently characterise the non linear part, there is a strong possibility that a trend analysis will lead to accelerated cosine warming ;)
http://climategrog.wordpress.com/?attachment_id=209
Greg: I agree entirely. And if you extend this out to the ‘linear trend since the Little Ice Age’ argument you get the position I believe we are in. In that case we are only taking a rising part of a an unknown waveform length and magnitude into account. There is the assumption that it is a longer term waveform implicit in the assumption that it is the start of the linear trend of course :-)
Pekka: “What makes the observed warming from 1970s significant is that it was predicted before any real sign of the warming due to the increase in CO2 had been observed. Both its general timing and magnitude are consistent with the best scientific understanding of that time developed originally by Manabe and his coworkers.”
You seem to be saying that prior to late 20th c. warming actually happening (ie pre 1974) Manabe et al predicted not just the physical spectroscopic CO2 effect but the magnitude with what is now the hypothesised water vapour/cloud feedback tripling the effect of CO2.
Is that a correct interpretation of what you meant? Refs pls.
The best known of the several papers is Manabe and Wetherald: Thermal Equilibrium of the Atmosphere with a Given Distribution of Relative Humidity, J. Atmos. Sci, Vol 24, 241-159 (1967). It gives the value of 2.3C as the preferred estimate of climate sensitivity. Several more papers were written before 1975, but the estimate of climate sensitivity has been surprisingly stable since that 1967 paper. It’s clear that the estimate was not precise, but it wasn’t too bad.
Pekka,
With regard to Manabe and Wetherald, quite apart from the question of whether it is reasonable to assume fixed relative humidity, any estimate of climate sensitivity that neglects ocean heating is going to get a value that is below ECS in proportion to how quickly the CO2 is rising. This is because the ocean viewed as an RC network has a relatively fixed time constant whose relevance to estimating ECS rises in proportion to the rate of increase of CO2.
Manabe assumes zero heat capacity for the Earth’s surface. As Hansen et al pointed out in 1985 the huge heat capacity of the ocean can greatly reduced the experienced or observed climate sensitivity, just as a heat sink can keep a just-started CPU cool for a little while even when it has no fan.
While we (or I at any rate) don’t know of any reliable way of estimating the ocean’s time constant, in my AGU talk on Friday (GC53C-06) I presented an (admittedly crude) argument that every extra 10 years in the ocean’s time constant subtracts about 0.05 °C from the expected temperature rise in response to a doubling at the recent rate of increase of CO2. A slower rate of increase would reduce that amount leading to a higher observed climate sensitivity.
Vaughan,
The significance of the rate of increase of the Earth system heat content was expressed in simplest possible way in the short paper of Otto et al (Nature Geoscience, 2013).
Nic Lewis presented his attempt in solving the problem in his paper and also in a guest post on this site, but I’m not convinced in the validity of that approach based on so called objective Bayesian analysis, which is not nearly as objective as the name indicates.
@PP: I’m not convinced in the validity of that approach based on so called objective Bayesian analysis, which is not nearly as objective as the name indicates.
By “not nearly as objective” do you mean in the technical sense of the term or as non-statisticians use the term in informal conversation?
If the former then I’d be interested in your criticism of the Jeffreys rule invariance prior based on a square root of the covariance matrix. What prior would you prefer and why? (E.g. if you’re a frequentist you might prefer the right-Haar measure for an invariance prior.)
Pekka: “Several more papers were written before 1975, but the estimate of climate sensitivity has been surprisingly stable since that 1967 paper. It’s clear that the estimate was not precise, but it wasn’t too bad.”
Thanks for the ref. It’s surprising how little things have progressed since, really.
I experimented with trying to fit a linear increase in dT/dt (ie fixed acceleration) to various global temp datasets. I used a wide range fitting periods to enable a graphical extraction of an overall, long term value.
http://climategrog.wordpress.com/?attachment_id=523
There is roughly quadratic rise since the earlier part of 19th c. that could be similarly as exponential though a quadratic eventually has faster growth than exponential fn.
Although the BEST land record is more volatile it is interesting that hadCRUT3 and hadSST3 seem to settle to about the same long term value.
Anticipating CO2 doubling pre-industrial estimates by 2050 on business-as-usual, and assuming this quadratic is attributable to CO2, indicates a 2xCO2 warming of 1.5K .
I don’t believe the underlying uncertainty of the data are realistically evaluated so I have not spent time trying to work out how to attribute an overall uncertainty to the 1.5K value produced by this method.
Though the beginning of the available data corresponds to a zero dT/dt intercept, there is evidence of a long term rise in global temps over last 300 years, so the _assumed_ attribution effectively assumes that warming had ended, did not reverse and was replaced by CO2 driven warming.
It’s a demonstration of what can be fitted to the data. Attribution is another question but it’s interesting that this seems close to Nik Lewis’ figure.
Greg: “There is roughly quadratic rise since the earlier part of 19th c. that could be similarly as exponential though a quadratic eventually has faster growth than exponential fn.”
You can also express this a cycle of some sort rather than an open ended rise of any type. That would have more support from the long term proxy data and, therefore, seem more logical.
We ‘know’ that there was a fall in temperature prior to the record and that often seems to be ignored.
Greg: “Although the BEST land record is more volatile it is interesting that hadCRUT3 and hadSST3 seem to settle to about the same long term value. ”
The ~60 year cycle appears to be less strong in all the land data sets which would lead to the conclusion that it is an Ocean based cycle quite nicely.
Vaughan,
I made my statement based on the actual application in Nic Lewis’ paper. The fundamental problem is more general, but I had this one case in mind.
No rule for determining the prior is genuinely objective, the more complex methods may help in some cases in obtaining useful priors, but in other cases they only mislead and hide the problems. To get a unique prior some method or principle must be specified. Judging whether a specific abstract principle is applicable to a particular problem may be even more error prone than the use of elementary openly subjective approaches. My conclusion from looking at the specific case of Nic’s paper was that it’s impossible to tell what’s justified in that case. The risk that the method is misleading is real. The analysis did not add significant information or test the validity of the assumptions at a significant level as far as I can judge.
Many applications of statistical analysis are not very sensitive to the choice of priors within a plausible range of alternatives. When the results are highly sensitive on the prior, it’s typical that the choice of an “objective” principles turns out to be subjective.
The results of Nic’s analysis are plausible, but the method did not strengthen their plausibility in my view.
Sorry, I was away at AGU last week. In the meantime most of the comments that I might have replied to at the time seem to have been taken care of. I did notice however that the following contradicts the second paragraph of an earlier comment of mine in this thread.
@GG: check to ensure you are correctly centring the data, you seem to my eye to have a slight lag. Is this 12,10,8 RM by any chance. I pointed out at the end of the article discussing using spreadsheets that even numbered RM will introduce a 0.5mo lag. Three times is 1.5 which looks like what I’m seeing. (Just guessing by eye).
Actually one has the choice of a 0.5mo lag or 0.5mo lead. Hence if you alternate them they cancel. So the worst case is a 0.5mo lag or lead (your choice) when there is an odd number of even boxes.
By adjusting the least influential member of the cascade up or down one that too disappears. Assuming 12 can’t be touched, there are four ways to adjust 8 10 12, all of which are shown here. Except for 8 10 12 itself, the only one staying within 0.5% of zero in the first side lobe is 8 11 12, the purple one.
This is using sinc which as John S. points out is only exact in the continuous limit, but the error is so small in the first lobe as to leave the ranking unchanged. Don’t bother with either the 8 12 or 10 12 F2 filter however, the first side lobe exceeds 3%!
Vauhan: I hope the AGU was fun. Yes you are correct. I forgot to offset the middle stage, hence the slight phase error (which I subsequently corrected).
Vaughan: And given the data, the actual differences in the outputs are tiny. I do accept that mathematically you are correct. It just seems that the input digitisation error (signal is 0.01 resolution in +-0.6 range after all) swamps most of this.
@RLH: It just seems that the input digitisation error (signal is 0.01 resolution in +-0.6 range after all) swamps most of this.
Right. These differences between the F3 variants are tiny compared to the size of the F1 (single box filter) side lobe, so it would be quite surprising if one could tell the difference.
The spreadsheet accompanying my AGU 2012 poster used a 13 17 21 F3 filter in the first stage, targeting the Hale cycle. Its support is therefore 49, namely cells AQ246:AQ294. The sum of those 49 cells is 1.000 of course (select them and look at the bottom right of the spreadsheet for their sum and average). However the sum of the first 7 of those cells is only 0.0181, so if you delete 7 at each end the remaining 35 cells represent 96.38% of the whole F3 kernel, which is still a vastly better shape than a simple box!
The 3 significant figures in your Gaussian back here is plenty of precision. Another digit would as you correctly intuit make no perceptible difference.
By default MATLAB truncates its Gaussian filter, gausswin(n) for n points, at σ = 0.4. You can supply 1/σ as a second parameter, e.g. 3.0 for σ = 1/3, but I haven’t seen much difference and am happy to stick with their default truncation parameter of 2.5 = 1/0.4, which is what I used in my AGU talk.
AGU was a lot of fun. The only sad part is so many talks and posters, so little time.
Vaughan: “AGU was a lot of fun. The only sad part is so many talks and posters, so little time.”
Yes. I know, been there done that. Even working out an agenda can be a difficult exercise. Do you have any videos/slides/transcripts/posters of your talk(s) (or other that may be of interest) to share?
I tend to use low pass filters not to target specific frequencies but rather in a sweep manner to determine where frequencies that have energy in them are likely to lie.
The ~60 year cycle that can be uncovered in this way (by using 15 years as the roll off point – see above) is a case in point. The choice of parameters does not reveal anything about 15 year cycles (presence or absence) but rather removes all the high frequency noise above that value and displays what is left.
As it turns out there is very little LF noise left in the record and the ~60 years jumps out easily.
Now if you were to try and filter with a narrow filter tuned to, say, 65-75 years then the rest of the ‘noise’ in the record will turn it into something that rings almost regardless if anything is there or not.
I must apologise to you about my comment on Gaussian and ringing. As you quite correctly observe it is the best filter for exhibiting no such thing. I thank you for the correction.
@RLH: Do you have any videos/slides/transcripts/posters of your talk(s) (or other that may be of interest) to share?
For now AGU is making all recorded material available free to the public at
http://virtualoptions.agu.org/
using passcode AGU13. I think they’ll be closing it to the public after perihelion (which is at Jan. 4 11:59), no idea why.
As it happened my talk was in the Carbon Sequestration interdisciplinary “SWIRL”. All SWIRLs were taped. As I mentioned above my talk is GC53C-06 (2:55 pm on Friday afternoon in the session “Understanding 400 ppm: Past, Present and Future”). The audio is me but as with all talks the video consists of just the slides. (At 30 seconds per slide and 30 fps an uncompressed video would play 900 identical frames; hopefully frame-to-frame coherence manages to shrink that some.)
Incidentally, in my answer to the question about ocean dynamics at question time in my talk, I neglected to say that the inner core is spinning faster than the rest of the planet and that it is this rotation that is causing the oscillations I mentioned. On my list of things to follow up on here is to check whether the likely resonances in this mechanism include one with a 60 year period. This will entail using estimates of such parameters as the mantle’s modulus of elasticity, moment of inertia of the inner core (to verify that friction with the outer core is draining rotational energy from the inner core at a rate consistent with everything else), etc.
Richard: “If you can manage to convince yourself that you can have an assumed ‘flat’ data set before the record and a ‘rising’ data set after the record then logic is not likely to be your strong point.”
Where do you get that from? I don’t see anyone suggesting that here. If you have a steadily rising series, you use some technique like differentiation to ensure it is at least roughly stationary before doing any Fourrier techniques on it. Your “z problem” isn’t a problem.
Greg: If you have a steadily rising series then you may have
1. The rising edge of some waveform with a starting point at the beginning of the record and flat before the record.
2. The low point of a sawtooth waveform with a minima at the beginning of the record and a falling series after the record.
3. A parabola or other non-periodic waveform with a low point at the start of the record.
4. Many other waveforms that happen to have a rising pattern of at least the record period in length.
The data will not help you. Choosing one only and not at least exploring the others is the logic problem (and the ‘z wave’ thinking).
Greg: And I assume I do not have to point out that CAWG and CO2 related temperature rise is case 1 thinking.
You can strongly argue that by assuming that all you do is prove that your assumption is supported by the data. You do not disprove any of the other options.
Greg: The problem with linear trend analysis is best illustrated with these two graphs.
http://www.woodfortrees.org/plot/hadcrut4gl/plot/hadcrut4gl/mean:180/mean:149/mean:123/plot/hadcrut4gl/mean:720/plot/hadcrut4gl/trend
http://www.woodfortrees.org/plot/gistemp/plot/gistemp/mean:180/mean:149/mean:123/plot/gistemp/mean:720/plot/gistemp/trend
Greg: “You can “detrend” with any fn you can like, do it with 160y cosine if you wish.”
You could probably “detrend” it with a cosine of anything from 100 years to 200+ years as well given the rest of the data. That was the “reliably” point I was making.
http://www.woodfortrees.org/plot/hadcrut4gl/mean:156/mean:137/mean:86/derivative/plot/hadcrut4gl/mean:156/mean:137/mean:86/derivative/derivative/scale:60
The second derivative has removed the “z wave” and gives something you could apply FA on (with suitable windowing).
It has also has attenuated the 60 y cmpt leaving the circa 20 y cycle clearly visible.
In the first derivative both the 60 and 20 year periods are visible. You’d need to do a linear detrend if you want to FA that:
http://www.woodfortrees.org/plot/hadcrut4gl/mean:156/mean:137/mean:86/derivative/detrend:0.0011/plot/hadcrut4gl/mean:156/mean:137/mean:86/derivative/derivative/scale:60
The heavy filter is just to make the cycles visible to the eye, you’d obviously do FA unfiltered (or perhaps a 12,10,8 3RM to prevent the annual peak swamping the calculations.). Looks like a bit of 2.5 ripple there too. QBO maybe.
Greg: So your logic for using the ‘derivative’ is what? What are you expecting it to show?
I am not sure why you switched to a 156 month based corner as that appears to let through a considerable amount of high frequency.
http://www.woodfortrees.org/plot/hadcrut4gl/mean:156/mean:137/mean:86
Why should that be better than a longer low pass filter such as the one I used which shows very little high frequency problems and exhibits the decreasing slope at the start of the record?
http://www.woodfortrees.org/plot/hadcrut4gl/mean:720/mean:180/mean:149/mean:123
Greg: In fact in order to remove the most high frequency from the signal whilst leaving the rest intact it looks like
http://www.woodfortrees.org/plot/hadcrut4gl/mean:220/mean:174/mean:144
might be a better choice.
Greg: And if we apply a derivative to that we get
http://www.woodfortrees.org/plot/hadcrut4gl/mean:220/mean:174/mean:144/derivative
“So your logic for using the ‘derivative’ is what? What are you expecting it to show?
I am not sure why you switched to a 156 month based corner as that appears to let through a considerable amount of high frequency.”
I suggest you read what is already posted before asking questions that have already been answered. I think Pekka was telling you that same thing earlier.
720mo seems rather excessive. You’ve run a 60 year low-pass and it leaves you with 60 years of data that is almost a straight line. Could it be anything but straight ?!
So you have the average straight line for the middle 1/3 of the data. Is that period or that figure of any particular importance?
You seem particularly interested in the 60 y periodicity but that does not mean sine waves. I would suggest the lightest filter that unclutters the data enough to see the shape of the ~60 year variation, and it’s not harmonic.
60 y is too long to be reliably extracted by FA techniques on that length of data. Regression fitting two cosines primed at 60 and 20 should fit well to either the detrended derivative or the second diff that I plotted. You can then subtract them and see what the residual form looks like and whether it has sufficiently characterised the oscillatory component.
Derivatives are a kind of high-pass filter (1/f weighting) so you effectively have the band pass filter you’ve been going on about.
This may be of interest re. circa 65 y cycle:
http://wattsupwiththat.com/2013/12/17/solar-amo-pdo-cycles-combined-reproduce-the-global-climate-of-the-past
Greg: “720mo seems rather excessive. You’ve run a 60 year low-pass and it leaves you with 60 years of data that is almost a straight line. Could it be anything but straight ?! ”
The point was that it is very much NOT a straight line. It has a hook at the start showing that we are very likely to be at the beginning of some cyclic/rising event.
Given that proxy data with a longer time frame supports the concept that it is indeed the base of a cycle I think it makes the point rather well.
Of course it is extreme, we only have a very short data set to work with.
Greg: “You seem particularly interested in the 60 y periodicity but that does not mean sine waves. I would suggest the lightest filter that unclutters the data enough to see the shape of the ~60 year variation, and it’s not harmonic. ”
And I would think that a filter that removes more of the HF noise and leaves the fundamental cleaner is a better option.
http://www.woodfortrees.org/plot/hadcrut4gl/mean:220/mean:174/mean:144
http://www.woodfortrees.org/plot/hadcrut4gl/mean:220/mean:174/mean:144/derivative
Please note the corner frequency here is only 18.3333.. years against the ~60 year cycle.
Greg: “The second derivative has removed the “z wave””
I see I have failed to communicate what the ‘z wave’ is well enough.
If you put a downward linear trend on a record then you implicitly suggest that the data would have been on a similar downward trend prior and post the record. This is very rarely supported by any evidence that it is the case, just unstated assumption. So what we have is a continuously rising trend for all time with no good evidence for it.. This turns out to be almost never to be true.
The data can also be extended backwards by a flat line from the start of the record. However this same logic is often not then applied to the period after the record. This is often extended on the same rising trend as in the record. An assumed hockey stick if you will.
Alternatively you can extend the record by in filling with data that is at the average of all of the data in the record on both ends or with the initial and final values (c.f. CET record with a 21 point polynomial and last value projection). The ‘z wave’.
These are well known initial condition problems of analogue circuits if fed with short data series that simply moving to a digital world dos not remove.
“If you put a downward linear trend on a record then you implicitly suggest that the data would have been on a similar downward trend prior and post the record. ”
If you prefer, you can take the diff, that way you are not introducing anything, it’s still purely the data. (in fact it’s nearly same thing as subtracting a trend, depending how you get the trend).
If you are going to start padding with anything then you’d better do something like this but it is the padding that is the problem which is why it’s best to stick to the data.
If you’re padding to do some kind of FA, then you need to ensure the data is “stationary” anyway, ie it’s mean does not drift systematically across the dataset. Detrending or diffing is a common solution.
Greg: I just think that the closeness of the output of the filter I suggested above to the “constructed from the strongest 6 Fourier components” of a longer data set is my best answer.
http://wattsupwiththat.files.wordpress.com/2013/12/clip_image006_thumb.png?w=462&h=335
“And I would think that a filter that removes more of the HF noise and leaves the fundamental cleaner is a better option.”
What is this idea about a “fundamental” and “cleaner”? There is no reason to assume, even if there is a 60 periodicity, that it is a pure harmonic. Many patterns in climate seem more like a full wave rectified wave or a pulse and relaxation response. To correctly capture that kind of profile you NEED higher frequency harmonics.
It’s interesting the graph you picked off the WUWT post, yet another example running mean distortions.
They use a 15y “box-car” RM. The negative lobe peaks at 15*1.43=10.5 years. Pretty much the Schwabe cycle period. For a paper suggesting a significant solar influence that’s pretty bad way to go looking for it. About 20% of that signal will get though and be INVERTED.
If they’d used one of the options suggested here their model may have come a lot closer to matching the data.
Greg: Either your reading comprehension is poor or mine.
Fig. 4 ( Fig. 6 of [1] ) Measured temperatures ( black ) and constructed from the strongest 6 Fourier components ( red ).
Greg: I would counter that there is no reason to assume it cannot be represented as a fundamental (sine wave) with other yet to be discovered and minor sub-components. First find the fundamental, then discover the rest.
“First find the fundamental, then discover the rest.”
Fine, we know the circa 65 is there, next step discover the rest. You won’t do that if you’ve removed it all, which is why I referred you to the frequency analysis I’d already done on SST and suggested 13y, which reveals a smaller but clear 21.5 y component. Those two give the basic, fairly straight rise and fall periods already noted.
re. reading comprehension :
“Fig. 4 ( Fig. 6 of [1] ) ” …. see [1] to find out more about that graph and you will find and probably comprehend the text I quoted relating to it.
It is a 15y “box-car” RM which is a perfect choice to invert a 10.5y Schwabe signal if one is present.
Like I said , the problem is ubiquitous.
Greg: You know I did go and read the paper.
” …(the surrogate records hereafter SU, and the boxcar-smoothed SU over 15yr hereafter SSU)…”
“…Choosing among the lowest eight frequencies the ones with periods no shorter than 30yr (definition of “climate” as 30-yr temperature average), the six with the highest power densities yield an excellent reconstruction of M6. No other spectral contributions were used…”
Now I’m sure you believe that the collection methodology used will/may spread bad things up and down the spectrum but I would love you to show any actual workings that mean your claim has any significance given the above criteria. They stopped at one octave above boxcar and then only chose the 6 highest power densities above that. I don’t think that the boxcar will produce any distortions sufficient to be visible under those conditions but….
As to supporting what I had given as example I was actually referring to the observation that there probably was a ~100+ year in the data as well as the ~60 year one and that the start of the record was likely to be a minimum for that curve. Rather nicely exampled by the overall shape of Fig 4 don’t you think?
“They stopped at one octave above boxcar… ”
You are having reading comprehension problems as you suspected.
What I said was that their model would probably have matched that data better if they had not distorted the data with a crappy box-car filter. There is nothing wrong with the model in this respect but with the distorted form of that data that they compare it to !
My point is that their 19 parameter model should be pretty good fit to the original data on which they did the spectra analysis. The reason it is only rough fit is in large part due the 15y box-car they applied _after_ fitting the model.
Greg: In that case please enlighten us with a better working of the data that demonstrates your point as a fact. As I do not accept that any distortions added by their methodology will show up in the way you claim.
I note that you did kinda sidestep my point about why using a linear trend on the data since the low point (~1880), which is what the HadCrut4 data covers, fails to even remotely track the data before that point and is, therefore, a rather useless choice. If you impose a hockey stick on the data before you look at it, it is not surprising you find it there in your conclusions.
Do you accept that their longer series data (rather than the method they applied to the data) refutes as least the concept of a linear trend in HadCrut4?
Richard, I have neither the time nor the inclination to try to reproduce their model or try to find sources for their data which is not clearly sourced.
It was an observation on their method, that is not of earth shattering importance. You are free to try to investigate that if it interests you.
I did not sidestep, neither did I suggest that there is a longer term linear rise in SST or anything else. Please (again) take more care to read what is said. It is a technique that is necessary in order to do FA, it is not suggesting that the trend is can or should be extrapolated outside the data period. In the same way FA does not guarantee that the 65y periodicity exists beyond the data.
The longer land data also end up a bit higher too.so will have a “trend” but less then if you start in 1850. Neither will be a valid for assumptions beyond the data.
Greg: So what you do instead is to effectively imply a linear trend instead by discounting any longer cyclic alternative and suggesting a derivative or some such is used which is basically the same thing.
You suggested that my removal of the ~60 term by simple low pass filtering and observing that the final term was NOT a straight line was not useful or relevant.
I then point out that this ‘low point at the start of the record’ is supported by longer term data from other sources.
You sidestep that point.
AFAIK an FA can only reliably be used to observe cycles with periods less than approximately half the length of the data series on which they are run. Yet people (including yourself) will regularly display outputs and derive conclusions with periods much longer than that in them. No problems with that?
“You sidestep that point.”
I don’t “side step” anything but I dont’ have time to discuss at length every aspect of every comment make (usually several times).
“AFAIK an FA can only reliably be used to observe cycles with periods less than approximately half the length of the data series on which they are run. Yet people (including yourself) will regularly display outputs and derive conclusions with periods much longer than that in them.”
That’s your own inverse Nyquist theorem that I’ve already commented on.
You can “detrend” with any fn you can like, do it with 160y cosine if you wish.
(sorry re-post as I skipped one too many replies up to answer :-( ).
Greg: “You can “detrend” with any fn you can like, do it with 160y cosine if you wish.”
You could probably “detrend” it with a cosine of anything from 100 years to 200+ years as well given the rest of the data. That was the “reliably” point I was making.
The other reason for using the diff to make the data sample stationary is that it attenuates by period/(2*pi) , for 160 that’s about a factor of 25. It’s not a large signal to start with so the diff can be an effective way of not having to argue about a linear or other detrending.
The diff of a linear trend is a constant, which will get lost in the FA. It is also a high-pass filter as I have already pointed out.
It’s also usually necessary to use a window fn as well. None of these long periods can be extracted with any confidence, the aim is to stop their presence messing up the shorter periods of the spectrum by trying to reproduce a saw-tooth , or a half cycle, for example.
The trouble with the Luedecke paper is they have one hell of a half cycle.
“” To obtain more frequency steps, we gener-
ally applied zero padding in the DFT except for the empirical
reconstruction of M6.””
AFAICT, they are doing straight DFT on that form which will necessarily just wrap it end to end. Hence the big drop.
I’ve posted criticisms on their thread but they have not responded once to anyone’s comment since it went up.
Not impressive.
Greg: “The trouble with the Luedecke paper is they have one hell of a half cycle.”
I too would be suspicious of this part of their work. What we have is the lower part of some cycle to which we probably do not have a reliable upper edge to (at either end). It could continue to extend at both ends in an upward direction. Too early to tell yet or from that data set alone anyway.
however dT/dt is fairly flat and may give a sensible result.
Here’s the same second diff with the same 3RM I used above, compared to a straight RM with the same base period.
http://www.woodfortrees.org/plot/hadcrut4gl/mean:156/derivative/derivative/scale:60/plot/hadcrut4gl/mean:156/mean:137/mean:86/scale:60/derivative/derivative
The amount of h.f. getting throught the running mean is about two orders bigger than the signal I was successfully isolating before, which has had to be scaled down so much to get it on the same graph that it’s now almost a flat line.
So much for the famous box car “smoother” ;)
V.P. “There seems to be a belief in certain circles that high-frequency oscillations can mask low-frequency ones and/or create them. I don’t understand why that should be true, nor where this belief originated.”
First of all Vaughan, I do not wish to end this year as it began, which is why I have not replied to any of your comments since. However, you have attempted to address me several time here. So I hope we can have a more fruitful dialogue this time.
In reply to your comment above, would you agree that two close frequencies will produce an amplitude modulated effect equal to the average frequency modulated by half the difference of the frequencies?
cosA+cosB=2*cosC*cosD
with C and D being half the sum and half the difference of A and B.
If A and B are close C will be similar to A and B while D will be small, corresponding to a long period.
If A and B are physical phenomena, there will be the appearance of amplitude modulation in the time series. If C and D represent a true physical modulation, it will appear in a spectral analysis as A and B.
Do you see any error in that?
Do you see any error in that?
Not at all. Mutually coherent signals are like that, and combine conservatively by adding amplitudes, which is what you’re doing here.
Mutually incoherent signals combine conservatively by adding intensities, not amplitudes.
Physicist Robert Wood published a paper about Talbot fringes in the November 1909 issue of Philosophical Magazine (a science journal in the same sense that Doctors of Philosophy can be scientists) in which he was criticized (in the same issue!) by noted English optical physicist Arthur Schuster for failing to make that distinction.
(This incidentally was the same journal, year, and author concerning the two-box experiment with glass and salt windows, for which Wood was criticized in the July issue by noted American physicist Charles Abbot, director of the Smithsonian Observatory. Something of a pattern there.)
If there is a reason to suspect coherence between ENSO and the 60-year ocean oscillation then you would have a good point. However I would say that the burden is on you to demonstrate at least some small sign of such coherence. As far as I’m aware no one has ever observed such, or even seriously conjectured that it might exist.
Incidentally the statistical counterpart of coherence vs. incoherence is correlated vs. independent. (These are not exhaustive but are two extremes—in between, two Gaussian processes can be completely uncorrelated and yet one can be perfectly reconstructed given just the other.) Well-correlated time series combine conservatively by adding them, whereas independent time series combine conservatively by adding their variances. (Matt Marler may correct me on the precise conditions sufficient for the latter.)
I was not talking about ENSO, just replying to your comment that you did not see where the “belief” that high-frequency oscillations could cause low frequency once could come from.
You introduce the caveat of coherence but it seems you don’t object to the principal that it is possible.
There is a second possibility where the unsigned magnitude is what is measured. In this case it corresponds to the audio phenomenon of “beats”, which has twice the frequency given above.
One could imagine measurements such as wind speed may match that interpretation.
Many interactions such as evaporation (which implies a resultant effect on SST) depend on wind speed ( or square of wind speed ) so the modulation pattern creates a real long term signal, not just modulation of a short cycle which will average out.
I see his comments here as informative rather than annoying. Let’s hope we can keep it that way. If you could keep your boots out of that particular ant hill for the moment it may be helpful ;)
Merry Christmas!
Enjoy the festivities Don.
VP has a life-time of knowledge and experience in hard science. I’m hopeful the little discussion he started here may get somewhere interesting.
Let’s hope 2014 sees a return to reason in all this mess.
VP has gone rather quiet, perhaps he has now realised why people in “some circles” “believe” short cycles can create long cycles. I find it odd that this kind of thing needs to be explained to someone with his credentials.
He also raised the question of Tisdale’s ideas on ENSO.
Bob Tisdale apparently has no training but he has done a lot of reading in the past few years. He makes his arguments poorly because his data skills seem limited to trend fitting in Excel. That does not mean he is wrong. I think he has pointed out something the merits serious consideration.
One of the key premises of AGW is that all variation in climate is “internal variability” which will average out over time, hence any long term variation must be CO2.
It is this _assumption_ of equal, symmetrical variations that Tisdale is questioning.
El Nino and La Nina are not simply two phases of an “internal oscillation”, like the two strokes of a pendulum. They are two fundamentally different processes that have opposing effects on SST. There is no reason to assume that they equal in magnitude and long term neutral.
During La Nina, cooler tropical ocean SST leads to more solar energy being captured by the climate system. During El Nino a proportion of that energy is transferred to the atmosphere. Hadley convection takes a lot of this polarwards and a lot gets radiated out of the system. These two processes are part of the throughput of energy, this is not a pendulum swing.
Those wanting to suggest that the net effect on global energy budget is zero they had better show some justification for that assumption.
Tisdale claims ENSO is the _cause_ of the recent warming. I think he has identified to a possible _mechanism_ . This invites the question of what causes ENSO. I find the current hand-waving arguments suggesting it causes itself entirely unconvincing.
“Those wanting to suggest that the net effect on global energy budget is zero they had better show some justification for that assumption.”
Surface station, annual average of day over day max temp difference hasn’t changed hardly at all since the 50′s.
Go to the url in my name.
@GG: VP has gone rather quiet, perhaps he has now realised why people in “some circles” “believe” short cycles can create long cycles. I find it odd that this kind of thing needs to be explained to someone with his credentials.
Horrors! There are contributors to Climate Etc. that have other obligations preventing them from posting to it 24/7? Whatever has the world come to? This is something up with which none of us should put!
That was a feeble attempt at one-upping mwgrant, who a year ago wrote these remarks in response to the same tiresome complaints from Greg, that people aren’t responding with military promptness to his every
commandcomment. Examples of this sort of thing can also be found above.William Goldman (sounds like Goodman) may have said it best: Get used to disappointment, Greg.
Greg,
ENSO itself represents short term variability, more persistent variability in the statistical properties of successive ENSO events represent longer term variability. That’s a separate phenomenon and might be linked with some other indicators of longer term variability like PDO.
@GG: There is a second possibility where the unsigned magnitude is what is measured. In this case it corresponds to the audio phenomenon of “beats”, which has twice the frequency given above.
Agreeing that there is room for intermediate possibilities between coherence and incoherence, I would nevertheless be inclined to view coherence as a necessary condition for beats.
Regarding the intermediate possibilities, here’s an example to ponder. Alice and Bob each have a fair coin they toss at the same time. If Alice’s coin comes up tails they both say 0. Otherwise Alice says 1 while Bob says 1 or -1 according to whether his coin comes up heads or tails respectively.
As this synchronized flipping duo flips away, each looks like a random variable. Alice says 0 or 1 with equal probability while Bob says -1, 0, or 1 with respectively probabilities 1/4, 1/2, and 1/4.
Now would you judge these two as coherent or incoherent, and why?
Slight modification of the above to make things more symmetric: Alice says -1 rather than 0 when she flips tails. No change to Bob, who continues to say 0 when Alice flips tails.
“Get used to disappointment, Greg.”
No disappointment here Vaughan. Have a good Christmas. It’s a good time to reflect on the “beliefs” of others.
Glad to hear it. An enjoyable Christmas to you too.
It’s a good time to reflect on the “beliefs” of others.
I believe I shall.
Two of my cherished beliefs are that the number of gods is a perfect square, and that nine gods is more likely than four.
Pekka Pirilä
“ENSO itself represents short term variability, more persistent variability in the statistical properties of successive ENSO events represent longer term variability. That’s a separate phenomenon and might be linked with some other indicators of longer term variability like PDO.”
I am accumulating several threads of evidence that these “pseudo” periodic phenomena like ENSO and QBO are relatively simple interference patterns.
The classic description of ENSO as “between 3 and 5 year” period, it is in fact both. Something like 3.4, 4.43 and 5.26 can be found in WPAC850 reanalysis trade wind data. If one just looks at the time series it will appear like erratic pseudo-cycles.
5.26y superimposed on the annual cycle is equivalent to 20 months modulated by 29 months. The latter is the period most often quoted for QBO and 20mo can be found as the strongest non-annual component in lower stratospheric temps. QBO is reckoned to be stratospheric in origin.
I suspect things like PDO are just the consequence of all this, not the cause. These are the long periods which arise from interference of the shorter decadal and sub-decadal periods.
Much of it seems related to perigee and saros cycles, the presence of which Keeling noted as far back as 1995.
Greg,
You can draw that kind of conclusions from the data only, if you can identify phenomena that have a persistent natural cyclicity of their own. In practice that may be possible only, it there’s an accurately constant period that shows sharply up in the fourier transform, unless the physical mechanisms can be identified and the succession of the causally linked phases followed.
For anything more irregular and lacking causally linked phases of the cyclic process such interpretations remain purely speculative.
Thanks Pekka. We have noisy and uncertain data, often heavily “corrected”. We do not even have realistic uncertainly values for most data. Everything in climate science is purely speculative.
We are probably at least ten years from even the most basic understanding of how climate works, yet some are trying to claim 95% certainty.
I think it’s very likely (>95%) that we know very little (<5%). ;)
Pingback: Proper Cherry Picking | Watts Up With That?
Pingback: Global Warming: Don’t Confuse Us with the Facts Timothy Birdnow | RUTHFULLY YOURS
Pingback: A Mathematical Tool for examining Temperature data | Climate Data and Summaries of the data
Pingback: Crowdsourcing A Full Kernel Cascaded Triple Running Mean Low Pass Filter, No Seriously… | Watts Up With That?