
The title of this post is taken from my AGU Fall Meeting poster presentation on the afternoon of Tuesday Dec. 4 (tomorrow).
You can view the poster from the comfort (?) of your terminal at where you can click on the View-ePoster tab.
For full transparency of the number crunching the poster links to the
Excel spreadsheet from which the graphs were extracted, allowing the reader equipped with Excel (2000 or later) to audit all graphs directly and experiment with alternatives, some of which I’ve provided for with sliders. (Microsoft’s free viewer will allow all this except for the ability to experiment, but I would expect Excel 2000 to be pretty cheap these days. I had high hopes for OpenOffice’s CALC but it turned out to be a nonstarter for non-toy spreadsheets.) Please let me know of any glitches you encounter. Only macros signed by Microsoft are used so Excel 2007 onwards should be happy, though I don’t believe 2000 knows how to read macro signatures and hence lives in a perpetual state of paranoia concerning viruses.
Global warming of some kind is clearly visible in HadCRUT3 (Figure 1,
resistor-color-coded red in the poster) for the three decades 1970-2000. However the three decades 1910-1940 show a similar rate of global warming. This can’t all be due to CO2 since the emissions data from the Carbon Dioxide Information Analysis Center (CDIAC) show that human-emitted CO2 wasn’t rising anywhere near as fast then as during 1970-2000. Both the population and its per-capita technology increased enormously in the intervening 60 years, with WW2 technology capable of obliterating cities with both conventional and nuclear weapons that WW1 generals could only dream of, and with WW3 postponed as sheer MAD-ness.

Figure 1
It would seem therefore that rising climate since 1850 is a lot more complex than can be explained by our rising CO2 emissions.
My hypothesis is that there is less to HadCRUT3 than meets the eye. I
hypothesize the following.
1. I collect all the so-called multidecadal ocean oscillations into one
phenomenon I call a quasisawtooth, namely a sawtooth lacking its first
harmonic or fundamental. Sawtooth waves occur naturally as the result of a sudden perturbation away from equilibrium followed by a slow return to equilibrium. The several 100,000 year deglaciation cycles of the late Quaternary are one example; this might be another, albeit with its harmonics filtered differently due to whatever lies between the perturbations and our perception of them (speculated on at the right of the poster, where I forgot to point out that the effect is seen in the oceans because the crust beneath is only 20% the thickness under the continents and almost nothing along the mid-Atlantic ridge). I remove this from the data (Figure 1) by subtracting it, giving the orange curve in Figure 2 labeled DATA – SAW.
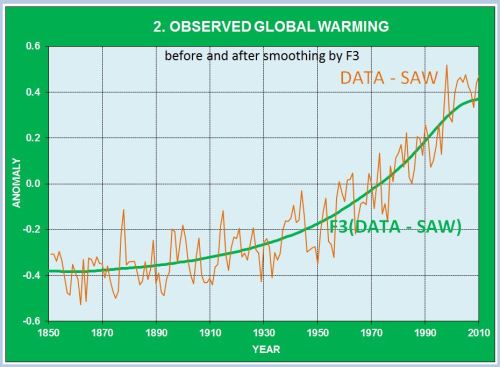
Figure 2
2. I further hypothesize that all remaining natural fluctuations in modern climate have as their slowest component the 21-year Hale or magnetic cycle. I filter out this and all higher frequencies with a low-pass filter designed to aggressively block such frequencies. Its frequency response is given as the curve F3 in Figure 5.
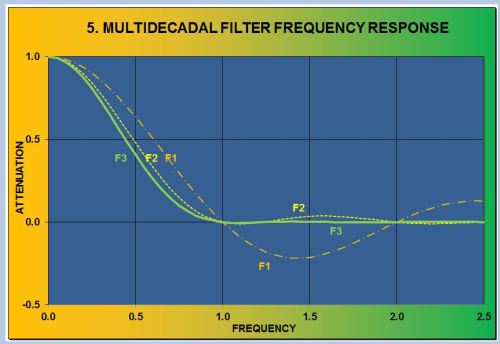
Figure 5
F3 is constructed as the convolution of three box or moving average filters of respective widths 21, 17, and 13 years. The first gives F1 which by itself takes out both the Hale cycle and the 11-year solar (TSI) cycle. The second then gives F2 by bearing up at the one-third point of the first side lobe, while the third pushes down on the two-thirds point to give F3. (This filter can be constructed at
woodfortrees.org as I noted in my previous post here early in 2012.)
The effect is to block essentially all frequencies with shorter periods than 22 years. At most 0.4% of any such frequency gets through. What remains is the green curve in Figure 2 labeled F3(DATA – SAW). This is clearly global warming, whatever the cause; the poster calls it Observed Global Warming, color-coded green.
These two operations on HadCRUT3 take place on the left or experimental side of the poster, which deals with observation (in this case HadCRUT3) and its analysis (in this case by subtracting low frequencies and filtering high frequencies).
The right or theory side of the poster deals with the rationalization of observation, the half of science that goes beyond the mere reporting of
experience by hypothesizing explanations for it. Figure 3, color-coded blue, graphs the formula immediately below it, both before (in orange) and after (in blue) applying F3. (It can be seen that the filter makes essentially no difference except for a one-decade end-effect artifact where the curve is changing rapidly. In that context the (literally) side point is made that all odd decades since 1870 have trended positively while all even ones have trended more weakly and often
negatively, verifiable at Wood For Trees.)
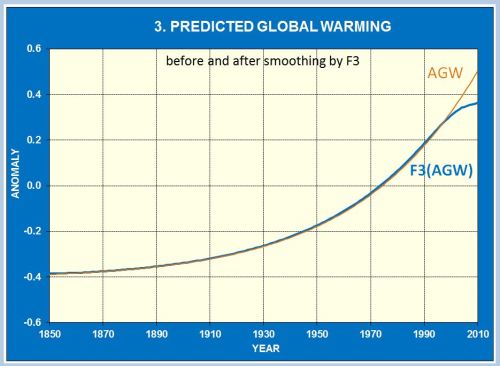
Figure 3
The formula is based on known ideas due to Arrhenius in 1896 and Hofmann in 2009 (that the portion of atmospheric CO2 above the preindustrial level is growing exponentially), with the added twist that the oceanic heat sink delays the impact of radiative forcing variations on HadCRUT3 by 15 years, analogously to the overheating of a CPU being delayed by the addition of a heatsink with no fan, what I refer to as the Hansen delay. I call this the Arrhenius-Hofmann-Hansen or AHH law.
The rest of the poster, color-coded violet (purple, whatever), deals with the similarity to the curve in Figure 2: they are equal to within millikelvins. For the period to 1950 the standard deviation of their difference is half a millikelvin. After 1950 there are two bumps that need explaining; the best I could think of was brown-cloud pollution from uncontrolled western civilization emissions abating in the 1970s and then resuming with the industrialization of nonwestern civilization, but there may well be other explanations. Whatever the explanation however the main point is that multidecadal residual (MRES) is inconsequential in the context of global warming.
The hypothesis then is that multidecadal climate has only two significant components: the sawtooth, whatever its origins, and warming that can be accounted for 99.98% by the AHH law as measured by the R2 of its fit to observed global warming (and could be brought even closer to 1 with a good story for MRES).
Because filter F3 rises slowly on the left of its cutoff there is the worry that some multidecadal phenomenon was overlooked by sneaking into the Hale octave. Something like this seems to have happened on the high-frequency side of the SOL band, perhaps some ENSO noise from DEC (decadal band) getting into the TSI band. However the HALE band looks much cleaner than the TSI band, suggesting that nothing entered from the MUL (multidecadal) side. And since MRES as shown in Figure 10 is essentially flat by comparison with SAW and AGW, it would appear that those multidecadal variations not accounted for here are either too small to matter or have been inadvertently lumped in with (i.e. are inseparable from) one of SAW, AGW, or HALE.
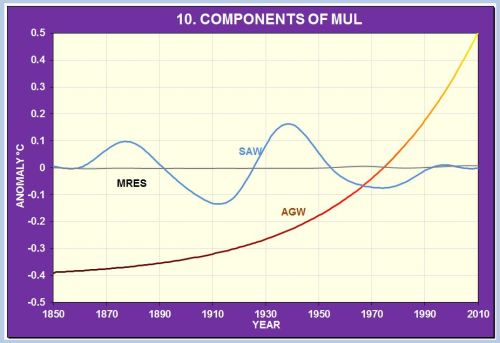
Figure 10
With enough parameters one can make any two curves equal to within any desired precision. The judgement to be made here is whether the nine parameters used here have any chance of achieving a comparably accurate fit on random data in place of HadCRUT3. This was an objection raised to Mann’s methodology, and I would be interested to see if it applies here.
After the comments responding to this post, this might not be the poster I want any more, but meanwhile you go to the conference with the poster you have, not the poster you want. :)
In any event this poster is offered as a preliminary report on work still in progress. One reason for advertising it here at an early stage is that the denizens of Climate Etc. seem well motivated to poke holes in theories of global warming, which I view as a positive benefit of skepticism, as distinguished from flat denial. There seems to be a lot of the latter here too but I haven’t found it as useful.
JC comments: This is an invited guest post. I think that this is an intriguing analysis, but I have not looked at this in any detail. This is a technical post, please keep your comments on topic.
I am at the AGU this week, I will have a post on the meeting later this week.

Confucius say:
Beware results of frequency analysis if most of relevant information occurs at one end of a non-periodic time-series.
If we really understand it all then even if the average global climate does not rise as fast as projected and despite the fact it is godawful cold outside, C)2-producting humanity can still be seen to be the destroyer of the Earth because it should be even colder.
By analogy what Vaughan Pratt is trying so hard to tell us non-believers is, Look, look, the witch didn’t float so she must’a not been a witch. Next!
+100
-100
When you’re incapable of commenting on content, just spit in the writers’ general direction? Thanks for contributing and giving climate skeptics a good name.
Then, you do not find “non-believers” to be objectionable ad hom? Good.
Nice job Vaughan. I still think perfect matches in an imperfect world are scary though. Especially since it can be hard to separate cause and effect.
https://lh3.googleusercontent.com/-7yQZf4cRGG0/UL4YWvB6AnI/AAAAAAAAF3Q/M50BKvLQWzk/s720/TSI%252015%2520year%2520lag%2520with%2520sh.png
Then I am a bit of a thermo dinosaur playing with psych charts and such :)
One question (not the only one but the most obvious) that comes to my mind is the influence of volcanic eruptions. Their effect is strong enough to affect the outcome after the the removal of high frequency phenomena but lumping that effect with the others in the sawtooth sounds rather overfitting than potentially justified by other means.
Up to a point Lord Cooper. Have you ever seen a global temperature response from a volcano? They don’t actually exist, nor are they present in the reconstructions.
The observation is made that cycles of less than 20 years are filtered out, so presumably volcanoes are treated as noise and suppressed.
I took Pekka’s point to be about sustained volcanism, which would need to be sustained for at least 25 years to get through the F3 filter. If seismic events at the crust-mantle boundary are responsible as I suggested, sustained volcanism might be so well correlated with this (whether positively or negatively does not matter) that they may be inseparable.
I had intended, but forgot or ran out of space, to make the point that one cannot choose between well correlated phenomena based solely on observation. Volcanism vs. my crust-mantle/mantle-core boundary explanations is such a situation. Unlike the latter, the former has been the subject of much discussion ,and to save space I focused on new ideas at the expense of old. A longer writeup would need to do justice to both.
What I have in mind can be seen from this Fig 2 from the paper of Lean and Rind.
There we see that volcanic influence has led to cooling by up to 0.25 K and with a decay that has taken a few years. Averaging over periods up to 22 years leaves still a signal of a few tens of mK. As the effect is purely cooling without a compensating warming phase it’s not averaged out but it influences the analysis and reaching an accuracy of mK range in presence of such random external influence seems to indicate overfitting.
Vaughan,
Taking into account what you tell in some of your comments about your goals my comment is not directly relevant to your work as stated.
Going beyond that this detail along many others mentioned in other comments or unmentioned lead one to conclude that reaching the level of accuracy you have reached is probably not very significant. It may indicate that allowing as much freedom for the choice of model as you have used and as many explicit parameters as you have is likely to allow for the observed accuracy as long as the data is reasonably well behaving.
A separate issue is that one may compare the results that you obtain using approach with that of Lean and Rind who try to find out how much of the variability can be explained by solar and volcanic forcing and “explained” by ENSO. I put the latter explained in quotes because ENSO is not really an explanation but another index that tells about the same Earth system as the temperature data. Solar irradiation and volcanic activity are external to the system of atmosphere and oceans while ENSO is internal.
Pekka, place show me a Thermometer record which shows anything like the temperature change shown in that figures, as a result of volcanic aerosols.
In the sciences one tests a hypothesis against the data. If the data is different from hypothetical result is different from reality, start over.
You are completely unable to show a temperature record that shows the model line shape in Figure 2b., because its not true.
@Pekka: Going beyond that this detail along many others mentioned in other comments or unmentioned lead one to conclude that reaching the level of accuracy you have reached is probably not very significant. It may indicate that allowing as much freedom for the choice of model as you have used and as many explicit parameters as you have is likely to allow for the observed accuracy as long as the data is reasonably well behaving.
That’s certainly a possibility that worries me, Pekka. However I would expect that the 9 parameters of my SAW+AGW model are not enough to reach the observed accuracy for more than 1% of other randomly constructed “reasonably well behaving data,” and likely much less.
One way to test this would be to perturb HadCRUT3 slightly by adding a dozen or so sine waves each with randomly chosen phase, small amplitude, and frequency below that of the Hale cycle (since F3 effectively kills all higher frequencies). Do this say a thousand times, and for each note the resulting R2. If 99% of the R2’s were significantly less than 99.98% then consider HadCRUT3 “special” with respect to this model, in the sense that it would seem not to contain the sort of noise being added in this test.
Would this kind of test satisfy you?
Vaughan,
The problem in testing the significance of this kind of findings is in estimating the “effective degrees of freedom” involved in the selection of the form of the model. I cannot know exactly what you have done but probably you have looked at the data and pondered what kind of parameterization might work. You may have also tested several alternatives and finally picked the one that performed best. It’s impossible to evaluate well the role your selective process plays in the success.
Testing with perturbed data would require an equal amount of pondering and search for the best performing model to even approach comparability.
Literature on statistical technical analysis used by people who hope to make money in the stock market by such tools is quite revealing. A number of papers have been written on testing the predictive power of models based on history time series. Some of the papers list known caveats that lead to spurious positive results and methods have been proposed to get rid of such false positives. The problem is that such methods are likely to get rid also of some valid positives.
The most difficult problem is always the human role in putting in information that’s not counted among the free parameters fitted to the history. This problem applies to all simple fits to history data, be that by you, Scafetta, or anyone else. That applies also to the climate modelers who have developed their large models knowing at least qualitatively how the numerous choices that they have made and continue to make affect the outcome. For this reason they can never tell with reasonable precision the statistical significance of the agreement found in hincasting. They’ll never know, how much implicit tuning their models contain.
Pekka, I agree wholeheartedly with your comments. As I think you’ve gathered, my main goal is not to predict climate, or even explain it, but only to describe the multidecadal part of HadCRUT3. Explanations enter only as a motivation for descriptions that are at least consistent with the known physics and that are analytic by virtue of belonging to the class of functions containing the constant functions and closed under linear combination, exponentials, logs, and sines. The multidecadal part seems to lend itself it to simple such descriptions.
There is much more to say about this, particularly as regards the role of F3 in reducing dimension, but after spending a day writing some 25 paragraphs about filtering technology and dimension reduction I realized I should instead organize it as a post and therefore put it to one side for the time being so I can respond more immediately to other comments.
Not to worry Pekka. Volcanic cooling stays up there, never descends into the troposphere. Such volcanic cooling as has been claimed is nothing more than misidentified La Nina cooling incidents whose timing accidentally followed an eruption. Best known is the claimed Pinatubo cooling that has nothing to do with Pinatubo. That is not surprising if you consider that the entire temperature curve is a concatenation of side by side El Nino peaks and La Nina valleys. After all his filtering Vaughn Pratt still could not get rid of them and says that “…multidecadal climate has only two significant components: the sawtooth, whatever its origins, and warming…” He does not understand the sawtooth and is wrong about warming. His analysis is brilliant but signifies nothing.
@Arrak: After all his filtering Vaughn Pratt still could not get rid of them
Since “them” (the southern oscillations) have a period in the vicinity of 7 years, I can assure you that the 21-year F3 filter got rid of them completely. Saying it didn’t is simply contradicting its frequency response with no justification.
Vaughn – five or six years is more likely from observation. I don’t doubt that you can make them invisible but they have been a real feature of climate since the Isthmus of Panama rose from the sea. You need their precise locations to compare with dates of volcanic eruptions. Müller shows four independent temperature curves (NASA, Met Office, NOAA and Japanese) to demonstrate warming since 1880. There are errors but far more striking is the precise correspondence of El Nino peaks among them going back to 1880. You could probably place Tambora on one of his longer term curves and get the lowdown on the year without summer.
Vaughan Pratt
Although I have to admit that I am not really sure I understand all you are saying, I have some comments or questions.
As I see it you take a temperature record with strong multi-decadal warming and cooling cycles plus lots of annual ups and downs (sawtooths) and smooth it by filtering out various assumed short term or long term cycles and end up with a smooth curve that shows exponential warming, presumably from AGW.
This is essentially handling everything except GH forcing as background noise, which can be filtered out to end up with the real residual signal, as I understand it.
Before F3 smoothing you remove all the multidecadal ocean oscillations This apparently eliminates the strong early 20th century warming cycle 1940-1970 (which is statistically indistinguishable from the warming cycle of the late 20th century, 1970-2000). After F3 smoothing, the early 20th century warming cycle is completely gone. How realistic is this?
You indicate that you have built in a 15-year time lag, calling this the Hansen effect. Doesn’t Hansen posit a much longer time lag in his “pipeline” postulation?
You take out the TSI impact of the 11-year solar cycle. Does this smoothing also consider any other solar mechanisms (e.g. Svensmark), or does this even matter to the analysis? How is the unusually high level of 20th century solar activity handled?
Is the 1940-1970 MRES smoothing for increased aerosols a convenient fit or are there empirical data to support it? Same question goes for the 1970-1980 reduction in MRES and the increase after 1990.
A final question: was the intent of this study to end up with the underlying exponential warming curve or did that just happen after all the noise was filtered out?
Sorry if these questions are too simple – but I am just trying to understand what you have written
Max
This seems pretty straight-forward.
HadCRUT3 – CO2 – Hale = quasisawtooth
Then publish as: HadCRUT3 – Hale – Saw = CO2
In the glacial/interglacial sawtooth pattern, the amplitude of each tooth is nearly equal. Why are the 1880 & 2000 teeth in the quasisawtooth blunted versus the 1940 “tooth”?
This does have a similar look to Foster and Ramstorf statistical exercise. Perhaps there is merit in this approach. The fit seems too precise given the errors in the temp records though. It seems difficult to remove all the dynamical processes so very accurately though as to be missing any bias in your assumptions.
The fit seems too precise given the errors in the temp records though.
If a million temperature measurements each have an uncertainty (however defined) of one degree, then a parameter inferred from them will have an uncertainty of 1/sqrt(1000000) = one millikelvin.
Bias is always a problem, but I didn’t get the sense that bias was your primary complaint.
“If a million temperature measurements each have an uncertainty (however defined) of one degree, then a parameter inferred from them will have an uncertainty of 1/sqrt(1000000) = one millikelvin.”
If – and only if – they are measuring the SAME THING. Measuring the fuel efficiency of 1 million different cars does not pin down the fuel efficiency of one particular car UNLESS they are all the same make and model, driven over the same route at the same speed, etc etc. If they are not the same thing, then the only inferences we can make relate to DIRECTLY UNMEASURABLE statistical qualities of the sample – the mean, standard deviation etc etc, such as “our fleet average fuel consumption is x MPG”, or – digging further – “On average, California drivers in our fleet consume 15% more fuel per mile than Texas drivers”. While these statements may be accurate, they do not tell you about the individual cars or drivers, only about the qualities of the whole, or sub-samples thereof. They can help you to predict what changes will have the largest impact on average, but they do not tell you the impact on the individual concerned (in this case, particular drivers and/or particular cars).
So the questions we must ask are:
Is a global average temperature useful to us?
If so, how? What does it tell us that other measurements do not?
Is spacial average more useful than temporal average for particular sites / areas / regions?
“Is a global average temperature useful to us?”
It tell you most of earth is covered by oceans.
I think bias was the main question though I appreciate the answers to Max A’s questions they much more clearly state my curiosities. You have avoided his question regarding if the fit came naturally or by design
Having seen Vaughan’s development of this idea earlier on this forum, I think the first realization comes from seeing how CO2 has followed a simple functional form with time, and combining that function with T as a theoretical function of CO2, which gives T as a function of time. Fitting that to any kind of smoothed temperature trace shows only a few anomalous but temporary bumps. It is very persuasive that these are the main things going on at the century scale.
But it is very telling that much else is happening on decadal scales in more recent times.
@Neil Fisher: Is a global average temperature useful to us?
This is an important question. On less than a decadal scale I would say not: regional temperatures are more interesting to the region in question.
However two or three decades is enough time for regional phenomena to be assimilated into the global temperature. Hence regions can’t exhibit multidecadal phenomena because on that time scale they’ve become global.
So if you’re studying El Nino say then regional temperature is important. But if you’re studying a 75-year cycle, or a slow trend like global warming, then only global temperature matters.
That’s just my opinion, and I’m happy to be persuaded otherwise.
“This is an important question. On less than a decadal scale I would say not: regional temperatures are more interesting to the region in question.”
Ah – I gather from this reply that this is the reason for the 30 years minimum so often quoted as required for climate rather than weather. And while I certainly appreciate the logic (and yes, it does make sense!), I think that from what we can see from direct measurements (~ 150 years) and infer from proxies (up to millions of years) that it is apparent there are psuedo-cycles (your saw) that extend across several orders of magnitude (perhaps best described with a fractal) – everything from day/night, through summer/winter, PDO/AMO, the approximately 80, 300 and 1500 year cycles all the way through the 100k Milankovitch and perhaps beyond. It is difficult to believe (for me anyway) that we are aware of even the existence of some of these, let alone their magnitude and phase (where we are in terms of each cycle right now).
The point is: is the saw wave that you subtract to show the underlying trend merely bumps on the teeth of a yet longer psuedo-cycle that you have not considered (may not even be aware of)? Teeth on teeth, as it were (hence the fractal description earlier). It would certainly make an interesting study to determine the fractal dimension of your saw and then “zoom out” to the next level and re-apply your method – it seems to me that this may even provide a better fit to the available data (inc long term proxies) than the single level you have already calculated – certainly the change in the projections would be most interesting! Certainly it would be difficult to calculate the exact phase relationships, and so there may be more uncertainty than we might hope (and is displayed by your work so far), meaning that several projections (with the phase of the longer cycles differing) may match the available data, but this is quite intriguing to me. Alas, this is beyond my abilities and resources to investigate, but I hope you might be intrigued enough by the concept to investigate – if you do, I would very much appreciate another post here at Judith’s blog outlining the results!
Thanks for engaging with us here BTW – so many of your colleges have been “burnt” by blog interactions in the past and I hope you will not be one of them. I believe that if you ignore the ad hom and other dross, you can pick up some useful “peer” review from interested laymen. I would like to think I fit that description, but I highly doubt it ;-)
Neil, I’m truly sorry I overlooked your second December 7 comment back when you made it. Thank you for your insight, as well as the intriguing idea that SAW might be just a part of a larger fractal.
However AGW makes even SAW hard to see, particularly after 1950, and I would expect it completely washes out anything much slower than SAW. With a reliable temperature record going back further than 1850 (and even 1850-1900 is a stretch according to many) one could do better.
The best candidates there would seem to be CET (Central England Temperature) for 1660-1900, the various ice core samples, and the International Tree Ring Data Bank maintained by NOAA.
Global warming would seem to have hit CET about a century earlier than HadCRUT3 because it’s so regional. While it has always reflected global temperature, Hubert Lamb’s premise, it samples only 0.01% of the Earth’s surface making it much more sensitive to industrialization in that region. The green curve here at Leif Svalgaard’s site starts out cleanly but is pretty ragged during 1900-1980, though it cleans back up after 1980, perhaps on account of more consistently applied emissions controls in that neck of the woods. (I’m using the Sun’s Hale cycle as a canary-in-the-mine because that portion of the climate spectrum seems to be unusually free of interfering natural signals compared to the rest.)
I believe that if you ignore the ad hom and other dross, you can pick up some useful “peer” review from interested laymen.
Yes, overall I’d say the response here has been a plus, at least in terms of my understanding of the issues raised.
The main downside of the “dross” is that it makes the thread much harder to follow. At some point I may try to address this by collecting the more salient criticisms, questions, and other contributions in one place.
Great questions, Max!
How realistic is this?
There are two parts to my analysis of HadCRUT3: describe, then explain.
Questions like yours about realism of a description can only concern explanations of it, not the description itself. As someone perfectly capable of doing the relevant arithmetic I stand strongly behind my description, but nowhere near as strongly behind my explanation. So to answer your question (which I take to be about explanation), not much until I get buy-in from others about whether my explanation (in terms of seismic events at the two mantle boundaries) is at all realistic.
Doesn’t Hansen posit a much longer time lag in his “pipeline” postulation?
Where? And how much longer?
You take out the TSI impact of the 11-year solar cycle. Does this smoothing also consider any other solar mechanisms (e.g. Svensmark), or does this even matter to the analysis?
The simple answer is that it doesn’t matter because the phenomenon Svensmark points to, namely the interaction between the galactic magnetic field and the Sun’s, operates on the same 21-year cycle that F3 removes.
However it’s an interesting question nonetheless. One grad student in hydrology asked me during the poster session this afternoon whether it would ok for him to cite Svensmark’s paper in support of his analysis of cycles in Indian hydrology. I told him that the papers of Ney and Dickinson on the same subject in respectively 1959 and 1975 would serve that purpose much better, not only for priority but also because they did not have the axe to grind that Svensmark does.
How is the unusually high level of 20th century solar activity handled?
Numbers, please.
Is the 1940-1970 MRES smoothing for increased aerosols a convenient fit or are there empirical data to support it?
If you’re referring to the 1950-1980 “bump” in MRES, how is it “convenient?” I wish it would go away. Please play with the Excel spreadsheet so that you can see what I mean. To the question “who ordered that?” it wasn’t me.
Same question goes for the 1970-1980 reduction in MRES and the increase after 1990.
Same answer.
Was the intent of this study to end up with the underlying exponential warming curve or did that just happen after all the noise was filtered out?
Great question. My analysis was in two steps: describe, then explain.
The tendency in climate science has been to eyeball the data and proceed right away to the explanation. All along the “underlying exponential warming curve” was in the back of my mind, but it seemed to me intellectually dishonest to infer it from inadequately described data such as the 162 numbers in the raw HadCRUT3VGL times series, which was just a mess of numbers.
I addressed this concern by reducing 162 numbers to 9. Part of this was done by applying F3, which I estimate to reduce the dimension from 162 to 16.
By putting up with a poor R2 (well less than 1), one can typically lop off a few more dimensions.
In this case the dimensionality went from 16 to 9 with an R2 of 0.9998.
Whereas I only play a statistician on YouTube, MattStat/MatthewRMarler is a real statistician, so I would defer to him on the question of whether 16 –> 9 vs. 0.9997 was significant. What say you, Matt?
(I asked Persi Diaconis this question a couple of months ago and he inclined towards significance. Seems like an interesting question.)
Dr. Pratt, you write “The simple answer is that it doesn’t matter because the phenomenon Svensmark points to, namely the interaction between the galactic magnetic field and the Sun’s, operates on the same 21-year cycle that F3 removes.”
I have enormous difficulty with this claim, but my expertise is not sufficient to really dispute it. But I think it is wrong As I understand things, Svensmark’s point relates to the strength of the sun’s magnetic field. This changes little over the Hale cycles. It is far more related to the sort of measurements Livingston and Penn are making on the magnetic strength of sunspots, which has been decreasing steadily ever since measurements started around 1998. I dont think that this magentic effect shows any sort of 22 year cycle. It is more likley associated with the 189 year cycle of planetary alignment.
But we really need someone like Leif Svalgaard to comment on this claim.
vrpratt: All along the “underlying exponential warming curve” was in the back of my mind
This was what I meant by finding the correct filter to match someone’s expectation. And, if in fact that is the correct function, then you found the best filter to reveal it. There is a symmetry: if you know the characteristics of the noise, you can design a filter that will reveal the signal; if you know the signal, you can filter away ad lib until you have revealed the signal. If both are in doubt, a clear result is ambiguous. There are different ways to say this: instead of testing a hypothesis, one may say that you have “rescued” the hypothesis. Or, the procedure itself has a type 1 error rate of 1.0, when the nominal value is 0.05.
Or, consider the hypothesis that there is a 1000 year period, and we are nearing or in the “next” peak: (a) you can assume it’s true and filter until you have it clearly confirmed; or (b) you can assume it’s false and filter until it’s removed (which you did by focusing on the short recent time series.)
to test whether you have found something reliable, keep your full model prediction: model = “smooth” + “rough”; compare to future data.
MattStat, “one may say that you have “rescued” the hypothesis.”
I like that. Couldn’t you compare “rescue” attempts? Use the same rescue solar and compare. When you get into smoothing you are throwing away lots of information that needs some reasonable standard method to validate.
https://lh3.googleusercontent.com/-7yQZf4cRGG0/UL4YWvB6AnI/AAAAAAAAF3Q/M50BKvLQWzk/s720/TSI%252015%2520year%2520lag%2520with%2520sh.png
I threw solar TSI smoothed to 11 yma and used the 15 year lag in that. With a little SAW I could nail solar pretty easy.
vrpratt: Whereas I only play a statistician on YouTube, MattStat/MatthewRMarler is a real statistician, so I would defer to him on the question of whether 16 –> 9 vs. 0.9997 was significant. What say you, Matt?
It’s really hard to tell.
If you would like your modeling result to be taken seriously as a guide to future planning (I don’t mean to presume to know your motives), then keep track of the squared prediction error, the sum of the squared prediction errors (CUSUM), and the square root of the mean prediction error (RMSE) over the next 20 years. That will provide better information for whether you have a significant result, by any definition of significant.
I used to “lean” toward AGW, and a result like you got. Now I “lean” toward the 1000 year cycles and the idea that we are near a peak. The two ideas make sharply different forecasts for the next 20 years. I am 65, so I may not live long enough to decide which leaning was correct. But the test of the model is in the future data. If you see Dr. Diaconis soon, I would be interested in his responses to my comments. I can’t really believe they are worth his time, but who knows?
vrpratt and MattStat
re: 1000 year cycle
Loehle and Singer evaluated nine temperature reconstructions and found a climate cycle about 1500 years (or 1200) long that may correspond to the Pleistocene Dansgaard-Oeschger (DO) oscillations. See:
Craig Loehle and S. Fred Singer, Holocene temperature records show millennial-scale periodicity. Canadian Journal Earth Science Vol. 47 pp 1327-1336 (2010).
Bond event zero?
http://s1114.photobucket.com/albums/k538/Chief_Hydrologist/?action=view¤t=Vance2012-AntarticaLawDomeicecoresaltcontent.jpg
http://journals.ametsoc.org/doi/abs/10.1175/JCLI-D-12-00003.1?journalCode=clim
vrpratt and MaxStat
On AGW attribution, what is you NULL hypothesis?
Your filtering exercise shows an underlying accelerating upward trend. However, I also expect a natural underlying accelerating upward trend from the 1500 year cycle. e.g. there is
1) a mild global cooling from the Holocene Climatic Optimum
2) A millenial scale oscillation of ~ 1500 years per Loehle & Singer above
(i.e. an approximately linear rise from the Little Ice Age – or better
an accelerating natural warming since the LIA)
3) A 50-60 year multidecadal oscillation.
4) A 22 year Hale solar cycle (or conventionally 11 year Schawb) (See WGR Alexander et al. (2007) Linkages between solar activity, climate predictability and water resource development).
How then do you distinguish anthropogenic contributions, from CO2 etc. from that Null Hypothesis?
5) AND account socio economic impacts on the temperature data.
(See Ross Mckitrick’s recent papers)
Robustness
Have you evaluated the potential to hindcast/forecast from a two portions of the data and then compare the projections against the third portion?
Have you any comments on the relative physical and statistical validity of your methods compared with those of Nicola Scafetta? cf
Testing an astronomically based decadal-scale empirical harmonic climate
model versus the IPCC (2007) general circulation climate models
or see the links above
Physicality
Consider the recent WUWT comments of physicist Robert Brown of Duke U
On certainty: Truth is the Daughter of Time
So what do your results mean?
Do I understand you to assume an exponential CO2 rise to cause an exponential temperature rise?
From Beers law etc., the warming contribution of CO2 is logarihmic to the concentration. Consequently wouldn’t combined impact of exponential and logarithmic be an approximately linear warming contribution? e.g. as per Scafetta 2011 above?
But it is very telling that much else is happening on decadal scales in more recent times.
@David L. Hagen: On AGW attribution, what is you NULL hypothesis?
That there is no essential difference between the AHH law as I formulated it and observed global warming as I defined it.
How then do you distinguish anthropogenic contributions, from CO2 etc. from that Null Hypothesis?
By its good fit to the data since the onset of serious industrialization. I would be very interested to see how well your null hypothesis fits the data. over that period. My expectation would be that a good fit is not possible, but I enjoy being surprised in matters of science.
@David L. Hagen: Have you evaluated the potential to hindcast/forecast from a two portions of the data and then compare the projections against the third portion?
That’s a rather low bar compared to simply deleting the last few decades. My analysis depends critically on the Keeling curve, so if you try to predict 2010 by deleting all data after 1980, you only have 22 years of Keeling curve to go on. If instead you delete a middle third while retaining the last third as you suggest then you’ve retained the critical part of the Keeling curve, which sounds like cheating.
What you really want to know is how well the model predicts when you don’t know any part of the future, not just HadCRUT3 but also the Keeling curve.
So I deleted everything after 1980 and did the fitting based only on data from 1850 to 1980. (So far only RobertInAz has shown any interest in auditing my work—he’s welcome to play with http://clim.stanford.edu/hadcrut3to1980.xls which does all this.) Here are the changes from fitting to HadCRUT3 to 2010.
The parameters are in three groups, the timing/amplitude of SAW, its shape, and the three CO2 parameters.
Timing/amplitude barely changed:
Period: 151 years no change
Trigger: 1924.46 –> 1924.47 (essentially no change)
Amplitude: 1.80 –> 1.81 (very small change)
The three shape parameters controlling the amplitudes of the 4th and 5th harmonics and their common phase shift also barely changed:
Amp4: 0.14 no change
Amp5: 0.47 –> 0.44 slight decrease
Phase Shift: .03 –> .032 slight increase
The biggest change was in estimating CO2 and its impact.
Natural CO2: 287.3 –> 281.1 (large decrease)
Sensitivity: 2.83 –> 2.43 (large decrease)
I blame these big shifts in those two parameters on our rather incomplete understanding of CO2 up to 1980, relative to what we have now, namely 1850-2010.
Hansen delay did not change:
Hansen delay: 15 years no change
Is there a peer-review process for posters at AGU meetings?
no
Seems to me that this blog is doing a pretty good job already of peer-review.
25 comments from about a dozen individuals in just a couple of hours.
A process simialr to this will be the future replacement for old-fashioned peer-review…and far better than Phil Jones’s gut feel:
‘ I have a feel for whether something is wrong – call it intuition. If analyses don’t seem right, look right or feel right, I say so’
aut viam inveniam aut faciam
Yeah, ain’t it great. And medical decisions will be made in the same way. Need a new liver? We better post on the blog and see what folks say. There is a difference between feedback and peer review.
I would not make too much of the lack of peer-review for the AGU general meeting. It’s been that way for years and those attending know that to be the case. I’ve viewed it as ‘well, good here is an open forum for members.’ It serves multiple purposes–good and not so good, depending on point of vision. Yawn.
‘point of vision’ –>> ‘point of view’ (oops, thinking of Persistence of Vision)
mwg practiced medicine in the recent past because medical references seem to be popping up from time to time ;)
Peter
No medical practice. Medicine is interesting from a number of perspectives including uncertainty, science, rules-of-thumb, ethics, etc., and it has been a significant area of interest over the years for decision theory and artificial intelligence researchers in part because it has non-trivial elements of uncertainty, serious outcomes, extra-medical considerations, etc. The uncertainty and gravity surrounding some medical decisions and the sheer number of these decisions suggest that they might provide useful insights for some of our ‘one-chance’ environmental decisions. Just a personal bias operating here ;O)
mwg your take on the ubiquity of medical issues and their relevance to theories of general decision-making is an interesting and valid one. I have often thought, however, that the better practicioners were slower and more methodical in their approach to diagnosis and were better in patient relationships.
The very bright ones seemed more remote and bored with the whole thing and yet, to get into medical school in Australia one had to be pretty bright. There are, however, a few very hard workers who manage to get the pass levels required for Uni entrance and these ones seem generally to be better at their vocation.
@Latimer Alder: Seems to me that this blog is doing a pretty good job already of peer-review.
Lord Monckton took “peer review” quite literally.
Poster sessions are a means of gathering critical information on an idea you think is good. It might also have a hole a truck could be driven through that you missed in the blinding flash of creative genius that generated the poster session. Someone will wander up and stare at your work for a bit and then say, “have you considered …?” You will either then say “of course …” or stare back like a poll-axed steer. The obvious is often unaccounted for.
Yes. What a pity the authors didn’t take that approach before submitting the paper with this scheme to the journal:
http://judithcurry.com/2012/08/24/a-modest-proposal-for-sequestration-of-co2-in-the-antarctic
They got plenty of advice on this thread, but the paper has already been submitted and the Lead author did not accept most of the comments:
Presentation of am AGU general meeting 10 minute talk or a poster session is not viewed as anywhere near the equivalent of peer-reviewed journal publication. It serves other purposes.
Yes, though not at the journal level. It is easier to find AGU-FM posters that contradict each other than Nature articles.
Has the temperature data been considered in light of Dr. Ross McKittrick’s statistical analysis that brings doubt to its validity? I am not sure if the HadCRUT3 data has similar problems.
And…I am NOT a scientist so I suspect my question above might have already revealed as much ;-) I just wonder if the underlying data regarding warming is accurate.
Mike, in addition to data accuracy, there are quite a bit of filters and delays in the pipeline. These can do magic to get things aligned.
How do we validate the Arrhenius-Hofmann-Hansen’s Law? Any suggestions by the authors of the law anywhere in the science?
The historical record would show that one could not have a change in temperature without a change in atmospheric CO2.
There would never be a case where temperature fluctuated and CO2 didn’t or that CO2 fluctuated and temperature didn’t.
I refute it thus
http://i179.photobucket.com/albums/w318/DocMartyn/last400KYEPICADomeCCO2vsTemp.jpg
How do we validate the Arrhenius-Hofmann-Hansen’s Law?
“Control-Knob Law” is a lot easier to say.
“Control-Knob Law” is a lot easier to say.
Control is a redundancy.
LOL Doc !!!
These might be of interest to folks whose knowledge of calculus and statistics is not covered with rust, as mine is. “Harmonics” caught my eye; my recollection is that “harmonics” can cancel or amplify component signals.
Markonis, Y., and D. Koutsoyiannis. “Climatic Variability over Time Scales Spanning Nine Orders of Magnitude: Connecting Milankovitch Cycles with Hurst–Kolmogorov Dynamics.” Surveys in Geophysics (2012). doi:10.1007/s10712-012-9208-9
Related to paywalled paper Scafetta, 2012?
Scafetta, Nicola. “Multi-scale Harmonic Model for Solar and Climate Cyclical Variation Throughout the Holocene Based on Jupiter–Saturn Tidal Frequencies Plus the 11-year Solar Dynamo Cycle.” Journal of Atmospheric and Solar-Terrestrial Physics 80, no. 0 (May 2012): 296–311. doi:10.1016/j.jastp.2012.02.016
http://www.sciencedirect.com/science/article/pii/S1364682612000648
Pooh, Dixie
For preprints see Nicola Scafetta’s home page e.g. see.Scafetta N., 2012. Multi-scale harmonic model for solar and climate cyclical variation . . .PDF PS Scafetta’s updated graph is at the page bottom.
For full presentation graphics see Scafetta’s Presentation at 2012 SORCE Science Meeting – Annapolis, MD, 18-19 Sept., 2012.
For his earlier technical paper & discussion see:
Scafetta N., 2012. Scafetta N., 2012. Testing an astronomically based decadal-scale empirical harmonic climate model versus the IPCC (2007) general circulation climate models. (Science and Public Policy Institute). Web: PDF
As reported by
Watts, Anthony, Y. Markonis, and Demetris Koutsoyiannis. “New Paper from Markonis and Koutsoyiannis Shows Orbital Forcings Signal in Proxy and Instrumental Records” Scientific. Watts Up With That?, November 4, 2012.
http://wattsupwiththat.com/2012/11/04/new-paper-from-markonis-and-koutsoyiannis-shows-orbital-forcings-signal-in-proxy-and-instrumental-records/
Markonis and Koutsoyiannis, 2012
http://www.itia.ntua.gr/en/docinfo/1297/
http://www.springerlink.com/index/10.1007/s10712-012-9208-9
David L. Hagen: Many thanks! :-)
Dr Pratt
A law no less, and to think Reimann only has a hypothesis to his name.
LAW
1) An empirical generalization; a statement of a biological principle that appears to be without exception at the time it is made, and has become consolidated by repeated successful testing; rule (Lincoln et al., 1990)
2) A theoretical principle deduced from particular facts, applicable to a defined group or class of phenomena, and expressible by a statement that a particular phenomenon always occurs if certain conditions be present (Oxford English Dictionary as quoted in Futuyma, 1979).
3) A set of observed regularities expressed in a concise verbal or mathematical statement. (Krimsley, 1995).
THEORY
1) The grandest synthesis of a large and important body of information about some related group of natural phenomena (Moore, 1984)
2) A body of knowledge and explanatory concepts that seek to increase our understanding (“explain”) a major phenomenon of nature (Moore, 1984).
3) A scientifically accepted general principle supported by a substantial body of evidence offered to provide an explanation of observed facts and as a basis for future discussion or investigation (Lincoln et al., 1990).
4) 1. The abstract principles of a science as distinguished from basic or applied science. 2. A reasonable explanation or assumption advanced to explain a natural phenomenon but lacking confirming proof (Steen, 1971). [NB: I don’t like this one but I include it to show you that even in “Science dictionaries” there is variation in definitions which leads to confusion].
5) A scheme or system of ideas or statements held as an explanation or account of a group of facts or phenomena; a hypothesis that has been confirmed or established by observation or experiment, and is propounded or accepted as accounting for the known facts; a statement of what are held to be the general laws, principles or causes of something known or observed. (Oxford English Dictionary, 1961; [emphasis added]).
6) An explanation for an observation or series of observations that is substantiated by a considerable body of evidence (Krimsley, 1995).
Forgot to add auxilary hypothesis to my previous list. Given the nature of the blog topic I feel it would not be complete without it.
The introduction of an auxiliary hypothesis should always be regarded as an attempt to construct a new system; and this new system should then always be judged on the issue of whether it would, if adopted, constitute a realadvance in our knowledge of the world. An example of an auxiliary
hypothesis which is eminently acceptable in this sense is Pauli’s exclu-
sion principle. An example of an unsatisfactory auxiliary hypothesis would be the contraction hypothesis of Fitzgerald andLorentz which had no falsifiable consequences but merely served to restore the agreement between theory and experiment.
“Auxiliary hypothesis” implies that there is a main hypothesis. I prefer to think of hypotheses competing on an even field, rather than in terms of a reigning champion and a challenger.
“…but meanwhile you go to the conference with the poster you have, not the poster you want… In any event this poster is offered as a preliminary report on work still in progress…”
Are we looking at the graph with the jaundiced eye of skeptic, for the sake of the health and credibility of future scientific endeavors, or with a shopkeepers desire to fill shelf space with whatever the government will buy?
Neither. I’m looking at HadCRUT3 with an eye to describing it as simply as possible. I would be thrilled if anyone could offer me a simpler description.
Its the utility of the description you should be worried about (and this is context specific), not the simplicity. Simplicity can be useful, but not always.
The simplest description is that this its a temperature series.
I fear for the future of Western civilization. AGW prognosticating has become a smithy’s craft. From an age of technology, reason and hope we have turned a dark corner to the disinformation age where schoolteachers trade in their sheepskins for hammers to pound out the coffin nails to be used to bury science.
So if this is a work in progress, what are you shooting for? A milliKelvin?
Free from preconception and bias, what can we really know about the theory that humans cause global warming?
■We know that global warming is not proven science. Just what is the circumstantial evidence for global warming?
■We know that climate change is not unusual. It’s not even unusually rapid.
■We also know that the myth of a scientific consensus belies the actual fact of an ideologically-driven consensus supported by fraud and corruption.
■We know that the global warming alarmists have become further and further removed from the kind of rationalism that a dispassionate search for truth requires.
■We see the failure of academia and note its precipitous decline in a sense of truthfulness among AGW scientists in proportion to the reality-inspired cognitive dissonance of the confused Climatology belief system.
■We see global cooling. We see all of the other completely natural explanations for climate change that global warming alarmists ignore.
■We know now about all of the errors in historical land measurements, and how NASA is the next CRU; and, we know how more accurate evidence from satellite data does not show any dangerous global warming at all.
■We have learned that the atmospheric CO2 levels as measured at Mauna Loa are totally erroneous — the mere product of a cottage industry of fabricating data by a father and then his son.
■We all smelled the carcass of stinking fish in Copenhagen and the Leftist-lib agenda is all too clear to ignore the real truth about the global warming hoax.
Some circumstantial evidence is very strong, as when you find a trout in the milk. ~Henry David Thoreau
Wagathon, you’re a loon. Please remember not all of us are when you start tossing around “we.”
It should be implicit that when I use the royal “we,” I do not mean to include hypocrites. Is that better?
If by “better” you mean better at showing you’re a loon… yes. It is better. Otherwise, you’re saying anyone who disagrees with your stupid comments is a hypocrite, and that’s…
Loony.
For example, understanding that global warming is not a proven science and that there is no circumstantial evidence for global warming alarmism — which is why we see goats like political charlatans like Al Gore showing debunked graphs like the ‘hockey stick’ to scare the folks — and, not understanding that climate change the usual thing not the unusual thing and that the climate change we observed can be explained by natural causes is the only thing that really separates we the people from superstitious and ignorant government-funded schoolteachers on the issue of global warming… that and the fact that global warming alarmists do not believe in the scientific method nor most of the principles upon which the country was founded.
I’d say that comment pretty well demonstrates it. Either people who disagree with you, including our hostess, are hypocrites and apparently ignorant, or you’re a loon.
Guess which seems more likely.
Don’t be embarassed if you do not understand that the ‘we’ of science prefer the scientific method to guessing. Bob Carter points to what is missing–independent verification: “the essence of scientific methodology is the free sharing of data, and the unfettered and unprejudiced discussion of those data. Issuing statements of ‘consensus’ or ‘authority’ is antithetical to good science, and especially so in circumstances where the originating organizations have been established with political intent, have acted to restrict public debate or have a financial conflict of interest. Those familiar with the global warming issue will know that (IPCC) authority rules, despite it being well known that some IPCC practitioners of warming alarmism have flouted correct scientific procedures since the 1990s. And, anyway, a science truth is so not because the IPCC, the Royal Society or the Minister for Science asserts it to be so, but because it is based upon a hypothesis that has survived repeated testing by many independent scientists.”
What, successfully evading testing doesn’t count? How naively unpolitical of you!
I think this thread gives a further indication of just how desperate the warmists, including our hostess, are becoming. The more empirical data we collect, the more it gives a stronger and stronger indication that adding CO2 to the atmosphere has a negligible effect on global temperatures. This is, of course, heresy; it does not conform to the religion of CAGW. As Ronald Coarse noted “If you torture the data long enough, it will confess.”. Unfortunately, torturing data is not an indictable offense in any country. Ohterwise I would be delighted to make a citizen’s arrest, and turn Vaughan over to the authorities for prosecution.
I note our hostess claims that this is a technical post. I beg to differ. This is sheer propoganda.
Yes, the certainty (no significant effect) is growing and the desperation of warmists too.
Oh do come off it Jim, the use of epicycles to explain and predict complex phenomena has a long history. When they show the instruments of torture to the ‘denialists’ you will change your tune.
There is no need to torture data anymore, the drones will save us all.
The Cripwell:
I note our hostess claims that this is a technical post. I beg to differ. This is sheer propoganda.
And this is sheer denialism.
And this is nothing but a loser who has nothing better to do with his life than to go around the internet and regurgitate political slogans like ‘denialism’.
Andrew
Do you have to stop breathing when you type, I wonder?
Jim you are hundred percent right on carbon dioxide having a negligible effect. I count it as zero because of Ferenc Miskolczi and because of the failed predictions from IPCC. Miskolczi elaborated his theory in a 2007 paper according to which the greenhouse gases collaborate by feedbacks to keep the IR transmittance of the atmosphere constant. He even calculated theoretically that the optical thickness of the atmosphere in the infrared should have a value of about 1.86. This corresponds to an IR transmittance of 15 percent. He was attacked in the blogosphere because his theory requires water vapor feedback to be negative, the exact opposite of IPCC. This was vital to these guys who needed the positive feedback to produce their outrageous warming predictions. The theory was up in the air until 2010 when Miskolczi was able to put it to an experimental test. What was required was a direct comparison between his theory and the greenhouse theory on infrared absorption by the atmosphere. His theory says that the IR transmittance of atmosphere should not change when more CO2 is added to it. With the greenhouse theory the opposite is true – adding CO2 will lower the IR transmittance of the atmosphere. Using NOAA database of weather balloon observations Miskolczi was able to demonstrate that the IR transmittance of the atmosphere did not change for 61 years while carbon dioxide percentage increased by 21.6 percent. This is exactly what his theory had predicted and was a clear victory over IPCC. If so, it follows, we should be able to show in other ways whether the greenhouse effect works or not. Fortunately we can. In 2007 IPCC predicted from the greenhouse theory that global warming in the twenty-first century shall proceed at the rate of 0.2 degrees per decade. We are now in the second decade of this century and there is no sign whatsoever of this predicted warming. The fate of scientific theories that make wrong predictions is to be consigned to the trash heap of history. The greenhouse theory has already made two wrong predictions First, that adding carbon dioxide to air will reduce atmospheric IR transmittance (it didn’t); and second, that it will cause twenty-first century warming (it didn’t). That’s enough to earn it a place in that trash basket of history. Greenhouse warming theory, R.I.P.
This is the most recent of 2 decades worth of work trying to identify periodic filters and decay rates that can smooth the observed trend and get a relatively straightforward function of CO2 as a result. This is either the Holy Grail or else a carefully constructed flimsy imitation. That is: if this is the signal of CO2, you have constructed the best filters to reveal it; if this is not the signal of CO2, you have constructed the best filters to reveal something conforming to someone’s expectations.
Whether you have found the signal of CO2 is as uncertain as with all the other phnomenological model fitting efforts.
The best test of models is how well they are matched by future data. What is your model for the data collected after the last of the data used in estimating model parameters? What is your model for the next 30 years, say possibly 3 models as Hansen did for 3 realistic CO2 scenarios?
What is your estimate of the transient climate effect, say a doubling of CO2 over a span of 70 years?
There is an apparent period of 1000 years or so, that produced the Minoan Warm Period, Roman Warm Period, Medieval Warm period, etc. That is, it is “apparent” to some. If you subtract out the best estimate of that periodic function, how much remains to be accounted for by CO2?
Remember to smile, wink and chuckle when you say “millikelvin accuracy” and “99.98%” aloud.
Just to add a couple of comments in the same vein.
First why not subtract some CO2 series (possibly one with some basis in reality) from the temp series and then play around to explain the residue? Answer that question and you start to expose the problem with the reverse approach – methodologically they are much the same.
Second why not hold out 50% of your temp time series (random selection of each data point perhaps), do your analysis on on one half and check the fit to the other. Don’t even need to wait for the future to see if it works.
On Dec 4 your post refers to Dec 4 as “tomorrow”. Is a puzzlement!
tangled web weaving is tricky business
I mailed my post to Judith on December 3 and she said she’d post it that evening. Due to time pressure she wound up posting it on the morning of Dec. 4 without editing it accordingly. Less puzzled now, King of Siam?
Thanks for clearing that up, Anna.
Yep. I’m even whistling a happy tune, that I picked up on the docks.
From 1850 to 1980 SO2 emissions rose from almost 0 to 140,000 Gigagrams per year in 1980 and then dropped down to 110,000 Gigagrams around 2000 and then it started to rise again as China began to burn a lot more coal.
http://sunshinehours.wordpress.com/2012/09/14/are-we-cooling-the-planet-with-so2/
You forgot to account for 7 Pinatubos rise of SO2 by 1980 and a 1 Pinatubo drop from 1980 to 2000.
Good point, one that I had the very fortunate opportunity to discuss with Pieter Tans from NOAA Boulder this afternoon when he dropped by my poster. (Perhaps I should call him Al since he and James Butler are the two al’s in my “Hofmann et al” in the poster.)
SO2 (which cools) and brown cloud pollution (which warms) are too well correlated to separate. The only question is which dominates. MRES suggests brown cloud dominates, which Pieter had no quarrel with. Had MRES gone down instead of up it would support that SO2 dominates.
sunshine
The problem with the aerosol explanation for the mid-century cooling is that it begs the question:
If human aerosols (SO2) were responsible for the mid-century cooling, could it not be that their removal was largely responsible for the late century warming (rather than GHGs)?
Hans Erren has plotted this for the USA with the same line of reasoning:
http://members.casema.nl/errenwijlens/co2/usso2vst.gif
Max
“could it not be that their removal was largely responsible for the late century warming (rather than GHGs)?”
Of course.
If 1 Pinatubo of CO2 causes .5C warming, then removing 1 Pinatubo of SO2 should causes .5C of warming.
Ooops. “If 1 Pinatubo of SO2 ” (not CO2 which I typed inadvertently)
” the oceanic heat sink delays the impact of radiative forcing variations on HadCRUT3 by 15 years”
Does this mean the current temperature plateau has its root in what happened 15 years earlier ?
Well the bottom of the Oceans is at 4 degrees so the water there came from polar sources, melted ice/seawater or chilled winter, high salt brines.
The movement of cold water to the bottom is why the Oceans are cold. The Oceans are not cold at the bottom because they are at thermal ‘equilibrium’ with the sea bed.
Strange but true:
The average temperature of the ocean, top to bottom, is 3.9C.
The temperature below 300 meters is a fairly constant 3C all over.
The freezing temperature of seawater is -1.8C.
The maximum density of seawater occurs at -1.8C.
Matter at 4C has a radiative emittance of 335W/m2.
The power delivered to the earth from the sun is 1366W/m2 at top of atmosphere.
Projecting solar power onto a sphere reduces it by a factor of 4 to 341W/m2.
It could be just a coincidence that the average temperature of the ocean is almost precisely that of a spherical black body illuminated by a 1366W/m2 source. Then again maybe it isn’t just a conincidence.
I agree with the general analysis of Mr. Pratt’s but not the extrapolation going forward. We are only now beginning to see some of the Earth system feedbacks begin to kick in from previous decades of CO2 emissions. An ice free summer Arctic and melting permafrost are just two of the Earth system feedbacks that will alter the future shape of the curve. This quadratic rounding or leveling may occur later in the century or next century but we’ve got several jumps upward to come in the deacdes ahead. This is just getting started.
Skeptical warmist
Baseless beliefs of certainty are for religious zealots and realclimate bloggers. Here we expect more.
As Niels Bohr pointed out decades before Yogi Berra, “Prediction is very difficult, especially about the future.” Please don’t view my extrapolations as predictions, there’s a difference. As extrapolations they are perfectly fine.
Ray Pierrehumbert told me this morning at AGU that the permafrost threat was greatly overblown. I have no opinion either way, so if you disagree with Ray please take it up with him, not me.
My comment is more about Earth system feedbacks. Hansen’s last few papers have made some excellent points about these as well as the overall Earth system level of equilibrium. Once big things like permafrost, Greenland and Antarctica really chart to change, the feedbacks fall heavily into the positive side of things. This rounding of your curve of course does not and cannot include these, but they could be significant.
Wondering how much Ray is an expert on permafrost or up on the latest resarch there– really, I’m wondering…I’ve got no idea what his expertise in this very specialized area is, for the latest research would seem to contradict his comments:
http://www.newscientist.com/article/dn22549-arctic-permafrost-is-melting-faster-than-predicted.html
Hi Dr. Pratt
There is no beef in the CO2; the beef is in the mid-Atlantic ridge.
http://www.vukcevic.talktalk.net/SST-NAP.htm
It is shame you left out the bit about the low frequencies and the ocean floor.
A shame indeed. But I only attributed ocean oscillations to that effect. Are you able to account for global warming the same way?
North Hemisphere yes, Enso possibly, not within miliKelvin, not globally, but to a point and to a degree where can be taken seriously, hopefully by those to whom true cause matters more than a personal conviction.
this doesn’t make any sense to me
it’s making more sense to me now, the order of graphs confused me
Well done, and with maybe two parameters more, dr. Pratt might be able to reduce the residual well into the microkelvin range! And congratulations to the people who have measured and processed surface temperatures for over a century for their remarkable achievement.
Actually I’ve pretty much had it with these least-square fits to a single signal with only a few degrees of freedom “explaining” everything and more, with wildly diverging conclusions but always stated with confidence. Whether done by professional scientists or amateurs. In spirit, it comes pretty close to astrology in my opinion.
Three more parameters and he can draw elephant. Oh goody.
About right. For an R2 of 99.98% I’d calculated seven, shall we split the difference? ;)
The occurrence of the records by decade [i.e., by decade by state]… makes it obvious that the 1930s were the most extreme decade and that since 1960, there have been more all-time cold records set than hot records in each decade.
However, there are only 50 states, and this is a number that isn’t large enough to give the best statistical results… [a better metric is a ] year-by-year numbers of daily all-time record high temperatures from a set of 970 weather stations with at least 80 years of record… There are 365 opportunities in each year (366 in leap years) for each of the 970 stations to set a record high… Note the several years above 6000 events prior to 1940 and none above 5000 since 1954. The clear evidence is that extreme high temperatures are not increasing in frequency, but actually appear to be decreasing. The recent claims about thousands of new record high temperatures were based on stations whose length-of-record could begin as recently as 1981, thus missing the many heat waves of the 20th century.
John R. Christy, PhD, Alabama State Climatologist, The University of Alabama in Huntsville / Senate Environment and Public Works Committee,
1 August 2012 (One Page Summary)
(Data: NOAA/NCDC/USHCNv2)
FAIL
A Cornell statistics professor explains why you Do not smooth time series.
And if you do, you never ever use the smoothed data as input to another analytic.
With four parameters I can fit an elephant, and with five I can make him wiggle his trunk. ~Jon von Neumann
There are three kinds of lies: lies, damned lies, and statistics. ~Mark Twain
Lessee, first you massage away inconvenient data (sawtooth). You pretend that there was a semblance of something that could be called global temperature sensing in the late 19th and earlyt 20th century. You smooth the questionable, massaged data into curve that looks like about 30 zillion (rough estimate) curves in nature. Then drop off the past 15 years of data. Then you fit it.
Are you f*cking kidding me?
Briggs, William. “Now I’m going to tell you the great truth of time series analysis. Ready? Unless the data is measured with error, you never, ever, for no reason, under no threat, SMOOTH the series! And if for some bizarre reason you do smooth it, you absolutely on pain of death do NOT use the smoothed series as input for other analyses! If the data is measured with error, you might attempt to model it (which means smooth it) in an attempt to estimate the measurement error, but even in these rare cases you have to have an outside (the learned word is “exogenous”) estimate of that error, that is, one not based on your current data.
“If, in a moment of insanity, you do smooth time series data and you do use it as input to other analyses, you dramatically increase the probability of fooling yourself! This is because smoothing induces spurious signals—signals that look real to other analytical methods. No matter what you will be too certain of your final results! Mann et al. first dramatically smoothed their series, then analyzed them separately. Regardless of whether their thesis is true—whether there really is a dramatic increase in temperature lately—it is guaranteed that they are now too certain of their conclusion.”
David
It’s an old saw, but worth repeating here.
Three statisticians go hunting. When they see a rabbit, the first one shoots, missing it by a foot on the left.
The second one shoots and misses it by a foot on the right.
The third one shouts: “We’ve hit it!…
Max
The mean weight of all statiscians in the world is 3 lbs.*******
Includes urn.
Being in love means never having to say you’re sorry. Being in statistics means never having to say you’re certain.
Bazinga.
Data sets are like people. Torture them enough and they’ll tell you whatever you want them to say.
Celebrating your birthday is good for your health. Statistics prove the more of them you celebrate the longer you are likely to live.
Shoe size is highly correlated with income and education level.
A statistician is a person who draws a mathematically precise line from an unwarranted assumption to a forgone conclusion.
The great majority of people have more than the average number of legs.
Scientists use statistics as a drunk uses a lampost; for support rather than illumination.
Vaughan, I’m not sure where you’re going with this ? Does it, or will it have any predictive value ?
Of course it has no predictive value. He cut the fit off at 1995 because it fails at that point. It’s worthless.
David, It is a problem with the American education system, half of our scientists are below average.
According to a new model developed for AR5, 97% of climate scientists are above average.
And the other half are engineers.
(Again apologies for not getting to all comments promptly.)
@J Martin: Does it, or will it have any predictive value ?
Five years, perhaps not. But ten years, it strongly suggests that 2010-2020 (an odd decade since its 3rd digit is 1) will trend up, very likely strongly. Reasons:
(i) Every odd decade since 1870 has trended up more strongly than its predecessor. This despite the fact that there have been sustained downward trends, much stronger than in recent decades.
(ii) If SAW continues it will trend up.
(iii) SOL looks extremely likely to trend up.
(iv) AGW has been trending up for over a century.
So if 2010-2020 trends down it is hard to imagine stronger evidence than that against my hypotheses!
Looking further into the future is risky. Conceivably new technologies could price fossil fuel energy out of the market, in which case CO2 emissions might drop right off the Keeling curve. Or the permafrost might melt and dwarf the impact of increasing CO2.
But if neither of those things happen, and the Keeling curve stays on its predicted track, then I would predict continuation of the green curve in Figure 2, for two reasons.
1. Because the causal link between CO2 and temperature is well understood (pace those who insist otherwise).
2. Because even if we’d never heard of CO2 we’d still have this separation of multidecadal climate between Figures 1 and 2 into an oscillating component and a rising component, whose upward-curvature has continually been getting steeper and shows no sign of abruptly turning into a downward curvature. Those who claim 2000-2010 proves otherwise are ignoring SOL in Figure 11, which accounts for the pause in 2000-2010. One decade gives no information at all about multidecadal climate, which is the subject of this poster.
Vaughan Pratt | December 7, 2012 at 7:50 pm | Reply
“But ten years, it strongly suggests that 2010-2020 (an odd decade since its 3rd digit is 1) will trend up, very likely strongly. Reasons:”
Let me boil those reasons down for you: numerology.
Incredible.
Are you a fan of bible codes too?
I should add that anyone who can separate multidecadal climate defined as F3(HadCRUT3) into the sum of an oscillating component and a concave-downwards trend (the opposite of what I called Observed Global Warming which is concave-upwards) will have the immediate attention of a lot of people.
The whole idea that multidecadal climate is something that can be so precariously defined reveals an academic mindset in the extreme. Those of us who insist that geophysical processes need to be carefully observed and analyzed incisively without precious preconceptions can only smile at such hubris. I’ll say nothing more here..
Having read this twice, my faith in climate models, already negligible, managed to sink even further.
The purveyors of climate models have a product to sell and obviously seek to protect their own jobs/careers. I am certain you can model some of the factors affecting the Earth’s climate accurately, but they are dwarfed by the number of factors about which we have little understanding, or whose existence we have not yet even recognized. The modellers want you to think otherwise and that there is no GIGO or doubt in climate science.
Climate modellers can be relied on to be shrill in defense of their ‘beautiful creations’, using derision and sneers as their principal defense.
Like an increasing number of people, I deeply resent these models, which are responsible for the hugely wasteful and expensive economic decisions taken by our gullible ‘political elite’, who are stupid enough to be taken in by their highly dubious projections.
Watts et al. demonstrate that when humans alter the immediate landscape around the thermometer stations, there is a clear warming signal due simply to those alterations, especially at night. An even more worrisome result is that the adjustment procedure for one of the popular surface temperature datasets actually increases the temperature of the rural (i.e. best) stations to match and even exceed the more urbanized (i.e. poor) stations… the adjustment process took the spurious warming of the poorer stations and spread it throughout the entire set of stations and even magnified it.
~John Christy, EPW Testimony (1 August 2012)
Christy is a professed Christian. That’s an automatic fail in warmist circles.
Maybe conversion to heathen might be a great career move.
A couple things I did NOT know about Christy but I do now.
1) Christy was a lead author in IPCC 2001
2) His doctoral thesis advisor was Keven Trenberth
Politicians are not stupid for embracing global warming hysteria. It represents a vast untapped tax base able to pay a generous salary and retirement benefits for a million bureaucrats. Even better, no one expects to see any results from the inestimable taxing and spending for the war on global warming for 50 years. Politicians are generally unaccountable to begin with but no accountablility for 50 years is a dream come true.
Peter: re “gullible ‘political elite’”. I don’t concur. Try fitting “money” and “power” as missing variables. All is revealed.
You are obviously correct in many instances, but there are many gullible politicians who have only lived their lives in the political, as opposed to the real, world. These people will believe whatever is trendy and/or what their spin doctors tell them they should believe.
Money and power are the obvious incentive for most politicians, but given the apparent chance “to save the world” as well, and in full view of the public, then that’s the icing on the cake. Then, of course, there is the subject of finding new ways to raise tax revenues.
Anyhow, the point is this: the general public is constantly being told it has “to save the world” by self-appointed elites (environmental and political) by digging deep into its own pockets Why? Because of the ‘predictions’ of highly flawed and dubious climate models, most of which have a problem in making accurate hindcasts.
Whatever your opinion of computer climate models, you have to recognise they are mostly produced by people interested only in the self-preservation of their own comfortable lifestyles. So, whatever results the paymaster wants, the paymaster gets. And the paymaster almost always wants more tax revenues, but he/she also wants you to feel good – hence “saving the world” – about paying them.
Peter Miller. Agreed on your points of altruism (save-the-world) and self-interest. (Strange bedfellows). Over on the post “Should scientists promote results over process?”, there is little choice except integrity of Process. Once the “boss” (UNFCCC) defines the objective, it is little wonder that the worker-bees find justification in their results. But that is not science.
[Article 2 of the UNFCCC charter (1992) sets the objective of stabilizing greenhouse gasses. (United Nations Framework Convention On Climate Change). http://unfccc.int/resource/docs/convkp/conveng.pdf ]
You might find this of interest (from 2008): “The Politics of ‘AGW'”. It reviews various schemes for political profit from AGW. Bottom line, the schemes are very similar to the “Turnover Tax” used in the former Soviet Union, and deliver control of ~70% of our energy supply to bureaucrats. Nirvana at last: control over the means of production.
http://solarcycle24com.proboards.com/index.cgi?board=globalwarming&action=display&thread=192
Mr. Peter Miller, I think the ‘public’ has been gullible, the ‘political elite’ are sociopaths and the question of our stupidity as a nation has not yet been fully addressed.
http://rt.com/usa/news/surveillance-spying-e-mail-citizens-178/
However our emails remain in storage for their future use. At no cost too; you?
JC comments:
I have not looked at this in any detail.
Very wise decision.
Vaughan Pratt
Up-thread I have asked you some questions to be able to understand what you’ve written better.
These are not “loaded questions”, so I would be thankful for a response.
The final question was also not intended to be “loaded” (although it might sound that way), but it is (for me) the most important, so I will repeat it:
Was the intent of this study to end up with the underlying exponential warming curve or did that just happen after all the noise was filtered out?
Thanks for a reply
Max Anacker
Sorry, Max, I was at AGU all day and just getting around now to answering the responses to my post, including your earlier comment. Let me know if you feel I didn’t do it justice.
There has been much discussion on this blog about uncertainty, but none in the comments above that I noticed in a quick read. Is it warranted to reproduce graphs like those shown without confidence limits/error bars?
hillrj: There has been much discussion on this blog about uncertainty, but none in the comments above that I noticed in a quick read
I, David Springer and Dixie Pooh have commented on the risk of error with this procedure. The lack of error bars does not come close to describing it. The procedure could produce very small calculated error bars and still produce a bogus result.
There is a primitive engineering rule of thumb that errors must add or multiply. If some procedure starts with HADCRUT3 with known errors then any result calculated from it must have at least that range of error or more. If the procdure produces very small calculated errors (ie smaller than the input data) then it must be suspect on thos grounds alone..
hillrj: If the procdure produces very small calculated errors (ie smaller than the input data) then it must be suspect on thos grounds alone..
On that we agree.
I claimed an R2 of 99.98%, which might sound like it should be convertible into a fantastic error bar. This is easily refuted by fitting the top of a gaussian to the top of a sine wave, or vice versa (depending on which one you propose to extrapolate from).
They are virtually indistinguishable, with an extraordinarily high R2! Yet they evolve in very different directions.
This makes the point that a high R2 cannot be taken as an indication of certainty. No way, Jose!
Yes. The curve you obtained from the dubious sources and methods closely matches a zillion other unrelated curves. It’s therefore meaningless. Can’t you figure out something productive to do in your dotage?
With a millikelvin in the title they may be hard to see :)
“Error bars ? To god-damned hell with error bars! We have no error bars. In fact, we don’t need error bars. I don’t have to show you any stinking error bars, you god-damned cabrón and chinga tu madre!”
Vaughan Pratt, I do hope that you stop by and respond to our comments. Mine are a little indirect, but in concordance with the more direct criticisms of David Springer and Dixie Pooh.
Sorry, I was at AGU (same excuse as Judith, more or less).
No apology necessary. You have dropped by.
The graph with a rising warming curve through time seems to correspond pretty well to the one swanson and tsonis found:
http://i52.tinypic.com/14cbgwh.png
Excellent point. All sorts of mechanisms could account for a nice smooth warming curve like Figure 2. Do you have a suggestion as to which one to prefer?
I prefer the manufactured curve invented by the producers of the HadCrut data set. There was nothing remotely like a global temperature sensing network in the late 19th and early 20th centuries. Prior to 1979 there was no means of obtaining a reliable global average temperature yet you insist on an accuracy that your initial data cannot come close to supporting. Garbage in, garbage out. Write that down.
I’ve downloaded the Excel spreadsheet.
I’m impressed by its beauty and clarity! :-)
Thanks, Gene. Usually I program in LISP, C, C++, and MATLAB, this was my first attempt at programming in Excel. Avoiding VBA (so that all macros would be signed by Microsoft) made it additionally challenging.
I appreciate all the effort that Dr Pratt has put into his theory and it is well presented.
But as a lay person, I just can’t believe in these cycles:
They just seem contrived. Its as if someone started of with the premise that the fluctuations seen in annual temperature averages follow a cyclical pattern. Whenever the first model is contradicted, another one is superimposed on it to get the desired results.
This has nothing to do with warmists or skeptics, because there are many in both camps that use these cycles to “prove” their point.
The sheer complexity of the model involving all these cycles means that they can’t be validated without 1000s of years of data (which is not available).
For instance, if you were to carry out an opinion poll on an election, involving 2 or 3 main candidates (or parties), you would need to sample at least 1000 people just to get a meaningful result. (That is the number which is always aimed at in these surveys.) But these combined cycles are so much more complex that several thousand years of results would be needed to verify them.
To me, the temperature graph appears to have just taken a random walk.
Mark B
Link to Beenstock statistical analysis of temperature record
http://economics.huji.ac.il/facultye/beenstock/Nature_Paper091209.pdf
Max
Mark B (number 2), all I’m trying to do is succinctly describe the last 162 years of global temperature date. Unless you have a more succinct description, namely one with fewer than 9 parameters, then I don’t understand your complaint.
Vaughan, I think you are actually trying to describe the last 162 years in terms of cycles and harmonics. It seems to me that you are looking for a mathematical explanation for every tiny variation in temperature. In reality we have things happening (apparently at random) such as volcanoes erupting, snow happening to fall in places where it won’t melt as quickly (causing albedo effects), unusual weather patterns etc.
When I look at the original graph, I just see randomness. If I run a random walk on my spreadsheet, there will be many examples of a temperature graph like the one you have shown. And just as many showing the same range of fluctuations, but in a downward direction.
Furthermore, with all the apparently random events happening, which could effect climate/weather, it seems unlikely, to me, that the temperature would slavishly follow preordained cycles.
As there is no reason to believe that such cycles would effect the climate in the short term, why believe in them? To verify your theory you would need longer than 162 years of data. So why make a guess? Wouldn’t it be better to say that we just don’t know, due to the lack of data?
I do appreciate that you have taken the time to reply to a non scientist. I realize that there is a lot that I don’t know. I am just calling things as I see them.
@Mark B (number 2): I think you are actually trying to describe the last 162 years in terms of cycles and harmonics. It seems to me that you are looking for a mathematical explanation for every tiny variation in temperature.
That would be a hopeless task using what we know today. In Figure 11 of my poster, which represents HadCRUT3 as a sum of three curves, the many tiny variations in temperature you’re thinking of are in SOL and DEC, neither of which I try to explain mathematically.
When I look at the original graph, I just see randomness.
Yes, certainly. My technique is to separate out the randomness and put it in SOL and DEC, leaving behind MUL (for multidecadal climate) as the only part of climate I want to describe mathematically. Do you see “just randomness” in MUL?
I was able to separate MUL into an oscillation and a curve with no inflexion points (a point where a car following the curve has its steering wheel straight ahead). The laltter bends upwards, which is a very bad sign. To prove that things aren’t really that bad one would have to separate MUL into an equally convincing oscillation and a curve showing some sign of bending downwards in the near future. I doubt if this is possible.
If I run a random walk on my spreadsheet, there will be many examples of a temperature graph like the one you have shown. And just as many showing the same range of fluctuations, but in a downward direction.
The difference is that the downward curve won’t arise from any known theory. The green curve in Figure 2 is in outstanding agreement with the well-understood physics of radiative forcing by CO2.
If you extend the graph backwards 200 years using your constructions, what happens?
My suspicion is nothing good related to the best observations we have. And what does that say about any predictive power it may have?
If you run the same analysis from 1700 to present, do the results results completely change?
All these numerical constructions that assume the big bang was at year ~1850 are a bit disconcerting. All these will yield an infinite increasing trend of some sort if you want them to. It’s too open to confirmation bias to be reliable, I give it about a 1000% chance that this analysis was tuned iteratively and significantly. Did the author work out his methods independent of the data? Not likely. Torture data until exponential drops out? Be honest with yourself.
Frequency analysis of temperature data just seems inappropriate if you ask me. It may help identify some cyclical signals buried in the noise, but using it as a tool to identify an overall trend is risky business. The typical first step in frequency analysis is to remove any underlying trends, else they corrupt the analysis significantly. Hanning / Hamming windows do this, etc.
Frequency analysis of temperature data just seems inappropriate if you ask me.
If you have a more appropriate analysis then you win. Go for it!
Its worse.
Hadcrut and GISS are not temperature series. Everybody keeps forgeting that.
For some bizarre reason when hansen and Jones did their first series they decided to add together
1. The air temperature over land.
2. the surface sea temperature.
Adding SST to Surface air temperature doesnt give you a temperature of anything. it is more properly understood as an Index. Now, provided you take the index in the same way you can get an indication of the state of the climate from the index, but you do not have a physical metric.
One could use MAT ( marine air temperature) instead of SST. That way you would have a measure of the atmosphere at a constant altitude. Interestingly, the database that contains SST also contains MAT, basically the same amount of data.
The other thing is that SST and SAT have different variances and different uncertainties and they respond with different lags, so I UNLES Vaugh does some work with synthetic data FIRST to prove that the methods he applies to this data actually work, I’d say the signal analysis is flawed from the start since the “signal”, the temperature curves are not really physical metrics.
While I have no doubt in his abilities its clear to me that he didnt do the basics. Define a method. Show that the method works to recover a signal using synthetic data ( where the truth is known ). Also, the failure to.
A) test results WRT choice of dataset ( Hadcrut versus, others, other solar forcing datasets)
B) hold out data for verification.
Make his result an interesting start, but thats about it
Is that much worse?
For all practical purposes all temperature averages are just indexes. Temperature is an intensive variable, not extensive. The average temperature has no more influence on any particular matter than some other temperature index.
What we hope to have is an indicator that is
– strongly correlated by significant variables
– allows for accurate enough determination
– is not unnecessarily volatile
– allows for construction of as long time series as possible.
It’s by no means obvious that any “more natural” average temperature would be better than some less natural one. There are obvious advantages in the possibility of calling the number “global average surface temperature” or something like that, but that’s not essential for it’s value for science.
It’s quite possible that some temperature index defined slightly differently from the present ones would be better by the criteria that I list above but I don’t know what the best index would be.
thats an interesting defense. I think im
going to agree with you. I would still like to see the effects on spectra from adding and averaging such different quantities
We agree then, averaging temperature isn’t physical. So what do these averages have to do with physics?
Brian,
The problem is you have a system ( the ‘climate”) that is multi dimensional. It is useful to a metric that indicates change in the system, this will of necessity be a lower order metric. Like temperature versus time.
Temperature, is selected for a variety of reasons, but there are probably better metrics like OHC or energy imbalance.
Don’t buy it Steve. As Pekka stated these average are some sort of index. So is phone book, so maybe we should just average the phone numbers in each thermometer location and use it as an index.
Brian,
There’s nothing basically wrong with indexes. Suitable indexes are as good and some indexes probably better for following the warming than the true average temperature at some near surface altitude like 2 m.
The main point of my comment is that many different temperature based indexes are essentially as useful and that several existing time series have basically the required quality. Some of them span, however, a too short period for being as useful as those spanning a longer period are.
Pekka
I understand what you are saying. I’m saying if increasing temperature means “warming,” what does increase “index” mean? Both you and Steve, in my opinion, are thermodynamically minded people. The earth isn’t in thermodynamic equilibrium, so there is no single temperature for the whole earth. Just because you average a bunch of numbers doesn’t mean the average means anything at all. Try making sense out of averaging speed limits.
Tom Scharf: If you extend the graph backwards 200 years using your constructions, what happens?
Which graph? If AGW, that’s essentially perfectly flat before 1850, based on hindcasting preindustrial CO2 to a constant 287 ppmv. We know that’s not exactly true because 2250 years ago it was 284.7 ppmv according to the Vostok ice cores. The point however is that natural temperature fluctuations due to other causes, particularly the ocean oscillations, will dwarf those attributable to CO2 fluctuations, which is what AGW accounts for. Hence for all practical purposes AGW may as well be modeled as perfectly flat for the period 1650-1850. There are no known fluctuations in recent (last millennium) natural sources and sinks of CO2 that are remotely as large as the growth in CO2 of the last half century.
All these will yield an infinite increasing trend of some sort if you want them to.
Quite right, and I don’t claim that CO2 will continue to follow Hofman’s raised-exponential law forever. In fact the doubling time for anthropogenic CO2 seems to be increasing a bit in the last couple of decades, confirming your point, though not enough for your point to save the world in say 2050.
I give it about a 1000% chance that this analysis was tuned iteratively and significantly.
Right again. Welcome to parameter estimation. Do you have methodological or philosophical objections to estimating parameters from data?
The typical first step in frequency analysis is to remove any underlying trends, else they corrupt the analysis significantly.
That would make sense when the only analysis tool you have is Fourier analysis, where every signal is expected to be a sum of sine waves and any trend present throws the analysis into chaos. But if you have Laplace transforms and/or wavelets in your toolkit the order becomes less important. In the case at hand the difference made by removing the AGW trend or the SAW oscillation first is in the least significant bit of a double precision floating point number, i.e. none at all.
Hanning / Hamming windows do this, etc.
A Hamming window is just a brute force way of turning an infinite impulse response (IIR) filter into an FIR filter to obtain some temporal locality. When applied to Fourier analysis, which I’m guessing is what you have in mind, it’s rather a procrustean bed. Better to go the whole hog and use wavelet theory in its full generality. This is how my analysis looks at the situation.
Two fundamental issues severely damage the credibilty of Pratt’s interpretation that a bona fide global warming trend has been revealed by his simple filters:
1. The naked assumption that HADCRUT3 represents an unbiased estimate of GST, as if that index was free of UHI effects on land and had fully adequate spatio-temporal coverage over the oceans from1850 to present.
2. The manufacture of low-pass values throughout the entire time-interval of the raw data, as if properly applied boxcar filters did not necessarily truncate the output near both ends of the available time series.
Based upon results of more rigorous filtering, I also suspect something amiss in the construction and removal of the “quasi-sawtooth.”
This work is neither credible physical science nor proper signal analysis.
Compared to what? I eagerly await your more credible physical science and more proper signal analysis.
Well I await more credible physical science. In the meantime what properly can be said about ‘signals analysis’?
For starters, cross-spectrum analyses between long concurrent time-series of atmosphericCO2 concentrations and of total enthalpy metrics (not just hybrid temperature indices) on a global scale would provide an unequivocal indication of the coherence–or lack thereof–and phase relationship between the putative cause and the observed effect. On the very limited scales that such analyses have been performed, due to limitations of bona fide measurements, the cross-spectral results militate strongly against any very intimate physical relationship in any frequency range.
What you have done here is largely a mathematical exercise in multi-parametric curve fitting (reminiscent of von Neumann’s quip that with 5 parameters he could wiggle the ears on a mythical elephant), with but conjectural reference to unproven AHH theory.
With a bit more leisure now that AGU has ended, let me comment more carefully on:
@John S.1. The naked assumption that HADCRUT3 represents an unbiased estimate of GST, as if that index was free of UHI effects on land and had fully adequate spatio-temporal coverage over the oceans from1850 to present.
I made no such assumption. Like many other commenters you’re reading things into my poster that simply aren’t there.
If it turns out that HadCRUT3 bears no relationship to actual global temperature then my work will have been merely a (possibly) interesting theoretical exercise. To the extent that pessimists such as yourself have exaggerated such biases, others may find my work relevant to global temperature. I claim nothing more than that it is relevant to HadCRUT3 itself, warts and all. I will have to leave it to others to quantify the biases etc., not having the requisite resources myself. As an example Berkeley’s BEST project to such an end is a massive undertaking.
2. The manufacture of low-pass values throughout the entire time-interval of the raw data, as if properly applied boxcar filters did not necessarily truncate the output near both ends of the available time series.
That’s a fair point. Please avert your eyes from the first and last decades of MRES (figure 6 of the poster) and consider only the rest. (I do so myself and should add a paragraph somewhere advising others to do so.)
Based upon results of more rigorous filtering, I also suspect something amiss in the construction and removal of the “quasi-sawtooth.” This work is neither credible physical science nor proper signal analysis.
Computer programs today can generate better critiques than first-year grad students when asked to referee a paper. I’ll play safe and guess you’re not a first year grad student. Either way your paragraph there is not exactly what I’d call incisive.
How charming of you to guess that!
I like this. The backbone of this final curve is two assumptions. (1) that CO2 sensitivity is a log function with 2.83 C per doubling, and (2) that man’s contribution to CO2 is a growing exponential with a doubling time of 28.6 years that fits the Keeling curve. The fit gives credence to these assumptions. It is fortuitous that other factors are not distorting it. We know other GHGs are also increasing, for example, and aerosols and solar forcing are changing, but these seem to be absorbed in the low-frequency saw-tooth together with ocean variations.
The interesting extrapolation graph (hidden in the bottom left) shows 4 more degrees of warming and CO2 levels over 1000 ppm by 2100 if the manmade exponential use of carbon continues (which is pessimistic).
Jim D | December 4, 2012 at 10:14 pm said: ”I like this. The backbone of this final curve is two assumptions. (1) that CO2 sensitivity is a log function with 2.83 C per doubling”
Jimmy boy: ”doubling ZERO by two, or by 10, or by 100, is still ZERO!!! What you like, never had anything to do with the reality; because Vaughn Prat is your Tudor / Brainwasher,…
I agree with Jim D that naive extrapolation of carbon is pessimistic. Inspection of recent CDIAC data on carbon emissions shows that it’s been falling off since the mid-1970’s, relative to the high values it reached between 1870 and 1970. Some of this could be accounted for by the increasing cost of fossil fuel energy, some by the increasing awareness of its hazards, and there may be other factors.
Forecasting the future is not the same cakewalk as hindcasting the past.
This was my much more modest attempt:-
Top Temperature anom and CO2 (Keeling and then estimated based on calculated fossil fuel consumption).
Middle Natural log of [CO2] vs Temperature anom. Th best fit slope give a climate sensitivity of about 2 degrees for a doubling of CO2
Bottom. What temperature looks like if we subtracted the effect of [CO2].
http://i179.photobucket.com/albums/w318/DocMartyn/LNCO2vstemp.jpg
I am so not worried about 560 ppm Co2.
I am so not worried about 560 ppm Co2.
What, me worry? (TM)
Somehow life on Earth managed to survive much higher levels of CO2 than that. Perhaps by thriving on it, perfectly plausible.
Mass extinctions aren’t so dramatic when the climate changes gradually.
The problem comes when you give the biosphere only a century or less to adapt to some dramatic change.
Especially if the change is global. Mount St. Helens recovered within a decade, but the change was extremely regional, allowing species to move in to the changed area quickly.
When a Mount St. Helens type change hits the whole planet, where are the replacement species going to move in from?
That’s a recipe for reducing biodiversity far more effectively than if you give Earth’s species 10x more time to adapt.
This time it really is different.
Disclaimer 1: this impact might not happen for all sorts of reasons, including the intervention of God.
Disclaimer 2: I’m not wearing my scientist hat, just partying on with everyone else.
‘This time it really is different.’
Yes it is so much more difficult to respond to a change in CO2, which will give rise to a 2 degree doubling of ‘average’ global temperature, from 1750 to 2050, compared with an ELE that happens in hours.
I understand bits of Scotland when from warm than present to being underneath a glacier in less that a century.
Let me put these odds things about the future in a perspective you can understand; the chances are that you will die of heart disease, cancer, lung disease or dementia. Each of them is going to make you last 6 months unpleasant. You will not witness any event that can be attributed to CO2 increases in the atmosphere in all you life.
@DocMartyn: You will not witness any event that can be attributed to CO2 increases in the atmosphere in all you life.
This point is readily conceded by those pointing to the increases in frequency and violence of storms: no single storm can be blamed on CO2.
It’s like the proverbial frog in the pot being boiled with the stove set on high: convection mixing hot water coming up from below with cold water at the top results in more frequent and more violent fluctuations in temperature than would be observed with the stove turned way down, but the frog cannot blame any single fluctuation on the stove being on high.
Jim D
I’d agree with you that “it is an interesting graph”, but even Vaughan agrees that the exponential curve is most likely pessimistic (i.e. there will be less that 4C warming by 2100).
Exponential atmospheric CO2 growth rate will most likely not increase beyond the recent ~0.5% per year, when population growth rate is expected to decrease to less than one-third of the recent past rate, even if per capita use of fossil fuels increases by 50% by 2100.
This would get us to 600 ppmv by 2100 (all other things being equal), around the same as IPCC “scenario + storyline” B1 or A1T, with warming by 2100 of 2C (rather than 4C as predicted using the exponential curve).
Max
This 2 C would be the amount above the current or 2000 temperature. To hold it to 2 C above preindustrial, we would have to keep below 450 ppm. Some consider that 2 C mark as already a limit to be avoided, but we should reach 450 ppm by 2040 just assuming a linear CO2 growth, which is a slowest growth estimate.
There has been very little CO2 impact on temperature but extrapolation is absurd. Climate is not linear and to continue to pretend that it is – is profoundly idiotic.
Vaughn Prat: ”It would seem therefore that rising climate since 1850 is a lot more complex than can be explained by our rising CO2 emissions”
”.rising climate” == climate doesn’t rise, you idiot! If you are ashamed to say: ” rising the phony GLOBAL temperature” – just admit it!!!
con #2: ”However the three decades 1910-1940 show a similar rate of global warming”
A#2: you and nobody else knows what was last year’s GLOBAL temp – you are driveling about 1910-1940…
con #3: ”the poster calls it Observed Global Warming, color-coded green”
A#3: was it ”observed” from the top of the hill, or, from your future jail cell?
.Vaughn, instead of an EXTREME Warmist; you are starting to sound as a Fake Skeptic (as inbedded Warmist in the Skeptic’s camp) What did they do to you; did they promise you more rip-off money – or are you starting to run with one leg on each side of a barbed wire fence… will get even more painful!!! CRIME SHOULDN’T PAY!!! Those ”loaded comments” of yours; will earn you another 10years!
P.s. the therm ”decadel” was invented, because I was ridiculing how can they see 0,003 degrees differences between years -> they invented ”decadel” hopping that: the nutters cannot realized that: zero multiplied by 10, or by 100, is still zero. It’s only kiling and screaming on the way to the confession box / under oath!!!…
Any analysis using smoothed time series data over a relatively short time scale wouldn’t have much predictive value IMO and it would also be wise for Dr Pratt to state his assumptions about the use of HadCrut3.
Retro curve fitting is a piece of cake if you massage everything enough and that’s what has been happening with the GCM’s that are now being used to drive Govt climate policy.
I am sort of smiling here, maybe Vaughn Pratt is just testing us wit this !
Not me, but if anyone wants to grade this as a test, feel free. By all means grade on a curve.
This is the wit from above. I think it is a doubled edge question.
“With enough parameters one can make any two curves equal to within any desired precision. The judgement to be made here is whether the nine parameters used here have any chance of achieving a comparably accurate fit on random data in place of HadCRUT3. This was an objection raised to Mann’s methodology, and I would be interested to see if it applies here.”
Thank you for posting this here. Vaughn Pratt
Could you fit a random data to this, it seems difficult, so many dependent variables. I don’t know perfectly well, that’s why I ask.
I appreciate that you are willing to post a best estimate publicly with the supporting documentation for all to see.
For 162 years with a 21-year filter, by Nyquist I figure 2*(162/21) = between 15 and 16 parameters. I used only 9 parameters and got an R2 of 99.98%. Go figure. (I asked Persi Diaconis this and he thought of the top of his head that I was ahead of the game, but a more careful calculation is in order.)
Dr. P,
I think this is an important fact for folks to take note of. Personally i’d make more of it ( be clearer ) than you were in the poster. (yes space is limited ) but it really switched around they way I was looking at the work
Thankyou Professor Pratt for posting this. I will attempt to provide some skeptical but I hope constructive comments. I apologise I have not had much time to study this, and have not been able to play with the spreadsheet. My perspective on this is that I trained as a physicist and have some experience of modeling two-phase fluid dynamics. It has always seemed to me futile to try to predict long term climate trends with GCMs when much of the physics such as temperature feedbacks is not well understood. The starting point should be simple physical models backed up by empirical evidence. So I am initially sympathetic to your approach.
1) Unless I am misunderstanding you are not using a physical model of multidecadal cycles. You are saying the temperature data can be fitted by an exponential (modeling AGW) plus a “sawtooth” (harmonics thereof, with 6 free parameters), representing multi-decadal effects plus periodic terms with period less than 22 years that are smoothed away as noise.
There are many ways to decompose a function. As a power series, as a Fourier series, etc. That does not necessarily reflect physical causes. It is not clear to me how well this decomposition into an exponential plus periodic terms is constrained by the data. Would it be possible to do it differently? For example your “sawtooth” is pretty much flat from 1990 to 2000, leaving all the warming to be accounted for by AGW. That accords with the IPCC view that “most” of the late 20th C warming is due to AGW. But one possibility much discussed on this blog is that a substantial part of that was “juiced” by multi-decadal cycles. I am not clear if you are saying you can show that is not the case, or if you have effectively assumed it isn’t by your choice of sawtooth parameters.
You do say the SAW and AGW parameters are obtained by least squares. You don’t describe the method, I guess that would be in the spreadsheet. I find it surprising, with a function like your “sawtooth”, if there is only one global minimum when varying all the parameters. I would expect you would need to use something like simulated annealing to find mutiple local minima in the least-squares measure. Then we need to know how much better your fit is than the others. (Even if there is a global minimum we would still want to know how “flat” it is, i.e. how fast does the least squares measure change around that minimum).
I don’t want to seem to accuse you of taking the largest possible exponential component and then choosing the sawtooth parameters to fit whatever is left, but what would it look like if someone did that? What are the physical arguments for the parameters you have chosen?
You say the “sawtooth” has a possible physical explanation as the effect of two seismic events at the core-mantel boundary. That’s a lot of heat. Could such events produce heat that is globally distributed or would that be localized around the event? And would they not be detectable in the historical record as earthquakes? I have not heard of this phenomenon and I don’t see a reference. Physical evidence of these events (other than their assumed heat signature) would certainly support your model. In the absence of such evidence, there may be many other ways to model multi-decadal cycles that would leave a substantially different AGW component behind.
2) The most obvious feature of your figures 2 and 3 is the divergence between AGW and F3(DATA-SAW) since about 2000. One of the biggest discussion points on AGW recently is the near 15-year flattening of the land surface temperature curve. You label this “End-effect artefact of filtering”. I have not followed how that artefact arises under your analysis but I will assume you are correct. Even so, if you are asking us to ignore the discrepency since 2000, I think that still means you can’t model the last decade or so of data. For me at any rate, it is the discrepency between prediction and reality of the last decade-and-a-bit that provides the strongest argument there is something wrong with the AGW “consensus”. You will not do much to close the gap between “warmists” and “skeptics” if you can’t address that.
3) Your AGW model is based on the Arrhenius logarithmic model of the effect of CO2 on temperature, and the exponential Hoffman model of CO2 emissions. The Hoffman model may have been reasonable until now, but is it likely to continue until 2100? Exponental growth never lasts very long. Population growth peaked in the late 1980s in absolute terms. With population growth slowing CO2 emissions will surely cease to be exponential, even if no special measures are taken to reduce them. That would reduce the estimate of 2100 temperature.
4) You use a constant value for the oceanic pipline delay. The main “warmist” explanation for the recent hiatus in land surface warming is that the heat is going into the oceans. If that is true it implies the pipeline effect is complicated. The atmosphere/ocean coupling must be stronger than assumed. The delay may be reducing. Or it may be cyclical. In either case the value that best fits the period up to 2000 will not be representative of the next century. Increased warming of the oceans will again reduce the estimate of land surface warming by 2100.
3) What would happen if you included a linear term to model the “rebound” from the little ice age? (Or is this supposed to be included in your sawtooth term?) I guess the effect of a long-term linear term would be to reduce the amount of warming attributed to AGW.
4) I think your claim to 99.98% accuracy is going to cause you unnecessary grief. I do not think you are claming to fit the actual data to that accuracy. It is the fit between the smoothed data and your AGW model you are talking about. But if you smooth data until it looks smooth and then fit a snooth curve to it you will get a pretty good fit. It is not as impressive as it sounds. As a physicist I would expect you to report the fit of your model to the actual data and maybe compare it with other models.
In conclusion, I don’t want to sound too negative. I think this kind of analysis is valuable, and I think it demonstartes there is an alternative to the GCMs. But unless your nine free parameters are very tightly constrained (and I have missed that) the reaction from skeptics is likely to be that it is an exercise in confirming the IPCC “concensus”. I would be interested to see a range of results based on a plausible range of the free parameters, constrained where possible by physical models of the underlying phenomena.
gareth | December 5, 2012 at 2:20 am said: ‘Thankyou Professor Pratt for posting this. I will attempt to provide some skeptical but I hope constructive comments”
gareth, .you and ”daily planet’ are capable of providing ”skeptical comments” as much as cane-toads can provide wool. For the 2 of you + Pratt, genuine ”skeptical comments” are a nightmare = you can’t provide one, you can only try to silence those. Now is obvious that: all 3 of you are sucking & sponging from the same suffering taxpayer .
Rubber-stamping / dignifying Vaughn’s LOADED post with crap; Vaughn should have already provided washing pegs, for people’s noses; before starting to read it, now you Gareth &daily planet are adding extra and string up Vaughn’s witchcraft doo-do. Is that what ”peer reviewed” means for the Warmist EXTREMIST, as the 3 of you?!?!?!
@geronimo: I have to ask the daft question are you saying that having filtered out those natural variations you have found a strong warming signal because the only warmer left is CO2?
A “warmer” in what way? For example if I turn a dial on my radio to tune in a different station, was it the mere rotation of the dial that did the job or is the dial merely a means of controlling a variable capacitor that does the real work?
CO2 is properly understood as a control knob in that sense. We know quantitatively, albeit roughly, from the work of Tyndall in the 1850s the extent to which CO2 itself, with no feedbacks, blocks the passage of thermal radiation; these days we infer this much more precisely from the HITRAN tables of spectral absorption/emission lines. We also know how much CO2 is in the atmosphere. Much less certain is how much assistance CO2 gets from feedbacks.
A closer analogy than a radio knob is vacuum assisted power steering on a car. The steering wheel exerts some force on the front wheels but greatly amplified by the power assist. HadCRUT3 is like an instrument for measuring the force applied by the power-assisted steering directly to the front wheels: you can’t infer just from that the force needed at the steering wheel, which is a mere fraction of what’s needed when the vacuum fails.
Without that sort of information about division of labor in observed global warming, all I can say is that there is an extremely good correlation between observed global warming and the warming predicted by the greenhouse hypothesis. That doesn’t prove the greenhouse hypothesis, it merely makes it a contender. There are other hypotheses, for example Ferenc Miskolczi’s hypothesis that water vapor does the work. If his hypothesis had a comparably straightforward account showing an excellent correlation between some global temperature dataset and another observable (his alternative to CO2 as the control knob) it would be a good contender, but so far Miskolczi has been unable to bring any clarity to his hypothesis. This in turn makes it hard to verify the soundness of its reasoning; at one point it incorporated the virial theorem that average potential energy is twice average kinetic energy, which however doesn’t apply at all to the atmosphere because the frequency of molecular collisions is many orders of magnitude too high for the theorem to hold.
@geronimo: if it [the odd-even-decade phenomenon] hasn’t got anything to do with AGW, what has it got to do with? And if you don’t know the answer to that question then there must be unknown unknowns lurking in the climate system.
If you look at the middle component of HadCRUT3 shown in Figure 11 of the poster, SOL, which is essentially all due to the influence of the Sun’s magnetic on both the Sun and Earth, you’ll see that it’s sufficiently synchronized with the decades since 1870 as to be able to take full credit for the phenomenon. Being roughly 21 years instead of exactly 20, it will drift out of phase on either side of 1870-2010 and in due course the phenomenon will resume with the opposite phase, with the even decades trending up more strongly than the odd ones, independently of whether the longer-term trend is up or down.
@geronimo: Forgive me if I’ve misunderstood what you were trying to prove, but thanks for sharing your data with the skeptics, it’s surely a good way of proving it correct if the “enemy” can’t find anything wrong with it.
I appreciate knowing that there are those on Judith’s blog willing to listen to both sides of the argument. This may not appear so to the casual observer because each side accepts their side’s arguments as reliable and the other’s not. This comes about from the natural tendency to judge logic not by whether the steps are sound but whether the conclusions fit the “known” facts. When there is agreement as to the facts this is a great way to debug an argument, but when there is not then you have to fall back on soundness of reasoning as a criterion for resolving the disagreement. I believe the latter could be done with greater care by both sides. (I was trained in both physics and logic, and although my original goal was a career as a physicist I ended up spending much of my research career on logic.)
Gareth, thanks very much for your detailed and thoughtful comments. Let me respond with your numbering.
1. Lot to respond to here. First, are there different decompositions? Excellent question. While I didn’t find any, mine is easily shot down by a better one, which I eagerly await.
For example your “sawtooth” is pretty much flat from 1990 to 2000, leaving all the warming to be accounted for by AGW
As Santer et al and others have pointed out, AGW is not a decadal phenomenon and as such can’t hope to account for the warming 1990-2000. This is due in part to this being an “odd decade,” namely one whose third digit is odd. You can verify at woodfortrees.org that every odd decade in HadCRUT3 since 1870 has trended up, and every even decade since then has trended down relative to the two odd decades on either side. Obviously this very interesting phenomenon has nothing to do with AGW.
Regarding the least-squares method I used, you correctly surmised that it found only a local minimum. Simulated annealing might find other local minima but with outrageous parameters. One of the main reasons for making my spreadsheet broadly available was to allow others to search for other minima. With such a minimum in hand one then can address the difficult question of whether its parameters are within reasonable limits.
Then we need to know how much better your fit is than the others.
That question is easy: to my knowledge it is way better, and if I am wrong about this then it will be easy to demonstrate this with a better model.
2. I have not heard of this phenomenon and I don’t see a reference.
Glad to hear it, yet more support for my sense that it’s an original hypothesis.
Physical evidence of these events (other than their assumed heat signature) would certainly support your model. In the absence of such evidence, there may be many other ways to model multi-decadal cycles that would leave a substantially different AGW component behind.
Fully agree.
The most obvious feature of your figures 2 and 3 is the divergence between AGW and F3(DATA-SAW) since about 2000.
That’s an apples-and-oranges comparison. You need to compare F3(AGW) and F3(DATA -SAW). F3 as currently constituted gives unpredictable results at the first and last decade.
3. (Will the exponential CO2 growth continue?) Excellent question. Quite likely not. It was a mistake for me to include the predictive slide at bottom left.
4. (your repeat of 3) The pipeline delay may well vary, though I guess that the ARGO data would tell us more about that.
5. The little ice age is out of scope for my analysis. I’m not sure I have to contribute to that area.
6. (your repeat of 4). But if you smooth data until it looks smooth and then fit a snooth curve to it you will get a pretty good fit.
Does your “pretty good” extend to 99.98% R2? This question is of great interest to me.
Dr. Pratt, thanks for coming on this blog to share your ideas, I’ve only scanned the document because of lack of time, so I have to ask the daft question are you saying that having filtered out those natural variations you have found a strong warming signal because the only warmer left is CO2?
If you are you then go on to say:
“Obviously this very interesting phenomenon has nothing to do with AGW,” about the cooling decades. Which of course begs the question from the ignorant such as myself, if it hasn’t got anything to do with AGW, what has it got to do with? And if you don’t know the answer to that question then there must be unknown unknowns lurking in the climate system. And if they are causing decades of cooling why can’t they, or other unknown unknowns, be causing decades of warming? Surely until you have the answer to these questions you simply have a graph showing correlation of warming with increases of CO2 emissions, don’t you?
Forgive me if I’ve misunderstood what you were trying to prove, but thanks for sharing your data with the skeptics, it’s surely a good way of proving it correct if the “enemy” can’t find anything wrong with it.
Must go deadline to meet.
Dr. Pratt
On decadal trending:
During the last 100 years or so, solar cycle period was on average 10.54 years, while theHale cycle is twice as long. This means that Solar coronal mass ejections CMEs in the even-numbered solar cycles tend to hit Earth with a leading edge that is magnetized north. Such CMEs open a breach and load the magnetosphere with plasma starting a geomagnetic storm .
Geomagnetic storms hit the Arctic, induce strong currents, disturbing the Earth’s field and feed back into the oceanic currents, releasing some of the stored heat during the previous cycle (with less geomagnetic input):
http://www.vukcevic.talktalk.net/Spc.htm
Oops, I clicked on the wrong Reply button, geronimo, with the result that my reply appears a short distance (which may widen with further comments) above your question, sorry about that.
A few weeks ago, links from another website alerted me to Vaughan Pratt’s earlier, stimulating contributions on the theme of the current article.
An in-page search for (rebound from) “LIA” &/or “little ice age” highlighted:
1. gareth | December 5, 2012 at 2:20 am |
http://judithcurry.com/2012/12/04/multidecadal-climate-to-within-a-millikelvin/#comment-273951
2. Vaughan Pratt | December 5, 2012 at 5:11 am |
http://judithcurry.com/2012/12/04/multidecadal-climate-to-within-a-millikelvin/#comment-273999
Gareth is correct that Vaughan Pratt’s model can be improved with attention to hard constraints. Suggestion for sensible parties: Be aware of Earth Orientation Parameters.
Reading more comments in this discussion suggests that most contributors will have to make substantial, concerted effort to deeply appreciate & understand gareth’s lucidly aware & eminently sensible suggestion about hard constraints.
A simple example of how the thought process looks:
Munk (2002) 20th century sea level enigma
http://www.pnas.org/content/99/10/6550.full.pdf
Accessible background:
Chao (2006) Earth’s temporal oblateness
http://www.earth.sinica.edu.tw/~bfchao/publication/eng/2006-Earth%E2%80%99s%20oblateness%20and%20its%20temporal%20variations.pdf
Fully agree, Paul. –v
@gareth: I trained as a physicist and have some experience of modeling two-phase fluid dynamics.
Sorry for overlooking this in my previous reply, Gareth, this is an important point. I’ll try to incorporate your response into an overall picture of these comments. I also doubt if I did justice to all your points in my earlier reply to you due to pressure of time, this will take time to sort out. In any event thanks very much for your very insightful input!
Vaughan
@Vaughan
Sorry to have dropped out of the conversation for a while. I have fingers in several pies at the moment. If I had spare finger I would download your spreadsheet and try out a few ideas (BTW I have found OpenOffice Calc to be quite up to handling non-toy spreadsheets, and faster than exel for very large ones, >50,000 rows. The macros are not always compatible)
I had also missed that you started out as a physicist. So I hope you will understand what I mean if I say that from my perspective what you have done is an interesting piece of maths but not (yet) physics.
If your analysis is correct then you have separated two independent effects: the AGW signal and a new mechanism whereby heat is transferred from the mantle to the crust, driving multidecadal climate.
But until there is independent evidence that the “sawtooth” components exist as physical effects, what you have done effectively is take the smoothed temperature data, subtract your preferred AGW model and show that what is left can be fitted by a 9-parameter model pretty good.
You asked if “pretty good” extends to a 99.98% R2. I don’t know how to calculate that theoretically. (It looks almost too good – as if you have enough free paremeters to fit whatever is left over) Personally I would model it. Produce some random data sets (with an underlying linear trend – there clearly is some real warming going on – or was until about 2000) until you get a few that look broadly like the observed data. If you can’t fit those at 99.98% R2 then you may be on to something.
As I said I do have some sympathy with this approach, which suggests new physical effects and is in principle testable. Far better this than running a dozen GCMs with funamentally different assumptions about climate feedbacks, plotting them on a graph and claiming that as a measure of the uncertainty in the behaviour of the real climate.
Thanks, Gareth. Currently I view F3 as too low a frequency and 9 as too many parameters: while not overfitting neither are they underfitting, which is where Fourier transforms stand.
My current plan is to double F3’s frequency (which will double the number of degrees of freedom in the image of F3 assuming the same SNR) while cutting back on parameters, maybe down to 6.
I may also try to improve F3 to get a faster rise from the cutoff frequency. This will further improve the number of degrees of freedom in the image of F3.
Underfitting understood as having fewer tunable parameters in the model space than there are dimensions in the observation space, consistent with a good fit of the model to the data, ought to be a powerful argument for any hypothesis.
@gareth: (BTW I have found OpenOffice Calc to be quite up to handling non-toy spreadsheets, and faster than exel for very large ones, >50,000 rows. The macros are not always compatible)
Sure, 50,000 rows of trivial formulas, I can believe that. Anyone could implement a spreadsheet app that can do that much, and much faster than Excel if you skip Excel’s very time-consuming error-checking. Excel 2000 is way faster than Excel 2010 for exactly that reason.
Unfortunately that does not describe my spreadsheet, which has charts along with sliders to control parameters in real time. OpenOffice Calc cannot handle either charts or sliders.
Just this afternoon I installed Ubuntu 12.04 (“precise”) on a machine I just bought to try out my spreadsheet again with OpenOffice CALC (actually LibreOffice CALC, which is what comes with Ubuntu and which works a darn sight better than OpenOffice CALC speedwise, at least with my spreadsheet). My spreadsheet was still complete garbage: graphs not working, sliders inoperable, useless.
Maybe OpenOffice Calc can handle ten million rows of something trivial, but it is completely incapable of handling a spreadsheet containing anything to do with real-world problems like climate. Macros are not the problem, my spreadsheet contains no macros other than those needed for sliders to work: the sliders show up but don’t work.
It would be fantastic if OpenOffice could run this spreadsheet because then I wouldn’t be stuck having to use Windows to display it. Hopefully someday those working on LibreOffice will get it to work properly.
AGW was negative before 1972?
Yes. HadCRUT3 is a dataset of “anomalies,” meaning temperatures relative to some arbitrary index, in this case the mean temperature between 1960 and 1991. Since the mean of SAW is very close to zero the mean of AGW can be expected to track that of HadCRUT3 when averaged over sufficiently long periods.
I just note the continued assertion that you can get any desired precision with enough averaging of data items… and ignoring that the effect can only work on random error and can not work on systematic error.
So, for example, the conversion from Stevenson Screens to MMTS was accompanied by the observation of a ‘cooling bias’ in the MMTS, which was ‘corrected’. Except now we find that the real error was that aging Stevenson Screens get warmer. So a slow increase (“warming”) over the life of the Stevenson Screens that is an error gets ‘locked in’ via the ‘removal of the cooling bias’ of swapping to the MMTS.
That is a SYSTEMATIC error that will never be removed by averaging. So you can never have milli-Kelvin, or IMHO, even good partial Kelvin accuracy or precision in the historical trend data. And that is only ONE such systematic error. The dramatic increase in use of Airports (that are known to be warming) as percent of data introduces another systematic error term. Aviation increased dramatically from post W.W.II to now. Aviation thermometer are to record temperatures near the runway (where the wings are, and were density altitude determines if you fly or crash…) so they want to know how hot it is over the asphalt / tarmac / concrete.
There’s more, but you get the picture. Systematic errors in equipment splices, location microclimate, instrument selection (thermometer change over time to less volatile locations during a PDO / AMO 60 year cycle).
Gives a nice 30 to 40 year ramp up. That then suddenly stops. Unless continuously ‘corrected’ with added ‘adjustments’… When long lived rural non-airport stations data are observed, it does not show this warming trend. So what you have shown in your filtered data is the signal of economic growth, aviation growth, and urbanization; along with equipment changes and ‘corrections’ that go the wrong way.
But it makes pretty graph and the ‘milli-Kelvins’ is a nice touch… that makes it clear the concept of False Precision is being soundly ignored.
E M Smith said’
“I just note the continued assertion that you can get any desired precision with enough averaging of data items… and ignoring that the effect can only work on random error and can not work on systematic error.”
I have a similar argument with Mosh.
We have -as one example-loads of extremely dubious SST figures many of which are likely to bear littlle relationship to reality the further back in time or the more geographically remote the sampling location-yet somehow averaging all these figures together apparently enables us to know the temperatures of the worlds oceans to 1850 to fractions of a degree.
Yet well authenticayed observations of weather/climate are dismissed as ‘anecdotal.’
Seems to me that its the ‘four legs good two legs bad’ syndrome. Anything with a figure in is considered highly accurate ‘data’ yet anything comprising just words is barely worth looking at.
tonyb
Tony, your historical approach to climate study is appreciated. However, many of your anecdotal examples, although authentic, are not suitable evidence for suggesting that any climatic abnormality had occurred. The opinions being expressed are of general interest only, as one person’s opinion could well be negated by someone else’s.
Hi, TonyB!
up thread is an assertion of exactly the kind I’m talking about. That any data can be made more precise and accurate with enough averaging.
Sad, really. I learned in High School that you can’t fix really bad data that way. (Though you can remove random errors that way… IFF they are truly random in distribution…)
What is becoming particularly interesting to watch is how the “warmest ever” years keep being touted even as the world gets snowy and cold.
Snow returning to Kilamajaro. Snow in the UK. Cold and snow fairly strong in the S. Hemisphere this last winter (and N. Hemisphere last year… this year a work in progress as it’s only fall…) So the simple fact of ‘snow on the ground’ will be hard to dismiss as ‘just words’…
Yet the disconnect exists. It’s the abnormal fascination with numbers. ( Hey, I have it too… Math Geek with a math award / scholarship and Aspe tendencies… I’m just more aware of the risks it brings… )
Oddly, I can still hear my college Stats professor talking about how the deviation in a mean can be made arbitrarily small with larger numbers of items, but that does NOT improve the accuracy of the data nor of that mean… due to systematic error problems. I guess they don’t push that as much as they used to. IIRC, they used the example of measuring a door height. If you measure it a 1000 times, you can get a very small variation in the mean, but if your tape measure is an inch short, you will never recover that inch in the averaging…
At any rate, the snows will demonstrate that the numbers are wrong. The move to “dirty weather” and “weather extremes” shows that global “warming” isn’t any more… Signs of desperation, really. Have to find a way to call “snow” a sign of “warming” and can’t… so changing the definition of the problem…
E M Smith said;
“Yet the disconnect exists. It’s the abnormal fascination with numbers. ( Hey, I have it too… Math Geek with a math award / scholarship and Aspe tendencies… I’m just more aware of the risks it brings… )”
I assume this unhealthy obsession with dubious numbers is a result of computers needing numerical data in order to create models. If there is anything the modern world likes its playing with computers and creating umpteen versions of models that enable you to prove anything you want.
There are numerous things I fear much more than so called man made climate change and at the top of that list is the consequences of the Western Worlds obsession with computers.
Whether its a Carrington event , rogue hackers or a concerted state led attempt to wage cyber war
http://www.dailymail.co.uk/sciencetech/article-2241525/The-Boeing-blitzing-drone-cripple-nations-electronics.html
our civilsation is far more likely to be brought down by computers than by climate change
tonyb
Peter Davies
Thanks for your kind words. Generally I try to combine anecdotal accounts with scientific studies. If one contradicts the other it would need several independent anecdotal accounts to counter a scientific study asserting something different.
How do you feel about the ‘anecdotal’ numerical data that is commonly used?
Tonyb
tony b
Your historical perspectives on climate are always interesting to me. They open up a whole new viewpoint, often exposing the human element as it interfaces with changes in climate over the centuries, and in some cases demonstrating how climate had an impact on human history
What Peter Davies calls “anecdotal” evidence, others refer to as “historical” records.
Crop records from China or the Middle East, records of silver mines being covered by advancing snow and ice in the Alps, records of wine being grown in northern England – these are all examples of historical evidence.
Then there is actual physical evidence: carbon-dated remains of trees (or even signs of earlier civilization) recovered under receding glaciers high above today’s tree line, Viking farms buried in the Greenland permafrost, etc. These are hard data.
Some people (like Mosh) only believe numerical data with the code.
But these data were not available before there were computers.
Much of the historical data on climate precedes the computer age, so we have a dilemma.
Paleo-climate data are dicey. Often these are simply subjective interpretations of unreliable proxy data from carefully selected time periods of our planet’s geological past, in some instances made to “prove” a preconceived hypothesis. We saw how poor this was just for the past 1300 years (Mann hockey stick fiasco). Another example is the “CO2 control knob” posit of Richard B. Alley, which is based on carefully selected paleo reconstructions.
These studies have another basic flaw: the analyses usually involve an “argument from ignorance” (i.e. “we can only explain this if we assume…”), where unknown factors are simply ignored and the assumption is that all factors can be accounted for. A fatal flaw.
Historical data are not questioned when it comes to “anecdotal (or reported) evidence” of battles of WWII, for example, and it is inconceivable to me that climate scientists give higher weighting to dicey paleo-climate studies than to historical documentation.
Guess it’s what the French call “une déformation professionnelle”.
Or is it “cherry picking” methodologies that can more easily be used to achieve the desired results?
(Just my skeptical mind at work, tony – forgive me.)
Max
Tony, If there are historical thermometer readings then its a different story. The reason for this is that, to my mind, thermometer readings are objective whereas opinions by individuals are subjective.
As Max rightly points out, anecdotal evidence is not as good as historical records or contemporary paleo evidence subjected to rigorous scientific processes, simply because in the latter two cases, the evidence is unbiased.
Max said
“Historical data are not questioned when it comes to “anecdotal (or reported) evidence” of battles of WWII, for example, and it is inconceivable to me that climate scientists give higher weighting to dicey paleo-climate studies than to historical documentation.”
At present the number crunchers and statisticians are in charge and Historical climatologists are taking a back seat as far as influence goes. They should work more closely together, but until number crunchers stop using the word ‘anecdotal’ in a perjorative fashion that seems unlikely.
Trouble is if the basic data number crunching leaves somerhing to be desired the statistical element is on very shaky ground.
tonyb
Peter Davies
I believe you may have misunderstood what I wrote.
“Anecdotal data” is the term that climate scientists (IPCC, etc.) assign to what tony b calls “historical evidence” This can be old sea charts, notes by explorers, crop records, old chronicals of mines being covered by advancing ice and snow, etc.
Paleo climate studies are not very compelling IMO – sort of like “reading tea leaves”. “Rigorous processes” may help avoid a hockey-stick fiasco, but there are still two very basic problems: a) the proxy data themselves are often dicey, especially when the time scale is large, and b) the interpretation of the data is based on an “argument from ignorance” (i.e. “we can only explain this if we assume…”), where unknown factors are simply ignored and it is falsely assumed that we have the knowledge of all factors that could possibly have been involved; if these studies are used to provide evidence for a preconceived hypothesis, I think they are next to worthless.
I would say the first category provides more compelling evidence than the second, for the reasons stated – but “consensus” climate science today sees this differently.
The best data of all, of course, are provided by actual physical evidence: carbon-dated remains of trees or signs of past civilization under receding glaciers, farm houses buried in permafrost, etc. But this sort of evidence only exists for the recent past and, even then, is rare.
This is all just my opinion, of course.
Max
This long thread about bias in measurement is reading things into my poster that are simply not there. All I claimed was a millikelvin fit to “observed global warming” as defined. I agree that it is highly implausible that this gives us an understanding of actual global warming to that precision, only of observed global warming (OGW) as I’ve defined it in the poster. Your concerns about bias in the observations are entirely legitimate, which for all any of us know could be present in OGW to some degree or other, and are outside the scope of the results presented in the poster.
They are addressed however by others, for example Richard Muller’s BEST project at Berkeley, which claimed to be unable to find significant bias of the sort you refer to. Like my work, BEST’s supporting software (in MATLAB) can be downloaded so you can verify BEST’s claims for yourself.
Incidentally although I used MATLAB myself for this work, I translated it into VBA-free Excel because MATLAB is a lot more expensive and less widely available — your administrative assistant is much more likely to have Excel than MATLAB for example. This was my first exposure to writing a nontrivial spreadsheet, which is quite a different thing from ordinary programming, especially when you don’t allow yourself the luxury of resorting to Visual Basic. VBA in Excel has the downside of obscuring the clarity of a macro-free spreadsheet as well as opening a gateway to viral infections.
manacker
And as far as your constant disparagement of all paleoclimate studies goes, it is worthless. Actually, it is worse that that. It is actively distorting.
Your endlessly repeated dismissal of an entire field is nothing more than a self-serving misrepresentation.
Remember manacker, MBH98/99 ≠ the entire field of paleoclimate. As dear, dear David Springer would say: write that down.
Max
‘Now imagine that you have never seen the device and that it is hidden in a box in a dark room. You have no knowledge of the hand that occasionally sets things in motion, and you are trying to figure out the system’s behavior on the basis of some old 78-rpm recordings of the muffled sounds made by the device. Plus, the recordings are badly scratched, so some of what was recorded is lost or garbled beyond recognition. If you can imagine this, you have some appreciation of the difficulties of paleoclimate research and of predicting the results of abrupt changes in the climate system.’ http://www.nap.edu/openbook.php?record_id=10136&page=12
But of course the milenialist cult of AGW groupthink space cadets has a different dynamic.
‘Janis has documented eight symptoms of groupthink:
– Illusion of invulnerability –Creates excessive optimism that encourages taking extreme risks.
– Collective rationalization – Members discount warnings and do not reconsider their assumptions.
– Belief in inherent morality – Members believe in the rightness of their cause and therefore ignore the ethical or moral consequences of their decisions.
– Stereotyped views of out-groups – Negative views of “enemy” make effective responses to conflict seem unnecessary.
– Direct pressure on dissenters – Members are under pressure not to express arguments against any of the group’s views.
– Self-censorship – Doubts and deviations from the perceived group consensus are not expressed.
– Illusion of unanimity – The majority view and judgments are assumed to be unanimous.
– Self-appointed ‘mindguards’ – Members protect the group and the leader from information that is problematic or contradictory to the group’s cohesiveness, view, and/or decisions.
When the above symptoms exist in a group that is trying to make a decision, there is a reasonable chance that groupthink will happen, although it is not necessarily so. Groupthink occurs when groups are highly cohesive and when they are under considerable pressure to make a quality decision. When pressures for unanimity seem overwhelming, members are less motivated to realistically appraise the alternative courses of action available to them. These group pressures lead to carelessness and irrational thinking since groups experiencing groupthink fail to consider all alternatives and seek to maintain unanimity. Decisions shaped by groupthink have low probability of achieving successful outcomes.’ http://www.psysr.org/about/pubs_resources/groupthink%20overview.htm
It results in an inability to rationallty assess the strength of evidence. In particular blah blah doesn’t have any science background and simply imagines that his narrative superficially in the objective idiom of science is the indisputable truth. So sad too bad.
Cheers
CH
Different screen name, same deranged crap.
Only loons and hucksters resort to sock-puppetry.
manaker.
i think you misunderstand my concerns about documentary “evidence”.
Think about the problems people have with uncalibrated sensors. now ask yourself how you calibrate a person who writes an account.
In short apply your skeptical skills across the board. doubt everything with the same vigor
One persons symbology is anothers little needed rationale for frothing at the mouth.
‘- Belief in inherent morality – Members believe in the rightness of their cause and therefore ignore the ethical or moral consequences of their decisions.
– Stereotyped views of out-groups – Negative views of “enemy” make effective responses to conflict seem unnecessary.’
Delusional space cadets repsponding with rage and abuse? Seems par for the psychopathology of AGW groupthink.
EM Smith fails to mention that the NH Late spring/Early Summer snow cover has been in decline for some time and there is absolutely no way any return to glacial or even LIA conditions could occur until this trend starts to go the other way:
http://climate.rutgers.edu/snowcover/chart_anom.php?ui_set=1&ui_region=nhland&ui_month=6
E.M.Smith: That is a SYSTEMATIC error that will never be removed by averaging.
What, never? No never!
What, never? Well, hardly ever… (H.M.S. Pinafore)
An accurate estimate of a systematic error permits its subsequent removal.
Now if a 160-year dataset A is accumulated that is full of errors and false precision, and another dataset B is accumulated that is free of such errors, would you expect A or B to be more amenable to analysis to within a millikelvin?
And if B then how would you explain accomplishing this for A? And would you expect the analysis for B to be even more accurate?
So Arrhenius had a couple of wild guesses at what the warming would be from carbon dioxide after misreading Fourier and without ever having established if such a trace gas could have such great effects of raising global temperatures several degrees C, and its now a “law”?
Still the denial out of ignorance…. textbook Myrrh.
That Arrhenius’s numbers from over 100 years ago have needed correction, does not gainsay that the principle was correct.
But please, do feel free to furnish us with your ‘alternative’ revised measurements of greenhouse gas absorption characteristics.
Carbon dioxide can’t trap heat, backradiation/blanketing doesn’t exist, and no proof has ever been given that it can do these things.
Which is why, as I said, Arrhenius based his figures on an imaginary concept of which he had no proof – that you keep ‘adjusting’ his figures based on nothing at all is on par with his silliness.
Carbon dioxide can’t trap heat
IOW, you deny the well-established absorption spectra of CO2.
“Carbon dioxide can’t trap heat”
Any references ?
Carbon dioxide has for all practical purposes, zilch heat capacity, it releases any it gets instantly.
Unless you want to claim, as the analogy given by a warmist in Clouds and Magic, that carbon dioxide is a thick down blanket 100% of the atmosphere, you don’t have a hope of a snowball’s chance in hell of showing how it can trap heat.
You have no sense of scale.
And anyway, carbon dioxide is fully part of the Water Cycle, which CAGW/AGWs have excised from their calculations, every time it rains it clears the air of carbon dioxide, all pure clean rain is carbonic acid. Gosh, even Arrhenius knew that..
He also got Fourier wrong, so he based whatever thinking he was having about all this on something Fourier said didn’t exist..
Fourier didn’t maintain this:, quoting Arrhenius, “Fourier maintained that the atmosphere acts like the glass of a hot-house, because it lets through the light rays of the sun but retains the dark rays from the ground.”
What Fourier really said:
“Misattribution, Misunderstanding, and Energy Creation
Arrhenius’ first error was to assume that greenhouses and hotboxes work as a radiation trap. Fourier explained quite clearly that such structures simply prevent the replenishment of the air inside, allowing it to reach much higher temperatures than are possible in circulating air (Fourier, 1824, translated by Burgess, 1837, p. 12; Fourier, 1827, p. 586). Yet, as we have seen in the previous quotation of Arrhenius, this fundamental misunderstanding of greenhouses is attributed by Arrhenius to Fourier.”
From Timothy Casey on http://greenhouse.geologist-1011.net/
So, what was Arrhenius ‘measuring’ anyway? This was a man who was exploring acids, his ideas have been superceded by better understanding, but, nevertheless, he knew that carbonic acid was water and carbon dioxide. His paper is all about carbonic acid.
So why do we have this typical AGWScienceFiction response to this?
http://www.rsc.org/images/Arrhenius1896_tcm18-173546.pdf
“Arrhenius’s paper is the first to quantify the contribution of carbon dioxide to the greenhouse effect (Sections I-IV) and to speculate about whether variations in the atmospheric concentration of carbon dioxide have contributed to long-term variations in climate (Section V). Throughout this paper, Arrhenius refers to carbon dioxide as “carbonic acid” in accordance with the convention at the time he was writing.”
BS, Arrhenius knew what carbonic acid was, knew it wasn’t carbon dioxide. His ‘measurements’ were about CARBONIC ACID, not Carbon Dioxide.
If you’re going to claim Arrhenius as “known” as if proven, then you’re deceiving yourselves. You have never, not one of you, ever shown any analysis of Arrhenius’s work, never examined him to confirm his basic principles in his claims. You, generic, show absolutely no bent for science at all.
You continue to base your arguments on Arrhenius not only without making any attempt to show he is correct, but while knowing full well he got Fourier wrong. And if you didn’t know he got Fourier wrong, then what the heck are you doing in this discussion on the effects of carbon dioxide in the atmosphere?
You don’t have any basics in your claim about “greenhouse gases warming the Earth”..
That’s why all your fisics is gobbledegook.
Following on the outright laughable lie you made about longwave from the sun being being ‘excised’ from AGW theory, further evidence of your profound ignorance of the theory you purport to challenge, is your obsession with backradiation, which, in order to support some predetermined conclusion, you presumably want to pretend is a vital factor in your trademark silly fisicsfiction.
It isn’t. A (CO2-)warmed atmosphere does not directly heat the earth as such, it slows down the rate at which the earth cools.
Memphis | December 5, 2012 at 5:37 am | Following on the outright laughable lie you made about longwave from the sun being being ‘excised’ from AGW theory,
Enough of this stupidity, this is the AGWSF Greenhouse Effect energy budget, that “shortwave heats the Earth and no longwave infrared from the Sun plays any part in heating the Earth’s land and water”, either because it doesn’t get through some unknown unexplained silly idea of an invisible barrier like the glass of a greenhouse, as per Arrhenius’s getting Fourier wrong, or, as Pekka gives, that the Sun produces very little longwave infrared.
Either reason for it not being in the Greenhouse Effect irrelevant to the main point about this: that the direct heat from the Sun which in real physics is thermal infrared, has been excised from the Greenhouse Effect’s energy budget.
Which proves none of you know anything about climate physics, you haven’t even noticed..
Utter, total, idiotic, stupidity – either way.
And, I think you know this is the claim “shortwave in longwave out and no direct heat from the Sun”, and you are being disingenuous as you’ve shown elsewhere in your posts, on the other hand, that’s crediting you with logic thought, I’m not sure but it could be you simply don’t know what you’re talking about.
@myrhh
Pekka “The Weasel” Pirila is correct about longwave infrared from the sun and he doesn’t need to weasel about it. Infrared begins at an arbitrary point just past the range of human vision and stretches all the way down to microwaves. It is broken down into various ranges inside that limit into near, mid, and far. Longwave infrared is another name for far infrared. The sun only emits near infrared in significant amount. Far infrared is what the earth emits. It’s the difference between the radiative spectrum of blazing hot 5000C matter and barely above freezing 15C matter.
By continually failing to recognize the differences and similarities between various frequency ranges along the electromagnetic spectrum you demonstrate either willful ignorance or a total failure of you grade-school phyical science teacher. This is VERY basic stuff that is part of the curriculum of every child in the developed world. Yet you don’t know it. What are we that know better than you supposed to make of that?
By the way, Myrrh.
What’s the physical difference between a blue photon from the sun and a blue photon from a laser?
This is the umpteenth time I’ve asked you that question and you have yet to answer it.
David Springer | December 5, 2012 at 9:01 am | @myrhh
Pekka “The Weasel” Pirila is correct about longwave infrared from the sun and he doesn’t need to weasel about it. Infrared begins at an arbitrary point just past the range of human vision and stretches all the way down to microwaves. It is broken down into various ranges inside that limit into near, mid, and far. Longwave infrared is another name for far infrared. The sun only emits near infrared in significant amount. Far infrared is what the earth emits. It’s the difference between the radiative spectrum of blazing hot 5000C matter and barely above freezing 15C matter.
By continually failing to recognize the differences and similarities between various frequency ranges along the electromagnetic spectrum you demonstrate either willful ignorance or a total failure of you grade-school phyical science teacher. This is VERY basic stuff that is part of the curriculum of every child in the developed world. Yet you don’t know it. What are we that know better than you supposed to make of that?
You are so brainwashed by the AGWScienceFiction memes that you have absolutely no idea what you are saying. The heat we feel direct from the Sun is longwave infrared, aka thermal infrared, aka radiant heat aka simply, heat – this is standard basic physics knowledge in traditional physics and thermodynamics. Thermal infrared is the Sun’s heat energy in transfer.
The power of heat, that’s what thermodynamics means: heat is transferred in three the ways, conduction, convection and radiation. The heat transferred to us direct from the Sun is thermal infrared. That’s why it’s called thermal, because near infrared is not thermal and because it is the heat of the Sun not the light of the Sun. Thermal means ‘of heat’, it is the direct heat energy of the Sun, transferring the Sun’s great heat by radiation.
You have no heat from the Sun in your world, and visible light from the Sun cannot move molecules of matter into vibration, because visible light from the Sun is too small, so small, we can’t even feel it – it works on the electronic transition level, the level of electrons, it doesn’t impact matter on the molecular vibrational level, it takes the bigger more powerful heat energy from the Sun to move the molecules of matter into vibration – which is what it takes physically to heat up matter. Do you understand I am pointing out that there is a difference here?
That you have been brainwashed into believing such utter idiocy that visible light heats matter is one thing, that you haven’t any sense of scale and don’t even know how to tell hot from cold is another, that’s a disadvantage in someone interested in science. Which shows of course, you’re not interested in understanding the differences between things as your stupid reply to me confirmed, you repeat it again:
David Springer | December 5, 2012 at 9:13 am | By the way, Myrrh.
What’s the physical difference between a blue photon from the sun and a blue photon from a laser?
This is the umpteenth time I’ve asked you that question and you have yet to answer it.
This is the question you asked me in response to my challenge. My science challenge was – prove that visible light from the Sun can heat the land and water at the equator to the intensity these are heated which gives us our huge equator to poles winds and dramatic weather systems.
That is not an answer to my challenge. You are avoiding it. It doesn’t deserve any response from me, but your idiot repetition of it as if it proves you’re being clever is getting tedious, grow up. Answer my challenge, I have worded it as I have for a reason, see if you can work it out.
Anyway, as I said, you are all so brainwashed by these AGWSF sleights of hand that you actually believe that our blazing hot Star the Sun millions of degrees C hot, doesn’t give off any heat!
You just don’t know how stupid you all look..
..to anyone with the basics of traditional physics.
I have done my best to avoid being so brutally honest in past postings, but it really is getting tiresome trying to get some of you to think.
The heat we feel from the Sun is the Sun’s heat in transfer, it is not the Sun’s light in transfer, we cannot feel near infrared or visible light.
You can’t ignore that I have given exactly the same information from a NASA page, you have to take that on board if you’re making any claim to being science minded. The NASA information CONTRADICTS YOU.
Are you even capable of understanding what that means?
It challenges your claim.
If you’re having any problem comprehending that last sentence, you’re really not up for this.
I’ll show again that NASA on a traditional page contradicts your AGWScienceFiction fake fisics claims:
Read it until you understand that it is contradicting you..
http://science.hq.nasa.gov/kids/imagers/ems/infrared.html
“Infrared light lies between the visible and microwave portions of the electromagnetic spectrum. Infrared light has a range of wavelengths, just like visible light has wavelengths that range from red light to violet. “Near infrared” light is closest in wavelength to visible light and “far infrared” is closer to the microwave region of the electromagnetic spectrum. The longer, far infrared wavelengths are about the size of a pin head and the shorter, near infrared ones are the size of cells, or are microscopic.”
Here it is again, do you understand that it is saying there is a distinct difference in size?
“Infrared light lies between the visible and microwave portions of the electromagnetic spectrum. Infrared light has a range of wavelengths, just like visible light has wavelengths that range from red light to violet. “Near infrared” light is closest in wavelength to visible light and “far infrared” is closer to the microwave region of the electromagnetic spectrum. The longer, far infrared wavelengths are about the size of a pin head and the shorter, near infrared ones are the size of cells, or are microscopic.”
Next:
“Far infrared waves are thermal. In other words, we experience this type of infrared radiation every day in the form of heat! The heat that we feel from sunlight, a fire, a radiator or a warm sidewalk is infrared. The temperature-sensitive nerve endings in our skin can detect the difference between inside body temperature and outside skin temperature”
Have you got that? Read it again and again however many times it takes until you understand what it is saying. It is saying what I am saying, that the HEAT we feel from the Sun is Thermal Infrared.
Here it is again: “Far infrared waves are thermal. In other words, we experience this type of infrared radiation every day in the form of heat! The heat that we feel from sunlight,
Next:
“Shorter, near infrared waves are not hot at all – in fact you cannot even feel them. These shorter wavelengths are the ones used by your TV’s remote control.”
Have you taken that on board? We cannot feel the much tinier wavelengths of LIGHT, near infrared is classed with light. Hence the same principle of reflection capture in near infrared cameras. Near infrared is classed as Reflective, not Thermal. These are distinct categories in real world physics because there is difference between them.
We cannot feel visible light, because it is not a thermal energy, it is not heat, if we feel heat we are feeling thermal infrared.
The heat we feel from the Sun, which we can feel heating us up, heating up the land and water around us, is thermal infrared.
This is what AGWSF’s Greenhouse Effect has excised from it energy budget.
So you have no heat from the Sun in your world – because you have substituted Visible light from the Sun which cannot heat matter
What does it take to get this through to you?
As I said, you cannot ignore this if you make any claims to be a scientist, or interested in science.
Either you are wrong or what this NASA page and I am saying is wrong. They can’t both be right.
Sort it out, don’t avoid it.
Enough of this stupidity, this is the AGWSF Greenhouse Effect energy budget, that “shortwave heats the Earth and no longwave infrared from the Sun plays any part in heating the Earth’s land and water”
Once again Myrrh repeats this obvious lie. Enough of this stupid dishonesty (even using quotes to give the false impression he is quoting some authoritative source!).
And, exactly as predicted, the militant ignoramus Myrrh again (10th time?) simply ducks the point that the specific wavelength that warms the earth is completely irrelevant to AGW theory.
Hoping we won’t notice this, he again quietly switches his argument – this time to this new notion that CO2 is unheatable. Which I suppose explains why it is always found to be at zero degrees absolute.
Another Myrrh ‘fact’, is that “every time it rains it clears the air of carbon dioxide”.
Needless to say, not empirical studies cites. And one does wonder why, if CO2 is anyway unheatable (see above), he bothers mentioning this. Through in enough denials, maybe one will stick ?
Memphis | December 5, 2012 at 3:49 pm |
Enough of this stupidity, this is the AGWSF Greenhouse Effect energy budget, that “shortwave heats the Earth and no longwave infrared from the Sun plays any part in heating the Earth’s land and water”
Once again Myrrh repeats this obvious lie. Enough of this stupid dishonesty (even using quotes to give the false impression he is quoting some authoritative source!).
You really are this dumb or just continuing the disingenuousness you’ve shown in other posts?
So I have to reply to every repetition in case some unsuspecting reader thinks I have been lying? You stink Memphis.
I have given authoritative sources. You are dishonest, others should be wary of discussing anything with you, because you think you’re being clever but you just show yourself to be deceitful in your posts.
Memphis | December 5, 2012 at 4:14 pm |
And, exactly as predicted, the militant ignoramus Myrrh again (10th time?) simply ducks the point that the specific wavelength that warms the earth is completely irrelevant to AGW theory.
I have already answered this, but in a nutshell for information:
There is no Greenhouse Effect.
That’s why AGWScienceFiction has taken out the direct heat from the Sun, which is the the Sun’s heat in transfer, which is longwave infrared, which is thermal infrared.
See the NASA quote which gives the same traditional real world physics teaching I have been giving. This is the heat we actually, really, feel from the Sun. We cannot feel visible light, this is not a thermal energy and it cannot heat land and water because it is too small to heat matter and water is a transparent medium for it, water transmits visible light from the Sun through unchanged.
AGWScienceFiction has deliberately excised the real direct heat from the Sun, thermal infrared, so that it can pretend there is such a thing as its claimed “greenhouse gas warming”, it uses real world measurements of increases of downwelling longwave infrared but pretends the Sun doesn’t have anything to do with this, that it all comes from “greenhouse gases in the atmosphere backradiating/blanketing”.
This is a con.
There is no such thing as the Greenhouse Effect which is based on the claim that “greenhouse gases heat up the Earth 33°C from the minus 18°C it would be without them.
Firstly to get this, AGWSF has excised the Water Cycle from the real world. Without water the Earth would be 67°C, think deserts. It is the Water Cycle which cools the Earth down to 15°C.
So, I’m not expecting you to see that, Memphis, but there might be someone reading who has the nous to follow what I’m saying.
The AGWSF has given that -18°C figure to its claim that this would be the temperature only without its “greenhouse gases”, but, in real world physics that is the temperature for the Earth without any atmosphere at all, that is, without any nitrogen or oxygen too.
This is a magician’s trick. It has fraudulently given the figure of one scenario to another entirely different. The 33°C figure is what is fake here, it doesn’t exist. It’s an illusion. There is no direct connection between -18°C to 15°C accounted for by the “greenhouse gases water and carbon dioxide which take in radiated longwave”. Which is why no empirical science is ever produced to prove it exists.
So, firstly by taking out the Water Cycle and secondly by falsely claiming this is the figure only without its “greenhouse gases” when it is the figure for the Earth without any real gas atmosphere at all.
If you’re actually thinking about what I’ve just said, you’ll realise that the real world’s greenhouse gases are predominantly nitrogen and oxygen, they are the bulk of our atmosphere and act like a blanket delaying the escape of heat from the surface..
All of AGWSF is like this, it twists the real facts and terms in physics and changes meanings, plays with words, gives the property of one thing to another and takes laws out of context and so on, and this applies to all its basic claims. All its basic claims are fake fisics. All to promote that the AGW exists to the agenda of those who created this illusion.
For any reading this who do know the real physics involved, it can be very amusing to see what kind of world is depicted by these fake fisics claims. For example, it has substituted ideal gas for real gas, so it actually has no atmosphere at all – only empty space with hard dots of massless, volumeless, weightless molecules without attraction and not subject to gravity zipping around at great speeds under their own molecular momentum miles apart from each other..
.. so they have no sound in their world either..
It really is comic cartoon fisics of an impossible world.
So Memphis, you claim the Greenhouse Effect exists, but it doesn’t, it’s an ILLUSION created as I’ve been explaining, so it doesn’t matter what energy is heating the Earth to get it, the gods at the four corners farting hot air would do just as well..
Memphis’s question is redundant, there is no “AGW from a heated Earth”, the AGWSF Greenhouse Effect is science fraud.
Now, stop avoiding my direct science challenge.
A (CO2-)warmed atmosphere does not directly heat the earth as such, it slows down the rate at which the earth cools.
Exactly right. We must be in 2012, I don’t recall anyone saying this in 2010.
Myrrh : There is no Greenhouse Effect
We are all swell aware you deny the well-established physics on the absorption spectra of greenhouse gasses. We eagerly await your ‘alternative’ empirical data that contradicts it. The longer you avoid this challenge, the more certain we are you are just making it all up.
A (CO2-)warmed atmosphere does not directly heat the earth as such, it slows down the rate at which the earth cools.
Vaughn >> Exactly right. We must be in 2012, I don’t recall anyone saying this in 2010.
Yes previously the cry was “back-radiation”.
@Memphis: Yes previously the cry was “back-radiation”.
And moreover cried so long and loudly that even climate skeptics knew that, as an explanation of the greenhouse effect, it was preferred over the analogy of CO2 as a warming blanket. On now-archived Wikipedia talk pages for the greenhouse effect article one can find would-be “owners” of that article slapping down those daring to draw the blanket analogy.
I believe the first post on this blog to protest the illogic of the back-radiation theory was my post sixteen months ago. As evidence that such an objection was a complete novelty at the time, although there were a few positive responses there were many more negative responses such as “The whole article is ridiculously unphysical,” “Dr. Curry, how much undergraduate physics would I have to *forget* in order to be invited to ‘blog for you?” “there is no rational basis to dispute [back-radiation],” “it’s a joke post, right?” “DLR is Settled Science, and nobody who says otherwise has any right to expect to be taken seriously. I find Vaughan Pratt’s approach terribly flawed, in that it systematically wastes the time of the best scientists, in servitude to folk too ignorant to inform themselves and too arrogant to admit their egregious ignorance.” and much more in that vein.
So I’m quite chuffed to see people nowadays abandoning the back-radiation explanation of the greenhouse effect in favor of what is essentially the blanket explanation: a thicker blanket is colder on the side from which it radiates to a colder environment (and warmer with a warmer environment—radiation from a 115 F desert will warm an unprotected 98 F human, which a blanket can reduce independently of the fact that your body generates heat).
Not only is it a simpler explanation but it’s easier to calculate with. How on earth do you calculate the increased warming resulting from increased back-radiation when the CO2 is both radiating and absorbing in all directions? Following the trajectory of photons as they seemingly bounce around in the atmosphere (being bosons they don’t actually bounce but are created and annihilated) is a very challenging book-keeping task to say the least!
Vaughan, an interesting parallel is seen in Pierrehumbert’s AGU talk on the history of AGW. After Arrhenius, who had the correct top-view of the energy balance there was a long period that Ray calls dark ages where the bottom-view prevailed including such names as Callendar and the top view didn’t really prevail again until Manabe in the 60’s.
Vaughan Pratt
Thanks very much for your response to my questions. How did the presentation go?
To my question of whether Hansen posits a much longer time lag than 15 years in his pipeline postulation, you answer with a question:
I was referring to the “pipeline” paper, which he co-authored in 2005, in which the authors postulate that half of the warming since 1880 was “still in the pipeline”.
http://pubs.giss.nasa.gov/docs/2005/2005_Hansen_etal_1.pdf
The “last 15 years’ emissions” were only one-third of the total cumulated emissions, IOW “half of the warming” figures out to a longer time lag than 15 years, so I just wondered from where you got the “15 year” figure.
Thanks for answering my question on TSI vs. GCR/cloud impact in solar cycles (it’s the solar cycle, not the magnitude that counts).
To my question about how the unusually high level of 20th century solar activity had been considered in your analysis, you answered:
I was referring (for example) to Solanki et al. 2004
http://www.ncdc.noaa.gov/paleo/pubs/solanki2004/solanki2004.html
And (on a four hundred year basis) the Lean curve of solar irradiance 1611-2001
http://farm9.staticflickr.com/8202/8246230123_71547c34c5_b.jpg
You did not really answer my question on physical data supporting the MRES smoothing. I have checked the sources out there (cited by IPCC) and the data are very feeble – I had hoped you might have been able to cite a better source of information, but apparently this does not exist.
My last question related to whether or not you started with the “correct answer” and worked your way backward to arrive at it statistically, or whether or not you made an independent statistical analysis of the data and arrived at the “correct answer”. You confirmed:
So this answers my question.
Thanks again for taking the time to respond.
Max
@manacker: Thanks very much for your response to my questions. How did the presentation go?
Thanks for asking, Max. Way better than its precursor at last year’s meeting, in all respects – better results, cleaner production (my poster last year was a mess), much greater percentage of the four hours explaining the poster to interested parties, much higher quality of such including a couple of directors of relevant labs, and very positive reception of the novel items, in particular the huge importance of Hansen delay in estimating climate sensitivity from observation (as distinct from GCMs) and my seismic hypothesis for the sawtooth.
Embarrassingly I discussed the poster with Pieter Tans, one of the coauthors of the Hofmann et al result cited in the poster, for ten minutes without recognizing his name until he pointed it out. Ouch! But he didn’t complain, other than to point out that the exponential part of their law was weakening lately with the 1974 oil crisis and increasing prices for all fossil fuels, with which I fully agreed. I plan to redo the work using actual emissions data reconciled with the Keeling curve in place of the exponential. While I expect that to make very little difference to my numbers since they model only the past, I do agree with Tans that the exponential law is a pessimistic predictor of the future on account of this decline in the rate of rise of emissions—the problem there is how to estimate the likely future decline. The possible impact of methane from melting permafrost is another obstacle to a meaningful extrapolation of global warming to date.
@manacker: The “last 15 years’ emissions” were only one-third of the total cumulated emissions, IOW “half of the warming” figures out to a longer time lag than 15 years, so I just wondered from where you got the “15 year” figure.
Those are two different things. If you start up a CPU with a heatsink but no fan, after ten seconds the heatsink may have retained half of the total dissipation of the CPU but (with the appropriate circumstances) the CPU temperature at 10 seconds could nevertheless be what it would have been at 9 seconds without the heatsink. What I’m calling the “Hansen delay” is the 1 second in that situation, not the 10 seconds.
@manacker: I was referring (for example) to Solanki et al. 2004
http://www.ncdc.noaa.gov/paleo/pubs/solanki2004/solanki2004.html. And (on a four hundred year basis) the Lean curve of solar irradiance 1611-2001
That variation in the Sun’s output is a reasonable candidate for portion of either SAW or AGW or both. All I’ve done is separate the multidecadal part into an oscillatory component and a rising component and modeled them accurately. As I say in the poster, “Whether SAW describes a single phenomenon or several is an
excellent question.” Solar variation is a very reasonable candidate, especially when you consider that a more accurate fit to the Lang curve is obtained with a second-order curve, the last century of which would be concave downwards, opposite to AGW and therefore more likely to be associated with SAW.
To clarify my answer to your last part concerning what was in my mind, I fitted all 9 parameters jointly taking the variance of MRES as what was to be minimized The exponential is indeed part of the hypothesis being tested here as to whether there is any good fit of theory to data. The point of splitting up F3(DATA – (SAW + AGW)) as F3(DATA – SAW) – F3(AGW) was to allow the denominator in the formula for R2 to be visualized, namely by comparing “observed” and “predicted” global warming by eye, which shows visually that MRES regarded as the unexplained variance is a very tiny fraction of the total variance.
Vaughan Pratt
Thanks for answering my questions.
Agree with your statement that the exponential function is overly pessimistic.
IPCC has two “scenarios + storylines” (B1 and A1T) which end up with CO2 at around 600 ppmv by 2100.
These assume a continuation of the past exponential growth rate of atmospheric CO2 of around 0.5% per year despite a dramatic decrease of the population growth rate to less than one-third of the past rate so, even if the world per capita fossil-fuel based energy use increases by 50%, these are most likely “upper limits” themselves.
On this basis, using the IPCC mean CS of 3.2C we would end up with warming of 2C above today’s temperature, all other things being equal.
This is about half of the warming which the exponential curve would predict.
Of course, one can argue about whether or not the IPCC mean CS of 3.2C is exaggerated and about “all other things being equal”, but that would be another argument.
Thanks again for your time.
Max
Dr Pratt,
This is a quote from your paper:
“With either dataset, the model forecasts a 4 C rise for 2100”
Does this mean a rise from the current temperature (2012) or from the vague “pre industrial” value. (If it is the latter, can you please say what the temperature is assumed to be at the moment, on the same scale?)
Furthermore, I don’t see any decimal point with zeroes after it, just “4C”, Does this mean that you cannot actually predict the future temperature to an accuracy of 0.001 degrees C (1 millikelvin)?
Also do you have a temperature change prediction for the next 10 years?
Mark B
Assume that Vaughan Pratt will answer your specific question regarding the 4C warming forecast to 2100.
But let’s assume for now this refers to the warming from today and do a quick “sanity check”.
We have 88 years to go, so that means an average decadal warming rate for the rest of this century of 0.45C per decade. This sounds pretty high to me (three times what it was during the late or early-20th century warming cycle). But maybe that’s what you get from an exponential curve.
But how realistic is this projected warming?
Let’s assume that other anthropogenic forcing beside CO2 (aerosols, other GHGs) will cancel each other out, as IPCC estimates was the case in the past.
Using the IPCC mean 2xCO2 climate sensitivity of 3.2C (and assuming there will be as much warming “in the pipeline” in 2100 as there is today, this means we would have to reach a CO2 level of 932 ppmv CO2 by 2100 to reach a warming of 4C (all other things being equal, of course).
This is unrealistic, since WEC 2010 estimates tell us there are just enough total optimistically inferred fossil fuels to reach around 1030 ppmv when they are all gone.
Let’s assume, on the other hand, that Dr. Pratt is referring to 4C warming since industrialization started (a pretty arbitrary figure, as you point out, but a concept that is often cited). On this basis, there has been ~0,8C warming to date, leaving 3.2C from today to year 2100.
Using the IPCC climate sensitivity of 3.2C, the CO2 level by 2100 would need to double by 2100, from today’s 392 to 784 ppmv, to reach this warming (the high side IPCC “scenario and storyline”A2 is at this level, with estimated warming of 3.4C above the 1980-1999 average, or ~3.2C above today’s temperature).
So, on this basis, Dr. Pratt’s estimate would agree with the high side estimate of IPCC.
I’d question the realism of this “high side” estimate by IPCC, since it assumes that the exponential rate of increase in CO2 concentration will jump from the current rate of 0.5% per year to 0.74%per year, despite a projected major slowdown in human population growth rate.
But I guess that only shows that you can demonstrate anything with statistics.
Max
Furthermore, I don’t see any decimal point with zeroes after it, just “4C”, Does this mean that you cannot actually predict the future temperature to an accuracy of 0.001 degrees C (1 millikelvin)?
It depends on whether you’re predicting average temperature for one year such as 2097 or one decade such as the 2090’s or twenty years. SAW + AGW can be evaluated to ten decimal places at any given femtosecond in time. But that’s no good for a forecast because you have to add SOL and DEC from Figure 11. Double their joint standard deviation and you get a reasonable figure for the uncertainty of a prediction in any given year. For any given decade the uncertainty decreases, but I wouldn’t want to forecast to two decimal digits so far ahead.
But even one digit isn’t that reliable because of unknowns like those Max refers to.
Dr Pratt,
I am not sure what you mean by “SOL”. The only mention that you make of it is in this paragraph
“Because filter F3 rises slowly on the left of its cutoff there is the worry that some multidecadal phenomenon was overlooked by sneaking into the Hale octave. Something like this seems to have happened on the high-frequency side of the SOL band, perhaps some ENSO noise from DEC (decadal band) getting into the TSI band.:
Do you mean that SOL is a variable which has to be incorporated into the model retrospectively, once its values (over a given time period) become known?
I have to admit that I have jumped into all this theory a bit late on, and terminology which you and the scientific community take for granted are like a foreign language to me.
Thanks again for replying to my previous posts.
SOL = HALE + TSI. HALE is obtained by filtering RES1 = HadCRUT3 – F3(HadCrut3) with another filter F3′ twice the frequency of F3 (so HALE = F3′(RES1), and TSI is obtained as F3”(RES2) where RES2 = RES1 – HALE.
The windows for F3 are 21/17/13, those for F3′ are 11/9/7, and for F3” 7/5/3.
Vaughan Pratt
Above, Jim Cripwell asks a question regarding the magnitude of the solar influence, referring to the SvensmarkGCR/cloud hypothesis being tested at CERN.
You explained to me that for removing the 11-year “solar cycle”, the amplitude of the cycle itself did not matter, and I can accept that, as far as the 11-year solar cycle is concerned.
But I think Jim’s question goes in a different direction, and it is the same question I asked, namely how your analysis had handled the unusually high level of 20th century solar activity.
You asked me for supporting data, so, at your request, I linked two sources for this information (Solanki and Lean).
There have been several other independent solar studies, which have concluded that around 50% of the past warming (instead of 7%, as assumed by IPCC) can be attributed to this unusually high level of solar activity, and I just wondered how you had handled this in your analysis.
Since a major portion of this solar forced warming is believed to have occurred during the early-20th century warming cycle (which is statistically indistinguishable from the late-20th century warming often cited by IPCC, which is believed to be “mostly” caused by GH forcing), it seems to me that the magnitude of the solar forcing is a component that should be included in your analysis.
[Of course, if you have assumed (as IPCC does) that the only solar forcing is that from direct solar irradiance alone, then that would answer my question.]
I hope I’ve explained this clearly enough.
Max
Thanks, Max, I have had some further thoughts on this subject. I dont think that anyone understands just how the Svensmark effect works. I am not sure that Dr. Pratt has the necessaary expertise and background to be able to justify the simple assume that all of this effect can be accounted for in the Schwab and Hale cycles. One wonders which solar physicist he consulted before he made this assumption. Did he contact Henrik Svensmark himself? I know my expertise is nothing like good enough to state with any clarity just where Dr. Pratt is wrong, but I am reasonably certain that he is not correct.
What Pratt did was remove the actual data from the HadCRUT-tortured temperature record to leave behind the smooth curve introduced by the model adjustments. It is well known that said adjustments artificially lower the early years in the record and raise later years.
Here is the effect of each adjustment:
http://www.ncdc.noaa.gov/img/climate/research/ushcn/ts.ushcn_anom25_diffs_pg.gif
Note two adjustments called SHAP (station homogeneity adjustment procedure) and TOBS (time of observation bias) account for all the warming in the United States Historical Climatology Network data set. USHCN data is the gold standard in instrument records and the warming is trend is not in the raw data. The warming trend only exists in the modeled data.
http://www.ncdc.noaa.gov/img/climate/research/ushcn/ts.ushcn_anom25_diffs_pg.gif
Above is the final result of modeled adjustments to actual thermometer readings. Here is how NOAA describes this graph:
“The cumulative effect of all adjustments is approximately a one-half degree Fahrenheit warming in the annual time series over a 50-year period from the 1940’s until the last decade of the century.”
Take out the adjustment from Pratt’s figure 2 and there’s no residual remaining for CO2 to account for. CO2 warming is a sham and it’s being exposed by mother nature and our network of satellites which actually do have the capacity to measure the average temperature of the lower troposphere over the earth’s entire surface. There’s been little if any warming in that data in the past 15 years despite there being no respite in anthropogenic generation of CO2 during that time.
The jig is up. Pratt’s work is mental masturbation. It doesn’t reflect well on him.
@Jim Cripwell: I dont think that anyone understands just how the Svensmark effect works.
First, this effect (influence on cloud formation by solar cycle modulation of cosmic rays) has been known for half a century. It was suggested in 1959 by Edward Ney and again in 1975 by Robert Dickinson. What is your basis for attributing it to Svensmark?
Second, there is nothing at all in my results to either confirm or deny the Ney effect. The Hale cycle is clearly present, but there is no way to tell from the HadCRUT3 data whether it results from the Ney effect or say from the Birkeland current which runs a 100,000 amp current through the ionosphere tracking the Hale cycle. Why not a hundred-thousand amp toaster warming the Earth periodically?
Third, whatever the cause of the Hale cycle as a component of HadCRUT3, it’s obviously been there for as long as the Sun has had a rotating magnetic field (which accounts for both the Ney effect and the Birkeland current), so why would it contribute to global warming right when humans suddenly pump an incredible amount of CO2 into the atmosphere?
@DS: What Pratt did was remove the actual data from the HadCRUT-tortured temperature record
David, nothing has been “removed” as you put it, though it may have been misplaced. HadCRUT3 = MUL + SOL + DEC, your quarrel should be with whether portions of one of these three wide frequency bands have crept into the wrong band.
Can you point to a specific component of HadCRUT3 that you feel my spectral analysis has put in the wrong band?
Dr. Pratt:
it’s obviously been there for as long as the Sun has had a rotating magnetic field (which accounts for both the Ney effect and the Birkeland current), so why would it contribute to global warming right when humans suddenly pump an incredible amount of CO2 into the atmosphere?
Dr.Pratt
Simple. Geomagnetic storms!
http://www.geomag.bgs.ac.uk/images/image022.jpg
Can you spot similarity?
Dr. P. You cause me grief, now your colleague ‘Svalgaard of Stanford’ will be after me again.
Dr. Pratt, you write “What is your basis for attributing it to Svensmark?”
The Wilson Cloud Chamber preceded the suggestion by Ney. Henrik Svensmark was the first to do an actual experiment, and collect empirical data that strongly suggests that GCRs contribute to cloud formation.
David.
If instead of USHCN you use unadjusted GHCN daily data or unadjusted FSOD data, you get the same result as using USHCN.
Further if you remove the US from CRUTEM the answer doesnt change much. it cant as the US is only 2% of the land surface.
And as you know the rest of the world doesnt use SHAP or TOBS.
And SHAP, as you know, adjusts cold sites that were at 1000 ft ASL level
when they are moved to lower altitudes. Now, if a site was at 1000 ASL
and moved to o ft ASL ( and warmed ) would you suggest leaving.
As for TOBS. If you are making a measurement at 7AM and you change the time of observation to midnight do you believe ( have any evidence) that this change in practice does not effect the results.
Your nobel awaits you if you do
Are you saying NASA lied about the effeci of the corrections?
Everyone using surface station data applies TOBS and SHAP corrections to raw data at some point before the finished product although SHAP may not be explicitely called that.
The fact remains that NOAA explicitely admitted that the adjustments produce the warming from the raw data. You must either accept that or claim that NOAA lied about the effect of the adjustments.
You seem to want to have your cake and eat it too now both claiming that the adjustments are justified and even without the adjustments the warming trend is still there. The latter claim makes NOAA out to be lying.
As to your claim that the U.S. is only 2% of the globe, big deal. It’s representative enough for this purpose. US land-only temperature doesn’t have a markedly different trend than global satellite data. In fact if that doesn’t hold true prior to the satellite era then you can kiss the instrumental record prior to 1950 goodbye because its coverage isn’t anywhere near global and is almost completely absent for undeveloped countries, remote regions, and over the ocean.
You can’t have your cake and eat it too.
Myrrh | December 5, 2012 at 6:46 am |
“Carbon dioxide has for all practical purposes, zilch heat capacity, it releases any it gets instantly.”
Really? So if I electrically heated a tank of CO2 to say 350F and opened the valve to release a jet of it you’d have no problem holding your hand in the jet?
David
More realistically, suppose you were to heat a tank of co2 at 390ppm to the earths average temperature of 15 Degrees C and a tank of water vapour (Fog?) to the same temperature and opened the valve for an hour, what would be the temperature of each tank at that time?
tonyb
1. What is the pressure in the tanks?
2. How big are the tanks?
3. What is the temperature outside the tanks.
Also, what are the tanks made of, how thick, etc, etc …
How about if these tanks were to be dropped into your compound…
http://worldnews.nbcnews.com/_news/2012/12/05/15706380-syria-loads-chemical-weapons-into-bombs-military-awaits-assads-order?lite
you would pray it was CO2.
If the tank contained ordinary air but with CO2 removed you’d only roast your hand but if anyone were so craZy as to add CO2 that could start a chain reaction that might lead to runaway global waming and very well could destroy every living thing on the planet.
Jim2
Its Davids tank. :)
However I’m sure your tank would be just as good if you’d care to make the calculation using your own parameters.
tonyb
Not enough information to answer.
Typical idiocy I’ve come to expect from you in response.
No sense of scale, no sense of difference between hot and cold, no sense of context.
Myrrh
Presumably your last comment is directed at David Springer?
You posed an interesting comment about c02 releasing its heat instantly. It would be good to have an answer based on real world temperature conditions within Davids hypothetical tank.
tonyb
climatereason | December 5, 2012 at 2:47 pm |
Myrrh
Presumably your last comment is directed at David Springer?
Grin.. yes, sorry about that. I usually post to whom and to what I’m replying..
Re your: You posed an interesting comment about c02 releasing its heat instantly. It would be good to have an answer based on real world temperature conditions within Davids hypothetical tank.
Real world physics such as heat capacity is avoided by AGWSF because it spoils its “carbon dioxide traps heat” meme, that’s why they’ve taken rain out of their Carbon Cycle, so they can pretend it accumulates trapping more and more heat. So also the misdirection in the pretend experiments which stop short of measuring how long flasks of carbon dioxide take to cool..
Besides the other skullduggery in them, for example that a flask full of carbon dioxide against a flask of “air” is hardly the beginning of a rational experiment to prove anything, why not appropriate volume of the trace carbon dioxide, and, what’s in the “air”? A high volume of water with it great heat capacity which will taken longer to heat up..?
A while ago, can’t recall off-hand which discussion here, I was told that carbon dioxide had a much greater heat capacity than oxygen and nitrogen.. I hadn’t heard that fake fisics meme before. On checking out the heat capacity figure I was given it turns out it was for carbon dioxide at gazillions degrees temps! They’ll use anything they can to confuse the unwary.
By the wa Myrrh,
Have you figured out yet that there’s no difference between a blue photon from the sun and a blue photon from a laser?
I’m still waiting for you to cowboy up and either describe the difference or admit there isn’t one.
David
Debating partners of Myrrg need to know his groundrules. Here is a starter pack :
– he doesn’t address points that disprove what he is saying
– his preference in such situations is a tactical switch; failing which, simple silence
So please don’t wait up expecting him to cowboy up any time soon. His overall style is self-important, arrogant ‘lectures’ on his fisics fiction, and the abovementioned switch-if-defeated tactic.
Memphis I agree the Myrrh is selective of what he chooses to follow up. Rhetoric needs to be backed up with salient information at least even if we cannot agree if they are “facts”
Rapidly expanding a gas cools it as the thermal energy is converted to translational energy. Supersonic expansion of gases into vacuums is often used as a method to adiabatically cool the gas and reduce its internal temperature (i.e. low rotational and vibrational states). This technique allows for cleaner spectral analysis of molecules not achievable at RTP.
Though your example is not a supersonic expansion into a vacuum, I would expect the gas jet to be considerably cooler than the tank temperature.
You’d be wrong about the exiting gas being lower in temperature than the tanked gas. The gas inside the tank is expanding. The gas that has left the valve is done expanding and won’t drop in temperature further except as it is duluted by lower temperature ambient air. Given I’m electrically heating the tank I would be replacing the energy lost from expansion and the tank temperature would remain constant.
I’d guess you don’t have a shop with an air compressor to experience these effects first hand. I do.
Dear Myrhh would receive third degree burns if the gas hadn’t diluted much with ambient air before contacting his skin. I’d take a jet of 350F CO2 over a jet of 212F steam any day of the week though and twice on Sunday’s. I have a hot-air plastic welder that delivers well regulated air streams in the hundreds of degrees F with fairly constant regulation to whatever temperature you set it to. You can pass your hand quickly through it without getting burned. You can’t do that with steam. Steam is dangerous as the heat capacity is about 1000x an equal weight of dry air.
“The gas inside the tank is expanding.”
Well, assuming the tank volume is constant, the gas is not expanding but the pressure is increasing (which is not expansion). Expansion requires the volume to increase… so the gas is not expanding inside the tank as you heat it.
“The gas that has left the valve is done expanding”
No, that gas is expanding as it leaves the tank and doesn’t finish expanding until it’s pressure is equal to the surrounding gas it is expanding into.
I think you have to look at the Joule-Thompson inversion temperature of CO2 to determine if the gas would cool upon expansion starting at a temperature of 350 F or 450 K. The inversion temp of CO2 is 968 K at 1 atm which is greater than 450 K so CO2 should cool upon expansion due to the Joule-Thompson effect.
Here is an interesting paper related to carbon sequestering and injecting CO2 into depleted natural gas wells and the problem of freezing water during the process.
http://esd.lbl.gov/FILES/research/projects/tough/documentation/proceedings/2006-Oldenburg_CO2.pdf
Check it out
Why start the analysis in 1850? What happens if you choose 2000 BCE as the starting point? That would include at least three of the 1000-yr oscillations.
The Earth has been in a cooling trend over the last 4000 years, and since the time of Jesus as well… The Earth has been in a cooling trend for 10000 years.
What 1ky oscillation?
Captain Kangaroo – aka Skippy – is ultimately a climate warrior on a blue horse called shibboleth – and who is quite immune from jibes from buffoons such as you. Symbology rather than sock puttetry – it signifies a hardening of attitude. It calls attention to the descent of this site into a battle field in the climate war – not least attributable to your abusive and ignorant comments. Take it as read that scientific and civil discourse with climate activists is impossible to be replaced entirely by tribal polemic.
‘Although it has failed to produce its intended impact nevertheless the Kyoto Protocol has performed an important role. That role has been allegorical. Kyoto has permitted different groups to tell different stories about themselves to themselves and to others, often in superficially scientific language. But, as we are increasingly coming to understand, it is often not questions about science that are at stake in these discussions. The culturally potent idiom of the dispassionate scientific narrative is being employed to fight culture wars over competing social and ethical values.49 Nor is that to be seen as a defect. Of course choices between competing values are not made by relying upon scientific knowledge alone. What is wrong is to pretend that they are’ http://www.lse.ac.uk/collections/mackinderCentre/
It is the narrative that has no resemblance to the search for truth that distinguishes AGW groupthink space cadets such as yourself. The groupthink is not susceptible to rational discourse. Rationalisation follows distortion and bad faith. Your frequent resort to ad hom, distortion, rationalisation and misrepresentation – as well as the absurd and overweening confidence in your own narrative – laces you firmly in the grasp of AGW groupthink.
This is what I actully quoted from the NAS about the uncertainty of paleoclimate research.
‘Now imagine that you have never seen the device and that it is hidden in a box in a dark room. You have no knowledge of the hand that occasionally sets things in motion, and you are trying to figure out the system’s behavior on the basis of some old 78-rpm recordings of the muffled sounds made by the device. Plus, the recordings are badly scratched, so some of what was recorded is lost or garbled beyond recognition. If you can imagine this, you have some appreciation of the difficulties of paleoclimate research and of predicting the results of abrupt changes in the climate system.’ http://www.nap.edu/openbook.php?record_id=10136&page=12
This is what I cited in respect of variability.
‘There is variability on all scales. Putting a name or a putative period to these things is irrelevant.
http://s1114.photobucket.com/albums/k538/Chief_Hydrologist/?action=view¤t=chylek09.gif
http://s1114.photobucket.com/albums/k538/Chief_Hydrologist/?action=view¤t=tsireconstruction.png
http://s1114.photobucket.com/albums/k538/Chief_Hydrologist/?action=view¤t=Vance2012-AntarticaLawDomeicecoresaltcontent.jpg
http://s1114.photobucket.com/albums/k538/Chief_Hydrologist/?action=view¤t=ENSO11000.gif‘
The references are all in the names or on the graphs themselves. But please – it would be absurd to suggest that climate wasn’t variable at all scales. Not that I would put that past an unqualified and unscientific bozo like you.
As for GIS and ‘the planet’ – the only use of GIS I have ever made relates to geographic information systems. GIS certainly doesn’t google as anything else.
There is variability on all scales. Putting a name or a putative period to these things is irrelevant.
http://s1114.photobucket.com/albums/k538/Chief_Hydrologist/?action=view¤t=chylek09.gif
http://s1114.photobucket.com/albums/k538/Chief_Hydrologist/?action=view¤t=tsireconstruction.png
http://s1114.photobucket.com/albums/k538/Chief_Hydrologist/?action=view¤t=Vance2012-AntarticaLawDomeicecoresaltcontent.jpg
http://s1114.photobucket.com/albums/k538/Chief_Hydrologist/?action=view¤t=ENSO11000.gif
Why are you resorting to sock-puppetry? Were you banned for being an arse?
What 1ka oscillation? Let’s have some references. Not the usual cobbled-together snippets clipped out of their proper context.
Nearly forgot – have you worked out the difference between the top of the GIS and the entire planet yet?
How was it you described yourself again? Oh yes (how could I forget):
Bit weak on paleoclimate though.
;-)
My comment is awaiting moderation? It is in the wrong place anyway. Too many links I take it.
Captain Kangaroo – aka Skippy – is ultimately a climate warrior on a blue horse called shibboleth – and who is quite immune from jibes from buffoons such as you. Symbology rather than sock puttetry – it signifies a hardening of attitude. It calls attention to the descent of this site into a battle field in the climate war – not least attributable to your abusive and ignorant comments. Take it as read that scientific and civil discourse with climate activists is impossible to be replaced entirely by tribal polemic.
‘Although it has failed to produce its intended impact nevertheless the Kyoto Protocol has performed an important role. That role has been allegorical. Kyoto has permitted different groups to tell different stories about themselves to themselves and to others, often in superficially scientific language. But, as we are increasingly coming to understand, it is often not questions about science that are at stake in these discussions. The culturally potent idiom of the dispassionate scientific narrative is being employed to fight culture wars over competing social and ethical values.49 Nor is that to be seen as a defect. Of course choices between competing values are not made by relying upon scientific knowledge alone. What is wrong is to pretend that they are’ http://www.lse.ac.uk/collections/mackinderCentre/
It is the narrative that has no resemblance to the search for truth that distinguishes AGW groupthink space cadets such as yourself. The groupthink is not susceptible to rational discourse. Rationalisation follows distortion and bad faith. Your frequent resort to ad hom, distortion, rationalisation and misrepresentation – as well as the absurd and overweening confidence in your own narrative – places you firmly in the grasp of AGW groupthink.
This is what I actully quoted from the NAS about the uncertainty of paleoclimate research.
‘Now imagine that you have never seen the device and that it is hidden in a box in a dark room. You have no knowledge of the hand that occasionally sets things in motion, and you are trying to figure out the system’s behavior on the basis of some old 78-rpm recordings of the muffled sounds made by the device. Plus, the recordings are badly scratched, so some of what was recorded is lost or garbled beyond recognition. If you can imagine this, you have some appreciation of the difficulties of paleoclimate research and of predicting the results of abrupt changes in the climate system.’
This is what I cited in respect of variability.
‘There is variability on all scales. Putting a name or a putative period to these things is irrelevant.’
The references are all in the names or on the graphs themselves. But please – it would be absurd to suggest that climate wasn’t variable at all scales. Not that I would put that past an unqualified and unscientific bozo like you.
As for GIS and ‘the planet’ – the only use of GIS I have ever made relates to geographic information systems. GIS certainly doesn’t google as anything else.
GIS = Greenland Ice Sheet. As you would know if you were not somewhat vague about paleoclimate. It was the *region* that experienced extreme warming at the end of the YD. The *region* you persistently confuse with the entire planet. Or perhaps this is deliberate misrepresentation.
***
If there’s no 1ka oscillation (and there isn’t) why did you not point this out to Caz instead of having a pop at me? I ask because among the bizarre statements you make above, we find this:
Well, CH, you are the most unpleasant commenter I have ever encountered, which is also the key to your single redeeming feature: your comical lack of self-awareness.
As for all this nonsense about ‘symbology’ and ‘blue horses’ etc, what can I say? You deny sock puppetry in spoutingly grandiloquent terms that frankly raise the suspicion that you are losing your grip.
Oh I remember – you have a reference that suggsts that the Younger Dryas was a arctic phenomenon.
‘More than a decade ago, ice core records from Greenland revealed that the last glacial period was characterized by abrupt climate changes that recurred on millennial time scales. Since their discovery, there has been a large effort to determine whether these climate events were a global phenomenon or were just confined to the North Atlantic region and also to reveal the mechanisms that were responsible for them…
Finally, given the potential role for processes occurring in both low and high latitudes, we suggest that a global approach is necessary for understanding the problem of abrupt change. Coupled GCMs certainly offer this kind of perspective, but they have been used only in limited
applications to this problem, primarily in studies of the climate response to freshwater forcing in the Atlantic. While this has been useful, there are other ways to perturb the climate (e.g., different initial conditions or forcing persistent changes in particular phenomena) that may help to reveal the global-scale coupled feedbacks that can cause the climate to change abruptly around the globe.’ MECHANISMS OF ABRUPT CLIMATE CHANGE OF THE LAST GLACIAL PERIOD
Amy C. Clement and Larry C. Peterson
Really it just this AGW spoace cadet narrative of climate that I complained about. An inability to weigh evidence or to acknowledge uncertainty. The paleoclimate is especially an area of uncertainty – which is not what I said but what I quoted from the NAS.
‘Now imagine that you have never seen the device and that it is hidden in a box in a dark room. You have no knowledge of the hand that occasionally sets things in motion, and you are trying to figure out the system’s behavior on the basis of some old 78-rpm recordings of the muffled sounds made by the device. Plus, the recordings are badly scratched, so some of what was recorded is lost or garbled beyond recognition. If you can imagine this, you have some appreciation of the difficulties of paleoclimate research and of predicting the results of abrupt changes in the climate system.’ http://www.nap.edu/openbook.php?record_id=10136&page=13
I don’t know why you persist. It is quite clear that I saif that there was variability at all scales. Please if you think otherwise just say so. It would be quite in keeping with your ill informed AGW groupthink narrative – so not surprising.
But your ongoing frothing at the mouth has little meaning or impact for me. I am the most unpleasant commenter you have ever encountered? What a joke. My tone is reasoned and mild by comparison. All you do is spray your rants and insults quite widely and most indiscriminantly at any number of denizens. Do you think it has escaped notice?
Do you really believe what you say. I suppose it is possible – but quite bizarre.
Chief Kangaroo
When are you going to admit that you have repeatedly mistaken the GIS ice core data showing abrupt temperature change at the end of the YD for an abrupt *global* temperature change of ~10C?
Or was that a deliberate misrepresentation? I’m trying to work out if you are genuinely ill-informed or genuinely dishonest.
Please clarify.
And please explain why you have changed screen name. Were you banned for being an arse?
You drop in with silly comment – frothing at at mouth, insulting and lying. Why? Who gives a rat’s arse.
Captain Kangaroo
Stop being evasive and answer the questions:
1/. When are you going to admit that you have repeatedly mistaken the GIS ice core data showing abrupt temperature change at the end of the YD for an abrupt *global* temperature change of ~10C? Or was that a deliberate misrepresentation? I’m trying to work out if you are genuinely ill-informed or genuinely dishonest. Please clarify.
2/. Please explain why you have changed screen name. Were you banned for being an arse?
Cheif changes his screen name because he is Aussie insane. This is different than regular insane. It is the same affliction which caused a couple of Aussies to call the hospital where Kate was being treated while trying to impersonate the royals.
All these Aussie commenters from Chief, to Doug Cotton, to Myrrh, to Stefan the Denier, to Girma are all probably just pulling our collective leg. This is clown insanity and these guys are part of the Aussie insane clown posse.
WHT
That’s terribly unfair. Chief Kangaroo is a great man. He tells us so himself:
Now bend the knee. Show the proper respect.
BBD,
Yr: “Why are you resorting to sock-puppetry/”
You know, BBD, it is curious how the crushers on this blog get all worked up by “sock-puppetry.” I mean even the alternate “handles” used by the Chief and Latimer, which everyone knows belong to them, seem to trigger spoiled-brat-temper-tantrum, up-tight, nit-noid obsessed, totally weirdo, freak-out, over-wrought objections on your part suggestive of severe mental-health issues. Like I say, BBD, curious–especially since you and your fellow crusher hive-bozos don’t have the slightest objections to, say, the use of pseudonyms.
Just a theory, here, BBD, but let me run it by you and see what you think. So, BBD, I’m, like, thinkin’ you crushers are keepin’ some sort of a file of selected deniers’ comments and the “sock-puppet” business messes up your rigid, amateurish, DISCIPLINED, top-down-iron-fist-controlled, typical-greenshirt-inflexible-set-up, file system.
And instead of just whippin’ up some modifications to your little “surveillance” system so that it cross-links “sock-puppet” monikers, you, BBD, and your crusher hive-retards respond, as your alternative of choice, by spinning yourselves up into a series of little, fussbudget-geek, whiny-dork, prig-dude snit-fits that routinely lead to a blown, control-freak gasket or two before an astonished humanity and hope that solves the problem.
You know, BBD, I can hardly wait for you and the other crushers to become our power-and-control, whip-cracker, autocrat Philosopher-Kings-and Queens so that you can plunge us all into that misery-loves company, nit-picking, fault-finding, nag-bot hive-hell, you eco-weenie, “little-man” martinets call home.
mike
I’m really not supposed to talk about this, but since it’s just you and me in here I will confirm that you are correct. We keep files. Sock-puppetry means more bloody paperwork and we resent it.
And yes, you are on the list. Several of them in fact. When we take over, if you are not shot at once, you will be among the first shipped to the work farms, where you will learn to love the smell of tofu in the morning.
But I have said too much. Forget this. Carry on as normal while you can.
Several hectoring trivialities all at once?
Let me explain just once more – only because it is fun. It is simply the recognition that rational discourse with millenialist cult of AGW groupthink space cadets is impossible. It is just one trivial skirmish after another.
‘Although it has failed to produce its intended impact nevertheless the Kyoto Protocol has performed an important role. That role has been allegorical. Kyoto has permitted different groups to tell different stories about themselves to themselves and to others, often in superficially scientific language. But, as we are increasingly coming to understand, it is often not questions about science that are at stake in these discussions. The culturally potent idiom of the dispassionate scientific narrative is being employed to fight culture wars over competing social and ethical values. Nor is that to be seen as a defect. Of course choices between competing values are not made by relying upon scientific knowledge alone. What is wrong is to pretend that they are.’
It is just a simplistic narrative that is defended with overweening moral and intellectual certitude as some grand and immutable truth . It is not about science. It is about the climate war. This site has descended into the abyss driven not least at all by the abusive and repulsive antics of blah blah and butch.
Variability is about randomness the webster says. It echoes what Vaughan says about saw tooth functions. ‘Sawtooth waves occur naturally as the result of a sudden perturbation away from equilibrium followed by a slow return to equilibrium. The several 100,000 year deglaciation cycles of the late Quaternary are one example; this might be another…’ Not so much randomness as such but perturbation – but we will let that slide.
My own view is that it is truly heroic to view the glacials/interglacials of the Quaternary as a statistically stationary system. These and other variabilities are best seen as chaotic shifts in a complex and dynamic system. But this does not imply that any state is possible – just those on the complex topology of the climate phase space.
So we have natural variability – but it is not about this. It is all about the the millenialist groupthink memes of the hive-bozos. That they happen to be appallingly scietifically illiterate is probably to be expected. That they distort, lie and misrepresent is part of the psychopathology. So sad to bad.
1/. When are you going to admit that you have repeatedly mistaken the GIS ice core data showing abrupt temperature change at the end of the YD for an abrupt *global* temperature change of ~10C? Or was that a deliberate misrepresentation? I’m trying to work out if you are genuinely ill-informed or genuinely dishonest. Please clarify.
Just to make it abundantly clear – the comment was on sensitivity and relates to the YD only in your own fervid imagination.
Here’s the comment.
‘Girma – I no more believe in a constant sensitivity than I believe in fairies at the end of the garden. Actually fairies are probably higher on the list of the feasible.
What we had was 10 degrees C warming in as little as a decade at times. Let’s see – that’s about a sensitivity of 296,000.’
I gave you a reference for regional and time varying sensitivities. I no more more believe in a global sensitivity than in a time unverying sensitivity.
2/. Please explain why you have changed screen name. Were you banned for being an arse?
No it’s because you are an arse. I thought that much was abundantly clear even to a hive-bozo such as you.
BBd : 2/. Please explain why you have changed screen name. Were you banned for being an arse?
As the undisputed biggest arse that has ever been on this site – even Myrrh and Web pale in significance – and who has not been banned, what comments do you imagine might have earned a ban ?
Or was that question just more of your usual arse talk?
Chief Kangaroo
Caught out in ignorance and now resorting to *lies*. You’ve made too much of the ~10C shift at the end of the YD over the past few weeks to get away with this. It’s childish. Don’t underestimate your enemies. We businessmen understand this well.
Chief Kangaroo
You wriggle frantically on the hook but let’s keep the focus where it needs to be: on your refusal to acknowledge your errors.
I pointed you at a state-of-the-art study demonstrating that the global cooling associated with the YD was modest (Shakun & Carlson 2010). It’s misleading and mistaken to suggest that there was a 10C global climate shift at the end of the YD but you have been doing so for several weeks to my *certain knowledge*. This was simply the latest example:
One can readily see just how misleadingly mistaken you are in saying this. What you have to do now is admit your error.
Only children and nutters refuse to admit their mistakes when confronted with the evidence. So come on, out with it.
Here’s the comment.
‘Girma – I no more believe in a constant sensitivity than I believe in fairies at the end of the garden. Actually fairies are probably higher on the list of the feasible.
What we had was 10 degrees C warming in as little as a decade at times. Let’s see – that’s about a sensitivity of 296,000.’
That’s obviously hard science and you’re an idiot.
‘Large, abrupt climate changes have affected hemispheric to global regions repeatedly, as shown by numerous paleoclimate records (Broecker, 1995, 1997). Changes of up to 16°C and a factor of 2 in precipitation have occurred in some places in periods as short as decades to years (Alley and Clark, 1999; Lang et al., 1999). However, before the 1990s, the dominant view of past climate change emphasized the slow, gradual swings of the ice ages tied to features of the earth’s orbit over tens of millennia or the 100-million-year changes occurring with continental drift. But unequivocal geologic evidence pieced together over the last few decades shows that climate can change abruptly, and this has forced a reexamination of climate instability and feedback processes (NRC, 1998). Just as occasional floods punctuate the peace of river towns and occasional earthquakes shake usually quiet regions near active faults, abrupt changes punctuate the sweep of climate history.’
No that I mentioned the YD – but.
‘The Younger Dryas is one of the most well-known examples of abrupt change. About 14,500 years ago, the Earth’s climate began to shift from a cold glacial world to a warmer interglacial state. Partway through this transition, temperatures in the Northern Hemisphere suddenly returned to near-glacial conditions (Figure 6). This near-glacial period is called the Younger Dryas, named after a flower (Dryas octopetala) that grows in cold conditions and became common in Europe during this time. The end of the Younger Dryas, about 11,500 years ago, was particularly abrupt. In Greenland, temperatures rose 10° C (18° F) in a decade (Figure 6; Cuffey and Clow, 1997).’
‘The Younger Dryas cold reversal event is one of the best known instances of an abrupt climate change on record. Theories about what caused the shift from global warming to a distinctly cooling period are varied. Debate continues amongst scientists as to whether the Younger Dryas was a regional or global occurrence. Evidence from the Northern Hemisphere strongly supports the existence of the event, but evidence from the Southern Hemisphere is less compelling. Concern about the impact of a similar abrupt climate change episode in today’s world has prompted further research to better understand the Younger Dryas. ‘
There is an ongoing debate about the YD – including asteroid impact as a cause. Yet you have one ‘state of the art’ paper. You are an absolute moron.
The latest news is that the nurse that took the phone call from the Aussie Larrikin pranksters has now committed suicide a few days after this incident.
I want to say that actions have consequences.
To all you Aussie tribal clowns that inhabit this comment area with your pranks and antics, which includes sockpuppetry, word salad, foo, FUD, and general spew, you have been pwned.
StefanTheDenier : shove it
Chief Hydro : pretentious prick
Girma : get a clue
Doug Cotton : get some help
Myrrhh : buy a vowel, your schtick ain’t working
Peter Lang : whatever
Alexander Biggs : no one is interested
Tim Curtin : and you are who?
with due respect to Professor Pratt, who I realize is a native-born Australian, but somehow managed to escape this affectation.
Bit of a stretch here webnutcolonoscope? But then frothing at the mouth and irrationality is what you do best.
My actions in pointing out your hick Minnesotan irrationality about climate randomness, peak oil, power rules for everything and the atmosphere heating the ocean has consequences? I hope so.
Chief Kangaroo
I don’t dispute that there have been large, abrupt climate shifts. Nor do Shakun & Carlson.
I don’t dispute this either. Nor do Shakun & Carlson. Their work provides insight into the extent and effects of the YD, regionally and globally.
My point has always been that the large, sometimes abrupt climate shifts over the last ~15ka were associated with deglaciation.
Where we seem to differ is over the likelihood of significant, global-scale cooling episodes during the C21st. I’m sceptical because I don’t see the mechanisms that might produce a surprise at the cool end of the scale. We are 11.5ka into the Holocene. The albedo-driven instability from a large NH ice sheet is gone. Huge fluxes of freshwater from proglacial lakes are gone. But increasing GHG forcing is ever with us.
***
Presumably we agree that the climate system is moderately sensitive to radiative perturbation. So do we agree that under a sustained and increasing forcing, the centennial trend will be up? And that as energy accumulates in the climate system, even modest cool climate shifts become ever-less *possible*?
‘GK: San Diego —– (SEAGULLS, SURF) a beautiful city with a Mexican flavor (LATIN DANCING, SS SPANISH), a city of perpetual summer most of the time. But for some San Diegans, it’s just too much. The freeways. (TRAFFIC) the helicopters going overhead day and night (HELICOPTERS)—the price of real estate (FN: HOW MUCH? A HUNDRED THOUSAND DOLLARS FOR THIS???). Why not try Minnesota? (LOON). A reasonably pleasant state on America’s other border, Minnesota offers an interesting variety of weather conditions. It’s quiet, especially at this time of year. (QUIET WIND, DISTANT OWL). In northern Minnesota, you can buy a 3-bedroom house for less than you’d pay for a garage in San Diego. The people are courteous.
Minnesota. It’s quiet. It’s cheap. It’s mannerly. And it’s interesting, in its own way (WIND) Maybe it’s the place for you after all.
(BIG CHORDS)
JEARLYN (TO “NATURAL WOMAN”):
Maybe it’s time
Maybe it’s time
You think about Minnesota……’ http://prairiehome.publicradio.org/programs/2011/02/26/scripts/minnesota.shtml
I was listening to White Top Mountaineers on the radio last night – absolutely gorgeous music. Such charm and such a rich tradition of banjo picking. Replete with self deprecating humour. They had dinner with the family one evening. It was all chicken. Fried chicken, baked chicken, chicken casserole, chicken nuggets. They was it was a bit strange but ate dinner – and it was good.
After dinner sitting on the porch and pickin’ when a chicken came staggering around the corner of the house and fell over and lay on the ground.
‘Hey’, Martha said, ‘what do you reckons wrong with that chicken.’
“Well I don’t rightly know Martha. All we know is that they are dying faster than we can eat them.’
They like Australia to and we like them I found out last night. But the attitude is something that seems alien to the webster. He is all pompous self aggrandising and absurd abuse. I guess the nexus of redneck USA is Minnesota and not the Appalachians.
I am all over this crazy Australian Larrikinism.
And of course the crazy Chief Hydro will adopt all sorts of sockpuppet names such as Capt. Kangaroo to try to pin his inadequacies on me.
That is called pure projection.
Given that there are 8+ commenters from Australia on this site with crackpot theories (and some other questionably unbalanced such as Beth), and given that the USA has almost 14 times the population of Australia, then statistically you might imagine that there would be at least 100 American crackpots commenting here.
In fact there are only a handful of wacko American commenters, and they are really pitiful sad-sack characters such as Oliver, HAP, and Joe’s World. They can almost compete with Girma.
Hmmm …. maybe what we are seeing coming out of the Aussie commentary are Black Swans or maybe these are the the Dragon Kings that the Chief is always yapping about. Yes sir, these crackpots are Dragon Kings. They are Sky Dragon Kings!
The climate geniuses coming out Australia are more numerous than one originally imagined. Who would have thunk it? Ahh, but remember the first Black Swan was discovered in Australia …
All hail the Australian Black Swan Sky Dragon Kings !
The redneck mouth from Minnesota. Is that a mixed metaphor? Try at least not to just say I’m not you are. Have a bit of style about it. Study Mike that’s the go. Redneck, hive-bozo, greenshirt creep out etc etc but try to be original. Try not to repeat things endessly either. Embellish, develop a patter but be constantly creative. As it is – we have heard it all before and frankly it was tedious and stupid the first time.
You didn’t count yourself as one of the biggest space cadet wack jobs on the net. That’s gotta count for something.
And let me be very clear – the parable of the suiciding nurse above is just Minnesotan redneck insanity.
It was worth the wait – the pinnacle of Web’s intellectual achievements thus far:-
– the prank callers are from Oz
– some sceptics are from Oz
– therefore CAGW is true
Can she ever top this?
You should watch what you say. I have never used the term CAGW or catastrophic AGW on my blogs (since I started in 2004) or here. So that is a completely false premise.
I even have trepidation of looking at recent temperature time series because I know the theory and practice of noise at a fairly detailed level. And these are noisy time series, so can laud Vaughan Pratt for applying interesting signal processing techniques to extract the signals from the noise.
Yet, by that same experience I can judge when the statistics of some process show an obvious trend. The fact that Australians are overly represented on this site (and residents or ex-patriots of the British Empire to a lesser degree) says that there are tribal and cultural influences at work here.
For Australians, it probably comes down to the mocking of authority and practicing mischief that a certain subculture is known for. That is the basis for the term Larrikinism.
For the Brits, it is the joy of argument and perhaps the fact that they are free from legal troubles for saying the wrong thing on a USA-based commenting site.
What you and other rethugs should read is Nate Slilver’s recent book “The Signal and the Noise”. You will find that numbers and statistics have underlying meaning and one can infer sociological meaning as well as physical meaning from the numbers as presented.
Yes, I am guilty of using a single anecdote with the nurse suicide, but that was meant to call attention to the circus of pranking mischief that the Aussie commenters have cultivated here by infiltrating their tribal influence.
Chief Kangaroo
When you get a minute.
Caz, they are not really oscillations. They are weakly damped decay responses due to the differences in ocean/atmosphere sensitivities to difference forces and feedbacks. 1470 +/-500 years is roughly the Bond Event timing, but they are not very consistent. Some of the solar harmonics are pretty reliable though.
https://lh5.googleusercontent.com/-V3BcTzzsesU/UL-q6KsdAXI/AAAAAAAAF4w/HyaBLOtva7o/s835/ocean%2520atmosphere%2520lags.png
Bintanji and Van de Wall have a paleo reconstruction that rocks as far as the 100 year interpolation. That plot I made by normalizing the surface temperature by dividing by standard deviation (4.2) and the deep ocean temperature (0.82). The difference shows the lead/lag between the two.
ftp://ftp.ncdc.noaa.gov/pub/data/paleo/contributions_by_author/bintanja2008/bintanja2008.xls
So no 1ka oscillation then. Why not just tell caz that (s)he is mistaken?
Why, instead, do we get *reams of shite* from you and Captain
FruitcakeSkippy?You supposed rigorous men of science are doing an extremely poor job of pointing out a simple error by a single commenter.
I wonder why that is?
BBD, “Why, instead, do we get *reams of shite* from you and Captain Fruitcake Skippy?” You perceive reams of *Shite* because you are as confused as Doug Cotton. I have been pretty consistent in referring to weakly damped decay responses, recurrent responses, internal heat imbalances and transfer rates, though I am forced to refer to some “oscillations” because some have that in their name, PDO, AMO, AO, AAO, JO, QBO, NAO. I didn’t name them.
If you look at that chart, the normalizing by dividing by standard deviation and then taking the difference, is not like super advanced math. Tdo, the Temperature of the Deep Ocean reconstructed by Bintanji, leads and lags Tsurf, Temperature of the surface, because the two respond differently to forcings and feed backs. The differences in heat capacity and uptake/discharge causes the leads and lags. Pretty simple basic stuff. If you look at the standard deviation of Tdo of 0.82 and my online handle, you may have an epiphany. The Standard deviation of Tsurf, might also turn on the light bulb. Which has the most thermal mass?
BBD, My well thought out comment must have gone to spam So here is the short version, Pftttt!
BBD, I will attempt another detailed response, but this too may go to spam.
I consistently refer to weakly damped decays or recurrent response patterns. Oscillations are forced on us by the names given for some of the shorter term patterns. They are more accurately called Pseudo-cycles or quasi-oscillations.
Some of the longer term patterns are still stuck with the “oscillation” because of convention, but they are still Pseudo-cycles, quasi-oscillations, weakly damped decays or just recurrent patterns of unknown origin.
The Bintanji Van de Wal reconstruction is one of the few that has consistent time intervals, 100 years in this case, which easily allows simple comparisons. Normalizing and subtracting Tsurf(norm) from Tdo(norm) shows the lead lag relationship between the surface and deep ocean responses to forcing and feed backs. The Tsurf(norm) minus Tdo(norm) provide a very basic indication of the shapes of the various responses due to the internal system lags. Some of the more pronounced pseudo-cyclic patterns are given names. The ~1000 year occurrence is not an oscillation, but likely a recurrent weakly damped decay pattern due to orbital forcing variations.
BTW, Tdo standard deviation is 0.82 for the past 500ka and Tsurf is 4.2. Why do ya think that is?
You may what to make a note of that.
They are not cycles as captdallas says. My precise comment was that there is variability at all scales. Why do you insist of frothing at the mouth about irrelevant points? Who gives a rat’s arse.
vukcevic | December 5, 2012 at 5:57 am |
During the last 100 years or so, solar cycle period was on average 10.54 years, while theHale cycle is twice as long. This means that Solar coronal mass ejections CMEs in the even-numbered solar cycles tend to hit Earth with a leading edge that is magnetized north. Such CMEs open a breach and load the magnetosphere with plasma starting a geomagnetic storm .
Geomagnetic storms hit the Arctic, induce strong currents, disturbing the Earth’s field and feed back into the oceanic currents, releasing some of the stored heat during the previous cycle (with less geomagnetic input):
Sigh. That is not how it works. There is a weak 22-yr cycle in geomagnetic activity, but it goes from solar maximum to solar maximum, not in sync with the odd-even numbering. Explanation in section 9 of http://www.leif.org/research/suipr699.pdf
The bit about oceanic currents is also completely wrong.
Hi Doc
Nice to here from you. I hope Japan trip was success.
Yes, the solar 22 year cycle is pretty weak, but the Earth’s magnetic field has strongish 22 year component too.
Coincidence is highly unlikely, so is the Earth’s 22 year magnetic ripple induced by the solar, or do they have a common source?
p.s.
your trip inspired this little ‘gem’
http://www.vukcevic.talktalk.net/NoaaD.htm
the most of people attending to this blog can reproduce it, and wonder at the mother Earth’s capacity to surprise.
All the mumbo-jumbo in this poster can be summarized as follows. If you postulate that there was some earth internal process that lifted earth temperatures from 1910 to 1940, and remove the effect of this putative process from the data, you get a continually increasing temperature curve in the last century or so (except for the last decade). We may paraphrase this by saying if it wasn’t for the fact that the temperature did not rise with a continually increasing curve, it would have risen with a continually increasing curve. Just like in tennis: If I hadn’t double faulted, I would have gotten my serve in.
Yes there is such a process from 1910 to 1940, but again the same process lifted temperatures from 1975 to 2005, for even greater amount as I show here:
http://www.vukcevic.talktalk.net/EarthNV.htm
4-5 prominent scientists (two are climate) have details of my calculations. They question mechanism but not result of calculations.
Dr. Pratt should treated both sections equally, then he would found out that is not exponential and nothing to do with CO2 formula.
@DR: In place of your summary I would summarize the “mumbo-jumbo” as
(i) representing HadCRUT3 as a sum MUL + SOL + DEC of low, medium, and high frequency components, with MUL as the component of primary interest defined as F3(HadCRUT3);
(ii) fitting a 9-parameter analytic function (namely AGW+SOL) to MUL with an R2 of 99.98%.
The latter should be construed merely as a hypothesis about multidecadal climate (namely that it can be modeled in this way) that is in the running with other hypotheses.
A random time series with 162 points when filtered with F3 can be expected to require at least 14 parameters to model it with an R2 of 99.98%. That this hypothesis can model F3(HadCRUT3) with only 9 parameters makes it an above-average hypothesis and therefore in the running to compete with other hypotheses about multidecadal climate. If anyone knows of a good alternative hypothesis that isn’t overfitted, i.e. that doesn’t use 14 parameters to model MUL (or whatever you prefer to define as multidecadal climate) I’d be very interested to see it.
Ordinary Fourier analysis would be an example of overfitting. Every dataset can be Fourier analyzed, and the result is only interesting when you can say something meaningful about the resulting frequency components. For a random 162-year time series filtered with F3, expect around 7 significant sinusoids specified with 15 parameters (one to specify the fundamental, the rest specifying amplitude and phase of each sinusoid, the frequencies are all determined by the fundamental).
Dr. V,
put this way, I’m more curious about your result than on first read through.
So, scratch me from the critic column and put me in the curious column, but not the convinced column
Put me in your column, David. I’m not convinced myself, though I’m certainly very curious. My analysis is nothing more than one way to decompose HadCRUT3 — it certainly doesn’t rule out the possibility of better decompositions. A better one would be great!
If only the real world was made up of physical processes that were limited to sine waves.
It isn’t. And even if we assume that there are X “significant” sources in a signal, Each X has it own waveform morphology, usually not even cyclic, which is composed of a fundamental and Y different “significant” harmonics. And of course it is entirely possible the fundamental is of zero magnitude (and the signal comprised of only harmonics). Now throw in the fact that signals that are modulating via frequency and/or amplitude (i.e. all real signals) exhibit frequency side lobes. Even signals that are cyclic, but have distinct phase changes exhibit a large amount of interference in lower frequency bands. And guess what? Real signals don’t line up with the center bands of each freq bin, making discriminating signals of close frequency near impossible to discriminate. I could go on.
The point is that doing frequency analysis on mixed real world signals with a bunch of unknowns is simply scrambled eggs. In my experience if you can’t see the signal with your eye in the timeline with this type of analysis, you aren’t likely to find it using frequency analysis. FFT’s are useful to more precisely measure certain types of cyclical signal characteristics of signals you know are already there, less useful for finding them.
Is the return from a frequency bin a fundamental, harmonic, side lobe, phase distortion? With this type of signal, probably all of the above and more.
You.cannot.unscramble.this.with.a.FFT. It’s not a very useful tool for this type of data.
Vaughn – what you have done with HadCRUT is worthless. You are obviously a computer whiz and are having fun applying your trade. But the dataset you are working with isn’t what it seems to be. It has numerous errors in it and that alone is enough to make your output GIGO. Furthermore, it is not worth including ill-defined climate cycles into your analysis. And those seismic events at the core-mantle boundary sound an awful lot like deus ex machina to improve your curve fit. Furthermore, you are still talking of sensitivity being 2.8 Celsius when it is exactly zero. That follows from Ferenc Miskolczi’s work who showed that water vapor feedback is negative, not positive as IPCC insists. They absolutely need that positive feedback to create those preposterous warming predictions of theirs. Miskolci showed that according to NOAA database of radiosonde measurements of infrared transmittance of the atmosphere the transmittance of the atmosphere remained constant for 61 years. At the same time CO2 concentration of the air increased by 21.6 percent. His theory had predicted that IR transmittance should remain constant, IPCC greenhouse theory required that it should go down. It did not go down which gives a decisive victory to Miskolczi. Hence, you may consider the greenhouse theory dead. Let me now explain how screwed up the data are that you worked with. There are three kinds of errors in it: historical errors, deliberate anthropogenic distortions, and unintentional anthropogenic errors. The most glaring historical error is distorted World War II climate. The early twentieth century warming started in 1910 and stopped abruptly with World War II cooling. But temperature curves show it as a heat wave, not cooling. HadCRUT has two peaks there, the last one showing a precipitous drop of temperature in 1944. That drop belongs in 1940. No one seems to know that the Finnish Winter War of 1939/40 was fought in minus forty Celsius. Or that General Frost and not the Red Army saved Moscow from Hitler. The Germans could see the suburbs of Moscow but their tanks were frozen in place, their soldiers were dying of cold in their summer uniforms, and their supplies could not move. Some heat wave. Apparently they all copied this fiction from each other. Next lets take unintentional anthropogenic errors. These are not unique to HadCRUT but are also found in GISTEMP and NCDC temperature curves. They are sharp spikes that extend upward from the temperature curve. They may at first seem indistinguishable from noise. They are of various lengths, some extending up by as much as 0.2 to 0.3 degrees. So why do I call them anthropogenic? Very simple – they all occur in the first two months of a year. No natural process can do that. For the satellite era I have identified such anthropogenic spikes at the beginnings of the years 1980, 1981, 1983, 1990, 1993, 1995, 1998, 1999, 2002, 2007 and 2008, plus others I am not too sure about. I suggest you verify that by observation. I do not know when this started. It is pretty obvious that they are an unintended consequence of some kind of computer processing that these data have been subjected to. They are in the exact same places in the other two datasets above. This commonality of anthro spikes in theoretically independent datasets bespeaks of a common origin. What kind of data processing was done, what its purpose was, or who authorized it, is a complete mystery. They are there and you just might be the person who can write a program to detect them so they can be eliminated. Knowing that vital climate observations have been secretly computer processed requires that the purpose of such processing should be made public and explained. Finally, the most serious rerror is anthropogenic distortion of temperature rise since the eighties. What they have done is to give the temperature curve an upslope called the “late twentieth century warming.” It does not exist. In the eighties and nineties global mean temperature was constant and there was nothing but a series of ENSO oscillations until the super El Nino of 1998 appeared. The step warming it brought was the only real warming of the satellite era. In four years global temperature rose by a third of a degree and then stopped. Its cause was oceanic – warm water carried across the Pacific by the super El Nino. It stayed warm but there was no further warming after that. The warmth did have an influence on such things as animal migrations but talk of continuing warming from Hansen & Co. is just rubbish. There is this further interesting twist to this, namely that the latest HadCRUT3 release shows cooling for the twenty-first century while the conferees in Doha are still babbling about warming. HadCRUT3 of course has inflated the climate by that phony late twentieth century warming, easily by a tenth of a degree or more. And so did GISTEMP, NCDC, and NOAA. But GISTEMP and NCDC have decided to become honest and their August release shows a revised section in the eighties and nineties with constant global temperature, like it should be. I had been harping about this ever since I published “What Warming?” where I showed that according to satellites, global temperature of the eighties and nineties had to be constant. But HadCRUT has not followed suit on this and still shows that phony late twentieth century warming. I could say, what do you expect from people who gave us the Climategate scandal?
Your claims are quite wrong as demonstrated by the following agreements.
http://www.woodfortrees.org/plot/gistemp/plot/hadcrut3gl
http://www.woodfortrees.org/plot/crutem4vgl/plot/best/from:1850
http://www.woodfortrees.org/plot/hadcrut3vgl/from:1979/plot/uah/offset:0.25
Unfortunately the satellite data only begins in 1978. The particularly striking flat portion of MRES is from 1860 to 1950, which is strong support for my point that global warming can already be observed starting in 1860 as shown in Figure 2, Observed Global Warming or OGW, and follows a curve that is in remarkable agreement with what the greenhouse effect hypothesis should predict.
If you have an alternative widely accepted dataset that (a) covers the period 1860-1950 and (b) an alternative description of it that does not entail as strong a rise over that period as HadCRUT3 does I’d happy to evaluate your claim that global warming is not happening based on your dataset and analysis. But keep it short: if it is 10x as complicated as my analysis or more I’m afraid I won’t have time myself to evaluate it.
Vaughan
Through an evaluation of BEST and CET I demonstrated that global warming was apparent from the start of the instrumental era in 1660.
http://wattsupwiththat.com/2012/08/14/little-ice-age-thermometers-historic-variations-in-temperatures-part-3-best-confirms-extended-period-of-warming/
Both Giss and Hadley can be seen to be merely staging posts in the already long established warming trend and not the starting post.
tonyb
Tony,
I looked at your WUWT article and ran across the following.
BEST has been broadly level in recent years, which does not reflect the reasonable historic correlation between the ‘tendency’ of the two graphs as can be seen by following the trend lines since the start dates, albeit those of BEST seem at times to be exaggerated, perhaps reflecting Britain’s temperate climate.
Here’s annualized BEST over the most recent 20% of the whole BEST dataset, namely since 1970, at WoodForTrees. Where exactly are you claiming it starts to become “broadly level?”
Vaughan
You’ve taken that slightly out of context. The full quote was as follows;
“The crossover point of BEST and CET around 1976 –when BEST starts to rise steeply- may or may not therefore reflect that one record allows something for uhi whilst the other doesn’t.
CET has been in steep decline since around 2000.
http://www.metoffice.gov.uk/hadobs/hadcet/
BEST has been broadly level in recent years, which does not reflect the reasonable historic correlation between the ‘tendency’ of the two graphs as can be seen by following the trend lines since the start dates, albeit those of BEST seem at times to be exaggerated, perhaps reflecting Britain’s temperate climate.”
My point was that there is reasonable correlation between the two datasets (often surprisngly good at times) There was a crossover point betwen the two around 1976 and whilst BEST has been reasonably flat in recent years-the last decade-CET has shown a decline,
A measurement since 1970 as you have done was not my meaning of ‘recent years.’
We seem to have both datasets broadly agreeing with each other until recently. Perhaps BEST will follow the way of CET in the next year or two or perhaps something else is going on that has broken the link. If the latter we can examine the allowance the MET office make for Uhi which is not reflected in the BEST data.
tonyb
@climatereason: There was a crossover point betwen the two around 1976 and whilst BEST has been reasonably flat in recent years-the last decade-CET has shown a decline,
Thanks for clarifying “recent”, Tony. One decade, got it.
The plot at top left of these figures confirms that BEST has indeed been “reasonably flat” during the decade 2000-2010.
Unfortunately the three graphs immediately below confirm that BEST has been “reasonably flat” during the three preceding decades as well.
So I don’t understand the point of your observation that BEST has been flat during the most recent decade when exactly the same can be said of all three preceding decades.
(This is merely a way of visualizing graphically the point articulated statistically by Santer et al, and others even earlier, who they say that one cannot see global warming in a single decade. It’s like watching paint for a minute to see whether it’s drying.)
tony i’m not so sure I would rely on woodsfor trees representation of BEST.
I would check that he is grabbing the latest up to date data.
WRT to comparisons with hadcrut, we can show definitively that the had cru averging approach leads to higher uncertainty and bias when tested using synthetic data where the truth is known. Also, one can show how in some cases adding more data to hadcrut methods leads to worse performance.
WRT to CET. I’d probably have to llok more closely at there methodology for constructing the series, but I’d be surprised if it could outperform an approach known to be optimal. I’ll call that an open question.
So many people just accept CET because it suits them without doing a proper examination and testing of the methodology.
Here is a nice little factoid. are you aware there is no methodology paper for GISS or hadcrut or CET ( that I know of) that demonstrates the method they use does not introduce bias?
Folks might want to practice skepticism more consistently than they do.
For something to be “known to be optimal,” shouldn’t it at least have been published? Sharing pre-publication work is good and all, but if no response is given to peer review, it’s hard to understand how the results could be “known” to be right, much less optimal.
Or is this another one of those cases where someone decides they “know” something, thus it is “known” to be true?
@Vaughn
… strong support for my point that global warming can already be observed starting in 1860 … and follows a curve that is in remarkable agreement with what the greenhouse effect hypothesis should predict.
Yet even the IPCC, in their unfaltering commitment to CAGW, claim only the post-1960 warming is down to greenhouse warming.
@Memphis: the IPCC, in their unfaltering commitment to CAGW, claim only the post-1960 warming is down to greenhouse warming.
Indeed. The odds of an outsider like me changing the IPCC’s collective opinion on that in the near term probably isn’t very high.
@Vaughan
To what do you attribute the IPCC’s failure to seize on your even more juicy and clear-cut brand of alarmism ? Their mandate would clearly predispose them to run with this idea, so why haven’t they ?
Vaughan said, somewhat tongue in cheek (I assume)
“Thanks for clarifying “recent”, Tony. One decade, got it.”
If your favourite football team had won their league within the last decade you would say that was ‘recent,’ If they had won it in 1970 you would say it was a pretty long time ago! I was , as you must realise, pointing to the ‘recent’ relatively flat period over the last decade or so noted by most data sets. Cet has shown a decline.
Whilst interesting it is far too short a period to start talking about trends. My money would be based on an assumption that the warming we can observe-in fits and starts- over the last 350 years or so- will resume, if only because its such a long term trend.
I’m not sure I woud agree that looking at the previuous thirty years also demonstrates flatness. If so we might as well disband rhe IPCC as their role has become pointless.
I would however totally agree with your final point that you can’t see global warming in a short period. I have had graphed the entire extended CET period in ten year and fifty year blocks.
It is interesting to see how often the temperature of one decade is so different to the preceding or following decade that it could be called a climatic shift ( I have tried without success to get a proper definition of ‘climatic shift.’)
These sudden decadal changes tend to become ameliorated over the 50 year period with shifts rrestricted to 0.25C except the fifty year period commencing around 1660 which is by far the greatrest shift in the entire CET record. If you want to see the graphs just email me.
tonyb
Brandon. You shouldnt try to read between lines. because what you think Im talking about is not what I am talking about. The method I am talking about has been published many times and used many times.
If you think that kridging is not BLUE please collect your nobel after showing that.
Since CET is about .01% the area of the Earth, with a far higher level of technology during 1600-1800 than over 95% of the rest of Earth’s surface, it should not be surprising that such a tiny region so dense with technology would see global warming in the 17th century. This would not be due to CO2 however but more likely brown-cloud pollution localized to that region.
Tiny areas like Central England are not at all representative of how the temperature of the globe has evolved in recent centuries.
Furthermore, if CO2 had the postulated effect, it wouldn’t be physically plausible that AGW started before ~1960 – the emmited quantity was insignificant compared with the emissions after ~1960.
http://www.nature.com/nclimate/journal/v2/n1/images_article/nclimate1332-f1.jpg
Mosh said to me
“WRT to CET. I’d probably have to look more closely at there methodology for constructing the series, but I’d be surprised if it could outperform an approach known to be optimal. I’ll call that an open question. So many people just accept CET because it suits them without doing a proper examination and testing of the methodology.
Here is a nice little factoid. are you aware there is no methodology paper for GISS or hadcrut or CET ( that I know of) that demonstrates the method they use does not introduce bias?”
Not sure of your exact definition of ‘bias’ in this context but the original Manley paper and Parkers follow up were highly sceptical and discounted much information as possibly having a bias. I have linked to them before.
The original Giss/Lebedeff document is another matter. As far as I could see Hansen used many of the global data sets that Callendar had used in his 1938 paper on Co2. These were called into question at the time by various Met organisations one of whom called Callendar ‘an amateur’. (which may have been professional jealousy of course)
tonyb
Over the period covered by both records, CET and global temperature indices show very similar overall trends and variations.
Vaughan said
“Tiny areas like Central England are not at all representative of how the temperature of the globe has evolved in recent centuries.”
Sorry Vaughan, that isn’t correct. In my study of reconstructions by Lamb and Mann carried here;
http://judithcurry.com/2011/12/01/the-long-slow-thaw/
I researched many climate scientists (ancient and modern) who saw a very clear link between CEt and global temperature. For the sake of brevity in an already long article I discarded another ten or so references demonstrating this link.
I don’t want to claim for a moment that the link is infallible, but its often pretty close as can be seen in the graphs I posted earlier.
I side with Hubert Lamb in this correlation who said (in a slightly different context) that with this old data ‘we can see the tendancy but not the precision.’
tonyb
Steven Mosher:
And you shouldn’t make comments that are so vague as to be useless. But since you often do, we have to “read between lines” as best we can.
It’s true, I assumed you were referring to something someone has actually done, not a hypothetical kriging implementation that hasn’t actually been implemented. I suppose that was a mistake.
But that does nothing to redeem what you said. You said kriging is “known to be optimal.” For that to be true, there would have to be no approach that could work better than kriging. Nobody has ever done anything to show that is true. Kriging is useful. It is better than a number of other approaches. It is not known to be optimal.
Anyway, I’ll try not to read between the lines in your comment from now on. Instead, I’ll just stick to what you explicitly say, such as nonsensical things like:
If something is optimal, then by definition, nothing can out perform it. Like you, I’d be surprised if something that couldn’t happen happened.
By the way, I stand by my interpretation of Steven Mosher’s comment. He said a particular approach is “known to be optimal.” For something to be known to be true, it’d have to have been examined. As far as I know, nobody has ever examined kriging and decided it is “known to be optimal” for constructing global land temperature fields.
Now then, if BEST believes it has done so, Mosher’s comment would make sense, as would mine. If BEST has not done so, then Mosher’s comment wouldn’t make sense. Naturally, a response which assumes coherency from Mosher would be wrong if Mosher was incoherent.
So unless there is some body of work I am unaware of that shows kriging is the optimal approach for this problem, not merely a useful approach, my interpretation was the only one that makes sense.
I don’t think my ability to read between lines should be called into question when I come up with the only interpretation that makes sense.
Regarding optimality of kriging, see here for a brief treatment of its properties. Note in particular Cressie’s 1993 caveats.
Sorry about the formatting…verdammte WP. Lucia does a much better job.
[My apologies. Ihope this is easier on the eyes:
A couple of comments for the Steven Mosher, Vaughn Pratt, Brandon Schollenberger sequence…
It would seem that a concise definition of BLUE embedded in the context of kriging and other interpolation methods might help some folks reading along. From the start of Chapter 12 on ordinary kriging of Isaaks and Srivastava (An Introduction to Applied Geostatistics):
“Estimate” here refers to point estimation. (Universal kriging is also a BLUE.)
Vaughn Pratt calls attention to some limitations (Cressie 1993), a couple of which are worth noting and expounding on here. First, “no properties are guaranteed, when the wrong variogram [or correlation function — mwg] is used. However typically still a ‘good’ interpolation is achieved.” Though error estimation was not not done (more accurately, not reported or discussed) in the BEST study, kriging by its nature does a lot of error estimation. Indeed it was initially puzzling to me why those particular capabilities were not exploited by the BEST team. In a nutshell, I have concluded that perhaps this is because anisotropy is not considered in the correlation function (variogram). [Or given the amount of data being used, the crush of schedule may have lead to prioritizing activities in the first cut.] However, that is neither here nor there because only the (point) estimates are used in this round of BEST, and as noted above the interpolation done by the kriging would probably be OK. This does seem to impose some reasonable limits using the term ‘optimal’ in regard to the current BEST calculations but in fairness I think the improvement in ‘global temperature(?)’ methodology that is accomplished far outweighs that nit for the time being. Only one Pinocchio is assessed.
There are a couple of more points particular to BEST to make before leaving that topic of variogram (ugh, correlation). For a number of physical reasons, e.g., geography it is hard to believe that the use of an isotropic model (correlation/variogram) will ultimately remain viable. The range of the correlation is on the order of several hundred to a thousand kilometers. Consider the dimensions and orientation of mountain chain throughout the world: e.g., the Appalachian, Urals and Rockies are roughly on the order of a few hundred kilometer wide and thousand(s) of kilometers long.; also ridge-valley structure, on the order of 10s of kilometers occur. These changes both have orientation and occur at scales much less than the correlation range, and at ranges comparable to useful grid sizes. Care in needed. Also because the orientation of geographical features vary from region to region it would seem that the anisotropy is location dependent–a good reason to ignore it on the first cut.
The second point in regard to the correlation/variogram is that the data are clustered around urban areas. While kriging handles some effects of clustering in its weighing scheme, it is dependent upon the variogram/correlation and that can be very sensitive to clustered data. Also, I wonder if what sort of sample support** issues may be hidden in the data–this would impact all of the statistical treatments well beyond kriging. I would expect that when kriging gains more traction in the global temperature game these topic will be examined thoroughly. This is a lot of work–nobody should tell themselves otherwise.
Finally, Cressie, as do Ed and Mo, points out that there might be better nonlinear or biased methods, e.g., indicator kriging to generate a temperature pdf. But what is ‘better’? Perhaps ‘appropriate’?
A note to the unwary–correlation functions and variograms are related but are not the same. BEST uses correlation functions. (To make matters worse, the term variogram is usually referring to an entity called the semi-variogram.) Don’t sweat it here. This is a comment only.
Edim
You commented that essentially all of the CO2-induced AGW came after 1960.
If we assume the warming all came from CO2 we have
Co: 1750 – 280 ppmv (IPCC, based on ice core data)
C1: 1960 – 316 ppmv (Mauna Loa)
C2: 2012 – 393 ppmv (Mauna Loa)
ln(C1/C0) = 0.1210
ln(C2/C1) = 0.2181
So (excluding any time lags) CO2 warming after 1960 was theoretically around two-thirds of the total.
This is because of the logarithmic relation. The higher the concentration the lower the impact of an added ppmv of CO2..
But you’re right. The annual increase in forcing (and warming) from CO2 prior to 1960 was negligible.
That is why the early 20th century warming cycle (~1910 to ~1940), which is statistically indistinguishable from the late 20th century warming cycle (~1970 to ~2000) is difficult for the climate models to explain.
Max
Max,
There is a well defined consensus theory on temperature ‘anomalies’ and attribution since ~1900, there’s no need to guess:
http://earthobservatory.nasa.gov/blogs/climateqa/files/2010/05/natural_anthropogenic_models_narrow.png
There are many graphs like that and they all look the same, the divergence between ‘human’ and ‘no human’ starts in ~1960. This is plausible IF CO2 had an effect, and I think it doesn’t. If anything, it has a cooling effect (atmospheric IR radiation to space).
I don’t think the early 20th century warming is that dificult to explain (mostly solar?), but the early 21st century cooling will be more and more difficult to explain with the consensus science. They will try with natural variations, aerosols, OHC and ‘future warming’, but sooner or later it will all collapse. I think almost one third of all human CO2 is emitted since ~1998 and there’s been no warming since.
Edim: If anything, it has a cooling effect (atmospheric IR radiation to space).
Well, it certainly is true that those frequencies at which CO2 radiates strongly are radiated to space, so you’re right there. However increasing the level of CO2 decreases that cooling effect. This is because the more CO2 there is, the higher that radiation comes from. (The altitude it used to come from is now blocked above by the additional CO2.) But higher altitudes are colder, and colder objects, whether solid, liquid, or gas, radiate less strongly. So the upshot is that more CO2 weakens the cooling effect you refer to.
The same principle explains why a blanket or thick jacket keeps you warm on a cold day better than a thin one (assuming no wind, which adds the cooling effect of convection to that of radiation). The outer surface of a blanket is colder than that of a thin one and so radiates less heat away.
This is why CO2 can be viewed as a heat-trapping blanket: it works essentially the same way as a blanket (on a cold day without wind anyway). The back-radiation explanation of the greenhouse effect that people used to prefer until recently is less satisfactory because it has the kinds of problems I pointed out 16 months ago in an article on this blog, which was received at the time with only slightly more enthusiasm than Galileo’s heliocentric account of planetary motions: at least no one suggested I be placed under house arrest for it!
@vaughn and the CO2 blanket
Does more CO2 really mean a thicker blanket, or is it rather a denser blanket, wherein the mean free path for re-radiated IR from one CO2 molecule to another is now shorter ?
Vaughan, the Earth’s surface is free to cool non-radiatively (and it does so pre-dominantly, radiative cooling is secondary in average), while the atmosphere can only cool by LW IR radiation to space. Only the so-called GHGs can do this cooling – the bulk of the atmosphere insulates the surface. More than 90% of the terrestrial cooling to space is atmospheric radiation (GHGs and clouds), less than 10% is surface radiation.
http://science-edu.larc.nasa.gov/EDDOCS/images/Erb/components2.gif
Memphis,
The density of the blanket has little influence except at the outer edge because it has little influence on the lapse rate. That the troposphere is denser against radiative heat exchange means that a little less heat is transferred by radiation but that’s compensated by a little more convection (and latent heat transfer). That leads to changes in the troposphere, i.e. to feedbacks. The primary change is, however, that of the outer edge. There more CO2 leads to a change in the altitude of the level whose energy balance is controlled by radiation without a significant convective component.
The atmosphere acts as a blanket up to that altitude and raise of that altitude means that the mantel gets thicker.
The full picture is a bit more complex as some radiation can escape to space from all altitudes of the atmosphere and the surface. A bit unexpectedly an useful graph can be found from a paper that’s severely wrong in its conclusions, the 2010 paper of Miskolczi. Miskolczi has calculated the distribution of the altitude of the origin of the emission for a clear sky atmosphere. His method seems to be correct for this calculation and the result looks credible, but further I cannot tell whether it’s really correct.
From the linear version of the graph (on the right) we can see that a large part of the radiation comes from the altitudes 8-15 km. In this altitude range CO2 is the dominant emitter as there’s very little H2O left when the temperature is 210-240K as it is at these altitudes. Adding CO2 enhances the share of high altitudes while the radiation from lower ones is blocked more effectively.
I have noted before that Miskolczi should have paid more attention to this part of his calculation as that would have forced him to reverse his conclusions on the effect adding CO2 has. He was, however, fixed in looking at the surface balance which is very difficult to interpret and which he used to draw badly erroneous conclusions based on faulty logic.
The link should have been:
useful graph
Does more CO2 really mean a thicker blanket, or is it rather a denser blanket, wherein the mean free path for re-radiated IR from one CO2 molecule to another is now shorter ?
All of the above. Certainly denser, and the mean free path is shorter. But because the altitude for the “photosphere” for any given frequency is rising with increasing density, the blanket is also thicker when thickness is measured from the ground to that frequency’s photosphere.
@Edim: More than 90% of the terrestrial cooling to space is atmospheric radiation (GHGs and clouds), less than 10% is surface radiation.
Quite right (maybe as low as 6%). Did I say something that would suggest otherwise?
Vaughan Pratt
Just semantics, but at 393 ppmv, let’s call that “CO2 blanket” “a bit less dispersed” (rather than “denser”).
Otherwise folks get the wrong impression that there’s a “dense” CO2 blanket up there (which there isn’t).
Max
Good point, Max, at least on a non-technical thread. However I was treating this as a technical thread where the audience can be assumed sophisticated enough to know that “acidification” refers to reducing pH as opposed to decreasing the pH below 7. Your objection to “denser” is even less appropriate here since there is no scientific threshold of that kind between “dense” and “not-dense.”
+1
Especially about the step-change associated with the super El Nino in 1998 which is, by even a casual glance, largely the only warming in the late 20th century record and it all happened in a period of about 4 years. That certainly isn’t CO2. Pratt’s manipulations simply mask what happened by smoothing the series so step changes become curves. This is why you do not smooth a time series then use the smoothed data as input into a subsequent analysis.
@DS: This is why you do not smooth a time series then use the smoothed data as input into a subsequent analysis.
To be consistent you should object to the Vostok ice-core data on the ground that it smooths out anything faster than a couple of centuries. And you should object to the monthly Mauna Loa data, which smooths out the daily data. (Didn’t we already have this conversation a long while ago?)
You also need to distinguish between smoothing data and analyzing data into frequency bands. My decomposition of HadCRUT3 as MUL + SOL + DEC does the latter. This is lossless analysis because it can be inverted, namely by summing the three bands to recover HadCRUT3. Convolution with multiple wavelets (how I analyzed HadCRUT3) is a practical method of losslessly analyzing signals into frequency bands.
Incidentally the authority you cite on not smoothing a time series, William M. Briggs, is only at Cornell during summers. He says on his website, “I’d rather be teaching, so if you hear of a school (especially a faithful Catholic college) that needs somebody, let me know.” Briggs’ objection to analysis by filtering makes no sense, it is a fundamental part of both signal processing and image processing. If one followed his advice not to input filtered data into a subsequent analysis art critics could not analyze jpegs.
Everything is more complicated than you think. (anon)
Compared to science involving prediction as verification, historical investigations study past events looking to the authenticity of an
event, eg ‘how’ or ‘why’ or ‘what sort of event’ took place. Evidence
is of the kind, identification of a problem situation of the period or
place. Empiric data includes cross referencing or contextual data,
primary evidence may include physical and written records of the
event. Written accounts may be more, or less reliable depending
on the likely bias of the writer, cui bono, eg the public statements
of political leaders as players are more suspect than their private correspondence to a trusted associate.
Tony Brown and EM Smith discuss historical data, climate science
and number crunching on this thread, (5/12 @4.03/4.26am) In my
view, considering the last 16 years of no warming climate, science
has been unsuccessful in its role of prediction. Michael Mann’s
tree ring hockey stick, already criticized as a poor proxy for climate
didn’t predict this.
Tony Brown’s ‘Long Slow Thaw’ based on CET records and later
supported by C Loehle’s multi proxy climate study, cross
references voluminous empiric data on weather across regions,
UK and Europe eg frost fairs, crop failure data, famine reorts and
farmers’ accounts of seasonal shifts in planting times. These
provide strong contextual confirmation supporting CET on the
Medieval Warming period, Little Ice Age etc.
They offer what Winston Churchill termed ‘taking a military map
cross bearing’ on a situation and re bias, the anecdotal evidence
is not by generals, but by farmers and other people who had
nothing to gain by their comments on weather, such as ‘ This
year we have had no summer and thecrops have failed.
vukcevic | December 5, 2012 at 3:19 pm | Reply
Coincidence is highly unlikely, so is the Earth’s 22 year magnetic ripple induced by the solar, or do they have a common source?
Read my explanation http://www.leif.org/research/suipr699.pdf
Your ‘findings’ are spurious and the ‘physics’ is wrong. Try to learn something.
Vaughan Pratt
Thanks for your patience and good humor.
I think that this is a fantastic exercise. Playing with your spreadsheet may become a new addiction for some of us.
Thanks, Robert. That was certainly my hope.
Everyone starts at Level 1. Unlocking the seven locked sliders gets you to Level 2. ;) From there on I know I’m dealing with serious commenters.
Level 3 is ocean and atmospheric dynamics and level 4 unlocks the secrets of the universe. God is about to be reveaved.
For you maybe, CK, but for me level 3 is mucking with the formulas in the cells while level 4 is reorganizing the columns.
Disappointing. Perhaps we will wait for level 5 to refine the ‘explanation’.
I was thinking more along the lines of challenging the explanation than refining it. It evolved to where it is by challenging it myself, but I seem to have stalled there so it’s time for others to challenge it by coming up with a better hypothesis of how HadCRUT3 should be analyzed into components. HadCRUT3 = MUL + SOL + DEC, but obviously that’s not the only possible analysis. Is there another good one that indicates different conclusions?
Vaughan, I am a OpenSource user so the spread sheet don’t work, but since HADCRUT 4 has NH, SH and Tropics, wouldn’t it be interesting to compare the three?
Have you tried –
HadCRUT3 = MUL + SOL + DEC + TOARI
I understand that they have found the missing energy.
http://s1114.photobucket.com/albums/k538/Chief_Hydrologist/?action=view¤t=CERES_MODIS-1.gif
Vaughan Pratt
I’d second Robert’s “thanks” for posting this.
It is a fascinating statistical study that gets folks to thinking, even though many of us might not agree with the conclusion reached.
Max
Doha is Kyoto’s last gasp as the UN is ditched for the MEF.
‘Therefore, to completely escape from the discordant voices of a plurality and the ‘shackles’ of CBDR, the US may move away from the UNFCCC framework and seek an alternative policy platform. MEF seems to be a good candidate: it was proposed by the US, covers some 85 percent of the global emissions, and most importantly, makes no differentiation between its mere 17 members who would otherwise span both Annex I and Non-Annex I divisions. Through shifting its focus to work under the MEF, it is possible for the US to reach a consensus with the other 16 members instead of nearly 200 under the UNFCCC. And at the same time, the US can shift some of the burden which would otherwise have been borne by the Annex I countries to emerging economies such as China, India and Brazil. There are, therefore, logical reasons for the US to advocate the shift from UNFCCC to MEF.
However the consequence of the US abandoning the UNFCCC will be more far-reaching. Given its immense political and economic influence, if the US does take ‘leadership’ to move the talks from UNFCCC to MEF, many other parties with similar positions and interests (such as the Umbrella Group) might also follow. This may potentially trigger a mass exodus of the non-EU developed countries, which will seriously impair the integrity of the UNFCCC framework, and may even eventually destroy its efficacy all together.
And instead of a UNFCCC convention which will capture the view of all parties (albeit to different extent), MEF will at best produce a unilateral, lukewarm treaty that will preclude the interests of the nations which are desperate for urgent global-wide mitigation and adaptation efforts. For the US, this might be a victory: the commitment is now palatable at the domestic level, and developing countries like China and India are also on the mitigation boat together. But for the world, as we lose the UNFCCC, which is “the one and only place where formal negotiations and, above all, decisions take place and where treaties are negotiated” [1], the impact will be serious and irreversible.
Therefore, it is important for the US to stay committed to efforts under the UNFCCC framework, which will of course entail the US to not only have a greater domestic policy action, but also a long-term vision that sees “the pursuit of equity [not] as an obstacle, [but] as an opportunity to ensure all countries take on greater efforts.”
However, despite these speculations, exactly how the US’s position will play out in Doha remains uncertain. I will be following the US delegation and their negotiations closely, and report back on any first hand updates on the progress (which I sincerely hope, are progressive).’
The MEF set up by George Bush and John Howard has the benefit of being flexible and inclusive – as well as in ditching the opportunists and hive-bozos. So sad too bad.
A monomaniacal focus on humanity’s contribution to atmospheric CO2 has been Western academics’ Pyrrhic victory over reason. The mania reached a zenith with the obsessive compulsive melt down of Al Gore following his defeat by George Bush. Historians understand that for the 1000s of years before that it has been the Sun that captured the interest of scholars. Outside Western CO2-phobia the Earth’s climate is seen as the result of a holistic process; we don’t really understand it so we call it nature and we know that nominally it’s the Sun that is the cause of it all.
@Vaughn
http://judithcurry.com/2012/12/04/multidecadal-climate-to-within-a-millikelvin/#comment-
We know quantitatively, albeit roughly, from the work of Tyndall in the 1850s the extent to which CO2 itself … blocks the passage of thermal radiation; these days we infer this much more precisely from the HITRAN tables of spectral absorption/emission lines.
@Arno Arrak
http://judithcurry.com/2012/12/04/multidecadal-climate-to-within-a-millikelvin/#comment-
The theory of Ferenc Miskolczi says that the IR transmittance of atmosphere should not change when more CO2 is added to it … Using NOAA database of weather balloon observations Miskolczi was able to demonstrate that the IR transmittance of the atmosphere did not change
for 61 years while carbon dioxide percentage increased by 21.6 percent.
So who to believe ?
Actually Tyndall’s gear wasn’t sensitive enough to measure CO2 absorption of “calorific rays” as thermal IR was called back then. CO2 absorption band is narrow and his best, most stable source of calorific rays was at the boiling point of water which doesn’t generate a lot of energy in CO2 absorption bands as it’s too hot. He worked with other gases that exhibited much stronger absorption and most particularly for the greenhouse effect it was water vapor that held the greatest interest and was easy to measure. Tyndall had some particularly ingenius methods for drying his gases to avoid water vapor contaminating the results.
Be that as it may it doesn’t speak to Miskolczi’s work which you’d know if you knew anything at all about it. Miskilczi’s “saturated greenhouse” posits that as atmospheric CO2 increases an equal but opposite decrease occurs in atmospheric water vapor so that the net effect is no change in greenhouse efficacy. This is no way denies the IR absorptive properties of greenhouse gases so any mention of Tyndall are irrelevant and only serve to give notice that the mentioner doesn’t know his ass from his elbow about Miskolczi’s hypothesis.
Using NOAA database of weather balloon observations Miskolczi was able to demonstrate that the IR transmittance of the atmosphere did not change for 61 years while carbon dioxide percentage increased by 21.6 percent.
How exactly was IR transmittance measured?
And if this is indeed possible, can they not just measure the TOA radiation imbalance, and promptly settle whether or not it moves with CO2 levels or not?
The accuracy of the balloon sounding data Miskolczi uses is questioned by the usual suspects as to having precision and accuracy required for the task. Funny, ain’t it, how amongst the warmists contrary data is rejected but data from the same source that is not contrary is accepted without question.
Radiosondes (I’ve launched many of them and was a technician responsible for calibration and repair of the equipment used in the early 1970’s) return a constant stream of temperature, pressure, and humidity. Miskolczi found in the balloon sounding record that as atmospheric CO2 rose absolute humidity declined in direct proportion such that the extra greenhouse effect from CO2 was exactly cancelled by less greenhouse effect from water vapor. If the sounding data is not somehow discredited he’s got an airtight (pun intended) case.
More info:
THE STABLE STATIONARY VALUE OF THE EARTH’S
GLOBAL AVERAGE ATMOSPHERIC PLANCK-WEIGHTED
GREENHOUSE-GAS OPTICAL THICKNESS
by
Ferenc Miskolczi
Reprinted from
ENERGY &
ENVIRONMENT
VOLUME 21 No. 4 2010
http://www.friendsofscience.org/assets/documents/E&E_21_4_2010_08-miskolczi.pdf
Spencer explains in this blog post and ensuing discussion why Miskolczi’s claims are totally unjustified.
The post is lengthy but the essential points come perhaps best up in the discussion where Spencer replies correctly to comments that try to defend Miskolczi.
Stated simply: Miskolczi looks at differences that are known to be small and finds them small. Then he concludes without any real justification that they are exactly zero and this totally unjustified assumption leads to his conclusions. Observing that the differences are small is fully in agreement with the main stream theory and therefore cannot contradict to the least.
The whole Miskolczi paper is totally worthless and based on a combination of misunderstanding empirical data and making false assumptions.
No, that’s not what Spencer wrote. He wrote that he did that review reluctantly because he didn’t understand some of Miskolczi’s claims. He wrote that he doesn’t disagree with the conclusion supported by radiosonde data but that he disagreed with Miskolczi’s theory behind the negative feedback from water vapor. Spencer points out that suspiciously high radiosonde humidity data during the 1950’s and 1960’s might not be correct and if not then there’s no drying effect in the atmosphere subsequently.
Furthermore Spencer goes on to say that negative feedback from water vapor is a hypothesis that both he (Spencer) and Richard Lindzen have both proposed but the theoretical explanation behind it differs from Miskolczi’s.
Now Pekka, you must weasel your way out of what you wrote since it’s clearly in error.
I have some reservations about Spencer’s response where he states that greenhouse gases allow the atmosphere to radiatively cool itself.
Really, Roy? I was taught that all matter with a temperature above absolute zero radiates. Given that nitrogen appears in the Periodic Table it is ostensibly matter then it must radiate.
I think what Roy meant to say is that greenhouse gases allow the atmosphere to be radiatively warmed. Absent radiative warming it will still warm through conduction and convection and it will cool radiatively because all matter above absolute zero radiates and I’m pretty sure the nitrogen in our atmosphere is matter and it has a temperature above absolute zero therefore it radiates a continuous black body spectrum characteristic of that temperature.
Perhaps you missed this exchange in your shallow perusal. Perhaps you intentionally missed it. Perhaps your brain is weasel-like in size and strength as well as attitude. I’m not sure. But in the interest of making sure you mistakes are not believed by others here it is explained.
Ferenc Miskolczi says:
August 7, 2010 at 3:03 PM
Dear Roy,
Thank you very much for your time and effort to comment my recent E&E article:
Miskolczi, F., 2010, Energy and Environment, 21, No.4, 243-272.
But why do you confuse people? In this article we are not talking about competing greenhouse theories. The main point of the paper is that in the last 61 years the global average infrared optical thickness of the real spherical refractive inhomogeneous atmosphere is 1.87, and this value is not changing with increasing CO2 amount. This means that no AGW exists based CO2 greenhouse effect.
This is a very simple statement. To conquer this statement you must come up with your own global average atmosphere and optical thickness, and show the methodology of its computation.
It is irrelevant what you or K. Trenberth, R. Lindzen, or the RC gurus like G. Schmidt from NASA or R. Pierrehumbert, P. Levenson, ect. may guess, assume or believe about the physics of greenhouse theories. Even my theory which supports the 1.87 value is irrelevant. Here no useless radiative budget cartoons or GCMs, or assumed feedback processes or arbitrary constants are needed. You do not need to worry about what the global h2o, temperature and pressure field is doing and what is the relationship among them. The atmosphere and its radiation field knows exactly what it should do to obey the laws of thermodynamics, or how to obey the laws of the conservation of energy, momentum and mass, or how to obey the energy minimum (entropy maximum) or Hamilton principles on local, regional or global scale.
If you really want to know what is going on with the global average IR radiation field and you or your experts have some knowledge of quantitative IR radiative transfer, you (or the others) may compute precisely this physical quantity using only first principles and real observations. There is no other way around. The true IR flux transmittance, absorption or optical depth is fundamental for any or all greenhouse theories.
If you do not trust my 1.87, compute it yourself, see how it is changing with time and verify or falsify my computation. Here there are no theories to chose, but the correct straightforward computation of a single physical quantity which gives the accurate information about the absorbed amount of the surface upward radiation. I am patiently waiting for your results. It is not very easy, but you or your group may give a try. If you can not do this with your resources, then further discussion of this topic here is useless.
After we agree on this issue, we may start our debate on the theoretical interpretations of the results that was outlined in my 2007 Idojaras article, or on the questions how to relate the absorbed surface radiation to the surface temperature or to the downward IR flux density.
Ferenc
Spencer replies:
Roy W. Spencer, Ph. D. says:
August 8, 2010 at 6:13 AM
If you read and understood what I posted, Ferenc, I agreed that the *observational* result from 61 years of radiosonde data of a constant GHE (tau=1.87) is indeed intriguing, and possibly even true. (That it depends upon high humidities from the earliest sondes in the 1950s and 1960s, though, will not convince many people because there are so many instrumentation problems that affect long-term trends.) This is indeed a useful contribution, as I previously stated.
But you have not addressed what I *was* objecting to, Ferenc: People are using your work to claim that Ed=Aa, and I was discussing in detail why that might APPEAR to be the case, but cannot be the case for a greenhouse atmosphere.
You could help clairify things by answering the following question:
If atmospheric layers A and B each contain greenhouse gases, under what conditions will we find that the rate of absorption by layer B of layer A’s thermal emission equal the rate of absorption by layer A of layer B’s emission? Your answer to that question could potentially remove all my objections to this key issue.
In answer to Spencer’s question above, Ferenc understandably refuses to take the bait which would just lead to an irrelevant tangent about local thermodynamic equilibrium (LTE). Miskolczi is a physicist. Spencer’s question is insulting. There is very likely a language barrier and Spencer should perhaps have assumed that Miskolczi is a physicist, knows the difference between LTE and GTE and simply inferred something that Miskolczi never meant to imply.
Anonymous says:
August 14, 2010 at 7:56 PM
Dear Roy,
I am very sorry, that you feel that you have to comment something that you do not understand. I admit that because of the very technical nature of the paper, it is difficult to digest.
In this debate the most important thing is that you and I must have a common understanding of the physical laws and the terminology. I suggested you that, the best way to proceed is that you and I compute the same physical quantities – for example for your favorite global average atmospheric structure – and when we agreed on tau, Ed, Su, Eu, OLR, etc., then we start to analyze the relationships among them. I do not really care what you believe. I only care what you know for sure and what you can prove.
If you do not mind, I shall not answer or elaborate your quiz. I did answer such questions forty years ago at my first astrophysics course at the university. However, you may easily answer your question yourself, if you figure out what Eq. 7 means.
On the other hand you say: “…People are using your work to claim that Ed=Aa, and I was discussing in detail why that might APPEAR to be the case, but cannot be the case for a greenhouse atmosphere….”
Think about – qualitatively – the new Trenberth-Fasullo-Kiehl cartoon: 1.87=-ln(1-Ed/Su) or Ed=Su*(1-exp(-1.87) ) or Ed=Aa. ( Ed and Aa are global average measured quantities.) If you agree that tau=1.87, in your view does this mean that the Earth’s atmosphere is not a greenhouse atmosphere???
We arrive again at the same problem. To make quantitative statements on the degree of anisotropy in the Ed field you must produce numbers. Those numbers will tell you what is the physical meaning of the spherical emissivity (fudge factor ??), and you will see, that in monochromatic radiative equilibrium it is required by the law of the conservation of energy.
And finally, I think you should assume that everybody joining this discussion has his own independent and decent scientific view of the topic.
Ferenc
Then Spencer, poor fragile thing, feigns injury:
Roy W. Spencer, Ph. D. says:
August 27, 2010 at 6:23 AM
….everybody but me, apparently.
David,
If I can recollect correctly our earlier discussions we do agree that the surface radiative balance is not essential because convection and latent heat transfer fill up the balance anyway. This is just one way of noting that the Miskolczi analysis concentrates on something that’s not the most essential point. Based on the earlier discussion we seem to also agree that Aa>Ed although rather small.
The argumentation between Spencer and the supporters of Misckolzi including Miskolczi himself get very confusing.
The Miskolczi side in the argumentation alternates between admitting that Aa=Ed is not based on theory and claiming that it’s still true based on empirical data. At one point of the paper Miskolczi presents correct arguments based on the physical understanding that the equality is not true when there are temperature differences. That occurs in the discussion related to Figure 5. of his paper. Thus he seems to be well aware that the relationship is always broken when the atmospheric temperature differs from the surface temperature (the size of this difference is given by the theory he is using in his calculations). This is certainly one of the two totally decisive points in understanding the radiative balance of the surface. The other point is the transmissivity of the atmosphere that he calculates. (The two components are defined in his Figure 1.)
It’s clear that he presents many parts of the radiative balance of the surface basically correctly but misses some equally important ones and uses false arguments to defend his results. He does that to the point that he contradicts explicitly his own understanding in the discussion of the (approximate) equality Aa=Ed and its significance.
All the above is of little importance for understanding changes in the strength of GHE because the surface radiative balance is not the right place to look at that. Changes in transmittance are one component in the strength of GHE but not the most important one. The more important parts concern the radiation from atmosphere (both from gases and from clouds). Here again Miskolczi does one interesting part of the calculation. In Figure 6. he shows the altitude profile of the point of emission in his model. He shows, how the emission originates over a wide range of altitudes with a significant contribution from altitudes 8-15km, where the amount of water is small and CO2 is the main source of emission and where the temperature is falling with altitude (Figure 2). A change of CO2 concentration affects this distribution. This change is one of the main mechanisms for the influence of the CO2 concentration on GHE. Here Miskolczi comes close to presenting an useful result but fails to bring it to conclusion.
All the above is written accepting that the empirical analysis Miskolczi is valid and that the model he is using describes all essential properties of the atmosphere. It’s seen that there are internal contradictions in his paper and that he dismisses the probably most important effect that he could have easily calculated. There are, however, many more questions. It’s certain that looking only at clear sky conditions cannot describe all essential factors. Clouds have an essential share in the emission that escapes to the space. What happens to that must also be calculated. What one can really learn from the radiosonde data on the changes in H2O concentration is an interesting issue not answered conclusively by this analysis.
All in all the Miskolczi paper is an odd mixture of interesting calculations which use empirical data and a detailed radiation model and conclusions largely unsupported by the results of the analyses and in some cases internally contradictory.
Refining his calculation, concentrating fully on what it tells about the OLR rather than surface radiative balance and adding somehow clouds appears to be a valid way of estimating radiative forcing.
Thanks for applying some innovative ideas to data analysis, Vaughan.
The approach reminds me of the various transforms that stand alongside the conventional Fourier analysis. The choice of a sawtooth kernel function is similar to the approach with wavelet transforms. The idea is to use these kernels to reproduce the profile with fewer parameters than a fourier series.
Vaughan said
“Tiny areas like Central England are not at all representative of how the temperature of the globe has evolved in recent centuries.”
Yet Pratt goes right on ahead and blithely uses a temperature record extending back to 1850 like it was global in coverage and accurate to hundredths of a degree. The intellectual dishonesty in that is breathtaking.
It seems to be a continuing confusion that I’m claiming to explain actual temperature (whatever that might mean). Firstly it’s HadCRUT3 as observed temperature that I’m using, exactly that, not some proposed improvement to it as you’re implying exists. Secondly all I’ve done is separate HadCRUT3 as a sum MUL + SOL + DEC, and MUL as a sum SAW + AGW + MRES, backed up with a spreadsheet to make it easy to verify the accuracy of my claim. It’s all there for you to audit. If you find an error in it then and only then can you accuse me of deliberately putting the error in there.
If there is any intellectual dishonesty here it belongs to those accusing me of doing something that I’m not doing. That’s dishonest.
> If there is any intellectual dishonesty here it belongs to those accusing me of doing something that I’m not doing. That’s dishonest.
A lack of plasticity might be a simpler hypothesis.
David Springer 6//12 3.05 am … Ironic ain’t it)
Vaughan Pratt | December 5, 2012 at 5:36 pm | Reply
“Unfortunately the satellite data only begins in 1978.”
You go to analysis with the data you have not the data you wish you had.
Write that down.
Vaughan said
“Tiny areas like Central England are not at all representative of how the temperature of the globe has evolved in recent centuries.”
Interesting. So we can discount anything we think we know about global temperature taken from ice cores. Thanks for clarifying that, Vaughan. LOL
David
Yeah, ice cores are well known to be highly representative of the tropics.
Tree rings taken from a tiny area are also scientifcally proven to be highly representative of the global temperature. Both are well known to be accurate to fractions of a degree over hundreds of years.
tonyb
climatereason, you should support people taking quotes out of context. David Springer fails to quote the paragraph prior to what he provides:
Notice how he refers to “a tiny region so dense with technology.” In his next paragraph, he says, “Tiny areas like Central England are not” representative of global temperatures. The context makes it clear he when he refers to “tiny areas” he is referring to “tiny regions… dense with technology.” That is quite different than what you and Springer portray.
Misrepresenting people to score cheap points is a pathetic tactic. People shouldn’t do it.
Brandon said
The context makes it clear he when he refers to “tiny areas” he is referring to “tiny regions… dense with technology.” That is quite different than what you and Springer portray.”
Sorry, I genuinely don’t get your point. Vaughan says this;
“Tiny areas like Central England are not at all representative of how the temperature of the globe has evolved in recent centuries.”
Are you saying that Vaughan believes that CET is a useful (but not infallible) proxy for a global temperature? No matter how you parse it my reading is that Vaughan thinks that such a tiny area has little merit as any sort of global proxy whether or not it is ‘dense with technology.’. If he meant otherwise I will apologise.
tonyb
climatereason:
No.
The key is in the word “like.” One can say “tiny areas like x” to mean areas the size of x, or tiny areas that share certain traits with x. As in, an area like x that is tiny.
When you have two possible interpretations, you look at context. Two sentences prior to the quote, he said “a tiny region so dense with technology.” His next sentence explained why the density of technology in the area would make it unrepresentative. It was at this point he said, “Tiny areas like Central England are not at all representative.”
Your interpretation requires us ignore his explicit explanation that comes immediately prior to the sentence in question and focus solely on the word “tiny.” I don’t think that makes any sense.
Brandon and tony b
“Tiny areas dense with technology” as a description to discount the meaning of the CET record carries two connotations for me.
Tiny – yes, but as tony has pointed out, there are climate influences which could make it more representative than Italy, for example.
Dense with technology – only applies after the mid 19th century; the historic record, to which tony refers, probably has no distortion from technology (or urbanization, for that matter).
But, again, the CET record (even as extended by Tony) is the only real continuous regional temperature record we have prior to the mid-19th century so, ignoring paleo data (which are arguably less representative than the CET) it’s the best “proxy” we have for a global temperature prior to ~1850.
And since this record covers a time span prior to industrialization (and CO2 emissions) it gives us a picture of how climate changed naturally, which in turn gives us food for thought considering the natural versus anthropogenic attribution of recent climate change.
If I’m not wrong, I believe this is tony’s point regarding the significance of CET.
Max
record
Brandon and tony b
My biggest problem with the CET as an indicator of anthropogenic warming is the start and end points.
http://en.wikipedia.org/wiki/File:CET_Full_Temperature_Yearly.png
It starts during the coldest part of the LIA in the middle of the Maunder minimum and ends today, after a 20th century with solar activity at its highest in several thousand years (see the Lean curve).
http://farm9.staticflickr.com/8202/8246230123_71547c34c5_b.jpg
There are “bumps and grinds” in the CET record but the overall warming trend is 0.9°C over 350 years or a decadal warming rate of 0.026°C per decade.
I believe that the extension back before 1659 made by tony b is an important addition, because it shows that prior to the Maunder minimum, when solar activity was higher, temperature was warmer. IOW it shows that solar influences may have been responsible for a large part of the warming after the Maunder minimum ended.
This leads to the basic question both Jim Cripwell and I asked Dr. Pratt on how solar forcing was handled in his analysis.
I believe if someone wanted to do so, they could make an analysis similar to that made by Pratt, but removing the “CO2 – or total GHG – signal” (without feedbacks) , ending up with a correlation between natural solar forcing and temperature over time, IOW treating the GHG effect as “noise” and the solar effect as the principal driver. (But I’m not going to do this study, as I don’t think it would tell us much more that Pratt’s study does.)
Max
Max,
When you bring up the solar activity you should note that it has not risen for 50 years but rather gone a little down.
That means that the solar activity has not risen at all over the period of strong apparent AGW signal. Pretty poor for a supposed explanation. 50 years is already long enough to be climatically significant. The overall picture fits nicely with the main stream interpretation that worming up to the 1940’s maximum had a significant solar component but what has happened thereafter not so. The sun does, however, explain part of the recent plateau. Again what we know about the sun agrees well with the main stream views and supports them to a significant degree.
Pekka said, “That means that the solar activity has not risen at all over the period of strong apparent AGW signal. Pretty poor for a supposed explanation.”
Ah, but with a little smoothing and a lag or two…you can “rescue” that theory :)
Pekka
You are right that solar activity has slowed down after reaching the highest level “in several thousand years” in the late 20th century (Solanki 2004).
The Wolf numbers for the late 20th century solar cycles were:
http://www.warwickhughes.com/agri/Solar_Arch_NY_Mar2_08.pdf
152: SC 18 (1945-55)
190: SC 19 (1955-65)
108: SC20 (1965-75)
158: SC 21 (1975-86)
160: SC 22 (1986-96)
Average Wolf number of these late 20th century solar cycles was 154.
Prior to SC 18 the Wolf numbers were all significantly lower than this average, as was SC 23, which just ended. SC 24 is starting off very inactive and is projected to be even weaker than SC 23, so it looks like the period of “unusually high solar activity” is over.
How this looks longer term can be seen from the Lean curve of solar irradiance:
http://farm9.staticflickr.com/8202/8246230123_71547c34c5_b.jpg
It is clear that the late 20th century saw a period of unusually high solar activity as Solanki suggests.
It is also clear that this period of high solar activity has ended.
Max
Pekka
You wrote:
Not so, Pekka (see my previous post).
The “unusually high level of solar activity” (Solanki) occurred over the second half of the 20th century, as can be seen from the max. Wolf numbers of the solar cycles or Lean’s curve on TSI.
Several independent solar studies (which I can cite if you are really interested) have suggested that around half of all the warming since industrialization can be attributed to the “unusually high level of solar activity” in the 20th century.
I do not know how much “time lag” (if any) these studies have built in, but the correlation with temperature doesn’t look that bad to me.
Of course, correlation does not provide evidence for causation.
Max
Pekka
There is another factor one must consider when comparing natural (solar) warming with AGW.
AGW is “driven” by the change in concentration of GHGs, supposedly in a logarithmic relation at the sort of levels we might see.
Solar warming is driven by the absolute level of solar activity, by TSI plus additional mechanisms we do not yet fully understand
The second half of the 20th century saw solar activity at record highs historically (and for “several thousand years”, according to Solanki 2004).
So it could well NOT be correct (as IPCC claims) that:
“most of the observed increase in global average temperatures since the mid-20th century is very likely due to the observed increase in anthropogenic greenhouse gas concentrations”
Until we truly understand ALL the mechanisms by which the sun drives our climate, it is premature to conclude that AGW was the principal driving force of global temperature over the late-20th century IMO.
Max
Max, “Until we truly understand ALL the mechanisms by which the sun drives our climate, it is premature to conclude that AGW was the principal driving force of global temperature over the late-20th century IMO.”
Kinda the never ending quest. Understanding the oceans would be a better goal. The legitimate “smoothing” and time delays are in the oceans and water cycle.
Max (second attempt)
The lag between solar cycles and the ocean SST (Atlantic and Pacific) is ~ 15 years.
Solar activity input is twofold:
1. TSI – relatively constant (changes Glob Temp ~ + or – 0.1C)
2. Geomagnetic factor, where Hale cycle and the Earth’s magnetic field go in and out of phase, which is far greater than normally considered, and it is source of the 60sh year cycle.
I’ve done some calculations from the existing data and emailed it to Dr. Leif Svalgaard from Stanford University, one of the world most prominent solar scientists.
He found results so ‘unpalatable’ that he thought it was necessary to make a very rare visit to this otherwise very respected blog, and declare result spurious.
Note: he didn’t challenge accuracy of calculations, but interpretation.
Calculation shows that solar cycles could be both warming and cooling, depending on the orientation of resultant geo-magnetic vector.
http://www.vukcevic.talktalk.net/EarthNV.htm
Well, this is weird. Tony says CET indicates warming there in the 1600s, I offer a possible explanation (high tech concentrated in the region where the temperature is being measured), and somehow Tony thinks I’m contradicting him.
I see no contradiction between CET being correlated with global temperature and CET showing regional warming attributable to local industry. Neither has to override the other.
My point about CET not being representative is that while global changes can obviously influence CET, thereby creating a correlation, the converse is far less likely because CE is only .01% of the planet. By all means expect a correlation between CET and global temperature, but don’t interpret warming observed in CET as global warming.
Just because the sun never sets on the British Empire doesn’t mean it never sets on Central England.
Vaughan Pratt
See my query/post above on distinguishing anthropogenic warming from the null hypothesis of natural which includes an “accelerating warming” due to the ~1500 year cycle identified by Loehle and Singer, and an exponential increase in CO2 only gives a linear response due to the logarithmic effect of CO2 concentration.
David L. Hagen | December 6, 2012 at 10:32 am |
Yes. I haven’t raised that point in a long while. The notion that CO2 induced warming is only relevant after 1950 is false. Due to the decreasing GHG efficacy, part for part, of CO2 the small annual amount added with the beginning of the industrial revolution circa 1750-1800 (when the steam engine became widely deployed) have the same effect as the big bits being added now. Anthropogenic generation of CO2 happens to have grown inversely to its decreasing ability to warm the atmosphere since the beginning of the industrial revolution. This yields a roughly linear rate to increasing temperature. In other words ignoring the non-linear GHG efficacy curve of CO2 and the rate of anthropogenic deposition is just another attempt to hide a couple of inconvenient declines. Ignore the man behind the curtain. CO2 only became an anthropogenic greenhouse gas after 1950. Before then it somehow doesn’t work that way.
David L. Hagen
Of course he did. There’s a reason he cuts off the analysis in 1995. Continuance of the curve fails after that. If you go to the poster:
http://fallmeeting.agu.org/2012/files/2012/12/GC23C-1085.pdf
there’s an extra bit shown in figure 3 that explains the data past 1995 is an “end effect artifact of filtering” with the implication I guess that it should be ignored. How convenient. The actual temperature data reveals that’s not an artifact as there is no significant trend beyond that date. Pratt, with a wave of his hand and 21 year filter, discounts “the pause”. Isn’t that just precious?
Vaughan
Thanks for your clarification. Not sure I see your nuancing, but I think we agree that for some reason CET is a reasonable (but not perfect) proxy for global temperature when you say;.
“By all means expect a correlation between CET and global temperature, but don’t interpret warming observed in CET as global warming.”
In this respect the reasonable but not perfect correlation with BEST seems to indicate a steady world wide warming (although there are bits that are cooling and I remain dubious about the validity of a global temperature) that has been continuing in fits and starts for some 350 years. This also correlates with observations of sea ice and glaciers. Manley observed that in general glaciers had ceased their advance by 1750.
My original point was that the warming is nothing new and to try to attribute it to co2 is I think incorrect. I do believe that humans are a substantial noise in the climate system (especially locally with regards to Forestry and agriculture) ) but the sound of co2 within that louder noise is very muted.
Incidentally, yours was an intriguing and nicely written paper and well supported by data, irrespective of whether I agree fully with it or not.
tonyb
@Pratt
Instead of relying on your poor powers of inference why not just take a peek at CET data yourself? It’s not hard to find and I already linked to it once.
Now twice:
http://en.wikipedia.org/wiki/File:CET_Full_Temperature_Yearly.png
Yes there was a rapid temperature increase from 1690 to 1730. It was preceded by a rapid decline of same magnitude from 1660 to 1690 and was followed by a rapid decline from 1730 to 1760 back to a baseline where it then embarked on a drunkard’s walk for the next 100 years.
The period from 1660 to 1760 with an approximate 60-year cycle (1.5 cycles) looks suspiciously like the Atlantic Multidecadal Oscillation to me which then reappears in the record after 1880 for another ~2 cycles taking us to the present day. But it’s probably just sheer coincidence that the 60-year AMDO keeps popping up in all the temperature records huh?
David Springer wrote:
You’ve misunderstood – the filtered AGW curve in fig.3 isn’t based on HadCRUT3 observational data. It’s clearly stated just below fig.3 on the poster (and in Vaughan Pratt’s excellent spreadsheet) that
AGW(y) = 2.83 * log_2(287+ 2^((y-1834)/28.6)))
Springer
Once again, poor topic knowledge is your undoing.
See Parker et al. (1992) here. Please note: it’s a 10.8Mb pdf of a scan of the original. I’ve retyped this from the introduction. Please read this carefully:
Repeat: no reliable data before 1770. ‘Warming’ very likely an artefact.
Massive over-interpretation of unreliable data = deeply unwise. Corrosive to credibility.
Self:
Well, ok – three of the AGW formula’s parameters are derived from HadCRUT3, but the plotted AGW curve is mostly insensitive to changes in the last decade of the HadCRUT3 data (so changing the ‘pause’ into a steep ‘decline’ or ‘ascent’ barely affects fig. 3)
BBD
Hope this lands up somewhere near your post on CET.
I call into the Met office frequently to use their archives and library. David Parker is still around. He wrote a monthly series to 1772 whereas Manleys intention was to create a monthly one to 1659. Many people have reinterpreted the indoor temperatures (although many records were taken externally) including Camuffo and Jones who got a substantial EU grant for doing so under the Improv project.
DE Bilt borrows some of the Early CET record but no other one is old enough to overlap back to 1660, hence the need for other records.
There are lots of material (diaries, crop records, payments to the poor etc) to demonstrate the ups and downs of the climate from 1660 onwards including the sharp drop in temperature and its subsequent recovery. I have seen many of these records myself-some are in the Met Office Archives with annotations by Manley himself.
Of course we could bring out the broader argument that ALL old temperatures records are suspect for one reason or another. I wrote about it here;
http://wattsupwiththat.com/2011/05/23/little-ice-age-thermometers-%E2%80%93-history-and-reliability-2/
This includes those from Hadley and Giss as the Stevenson screen was not widely used until well after 1880 and many of the observers were untrained (many of the earlier observers had better credentials than the later ones as it was considered a scientific job.)
Modern stations also often leave something to be desired, so personally I wouldn’t bet the house on the reliability of the instrumental record at all, but its the only thing we’ve got.
As Lamb observed ‘we can see the (temperature) tendancy but not the precision.’
Do we know the temperature back to 1660 in fractions of a degree? Of course not and that becomes even more true when trying to construct a global temperature. What we can reasonably safely say is that its been gently warming -in fits and starts- for some hundreds of years with substantial downturns in the early and late 1600’s. Warming is not a new phenemonon
tonyb
Cap’n
Sure there’s more to it than just solar influence (“oceans and water cycle” incl. clouds). Maybe these are even linked.
All of these natural factors need more work.
The analysis by Dr. Pratt has essentially filtered these all out as “noise”, with an exponential CO2 curve as a result.
To me this is an oversimplification.
One could just as well filter out the signal from GHGs as “noise” to leave the natural factors as the principal “signal” (which would be just as wrong).
The reason this is wrong is because the climate system is too complicated and we just don’t know the answers yet – especially concerning all the many natural climate forcing factors.
That’s basically my point.
Max
BBD,
you re typed that from the original?
man you are a good typist.
hmm.
steven
Yes, I typed it from the original, as stated. Yes, I can type. I’ve been doing it for twenty years. It’s not difficult. Why the ‘hmm?’
tonyb/climatereason
The CET data pre-1770 are generally held to be unreliable. There are, I believe, more modern references that corroborate this. You don’t actually provide any substantial reason why everyone from Parker on is wrong to state that the CET data pre-1770 are unreliable, so that’s the state of play I’m afraid.
As a general rule, I don’t place much weight on global reconstructions before ~1900 as I understand that earlier data is not considered as reliable as C20th data. Steven would know more about this than me.
BBD
Parkers is a daily series, Manleys is a monthly one. These are the two most scrutinsed temperature series in the word and have been taken apart, referenced, used as the basis for such as de bilt and generally examined for many years by very many people. As such both are ‘reliable’ as circumstances permit but see my article that pointed out the drawbacks of any temperature series
As I say I wouldn’t want to believe either to fractions of a degree but when combined with the numerous other records available we can be pretty sure that the warm and cold bits are pretty accurate but we do not know exactly HOW cold or HOW warm.
tonyb
BBD
Huh?
If you’ve got “no reliable data” how can you conclude that “warming was very likely an artefact”?
Answer: you can’t.
Max
David, global temperatures are figments of AGWers imagination. NH temps are going down…. down…. down. That’s where most of the land mass is anyway.
The percentage of the earth’s surface is a fair criticism but the level of industrialization of England’s midland regions is not. Without modification smokestack emissions exhibit a net cooling effect not a warming effect. Lest Vaughn forget the mid-twentieth century “global cooling” is blamed on sulfate particulates. Lately Hansen has tried to blame “the pause” on particulate emissions from China’s rapidly and hugely increased expansion of coal-burning electrical generation.
Pratt just makes crap up as he goes along. He might be very knowledgable in arcane computer-related subjects but his knowledge outside that is shallow at best but he acts like it isn’t and substitutes what he believes are educated guesses for actual knowledge.
And by the way… here is CET graph
http://en.wikipedia.org/wiki/File:CET_Full_Temperature_Yearly.png
Where it can be compared to independent data I see no marked difference. It appears representative of HadCRUT from 1880 onwards. And where Pratt claims there should be no surprise in greenhouse warming in the English Midlands prior to 1880 the actual data show no warming prior to 1880. So that’s just more stream of consciousness bullchit from Pratt too as he either didn’t actually examine the data before commenting on it or ignored what he saw or can’t interpret what he saw. In any case it’s yet another poor reflection on him.
@David Springer: Without modification smokestack emissions exhibit a net cooling effect not a warming effect.
Certainly sulfate aerosols cool, being reflective. However other pollutants, especially black carbon, are not reflective and at low altitudes warm. (At high altitudes lapse rate kicks in to reduce their warming effect.) An efficient power plant produces relatively little black carbon, but back when England was obtaining most of its industrial power by burning up all its forests, it seems unlikely that efficiency was on anyone’s mind until most of England’s forests were gone. So I would question your certainty that the emissions from England’s energy sources in the 17th and earler centuries had a net cooling effect.
> Certainly sulfate aerosols cool, being reflective.
Sulfate aerosols are to be emulated.
David Springer
Wrong again. High latitude ice cores are proxies for global temperature. The key indicator is the ‘heavy’ oxygen isotope δ18O. Less = colder.
See here for details.
You misinterpreted what I wrote. No surprise. See here for clarification. I was mocking Pratt not Proxies. Maybe the same two letters at the beginning of each word caused your confusion.
But I can mock ice core proxies too if you so desire. Sealing time of air bubbles at best about 70 years and mixing with ambient air through diffusion all that time, chemical changes thereafter, different diffusion rates for different gases thereafter… ice cores are a target-rich environment for casting of doubt about how well they perform as global temperature proxies. But I generally don’t do that as there are far richer target environments in more recent years. All the juiciest manufactured evidence is in the past 70 years (since 1950) and ice cores don’t seal air bubbles younder than that even if we were to ignore the fact that the bubbles are averages of air composition over the sealing interval which, if you know what the Nyquist rate is, can’t be used except to reconstruct records with precision to more than about 140 years.
No David, you betrayed your ignorance and now you are trying to cover up your gaffe.
To make matters worse, you seem unaware that the δ180 analysis of ice cores is carried out on *water ice*, not gasses trapped in the core.
You are hopeless.
‘GIS = Greenland Ice Sheet. As you would know if you were not somewhat vague about paleoclimate. It was the *region* that experienced extreme warming at the end of the YD. The *region* you persistently confuse with the entire planet. Or perhaps this is deliberate misrepresentation.’
So earlier it was the region and here it is global? Just what are we supposed to make of that? Other than that he freely invent whatever seems to suit his AG grouthink narrative.
Chief Kangaroo
I’m trying to keep it simple for David. But for you, the detail. See Shakun & Carlson (2010).
Here’s a teaser from the abstract:
;-)
BBD | December 6, 2012 at 5:22 am |
As I already explained I was mocking Pratt not ice cores. I also explained I don’t have any real beefs with ice core data but if you want to state something specific I’m sure I can find something to cast doubt upon it as very little in this debate is writ in granite, confirmation bias is rampant, overconfidence abounds, the race to publish by inexperienced youngsters on the tenure track is heated, and pal review let’s just about anything that supports the consensus view get published while simultaneously quashing anything contrary.
Maybe you should read the climategate emails instead of relying on the whitewash that were called investigations on your crappy little island.
BBD | December 6, 2012 at 5:22 am |
Suggest you clue yourself in on what can be determined from oxygen 18 isotopes by the way. It’s something like tree rings. Lots of factors effect it other than temperature and the current relationship between temperature Oxygen-18 in GIS doesn’t hold true for the past. Factors such as the season the snow fell, the source of the moisture, and the migration path of the ice. The distance the water vapor traveled, the admixture of vapor from different sources. Documented below.
http://books.google.com/books?id=n-Fv4vYIQcIC&pg=PA361
So is that the best you got? LOL
Springer.
Spare me the so-called ‘Climategate’ conspiracy theory misdirection.
Really? This was you, just upthread:
Words fail me.
Let’s keep the focus on your bloopers. First, you slip up in a pool of ignorance and go face down. Splat.
Then you get up, dripping in the stuff, and have the brass neck to pretend that it was all a joke. In the process, you manage to slip up and fall over again – this time on your arse.
Now you have struggled back to your feet again and are *still* trying to pretend that it was all a ‘joke’.
It is painfully obvious that you have no idea what you are talking about. And even when confronted with evidence that would make a tart blush, you keep right on going.
It beggars belief.
Now, take a hint. Stay away from paleoclimate.
Posting links to books you’ve never read won’t get you out of this. Nor will pretending to knowledge you do not posses. Does the name Kurt Cuffey mean anything to you? Of course it bloody doesn’t. I know how the GIS isotopic temperature reconstructions have been validated – you don’t. Stop pretending.
You know I have seen your single reference for localised rather than global impacts – but this is an area of ongoing research. And hardly likely to be definitively resolved any time soon.
It was really your point scoring above with local and then point scoring below with global. Typically absurd misdirection.
You don’t have any depth of knowledge on anything. Springer is a dozen times more subtle and that’s amazin’. You’re a shopkeeper with a facile AGW space cadet narrative superficially in the objective idiom of science.
Local versus global effect. Since energy does like the path of least resistance and different regions have different heat capacities and heat transfer rates, the study of local versus global climate impact should provide a great deal of job security.
http://web.mit.edu/karmour/www/Armour_JCLIMrevised_2col.pdf
This guy Armour may have realized that.
Captain Kangaroo
When are you going to admit that you have been caught using paleoclimate as a sandbox by somebody who demonstrably knows more about it than you do?
Come on man. Out with it.
Blah blah – you demonstrably know squat. When are you going to admit that you are a shopkeeper with nil scientific chops at all? Nothing but lies, misrepresentation and trivialities. You trying to prove you are not a shopkeeper but in fact a leading paleoclimate investigator in a mask? (Who was that masked paleoclimatologist?) It isn’t going to work – you are an idiot with your underpants on the outside of your trousers.
Let me again introduce some sanity from actual paleoclimatologists under the auspices of the NAS.
‘Now imagine that you have never seen the device and that it is hidden in a box in a dark room. You have no knowledge of the hand that occasionally sets things in motion, and you are trying to figure out the system’s behavior on the basis of some old 78-rpm recordings of the muffled sounds made by the device. Plus, the recordings are badly scratched, so some of what was recorded is lost or garbled beyond recognition. If you can imagine this, you have some appreciation of the difficulties of paleoclimate research and of predicting the results of abrupt changes in the climate system.’ http://www.nap.edu/openbook.php?isbn=0309074347
The wrong trousers as it happens to be. ‘The culturally potent idiom of the dispassionate scientific narrative is being employed to fight culture wars over competing social and ethical values. Nor is that to be seen as a defect. Of course choices between competing values are not made by relying upon scientific knowledge alone. What is wrong is to pretend that they are.’ http://www.lse.ac.uk/collections/mackinderCentre/
Chief Kangaroo
But you keep getting shown up, again and again. And all you do is fulminate and post irrelevant quotes (again and again).
Luckily, you aren’t the person who gets to decide who is talking bollocks here.
You should reflect on something further. If a mere layman can show you up as a know-nothing when it comes to paleoclimate, then you aren’t doing very well.
It’s obvious that you are never going to work this out for yourself, so I’m obliged to prompt you. This would be further cause for embarrassment, if you were capable of the necessary self-awareness.
Spare me the so-called ‘Climategate’ conspiracy theory misdirection.
Generally the only people who drag out the stupid and tired old “conspiracy” strawman to refer to the systemic bias and corruption in government climate science clearly exposed in Climategate (and then also in the corrupt ‘investigations’ the institutions involved commissioned to exonerate themselves),
are those who seek to promote their underlying totalitarian leanings by trying to blind us to the motivation for this endemic corruption – the obvious vested interest government has in promoting CAGW – the opportunity it offers to expand its reach through more taxes and controls.
You don’t need a “conspiracy” to explain why an organisation acts to promote it own interests. That is the norm. It would require a conspiracy if it didn’t act to promote it own interests; iow, for government climate science to strive to be objective – now that is something that would require a conspiracy. And we don’t believe in those much, do we ?
BBD, The pretense that David wasn’t joking about the ice-cores is plain moronic (ditto your desperate and dreary ‘story’ to support your misinterpretation).
I guess the famed British sense of humor is much overrated. Either that or I greatly underestimate your British dissembling (euphemism: reserve).
memphis
Only a moron would make this claim with the contrary evidence in plain sight.
The science of isotopic analysis is not a “desperate and dreary ‘story'”, nor is it ‘mine’. This sort of imbecilic and transparent misrepresentation is the blog equivalent of self-harming.
BBBD When are you going to admit that you have been caught using paleoclimate as a sandbox by somebody who demonstrably knows more about it than you do?
+1 on that arsecount
BBD | December 7, 2012 at 3:32 am |
Chief Kangaroo,
But you keep getting shown up, again and again.
The problem here, is that BBD is the only person who believes BBD’s claim.
BBD, The pretense that David wasn’t joking about the ice-cores is plain moronic
> Only a moron would make this claim with the contrary evidence in plain sight.
And with zero contrary evidence anywhere at all, only a moron would claim that.
Perhaps you’d care to tell us what you carefully misinterpreted as “evidence” he wasn’t joking.
> (ditto your desperate and dreary ‘story’ to support your misinterpretation).
Your bad faith here is legend; ever considered becoming a government consensus climate scientist?
This time you slyly pretended to think I was referring to ice-cores etc, when obviously the ‘story’ in question was your feeble story about David falling on his face etc (in your own mind, of course) .
Max
The lag between solar cycles and the ocean SST (Atlantic and Pacific) is ~ 15 years.
Solar activity input is twofold:
1. TSI – relatively constant (changes Glob Temp ~ + or – 0.1C)
2. Geomagnetic factor, where Hale cycle and the Earth’s magnetic field go in and out of phase, which is far greater than normally considered, and it is source of the 60sh year cycle.
I’ve done some calculations from the existing data and emailed it to Dr. Leif Svalgaard from Stanford University, one of the world most prominent solar scientists.
He found results so ‘unpalatable’ that he thought it was necessary to make a very rare visit to this otherwise very respected blog, and declare result spurious.
Note: he didn’t challenge accuracy of calculations, but interpretation.
Calculation shows that solar cycles could be both warming and cooling, depending on the orientation of resultant geo-magnetic vector.
http://www.vukcevic.talktalk.net/EarthNV.htm
Say Tony, ironic ain’t it )
Say, Peter, and in the southern hemisphere, down in the Antarctic,
ice is up, up, up! Hoopla!
Yay!!! Chief says that Oz will be cooler over the next decade or three ;) Not sure about the tropics though!
Beth
Yep. Ice is up (not only here in Switzerland) but also in the Antarctic. The poor penguins must be struggling.
And in the Arctic, despite all the wailing and lamenting and gnashing of teeth for those cute, cuddly polar bears, it’s déjà vu all over again.
http://farm9.staticflickr.com/8338/8248714491_aa61fbbd96_b.jpg
Max
Vaughan Pratt | December 5, 2012 at 4:09 pm |
@DS: What Pratt did was remove the actual data from the HadCRUT-tortured temperature record
David, nothing has been “removed” as you put it, though it may have been misplaced. HadCRUT3 = MUL + SOL + DEC, your quarrel should be with whether portions of one of these three wide frequency bands have crept into the wrong band.
—————————————————————————
Really. So a filter doesn’t remove things. Interesting. Are you trying to torture the English language now too?
“2. I further hypothesize that all remaining natural fluctuations in modern climate have as their slowest component the 21-year Hale or magnetic cycle. I filter out this and all higher frequencies with a low-pass filter designed to aggressively block such frequencies. ”
You’re a sterling example of what passes for an honest researcher at Stanford when the choice is between objective results and politically correct results. You make me ill.
I don’t think so but he likes to be brief and a little cryptic for readers who don’t read his formulation with enough care.
Pekka Pirilä | December 6, 2012 at 5:55 am | Reply
“I don’t think so but [Pratt] likes to be brief and a little cryptic for readers who don’t read his formulation with enough care.”
Pratt’s problem is with readers who do read his formulation with enough care. That leaves you out.
@PP: I don’t think so but he likes to be brief and a little cryptic for readers who don’t read his formulation with enough care.
Quite right, though not intentionally so — I’d prefer to be less cryptic, if that entails longer explanations so be it.
Dr. Pratt
To the contrary to some of the statements above , there is high degree correlation between CET and the global temperatures
http://www.vukcevic.talktalk.net/GTCet.htm
Proponents of the AGW will continuously deny importance of the CET- Globlal temperature correlation for a simple reason that the CET exposes the CO2 hypothesis as false.
Two challenges presented by the CET:
The CET summers have not shown any global warming in 350 years.
http://www.vukcevic.talktalk.net/MidSummer-MidWinter.htm
while all the warming was in the winter months.
The early 18th century warming correlation to the most recent decades
http://www.vukcevic.talktalk.net/CET1690-1960.htm
which could be only explained by the natural variability:
Some of the more prominent AGW propagandists from Grant Foster (Tamino) and Daniel Bailey (Skeptical Science) to the NASA’s expert Jan Perlwitz have fallen flat on their faces trying to deal with the above.
Dr. Pratt you are welcome to have a go .
Any other AGW takers?
It’s to be expected that there’s a high level of correlation between CET and wider temperature indexes, but that’s not enough to make it a good indicator for global temperatures. The problem is that there’s also a lot of extra variability in CET and that the available data is not sufficient for estimating well enough how much CET can tell about the wider temperature trends at other times. Much more data is needed for estimating well the skill of CET to predict the global average even assuming absence of all sources of systematic errors. (Assuming absence of systematic errors is also suspect.)
Commentator of your experience should realize that variability in averaging few tens of stations (CET) is greater than variability of many thousands (global temperatures) but the trends and the correlation are there
http://www.vukcevic.talktalk.net/GTCet.htm
The rest are wishy-washy excuses.
What about the NO GO AREA for any AGW expert, since Grant Foster (Tamino), Daniel Bailey (Skeptical Science) and Jan Perlwitz made publicly fools of themselves:
The CET summers have not shown any global warming in 350 years.
http://www.vukcevic.talktalk.net/MidSummer-MidWinter.htm
while all the warming was in the winter months.
The early 18th century warming correlation to the most recent decades
http://www.vukcevic.talktalk.net/CET1690-1960.htm
This is exactly the starting point of my argument. The rest is understanding what one can and cannot learn from statistical analysis.
The winter temperatures with 350 rising trend is a ‘good statistic’, but 350 years of no summer warming trend is a ‘bad statistic’.
http://www.vukcevic.talktalk.net/MidSummer-MidWinter.htm
Ah, the expertise in the meaningless elucidation.
Dr. Leif Svalgaard of Stanford
vukcevic
Your ‘findings’ are spurious and the ‘physics’ is wrong. Try to learn something.
Hi Doc
The readers of this blog would far more benefit from your often masterly dissection, if applied to your Stanford colleague’s, i.e. Dr. Pratts’ paper.
We are eagerly awaiting.
Reading through the comments on this thread, it is fairly clear what is happening. It does not matter what aspect of CAGW is discussed, the warmists can always point to a paper in the peer reviewed literature that supports their hypothesis, except for one aspect; the empirical data. As we collect more and more good data on what is actually happening to the earth’s atmosphere, it is becoming more and more obvious that adding CO2 has a negligible effect. This presents a major problem to the warmists.
So we find a series of papers which attempt to show that, although the empirical actually data indicates strongly that adding CO2 to the atmosphere has an effect that is so small that it cannot be measured, in fact the data can be manipulated to show that the opposite is the case. Then if these papers can get into the peer reviewed literature, the awkward problem of the empirical data giving the “wrong” result is solved
Why can’t your opponents simply claim that you’re the one doing the “manipulation”? When both sides read opposite interpretations into the same data, it is natural for both sides to attribute the disagreement to manipulation by the other side.
I dont believe in manipulation. I know that the data that is presented on global temperatures daily, monthly and yearly, is not raw data; it has had a considerable amount of processing before it is presented as an average global temperature. As I understand things, the way this process is done has been peer reviewed, and has been found to be scientificly valid. This data is as close to scientific fact as we can get. I call the data on global temperatures presented monthly by HAD/CRU, NOAA/NCDC. GISS, RSS, and UAH “basic” data. I do not manipulate this basic data. Girma has produced a graph from the HAD/CRU data at http://bit.ly/V19Im8. This is the graph that I think represents the truth. What it shows is that global temperatures have been rising at about 0.06 C per decade ever since good records became available around 1850. This trend shows not signs that it has changed, and the recent pause in warming is, to me, simply a reflection of a compensation for the rather rapid rise in temperatures which was observed at the end of the 20th century.
If CAGW is going to be proven to be correct, then at some point the global rate of rise of temperature must persist at a rate considerably in excess of 0.06 C per decade for a prolonged period of time. There is no sign that global temperatures have deviated significantly from 0.06 C ever since records began.
That is not data manipulation. It is merely interpretation of the basic data.
HadCRUT4 1950 – present decadal trend 0.11C.
Six decades and nearly double the trend since 1850.
Jim
What you dont understand is that when you “fit” a straight line to the data you are ASSUMING that the model of temperature change is linear.
You fit a linear model to the data. You dont “find” the trend. The data has no trend. Trend is the result of making an assumption about which statistical model should be used to “fit” the data.
Well, we know a couple things. Most importantly we know a linear model is unphysical. The test is simple. project that linear fit back in time. Then project it forward in time. You see, temperature cannot go up via a linear model because it gets unphysically hot or unphysically cold at either end. From a physics perspective a linear model is non sensical.
Now you might make an argument that over short time spans the increase is roughly linear, But that argument is not made by simply fitting a line and saying “look”. you would actually have to make an argument why the increase should be linear over short periods or why a linear model is the best or short periods. There are ways to estimate what the data generating model is underlying the process, but Girma hasnt done that. There is no “trend” in the data. The data is and will always be just data. To find a trend you have to make assumptions.. Lets assume its linear? then you fit a linear model. You can test how well that “model” works to explain the data.. with temperature since 1850, it doesnt work very well.
Again. Data has no trend. If you decide to “fit” the data with a linear model, that model will have a trend term. If you decide to fit the data with a different model, that model will have a trend term. In the linear case the trend is not a function of time. With other models, it could be a function of time. For example, you could decide that the model to use is a piecewise linear model with empirically derived break points. In this case you find that the temperature series is BETTER FIT by a piece wise linear function. Or you could use a spline fit.
Bottom line. Do not trust Girma to do a complete analysis where all choices are laid out and all decision are documented and supported with good argument. Like many on the warmist side he is making propaganda.
He believes in one thing: anything but ACO2.
81 years of “Recovery from the LIA” “cooling?” right at the very beginning of the instrument record.
Steven
Talking to Jim is like talking to the cat. Nothing goes in. For example, I’ve only just said this to him:
Now unless his mind is going he cannot possibly have forgotten this already. It’s starting to look as though we might as well be talking to the cat.
Steven, you write “What you dont understand is that when you “fit” a straight line to the data you are ASSUMING that the model of temperature change is linear.”
I have read what you have written half a dozen times, and, I am sorry, what you write makes no sense whatsoever. If I go out and measure something, anything, and plot the points of a piece of graph paper, and the points may lie on a straight line, some sort of curve, or there may be so much noise in the data that no trend is apparent, then this is what fits the data. It has nothing to do with models, or hypotheses, or theories, or anything else. It is what it is; nothing more and nothing less. If we look at Livingston and Penn’s data on the magnetic strength and contrast of sunspots http://wattsupwiththat.com/reference-pages/solar/, then the data suggests a linear fit; no models, not theory, no nothing. Just a linear fit.
If we look at any set of data, hard scientific facts, and plot them in some way or other, the data shows what it shows. It is just a plot.
The question then becomes how do you interpret that plot. That is a horse of an entirely different color. Now if you want to query my interpretation of Girma’s plot, by all means let us discuss what I have deduced from the plot. But saying that the linear trend is not there, when it clearly is, and is quite discernable above the inherent noise in the system is sheer nonsense. It makes absolutely no scientific sense whatsoever.
Ya. BBD I read Girma over at stokes and was aware of my old buddy Ron, having a go at ‘educating’ a supposed phd.
The thing I find really odd with people like Jim, is the switch between obstinate refusal to examine ones own beliefs ( say on c02) versus his uncritical swallowing of Svensmark.
A disciplined consistent skeptic is one thing. I can respect someone who doubts everything. But folks who swing back and forth between fighting what is well known and swallowing speculations that suit their mind set, are a real puzzle. I suppose one would have to get personal to explain the behavior.
Jim made an amusing comment on climate dialog the other day about “peer review” of ice extent data. So, I collected All the verification and calibration studies… and then thought.. why the hell am I wasting my time pointing out data that he should find himself if he was really interested.
In the end I think Eli came along to straighten him out.
More and more when faced with the choice of correcting lazy people who wont check the data that has been made available, and working with that data, i’m choosing the latter. the stupid is so thick, that im beginning to doubt the rationality and good faith of most commenters. haha, present company excepted.
Any way, I’ve spent too much time away from the MODIS project I was working on, so I’ll leave the task of educating Jim and Girma to you and pekka.
BTW, you might want to check out Zeke’s poster at AGU ( just search for his last name )
Girma Gobbles is a propagandaist all right.
Yes, I think Jim Cripwell has ulterior motives.
Note that when he comments at Climate Dialogue, he agrees that GW is due to aCO2 but here he won’t admit to it.
He is playing to his audience, clear evidence of an argument manipulator.
Jim,
The data is just points. That is what is observed.
Here is what is not observed for example..
1. the average
2. the trend.
Those two “things” are never observed. They are not in the data.
They are created when you decide to apply a mathematical operation TO the data. This mathematical operation is a choice. An analyst choice. It is not “In” the data. you apply a method to the data and you get an answer.
Here is some help. I can explain it to you, but I cannot understand it for you.
http://wmbriggs.com/
http://wmbriggs.com/blog/?page_id=2690
http://wmbriggs.com/blog/?p=3562
http://en.wikipedia.org/wiki/Model_selection
http://en.wikipedia.org/wiki/Trend_estimation
“Thus far the data have been assumed to consist of the trend plus noise, with the noise at each data point being independent and identically distributed random variables and to have a normal distribution. Real data (for example climate data) may not fulfill these criteria. This is important, as it makes an enormous difference to the ease with which the statistics can be analysed so as to extract maximum information from the data series. If there are other non-linear effects that have a correlation to the independent variable (such as cyclic influences), the use of least-squares estimation of the trend is not valid. Also where the variations are significantly larger than the resulting straight line trend, the choice of start and end points can significantly change the result. That is, the result is mathematically inconsistent. Statistical inferences (tests for the presence of trend, confidence intervals for the trend, etc.) are invalid unless departures from the standard assumptions are properly accounted for, for example as follows:
Dependence: autocorrelated time series might be modeled using autoregressive moving average models.
Non-constant variance: in the simplest cases weighted least squares might be used.
Non-normal distribution for errors: in the simplest cases a generalised linear model might be applicable.”
Girma and you need to read more and comment less.
Unit root: taking first differences of the data
Steven, you write “Here is what is not observed for example..
1. the average
2. the trend.
Those two “things” are never observed. They are not in the data.
They are created when you decide to apply a mathematical operation TO the data. This mathematical operation is a choice. An analyst choice. It is not “In” the data. you apply a method to the data and you get an answer.”
Sorry, you are talking nonsense. If I have a set of numbers, and I can add up the total, divide by the number of numbers, and calculate the average. So the average is inherent in what the numbers are. It may not be observed, but it can always be calculated. Whether the average actaully means anything, and how you interpret it, that is an entirely different matter. The average is the first moment of the data. I can also calculate the second, third and fourth moments of the data, and these will tell me what sort of a curve I can fit to the data.
I have spent a good part of my career obtaining data from trials of various sorts, and then analyzing the data. It is a simple and straightforward matter. I worked with the Canadian Army, and we analyzed many results of firing trials, where weapons of various sorts were fired at targets, the results recorded and then we used the data to assess the relative effectiveness of different weapon systems.
I dont care what references you give me, I did this for years during my career, my colleagues did exactly the same sort of thing, and we applied the results to real problems. I dont need to read anything. I have practiced this for years.
Web,
I find myself hesitating more and more when it comes to attributing motives. note I said hesitating.
Jim may just like to argue ( I do that sometimes)
Jim may just be testing out arguments ( I do that sometimes)
Maybe he is cranky and needs prunes ( I never do )
I’m not inclined to play detective, it could be dangerous
Jim, Jim, Jim.
Data makes no suggestions. Stop pretending that it talks to you.
When you apply a least squares fit you are making assumptions.
TESTABLE assumptions.. In the case of temperature data, these assumptions Girma and you are making are wrong.
Here. read again. let this speak to you and suggest that you might not know everything and that your past experience might not be the best teacher.
In short, be skeptical towards your own ideas. Or be a fake skeptic.
“Thus far the data have been assumed to consist of the trend plus noise, with the noise at each data point being independent and identically distributed random variables and to have a normal distribution. Real data (for example climate data) may not fulfill these criteria. This is important, as it makes an enormous difference to the ease with which the statistics can be analysed so as to extract maximum information from the data series. If there are other non-linear effects that have a correlation to the independent variable (such as cyclic influences), the use of least-squares estimation of the trend is not valid. Also where the variations are significantly larger than the resulting straight line trend, the choice of start and end points can significantly change the result. That is, the result is mathematically inconsistent. Statistical inferences (tests for the presence of trend, confidence intervals for the trend, etc.) are invalid unless departures from the standard assumptions are properly accounted for, for example as follows:
Dependence: autocorrelated time series might be modeled using autoregressive moving average models.
Non-constant variance: in the simplest cases weighted least squares might be used.
Non-normal distribution for errors: in the simplest cases a generalised linear model might be applicable.”
Sorry, Steven, I give up. I know that I know what I am talking about, That is all I need to know.
Well there you have it: smartest guy in the room.
It’s still like talking to the cat though.
Ya, BBD.
Jim sure knows that he knows. I guess feynman was right about fooling oneself.
where is Willis? shouldnt he be keeping his tribe in line and honest ?
oh well. cats.
Pekka
Further to earlier posts above.
The biggest problem with “writing off solar effects on climate as insignificant”, at the same time attributing most of the recent changes to AGW, is that it does not appear to stand up over the longer term.
Vaughan Pratt’s analysis attempts to remove everything besides the AGW effect as “noise” and ends up with an exponential temperature increase over time with added GHGs.
This is an interesting analysis, but it handles natural (solar) forcing as “noise”, rather than the “signal”.
But the longer-term record looks a bit different.
There have been major climate shifts over the past few thousand years, before there was any real human influence through added GHGs. Many of the cold periods coincide with periods of very low solar activity (Spörer, Maunder, Dalton, etc.) and warm periods coincide with periods of higher solar activity (late 20th century, for example).
So it appears to me that we need to know more about how the sun influences our climate than we already do. I do not believe that the climate models today can accurately model solar cycles and their impact.
So what is the “noise” and what is the “signal”?
Svensmark has shown a good long-term correlation between solar cycle length and temperature. There are other studies showing a long-term solar climate correlation. IMO if one applies temporal averaging of various solar-related factors, such as Wolf number, cycle length, geomagnetic effects, cosmic ray intensities, etc. one can get a much stronger correlation between the sun and our climate than one can with GHG concentrations (primarily CO2) alone.
And the beauty of this is that we can go back much further in time, long before there was any AGW.
I know there have been solar studies and the cosmic ray/cloud connection is being tested at CERN today, but I believe there has been far too little effort to try to fully understand all the mechanisms by which our sun drives our climate, and far too much emphasis on AGW.
And, Pekka, I’m afraid that this has been NOT for scientific reasons, but for purely political ones.
But that is just my opinion.
Max
Lag sun- SST = 15 years .
See
http://judithcurry.com/2012/12/04/multidecadal-climate-to-within-a-millikelvin/#comment-274253
http://judithcurry.com/2012/12/04/multidecadal-climate-to-within-a-millikelvin/#comment-274250
Max,
There are certainly political reasons for the amount of research on AGW related issues. The “political reasons” have a strong influence on research funding. A major part of the present climate research would not be there without the “political reasons”, i.e. the willingness of politically controlled organizations to fund such research much more than it would be funded in absence of the widely accepted view that AGW is a very serious and possibly the most important risk to humanity. The acceptance of this view is not universal but it’s certainly wide enough to have that influence on research funding.
The worry is about AGW, not about suns influence on the climate. Understanding suns role more accurately helps in interpreting history data, otherwise it’s of zero relevance for the issue politicians wish to have more knowledge about.
The question asked is fundamentally not what has happened in the past, the question are along lines
– What are the possible outcomes for the future?
– What are the credible worst cases and how likely they are?
– If the risks are severe enough then what can we do to reduce the damage?
And ultimately:
– What are the best policies taking into account the estimated risks and the available options for mitigation and for improving our ability to adapt in the future?
Understanding the role of the sun is a very small piece in this real case.
Pekka
You have cart before horse. The reason CAGW is widely accepted in the first place, is that the idea was politically funded, and politics stands to gain so much from an acceptance of CAGW.
“politics stands to gain”
What does that mean?
How can you relate that to the rise of the climate change issue to worldwide concern?
Claiming that the basis for the development of the climate concern would be in “politics stands to gain” lacks merit. The concern grew from scientific results: Mauna Loa CO2 measurements and scientific understanding of the atmosphere based on the work of Manabe and others.
I do, however, agree that at a later stage a number of politicians have (consciously or not) realized that emphasizing the threat from AGW fits well with their other ideologies of ecologist or degrowth nature. They have then become ardent supporters of the most alarmistic views in hope that this advances their other interests as well.
Pekka Pirilä
“politics stands to gain”
What does that mean?
It means more of society is then controlled by political structures. More taxes, more regulation, more bureaucracies.
How can you relate that to the rise of the climate change issue to worldwide concern?
The result of the untold $billions governments spend on climate science. You’d need to be very naive to think that political funding decisions weren’t from the start biased from high up so as to advance political control.
I note that you partially agree with this, but the greater issue is that, most of all, CAGW plays to the soft totalitarian political agenda. That is why leftists are so keen to just believe in it.
Nerp! Nerp! Nerp!
Conspiracy theory alert! Conspiracy theory alert!
Nerp! Nerp! Nerp!
Obvious facts
– Government funds climate alarmism (cagw)
– Government stands to benefit from acceptance of alarmism (more excuses for tax…..).
So how exactly do you manage to worm “conspiracy” into your desperate denialism ? Why do you need a “conspiracy” to explain how an organisation promotes its own interest ? Are you a ‘naivete theorist’ then, who thinks vested interest never affects the funders of science ?
Pekka
Thanks for your respomse.
Everything you write makes good sense to me except the last sentence:
An example:
IPCC models estimate that the total forcing from the sun since pre-industrial year 1750 was around 7% of the total forcing, with the CO2 forcing being roughly equal to the total anthropogenic forcing (other factors, such as minor GHGs, aerosols, etc. cancelled one another out). IPCC does concede, however, that its “level of scientific understanding of solar (natural) forcing is low”.
Several solar studies estimate that around half of the past warming can be attributed to the high level of solar activity in the second half of the 20th century (Lean curve).
So the difference in solar forcing between 7% (as estimated by IPCC) and 50% (as estimated by the solar studies) has a significant impact on the estimated past forcing from CO2.
The IPCC statement that most of the observed increase in global average temperature since the mid-20th century is very likely due to the observed increase in anthropogenic greenhouse gas concentrations” is very much dependent on what weighting was given to natural (mainly solar) forcing over this period.
If solar forcing was 50% of the total, then “most of the observed increase” cannot have come from increases in human GHG levels.
And the solar portion would also have a major impact on hat “most” really means: is it 51%, is it 67%, is it 80%?
Makes a big difference.
So “understanding the role of the sun is a NOT very small piece in this real case.”. It is of paramount importance IMO.
Max
Vassily
So “alarmism” is a governmentally funded conspiracy to raise taxes and increase governmental control over private individuals… As opposed to an unpleasant possibility arising from scientific investigation into the radiative properties of CO2.
[Shakes head sadly]
You are a conspiracy theorist and you don’t even realise it. This should be amusing but somehow it isn’t.
BBD
Obvious facts
– Government funds climate alarmism (cagw)
– Government stands to benefit from acceptance of alarmism (more excuses for tax…..).
No contest from you. OK.
So how exactly do you manage to worm “conspiracy” into your desperate denialism ?
BBD : no relevant argument offered.
Why do you need a “conspiracy” to explain [why] an organisation promotes its own interest ?
BBD : no relevant argument offered.
Promoting self-interest is obviously normal behaviour, done without having to think about it. Or talk about it, or conspire about it. Science programs that boost the funder will get preference without a murmur.
Are you a ‘naivete theorist then, who thinks vested interest never affects the funders of science ?
BBD : no relevant argument offered.
A resounding Yes then.
And you don’t even realise it. Head-shake time indeed.
No doubt you think pharmaceutical- and tobacco-funded research isn’t likely to be skewed in its sponsor’s favour either?
As regards CAGW emerging from a bona-fida science process, we have overwhelming evidence from Climategate of the widespread compromising of the science process, always in the alarmist direction.
Worse, this doesn’t seem to trouble many climate scientists, indicating that Mann and Jones &co aren’t just a few rotten apples – virtually the whole barrel is off. Bear in mind it isn’t just what they are telling us, it’s also a question of what they are not telling us (eg Hiding the Decline).
@vukcevic
Thanks for the heads up about Svalsgard and Pratt both being at Stanford. That explains a lot. Birds of a feather, left coast liberals, and so forth…
“left coast liberals”
They’re like breakfast cereal out there: Nuts, Fruits, and Flakes. ;)
Andrew
dr. Pratt has voted republican for 56 years by his own account, but is not what you might call a typical republican.
I’ve never asked leif about his politics,
dr. Pratt has voted republican for 56 years by his own account
You must be confusing me with someone else. I’ve only been eligible to vote for the past dozen or so years. I wasn’t even a teenager 56 years ago.
Just realized you misinterpreted my “Chairman Pratt” page. The “I” under the heading “The Republican’s Dilemma” refers to a dilemma faced by an abstract republican speaking there. But I can see how the confusion could arise.
That’s funny. reading through that piece I had to throw up my hands and conclude.. well he says he voted republican, but his ideas are all over the map. glad you “cleared” that up. sorta.
manacker | December 6, 2012 at 8:06 am |
It is clear that the late 20th century saw a period of unusually high solar activity as Solanki suggests.
No, there has been no increase in solar activity the past three hundred years: http://www.leif.org/research/Solar-Petaluma–How%20Well%20Do%20We%20Know%20the%20SSN.pdf
But there has be a tiny change in solar TSI over the past 500 years. A variation that could cause a whopping 0.1 C +/- 0.1C change in surface temperature. Over 50 years, that could add 14×10^22 joules to the oceans :)
Max, some will take issue with my methods but this is a different look at the lead lag relationship of surface temperature and deep ocean temperature.
https://lh6.googleusercontent.com/-joaHMi2s-WI/UMDbWz5271I/AAAAAAAAF5E/I4Gg9M5cu3c/s925/bintanji%25205%2520ka%2520sd.png
To get the scale close I normalized over 500k years then used a 5k year running standard deviation to produce a nice smooth look. There appears to be an average 4,000 year deep ocean lag. We are riding on one of those waves.
But even if we take Judith Lean’s plot of TSI that Max pointed to as gospel, it still doesn’t bear out his point. Max is perfectly happy to point out that the upward trend in HadCRUT3 for 2000-2010, at 0.028 C/decade, is lower by a factor of two than that of the decade 1980-1990 (you can check these on WoodForTrees), and to infer that global warming must have stopped. Yet he is unwilling to point out that Lean’s Figure 4a on p.2427 of her paper, which shows a strong rise between 1890 and 1950, flattened out for the half-century 1950-2000. Instead he (or someone, but certainly not Lean herself) fits a straight line to the period 1890-2000.
This is a pretty inconsistent way of proving that global warming is due more to increasing TSI than to increasing CO2. Whatever its significance for TSI, Lean’s plot tells us something about climate skepticism.
Vaughan Pratt
I think you have misunderstood what I wrote.
You say that changes in TSI could not have been the primary cause for past warming.
I agree with you; it would take other solar-related factors besides just TSI for the solar influence to be significant.
Even then I believe that there are other non-solar factors, which play a role and influence our climate, including GHGs.
I do not believe, as you do, that there is one overriding “climate control knob” (Lacis, Alley) – and that this is CO..
I believe it’s much more complicated than that and there are many “climate control knobs”, some of which we are even unable to define a mechanism for today.
But, Vaughan, since there are long-term records that show reasonable correlation between solar activity and temperature, then it is hard for me to simply discard the solar factor as “noise”.
As they say at the end of all climate studies “more work needs to be done”.
I agree, and I think this work needs to be done in order to identify and quantify all the mechanisms by which the sun has influenced our climate over the past.
Max
Max said, “I agree with you; it would take other solar-related factors besides just TSI for the solar influence to be significant.”
Not really. Solar is significant as it is, we just don’t have any good grasp on the potential lags that the oceans can produce. There are thousand year lags in solar response. A roughly 5 to 6 ka delayed response or fifth based on obliquity, a 4.3 ka delayed or fifth based on precession. We are currently in the austral summer peak of the precession so the oceans could be in a charging cycle. The 0.09C increase in deep ocean temperature may not be felt at the surface for 4000 years or more. a few hundred years of instrumental data needs to be taken with a grain of salt water since we don’t even know the absolute surface temperature to within 2 degrees.
Vaughan Pratt
Not to belabor a detail here but you apparently misunderstand the fact that
– GH forcing (and warming) is based on an increase in the GHG concentration in the atmosphere, with an estimated logarithmic relation
BUT
– Solar forcing is based on the absolute value of the direct irradiance, for example (plus other possible mechanisms not yet fully understood).
So if the second half of the 20th century had the highest average absolute levels of solar activity for “several thousand years” (Solanki) and at least 350+ years (Lean), then this could well have been a significant cause of late 20th century warming (building in all the “time lags” one might envision), despite the fact that the absolute level of solar activity was declining over this period.
IOW it is NOT the rise or decline in solar activity that is the driver, it is the absolute value (and this was unusually high in the 2nd half of the 20th century).
Hope this clears up the point I was trying to get across.
Max
@manacker: IOW it is NOT the rise or decline in solar activity that is the driver, it is the absolute value (and this was unusually high in the 2nd half of the 20th century).
Certainly, but whether high or low, if the Sun is going to influence global warming then how can a Sun that has constant TSI (averaged over a solar cycle) during 1950-2000 play any role in the global warming that was at its strongest over that period?
@manacker: I agree, and I think this work needs to be done in order to identify and quantify all the mechanisms by which the sun has influenced our climate over the past.
Max, I’m open to the possibility that a warming Sun during 1890-1950 contributed to a warming Earth over that period, but not over a period where no one is claiming the Sun is changing. Whether hot or cold, the Sun can’t be blamed for rising temperatures when the TSI is not rising.
However I know a lot less about solar phenomena than atmospheric ones and therefore would defer to Leif Svalgaard’s far greater expertise there. My understanding from Leif is that solar variation over the last century or more has been overstated.
Vaughan Pratt said, “Certainly, but whether high or low, if the Sun is going to influence global warming then how can a Sun that has constant TSI (averaged over a solar cycle) during 1950-2000 play any role in the global warming that was at its strongest over that period?”
Trickle charging. The rate of OHC uptake and solar are in the same order of magnitude, with an inertial lag, the deeper oceans would continue warming slowly while the upper layer flattens. The UV change BTW is more per cycle than the overall TSI. Nothing like a complex system with many thermodynamic boundary layers or different heat capacities if you get tired of crossword puzzles :)
Note: The effective radiant energy of the 4C deep oceans is 334Wm-2 just as a reference, the estimated DWLR which I am not a big fan of is ~334Wm-2 +/- 20, The standard deviation of the deep ocean temperatures over the past 500ka is roughly 0.82 and at 334Wm-2, the “sensitivity” of the deep oceans to a 3.7Wm-2 forcing increase would be about 0.8 C degrees. I am sure that is all just coincidence though.
Vaughan Pratt
It is not the change in solar activity that counts, Vaughan (as it is with CO2); it is the absolute level.
If we assume that the Solanki paper and Lean curve I cited are correct, then the solar activity in the second half of the 20th century was unusually high (TSI is a part of this but by no means all).
Just taking the maximum Wolf numbers for the solar cycles shows this fairly clearly (the Warwick Hughes curve I cited).
Average of the max. Wolf numbers for:
SC 18 thru 22 (1945-1996) averaged 154
SC 10 thru 14 (1858-1902) averaged 88
So the late 20thC solar activity was 75% higher than the late 19thC activity.
And, remember, it is the absolute level of solar activity that counts.
I think it is fair to say that we do not know all the mechanisms involved between the sun and our climate (for example, things like the GCR cloud hypothesis being tested at CERN), and IPCC has conceded that its “level of scientific understanding of solar (natural) forcing is low”.
Past climate swings (some much larger than the current warming) correlate well with changes in solar activity, but these cannot be accounted for just with TSI.
These factors all lead me to suspect that there is more to solar forcing than meets the eye or than IPCC has assumed in its models.
That was my point.
Although I certainly don’t “have a dog in this race”, I think the CLOUD experiment work at CERN will clear up a lot of the uncertainty.
The last report showed us that CLOUD had confirmed the basic cloud nucleation mechanism with cosmic rays if certain natural aerosols are present, but stated that more work was needed to see how this would work in our atmosphere. If the ongoing work fails to confirm the GCR cloud hypothesis, we can at least write that hypothesis off. If, on the other hand, it confirms the GCR cloud hypothesis experimentally, then this could give us a whole new ball game.
Times are exciting.
Max
“Just how large this role is, must still be investigated, since, according to our latest knowledge on the variations of the solar magnetic field, the significant increase in the Earth’s temperature since 1980 is indeed to be ascribed to the greenhouse effect caused by carbon dioxide,”
JCH
Your quote underscores the fact that “latest knowledge” gets updated every day.
Sometimes there is a major “update”, which results in a paradigm shift.
Whether or not CERN will provide us one of these “biggies” is still wide open, as the above quote confirms.
Stay tuned
Max
lsvalgaard
Thanks for your interesting presentation on solar activity.
Looks like there are open questions that need to be resolved on the record of solar activity.
It will be interesting to see how this one develops.
Max
Vaughan Pratt
The assumption of nearly flat CO2 concentration before mid-20th century is unjustified as it has a strong correlation with the global mean temperature since 1958 as shown:
http://www.woodfortrees.org/plot/hadcrut3vgl/compress:12/plot/esrl-co2/compress:12/derivative/scale:0.2/detrend:-0.5/offset:-0.4
The global mean temperatures were higher in the 1940’s compared to in the 1970’s, so the CO2 concentration should be higher in the 1940’s than in the 1970’s.
@Girma: The global mean temperatures were higher in the 1940’s compared to in the 1970’s, so the CO2 concentration should be higher in the 1940’s than in the 1970’s.
That would follow if CO2 were the only influence on global temperature. Do you believe it is, then?
Vaughan
That would follow if CO2 were the only influence on global temperature. Do you believe it is, then?
Why do you think the direct correlation between CO2 concentration and GMT, shown below, exists only for the last 54 years, since 1958?
http://www.woodfortrees.org/plot/hadcrut3vgl/compress:12/plot/esrl-co2/compress:12/derivative/scale:0.2/detrend:-0.5/offset:-0.4
Why not for the last 162 years, since 1850?
Girma, I think the correlation existed for the last 162 years too. Furthermore the correlation is between T and CHANGE in CO2, not the CO2 level.
Edim is exactly right — the change in CO2 was very small during the first half of the period, so the resulting changes in temperature then were overshadowed by the various natural swings. As the CO2 started to change faster you can see the CO2-caused temperature rising out of the rest of the fluctuations, which are there throughout the whole period.
If you write HadCRUT3 = SAW + AGW + MRES + SOL + DEC as per Figures 10 and 11 of my poster, you have one manmade fluctuation (which may be caused by more than merely CO2 but how do you tell them apart?) and four natural ones (well, DEC is surely lots, e.g. ENSO, but they’re lumped together as DEC).
IPCC can not show any kind of human means to control climate warming.
Investigations we have to direct to potential working solutions available to adapt ourselves to harmfull events of natural climate changes.
The biassed view of the cause on recent warming and certain kind of extreme events, which are believed by UN politicians to be due to anthropogenic CO2 emissions, has to be replaced by working solutions regarded as due and fitting. As easily understandable for politicians, too, this can be reached by a pragmatic approach of the problem. For instance, one serviceable procedure is to interpret the question brought up for discussion by Girma; http://judithcurry.com/2012/11/28/clouds-and-magic/#comment-273030 :
”Chief
What is your interpretation of the following data?http://www.woodfortrees.org/plot/rss/compress:12/normalise/plot/esrl-co2/compress:12/derivative/normalise/from:1979.3/plot/rss/normalise/trend ”
As far as I am aware there is no proper evidence available for the AGW hypothesis of IPCC. The result of the interpretation asked by Girma above can only be an increase of CO2 content in the atmosphere because of natural warming, where the share of anthropogenic CO2 emissions is minimal.
There are ways of various kind to prove that the recent warming and increase of CO2 in atmosphere are dominated by natural factors; look e.g. at my comment http://judithcurry.com/2011/08/04/carbon-cycle-questions/#comment-198992 etc.:
1)The CO2 content in the atmosphere is controlled together by both all CO2 emissions from sources to atmosphere and by all CO2 absorptions from atmosphere to sinks. Nowadays when the yearly total CO2 emissions are little over 200 GtC (CO2 as carbon) and the yearly human CO2 emissions are about 8 GtC, the influence of the human CO2 emissions on the CO2 content in atmosphere is approaching 4 % at the most. For instance, when the CO2 content in the atmosphere is 390 ppm, the manmade share of it is only about 16 ppm at the most; in the reports of IPCC the human share of recent CO2 content in atmosphere is assessed to be about 100 ppm without any proper evidence.
2)In the recent Mauna Loa measurements the rate of increase in the atmospheric CO2 content is changing in accordance with the seasons and ENSO cycles, but the rate of increase in the trend of CO2 content is caused by longer cycles of natural warming.
3)Being based on measurements in reality during the last three decades e.g. Lance Endersbee claims: “Oceans are the main regulators of carbon dioxide”. This means that the global mean sea surface temperature mainly controls the CO2 content in the atmosphere; when the mean sea surface temperature is rising, the CO2 content in the atmosphere is increasing.
4)By interpreting the analyss of Bob Tisdale, the global sea surface temperatures used by Endersbee in his calculations have been controlled by warming of the sea surface waters outside the tropical sea surface i.e. mainly by the warming of the sea surface waters of higher latitudes where the sea surface CO2 sinks are.
5)As a consequence, the partial pressure of CO2 has been rising in these as sinks acting surface waters, which has been making CO2 absorption from the atmosphere to the sea surface sinks become slower. Because of that, the CO2 content in the atmosphere has been increasing. It means that more CO2 from the total CO2 emissions to the atmosphere has remained in the atmosphere to increase its CO2 content, in order to reach a new dynamic balance between CO2 emissions and absorptions. As the warming of oceans is the dominating reason for the increased content of atmospheric carbon dioxide, and as nowadays the human yearly portion ( about 8 GtC CO2) of the all yearly CO2 emissions ( little over 200 GtC CO2) to the atmosphere is about 4 %, the human role on the recent yearly increase of CO2 in the atmosphere is also about 4 % at the most. For instance when CO2 content in the atmosphere increases 2 ppm per year, the human portion of that is only about 0.08 ppm at the most.
6)Media have introduced that during the year 2010 the yearly increase of anthropogenic CO2 emissions has rised from about 3 % to about 6 %. It means that, in the yearly human emissions of about 8 GtC, there has arisen a new yearly recordbreaking increase of about 0,5 GtC in the manmade CO2 emissions. As at the same time the increase of CO2 in atmosphere have been about 4 GtC per year, one can find that the increase of 0,5 GtC CO2 in the manmade CO2 emissions is not able to explain the rise of carbon dioxide in atmosphere, not even though all the anthropogenic CO2 increase (0,5 GtC) of emissions would remain in the atmosphere. In reality the share of manmade CO2 emissions per year remaining in the atmosphere is only about 2 % from the yearly increase of human emissions of about 0,5 GtC, as consistent with what the yearly total CO2 increase of about 4 GtC in atmosphere is in relation to the total yearly CO2 emissions of little over 200 GtC, expressed in procentages. The 2 % from the mere manmade increase of 0,5 GtC per year of CO2 emissions causes only an increase of 0.01 GtC i.e. 0.005 ppm CO2 in the atmosphere. Nowadays only the sea surface warming expressed by Endersbee seems to make higher portions of manmade CO2 in atmosphere possible, as the warming of the as sinks acting sea surfaces at the higher latitudes makes absorption of CO2 from the atmosphere become slower. For instanse, in the latest yearly increase of 4 GtC CO2 in the atmospehere there is a portion of 0.16 GtC of human CO2 i.e. 0.08 ppm CO2 as presented above.
7)Tom V Segalstad says, http://www.co2web.info/Segalstad_CO2-Science_090805.pdf : ”The rising concentration of atmospheric CO2 in the last century is not consistent with supply from anthropogenic sources. Such anthropogenic sources account for less than 5% of the present atmosphere, compared to the major input/output from natural sources (~95%).
8)Further interpreting of Bob Tisdales analyses indicates that during periods of several decades dominated by El Niño events (e.,g. 1910-44 and 1976-2009) change trends of SST are increasing, and during same kind of period dominated La Niña -event 1945-1975 there are changes of SST but not such a trend.
9)The correlation between CO2 content in atmosphere and sea surface temperature is connected especially with global sea surface temperature during time periods when El Niño events are dominating. The key role there appears to be related to the temperature of sea surface on higher latitudes where the sea surface CO2 sinks are.
10)The same principle based on Bob Tisdale’s analysis can be used to explain Ernst-Georg Beck’s claims on the rise of CO2 content during the first part of 20th century, including the drop of the CO2 content during the La Niña dominated years 1945-1975. Being direct measurements, the CO2 contents in the atmosphere used by Beck are accurate enough for those purposes; link http://www.biomind.de/realCO2/ . Whereas the ice core proxy values of carbon dioxide content used by IPCC are incompatible with any one of direct measured values, because they are mean values of some centuries, even at their best.
11)As to the observations on potential causes of CO2 changes in atmosphere in reality, one can state:
– Based on cosmic ray variations, one can interpret that during the present interglacial period, Holocene, GST and SST changes follow activity changes of Sun. The machanism is being solved. The trends of CO2 changes in atmosphere are dominated by changes of SST.
– Even during glacial and interglacial periods – mainly being caused by orbital changes – CO2 content in atmosphere have followed temperature changes. For instance during glaciation there have been influenced by two causes: cooling surface waters dissolve more CO2 from atmosphere and a colder climate makes CO2 emitting from biosphere to increase, in which the dissolving of CO2 to sea surface wins the emission of CO2 from biosphere to atmosphere.
– According to geological observations, during the latest 100 million years changes of CO2 content in atmosphere have followed climate changes, especially due to temperature changes.
David Springer and Memphis can pretend all they like that I am avoiding answering questions, but idiotic responses from them in reply to my direct science challenge is not relevant. I’m not interested in playing their games. The only reason I continue to post responses is so others reading might have the nous to understand what I’m saying.
http://judithcurry.com/2012/12/04/multidecadal-climate-to-within-a-millikelvin/#comment-274078
http://judithcurry.com/2012/12/04/multidecadal-climate-to-within-a-millikelvin/#comment-274271
Myrrh
The simple fact is that you are indeed avoiding questions you can’t answer. We can all see that, so pretending otherwise is just idiotic.
That you may be asking other questions does not change that.
Was Carbon Dioxide’s c800 year lag included?
Vaughan Pratt | December 6, 2012 at 10:15 am |
Well, this is weird. Tony says CET indicates warming there in the 1600s, I offer a possible explanation (high tech concentrated in the region where the temperature is being measured), and somehow Tony thinks I’m contradicting him.
Well that is even more weird explanation for the CET centennial trends
http://www.vukcevic.talktalk.net/CET-100-150-100.htm
Hmmm, may be high tech moved to China in 1725 ?
Dr. P. : All knowledge resides in the going odds. The odds improve as more people buy the proof.
After reading your paper for the second time and many of the additional comments, I am starting to think you are taking ‘proverbial p..s’ out of AGW science.
This paper got you a future ‘out of jail’ card.
Vuk
Nice graph. The thing that strikes me is that the population of Britain was tiny in the 1600’s -some 4 million- and even London had only 200,00o at that time. If industry was having a material effect on the climate/temperature even then, it seems to me that man and planet earth are incompatible because there s no way that 7 billion people can have a negligible impact on the planet.
tonyb
High Tony
I prefer to believe that many comments about validity of the CET are result of sheer ignorance, rather than an underhand attempt to sell their ‘past its sell-by date’ goods.
Tony,
It is not that humans and planet are incompatible, for surely we as a species have sprung from this planet and are surely part of the living biosphere. What may be incompatible are the ways we choose to organize ourselves into this mass global civilization. Only completely blind denialists would posit that our current human global civilization is only having a “negligible” effect on the planet. The anthropogenic fingerprint is everywhere.
Hi Gates
Do you think that 4-5 million Brits around 1720 burning wood for heating in the winter (then they run out of wood in 1725), produced as much warming as 60 million all with their central heating, motorcars, heavy industry in 2000 ?
http://www.vukcevic.talktalk.net/CET-100-150-100.htm
Or do you also consider the CET just a ‘little local difficulty’ best left alone ?
Should we consider or dismiss the N. Atlantic Ocean is an unpredictable beast?
http://www.vukcevic.talktalk.net/CET-NAP.htm
As a scientist you know that science needs specific and precise answers not meaningless generalizations.
Vukcevic
The early warming in CET is almost certainly an artefact.
See Parker et al. (1992) here. Please note: it’s a 10.8Mb pdf of a scan of the original. I’ve retyped this from the introduction. Please read this carefully:
No reliable data before 1770. ‘Warming’ very probably an artefact. Massive over-interpretation of unreliable data = deeply unwise.
Couldn’t agree more, Vukcevic. See Parker et al. above.
BBD
In that case Manley not only did a good copy of the 1960 to 1974 (second ref. from 1974) but also remarkably predicted 1974 to 2011.
http://www.vukcevic.talktalk.net/CET1690-1960.htm
as it happens there are geological records, he certainly did not know about, from the N. Atlantic which are not related to the climate change, but could cause the CET change
http://www.vukcevic.talktalk.net/CET-NAP.htm
which shows the second remarkable coincidence.
Pretty pictures do not a scientific case make, Vukcevic. But they are very pretty.
BBD
Science moves by specifics, not opinions. .It is the data the graphs represent that matter, not whether you or I may think they are pretty or ugly. Some dismiss unwanted information, others attach an interpretation they find suitable for the purpose.
Neither is science, nor it was Yamal tree, or many other nonsensical pronouncements often masquerading as a ‘peer review’ science.
I show visually data content for your and others attention, it is your choice what you may say, think or believe.
I had a look at your spreadsheet. A quick one, because I simply don’t have time to go through it thoroughly. I found temperatures at NAMES!D52 and at DATASOURCES!B2
I shifted both temperature datasets down 60 years. ie, I changed 1910’s temperature(s) to equal 1850’s, 1911’s to 1851’s, etc. The new temperatures ending in 2010 therefore show what the temperatures actually did up to 1950. Only the temperatures were changed, not the dates.
Then I compared AGW in your unadjusted spreadsheet to AGW in my adjusted spreadsheet and surprise, surprise, it was the same shape in both. Unadjusted (ie. in your version) AGW runs from about -0.4 to +0.5. In my adjusted version, it runs from about -0.55 to +0.35.
Either the spreadsheet calcs aren’t properly connected, or I have missed some temperatures, or I have misunderstood what you mean by “AGW”, or your calculation of AGW is rather dubious.
Now I see what you have done. You haven’t taken the temperature and removed various components to find out what the AGW component is. What you have done is to start with the AGW component as calculated by the model (which is coded to match the temperature), and then removed from the temperature all the components (“the 22-year and 11-year solar cycles and all faster phenomena”) that aren’t in the model.
Of course the output matches the model!!
The fact that you got a match to a ‘millikelvins’ should have told you that you had stuffed up.
What a shame I’m too late to prevent your circular logic being presented at the AGU Fall Meeting. I hope someone there was able to point it out.
Wouldn’t made any difference. Content of this paper with the Excel files was on the Stanford university website for months (at least July 2012). Stanford is one of half a dozen of the world’s top ranking universities. One can not question the university expertise, but motives is another matter.
Does this AGU poster appear “expert” to you?
By the way, Stanford ranks 20th on number of Nobel prize winners affiliated with it. You are probably confusing it with UC Berkeley.
http://en.wikipedia.org/wiki/List_of_Nobel_laureates_by_university_affiliation
Thank you Mike Jonas for answering the question that has been requested several times of Dr. Pratt in such clear fashion..
@Mike Jonas: What you have done is to start with the AGW component as calculated by the model (which is coded to match the temperature)
What do you mean “coded to match the temperature”? Are you saying that the predicted global warming curve was obtained simply by cloning the data points of the observed warming curve? Had I done that I’d agree with you that this would be utterly stupid.
The model is coded to match the CO2 (as modeled by Hofmann et al) and the Arrhenius law governing the impact of CO2 on surface temperature. It therefore serves to test the accuracy of the Hofmann raised-exponential law for CO2 and the Arrhenius logarithmic law describing the effect of CO2 on surface temperature. It would not match to within a millikelvin if those were not good models of what’s actually going on with surface temperature as observed.
and then removed from the temperature all the components (“the 22-year and 11-year solar cycles and all faster phenomena”) that aren’t in the model.
The claim is restricted to multidecadal climate. That’s why the faster components are removed. Multidecadal climate is well-known to exhibit two prominent features, global warming and the so-called oscillations. It has been a long-standing problem how to separate the two in order to judge their relative proportions. The sawtooth and the AHH law give one way of doing it. I haven’t seen any other way, but I’m certainly looking forward to seeing one if it ever appears.
Incidentally my apologies for the long delays in replying. The time spent replying to so many comments starts to add up, and I’m concurrently trying to attend AGU, which ends today.
[I hope this comment appears in the right place. It is intended as a reply to Vaughan Pratt December 7, 2012 at 2:20 pm ]
VP – you say that “The model is coded to match the CO2 (as modeled by Hofmann et al) and the Arrhenius law governing the impact of CO2 on surface temperature.”.
No, you used the formula, but picked parameters to match the temperature. Those parameters included at least a time-delay and an arbitrary number for climate sensitivity.
(Reading the comments in reverse order, sorry.)
@Mike Jonas:I simply don’t have time to go through it thoroughly.
Right, few will, only people auditing with a fine tooth comb. The thing to focus on at first is the sliders and the MRES chart (in gray) above them, which should take no time to figure out how to slide. But first this.
I found temperatures at NAMES!D52 and at DATASOURCES!B2
By NAMES!D52 I guess you mean MAIN!D52.
I shifted both temperature datasets down 60 years. ie, I changed 1910′s temperature(s) to equal 1850′s, 1911′s to 1851′s, etc.
Shifting MAIN!D52-D212 down 60 rows won’t change anything because every cell in that column contains the same formula, namely =AVERAGE(MONTHSy). Shifting DATASOURCES!B2-B1933 down 12*60 = 720 rows will shift the values in MAIN!D52-D212 down 60 rows. This is because MAIN!D contains the annual averages of the monthly values in DATASOURCES!B. MONTHSy denotes a 12×1 window (one year’s worth of monthly temperatures), which AVERAGE(MONTHSy) takes the average of.
The new temperatures ending in 2010 therefore show what the temperatures actually did up to 1950. Only the temperatures were changed, not the dates. Then I compared AGW in your unadjusted spreadsheet to AGW in my adjusted spreadsheet and surprise, surprise, it was the same shape in both.
No occasion for surprise. AGW gives the temperature predicted by the Arrhenius law from the CO2 level. Unless you change the CO2 level the predicted temperature won’t change—Arrhenius would have been most surprised if it did. The prediction is not based on temperature and therefore AGW won’t change when you change the temperature.
To make CO2 and hence AGW change, change the sliders at Q25 and T25 (on MAIN!). (The little green triangles indicate that the slider is unlocked for sliding.)
The goal with the sliders is to make MRES (multidecadal residual) in the gray plot above the sliders as flat as possible. One criterion for flatness is its variance (MAIN!AB33), whose square root is its standard deviation (shown on the chart itself). The flatter the smaller. Minimizing either minimizes the other.
Changing the temperature as dramatically as you did will make MRES go crazy, and you won’t find any slider positions that can calm it down, even if the sliders went off to infinity. Sliding it down one year instead of 60 should allow you to find a slider setting that flattens MRES.
For background behind the flattening-MRES process, glance at estimation theory and take a slightly longer look at least squares (minimizing the sum of the squared errors—related article at Minimum mean squared error—minimizing sum-of-squares and mean squared error are the same thing, and essentially the same thing as minimizing variance and standard deviation ). Flattening MRES can be defined precisely as minimizing mean squared error. When you slide the sliders to minimize the variance you are doing manually what computers do inside a black box when performing a least-squares estimate. Here you can actually see not only the variance of the residual (in AB33) but the shape of the residual as well, which itself is very interesting.
In my MATLAB version of the same thing the parameters are adjusted algorithmically with the Nelder-Mead or downward simplex method, at least for the nonlinear dependencies, which makes a black box of the procedure from which it is hard to learn anything. The ability to perform manually what the computer does behind the scenes is intended to give an intuitive feel for what least-squares estimation is. And if you judge MRES by other criteria than variance or standard deviation, e.g. getting an interesting shape, then you are still within the realm of estimation theory (you’re estimating the parameters that give you your interesting shape) but no longer in that of minimum mean squared error.
In due course I’ll flesh out the documentation, which is pretty minimal thus far. (Only time for so many things.)
Yes MAIN!D52, and yes it is only DATASOURCE that needs to be changed to change temperatures.
You say “AGW won’t change when you change the temperature”, but it did. It shifted down by 0.15 deg C. The temperature is explicitly added into AGW in sheet MAIN column V.
Sorry, you’re right, I forgot that MeanDATA is added at the end to force the AGW prediction to use the same anomaly reference temperature as HadCRUT. If you were to replace “= Mean” with -0.1654 in D32 (the mean of HadCRUT3 before changing it) AGW will now not depend on temperature.
I’ve had a houseful of guests over the weekend. I’ll try to give you a more detailed rundown in the next day or two.
Vaughan Pratt – I have supplied a detailed analysis of your circular logic to Judith Curry, and requested guest post status so that it can get equal exposure to your initial guest post.
Looking forward to it, Mike.
My analysis is now posted on WUWT.
http://wattsupwiththat.com/2012/12/13/circular-logic-not-worth-a-millikelvin/
The Skeptical Warmist | December 6, 2012 at 1:48 pm |
“It is not that humans and planet are incompatible, for surely we as a species have sprung from this planet and are surely part of the living biosphere. What may be incompatible are the ways we choose to organize ourselves into this mass global civilization. Only completely blind denialists would posit that our current human global civilization is only having a “negligible” effect on the planet. The anthropogenic fingerprint is everywhere.”
Compatible with what? If the planet actually gives a rat’s ass whether it’s got a biosphere or nothen it’s probably like every other bloody living thing of lesser scale and what it cares about is reproducing so it doesn’t die out.
It’s a given the earth will eventually die. The sun goes red giant and it incinerates the earth. A forgone conclusion if nothing else wipes out all life first.
So what the earth needs is a way to locate other planets suitable for life and then reproduce the extant biosphere there before it dies. The sooner the better because something else can come along at any time.
So what happened so far in the furtherance of that goal you might ask.
Well sir, I’ll tell you. The earth produced a species that builds telescopes and for some crazy reason is obsessed with finding other planets that might support life like we find here. The same species also builds spacecraft. It also has a gene database and is in the process of cataloguing the global gene pool. It has cryogenic tissue banks with samples of a zillion different things from plants to fungi to bacteria to human sperm and ova and everything in between.
Remarkable, isn’t it. It’s like humanity was designed for the purpose of bringing technology to bear on the task of finding other habitable worlds and/or terraforming suitable fungible worlds and moving a subset of the biosphere to it to get things rolling and maybe even genetically tailor it for a new environment.
Homo neanderthalensis went extinct, since he lived in harmony with th environment. Homo sapiens came along, hell bent on changing that environment for his convenience and benefit, eventually evolving into homo antropogenicus tepidus.
You must have missed the memo. Neandertal DNA has been recovered, sequenced, and is found mixed in with DNA of modern humans. It appears they cross-bred with homo sapiens and produced fertile offspring.
If cross breeding produces fertile offspring then by definition the parents of the same species. That is the biological definition of species and is the strictest definition. So Neanderthals and modern humans are actually different breeds of the same species.
You know anyone with really protruding brow ridges? They got a double dose…
Write th
According to the The Times Higher Education World University Rankings 2012-2013 this is top list for the US
1 California Institute of Technology 95.5
2 Stanford University 93.7
4 Harvard University 93.6
5 Massachusetts Institute of Technology 93.1
6 Princeton University 92.7
9 University of California, Berkeley 90.5
comment about homo antropogenicus tepidus was a bit of sarcasm.
vukcevic | December 6, 2012 at 7:06 am |
“The CET summers have not shown any global warming in 350 years.
http://www.vukcevic.talktalk.net/MidSummer-MidWinter.htm
while all the warming was in the winter months.”
Yes of course. That’s because it’s dryer in the winter. Water vapor has a negative feedback so the non-condensing greenhouse gases have the most potential for warming where there’s the least potential for evaporation to blunt it. With the sole exception of Antarctica global warming in any region or season is inversely proportional to the amount of water available for evaporation. The NH gets the lion’s share of it. Over land. In higher latitudes. All things that conspire to limit the hydrologic cycle. If the water vapor “amplification” narrative was true we’d expect to see exactly the opposite. But we don’t. That’s because water vapor amplification is a fiction. It’s water vapor dampening (pun intended).
David Springer
You allude to a negative water vapor feedback.
I know this may sound like a red herring, but there are NOAA data out there from weather balloons and satellites, going back to 1948, which measured and recorded tropospheric relative humidity (RH) and specific humidity (SH).
I downloaded these data and plotted them against the “globally and annually averaged land and sea surface temperature anomaly” record of HadCRUT3, to see if there was any correlation.
http://farm4.static.flickr.com/3343/3606945645_3450dc4e6f_b.jpg
The results were counter-intuitive. Water vapor content (SH) showed a long-term decreasing trend with warming temperature. Yet on a short term basis humidity seemd to increase with temperature, as the many “blips’ in the two curves show.
The short-term correlation has been shown by physical observations, such as those of Minschwaner + Dessler 2004, for example. These showed a positive feedback, albeit at a much lower level that would be required to maintain constant RH (as assumed by the IPCC models).
http://farm4.static.flickr.com/3347/3610454667_9ac0b7773f_b.jpg
But the surprising thing to me was the long-term trend in the opposite direction.
I posted this over on RealClimate with a question of how this could be so and Gavin Schmidt quickly commented that the published NOAA data were false, due to instrument errors.
I asked Gavin if the records are false why are they still being published by NOAA, but my comment got censored out.
But for me this is a dilemma. Why would the long-term SH response to temperature be different from the short-term response?
Do you have an answer for this?
Max
The interchange between David L.Hagen (‘6/12 10.32am) and
David Springer (6/12 1054am) is about what I asked in the
previous thread.
DLH: ‘An exponential increase inCO2 only gives a linear
response to the logarithmic effect of CO2 concentration’
DS: ‘Due to the decreasing GHG efficacy, part for part,
the small amount added with the beginning of the industial
revolution …have the same effect as the big bits being
added now.’
Isn’t this the crux of the AGW debate? Or is this jest
(another) over simplification on my part? (
No Beth, that is not the crux.
The crux is how big is the hit and what can we do if anything to stop it.
Lets put it in perspective.
Start with this
http://en.wikipedia.org/wiki/File:All_palaeotemps.png
Today, its about 14-15C average temp for the earth.
Now look back 2-3Million years ago, when we evolved.
During the course of out life on the planet its been in a band roughly -2C from today to plus 1C from today. And we exist pretty happily in that terrarium. At least, the evidence is that we’ve done pretty well in that temperature range. not too cold not too warm. And we’ve built our civilization in that regime. Built our houses by the sea, planetd our food where it grows, adapting to the environment and changing it where we can.
Now look back 50 million years to the Eocene. basically it was 5-6C warmer than today back then.
http://en.wikipedia.org/wiki/Eocene
Question. Do you think its safe to go back to that kind of climate, you know with alligators in alaska?
http://www.scotese.com/earlyeoc1.htm
So, starting from today at 15C, do you think its safe to go to 20C?
If we go halfway there to 17.5C it will be warmer than our species has ever seen. I suppose we will migrate. But do we really want to put ourselves in that situation if we dont have to?
That’s the crux. We are headed to a future that we havent seen. Headed to future the planet hasnt seen in 50 million years. That’s not to scare you. That’s just to give you a sense of what is at stake. Its a big unknown
So, when people talk about doubling C02 and adding 3C to the temperature that would basically put us more than halfway to a hot house earth. Not sure we want to do that.
But if doubling C02 adds 1C, well we are not so far outside the range we have grown up in. Still, you want to do that?
For me it doesnt see wise to claim that we know it will be safe. And it doesnt help to get overly dramatic and go all apocalyptic. waaa the sky is falling….
You have rocks in your head mosh. Temps have been higher in the Holocene. Average temps flucuated 14 degrees F in the glacial/interglacial shifts. Temps have been higher commonly in the planetary history than in the current Ice Age.
http://hyperphysics.phy-astr.gsu.edu/hbase/thermo/templine.html
http://en.wikipedia.org/wiki/File:Five_Myr_Climate_Change.svg
And the argument that things are changing more rapidly doesn’t wash either. Major shifts happen in months let alone decades. It is the nature of a chaotic system.
Projections are absurd. It is impossible to do it with models that are themselves chaotic. You want me to believe that you can do it in your head? Sorry – too many rocks there already.
“Average temps flucuated 14 degrees F in the glacial/interglacial shifts.”
That’s not global temperature, that’s regional temperature at vostok.
Here’s an estimation of Global Temperature over the past 5 million years. This is what the multi degree C warming humans risk producing in the two coming centuries should be compared against.
link http://upload.wikimedia.org/wikipedia/commons/4/4c/Global_temperature_relative_to_peak_Holocene_temperature,_based_on_ocean_cores_(NASA).svg
fixed link
Beth
You ask:
It’s a big part of the debate, to be sure.
The logarithmic CO2 temperature response is a bit of a dilemma for those who want to demonstrate catastrophic AGW.
They need to come up with a CO2 increase rate that is more than exponential to arrive at high warming projections, because an exponential rate of increase only results in a linear warming rate.
The dilemma is this: the rate of increase of atmospheric CO2 has leveled off at around 0.5% per year, over a time period when human population was growing at 1.7% per year.
UN projections predict that population growth will slow down dramatically in this century, reaching around 10.5 billion by 2100 (and an exponential growth rate of less than o.5% per year).
With all the pressure on fossil fuel costs (more difficult and costly extraction, etc.) it is highly likely that alternate sources (such as nuclear or something new) will be used to cover much of the future demand.
As a result of these factors, overall carbon efficiency (GDP generated per ton of CO2 emitted) is increasing for all countries.
However, even if per capita fossil fuel based energy were to increase by 50% by 2100, the overall CO2 concentration would still not grow at a higher rate than 0.5% we now see, due to the slowdown in population growth rate.
So we have a rate of temperature increase that is linear in the most pessimistic case and logarithmic in the most optimistic case – and this will not get us to the alarming temperature increases projected by IPCC (or by Vaughan Pratt’s exponential curve).
Max
Beth
I see Steven Mosher has given his response to your question.
He paints the specter of temperature rising by 5C by 2100 (from 15C to 20C on average).
This may be something that comes out of the models if you feed them the right input, but it is poppycock if you look at the likely CO2 growth rates and the logarithmic CO2 temperature response (my previous post).
We see how poor the models are at forecasting temperature on a decadal basis: 0.2C/decade warming projected; 0C warming observed since the end of the last century.
If they can’t get a decadal forecast right, it is likely that they will have even greater difficulty getting a 90+-year forecast right.
The climatologist quacks
The black swan (hiding) ponders
Was that a canard?
Max
@manacker: So we have a rate of temperature increase that is linear in the most pessimistic case and logarithmic in the most optimistic case – and this will not get us to the alarming temperature increases projected by IPCC (or by Vaughan Pratt’s exponential curve).
First off it’s not an exponential curve, it’s the log of a raised exponential, meaning a function with the shape of log(1+exp(x)). It gradually straightens out in the distant future, becoming a line with a slope of about one degree per decade. It seems extremely unlikely that this model could possibly hold up that long, although they said the same about Moore’s Law decades ago.
Second, I did not make any predictions. I did extrapolate the model in a side bar (on the left), but extrapolation is not prediction. I don’t claim to know whether the doubling time of CO2 emissions will increase or decrease over this century. Even if it increases for population (i.e. population grows more slowly in future), any matching decrease in doubling time for per-capita energy consumption will offset that increase and CO2 emissions will therefore continue to follow the curve. We have no way of knowing, and guessing wrong could be bad.
@manacker: If they can’t get a decadal forecast right, it is likely that they will have even greater difficulty getting a 90+-year forecast right.
That doesn’t follow. In some systems it’s true, in some it’s false. For climate vs weather it is an empirical observation that shorter term is harder down to about two weeks; shorter than that and the predictions start improving again thanks to supercomputers.
If my poster has any bearing on predicting multidecadal climate, it shows that 50-year predictions are easier than 5-year ones. Try to find a pattern in DEC (the top series in Figure 11)! It is an empirical observation that SOL and MUL show regularities that are not at all apparent in DEC.
@manacker: The logarithmic CO2 temperature response is a bit of a dilemma for those who want to demonstrate catastrophic AGW.
Ironically it’s the other way round. Suppose Ming the Merciless on Mars (a character from 1930’s Buck Rogers comics and matinee serials) decides to cook Earth’s humans by adding greenhouse gases to Earths’ atmosphere. For simplicity let’s assume H2O and CO2 each add a degree per doubling.
So to add a degree Ming has the choice of doubling H2O or doubling CO2, right? Either one will have the same effect.
Assuming Earth’s atmosphere is 1% water vapor, to double it Ming would have to boil off something like the top 15 cm of ocean.
Earth’s atmosphere is only 0.04% CO2. To double the CO2, if dry ice lay on the Earth’s surface he’d have to sublime a mere 4 mm thick layer of it. Actually that takes no energy since CO2 will sublime all by itself.
But even if it did take energy, it would still be much less expensive for Ming to add a degree by doubling CO2 than by doubling H2O.
And if he did it by burning fossil fuel instead of subliming CO2 the cost becomes negative! Ming doesn’t have to consume energy to produce CO2, he gets it for free when he produces energy by burning fossil fuels.
Ming’s strategy is clear: teach Earth’s humans about fire and the wheel. Much cheaper energetically than to boil off 15 cm of Earth’s oceans for the 1st degree rise, then 30 for the second, 60 for the third, and so on (since you have to keep doubling what you add per degree).
This doubling is also true for CO2, but with humans doing all the work for him for free (because they love doing it) Ming doesn’t care.
In fact they love doing it so much it’s become an addiction for them. They can’t stop themselves. Instead they pretend they’re only having a sip when in reality they’re chugging away.
Not that I’m complaining or advocating anything (and even if I were, putting “drink responsibly” signs in bars has not been shown to work). I’m merely observing social behavior as a break from calculating. I do it myself. Party on!
Max and Steven thx fer taking the trouble ter respond and
I will keep reading and learning, I hope, from all this.
Liked yer non classical Haku, Max )
here’s a classic example on similar theme h/t Bader.
Beth
The Wild Duck
Henrik Ibsen
She has shot the duck!
No, Hedvig has shot herself.
(Off stage, relieved quacks.)
Vaughan Pratt
You have put this post out there for everyone here to critique.
Doing that on this site is sort of like running the gauntlet – you get chopped at by a lot of critical souls with only a few posters to come to your rescue.
And, unlike many lead posters who disappear under a rock, you respond to critiques by the denizens here and fight like a man to get your points across.
I might not agree with your conclusions, but I admire your courage.
Chapeau!
Max
Thanks, Max, I appreciate that.
As far as not agreeing with my conclusions, perhaps we need to agree first on what my conclusions actually are. A lot of denizens have been reading things into my post that I didn’t say. I’m claiming that it’s possible to analyze multidecadal HadCRUT3 (defined as F3(HadCRUT3)) as a sum of two naturally arising functions, SAW and AGW, to within millikelvins, where SAW has 6 parameters and AGW has 3 that I’m allowing myself to tune to improve the fit. 9 is not all that many compared to GCMs. I venture that it’s very hard to find any other 9-parameter analytic formula with as good a fit.
Vaughan
manaker
you will note i said nothing about models and nothing about 2100.
simple question. is your science settled.
are you certain it is safe to go 5 c warmer?
Steven Mosher
You ask:
Answer:
No – but it’s a safe bet that it won’t (from AGW).
Max
Again, you seem certain that it wont from AGW. Is that science of your settled?
Steven Mosher
You brought up the specter of 5°C warming from AGW, and I’ve told you I’m not worried about that. This does not mean that any “science in settled”.
Let me explain to you where I’m coming from. I’m not a computer jockey or guru, but I have used computers, for example to vary the reaction kinetics in designing a complex exothermic chemical reaction system. I learned that if you feed in parameters that were just slightly off, you could get wildly varying results – often with very goofy answers. The old “GIGO” syndrome. And if you want to get a screwy output, it’s pretty easy to do.
IPCC needs scary outputs – otherwise who needs IPCC?
The computer jocks need to feed IPCC scary outputs – otherwise who needs them?
This is not a “conspiracy” at all – it’s just a simple matter of survival and a collusion of interests.
So, instead of believing what the gurus and their models are telling me, I decide to check the empirical data, using “Occam’s razor” or the “KISS” approach.
As I pointed out earlier, the past CO2 and temperature record since 1850 shows 0.7°C warming with CO2 increasing from ~290 to 392 ppmv. Depending on the amount of natural forcing one assumes (IPCC versus several independent solar studies) you end up with a long-term 2xCO2 temperature response of between 0.8° and 1.5°C.
Now let’s look at likely atmospheric CO2 increase from today to 2100. IPCC has several modeled “scenarios and storylines”. The higher ones are clearly exaggerated (for the same underlying reasons stated above). With the UN projections for population growth and assuming a 50% increase in per capita fossil fuel consumption, we end up with around 600 ppmv CO2 by 2100.
This means if we use the observed CO2 temperature response and the logarithmic relation, we end up with warming of 0.5°C to 0.9°C from today’s “jes’ fine” temperature to year 2100.
No big deal.
No “5°C specter”.
Now I also think beyond 2100, and wonder how much CO2 we could ever generate with all the fossil fuels that are left on our planet.
I have WEC 2010 estimates of total inferred fossil fuel resources on our planet, which tell me that we have “used up” around 15% of all the recoverable fossil fuels that were ever on our planet, leaving 85% to go.
Since the 15% got us from 280 to 392 ppmv in the atmosphere, the remaining 85% could get us to a calculated absolute asymptotic maximum level of ~1030 ppmv.
Using the same observed long-term CO2 temperature response, I can calculate the absolute maximum AGW from CO2 at 1.1° to 2.1°C.
That’s it, Steven.
No “5°C”.
No big deal.
Nothing to get your knickers all twisted about.
So “my knickers are not twisted” in climate fear; no matter what IPCC tries to sell me, I’ll check the actual empirical data that’s out there and stay rationally unemotional on AGW.
Hope this clarifies it for you, Steven.
Max
Sounds like a gun to me ;-)
BBD
It was a petrochemical reaction system, but it could have been a “gun” if the kinetics were not controlled. Fortunately, it worked.
Max
Oooh! Big Oil!!
Only kidding.
5 C warmer is possible only by chance. There are possibilities of surprises at both ends of the warmer and cooler spectrum.
You seem certain that is only possible by chance. What science do you know of that settles this matter?
‘Prediction of weather and climate are necessarily uncertain: our observations of weather and climate are uncertain, the models into which we assimilate this data and predict the future are uncertain, and external effects such as volcanoes and anthropogenic greenhouse emissions are also uncertain. Fundamentally, therefore, therefore we should think of weather and climate predictions in terms of equations whose basic prognostic variables are probability densities ρ(X,t) where X denotes some climatic variable and t denoted time. In this way, ρ(X,t)dV represents the probability that, at time t, the true value of X lies in some small volume dV of state space.’ (Predicting Weather and Climate – Palmer and Hagedorn eds – 2006)
‘If as suggested here, a dynamically driven climate shift has occurred, the duration of similar shifts during the 20th century suggests the new global mean temperature trend may persist for several decades. Of course, it is purely speculative to presume that the global mean temperature will remain near current levels for such an extended period of time. Moreover, we caution that the shifts described here are presumably superimposed upon a long term warming trend due to anthropogenic forcing. However, the nature of these past shifts in climate state suggests the possibility of
near constant temperature lasting a decade or more into the future must at least be entertained. The apparent lack of a proximate cause behind the halt in warming post 2001/02 challenges our understanding of the climate system,specifically the physical reasoning and causal links between longer time-scale modes of internal climate variability and the impact of such modes upon global temperature. Fortunately, climate science is rapidly developing the tools to meet this challenge, as in the near future it will be possible to attribute cause and effect in decadal-scale
climate variability within the context of a seamless climate forecast system [Palmer et al., 2008]. Doing so is vital, as the future evolution of the global mean temperature may hold surprises on both the warm and cold ends of the spectrum due entirely to internal variability that lie well outside the envelope of a steadily increasing global mean temperature.’ S&T09
Quite a lot actually.
Moshtwit,
Are you asking questions?
I thought it wasn’t allowed (according to you)
Or is it only your unsubstantiated statements – your statements from authority – you do not like to be questioned?
Get the point yet? (I expect not!)
And here we see it lying well outside the envelope of steadily increasing global mean temperature.
From the Tsonis paper. JCH – the point is that the past is not neccessarily the future. You are just full of AGW groupthink trivialities JCH. Why do you think anyone would give a rat’s arse about your trivialities?
‘Nevertheless, however much models improve, there will always be an irreducible level of uncertainty—‘flap of the seagull’s wings’—because of the chaotic nature of the system. Even the climate we have observed over the past century or so is only one realization of what the real system might produce.
Figure 12 shows 2000 years of El Nino behaviour simulated by a state-of-the-art climate model forced with present day solar irradiance and greenhouse gas concentrations. The richness of the El Nino behaviour, decade by decade and century by century, testifies to the fundamentally chaotic nature of the system that we are attempting to predict. It challenges the way in which we evaluate models and emphasizes the importance of continuing to focus on observing and understanding processes and phenomena in the climate system. It is also a classic demonstration of the need for ensemble prediction systems on all time scales in order to sample the range of possible outcomes that even the real world could produce. Nothing is certain.’ Slingo and Palmer 2012
The less the area of ice sheets on Earth the more stable is the climate.
The warmer the better for life (up to a point, which seems to be a lot warmer than now).
Therefore, to justify high cost mitigation policies, there needs to be strong evidence of the supposed catastrophic impacts of warming. After 20 years of scaremongering, we still cannot get clear, well quantified, scientific, definition of the impacts.
Uncertainty about the problem is a given; uncertainty about the chosen solution is inexcusable. This is to say, we should be confident that our solutions are going to be effective, and the more expensive the solution the more confident we should be.
Peter Lang
You wrote:
Very true.
There have been NO “chosen solutions” proposed so far that would result in any perceptible reduction of global warming by 2100.
None.
We’ve had calls for a direct or indirect carbon tax. But everyone knows that a tax will not change our climate – no tax ever did.
We’ve had politicians making hollow promises to “reduce CO emissions to X% of what they were in year Y by year Z” , or (even more stupid) to “hold global warming to no more than 2C”. But these promises are not actionable. They are just political hot air.
We’ve had a few specific actionable proposals, like the Hansen et al. suggestion to shut down (and replace) all US coal-fired plants by 2030; a calculation shows that, even using IPCC’s arguably exaggerated mean climate sensitivity of 3.2C, this proposal would theoretically reduce global warming in 2100 by an imperceptible 0.08C.
Another scheme has been proposed to install carbon capture and sequestration (CCS) on half of all coal-fired plants in the USA. At $17.3 trillion, this carries some environmental risks and is even more costly than the Hansen proposal, but would only theoretically reduce global warming in 2100 by a measly 0.35C.
http://farm7.static.flickr.com/6112/6208819043_0931707315_b.jpg
So there is a lot of arm waving and shouts that “we must act now”, but no one has any real actionable proposals that make any sense.
You’ve called for installing nuclear power plants worldwide instead of coal-fired or gas-fired plants for all new or decommissioned old plants. Depending on location, this alternate is cost competitive with today’s coal price (no carbon tax needed), so there would be no net cost disadvantage for going this route (i.e. it makes economic sense).
I’ve shown you that even this very drastic scheme would reduce CO2 in the atmosphere by 2100 by a calculated 104 ppmv, reducing atmospheric CO2 concentration from the 600 ppmv estimated by IPCC models to 496 ppmv..
Using IPCC’s arguably exaggerated 2xCO2 climate sensitivity, this would end up reducing global warming by 2100 by 0.8C.
But using the observed long-term CO2 temperature response since 1850, this would end up reducing 2100 warming by 0.2C to 0.4C.
I agree this would be a good move, provided the political, emotional and regulatory hurdles can be removed and the world adopts the sensible “French” approach.
But even this relatively drastic measure is not going to change our global climate by anything meaningful.
So my conclusion is:
We are unable to change our planet’s climate, no matter how much money we throw at it.
There are no “silver bullets”.
And I will stay with this conclusion until someone shows me an actionable mitigation proposal, which would result in a meaningful reduction of warming by 2100 at an affordable price – so far I’ve seen none (yours comes the closest).
Max
Manicker,
I agree. However, I also suggest, the realists have to stay in the game. Arguing to ‘do nothing’ would exclude those who argue for that approach from the game. So, we have to stay involved.
I am more than happy to support ‘No Regrets’ policies. They are beneficial to human well being whether or not AGW is CAGW.
Replacing coal with nuclear as coal plants are retired and new capacity is needed makes economic sense, as long as nuclear is cheaper. Small plants will make that possible for more countries and more electricity grids. It will also allow nuclear to improve faster and become cheaper more quickly. There are many other known advantages – such as avoiding 650,000 fatalities per year globally – and unknown benefits we cannot imagine (for example, benefits from the 20,000 to 2 million times increase in energy density and the effectively unlimited amounts of energy available).
Look on the bright side, Mosh. Dem gators is good eatin’.
I love gator. In a gator polar bear fight who wins?
chuck norris
Steven Mosher
It depends on how they are prepared.
In a gumbo, with lots of sassafras and chili peppers, I’d go for the gator.
But served with a sauce chasseur, Spätzli and cranberry sauce on the side, the polar bear would be my choice.
Max
CO2 concentration increase in the atmosphere is mainly due to the increase in global mean temperature, not due to human emission of CO2.
Proof=>http://www.woodfortrees.org/plot/hadcrut3vgl/compress:12/plot/esrl-co2/compress:12/derivative/scale:0.16/detrend:-0.55/offset:-0.4
A direct correlation between CO2 concentration in the atmosphere and GMT exists for the last 54 years.
Why not for the last 162 years?
Perhaps you overlooked the fourth paragraph of my post, Girma. The one starting “Global warming of some kind…” The point of my poster is to answer your question.
Memphis,
So if CO2 slows down the rate at which the “earth” cools (I think you are too general here but I don’t want to overreact to a figure of speach), why has it not slowed down the cooling of the atmosphere (where it optically resides) for the last decade and a half? connundrums abound. The atmosphere which should be warming has flatlined since the 1997 EN, while the oceans, incapable of recieving IR below a few microns have continued to warm (albeit unevenly) until recently (maybe?) in spite of melting all that ice at 82 calories/ml. Furthermore, this well mixed gas has mixed its way into the stratosphere (the real hot spot) where instead of radiating at a lower temperature it radiates at temperatures approaching the surface.
@gymnosparm
So if CO2 slows down the rate at which the “earth” cools … why has it not slowed down the cooling of the atmosphere … for the last decade and a half? connundrums abound.
What I was intending to describe was themechanism of how AGW is said to work. I was not intending to deny the Pause.
while the oceans, incapable of recieving IR below a few microns have continued to warm
Yes that the oceans have warmed during the Pause, can only mean CO2/AGW is not what is causing it.
Furthermore, this well mixed gas has mixed its way into the stratosphere (the real hot spot) where instead of radiating at a lower temperature it radiates at temperatures approaching the surface.
Please elaborate.
@gymnosperm: Why has [CO2] not slowed down the cooling of the atmosphere for the last decade and a half?
It turns out that in years close to 1890, 1910, 1930, 1950, 1970, 1990, and 2010 (we’re close to 2010), the following has been a true statement: “the decade just ended did not trend up as strongly as the previous decade.” Furthermore in every case (except 2010 of course since we haven’t seen the whole of this decade yet) the following would have been an accurate prediction: “the coming decade will trend up more strongly than the one just ended.”
You can spot check this amazing bit of trivia for yourself on WoodForTrees.org using HadCRUT3 global land-sea. Here’s an example: the four decades 1930-1970. Look for a counterexample.
(By “decade” I mean intervals like 1880-1890, 1930-1940, etc, i.e. round numbers. WoodForTrees interprets “To: 1940” as “to December 1939 inclusive” so that 1930-1940 is exactly 120 months, not 121 or 132.)
gymnosperm | December 7, 2012 at 1:09 am said: ”Memphis, The atmosphere which should be warming has flatlined since the 1997”
Mate, 1998 was declared officially; as ”the hottest” b] after it didn’t flat-lined; it was ”SAID” that it flatlined.
The truth: 98 was ”the hottest” for two reasons; reason #1: because was the year after the Kyoto Conference (to scare the crap out of the Urban Sheep) reason #2: some prudent guys in IPCC realized the following year that: too many people started scrutinizing the phony data b] it will take much longer to convince 51% of the population about the phony global warming – if every year they ad as much extra warming as from 97-98… by the time masses are convinced; temp should be above boiling point -> therefore, they lowered it for the following years.
Bottom line: GLOBAL temp has nothing to do with what they dish to you. b] they put global temp for individual years, to fit the occasions. #3:the planet hasn’t accumulated enough ”extra” heat for the last 150y,, to boil one chicken egg!! #4: nobody knows what’s the global temp, to save his life; so: you can declare any temp, for any year; if you are dishonest person…
In a gator polar bear fight who wins?
I’d say depends where its staged. At the colosseum the heat would
probably affect the polar bears’ performance, I’d back the gator …
whereas, … if the event was held at the North Pole, mebbe a
Xmas event,… hmmm, the gator would likely have frozen jaws.
Beth
As a reptile in Arctic climes, the hapless gator’s pulse would slow down, as would his motor reflexes. His jaw might be locked with teeth chattering from the cold, as you suggest. The cuddly bear would simply whop him silly first and then gobble him up for breakfast (like he does the cute little seal pups he normally devours when there are no Inuit children around).
Of course, if AGW continued according to Steven’s models, the water warmed and all the ice were GONE, the gator would have a field advantage and all bets would be off.
Max
Vaughan Pratt:: ‘ Lord Monckton took ‘peer review quite literally.’
Lol , C’est bon, Descartes.’
BBD
Excuse me for posting this at the current end of the thread, but our discussions on CET now range all over Vaughans responses and it is difficult to keep them in any sequence.
Upthread You cited Parker et al at length and ended with this comment from his paper;
“For this reason, no daily series truly representative of CET can begin before about 1770. In this paper we present a daily CET series from 1772 to the present.”
To which you said.
‘No reliable data before 1770. ‘Warming’ very probably an artefact. Massive over-interpretation of unreliable data = deeply unwise.’
I think I had replied immediately to your item as follows but it ended up here some way from your comment;
http://judithcurry.com/2012/12/04/multidecadal-climate-to-within-a-millikelvin/#comment-274342
I would like to amplify that as I did not see any response.
I think you are over interpreting that comment from Parker you cite when you say there is no reliable data before 1770 and then say that unreliable data has been massively over interpreted –presumably as a response to the comments myself,Vuk or David Springer made concerning the Manley series from 1660 to 1772, which showed considerable periods of warm and cold climate states.
Manley created a monthly series because much of the information available to him was as aggregated monthly data as that was the fashion of the earliest observers. Some of the daily readings survived but others were lost over time so it was impossible to create a daily series. As Parker observes, due to the thermal response of the rooms-where some readings were taken-a daily figure is in any case not appropriate.
The observers of the period Parker et al looked at from 1772 generally recorded data daily and used it as such, or if it were aggregated to a monthly figure the daily information still remained in order for Parker et al to compose their series.
Parkers comments about the lack of overlapping stations for the first decades or more of CET was a reference to the paucity of other instrumental records that could correlate with CET. Uppsala comes in at the end of the period.
It is not therefore correct to say there is no reliable data before 1770, it was just presented by Manley as a monthly rather than daily figure, which Parker acknowledges. The periods of warmth and cold we can discern in the earliest part of the Manley record are supported by cross referencing other material. Warming shown within it is certainly not an artefact, the data is reliable and has not been over interpreted. All this in the context that we should look at the tendancy of all instrumental records and not their precision.
tonyb
tonyb/CR
I did see your response, and reiterated my own: CET data pre-1770 are unreliable. You really cannot get around this nor is it wise to try.
I also said (and it obviously bears repeating) that the GAT reconstructions are unreliable pre-1900.
These are the pragmatic constraints within which we must operate. Trying to make *anything* out of the earliest section of the CET is, as I have already said, deeply unwise.
I cannot quite see why you have a problem with this repeated statement of the very obvious. Unless of course you want to make a strong claim about warming in the early part of the CET, which you can’t.
Let’s leave it at that, since I am not going to change position on this because I am correct – and in your heart of hearts, you know I am correct – to argue for extreme caution about early records.
BBD> I am not going to change position on this because I am correct – and in your heart of hearts, you know I am correct
+1 on the arse count
BBD
That reply is not worthy of your normal high standards. I will assume it was partly tongue in cheek
Parker does not say that data prior to 1770 is unreliable, it is you who are saying it. I am surprised that you do not believe there was warming in the early part of the record. I tend to side with Parker, Manley and my own research which indicates that the broad parmeters of pre 1770 material is correct. Writing about the period 1700-1750 is on my long list of articles . No doubt we can re-enter the fray on CET should I ever get the time to write it
I certainly don’t know in my heart of hearts that you are correct.
tonyb
tonyb
There are NO instrumental records much prior to 1900 that are accepted as reliable. Your refusal to acknowledge this entirely uncontentious point is baffling. Unless you are trying to build an argument on the very early section of the CET, which of course would be deeply unwise.
Bated Breath
I’m getting a bit tired of being called an arse for no reason at all. Please explain to me why I am an arse for making the following statement, which I have partially emphasised to help you understand the words:
Or do you think we should use a pile of ancient, poorly calibrated, discontinuous and heterogeneous scraps as if it were gospel?
Idiot.
BBD
I have written some three articles on the general unreliability of instrumental records and reiterate that I do NOT believe it is possible to accurately parse a local temperature to fractions of a degree, let alone a global one. It is certainly possible-by backing it up with diverse and copious records-to confirm the tendancy of local instrumental readings but not their precision.
I think setting 1900 as the advent of reliable surface records is optimistic, but does allow us to discard the early part of Giss and Hadley. Such records as SST’s have an even more dubious provenance so I am sure we can agree that only the last 50 years or so of such readings give us any idea of what is happening, albeit in relatively limited geographic areas and in very general terms.
tonyb
The warmists will now, at the twilight of the CO2 euphoria, employ every possible trick from ‘hide the decline’ to ‘hockey stick’ including denying the best temperature record that humanity has assembled, to keep the falsehoods of the AGW alive. It’s evident everywhere.
Dr. Pratt had an inkling what is actually important to the climate change, see my post further down, but I suppose that the AGUs at the Stanford University may have not liked any natural factor overriding CO2 nonsense.
@BBD|
This is (the latest) reason you are an arse. I have bolded to help you understand the words:
I am not going to change position on this because I am correct…
An arrogant arse, to be more specific. And how you – as abuser-in-chief on this blog – can bleat about being called an arse, beggars belief.
I note too your diversionary tactic of pretending my comments related to the content of the spat you were involved in, as opposed to the form. You really are a piece of work.
You’re not just an idiot BB, you are a dishonest idiot.
@climatereason: I do NOT believe it is possible to accurately parse a local temperature to fractions of a degree, let alone a global one.
…and hence HadCRUT3 is not an accurate record of global temperature.
I would like to think it was accurate, but my results don’t depend on that. What they do show is that the multidecadal part of HadCRUT3, the slow-moving or low-frequency bits, follow a precisely specified mathematical formula to within a millikelvin over a century, and a few millikelvins over 1950-now.
You might not like HadCRUT3, or the mathematical formula, namely that for SAW+AGW, or my definition of “multidecadal” as what F3 passes, but not liking is not disbelieving. if you don’t believe what I’m claiming, I’ve set up everything to make it as easy as possible for you to point out where my claim is wrong.
Vaughan
When it comes to any matrix-especially land instrumental ones- I have always followed Hubert Lambs maxim that we can follow the (temperature) tendancy but not the precision. When it comes to ocean temperatures I do not think they have any value until the 1950’s and even then only in some well sampled areas.
So I do not agree or disagree with anything you say. We simply don’t know enough about the climate to make definitive prognostications. I have already complimented you on your paper and only time will tell as to its accuracy and merit. Whatever your conclusions though, it should acknowledge and incorporate the apparent 350 year rise in temperatures we can observe.
tonyb
BBD | December 7, 2012 at 5:36 am said: ” tonyb/ I also said (and it obviously bears repeating) that the GAT reconstructions are unreliable pre-1900”
BBD, last year’s GLOBAL temp data is NOT reliable!.saying about warmer / colder years for 1700’s; tells everything about the person, not about the temp.
DOUBLE CON IS BETTER
The leading ‘’Skeptics’’ realized that: it’s easier with a telescope to see distant objects in details -> concocted that: Galileo, and after him, people were observing the sunspots. Then they added that: since 6000years ago, Chinese were absorbing and documenting sunspots. So, they falsified for every year in the last few thousand years – sunspots to fit their original lies and misleading GLOBAL temp charts… PERFECT FIT! Marvellous… crap!
In reality, for the first time a filter was made, to see that the surface of the sun is not just red; but has sunspots; in 2004-6. Before that, for 100y they were blocking the sun with a cardboard and observing the sun-flare; NOT sunspots!!! Because the sun-flares from the corona were going in 8 minutes, where the earth will be in 6 months; the flares that affected the earth directly were blocked… wasn’t any benefit. B] looking directly at the sun, in 7-8 minutes; you will not see any sunspots, BUT, will see sunspots after for a day, even in a completely dark room; and you will never see anything else in your life.
C] if you look at the sun with a telescope, will burn your eyes COMPLETELY, in half the time, than looking direct at the sun. Depends the power of the telescope; in 2-3 seconds complete blindness – in 10 seconds, your head will be steaming – in 2-3 minutes: the light through your eye socket would be going out from the back of your head. Galileo wasn’t so stupid, to look at the sun; he was looking at Jupiter. But the ‘’Fake Skeptics’’ to make the skeptical people to appear as bigger liars than the Warmist -> made for every year their ‘’forgery sunspots’’ to clip exactly to match their misleading global temp charts… what a criminal scam… to degrade the genuine skeptical people!..
D]Their phony GLOBAL temp charts for the past, were created from their phony ‘’proxy’’::: if records say: 12 bushels of grain per acre, in Yorkshire / England = was warm year, on the whole planet. Next year only 11,2 bushels; they made official: colder year on the WHOLE planet by 0,4C. Next year locust, or neighbor’s goats damaged the grain; only 9,3 bushels -> mini ice age declared officially on their ‘’GLOBAL’’ temp charts. Therefore: if the neighbor got drunk in the tavern, instead of looking after his goats; the extra bottle of vino; changed the number of the sunspots…?! miracle, or a grotesque CON, by the ‘’leading’’ Fake Skeptics…
E] if Colorado canyon alluvial deposits say that: for certain period in the past was more rain, or less – for the Original Swindlers, that was telling the temp on the WHOLE planet…? Instead of admitting that: those deposits cannot even tell about the rainfall for the whole state of Colorado. Because they have being declaring: Paleocene, Eocene, Crapocene – phony GLOBAL temp cycles = declared as official records, by the original scum. Therefore, to cover up the mountains of the original Pagan lies – GLOBAL temp charts, which look as seismographs, with precision to one hundredth of a degree – they made the ‘’Sunspots Forgery’’ to support the biggest continuous con, since Darwin published his book. Before that; the climate entirely depended on St. Peter’s mood. Regular showers, if you are good; or drought and floods, hailstorms; St. Peter starts rolling the drums with hailstorms
Would falsifying sun’s activity chart, make the politicians, media; and especially Mann, Hansen: to admit that they are lying about the phony GLOBAL warming? NOP, they and the bias media know the date in 2004, when the first time powerful filter was used, to see details on the surface of the sun; and the company that made that filter. They keep under their sleeve that proof, to be used, when is most important time; to rub ”Skeptic’s” nose, in public…
Tony
I think there is lot of the AGW politics to it.
Lamb left MetOffice because he did not like the attempts to interfere with existing data
A much later twist is that, 40 years on, one of the reasons Lamb decided to leave the Meteorological Office to found the Climatic Research Unit at the University of East Anglia was because he felt there was an over- emphasis on the type of research Richardson had started, to the exclusion of the research Lamb was undertaking.
Ironically CRU finaly done it
http://www.independent.co.uk/news/people/obituary-professor-h-h-lamb-1249739.html
Vaughan Pratt | December 7, 2012 at 2:52 am |
Hansen delay did not change:
Hansen delay: 15 years no change
Hansen is wrong to attribute 15 year lag to the CO2 warming factor.
15 year lag is well known natural effect
The 15 years lag is nothing to do with CO2, it is result of totally natural process, since this is exactly the delay between geomagnetic signal (simply derived from the combined sun-Earth magnetic field changes and the AMO:
http://www.vukcevic.talktalk.net//GSOc.htm
Why is that?
There is a 15 year delay between the changes in the angular momentum of the Earth’s inner core (where magnetic field is generated) and the LOD (length of the day)
NASA and the Oxford University scientists in 1997/2000 published paper on the effect: Torsional oscillations of the Earth’s core
http://trs-new.jpl.nasa.gov/dspace/bitstream/2014/13763/1/00-0133.pdf
Dr. Pratt would have done far better service to the climate science if he pursued the idea from his initial draft:
The second and third harmonics dominate, are largely untouched by the filtering, and can be associated with ocean oscillations of respective periods 83 and 55 years per our fit (75 and 50 years when fitted with HADCRUT3). A plausible origin for this component is wobbling of the Earth’s iron core pumping hot magma upwards, felt most strongly at the ocean bottom where the crust is thinnest. The crust could be filtering (attenuating
and phase-shifting) the other harmonics.
The Ocean tectonics, according to the geologic records from North Atlantic show (as I actively advocated for some years) that the primary temperature change is a function of the natural processes.
http://www.vukcevic.talktalk.net//CET-NAP.htm
( it was also posted in the other thread- my error)
The total CAM (core angular momentum) exhibits a principal maximum at a 15-year lead with respect to LOD
page 6/10
http://trs-new.jpl.nasa.gov/dspace/bitstream/2014/13763/1/00-0133.pdf
@vukcevic: The 15 years lag is nothing to do with CO2 … There is a 15 year delay between the changes in the angular momentum of the Earth’s inner core (where magnetic field is generated) and the LOD (length of the day)
If I were to report that my cat weighed 10 lb, and you noticed that this was the weight of your cat too, would you infer that I must have weighed your cat instead of mine? Of course not. But that’s exactly the sort of thing you’re doing here.
The 15-year figure I obtained is how far I had to slide rightwards the predicted global warming curve in Figure 3 so as to make its curvature match that of the observed global warming curve in Figure 2. (The fact that these curves have varying curvature is what makes the measurement of Hansen delay possible at all.) How would this measurement constitute a measurement of the delay between fluctuations in angular velocity and fluctuations in magnetic field? Is there some physical explanation of why these should turn out to be the same delay?
Hi Dr. Pratt
Of course there are physical explanation, but would the AGU folk consider it?
This graph
http://www.vukcevic.talktalk.net/GSC1.htm
is constructed by using 15 year delay between geomagnetic (sun + earth) vector and the AMO (AMO delayed).
Totally independent geological records (nothing to do with magnetic fields) collected along N. Atlantic ridge shows same 15 advance advance to the AMO
http://www.vukcevic.talktalk.net/SST-NAP.htm
Arctic atmospheric pressure and the ACE (Atlantic accumulated cyclone energy) also have 15 year mutual time displacement.
http://www.vukcevic.talktalk.net/AHA.htm
Surprisingly there is also the North Pacific coincidence but in the opposite direction
http://www.vukcevic.talktalk.net/AHA.htm
The JPL-Oxford University paper is based on the geomagnetic measurements
http://trs-new.jpl.nasa.gov/dspace/bitstream/2014/13763/1/00-0133.pdf
As you can see I have 4 cats JPL-OU one more, Hanson and you have one each, hence the result 5:2, I declare a victory.
Geological records in Central pacific have also delay
http://www.vukcevic.talktalk.net/ENSO.htm
but it appears to be only 12 years (if I am correct), so I left this kitten out of the ‘scrap’ with your moggy.
On serious note I have sort of a vague idea how this works, I was looking forward to your AGU presentation (someone anonymously emailed the link to clim.stanford link last July). I have been going on about this for some time, and was hoping you are going to break the ice at AGU. It was disappointment that you didn’t.
As long as 2009 Steven Mosher commented about ‘guy blabbering on about magnetic field’ but since then he has moderated the tone.
Early this year I came across this:
Jean Dickey of NASA’s Jet Propulsion Laboratory, Pasadena:
One possibility is the movements of Earth’s core (where Earth’s magnetic field originates) might disturb Earth’s magnetic shielding of charged-particle (i.e., cosmic ray) fluxes that have been hypothesized to affect the formation of clouds. This could affect how much of the sun’s energy is reflected back to space and how much is absorbed by our planet. Other possibilities are that some other core process could be having a more indirect effect on climate, or that an external (e.g. solar) process affects the core and climate simultaneously.
and Ms. Dickey is not your ordinary domestic pussycat, she is a tigress.
What your and Hanson’s 15 years is about, have no idea, not particularly interested to find out, but as far as I can see it, my 15 years is of a ‘superior’ quality and dominates the climate science, such as it is.
My reply has gone to moderation (more than 3 links) hopefully will not be long.
The North Pacific link should be
http://www.vukcevic.talktalk.net/NoaaD.htm
From Georgia State University: http://hyperphysics.phy-astr.gsu.edu/hbase/thermo/grnhse.html#c1
I’d like to draw your attention particularly to something in AGWScienceFiction’s Greenhouse Effect as stated in this:
“A major part of the efficiency of the heating of an actual greenhouse is the trapping of the air so that the energy is not lost by convection. Keeping the hot air from escaping out the top is part of the practical “greenhouse effect”, but it is common usage to refer to the infrared trapping as the “greenhouse effect” in atmospheric applications where the air trapping is not applicable.”
This is where AGWScienceFiction has introduced another misdirection to fool the real world physics challenged – it is applicable.
This is why the atmosphere around the Earth was first likened to a greenhouse, a real greenhouse which has both heating and cooling to regulate temperatures for optimum plant growth. The fictional Greenhouse Effect has excised the cooling, as I’ve explained earlier, by taking out the Water Cycle which brings down temps 52°C from the 67°C it would be without water.
AGWSF’s Greenhouse Effect doesn’t have convection because it doesn’t have real gases, it has substituted the imaginary ideal gas without properties and processes, but our real Earth’s atmosphere does have convection – the heavy ocean of real fluid gas oxygen and nitrogen weighing a ton on our shoulders, a stone per square inch, acts like a blanket around the Earth stopping the heat escaping, compare with the Moon which has extreme swings of temperature.
The impossible AGWSF Greenhouse Effect world does not have any atmosphere at all, it goes straight from the surface to its imagined empty space with the imaginary ideal gases without mass zipping around at great speeds miles apart from each other, so it has no convection because it has no real gas for gravity to work on.
The real heavy ocean of fluid gas with volume, weight, attraction which we actually have around the Earth is SUBJECT TO GRAVITY.
This is what gives the blanket effect of nitrogen and oxygen keeping the heat from escaping as in a real greenhouse.
The whole of the AGW scenario is created out of mangling real world physics by giving the properties of one thing to another, taking laws out of context, excising whole real world properties and processes, deceitfully changing the meanings of words and so on.
The Greenhouse Effect is an illusion, a magician’s trick, but more importantly here, it is a con, a deliberate science fraud.
But this illusion couldn’t work if so many didn’t lack sense of scale..
You don’t have any sound in your world, perhaps that’s why you can’t hear yourselves.
A trace gas ‘trapping the heat like an insulating blanket, a thick down jacket’..?
A Star, which is our Sun, ‘only 6,000°C producing very little longwave infrared’ …?
Myrrh Oh do stop being a complete moron.
– By now everyone over the age of 10 probably knows greenhouse warming/gasses has nothing to do with what happens in greenhouses.
– AGW (the absorption of IR by greenhouse gasses) does not mean that the water cycle has been ‘excised’ from standard science.
– The absorption of IR by greenhouse gasses also does not mean convection has been ‘excised’
– The absorption of IR by greenhouse gasses also does not rule the possibility out a ‘blanket’ effect
I have yet to see you make any sense at all. You duck questionss, and all you come up with is wild claims you refuse to corroborate. The only fictional physics here is yours.
It has everything to do with what happens in real greenhouses, in the atmosphere the ocean of heavy real gas of mainly nitrogen and oxygen with significant amounts of water, is a fluid subject to gravity, this is our real blanket around the Earth keeping the Sun’s heat from escaping rapidly as it does on the Moon for example.
The minus-18°C figure quoted by AGWScienceFiction fisics in its fake Greenhouse Effect energy budget, has been stolen from real physics where it refers to the Earth without any atmosphere at all, and that is predominantly nitrogen and oxygen. So, in typical sleight of hand AGWSF uses a description from real physics in which the atmosphere of fluid gases are all greenhouse gases, and misappropriates it to refer only to its version of “greenhouse gases”.
They have lied, the temps without AGW’s “greenhouse gases” would be 67°C – not minus18°C – do you see the trick they’ve pulled here?
Real greenhouses warm and cool, AGWScienceFiction has changed that, its “greenhouse” only warms.. They’ve taken out the Water Cycle which cools.
In the real greenhouse which is our whole fluid real gas atmosphere which has volume, weight and attraction and is subject to gravity, the some 99% nitrogen and oxygen dry air is what acts as a blanket keeping the Earth’s heat from escaping too fast before the Sun again heats the surface, without water the Earth’s temperature would be 67°C not 15°C – think deserts. That’s how hot we’d be without the Water Cycle, that’s why AGWSF has taken the Water Cycle out of its Greenhouse Effect Energy Budget.
Their is no Greenhouse Effect warming of 33°C by AGW’s “greenhouse gases” from the minus18°C the Earth would be without them.
This is a magician’s trick, created by sleights of hand, you’ll need to concentrate to see it.
BatedBreath | December 7, 2012 at 6:25 am | Reply
Myrrh Oh do stop being a complete moron.
– By now everyone over the age of 10 probably knows greenhouse warming/gasses has nothing to do with what happens in greenhouses.
Myrrh : [ducks issue – no relevant response]
– AGW (the absorption of IR by greenhouse gasses) does not mean that the water cycle has been ‘excised’ from standard science.
Myrrh : [ducks issue – no relevant response]
– The absorption of IR by greenhouse gasses also does not mean convection has been ‘excised’
Myrrh : [ducks issue – no relevant response]
– The absorption of IR by greenhouse gasses also does not rule the possibility out a ‘blanket’ effect
Myrrh : [ducks issue – no relevant response]
BatedBreath | December 7, 2012 at 10:59 am said: ”By now everyone over the age of 10 probably knows greenhouse warming/gasses has nothing to do with what happens in greenhouses”.
Than, why are they referred as ”Greenhouse gases”?! a: to confuse the already confused? b: because is fashionable to be dumb / ignorant?!
WHY BOTH CAMPS REFER TO CO2 AS: A ‘’GREENHOUSE GAS?!’’
All normal greenhouses have solid glass roof. Glass is transparent for the sunlight; but ‘’SOLID’’ prevents hot air (O&N) of getting out. On the other hand; CO2 is NOT transparent for the sunlight – intercepts sunlight high up = less sunlight comes to the ground.
b] CO2 & water vapor are less than 3% of the atmosphere, the rest 97% is oxygen &nitrogen. Which means: ‘’ if one removes 97% of the roof off a normal greenhouse – that wouldn’t be a greenhouse anymore!’’ When there is a small hole on the roof of a normal greenhouse – farmer instantly plugs the hole – heat not to escape out. Warmist are lying for profit and power / why are the ‘’Skeptics’’ misleading for; by referring CO2 &H2O as ‘’Greenhouse Gases?! Because of ignorance, or b: because they are born losers??
>> By now everyone over the age of 10 probably knows greenhouse warming/gasses has nothing to do with what happens in greenhouses
Stefan > Than, why are they referred as ”Greenhouse gases”?! a: to confuse the already confused? b: because is fashionable to be dumb / ignorant?!
A mistake. That everyone over the age of 10 knows about. So be a grown-up and just get on with it.
Yeah right. They still call the far side of the moon the dark side even though it’s lit as often as the near side. Peculiarities of language and tradition aren’t usually conspiratorial in nature.
By the way, what’s the difference between a blue photon from the sun and a blue photon from a laser?
BatedBreath | December 8, 2012 at 4:20 am said: ” So be a grown-up and just get on with it”
wrong! CO2 was considered as blocking the sunlight ”dimming effect”, in the 70’s.and they were ”predicting” nuclear winter by year 2000, because of it. b] about the effect, they were correct; BUT, they were ignoring that: only 12h in 24h is sunlight –
Then they changed it to GLOBAL warming; because CO2 &H2O slow down cooling.
THE TRUTH: those two molecules are slowing warming during the day / slowing cooling at night. THOSE TWO FACTORS CANCEL EACH OTHER!!! Only make ”milder climate” cooler days / warmer nights
BUT, because of the Fake’s ignorance, the Warmist are still fleecing the western democracies
They still call the far side of the moon the dark side even though it’s lit as often as the near side.
No no no, they are trying to confuse the confused.
SpringerThe Moron | December 8, 2012 at 9:11 am said: ”Yeah right. They still call the far side of the moon the dark side”
They don’t fleece billions for referring as dark side of the moon; which on many languages is interpreted as; the mysterious side of the moon. Because nobody can see what’s there looking from the earth.
BUT, the question remains: ”why CO2 &water vapor are referred to, as Greenhouse gases? If is corrected = Warmist don’t have a case. You Moron, don’t understand even the ”IMPORTANCE” of correcting that misleading, and why…
Stefan do you actually believe that anyone has ever been persuaded that greenhouse warming is true, because they think it is related to what happens in greenhouses? Seriously ?
On this planet of some 7 billion people, can you point to even 1 such person ? (Or were you yourself once that 1 person?).
Lots of people believe in all sorts of strange things. The existence of more than half the commenters on places such as Climate Etc and almost all of the commenters on WUWT is proof of that conjecture.
I do like the fact that plain vanilla “AGW uncertainty” skeptics such as punksta are starting to grow weary of all the crackpots that infest this site with their oddball theories.
Yes they are almost as tiresome as the AGW Certainty oddballs.
I am not saying to agree with all statements but the conclusions are right.
Two-stream heat flow gives spurious absorption.
In the link an one-stream heat flow formulation is used to describe the play between the 90% convection and the 10% radiation to evacuate the heat from the planet. No back-radiation.
http://www.tech-know-group.com/papers/IR-absorption_updated.pdf
Punksta | December 10, 2012 at 12:04 am asked: ”Stefan do you actually believe that anyone has ever been persuaded that greenhouse warming is true, because they think it is related to what happens in greenhouses? Seriously ?”
Mate, if that was the case, would be a good news, BUT: CO2 ”supposed” to trap heat – same as glass roof on a normal greenhouse… Apart of Myrrh, almost EVERYBODY, from both camps are badmouthing CO2 & water vapor, as the offenders… in the cuckoo’s land…
If CO2 is not a greenhouse gas; than what’s the problem? Punksta, have you seen maybe any greenhouse with fishnet as roof; apart of the Warmist’ &Fake’s Greenhouse? Referring to ME, as the only ”believer” in their greenhouse effect; I don’t know even if you are trying to be sarcastic; or are you on the third bottle of vino…?
Punksta > Stefan do you actually believe that anyone has ever been persuaded that greenhouse warming is true, because they think it is related to what happens in greenhouses? Seriously ?
Stefen > Mate, if that was the case, would be a good news
Ok, so that is NOT the case. Good. But in that case your big fuss about the term “greenhouse” having nothing to do with what happens in greenhouses, makes no sense al all … so wtf are you on about ??
Apart of Myrrh, almost EVERYBODY, from both camps are badmouthing CO2 & water vapor, as the offenders… in the cuckoo’s land…
So you deny the comprehensively validated absorption characteristics of CO2 and the others? Can you point us to the studies that support your point?
If CO2 is not a greenhouse gas; than what’s the problem? Punksta, have you seen maybe any greenhouse with fishnet as roof; apart of the Warmist’ &Fake’s Greenhouse?
You need to make up your mind here. If as you claim CO2 is not a greenhouse gas, then how can there be even a warming fishnet? To be consistent (if that is of any interest to a determined denier), you need to deny even a fishnet.
Referring to ME, as the only ”believer” in their greenhouse effect;
??? You are clearly guilty of BUI*. No, I was very obviously noting that you are the only person who (sometimes?) seems to mistakenly believe greenhouse warming has something to do with what happens in greenhouses.
* Blogging Under the influence
Punksta | December 10, 2012 at 12:57 am said: ”But in that case your big fuss about the term “greenhouse” having nothing to do with what happens in greenhouses, makes no sense al all … so wtf are you on about ??”
I’m on about: to point and prove to people with common sense that: CO2 doesn’t make any greenhouse effect – it’s all 100% con / doesn’t prevent cooling – O&N are regulating the temp – there is much more of oxygen &nitrogen in the troposphere and always will be!!!
Q#2: ”So you deny the comprehensively validated absorption characteristics of CO2 and the others? Can you point us to the studies that support your point?”
A#2: of course CO2 ”absorbs” heat – during the day! Also ”RELEASES HEAT / ABSORBS COLDNESS, better than O&N can, if you will, at night =(reason CO2 is used to make dry ice) Unless you are a Flat Earther, should be able to understand me that: it’s not sunlight 24h, for every carbon molecule to constantly absorb heat. b] my studies are the only reliable, because I’m not in any bias fanatic camp.
Honest people that invented ”dry ice” studied it – if you refer for some kind of studies from extremist like Pratt… their studies shouldn’t be used even as toilet paper; can you remember all that, to repeat it, to all your neighbors?
Q#3: ”You need to make up your mind here. If as you claim CO2 is not a greenhouse gas, then how can there be even a warming fishnet?”
A#3: ”fishnet for warming”?! there isn’t a fishnet for warming = CO2 &water vapor are NOT a global warming gases; they are the most essential for life Punksta, are you playing with words, smart-ass ?
you say: ”seems to mistakenly believe greenhouse warming has something to do with what happens in greenhouses”
A: if CO2 is not blocking the cooling in the troposphere; as glass roof does in a normal greenhouse.= than why is badmouthed as GLOBAL warming gas? the case is closed!! the ball is in your court.
Stefanthedeiner
STD > I’m on about: to point and prove to people with common sense that: CO2 doesn’t make any greenhouse effect – it’s all 100% con / doesn’t prevent cooling – O&N are regulating the temp – there is much more of oxygen &nitrogen in the troposphere and always will be!!!
O & N are not greenhouse gasses, and hence have no radiative effect here. The IR that the CO2 re-radiates has no effect on them, and continues on its way until it encounters another CO2 in the blanket/fishnet (or escapes to space (more likely the closer to TOA this happens, and vice-versa)).
STD > of course CO2 ”absorbs” heat – during the day! Also ”RELEASES HEAT / ABSORBS COLDNESS, better than O&N can, if you will, at night =(reason CO2 is used to make dry ice)
As per above comment, O & N play no part in the radiative events here.
P > You need to make up your mind here. If as you claim CO2 is not a greenhouse gas, then how can there be even a warming fishnet?
STD > there isn’t a fishnet for warming = CO2 &water vapor are NOT a global warming gases; they are the most essential for life Punksta, are you playing with words, smart-ass ?
No, it’s you being a dumb-ass – since (a) being a greenhouse gas and (b) being a gas essential for life, are not mutually exclusive properties.
P > seems to mistakenly believe greenhouse warming has something to do with what happens in greenhouses
STD > if CO2 is not blocking the cooling in the troposphere; as glass roof does in a normal greenhouse.= than why is badmouthed as GLOBAL warming gas?
How many times does it need to be explained that greenhouse warming has nothing to do with what happens in greenhouses?! This has been mentioned at least 10 times now. Please pay attention ffs!
And above you agreed that CO2 is being warmed (ie is a greenhouse gas, and so is slowing down cooling).
I have had a disussion with Steven Mosher. Let me state what I believe to be fact, which has nothing to do with climate science, CAGW, or what this blog is all about. You can do a test, or a trial, or an experiment, or whatever, where there is a dependent and independent variable. You do not need to know the Dimensions; you do not need to know the units the numbers are measured in; all you need is the numeric values. Depending on the sophistication and complexity of what you have done, there are a variety of techniques, including statistical techniques, which tell you the relationship between the dependent and independent variables. I do not intend to waste any more time on this issue.
There is already some research on urban CO2 domes to test for the CO2 warming effect, but conclusions were that the UHI is much stronger than any CO2 effect, if I remember correctly.
How about creating a local CO2 dome in a remote area, far from any human influence, by transporting flue gases from power plants and releasing it there. Maybe one big power plant (coal fired) would be enough to create a small area of increased CO2. Then measure everything, temperatures, winds, heat fluxes, concentrations etc.
Well done Dr. Pratt. Many such techniques clearly demonstrate the linkage between our expulsion of greenhouse gases and climate change. I’ve been working on a research project which shows similar results (hoping to publish). I’ve experimented with holding up this graph:
http://upload.wikimedia.org/wikipedia/commons/thumb/9/90/CO2-Temp.png/800px-CO2-Temp.png
to a mirror. I meticulously plot the points from the mirror image then run the data through a RIC (reverse image configurator). I’ve repeated this procedure three times thus far. Each run shows a strikingly similar result: an absolute correlation between the rise of noxious CO2 and soaring temperatures! Get over here so we can exchange noogies.
Zauber
I like your curve.
It is sleek and straightforward – no silly sidetracks or annoying uncertainty.
I also like your verification process. Simple and effective.
You’ll go a long way as part of the “inner circle” (maybe they’ll even award you an “ex post facto” Nobel Peace Prize).
Max
I played with the four magic parameters (no wiggling ears) within the allowed ranges and found if you put the kabosh on the 15-year Hansen delay, CO2 start at 270ppm instead of 287ppm, 1.1C/doubling, you can get a lovely curve with 0.6C warming since 1850 instead of 0.8C. I didn’t try but I’m pretty you can then tweak the filter to get the millikelvin accurate shape.
It’s too bad there’s no room to adjust HadCRUT data for margin of error. Two tenths of a degree to play with there and someone can make the elephants ears wiggle at sensitivity = 1.1C.
Given how global warming from CO2 is delivered prefentially over land, high latitudes, in the winter 1.1C should be quite welcome even before considering that plants will grow faster using less water and have a longer growing season in which to do it. Then the cost savings in no expensive CO2 mitigation measures and there’s very little not to like about business as usual.
Why is this ?
The fact of it is observation. The why of it is hypothetical but the explanation I came up with is that the hydrologic cycle is a negative feedback. So where the hydrologic cycle is retarded there is less feedback to dampen warming caused by CO2. So follow the water. Colder temperatures slow the water cycle. So look for more warming in higher latitudes. There’s less water over land than ocean so look for more warming over land than water. Winters are colder than summers so look for more warming in winter than in summer. Nights are colder than days so look for more warming at night than during the day.
The clincher for me was when I went to look for the record highest mean annual temperature in the world. It’s 34.5C, from 1960-1966, at 8 degrees north latitude, in Ethiopia. It’s an inland salt desert a bit below sea level with annual average rainfall between 1 and 3 inches making it one of the dryest places in the world. If the record had been a tropical jungle or sea I’d have considered my hypothesis falsfied but so far every prediction made by it fits what has been observed with the sole exception of the Antarctic interior but that may be due to exceptional characteristics such as the strong polar vortex, ozone hole, and a temperature far lower than anywhere else on the planet.
David Springer | December 8, 2012 at 8:41 am | NB correction: ..the explanation I came up with is that because the hydrologic cycle is a negative feedback, where the hydrologic cycle is retarded there is less feedback to dampen warming caused by..
Corrected the sentence for you – because of course, it is already well known in traditional real world science that the Water Cycle, which you call the “hydrologic cycle”, is a negative feedback.
In fact, as I have been pointing out, when the Water Cycle is put back into the AGWScienceFiction’s Greenhouse Effect Energy Budget, then the “33°C warming from -18°C by greenhouse gases” is seen to be an illusion.
Without any our atmosphere of mainly nitrogen and oxygen the temperature would be -18°C.
AGWSF lies that this is the temperature “with nitrogen and oxygen in place”, and only without its greenhouse gases ..
Our full atmosphere of real greenhouse gases, which are not ideal gases but have volume, weight, attraction and subject to gravity, act as a blanket weighing down a ton per square foot around the Earth keeping the heat from the Sun’s warming of the Earth from escaping too quickly before the Sun again heats the surface. Compare with the Moon.
Taking the Water Cycle out of this the temperature would be 67°C, think deserts.
In other words, the Earth’s atmosphere of practically 100% nitrogen and oxygen alone, without water, would be 52°C hotter – so much hotter, these are the real gases actually acting like a heavy blanket around the Earth..
The Water Cycle cools the Earth down to 15°C from the 67°C it would be without water.
By clever sleight of hand AGWSF has created a direct warming from the minus18°C to 15°C without any connecting logical process, from beginning with the science fraud that the -18°C doesn’t include absence of our great heavy real gas blanket of nitrogen and oxygen and by removing entirely the Water Cycle.
Real physics is logical in its connections with internal coherence..
The “Greenhouse Effect of 33°C warming by greenhouse gases” is an illusion, a magic trick.
Hi Myrrh,
What’s the difference between a blue photon from the sun and a blue photon from a laser?
@David Springer: global warming from CO2 is delivered prefentially over land, high latitudes, in the winter
Springer infers this from the fact familiar to all beach dwellers and sailors that daytime inland temperatures are higher. This inference overlooks the cooling effect of the oceans, which are a much more effective heat sink than the continents. There is no physical reason why radiative forcing due to CO2 should be stronger over land than sea, as annually averaged CO2 is distributed equally over both.
Vaughn Pratt said:
“There is no physical reason why radiative forcing due to CO2 should be stronger over land than sea, as annually averaged CO2 is distributed equally over both.”
____
Overall of course, we do see higher temperature anomalies over land on a historical basis, owing to the huge modulation role that the ocean plays in the storage of excess energy and the higher humidity levels over the ocean. But this is then energy that gets “stored” in the ocean, or as latent heat. The storage in the ocean is not directly, but by altering the thermal gradient between ocean and atmosphere such that there is less heat that would normally flow from ocean to atmosphere, thus increasing ocean heat content.
http://www.ncdc.noaa.gov/sotc/service/global/glob/201210.gif
Given the fact the the bulk of the energy in the TOA imbalance is getting stored in the ocean, yet temperature anomalies over the ocean are less than over the land, for the above stated reasons, the global combined land and ocean (that is, air over the ocean) temperature anomalies actually tend to greatly understate to a the actual effects of the anthropogenic caused TOA anomaly. A better metric to gauge to real planetary effects of the TOA GHG induced imbalance is of course to combine combine troposphere anomalies with ocean heat content anomalies, as well as cryosphere anomalies, to get a net Earth system energy imbalance. When this is done, the results tell the full story of the on-going consistent impacts of anthropogenic climate change.
David Springer | December 9, 2012 at 7:29 am | Hi Myrrh,
What’s the difference between a blue photon from the sun and a blue photon from a laser?
When you work it out you can then make a start on answering my science challenge which you keep avoiding –
Prove that visible light from the Sun heats the land and water at the equator to the intensity it does which gives us our HUGE equator to poles winds and DRAMATIC weather systems.
Because until you can prove it, you have no heat in your AGW fantasy “Greenhouse Effect” world which has taken out the direct beam heat from the Sun, which is longwave infrared aka thermal infrared aka HEAT.
I remind you of what you are missing, as traditional physics still teaches:
NASA “Far infrared waves are thermal. In other words, we experience this type of infrared radiation every day in the form of heat! The heat that we feel from sunlight, a fire, a radiator or a warm sidewalk is infrared. The temperature-sensitive nerve endings in our skin can detect the difference between inside body temperature and outside skin temperature
” Shorter, near infrared waves are not hot at all – in fact you cannot even feel them. These shorter wavelengths are the ones used by your TV’s remote control.”
In the real world, the heat we feel direct from the Sun is thermal infrared, the longwave infrared excised from the AGWSF GE energy budget. In the real world we cannot feel visible light at all, as we cannot feel near infrared, because these are not thermal energies and which, working on the electronic transition level, are too small to move whole molecules of matter into vibration which is what it takes to heat up matter. It takes the power of heat, therme dunamis from which thermodynamics, to heat up matter.
But, shrug, carry on believing with Pekka that the Sun doesn’t produce any of this.., bask in your “heat from visible light” from your 6000°C Sun ..
Though, since you have no sound either in your AGWSF fantasy Greenhouse Effect world, I doubt you can hear how funny this is.
No wonder you can’t tell the difference between light from the Sun and light from a laser..
Myrrh
As repeatedly pointed out to you, and as repeatedly ducked by you, IT MAKES *NO DIFFERENCE* TO AGW THEORY *WHICH* WAVLENGTH WARMS THE EARTH
(or does your imaginary fisics also deny the sun warms the earth?)
David Springer > What’s the difference between a blue photon from the sun and a blue photon from a laser?
Myrrh > When you work it out …
Yet again (10th time?), Myrrh avoids David’s question. He doesn’t haven’t an answer but just won’t admit it. He is intellectually bankrupt and has no integrity.
Myrh
Why do you imagine the existence of the water cycle somehow interferes with the absorption spectrum of CO2 (ie stops the greenhouse effect)?
Seems to be a big difference between what established physics says about solar radiation, and what Myrrh says it says, so herewith a quote from wikipedia (there is a graph there too)
http://en.wikipedia.org/wiki/Sunlight
“sunlight’s composition at ground level, per square meter, with the sun at the zenith, is about 527 watts of infrared radiation, 445 watts of visible light, and 32 watts of ultraviolet radiation”
(1) So much for infrared being ‘excised’
(2) Visible light has almost as much energy as infrared. So, Myrrh, if the energy in visible light does not cause warming, where does it all go?
Memphis | December 9, 2012 at 11:24 pm |
Myrrh
As repeatedly pointed out to you, and as repeatedly ducked by you, IT MAKES *NO DIFFERENCE* TO AGW THEORY *WHICH* WAVLENGTH WARMS THE EARTH
Memphis – I have not ducked this – I have been explaining it…
It matters because the AGWScienceFiction Greenhouse Effect is built on pretending that the only measurements of longwave infrared aka thermal infrared aka heat, “come from the atmosphere from greenhouse gases” –
they are using this sleight of hand to “prove” that there is such a thing as AGW.
Go on, prove AGW exists. Let’s see the science, let’s see what you’ve got…
(or does your imaginary fisics also deny the sun warms the earth?)
Visible light doesn’t warm the Earth! I have been telling you that it is the:
DIRECT HEAT FROM THE SUN WHICH WARMS THE EARTH AND THAT IS THERMAL INFRARED, LONGWAVE INFRARED.
AGWSF HAS REMOVED THIS FROM THE ENERGY BUDGET.
YOU ARE THE ONE DENYING THAT THE SUN WARMS THE EARTH!
Got it now?
Shortwave is incapable of heating matter.
AGWSF claims it can because they have taken out the real heat from the Sun, longwave infrared, so they can pretend that measurements of this “downwelling heat from the atmosphere” are from their “greenhouse gases”.
Put back the direct heat from the Sun, which is thermal infrared, longwave infrared – where’s the downwelling from “greenhouse gases by backradiation/blanketing from the upwelling of the heated Earth”?
AGWSF has so totally corrupted basic science for the majority general population through the education system that the critical, to applied science, difference between heat and light has been lost, not only lost, but the general population DUMBED DOWN by being made to believe that visible light is heat.
You would not be able to design the photovoltaic cells and thermal panels we have now to capture the energy from the Sun! Because you don’t know the difference and these are two completely different systems.
What bothers me about all this, more than any other aspect, is this idiotic dumbed down physics is being taught to the next generation. Real science is being lost to the majority population.
You won’t know how comic cartoon your world unless you get to grips with how AGWSF has manipulated basic physics to create an impossible world. Impossible. You have no sound in your world.. Do you understand why you have no sound in your world? Look up the difference between ideal and real gases and analyse the AGWSF memes bearing the differences in mind.
But, it only takes one falsification to show how stupid the fisics, and by showing AGWSF taking out the real heat from the Sun and substituting visible light is showing their Greenhouse Effect is built on nonsense physics and is, I thought.., easier to explain.
I had hoped my science challenge would get a least one person to examine this..
Have you tried reading my explanation of how the AGWSF figure of 33°C for “greenhouse gases warming the Earth” is an illusion?
It isn’t just one physics basic wrong, it’s the whole package of fake fisics basics put together to promote the fiction of AGW.
Mr B | December 9, 2012 at 11:51 pm | Myrh
Why do you imagine the existence of the water cycle somehow interferes with the absorption spectrum of CO2 (ie stops the greenhouse effect)?
Because, it shows there is no “greenhouse effect”..
I am trying to show how the concept itself is an illusion created by taking out the Water Cycle.
Once you take on board that is what I’m saying, you’ll be able to see what it is I’m pointing out, the sleights of hand, the magic tricks used to create the illusion. For example, misappropriating the concept of blanket warming from the real gases responsible, nitrogen and oxygen, to claim it is the “greenhouse gases”.
It is to my continual amazement that so many arguing for AGW/CAGW have no sense of scale, don’t realise how, sorry, ridiculous they appear when they claim the “great warming power” of a insignificant amount of trace gas carbon dioxide and compare it with an “insulating blanket”. These are the memes produced by AGWSF to trick those ignorant of real physics.
They, the fake fisics memes, appear to have become so ingrained that those saying such things can’t seem to be objective about them. Perhaps, by explaining these tricks and showing where AGWSF has tweaked real physics and misapplied terms and concept and properties and processes.., it will be easier to see how ridiculous such claims.
When you also know how real physics uses these terms and what it refers to by them, such as “blanket warming” referring to the whole of the Earth’s atmosphere of real gases, compare with the Moon plerhaps you’ll get back some sense of difference in scale.. Taking water out of this, i.e., leaving the practically 100% nitrogen and oxygen ocean of gas, this blanket warming would give a temp of 67°C. Think deserts. Without water our nitrogen and oxygen real heavy gas atmosphere stops the Earth from losing the Sun’s warming too quickly before it’s warmed again.
In other words, it is the Water Cycle which cools the Earth to bring the temps down to 15°C. AGWSF’s main greenhouse gas, water, cools by 52°C. There is no logical connection in the AGWSF’s 33°C warming from minus18°C to 15°C. It’s an illusion.
That’s why no physics is ever fetched to show such a thing exists..
“DIRECT HEAT FROM THE SUN WHICH WARMS THE EARTH AND THAT IS THERMAL INFRARED, LONGWAVE INFRARED. ”
And how many watts per square meter is this LONGWAVE INFRARED
from the sun?
Simple question.
Requires an answer.
One sentence should be enough.
No need for all crazy stuff.
Punksta | December 10, 2012 at 12:27 am | Seems to be a big difference between what established physics says about solar radiation, and what Myrrh says it says, so herewith a quote from wikipedia (there is a graph there too)
http://en.wikipedia.org/wiki/Sunlight
“sunlight’s composition at ground level, per square meter, with the sun at the zenith, is about 527 watts of infrared radiation, 445 watts of visible light, and 32 watts of ultraviolet radiation”
(1) So much for infrared being ‘excised’
That is not the AGWScienceFiction’s claim for its fantasy Greenhouse Effect Energy Budget.
AGWSF claims it is mainly visible light which does the heating. Of the two shortwaves either side included in its “shortwave in longwave out”, uv is sometimes mentioned, shortwave infrared hardly at all. AGWSF claims that the shortwave of “shortwave in longwave out” is 100% of the energy from the Sun doing the heating of Earth’s land and water, it gives shortwave infrared 1% of this.
What you have pointed to is figures for the different percentages of visible, infrared and uv from the Sun as a total, including longwave infrared..
This is sleight of hand confusion for the unwary, here, you fool yourself.
You are the one making the association that “this infrared” refers to the AGWSF claim, which is only shortwave infrared and of that infrared is only 1%, it does not include the real heat from the Sun.
The real heat from the Sun is included in that wiki split, which is longwave infrared aka thermal infrared aka radiant heat from the Sun, but WHICH HAS BEEN EXCLUDED FROM THE GREENHOUSE EFFECT ENERGY BUDGET
(2) Visible light has almost as much energy as infrared. So, Myrrh, if the energy in visible light does not cause warming, where does it all go?
What sort of energy is it? It is not thermal energy from the Sun, it is so tiny we can’t even feel it.
“if the energy in visible light does not cause warming, where does it all go?”
Try looking for it on the scale it operates, the electronic transition level..
..look in Optics not Thermodynamics, for illuminating our world, and look in Biology for conversion to chemical energy in photosynthesis.
But first, I am challenging the AGWSF energy budget, not your idiosyncratic version, and if you are defending the AGWSF Greenhouse Effect then prove that visible light from the Sun heats matter of land and water at the equator to the intensity these are heated which gives us our huge equator to poles winds and dramatic weather systems, which is what the AGWSF Greenhouse Effect claims..
Petra | December 9, 2012 at 11:37 pm | David Springer > What’s the difference between a blue photon from the sun and a blue photon from a laser?
Myrrh > When you work it out …
Yet again (10th time?), Myrrh avoids David’s question. He doesn’t haven’t an answer but just won’t admit it. He is intellectually bankrupt and has no integrity.
Sigh, let me put it another way. If David Springer wants to argue that there is no difference between a photon of blue light from the Sun and a photon of blue light from a laser, then let him prove that the Sun is a laser doing the heating of land and water at the equator..
He is avoiding my direct science challenge which specifically states “visible light from the Sun”, because, I am specifically challenging the specific claim from AGWScienceFiction that “visible light from the Sun heats land and water of the Earth’s surface and longwave infrared from the Sun has no part in this”.
The intellectually bankruptcy and lack of integrity isn’t on my part..
gbaikie | December 10, 2012 at 6:27 am | “DIRECT HEAT FROM THE SUN WHICH WARMS THE EARTH AND THAT IS THERMAL INFRARED, LONGWAVE INFRARED. ”
And how many watts per square meter is this LONGWAVE INFRARED
from the sun?
Simple question.
Requires an answer.
One sentence should be enough.
No need for all crazy stuff.
No it doesn’t require an answer, not in context of my direct science challenge which is asking for proof of the AGWSF claim that “mainly visible light from the Sun of the 100% shortwave in is heating Earth’s land and water and longwave infrared from the Sun doesn’t do any of this”.
AGWSF has completely excised the Sun’s direct heat to us, and that doesn’t strike you as crazy?
Unless you can prove that visible light from the Sun is doing the heating of land and water which in the real world and real physics is done by the Sun’s direct heat in transfer by radiation which is thermal infrared, longwave infrared, then you have no heat from the Sun in your world.
That’s how crazy your claims are..
You’re having difficulty seeing how crazy the claims you make because you make up even crazier claims to ‘prove’ your crazy claims, like the Sun is only 6000°C..
If only you could hear yourselves.., but you can’t, because you have no sound in your world…
Grin.. You’re very good at doing your own research whenever something intrigues you, I’m sure we’ve all noticed that. So what’s the problem? Can’t you find it?
Here, let me give you a starting point: http://docs.lib.noaa.gov/rescue/mwr/056/mwr-056-08-0322.pdf
Follow the science..
As repeatedly pointed out to you [Myrrh], and as repeatedly ducked by you, IT MAKES *NO DIFFERENCE* TO AGW THEORY *WHICH* WAVLENGTH WARMS THE EARTH.
Memphis – I have not ducked this – I have been explaining it…
It matters because the AGWScienceFiction Greenhouse Effect is built on pretending that the only measurements of longwave infrared aka thermal infrared aka heat, “come from the atmosphere from greenhouse gases” –
1. That is a strawman – agw is not built on that. The idea that it is, is just another piece of MyrrhFisicsFiction.
2. And even if it was true, it is no answer to the point above. IOW, you duck the question yet again, even as you deny doing so.
So, **WHICHEVER** WAVELENGTH WARMS THE EARTH, THE RESULT IS THE SAME – THE EARTH RADIATES LONGWAVE, which warms the greenhouse gasses.
So unless you want to deny the sun warms the earth, your big point is completely pointless.
@Myrrh
Q: Why do you imagine the existence of the water cycle somehow interferes with the absorption spectrum of CO2 ?
Your response did not address the question at all.
” Myrrh | December 10, 2012 at 8:30 am |
gbaikie | December 10, 2012 at 6:27 am | “DIRECT HEAT FROM THE SUN WHICH WARMS THE EARTH AND THAT IS THERMAL INFRARED, LONGWAVE INFRARED. ”
And how many watts per square meter is this LONGWAVE INFRARED
from the sun?
Simple question.
Requires an answer.
One sentence should be enough.
No need for all crazy stuff.
No it doesn’t require an answer, not in context of my direct science challenge which is asking for proof of the AGWSF claim that “mainly visible light from the Sun of the 100% shortwave in is heating Earth’s land and water and longwave infrared from the Sun doesn’t do any of this”.”
Some people are only interested in what can be measured.
So they measure things. One of things they have measured is the energy of the sun.
And they a system of measuring which allows them to discuss things in a rational manner.
And most people think it’s rational that the Sun warms the earth.
It seems like a good system.
Myrrh | December 10, 2012 at 8:30 am |
” the AGWSF claim that “mainly visible light from the Sun of the 100% shortwave in is heating Earth’s land and water and longwave infrared from the Sun doesn’t do any of this”.
AGWSF has completely excised the Sun’s direct heat to us…”
You are simply making this up.
And the rest of your message was just incoherent.
What’s the difference between a blue photon from the sun and a blue photon from a laser?
If David Springer wants to argue that there is no difference between a photon of blue light from the Sun and a photon of blue light from a laser, then let him prove that the Sun is a laser
Stop ducking and diving. Just answer the question.
There appear to be some of you who don’t know that longwave infrared aka thermal infrared aka radiant heat direct from the Sun has been excised from the AGWScienceFiction Greenhouse Effect Energy Budget. I’m not responsible for your ignorance.
This has now been introduced into the general education system, though not taught by traditional physics teachers. If you were fortunate enough to have been educated traditionally then you might not know that the majority of the general education system is teaching this fake fisics created by AGWSF. My argument is against this now ubiquitous fake fisics teachings, because it has effectively dumbed down basic science for the majority of the world’s population by becoming the “official” version.
So, you will find it taught at universities and in encyclopaedia’s, as I have previously given references. You can look this up for yourselves.
Unless you understand this, you cannot follow my argument. Those who were taught this do understand what I’m saying. So, you who do know what I’m saying, might not like what I’m saying, but you know I am arguing about the teaching you have received.
And I’m saying it is idiotic, impossible fisics. The sooner y’all wake up to the fact that general science education has been deliberately manipulated over the last decades to promote the fictional AGW claim, the sooner you’ll get out of its trap.
Why some in the “West” think themselves immune from mass indoctrination through the education system while being able to appreciate that such techniques were routinely carried out in other countries such as in the Soviet Union and China, is surprising, but I think perhaps, I’m only guessing, that this could be why so many here are ‘blocking out’ what I’m trying to explain by refusing to take up my challenge.
This AGWSF meme of “shortwave in longwave out” is now fully entrenched in the general education system and you who hold this view have been consistently telling me it is real physics – why hasn’t even one of you been able to provide me with proof of this?
Have you looked for it? I’m constantly being told that ‘there are hundreds of experiments to prove it, that it is well know physics, thoroughly examined in the last century’, but yet not one of you has ever come back with any real physics to explain it.
Why not?
The obvious answer is because it doesn’t exist to be fetched. All you find is repetition after repetition of the claim, but no rational explanations.
If you continue to ignore that you can’t explain your claims that is your own personal dilemma, but as scientists, it is encumbent on you to face the challenge I’ve presented to your claim.
I have given traditional physics teaching contradicting your claim, I have given you a recognised science body giving the same teaching, see the NASA quote I’ve posted.
What does it take to get you to engage with what I’m actually saying here? Argue your case or admit you can’t, or, learn what the real physics basics are and begin exploring the techniques of the con..
So, how does visible light from the Sun heat the land and water at the equator to the intensity it does …?
Climate skeptics like Springer are schizophrenic.
First they doubt the mechanism of AGW.
Then if they start to doubt their own doubt, they claim that global warming won’t be bad, so might as well bring it on.
Schizoid or high school level debate tactics, you be the judge.
There are several separate issues. I know that’s difficult for a one track mind such as yours to comprehend.
Issue 1: how much anthropogenic warming if any
Issue 2: consequences of warming
Issue 3: consequences more CO2 on agriculture
Issue 4: consequence of spending money to limit CO2 production
The earth has had far higher atmsperic in the atmosphere through natural processes in the past. It wasn’t catastrophic. In fact the ice age for the past 4 million years greatly limits the amount of biomass the earth can support. Where in the past it has been fecund and green it is now barren and frozen. Agriculture practioners where practical artificially raise CO2 to 700-1000ppm to increase productivity. Agriculture in higher latitudes is limited by length of growing seasons. CO2 warming should lengthen those growing seasons as the effect occurs primarily by way of warmer winters not warmer summers. Spending money needlessly, which amounts to waste, is generally bad no matter what the cause. If warming and increased CO2 is a net benefit, which cannot be ruled out, then the waste turns into an active harm.
These things must all be considered and might indeed be too many things for a dumbass like webhubcolonoscope to hold in his head all at one time.
Springer is from the “yes but” school of debating tactics.
It’s also CYA stuff for in the future in case he was wrong about AGW. He can then claim that he was looking forward to it.
Kind of expected since CYA is taught well by the military.
Yes a narrow control-knob like Web does seem to struggle with the concept of a problem with more than one variable.
Putrid,
Your content-free comment is rather timely, as I just finished describing elsewhere in this thread a very simple climate science problem that I solved with essentially TWO variables, ha ha.
http://judithcurry.com/2012/12/04/multidecadal-climate-to-within-a-millikelvin/#comment-275392
Care to share your struggles concerning your intellectual vapidity?
Wow Web, a staggering advance for you. Any decade now you might even develop a spirit of enquiry, instead of your usual polemic dressed up as enquiry.
Are you really that transparently phony?
All that you are doing is projecting your own inadequacies on me.
You have nothing to show so you might as well lash out at an arbitrary target.
WebHubTelescope | December 8, 2012 at 8:57 am said: ”Climate skeptics like Springer are schizophrenic.First they doubt the mechanism of AGW. Then if they start to doubt their own doubt, they claim that global warming won’t be bad, so might as well bring it on”
There are lots of Fakes as Springer; they all suffer from.. I think was called ”Jackal & Hide” chronic sickness. Used to be described as: running with one leg on each side of a barbwire fence experts… Or; only half of his brains is on the front end… They are experts on ”ifs and maybes” same as the Warmist. .
Springer &lowot sound and look the same to me; like two cheeks on same ar/se, only YOU stand in-between two of them, not to blend into one
Covering up your penchant for projecting your inadequacies onto others, by arbitrarily accusing others of using your tactics. Genious.
Petra is in league with her Aussie buddy Stefan the Denier I see.
Ok so she is not projecting her inadequacies, just acting like the typical larrikin punk that inhabits these parts.
That’s good, you just keep projecting yourself onto others, that’ll continue to keep noone all fooled.
I always suspected Stefan and Murh weren’t real people, just inventions of you or one of the other alarmist truebelievers, who you make spout a lot of drivel, as you try and discredit we sinners guilty of climate blasphemy. Their gospel may differ to yours, but the dogged, blinkered attitude is virtually identical.
If all these commenters are simply agent provocateurs, somebody is doing it from an oz address and giving them australian identities.
Petra | December 10, 2012 at 7:22 am said: ”I always suspected Stefan and Murh weren’t real people, just inventions of you or one of the other alarmist truebelievers”
wrong, I’m for real, b] Warmist would prefer for me to disappear more, than all the Fakes; because the Fakes are Warmist ”Fig Leaves” covering up the Warmist shame. Therefore I couldn’t be ”invention of alarmist truebelievers” as you are confusing your good self
#2: Petra, you don’t need much brains, to prove to us that you are WRONG, and back to front on everything… typical Fake. Listen carefully:: I’m not discrediting you – I’m pointing out.the things that are discrediting you – Plimer’s collection of shameless, cheap crap. The leading Warmist know that, and are convincing the politicians / media easy that: the Fakes are irresponsible grown ups with children’s mentality, to believe in already exposed pagan lunacy / lies: . http://globalwarmingdenier.wordpress.com/2012/08/25/skeptics-stinky-skeletons-from-their-closet/
If the truth is known, Hansen, Mann and many others will end up in jail – does anybody believe that: they will admit guilt, because the Fakes use bigger and more prolific lies?! Petra, I’m pointing to the honest Skeptics: ”don’t use Plimer’s stupid blanks” there are real proofs.
You are saying: ”as you try and discredit we sinners guilty of climate blasphemy. Their gospel may differ to yours, but the dogged, blinkered attitude is virtually identical” WRONG!!!
I don’t use any gospel, but real proofs, b] Fakes & Warmist are both into the PHONY GLOBAL warmings c] both don’t know the difference between climatic changes and phony global warmings d] for both camps O&N doesn’t exist in the atmosphere. Warmist & Fakes like you are like two cheeks on the same ar/se
.Me, I’ve proven that: warmings / coolings are NEVER global – overall heat is always the same c] climate never stops changing – being ”skeptical” about climatic changes… is the dumbest thing to say.. you carry the brand, proudly d] O&N are cooling the planet, not CO2!!!
P.s. Myrrh is correct on some things 100%, on others he is wrong, for example: ‘water evaporation cools the land and the sea, BUT, that doesn’t cool the planet – only takes heat high up to be easier cooled by the shuttling oxygen &nitrogen, plus: as sun umbrellas clouds intercept lots of heat, high up – nevertheless, that heat is still in the earth’s system – only O&N are ”COOLING THE PLANET”
Petra, do you believe that; O&N exist in the atmosphere? Do you believe that they expand INSTANTLY, when warmed / increase the volume of the troposphere? If you do, you are not a Warmist’ Fig Leaf == BUT, you are, if you don’t acknowledge that: they are cooling the planet, not CO2!!! Or, do you know precisely, the global temp, for the last 1000 -2000 years; as the rest of the Plimer’s dysentery?!
Thanks for reminding me that Ian Plimer is another one of those kooks.
He is missing an opportunity by not commenting here with his buddies.
A note to any newcomers. “Kook” and such words are typically used by Web to describe anyone whose conclusions he dislikes, but whose arguments he cannot fault.
Vaughn Pratt
Thanks for sharing your poster. And btw, you seem to be a mischievous, funny guy.
When a strong AGWer posts up at Climate etc, skeptics sometimes react as if a stink-bomb was thrown into the library; quiet thinking quickly leaves the building. I wonder if you anticipated that reaction and if it provided some amusement.
Because I am pretty sure that some who were upset by your post would have reacted differently to a nearly identical post which decomposed and described a signal obtained from a portion of the operating range of a non-linear device. The reaction then might have been ‘thanks Pratt, you’re a cool dude’. Since you do not claim the description holds true outside the observed operating range, (i.e. a century into the future), you probably ARE a cool, albeit rascally, dude.
bi2hs
I wonder if you anticipated that reaction and if it provided some amusement.
Actually I was expecting a more negative reaction. My previous post here 16 months ago (which objected to the back-radiation explanation of the greenhouse effect) was met with much more hostility. I felt I was treated relatively gently this time. ;)
Since you do not claim the description holds true outside the observed operating range, (i.e. a century into the future)
Thanks for noticing that. Figure 7 was careful to say “extrapolate” and not “forecast,” and to make business-as-usual CO2 a condition, but in hindsight I should have left it out altogether to avoid any confusion.
I am indeed a “rascally dude,” at least to the extent that I am a generalist who likes to write about a very wide range of topics. I can only tolerate about seven years of specialization at a time, at which point I feel I’m not learning much more about that subject and move on. These days I go even further and work in several areas at a time, which has its pros and cons. I appreciate your remarks. :)
So no warming this decade will invalidate the thoery?
Vaughan – old buddy – you’re wasting everyone’s time here.
@CK: So no warming this decade will invalidate the thoery?
It certainly will for me. If 2010-2020 doesn’t warm I’m afraid it’s back to the drawing board for my analysis!
Vaughan – old buddy – you’re wasting everyone’s time here.
From which I infer you’re predicting this decade won’t warm. If we’re both alive in January 2020 (2010-2020 ends in December 2019) we’ll know who was right. :) Maybe even earlier if the warming is sufficiently clear by say 2017.
Looking at the trends in each decade of HadCRUT3 since 1870 (1870-1880, 1880-1890, etc.), the Laplace Rule of Succession gives you less than a 1/14 chance of being right.
Don’t rely on the Sun Spot Number for solar cycle 24. According to Leif Svalgaard a low SSN does not guarantee a low TSI (Total Solar Irradiance).
While I’m responding to CK here I should say that I take umbrage at WebHubTelescope’s suggestion that we Aussies are all flakes. I’ve met some pretty flaky Yanks. ;)
VP – mostly he’s counting on a repeat of mid-19thC cooling.
Sorry, mid-20thC cooling.
Ironically so am I, in fact not just the mid-20th C but going all the way back to 1870. I’m counting on all the even decades having cooling trends relative to the odd decades on either side. The difference is that whereas CK is counting on just one cooling (mid-20th C) I’m counting on 7 relative coolings in a row: 1880’s, 1900’s, 1920’s, …, 1980’s, 2000’s, the first six of which were followed by relative warmings. Let’s see if the pattern continues with the seventh.
Well WebHubTelescope, ( if that is what you think U are? )
There be Australians, as some inhabitants of other continents,
who may be unbalanced… but I ain’t one of them, and I definitely
don’t imagine I am a telescope … :)
Australian ‘birds,’ generally speaking, eg, The Oz Magpie
( Gymnorhina hypoleuca) seem not ter be apocalyptic about
climate change though some of us are alert ter Hume’s black
swan problem.
Magpie (gymnorhina hypoleuca)
What have you, magpie, to celebrate?
Such glorious chortling in an arid landscape.
Leaves of eucalypts hanging motionless
In the breathless mid-day heat. It isn’t
That you can’t, or won’t complain in some
Scenarios, but rather that, by your very song,
You are constrained from sef-reflexive musing,
For magpie, you may sing only the songs
Passed down the line by those first ancestors.
Songster extraordinaire, you are programmed
To voice liquid stanzas of affirmation,
Your concert repertoire scarcely allowing
For lamentation.
BC
Beth
Like your Oz birds.
Max
Vaughan Pratt :
”Edim is exactly right — the change in CO2 was very small during the first half of the period, so the resulting changes in temperature then were overshadowed by the various natural swings. As the CO2 started to change faster you can see the CO2-caused temperature rising out of the rest of the fluctuations, which are there throughout the whole period.”
As I understand this is a hypothesis of your own. If you test it pragmatically you should understand what I have tried to state in my comment below; http://judithcurry.com/2012/12/04/multidecadal-climate-to-within-a-millikelvin/#comment-274367 .
Yes Lauri, Vaughan cannot let go of the CO2-caused temperature rising. It all comes down to the next decade(s) now, the consensus needs warming, and soon (Roll on the next El Nino!). The 30-year linear trend started dropping in ~2005 and if it goes like in the last ‘cycle’, we will be at 30 years of no warming in ~2020.
@Edim: The 30-year linear trend started dropping in ~2005
What do you mean by “started”? Certainly not one year since the trend during 2005 was up. However the trend during 2000 was down, likewise for 2002, so it would be more accurate to say it started dropping during the decade 2000-2010. (The trend for that decade was 0.03 C/year, way low compared to recent previous decades, so to say it trended down in that decade is a fair statement.)
Let’s see whether the trend is up or down for 2010-2020. (Looks at watch.)
Meanwhile the downward trend for 2005-2012 (up to December 2011) was -0.09 C/decade while that for 2005-2013 (up to October 2012) was -0.06 C/decade, so I wouldn’t be so confident that there is an increasingly downward trend starting in 2005. All this is completely consistent with what happened to odd and even decades since 1870.
Vaughan, I mean the 30-year trend:
http://i1159.photobucket.com/albums/p623/Oefinell/30yrLR.jpg
Oh, I see what you mean. That phenomenon happens every 20 years, it’s right on time. Look at 1985, 1965, 1945, 1925 (less clear-cut as it’s merely a flattening of a sharp climb), 1905, 1885. It would be very unexpected for 2005 not to show it.
— And Finally—
So it is not necessary to go to an over-elaborate analysis to
plot a graph showing that the CO2 saved N. Hemisphere
or even the world from onset of the new LIA starting in 1960s.
or to calculate theCO2 feedback sensitivity at 3 degrees C
for doubling of the CO2 concentration.
http://www.vukcevic.talktalk.net/00f.htm
— And Finally—
So it is not necessary to go to an over-elaborate analysis to
plot a graph to show that the CO2 saved N. Hemisphere
or even the world from onset of the new LIA in 1960s.
or to calculate theCO2 feedback sensitivity at 3 degrees C
for doubling of the CO2 concentration.
http://www.vukcevic.talktalk.net/00f.htm
Vaughan Pratt | December 7, 2012 at 11:27 am | Reply
“The 15-year figure I obtained is how far I had to slide rightwards the predicted global warming curve in Figure 3 so as to make its curvature match that of the observed global warming curve in Figure 2.”
But if you try to match maximum solar insolation with maximum ocean temperature you only have to slide the prediction forward a few months which empirically appears to be the extent of the lag between forcing and mixed ocean layer temperature. I don’t believe there’s any empirical support for that 15-year lag. It’s just you adding parameters and fudging with numbers to get the fit you wanted. It’s virtually the classic story of lying with statistics, Vaughn. Just like you chose 20-some years as the longest natural variation to filter out. If there’s any longer natural variation, especially one of a century or more it ruins your statistical narrative. There ARE longer natural cycles from the just a bit longer (AMDO ~ 60 years) to much longer (Milankovich ~ 100,000 years) and lots in between.
The same thing about measuring two cats and finding the same weight can be said of recent warming caused by rise in CO2 and rise of CO2 happening to be coincident with warming caused by a natural ocean cycle (AMDO). The jury is still out and with no warming in the 21st century so far it’s looking bad for CO2 good for AMDO because “the pause” is right on time for the AMDO is not explainable in a 3C/doubling CO2 narrative. A few more years of no warming will drive a stake through the heart of sensitivity estimates higher than the no-feedback response of 1.1C/doubling.
Vaughan Pratt | December 7, 2012 at 12:04 pm |
I” would like to think it was accurate, but my results don’t depend on that. What they do show is that the multidecadal part of HadCRUT3, the slow-moving or low-frequency bits, follow a precisely specified mathematical formula to within a millikelvin over a century, and a few millikelvins over 1950-now.”
If HadCRUT showed 0.5C warming instead of 0.8C you’d have to at least change the value of some of the hypothetical constants in the formula with the most glaringly obvious requirement of changing 2.8C/doubling down to a no-feedback response of 1.1C/doubling. You’d also have to diddle with the starting value of 287ppm CO2, diddle with the 15-year Hansen delay, and perhaps also tweak the filter parameters to get the shape right.
Agreed. If HadCRUT3 were very different from what it is, my formulas would be very different too.
Using the 5 sawtooths Excel’s evo solver got to 10 millikelvins average absolute MRES (with the climate sensitvity set to zero). However sinewaves seem better: Setting the sawtooth amplitude also to zero, five sine waves have an average abs residual in the tenths of a milliKelvin.
“It would seem therefore that rising climate since 1850 is a lot more complex than can be explained by our rising CO2 emissions.”
Yes and No. When are people going to realise that the relation between temperature rise and CO2 concentration is very non-linear? That is because quantum thermodynamics tells us so. According to quantum theories, we should arrive at the higher temperatures by a series of steps and stairs for each molecule of CO2, but how many steps and stairs are available? We don’t see this normally because changes of state, which depend on both temperature and Photon arrival or departure from the individual molecule, as well as degrees of freedom, are not normally syncroniised so the random phase differences make it appear to be smooth and continuous. See my website at http://members.iinet.net.au/~alexandergbiggs .
Pratt’s model uses CO2-only to predict a warming curve. Yet the HadCRUT temperature record necessarily includes effects from anthropogenic methane, soot, and land use changes which according to IPCC report accounts for as much as half of all warming.
I guess it all just produces exactly the same curve as atmospheric carbon. /sarc
CO2 is a proxy for all greenhouse emissions. We have better long-term emissions data for it than the other GHGs thanks to the CDIAC. My analysis is not able to say what proportion of anthropogenic GHG warming is directly attributable to CO2.
We essentially did the same in in our results paper, taking c02 as a proxy for all GHG forcings. We got no better results when we tried to disaggregate the components since the curves all have the same basic shape.
For people who accept AGW ( durrrr basic physics) the demonstration that you can “explain” the temperature as a function of 2 parameters ( in out our case) or 9 parameters ( in your case ) stands as a good sanity check of what we already know to be the case. For folks who dont accept the basic physics (GHGs warm) they will never get the point of the demonstration.
David and Vaughan
IPCC in AR4 has made the model-based estimates (or assumptions?) that, since 1750, all anthropogenic forcing factors other than CO2 (other GHGs, aerosols ,black carbon, land use changes, etc.) have “cancelled one another out”, so that the radiative forcing from CO2 = RF from all anthropogenic factors.
IPCC also assumes (with a “low level of scientific knowledge”) that natural (solar) forcing was only 7% of the total forcing over this long period, while several solar studies have estimated this to have been around 50%.
So we have, in the long-term CO2 and temperature record, enough data to estimate a range for the observed 2xCO2 temperature response.
This has been between 0.8C and 1.5C.
So Vaughan is not “way off” if he uses CO2 as the anthropogenic forcing proxy for all GHGs plus aerosols, etc. (assuming the past repeats itself).
The underlying assumption is that all other anthropogenic forcing factors will cancel one another over the long-term future as they have in the past.
This seems reasonable to me.
Max
For folks who dont accept the basic physics (GHGs warm) they will never get the point of the demonstration.
Kind of like the modellers’ “we can’t think of what else it could be” ?
Sorry for coming late to the party. I only just spotted this thread. I have scanned ‘most’ of the 650-odd comments ,especially for the author’s remarks so I hope I’m not repeating anything.
Firstly, I find Vaughan clearly shows a open mind and clear willingness re-evaluate what he’s done as well as good technical understanding that is sadly often missing, even in a lot of the published literature.
One if my bug-bears is the use of running means as a filter so it very refreshing to see VP fully understands the issues and has built his F3 filter with due regard to it’s frequency response. However, as will all such convolution filters each filter reduces the length of the dataset by half the kernel width at each end. Applying successive filters successively reduces the data.
21+17+13= 51 y
So F3 should reduce dataset by 25 years at each end. The fact that this is not what is shown means some kind of artificial data “padding” is going on.
He invites us to ‘ignore’ the end decade but this data should not even be there, it is artificial, and it is 25y at each end not just the inconvenient decade.
Since all the F3 plots run upto 2010 I think a clear explanation is required as to how the data were extended.
a clear explanation is required as to how the data were extended.
Phew, someone finally asked. :)
Picture the columns as extended with blanks (no information) above and below (as in fact they are, I didn’t pad them that way, Excel did by default). A 21-year window at the end has 10 blanks and therefore Excel takes the average of the 11 non-blank numbers (Excel’s definition of AVERAGE when data is missing: it just takes the average of whatever data it finds).
As Figure 3 makes clear, when there is a strong trend at the end this biases the window’s mean towards the values further from the end, i.e. away from the trend. (One can read from the comments that this has greatly pleased the predictors of a coming downturn, who appear not to have noticed that it is the filter and not nature that is bending the orange curve down.) However this happens to both Figure 2 and Figure 3 so they more or less cancel or the end values in MRES would be much more than 8 mK.
It is a good question whether there is any “best estimate” for the values beyond the end other than blanks. Certainly if Figure 2 were extrapolated with predictions based on the immediate past this would correct the downward bend. However there is a large community here that is forecasting a downward trend over the coming decade even though the previous two decades trended upwards, and I am positive that they would object to this approach even if someone were to prove mathematically that it was an optimal estimator in a suitable sense.
However, as will all such convolution filters each filter reduces the length of the dataset by half the kernel width at each end.
Then you must really hate Gaussian filters, which have an infinite kernel width. :)
and it is 25y at each end not just the inconvenient decade.
One can see both empirically and theoretically that this is not quite right. Empirically we see the sharp upwards trend in Figure 3 bending the curve down starting only one decade from the end, not 25 years. And theoretically 25 years would only make sense for a 51-year box filter, which F3 is definitely not. Instead it looks more like a Gaussian filter, albeit with a much sharper cutoff at 1.5 nHz (21 year period), and one would not say that a Gaussian filter should chop infinitely much off the end merely on the ground that it is an infinite impulse response (IIR) filter.
What one does instead is pick a point some dB down the impulse response of the filter, say 6 dB, and treat that as the counterpart of the edge of a box filter. In the case of F3 that point is about 11 years from the end, not 25. When cascading a few box filters significantly different in width, the largest width is a good estimator for the whole thing as the narrower filters tend to bend the impulse response around the 6 dB point (variance, 3 dB amplitude).
It should also be mentioned that the 21-point binomial filter (which despite being an FIR filter is an extraordinarily accurate approximation to a Gaussian filter) has in common with F3 that it is the convolution of box filters, namely of 20 width-2 box filters. (To preserve phase one should convolve two of these to give a 3-point binomial filter and then convolve 10 of those, as per MAIN!P224:Z247 of the spreadsheet.)
Convolving (i.e. cascading) a few small simple filters is an effective way of tailoring large complex filters to meet specific criteria. (But not Gaussian filters: the convolution of two Gaussian filters is just another Gaussian filter. The convolution of an m-point and n-point binomial filter however is an (m+n-1)-point binomial filter, more useful given that n=2 is a box filter.) For this application I wanted to clean out all phenomena faster than the Hale cycle, for which I used two narrower box filters to essentially flatten the large box filter’s first side lobe. Different needs call for different filter designs.
Ocean currents ‘Saw-tooth’.
here is an autocorrelation lag analysis of 100 years of North Atlantic and North Pacific temps according to Hadley ISST , both filtered with 60 month gaussain.
The lag analysis was done on rate of change (derived from monthly difference) , since we are looking for causes of change it seems most useful to look at change directly.
http://i47.tinypic.com/5d831l.png
Circa 60y in Atlantic seems fairly simple in form, though there is some bending, so period should not be taken too precisely. At 93.6y it has 1.5 cycles of 62.4y. NP shows 2.5 cycles in 93.6y, = 37.44y Twice that =74.88y
Extrapolation of these ‘cycles’ would suggest a common positive correlation around 180y rather than the 151 years used by VP.
There is some support for the idea of linked resonators that has been discussed here before. There may be evidence for 5:3 locked resonance here.
So this idea of circa 75y repetition with a harmonic at half that, plus 60y repetition in Atlantic may characterise those ocean basins. (NP is generally regarded as decent measure for the whole Pacific in PDO.).
Some care should be taken since autocorrelation shows a repetition of form and in no way suggests is it sinusoidal as VP does in his saw wave. The NA autocorr is much stronger than the Pacifc. (though the 0.2 peak is above 95% significance for the number of samples.)
Now looking at fig1 it seems fairly obvious where the peak and troughs of the 60y cycles are and, if we are to assume a sine wave, starting around 1925 seems to pretty good. The form and timing of Pacific repetition is not obvious.
Now for the Saw tooth (which is finally that in name only) it is unclear where the fundamental of 151y comes from and why the so called harmonics are where they are other than what appears to be a totally arbitrary idea that they should compose a saw tooth , which is quickly abandoned anyway.
Maybe I just missed some key point but I see no reason presented why the ocean currents should conform to this saw tooth idea.
While autocorrelation does suggest some justification for 74, 37y periods, it would be hard to “tweak” the strong 60y to conform to 151y saw tooth.
On the contrary , the obvious trough of the record around 1910 and peak around 2000 would suggest the saw tooth that fits best would be very different from the one presented.
Since the exact method was not presented it difficult to see where the error lies, but it seems to me that the exponential rise was remove before the saw-tooth was fitted, not later as is suggested in the layout of the poster.
A more thorough explanation of how to reproduce the saw tooth and its coeffs would be useful in verifying that there is not a degree of induction in the saw tooth fit.
This needs working out correctly but my best fit ‘saw tooth’ to that data would be something like 37,60,75y all peaking somewhere between 1998 and 2003
Perhaps Vaughan could explain why the more obvious saw tooth was not fitted and where the idea of a saw tooth defining the harmonics to be fitted comes from.
@greg goodman: Extrapolation of these ‘cycles’ would suggest a common positive correlation around 180y rather than the 151 years used by VP.
Applying my methodology to HadCRUT4 gave 170 years, but I’m a bit dubious of the 100 mK bump they added to HadCRUT3 during 1940-1970 and therefore didn’t put it on the poster (no room anyway). Somehow I formed the impression that Phil Jones didn’t like the way HadCRUT3 dipped there, anyone notice that or am I just confused? Anyway these periods are somewhat sensitive to fiddling with the data and I wouldn’t want to have to choose between 180 and 150 years. On the other hand, so far no one has shown that anything other than 151 years fits HadCRUT3 better. If you can get a good fit with 180 years let me encourage to exhibit it, as a formula, MATLAB program, spreadsheet, or whatever.
There is some support for the idea of linked resonators that has been discussed here before. There may be evidence for 5:3 locked resonance here.
How does one distinguish “locked resonance” from “periodic?” Every periodic signal is a sum of “locked resonances,” namely locked to the fundamental.
Your 5:3 = 1.67, my 3:2 = 1.5. I got a great fit to HadCRUT3 using 1.5, if you can get a better fit using 1.67, go for it! (I say that to everyone, I’m starting to sound like a cracked record.)
Maybe I just missed some key point but I see no reason presented why the ocean currents should conform to this saw tooth idea.
Please refer to the rightmost column, under “MECHANISMS” which starts at the top “We discuss a possible mechanism for the sawtooth.”
For lack of space I did not address the issue of why a sawtooth caused by seismic events (see poster) should be specific to the oceans. (I had set aside some space for comments, but although some people remarked on it being a cool idea no one used it so I could have put it there.) My reasoning was that if seismic events at either mantle boundary are responsible then the oceans are where you’d expect to see the sawtooth most clearly, because the crust under the oceans is only 20% the thickness under the continents and convection easily carries the thermal fluctuations up from the ocean floor.
The multidecadal oscillations of the Earth’s core relative to the crust described at this 2000 paper by Hide et al fits quite well with this theory, and gives an alternative to the more naive “seismic events” in my theory.
Some care should be taken since autocorrelation shows a repetition of form and in no way suggests is it sinusoidal as VP does in his saw wave.
How is a sawtooth sinusoidal? See Figure 8. Sinusoids enter as harmonics, but that’s true of all periodic signals regardless of their shape, which are the sum of their harmonics, which by definition are sinusoidal. If you’ve found a “repetition of form,” that is, a periodicity, then its shape will be a sum of sinusoids too, all locked to the fundamental.
It is highly likely that both thermal and mechanical phenomena will filter seismic signals, by acting as both low-pass and high-pass filters, so attenuating or completely losing the fundamental and higher harmonics is by no means unreasonable. (HadCRUT4 wanted me to put the fundamental in, but phase shifted so far back in time as to be ridiculous, see hadcrut4.xls at clim.stanford.edu.)
The NA autocorr is much stronger than the Pacifc. (though the 0.2 peak is above 95% significance for the number of samples.)
Are you arguing against or for my theory? Although the sawtooth should be visible in all oceans it should be particularly visible in the Atlantic because the crust is almost non-existent in parts of the mid-Atlantic ridge.
a totally arbitrary idea that they should compose a saw tooth , which is quickly abandoned anyway.
Where are you getting that? It’s neither arbitrary nor abandoned.
On the contrary , the obvious trough of the record around 1910 and peak around 2000 would suggest the saw tooth that fits best would be very different from the one presented. Since the exact method was not presented it difficult to see where the error lies
Not presented??? Every detail is presented in the spreadsheet, that was the whole point of supplying the spreadsheet! Are you claiming the spreadsheet omits something? That would be impossible, how could the spreadsheet compute the R2 of 99.99% (MAIN!U35 in the spreadsheet) with something missing?
And given that the R2 is 99.99%, are you saying that “the error” is the unexplained variance of 0.01% and that a better fit would improve on 99.99%? How meaningful would that “improvement” be? Or do you have a different criterion than R2 for what “fits best?”
but it seems to me that the exponential rise was remove before the saw-tooth was fitted, not later as is suggested in the layout of the poster.
They commute (this is all linear algebra). You can remove them in either order, or even simultaneously (DATA – (SAW+AGW)) as pointed out in the poster
This needs working out correctly but my best fit ‘saw tooth’ to that data would be something like 37,60,75y all peaking somewhere between 1998 and 2003
Looking forward to the proof. You just have to show a better fit than I got. ;)
But before you spend too many hours/days reinventing this wheel, might I recommend spending a few minutes experimenting with the 9 sliders on my spreadsheet, if only to get a feel for where the biggest improvements are needed?
As a starter, try setting GWDelay to each of 5 years and 25 years and see if you can get as good a fit with the remaining 8 sliders as I got with it set to 15 years, namely 99.99%. Let me know if you find a setting that gives you a better R2 than 95%. If that doesn’t convince you that Hansen delay can be extracted from HadCRUT3 I’d love to know why not.
You can also experiment with the locked sliders, either by ignoring them and just typing the values you want into the spreadsheet’s little gray cells, or unlocking the locked sliders via the Developer tab and turning on Design Mode (Control Toolbox in Excel 2000). This will likely give you so much freedom that you should be able to get an excellent fit even if you enter 0 in MAIN!V26 (ClimSens).
If you don’t have Excel yourself just hunt down a nearby admin who will be sure to have Excel 2007 if not 2010 on their desktop. MS Office is never far away unless you live in a cottage in the woods. Although I dual boot into Linux on my laptop I have had no luck with free spreadsheet software such as OpenOffice CALC for Linux, only MS Office seems to work at all for this spreadsheet, much as I wish it were otherwise. Excel on MacOS should be ok though I haven’t heard yet from anyone trying it. Incidentally on Windows 7 Excel 2000 is blindingly fast compared to Excel 2007 or 2010, go figure. Might be due to 10x as much error checking.)
http://fallmeeting.agu.org/2012/eposters/eposter/gc23c-1085/
“The second and third harmonics correlate well with the principal ocean oscillations, e.g. AMO;”
AMO …. and ?
Which other “principal ocean oscillations” are being implied here without being explicitly named? If something correlates what is it?
Which harmonic, 2nd or 3rd. is claimed to “correlate well ” with AMO, can we see this demonstrated? There is a clear circa 60y cycle but I don’t see that being a harmonic of 150 years. So what is this supposed to be claiming?
This also leaves the rather obvious omission of the fundamental. The largest component of the supposed SAW gets curiously omitted from the commentary.
Having had time to check this out a bit, it appears that the whole SAW idea is rather contrived and does not relate to any established physical phenomena.
I’d like to see the author explain these points because it appears that the SAW element is somewhat arbitrary, contrived and is providing a pretext to remove the inconvenient early 20th warming that has always been a major problem for the hypothesis of a dominant AGW driven by CO2.
Vaughan,
How about doing the experiment we talked about at AGU?
Will do shortly, though it concerns the solar cycles, not the sawtooth. So far responding to the comments is keeping me occupied full time.
“The judgement to be made here is whether the nine parameters used here have any chance of achieving a comparably accurate fit on random data in place of HadCRUT3. This was an objection raised to Mann’s methodology, and I would be interested to see if it applies here.”
9 ? Sorry?
SAW has four frequencies, four amplitudes and a start date, that’s 9 already. (The trick ™ of calling it a “saw tooth” without it being one and linking the choice of frequencies does not absolve fact there are four freq parameters.)
The exponential has four explicit parameters plus the Hansen frig factor, that makes 5.
so far I see 14 parameters ! (Unless I missed some).
Now if you have 130y of data with a range of +/-0.5K and hit it with an “aggressive” 21y low-pass filter, ie your cut-off is about 1/6 of the length of the total dataset (one third the Nyquist frequency), and you fit it with 14 parameter model you can hardly fail to get a good fit.
Your MRES goes from -0.3 to +0.8 mK so your residual is of the order of cK not mK .
Let’s put this another way : 1% residual with a 14 parameter model having slugged that data so hard it can barely wiggle.
Come on man. You are clearly a smart and well trained guy, I’m not telling you anything you don’t already know.
You’re having a laugh, right? It’s a bet. Just seeing how gullible your colleges at AGU are.
OK, fair game, ‘April fool’ an’ all that. You had me going for a while there, too.
Now how about you come clean, in case anyone starts to suspect that you were capable of being so silly and meaning it?
What kind of fit do you think you can get if you restrict yourself to just low-pass box filters and the low harmonics? I bet you still end up with a curve suspiciously like Vaughan’s. No way to remove that with those functions.
By “parameter” I mean an independent parameter that can be tweaked. How do you propose to tweak the frequencies of the harmonics of a periodic signal? They’re all locked to the fundamental and therefore can’t contribute to the dimension of the space of all functions representable with formulas of the form I’m using. That is, they can’t be varied continuously, as would be required of an independent parameter. If they could I would agree with you. Same for the amplitudes. Same for the phases. Any of these that I “unlock” are counted, namely 3 (two amplitudes and a common phase).
To count the parameters just count the sliders. These were the only variables that were adjusted in order to maximize R2. There are 9 sliders.
Your MRES goes from -0.3 to +0.8 mK so your residual is of the order of cK not mK .
I was going by the standard deviation, not the range. This is half a mK for the first 100 years, an interesting period in its own right for those claiming there was no global warming prior to 1950.
Over the whole 160 years, if MRES is not counted as part of multidecadal climate then the standard deviation of that as the residual is 2.5 mK. However if one chooses to interpret the last 50 years of MRES as somehow part of multidecadal climate, namely as extra upticks around 1970 and 2000 from the baseline set by 1850-1950, as I proposed in the first sentence of the conclusion, “plus a miniscule amount from MRES after 1950,” then I would think around a mK is fair when those upticks are included as part of “modern multidecadal climate.”
In any event, although the title says “a mK” the poster shouts “YES! WITHIN MILLIKELVINS” and I wasn’t claiming an exact upper bound here.
“I was going by the standard deviation, not the range.”
OK, so your title was a little misleading and you are indeed shouting about WITHIN MILLIKELVINS so using the SD or any other metric is this any more impressive than 1% ?
“Any of these that I “unlock” are counted, namely 3 (two amplitudes and a common phase).”
You have four frequencies (since you removed or “unlocked” the fundamental) . Of these four harmonics you “unlock” two amplitudes from the saw tooth model , that leaves two “locked” harmonics. The ratio of those two frequencies and amplitudes is predetermined by your choice of linking them in ratios of the supposed saw tooth: an infinite series of which you retain just TWO components.
So all your saw tooth argument boils down to is a pretext to “lock” those two frequencies and amplitudes and not count them as model parameters. There is no objective reason for this pre-selection, it is just another free parameter choice. This is smoke and mirrors.
“The second and third harmonics correlate well with the principal ocean oscillations, e.g. AMO;”
You have not addressed the fundamental questions I raised about this declaration. The strong and clear circa 60y cycle in AMO does not match any of your harmonics. This claim is false. You suggests there are other “principal ocean oscillations” that match your model. Which ones??
This claim is so tenuous that you do not even name which cycles you are referring to nor which harmonics you pretend they match.
Without some concrete, testable claims this whole idea is spurious. You have simply fabricated a waveform which removes early 20th century climate variation and kept the bit that fits AGW.
so your title was a little misleading
If you were misled, my apologies, it was not intentional.
@greg goodman: The ratio of those two frequencies and amplitudes is predetermined by your choice of linking them in ratios of the supposed saw tooth: an infinite series of which you retain just TWO components.
The sawtooth is assumed to have been filtered naturally, with both high and low frequencies being attenuated. The same thing happens with a stereo, you don’t get frequencies all the way down to 1 Hz or all the way up to 0.1 MHz unless you have out-of-this-world transducers. In nature signals going through many kilometers of crust face even more filtering, and it would be extraordinary to see an actual sawtooth faithfully reproduced.
In this case the first harmonic would appear to have been filtered out completely, I conjecture due to thermal leakage. The 4th and 5th harmonics come through as muffled, as typical of high frequencies passing through a thick mechanical barrier. There is no point retaining the 6th and higher harmonics because (a) they’re weak to begin with even as theoretical artifacts, (b) nature filters them to even weaker, and (c) F3 takes out what little of them is still left after (a) and (b), making it pointless to view them as visible components of multidecadal climate.
There is no objective reason for this pre-selection
A sawtooth waveform arises naturally as the result of an abrupt shift followed by a slow return to equilibrium. And filtering occurs naturally. Those are objective reasons. One sees the sawtooth in the late Quaternary deglaciations, and one of the visitors to my poster mentioned that his hydrology studies encountered a sawtooth. It’s a very natural waveform.
it is just another free parameter choice.
A “free parameter choice” is something that can be varied continuously. Where is the continuous variability here?
The strong and clear circa 60y cycle in AMO does not match any of your harmonics. This claim is false.
First off it’s not a round number, it’s closer to 62 years when measured carefully. Second, I would agree that it is “strong and clear” if you can demonstrate a 99.99% R2 for it. If you can’t then you have a rather generous notion of “strong and clear” which I would call “weak and vague.”
Two sine waves of respective periods n and 2/3 of n years, with the latter 2/3 the amplitude of the former, sharing a positive-going zero-crossing (that’s three properties!) are easily mistaken for a single oscillation of period about 5/6 of n (their mean). But although it may seem like a “strong and clear” oscillation, you will not be able to fit a single sinusoid to it anywhere near as accurately as two sinusoids with the above three properties. That’s not merely an empirical observation, it’s an easily proved mathematical fact.
You suggests there are other “principal ocean oscillations” that match your model. Which ones??
The literature tends to be vague about the periods of ocean oscillations, which I suspect is because it’s hard to separate the 50-year and 75-year cycles. In any event the former seems to correspond to the AMO and the latter to what some authors call the PDO and others the PMO. Some of the relevant literature for the PDO can be found at http://agwobserver.wordpress.com/2011/02/10/papers-on-pacific-decadal-oscillation/ where you’ll find a number of references to periods in the vicinity of 75 years.
In addition there is literature concerning oscillations of the core as it rotates inside the mantle, e.g. the paper by Hide et all that I mentioned earlier. Here again we find oscillations with periods in these neighborhoods, consistent with my theory of abrupt mantle disturbances. Purely conjectural at this point, but when you have signals that agree in all three of amplitude, phase, and frequency with harmonics of a sawtooth, don’t you think that’s a bit too improbable to be a mere coincidence?
VP: “Two sine waves of respective periods n and 2/3 of n years, with the latter 2/3 the amplitude of the former, sharing a positive-going zero-crossing (that’s three properties!) ”
NO. That’s one frequency plus a frequency ratio; an amplitude and one amplitude ratio. “Sharing” a common phase is probably two parameters of the same value, not one. Speculating (gratuitously) that these may have their origins in the bowels of the earth does not mean you can pretend 1+1=1 . That is not a key point since even fitting that heavily filtered data with 9 params and getting 1% is not a miracle.
VP: “The literature tends to be vague about the periods of ocean oscillations, which I suspect is because it’s hard to separate the 50-year and 75-year cycles. In any event the former seems to correspond to the AMO and the latter to what some authors call the PDO and others the PMO. Some of the relevant literature for the PDO can be found at http://agwobserver.wordpress.com/2011/02/10/papers-on-pacific-decadal-oscillation/ where you’ll find a number of references to periods in the vicinity of 75 years.”
Well that has to be about the most blatant example of a hand waving argument I ever seen. You’re not sure whether AMO repetition of 62y is supposed to match 50 or 75. I agree it’s a tough one since it’s slap bang in the middle and is nowhere near matching either.
You then get even more vague about PDO, PMO …. and more incoherent waffle in the vicinity of….
So in short you have asserted frequencies on the model that have no physical meaning. You have suggested these can be associated with ocean oscillation, yet you are patently incapable of backing up that claim. That is what is known technically as a false claim.
Also your so-called seismic “theory” is not even at the level of a hypothesis, it is just an idea pulled out of the air with no physical evidence presented to back it up. It is apparently total supposition.
That you expect to be taken seriously in a scientific discussion with this kind of argument is amazing.
VP: “Purely conjectural at this point, but when you have signals that agree in all three of amplitude, phase, and frequency with harmonics of a sawtooth, don’t you think that’s a bit too improbable to be a mere coincidence?”
It’s not a “coincidence” , you locked them ! Then used 9 other free parameters to tidy up the rest.
Far from being improbable it was a programmed result.
You’re not sure whether AMO repetition of 62y is supposed to match 50 or 75. I agree it’s a tough one since it’s slap bang in the middle and is nowhere near matching either.
You may be overlooking the possibility that something that superficially looks like a 62-year period might actually be an amplitude-modulated carrier with that period. At full modulation this is mathematically equivalent to (and therefore observationally indistinguishable from) a pair of sidebands symmetrically placed on each side with no power at the carrier frequency itself, as shown in the first figure in the article on sidebands. (The sidebands are broad as shown there when the modulation is broadband audio, but are single frequencies when the modulation is a single audio frequency.)
Some history may be in order here. When I first started looking at “ocean oscillations” the 62-year period was all I could see, and after detrending AGW I was able to get a reasonable least-squares fit of a sine wave to HadCRUT3 to estimate its period, phase, and amplitude. (I also tried other ways of the estimating the period such as finding the width of box filter that removed the most energy from HadCRUT3 though that does not give the amplitude or phase.)
But then I noticed that the amplitude was clearly not constant, but instead looked like an amplitude-modulated carrier centered on a 62-year period.
Now such a thing is mathematically identical to the sum of two sine waves. This was an alternative hypothesis, so to test it I tried fitting two sine waves instead of one. This as you point out entails six parameters. The fit was much better, suggesting it really was two sine waves.
But then I noticed that their periods as fitted, with none of the six parameters locked to each other, were extremely close to 75 and 50 years while their amplitudes were extremely close to 0.09 and 0.06 respectively, the same ratios. Furthermore they both had positive-going zeros within a few months of the same year. This struck me as an amazing coincidence; it certainly wasn’t what I expected and I hadn’t been looking for it before I noticed it. Note that the parameters were not locked when I made that observation: it was that observation that motivated locking them.
I recognized these as the second and third harmonics of a sawtooth. Now sawtooth waves arise in nature, both empirically (i.e. examples arise in nature) and also for a sound physically-based reason, namely as the result of a sudden perturbation followed by a slow return to equilibrium. All this then raised the possibility that what we were really looking at was neither a 62-year oscillation nor a sum of two sine waves but a single sawtooth passed through various linear filters of natural origin, both high-pass and low-pass but with good response in the vicinity of the 60-year period and falling off on either side, not necessarily in a smooth way.
These considerations led me to the filtered sawtooth hypothesis as an alternative to the other explanations. To test that hypothesis I tried fitting a single sawtooth with both phase and amplitude of the individual harmonics unlocked (one cannot “unlock” the frequencies of harmonics, they are locked by definition of “harmonic.”) I found that the best fit was when the fundamental had essentially zero amplitude and the fourth and fifth harmonics were present (omitting them gave a rather worse fit) but attenuated (consistent with the filter theory) with only minimal phase distortion, both by the same amount of time. I stopped at the fifth for the three reasons I gave above.
This led to the hypothesis that the filtering had removed the fundamental altogether, filtered the next two harmonics equally, and greatly attenuated and slightly phase-distorted the remaining harmonics.
This is nothing more than a hypothesis motivated as above. I do not claim it actually describes the world, only that the motivations I gave are suggestive of it doing so to some extent.
To test that hypothesis I described the space of filtered sawtooth waves having those properties as the image of a function of six variables. This space of curves has six degrees of freedom.
These properties led to the current set of six enabled sliders for SAW, namely for the common phase shift of the fourth and fifth harmonics and their independent amplitudes, along with the three parameters governing a sawtooth, namely period, phase, and amplitude.
Independently of whether you approve of that selection, it remains a mathematical fact that my selection defines a space of curves with six degrees of freedom. Only the number of degrees of freedom counts when judging questions of overfitting etc.
You want to count two parameters that are locked together as two degrees of freedom, but that’s statistically unsound because they are then not independent.
I’ve been careful all along to confine my claims to analysis of just the HadCRUT3 dataset. Other datasets that might support a different analysis are irrelevant to this analysis, which should be judged only as to how well it describes HadCRUT3.
Vaughan “Now sawtooth waves arise in nature, both empirically (i.e. examples arise in nature) and also for a sound physically-based reason, namely as the result of a sudden perturbation followed by a slow return to equilibrium”
True, then you can also have a weakly damped response so what “wave” you are catching would influence the harmonic you notice. There are a lot of fifths in paleo climate. Bintanji and Van de Wal have a nice long term reconstruction where they extrapolated the data to 100 year intervals. There is a fairly consistent lag in deep ocean temperatures of about 1400 to 1700 k years which produces some neat interactions in the decay responses, likely the Bond Events where the D-O events/oscillations are just more noticeable version of the same situation.
https://lh6.googleusercontent.com/-joaHMi2s-WI/UMDbWz5271I/AAAAAAAAF5E/I4Gg9M5cu3c/s925/bintanji%25205%2520ka%2520sd.png
The dampening coefficient would depend on the internal ocean energy transfer efficiency. Since that changes, your millikelvin match likely diverge with time.
Thanks, cd, I’m glad someone understands what I’m trying to say.
The spherical harmonics that can arise in the mantle between the core and the crust make for an interesting filter. Currently that sort of thing is above my pay grade—although I studied spherical harmonics in the sixties I’ve never had occasion to use them before and have completely forgotten it all. I should talk to the experts and/or become one myself.
Vaughan, “I’ve never had occasion to use them before and have completely forgotten it all. I should talk to the experts and/or become one myself.”
I am just going for trying to better understand the pretty patterns :)
Selvam came up with her Self Organizing Criticality: a Signature of Quantumlike Chaos in Atmospheric Flows, which gives me a headache so I shoot for the still chaotic but at least slower, deep oceans for inspiration.
http://amselvam.webs.com/earlsel/socpp.PDF
Simple models for the simple minded or is simplicity elegance?
Anywho, the chaotic pattern tea leaf reading is interesting.
thanks for this link, v. interesting paper
Captain Bonefish.
You aren’t able to pick up “fifths” of anything except for that fifth of vodka you have been drinking.
The fifth harmonic of a waveform buried in noise will be impossible to uncovet and reveal.
I guess the issue is the misuse of the term harmonic. By strict definition, a harmonic has to be an integral multiple of the fundamental frequency. In climate speak however, they appear to redefine it as being successively longer wavelengths than the fundamental wavelength.
Drives some of us DSP guys bonkers.
Vaughan Pratt
Re your 60 year cycle
I would be interested in your evaluation of Nicola Scafetta’s identification of solar/planetary cycles and beat frequencies showing up in the climatic record. e.g., see his Dec. 2012 presentation: Nicola Scafetta (2012). Multi-scale harmonic model for solar and climate cyclical variation throughout the Holocene based on Jupiter–Saturn tidal frequencies plus the 11-year solar dynamo cycle. Abstract GC22E-01
Webster chimes in with a less than knowledgeable comment, “You aren’t able to pick up “fifths” of anything except for that fifth of vodka you have been drinking.”
There is a 4.3 ka recurrence associated with the precession cycle. If 4.3ka is a fifth, then the most resent precession cycles would have a period of ~21.5 ka. I believe that is a fifth. The ~41ka obliquity cycle would have a fifth of 8.2 ka, however, the recurrent pattern typically associated with the 41ka obiquity cycle since the 100ka world evolved is 5ka to 5.8ka. One would expect a more dominate second or third harmonic signature, but the 4.3ka presence and lack of a pure 8.2ka is a puzzle since obliquity should be more dominate than precession. Where did the 8,2ka go? Why is there still a noticeable fifth associated with precession? Why are Bond events 1470 +/- 500 years? Why is the average lag of deep ocean temperatures ~1640 years behind SST?
Since you are so sure there are no fifths except in the liquor store, perhaps you would like to explain why they do not exist?
ftp://ftp.ncdc.noaa.gov/pub/data/paleo/contributions_by_author/bintanja2008/bintanja2008.txt is a good data base and
A good manual.
http://www.people.fas.harvard.edu/~phuybers/Doc/tune_or_not.pdf
“A different behavior is observed for the 1/23 kyr−1 peak where, for a moderate amount of tuning, the significance of the peak increases dramatically. The robustness of the results for precession across testing configuration lead us to confidently conclude that significant precession band variability is present in the ODP 1218 δ18O record. This result is, to our knowledge, the first unbiased statistical test for orbital variability using orbitally tuned records”
later, “For ODP 1218 the estimated autocorrelation coefficient is ϕ=0.87 and the variance of the ∈ disturbances is 0.41 at a time step of 4.3 kyr.”
Now if you read the Selvam work, which applies to much more than SOC in the atmospheric system, fifths are more interesting than 2nd and 3rd harmonics, at least to me since I am curious about how good Earth’s shock absorbers are.
Those aren’t technically harmonics.
Listen, Vaughan is modeling with a sawtooth. Depending on the symmetry of the sawtooth, it will consist of a mix of even and odd harmonics in addition to the fundamental.
There is also a mix of differing period sawtooth waves. The art of reconstructing the original sawtooth with its harmonics is difficult to do when one suppresses frequency components via indiscriminant filtering.
Those other cycles are not necessarily harmonically related.
By retaining the harmonics of a sawtooth waveform, he is able to recover more of the spectrum that might have been too easily eliminated by filtering.
Say we had a noisy square wave in a signal. One can use a naive approach and filter out the square wave, or one can lock onto the square wave and thus remove that signal, leaving the desired signal in a more faithful representation.
If that is not what Vaughan is doing, I am very confused.
Webster said, “Those aren’t technically harmonics.” You are right. You could call the “fifth”, a lobe in a weakly damped decay curve or be more creative. I like Vaughan’s carrier and amplitude modulation which I have played with, but in my opinion, weakly damped recurrent patterns is what I call them and the “fifth” or other harmonic reference just helps associate the event to the potential cause. There are also what I would describe as “reflection” like waves returning from a wall that can produce the occasional “rogue” wave. Then to get funky, there are recurrent patterns associated with saddle node transitions and other types of bifurcations. I am considering thermal inertia as real inertia, not just heat capacity.
The problem is placing an energy and time constant with the impulse perturbations so you can follow them through the system or “space”. To make that a little easier, I cheat and try to use the deep ocean for my reference to avoid the short term chaos in the atmosphere.
OK, your ‘little bit of history’ comment puts this in a new context. This is not what you presented along with the poster where you explicitly wrote that the 2nd and 3rd harmonics matched ocean oscillations, which you are still unable to justify.
I’m not against some of your ideas as you are now presenting them, but you really have not addressed my criticisms of what you presented to AGU.
I agree that what you carelessly call saw tooth is frequently found in nature if you are in fact referring to step displacement and an exponential decay
Here’s one now:
http://i48.tinypic.com/ay7z2s.png
This is the same area that is the basis for PDO. This is more like a (non repeating) saw tooth than one of its sinusoidal harmonics you are kinda , kinda not attributing to PDO.
Since much of global temps look like this on all time scales, there would be a good case for doing something similar to a sinusoidal Fourier analysis using such exponential wave forms. You will recall it was I who posted the autocorrelations plot showing 62y repeat period in AMO and I who stressed that this did not imply a sinusoidal form. It is you who is fitting sine waves.
However, having started out with the saw tooth (which is an exponential) and having found that there is ZERO fundamental distorted, 4th and 5th and nothing higher, the obvious conclusion is that you are not in the presence of a saw tooth. Yet you manage to conclude the opposite.
This is like saying you have found a 440 Hz tuning fork because you can fit 2nd and 3rd harmonics but the fundamental has got ‘totally’ damped.
Sorry this is absolute nonsense. I might buy attenuations of higher freqs but if you have ZERO fundamental your idea has no ‘fond’ or foundation.
I’m well aware of the mathematical identity : cosA + cosB = 2.cos((A+B)/2) .cos((A-B)/2) but this is NOT what you were presenting in your poster nor in it’s description article. Pretending now that that was what you were putting forward is just a desperate attempt to argue your way out of a corner.
I’m not against such propositions, Vukevic has been more successful than the official predictions of solar activity using such a model.
Sorry this is long but there’s just so much wrong with this presentation it takes some time to work through it.
Your AGW equation is full of circular logic as well. You use what you call the “prevailing” climate sensitivity of 2.98 C / doubling as a basic assumption. Yet this is derived by assuming that CO2 is main driver and that natural variations are non consequential “internal variation”.
This is not a free parameter , it is a given assumption.
This is not the “observed” climate sensitivity , it climate sensitivity displayed by failed climate models. Perhaps not surprising that your plot shows the same post 2000 problems, which you try to brush under the carpet as “filter” problem.
Then after all the hand waving and ‘baffle me with science” bit you end up “proving” CO2 is the main driver and attribute the bit that does not fit to unspecified “oceanic oscillations”.
This is just totally circular logic.
There’s another way to get this result more directly:
1. assume long term climate change is due exponential increase in CO2.
2. find the residual
3. fit a few sine waves to residual
4. arbitrarily attribute sine waves to ‘internal variation” of oceans.
5. predict out to 2100
6 OMG !
This is mathematically the same as what you have done .
You then try to give the impression that it must be correct because it is amazingly accurate, falsely claiming it is “within a millikelvin”.
An archetypical abusive comment from Web, as always suggesting a lack of confidence in his own argument, hence the need to spice it up – if such braindead low-grade, could be called spice, that is.
What, are you afraid to engage in real discussion? Science is a contact sport yet you are just heckling from the stands. It’s not my problem that Captain Clueless has never said one thing that has made any sense.
Did you not read that Dallas Salad he just tossed?.
My comment was clearly about the process of science, rather than the content. About which you clearly understand as little as why-should-I-show-you-my-data Jones (and those who won’t criticise him for it) do. Which is of course why you just ducked it.
Perhaps you’d care to regale us on exactly how abuse (“contact” in your propaganda-speak) advances the cause of knowledge ? Leavened with humour it could. But that is way, way beyond your pay grade.
Webster, What kind of dressing do you like on your salad?
https://lh3.googleusercontent.com/-bC0cuO2h2Kc/UGOxs3GU3AI/AAAAAAAAD80/1JDJnV_Ygz8/s925/Tierney%2520cycles.png
To me those look like weakly damped response curves and that reconstruction is from Africa, not the ODP1218 core. With paleo ocean data getting better, I would think you could track the propagation of a signatures like that and get a better feel for the dynamic time constants.
Since you have a fat tail and make the distinction between Dragon Kings and black swans, “Self-organized criticality is therefore a signature of quantumlike chaos in dynamical systems. The model provides universal quantification for selforganized criticality in terms of the universal inverse power-law form of the statistical normal distribution for the power spectra of spacetime fluctuations.”
and
“The ‘Elliott waves’ could be a signature of an underlying critical structure of the stock market (Sornette et al., 1995).” From Selvam
Unlike the stock market and instrumental record, paleo has a few million years of data that might help better define what those dragon kings are.
Right now SOC just means Pooh pooh occurs, big pooh poohs occur less frequently and the farther you are from the source of the pooh, the less likely the pooh gets on you. I would like to refine that a touch.
(With so many comments coming in it quickly became impractical to address them in chronological order. I’m replying to a week-old comment of GG’s.)
Sorry this is absolute nonsense. I might buy attenuations of higher freqs but if you have ZERO fundamental your idea has no ‘fond’ or foundation.
It’s a common misconception that, in a periodic or quasiperiodic signal of period 10 ms, the 100 Hz fundamental must be present. That period is common in male speech. Yet in order to pack more signals into a phone line the phone company filters out such frequencies and communicates only the higher harmonics of a male speaker’s voice. This is why phones sound more tinny than your stereo.
The miracle of the human auditory system is that it can fill in the missing fundamental and infer a 10 ms periodicity even in the complete absence of any spectral energy at 100 Hz. As I mentioned before, this phenomenon is at the heart of my student Keyvan Mohajer’s Ph.D. thesis, which developed an algorithmic theory of how to infer the periodicity (and hence the fundamental, i.e. pitch detection) from the available harmonics. This inference can be quite difficult depending on which harmonics are available. The case with the least computational complexity, treated explicitly for illustration in his thesis, is precisely the case we have here of having the second and third harmonics present in full strength (“full” in this case meaning for a sawtooth) and no fundamental at all.
I’m well aware of the mathematical identity : cosA + cosB = 2.cos((A+B)/2) .cos((A-B)/2) but this is NOT what you were presenting in your poster nor in it’s description article. Pretending now that that was what you were putting forward is just a desperate attempt to argue your way out of a corner.
Why would it come up in either the poster or the article? You were the one insisting the signal was not a sum of 50 and 75 year periods but one 60 year period, which I then had to address. However thank you for doing so as I now realize others may have the same thought. It may therefore be worth addressing in the paper, space permitting.
Your AGW equation is full of circular logic as well. You use what you call the “prevailing” climate sensitivity of 2.98 C / doubling as a basic assumption.
What did you suppose I meant by “prevailing climate sensitivity” in the poster? Did you equate it to “equilibrium climate sensitivity?”
The belief that “climate sensitivity” is a single notion is widespread but fallacious. Different definitions can give quite different values for it. It is essential therefore to state which definition one is using.
Yet this is derived by assuming that CO2 is main driver and that natural variations are non consequential “internal variation”.
Correlation is not cause. I’m not inferring a cause, I’m merely pointing out a correlation.
One hypothesis about global warming is that it is the result largely of increases in CO2 and H2O in some proportion as yet undetermined. A strong feedback between the two will naturally result in a strong correlation between them. We have far more data about increasing CO2 than increasing water vapor, hence if we want to test this hypothesis by looking for a correlation between global warming and the combined effect of CO2 and H2O, a correlation with CO2 alone is more feasible than one involving water vapour. And the closer the correlation found if any (between CO2 and global warming), the more plausible the hypothesis of the joint effect of CO2 and H2O.
Which still leaves us completely in the dark about how that labour is divided between them (and for that matter with other candidate correlates like methane). Your complaint that I’m implying that CO2 is the main driver, at least in a direct sense, is unwarranted. However thank you for bringing it up since this too should almost certainly be addressed in the paper, at least briefly.
[Climate sensitivity] is not a free parameter , it is a given assumption.
Well, to be more precise it starts out as a free parameter, which I subsequently estimate in the course of testing the poster’s hypothesis.
The scientific method can be illustrated with Newton’s expression GMm/r^2 for universal gravitational attraction. We can view this as a hypothesis in its own right with a free parameter G. But how would you test this hypothesis? One way would be to vary M, m, and r independently and observe the variation in gravitational attraction. This method has the benefit of not requiring any knowledge of G This could be done by suspending two heavy balls near each other. However G is so tiny that for any sizes of M and m that one could vary in practice, the gravitational attraction is likewise so tiny as to make its measurement to any reasonable accuracy extraordinarily difficult. So instead we estimate G and test the hypothesis against astronomical data.
A similar thing happens with my poster’s task of testing the hypothesis T = s log(b + exp(t − d)) applied to recent climate. One way of testing it without estimating s itself would be to vary b, d, and the (presumed linear) scale of t (two parameters) and study the behavior of a GCM. But GCMs are predicated on a geophysical understanding of the planet complete enough for the requisite accuracy, limiting the plausibility of such a test to those accepting that article of faith. My poster is addressed especially to those who might not be willing to accept that GCMs have a geophysical basis sufficient for the purpose of testing the poster’s hypothesis.
Just as Newton’s law of universal gravitation is most easily tested against astronomical observations, which we are in no position to vary ourselves, so does my poster test its hypothesis against modern climate observations, which likewise we are in no position to change. Estimating climate sensitivity s then becomes a necessary step in the test.
This is not the “observed” climate sensitivity , it climate sensitivity displayed by failed climate models. Perhaps not surprising that your plot shows the same post 2000 problems, which you try to brush under the carpet as “filter” problem.
Actually it’s the observed climate sensitivity as defined by the AHH law and observed in the HadCRUT3 data as detrended and filtered per my poster. This could be quite different from other definitions of climate sensitivity. In particular there is no reason why it should be related to the sensitivity obtained from any GCMs, “failed” or otherwise.
If one wants to see a minimal parameter model on a climate science topic, you ought to look at my fit of excess atmospheric CO2 ->
http://theoilconundrum.blogspot.com/2011/09/fat-tail-impulse-response-of-co2.html
This model only has two adjustable parameters, an effective Fickian adjustment time for CO2 sequestration time, and the baseline for CO2 concentration prior to the oil age. This is chosen as 290 PPM.
And I basically got the Fickian adjustment time from a one parameter fit to a multi-parameter BERN curve.
The fixed input stimulus was the carbon emission time series from the CO2 analysis center, starting way back in the mid-1800’s
The resultant curve was simply a convolution of the carbon emissions with the one parameter impulse response describing sequestering behavor.
This simple function explains the fact that half the CO2 appears to get sequestered with the other half remaining in the atmosphere.
This is no big deal, because all it does is confirm already SETTLED SCIENCE, ha ha. I only point it out to show that one can indeed get ridiculously good fits based on pretty much fixed empirically determined physical parameters.
Furthermore, there is no need for any filtering in the excess CO2 model because the signal-to-noise ratio is very high. I wouldn’t go near recent temperature time series because the signal-to-noise ratio is too small. The noise in temperature time-series is way too strong for my tastes, and can see what kind of ambiguity a filter can produce. But if Vaughan or Tamino or whoever else wants to take it on, fine by me.
WHT, I’ve seen your CO2 treatment before, very thorough.
It would be interesting to compare to other temp time series. You model shows GISS jumping ahead after 1998, I recall there was some dubious “adjustments” done around that time that sneaked in a little extra warming under the cover of the strong El Nino event.
It would be worth seeing how other records compare. They all have their short-comings but linking back to other physical data like this can be a good way of spotting sampling issues or dubious “bias corrections”.
Any mention of GISS is incidental to the main model. Within the noise level of the co2 signal, one can detect seasonal influences due to outgassing but that is second order and rides on top of the first order anthro-based co2 response.
You may have misinterpreted the main point.
WHT
Wow! That’s quite a piece of work and it looks very good for the past evolution of CO2 concentration.
Now to the future.
It is anticipated by most sources that human population growth rates will decrease sharply from the very high exponential rates seen in the second half of the 20th century.
UN has a mid-range estimate of 10.5 billion by 2100, which would represent an exponential growth rate of 0.46% per year from today, whereas we saw an actual rate over the past 25 years of 1.35% (from 5 billion in 1987 to 7 billion today).
Tying future CO2 growth to population growth would be dicey, since per capita fossil fuel consumption has risen in the past (by around 20% over the past 30 years).
If we assume that, despite economic and environmental pressures to reduce fossil fuel consumption, the world-wide per capita rate still increases by 50% by 2100, we end up arriving at a concentration by 2100 of around 600 ppmv.
This seems reasonable to me. Using the very simplified exponential increase rate of 0.5% per year as observed over the past two decades, one arrives at the same approximate level.
What level would we arrive at using your correlation?
Does your correlation for the future take into account a sharp downturn in population growth rates over this century?
Thanks for responding.
Max
”@vaughn and the CO2 blanket”
What kind of ”blanket” is CO2, that’s only 270-400ppm; and the holes on his blanket are 998999ppm. That’s a ”fishnet” not a blanket. Vaughn, I wish I would be given a chance; to ask you 101 questions, when you are on a witness stand, under oath.
When 97% of a blanket is missing; is a postage stamp, not ”blanket”!!!
Pratt, you cannot avoid real questions, forever. Sleep with it: 97% of your ”blanket” is missing; I have the advice; where is gone, to pull it out; Start thinking about the crimes / rip-offs committed already, and in progress; ALL BASED ON THAT NON-EXISTENT BLANKET! Think fast Vaughn, day and night. There isn’t a single normal greenhouse, with 97% of the roof missing!!! .Only the Warmist mafia has a greenhouse with fishnet as a roof. Mother of all CON!!!
Fine, call it a CO2 fishnet if it makes you happy. Doesn’t change the underlying principle one jot. And what matters here is changes to the fishnet.
Memphis | December 10, 2012 at 12:34 am said: ”Fine, call it a CO2 fishnet if it makes you happy. Doesn’t change the underlying principle one jot. And what matters here is changes to the fishnet”
Memphis, are you dumb about everything; as much as about the climate?
CHANGING FROM BLANKET-> TO FISHNET; for you doesn’t have any meaning?! They were selling you fishnet as a blanket – for you; lies like that is O.K? You have underlying principal.., do you really know: ”what the underlying principal” is?? BLANKET KEEPS WARMTH / FISHNET DOESN’T!!! You need assistance from a shrink, not from Myrrh.
Memphis > Fine, call it a CO2 fishnet if it makes you happy. Doesn’t change the underlying principle one jot. And what matters here is changes to the fishnet.
STD> CHANGING FROM BLANKET-> TO FISHNET; … They were selling you fishnet as a blanket – for you; lies like that is O.K? You have underlying principal.., do you really know: ”what the underlying principal” is?? BLANKET KEEPS WARMTH / FISHNET DOESN’T!!!
Since clearly neither you nor Myrrh have grasped the relevant difference in the blanket and fishnet analogies, let me explain : it is merely a question of degree, not of type; a fishnet keeps in less heat than a blanket. But still more than zero.
Which refers to the fact that CO2 is a well-mixed trace gas, ie the ‘blanket’ is less dense, ie is of a threadbare/fishnet variety. It does still though still exist.
Stefan, doubling CO2 raises the surface temperature by the same amount no matter how much CO2 there is.
If that’s the case, what difference does it make whether the CO2 is 100 ppmv, 1000 ppmv, or 10000 ppmv? Doubling it will always have the same effect no matter how little or how much there is.
Moreover if there is very little then doubling it is a lot easier than if there’s a lot. So actually having a little is worse than having a lot, not better.
Vaughan Pratt | December 10, 2012 at 4:19 am asked: ”Stefan, doubling CO2 raises the surface temperature by the same amount no matter how much CO2 there is”
Vaughn, I was asked similar question by Mosher; looks like that trick must be working on some people;.. lets we talk reality; listen very, very carefully:: 1] CO2 effect is soo minuscule, maybe immeasurable; BUT, to better understand, lets incorporate water vapor as well – so: quadrupling the effect, is more visible: when is more of them in the atmosphere -> upper atmosphere gets warmer – on the ground, days are cooler / nights warmer. The effect from CO2 itself is smaller, BUT exist! B] cooler days / warmer nights ===or hotter days / colder nights = is not global warming, or cooling! Reason monitoring only for the hottest minute in 24h, is the biggest con. because in extreme climate as inland OZ, the extremes cancel each other. BUT, must monitor temp for every minute in 24h, to realize that
2] to use the answer what I gave to Mosher: ”if you put an elephant on one side of the scales — on the other 280 flees; then double the flees – as experiment, quadruple the flees, put 1000 of them / (1000ppm CO2) Would the flee’s difference in number tip the scales?! O&N 998999ppm = overlooking the ELEPHANT in the room…!!!
3] Wind (O&N) are cooling the surface, not CO2 === vertical winds are shuttling the collected heat directly trough your phony ”blanket” which is actually a ”fishnet” for very big fish / big, big holes – and are personally taking the heat further up and wasting it. The angel CO2 has being turned into a bogyman. 10000 will not tip the balance, against the elephant. As long as there are the heat shuttles O&N – play any doubling of CO2.
Q#2: ”So actually having a little is worse than having a lot, not better”
A#2: ”having extra CO2, is better for the trees / crops. b] moire CO2 increases condensation = as rainmaker, gets read of humidity -> increases evaporation = evaporation is cooling process -> more evaporation -> more clouds as sun umbrellas – more rain – more raw material for replenishing the ice on the polar caps and glaciers. AS long as there is plenty of O&N, no worries!!! (burning natural gas is depleting oxygen, but the con that burning gas is good, but not coal; is another crime)
Vaughn, start asking real questions like those; doubling / quadrupling of CO2, that’s for the nutters. BUT, the chain reaction, the domino effect from misleadings, are grotesque. so, when I’m talking law / justice… if you only know 10% of the damages done because of the phony global warming crap… Climate can be improved, BUT, is not; because H2O controls the climate, not co2!
Memphis | December 11, 2012 at 3:20 am said: ” it is merely a question of degree, not of type; a fishnet keeps in less heat than a blanket. But still more than zero”
Memphis, I’ve explained to you; but cannot do the understanding / thinking for you…
CO2 as ”fishnet” intercepts minuscule amount of sunlight – so small, that’s not worth writing home about it.
2] intercepts it, 6-7-8km high up, during the day – which means: a bit LESS radiation comes to the ground! simple, see
3] at that altitude, mountain climbers on Himalayas, at summer / in the tropics have fingers amputated from frost bytes. Cooling there is very, very instant. Tell those people: to have double fishnet, instead of clots, when climbing.
The issue is: if CO2 up there, is not as glass on a sealing of greenhouse / is NOT as a blanket – but as ”fishnet” with big, big holes; lets warmed O&N on the ground; to go trough, to go up and waste the heat. can you grasp: the size of holes on the fishnet and the size of O2 and N2 preventing them of getting trough and up?!
By the way: warm CO2 goes upwards also!! Hot air balloon, after flying for 0,5h, CO2 inside is over 20000ppm, but still lifts half a ton upwards.
try to use some logic, try to use your own brains; nobody can pour knowledge with a funnel into the globe on your shoulders… Merry Christmas!
Memphis it is merely a question of degree, not of type; a fishnet keeps in less heat than a blanket. But still more than zero
Stefan [non-responsive reply – absolutely no attempt to address the point; falls back on pompous appeals to his own authority and unconvincing unrelated “explanations”]
Response to Dr. Pratt’s Earth core oscillations and AMO</b)
Dr. Pratt is here a bit behind the ‘latest research’
The AMO (64 year) in the Atlantic ocean is no product of any sawtooth signal, but interaction of solar and Earth’s magnetic fields.
Solar coronal mass ejections – CMEs hit the Earth with a leading edge that is magnetized north, they open a breach and load the magnetosphere with plasma starting a geomagnetic storm .
Arctic atmospheric pressure responds directly to these changes in the geomagnetic field.
Electro-magnetic induce currents in the polar region disturbing circulation in the liquid conducting magma, which is reflected in the Earth’s magnetic field. Since the poles are on the central cylinder of thermal convection (here Dr. Pratt may have misunderstood Hide and Dickey work, to which I’ve been referring in my posts for some time now, widely discussed on the web with another researcher of the ‘LOD-climate-solar’ Paul Vaughan), it takes about 15 years to propagate to equatorial cylinder of thermal circulation, etc….(and vice versa for the angular momentum changes).
My first article on the subject (published Sep. 2009) states refers to convection in the underlying mantle (as reflected in changes of the area’s magnetic intensity) are making significant contribution to the Atlantic basin climate change.
Since than much more work was done (Vukcevic), snippets of which are all over the internet, some of it is condensed in the latest article published Sep 2012 (copies forwarded to Dr. J.C. Curry- Gtec, Dr. Leif Svalgaard – Stanford, Dr. R.J.Brown –Duke Univ., Steven Mosher (BEST project) and T. Brown – climatology historian.
Here you can see the general idea :
http://www.vukcevic.talktalk.net/EarthNV.htm
see also
http://judithcurry.com/2012/12/04/multidecadal-climate-to-within-a-millikelvin/#comment-274609
I am looking forward to the new ideas from the ‘competing research’ by Dr. Pratt
Bold control was incomplete.
Response to Dr. Pratt’s Earth core oscillations and AMO
(there are number of typing errors in my post above, I’ll attempt to remove some)
Dr. Pratt is here a bit behind the ‘latest research’
The AMO (64 year) in the Atlantic Ocean is no product of any sawtooth signal, but interaction of the solar and Earth’s magnetic fields.
When solar coronal mass ejections – CMEs hit the Earth, if the leading edge is magnetized north, they open a breach and load the magnetosphere with plasma starting a geomagnetic storm .
Arctic atmospheric pressure responds directly to these changes in the geomagnetic field.
Electro-magnetic forces induce electric currents in the polar region disturbing circulation in the liquid conducting magma, which is reflected in the Earth’s magnetic field. Since the poles are on the central cylinder of thermal convection (here Dr. Pratt may have misunderstood Hide and Dickey work, to which I’ve been referring in my posts for some time now, widely discussed on the web with another researcher of the ‘LOD-climate-solar effects’ Paul Vaughan), it takes about 15 years for disturbances to propagate to the equatorial cylinder of thermal circulation, etc….(and vice versa for the angular momentum changes).
My first article on the subject (published Sep. 2009) refers to the convection in the underlying mantle (as reflected in changes of the area’s magnetic intensity) is making significant contribution to the Atlantic basin climate change.
Since than much more work was done (Vukcevic), snippets of which are all over the internet, some of it is condensed in the latest article published Sep 2012 (copies forwarded to Dr. J. Curry- Gtec, Dr. L. Svalgaard – Stanford, Dr. R.J.Brown –Duke Univ., S.Mosher (BEST project) and T. Brown – climatology historian.
Here you can see the general idea :
http://www.vukcevic.talktalk.net/EarthNV.htm
see also
http://judithcurry.com/2012/12/04/multidecadal-climate-to-within-a-millikelvin/#comment-274609
I am looking forward to the new ideas from the ‘competing research’ by Dr. Pratt
Vaughan Pratt | December 9, 2012 at 5:49 pm |
@David Springer: global warming from CO2 is delivered prefentially over land, high latitudes, in the winter
“Springer infers this from the fact familiar to all beach dwellers and sailors that daytime inland temperatures are higher. This inference overlooks the cooling effect of the oceans, which are a much more effective heat sink than the continents. There is no physical reason why radiative forcing due to CO2 should be stronger over land than sea, as annually averaged CO2 is distributed equally over both.”
Once again your lack of depth in natural sciences comes to the fore. Water responds to downwelling infrared by evaporating without any rise in temperature. Rocks can’t evaporate so the only way for them to shed the energy is by getting warmer.
It’s hard to imagine someone in your position not astute enough to even think to look into the physical differences and radiative responses of materials so fundamentally different as a rocks and water. Yet here your density is recorded and preserved for posterity.
No. It does not. The DWIR affects evaporation only through temperature, there are no other mechanisms of any significance.
The top millimeter of the ocean is cooler than the water below it. When you can explain that you will have explained how evaporation can occur with no rise in temperature. Increased evaporation leaves the surface cooler not warmer than it was before. The appropriately named “cool skin layer” of the ocean is there because of it. If a breaking wave disturbs that skin layer it reforms within 10 seconds.
Even so it’s a temperature effect.
If the skin would not be in close contact with the lower layers it would warm as fast as land areas. Evaporation is just one form of heat transfer. The heat taken by that is brought soon back in condensation. It does not disappear.
Oceans warm slowly because there’s so much mixing that the effective heat capacity is large and the present net energy flux cannot heat such a heat capacity faster.
As usual Pekka is reliably correct in the clutch while Springer is whiffing while always trying to go for the home-run. Get a grip, man.
“No. It does not. The DWIR affects evaporation only through temperature, there are no other mechanisms of any significance.”
Why do you state all that with such certainty? Is it sufficient for you to say something for it to be true? Sadly, you understanding is lacking.
Evaporation happens one molecule at a time (as does photon absorption). Temperature is a statistical bulk property.
Statistical variations in individual molecules’ energies account for evaporation occurring well below 100 deg C.
Molecules absorbing photons at a depth of 1mm will likely loose that energy to the bulk by molecular collision. Those very near the surface will be more likely to evaporate.
Due to wind and convection, when condensation happens a lot of this vapour will be a several thousand feet!
Maybe you should think before making such bold affirmations. If thinking doesn’t work, try reading.
Greg,
My statement is close enough to full truth to fit here. I have actually written several more nuanced comments on the same issue before – and you may perhaps see from the answer of David that he remembers those comments but chose to make his own statement while he cannot contradict the message.
There’s practically always more IR emission from the thin layer than absorption (in exceptional cases the air might be so warm that the opposite is true). Both emission and absorption occurs for all wavelengths at an average depth of at least thousand molecular distances from the surface and for most LWIR at depths of tens of thousands molecules. The molecules at the surface are very much more likely to receive the energy needed for breaking the hydrogen bond from neighboring molecules than directly from the radiation. The energy spectrum of the DWIR is also similar to the energy spectrum of the molecular kinetic energy.
David Springer | December 10, 2012 at 7:51 am said: ”Increased evaporation leaves the surface cooler not warmer than it was before. The appropriately named “cool skin layer” of the ocean is there because of it. If a breaking wave disturbs that skin layer it reforms within 10 seconds”
Springer, your ”half truth” is typical for most of the Fakes: it ”suppose” to be a “cool skin layer” reason the runner / athlete sprinkles mist of water – the hotter he / she is – > the more it cools. BUT, you have to learn to use bigger part of your brains; to be able to see the broader / complete picture!!! ::
That ”cool skin layer” of yours; is not disturbed by the waves – but sinks deep down!!! Repeat after me: -”evaporating molecule takes lots of heat from the molecule next to it -.> that makes the ”next molecule” colder by many degrees, than are the other surface molecules -> its temp becomes closer to 4C (SHRINKS) and becomes much heavier than the other surface molecules that the molecule next to them didn’t evaporate -> because becoming heavier -> sinks deep down ==== because was on the surface, had oxygen attached to it – that’s how the Springer’s “cool skin layer” is actually SINKING and delivering oxygen deep down to the critters that need it.
(where is more water converted to around 4C at the surface – is the best place for fishing!!! because of the propaganda: most of the seawater, for big part of the year is oxygen depleted; not enough, to sustain many varieties of fish == but molecules cooled on the surface to around 4C = all the fish are there; but don’t tell anybody)
@DS: Yet here your density is recorded and preserved for posterity.
“Your”? Not “our”?
You have some magic way of erasing your contributions?
Vaughan Pratt | December 10, 2012 at 4:19 am | Reply
“Stefan, doubling CO2 raises the surface temperature by the same amount no matter how much CO2 there is.”
That is approximately correct at ~300ppm. It is not correct at much lower concentrations where absorption efficacy increases linearly rather than logarithmically.
You really need to stop relying on your gut or hearsay or wherever it is you’re getting your information and begin approaching as if you were engineering something out of unfamiliar materials. Garbage in, garbage out.
And even then it’s only approximately correct at 300ppm for a black body. Black bodies don’t respond to radiation by evaporating. You probably knew that but the toy model of the earth you hold in your head doesn’t incorporate that bit of knowledge.
@DS: That is approximately correct at ~300ppm. It is not correct at much lower concentrations where absorption efficacy increases linearly rather than logarithmically..
“Much lower?” Much lower than what? The HITRAN tables for CO2 line spectra indicate logarithmic dependence even down to 30 ppmv, a level that planet Earth has never experienced in 4 billion years.
You really need to stop relying on your gut or hearsay or wherever it is you’re getting your information and begin approaching as if you were engineering something out of unfamiliar materials
“You”? Not “we”? (Sorry if I sound like a cracked record.)
And even then it’s only approximately correct at 300ppm for a black body.
“Approximate” how? You mean like off by 0.001% or what? Facts please.
Most logarithmic behaviors are a result of a model of a system that is best described as
f(x) ~ ln (1+k*x)
This has the asymptotic behavior of appearing as a logarithm for large x and as a linear function for small x.
Run Wolfram Alpha with a Taylor’s series generator to see this:
http://www.wolframalpha.com/input/?i=series+ln%281%2Ba*x%29
How does this come about? well one way to get this behavior is to integrate a hyperbolic function over a range:
Vaughan Pratt | December 9, 2012 at 5:49 pm |
@David Springer: global warming from CO2 is delivered prefentially over land, high latitudes, in the winter
“Springer infers this from the fact familiar to all beach dwellers and sailors that daytime inland temperatures are higher.”
Interesting. You infer my inferral.
You infer wrongly. I didn’t infer the distribution of positive temperature anomalies. I got them from GISS.
Perhaps you might benefit from a little less inferring and little more familiarity with the primary data.
The following is a good place to start. If a picture is worth a thousand data points an animated map of the globe showing evolving temperature anomalies from 1880-2011 is worth a thousand pictures.
http://data.giss.nasa.gov/gistemp/animations/
IPCC agrees with me in this case too. The following are projected global temperature anomaly maps for years 2080-2099 one each for winters and summers.
http://jeb.biologists.org/content/213/6/855/F3.large.jpg
It can clearly be seen that there is far greater temperature increase in winter vs. summer, land vs. ocean, and increasing with latitude in general.
You boys that are on the consensus bandwagon should probably know what’s on the bandwagon. I’m here to help.
I didn’t infer the distribution of positive temperature anomalies.
Correct, that was the premise for your inference that “global warming from CO2 is delivered prefentially over land” etc. It was that inference I was complaining about, not the premise from which you inferred it, which was that daytime inland temperatures are higher. The GISS is a fine authority for that, no objection there.
vukcevic | December 10, 2012 at 7:18 am
The AMO (64 year) in the Atlantic ocean is no product of any sawtooth signal, but interaction of solar and Earth’s magnetic fields.
Electro-magnetic induce currents in the polar region disturbing circulation in the liquid conducting magma, which is reflected in the Earth’s magnetic field.
Both of these claims are false
Dr.S
Stanford is a great university, the second best in the USA (after Cal-tech), but that doesn’t preclude anyone else looking at the data and finding what the Stanford’s old guard (Dr. Svalgaard, Dr. Pratt and may be few others) have not bothered to look for .
http://www.vukcevic.talktalk.net/EarthNV.htm
I presume you have by now dissected Dr. Pratt’s analysis too, we are expecting your verdict.
What do you make of it on the scale 1-10?
Vaughan Pratt | December 9, 2012 at 6:18 pm | Reply
“It certainly will for me. If 2010-2020 doesn’t warm I’m afraid it’s back to the drawing board for my analysis!”
Your stock just went up in my book. I’ll have to reconsider mine in that time frame too if warming resumes. The approximate 60-year sinusoidal AMDO was due to crest and reverse beginning in about the year 2000. By 2007 it looked to me like it had slowed and possibly peaked. As of today… well sir global average temperature has been in rapid decline since 2010 and the rate of decline is alarming. I don’t expect that rapid decline to continue but if goes on for 10 more years at the rate of the last 3 years it would be good idea to invest in companies that build snow moving equipment.
(is going to do. I don’t trust proxies and instrument records all that much before the satellite era for providing reasonably precise global average surface temperature. Not to hundreths of degrees and with increasing credulity the further back in time. Models are built and tweaked to produce agreement with the reconstructed temperature record. So even with perfect skill they are no more accurate than the reconstructed temperature record they were designed to reproduce from theory. To be frank yours is pretty damn good and I don’t disagree in principle. I believe the global average temperature reconstruction from beginning of industrial revolution through present is not precise to the neccessary few tenths of a degree needed to support a sensitivity of 2.88. I believe the oceanic mixed layer
All computerized fits to long-term climate trends, his included, ignore the existence of breakpoints where physical conditions change. They attempt to fit a universal curve which is entirely possible with enough free parameters and questionable assumptions about poorly understood “cycles,” imaginary phenomena like volcanic cooling, and unjustified smoothing practices. Breakpoints within the last 100 years include 1910 (sudden change from cooling to warming), 1940 (sudden WW II cooling), 1976 (step warming) and 1998 (super El Nino and step warming). One must not fit any computerized curve that crosses and ignores these boundaries. Plus, regional temperature differences like Arctic warming must not be included in the global temperature pool. Arctic is actually the only part of the world that is still warming thanks to warm Gulf Stream water carried into the Arctic Ocean by North Atlantic currents. Call it an exception that proves the rule. By the way, 2010 is a bad year for temperature comparison because it happens to be the peak year of the 2010 El Nino. For evaluating temperature trends you must use the average of the El Nino peak and its neighboring La Nina valley, in this case the bottom of the 2008 La Nina. When you do that this average lines up neatly with the rest of the twenty-first century trend.
vukcevic | December 10, 2012 at 11:02 am
that doesn’t preclude anyone else looking at the data and finding what the Stanford’s old guard (Dr. Svalgaard, Dr. Pratt and maybe few others) have not bothered to look for
Your claims of the physical mechanisms are not valid and do not follow from the spurious correlations you find.
I presume you have by now dissected Dr. Pratt’s analysis
He needs to make an experiment that I suggested to him at AGU. Then we’ll see.
All experiments have to be verifiable by repetition
come on doc
Don’t be so mysterious, we want to know, don’t we?
What is the experiment?
Apply his filters to the sunspot number and to the heliospheric magnetic field
Dr. S.
Thanks, I’ll ask Mosher to have a go. I think the sawtoot idea is a bit dodgy too.
So how did it work out with Mosher?
Re: CO2 as the “climate control knob”
The “pause” in warming has only been since the end of 1997, so only 15 years.
“Too short” to mean much (Ben Santer says it takes “17 years”).
But, hey, it may only have been 15 years, but in those 15 years:
– humans emitted 31% of all the CO2 they have EVER emitted, and the
– human contribution to atmospheric CO2 was up 36% (from 83 to 113 ppmv)
Yet temperature did not increase.
What happened to the “control knob”?
(Is the thermostat broken?)
Max
“What happened to the “control knob”?
Too soon to panic (if you’re a control-knobhead), but not too soon to start a serious rethink.
I don’t rethink so.
Natural variation, a roller coaster, is riding on rising ship. You’ll still get that sinking feeling.
Vaughan Pratt | December 10, 2012 at 11:13 am |
You may be overlooking the possibility that something that superficially looks like a 62-year period might actually be an amplitude-modulated carrier with that period
wrong !
AMO’s 62 (its actually closer to 64) year period (can be easily shown) is direct result of interaction between the solar and the earth’s magnetic oscillations.
http://www.vukcevic.talktalk.net/GSOc.htm
A couple of questions that assume that the quasi-sawtooth is in there:
– Do you guess that the sawteeth are periodic or simply random single-tooth events? Have you had a look in any longer reconstructions for teeth?
– Your quasi-sawtooth is not immediatley recognisable as a sawtooth, so I am bound to ask; Do sawteeth often tend to decay into this shape?
@Chas: Do you guess that the sawteeth are periodic
If they were periodic one should expect to observe them as an amplitude modulated carrier at around a 60-65 year period (it would look closer to 60 if they were equal strength). There is some literature supporting this, for example Delworth and Mann 2000 analyze proxy based reconstructions of surface temperatures during the past 330 years and fnid a significant spectral peak in the 50- to 70-year band. This variability was named the AMO in the same year by Kerr, see Dijkstra et al 2006 on AMO physics for background literature.
Gray et al 2005 push Delworth and Mann’s 330-year analysis to 440 years; their Figure 2 is very interesting.
However even 330 years is not enough to distinguish between 2 teeth and 3. With only 2 there is no way to distinguish them from completely aperiodic events, other than inferring that the two most recent ones should be around 150 years apart.
Do sawteeth often tend to decay into this shape?
Great question, one that I’ve been asking myself a lot lately. It may be that the 3:2 ratio in both frequency and amplitude along with the phase matching is characteristic of some kind of spherical harmonic arising from the rotation of the core relative to the crust. I’ll have to look into this. Currently the hypothesis is rather feeble without that sort of corroborative detail.
It’s worth mentioning that the harmonics of any periodic signal are orthogonal over any integer multiple of that period. So a signal that really did consist of the harmonics of a sawtooth of period p could be uniquely analyzed into those harmonics given a p-year time series.This is made easier when the global warming trend AGW can be subtracted and signals unrelated to the sawtooth removed somehow, e.g. by filtering.
If there was a one off event such as an undersea eruption that warmed the ocean enough to leave a .5c rise on the temp record, should your warming due to CO2 graph, restart at a point .5c higher and then continue its climb? If such an event took place, why would the temp then subside, or not continue to rise, in a world of rising temps caused by the constant and increasing effect of CO2? How does your graph match HADCRUT3 Southern Hemisphere (50%of the planet) or SH + tropics, 70% of the planet?
There is a 1200 year reconstruction but I don’t have a link to the full paper and I couldn’t find one.
http://meetingorganizer.copernicus.org/EGU2010/EGU2010-13508.pdf
“If there was a one off event such as an undersea eruption that warmed the ocean enough to leave a .5c rise on the temp record, should your warming due to CO2 graph, restart at a point .5c higher and then continue its climb?”
It should if the theory mad any sense.
But much heat would it would require?
Since stipulated a sudden event rather than constant undersea eruptions
are occurring all the time, we assume fast transition of heat from ocean floor to surface. And therefore not be talking about heating the entire ocean but can limit to the surface of entire ocean.
We want to know how much energy is require to warm say 10 meter of surface of entire ocean. Or limit further to a significant portion of the ocean that would effect average global temperature the most.
It seems to me the biggest affect would ocean in temperate regions.
And I recall the southern temperate are receiving more solar energy.
So let’s center it at the location of the Island of Gough:
“Gough Island is roughly rectangular with a length of 13 km (8.1 mi) and a width of 7 kilometres (4.3 mi). It has an area of 91 km2 (35 sq mi) and rises to heights of over 900 m (3,000 ft) above sea level.”
http://en.wikipedia.org/wiki/Gough_Island
Which began forming into a island about 2 million years ago with final major eruptions in island formation occurring about 150,000 years age.
There may impressive mountains on Gough, but island rose from sea floor about 3500 meters:
http://web.uct.ac.za/depts/geolsci/dlr/pdf/maund%20rex%20leroex%20reid%201988.pdf
So it’s in location I like, and it certainly possible as already happened- and fairly recently:) But one could probably find examples.
The ocean area of Earth is 360 million square km. 1/2 is around tropics and this will pool reaching the tropics and over southern Africa. Say around radius of 20 degree latitude/longitude, so more 2000 km in radius. Or about 12.5 million square km. Which pretty insignificant- bigger than US, but less 3% of ocean but more than 10% of Southern
temperate ocean.
So 12.5 million times 10 meters. Or 125,000 cubic km of water.
Or almost boil 1000 cubic km of water.
Entire island is about 400 cubic meter of rock and it was lava.
Stone: 0.84 and water: 4.2
rock is twice density and 700 to 1200 degrees C
So eruption creating Gough island roughly the size of eruption needed.
@robt319: If such an event took place, why would the temp then subside, or not continue to rise, in a world of rising temps caused by the constant and increasing effect of CO2?
This is a great question.
Assuming superposition, these processes play out independently, with the net effect being their sum. If CO2 forcing is insufficient to offset this cooling effect, then cooling will result. Likewise warming if the converse is true.
How does your graph match HADCRUT3 Southern Hemisphere (50%of the planet) or SH + tropics, 70% of the planet?
Good suggestions. However I’ve been focusing on multidecadal climate, so a better question would be whether these more regional datasets are significantly different on a multidecadal timescale. Quantifying this seems like a great project, thanks for proposing it!
Sawtoot idea is misleading.
There are two well recognized AMO reconstructions Mann (before he went to Yamal) and Gray. I just used geo-solar magnetic oscillations and have shown that is a perfectly good fit for the AMO, except for the Dalton min, when the climate base proxies were suppressed to negative by two major volcanic eruptions Mayon and Tambora .
AMO reconstructions link
http://www.vukcevic.talktalk.net/AMO-recon.htm
vukcevic | December 10, 2012 at 12:11 pm | Reply
wrong !
AMO’s 62 (its actually closer to 64) year period (can be easily shown) is direct result of interaction between the solar and the earth’s magnetic oscillations.
Not so. Just keep repeating it does not make it so.
Dr. S. you have the data, you have access to my calculations (pages 5 & 6), so do Dr. J. Curry, Dr. R.G. Brown, S. Mosher), the result is here:
http://www.vukcevic.talktalk.net/GSC1.htm
As you can see it is very close to the AMO, and even closer to the N. Hemisphere’s temperatures which (btw) are more accurate.
Anyone can produce a closer approximation?
I doubt it.
Coincidental?
Possible but not likely.
Dr. S your visit here is appreciated. Thanks.
vukcevic | December 10, 2012 at 4:33 pm | Reply
Dr. S. you have the data
Your Solar-Geo data is not described, but in any case your various attempts to sneak some ‘physics’ into the mix are all way off the mark [as we have discussed enough times that no more is needed].
Following lsavalgaard’s idea of experiments:
I have just generated some time series based on an ARMA model of (non-detrended) Hadcrut3. A good 30% of them might be mistaken by the man in the street for a real global temperature series. How about testing fake ARMA series in the spreadsheet to see how often they appear contain sawtooths etc.?
Excellent suggestion! But it would be preferable to test them by someone hoping to see more rather than fewer sawtooth waves. It is easier to say nothing was found, as Sir Bedivere did the first two times when Arthur asked him what he saw when he threw Excalibur into the lake. He had to be really pushed to find something.
That would be informative. Don’t you have Excel to try this yourself?
If not post the data somewhere , preferably with the model that allows reproduction. I’m sure someone will be able to collate it into Excel in place of hadCrut3.
Since the spreadsheet provided is hard-coded with 2.98 C / doubling , it will almost certainly fit a result that ramps off to OMG by 2100.
Assuming your model has similar variability to hadCrut3, such an exercise will be an interesting demonstration of whether the 1% residual is anything interesting.
One caveat will be that Vaughan has pre-selected some of the model parameters to fit the data. He explains this in one of his replies above.
What you need to do to reproduce his method is fit the 2.98 C / doubling model, find out what is left, then fit two cosines with all parameter free. Once you have most of the residual captured by two cosines, make up some pretext for “locking” the frequencies so that you can reduce the parameter count. If this can be matched to the 3/2 ratio it would be nice but any waveform that does NOT match ocean oscillations will do since the saw tooth model is totally arbitrary anyway.
Then use more free parameters to model the remaining residual.
Anyway, an interesting first step would be to just dump the ARMA data into the spreadsheet. Please post some data and/or how you generated it.
@gg: Don’t you have Excel to try this yourself?
Yes, but if I find nothing (as I expect) people will just say “confirmation bias.” The search for sawtooth waveforms needs to be done by those claiming there’s lots of them in random data.
@gg: the saw tooth model is totally arbitrary anyway.
Not totally arbitrary. If stress accumulates at a boundary between the inviscid mantle and either the crust or the core, any resulting seismic event will cause a sudden temperature change followed by a slow return to equilibrium. This sequence creates a sawtooth. How is that “arbitrary?”
@gg: Since the spreadsheet provided is hard-coded with 2.98 C / doubling
News to me. Is there a specific climate sensitivity cell containing 2.98? The default value for CS is 2.83, but the slider is there to make it very easy to try other values, which I certainly wouldn’t call “hard-coded.”
@gg: One caveat will be that Vaughan has pre-selected some of the model parameters to fit the data. He explains this in one of his replies above.
It’s more than just that. I’m claiming that this selection of the nine parameters is a local minimum. I put the sliders in to make it easy for people to play around with this.
As I said earlier I don’t claim it’s a global minimum. In fact I rather doubt this after looking around a lot. Although a Hansen delay of 15 years did look like the minimum value possible, I’m starting to think it’s more like 9 or 10 years. It seems to me the whole question of global minima is up for grabs. Measuring Hansen delay from just HadCRUT3 is a more delicate operation than I’d originally given it credit for.
Apologies to Vaughan for the confusing, my comment was aimed at Chas.
If you have some ARMA data that behaves similarly to hadCrut3 please make it available somewhere, preferable with the formula to reproduce similar output.
greg, I have put 20 HadCrut ARMA1,1 series in a .csv:
https://dl.dropbox.com/u/97672676/HadCrut%20ARMA%20npd.txt
I will give you a recipe for creating your own series.
Some ARMA series will increase in temperature and some will decrease, so I have selected out those that have a slope of greater than 0.003 C/yr so as to make them generally similar. This was done WITHOUT looking at their shape first, just to be fair!
I have come across a bit of an issue with the sawtooth sinewaves, they do not appear to be in the 3:2 wavelength ratio that I was expecting, from Vaughans preamble.
With ToothWSlider set to 1000 (100 years) I get:
Saw1 97.8 years
Saw2 49.6 years 50.7% of 1
Saw3 33.22 years 67.% of 2
Saw4 24.98 years 75.2% of 3
Saw5 20.01 years 80.1% of 4
Maybe it is my fitting of them or perhaps I misunderstand something. Unfortunately I am a bit of a numpty when it comes to proper excel stuff so I cant get to see the formulae that generate the waves.
@Chas: I have come across a bit of an issue with the sawtooth sinewaves, they do not appear to be in the 3:2 wavelength ratio that I was expecting, from Vaughans preamble
Chas, PAST gave you Saw2 as 49.6 years and Saw3 as 33.22 years. 49.6/33.22 = 1.493. I agree this is not exactly 3:2, but what precision were you expecting here?
P. Solar says: Since the spreadsheet provided is hard-coded with 2.98 C / doubling
This may not be correct. The panel states this as the first assumption of the model but the text suggests is it a least squares result. Unclear.
Who is P. Solar, and what panel contains 2.98?
Vaughan Pratt | December 11, 2012 at 4:42 am
1. Headline claim of “within a millikelvin” is false.
Oh come on, that’s ridiculous. I’ve already explained what I meant by “within a millikelvin,” it’s only false if you replace it with your own interpretation.
P.S >> You have “explained” what you meant on blog post but that does not alter what was , and is , the title of your graph the you presented to hundreds of AGU members. What you chose as the title remains false. But yes it is ridiculous of you to chose such a title if you “meant” something else. <> I did not say if preferable or not. If you would like to compare SD of you residual to SD of the data, do so and tell me if it is substantially different. I said it would not be substantially different from the 1% figure. That’s twice now that you reply with your SD get-out without actually showing how your chosen SD metric compares. Yet more supposed replies that do not address the issues raised.>>
3. Claims that the fitted frequencies correspond to oceanic oscillations is totally without foundation. Another false claim.
On the contrary, the false claim is you saying it’s without foundation. You are completely ignoring my points about thickness of crust under the ocean etc, as well as the frequencies.
PS>> You have hand-waving comments about possible filters affecting a totally undocumented event that you state is pure speculation .
None of that has any bearing on your false claim that the frequencies you found corresponded to ocean oscillations. That remains unfounded and remains a false claim. <> NO. An unproven ad hoc, hypothesised relationship is called just that. Law is strong word that is used to imply the certainty that accredited to a theory. Physical Laws are usually called laws once the theory they propose has been thoroughly tested and accepted. Now it seems you want to redefine this usage rather than admit you over-rated your unproven ad hoc, hypothesised relationship.<> OH, so if Santer says something it must be true. QED. In fact it’s 16 now, so next year is going to have to be a scorcher to turn around the result of the last 16 years. But I suppose you will go on denying reality until next year then you’ll find someone who said we need 18y before it “matters”. <<
There’s more, but I think that is enough to show that this poster is not more than that, a poster.
Seems to me you need stronger arguments than that. Your arguments are at the level of those used to shoot down the heliocentric theory of planetary motions, tectonic plates, quasicrystals, and so on. They substitute rhetoric for logic. Science moves forward without the help of people like you.
P.Solar. << In that comment your are of course doing exactly what you accuse me of: substitute rhetoric for logic. Having presented nothing but hand waving and evasion in response to technical points, you now resort, in effect, to calling me a flat-earther.
Brilliant Professor , absolutely brilliant.
@GG: I said it would not be substantially different from the 1% figure.
To put this more precisely, you’re saying (if I understood you) that the standard deviation of the residual is 1% of that of the data.
Since variance is the square of standard deviation, and since 0.01 squared is 0.0001, this is the same thing as saying that the R2 is 99.99%.
I only claimed an R2 of 99.98%. You are now protesting that I should have claimed an R2 of 99.99%.
In fact you are quite correct, the spreadsheet says quite clearly that the R2 is 99.99%. I don’t know how I screwed up there, but clearly I lied when I claimed the R2 was only 99.98%.
So sue me.
Physical Laws are usually called laws once the theory they propose has been thoroughly tested and accepted. Now it seems you want to redefine this usage rather than admit you over-rated your unproven ad hoc, hypothesised relationship.
I wasn’t proposing a physical law but a mathematical one. A mathematical law is nothing more than a relationship between variables.
But yes it is ridiculous of you to chose such a title if you “meant” something else.
I did not mean “something else,” I meant exactly what I said I did. Your argument is a straw man. A straw man argument is one that accuses someone of saying something they did not.
Problems so far with this poster presentation.
1. Headline claim of “within a millikelvin” is false.
2. The range of residual is of the order of 10mK comapared to +/-0.5 in the data. This is about 1% residual. Shouting about millikelvins gives the false impression that the result amazingly accurate. “Within 1%” would not have the same effect. Excuses about ” I really meant SD” will not change this.
3. Claims that the fitted frequencies correspond to oceanic oscillations is totally without foundation. Another false claim.
4. References to a mythical “Arrhenius-Hoffmann-Hansen Law”. This is an ad hoc formula, not an established “law”. Calling this a law gives the false impression it is a well-established and accepted relationship. Misrepresentation.
5. False accounting in the number of parameters used. Pre-fitting some of the params , which VP has clearly stated above he did as a first step, then “locking” them does mean they are not fitted params. It is just done is two steps.
6. Dismissing the deviation at the end as being a “filter” problem is misleading. The real reason for the divergence is that the DATA for the last 15 years DOES NOT FIT a model dominated by a 3 C / doubling model. This is a well known problem and such models have grossly failed to capture climate variation. Trying to sweep this under the carpet by pretending it is a filter artefact is disingenuous and misleading.
There’s more, but I think that is enough to show that this poster is not more than that, a poster.
1. Headline claim of “within a millikelvin” is false.
Oh come on, that’s ridiculous. I’ve already explained what I meant by “within a millikelvin,” it’s only false if you replace it with your own interpretation.
The range of residual is of the order of 10mK.
The standard deviation is 0.5 mK for 1850-1950. What substantive point are you trying to make here by insisting that I must have meant range instead of standard deviation? Why is range a preferable measure to standard deviation?
3. Claims that the fitted frequencies correspond to oceanic oscillations is totally without foundation. Another false claim.
On the contrary, the false claim is you saying it’s without foundation. You are completely ignoring my points about thickness of crust under the ocean etc, as well as the frequencies.
Calling this a law gives the false impression it is a well-established and accepted relationship.
I have no idea where you got that. A law is simply a relationship between variables.
False accounting in the number of parameters used.
If you start out with a 50 parameter model and your realize that all 50 of them are simply functions of 2 variables, at that point the model collapses to 2 parameters. It does not continue to be a 50 parameter model. If you believe otherwise please explain why.
The real reason for the divergence is that the DATA for the last 15 years DOES NOT FIT a model dominated by a 3 C / doubling model.
As Santer et al have pointed out, the data for the last 15 years is meaningless.
There’s more, but I think that is enough to show that this poster is not more than that, a poster.
Seems to me you need stronger arguments than that. Your arguments are at the level of those used to shoot down the heliocentric theory of planetary motions, tectonic plates, quasicrystals, and so on. They substitute rhetoric for logic. Science moves forward without the help of people like you.
That last sentence should have read “Science moves forward without the help of this sort of misplaced criticism.” I was unfairly inferring from too few examples that you make a practice of it. If that’s not the case my apologies.
However your refusal to accept that an amplitude modulated carrier (in this case with period 60 years) is the same thing as a pair of sidebands (in this case 50 and 75 years) does raise the concern that you might continue to raise misplaced objections to technical but sound reasoning.
One major problem with trying to suggest the climate is dominated by human CO2 emissions is that period of most rapid 20th c.growth was precisely the period when global temperatures fell !
http://i50.tinypic.com/2n83l1d.png
If we increase the Hansen frig factor to 30ys to fix this we see the coming 30 years will be “dominated” by a rate of increase that “causes” global cooling as was seen in the post WWII period.
A more reasonable approach would be to freely fit all the parameters and the result of that has already been established in the literature by N. Scafetta.
Notably , his model has proved remarkably good in predicting the last decade. In contrast , models such as this one, dominated by CO2 totally fail (unless you pretend that failure is a filter artefact).
@greg goodman: One major problem with trying to suggest the climate is dominated by human CO2 emissions is that period of most rapid 20th c.growth was precisely the period when global temperatures fell !
Whoa! You just totally disqualified yourself as a serious commenter here by appealing to the temperature decline in 2000-2010.
What you’ve failed to take into account is that every “even” decade since 1880 has declined relative to the two “odd” decades on each side. (An even decade is one whose years have an even third digit, e.g. 2000-2010 is even because the third digit of its years is the even number 0.)
This very interesting phenomenon can be verified at WoodForTrees.org using its linear trend option.
That 2000-2010 declined relative to 1990-2000 is completely consistent with the previous six such instances of an even decade both following and preceding odd decades.
At every even decade starting with 1880 one could forecast that global warming had halted on the basis of that decade having cooled relative to the previous decade.
At all of them save the decade starting with 2000 one would have been wrong.
Lots of luck with your hope that the decade 2010-2020 won’t increase sharply over 2000-2010. That would be a first since 1880. Sounds like wishful thinking to me.
VP – I think he’s talking about the period 1944 to 1974: mid-20thC cooling. Look at his graph.
“Whoa! You just totally disqualified yourself as a serious commenter here by appealing to the temperature decline in 2000-2010.”
I have not “disqualified” myself and you will not do so either. You obviously made that comment without reading what I said or looking at the graph I linked.
I did not “appeal” to anything and I did not suggest a “temperature decline in 2000-2010.”
“What you’ve failed to take into account is that every “even” decade …”
You spent of lot of effort designing a filter to remove such variations, now you want to suggest they are still there. Remarkable.
Your arguments get more and more contrived.
Good luck with explaining why the log slope of 1944-1974 period, being about 3 times that of the preceding and following periods, corresponds exactly to a 30 drip in temperature.
Actually, we are in the cool phase of the PDO, soon to be in the cool phase of the AMO. The previous similar period was 1946-1964, a period that stayed pretty flat.
Hi Judith, without getting into pointless discussion of “how much”, the hadCrut3 data in the poster definitely shows some cooling in that period, which I why I made that comment. It is “flatter” that the notable rises either side that correspond to periods of much slower exponential growth.
That simple underlines the problem with idea that CO2 is the major driver here.
regards, Greg.
Vaughan
I have found the entire discussion very interesting and in particular the interplay with Greg has been fascinating.
I am not sure I agree with your hypothesis summarised here;
“That 2000-2010 declined relative to 1990-2000 is completely consistent with the previous six such instances of an even decade both following and preceding odd decades.”
Global temperatures are a real mish mash and it woud be interesting to judge your comment against real life single series temperatures to see if it stands up, whereby it can be seen that some areas of the world have not followed the warming trend but their cooling signal has been smothered by a warming one, probably from the thermometers placed in newly urbanised areas.
The ‘odd and even’ hypothesis doesn’t seem to work with CET for example. Perhaps even more interesting would be to test that hypothesis against individual months or more practically seasons. Again, looking at CET it goes all over the place during the four seasons during the odd and even decades .
Decade long climatic shifts however undoubtedly exist-in fact I am working on an article about them-and sometimes one decade bears no relationship to the decade preceding or following it. The ‘saw tooth’ effect is very noticeable here, rather than a gentle upwards or downwards drift.
As for where the general trend goes, it is evident there has been a long warming trend since 1760 with one slight downward period which otherwise interrupts the upward trend since 1700.
tonyb
JCH is right, I should have realized GG was talking about the 1950s decline instead of that of the last decade. My comprehension skills fall off sharply at 2:30 am. :( Very sorry about that, Greg.
@climatereason: The ‘odd and even’ hypothesis doesn’t seem to work with CET for example.
One can get a good idea why from my plots of the Hale octave (centered on the 21-year period) that Leif posted on on his research page. These are for respectively the sunspot numbers since 1750 (SSN), the heliospheric magnetic field since 1835 (HMF), CET since 1659, and the Hadley-CRU global land-sea temperature since 1850 (HadCRUT3). These are obtained simply by applying F3 and F3′ (essentially F3 shifted up an octave in frequency) and extracting the middle band. Tony’s point can be addressed with just the last two, the green and blue curves.
For HadCRUT3 the peaks occur reliably at multiples of 20 years (quite a coincidence!) except near the ends, which as Greg points out are unreliable regions when filtering. Figure 9 of my poster shows a more steady amplitude, due to removing SAW by subtraction instead of by filtering. Now the blue curve is F3′(HadCRUT3 – F3(HadCRUT)), and F3(HADCRUT) is within MRES of F3(SAW) + AGW since F3 is linear and Figure 3 shows that F3(AGW) is essentially AGW except near the end. Hence the filtering implicitly subtracts AGW and F3(SAW) and frequencies above (periods below) the Hale octave. F3(SAW) is sufficiently different from SAW to account completely for the vertical movement of the peaks in the blue curve relative to poster Figure 9, though the difference is too low in frequency to significantly move the peaks horizontally. Other than this impact of SAW – F3(SAW), the blue curve is quite clean.
The Hale curve for CET (green) is impressively clean between 1659 and the early 19th century, but starts to become pretty random thereafter. This is hardly surprising given that the area of CE is only about 0.01% of that of the planet while its population-technology product must be at least 0.1% of that of the planet if not 1% during the 19th century. Whereas the planet as a whole receives only the global impact of climate change (by definition), CET receives that and the local impact of a one-or-two-orders-of-magnitude increase in population x technology / area relative to that of the whole planet.
So while CET can be expected to track global temperature (Lamb’s thesis), this is somewhat masked by this additional regional climate change, as reflected in the transition from regularity to chaos in its Hale curve around mid-18th century (one reason for preferring HadCRUT3 over CET in identifying multidecadal components of climate change for recent centuries).
On that basis I would not expect CET to show the odd-even-decade coincidence that has been occurring so reliably in HadCRUT3. And since the Sun is (presumably) not phase-locked to decades, phase drift will easily erase or even reverse this coincidence.
However the relative cleanliness of the first half of CET Hale suggests that natural variations may be more visible in that portion of CET. On that basis I could put a little more faith in Milivoje’s correlations between CET and other phenomena for the first half of CET than for the second (and yet more with some improvements to the physics!).
As for the CET and the geology it is indicative of a correlation:
http://www.vukcevic.talktalk.net/CNA.htm
The CET responds to the Icelandic Low, its footprint is found in the most climatic events of the N. Hemisphere. The strength of the Icelandic Low is the critical factor in determining path of the polar jet stream over the North Atlantic
In the winter the IL is located at SW of Greenland (Subpolar Gyre)
In summer the IL is to be found much further north (most likely the North Icelandic Jet, formed by complex physical interactions between warm and cold currents)
These two run under two different regimes and two clocks (see the CET synthesis from 3 harmonics, one for each summer and winter, and one common – see the above link, bottom graph).
Both areas are locations of the strong ocean surface-atmosphere interactions.
http://oceanservice.noaa.gov/education/pd/tidescurrents/media/effect_influences_4.gif
One of the good reasons why we have
http://www.vukcevic.talktalk.net/MidSummer-MidWinter.htm
which made fools of Grant Foster (masquerading as Tamino), Daniel Bailey (ScSci) and Jan Perlwitz (NASA)
Dr. Pratt, as you can see it shouldn’t be matter of fate, but matter of data available to anyone.
Judith said:
“Actually, we are in the cool phase of the PDO, soon to be in the cool phase of the AMO. The previous similar period was 1946-1964, a period that stayed pretty flat.
Exactly so, and all the more reason that as we slip into a cool PDO/cool AMO/quiet sun (based on sunspots) period we will get a chance to compare the strength of this potential negative forcing on tropospheric temperatures versus the positive forcing from continued GHG increases. Given that the global atmosphere of 2013 does not equal the global atmosphere of 1946, nor does the ocean heat content of 2013 equal the likely ocean heat content of 1946, all these factors combined make the next few decades among the most exciting times to be studying the climate and the relative anthropogenic effects theron.
Quite right, couldn’t agree more.
Dr Pratt performed the experiment I suggested. The result [which I extracted from the spreadsheet he kindly provided] is here: http://www.leif.org/research/Pratt-Experiment.png
Some comments:
1) that the Sunspot Number SSN shows a ’22-year cycle’ is not surprising as high and low cycles often alternate [we don’t quite know why]. That creates power at twice the cycle length
2) that the Heliospheric Magnetic Field HMF shows the same cycles as the SSN is not surprising as the SSN is the source of the HMF. There is a good correlation HMF nT = 4 + 0.29*SQRT(SSN) which is understood theoretically
3) the CET temperature shows weak 22-yr cycles not correlated with the solar ones
4) the HadCRUT3 temperature shows weak 22-yr cycles not correlated with any of the above
Thanks, Leif. It should be mentioned that all these 22-year cycles that have been observed lack the clean sinusoidal shape of the HALE plot in Figure 9 of my poster. This afternoon I tried generating this shape simply by filtering HadCRUT3 with F3, and it came out very ill-defined, typical of the usual experience.
What made HALE in Figure 9 so clean was subtracting SAW. (Subtracting AGW made no difference.) The reason seems to be that, unlike AGW, SAW contains periods below 40 years, which F3 does not pass 100% of. A better filter than F3 could reject more of SAW, but almost certainly at some loss of temporal resolution.
When SAW is subtracted before applying F3, the frequencies of SAW that F3 partially blocks do not matter. However if SAW is not subtracted then its higher frequencies corrupt the otherwise clean HALE plot. This corruption is clearly visible in the blue curve (HadCRUT3Hale) in what Leif posted just now, which is nowhere near as sinusoidal as HALE in Fig. 9 of my poster.
At last year’s AGU Fall meeting I showed this clean HALE curve to NCAR’s Stanley Solomon. He prefaced his remarks with “If it’s real,” which I took to mean that those like Solomon and Svalgaard who study the Sun have never seen such a clean 21-year sinusoid.
The key to producing it was to remove SAW. It’s a good question where to go next from there.
@lsvalgaard | December 11, 2012 at 4:31 am (just above): 4) the HadCRUT3 temperature shows weak 22-yr cycles not correlated with any of the above
Yes, the Hale cycle from HadCRUT3 in that plot of mine you posted is a bit ragged. However the version of the HadCRUT3 temperature cleaned up as described immediately above, namely by subtracting SAW from HadCRUT3 before extracting the Hale cycle, yields the mch cleaner upper (orange) plot in Figure 9 of my poster. Its last five extrema (peaks and troughs), starting with the trough in 1970 and seemingly about to end with the trough shortly, line up to within a year or so with the crossings you show at http://www.leif.org/research/Solar-Polar-Fields-1966-now.png .
Unfortunately observation of these crossings apparently only began in 1966, so there is no way of telling whether the alignment was as good any earlier, or whether this is just a pure coincidence. As the decades go by this should become clearer.
Note to the two Stanford old cronies
CET is responding to geological movements along mid-Atlantic ridge, the data-graph I’ve shown many times (North Atlantic precursor). This has long term similar response as the average SSN but not on the individual cycle scale. Reason the Earth’s interior.
http://www.vukcevic.talktalk.net/CET-NAP-SSN.htm
Lot of knowledge at Stanford.
Some outsiders may have the lesser knowledge but the more incisive intuition
http://www.vukcevic.talktalk.net/EarthNV.htm
till next time
vuk, I find your work very interesting and I’m sure you are highlighting some useful correlations, however I’m often a bit frustrated that you never quite explain things enough for anyone (ie me) to reproduce take a closer look.
Just as an example in the second link above, fig 2 “corrected T” , corrected for what ? How?
Later N.H temps (de-trended) – why remove a linear trend? why not a quadratic or an exponential? Yeah, I know climate scientists do this sort of crap all the time, but that does not excuse or explain it.
Just saying , I often say, Hey this looks interesting but then find I can’t follow it up.
Hi Greg
According to Svalgaard of Stanford whatever I find in the data appear to be spurious. I occasionally do write a bit more, occasionally email it to Dr. S. and the Dr. Curry, she is very supportive, had offered space on her blog, but I prefer to do my own thing.
Despite the appearances, the Stanford Solar Supremo is very helpful too.
I often use integration or differentiation but if there is ‘power’ involved I do use the square law, as in this example:
http://www.vukcevic.talktalk.net/Ap-VI.htm
thanks for the reply. Glad to hear Lief is a bit more helpful than his public image would suggest, I’m sure he’s a smart guy.
That latest link is a prime example. There seems to be the possibility of a link, but NO data source, nothing. You say this is an example of you using square law but I would not have known that from your graph. That’s not the kind of detail you can leave off.
If I want to look at the derivative or try a filter or simply verify what you present before recommending it to someone else. No go.
I’d often like to send your stuff on to like minded colleges but until I can check it over and confirm it is sound I’m not going to be passing it on.
You can obviously play it the way you like, but unless it is reproducible, for me it is little more than a curiosity, which is a shame because you seem to come up with some good stuff.
regards
Here is a study on aerosols. See figure 1 which shows locations of greatest aerosol optical depth.
http://www.atmos-chem-phys.net/12/8037/2012/acp-12-8037-2012.pdf
Here is a map of the temperature anomalies from 2000 – 2010 using the 1990s as a base period.
http://data.giss.nasa.gov/cgi-bin/gistemp/do_nmap.py?year_last=2012&month_last=11&sat=4&sst=1&type=anoms&mean_gen=0112&year1=2000&year2=2010&base1=1990&base2=2000&radius=1200&pol=reg
There is no obvious correlation between temperatures and aerosols at the regional level. That makes it unlikely that global temperatures are at the mercy of said aerosols. This being only an eyeball study, if you have a real study that shows how they do affect global temperatures by affecting regional temperatures please share. If you have a study that shows they affect global temperatures but not the regional temperatures where they are located, please explain the magic that allows this.
The problem with your main point in this presentation is that it won’t filter out a long term trend in an alternative source of warming such as a trend in heat transport.
http://www.nature.com/ncomms/journal/v3/n6/full/ncomms1901.html?WT.ec_id=NCOMMS-20120612
Figure 5 is of interest here.
Steven, it is kinda funny that since aerosols and ocean circulation are so poorly understood, the no feedback CO2 forcing is the best understood tracer we have :) So Vaughan could reset his CO2 sensitivity to 1.0 and produce a pretty accurate range of uncertainty.
Webster and Vaughan, More of my world famous salad :)
http://redneckphysics.blogspot.com/2012/12/fractals-and-climate.html
It has pretty pictures.
VP says:
@gg: the saw tooth model is totally arbitrary anyway.
Not totally arbitrary. If stress accumulates at a boundary between the inviscid mantle and either the crust or the core, any resulting seismic event will cause a sudden temperature change followed by a slow return to equilibrium. This sequence creates a sawtooth. How is that “arbitrary?”
Vaughan. You propose the so-called saw tooth as having it’s cause in a massive seismic event that produced decadal scale warming on a planetary scale. First problem is that you do not point to evidence if either the event not any evidence of such a warming event from below. That much you agree is total speculation.
Then you remove the presumed fundamental of 150y. You arbitrarily set its amplitude to zero. At this point you have abandoned any pretence of this being the physical cause.
The only reason you were invoking this hypothesis (aka WAG) was because of the 2/3 ratio, but if you have to adopt ZERO fundamental, you no longer have any reason to support the idea of a saw tooth. In essence all you have are two cosine components.
You have a non existent event causing a non existent bottom up warming via a non existent fundamental plus two detectable cosines.
If someone like Tallbloke produces model with the speed of the barycentre plus the relative distance of Jupiter and Saturn, or whatever, he gets blown out of the water with calls of “numerology” from your college lsvalbaard.
At least the barycentre and those planets exist. Your suggestion which is not even at the level of hypothesis does not even have evidence that its supposed cause exists, let alone something fancy like data and a correlation.
On that basis, any rival model is free to adopt absolutely any form that is convenient.
“Arbitrary?” Any clearer now?
As I pointed out earlier , all you are doing here is fitting your assumed CO2 exponential and inventing a excuse to subtract what is left.
All the rest is an elaborate game of smoke and mirrors.
Vaughan says: “The standard deviation is 0.5 mK for 1850-1950. What substantive point are you trying to make here by insisting that I must have meant range instead of standard deviation? Why is range a preferable measure to standard deviation?”
Since you are clearly trying to avoid responding to this one as well by not stating the SD of the temps, the SD of hascrut3 is 0.44K
That makes a comparison of SD instead of range, in fact, slightly worse than the 1% I calculated based on range.
My point was the 1% , not what metric you chose to use, (though there was no suggestion in your title or caption that you were using SD). Pretending this was supposed to refer to SD is just another desperate attempt to avoid the issues.
You were clearly putting forward the “within millikelvin(s)” banner comments and title to suggest the result was so accurate it must be significant. You even chose it as the title of your poster.
My point was that “within 1%” would have sounded less impressive though it would have been more informative.
So “within a bit more than 1% (of std. dev.)” if you prefer.
In view of the LP filter being 1/6 of the length of the dataset and the number of parameters (whether it be 9 or 15) this kind of result is in no way remarkable.
“Within millikelvin” tells us nothing without something to compare it to. Had it been “within 1%” you would not have splashed it across the poster and put it in the title.
What you are engaging in here is spin , not science.
Spot on! “A multi-parametric decomposition of HADCRUT3” would be a far more honest title, but would lack the topical sex appeal.
Getting someone without professional qualifications in any branch of geophysics to grasp the keen difference between compelling physical evidence and conjectural curve fitting of a contrived index is often a fruitless endeavor, especially when trendy academic mindsets are involved. If anything, what VP may have discovered inadvertently here is the all-too-pat method of trend construction in HADCRUT3. This has precious little to do with bona fide climate metrics.
“A multi-parametric decomposition of HADCRUT3″ would be a far more honest title, but would lack the topical sex appeal.
I went back and forth on that. Sex appeal won out over boring for the poster version. For the journal version I’m considering “On the complexity of secular global climate.” Hopefully that’s boring enough for you. :)
That makes a comparison of SD instead of range, in fact, slightly worse than the 1% I calculated based on range.
Which when squared to give the variance ratio and then subtracted from 1 gives an R2 of 99.99%. In the poster I claimed only 99.98%. I should have been paying more attention to the spreadsheet where it clearly says 99.99%. (The 99.98% figure was from an earlier spreadsheet, I neglected to update the poster to reflect the latest version.)
Vaughan Pratt, thank you for your replies.
I am part-reposting this at the bottom as the threads are getting entangled:
I have run up against a bit of a curiosity:
With ToothWSlider set to 1000 (100 years) I get:
Saw1 97.8 years
Saw2 49.6 years 50.7% of 1
Saw3 33.22 years 67.% of 2
Saw4 24.98 years 75.2% of 3
Saw5 20.01 years 80.1% of 4
I am using the ‘PAST’ program to fit the sine waves.(Model->Sinusoidal);
http://folk.uio.no/ohammer/past/
I am a bit of a numpty when it comes to proper excel stuff so I haven’t been able to see where the sine waves are made (I am after free tuition too!).
I follow your point about testing but the main thing is to agree to some reasonable ground rules and then anyone can test.
Actually, I reckon that you have the right skill set.
Chas, all five harmonics are constructed with the same formula, SAWnty, which computes SAW_n(t(y)) (the n-th harmonic) as
Scalen * SIN(2*PI() * n * (t_y – tShiftn)) / n
You can find that formula in NAMES!B79. Scalen is defined at NAMES!B91, n at NAMES!B68, t_y at B96, and tShiftn at B112. These can also be found at Formulas > Name Manager in Excel 2007 and later, or Insert > Name > Define in earlier Excels.
PAST is simply discovering empirically (by fitting) that the n-th harmonic has period 100/n. The higher frequencies are fitted more accurately because there are more cycles for PAST to go on.
I am a bit of a numpty when it comes to proper excel stuff
Me too, this is my first nontrivial Excel spreadsheet. Usually I use MATLAB but for publication purposes Excel seemed preferable as more people would be likely to have it so I forced myself to learn Excel.
Vaughn Pratt
My view is that EXCEL is an idiosyncratic fully automatic Mace. Everyone recognizes and use it, though at many skill levels. But one can easily mince one’s self (really one’s numbers) in a flash and yet be totally unaware. But EXCEL flaming is passé. I have of a more pedestrian question: did you try your MATLAB program in Octave, and if so how did that go? Clearly in your presentation sequence here you have thought considerably about the tools, communication, and transparency, so I just wanted ask.
I’ve been curious about this for a while because some of us MATLAB is not a practical alternative, (I’ve used R for about 12 years and it is clearly exploded, but a lot of freshly-minted scientists and engineers debut with MATLAB experience. In the private (consulting) sectors software acquistion beyond MSOffice can be dicey and using EXCEL can be constraining at times.)
Thanks
PS Slightly further OT: You listed LISP first in your programming languages. If you were doing this just for yourself would there be any flickers of CL or scheme exercise temptations?
did you try your MATLAB program in Octave, and if so how did that go?
Oh yes. It went very well except for the plotting. The problem is that MATLAB and Gnuplot have very different ideals of perfection, making Gnuplot a suboptimal choice for the Octave emulation of MATLAB.
It would be interesting to talk to Stallman about how fixable this is, if he were interested. I found him hard to argue with in the 1970s (he and I were in 545 Tech Square then) but perhaps he’s mellowed slightly.
Other than the plotting my experience has been that Octave is a terrific emulation of MATLAB. YMMV as always.
If you were doing this just for yourself would there be any flickers of CL or scheme exercise temptations?
Not at all. Although I do have some old CL software I wrote in the early 1980s for surveying real estate which I still use even today, and some even older NLP LISP code (in particular LINGOL, see IJCAI 1973 and 1975, which was used in Tokyo for English-to-Japanese translation until the Lisp community there, e.g. Tanaka at ETL, was forcibly retired by Japan’s Prolog revolution).
However we CL fans are all going to die sooner or later and today I would say that anyone seeing a need for CL would do just as well or better with APL, their conceptual differences notwithstanding. Better yet, move on to Python.
VP > Stallman … I found him hard to argue with in the 1970s
Hard to believe …
Vaughn Pratt
Affection for LISP is a strange malady. One wants to use it and at the same time one doesn’t want to use it….but that is for another forum. For a variety of reasons I’ve grown to view language/application selection is part-and-parcel to problem solution–a topic to which institutions (particularly outside of academia) should pay more attention. Thank you for your perspectives here.
= = = = = =
Mike Jonas,
It looks to me that the circular logic you see existing in Vaughan Pratt’s poster is partly what MattStat/MatthewRMarler was expressing in his comment when he said,
I find what both MattStat/MatthewRMarler and you are saying about the errors of the Vaughan Pratt’s poster possibly relevant to the extensive discussions of the ‘Screening Fallacy’ that occurred over numerous posts first starting at Steve McIntyre’s CA blog and then later concurrently in posts at Lucia’s Blackboard. The errors both MattStat and you are mentioning wrt Vaughan Pratt’s poster seem to me to have fundamentally similar properties to what is known as the ‘Screening Fallacy’.
Here is a link to one CA’s early ‘Screening Fallacy’ posts. There are many subsequent posts on the ‘Screening Fallacy’ at CA.
http://climateaudit.org/2012/05/31/myles-allen-calls-for-name-and-shame/
Here is a link to one of Lucia’s early ‘Screening Fallacy’ posts. There are many subsequent post on the ‘Screening Fallacy’ at Lucia’s.
http://rankexploits.com/musings/2012/screening-fallacy-more-ways-to-mislead/
I wonder if there are at root similar properties in: 1) risks of errors discussed by MattStat; 2) your preliminary finding of circularity error; and 3) the idea errors created by the ‘Screening Fallacy’.
John
John – I had seen those two links, but the error by Vaughan Pratt is much simpler than the screening fallacy, and is pure circular logic. I will hope to get a ‘guest post’ up here, otherwise I’ll post as a comment – or anywhere else that will publish it!
Looking forward to the post, Mike, wherever it appears. I’ll be happy to respond in the same forum.
As Pekka points out I tend to be brief to the point of being cryptic. Responding with a longer post rather than a brief comment should allow me to go into more detail concerning the finer points of analysis, fitting, and filtering.
John, its not circular. Now if dr, Pratt were trying to prove AGW it would look circular. But he is not. AGW is true and doesnt need proof. What he has done is something quite different.
Actually what I’m doing is assuming AGW is true and fitting parameters. If AGW is not true then the parameters are meaningless, but if it is true then these are best esimates of those parameters under reasonable hypotheses of why AGW is true, e.g. the blanketing effect of CO2 and the time needed to warm the ocean’s surface layer.
Indeed Vaughan, you are doing what I call AGW science, or in Kuhnian terms normal science based on assuming the AGW paradigm. Most climate science being done now is AGW science.
Steven Mosher,
This is all interesting, n’est ce pas? : )
Two points:
First – On a general level, not specifically related to Vaughan Pratt’s poster, I am inclined to think that epistemologically there is a common / root concept shared by the concepts of the circularity fallacy, the screening fallacy and the statistical procedure biasing errors that Mattstat mentioned.
Second – Specifically about Vaughan Pratt’s poster one may ask are his premises, data selection, logic and methods tailored to only find selectively what he maintains ‘a priori’ and discards things not included the ‘a priori’? That kind of error in my view would put him in any of the three error concepts mentioned in point #1. It looks to me like he has made an argument for an ‘a priori’, so there is more to talk about. As this discussion continues on various blogs (I think it will) then im may become clearer.
John
“AGW is true and doesnt need proof.”
AGW is false and doesn’t need proof.
Andrew
Vaughan Pratt: Actually what I’m doing is assuming AGW is true and fitting parameters.
That’s one of the alternatives I described.
Steven Mosher: AGW is true and doesnt need proof.
It doesn’t even need evidence, does it?
AGW is true and doesn’t need
proofevidenceI can hear Feynman turning over in his grave.
As I pointed out to Mosh, Vaughan’s analysis is basically OK for the past, but sucks for the future because it ignores two overriding constraints: human population growth rates and total available fossil fuels.
@manacker: “As I pointed out to Mosh, Vaughan’s analysis is basically OK for the past, but sucks for the future because it ignores two overriding constraints: human population growth rates and total available fossil fuels.”
I try not to make predictions, they’re too hard, especially when they’re about the future. (Apol. YB)
Max lists some future scenarios but conveniently ignores
(i) the developing countries inheriting Western Civ’s legacy. The number of cars on the planet could double long before the population doubles. Cars produce much more CO2 than people breathing.
(ii) melting permafrost. Methane has a way higher global warming potential than CO2.
For such reasons the greenhouse effect is especially hard to predict.
Vaughan Pratt
Yes.
The “number of automobiles per capita” will probably continue to increase as poorer nations develop. So will electrical power generation.
But to ignore the population growth rate in making a long-term prediction is foolish.
Ignoring the fact that fossil fuels are finite is also foolish.
I’ve pointed this out to you in more detail below, but will repeat the key points:
-population growth is expected by all estimates I’ve seen to slow down sharply to one-fourth to one-third the past rate
– all the fossil fuels on this planet by optimistic WEC estimates contain just enough carbon to get to ~1000ppmv CO2 when they are all gone
So to predict that human produced CO2 will continue to grow at the past rate and will reach the absolute maximum ever level of 1000 ppmv by 2100 is a lousy prediction.
Leave it out of your paper and I have no problem with it (others may disagree).
But if you leave it in, I’ll conclude that it is a lousy prediction made by someone who is ignoring the outside world and is simply fear mongering.
Max
Vaughan
Don’t switch subjects by tossing out that old bogeyman, methane from permafrost.
Your poster ties it all to anthropogenic CO2.
Your 4.3C “prediction” by 2100 requires ~1000 ppmv CO2 according to your own formula.
That’s all the CO2 there is in all the fossil fuels on this planet, Vaughan.
Use your head.
Stick to the past analysis, but don’t try to make predictions for the future without considering all the constraints.
Otherwise you just look silly.
Max
Estimates of fossil fuels that are recoverable are increasing annually. Wait till they start looking at methyl clathrates. Technology advances. This is something like Moore’s Law where technology allows the progress in speed of computers to maintain an exponential shape even over decades. Anthropogenic GHGs have had a doubling time near 30 years just to meet global population and development needs. I think this will continue. I will call it Gore’s Law (not that he had anything to do with it, but I like the rhyme with Moore’s Law.)
“Estimates of fossil fuels that are recoverable are increasing annually. Wait till they start looking at methyl clathrates. Technology advances. This is something like Moore’s Law where technology allows the progress in speed of computers to maintain an exponential shape even over decades. Anthropogenic GHGs have had a doubling time near 30 years just to meet global population and development needs. I think this will continue. I will call it Gore’s Law (not that he had anything to do with it, but I like the rhyme with Moore’s Law.)”
From 1937 to 1967 US CO2 emission more than doubled.
From 1967 to 1997, it went from 1007829 to 1500236:
http://cdiac.ornl.gov/ftp/trends/co2_emis/usa.dat
increasing 50%. From 1997 to 2008 CO2 declined slightly.
At 2012 it looks they will be below the 1990 level.
It seems a given that China will have a significant drop in CO2 levels, the only uncertainty related to how fast they can develop fracking.
Without even without fracking, China was “doomed” to lower there CO2 emission in the future.
It seems as soon as by say 2015 or so China may reach it’s peak level, which may take decades or never to reach again. India may take a bit longer- mainly due to India being less frantic in consuming fossil fuel.
And due to China being such large emitter of CO2, it could be that by 2015 to 2020 there is global peak in human CO2 emission, though I would expect global CO2 emission to regain their peak levels quicker than China, and generally increase modestly for next 50 years.
And largely due to fracking.
The potential huge supply of methyl clathrates may cause global enonomy to be based on natural gas rather than crude oil, and if so, further reduction in any possible increase of global CO2 emission.
No idea when this could kick in- maybe within 50 years.
vukcevic | December 11, 2012 at 9:28 am
Some outsiders may have the lesser knowledge but the more incisive intuition
“The Dunning–Kruger effect is a cognitive bias in which unskilled individuals suffer from illusory superiority, mistakenly rating their ability much higher than average”
vukcevic | December 11, 2012 at 2:07 pm |
According to Svalgaard of Stanford whatever I find in the data appear to be spurious
Some of what you call ‘data’ is not. It is made up.
vukcevic | December 11, 2012 at 6:13 pm |
As for the CET and the geology it is indicative of a correlation
Geology has nothing to do with CET, apart from the occasional super-volcano eruption.
Some of what you call ‘data’ is not. It is made up.
I assume you refer to Geo-Solar cycle:
It is combination of two sets of numbers
a) sunspot number as available from SIDC, world centre.
b) Periodic oscillation (Cosine function) as a component of the magnetic field at Earth’s core derived from data by Andrew Jackson(ETHZ) and Jeremy Bloxham(Harvard University)
Both sets of data are widely available to anyone.
Only thing I did is a simple arithmetic operation, and voila, the result is:
http://www.vukcevic.talktalk.net/GSC1.htm
whereby the ‘geo-solar cycle’ (combination of the Earth’s and solar) is moved forward by 15 years.
I suggest that neither of two sets of data is made –up.
If you say that I made up data by combining above two by using simple sum than I agree entirely, I am guilty of putting them together..
Would that be of any help?
I suppose not.
Because it would show that the solar oscillations is one of the two primary components in the natural process of climate change.
Stanford got the brains, but not much sense if they think that the solar factor can be excluded from what comes naturally….
Geology has nothing to do with CET, apart from the occasional super-volcano eruption.
I will paraphrase
Geology has nothing to do with CET in the eyes and minds of those who don’t understand either the CET or the geology of the N. Atlantic, or most likely both.
The second bit
from the occasional super-volcano eruption.
absolutely correct, the CET does suffer that misfortune.
Pleased to agree at least on something (science and pseudo-science shake hands). We are all friends now.
Science is at its best when the world’s science aristocracy is perplexed by the impromptu deeds of plebs.
Buy for now.
No, I wasn’t selling.
bye-bye
Vuk says: “Some of what you call ‘data’ is not. It is made up.
I assume you refer to Geo-Solar cycle:
It is combination of two sets of numbers…”
All this comes back to the comments I made to you earlier about the need to publish data sources on/with the graph. It’s no good explaining it in an unassociated blog post later, it should be on the graph or accompanying text.
That would make your work reproducible and avoid it being dismissed as “made up”.
lsvalgaard |
“The Dunning–Kruger effect is a cognitive bias in which unskilled individuals suffer from illusory superiority, mistakenly rating their ability much higher than average”
What is it called when skilled individuals suffer from the need to hide data from those that disagree with their conclusions, so as to maintain their illusion of superiority ?
The Climategate Effect ? The Jones Effect ?
lsvalgaard |
“The Dunning–Kruger effect is a cognitive bias in which unskilled individuals suffer from illusory superiority, mistakenly rating their ability much higher than average”
This does not mean that some “less skilled” cannot have insights of things overlooked by those wrapped up in the orthodoxy .
Sometimes a child can point us to something that should be staring us in the face but our preconceptions prevent us from seeing.
You can either slap the child and tell him not to be insolent, or see your mistake.
The opposite of Dunning–Kruger is expert group think. Both happen but their existence does not preclude a less killed person finding something useful.
Neither should anyone outside of govt. funded research be dismissed as “unskilled individuals [who] suffer from illusory superiority”, I’ve worked in university research and have seem plenty of people with PhDs that fit that description.
Yes there needs to be a fancy name too for the mental illness where *experts* overrate their own contributions.
You do seem to have a semantic problem here. Someone is an expert by virtue of his contributions being well above average…
Sure, but I took Mr B’s point to be that the expert shouldn’t be making that judgement, otherwise everyone’s contributions would be above average.
“Delusional” is one fancy name, though it doesn’t distinguish the case where those well below average overrate their own contributions. I kind of doubt there is a word that makes the distinction that finely.
Strange. I’m a non expert and I over rate Dr P and Dr. S.
Seems like we have a weird paradox.
Who is the expert on whether experts overate themselves or not and do those experts over rate themselves as the experts on experts.
Whew?
So we should all behave as if experts can simply be trusted and respected should we ?
So we should all behave as if experts can simply be trusted and respected should we ?
Who is “we all”?
There are three types of people: ground-breakers, experts, and laymen.
The ground-breakers invent new stuff and sometimes have a hard time convincing the experts. They tend towards heresy, which works best in moderation.
The experts are an interesting mix of progressives and conservatives with a deep understanding of the subject.
The laymen are an interesting mix of progressives and conservatives with at best an amateur’s understanding of the subject.
Basically the laymen should trust the experts, but take an interest in the ground-breakers, who will be right occasionally.
No, I think you have a logic problem here.
Having above-average contributions, and overrating those contributions, are not mutually exclusive conditions.
No, you have the logic problem and over rate your contribution on the discussion of experts.
Gosh this is fun and nearly fact free
A couple of years ago, someone used to post details of his research into a horse racing betting system on the Betfair (forum). He had no computer data base of results, so he had to go through the laborious task of back checking his system manually. He kept posting about how well his system was performing (in his back checked results), but whenever he had a few losing results (on paper), he announced adjustments to his system. These would always include either additional parameters, or different weighting (amplitudes) of his existing system. He justified this by saying that he was making his money making scheme even more efficient and productive.
Everyone could see through the fallacy of this approach and some even tried to dissuade him from continuing to waste his time on it. They suggested switching his computer off and trying to get more fulfillment from life.
It was constantly pointed out to him that he was “back fitting” his system to fit the results.
As far as I know, he never even had one bet as a result of his system. (Everyone assumed that this was because deep down, in his subconcious, he could see that he was deluding himself.)
But he carried on with this approach for several months, then wasn’t heard from again.
I am struck by the striking contrast between the attitude of the forumites at Betfair, who ALL saw the fallacy of such an approach, and the diversity of opinion of Dr Pratt’s research on here.
I respect Dr Pratt for coming on here and answering my questions (and other people’s too), although I can’t agree with any of it.
But Its the willingness of people on Climate Etc to criticize some of the finer points of his work, or trying to incorporate some of his ideas into their existing belief systems which I find puzzling. I can guarantee that if Dr Pratt’s poster was posted on the Betfair forum, it would find no support at all. The words “back fitting” would frequently be applied.
I put this down to the fact that gamblers have learnt the hard way: When its your money that is on the line, ones bullshit detector goes into overdrive.
Contrast that to the consequences of making a temperature prediction for 2100. The one thing certain about the year 2100 is that none of us adults is going to live to see it!
Mark B, What you wrote is very naive.
There is a significant difference between modeling a system that can react psychologically, i.e. any human endeavor such as gambling, and a system that is passive, i.e. a physics-based model of a system such as the earth’s climate.
To model a game, which is what gambling is, you will likely need to incorporate elements of game theory. Any model of the system will be used by the players to trip it up. This is known by various names such as the Lucas critique or Goodhart’s Law.
http://en.wikipedia.org/wiki/Goodhart%27s_law
To model a physical system, you need building blocks of the fundamental forces and of statistical mechanics and thermodynamics. None of the behaviors being modeled will attempt to game the system. That’s why what Vaughan Pratt is trying to do should be encouraged. He is not claiming to understand it all, but he is adding to the body of knowledge so that we can potentially get to that point.
Big difference between that and what your buddy was trying to do.
‘In 1963, Lorenz published his seminal paper on ‘Deterministic non-periodic flow’, which was to change the course of weather and climate prediction profoundly over the following decades and to embed the theory of chaos at the heart of meteorology. Indeed, it could be said that his view of the atmosphere (and subsequently also the oceans) as a chaotic system has coloured our thinking of the predictability of weather and subsequently climate from thereon.
Lorenz was able to show that even for a simple set of nonlinear equations (1.1), the evolution of the solution could be changed by minute perturbations to the initial conditions, in other words, beyond a certain forecast lead time, there is no longer a single, deterministic solution and hence all forecasts must be treated as probabilistic. The fractionally dimensioned space occupied by the trajectories of the solutions of these nonlinear equations became known as the Lorenz attractor (figure 1), which suggests that nonlinear systems, such as the atmosphere, may exhibit regime-like structures that are, although fully deterministic, subject to abrupt and seemingly random change.’ http://rsta.royalsocietypublishing.org/content/369/1956/4751.full
I guess they are all lauging at Tim Palmer and Julia Slingo too aye webnutcolonoscope? Hah hah.
I don’t agree with any of it either – the assumption of a perturbation and a return to equilibrium is simply wrong for a system with multiple equilibria of ‘regime like structures’. And the expectation of a return to warming any time soon simply invalidates the whole thing.
Hey, Larrikin tool, no one’s buying what you are trying to sell.
If you can’t understand the maths I really can’t help that. If someone prefers your nonsense to the reasoned views of leading scientists in the field – well you just can’t help some morons can you?
I side with the leading scientists in the field who realize that forcing functions will eventually win out over fluctuation wiggles.
You are no diiferent than your Aussie buddy Myrrhh in your repetitive nonsense.
Web : “I side with the leading scientists in the field who realize that forcing functions will eventually win out over fluctuation wiggles”
Absolutely top-notch evasion of the real question – ie, When?
There is no one answer to the question of why people believe weird things.
I can only say with certainty that these pranksters are likely actual Australians and not agent provocateurs working for Michale Mann. Chief Wiggles use of the term “maths” is a dead giveaway.
Unless he is an agent working for Phil Jones, ha ha.
The “when” you are asking about happened in the past, and long ago. The CO2 in the atmosphere prevented the earth from turning into a huge snowball and is a necessary ingredient to keeping our climate about 33C higher than the steady state black-body energy balance would indicate. Adding more CO2 to the atmosphere will not make the climate colder, as that is away from an energy minimum. QED,
I can repeat the preceding paragraph ad nauseum on this comment site and would turn into a kind of Captain Kangaroo, albeit one that is on the right side of physics.
Webster said, “There is no one reason why people deny things.”
True. Many deny that there are internal oscillation “wiggles” that have an impact on climate over undetermined time scales.
Take this post for example. Vaughan has fit a Saw tooth wave to the data with a estimation of CO2 forcing and produced a good fit. We all know that CO2 has an impact, what we don’t know is what actually causes the saw in the saw tooth. The AMO has an average period of roughly 62 years but can vary from ~50 to ~ 72 years. That implies a sum of two or more internal oscillation frequencies is producing the “pseudo-cyclic” SAW.
Just for grins I produced this “Golden Ratio” Sine wave. It is the sum of two sine wave where the difference in frequency is the ratio 1:1.618…
https://lh4.googleusercontent.com/-lw94R2ObThc/UMiQW7egdII/AAAAAAAAF8w/2DBLPB-__Vs/s823/golden%2520ratio.png
This is not a perfect match, just an illustration, but nature doesn’t produce many perfect 3:2 ratios, but if Selvam is right, this type of oscillatory pattern is quite likely in this system and all complex systems. If you don’t know what portion of the “Wave” you are on, your results will vary. Let’s call that Mr. Wiggles Law.
What Vaughan has done is shown that you can match just about any function with a combination of curves. That is not earth shattering news. However, the ratio of the sine waves required to reproduce the curves provides clues. I find the “Wiggles” interesting.
Now your overconfidence in your calculated rate of diffusion which starts at 15 to 21 C and ends at 2 to 4.5C with a likely 1700 +/- 500 year duration to an equilibrium that may never exist is puzzling to Mr. Wiggles.
vukcevic | December 11, 2012 at 7:28 pm | Reply
Science is at its best when the world’s science aristocracy is perplexed by the impromptu deeds of plebs.
Nobody is perplexed [it takes more than your made-up handiwork to do that]. For myself, I’m just trying to educate you [with no luck, it seems] as one would any wayward soul.
“Educating Milivoje Vukcevic.” That could work as the name of a Belorussian play. ;)
On both sides of the climate debate, those with a strong position either way tend to use the facts (as they see them) to debug logical arguments instead of vice versa. So whenever one side advances an argument, the other side looks for conclusions that don’t match “the facts” and then finds fault with the reasoning.
My experience as someone originally trained in physics but who made a career in logic has been that the fault-finding is often more illogical than the allegedly faulty reasoning. Debugging arguments turns out to be something the average person is not terribly good at.
So I don’t hold out much hope for “educating” either side in this debate when they rely on “the facts” to debug the opposition’s arguments.
I therefore don’t post or comment here in the expectation of changing the minds of the other debaters, whose minds are all clearly made up regardless of which side they’re on. They’re like the characters in a play whose lines were made up for them decades ago by the playwright, with only limited opportunity to ad lib.
Instead I’m assuming there are lurkers who don’t yet have an opinion either way but are interested in what each side has to offer by way of self-defense. Although I address my contributions to the debaters, who can be thought of as the actors on stage in the limelight, they are really intended for the audience out there in the darkness behind the limelight, who can make of them what they will.
I simply aim to be clear about what my position is and why.
Fault-finders find faults are clear. Critics say fault-finders are clearly at fault.
D’oh. I think I’m being too clear.
Vaughan Pratt: They’re like the characters in a play whose lines were made up for them decades ago by the playwright, with only limited opportunity to ad lib.
that’s me. My play wrights have written over and over that if you have a finite time series that has been studied for decades and modeled every which way, you can find a set of functions that fit it almost perfectly. The test of whether you have an improved or more accurate version of the the truth is in how well you predict the future values that you have not used in fitting your functions. The fact that I have limited ability to ad lib is just another instance of the fact that the truth is frequently trite, and this in particular has already been expressed in countless texts and lectures.
Had you been determined to show that we were near the latest peak in the recurring peaks of the millenia since the last ice age, you could have done so. Paraphrasing my earlier language, you could have “saved the hypothesis” that we are heading to a new Little Ice Age. Vukcevik has shown how you might have done so, but the procedure is not unique. You only have to be determined to work until you find what you want to find.
VP > My experience as someone originally trained in physics but who made a career in logic has been that the fault-finding is often more illogical than the allegedly faulty reasoning
And what of ( the fault-finding (of the fault-finding( of the allegedly faulty reasoning ) ) )?
And what of ( the fault-finding (of the fault-finding( of the allegedly faulty reasoning ) ) )?
Indeed. I may be wrong and you may be right. Though what of ( the fault-finding (of the fault-finding (of the fault-finding ( of the allegedly faulty reasoning ) ) ) )? You may be wrong and I may be right.
An interesting question is this:
Suppose we enter a Maunder-type minimum, but temperatures do not fall into Little-Ice-Age territory, would you then
1) discount the Sun or
2) say the data is wrong, made-up, manipulated, impossible, etc or
3) admit that the Sun is not a major driver, but still a minor player
I would say
4) a low SSN (the usual definition of “Maunder minimum”) need not always entail a low TSI.
The difference from 3) is that if this putative Maunder minimum was accompanied by a low TSI, and if an LIA then resulted, that combination would surely show that the Sun is an important player (unless CO2 had fallen dramatically or some such).
A continuing high TSI during a low SSN is therefore no basis for inferring that the Sun is a minor player.
(We logicians can argue ourselves into wacky corners.)
(To clarify, any credit for 4 should go to Leif, not me. Knowing how he reasons, his choices 1-3 look like a trick question since he surely had 4 in mind.)
There’s always the “Columbus caused a massive regrowth of trees in North and South America” theory.
Indeed, CO2 levels did fall during the LIA:
http://www.agu.org/pubs/crossref/2012/2011GB004247.shtml
Indeed, CO2 levels did fall during the LIA:
Now that I did not know.
So what is the evidence that SSN has any effect at all on TSI? Are they well correlated, slightly correlated, or not correlated?
I’ve always assumed that sunspots brought heat from below to the surface, thereby generating more TSI. Is that not true?
– – – – – – –
Leif,
IF I was to comprehensively assess, down to first principles and fundamental premises, the current scientific research on the: 1) Sun; 2) Earth-Atmospheric System; 3) Properties of the varying Space between them; and 4) their Orbital Dynamics . . . THEN I might say reasonably inconclusive wrt your three questions or might say reasonably conclusive to pick one.
What I do know is there is an irrational imbalance in research related to climate in the favor of studying anthropogenic CO2. So, I suggest we divert significant funds to do more of my items #1 thru #4. : ).
But to response to your multiple choice question, with my current level of knowledge, my answer is all three with some curiously strong personal inclination toward answer 3.
John
Leif, might it not be that sometimes the sun can be a major driver and sometimes it cannot be, rather like a plant in a pot; whilst both water and fertiliser are major drivers, yet if the pot is dry the fertilser will have no effect. i.e the the effect of the sun could be contingent on other states?
Or is this suggestion just an occams razor fail?
lsvalgaard: An interesting question is this:
Suppose we enter a Maunder-type minimum, but temperatures do not fall into Little-Ice-Age territory, would you then
1) discount the Sun or
2) say the data is wrong, made-up, manipulated, impossible, etc or
3) admit that the Sun is not a major driver, but still a minor player
I agree that it is an interesting question. I think that much will be learned in the next 2 decades. I am 65, but I hope to live long enough to have an answer to the question. As you put it, the case would undermine a strong role for the sun, but I do not want to bet now on knowing the future.
Vaughan Pratt | December 11, 2012 at 11:44 pm | Reply
4) a low SSN (the usual definition of “Maunder minimum”) need not always entail a low TSI.
To make the statement correct, it should include ‘for an extended times [several cycles]’. Now from what we believe about how the Sun works, we would assume that if another Maunder Minimum is in the cards it would be due to the same mechanism that caused the first and that therefore TSI would be the same as back in the 17th Century. BTW, we do not know that TSI back then was any lower than today. We assume so, in order to explain the LIA; a bit of circular logic here.
BTW, we do not know that TSI back then was any lower than today. We assume so, in order to explain the LIA; a bit of circular logic here.
Exactly so, and I wasn’t assuming otherwise in my answer.
Leif said:
“BTW, we do not know that TSI back then was any lower than today. We assume so, in order to explain the LIA; a bit of circular logic here.”
What we do know is that there were low SSN’s, some significant volcanic activity and lower CO2 levels, and potentially some changes in the THC that could have meant an extended period of a cool AMO. Some of these could be related to each other rooted in some other causal factor, or one of them could be a prime causal factor itself. Isn’t climate science fun!
Back-fitting
Feeling an attack of Dunning Kruger coming on, and having left my pills at home, I am unable to stop myself making the following suggestion :
Since the recommended minimum period for climatic significance is 30 years, we should trust only those climate models that satisfy both these conditions
– have not been changed for 30 years
– make successful predictions.
Punksta: we should trust only those climate models that satisfy both these conditions
– have not been changed for 30 years
– make successful predictions.
Nicely put. I think that the currently recommended minimum is 17 years.
An interesting question is this:
Suppose we assume 3 K / doubling and fabricate a waveform to explain deviations from our assumption. The model deviates more and more towards the end of the data. We can:
1) discount the CO2 or
2) say the data is wrong, made-up, manipulated, impossible, etc or
3) admit that the CO2 is not a major driver, but still a minor player
4) pretend the deviation is a “filter artefact”.
@GG: Suppose we assume 3 K / doubling and fabricate a waveform to explain deviations from our assumption. The model deviates more and more towards the end of the data.
A fair question. Though it should be pointed out that my SAW function is exactly the opposite: at the end of the data it barely deviates at all from the 3 K assumption, all the deviation is well away from the ends.
I’m looking at figure 6 which does fit my comment.
But that deviation is just a few millikelvins. How is such a tiny deviation relevant to anything?
Interesting to note in figure6 showing MRES that the model residuals are an order of magnitude smaller in the 60 years preceding the speculated event that caused the saw tooth pulse.
Yet another demonstration that the pseudo saw tooth is simply a function fabricated to remove deviations from the assume 3K CO2 exponential.
Amazingly many interpretions of MRES. ;)
Currently I don’t have any interpretation of that MRES other than that where the bumps appear is meaningless. A different local minimum might put the bumps somewhere else.
If the bumps are meaningless then so is earlier the lack of bumps. In which case why did you include this graph ?!
In which case why did you include this graph ?
(a) because its variance (over some range) was what I minimized to arrive at the parameters for SAW and AGW, and
(b) because the increasing variance on the right recapitulates that of the second half of CET, corresponding to the increasing impact of humans on nature.
What is your estimate of the number of car-driving humans the planet can support before their impact on global climate becomes visible? Umpteen gazillion?
To all who still may be around in a way of reply (tried to post already, but it failed for some reason unless my ‘contributions’ are destined for the waste bin.
So here we go again.
I don’t care much who is, or are Dunning-Kruger, just having good fun seeing the two Stanford (USA second best University) experts squirming around looking for a solution, where they well know there is none.
Dr. Svalgaard has my data (I emailed to him the Excel file), he knows is it is good, so his only way out ‘ your data is made up’ .
Of course if you have two sets of scalar or vector values, and then you perform simple arithmetic calculation, the result is MADE UP of two sets of data into a new one, in this case, surprising good approximation of the natural temperature variability in the North Hemisphere.
http://www.vukcevic.talktalk.net/GSC1.htm
The above is published ( you can see date stamp) , whole thing is explained in very fine detail and handful of scientists are informed, among them Dr. Svalgaard, with the additional advantage of him having copy of the actual Excel file.
Reading through some of the further comments including some from Dr. Pratt, they appear to be lot of a plain nonsense, when the ideas fail, revert to psychology is the exit out of embarrassing situation.
As far as Belo-Russia is concerned, they are fine example to the some of the CO2 theorists here, how to force free thinking people to submit to obviously failed theory.
Both ( Belo-Russia and the AGW) are still clinging to the something that is plainly failed or failing. Perhaps these two learned gentlemen would propose that no free thinking is allowed, unless it conforms to their psychological prescription.
Let me remind you that is not what universities are about, and I hope you are here as free agents, rather than espousing latest thinking of that great institution.
How about going back to what is presented to you, and standing up to the challenge:
Explain 350 years of no warming in the CET summer temperatures:
http://www.vukcevic.talktalk.net/MidSummer-MidWinter.htm
or go back to meaningless waffle.
See you soon.
You are clearly pretty skilled in dsp and filter design and fully aware windowing issues. I asked earlier how you were running the BoxFilter up to the end of the data. There is no legitimate was to pad the data window at the end of convolution filter. Each filter shortend the dataset. The filters you used should crop 25 y off each end as I already pointed out.
I asked what filling technique you were using. You failed to comment on that.
I’ve just dug into the spreadsheet coding and you are simply running off the end hence effectively padding zeros !!
So your comment on figure 3 is correct. It is your incorrect use of the box filter that is creating the down turn. However, this turns out to be quite convenient for your model. Since the data _really does_ flatten off in quite a similar fashion. As we see in figure 2.
Thought the filter is similarly misused, in this case, by chance, is not too far from following the actual data.
Despite this fortuitous “correction” of the defective exponential by the misused filter, figure 6 still shows deviations to be greatest at the end of the series.
Since the data _really does_ flatten off in quite a similar fashion. As we see in figure 2.
You’re being inconsistent. You agree with me that the falling off in Figure 3 is meaningless, yet for some reason trust the filter to be doing the right thing in Figure 2, namely reflecting that “the data _really does_ flatten off”.
The green curve in Figure 2 does not fall off because of any decline in actual temperature but because F3 is bending it down for the same reason it bends the orange curve in Figure 3 down. The order-of-magnitude smaller fluctuation on the right of MRES should make this clear.
Vaughn,
Will the next step be to take your CO2 induced warming curve and multiply by 0.2, 0.5, 0.8 and re-do the fits to see what the remainder looks like? See if you get the same millikelvin residuals (not that either one of us believes that means much but it made a good title). And also see if the leftover signal resembles the temp. signal more than this first result? I appreciate your pleasant attitude (from what I’ve seen) dealing with criticism.
My attempt to post reply to Dr. Svalgaard and Dr.Pratt failed couple of times
now available at my web page
http://www.vukcevic.talktalk.net/Reply.htm
Vaughan Pratt | December 12, 2012 at 3:38 am |
“But that deviation is just a few millikelvins. How is such a tiny deviation relevant to anything?”
Good question but as I pointed out above (after you posted this quote) the only reason this is so small is because the “filter artefact” hides the elephant in the room: the 140 mK deviation of AGW and F3(AGW) at the end.
As your spreadsheet points out, the least square fit you did has the effect of adjusting the parameters to minimise residuals in figure6 .
You are fitting a F3(AGW) curve that is an exponential with the end bent down by careless incorrect use of a box filter. By pure chance that distorts the last decades of the exponential is a very similar way to the down turn in the dataset. ie the recent lack of warming.
The ONLY reason all this works at all is the misuse of the filter and the fact you are then using a significant number of parameters to fit the distorted AGW to the filtered data.
Figure 6 is supposed to be the big deal here.
YES! WITHIN MILIIKELVINS! ( Big Red Arrow)
If you add back the 140 mK caused by the accidental and progressive zero padding in the filter it’s suddenly less impressive.
CONCLUSION
“We are unaware of other analyses claiming millikelvin precision.”
No comment.
By pure chance that distorts the last decades of the exponential is a very similar way to the down turn in the dataset. ie the recent lack of warming.
MRES shows that there is no “pure chance” about it.
@gg: “We are unaware of other analyses claiming millikelvin precision.” No comment.
Fair enough, since the rules of the game haven’t been written down yet. Let me propose some.
The CDIAC has told us how much CO2 we’ve added to the atmosphere since 1750 by burning fossil fuels, making cement, and changing land use (slash and burn etc.). In impressively good agreement with the increase in such emissions, the CO2 has increased, as has the global temperature.
However temperature hasn’t perfectly tracked human CO2 emissions. Some natural influence seems to be at work.
This natural influence should oscillate but not trend very fast, since a fast trend could not have been sustained over the past several millennia but we have no reason to expect a dramatic change over that period.
The game therefore is to come up with two curves we can call NAT and HUM for nature and humans, such that HadCRUT3 = NAT + HUM + shorter-term variations, where NAT oscillates without trending too far in a few centuries, and some physically justifiable relation between HUM and the CDIAC CO2 data can be demonstrated.
To within MRES I’ve proposed SAW for NAT, AGW for HUM, and what F3 removes for the shorter-term variations. I’ve also described what F3 removes as SOL + DEC. Hence I’ve described HadCRUT3 as MUL + SAW + DEC.
My proposal for this analysis of HadCRUT3 is nothing but a hypothesis. An easy way to shoot down a hypothesis is to come up with a better one. No matter how implausible a hypothesis might be, if it’s the best one you are stuck with its implausibility.
So far no one has proposed a better one, instead focusing on my methodology for how I arrived at my hypothesis.
A hypothesis should fit the data without overfitting it; ideally the model should have fewer tunable parameters than the observation space has observable dimensions. (On criterion for observability of a dimension is that any filtering should maintain its scale above the prevailing signal-to-noise ratio.) The model should also respect the physics underlying the greenhouse effect. Ocean oscillations are less well understood allowing more room for creative modeling.
Since DEC and SOL have significant variance it will not be possible to achieve an R2 above 90% while leaving their variance in the “unexplained” bin, as commonly done with the excuse “an R2 of 85% is as much as anyone gets in matters of climate”. However higher R2 (lower unexplained variance) can be achieved provided DEC and SOL can be explained one way or another. I’ve explained those components as consisting of those frequencies that are too high to have any bearing on long-term climate, thereby justifying removing them so as to make the unexplained multidecadal variance visible. Ideally the latter would be very small, i.e. R2 would be very close to 1.
Vaughan Pratt – I address your “NAT+HUM” idea here:-
http://wattsupwiththat.com/2012/12/13/circular-logic-not-worth-a-millikelvin/#comment-1172488
The AGW that you have found matches so well to the data is an exponential rise up until 2010 followed by 25 years of zero anomaly. That is what the input to your F3 filter is.
You have inadvertently used a model in which AGW global warming is zero form 2010 onwards and found it works to “within a millikelvin”.
vukcevic | December 12, 2012 at 3:44 am | Reply
Of course if you have two sets of scalar or vector values, and then you perform simple arithmetic calculation, the result is MADE UP of two sets of data into a new one
That is precisely what ‘made up’ data is: you take two physically unrelated sets and make up their combination. I can make up one right here: I multiply the sunspot number by the US population [expressed in billions to keep numbers reasonable].
ABSOLUTELY BRILLIANT, Svalgaard !
I was getting a bit concerned about this ‘vukcevic you made-up the data’; implication vukcevic you are fraud.
You said elsewhere that:
Geomagnetic field is made of two components:
-The Earth’s magnetic field
– short term response (few days) changes caused by solar wind impact on the magnetosphere.
That is precisely what I have done:
Using annual sunspot number as a representative of the long term (on the decadal scale) solar magnetic field impact and small variable component of the Earth’s magnetic field, as calculated from data by Jackson and Bloxam.
If you have an annual data file for solar dipole strength going back at least as 1850, I would be more than happy to use it:
In that case we would have variability of the solar magnetic dipole, combined with variability of the Earth’s magnetic dipole, so than presumably you would be content.
For new comers here is what this is all about
http://www.vukcevic.talktalk.net/EarthNV.htm
Now you have went through my Excel file and that is only thing you found object, than I am happy to do provide more information to the interested..
If you think that US population is anything to do with the Earth’s magnetic field, than the anecdote of your conversation with Severniy makes sense.
Vaughan Pratt
Your analysis of past CO2 evolution and impact by filtering out everything else is OK, with some caveats as we’ve seen posted here.
But as a forecasting tool it sucks for one primary reason: it does not take into consideration any possible changes in human population growth rates.
After all, it’s the “humans” who are emitting the human-based GHGs, including CO2.
It also ignores the amount of total carbon that’s still out there in fossil fuels.
So we have two real-life constraints, which your projection for the future has ignored.
To get to your “4C increase in temperature” using IPCC’s 3.2C mean climate sensitivity, you need to increase CO2 to almost 1000 ppmv (the level one could reach as an asymptotic absolute maximum, when all fossil fuels have been totally used up). This is virtually impossible by 2100.
By all estimates I’ve seen, population growth is projected to slow down sharply from the rates we saw over the late 20th century period you are using for establishing your curve.
1960 population was 3 billion
2010 population was 7 billion
So we had an exponential growth rate of around 1.7%/year
Estimates from UN and elsewhere project that population by 2100 will be somewhere between 10 and 10.5 billion.
This would represent a growth rate of between 0.40% and 0.45%/year – or less than one-third the past growth rate.
So this represents a major real-life constraint. It is very unlikely that human CO2 that has been observed to increase at X% per year while human population increased at Y% per year will continue to increase at X% per year when population growth slows to Y/3% per year. Right?
Over the past 40 years the per capita human consumption of fossil fuels has gone up by around 20%.
So it is reasonable to assume, despite the economic and environmental pressures on fossil fuels in the future, that the per capita fossil fuel useage would continue to grow, albeit at a slightly lower rate; a reasonable estimate would seem to be a 30% increase overall above today’s value by 2100.
If we use these bases for a future projection, we end up with atmospheric CO2 at around 600 ppmv and an increase in temperature of around 2C (not 4C, as your curve projects). [BTW this is close to IPCC “scenario + storyline B1 and A1T” in AR4.]
So I think for use as a forecasting tool for the future, you need to go back to the drawing board.
Max
@manacker: But as a forecasting tool it sucks for one primary reason: it does not take into consideration any possible changes in human population growth rates.
I fully agree, Max: prediction is tough, especially the future.
Making it harder still however is that it’s more complicated than mere population. If the 7 billion of us lived in caves and waged war with clubs, anthropogenic CO2 in the atmosphere would be more like 10 ppmv than 100 ppmv (that is, total atmospheric CO2 would be less than 300 ppmv today).
You have to take into account (a) further increases in per-capita energy consumption in the developed countries and (b) ditto for the developing countries.
The former might result if we all start flying around in our own private 500 mph jets (autonomously flown so you wouldn’t need a pilot’s license or a designated pilot after a party and wouldn’t crash into each other), or some other energy-intensive scenario.
The latter seems inevitable. Even if the population stopped growing altogether, bringing developing countries up to the standard of developed ones is guaranteed to have an enormous impact, especially if they too start flying those autonomous private jets.
But yes, I agree my methodology sucks at making those sorts of predictions. (Though apparently my inner SF writer doesn’t. ;) )
Vaughan Pratt | December 11, 2012 at 9:01 pm |
“Educating Milivoje Vukcevic.” that could work as the name of a Belorussian play. ;) see attached copy below
Minsk
Stanfordski office of the Byelorussian Party Commissar:
Vukcevic: Comrade Svalgaardovich what is your opinion of the work of Comrade Prattovich ?
Svalgardovich: : Comrade Pratovich has done a diligent analysis, followed my orders to perform the Lysenko type experiment. The experiment was great success, temperature rise tripled, few peasants froze to death, but the temperature rose of 4 degrees was within milliKelvin.
Comrade Vukcevic you are to stop making-up data that sun has anything to do with climate change in of Brotherly Socialist Countries. In decadent West that may be the case, but here Our Supreme Commander and the Party Commissariat are in charge of the climate change. Last warning comrade.
Gravely anxious Vukcevic exits.
Pratovich enters.
Svalgardovich: Comrade Pratovich excellent work, Our Glorious Motherland, Our Supreme Commander and Our Ever Victorious Party to which you serve so faithfully will present you with a copy of your black& white poster, colour inks are in a short supply at the moment.
Pratovich: Thank you, thank you Comrade Svalgardovich. What are we to do with Comrade Vukcevic.
Svalgardovich: No problem, I have ordered a Denning-Kruger syndrome diagnosis.
Pratovich: You are a very wise man Comrade Svalgardovich. What is my next task Comrade Svalgardovich?
Svalgardovich: get me timetable of the next Siberian cattle transport train. Our methods of dealing with ‘enemies of the Motherland’ are indeed well tested.
Prattovich: Educate Comrade Vukcevic we owe to Our Supreme Commander. .Long live Our Supreme Commander.
manacker, while the points you made are valid the main issue here is that the whole analysis is flawed since the F3(AGW) is no longer an exponential. It has been inadvertently blended with 25 year of zero temp anomaly.
That is what has be been used to in the least squares fit that produced the amazing “to within a millikelvin” fit. What this poster demonstrates is that setting AGW=ZERO after 2010 fits the data really well.
I detailed this above:
http://judithcurry.com/2012/12/04/multidecadal-climate-to-within-a-millikelvin/#comment-275980
Hopefully Vaughan will be able to comment on this.
In the above Byelorussian play, as written by Dr. Pratt, I was intrigued by the extraordinary claim made by Byelorussian Party Commissar Svalgardovich regarding ‘climate change in of Brotherly Socialist Countries. In decadent West that may be the case, but here Our Supreme Commander and the Party Commissariat are in charge of the climate change’.
I contacted NASA and they forwarded detailed proof:
http://data.giss.nasa.gov/cgi-bin/gistemp/do_nmap.py?year_last=2012&month_last=2&sat=4&sst=1&type=trends&mean_gen=0112&year1=1969&year2=1971&base1=1951&base2=1980&radius=250&pol=reg
As you can see the ‘decadent West’ was indeed freezing to death 1969-1961, while the ‘Glorious Motherland at the order Supreme Commander and the Party Commissariat’ was basking in the heath wave.
Therefore all should stop with their persistently questioning of Dr. Pratt, about temperature drop in 1960-70. As you can see from GISS data such a thing never happened in Byelorussia, the good Dr. Pratt is telling it as it is.
Vuk, all the clowning around is very amusing but maybe you could use the reply feature to that post rather than trumping the rather fundamental issues I’m trying to raise about the subject of this thread.
Vaughan Pratt | December 12, 2012 at 3:38 am |
“But that deviation is just a few millikelvins. How is such a tiny deviation relevant to anything?”
Good question but as I pointed out above (after you posted this quote) the only reason this is so small is because the “filter artefact” hides the elephant in the room: the 140 mK deviation of AGW and F3(AGW) at the end.
As your spreadsheet points out, the least square fit you did has the effect of adjusting the parameters to minimise residuals in figure6 .
You are fitting a F3(AGW) curve that is an exponential with the end bent down by careless incorrect use of a box filter. By pure chance that distorts the last decades of the exponential is a very similar way to the down turn in the dataset. ie the recent lack of warming.
The ONLY reason all this works at all is the misuse of the filter and the fact you are then using a significant number of parameters to fit the distorted AGW to the filtered data.
Figure 6 is supposed to be the big deal here.
YES! WITHIN MILIIKELVINS! ( Big Red Arrow)
If you add back the 140 mK caused by the accidental and progressive zero padding in the filter it’s suddenly less impressive.
CONCLUSION
“We are unaware of other analyses claiming millikelvin precision.”
You are fitting a F3(AGW) curve that is an exponential with the end bent down by careless incorrect use of a box filter.
We may be getting out of sync. Although I addressed this elsewhere (namely the discussion about 1870-1950 and five-sigma) let me restate it here just in case.
(i) After taking the linearity of F3 into account, F3 enters at only one point, namely to create MRES from HadCRUT3 − (SAW+AGW). And MRES is used for only one thing in the fitting process: to supply the unexplained variance that fitting aims to minimize.
(ii) When I did the fitting I paid no attention to the period 1990-2010 precisely for the reason you give: it can’t be trusted.
To fully satisfy you however I should also not pay attention to MRES for 1850-1870. This version of the spreadsheet does that and more: it also ignores 1950-1990 on the ground that the data being used to estimate SAW has been too badly corrupted by human activities in general (as opposed to CO2 alone) to be trusted.
Truncating down to 1950 has yet another benefit: it shows that if we ignore the temperature data beyond 1970 (since we’re using 1950-1970 temperature data to avoid end effects) and find the best fit using only HadCRUT3 up to 1970, we predict the next four decades of temperature remarkably well, even predicting the relatively flat temperature for 2000-2010, which the model shows is entirely attributable to SOL and has nothing to do with a cessation of long-term global warming.
It further forecasts a strong rise for 2010-2020. If by 2015 we have seen no sign of such a rise starting up I will start to lose faith in my model. By 2020 it will be clear how that forecast panned out.
Natural ‘pointers’ such as the, Arctic atmospheric pressure, SSN and geological records in the N. Atlantic all precede temperature changes indicate that the opposite is more likely. This is also reinforced by extrapolation of the CET record based on the 3 strongest harmonic constituents
http://www.vukcevic.talktalk.net/CET-NVa.htm
As any SF dude would say: future is cool, man !
Vaughan Pratt
Here’s a picture to go along with earlier post.
http://farm9.staticflickr.com/8364/8267881868_4f17478859_b.jpg
It’s based on the simplified notion that CO2 is the sole control knob (with everything else canceling each other out) and IPCC’s mean 2xCO2 climate sensitivity.
Three cases
1- CO2 increases with population; grows to 30% higher per capita CO2 generation by 2100
2- Total CO2 concentration continues to increase at observed past exponential rate of 0.5%/yr
3- Human CO2 concentration continues to increase at observed past exponential rate of 1.22%/yr
Case 3 is close to your curve, ending up with CO2 at close to 1000 ppmv and temperature increase at 4°C
I believe Cases 1 and 2 are more realistic, for the reasons stated earlier
Max
vukcevic | December 12, 2012 at 2:07 pm
implication vukcevic you are fraud.
Fraud implies intent, and I don’t think there is intent. You can correct me if I’m wrong.
That is precisely what I have done:
Using annual sunspot number as a representative of the long term (on the decadal scale) solar magnetic field impact and small variable component of the Earth’s magnetic field, as calculated from data by Jackson and Bloxam.
The sunspot number and the secular changes of the Earth’s field are as unrelated as the sunspot number and the US population. So your data set is made up on the assumption that the two ingredients are not unrelated.
Related or not, that is beside the point.
Earth magnetic change exists, sunspot number is the representative of the solar magnetic changes, it is fact that both react on the oceans, the physics is certain, so effect of one can be modulated by or added to the other, only degree of intensity is questionable.
Forget about your silly and pointless analogy of population with solar magnetic changes in respect of the geomagnetic changes, and discuss science.
I would be surprised if anthropogenic CO2 in the atmosphere (if it’s even anthropogenic and not just a rising ocean/atmosphere equilibrium point from some other cause) controls more energy than the gravitational and magnetic fields do. Someday we’ll know and in the meantime the important thing is to prevent miguided counter-productive actions from the alarmist community and sycophants.
Chas | December 12, 2012 at 1:50 pm
might it not be that sometimes the sun can be a major driver and sometimes it cannot be … Or is this suggestion just an occams razor fail?
I think you answered your own question
Aw, Occam’s Razor has a dull edge with over use. The sun has a greater impact on the long term ocean temperatures and with 124km^2 below 24S and 76km^2 above 24N the solar impact is likely blurred a touch with predominately NH high latitude data. There could be some interesting delays and amplifications involved.
I would not be surprised at all to find that the ocean sensitivity to solar forcing is twice its sensitivity to long wave forcing. :)
I would be mildly surprised if ocean sensitivity SW:LW is more than 10:1 or less than 3:1. Longwave forcing just peels H2O molecules off the surface. Any means for that energy to make it below the skin layer is contrived and not backed by experimental demonstration. It could be proven one way or the other experimentally with the recent availability of lasers which operate across 3-20um wavelengths.
David, I don’t know about over 3:1. The latent sweet spot is around 25C (450Wm-2) where 3.7 in long wave would only give you about 0.6C increase.
vukcevic | December 12, 2012 at 2:46 pm | Reply
Earth magnetic change exists, sunspot number is the representative of the solar magnetic changes, it is fact that both react on the oceans, the physics is certain
But not on each other, and their impact on the oceans is too small and short-lived [hours for the solar part] to have any significant effect on anything.
Forget about your silly and pointless analogy of population with solar magnetic changes in respect of the geomagnetic changes, and discuss science.
the science is what I just told you. The analogy holds because the two series are unrelated on the time scale you are considering.
Let us get this clear:
Solar magnetic field changes impacting the Earth’s magnetosphere, through number of intermediately steps induce electric currents into the oceans and the lithosphere.
These create secondary magnetic fields, which may or may not be in polarity conflict with the Earth’s field at time of impact.
This is physics experimentally observed, and as it happens I record the available data.
http://www.vukcevic.talktalk.net/Tromso.htm
Here we can see solar factor as SSN number (monthly scale), Ap index on daily and Bartel rot scale, and effect on the Earth’s surface magnetic field.
Strength of the Earth’s magnetosphere is directly proportional to the strength of the Earth’s magnetic field at any time scale from days to months years, solar cycles or Hale cycles periods, centuries, millennia..
Dr. Svalgaard face the facts, and facts are, as by now you know far better than I do (thanks to the work Vukcevic has done) that:
It appears that the temperature natural change in the N. Hemisphere directly correlates to the combined changes in two magnetic fields as measured at the Earth’s surface:
http://www.vukcevic.talktalk.net/GSC1.htm
To paraphrase Dr. Svalgaard of Stanford:
If correlation is really good, one can live with an as yet undiscovered mechanism.
Now we have another mechanism along Svensmark, but intensity of the impact is questionable: electric heating no, Lorentz forces on intensity of the ocean currents unlikely, breakdown in the integrity of the thermo-haline layers under impact of high frequency Lorentz force
http://www.vukcevic.talktalk.net/SO.htm
And again there is the unexpected correlation N. Hemisphere’s volcanic eruptions and Ap index.
I suggest, the science isn’t settle, there is far more to be found and understood. Time will tell.
Above, this was cited in connection with solar effects. Much the same has been said of CO2 AGW at various times.
greg goodman | December 12, 2012 at 9:01 am | Reply
The AGW that you have found matches so well to the data is an exponential rise up until 2010 followed by 25 years of zero anomaly. That is what the input to your F3 filter is.
You have inadvertently used a model in which AGW global warming is zero form 2010 onwards and found it works to “within a millikelvin”.
Still no ‘explanation’ from Prof. Vaughan Pratt on the blunder in the filter window that resulted in him fitting a down-turned exponential ?
Greg,
Vaughan can give you a more definite answer when he comes back to answer questions.
It seems, however, clear that he is comparing filtered data with filtered model predictions. Thus the “error” cancels out in the comparison.
The filtered model does not provide any valid prediction for the unfiltered data of the latest years. Assuming that such a prediction would be aimed at, your complaint would be serious, but that’s not what the spreadsheet does.
Vaughan came while I was writing the above, but at least I gave a shorter answer this time.
Still no ‘explanation’ from Prof. Vaughan Pratt on the blunder in the filter window that resulted in him fitting a down-turned exponential ?
I’ve tried the fitting various ways,
(i) including the endpoints as part of the residual;
(ii) excluding them as invalid for the reason cited by Greg (that is, just minimizing the variance of the interior of MRES);
(iii) excluding the whole of 1950-2010 as too corrupted by human activity to be a meaningful indicator of fit when fitting a putatively natural phenomenon (I saw no reason to suppose that the shape that SAW is fitting to is something attributable to humans).
The poster gives the fit for (iii). This was not originally intended—what happened when it first occurred to me to bring in the 4th and 5th harmonics is that doing so flattened 1850-1950 to an extent that amazed me while leaving a big bulge at 1970 that I could not see how to flatten. The idea of explicitly minimizing the variance of just 1850-1950 came later.
Usually when you do this sort of thing the unexamined portion (1850-2010) wiggles randomly. It is therefore very interesting that in this case the portion of MRES after 1950 never goes negative! Might be just a coincidence, but there could be more to it, especially given that it proved much easier to flatten 1850-1950 than 1950-2010.
I’ve been considering doing something similar for CET. As I noted above, the first half of CET looks a lot cleaner than the second as judged by the Hale band, suggesting that the second half has been corrupted by human activity. This happened earlier than for HadCRUT3 because of the greater density of population x technology in CET. The clean lines of the first half of CET suggest that one may be able to get a more accurate idea of natural influences by fitting to that portion and ignoring the second half for fitting purposes.
I don’t take the last decade of MRES seriously and neither should Greg. It is not impacting the fitting (at least in (ii) and (iii)) so I’m unclear as to his concern about it.
We could probably argue about the soundness of this rationale for a long time.
the unexamined portion (1850-2010)
…should read 1950-2010…
Vaughan Pratt,
This post reminds me of “Monkey business with numbers” a very important law case involving the cancellation of the A12 “Avenger II” stealth bomber program.
http://www.pmi-ssc.org/abba.shtml
vukcevic | December 12, 2012 at 4:25 pm
Solar magnetic field changes impacting the Earth’s magnetosphere, through number of intermediately steps induce electric currents into the oceans and the lithosphere.
These currents are very short-lived and your next statement is muddled nonsense:
These create secondary magnetic fields, which may or may not be in polarity conflict with the Earth’s field at time of impact.
This is physics experimentally observed, and as it happens I record the available data.
http://www.vukcevic.talktalk.net/Tromso.htm
Tromso is one of worst stations to use for this. Better would be the horizontal field at Honolulu.
It appears that the temperature natural change in the N. Hemisphere directly correlates to the combined changes in two magnetic fields as measured at the Earth’s surface
The combination is physically invalid and made-up, possibly for the purpose of producing a correlation: “hmmm, let’s see what combination of data would give me a correlation…”
And again there is the unexpected correlation N. Hemisphere’s volcanic eruptions and Ap index.
If you look hard enough you can always find spurious correlations. One of our students once reported that after examining 100 time series she found one that correlated with 95% confidence to another one. My response was that I was surprised she didn’t find 5 correlations.
there is far more to be found and understood.
Absolutely, but it must be [and generally is] through valid scientific analysis and not your ‘incisive intuition’. The mind boggles at your resistance to learning.
Data is made up
Data is ok but not related
Data is related but not on the time scale
Data is no good at Tromso but is ok at Honolulu
Data is all fine but it correlation is spurious, because some woman found one
Pathetic.
Pratt’s Svalgardovich from his Byelorussian play is far more steadfast in his reasoning.
http://judithcurry.com/2012/12/04/multidecadal-climate-to-within-a-millikelvin/#comment-276069
vukcevic | December 12, 2012 at 5:07 pm
Pathetic
Not really worthy of a response…
To get back to the topic under discussion – surely the big issue with global climate time series is how temperature is related to atmospheric CO2 concentration since this relationship is the core of the AGW theory. Norwegians Humlum, Strordahl and Solheim have filtered these time series to remove yearly data and background trends and found that atmospheric CO2 variations lag behind temperature variations. This is unequivocal and surely the last nail in the coffin of the AGW theory; an effect cannot preced its cause. See
http://www.scienceheresy.com/2012_11/humlum/climate-change-is-not-man-made.html
Nope, plenty of room for more nails. It is interesting that things tend to fit your expectations when dealing with complex non-ergodic systems.
That’s right Tomas! I said non-ergodic.
Is it possible that this kind of erroneous logic never ends?
The issue of short term variability vs.persistent trends has been discussed so thoroughly that even the slowest thinkers should understand it by now.
Have you actually read the Humlum et al paper or the Science Heresy post?
I read the beginning and that was all non-sense.
I didn’t realize that the post is so short. Now I can say that everything that it contains has been shown to be irrelevant using many strong arguments. The claims are not new and therefore they had been shown wrong long before this post got published.
The crucial fact of the matter is that CO2 never leads T coherently in ANY frequency range, including those of the Milankovich cycles.
It’s irrelevant for the argumentation on the source of the persistent rise of CO2 concentration observed at Mauna Loa and elsewhere over 50 years. This subject has been discussed so many times that there’s no reason to go back to it again.
The crucial fact of the matter is that CO2 never leads T coherently in ANY frequency range, including those of the Milankovitch cycles.
Johns said, “The crucial fact of the matter is that CO2 never leads T coherently in ANY frequency range, including those of the Milankovich cycles.”
True, but that is not a nail. CO2 is only credited with “about half” of the pre-industrial warming and not all of the current warming. There is actually a better correlation between CO2 and deep ocean temperature than surface temperature. That is chicken and egg country there.
There is a little “signature” of CO2 over land, mainly higher altitude and latitude land, so it is doing something, just with all the recognized noise and potential longer term noise, it is hard to separate out. Give it another 10 to 15 years are there may be enough data to say what is what.
Here are two facts that no one disputes:
1. Increasing temperature raises CO2.
2. Natural CO2 emissions into the atmosphere dwarf the man-made kind by a factor of 20.
Let me conjecture:
3. These very pleasing short term correlations between ocean temperatures and atmospheric CO2 cannot be seen at all in the 5% of CO2 emissions attributable to humans.
Why would I conjecture this? Well, think. How could tiny fluctuations in ocean temperatures cause humans to change their power consumption to such an enormous degree it would be visible above the huge noise of the 20x larger natural emissions of CO2?
It should be obvious that these short term CO2 fluctuations are entirely driven by ocean temperature variations, and are therefore fluctuations in nature’s 200 GtC/yr emissions. This is physically possible for the same reason that a bottle of beer left open on the counter can go flat in a day, and will go flat somewhat faster than if put in the fridge, and somewhat slower than if put in the sun.
It should be equally obvious that short term ocean fluctuations cannot be driven by short term CO2 fluctuations because the action of radiative forcing takes much longer than a year for its influence to be felt in ocean temperatures. For starters the heat capacity of the atmosphere is at least two orders of magnitude below the oceanic mixed layer, which is what CO2 radiative forcing heats.
Global warming is a very slow process, way slower than these short term fluctuations. It’s like boiling a kettle of water with a candle, it takes years.
@Pekka: The issue of short term variability vs.persistent trends has been discussed so thoroughly that even the slowest thinkers should understand it by now.
Harsh, Pekka. ;)
The logic of global warming is not obvious to amateurs. As an amateur myself I can vouch for this. (Though I am a professional applied logician, which helps.)
Vaughan,
One can look at the CO2 balances from different corners. Some of the ways don’t allow for conclusions while some others are both simple and strong. Choosing the right arguments makes the issue fully clear while all counterarguments have been shown to be irrelevant.
Vaughan Pratt said, ” How could tiny fluctuations in ocean temperatures cause humans to change their power consumption to such an enormous degree it would be visible above the huge noise of the 20x larger natural emissions of CO2?”
Is that Yokum’s razor? :)
I have read that land use impact on CO2 sink ability and deep oceans circulation of CO2 rich water and calthrates, I believe they are called, also tend to release CO2 and reduce the Sink ability. A guy named Stott from one of those left coast schools, has a theory about the deep ocean since he published a paper about CO2 lagging temperature by about 800 years. Now our dumping X % of CO2 via fossil fuels and seeing .5X% in the atmosphere, would lead to a logical assumption that only the X we are dumping is causing .5X, but there may be a complication with obvious logic in a non-linear world.
https://lh4.googleusercontent.com/-vqnDnnPA7wo/UMkkYRVtfSI/AAAAAAAAGB0/oiwhW12N1Bo/s912/time%2520lags%2520and%2520responses%2520with%2520lea.png
That is not properly attributed, but the data is on the noaa paleo site and pretty easy to find. There is a doctor lady, last name Lawrence, from Kansas I think, that noticed that deep ocean temperatures lead North Atlantic SST by a tad.
With the number of odd “sub-harmonics” in the system, 7.9ka, 5.8ka, 5.0ka, 4.3ka, 1.47ka this is a bit of concern over something called endogenous forcing. Fascinating subject :)
Alas, the Mauna Loa record is negligibly coherent with all unbiased temp time-series at its lowest (multidecadal) frequencies, rendering CO2 correspondingly irrelevant as a proximate cause of the abrupt post-1976 warming, which followed long decades of strong cooling This climate shift was evident most clearly in marine data. Empirical faith in AGW has been sustained largely on the basis of corrupted or diddled time series and quaint ad hoc notions of “trend.” That meaningful decomposition of geophysical signals requires an orthogonal set of basis functions has been ignored in the course of seeking extravagant claims.
Having stated my essential points, I cannot justify taking any more time on this impossibly slow server for a fruitless debate.
Alas, the Mauna Loa record is negligibly coherent with all unbiased temp time-series at its lowest (multidecadal) frequencies, rendering CO2 correspondingly irrelevant as a proximate cause of the abrupt post-1976 warming,
Very interesting. Do you have any numbers to back this up?
Pekka, Humlum heresy etc
Point of Information : Ignoring for the moment the various explanations offered, is it or is it not the case that CO2 (from whatever source) lags temperature trends by ~10 months over the last century or so ?
`
MrB,
There are two different processes that are clearly visible over the last decades.
1) There’s natural variability where weather patterns affect vegetation leading to alternation of years with increasing biomass and decreasing biomass. ENSO has the strongest influence on this and the largest variability in biomass occurs in tropical land areas. The amount of biomass goes up and down without strong accumulation or release over longer periods. A much weaker variability occurs in carbon storage of the surface ocean. According to some scientific studies this variability is out of phase with what we see. This is possible because the variability of the land vegetation dominates.
2) There are more persistent processes. Some of them concern land use and there’s also some persistent accumulation of carbon in soil. By far the strongest persistent changes in carbon storages are those caused by use of fossil fuels and cement manufacture.
The variability of 1) can be seen in detrended data presented by Humlum and also Salby. The detrended data is by definition incapable of telling anything on linear trends and almost nothing on a slowly accelerating trend. For the variability of 1) ENSO comes first and affects vegetation and through that CO2 concentration.
The change 2) is the persistent smooth change we see immediately in the annual Mauna Loa data. The variability of 1) is barely visible in the data without detrending and switch to a much smaller unit on vertical axis.
What has occurred at much longer periods in glacial cycles is a third class of changes not significant for the present consideration. On that scale there’s obviously a strong positive feedback between temperature, CO2 content and other changes. In positive feedback warming causes CO2 increase and CO2 increase causes more warming. Details of the initialization of those phenomena are not well understood.
There’s a lot of research that has produced more detailed knowledge on the carbon cycle of oceans and land areas. All that confirms the general picture. The knowledge is not very accurate but by a safe margin accurate enough to confirm that the natural conclusions I present above are, indeed, right.
What is trivially wrong in both Salby’s and Humlum’s argumentation is that they perform an analysis that by construction cannot say anything about 2) but claim that they have reached very strong evidence related to that. That’s really disingenuous when continued long after the issue has been pointed out by numerous others.
Thanks for the reply.
Vaughan Pratt:” (ii) excluding them as invalid for the reason cited by Greg (that is, just minimizing the variance of the interior of MRES);”
This is not a i, ii, iii choice. Your filter window is being padded with zeros, it is invalid. That makes it technically invalid at both ends for both data sets,
Since AGW is zero at the beginning this is by chance not disruptive in this case. Since temps are pretty much flat for the last 16 years it corrupts temps less than AGW, though both are corrupted. The fact that they are affected differently increases the problems this causes.
The exponential AGW totally changes from exponential growth to being near flat. It is TOTALLY corrupted and fundamentally changed in character as is shown in figure 3.
Before discussing anything else here are you agreed that filling the window with zeros was a mistake, has no mathematical validity and corrupts the data?
What about my answer? It was directly related to your complain.
If you mean your incorrect assertion that the errors will cancel out, I covered that above. They don’t. If you still believe that is the case, I suggest you think it through, try some experimenting or read up on convolution filters and why padding data (even intentionally) can never be correct.
greg, was it padded with zeros or blanks? Vaughan had mentioned that excel ignored non-numeric values in averaging. I have openoffice so I can’t check.
Applying the same filter to both leads to cancellation if there is agreement and cannot create agreement from disagreement. The size of disagreement would change to some extent.
look at figure 2. The filter data looks credible in form, with reasonable fidelity to the unfiltered data, though the final values are maybe about 0.02K lower than they should be there is no obvious corruption of the form.
Now look at what happens to the exponential in figure 3.
QED
Capt D “greg, was it padded with zeros or blanks? ”
What is the mathematical difference between ignoring a blank and adding zero?
The exponential gets modified more visibly, but my argument is a simple mathematical fact. You can see from the graphs that no full agreement is claimed for the last years. This is the point that Vaughan discussed in his reply.
Greg, yeah, that is where the filters lose forward data but not trailing. As long as Excel ignores non-numeric values it will just trail off. With real zeros it would plunge. Since Vaughan shifted the CO2 (AGW) forward by 15 years that one doesn’t. At least that is it way it looks to me.
captD:” With real zeros it would plunge. ”
It does plunge ! It’s suppose to be doing and exponential rise.
” Since Vaughan shifted the CO2 (AGW) forward by 15 years that one doesn’t”
No shift in the cell data, that’s just a parameter.
I’m not going to chat about this all night, just look at figure the F3(AGW) is screwed.
The corruption starts 25 years before the end when the accumulated filter window is no longer complete. It gets worse the more empty cells you add to the window.
You may not be too familiar with this but Vaughan certainly is. His reluctance to admit he messed up is perhaps understandable but does not change the maths.
The only reason he gets his “millikelvin” result is because he inadvertently made his ridiculous exponential rise into something more realistic by messing up the filter.
Once he has the humility to admit a mistake , maybe the discussion can advance.
greg, “captD:” With real zeros it would plunge. ”
It does plunge ! It’s suppose to be doing and exponential rise.”
That is not a plunge, you have seen my retirement account :) Seriously, the feature/bug in most spread sheets continues to average with one less forward value as it reaches non-numeric entries. With real zeroes, the end would have turned down very severely since the trailing values are at the upper end of the spread. Vaughan mentioned the feature/bug in the comments somewhere.
Vaughan’s “fit” is just that. He has an impressive “fit” to an assumed function buried in noise. That’s it.
Now smoothing out the longer term curves and pairing them with a combination of longer term internal “oscillations” would blow some wind up my skirt.
Your filter window is being padded with zeros, it is invalid. That makes it technically invalid at both ends for both data sets,
Sorry but you’re wrong about that, it is not being padded with zeros. Had it been padded with zeros there would have been a strong upturn at the left in place of no upturn at all; moreover the swing towards zero at both ends would have been several times stronger (a great many times stronger at the left!). Excel can tell the difference between a window with 11 cells and a window that has been padded with 10 extra cells: it says the former contains 11 cells and the latter 21 cells.
In any event, even if it had been padded with something so as to make it a bigger window, no use is made of the data at the ends in arriving at the parameters except in case (i). The only thing “invalid” is plotting the decade at each end, as a graph; it doesn’t get used for anything else in arriving at how MUL is divided between AGW and SAW. As I said when you first raised this objection, simply avert your eyes from that decade.
Since AGW is zero at the beginning
News to me. In the beginning it is −0.39 C. Padding with zeros on the left would have bent the left end up sharply.
Before discussing anything else here are you agreed that filling the window with zeros was a mistake, has no mathematical validity and corrupts the data?
Are you agreed that beating your wife was a mistake?
As Excel is my witness, I DID NOT PAD WITH ZEROS. Excel can tell when padding has been performed and only looks at cells when they’ve had numerical data placed in them. For numerical purposes Excel treats those cells as nonexistent when they don’t contain numerical data. There’s a big difference between existence and non-existence. (Whoa, I’m starting to sound like Jean-Paul Sartre.)
But I would certainly agree that padding with zeros could give really terrible results in some situations.
@gg (to Pekka): read up on convolution filters and why padding data (even intentionally) can never be correct.
What, never?
No, never!
What, never?
Well, … hardly ever.
This brings to mind the earlier discussion in this thread on the optimality of kriging. You presumably would argue that kriging “can never be correct” and would dismiss out of hand the concept of an optimal estimator for a stated distribution.
Before discussing anything else here are you agreed that a Gaussian filter can never produce any valid output no matter how long the time series, on the ground that it has an infinite kernel? (The support of the impulse response for F3, i.e. kernel width, is part of your rationale for invalidating my filter.)
CaptD: He has an impressive “fit” to an assumed function buried in noise.
NO, he has not fitted to the function he is projecting he is fitting to F3(AGW) which actually does look a bit like the recent lack of warming. That is why it looks “impressive”.
what he has shown, if anything, is that something that DOES NOT rise is a good fit.
Pekka: ” ….my argument is a simple mathematical fact. You can see from the graphs that no full agreement is claimed for the last years. ”
You have stated no “mathematical facts” you have presented mistaken, hand-waving assertions. That is neither maths , nor fact.
Full agreement is claimed in that the supposed millikelvin accuracy, which is the headline feature in this presentation, is shown and claimed across the whole range. As I have clearly explained that is totally due to Vaughan messing up the filter.
Now I’m tired of arguing with proxies. I’m waiting for the author to address these issues. Thanks for trying to help him out but he has a far better understanding of all this than both of you put together and is big enough to answer for himself. So I will now prefer to discuss the issues directly with the author.
Waiting….
greg, “NO, he has not fitted to the function he is projecting he is fitting to F3(AGW) which actually does look a bit like the recent lack of warming. That is why it looks “impressive”.”
Yep, If we can get him to post the “test” he performed based on Leif’s suggestion, then we can compare that “fit” with another possible reality. As it is, his results nailed the “range of comfort”.
Since he compares the oceans with a “CPU” heat sink, when the sinks starts drifting to another state, the “fit” will diverge more. If I could get the spread sheet to work, I would make AGW equal to 2.5ln(Cf/Co) and include the underlying trend from circa 1816, since I personally think that other factors are involved, to get SAW II. It looks like it might be a nifty tool. I am impressed.
NO, he has not fitted to the function he is projecting he is fitting to F3(AGW) which actually does look a bit like the recent lack of warming. That is why it looks “impressive”.
Anyone who thinks the downturn in F3(AGW) at the end has some connection with “recent lack of warming” clearly doesn’t understand what’s going on. The downturn is purely an end-effect artifact of filtering, nothing else. Anticipating that people might try to read something more into it than was there, I annotated it to the effect that it was just an end-effect artifact of filtering. In retrospect I see I should have written several paragraphs making precisely that point, since one sentence seems to have failed to accomplish this. Greg Goodman is trying hard to read something into the downturn that simply is not there. Please stick to more substantial criticisms. There is absolutely no significance to the downturn in F3(AGW), it’s just randomness to be ignored.
F3 turns HadCRUT3 down by the same amount and for the same reason. Again it’s randomness to be ignored.
As I’ve pointed out earlier on this thread, F3(HadCRUT3 − SAW) − F3(AGW) is identical to within a double-precision rounding error to F3(HadCRUT3 – (SAW + AGW)). That is, if you “detrend” HadCRUT3 by SAW+AGW and only then apply F3, you actually get a tiny uptick at the right end, about 7% of the size of the downturn in F3(AGW).
And (in the hope that those who didn’t notice me saying it before might do so this time), THERE IS NO PADDING WITH ZEROS.
Absolutely none. Nothing is there. Nada. Vacuum. Nonexistence.
recap:
The exponential AGW totally changes from exponential growth to being near flat. It is TOTALLY corrupted and fundamentally changed in character as is shown in figure 3.
Before discussing anything else here are you agreed that filling the window with zeros was a mistake, has no mathematical validity and corrupts the data?
Our comments crossed, see my reply above.
OK, thanks.
To clear a couple of side issues :
Never, what never? Well if the data is flat and zero for more than a window width the result would , accidentally, be correct. That does not mean it is “sometimes” mathematically correct, it is a trivial case where the wrong method gives the right answer. Let’s not get into silly word games.
Gaussian: as you well know a gaussian kernel is always a truncated gaussian. It produces a mathematically valid result to the precision determined by where the gaussian is cropped when designing the filter.
Now we’ve got the freshman questions out of the way, back to the spreadsheet.
“News to me. In the beginning it is −0.39 C. Padding with zeros on the left would have bent the left end up sharply. ”
You are indeed correct about the way AVERAGE() works and it is less dramatic than would be the case if zeros were added.
In any case both curves are similar in magnitude at the beginning, but the variance present in the observational data will be affected differently. The filter will not be doing what it is supposed to be doing since the window (hence the bandwidth) is reducing progressively in the first and last 10,8 and 6 years respectively. That means the corruption of the result will propagate back 24y from each end.
The corruption would be more serious if Excel counted the blanks but the result that I point to in figure 3 remains the same, whatever the mechanics of why, it is still the incorrect application of the filter. In contrast to the early end, the effects when the data have different variance and slope at the end are notable as can be seen in comparing figures 2 and 3.
In fact your exponential AGW ends up looking more like gaussian. Instead of an exponential rate of change, it near to zero.
As I also noted earlier, this accident makes is surprisingly similar to the observational data which has been essentially flat for the last 16 years. If we can avoid knit picking on that one, the filtered hadCrut3 is actually rising more that unfiltered temps as would be expected with the intended filter.
Were it not for this ‘happy accident’ there would be a significant deviation at the end of the data and your “millikelvin” result is out of the window.
If you don’t accept that , run the AGW function 25y further and re-run the filter, now you will get the correct result, something quite similar to the unfiltered AGW right the way through. The mK MRES is now shot to bits. I’d guess something of the order of 100mK at the end.
Now you may want to re-run the LSQ to minimise variance of MRES as before but I’m sure you’ll have a good idea what will happen when you do that.
I’m sure you’ve already run through that process anyway without me spelling it out, it’s obvious enough. If it was still saying “within a millikelvin” I’m sure you would have pointed it out by now.
My main point in all this is that the mK result is only obtained because the F3(AGW) if fundamentally different in form at the end. This is the critical part when all such 3K/doubling models fail match the data. The only reason yours appears to have a small residual is because you did not fit the exponential AGW but the “gaussian” F3(AGW).
If you don’t agree, please fit the exponential AGW , correctly filtered and show the correct MRES residual.
Please avoid diverting elsewhere until we have some common ground on this essential point.
regards, Greg.
So here’s my take on all this, make of it what you will.
What I did is mathematically identical to obtaining MRES as F3(HadCRUT3 − (SAW+AGW)), by linearity of F3. (Column AA of my spreadsheet confirms linearity of F3 numerically for those who prefer computation to algebra.) Hence Greg’s concerns about filtering only enter at the last step, applying F3.
But why even bother to apply F3? Well, you could try minimizing the variance of HadCRUT3 − (SAW+AGW), which is standard practice. Why deviate from standard practice with a dubious filtering step?
The problem with standard practice is that MRES is essentially invisible, being drowned in all the noise of the curve constituting SOL+DEC. The effect is to greatly widen the minimum, making it impossible to detect a sharp minimum.
F3 was designed to take out SOL+DEC essentially completely (below 0.4%) while bending up sharply enough to be 5x as sensitive to 23-year periods (2%) and way more sensitive to yet lower frequencies (40% at 42 year periods). This sharpens the minimum (or local minima) enormously!
With that as motivation for F3, let’s consider the impact of the errors it introduces at the ends. These errors can be clearly seen in the plot of MRES.
If we follow Greg’s recommendation to chop say 20 years off each end of MRES as being unreliable, then we should aim to minimize the variance (or standard deviation, same effect) of MRES over the period 1870 to 1990 rather than the whole period 1850-2010.
=================================
END OF FIRST PART
START OF SECOND PART
(for convenience of reference in subsequent discussion)
=================================
The experiment Leif Svalgaard asked me to do was simply to apply to SSN (the time series of sunspot numbers since 1750) and to HMF (the time series of the heliospheric magnetic field since 1835) the same filter, namely F3′ – F3’*F3, that I applied to HadCRUT3 to reveal the HALE cycle at the top of Figure 9 in my poster. (Although good there are yet better filters for this purpose and I’ll try some out soon.) I did so and sent him this plot which he then put on his research page for all to see, all good.
I found the green curve, for CET, particularly interesting. The first half is clean, the second half much dirtier. Evidently mankind got the upper hand over nature in that little neck of the woods (no reflection on you, Tony and Latimer, you’re just the legatees of your great-great-grandancestors’ chemistry kits and stinkbombs).
Much the same seems to have happened with HadCRUT3 except that population x technology only achieved the same density per square meter much later.
If I were trying to observe nature I would expect it to be easier to estimate the parameters using data that humans had not sullied with their creative genius. For CET that would mean doing so using the first half.
For HadCRUT3, based on what I’ve seen there I would be inclined to shift the afore-mentioned 1990 limit back to 1950. This would mean minimizing the variance of MRES over 1870-1950 rather than the 1870-1990 interval that should more or less satisfy Greg.
The fit in the poster actually minimized MRES over 1850-1950. Greg and I would agree that this is suboptimal on the left, so this morning I moved the left limit (called “CleanBegin” in the Excel Names dictionary) to 1870 so there would be no doubt.
Keeping an eye on std dev for CleanPeriod (= CleanBegin:CleanEnd = 1870:1950), namely MAIN!AA35, I adjusted the sliders little by little for a while to move towards a minimum (what, you want that stinking Nelder-Mead algorithm to automate me out of a job?), and found a pretty good minimum (PGM (TM)) at the following values for the nine parameters.
Sawtooth:
Period 151.4 years
Trigger 1924.5 CE (AD)
Amplitude: 0.18 C
Harmonics 4 and 5:
Scale4: 1/8 (0.125)
Scale5: 1/2 (0.5)
tShift4/5: 1/40 (.025)
AGW
GWDelay: 14.75 years (“Hansen delay”, Li’l Abner was 9 mo older)
NatCO2: 287 ppmv (preindustrial estimate)
ClimSens: 2.83 C/doubling of CO2
That combination delivers a standard deviation for MRES from 1870 to 1950 of 203 microkelvins. You can squeeze a few more uK out of my spreadsheet by using less “round” fractions, but only a very few.
The bulge at 1970 refused to go away. I still don’t know if it’s real or just a signal-processing hallucination. Originally I assumed the latter, currently I’m leaning towards the former, but would be happy to listen to arguments for either.
With the 1870-1950 range, my title of “to within a millikelvin” therefore is effectively claiming “to within five standard deviations.” What’s the odds of a five-sigma result in climate hacking? This could only happen if either (a) I’ve made a fundamental error somewhere (Greg’s default assumption), or (b) SAW, AGW, and that strange bulge at 1970 are the only components of recent secular (= multidecadal) climate, to within a fraction of a millikelvin (my default assumption).
A conversation about the dimension of F3(HadCRUT3) for 1870-1950 in the light of a standard deviation of two hundred microkelvins would seem to be in order. While I have some ideas about that topic, it could be a very long conversation as I don’t see people coming to any sort of consensus on it any time soon. It just gores too many oxen.
Vaughn,
A few points:
I am wondering what effect the contribution of the two other GHG’s– methane and N2O should have in your analysis. They’ve also seen large increases since preindustrial times of similar magnitude to CO2 and while of course they don’t have the overall size of effect that CO2 has, their effect is still not insignificant.
Also, the MRES bulges at 1970 and 2000 have me more than puzzled. Processing effects or air pollution “warming” both seem unpalatable and lead me to suspect something else. Of the two, I suppose I’d go with the processing effects, but you might also note that N2O increased dramatically during the 1950 to 1970 period as did methane output. These could provide some nontrivial positive forcing that your filtering is not accounting for.
To save people from having to enter all those number manually, I’ve put the adjusted spreadsheet here.
Sorry, that was just a jpeg from the spreadsheet. With any luck the real McCoy is here.
you might also note that N2O increased dramatically during the 1950 to 1970 period as did methane output. These could provide some nontrivial positive forcing that your filtering is not accounting for.
You may well be right. Pollutants of the 1960s is a subject well above my pay grade.
Vaughan Pratt | December 13, 2012 at 12:21 am said: ”The experiment Leif Svalgaard asked me to do was simply to apply to SSN (the time series of sunspot numbers since 1750) ”
Vaughn, to bring you to the real world, try to match Svalgaard’s CON ”sunspots” with the truth / reality. Ask him to to face the truth also:
IS DOUBLE CON BETTER
The leading ‘’Skeptics’’ realized that: it’s easier with a telescope to see distant objects in details -> concocted that: Galileo, and after him, people were observing the sunspots. Then they added that: since 6000years ago, Chinese were absorbing and documenting sunspots. So, they falsified for every year in the last few thousand years – sunspots to fit their original lies and misleading GLOBAL temp charts… PERFECT FIT! Marvelous… crap!
In reality, for the first time a filter was made, to see that the surface of the sun is not just red; but has sunspots; in 2004-6. Before that, for 100y they were blocking the sun with a cardboard and observing the sun-flare; NOT sunspots!!! Because the sun-flares from the corona were going in 8 minutes, where the earth will be in 6 months; the flares that affected the earth directly were blocked… wasn’t any benefit. B] looking directly at the sun, in 7-8 minutes; you will not see any sunspots, BUT, will see sunspots after for a day, even in a completely dark room; and you will never see anything else in your life.
C] if you look at the sun with a telescope, will burn your eyes COMPLETELY in half the time, than looking direct at the sun. Depends the power of the telescope; in 2-3 seconds complete blindness – in 10 seconds, your head will be steaming – in 2-3 minutes: the light through your eye socket would be going out from the back of your head. Galileo wasn’t so stupid, to look at the sun; he was looking at Jupiter. But the ‘’Fake Skeptics’’ to make the skeptical people to appear as bigger liars than the Warmist -> made for every year their ‘’forgery sunspots’’ to clip exactly to match their misleading global temp charts… what a criminal scam… to degrade the genuine skeptical people!..
D]Their phony GLOBAL temp charts for the past, were created from their phony ‘’proxy’’::: if records say: 12 bushels of grain per acre, in Yorkshire / England = was warm year, on the whole planet. Next year only 11,2 bushels; they made official: colder year on the WHOLE planet by 0,4C. Next year locust, or neighbor’s goats damaged the grain; only 9,3 bushels -> mini ice age declared officially on their ‘’GLOBAL’’ temp charts. Therefore: if the neighbor got drunk in the tavern, instead of looking after his goats; the extra bottle of vino; changed the number of the sunspots…?! miracle, or a grotesque CON, by the ‘’leading’’ Fake Skeptics…
E] if Colorado canyon alluvial deposits say that: for certain period in the past was more rain, or less – for the Original Swindlers, that was telling the temp on the WHOLE planet…? Instead of admitting that: those deposits cannot even tell about the rainfall for the whole state of Colorado. Because they have being declaring: Paleocene, Eocene, Crapocene – phony GLOBAL temp cycles = what a scam, declared as official records, by the original scum. Therefore, to cover up the mountains of the original Pagan lies – GLOBAL temp charts, which look as seismographs, with precision to one hundredth of a degree – they made the ‘’Sunspots Forgery’’ to support the biggest continuous con, since Darwin published his book. Before that; the climate entirely depended on St. Peter’s mood.
Would falsifying sun’s activity chart, make the politicians, media; and especially Mann, Hansen: to admit that they are lying about the phony GLOBAL warming? NOP, they and the bias media know the date in 2004, when the first time powerful filter was used, to see details on the surface of the sun; and the company that made that filter. They keep under their sleeve that proof, to be used, when is most important time; to rub ”Skeptic’s” nose in public…
to support the biggest continuous con, since Darwin published his book.
How about quasicrystals? Are they a con too?
stefanthedenier | December 13, 2012 at 1:19 am
…they made the ‘’Sunspots Forgery’’ to support the biggest continuous con, since Darwin published his book…
Very amusing, almost Vuk-or-Mann quality.
lsvalgaard | December 13, 2012 at 1:35 am lied: ”Very amusing, almost Vuk-or-Mann quality”
NO, the truth is not ”amusing” for you, but nightmare…
YES, they made the ‘’Sunspots Forgery’’ to support the biggest continuous con, since Darwin published his book!! Yes, before Darwin’s book, the climate entirely depended on St. Peter’s mood. Then the con opportunist evolved -> the planet started getting into global warming every summer / into ”global” cooling every winter. their ”GLOBAL” temp charts .become as seismologist charts.
Then a new, bigger caliber conmen arrived… when 7 years ago was discovered that the sun has ”sunspots” is not just red -> shameless opportunist as you / Svalgaard jumped constructing / promoting, the biggest lie: they created ”sunspots” to exactly fit the previous lies, for milenias.
Svalgaard, you should go to every blog, and apologize to everybody you have being lying.about the 1000y and more ‘sunspots”!!! On one blog they were referring to you as: ”eminent astronomer” … (no wander why your mob are obsessed in silencing me and the truth)
On a witness stand, under oath, you cannot say: ”Very amusing, almost Vuk-or-Mann quality” – but you have to justify for your despicable lies – you will have to demonstrate: how were sunspots counted, before the invention of that powerful filter. To demonstrate with, AND without a telescope!
Instead of trying to CON Vaughn, for him to legitimize your lies; explain first: how are you going to prove to the jury about the correct number of ”documented sunspots” for the last 997 years, before 1990 AD?!
Explain, or brown paper bag over your head – as the biggest con of the new millenia. I’m challenging: all the nutters that believe Svalgaard, to go in the backyard tomorrow and count the number of sunspots. Don’t worry, with a telescope, the sun would burn completely your eyes, much quicker, than without one. Then you will see, not sunspots; but what kind of character Svalgard,is – by him lying about past number of sunspots – to cover up lies supported by people like Tony Brown and similar. .
P.s. about a year ago; I pointed to Vuk, exactly what I’m pointing to you now. His proof was: giving me a tread, to see a picture of Galileo with his telescope… WOW! So, comparing me with Vuk & Mann. you are putting yourself even lower, please apologize – because them two believe in phony GLOBAL warmings / same as you!!!! I ”know” that all GLOBAL warmings and GLOBAL Ice ages are con / lies / sick propaganda. On the other hand: I know that: climatic changes are constant / some good other bad. Human can improve the climate, to a degree – because H2O controls the climate. BUT, global warmings are the real con, supported by you, Vukcevic and Mann. If you have any ”honor” as those nutters refereed, you will apologize to me, AND to all the nutters you succeed, or tried to con
No way, Jose. You seem to be among the nuttiest of them all.
It doesn’t matter. I don’t think anyone respects you enough to accept your apology in the first place.
lsvalgaard | December 13, 2012 at 9:15 pm said: ”No way, Jose. You seem to be among the nuttiest of them all”
ISVALGAAARD THE FORGER
Attention everybody: here is how the ”eminent conman Isvalgaard” is scared from the truth. Lying constantly throughout the blogosphere about ”sunspots for 1000years – when confronted with the truth; that’s his big defense for his lies… lsvalgaard, if I’m ”the nuttiest of them all” how come I can expose completely, your shameless lies? WHAT DOES THAT MAKES YOU?! How many people did get blind, to count sunspots for you, for the last 1000years????!!!! see people what kind of characters are succeeding to manipulate your trust in people!
You misspell my name, it should be LSVALGAARD
No you don’t understand. True to his moniker, Stefan denies that is how your name is spelled.
What does it matter how your unpronounceable foreign name is spelled on frickkin’ blog? It’s not like the misspelling is going on a passport or something. I’ll just call you Lief Smellsgold from now on. Everyone will know who I mean.
Vaughan Pratt,
995 comments have been posted on this thread so far. Most are way over my head and not my area of expertise (I confess I haven’t read most of them). Could I urge you to make a succinct summary, and especially focus on what is important.
Could you please include an explanation of what is relevant for informing policy, if anything?
If what you’ve done proves to be correct, what does it mean for our understanding of climate sensitivity? Can you say if this work changes our understanding of the central estimate or uncertainty of climate sensitivity?
Since the comments are all over the shop they’re hard to summarize, Peter. Currently Greg Goodman and Mike Jordan are disputing the soundness of my analysis, so we should wait a bit to see where that ends up — maybe they’re right, maybe I am, but let’s wait till things settle down a bit, hoping they do.
The relevance to policy is extremely unclear because I’ve only tried to describe what happened over the past 160 years. I’ve offered a little speculation as to why SAW and AGW happened, and would put more faith in the latter. But predicting the future is always hard, and made harder by the uncertainty of where future CO2 emissions are headed. Western Civ might reduce them, but 3rd world countries might fill that gap. And melting permafrost might release a lot of high-global-warming-potential methane, but we don’t have enough experience with that to say anything sensible about it.
Regarding the impact of my analysis, I would say it merely confirms existing analyses of what”s happened and of what the better models show. However I put far more faith in describing history than in those models because ultimately they’re adjusted to agree with history, making history our main predictor for the future. Which as I said is subject to considerable uncertainties about future CO2 and methane.
One interesting aspect is this question of whether SAW is one phenomenon or many, and if the former what is it. If it turns out to be something to do with rotation of the core relative to the crust as I was speculating, this would be an example of something no model could have predicted since there’s no basis for putting it in any existing model. (And by the same token there’s no basis for believing in that speculation to begin with, as Greg Goodman would surely agree.)
On the other hand those are the main uncertainties. I’m not aware of others that will make much of a difference, short of being hit by an asteroid or terrorists stealing and deploying some failing state’s WMD’s.
Currently Greg Goodman and Mike Jordan
–> Mike Jonas (but both the statistician Mike Jordan and the basketball player Mike Jordan might dispute it too).
Vaughan Pratt,
Thank you for your response. I understand that there will be ongoing discussion about whether the method is correct, meaningful, reliable, etc. I was hoping for a simple summary like you might give to a policy adviser if he could give you just 5 minutes. I’ll ask my question a different way?
Assuming your method turns out to be valid:
1. does it suggest any changes to the central value of climate sensitivity?
2. does it now or is it likely to reduce the uncertainty on climate sensitivity.
The other points you made about how population might grow, future emissions rates, etc are a different issue. What I mean by this is that, IMO, there are four key input parameters for doing cost benefit analyses and probably also for robust analysis. They are:
1. climate sensitivity [1]
2. damage function [1]
3. decarbonisation rate [1, 2]
4. probability (and uncertainty) that the proposed solution (e.g. carbon pricing) will achieve the objective (e.g. of controlling the climate in the way expected).
I suspect your method might be able to help to improve the central estimate and uncertainty for #1, but would not not throw any light on #2, #3 or #4.
[1] William Nordhaus, 2008 A Questrion of Balance, Table 7-2, p 130
http://judithcurry.com/2012/12/04/multidecadal-climate-to-within-a-millikelvin/#comment-276226
[2] Roger Pielke Jr. Decelerating decarbonisation of the global economy http://rogerpielkejr.blogspot.com.au/2010/07/decelerating-decarbonization-of-global.html
Or the article in Nature: http://sciencepolicy.colorado.edu/admin/publication_files/resource-2593-2008.08.pdf
“Assuming your method turns out to be valid:”
Let’s try to establish that point first rather than inviting him to divert the discussion once again.
@Peter Lang: 1. does it suggest any changes to the central value of climate sensitivity?
No, 2.83 is well within the generally accepted error bounds, in fact close to the middle.
One caveat however: the accuracy of this estimate cannot be better than that of what I called “Hansen delay,” namely the delay while waiting for the top hundred meters or so of the ocean to respond to GHG radiative forcing. I estimated this at 15 years, but my method of estimating this parameter is less sensitive than for the other parameters.
I would therefore recommend estimating Hansen delay by several methods, both empirical and theoretical, before putting too much credence in it. I plan to do some of this myself. If the consensus of several methods suggested a figure more like 10 years then my fitting method would put climate sensitivity at 2.55 C/doubling of CO2, while 20 years would indicate 3.2 C/doubling.
The optimist in me hopes it will turn out to be somewhere in the middle of the range 10-15 years; if so that would indicate a less pessimistic sensitivity than 2.83 C/doubling. 2.83 is actually quite bad were it to keep up, resulting in a 4 C rise between now and 2100. 3.2 C/doubling would be truly catastrophic.
2. does it now or is it likely to reduce the uncertainty on climate sensitivity.
Certainly not now since it hasn’t even been peer reviewed let alone debated seriously. Currently it’s not even at the level of being taken seriously by anyone but its author!
If it is taken seriously eventually, subject to getting Hansen delay nailed down better, then yes, it will very sharply reduce uncertainty on climate sensitivity. Personally I trust empirical observation over theoretical modeling, particularly in so complex a thing as the planet’s climate. The problem with all prior empirically based estimates is that they neglected Hansen delay, which as the figures above show makes a huge difference. Assuming it is zero results in an observed CS of 2 C/doubling even with the SAW model of ocean oscillations; other models of ocean oscillations give yet other sensitivities around that range.
there are four key input parameters for doing cost benefit analyses and probably also for robust analysis.
My focus has been on recent global climate change and I have not thought much about the damage function, decarbonisation rate, and expectations for proposed solutions, which I’m happy to leave to others. However it seems to me that as solar PV prices continue to decline they could work well in conjunction with cheaper energy storage technologies than we have today. The latter would act to filter out both the unpredictable (clouds) and predictable (night) solar outages. A wide range of energy storage options should be considered.
This only works for stationary power plants however, leaving mobile ones (cars, planes, boats too small to carry a stationary power plant) as an ongoing problem. I’ve therefore gotten interested lately in technologies for transportation energy, especially those that have been getting less attention than batteries, which is a mobile storage technology that I haven’t paid any attention to myself.
Circular logic at least makes sense. What’s with people abusing proxies?
Upper mixing layer lag. Hmmm?
http://www.ecd.bnl.gov/steve/schwartz.html
8.5 years +/- 2.5 years.
Vaughan Pratt | December 13, 2012 at 5:24 pm said: ”One caveat however: the accuracy of this estimate cannot be better than that of what I called “Hansen delay,” namely the delay while waiting for the top hundred meters or so of the ocean to respond to GHG radiative forcing. I estimated this at 15 years, but my method of estimating this parameter is less sensitive than for the other parameters”
Vaughn, before you start wasting more of your life on ”CON” estimates; here is a small doze of reality::.water temp doesn’t wait 15years, to readjust!!! As soon as it gets warmer; for any reason – as submarine volcanoes / hot vents extra activity -> evaporation increases, evaporation is INSTANT COOLING -> more evaporation = more clouds; clouds are the ”SUN UMBRELLAS” for the sea and land. More clouds = more rain – rain cools the land and oceans. readjustment takes 2-3months, not 15years!!!
You better start learning about the ”SELF ADJUSTING MECHANISMS” that the good lord created – before you start ”estimating” why the universe is spinning around the earth, with 15 years delay
Vaughan Pratt,
Thank you for your reply. I don’t think you would provide an answer like this to a policy adviser, would you?
I got this bit out of it:
I am not sure if the 2.83 sensitivity you mention is a figure that emerges from your analysis or is, in effect, a regurgitation of inputs.
However, this assertion seriously detracts from your statementr and damages your credibility: “resulting in a 4 C rise between now and 2100. 3.2 C/doubling would be truly catastrophic”. This part is nothing more than a statement of your personal belief. Assertions of catastrophe like this discredit your whole analysis because it shows you have an agenda to prove the beliefs you already hold. The statement is not a conclusion you can draw from your analysis. The estimates of future costs and benefits of AGW depend on the damage function which we know little about and the decarbonisation rate which could and probably will increase rapidly over the coming decades. So you’ve mixed your beliefs with your analysis and made totally unsubstantiated assertions.
Vaughan, you repeat the nonsense about solar power that you have stated many times before on previous threads and I refuted repeatedly. Your advocacy of solar power is purely ideological. Solar power provides about 0.2% of world electricity, and that is only because of very high subsidies. Solar power (PV and solar thermal) is hugely expensive, totally uneconomic, unreliable, cannot respond to demand, requires about an order of magnitude more materials per unit of electricity delivered than nuclear and causes more fatalities than nuclear per unit of electricity supplied. It’s ridiculous to be advocating it.
Continually pushing this irrational belief shows that your ideological beliefs strongly influence your thinking. Energy storage is not in the ballpark of being economically viable. To be viable solar generation plus transmission plus storage would have to provide reliable power on demand, 24/367 and the total costs would have to be cheaper than fossil fuels and nuclear. It won’t happen in the foreseeable future, or probably ever. It’s a Lefties’ dream. Arguing for these irrational polices and blocking rational policies is what is delaying progress. ‘Progressives’ have been blocking progress for 50 years!
By the way, I just happen to have the following prepared which shows that the newest, largest and state of the art solar thermal power station with storage is being constructed in California. Its cost is $19/W average power delivered. A nuclear plant would be about one third the cost and avoid three times more CO2 (compared on the basis of equivalent generating capacity).
Ivanpah http://www.ecc-conference.org/past-conferences/2012/BrightSource_ECC_Presentation_combined.pdf
Nameplate capacity = 370 MW.
Expected average energy generation per year = 1,000,000 MWh.
This means average power output is 114 MW (about 1/10th of a new nuclear plant).
Capacity factor is 31%.
Cost = US $2.2 billion = $19/Watt average electricity supplied.
This is 3x the cost of some recent nuclear power plant builds that most environmentalists have accused of being prohibitively expensive.
The heliostats used in the project weigh in at 30,000 tonnes. That’s 262 tons of heliostats per MW electric average. That’s just for the heliostats, not even the foundations, not to mention the tower and power block.
The power plant area that had to be bulldozed over is 20x larger than a nuclear reactor of equivalent average (real) capacity (twin unit AP1000).
Lastly, nuclear is safer than any other electricity generation technology, including wind and solar:
http://nextbigfuture.com/2012/06/deaths-by-energy-source-in-forbes.html
@Peter Lang: Thank you for your reply. I don’t think you would provide an answer like this to a policy adviser, would you?
As many have said (starting with Cicero?), if I’d had more time I could have given a shorter answer. With a policy adviser I’d spend more time formulating the answer before giving it than any reasonable person can afford in responding to blog comments. I would assume the same for you.
I am not sure if the 2.83 sensitivity you mention is a figure that emerges from your analysis or is, in effect, a regurgitation of inputs.
The former. It emerges from a least squares fit to the SAW+AGW model, which makes no commitment at all to 1 C or 10 C per doubling. These numbers come primarily from HadCRUT3 with additional support from the Mauna Loa Observatory CO2 data.
this assertion seriously detracts from your statement: “3.2 C/doubling would be truly catastrophic.”
Sorry about that, I was guessing it would be catastrophic without looking at the spreadsheet. Now that I look I see it says that with 3.2 sensitivity the temperature should only rise 4.4 C over current temperatures. Not as bad as I’d imagined.
Anyway it’s just a spreadsheet. If my spreadsheet could predict the future reliably I could get rich with it.
Solar power (PV and solar thermal) is hugely expensive, totally uneconomic, unreliable, cannot respond to demand, requires about an order of magnitude more materials per unit of electricity delivered than nuclear and causes more fatalities than nuclear per unit of electricity supplied.
Excellent, we agree that electricity is hazardous. I hadn’t realized solar electricity was more hazardous than nuclear however, not sure what the mechanism would be—skin cancer, maybe? Your electricity is much more hazardous than ours because it’s at 240V instead of 110V. You could save a lot of lives by persuading Australia to adopt 110V.
Anyway I’ve taken my life in my hands and put 7.5KW of PV on my roof. My annual $6K electricity bill dropped to $600 and will have paid for itself in 2-3 more years, but that’s just personal experience, YMMV.
Back when I got it half the cost was in the panels, but with wholesale panel prices down to a dollar a watt and still falling the cost is mainly in the installation today. In order to compete on price installers are going to have decrease their installation costs by increasing their installation efficiency, which currently is way too low. I wouldn’t want to be in the PV power market myself for the long haul, the margins are going to become razor-thin in due course. Pekka gets less sun that we do in California so PV might not serve him as well as it does us.
Energy storage is not in the ballpark of being economically viable.
Excellent, we agree on that too. That’s exactly why I was proposing the need for research into making it economically viable.
Good luck with your nuclear proposal. How have your local, state, and federal governments been responding? And in which countries does a majority of the population prefer nuclear over other sources of power?
Vaughan Pratt,
How can your spreadsheet say waht the temperature increase to 2100 when you have no idea what the emissions trajectory will be?
Intentionally misleading, Dishonest. The point was not about electricity being hazardous as you well know. Is that a fair indication of your lack of professional and personal integrity? Given previous interactions I believe it is.
Well, you haven’t done much research on it over the past 30 years, have you? You didn’t even bother to look at the reference I linked to (and follow the links to the authoritative sources if you are not satisfied).
That’s after subsidies by taxpayers and other consumers who are paying for your system. You know that. Again you are being intentionally misleading and dishonest.
This is a case of a mad scientist with not the slightest concept of money or economics proposing we waste money on ridiculous schemes that have no chance of being viable or achieving the stated objectives. Meanwhile these same scientists oppose economically rational solutions. Given this, why should we trust them on their advocacy about catastrophic climate change? They’ve demonstrated they don’t have any credibility, and in the case of this one, dishonest as well.
Is that your rational argument? You could equally ask in what countries do people want a carbon tax?
Unbelievable. Is this an example of a typical Climate Scientist?
Is this an example of the sort of mad scientists that are leading us to waste trillions of dollars on mitigation policies to combat CAGW?
dallas salad apparently only does numerology and is unable to understand diffusion and the long time scales that a diffusional response entails.
Peter Lang: proposing we waste money on ridiculous schemes that have no chance of being viable
Even several years after the Wright brothers had demonstrated that heavier-than-air flight was feasible, the French aeronautical “experts” were still carrying on exactly like you. Eventually the Wright brothers had to ship their plane to France and demonstrate it in person in front of them before they would shut up.
How can your spreadsheet say what the temperature increase to 2100 when you have no idea what the emissions trajectory will be?
Please read my poster more carefully. It draws a careful distinction between extrapolation and forecasting. There is no guarantee that extrapolation of a fitted function will bear any relationship to what will happen in the future.
Vaughan Pratt
@ December 14, 2012 at 4:20 am
That is obfuscation. It is pathetic. You can make no rational argument, so resort to stupid comments like the Wright brothers were right so I might be too.
Based on your Wright brothers argument you may as well make up any loony idea you want and use the Wright brothers argument as your justification.
Have you considered piping hydrogen from the Sun? The supply would be unlimited? Your justification is just as valid for that idea.
‘Mad scientist’ is confirmed! Loony Left ideologue is also confirmed.
The nonsense you and your comrades keep spewing out is delaying progress and wasting billions.
Vaughan Pratt,
@December 14, 2012 at 4:33 am
Here is another example of your dishonest arguing tactics.
In your first comment you said:
I asked:
How can your spreadsheet say what the temperature increase to 2100 [will be] when you have no idea what the emissions trajectory will be?
You did not answer my question, but instead said:
So, instead of answering my question which was in response to your clearly BS statement, you attempted to diverted from answering the question.
Please answer the question, or acknowledge you are BS-ing (again!).
Vaughan Pratt
You write to Peter Lang
This is a key problem with your analysis IMO (as I have written).
It ignores two real physical constraints on human CO2 emissions (plus resulting warming) in the future:
– changes in human population growth rates
– total carbon contained in remaining fossil fuel reserves
As a result, it is practically worthless as a projection for the future, while it gives the impression to be exactly that, rather than simply an academic exercise in statistical extrapolation.
Max
@manacker: As a result, it is practically worthless as a projection for the future, while it gives the impression to be exactly that, rather than simply an academic exercise in statistical extrapolation.
How you got that out of my conclusion is a complete mystery to me, Max. It does not say one word about the future, neither as a projection nor as an extrapolation. The conclusion of the poster is that I have analyzed HadCRUT3 as a sum of three components, decadal, solar, and multidecadal, and further analyzed the last as a sum of two components. You have a most vivid imagination.
There is a side bar on the left that does extrapolate the main results, but it was intended only as a sidebar (the border is color-coded accordingly, off the red-orange-green-blue-violet resistor-rainbow progression) making the obvious extrapolation, which anyone could have made themselves without my help. I said explicitly that it was “simply the extrapolation of SAW and AGW” precisely so that people wouldn’t think I was making a projection.
In the main progression flowing from top left to the conclusion and discussion of mechanisms, there is not a single word about or hint of the future, not even extrapolation let alone projection.
Vaughan Pratt,
It seems you are compulsively dishonest and misleading. You said to Manacker:
Yet only a few hours ago you said to me:
In you own words you are using your tool to project/predict the temperature in 2100.
Have you considered piping hydrogen from the Sun? The supply would be unlimited?
Interested in being on retainer? That’s a real moon-shot idea (ok, sun-shot). For a non-scientist you’re generating crazier blue-sky ideas than most of my colleagues. Combine that with a good idea filter and we might have something.
Vaughan Pratt,
More dishonesty. It never ends how you twist everything others say does it?
Peter, you’ve confused the conversation between Max and me with the conversation between my poster and the AGU participants. My poster addressed the latter, not Max, and was at pains not to speak about the future (except for the offending Figure 7 in the offline sidebar at the left).
Max asked me (not my poster) about the future, since he’s very fond of predicting it, and I (not my poster) answered him accordingly.
I would not say such a thing to any AGU audience unless they started behaving like Max and predicting the future. Max has been doing so for a long time now. He seems to get very worked up whenever he sees any analysis of the past that he interprets as being incompatible with his predictions of the future, and assumes that the analyzer must therefore share his interest in the future, regardless of whether that’s actually the case.
When I was approaching 20 I was very interested in the future. As I approach 70 I find my interests turning to the past. Funny how that happens.
Vaughan Pratt,
You continue posting one dishonest comment after another, intentionally twisting what’s been said. You know full well that my last response was to your preceding comment and they had nothing to do with Max’s comments. Now you’ve done it again, by trying to make out the argument was about Max’s comment. Habitual liar is a thought that comes to my mind.
Where this got started is that you provided a gobbledygook answer to my first question about climate sensitivity. When I rephrased my question and gave some background to my reason for asking it, you went way outside your area of expertise and turned to stating your opinions (based on you ideological beliefs) about how much your tool says the planet will warm by 2100 (4.4C you said based on 3.2C equilibrium climate sensitivity).
You also repeated your baseless, unfounded beliefs about solar power being a viable option for reducing global GHG emissions and arguing solar panels provide cheap power. I defrocked your silly beliefs again, as I have done every time you’ve raised them.
The more you write the more you demonstrate you couldn’t be trusted on anything. You’re not objective and you use dishonesty, obfuscation and other devious methods in arguing.
Let me ask you this, Peter. What proportion of those who disagree with you on blogs do you judge as doing so because they are filthy liars?
And of the others, why would you say they disagree with you?
I liked Vaughan’s response to the pinhead prankster Lang regarding PV.
Individual adopters will generate the data necessary to judge the utility of PV schemes, and as Vaughan said, more research can’t hurt.
Simple summary:
Vaughan Pratt assumed that climate consisted of IPCC-AGW and something else.
His finding was that the climate consisted of IPCC-AGW and something else.
Now, if we had learned something of value about the ‘something else’, then there could have been merit in his argument. But we didn’t. The ‘something else’s only characteristic was that it could be represented by a combination of arbitrary sinewaves which bore no relationship to any natural phenomenon, and three box filters. The ‘something else’ began its short life as “all the so-called multidecadal ocean oscillations“, but that didn’t last long because it clearly could not be even remotely matched to the actual ocean oscillations. The ‘something else’ ended its short life as a lame “whatever its origins“. The sum total of Vaughan Pratt’s argument is precisely zero.
There’s more detail at http://wattsupwiththat.com/2012/12/13/circular-logic-not-worth-a-millikelvin/
Vaughan Pratt assumed that F. His finding was F.
The “emperor has no clothes” gambit. Oh, well played, Mike. Mate in one, how could I have overlooked that? ;)
Mike, I would agree with your “simple summary” with two small modifications: replace the first F by F(v) and the second by F(V). My clothes will remain invisible to the denizens of Bill Gates’ case-insensitive world, but Linux hackers will continue to admire my magnificent clothing.
Here F is a function of a 9-tuple v of variables, or free parameters v_1 through v_9, while V is a 9-tuple of reals, or values V_1 through V_9 for those parameters (a valuation in the terminology of logic).
F(v) is a smooth 9-dimensional space whose points are curves expressible as analytic functions of y (smooth because F is an analytic function of the variables and therefore changes smoothly when the variables do). F(V) is one of those curves.
To summarize:
1. I assumed F(v).
2. I found F(V) (just as you said, modulo case)
3. at the surface of F(v) very near F3(HadCRUT3).
That’s all I did. As you say, very simple.
If needed we can always make the simple difficult as follows. With the additional requirement that “near” is defined by the Euclidean or L2 metric (as opposed to say the L1 or taxicab metric), “near” means “least squares.” The least squares approach to estimation is perhaps the most basic of the wide range of techniques treated by estimation theory, on which there is a vast literature.
Least-squares fitting has the downside of exaggerating outliers and the advantage of Euclidean geometry, whose metric is the appropriate one for pre-urban or nontaxicab geometry. Euclidean geometry works just as nicely in higher dimensions as it does in three, thereby leveraging the spatial intuitions of those who think visually rather than verbally.
We picture F(v) as a 9-dimensional manifold (i.e. locally Euclidean) embedded in the higher-dimensional manifold of all possible time series for 1850-2010 inclusive. Without F3 the latter would be a 161-dimensional space. F3 cuts this very high-dimensional space down to a mere 7*2 = 14 dimensions, on the premise that 161/7 = 23 years is the shortest period still barely visible above the prevailing noise despite losing 20 dB. F3(HadCRUT3), H for short, is a point in this 14-dimensional space. The geometrical intuition here is that F3(HadCRUT3) is way closer to F(V) than HadCRUT3, not because F3 moved it anywhere but merely because the dimension decreased. Given two points near and far from a castle wall, the nearest point on the wall to either can be estimated much more accurately for the point near the wall than for the one far away. Whence F3. Isn’t geometry wonderful?
(The factor of two in 7*2 comes from the fact that the space of all sine waves of a given period 161/n years, for some n from 1 to 7, is two-dimensional, having as its two unit vectors sin and cos for that frequency (as first noticed by Fourier?). Letting our imagination run riot, the same factor of 2 is arrived at via De Moivre’s theorem exp(ix) = cos(x) + i sin(x) but that might be too complex for this blog—when I wrote to Martin Gardner in the mid-1970s to complain that his Scientific American column neglected complex numbers he wrote back to say they were a tad too complex for his Scientific American readers.)
We’d like F(V) to be the nearest point of F(v) to H in F(v), i.e the global minimum, though this may require a big search and we often settle for a local minimum, namely a point F(V) in F(v) that is nearest H among points in the neighborhood of F(V).
In either case MRES is the vector from F(V) to H, that is, H – F(V). Since manifolds are smooth, MRES is normal to (the surface of) F(v) at F(V). Hence very small adjustments to V will not change the length of MRES appreciably, as one would hope with a local minimum.
Hmm, better stop before I spout even more abstract nonsense. ;)
Vaughan Pratt – I find it interesting that you are unable to give a direct answer. Nonsense dressed up in complicated technical language is still nonsense. We don’t need to make the simple difficult, we can keep it simple. In the real world, your F(V) has no meaning.
@Mike Jonas: In the real world, your F(V) has no meaning.
To within MRES (which is practically zero), F(V) is the curve called MUL in Figure 11 of my poster, which is my estimate of the multidecadal component of HadCRUT3. That is, all observed climate variations slower than the 20-year Hale cycle of the Sun.
While I don’t know your criteria for meaningfulness, they would presumably disqualify as meaningful any approximation of the Moon’s orbit around the Earth as an ellipse.
Nonsense dressed up in complicated technical language is still nonsense.
If “dressing up” had no effect, Mike, no one would do it. You greatly underestimate the value of dressing up nonsense as abstract nonsense. Category theory is merely one example, universal algebra is another, the theory of Riemannian manifolds is yet another, and so on and so on. The vast body of literature on these subjects is much more than just solving crossword puzzles, it has enormous practical applications.
The geometrical interpretation of least squares fitting is a very powerful idea. Let me encourage you to study it.
Vaughan Pratt – In your jumble of nonsense, I took F(V) to mean SAW – the thing that you were fitting sinewaves to, not MUL which was the measured temperature. Had you given a straight answer instead of obfuscating then your meaning might have been clear.
No matter, the facts are simple, and your response is misdirected.
In your post, you take the difference between the measured temperature and IPCC-AGW. You then fit sinewaves to it. You then claim to have found that the components of measured temperature are just IPCC-AGW plus the sinewaves. In other words, you claim to have found that the components of measured temperature are just IPCC-AGW and the difference between the measured temperature and IPCC-AGW.
If the sinewaves actually meant something, there might be some value. But they don’t. You yourself walked away from any attempt to relate them to anything meaningful.
Your technobabble.about F(v), F(V), 9-tuples and so on is completely irrelevant. All that matters are the real world meanings of the major components MUL, SAW and AGW.
Hi Mike.
The jig is up. Check my comment below which contains SAW filter parameters which perfectly reproduce the temperature record with a climate sensitivity of ZERO.
ROFLMAO
> Had you given a straight answer instead of obfuscating then your meaning might have been clear.
Playful, Mike. Not obfuscating, playful.
Vaughan’s using a pedagogical trick.
We can surmise that this trick helped him during his teaching career to spot cooks.
Cooks might have been saying that he was obfuscating too.
Vaughan Pratt: “F3 was designed to take out SOL+DEC essentially completely (below 0.4%) while bending up sharply enough to be 5x as sensitive to 23-year periods (2%) and way more sensitive to yet lower frequencies (40% at 42 year periods). This sharpens the minimum (or local minima) enormously!
With that as motivation for F3, let’s consider the impact of the errors it introduces at the ends. These errors can be clearly seen in the plot of MRES.
If we follow Greg’s recommendation to chop say 20 years off each end of MRES as being unreliable, then we should aim to minimize the variance (or standard deviation, same effect) of MRES over the period 1870 to 1990 rather than the whole period 1850-2010.
”
You will recall that my first post on this was very positive.When I saw Vaughan’s filter I though , OMG, at last someone who understand signal processing and how to design a filter.
The problems arise in the implementation, as we have now agreed the first and last 25y of the data are not being passed through this superbly designed filter but some increasingly sloppy approximation of it.
Admittedly at first this will be a small error but if we are looking to evaluate mK accuracy even this can not be assumed to be correct. Neither is this just ‘end effects’. 25+25y is quite large proportion of 160y. Almost a third of the data is being incorrectly filtered.
“These errors can be clearly seen in the plot of MRES.”
No, the error, as I have stated several times is seen in figure 3 . It is approximately 140 mK not the several mK seen in MRES. I have already pointed this out. You are still trying to sweep this under the carpet and divert attention elsewhere.
140 mk in a total swing of about 800 is about 17.5% a far cry from the 0.4% pass band ripple you are touting.
I am saying that your implementation of the filter is invalid, I’m NOT saying that you should use this as an excuse to avoid including the last 20 years of data when your supposed climate “law” goes totally loses all contact with reality.
What I DID suggest is that you extend the analytical function so that filter would work correctly and so avoid the distortion.
This leaves the problem of the distortion of hadCrut3, which we cannot extend. but, as I already noted, we can see the distortion here is a lot less problematic. As I already detailed, the end values may be low by about 10 to 20mK but the form is not visibly distorted. That error is about an order magnitude smaller than the error in F3(AGW) so does not change the fundamental point I am making.
What I did request is that if you did not agree you do the numbers and post the result. You chose not to do so.
You know doing this will blow your mK residual claims out of the water which is why you are doing you damnedest to avoid addressing this issue and trying to divert the discussion elsewhere.
SSN, CET HMF fine. Save that for you next presentation.
Would you now kindly comment on the “within a mK” headline claim in the “paper” and poster, that you presented to AGU and the rest of the world here? Do you still consider this claim to be valid or is it, as I have clearly demonstrated, simply a result of F3 distorting AGW into something far more like climate than the 3K/doubling exponential you proposed?
Greg
Extending the analytical function serves no purpose in comparison with data. It could be done to produce a prediction of what filtered data should tell in distant future. In comparison with data the same filter must be used to the model and the data as is done in the spreadsheet.
It’s true that the latest points are misleading. The filter gets highly asymmetrical at the end. The very last point labeled 2010 presents a weighted average of the unfiltered data (or model results) that weights most heavily the years 2000-2007 with a weight of 6.4% for each of them. A slightly lower weight is given for the three last years (5.9% for year 2010). The average date of the last point falls to 2002 because all years since 1986 have some weight in the given value. Thus it’s very far from the nominal 2010. This is obviously misleading although not strictly wrong when the issue is understood.
Furthermore it’s obvious that several last points of the filtered data present almost the same information with weights that differ only little. That explains the flatness of the curves.
Pekka: “Extending the analytical function serves no purpose ”
I’m not suggesting long term extension , which ironically he does anyway. What I meant was extending the analytical AGW function 25 years at each end to the filter window is correctly populated and the filter does not screw up.
Ideally, the same treatment should be given to the data but obviously that cannot be done. But I have already discussed twice why that is not significant in making a truer evaluation of the residual.
” This is obviously misleading although not strictly wrong when the issue is understood.”
It is both misleading and strictly wrong. The filter was well designed but is not correctly applied after 1986. The frequency and phase response from then onwards will be less and less as predicted, in short it is a mess.
This is strictly wrong any way you want to look at it. I’m very surprised that someone with Vaughan’s knowledge and experience made such a blunder but we all make mistakes. The important thing is to admit them rather than to persist in misleading everyone with a false result and false claims.
However, he has yet to admit if was a mistake or that the result invalidates his “within a mK” claims. Still waiting for a statement on that.
Greg,
To me such an extension is something that must absolutely be avoided whenever any comparison with data is involved. As the data cannot be extended for filtering the model should not either. That’s the most certain conclusion for me. What to do with the late years is another matter. Cutting everything off 25 years before the end of the whole period is unnecessarily restrictive, but cutting off around 2000 might be a reasonable compromise. Then again the same filter must be applied to the data and to the model, no extension of model period is acceptable.
Just to check: I guess you are aware that the filtering is done in the way that weights of the years included are increased when the nominal time grows from 1985 to 2010. No zero values (or any other values) are imputed for years after 2010. Those years are just cut off from the calculation and the weights transferred uniformly to the years included at each of the three filtering steps.
PP. “Just to check: ”
sure , the shorter “average” , which is the origin of the broken filter, effectively distorts the weight given to each element once the window is not full due to the AVERAGE() fn truncating. At the limit of the last point in a single running mean, this is equivalent to the half filled window being mirrored about the end point. You say you are against continuing the function with its REAL values but seem more ready to accept tagging on a mirrored, thus descending exponential. Strange choice.
I agree that having corrected the error in F3(AGW) to give absolutely correct values there is still a problem with the observational data. I’ve covered that at least twice now so I suggest you read back on that, I’m not going to repeat it a third time.
The crux is, it’s not accurate enough for a proper analysis but IS accurate enough to establish that the residual MRES is nearer 140mk than around 8mK.
When I put Vaughan on the spot with this question he went rather quiet. Let’s assume he’s busy with other business and will shortly find time to reply.
Recap:
Vaughan, would you now kindly comment on the “within a mK” headline claim in the “paper” and poster, that you presented to AGU and the rest of the world here? Do you still consider this claim to be valid or is it, as I have clearly demonstrated, simply a result of F3 distorting AGW into something far more like climate than the 3K/doubling exponential you proposed?
Greg,
I repeat that for me the most essential thing is that the same filter is applied to the morel and the observations. That makes extrapolation impossible to accept.
If I understand correctly your 140 mK is just what one gets when one does what I and apparently also Vaughan considers absolutely forbidden. Thus it’s your problem, not his.
OK , once more you just keep repeating your unfounded assertions instead of reading and commenting on what I say. You now seem to think you can talk for Vaughan Pratt.
I have not seen any indication he has authorised you to speak for him so I’ll wait to get it from the horse’s mouth rather than discussing it with the hind legs.
It’s very rare that I disagree with Pekka, and when I do the odds are good that I’m the one in error. So I’m very happy that he’s able to respond faster than me. and to represent my viewpoint accurately to boot.
I’m probably just repeating Pekka’s points here, but since Greg wants to hear them from me, here goes. Not entirely in order:
What I DID suggest is that you extend the analytical function so that filter would work correctly and so avoid the distortion.
Sorry, I overlooked that (easily done when responding to a thousand comments). That would certainly fix the problem with Figure 3, but the downturn in Figure 2 is caused by the same phenomenon. So this would only be justifiable if HadCRUT3 was similarly extended, otherwise extending one without the other creates an artificial difference that the data does not justify. (The essentially flat temperature of 2000-2010 is real, and the trend for that decade cannot be changed in 2020 by including the temperature for 2010-2020 unless you define decadal trend in some other way.)
As Pekka put it, “In comparison with data the same filter must be used to the model and the data as is done in the spreadsheet.”
the first and last 25y of the data are not being passed through this superbly designed filter but some increasingly sloppy approximation of it.
Regarding 25y, you saw no problem being “sloppy” with a Gaussian filter, by truncating it. To be consistent you should apply the same rules to my filter as you would use for a Gaussian filter.
So: at what dB below the peak of a Gaussian filter would you be willing to truncate it? We can then use the same criterion to determine where to truncate my filter, using F3’s tabulated impulse response at MAIN!AQ240:AQ300 of the spreadsheet. This is also graphed in blue at the left of the table under “MRES IMPULSE RESPONSES”. You’ll notice the uncanny resemblance to a Gaussian filter. (I should have relabeled MRES1, MRES2, and MRES as respectively F1, F2, and F3.) At 25 years the impulse response of my filter is down far further than for any Gaussian filter, while at 20 years it is down by 20*log(.0433/.0032) = 22.6 dB, about the same as for a comparably shaped Gaussian filter.
No, the error, as I have stated several times is seen in figure 3 . It is approximately 140 mK not the several mK seen in MRES.
Certainly, but in the comparison with Figure 2 it is canceled out by an almost identical error in Figure 2. The error therefore has no impact (a) because it’s canceled and (b) because even if it wasn’t the fitting procedure isn’t affected at all by it because it does not depend on that region of MRES—the fitting “averts its eyes” just as I was recommending you do.
Regarding (a), one can use your reasoning to prove that Macy’s will explode soon because 50 people a minute are walking into it. This ignores the 50 people a minute that are walking out of it.
Better to count the net flux into Macy’s: people in minus people out. The counterpart here is to appeal to linearity of F3 to recast the comparison implied by
F3(HadCRUT3 − SAW) − F3(AGW)
as
F3(HadCRUT3 − (SAW + AGW)).
These two forms are identical even at the endpoints (cf. column AA of the spreadsheet that verifies linearity of F3 even at the endpoints, also provable analytically). What my spreadsheet does is identical (to within a rounding error) to what it would do when using this equivalent form instead.
This makes F3(AGW) by itself irrelevant. When HadCRUT3 − (SAW + AGW) is filtered by F3 (a) there is no 140 mK move at either end, only at most 10 mK.
Reason (b) is that even if there were a big move by any of these terms at the ends it wouldn’t matter because essentially the same parameters are obtained whether or not the two decades at each end are ignored. Those decades have no material impact on the fitting. I’m quite happy for the ends not to participate in the fitting. Moreover the parameters for the poster were obtained by ignoring not just 1990-2010 as you would like but 1950-2010, since that portion may have been corrupted in various ways by the burden humanity has placed on the planet. (This has the additional benefit of demonstrating the predictive power of the model: HadCRUT3 for 1850-1970 predicts the average temperature for each decade of 1970-2010 to within the variability of HALE, which is fairly predictable.)
@Pekka: Cutting everything off 25 years before the end of the whole period is unnecessarily restrictive, but cutting off around 2000 might be a reasonable compromise.
At 10 years from the end the impulse response of F3 is down by 20*log(.0433/.0252) = 4.7 dB, at 12 years 6 dB. So if Greg uses 6 dB as his cutoff for Gaussian filters, and if we include the data for 2011 and 2012, that would justify cutting off at 2000.
However the model predicts so remarkably well that it makes essentially no difference where we cut off, all the way down to 1950. It would appear that HadCRUT3 for 1850-1970 contains all the data that’s needed to very accurately tease apart the global warming signal and the ocean oscillations. I did not expect such a striking result when I started this project. Maybe there’s an error somewhere, but if so it is definitely not where Greg claims it is. The 140 mK downturn is a complete red herring for reasons (a) and (b) above.
@Greg: Do you still consider this claim to be valid or is it, as I have clearly demonstrated, simply a result of F3 distorting AGW into something far more like climate than the 3K/doubling exponential you proposed?
Seems like each of us is convinced we have “clearly demonstrated” the other to be wrong. Since Greg doesn’t seem to like how Pekka has been adjudicating this, we may need a fourth adjudicator that would be acceptable to Greg.
However the comments are accumulating faster than I can keep up with them so I may be responding to out-of-date assessments.
Vaughan Pratt, By the way, I have it on good authority [1] that the Earths core is not made of iron and nickel. It’s hydrogen.
[1] Omanuel http://judithcurry.com/2012/12/01/open-thread-weekend-4/#comment-273003
(Clearly, if the sun is made of Iron, the Earth’s core must be made of hydrogen to get the correct proportions of elements in the universe)
I have it on good authority that if a circle is a square, the moon is made of blue cheese.
What about a bunch of AGW squares sitting in a circle? A blue moon event you say. Think more on this please.
Ah, that would explain why the Earth does not need to rest on the back of a turtle, Peter. It simply floats like a hydrogen balloon. Brilliant.
Don’t worry we aren’t here any way…
Jam 4:14 Whereas ye know not what [shall be] on the morrow. For what [is] your life? It is even a vapour, that appeareth for a little time, and then vanisheth away.
http://news.yahoo.com/blogs/sideshow/whoa-physicists-testing-see-universe-computer-simulation-224525825.html
one way to put it; anyway.
I’m a little skeptical of the “we’re just a computer simulation” meme (which has been around for a while now).
There are two cases: the universe is a simulation that is being run on an actual computer (out there “somewhere” as Ed Fredkin likes to put it), or it is the *potential* for a simulation.
If the former (which for all we know might be an antiquated PDP8 with an impressively large tape drive), we might be able to tell this from limitations such as word length: maybe that’s where the Planck units come from, for example.
But if every run of the simulation gives the same outcome, what’s the difference between running the simulation and the possibility of running it? The denizens of the simulation will feel the same whether there’s one run or a hundred. So why shouldn’t they feel the same if there is no run, just the abstract possibility thereof?
But this then raises the question, what’s the difference between the laws governing a potential computer run and the laws of the universe that we’re taught in school and whose revisions earn a succession of Nobel prizes?
You tell me.
The hardware might simply be the matter and energy in the universe. The Big Bounce Theory is interesting in this regard as all the matter & energy in the universe endlessly expands and contracts. If determinism is true then each cycle should be identical to the previous cycle barring something external to the system altering it. Or perhaps mind is fundamentally different than matter and is the exception to determinism. If that’s the case then each cycle may be uniquely changed internally from the activities of the mind but probably not much. It’s hard to imagine human activities effecting the evolution of galaxies. Or even single stars. On the other hand we don’t have much data to go on when it comes to sentience in the universe with just the one known instance of it.
‘The Big Bounce’- where time runs backwards during the contraction phases and you will not ( do not?) know it:
http://www.spaceref.com/news/viewpr.html?pid=716
>> ‘The Big Bounce’- where time runs backwards during the contraction phases and you will not ( do not?) know it:
I think if my baldness started going away I would notice it.
VP, too good :)
I can’t top that.
I asked O’Manuel how the sun could have a pulsar core when the Chandeshekar Limit puts the minimum mass of a pulsar at 1.4 solar masses. The limit is based on both theoretical and measured values for the fundamental forces so as far as I can tell O’Manuel thinks the foundations of both experimental and theoretical physics is wrong. I don’t think he’s playing with a full deck but I could be wrong.
Pingback: Circular Logic not worth a Millikelvin | Watts Up With That?
Recap:
Vaughan, would you now kindly comment on the “within a mK” headline claim in the “paper” and poster, that you presented to AGU and the rest of the world here? Do you still consider this claim to be valid or is it, as I have clearly demonstrated, simply a result of F3 distorting AGW into something far more like climate than the 3K/doubling exponential you proposed?
Answered above.
Couldn’t have said it better myself.
My hat goes off in respect to Vaughan Pratt’s openness, honesty, and respectful replies.
Chad,
Not when if it might conflict with his ideological beliefs:
http://judithcurry.com/2012/12/04/multidecadal-climate-to-within-a-millikelvin/#comment-276381
I’m never quite sure whether Peter visits blogs to cure the ideologues or to save innocent bystanders from being lured into ideology. He certainly seems ideologically opposed to ideology.
Vaughan Pratt,
I am for economically rational policies and opposed to economically irrational policies. I don’t expect intelligent people to have totally closed minds to rational arguments (as you seem to have). Furthermore, using the clearly dishonest arguing tactics, as you frequently do, makes me wonder why you are a professor. Your dishonest arguing tactics reflect on the credibility of climate science and integrity of scientists. The message I take from your tactics is that none of of the CAGW alarmists can be trusted. That is the message you send. IMO, the other scientists here should bring you into line instead of ignoring your behaviour.
The good Christian should beware of mathematicians, and all those who make empty prophecies. The danger already exists that the mathematicians have made a covenant with the devil to darken the spirit and to confine man in the bonds of Hell.
—Saint Augustine
Guilty as charged, yer honour. ;)
Hansen delay – what is the physical rationale here?
Surely CO2 has to warm the atmosphere BEFORE the oceans warm (due to cooling less into the atmosphere) ? Not AFTER.
The same is true with the CPU + fanless heatsink analogy. The CPU has to warm before the heatsink can warm. What the heatsink does is prevent the CPU from getting too much ahead of the heatsink, which as long as it stays reasonably cool will do its intended job of preventing the CPU from overheating.
Without a fan the heatsink slowly accumulates heat and therefore gradually rises in temperature. The CPU is always a few degrees ahead of the heatsink, but as the heatsink gets hotter and hotter, so does the CPU. The heatsink merely delays the inevitable overheating of the CPU. Likewise the oceanic mixed layer (the top one or two hundred meters of water that is roughly constant in temperature compared to deeper down, due to wave-induced mixing in that layer) delays global warming but does not stop it.
Bad analogy. The atmosphere is like a film of dust on a CPU passive heat sink. There are other bad aspects to it like the ocean doesn’t generate the heat. You don’t think well outside your box. I’m not sure you can think well inside it anymore either. It’s like you stopped trying to work in your field and climate science is like a hobby you’re not really not good at but it passes the time.
By the way, the forcing delay is easily measured. It’s the time between the longest day of the year (peak power) and the warmest mixed layer temperature (peak temperature). It’s several weeks. The longest day of the year (NH) is June 21st, give or take a day. The hottest day is about 4 weeks later. This applies to both land and water and can easily be seen in about a million graphs of mixed layer temperature over the course of a year.
That’s for sunlight of course. The delay for ocean warming due to a change in downwelling longwave infrared “forcing” is forever. Not all forcings are equal. Longwave doesn’t penetrate water but a few microns deep. All it does is peel off surface molecules converting liquid to vapor with no change in temperature of either the liquid or the vapor.
Hansen has long ago worked out the thermal latency model and it follows closely the PC heat sink analogy. I guess you have to be familiar with electronics design to be able to understand the argument.
Vaughan, thanks for finding the time to reply.
Gaussian: I don’t know why you keep bringing this up. You are not using G and I have never suggested you should be. I have been nothing but complementary about the _design_ of your filter. As you say, it is quite similar to gaussian, it may well be better since it was specifically aimed at removing known frequencies in the data.
My problem is with your implementation. As soon as you go beyond having a full window for AVERAGE(), your plotted frequency response becomes irrelevant.
VP: “At 10 years from the end the impulse response of F3 is down by 20*log(.0433/.0252) = 4.7 dB, at 12 years 6 dB. ”
What has this got to do with anything once you start to run out of data? You are no longer applying F3 , the impulse response of F3 is _irrelevant_ at that point.
I’m seriously starting to think I credited you with more competence than was merited. You are either deliberately trying to confuse things or you still have not understood the error. Maybe someone else helped you design the filter and I was unduly crediting you with the level of understanding it indicated.
I’ll try again because this is crucial to understanding why the results diverge and why the claimed mK accuracy does not relate to the 3K/doubling model.
Figure 3 does not show an artefact of F3 , artefacts of F3 with be so tiny as to be invisible.
Let me reiterate that : Figure 3 does NOT show an artefact of F3
What figure 3 shows is an artefact of a defective application of F3 which is NOT F3 at the beginning and end 25y of the data. F3 is a very good filter and would give a rise very similar to the original AGW model you are proposing.
The huge distortion to the form of AGW shown in figure 3 is uniquely a result of the fact it is not F3 that is being applied correctly at the end.
VP: “Reason (b)… essentially the same parameters are obtained whether or not the two decades at each end are ignored. Those decades have no material impact on the fitting. ”
Essentially, I agree. The second SAW you posted was notably different from the original and you have not posted what the residuals look like but if you continue to calculate the residual against the distorted F3(AGW) they will continue to be small since THAT function (whatever it is) is quite a good match for temperature.
My gripe is not with the fitting period.
VP: “However the model predicts so remarkably well that it makes essentially no difference where we cut off, all the way down to 1950. It would appear that HadCRUT3 for 1850-1970 contains all the data that’s needed to very accurately tease apart the global warming signal and the ocean oscillations. I did not expect such a striking result when I started this project. Maybe there’s an error somewhere, but if so it is definitely not where Greg claims it is. The 140 mK downturn is a complete red herring for reasons (a) and (b) above.”
You really don’t get it do you? You are not fitting your CO2 model, which is basically exponential, you are fitting the distorted form shown in figure 3 which is rounded down to be almost flat. THAT distortion is why it resembles temperatures.
Your residual is not the residual form the 3K/doubling model, it is the residual from the distorted model resulting from the bad filter. That distorted model is (totally coincidentally) quite like the temperature record.
You did not expect such a striking result and you were right. Were it not for the defective implementation of F3, you would not have got such a striking result.
VP: “Certainly, but in the comparison with Figure 2 it is canceled out by an almost identical error in Figure 2. ”
Almost identical ? That is a gross assumption that you need to demonstrate is true. I have argued why that will not be the case at least twice, proxy Pekka chose to persistently ignore those arguments without providing anything more that assertions. You also seem to have missed them. More on that below.
We are agreed that extending the analytical function for CO2 to 25 years beyond 2010 will provide a correctly filtered result. Since F3 is very good, once applied correctly, there will be no anomalous down turn and very small distortion ( your <0.4% will be valid) .
This will also allow precise numeric evaluation of the error induced by the defective application of F3, that I estimated to be about 140mK at the end point.
Now if you want to say this "doesn't matter" because hadCrut3 will suffer an "almost identical" distortion, you need to demonstrate that in some way.
How any signal is distorted will depend up on the form of data. A flat straight line of 50 y length would suffer no distortion from this truncation issue. Yet as we have seen and exponential is significantly changed.
We have noted the temperature is essentially flat since 1997 so your _assumption_ that the effects will cancel out is unfounded. Especially in the context of your claimed mK accuracy.
VP: "we may need a fourth adjudicator that would be acceptable to
Greg."
LOL , this is not marriage guidance counselling. ;)
We are both intelligent and well trained in the scientific method. I see no reason why we cannot agree based on logic and the facts.
Unfortunately we cant simply extend the data as we can the analytic function AGW. However, you could evaluate the possible range of the distortion by artificial extension of the data. This would constrain the range of the effect on hadCrut3 and allow us to evaluate whether there is a _possibility_ that the two would cancel out.
One way this could be done is by adding "possible" future data to the end of hadCrut3 based on recent variations. For example test case a) assume climate changes direction again next year and swings up for 25 years of rise similar to the end of 20th c. ; test case b) temperatures fall for 25y , a mirror reflection of the late 20th rise; test case c) continue flat : duplication of last 16y. That does not presume any of this will happen, the point is to evaluate how the filter distorts data _like_ the end of hadcrut3.
Extending the observational data by cut and paste along those lines will at least constrain the magnitude of distortion the filter is inducing on HadCrut3 and provide you with some foundation for your claim that the two will cancel out.
Since a flat signal would not be affected by the truncation issue and there is a significant flat portion at the end of hadCrut3 , the assumption that the effect would be the same is unfounded and erroneous.
If you wish to maintain that I am wrong because the huge 140mK distortion will be cancelled out to within a few mK by a similar distortion on hadCrut3, then please go ahead and demonstrate this is at the case.
You simply cannot dismiss an error of that size by _assuming_ they will cancel.
What has this got to do with anything once you start to run out of data? You are no longer applying F3 , the impulse response of F3 is _irrelevant_ at that point.
This has everything to do with the Gaussian filter, which is extremely similar to mine and therefore both should be judged by similar criterion. You’re willing to truncate the Gaussian filter at some point, but as soon as I truncate mine at essentially the same point you cry foul. That’s grossly unfair.
Pekka explained this to you in a different way. Neither way seems to be having much impact on you.
Are you being deliberately obtuse now? I AM judging both by the same standards and have repeatedly stated F3 is a good filter. I have NEVER suggested you should be using a gaussian instead of F3.
You are totally and deliberately misrepresenting what I’ve said here.
You are intelligent and know how to read so it is hard to see this as anything other than a deliberate attempt to miss the point but I’ll try again.
IN THE LAST 25 YEAR PERIOD YOU ARE NOT APPLYING F3.
You screwed up the implementation of that very suitable filter, so any further reference to impulse response of F3 in that context is also totally erroneous.
Deal with that issue and stop pretending I have said things I have not.
I have NEVER suggested you should be using a gaussian instead of F3.
That wasn’t my point. My point was that as far as where to truncate was concerned, which is a kernel or impulse-response issue, F3 is essentially identical to a Gaussian.
The only material distinction between F3 and a Gaussian is in the frequency domain, which is in units of frequency and therefore cannot be used to judge where in time to truncate.
IN THE LAST 25 YEAR PERIOD YOU ARE NOT APPLYING F3.
I believe we agree on this. What we don’t agree on are the following two points.
1. Exactly the same could be said were we to substitute a Gaussian for F3. In the time domain there is no substantive difference, only in the frequency domain.
2. Whether to truncate after 10 years, 12 years, or 25 years is a time issue. This should therefore be determined from the impulse response. For reasons I don’t understand you want to determine this from the frequency response.
Seems to me that the AGW curve is a better fit to the temperature record than F3-SAW. The last 10 years of F3-SAW should probably have been dashed as this is a provisional, not a final, value of that function for that period. We won’t know that until 2020.
Agreed. That would be a reasonable intermediate approach between what I did and deleting it altogether.
VP: ” Maybe there’s an error somewhere, but if so it is definitely not where Greg claims it is. The 140 mK downturn is a complete red herring for reasons (a) and (b) above.”
Basically OK with b), don’t see major issues with the linearity argument of a). The problem in a) is that what you are calling F3 isn’t F3 in the crucial divergence at the end.
a) contains the assumption that the two are distorted an “almost identical” way and that “almost identical” does not affect your “within mK” claims.
Refer to previous post as to how to determine whether that assumption is justified.
I’m ready to be proved by the numbers, but not by unfounded assumptions and assertions.
I think you’ll find my red herring is more the size of a basking shark.
Basically OK with b), don’t see major issues with the linearity argument of a). The problem in a) is that what you are calling F3 isn’t F3 in the crucial divergence at the end.
Indeed. In the last decade at the end a Gaussian filter would behave almost identically, and we would both agree that the filter was too close to the end.
But at 20 years from the end the divergence is still almost exactly the same for a Gaussian filter as for F3, namely totally negligible, yet you would allow use of the Gaussian filter there but not F3, instead insisting that F3 can’t be trusted any closer to the end than 25 years. This is inconsistent.
Basically OK with b), don’t see major issues with the linearity argument of a). The problem in a) is that what you are calling F3 isn’t F3 in the crucial divergence at the end.
Thinking about this again, I agree with you there. What’s missing here is the concept of what my filter does as it approaches the end of a series, which we agree now (I think) is not equivalent to merely padding with zeros.
I claim that taking the average of the existing data inside the window (whether 21, 17, or 13 years) creates a kind of Heisenberg uncertainty in both time and frequency near the end.
In effect the window shrinks to half its width as it approaches the end.
It would therefore be natural to store the average of each progressively smaller window at its midpoint. This would preserve temporal accuracy at the expense of frequency because a smaller window entails a smaller filtered-out period.
At the end we would have lost frequency accuracy (leakage from the next octave up) and also lost actual temporal data (the last quarter of the window-size is missing), though the values stored would be correctly located in time.
What Excel AVERAGE does is to lose frequency accuracy in the same way, but to lose temporal accuracy as well by writing the averages progressively further from the midpoint of the window, until at the end they are being written at the end, which is quarter of a window width from where they should be, namely at the midpoint of the half-window. So instead of losing actual data values we lose some frequency accuracy (leakage from the next octave up) and some temporal accuracy (displacement by quarter of a window width).
Hope that makes sense.
I don’t claim this is an optimal way of generating data up to the end. One alternative is to pad with extrapolated data based on fitting a sinusoid of the appropriate frequency to the last cycle or so, which might or might not be better depending on the application.
One of my red herrings suffering from exponential growth :
http://msnbcmedia4.msn.com/j/MSNBC/Components/Photo/_new/120301-SharkPhoto-hmed-1120a.grid-6×2.jpg
VP: “At 10 years from the end the impulse response of F3 is down by 20*log(.0433/.0252) = 4.7 dB, at 12 years 6 dB. ”
You can’t be “ten years from the end” of an impulse response , it is a frequency plot !
Just checking: you do realise that using AVERAGE() as you have done will NOT be calculating F3 when the window is not full, don’t you?
Just ran the suggested extensions of hadCrut3 through the F3 fitler in OpenOffice, did get to do the flat one but prob not needed.
I took the 1880 drip in temps. I would have taken post 1940 but this preriod is badly effected by WWII as well by the Met Office’s attempt to correct for WWII. Too unsafe. The rate of fall looks about the same.
I figured a real world drop was more realistic than reversing the steep 1980-2000 rise and would not be as contentious as reversing global warming! ;)
The warming curve is post 1980 warming period added to current temps from 2010 since that where the data ended in the xls.
http://i50.tinypic.com/2nvtmdy.png
year 160 is the end of the real data, so F3(hadCrut3) line is the same as how the filter was run in the original spread sheet.
That’s the visual, the numbers for the three F3 curves at year 160 are:
0.403 0.441 and 0.389
That’s hadCrut3 , had_rise , had_fall respectively.
The range of the F3 filter correctly applied to the extended data is -14mk to +38 mK
My gut feel was correct. My conclusion that the HadCrut data would not be bend down anything like as much as the exponential .
Even if the warming plateau stops tomorrow and ramps up like it did at the end of the 20th c. , the correctly filtered data would only be 38 mK more that the incorrectly applied F3 in the poster.
This is in no way “almost identical” to the apparent 140 mK drop estimated from figure 3., meaning that with correct filtering MRES would be at least 100 mK at the end of the plot.
As I already pointed out , this dwarfs the range of MRES reported by Vaughan Pratt.
The much heralded “within a mK” result was simply an error caused by running a filter up to the point where the window is half empty.
Watch out for those red herrings , sometimes they bite.
Excuse typos, I’m sure you can work it out.
The much heralded “within a mK” result was simply an error caused by running a filter up to the point where the window is half empty.
Isn’t this a bit like saying that since all the other competitors were unable to break the world record, the one competitor who did so must have made some sort of error?
Anyone making this sort of argument would be hugely motivated to demonstrate such an error, logic be damned.
As I see it your analysis of your so-called “error” is fallacious as explained in my earlier posts. YMMV.
As I already pointed out , this dwarfs the range of MRES reported by Vaughan Pratt.
Indeed, which is completely illogical as I’ve pointed out earlier based on the linearity of F3.
You can’t be “ten years from the end” of an impulse response , it is a frequency plot !
What is the referent of “it”, and where is the frequency plot? There is no mention of frequency plots in what I wrote. The x-axis of an impulse response is in years, so you can certainly be 10 yrs from the end of it. For a frequency plot the x-axis is in years^{-1}.
Oh wait. Leaf Smellsgold. That’s better. So Americans won’t mispronounce your first name.
Boing! Time for bed Zeberdee.
In comparing to figure 2, I just realised that shows filtering of DATA – SAW whereas I was just working on hadCrut3 as supplied. I haven’t the time or the inclination to try to get the whole spreadsheet to work in OpenOracfice Calc , just doing this was painful enough.
In any case, SAW in figure 4 is very small in at the end of the data so this will not noticeably affect the shape of hadCrut3 and hence way it gets filtered.
I haven’t the time or the inclination to try to get the whole spreadsheet to work in OpenOracfice Calc , just doing this was painful enough.
Please find an admin with Excel (of any vintage since 2000) installed on their machine. Neither OpenOffice CALC nor LibreOffice CALC is at all usable with my spreadsheet, and any conclusions based on either are total garbage.
I really wish it were otherwise since I’d like to run this spreadsheet on Ubuntu 12.04 myself. However as an emulation of Excel these freebies are currently a dead loss. Anything based on them is meaningless.
If you wanted it to run on OOO Calc , knowing it is less complex than Excel, the best approach would have been to design it using Calc.
“However as an emulation of Excel these freebies are currently a dead loss. Anything based on them is meaningless.”
“Anything” , no. Some things , yes. If that is supposed to be a backhanded rebuttal of my calculations, it may reassure you to know that I reconstructed you F3 filter using AVERAGE() only , having verified that the behaviour of that function was the same as you stated in the case of empty cells.
Vaughan Pratt, please will you issue a formal retraction of your poster “Multidecadal climate to within a millikelvin”.
Simple summary here:
http://judithcurry.com/2012/12/04/multidecadal-climate-to-within-a-millikelvin/#comment-276473
More detail here:
http://wattsupwiththat.com/2012/12/13/circular-logic-not-worth-a-millikelvin/
Mike, you can find my “formal retraction” here (right under the post you just linked to). I wrote “The ’emperor has no clothes’ gambit. Oh, well played, Mike. Mate in one, how could I have overlooked that? ;)”
Feel free to announce on WUWT that I “formally retracted” with those words. In the spirit of full disclosure do please include the point that only Windows fans would consider that a retraction, not Linux hackers. WUWT readers won’t have a clue what that means and will simply assume I retracted, whereas those at RealClimate will have no difficulty understanding my meaning. Climate Etc. may be more evenly split.
tty says: “I suggest that Vaughan Pratt and some commentators here read up a bit on Fourier theory. Any (yes ANY) periodic or aperiodic continuous function can be decomposed into sine waves to any precision wanted. So it follows that you can also subtract any arbitrary quantity (for example an IPCC estimate of global warming) from that continuous function and it can still be decomposed into sine waves just as well as before, though they would be slightly different sine waves.
However note that there is absolutely no requirement that those sine waves have any physical reason or explanation.“.
Thanks, tty. It explains neatly why VP’s finding is completely meaningless without any physical reason or explanation for the sinewaves.
Thanks also to Mike Rossander for repeating VP’s exact process but with slightly different parameters. These are the sinewaves generated using VP’s spreadsheet and Mike Rossander’s parameters:
http://members.westnet.com.au/jonas1/VaughanPrattSinewavesForAGWzero.jpg
and this is the result:
http://members.westnet.com.au/jonas1/VaughanPrattResultForAGWzero.jpg
Every single argument of VP’s in support of the process that he used with IPCC-AGW applies absolutely equally to the exact same process with AGW = zero.
Vaughan Pratt – Now do you see that your argument has no merit?
The updated ‘AGW = zero” spreadsheet is here:
http://members.westnet.com.au/jonas1/VaughnPrattsHadcrut3_zero.xls
So, having done the work you should have of done to establish whether the distortion of HadCrut3 was the same as F3(AGW) instead of just assuming it, I reiterate my quesiton once again:
Would you now kindly comment on the “within a mK” headline claim in the “paper” and poster, that you presented to AGU and the rest of the world here? Do you still consider this claim to be valid or is it, as I have clearly demonstrated, simply a result of F3 distorting AGW into something far more like climate than the 3K/doubling exponential you proposed?
Do you still consider this claim to be valid or is it, as I have clearly demonstrated, simply a result of F3 distorting AGW into something far more like climate than the 3K/doubling exponential you proposed?
“Clearly demonstrated” is in the eye of the beholder, Greg. Maybe you don’t but I see at least half a dozen logical flaws in your reasoning. The four biggest are these.
1. Your misplaced concern about F3(AGW) being a very noisy (i.e. uncertain) signal in the last decade.
2. Your refusal to take linearity of F3 into account, which you somehow feel is irrelevant.
3. Your argument that F3, whose impulse response is essentially the same shape as a Gaussian, does not deserve to be treated the same as a Gaussian as regards where to cut off the tail of its kernel.
4. Your feeling that these end effects occasioned by 1-3 have some bearing on the parameters resulting from how I use MRES, despite my pointing out repeatedly that the ends play no role whatsoever in the fitting process.
I’m not going to repeat my arguments about 2-4 since I don’t see how to make them clearer to you. However I will repeat the Macy’s analogy for 1 because I didn’t state it in terms of uncertainty before, merely in terms of Macy’s exploding or not. The argument may be clearer when put in terms of uncertainty.
Suppose Macy’s gets worried about overcrowding in their store, and assigns two people to monitor that situation by monitoring traffic at the entrance, one for in-bound and the other out-bound.
There are two cases:
(i) the monitors continually pool their data so as to keep an eye on the net flux, which they deliver to management as a single report, or
(ii) they report independently.
These correspond respectively to F3(HadCRUT3 − (SAW + AGW)) (the pooled report, my figure 6) and F3(HadCRUT − SAW) vs. F3(AGW) (two separate reports, my figures 2 and 3).
Assuming both directions are roughly equal, a 10% error in the joint report for (i) would not be considered an unreasonable level of uncertainty.
However a 10% error in the independent reports could greatly worry management because it’s a huge level of uncertainty from each monitor.
Your argument in effect is that my spreadsheet is in situation (ii) and therefore there is a huge uncertainty.
But by ignoring linearity of F3 you fail to acknowledge the possibility that management could pool the two reports synchronously at their end (as opposed to having the monitors do the pooling), thereby arriving at the same understanding of customer flux that they would have obtained in situation (i). This would enormously reduce the uncertainty arising from independent consideration of the two reports.
That in a nutshell is what’s going on here.
This link shows some empirical results whose relevance to this thread will be explained when I can find some spare time: http://s1188.beta.photobucket.com/user/skygram/library/
John, I’m assuming your five days since you commented with this link have been packed. Looking forward to understanding the relevance of your two plots to this thread, which is about modern climate. Your more recent reference to them shed no light.
Unless your graphs concern modern climate I have great difficulty understanding their relevance. Modern climate has no paleoclimate analogues save possibly for asteroid impacts and megavolcanoes.
Just curious Vaughn,
If you really thought your model to be correct, the conclusion and extrapolation is (much like another AGU poster) that unless we reduce GHG’s quickly, we are fu$&ed…
Does this bother you?
@TSW: We are fu$&ed…
Well, granted storms will get more severe, TSW. But look on the bright side: if you can see what’s coming more clearly than the climate skeptics then you should buy stock in insurance companies, whose actuaries are smart enough about the future to know when to raise premiums. It won’t be the insurance companies that suffer but those of us paying those dern premiums.
Then there’s also ocean acidification, which might (or might not) be the biggest factor in the decline over the past three decades of total biomass of Antarctic krill. Back in 1970 that exceeded the biomass of the human population. If we haven’t drawn ahead already since then we’re about to do so. Hey, we win! (Though it does take a big bite out of the food chain at some point between copepods and penguins.)
The extrapolation is predicated on the increasing steepness of both CO2 and temperature. That can’t go on, something has to saturate, peak oil and all that. What the biosphere is currently suffering from is not the level but its derivative, the slope. If the slope decreases even while the level continues to climb, this will take a lot of the pressure off the biosphere, which will then have more time to adapt.
Mt. St. Helens showed that catastrophes can be overblown. A year after the explosion the neighborhood was worse than Chernobyl. Ten years later species had moved in to make things look almost normal, at least to those not distinguishing secondary forests from primary.
But that’s just the curable optimist in me speaking. Claim that we’re not fu$&ed and you’ll cure me in an instant. In that respect I’m like Romney. ;)
Vaughan Pratt,
Does your tool make that prediction, or is it a statement of your ideological beliefs?
If your tool makes that prediction, what is the basis for it?
Does your tool make that prediction, or is it a statement of your ideological beliefs?
(I love the way you can’t resist turning a reasonable question into a loaded question by sticking in an adjective like “ideological,” Peter. It’s like asking whether I’ve stopped beating my wife instead of asking whether I beat my wife. You’re very predictable that way.)
Neither, it was stated by insurance companies in the 1970s. Climate skeptics said that insurance companies had merely found it a convenient excuse to hike premiums. If so insurance companies should be making a bundle with that excuse by now.
My advocacy of investing in insurance companies would be particularly apropos if the skeptics are right. If they’re so wrong that the insurance companies have underestimated the risk then my advice is bad. So if you’re a skeptic and you lose money that way by investing in insurance companies, … well, what can I say? If the fault is mine it’s because I understated the risk. How would that make me an “ideologue” in your sense?
If your tool makes that prediction, what is the basis for it?
If my spreadsheet could predict I could get rich off it. My spreadsheet doesn’t have a clue about the future, all it can do is extrapolate. Anyone can extrapolate trends, the only use that is in setting the odds when placing bets. It’s hard to make any money betting when the odds are reasonable and the bookie takes his cut.
Vaughan Pratt,
Your comments are frequently flaming as well as dishonest in that you misrepresent what others say, then make a dishonest response. Many of your comments are clearly biased by your ideological beliefs, so pointing it out appropriate.
Your comments are frequently flaming as well as dishonest in that you misrepresent what others say, then make a dishonest response. Many of your comments are clearly biased by your ideological beliefs, so pointing it out appropriate.
Point taken. I’ll try to model my comments on yours in future.
Vaughan Pratt,
Another ideologically based comment (anti-nuke this time).
Your partial, but incomplete, comparison with Chernobyl, I suspect is attempting to make a point about ‘deadly, dangerous’ nuclear power. Why didn’t you complete your comment by telling us what has happened to the species around Chernobyl. That will be interesting. I await your impartial, objective, scientific answer to that.
Your partial, but incomplete, comparison with Chernobyl, I suspect is attempting to make a point about ‘deadly, dangerous’ nuclear power.
Oh Christ. I think if I called out a winning lotto number it would offend Peter.
In order to avoid offending you, Peter, I’m afraid this time you’re going to have to supply me with the appropriate Mt.St.Helen’s-like disaster scenario that doesn’t offend any of your 27 delicate sensibilities. I couldn’t even begin to guess at what that might be. In fact I bet you couldn’t either. It’s impossible to open one’s mouth without deeply offending you.
Vaughan Pratt,
You’re all over the place. In your last comment to me you said you are.’t worried about the future only the past.
You’re very conflicted.
You’re all over the place. In your last comment to me you said you are.’t worried about the future only the past.
As usual you jump to unwarranted conclusions, Peter. How do you infer from the prospect of my future suffering that this worries me?
Even more certain are future taxes and future death. Neither of these worry me either.
I don’t worry about the future, and I would hope you don’t either. Future pain, taxes, and death simply aren’t worth worrying about.
The only statement I’m prepared to make about the future is that if you argue more soundly in future I will be thrilled. I don’t consider that a worry because the worst case is that it won’t happen, which doesn’t worry me at all. As I said, I’d be thrilled if it happened but I’m not holding my breath.
Vaughan Pratt,
Vaughan Pratt,
Pity you don’t apply your advice to yourself – e.g. in your irrational and illogical arguments about your solar power and energy matters more broadly.
Peter, I think I understood you but just in case not let me check. You’re saying in effect that any who thinks that solar PV and energy storage are technologies that humankind should actively pursue must have an IQ less than 40. Have I understood you correctly?
Greg Goodman,
You replied to Vaughan Pratt
I can answer that. Yes, he is. He does it very frequently. If he can’t win an argument, he employs exactly the tactics you describe. Some professor eh?
Climate Etc. is a bit like Congress. Only newly elected members of the House take seriously the concept of “reaching across the aisle.” Each side of the aisle is convinced of the soundness of its logic and the absurdity of the other side’s.
The real problem is that people don’t think logically but factually. They “know” what’s true and they debug arguments by working backwards from conclusions that don’t match the facts as they understand them in order to construct a fallacy. Sometimes it’s an actual fallacy, sometimes it’s merely one that was manufactured as a way of backing oneself out of an impossible corner.
This sort of approach only works when you have the right facts. If the opposite sides of the aisle have opposite facts, how can both sides possibly be right?
VP: The real problem is that people don’t think logically but factually. They “know” what’s true and they debug arguments by working backwards from conclusions that don’t match the facts as they understand them in order to construct a fallacy. ”
That is a pretty good description of the circular logic of your presentation, that was pointed out by Mike Jonas
VP “Sometimes it’s an actual fallacy, sometimes it’s merely one that was manufactured as a way of backing oneself out of an impossible corner.”
Like saying I’m not happy about the properties of F3 when I’ve said from the beginning I thought it was very suitable and well designed.
It would seem that your conclusions about how “people” function is largely based on introspection.
Now , getting back to your impossible corner , where were we?
Vaughan Pratt | December 14, 2012 at 11:18 pm | Reply
>>
GG:[ Do you still consider this claim to be valid or is it, as I have clearly demonstrated, simply a result of F3 distorting AGW into something far more like climate than the 3K/doubling exponential you proposed?]
“Clearly demonstrated” is in the eye of the beholder, Greg. Maybe you don’t but I see at least half a dozen logical flaws in your reasoning. The four biggest are these.
>>
Eye of the beholder indeed. So far you have your eyes shut , your fingers your ears and are singing “LA LA LA , I can’t here you! ” in a loud voice.
I understand it is embarrassing for someone with your track record to admit they made such a basic error and did not realise it despite featuring the problem in one of the graphs in the presentation. But it’s not going to go away.
You have also resorted to pretending I have said you should be using a gaussian instead of F3. This a TOTAL FALLACY. The first mention of gaussian here was by you on Dec 5 at 3:46 . I have always said I thought F3 was very suitable and have refuted your gaussian lie several times. You have not pointed to where I suggested you use a gaussian but persist in repeating the same lie. I’m prepared to accept a mistake once , Not every time you post.
You are not so stupid that you have not realised by now what I have pointed out a dozen times but for the benefit of anyone who has not read 900+ posts I’ll restate it:
F3 is a very suitable filter, probably better than a gaussian since it was designed to remove a specific frequency in the data.
The problem is you screwed up the implementation of the filter by running it to 2010. The distortion this caused is clear for all to see in figure 3
THIS DISTORTION IS THE ONLY REASON YOU GOT AN “AMAZING” RESIDUAL. Your “within a mK” claim is simply the result of your own ineptitude.
>>
1. Your misplaced concern about F3(AGW) being a very noisy (i.e. uncertain) signal in the last decade.
>>
It is not “noisy”, it is not “uncertain”: it is WRONG. It is not F3 !!!
What you are calculating in the last 25y is NOT F3(AGW), you got the implementation wrong. That is the basic problem. And you think a distortion of 140mK when you are claiming mK accuracy is a “misplaced concern” . Amazing.
>>
2. Your refusal to take linearity of F3 into account, which you somehow feel is irrelevant.
>>
Another lie. I have never objected to your linearity argument. F3(A)+F3(B)=F3(A+B) fine.
>>
3. Your argument that F3, whose impulse response is essentially the same shape as a Gaussian, does not deserve to be treated the same as a Gaussian as regards where to cut off the tail of its kernel.
>>
Another lie. I have never criticised F3 , nor spoken of its kernel . You are resorting to total fabrication now.
>>
4. Your feeling that these end effects occasioned by 1-3 have some bearing on the parameters resulting from how I use MRES, despite my pointing out repeatedly that the ends play no role whatsoever in the fitting process.
>>
I have never suggested that you should change the fitting period (that was your idea) nor that the small difference that makes to the parameters was of any significance. My issue is with WHAT YOU ARE FITTING TO: a bent down form that has absolutely no resemblance to an exponential in the crucial last 15 years.
You admitted above that your faulty filter did distort AGW but said it did not matter because you assumed hadCrut3 would suffer and “almost identical” distortion.
Now I have done the work for you and proved that assumption was false you simply ignore the result and hope it will go away.
I have shown mathematically that there is a difference of at least 100mK between the way your botched filter distorts AGW and the way it distorts hadCrut3.
That blows your “within a mK” claims out of the water.
You will not wriggle out of this by closing your eyes, ignoring the result of the calculations or lying about what I have said.
THIS DISTORTION IS THE ONLY REASON YOU GOT AN “AMAZING” RESIDUAL. Your “within a mK” claim is simply the result of your own ineptitude.
Sadly, rather than honestly recognise a simple, basic error you seem intent on digging yourself into a deeper and deeper mess.
You will not wriggle out of this by closing your eyes, ignoring the result of the calculations or lying about what I have said. L
Are you seriously suggesting that I would stoop to any of those three alternatives? If so I can only infer that you’re not here for a serious debate but merely to insult me in the same fashion as Peter Lang. Good day, sir.
Closing your eyes: you accepted that there was a distortion in your calculation of F3(AGW) but said it did not matter. When I proved that it did you simply ignored the post. Stoop No. 1 and stoop No. 2: check.
I have specifically noted several points where you have attributed things to me that I have not said. No once but several times, despite being corrected. You are unable to refute that.
The first time you misrepresented me it could be a mistake, repeating it after being corrected it becomes a knowingly false statement. aka a lie.
Snoop No.3 : check.
You are unable to refute that accusation. But when I call you on being dishonest you say it is an insult.
That you find it offensive does not make it untrue.
I find it insulting that you persistently attempt to misrepresent what I have said in order wriggle out of having made a fool of yourself. But I do not go off and sulk , I simply point out where you have misrepresented me and continue calculating exactly how and why your claimed mK result is erroneous and totally unfounded.
Going off into a sulk will not be a very effective defence of your work but since you no longer have a leg to stand on on the maths it may be your best option.
P.S my message above, posted at 3:51am , stated that VP had not replied to my calculations that I posted on December 14, 2012 at 11:56 am That statement was correct at the time of posting.
At 4:04am VP posted a quick “reply” to yesterday’s comment, which did not address its findings but related one of his bed-time stories for little children.
http://judithcurry.com/2012/12/04/multidecadal-climate-to-within-a-millikelvin/#comment-276730
A retroactive effort to give the impression he was not ignoring my comment, just before taking umbridge after being called out.
Greg, if I appear to be impatient with you, my apologies. It is not intentional though sometimes I do run low on patience occasionally.
Closing your eyes: you accepted that there was a distortion in your calculation of F3(AGW) but said it did not matter. When I proved that it did you simply ignored the post.
What is the purpose for which you claim it matters?
We may be talking at cross purposes. I have several times (worded in different ways for clarity) given two proofs that F3(AGW) does not matter for the purpose of parameter estimation:
(a) because F3 is a linear filter and therefore distorts (HadCRUT3 − SAW) and AGW in the same way (proved theoretically, and verified empirically via MRES); and
(b) because I don’t use the distorted portion in estimating parameters (which as Pekka points out raises a different concern that I’ll address in response to him).
If you have a proof that it does matter then I see only two possibilities:
1. Your proof is for some other purpose than estimating parameters.
2. We are using different rules of reasoning.
Had I seen you propose some other purpose for F3(AGW), that would have got my undivided attention as being very interesting. If I’ve overlooked it my apologies, there are over a thousand posts in this thread.
If we’re using different rules of reasoning, each might be consistent by itself but in combination they have shown P and not-P and therefore are inconsistent when our respective rules are used in the same argument. We would therefore either try to isolate the inconsistency or agree to disagree. If you’re going to call me a liar my preference would be for the latter, but since you want to have your cake (by continuing to call me a liar) and eat it too (by refusing to agree to disagree) I’ll reluctantly push forward.
The first time you misrepresented me it could be a mistake, repeating it after being corrected it becomes a knowingly false statement. aka a lie.
You continue to insist that the downward bend of F3(AGW) matters without having convinced me of it. That you have convinced yourself of it does not mean that you have convinced me of it, and therefore does not make me a liar. It merely points up a problem in our communication channel, namely that I am having continuing difficulty being convinced by you. This clearly needs debugging. Saying l lied is not a constructive way to debug it.
I would like to see a statement of what purpose the downward bend of F3(AGW) matters for, and an argument in support of it. If you’ve done both already please indicate where—if multiple times then whichever one you feel ought to be the most convincing.
Another lie. I have never objected to your linearity argument. F3(A)+F3(B)=F3(A+B) fine.
I never said you objected to it, I said you didn’t accept it—if you did then I overlooked it. You have accepted it now, thank you. (But I’m guessing that you see no role for it in my argument that F3(AGW) bending down doesn’t matter.)
“3. Your argument that F3, whose impulse response is essentially the same shape as a Gaussian, does not deserve to be treated the same as a Gaussian as regards where to cut off the tail of its kernel.” >> Another lie. I have never criticised F3 , nor spoken of its kernel . You are resorting to total fabrication now.
I didn’t say you criticised F3, I said you were treating it differently from a Gaussian. And you have at least twice spoken explicitly of the kernel of a Gaussian, and implicitly on other occasions.
I would not have used the term “kernel” myself had you not introduced it in your first post in this thread where you wrote “However, as will all such convolution filters each filter reduces the length of the dataset by half the kernel width at each end.” (Ordinarily I would say “support” instead of “kernel width,” as I did above for example, but as long as we use “kernel width” to mean the same thing as support, and “kernel” the same thing as “impulse function,” we should be fine. With integral transforms the kernel is K(u,t), a function of two variables, but it is common parlance to call the impulse function K(U,t) (U fixed) a kernel. In the spreadsheet U is the cell MAIN!AN270, which contains the impulse for the impulse function tabulated at MAIN!AQ240:AQ300.)
A little later you wrote “as you well know a gaussian kernel is always a truncated gaussian. It produces a mathematically valid result to the precision determined by where the gaussian is cropped when designing the filter.” I did not say that you criticized F3, I said that so far you have refused to allow F3 to be cropped according to the same criterion you would use in cropping a Gaussian, namely up to a given precision. Instead you ignore the precision question entirely for F3 and continue to insist on treating it as though it had a kernel width of 25 years by allowing no cropping at all. You have yet to justify why F3 and a Gaussian filter should be treated so differently. That is quite different from criticising F3.
My issue is with WHAT YOU ARE FITTING TO: a bent down form that has absolutely no resemblance to an exponential in the crucial last 15 years.
This may be the crux of the problem: we are speaking at cross purposes because we have different ideas of what I’m doing.
Both Figures 2 and 3 contain “bent down forms.” If you’re referring to the one in Figure 3, F3(AGW), I am not fitting anything to it. I’m fitting a model of multidecadal climate, namely SAW+AGW, to HadCRUT3. I do this by a procedure that is algebraically identical to subtracting SAW+AGW from HadCRUT3 to yield a residual RES, and then estimating the goodness of fit not as VARIANCE(RES) (the usual procedure) but of VARIANCE(CLEANPERIOD) where CLEANPERIOD is F3(RES) (= MRES) suitably truncated. In hadcrut3.xls CLEANPERIOD is 1850-1950, in flatter.xls it is 1870-1950.
Pekka raises an excellent point about whether CLEANPERIOD is long enough to be meaningful, which I’ll address in a separate comment since I’d like to stay focused here on your claim that the downturn of F3(AGW) matters for some purpose, one that I haven’t yet understood but would certainly like to.
Vaughan,
The discussion has raised the question of the best way of handling the end periods when filters are applied. It’s seems to be clear that no ideal solutions are possible. In your case every point after 1986 gets affected and gradually more and more.
In a optimal comparison of observations with a model every empirical value should have a weight that varies only based on empirical uncertainties in the particular value, not on it’s closeness to either end of the full period. If the analysis is stopped at the point where the filter must be truncated the extreme points have extremely little weight (0.0002 in the last filtered value retained). Even when the calculation is extended to cover nominally the whole period as is done in your graphs, the latest data point has a weight of 0.67 in the filtered values presented, i.e. less than any of the interior values but more than 0.52, which it would have on the values up to 2010, if 2010 would be a normal interior point.
You presented in one of your comments the idea that the latest points might be plotted at on x-value that corresponds to the weighted average timing of the data used. Thus the latest calculated value would fall in 2002 rather than 2010 and the whole end would be squeezed tight. Doing that there would not likely be any downwards bend at the right end of the graph and the graph would give a hint on how strongly autocorrelated the latest points on the plot are.
Another approach would be to modify the filter symmetrically when truncation is needed. That’s certainly not ideal either but has some favorable properties in comparison with your method.
Closer to your method but a little towards my second proposal would be rescaling the full impulse response after three steps rather than each of the three box filters separately. Rescaling the full impulse response would give a little more weight to the extreme data points than your approach. The unfiltered value for 2010 would have the weight 0.083 rather than 0.059 given by your spreadsheet. This method would be essentially equivalent to truncated and rescaled Gaussian filter.
There must exist some theoretical work on filtering data up to the end of a finite period but that’s not close enough to what I have done to make me aware of any such research. Consequently I have no idea of possible practical solutions based on such theoretical considerations.
Pekka,
Your suggestions might indeed improve matters when taking recent temperatures into account. Pending resolution of this, how would you feel if my least-squares fit simply ignored 1970-2010 altogether?
My reason for asking is that my conclusion, namely the parameters resulting from fitting the model to multidecadal climate, seems not to depend significantly on whether one cuts off at 2010, 2000, 1990, 1970, or even 1950. Essentially the same parameters are obtained in every case. HadCRUT3 from 1850 to 1970 would appear to be sufficient to determine my model, with the additional data from 1970 to 2010 making no perceptible difference.
I’m afraid Greg Goodman is getting himself worked up over the period 1990-2010 for no reason. Whatever happened there has no implications for the model I’ve fitted to HadCRUT3.
Vaughan,
My comment on that point was based on one (or two) of your comments in this thread where you described some details of your approach.
My comment is probably not formulated precisely enough and I may have also misinterpreted to some extent what you wrote. I did understand that you found the results rather insensitive on the cutoff but the impression I was left with is that the extreme years have very little weight in the primary fit. That’s justified when their influence on the values obtained for most interesting parameters is affected significantly by somewhat arbitrarily chosen other details of the approach, which cannot misbehave badly for the interior period but may introduce much stronger spurious effects at the end where they are not bound by data from future years.
With an overall period as long as yours the effect is perhaps not strong but it’s still there. As the full-width at half-maximum of your MRES impulse response is more than 20 years, the overall period is about 7 times that, and 7 is not a very large value for this ratio.
While I disagree on much of the recent critique on your work, I’m still not convinced that it allows for particularly useful conclusions at any level of detail. Many different factors have contributed and it’s difficult to imagine that many of them would not be independent and add up roughly independently to the total. Some factors (volcanic and solar) that contribute to the rise of period 1910-40 are known at some quantitative level. Taking them off based on some estimated coefficients would probably leave a residue that’s similar in overall shape but with a less pronounced SAW. Some alternative parameterization could certainly change the earliest and latest decades significantly. It’s certainly nice to have as few free parameters as possible but that’s by no means a proof that the model is more correct than an alternative that needs one or two more parameters.
Your model summarizes nicely the main low frequency features of the data but is there more to it. I’m not convinced except that I’m convinced that creating anything as plausible without a major AGW contribution is probably impossible. (The presentation of AGW might differ significantly from your delayed Hoffman in its details and its strength could also differ.)
VP: “I’m afraid Greg Goodman is getting himself worked up over the period 1990-2010 for no reason. Whatever happened there has no implications for the model I’ve fitted to HadCRUT3.”
There is none so blind as he who will not see.
I have at no stage said I thought the parameters of SAW fit were wrong, nor that the fitting period was important.
What you poster is shouting about is the residual and it is the residual that you got wrong because you are fitting the bent down AGW and NOT the 3K/decade model.
Hence the “residual” you are minimising with the least squares fit and plotting as MRES is NOT the residual of the exponential , it is the residual of the bent down curve.
You conclusion panel says you account for warming with SAW and AGW with “minscule” residual.
But you never fitter AGW , nor the true F3(AGW) you fitted a bend down cropped off F3(AGW)
Your conclusion is erroneous based on the evidence you present in the poster.
Pekka, There is no magic wand. To perform a convolution filter you need data on either side. You cannot filter the end since you don’t know the future. There is no point in scratching your head to come up with a solution, if there was one it would have been invented long ago , D.S.P has been around a lot longer than the computers that made it easy.
The simple rule is your filter stops when you no longer have the data to fill the window. Apparently Vaughan did not realise this and was not alerted by the huge deviation at the end of what he we calling F3(AGW). He misinterpreted this as an artefact of F3, instead of realising it was a fautly implementation of an otherwise excellent filter.
I should, at this point, apologise to you and the other person for my earlier comment that VP knew “more than the two of you put together”. That comment was apparently totally incorrect. Many of his subsequent comments have demonstrated that he has very poor understanding of the subject , I can only assume he got someone else to design the filter and did not understand how to implement it.
One other approach would be iterative filters where the errors are in the initial “spin up” period of the filter. However, they take a lot of data to converge to a useful accuracy and I don’t think that a 22y LP will be stable even to within a few percent after 160 y, let alone “millikelvin” accurate. So it’s of little help here.
CONSTRAINGING THE UNCERTAINTY:
What can be done is to extend the analytic function called AGW so that F3 can be correctly applied (that’s a simple drag operation in Excel). Then F3 will recover its 0.4% band pass ripple which is fine. It’s certainly a lot more use than 140mK distortion.
The only way I can see to asses the real data is what I have already done and posted results for. This does not provide a correct filtered result but does allow constraining the error at the end of F3(hadCrut3)
http://judithcurry.com/2012/12/04/multidecadal-climate-to-within-a-millikelvin/#comment-276545
The resulting deviations of a correctly applied F3 from the result in Vaughan’s spreadsheet found by applying the defective F3 implementation to hadCrut3 was -18mK to +38mK
The result of comparing those figures to 140mK shows that the filtered residual that is being called MRES should be AT LEAST 100mK at the end of the data.
If Vaughan was surprised when he got “within a mK” results, he was correct to be surprised. He should have followed through by checking his work.
I can only conclude that this is a classic example of confirmation bias. He was (is) so sure that 3K/doubling catastrophic warming is happening that even when the result looked too good to be true he went public with it.
Unfortunately (for him) it was too good to be true.
Hopefully he will have enough humility to say “oops!”.
Greg,
You make your guesses on what others know and think. From that you form straw men and fight them.
Your approach seems to be that others must have totally stupid views on every detail that they don’t explicitly state. it would be more productive to assume that others are reasonable people who have understood what you write, who have thought most of the issues already, and who have been led to the choices they have made taking all this into account.
Sometimes you may find out for valid reasons that my above paragraph is naively optimistic, but very often you could also realize correctly their reasons and understand their choices. Then you could either agree or present more relevant critique and ideas for improvement.
It should be obvious that neither me or Vaughan considers the issues related to the ends of the periods absent or fully resolved. Your dogmatic approach is, however, of no help in resolving them.
One more point. The filtered model is not a model for the real temperature time series, its a model for the filtered time series. Therefore there’s no role for the filtered model calculated using model values beyond the period of observed values.
greg, “Pekka, There is no magic wand. To perform a convolution filter you need data on either side. You cannot filter the end since you don’t know the future.”
You can’t filter into the future, but if you isolate the main frequencies, you can build a carrier wave that should continue into the future. Since Vaughan’s SAW is basically two sine waves with periods 72 and 52 years, you can sum them over a longer time as see they repeat. That should mean those frequencies are not the right frequencies. So I tried a different pair of frequencies.
http://redneckphysics.blogspot.com/2012/12/golden-saw.html
Like I said, I am impressed with the model, its wrong, but hey, it’s a model.
“You can’t filter into the future, but if you isolate the main frequencies, you can build a carrier wave that should continue into the future.”
This is essentially what Scafetta did years ago. He also includes an exponential (or quadratic) for CO2 but he does not presume its value he lets the parameters be free as it should be. This is scientific investigation rather than induction.
Scaffeta’s analysis has proved to be very close to climate in the 10y since it was produced.
greg said, “Scaffeta’s analysis has proved to be very close to climate in the 10y since it was produced.”
Yes, but… the mechanism(s) is(are) in question. Models just provide clues.
The problem with the solar model of Scaffeta is that his mechanism has to be awfully creative. Selvam points out that all non-ergodic system have similar basic “frequencies” The change in solar alone doesn’t have the umph to be a clear driver, so much longer term responses with difficult to determine thresholds are likely involved. Earth has a basic bi-stable response with the deep oceans lagging surface by roughly 1700 years +/- a bunch at transitions.
Had Scaffeta said, “hey lookie! it does this but I haven’t a clue why.” he could be up for a real Nobel. Instead he stepped on is appendage and over confidently said it is the sun stupid. Every where his fit misses is just another clue.
Climate is like the gift that keeps on giving. Makes a great puzzle.
Pekka:
>>
Greg,
You make your guesses on what others know and think. From that you form straw men and fight them.
Your approach seems to be that others must have totally stupid views on every detail that they don’t explicitly state. it would be more productive to assume that others are reasonable people who have understood what you write,
>>
We have to make some assumptions about “who” we are talking to, to know what level to discuss on. I initially assumed from the presentation of the filter , its impulse response etc that Vaughan had a good grasp on filter design.
I really could not understand how someone with his credentials could make such a basic mistake but we can all overlook things. As the discussion developed, I realised that he had a lot less understanding of what he was doing than I had credited him with.
>>
it would be more productive to assume that others are reasonable people who have understood what you write
>>
That is a good approach . But the amount of time it took for Vaughan to acknowledge (without even admitting I was right all along) that there was a significant distortion in F3(AGW) has shown that such a generous and patient attitude does not always work.
It would be useful if Vaughan stopped trying to play the role of the professor talking down to his “students” with his silly parables and realised HE may be able to learn something.
I guess a habit of a life time is hard to break.
I was asked by one of the WUWT participants if it is possible to extrapolate the CET by few decades forward.
The first step was to separate the summer and the winter data (using two months around the two solstices, to see the effect of direct TSI input); result was unexpected
http://www.vukcevic.talktalk.net/MidSummer-MidWinter.htm
Reason for temperature divergence is the Icelandic Low semi-permanent atmospheric pressure system in the North Atlantic. Its footprint is found in the most climatic events of the N. Hemisphere. The strength of the Icelandic Low is the critical factor in determining path of the polar jet stream over the North Atlantic
In the winter the IL is located at SW of Greenland (driver Subpolar Gyre), but in the summer the IL is to be found much further north (most likely driver the North Icelandic Jet, formed by complex physical interactions between warm and cold currents), which as graphs show had no major ups or downs.
Next step: finding harmonic components separately for the summers and winters, Used one common and one specific to each of the two seasons, all below 90 years. By using the common and two individual components, I synthesized the CET adding average of two linear trends. Result is nothing special, but did indicate that a much older finding of the ‘apparent correlation ‘ between the CET and N. Atlantic geological records now made more sense.
http://www.vukcevic.talktalk.net/CNA.htm
back to the CET extrapolation.
http://www.vukcevic.talktalk.net/CET-NV.htm
This suggest return to what we had in the 1970s, speculative but very probable. Although the CET is 350 years long, I would advise caution, anything longer than 15-20 years is no more than the ‘blind fate’.
Vuc said, “This suggest return to what we had in the 1970s, speculative but very probable. Although the CET is 350 years long, I would advise caution, anything longer than 15-20 years is no more than the ‘blind fate’.”
But it is unlikely that pattern will repeat. It may be close, it may not, let’s toss a coin.
http://redneckphysics.blogspot.com/2012/12/golden-saw.html
I did a simple curve fit using Selvam’s concept. Since that curve is non repeating, but does have self similarities, climate could come close to repeating the 1900 plunge or the 1816 plunge or the one of the previous Bond event pops. The pattern of the curve gives you no clue of what may be in the future if you don’t know the initial conditions. Now the heat capacity of the oceans, the rate of uptake of the oceans and the overall changes in forcings do provide some clues, but FIIK is the correct answer about the future on any time scale. The ocean inertia only allows a little extension of the time frame.
Now were Professor Pratt goes wrong is the PC heat sink concept. The poles are the primary heat sinks and the rate of energy transport to the poles the major variable. If he looked at more longer term paleo he would see that Ocean sensitivity to all forcings is ~1/5 the sensitivity of the atmosphere to all forcings.
:) It is a Tale of Two Greenhouses
http://redneckphysics.blogspot.com/2012/12/a-tale-of-two-greenhouses.html
Fitting of elephants. LOL
http://wattsupwiththat.com/2012/12/13/circular-logic-not-worth-a-millikelvin/#comment-1173395
re; Excel ‘Solver’ plug-in
Fascinating. Last time I played with an electronic spreadsheet was Lotus 1-2-3 about 30 years ago. The solver back then was me. It appears the human wiggle-fitter has been replaced by a robot. Automated lying with statistics. I suppose that’s progress.
Agree. Computer technology has a far greater capacity to produce bulldust than us mere humans. Vaughan has produced an interesting poster for the big get together and thanks to him for having the balls for posting it on CEtc. The jury is still out on whether AGW science has advanced or retreated due to this paper, because Vaughan to my mind is one scientist who is prepared to defend his position, with grace and good humour.
Yup, works like a charm. I set climate sensitivity to 0, plugged in the filter values above and viola a slightly better fit than Pratt’s original filter values. SAW became a smoothed version of HADCRUT temperature data with a nearly perfect fit and AGW becomes a flat line.
A demonstration that with only 4 parameters one can fit an element. My inititial reaction several days ago that Pratt’s work here is worthless is proven.
Thanks for playing and thank you Mike Crossander for doing the heavy lifting. Or maybe we should all thank Excel’s ‘Solver’ plug-in.
I have a question for Pratt – did YOU use the Solver plug-in to get the proper fit?
“fit an element”
I’ve been concentrating on web app programming for most of this year. Got elements on the brain, evidently. It’s elementary my dear Watson has taken on a whole new meaning.
“I have a question for Pratt – did YOU use the Solver plug-in to get the proper fit?”
The question is WHAT is he fitting , not what with.
I agree that once the exponential has been bent down to be nothing like and exponential it is a remarkably close fit to climate.
I really don’t see what this result tells us about the 3K/doubling model.
Fit to observed global warming as defined by HadCRUT3 dataset.
David Springer: I set climate sensitivity to 0, plugged in the filter values above and viola a slightly better fit than Pratt’s original filter values. SAW became a smoothed version of HADCRUT temperature data with a nearly perfect fit and AGW becomes a flat line.
Thank you for that. You demonstrated the truth of what I wrote above: if you assume functional form for the signal, you can find a filter that reveals the functional form.
I don’t agree that shows Pratt’s work to be “worthless”: it shows that with the data we have now there is insufficient evidence to estimate the true signal, or equivalently to reject a false claim.
JimD, “The key is how well the function behaves outside the fitted region. Vaughan Pratt’s one is fairly flat before the initial time apart from the harmonic parts that have small amplitude. If this is not reproduced by Rossander’s fit, it is a sign of fitting the wrong function (for example a harmonic to an exponential).”
Possibly. Pratt has provided a new tool and focuses a little (much needed IMHO) attention on the pseudo-cyclic phenomena that impact estimates of climate sensitivity to a variety of things. Once you isolate a few rough frequencies, then you can extend to see what fits.
The cool thing about the patterns is that they should repeat on numerous time scales. While they may never repeat purely, the probability of a close repetition should allow some estimate of a range or PDF. Oops! I think I have wandered into the Tomas zone :)
As far as I know just fitting harmonics cannot give you a trend. How did Rossander handle the trend part?
http://www.youtube.com/watch?feature=player_detailpage&v=YedgubRZva8
Chlandi patterns. Now if temperature decreases by ~ one degree C per latitude and the standing wave shifts?
Though most of the noise is not really harmonics but different weakly damped decay patterns. So it is more like tightening or loosening the banjo strings :)
Problem is, the data handling processes can also produce patterns. Since the temperature decreases roughly one degree C per degree of latitude, if you interpolate or Krige(?) across latitudes you can overly weight the colder regions or vice versa.
The key is how well the function behaves outside the fitted region. Vaughan Pratt’s one is fairly flat before the initial time apart from the harmonic parts that have small amplitude. If this is not reproduced by Rossander’s fit, it is a sign of fitting the wrong function (for example a harmonic to an exponential).
Jim,
The way Vaughan defined SAW allows it to produce the trend as well at least over this period. Entering the given values to the spreadsheet does exactly what’s stated by Rossander. The fit is even better for the latest years (which are not as significant due to the modified and asymmetric filtering) but for most of the full period the difference between the filtered data and filtered model oscillates more with a period of about 32 years and full amplitude of about 8 mK.
To me this provides additional evidence against the significance of the quality of fit that Vaughan found.
Pekka, yes, I noticed that Vaughan Pratt applied a small (3%) phase shift in some smaller harmonics that didn’t change the periodicity of his SAW function much (both ends are near zero). I suspect that Rossander’s phase shifts must have been more substantial. My point about the behavior outside the fitted range stands as a test for Rossander’s function. Since his harmonics have amplitudes adding up to the full warming, I would be surprised if prior to the fitted period, they did not oscillate to similar magnitudes.
Jim,
You are on right track. Extrapolating the Rossander parameterization beyond the fitted period tells that the temperature was year 1800 as high as in 2010 and that there will be a sharp drop to the minimum of 1840 (little lower than 1850) by 2050.
I didn’t want to say that the Rossander fit is plausible but only that the success of this alternative fit tells about the significance that the quality of Vaughan’s fit has. The strong smoothing applied seems to make it relatively easy to find functions that fit the data well. There’s a clear difference between the qualities of the fits over the period 1870-1950, where Vaughan’s fit is really accurate to about 1 mK while Rossander’s parameters lead to the oscillation with 10 mK full amplitude. Even so his observation adds to my reservations, which were based on the implausibility of the idea that Vaughan’s fit would really tell about some causal explanation for the variability (other than that given by smoothing).
Rossander ratcheted climate sensitivity down to zero. That’s a low probability value IMO. I suggest turning down sensitivity to 1.1C from Vaughn’s 2.8C and see what Solver comes up with. 1.1C is the no feedback climate response to a CO2 doubling. A significant fraction of so-called denialists have no problem with that figure. Mosher will argue all day and long into the night that the only serious discussion is about whether sensitivity is much higher than that. 1.1C is below the sensitivity that causes panic. If Vaughn’s model can be tweaked to generate a great fit with zero climate sensitivity it should take even less diddling (and fewer parameters) to get a fit with 1.1C.
Peter Lang; http://judithcurry.com/2012/12/04/multidecadal-climate-to-within-a-millikelvin/#comment-276227 :
”Vaughan Pratt,
995 comments have been posted on this thread so far. Most are way over my head and not my area of expertise (I confess I haven’t read most of them). Could I urge you to make a succinct summary, and especially focus on what is important.
Could you please include an explanation of what is relevant for informing policy, if anything?
If what you’ve done proves to be correct, what does it mean for our understanding of climate sensitivity? Can you say if this work changes our understanding of the central estimate or uncertainty of climate sensitivity?”
Peter, you focus our attention on the most essential matters!
My summary:
1)In accordance with the natural laws all CO2 sources and all CO2 sinks together control the CO2 content in the atmosphere. Because the antropogenic share of the total CO2 emissions is only about 4 % at most, it controls only 4 % of the CO2 content in atmosphere – and 4 % of a yearly increase of the CO2 content at the most, too.
2)The recent increase of the CO2 content in the atmosphere is controlled by the natural rising of SST on the higher latitudes, where the sea surface sinks are.
3)Because the share of anthropogenic CO2 emissions on the total increase of CO2 content in atmosphere is minimal i.e. insignificant, only political measure can be learnig to adapt ourselves to any one of natural climate events.
Concerning the presentation of Vaughan Pratt I have already written:
”As I understand this is a hypothesis of your own. If you test it pragmatically you should understand what I have tried to state in my comment . . .; http://judithcurry.com/2012/12/04/multidecadal-climate-to-within-a-millikelvin/#comment-274367 .”
Vaughan Pratt
Up-thread you comment to Peter Lang
Since I believe you are referring to me when you write “Max”, but apparently do no have the courage to respond to me directly, I think I have to straighten you out a bit.
I am not “predicting the future” anymore than you are doing with your analysis.
Like a true statistician, you use all sorts of statistical techniques to filter out what you consider to be “noise” from what you consider to be “signal”.
As I stated in my posts to you, this approach for analyzing the past is great.
But then you make a basic error: you then extrapolate this gobbledygook out 88 years to predict the future.
And, believe me, Vaughan, that’s the only curve that most people will be looking at in your analysis – your “prediction” of the future temperature allegedly caused by human CO2 emissions.
Yet you totally ignore two real-life constraints on the growth of human-caused atmospheric CO2, which are (to anyone except possibly a blinkered statistician or computer jockey) as simple and logical as night and day:
– the expected rate of population growth
– the maximum total CO2 available for humans to emit
The UN (and many other sources) have made projections on future population growth. These ALL agree that the rate of growth over this century will be around 0.4% to 0.45% per year, compounded, while the rate over the late 20th century was 1.7% per year. Note that this is NOT my “prediction”, but the projection from reliable sources.
If “human population growth” slows down to one-fourth the past rate, it is idiotic to blindly assume (as you have done) that human-emitted CO2 will NOT slow down.
That’s logic error number one in your analysis.
Now to logic error number two.
We all know that fossil fuel resources of our planet are limited. Some sources (Hubbert, et al.) estimate that we are close to running out, while others are less pessimistic. The World Energy Council made an estimate in 2010 of all the “inferred possible fossil fuel resources still on our planet”, as well as of the “proven reserves”. The first estimate was much higher than the second, of course. According to this study, we have “used up” around 15% of all the fossil fuels that were ever on our planet leaving 85% to go. At present consumption rates these remaining fossil fuels should last us over 300 years. Since the first 15% got us from 280 ppmv to 392 ppmv, the next 85% should get us to around 1000 ppmv when they are all gone.
Your projection has us reaching close to 1000 ppmv (and 4C warming) by 2100.
So your numbers are, in effect, “predicting” that a more slowly growing population will use up the remaining fossil fuels on our planet at a greatly accelerated rate, so that they are essentially all gone by 2100.
What’s wrong with this picture?
It is not logical, that’s what’s wrong with it. In fact, it doesn’t pass a basic “sanity test”.
Now, if you wish to address my above critique, do so directly with a post to me, explaining where my logic is incorrect, not in a snide remark to Peter Lang.
Okay?
Max
.
Vaughan
You should add this caveat to your poster, so people don’t make the mistake of believing there is a projection for the long-term future there:
Add that in and I’m OK with it.
Max
PS
And delete the word “FUTURE” in the sidebar, plus the phrase:
Then you’re “good to go”.
Max
“While the above analysis yields good results for by tying past climate change to increases in human CO2 ”
Those “good results” are too good to be true. Even the author was “amazed”.
Sadly they are spurious. The presentation is invalid and hence totally misleading.
This thread brings to my mind that people are fighting windmills. In this case some of the skeptics appear to think that the poster and post of Professor Pratt presents a threat for their cause. They see in that poster things that are not there, or at least they think that some innocent souls would see in it something that no innocent soul should be subjected to.
This problem is not one of skeptics alone, actually it may be much more a problem of some “warmists” who consider it essential to fight any slightest deviation off their preferred path. When the one who makes the small step to the side is another climate scientist they are even more horrified.
In most of these cases there are two better alternatives: forgetting the whole issue, and looking at it with a healthy criticism directed to the content interpreted as objectively as possible.
Pekka
You have apparently misunderstood.
I do not believe that Dr. Pratt’s poster is “a threat to my cause”.
I believe it is probably not too bad as an examination of past warming, i.e. by eliminating everything except CO2 as “noise”, ending up with a “CO2 signal”.
Where it fails miserably is in predicting the future (the curve with future warming should never have been included in the poster, as I pointed out to Vaughan Pratt, because it is highly misleading).
It “predicts” a temperature increase by 2100 of 4.3C from a CO2 increase to around 1000 ppmv.
This ignores the two basic constraining factors I mentioned above.
It is a “prediction” made in a vacuum, where the outside world is simply ignored.
As such, that part of Pratt’s poster isn’t worth the paper it’s written on, as I pointed out to him.
Others will determine whether the analysis of the past was simply based on circular logic or is a valid analysis. I have no position on that.
But I think he should remove anything that has to do with future projections, and then I have no problem with his poster.
Do you understand now?
Max
PS
A prediction of “multidecadal climate to within a millikelvin” that ignores constraining factors, which result in a 2000 millikelvin difference, is a lousy prediction, Pekka – that was my point to Vaughan Pratt.
The true MRES: CONSTRAINGING THE UNCERTAINTY:
Having recognised that there is distortion of both F3(AGW) and F3(hadcurt3) due to invalid implementation of the excellent F3 initially intended, and having established that these are not “almost identical” as spuriously suggested:
http://judithcurry.com/2012/12/04/multidecadal-climate-to-within-a-millikelvin/#comment-276545
What can be done to estimate the true residual MRES in the last 15 years when the 3K/doubling model clearly deviates from reality?
What can be done is to extend the analytic function called AGW so that F3 can be correctly applied (that’s a simple drag operation in Excel). Then F3 will recover its 0.4% band pass ripple which is fine. It’s certainly a lot more use than 140mK distortion when claiming mk accuracy.
The only way I can see to asses the real data is what I have already done and posted results for. This does not provide a correct filtered hadCrut3 since some is synthetic but it does permit a constraint being placed on the error at the end of the incorrectly filtered F3(hadCrut3)
The resulting deviations of a correctly applied F3 filter on the synthetically extended hadCrut3, from the result in Vaughan’s spreadsheet found by applying the defective F3 implementation to hadCrut3 was -18mK to +38mK.
The result of subratcting those figures form 140mK shows that the filtered residual that is being called MRES should be AT LEAST 100mK at the end of the data.
If Vaughan was surprised when he got “within a mK” results, he was correct to be surprised. He should have followed through by checking his work.
I can only conclude that this is a classic example of confirmation bias. He was (is) so sure that 3K/doubling catastrophic warming is happening that even when the result looked too good to be true he went public with it.
Unfortunately (for him) it was too good to be true.
Hopefully he will have enough humility to say “oops!”.
Vaughan Pratt | December 15, 2012 at 4:04 am |
>>
GG: [The much heralded “within a mK” result was simply an error caused by running a filter up to the point where the window is half empty.]
Isn’t this a bit like saying that since all the other competitors were unable to break the world record, the one competitor who did so must have made some sort of error?
>>
No, it’s a bit like seeing someone run with giant steps , guessing they have springs in their shoes and estimating from the size of their stride how strong the springs are. Then I examine the shoes and find the springs. When I measure the springs I found they are about the strength I predicted by eye.
At this point the “record holder” either admits cheating, says bought the shoes from someone else and didn’t realise, or denies the existence of the springs.
Now instead of your childish metaphors how about you stick to science and address the figures directly , Emeritus Professor Pratt.
Pekka: …some of the skeptics appear to think that the poster and post of Professor Pratt presents a threat for their cause.
That is certainly the case for a few commentators here, and especially on WUWT. But no, what I see here, like in much that gets past off as climatology, is a threat to the scientific method itself and the undermining of _valid_ environmental problems.
Vaughan Pratt may be surprised to know I’m in favour of harvesting solar energy for a number of reasons. I have designed and built my own highly efficient solar water heater, and done so for others. I have helped others design and install solar P.V., including solar trackers to optimise their production.
I have found the scientific method invaluable in such work.
What I am fervently opposed to is the corruption of science in order the advance ecological issues. Schneider’s “honest or effective” dilemma. The moral imperative to lie to “save the world”.
Though I have argued for 30 years in favour of green issues I’m not prepared to throw science out of the window to falsify a case for action.
Ecology needs science. It does not need science debased.
Now, enough psychology and politics.
Back to MRES.
The method employed is invalid as stands because the filter is run up to then end, that is an incorrect implementation and is invalid. As such the presentation is invalid.
Does that error “matter” or is it knit-picking?
I have shown mathematically that error induced in the calculation of F3(hadCrut3) is between -18 and +38 mK . The error in F3(AGW) is about 140mK.
The resulting MRES is of the order of 100mK , a far cry from the 8mK shown in the poster.
That is black and white. No politics, no opinion.
The claimed accuracy of the model was an error. Period.
From tiny nits, guts knit mighty serpents.
==============================
Pekka says:
“This thread brings to my mind that people are fighting windmills.”
If that comment was meant to belittle the contribution of greg goodman to this thread, it is mis-directed and ludicrous.
Max thought it was about him, you relate it to Greg.
It was not that specific – and I don’t make strong guesses on Greg’s motives.
Oh, my mistake. How could anyone have thought that you were talking about greg, or Max?
I suppose we will always have to wonder about the identities of the windmill tilters.
It was a dumb comment, Pekka.
Thanks for the supportive comment but I didn’t take that as a personal attack, neither do I think it was “dumb” taken in its entirety. Though I was unclear whether is a reference to Don Quixote or those opposed to wind-turbines (frequently mis-named as windmills).
Greg
If you can make a highly efficient solar water heater for use in northern latitude countries such as Britain during the winter you will make a fortune
Tonyb
Too late. In ten years or so the North Sea will be a balmy 38 deg C and everyone will be living under 2m or water. No one will be prepared to pay for hot water any more.
vukcevic | December 15, 2012 at 10:15 am |
‘apparent correlation ‘ between the CET and N. Atlantic geological records now made more sense…
spurious correlations don’t make anymore sense than ‘blind fate’.
It strikes me that we’re trying to ascribe climate outcomes to immeasurable influences in really small drivers (like CO2 created from human activity) instead of immeasurable influences in really large drivers (like insolation). How safe (or sane) a bet is that? It’s like stomping on mice when a herd of stampeding elephants is on the horizon.
ken,
When one has gotten tenure and numerous grants by stomping on mice, one has no reason to tackle elephants.
I know what you are saying Ken,
As a lay person, I have had to start from scratch learning about climate change. I have looked at ice core data and plotted graphs. Looked at recent temperature histories. And the only thing that we can be really sure about, with regard to climate change, is that we have had huge ice ages which have overshadowed everything else. There are indications that we had a Little Ice Age and MWP. But neither these are clearly defined periods, and both contained years and decades which were not typical of these periods. It just seems as if it was a bit colder about 300 years ago and that during the LIA. it was comparable to the present warmth.
As for the cycles, I can see the logic in believing that the 11 year sunspot cycle could have a small effect, but I can’t find any concrete evidence for it.
I don’t see any reason to believe in the 22 year Hale Cycle: I am happy to be corrected, but doesn’t the earth receive the same amount and type of solar radiation over an 11 year cycle? I know that there seems to be a 22 year cycle on the temperature graph which Dr Pratt has shown, but this could just be coincidental. I have plotted temperatures over the last 2000 years from Greenland Ice Core. And there is absolutely no sign of this 22 year cycle, or any other for that matter.
The same applies to data from individual weather stations taken over the last 150 years.
MarkB number 2
As you probably know I’m a historical climatologist wth a particular interest in reconstrcuting the past from contemporary observations, science papers, glacier records and such data as crop and vine maturity dates.
There is no doubt that weather patterns repeat themselves, sometimes enough over a thirty year period to cause a trend that can be termed ‘climate.’
In that respect there might be a ‘cycle’ of repitition, but as for an actual regular cycle of say 22 years or 60 years? No. I’ve not detected it through the tens of thousands of records I’ve looked at covering 2000 years.
Weather seems to be quite random and chaotic although we can discern some truths, one of which is that we’ve seen it all before and the other that severe weather-storms etc-seemed to be much worse during the LIA than they are toda. This is presumably beause the energy gradient between the tropics and poles can be much greater when there is extreme warmth and extreme cold as during the LIA.
Those extremes are smoothed out during a warm period such as the MWP and the modern warming period. Many reports describe how ‘settled’ the weather was (generally) during the MWP. I think we are similarly living in benign times today.
I think those looking for regular cycles -and finding them- are most likely merely demonstrating that computer models are very good confirmation bias instruments.
tonyb
The solar cycle cannot be detected at point sites, which are too noisy to see a signal of one to two tenths of a degree, but is easily seen in the global average surface temperature.
AMO is fairly cyclic , though not in the sinusoidal sense, with a repetition period of about 62years. PDO shows some clear repetition in autocorrelation but is a long way from anything even remotely wavey.
Vaughan’s hand waving attempts at attributing his 50 and 75y sine waves to oceanic oscillations are pure fiction.
When I pointed out that 62 was slap band in the middle of 50 and 75 so it could not be matched to either there was little lecture about amplitude modulation and more hand waving but not coherent attribution.
Now, if his two major harmonics cannot be attributed to the major oceanic oscillations , where are these well known phenomena in his 22y filtered results? Have the just disappeared?
The simple truth is he has isolated everything that does not fit his assumes 3K sensitivity and made an excuse to remove it. Once that is done , Voila! This is the circular logic that was criticised on WUWT.
What I am pointing out is that , even accepting the circular argument the claimed accuracy is a fallacy.
All he has shown is that something that does not look at all like exponential rise in recent decades is a very good match to climate.
That is not at odds with what most sceptics would say.
For those interested in cyclic repetitions , here are north altantic and north pacific SST from hadISST. Note (despite the AMO label) these are actual SST , not detrended etc.
http://i45.tinypic.com/23lgrix.png
http://i47.tinypic.com/5d831l.png
Don’t forget cycles in autocorrelation do not necessarily result from such nice sine wave looking cycles in the data, but do show repetitions of pattern.
@climatereason
You have obviously looked at a lot more data than I have, and even you haven’t seen any sign of a 22 year cycle, so it does look unlikely.
I didn’t know that the weather in the LIA tended to include more storms, so that is something else that I have learnt today!
Correction:
I said:
“It just seems as if it was a bit colder about 300 years ago and that during the LIA. it was comparable to the present warmth.”
It should be:
It just seems as if it was a bit colder about 300 years ago and that during the MWP. it was comparable to the present warmth.
Context corrected your mistake, M. I make the same mistake frequently and context usually doesn’t help me one tiny bit.
=================
MarkB
Don’t worry, i automatically translated it because of the context.
Summer temperatures haven’t really gone anywhere in 350 years, it’s the winter ones that have risen the most over this extended period.
http://www.vukcevic.talktalk.net/MidSummer-MidWinter.htm
This juxtaposition of great warmth and great cold caused storms of great intensity and have been written about by such as lamb in his book ‘historic storms of the north sea, British isles and northwest Europe’
Tonyb
Mark B: ” I have plotted temperatures over the last 2000 years from Greenland Ice Core. And there is absolutely no sign of this 22 year cycle, or any other for that matter.”
Which core are refering to ? What is the resolution of the samples? Would you expect that data to show a 22 cycles if one was present?
Are you just expecting to “see” on your plot?
You will need to try a bit harder than that.
http://www.fel.duke.edu/~scafetta/pdf/scafetta-JSTP2.pdf
“Empirical evidence for a celestial origin of the climate oscillations and its implications”. Nicola Scafetta
The circa 20y cycle is clearly defined in the power spectra from a lot of vary varied sources.See figure 11A. As is 60 years.
He also finds well defined peak at 12.5y in hadCrut3 , (line 6 in table 1.)
Now I hope Lief is watching because this is numerology:
12.5y modulated by 62y is equivalent to 50y + 75y
12.5y is a frequency found in the speed of the Earth relative to the Sun and is caused by the presence of the Moon.
Now the problem here is that VP reckons he’s filtered out all the sub 22y components. So we should not be seeing 50 and 75, just the modulation signal of 62y. So its tricky for him to claim the modulation of AMO is creating his “harmonics”.
Anyway, if you want to look for cycles there’s plenty to work on…
Another thing in the long time scale lag-autocorrelation plot:
http://i47.tinypic.com/5d831l.png
strong Atlantic peak around 62y; small Pacific peak at 50y but 0.2 is within 95% confidence level on this data so it is a significant correlation, though not huge.
BUT both ocean basins’ temps are near zero correlation at 75y lag.
That makes it a bit difficult to suggest either AMO or PDO are the source of “harmonics” as Vaughan Pratt tries to imply.
Yet another spurious claim.
@greg goodman
ftp://ftp.ncdc.noaa.gov/pub/data/paleo/icecore/greenland/gisp/dye3/dye3-1yr.txt
DATA DESCRIPTION:
# FILE: dye3-1yr.dye
# Dye 3 1980 Delta 18-O annual averages.
# These data start in 1872 and are absolute dated by counting of annual layers
(Try plotting a graph of these values and see if you can see a 22 year cycle)
13pt gaussian filter and a few annotations.
http://i46.tinypic.com/21jyxyu.png
Did spend long looking but there seems to be some fairly obvious 20y repetition there.
Ken, the “really large” driver has no secular trend. No change. Flat with a teeny tiny cycle that cant effect anything.
That would be the “one parameter explains the sun” hypothesis I presume.
greg if you have sat silently by while many kooks have peddled cyclomania nonsense at WUWT you basically have no credibility in my mind. Good skills, but no credibility.Zero. zip. When you demonstrate that you are willing to take on the sun nuts, you’ll gain a measure of credibility.
Vaughan Pratt,
I presented a few brief defenses of your work over at WUWT. It might interest you to read them.
Matthew
It might be of interest if you posted a link.
Vaughan has gone a bit quiet since I did the maths and disproved his latest spurious assumption: that his defective implementation of F3 affects the temperature data in an “almost identical” way to his 3K exponential.
The affect on F3(AGW) can be seen in figure 3 to be about 140mK. I determined the affect on hadCrut3 to be between -18and +38mK.
That leaves _at least_ 100mK residual at the end of the record where the exponential looses all resemblance of reality.
Sorry, Greg, but we were going round in circles without any sign of approaching a meeting of the minds. We were reaching the point of vanishing returns on a quite significant investment of time when Mike Rossander’s very nice description of recent multidecadal global climate serendipitously intervened to take the conversation in a new and (to me anyway) more fruitful direction.
I have nothing more to say about the downturn in F3(AGW) than that it is the irrelevant artifact my poster says it is, exactly that and no more. If my Macy’s analogy carries no weight with you then I have nothing further to say on the matter.
@Matthew R Marler: I presented a few brief defenses of your work over at WUWT. It might interest you to read them.
Appreciate that, Matthew. However I looked for a defense in terms of my model having fewer parameters than Mike’s but couldn’t find it. 9 is fewer than 12 (though he only needed 11) but 11 was enough to get Mike up to Level 2. To get to Level 3 he has to get the parameters down to 6 without losing much accuracy. If others join in it may become a race to Level 3.
Vaughan Pratt: However I looked for a defense in terms of my model having fewer parameters than Mike’s
That may merely mean that you have been working on this problem longer. Unless models are strictly nested and there is a true hypothesis test, then it is hard to judge whether the model with the smaller number of parameters is really better. There are zillions of functions for modeling time series, and it may be that in a couple weeks Mike will come across a set for modeling the noise that gives him fewer total parameters. Possibly both of you are already overfitting the noise.
Now that both models and their parameter values have been written, we can use a likelihood ratio, F-ratio or some information criterion to judge which is really a better fit after 20 more years of data collection.
Agreed that parameter counting is naive. But is there any correlation between parameter counting and these other measures like likelihood ration, F-ratio, etc? Intuitively there should be, but it would be nice to know how strong such a correlation could be.
Another way to evaluate these functions is to extend them back before 1850, and see if the amplitude swings are realistic. We don’t expect the phases to be much good, but using a purely harmonic fit guarantees a much more variable climate than even the LIA has produced.
I guess I should make clear that the Rossander approach is a purely harmonic fit with some high-amplitude regular components to fit the current climb. An exponential fit leaves less variability in the multi-decadal harmonics, and, extrapolated back, these amplitudes are only a few tenths of a degree.
An exponential fit leaves less variability in the multi-decadal harmonics, and, extrapolated back, these amplitudes are only a few tenths of a degree
Exactly right. For climate exponentials hindcast better than anything except Gaussians, which so far no one has thought to suggest, probably because they forecast terribly.
You are welcome, greg. Maybe Pekka’s comment wasn’t that ‘dumb’, but would be more aptly described as ‘hypocritical’:
” Pekka Pirilä | December 15, 2012 at 6:36 am |
Greg,
You make your guesses on what others know and think. From that you form straw men and fight them.
Your approach seems to be that others must have totally stupid views on every detail that they don’t explicitly state. it would be more productive to assume that others are reasonable people who have understood what you write, who have thought most of the issues already, and who have been led to the choices they have made taking all this into account.”
” Pekka Pirilä | December 15, 2012 at 6:51 am | Reply
This thread brings to my mind that people are fighting windmills. In this case some of the skeptics appear to think that the poster and post of Professor Pratt presents a threat for their cause. They see in that poster things that are not there, or at least they think that some innocent souls would see in it something that no innocent soul should be subjected to.”
It’s a pot and kettle kind of thing, if you know what I mean.
Since there are now more comments to reply to individually than I could possibly manage, and since I tend to dawdle thoughtfully over my comments (whence the very long pauses between them), let me respond here in one place.
I am very grateful to Mike Rossander for proposing an alternative description of multidecadal climate, which I’ve been asking for ever since I posted on December 4. As an accurate fit, it is as he points out even better than mine. To the best of my knowledge Mike is the first to respond.
To answer David Springer’s question whether I tried a solver, I tried essentially the same experiment as Mike in MATLAB early in 2012, using A\B for fitting linear coefficients and Nelder-Mead for non-linear. (Outside academia MATLAB costs several hundred dollars, so I ported it all to Excel later on for greater transparency and accessibility.)
I found that F3(HadCRUT3) could be fitted accurately with sine waves of frequency nf for n = 1 to 5, each involving 2 coefficients (amplitude and time-shift), plus one more for frequency f (= 1/ToothW) for a total of 11 coefficients. I also had the three coefficients for AGW but Nelder-Mead simply gave CS a tiny value so as to neutralize AGW—evidently computers don’t believe in global warming so why should humans? ;)
Mike used 12 coefficients to fit F3(HadCRUT3), which I could have told him in advance based on my experience would give a great fit with no help from AGW. (Actually he’s only using 11 coefficients because if you scale Amp1 by x and divide Scale1 through Scale5 by x you get back the same curve with the same fit, i.e. the coefficients are not linearly independent. Trigger is irrelevant for the corresponding reason: if you add x to Trigger you can compensate by subtracting x from each of the 5 shifts.)
However Fourier could have predicted in 1820 what Mike and I independently found without the need for either MATLAB or Excel Solver. This is because what we’re doing is fitting 5 sine waves of frequency nf for n = 1 to 5 to data X that has been filtered by F3, with the added degree of freedom (which makes it even easier to get a great fit) that the solver can decide in effect how wide it wants F3(X) to be.
Setting ClimSens to 0 flattens AGW to have the same mean as HadCRUT3. Hence HadCRUT3 − (SAW + AGW)), call it H, has zero mean and is influenced only by SAW when adjusting its 11 parameters (remembering not to count Amp1 and Trigger).
Now if you perform a 160-point Fourier transform of F3(H) (delete a year from one end to make it even), you will have analyzed it exactly as a sum of 80 sine waves for n from 0 to 79, with the n-th having frequency nf where f as the fundamental has period 160 years, an amplitude, and a phase (those familiar with the subject will know the other ways of packaging those two parameters). Since H (and therefore F3(H)) has zero mean, the 0th sine wave or DC signal will be zero. And since F3 takes out the 8-th and higher sine waves, that just leaves 7 sine waves in the Fourier analysis.
F3 has attenuated the 7th to 2% (essentially MAIN!Y276), and the 6th to around 7%. My impression is that that neighborhood of HadCRUT3’s spectrum doesn’t have a strong signal to begin with, so knocking it down to 7% of an already weak signal should be down in the noise.
This leaves the first five sine waves, which are the only ones we should expect to have any significant strength in the Fourier transform of F3(H). They are described by ten coefficients, two each.
Fourier would be greatly satisfied that Solver could find them.
But Solver need not find those coefficients because it is free to play around with ToothW as well — it doesn’t have to be 160 years. Some values for ToothW may worsen the fit found by Fourier’s method with ToothW = 160, but some may improve it. Apparently the 215-year value gives the best improvement out of all the possible years between 100 and 300 (anything much below 100 isn’t going to fit well, and probably likewise for 300). In making that adjustment for a better fit the other 10 parameters Fourier handed us will have changed a lot too since they are for sine waves of lower frequencies.
This brings to me to my first concern about Mike’s model of recent climate. It is overfitting by having enough parameters to wave the four legs and trunk of the elephant around independently each on a plane (two parameters per limb) and an extra one, ToothW, to adjust the length of its tusks (assuming they’re equal).
Pekka raised the concern about overfitting early on, so I’m surprised he didn’t notice that, however badly I might be overfitting with my 9 parameters (6 for SAW and 3 for AGW), Mike is overfitting by 2 more. It is surprising what a difference the loss of a mere 2 parameters can make here in the quality of fit achievable.
At least usually. In the case of my fit, when I set the three unlocked shape sliders to zero the R2 drops from 99.99% to 99.975%. I’m now down to 6 parameters, 3 each for SAW and AGW.
Yet I didn’t have to touch these 6 to keep the fit so high!
Now isn’t that odd.
Now that Mike has met the original challenge, namely to produce an alternative description of multidecadal global climate since 1850, it is time for a new challenge.
Describe multidecadal global climate since 1850 to an R2 of 99.97% with a six-parameter model.
Mike, if you can achieve this with a model (any model. it doesn’t need to involve my SAW or AHH’s AGW) that doesn’t admit an obvious decomposition resembling Figure 10 of my poster, and instead has a component more like D’Aleo and Easterbrook’s graph at WUWT that was mentioned here earlier, this ought to be excellent grist for their mill, as well as hopefully satisfying those objecting that SAW has nothing whatsoever to do with ocean oscillations. If it doesn’t then the same objection should apply to D’Aleo and Easterbrook since they have no better idea of where the AMO+PDO shape comes from than anyone else. It’s a big mystery.
And MattStat, you should be flogged with a wet noodle for not counting parameters! ;)
if you add x to Trigger you can compensate by subtracting x from each of the 5 shifts.
Correction: by subtracting x/ToothW from each of the 5 shifts (which are expressed in units of tooth widths).
Have you any idea just how stupid it is to be arguing about fitting temperature to within a few milliKelvins when the temperature itself is not known to anything like that accuracy.
A million samples at 1 C accuracy when averaged is at a mK accuracy. While it is true that this incorporates all systematic errors (biases), whatever that systematic error is is also being measured at that accuracy. So the bias might be 0.137 C, but it is meaningful to say so.
If I count the number of students at Stanford it won’t tell me how many students there are at Columbia. If I count the students at Stanford a million times it still won’t improve my knowledge of Columbia.
The global average temperature record is like that, you moron. It’s not a matter of the thermometers not being accurate to a millikelven. It’s a matter of not having a thermometer at all.
You’re either a moron or dishonest. Which label do you prefer?
Vaughan Pratt said, ” So the bias might be 0.137 C, but it is meaningful to say so.”
Yep, and since the bias increases as you try to squeeze more higher latitude data into the estimates, the regional bias can be twice as much or more. A shift in hemispherical dominance could produce a 0.2C change in “average” temperature with absolutely no change in average energy. The margins of error are frigging huge, but thanks to the “Merchants of Doubt” questioning what appears to be overly confident “confidence” intervals is suicidal.
That is one thing I really like about your poster, intentionally or not, it highlights how unbelievable “accuracy” can be obtained :)
http://www.youtube.com/watch?feature=player_detailpage&v=LV4adG7bTWE
Now imagine those patterns on a sphere with an average temperature change of 1 C per degree of latitude. “Houston, we may have a problem.”
Vaughan Pratt – Your latest long rambling point-avoiding response is nothing but an exercise in obdurate stupidity. It doesn’t make a fish’s tit of difference how many parameters are used or whether R2 is 99.99% or 99.975% or whether calculations are accurate to a few milliKelvins. Have you any idea just how stupid it is to be arguing about fitting temperature to within a few milliKelvins when the temperature itself is not known to anything like that accuracy. Even the Hadley Centre show that the 95% confidence range on their measured temperature is generally not far off 2,000 milliKelvins.
http://www.metoffice.gov.uk/hadobs/hadcrut3/diagnostics/comparison.html
The whole point of Mike Rossander’s calculation is that it shows that all of your calculations are completely meaningless wrt climate. Your sinewaves and his are demonstrably of equal merit – zero – not because of the number of parameters used, but because they do not have any physical reason or explanation.
The whole point of Mike Rossander’s calculation is that it shows that all of your calculations are completely meaningless wrt climate. Your sinewaves and his are demonstrably of equal merit – zero – not because of the number of parameters used, but because they do not have any physical reason or explanation.
If what you claim is completely independent of the number of parameters as you say, Mike should have no difficulty at all demonstrating it with six parameters instead of 11.
@Mike Jonas: long rambling point-avoiding response
Good one, that. Hope you don’t mind if I steal it… ;)
So professor. You continue blindly one ignoring fact that you have 140mK error at the end of F_defective_3(AGW) and a much smaller error of a between -18 and +38 mK at the end of F_defective_3(DATA) .
When you thought you could brush this issue aside by assuming they were equal you agreed the error was there but said it did not matter. Now I have proved that they are not equal and it does matter you carry on as if no one will notice.
Your defective implementation of F3() is not valid at either end of the time series.
The “amazing” success of your model is based on the fortuitous similarity of F_defective_3(AGW) and the actual Hadley data.
What is a bit odd is the you can turn an exponential that is nothing like the last 15 years into something so close just by over-running the running mean. But odder things happen.
Mikestat’s model will be less impacted because with a CS of zero he will not have the 140mK error at the end of F_defective_3(AGW) , however, he will still have between -18 and +38mK of distortion in F_defective_3(DATA) So his “amazing” fit is closer to the truth than your “amazing” fit by a long way but neither can ever correctly assess the true error in the model residual of the last 25y because you cannot correctly filter the data in that period.
He has proved your bogus result is not a uniquely bogus result but any more “challenges” will be wasting his time.
You claim there is identity between F3(DATA-SAW-AGW) and F3(DATA-SAW)-F3(AGW).
I agree with the linearity argument and have never said otherwise (despite your repeated false claims to the contrary). While you remain within bounds of the correctly calculated F3 this linearity is assured as it would be for any convolution filter with a fixed kernel.
However, once you run out the ends of the window you are changing the coeffs and the size of the kernel at each step. How do you calculate the frequency response of that? Are you saying that is a linear transformation as well?
Don’t you find it odd that, when your AGW model runs off to about 140mK above DATA in the last 15 years, this does not show up in MRES ?
Try calculating (DATA-SAW-AGW) explicitly without any filters then run F_defective_3() on that time-series. I bet you don’t find 8mK as the end value.
My guess would be about half the 140mK less half the 10-20mK drop in I estimated in temps. Somewhere around 60mK.
Maybe Mikestat, or someone else would like to run that test before wasting any more time on your “challenges”.
Don’t you find it odd that, when your AGW model runs off to about 140mK above DATA in the last 15 years, this does not show up in MRES.
That was my question to you. No fair bouncing it back to me.
I don’t find it odd at all, but it’s been clear all along that you’re enormously puzzled by it. You shouldn’t be.
Suppose for the sake of argument that ENSO and SOL and all those higher-frequency components don’t exist at all in HadCRUT3 − SAW and that it is exactly tracking my AGW model. Then both will bend down by exactly the same amount, and MRES will be exactly zero.
If F3 largely kills those higher frequency components then MRES will show only tiny fluctuations. That is why the green curve in Figure 2 bends down almost exactly like the blue curve in Figure 3.
Oops, MattStat, sorry.
Just a general remark: I find it very strange to see people complaining about climate models on the ground that they have too many parameters, yet when someone proposes to compare models on the basis of which one has the fewer parameters they spin on their heels and flatly deny the significance of number of parameters.
If that’s not a moving target what is?
They dont like the answer. Got the same reaction when we only used 2 parameters.. oh thats too simple,
The stupid gets pretty thick.
@Steven Mosher: The stupid gets pretty thick.
Kevin Kline got his only Oscar for repeating “Don’t call me stupid” incessantly in A Fish Called Wanda. I think this resonated strongly with the Oscar judges.
People underestimate the entertainment value of Climate Etc. Now that entertainment has shifted from Hollywood to the Internet Judith may come up for an Oscar at some point for hosting these Kevin Kline characters. I’ll be more than happy to endorse the nomination.
Dr. P.
I want to thank you for moving your stuff from matlab to excel so that people can play with the data and methods themselves.
When time permits I’ll swing down to the pennisula and buy you a cup of coffee. Maybe wrangle Dr. S into joining us.
Bring it on!
Make it a Thursday so Leif doesn’t have to make an extra trip. (He comes down to Stanford on Thursdays.)
Steven Mosher
The key is NOT the number of parameters.
It’s picking the right ones.
Max
Vaughan Pratt
You have yet to respond specifically to my critique that you left out a key parameter when it comes to projecting future human emissions of CO2, namely the rate of growth of human population (who are emitting this CO2).
You also ignored a key constraint on the amount of CO2 emitted by humans, i.e. the amount of carbon contained in all the remaining fossil fuels on Earth.
By ignoring these two key parameters, you ended up with a GIGO prediction IMO – one that has exaggerated CO2 increase and warming by a factor of around 2:1 (and is thus off by around 2,000 millikelvins by 2100).
Max
VP: “Suppose for the sake of argument that ENSO and SOL and all those higher-frequency components don’t exist at all in HadCRUT3 − SAW and that it is exactly tracking my AGW model. Then both will bend down by exactly the same amount, and MRES will be exactly zero.”
Two curves that are the same will be filtered the same no matter what they represent or how badly you implemented the filter.
“If F3 largely kills those higher frequency components then MRES will show only tiny fluctuations. That is why the green curve in Figure 2 bends down almost exactly like the blue curve in Figure 3.”
The reason fig 2 bends down is mostly because the data bends down, there has been no global warming for the last 16y.
The reason that F_defective3(AGW) bends down is because you screwed up the running mean. You have already recognised the problem and discussed with Pekka various ways of reducing the problem.
All you are doing now is falling back to where we were two days ago where you assumed (then) / pretend (now) that figure 2 is affected in exactly the same way as the exponential in fig 3.
I have shown that this is not the case and run the numbers to prove it.
You have not said whether you regard F_defective_3() to be linear at the ends.
You have not calculated the true residual and passed it through F_defective_3() to test your linear assumption on it.
It’s a simple test. Haven’t you checked?
@greg goodman: The reason that F_defective3(AGW) bends down is because you screwed up the running mean. You have already recognised the problem and discussed with Pekka various ways of reducing the problem.
Greg, anyone with an IQ over 50 can see that a moving average filter defined with Excel’s notion of AVERAGE will bend down a fast-rising curve at the end. I saw that weeks before you did, as evidenced by the commentary right next to the downturn in my poster. Hence your claim that I “screwed something up” is a problem inside your head that has nothing to do with reality. Have I made myself clear?
All you are doing now is falling back to where we were two days ago where you assumed (then) / pretend (now) that figure 2 is affected in exactly the same way as the exponential in fig 3. I have shown that this is not the case and run the numbers to prove it.
Apologies, I must have overlooked your proof and numbers, comments are flooding in way faster than I can possible respond to. Please point me to where you showed this, backed up with your numbers. Currently I don’t believe it for a second but I’m more than willing to entertain arguments to the contrary for however long it takes.
You have not said whether you regard F_defective_3() to be linear at the ends.
Actually I’ve done so several times, which you’ve chosen to ignore along with my other arguments. Furthermore the spreadsheet confirms this at column AA, which likewise you have never acknowledged. Please stop blowing off my arguments as though I were an IQ 50 moron or we’ll never get anywhere.
greg, you have realized that the same treatment for non-existent for future years is applied to the Hadcrut-SAW and AGW curves, haven’t you? It curves down in both for the same reason, i.e., the fill values. Ideally you would discard both in the last ten years because F3 requires 10 future years in order to be done properly without assumptions.
Lots of luck persuading Greg of this, Jim D. He seems to have stuck his brain in the freezer by mistake.
Vaughan Pratt | December 16, 2012 at 1:01 am said: ”Lots of luck persuading Greg of this, Jim D. He seems to have stuck his brain in the freezer by mistake”
would you believe; Jim D stuck his brain in the freezer, intentionally!… Someday, he may use it.
Vaughan Pratt, I tried out your Excel file. I like the 6-parameter fit. There is a wavenumber 5 in the residual. I suspect a longer running filter near 30 years would also remove that, but that adds a variable (F4?), and you may start compromising the exponential growth rate.
Thanks, Jim D. Actually I’m contemplating going the other direction on the ground that HALE looks like the only signal in its octave.
If I use F3′ (F3 shifted up an octave) in place of F3 I double the number of harmonics that it doesn’t kill! If F3 killed all but 5 harmonics (hence 10 parameters) then F3′ should kill all but 10 harmonics hence 20 parameters.
So all I have to do is to describe HALE with fewer than 10 parameters and I’m ahead of the game. 3 parameters would give a sinusoidal model of HALE, while 5-6 would describe its recent decline in amplitude as visible in HadCRUT3.
This looks to me like a promising way to widen the gap between the number of parameters in my model and the effective number of dimensions in HadCRUT3 after filtering out the hard-to-describe high frequencies. HALE doesn’t look that hard to describe.
The question for MattStat is whether this gap should be measured arithmetically or geometrically. That is, is it the difference or the ratio that matters when comparing number of parameters in the model with the effective number of dimensions in the filtered space?
It’s 25 not 10y your need. SAW and AGW are analytic fns. they can be extended and then F3 with be exactly as intended with 0.4% ripple. The current way they are distorted is pointless.
The problem is , see below. for that.
It’s 25 not 10y your need. SAW and AGW are analytic fns. they can be extended and then F3 with be exactly as intended with 0.4% ripple. The current way they are distorted is pointless. The problem is see below. for that.
You’re breaking up, Greg. Please hang up and dial again.
Vaughan , don’t worry about my chat here, I’m just killing time while you have a chance to look the estimation of the error induced by F_defective_3(DATA) .
@greg goodman: The reason fig 2 bends down is mostly because the data bends down, there has been no global warming for the last 16y.
Greg, I seriously hope nothing in your career depends on what you post in Climate Etc. This is without question the most utterly stupid statement you’ve made in all of your many comments in this thread.
Bends down in the sense that AGW bends down once filtered, from the upward trend of late 20th c. I’m not suggesting a temp drop, at no point have I suggested ‘global cooling’.
I’m not suggesting a temp drop, at no point have I suggested ‘global cooling’.
Ok. Have you suggested something else? (Just trying to understand the connection between your “there has been no global warming for the last 16y.” and the fact that F3(AGW) bends down.)
Drop it doesn’t matter, I’ve got tenure.
VP: “Usually when you do this sort of thing the unexamined portion (1850-2010) wiggles randomly. It is therefore very interesting that in this case the portion of MRES after 1950 never goes negative! Might be just a coincidence, but there could be more to it, especially given that it proved much easier to flatten 1850-1950 than 1950-2010.”
An exponential will always trump a cosine. This may be a sign that you’ve over cooked your CS.
@greg goodman: An exponential will always trump a cosine. This may be a sign that you’ve over cooked your CS.
How is “exponential” relevant to your point, which is no less true when you replace “exponential” by linear? Would a linear function prove that I’ve “overcooked” my CS?
I’m starting to feel like Peter Lang when he complains about ideologues. You wouldn’t by any chance be an ideologue about this question of AGW, would you? Please say no.
I was following up on the suggestion to look at WUWT and noticed the following comment there by John Mathon:
just as vpmks model shows natural phenomenon decreasing to zero effect
(vpmk = Vaughan Pratt mK)
That puzzled me greatly since my model shows that SAW (which is what I assume he’s referring to by “natural phenomena”) is about to rise significantly.
Furthermore so is SOL, which has gone way down since solar cycle 23, very similar to cycle 17 when solar went way way down then too. A big upswing is very likely to result from our entry into cycle 24.
Even if CO2 has no impact whatsoever on climate, the combination of SAW+SOL tells us that we’re in for a big upswing in the coming decades based purely on natural phenomena!
Those underestimating the impact of anthropogenic global warming are also underestimating the impact of natural global warming.
“Even if CO2 has no impact whatsoever on climate, the combination of SAW+SOL tells us that we’re in for a big upswing in the coming decades based purely on natural phenomena!
Those underestimating the impact of anthropogenic global warming are also underestimating the impact of natural global warming.”
I predict this to continue (roughly):
http://i1159.photobucket.com/albums/p623/Oefinell/15yrLR.jpg
http://i1159.photobucket.com/albums/p623/Oefinell/20yrLR.jpg
http://i1159.photobucket.com/albums/p623/Oefinell/30yrLR.jpg
So, by ~2020, the 15-year trend will be -0.2 K/decade, the 20-year trend -0.1 K/decade and the 30-year trend 0.0 K/decade.
@Edim: I predict this to continue (roughly):
Right on, Edim. Clearly Yogi Berra (about predicting the future) holds no fears for you. Go for it!
Hey, I just offer my ‘humble’ prediction (for comparison). What do you think the 30-year linear trend will be in 2020?
What do you think the 30-year linear trend will be in 2020?
2020? I only know about multidecadal climate, Edim. I don’t make projections. especially not seven-year ones..
Vaughan, you’re clearly expecting a big upswing in the coming decades, and I think we’re in for a big downswing. Quite the opposite. Who will be closer?
Beats me, Edim. I’m way too old for those questions, happy to leave them to the next generation.
http://judithcurry.com/2012/12/04/multidecadal-climate-to-within-a-millikelvin/#comment-277100
You replied in vague dismissive comment calling it fallacious without explanation. You now say “Currently I don’t believe it for a second ” so clearly you did not even read it before calling it fallacious.
” Hence your claim that I “screwed something up” is a problem inside your head ”
OK , apologies, that is not productive I agree. Less ‘fallacious’ and less ‘screwed-up’ would be more helpful all round.
” Please stop blowing off my arguments as though I were an IQ 50 moron or we’ll never get anywhere.”
Agreed, now please stop blowing off my arguments as though I were an IQ 50 moron .
It took considerable time for me to get you to get the point on this:
December 15, 2012 at 1:21 am
>>
The problem in a) is that what you are calling F3 isn’t F3 in the crucial divergence at the end.
Thinking about this again, I agree with you there. What’s missing here is the concept of what my filter does as it approaches the end of a series, which we agree now (I think) is not equivalent to merely padding with zeros.
>>
At least we’re not on the same page on that one now.
You have been trying to take me to task about F3 for days when I have said nothing but how good it is. You also keep bringing up gaussians which I never mentioned. I have no problem with the width of F3 when it gets it’s full width. There is no dispute and not need for gaussian.
I used F_defective_3 above to distinguish what is actually being used from the correctly applied F3 which has minimal pass band leakage. Choose another nomenclature if you wish but it is essential to distinguish the two. Calling everything F3, we will always be at cross purposes.
Clearly the two are identical in the middle 90 years of data.
When I said “You have not said whether you regard F_defective_3() to be linear at the ends.” I am specifically referring to shortening of the window and changing coeffs. That end up doubled. That variable factor would seem to break the linearity. The way it progressively expands the result in time( that you have already commented on) would not seem to be a linear operation , though I may be mistaken.
Though the expo appears to get bent down , and I have used that phrase myself, it is actually stretched. This is why is it has a very different effect on the essentially ‘flat’ temp data. And therein lies the problem.
I am aware that true F3() is linear, no issues. I am also aware that you are treating it as linear in the spread sheet even when the window is not full. Both in the text/graphics and calculations you are assuming it is linear.
You agree the defect ‘effectively’ reduces the height of AGW, it does this in a progressively increasing way by stretching it in time. I think you will agree that a flat line will not suffer this distortion and will remain flat.
Hence the essentially flat temp data, though not intact since not truly flat, will be less affected. Ironically the deformation of AGW makes its form very similar to that of temperature over the last decade or two.
I have tried to determine a reasonable assessment of the constraints of how DATA will be affected by considering current extremes of warming and cooling trends.
We can get an exact application of true F3 for the analytical functions SAW and AGW. The fly in the ointment is to at least put bounds on the range of distortion at the end of F_defective_3(DATA).
Here is what it looks like:
http://i49.tinypic.com/2yx4s61.png
the bottom line numbers are -18mK to +38mK. See linked post for the details.
Without spending days arguing over exactly how steep any future rise or fall may be (I think your current expectations would fall somewhere in the middle of these two extremes) , I think this clearly shows that DATA will be affected to a much lesser extent the AGW.
So the effect will not be the same and will not cancel out.
This was close to what I suggested would be the case but doing the calculations constrains the possible range of values.
You also keep bringing up gaussians which I never mentioned.
I beg your pardon? Earlier you wrote “as you well know a gaussian kernel is always a truncated gaussian. It produces a mathematically valid result to the precision determined by where the gaussian is cropped when designing the filter.”
You also wrote “In fact your exponential AGW ends up looking more like gaussian. Instead of an exponential rate of change, it near to zero.”
And later on your wrote.” The only reason yours appears to have a small residual is because you did not fit the exponential AGW but the “gaussian” F3(AGW).”
Yet later you wrote ” As you say, [F3] is quite similar to gaussian, it may well be better since it was specifically aimed at removing known frequencies in the data.”
You also wrote “You have also resorted to pretending I have said you should be using a gaussian instead of F3. This a TOTAL FALLACY.” (I have never claimed you said I should be using a gaussian, the fallacy is your claiming that I said so.)
Greg, your claim that you’ve never mentioned gaussians is laughable, as is your ongoing refusal to address my complaint that you allow Gaussians to be cropped but not F3. You are being intolerably inconsistent!
I could hardly reply to all your comments without using the G word.
You brought up kernel truncations in gaussian kernels not me, I just replied.
” AGW ends up looking more like gaussian.” was a reference to the FORM of your bent F3(AGW) not anything to do with filters.
Let’s not get into silly word games again. Try to stick to the physic/maths.
Now lets resolve this problem you have once and for all. Gaussians get truncated , typically at 3 sigma. Where they get truncated determines the precision, not the FWHH . Running means have a finite length, that length determines their frequency response not the accuracy , which is generally crap unless you stack them like you did here. RM does not get cropped so there is no direct comparison. Neither kind of filter will perform as designed it the kernel width is not respected. This goes for all convolution filters not just G and RM.
I don’t see anything contentious so far. So why do you keep saying I don’t apply the same rules.
Now all that is left is that you are trying to say abusing the window of F3 near the end of the data is in some way comparable to where a gaussian gets cut off during design.
If that is your point and you still can not see how incorrect that is , just say so and I’ll try to explain.
BTW the don’t take all day about it , I have to go out and check out the electronics on my tracker and help another college extend his off-grid PV array. I’m sure would not want to stop me doing that. So please be brief.
If that is your point and you still can not see how incorrect that is , just say so and I’ll try to explain.
Wow! We’re almost there!
So please tell me where exactly F3 should be truncated. If you continue to say at 25 years then what we’ve got here is a failure to communicate..
Almost but not quite. I’ll try again.
Now all that is left is that you are trying to say abusing the window of F3 near the end of the data is in some way comparable to where a gaussian gets cut off during design.
If that is your point and you still can not see how incorrect that is , just say so and I’ll try to explain.
That requires you make a statement. Not ask another question of me without replying.
That requires you make a statement. Not ask another question of me without replying.
Based on truncation at 6 dB, F3 should be truncated at 11 years.
Your turn.
are trying to say abusing the window of F3 near the end of the data is in some way comparable to where a gaussian gets cut off during design?
Hmm, trick one huh?
I have to go to set up my solar oven and make some bread. Take a few minutes to think about it.
Oh dear you’ve gone to make some bread too.
“Based on truncation at 6 dB, F3 should be truncated at 11 years.”
10^-0.6 = 0.25
25% , not very ambitious. Can’t do that then crow about mK accuracy.
Let me help. We already saw that 1mK SD was about 1% of hadCrut3 SD. Now you will be running three of these F3 filters and adding/subtracting results , so you need 0.0033 for each one.
That’s -25dB , how many years is that on F3 ?
Greg
Whilst you’re waitng for the bread to cool-I’ll have one of your solar ovens as well as the solar watrer heater please- thought you might be interested in this 1939 article concening a 16 year cycle.
This is with reference to our previous comments about the existence of cycles or being able to observe them ‘on the ground’ in individual locations rather than as a global signal
http://trove.nla.gov.au/ndp/del/article/17557868?searchTerm=iceland%20melting&searchLimits=
1939
THEGLACIERS.
Ice Retreating.
GEOLOGISTS STILL
PUZZLED.
CANBERRA, Thursday
One of the riddles which is puzzling geologists all over the world is the continuous retreat of the ice glaciers. Does this phenomenon indicate that the sun is getting hotter as some astronomers believe or is it dependent upon comparatively unimportant changes in the earth’s atmosphere ?
Consideration such as these were discussed by Professor R. Speight, formerly professor of geology at Canterbury College, Christchurch, New Zealand and now curator of the Canterbury Museum. In his presidential address to the geology section of the Science Congress to-day. His subject was “Some Aspects of Glaciation in New Zealand.”
The steady retreat of the glaciers in New Zealand he said had been observed during the last 70 years. Photographs taken in 1896 and 1935 showed that several glaciers had retreated distances varying from 100 yards to half a mile in 40 years.
The phenomenon, however, was world-wide. Equally impressive records were obtainable from Switzerland, Scandinavia, Iceland and the United States. Attempts had been made to reconcile these observations with the Bruckner cycle of climate change every 16 years. Pro- fessor Speight said, but so many discrepancies occurred that in his opinion precise synchronisation with that period could not be accepted.
In Alaska glaciers had been retreating from 100 to 200 years, the average rate of recession being about 50 feet a year. The Antarctic ice- sheet also showed signs of recent retreat.
“In fact,” said Professor Speight, “no case is recorded of a region of the world in which there are present signs of an advance. This is quite apart from the general retreat since the pleistocene age and may be merely a pacing phase. Its precise significance can only be determined by continued observation.”
tonyb
Oh shoot, I just noticed your
Gaussians get truncated , typically at 3 sigma.
That’s sufficient to let me answer my own question: “So please tell me where exactly F3 should be truncated.” I really must apologize for not noticing that.
The integral of a normalized Gaussian from 3 sigma to infinity (erfc(3/sqrt(2))/2 in MATLAB) is 0.00135, that is, 0.135% of the total area under the Gaussian.
The corresponding point in the impulse function for F3 is at 22 years. Hence the corresponding truncation is to remove years 23 and 24 (MAIN!AQ246 and 247). That removes .0.0009 or 0.09% of the total area under F3, close enough.
That means that when closer to the end than 22 years, F3 is making a larger error than is made by truncating a Gaussian at 3 sigma.
Actually one could truncate at 2 sigma and the area removed would still only be 2.27%. The approximately comparable place to truncate F3 is at 16 years, removing 8 years and 2.6%. Not quite good enough for 1 mK accuracy, but I’m well aware that as F3 falls off the end the accuracy falls off too. Nice to be able to quantify the fall-off more precisely.
You’re right that this doesn’t depend on Gaussians, and that it was I in the first place who forced you to use the G word—I apologize for giving you a hard time about that, it was quite unwarranted. However I’ve found this quantitative connection between F3 and Gaussians helpful for me as it gives me a better grip on the relationship between them.
And, as you point out, another difference with Gaussians is that they are truncated even when far from the end, whereas F3 is not (in fact the way I’ve implemented it in Excel that would be hard to do). However from an accuracy standpoint truncating a Gaussian at 3 sigma is harmless; 2 sigma would start to be a concern.
How to approach the ends with a filter is essentially the same issue with both F3 and a Gaussian, and any choice of approach can be applied to both with similar results. Accuracy in one or both of frequency and time necessarily falls off, and at about the same rate for any given choice of approach.
The only serious difference between F3 and a Gaussian is that F3 cuts off at its design frequency much more sharply than a Gaussian when clear of the ends. Otherwise they’re very similar and the intuitions about one largely carry over to the other.
OK, now we’re getting somewhere.
Firstly thank you for recognising your unwarranted badgering and the fact it was you who brought all this up not me. I’m glad I’ve been able help you get a better understanding.
Thank you for the apology.
VP: “The corresponding point in the impulse function for F3 is at 22 years. Hence the corresponding truncation is to remove years 23 and 24 (MAIN!AQ246 and 247). That removes .0.0009 or 0.09% of the total area under F3, close enough.
That means that when closer to the end than 22 years, F3 is making a larger error than is made by truncating a Gaussian at 3 sigma.
”
So you could crop two years at each end of you F3 design and be close to a 3-sigma gaussian but the comparison to gaussian is arbitrary and does not directly answer the design question. To attain your claimed accuracy you need 0.0033 for each run of the filter. I asked “That’s -25dB , how many years is that on F3 ?”
Since you have already stated the bandpass ripple on F3 is greater than that the clear answer is that you need THE FULL KERNEL WINDOW with no cropping to even get close to 1% on the overall result where you use it three times.
VP;” So please tell me where exactly F3 should be truncated. If you continue to say at 25 years then what we’ve got here is a failure to communicate. http://en.wikipedia.org/wiki/What_we%27ve_got_here_is_%28a%29_failure_to_communicate
”
So the failure to communicate was not where you thought it was. I will not rub your nose it in by asking for another apology for the smart comment , it is sufficient that we now agree that I was correct all along.
You need the full 24 years each side of the central date.
I’m glad I’ve been able help you get a better understanding.
I wish that were the case. I apologized for badgering you, not for failing to understand you, which remains the case. I remain mystified by your calculations. If you can persuade me that they make sense then I will apologize for being dense.
@gg: You need the full 24 years each side of the central date.
I confess to some puzzlement as to how you arrived at this. The impulse response for the 24th year from the center of the kernel is 0.0002, see cell AQ246 of the spreadsheet’s tabulation of the impulse response. Hence when the kernel center is 23 years from the end on each side Excel takes that 0.0002 and redistributes it to the remaining 48 points of the kernel so as to keep their total sum at 1. This falls out as a consequence of the Excel definition of AVERAGE: when you average say 23 elements one of which is blank, instead of weighting the non-blank ones by 1/23 it weights them by 1/22 in order that the weights in play always sum to 1.
It then follows that when averaging constant data there is no error at all when the kernel starts to fall off the end of the data. If however there is say a very steep systematic rise then the redistribution of that 0.0002 weight among the remaining 48 points of the kernel will very slightly bias the result, but by orders of magnitude less than you’ve calculated depending on the steepness. That is why F3(AGW) does not start to bend down noticeably despite that steep rise on the right until some 15 points of the kernel have fallen off the data.
I’m also puzzled by your reference to ripple in the frequency response. If we were working in the frequency domain this would make sense but I don’t see how we could be: we’re moving a kernel in the time domain and watching what happens year by year as kernel points fall off the end of the data, which itself is presented in the time domain.
I did however appreciate your eventually giving me the right link to your error analysis after you’d mystified me twice with an incorrect one, which is why I asked for help (to which you responded “oh please make an effort”). Unfortunately the correct link led to where you replied to my statement ““At 10 years from the end the impulse response of F3 is down by 20*log(.0433/.0252) = 4.7 dB, at 12 years 6 dB. ” by saying “You can’t be “ten years from the end” of an impulse response , it is a frequency plot !”
That too greatly puzzled me. How is an impulse response a frequency plot? The numbers 0.0433 and 0.0252 in that computation of mine come from cells AQ270 and AQ260 respectively in the impulse response tabulated in my spreadsheet. When the filter gets within 10 years of the end cell AQ260 falls off the end of the data. The frequency response for F3 tabulated in MAIN!Y258:Y313 plays no role in those computations.
Combining this strange statement with your mention of ripple leads me to the thought that you are getting numbers bearing no relation to reality because some of your calculations are being done in the frequency domain and some in the time domain and then are being combined without regard for the fact that they’re from different domains.
If my guess is correct that would explain a lot.
No, I’m an ideologue about not using simple running mean “smoothers”, which is why I was pleased with your triple RM composite. I hate climate science that cant’ get beyond subtracting non existent linear trends from chaotic data and doing OLS on scatter plots.
I’m an ideologue for doing the maths correctly. Beyond that as I said above, I think ecology needs science and despise those who pretend to be scientists but a ready to throw science under a bus to “save the planet”.
I’ve spent of lot of time trying to disentangle CS as well. I have my guesses as to where it lies but I’m looking for answers.
I’m an ideologue for doing the maths correctly.
Since we have that in common (along with Gavin Schmidt when I called him a “warmista” once), what do you say we stick to that and assume that both of us are working in good faith?
Sounds good. I would also suggest that both of us consider the horrifying prospect we may be wrong about some or other aspect of this and try to see if there is something we can learn from what the other is saying?
Speaking as a mathematician (one of my several hats), I so constantly contemplate that prospect that it has no horrors at all for me, to the extent that I could imagine six impossible things before breakfast. :)
There ought to be a club devoted to imagining six impossible things before every breakfast. (Please sir, is today’s lunch before tomorrow’s breakfast?)
very good, hope you enjoyed your breakfast.
How are we getting along assessing the error range ?
http://i49.tinypic.com/2yx4s61.png
the bottom line numbers are -18mK to +38mK. See linked post for the details.
By “linked post” did you mean the png or something else?
What definition of “error” are you using?
Vaughan,
I have spent some time to figure out some minor technical details of the workings of your worksheet but wrote my recent comments rather rapidly as responses to Jim D’ s comments.
I have still the basic skepticism concerning the significance of being able to fit the data at the mK level. It seems too likely that there are several factors that influence the results at that level even after filtering and that must be essentially independent. Approaching the problem from that end I have the feeling that the perfectness of your fit over the period 1860-1950 cannot have any fundamental significance but must be due to the freedom that you had in choosing the model.
The Rossander model shows a clear signature of overfitting as it creates a spurious residual oscillation with a period of the 6th harmonic. Such a 6th harmonic means that it comes from overfitted 2nd and 3rd harmonics. Such overfitting was needed to produce the rapid temperature increase of recent decades that’s more naturally reproduced by AGW.
Your model does not show any similar signatures of overfitting and that’s certainly a great virtue – but as I wrote above I do still think that this just cannot be as significant as it appears.
But lets go back to what the model might indicate, when taken seriously. Your model has the SAW as a periodic function with period of 151 years. Can we think that 160 years of data (including the problematic ends) can provide significant evidence for such periodicity. I don’t think so. What we can see is that there’s oscillatory variability of peak-to-peak amplitude 0.3C in that part of the data where the approach is best applicable.
There’s less variability at both ends, but does your fit show that this is a true property of the Earth system?
I don’t think so, because the approach cannot really resolve what happens closer to the ends of the period. The lesser variability is your input to the process, not an outcome. The Rossander experiment tells that it’s almost possible to fit the whole rise with the harmonics only, fitting a fair share of it would probably be much easier. Just looking at your SAW tells that it would not be unnatural to think that the variability component would be at a level 0.1-0.2 C above your SAW around year 2000.
On the other hand I have not changed my mind on the observation that making a plausible fit without a major role for AGW does not appear possible. In this connection what’s called AGW may contain some natural longer term trend in addition of the anthropogenic contribution. Such overall AGW could well be 0.7 C rather than your 0.9 C, but hardly less than 0.6 C. Curve fitting is inefficient in separating different contributions to the long term trend from each other. Only the recent decades (last 50 years or so) have a clearly anthropogenic signature.
Vaughan and Pekka, I also have some thoughts on the choice of window. As it is, the 6-parameter fit only needs the 2nd and 3rd harmonics (75 and 50 years) for a mK fit. This of course is because the window is 150 years. With a 120 year window your harmonics would be 60 and 40 years and a different fit would result. There is nothing unique about 75 and 50 year harmonics because they are set by the window length and the choice of SAW as a starting point. It is tempting to think that the dominant harmonic wavelengths and phases could be defined more objectively, and perhaps one around 60 years would provide an impressive fit to F3(Hadcrut3) on its own. If you play with a single harmonic and its phase you are down to 5 parameters with the 3 from AGW.
JIm,
I noticed that the SAW had a period equal to the number of years in the data but it didn’t even come to my mind that this would be anything else that accidental. Whether the value is really fitted or only selected as it leads to roughly the right period and happens to agree with the number of years in data the period represents one free fitted parameter for me to be counted with the same weight as other free parameters.
How many effective degrees of freedom are used in selecting the sawtooth as starting point is more difficult to tell.
@Pekka: How many effective degrees of freedom are used in selecting the sawtooth as starting point is more difficult to tell.
Excellent question. How many did Planck use in deciding to subtract 1 from the denominator of Wien’s black body law (nowadays called the Wien approximation) to arrive at his eponymous law? One could imagine all sorts of patches to Wien’s formula.
When Planck first lectured on it he stated the law and demonstrated that it did not blow up at low frequencies the way Wien’s formula did. (He may also have pointed out the agreement with the Rayleigh-Jeans law at low frequencies, but the latter was in the same year and I’m unsure about the timing.) He then spent several weeks working out a statistical mechanical justification for subtracting 1, based on the much earlier work of Boltzmann and Maxwell.
I’m not 100% sure that I got the sequence right here, but suppose for the sake of argument that’s what happened. Did his justification change the number of effective degrees of freedom used in deciding to subtract 1 from Wien’s denominator?
Vaughan,
The difficulty in applying analogies of that kind is that they often refer to universal and mathematically simple laws of nature. We have such laws both at the level of fundamental theories of micro physics and when we consider statistical properties of systems with a very clear separation between the scale of details and the scale of observation.
The Earth system is not like that. It has significant details at all scales from micro physics up to continents and ocean floors. There are also many mechanisms that affect the temperature. It’s possible that a few phenomena dominate in the determination of the long term temperature development when fast variability is filtered out, but I cannot believe that that could be true at the mK level. Therefore I cannot put so much weight on success on that level.
It’s more plausible that the variability described by your SAW over the period 1870-1990 is dominated by few phenomena (I left the ends out for as what happens there is not constrained well by the fit). My belief in such a hypothesis is, however, not significantly dependent on the accuracy of the fit as long as it’s reasonably good. By that I mean that 5 mK accuracy is essentially as good as 1 mK as long as the deviation does not show structure that tells about serious overfitting.
Tony B. “thought you might be interested in this 1939 article concening a 16 year cycle.”
Thanks for the link, but I’d rather not get distracted into other discussions for the moment. It looks like Vaughan is slowing starting to realise how realistic his millikelvin claims are so some progess is being made and I’d like to concentrate on the subject of this thread until we get some conclusions on the value of his presentation.
Do you have a machine with Excel on it?
greg
good luck with your quest
tonyb
It looks like Vaughan is slowing starting to realise how realistic his millikelvin claims are
Greg’s comment puts me in mind of the quote often attributed to Mark Twain: “When I was a boy of fourteen, my father was so ignorant I could hardly stand to have the old man around. But when I got to be twenty-one, I was astonished at how much the old man had learned in seven years.”
(Sorry, Greg, but I couldn’t resist such a perfect setup.)
My interpretation of my fit has not changed significantly since I first shifted from an 11-year cutoff for the filter (which I’d been using throughout 2011, entirely in C++ and MATLAB) to a 21-year cutoff (the current F3) around October 2011. However I did not until about mid-year try to estimate the effective dimension of the space onto which F3 projects the 160-dimensional space of zero-mean 161-point time series. I pegged it as somewhere between 12 and 14 dimensions depending on the observed SNR as determined from the variance of MRES. I therefore felt justified in characterizing modern secular climate with 9 parameters; had the image of F3 been much smaller I would not have bothered submitting to AGU.
As further justification, using only the 2nd and 3rd harmonics (hence dropping three parameters) without adjusting any of the remaining 6 parameters resulted in only a slight loss of accuracy. This would not be the case at all with Mike Rossander’s fit: even reducing the number of harmonics from five to four, let alone to three, would require radically changing all the coefficients in order to even approach his fit because all his coefficients are equally important in achieving his current fit. His coefficients are not part of any coherent theory other than general Fourier analysis.
What I am slowly starting to realise is that even those with an excellent EE grasp of filters don’t necessarily fully appreciate the quantitative aspect of Heisenberg’s uncertainty principle as it applies to the situation where one is trying to locate events simultaneously in spectrum and time. In that application Planck’s constant is 1 and dimensionless. The dimensions of time are just T as usual, while energy is simply identified with frequency and therefore has dimensions T^{-1}.
This analogy can be continued at length, but after writing some of it I kept finding it was getting too long for a mere comment and so kept truncating it. In the end I truncated it here. I’ll just say that back in March or so I had an interesting discussion with Jake Askeland in our autonomous driving group about how different treatments of endpoints when filtering give rise to different tradeoffs in precision between time and frequency. Some give one, some the other, some fall in between, and some give neither (such as the traditional truncation approach). However there simply is no getting around Heisenberg uncertainty: you can’t have high precision in both.
Vaughan,
Just a detail. Rossander’s fit used only four harmonics. The 4th was not present.
Pekka: The 4th was not present.
Good point, I should have paid more attention to the meaning of his fit the way you did. I was just treating it as no more meaningful than a Fourier analysis.
My guess is that Solver must have been trying to decrease Scale4 for a better fit and ran into a constraint Mike must have set, namely that the scales should be nonnegative. I bet if he removed that constraint it wouldn’t have happened and he’d have gotten an even better fit! (A negative scale is meaningful, it is the same thing as changing the phase by half a period but that’s a discontinuous change that Solver would be unable to discover by making small adjustments so it’s important to allow negative scales when solving.)
That also means Shift4 played no role. Interesting that Solver set it to 3468. 3468 − 2500 = 968 or −0.0032 (2500 is one period so adding multiples of 2500 makes no difference), which represents a phase shift of −0.0032*215.68 years or a mere 8 months back in time. Strange it would get it so small when it can’t be having any effect.
“greg goodman | December 15, 2012 at 7:33 pm |
13pt gaussian filter and a few annotations.
http://i46.tinypic.com/21jyxyu.png
Did spend long looking but there seems to be some fairly obvious 20y repetition there”
In my opinion, there is absolutely no 20 year repetition there. You appear to have just selected the low points that suit your point of view. You have simply ignored the more obvious points because they don’t fit your arguement. Even the ones you selected mostly don’t show 20 year intervals.
that was a type BTW, I of course meant “didn’t” spend long looking. Beyond that,I gave you a quick response as an aside,
Do some frequency analysis, autocorrelation of something if you want to examine the structure of that record.
I don’t intend this to take centre stage and distract from the subject of this thread. So I will not discuss that further here. Back to milliKevlin claims.
Vaughan Pratt | December 17, 2012 at 1:55 am |
Unfortunately observation of these crossings apparently only began in 1966, so there is no way of telling whether the alignment was as good any earlier, or whether this is just a pure coincidence.
We can actually tell, due to an effect [the Svalgaard-Mansurov Effect] that I discovered back in 1968. The solar polar field [and its reversals] has a signature in the geomagnetic field that be followed back a century.
Aha, the plot thickens. ;)
1. Is there a known or conjectured mechanism for your effect?
2. Do you have handy a reconstruction of the crossings based on the effect that can conveniently be compared with the Hale extrema (peaks and troughs) in Figure 9 of my poster?
1: yes. http://www.ann-geophys.net/30/817/2012/angeo-30-817-2012.pdf
Sections 8 and 9 of http://www.leif.org/research/suipr699.pdf show how that relates to polar field reversals.
2: no specific reconstruction is needed as the reversals of the polar fields take place close to solar maximum. But see also Figure 14 of http://www.leif.org/EOS/Munoz-Jaramillo_etal_ApJ2012.pdf for an independent reconstruction.
Mark Twain : ” I was astonished at how much the old man had learned in seven years.”
Well that , however pithy and amusing, is rather the opposite of the case here. I started off being impressed with you apparent knowledge of filter design and said so. To take your metaphor I would now say : ” I am astonished how much the old man has gone down hill in just a few days”.
Sorry , Vaughan, couldn’t resist. ;)
Now if we could leave anecdotes, dubious metaphors and Macy stories to one side for a while….
In what way do you feel the Macy’s analogy is “dubious?”
If you merely say it is when I say it isn’t, I would call that an impasse.
Vaughan Pratt | December 16, 2012 at 4:01 pm |
>>
By “linked post” did you mean the png or something else?
What definition of “error” are you using?
>>
Oh, please make an effort. You are replying to a post , the first line of which gives you the link to all the details
http://judithcurry.com/2012/12/04/multidecadal-climate-to-within-a-millikelvin/#comment-277126
The first time I posted the full working and the results you summarily dismissed it a “fallacious” yet in the previous post said you “unaware” of it. So clearly you posted that assessment without even reading it.
I would ask you read that post is full rather just the last few lines since I make some essential points about the need to be clear in our discussions about whether we are referring to the theoretical F3 which is fine or F3 as implemented running into the buffers. Calling everything F3 we will always be at cross purposes.
I used the terms F3() and F_defective_3() to clarify which I was refering to. You may suggest another nomenclature if you wish, just so long as we can be clear about which we are referring to.
Oops, the link in that post missed the target, but please re-read post for reasons stated above.
The examination to constrain the error in running the defective F3 filter of HadCrut3 is here.
http://judithcurry.com/2012/12/04/multidecadal-climate-to-within-a-millikelvin/#comment-276545
In summary precisely nothing has been learned about the climate from this exercise and what has been demonstrated is that with 4 parameters you can fit an elephant which was what I wrote nearly two weeks ago the first day this thread appeared:
So, were you f*cking kidding me?
David Springer : In summary precisely nothing has been learned about the climate from this exercise.
We’re not studying climate, we’re studying climate science.
That’s a bit questionable because there’s very little contribution by any climate scientist to this thread. Leif Svalsgaard might be one exception and I may have mistaken on someone but otherwise the contributions are by people whose background is in other fields (other sciences for some and non-scientific activities for others).
I think the subject of this presentation is most certainly climate.
It also has all the trappings of science, and was, sadly, presented to the AGU as climate science.
I see no need for those checking the validity of its methods to be climate scientists, so the background of those discussing here seems irrelevant to this point of whether the sugject is climate science. In fact there is a clear and obvious need for a lot of what gets published as climate science to be vetted by a broader audience.
If someone wishes to say the author is not qualified maybe that should have been done before he was invited to present this mess to the AGU .
So we are discussing climate science, though we are getting close to establishing it consists mostly of what Feynmann would have called cargo cult science.
Pekka, earlier in this thread you said you thought both (all three actually) sets of data (the time series and the two analytical functions) must be treated in the same way, which sounds good on the face of it.
However, since the analytical functions can be fitlered correctly and to a good precision, it seems illogical to insert a known error onto those functions is the hope that it may be a bit like the error in incorrectly filtering the time-series.
As we have seen, and you discussed briefly with Vaughan, the effect of narrowing the window near the end results in the data being stretched forward in time. In the case of the exponential this manifests as a progressive reduction in its amplitude, and quite a sever one, that totally changes the nature of the function.
Equally, I think it is obvious that stretching essentially flat data like the end of hadCrut will not reduce it in the same way. Indeed even by eye it is clear that the filtered result of the data is a reasonable representation. It is equally clear that the filtered AGW is a gross distortion.
To justify retaining the distortion of all three as a method, it is necessary to demonstrate that they will all be affected in a similar way and that the hope that the errors will “cancel out” is well founded. I have demonstrated that they are not.
In face of that situation I see no justification for deliberately distorting SAW and AGW by unnecessarily using a known defective process when it can be done correctly with a perfectly good, well-designed filter.
It remains to put bounds on the error in F3(hadCrut3) to ascertain the true residual MRES of this model.
I have done this and estimate the _best case_ residual to be “within 100mK”.
Greg,
To me Vaughan’s work tells about an interesting observation. Sometimes interesting observations lead to deeper research, but more often they don’t.
Calculating filtered model values using values outside of the observed period is totally pointless. The unfiltered model may be extrapolated to see where it would lead but filtering the model results is meaningful only for the purpose of comparison with filtered observations over an identical period. My view is that it’s extremely unlikely that the periodic function SAW could be used in forecasting future temperatures. It’s a fit over this period (or actually a more restricted period) and nothing more. Thus no extrapolation with the full model has much value. How well the model AGW presents real AGW is not clear but a more reasonable point to discuss.
There are some technical weaknesses in the analysis. The method does not extract information optimally from the ends of the full period. I’m sure that a bit more could be extracted but I don’t know what the most optimal method would be.
There isn’t any explicit error of the type you keep on insisting on. The presentation may lead to a misunderstanding. That’s a weakness, and I have discussed with Vaughan about some possible modifications. He was the first one to propose one that would not be unreasonable. That was to plot each of the point on the x-value (time) that represents the weighted average timing of the data values used in calculating the weighted average data value (I prefer that expression here as the the term “filter” is perhaps misleading). Applying that approach the latest point would fall on year 2002. The model value would almost certainly fall very close to the unfiltered model value similarly with the agreement seen up to 1995 in Fig 3. The corresponding value from observations would also be those 8 mK higher we see in Fig 6 for the last data point..
“Calculating filtered model values using values outside of the observed period is totally pointless. ”
And unnecessary, but Vaughan insists on doing it that way.
It is clear the neither the exponential not the model have frequencies that would be touched by a correctly formulated F3 filter. And while he insists on his deformed filter being ‘linear’ I am firmly of the opinion that once you start progressively multiplying up the kernel coeffs at the end the linearity is lost.
Convolution kernels are linear precisely because they are the addition of a constant set of coeffs. Convolution is a linear process because the kernel if fixed. Any comment on that?
Clearly he should be fitting and subtracting the analytic functions directly.
The way he is fitting MRES and minimising it, at best only tells that his bent down AGW fits quite well to temperature. That is neither surprising in view of its form , nor of particular interest since we no longer knows it analytic form. It certainly has little to do with his supposed ‘law’.
Had the filter worked as intended he would have seen that it made no difference and realised it was pointless applying to the analytic fns.
Now he realises that running the filter up to the end is wrong and is distorting it, continuing to do so is either foolish or perverse (possible both).
Greg,
The filter produces weighted averages of the data values. The weights are the MRES impulse responses in the lower right corner of the main page of the spreadsheet for the interior points where no truncation is needed. Each of the remaining points is also a weighted average of data points but the weights change at every step. As weighted averages they are also linear functions of the data values.
The weights are exactly the same for the model produced data points as they are for the observation based data points. Thus an agreement before application of the filter leads to agreement after filtering.
All weights are in every case positive and linearly independent in the way that an exact agreement in the filtered results means that also the raw data must agree exactly. It’s, however, true that the extreme data points have less influence on the set of filtered results. Thus a deviation in the extreme data points is not quite as strongly visible in the filtered results as deviation in some other points are.
Including model values outside the observed period would invalidate all comparisons where such model data values were used. That would be an explicit error.
In case of latest filtered points weighted averages centered in 2002 are compared. That’s true both for the model value and the observational value. The agreement of these weighted averages is good (8 mK off) at that point because the deviations cancel: the observed data is higher than the model for the earlier years and in particular for 1998 while the model is higher for the latest years.
The bending down is visible in the model values as the unfiltered values keep on rising. It’s less visible in the data because the unfiltered data had a rapid rise up to 1998 and has been relatively flat since. That’s exactly what averaging or filtering does, deviations in opposite directions cancel.
Pedant.
PP: ” Each of the remaining points is also a weighted average of data points but the weights change at every step. As weighted averages they are also linear functions of the data values. ”
Wishful thinking, which is below the level of expertise you have often shown here.
convolution is the integral of the impulse function and the data as one is shifted relative to the other. If you don’t change either this is a linear transform. What you have just described is adding a third function as a factor into that integral, One that is itself time dependant and one that progressively shortens the kernel fn. It is also a piecewise function that only affects the end portions of the integral.
Now just reflect for a minute and tell me if you seriously expect that to be a linear transform.
@GG: I think the subject of this presentation is most certainly climate.
It also has all the trappings of science, and was, sadly, presented to the AGU as climate science.
Are you referring to the rightmost column? If not then please identify which part of the poster had to do with climate science? And what was “sad” about that part?
Greg,
Convolution is a linear transform that’s also uniform in time. In the spreadsheet we have another linear transform. This is not a convolution and this one is not uniform in time but this is also a linear function from the set of 161 raw data points to 161 transformer points.
The transform of the spreadsheet is linear with respect to the value of each of the raw data points as a change by an amount y of a single data point changes the output values by an amount that is y times the change caused by amount 1 in the single data point. This is the definition of a linear transform.
Every convolution is a linear transform but all linear transforms are not convolutions.
This is not a filter that acts uniformly in time near the ends of the full period but this is still a linear transform between the input and output set of numbers. That’s all what’s needed for my argument.
Pekka,
OK, what is being done is no longer convolution filter and is a non constant transform but remains linear.
thank you for your clear explanation and your patient attitude.
Both are qualities of a wise man.
@Pekka: Calculating filtered model values using values outside of the observed period is totally pointless.
@gg: And unnecessary, but Vaughan insists on doing it that way.
A non sequitur like that most commonly indicates a failure to follow the thread. Not sure what else could explain it.
Greg has been defending his position for a solid two weeks now. In light of Pekka’s, Jim D’s and my protestations against his faulty logic, one can only assume he’s grasping at straws to save face.
If as he claims he’s an academic, I sincerely hope he doesn’t beat up the lower half of his classes as brutally as he does me. If I were one of his students I’d have bailed after the midterm. I expect others of his students would have bailed after realizing he couldn’t tell the difference between a frequency response and an impulse response.
He claims mathematical competence but I was unable to find him on the mathematics genealogy, consistent with his demonstrated lack of mathematical competence. Not to mention his obduracy as witnessed by his refusal to pay any attention to my Macy’s analogy.
Nevertheless it’s still worth explaining things to him since others may have similar questions to his. The difference is that the others may be more willing to listen to the answers than Greg, who seems utterly deaf to them unless presented in pictures as Pekka did. I will follow Pekka’s example in future as it seemed to work for Greg. “Cryptic” (Pekka’s accurate characterization of me) obviously doesn’t. Even if my pictures don’t work as well for Greg as Pekka’s did, they may clarify things for others.
There is a lot of curve fits and models and most were created with instrumented data of the past 130 years. Curve fits made during a warming period between the little ice age and now. If the data for the past ten thousand years was curve fit, it would show a warm max about now with a cool period to follow.
To find the precise error introduced into F3(AGW) by the defective filter implementation I extended the the dates to 2034. I then extended the first filter range by 10y , the second 8y beyond that and the final F3 to 2034. This providing a correctly calculated FPRED for 2010.
the unfiltered AGW(2010) = 0.1481
FPRED(2010)=0.1480
Not surprisingly F3 barely modifies the exponential. The difference being 0.1 mK
So what was labelled as “filter artefact” in figure 3 was not and artefact. It was totally due to an incorrect implementation of the filter: a _calculation_ error by Vaughan Pratt.
Now If I crop the dates back to 2010 but leave the filter ranges extended. The first one will run on and produce 10 extra years of distorted data. The same for each stage. We still get results out to 2034 but now the final value is 0.114 The data in each stage is not right but the window is full at each stage and at least the filter coeffs are not being distorted by AVERAGE() having to truncate.
Finally I crop all filter columns back to 2010 as in the original and get 0.98
So the first observation: 0.148-0.098 , the value of 140 mK that I read off the graph by eye was bang on.
Taking the most favourable end of the range of the error caused by incorrectly running F_defective(DATA) right up to the end of the data that gives a REAL residual MRES of 100mK, not the 8mK shown in figure 6.
Compared to the range of data in hadCrut3 of about +/-0.5K that is a residual of 10%.
Perhaps Vaughan will consider changing the title of his presentation to :
“Circular logic to within 10%” .
Less impressive but more truthful.
Looks pretty persuasive to me. As does you way of arguing the case throughout.
It will be interesting to see if VP can give a straight, clear answer, or whether he will indulge in obfuscation as is his usual practice when he doesn’t have and answer or doesn’t want to admit he is wrong.
greg, you seem to have gone off on a tangent, but it looks like you do agree that AGW+SAW fits the F3(Hadcrut3) to within a few mK over most of the 150 year temperature record, correct? This was the main point of the poster that is not affected by what you take as endpoints. The size of AGW was 0.9 degrees and the size of SAW was 0.2 degrees revealing that the main variation is as expected by AGW with minor natural SAW-like variations also consistent with those expected.
Jim, the “end points” are 25 years long !
If you remove the periods where the F3 filter is out of spec, the time series shrinks from 160 to 110y in length. Vaughan’s model is over fitted already with a dimension of 160/22, make that 110/22=5 and he’s really on marshy ground.
“… it looks like you do agree that AGW+SAW fits the F3(Hadcrut3) to within a few mK ”
NO. What matches is what I’ve called F_defective(AGW). ie the bent down warming curve in figure 3. You have just demonstrated that the presentation is totally misleading. You have been mislead.
What Vaughan has demonstrated is that if you take an exponential model for CO2, progressively bend it down so that is becomes almost flat by 2010, it FITS !!
So what?
What he has absolutely NOT shown is just what you believed he had shown, that the exponential model fits really well. Well it doesn’t.
If you crop off the end sections and only work with the remainder where the filter is correct you crop off the last 15 to 20 where temperatures start to deviate significantly from all the various models based on high, 3K/doubling CO2 warming.
You are basically taking climate since back 20 years to the time when the data did suggest there was a possibility of an important CO2 effect.
Science is not based on “expected”. But you saw what you expected in this presentation rather than what was really there.
The residual MRES is NOT the residual of the CO2 model it is the residual of the bent down line in figure 3. Having called it a “filter artefact” Vaughan still prefers to use it rather than his actual CO2 model.
Are you pissed off about being mislead?
Ignoring the last ten years on the right side the rest still fits to mK accuracy. I don’t see the point you are making or why it is important. Ten years from now he can include the years up to 2012 with most of the F3 filter and compare that with the full non-truncated AGW curve which still rises by its definition (a point that I think you missed).
Jim: “Ignoring the last ten years on the right side the rest still fits to mK accuracy.”
Except for the bits that prove it wrong it works.
Yeah, that’ll do it.
Thanks you for pointing out what I’d overlooked.
greg, you are interpreting it that the AGW function goes flat, which is flat wrong. It continues up as a growing exponential. See how it is defined and plot it if you don’t believe it. Figure 3 in the poster has a red line labelled AGW that shows it too. You may want to compare that one with Figure 2, and it is quite a good fit there too as it explains the last hot decade.
@GG: The residual MRES is NOT the residual of the CO2 model it is the residual of the bent down line in figure 3.
Ahem.
Greg, please think about what Jim D is saying. What you’re saying is not even wrong, it’s mathematical gibberish. Jim D is patiently trying to explain this to you.
MRES = F3(HadCRUT3 − (SAW + AGW)). As such it is the multidecadal portion of the residual HadCRUT3 − (SAW + AGW), not just to within a millikelvin but to within a rounding error.
The “residual of the bent down line in figure 3” as you put it doesn’t even have a mathematical meaning. A residual is the unfitted portion of the data (HadCRUT3 in this case) to which a model has been fitted (SAW+AGW in this case).
VP: His [Mke’s] coefficients are not part of any coherent theory other than general Fourier analysis.
Neither do yours !
Neither do yours !
Were that the case, that is, if this were just a random fit of sine waves, I most certainly would not have bothered submitting to AGU, it would be completely vacuous. Sawtooth waves arise naturally in climate as a result of a sudden disturbance followed by a return to equilibrium. I also have a candidate mechanism in this case based on abrupt seismic disturbances in the more viscous parts of the mantle. One never gets a perfect sawtooth, there’s always some filtering corrupting the signal.
That’s a plausible hypothesis that I do not claim for a second to have proved but that I feel bears looking into further. Science advances by plausible hypotheses that compete with each other for people’s acceptance. If you’d been a serious astronomer around 100 AD and Ptolemy had proposed his hypothesis of epicycles to you would you have rejected them out of hand or what?
Furthermore the AGW coefficients I use in place of Mike’s sine waves are part of a formula based on the Arrhenius logarithm law for dependence of surface temperature on CO2, the exponential rise in CO2 observable in both the CDIAC data, and the Keeling curve. It also incorporates the idea first introduced in the 1985 Hansen et al paper pointing out that the oceanic mixed layer can be expected to delay global warming, a phenomenon that explains why people have had difficulty in the past reconciling observed and predicted climate sensitivity. That gap has invariably been much larger than the one I’ve been able to obtain by taking the ocean delay into account. That alone could form the basis of a paper, provided it was supported by demonstrating a fit between observed and predicted global warming.
If one takes only two sine waves, namely the 2nd and 3rd harmonics of a sawtooth, this only requires 3 parameters to fit, namely period, amplitude, and trigger date. The resulting MRES is not as flat, but instead has a bumpiness similar to what Rossander gets with a lot more parameters. In that case the 6 parameters are evenly divided between my admittedly very novel SAW hypothesis and the AGW hypothesis which is well accepted at AGU if not at Climate Etc.
I am not aware of any comparable connection to known geophysical phenomena made by Mike’s coefficients. Nor does he claim any, whereas I do claim geophysical significance for my model.
I would not expect climate skeptics to accept that since they reject much of the geophysics on which I based my work; exactly what they reject depends on which ones you talk to. Logically therefore I should only contribute to AGU, where they do accept all of those fundamental geophysical ideas, and not here. You can blame Judith for my acting illogically in this way, she’s been pestering me for some time to post my AGU work here so I did. I was well aware that I would be stirring up a hornet’s nest or I might have gotten more upset and walked away instead of engaging with the critics.
VP: “Sawtooth waves arise naturally in climate as a result of a sudden disturbance followed by a return to equilibrium. I also have a candidate mechanism in this case based on abrupt seismic disturbances in the more viscous parts of the mantle. ”
Well not the triangular saw tooth you seem to base on but and exponential decay would be a very common behaviour. Indeed I have often thought most temperature records could better be decomposed by such “triangles” than by cosine waves.
Here’s some from the North Pacific, you know, the bit they use to calculate PDO:
http://i48.tinypic.com/ay7z2s.png
There’s “trigger” 1942 rather than 1924 and it does not last 150 years. However it does look like the peak you trying to argue away. The high frequencies seem pretty intact too so that side of the ”
hypothesis” looks a little wrong too.
What is left of your saw-tooth. I accept the attenuation of higher frequencies but the biggest component, the fundamental, which accounts for a large part of the total signal is totally AWOL.
You have also adjusted 3 and 4 in both amplitude and phase.
There is little left of you sawtooth idea except the 2/3 ratio. Indeed to look at figure it has not resemblance whatsoever to an individual tooth.
As far as I understand you, you don’t have any actual known massive event to tie it to, it is just “an idea”. Calling this a hypothesis is over stating it a bit. It is totally contrived as an excuse for removing whatever is not exponential.
What is left of your saw-tooth. I accept the attenuation of higher frequencies but the biggest component, the fundamental, which accounts for a large part of the total signal is totally AWOL.
So do you have a speaker system that goes down to 5 Hz?
Without knowing the detailed physics of the situation one cannot just blithely say that the fundamental must be present. A core part of the thesis of my 2nd last Ph.D. student (Keyvan Mohajer, now CEO of SoundHound (which is doing very well lately thank you) dealt with speech and music signals that completely lacked their fundamental, so it’s not exactly a new concept.
“Without knowing the detailed physics of the situation one cannot just blithely say…”
So you can blithely come out with a wild arsed idea without a grain physical evidence for its existence and a false claim that this represents ocean oscillations which you are able to substantiate. But if anyone questions the physical basis you reply with yet another bed-time story.
“Without knowing the detailed physics of the situation one cannot just blithely…” wave ones hand and remove the majority of climate variation that does not fit your banal CO2 model.
@gg: Well not the triangular saw tooth you seem to base on but and exponential decay would be a very common behaviour.
This is exactly right when the time between sudden events is long compared to the time to return to equilibrium. When it is much shorter the system never returns to equilibrium but is forever following the relatively straight initial portion of a decay and then jumping back up suddenly each. This can occur periodically, quasiperiodically, or at random times depending on the physics of the phenomenon. That’s the sort of situation most naturally associated with a sawtooth waveform, or even one triangle.
@gg: Indeed I have often thought most temperature records could better be decomposed by such “triangles” than by cosine waves.
Different physical phenomena are associated with differently shaped time series. Sine waves are ideal in situations where the even (with respect to order of derivative) coefficients of the relevant differential equations dominate the odd ones. The odd ones, especially for the first derivative, are responsible for damping following a sudden event, for which triangles are natural to look for. Wavelet theory offers a range of such shapes. The Daubechies wavelets, which have the remarkable combination of compact support and forming an orthogonal basis, tend to look more triangular than sinusoidal.
Vaughn,
This is a slightly edited repost from above. Was not sure you would see it.
Will the next step be to take your CO2 induced warming curve and multiply by 0.2, 0.5, 0.8 and re-do the fits to see what the remaining signal looks like? See if you get the same millikelvin residuals (not that either one of us believes that means much but it made a good title). And also see if the leftover signal resembles the temp. signal more than this first result?
Would this be a way of estimating how much of the GHG signal could be mixed in with the natural variation to give us the observed? That is, that the signal could be between 0.8 and 1.0 of the predicted GHG warming or between 0.5 and 0.8 or could be wider from 0.5 to 1.0 kind of estimates.
I appreciate your pleasant attitude (from what I’ve seen) dealing with criticism.
Thanks, Bill. It feels a bit like what would happen if you stirred up a hornets’ nest. No point getting angry with the hornets when you’re the one that’s angered them. :)
Will the next step be to take your CO2 induced warming curve and multiply by 0.2, 0.5, 0.8 and re-do the fits to see what the remaining signal looks like?
Since the factor in front of AGW is one of the 9 parameters being fitted, if I introduced a factor of 0.2 in the formula for AGW the fit would simply crank up ClimSens to five times its present value. The resulting fit would then be identical except that ClimSens would now be reported as 14.15 instead of 2.83.
What you might have had in mind is what would happen if the three AGW parameters were excluded from fitting, and ClimSens fixed at 0.566 (0.2 times what the fitting algorithm found). Since my fitting procedure only has 6 SAW parameters to play with, that’s a 6-dimensional manifold of curves embedded in the 10-12 dimensional space of curves of the form F3(x). It would be very surprising to find a good fit with ClimSens set so low, to get that you’d need to do what Mike Rossander did and introduce a whole slew of additional parameters by in effect unlocking the seven currently locked sliders.
But even when he did that his MRES curve wasn’t anywhere near as flat for 1860-1960 as what I found.
Is that along the lines of what you had in mind?
I guess I need to look more closely at exactly what you were fitting then before I respond. Although looking back at the HadCrut3 data you started with it’s very clear that once the rapid oscillations are removed, that the data looks very much like an exponential already, with the addition of humps (+ and -) at 1880, 1910, and 1930. I’ll have to go look at other temperature sets likes BEST, etc to see how they compare.
Bill, you hit the nail on the head. Given that the gradient is rising with time and clearly is largest at the end and near zero at the beginning, very few would start with harmonics to fit it (except perhaps Rossander). The exponential is an obvious choice even over a linear fit (like Girma’s line-and-sine).
Whereas exp(t) (t for time in suitable units) always hindcasts to 0 whatever the units, log(b+exp(t)) hindcasts to log(b). One might therefore hope to tell the difference provided you have data going back to a time t where exp(t) is really tiny compared to b, plus some way of improving the SNR. Removing the N (noise) is the way I’ve been doing the latter.
log(b+exp(t-d)) has the same shape but shifted d (for delay) to the right. This gives yet another way of improving the fit by matching what’s actually happening out there, and giving you the delay to boot.
Arrgh, I just found a major bug in my poster. What I wrote immediately above, namely
Whereas exp(t) (t for time in suitable units) always hindcasts to 0 whatever the units, log(b+exp(t)) hindcasts to log(b).
is rubbish when the units for CO2 level are chosen to make the preindustrial level b equal to unity. (I.e. if you think the preindustrial industrial level was say 285 ppmv then dividing whatever the current reading is by 285 gives you that reading in these new units.) In that case log(b) = log(1) = 0.
As x tends to zero, ln(1 + x) tends to x. (Hence log2(1 + x) tends to x/ln(2) or 1.4427 x but let’s stick to natural logs and exponentials for simplicity.) Therefore as t tends to minus infinity ln(1 + exp(t)) tends to exp(t), which itself tends to zero though nowhere near as fast as ln(1 + exp(t)) tends to exp(t).
Here are the values of exp(t) and ln(1 + exp(t)) for t going back in time starting now (t = 0) and decreasing t one time unit at a time.
1.0000000000 .69314718055
.36787944117 .31326168751
.13533528323 .12692801103
.04978706836 .04858735156
.01831563888 .01814992790
.00673794699 .00671534848
.00247875217 .00247568513
.00091188196 .00091146644
.00033546262 .00033540636
.00012340980 .00012340218
So why does it matter that ln(1 + exp(t)) approaches exp(t) so quickly going back in time? First of all nobody lives at time t < 0 other than Ray Kurzweil and the occasional BC prophet prophesying the exact date of Annie Domino, future heir to a pizza dynasty. And even if t was negative, why is it bad to sneak up on a shrinking violet like exp(t)?
The short answer is, take my word for it. The long answer could probably be shortened but I don't have time to do so right now, maybe later. My apologies for the length of the following.
The second question is easier to answer so let's get that out of the way first. exp(t − d) = exp(t)/exp(d). Hence if the AHH law was exp(t − d), varying Hansen delay is identical to varying climate sensitivity. If climate obeyed that variant of the AHH law, not even nanokelvins could estimate climate sensitivity and Hansen delay simultaneously from a global temperature time series. All you could estimate would be the ratio of climate sensitivity to exp(d) where t and d are given on a suitable time scale—t might be negative, remember, and it might also be in units not of years but decades or centuries or half a century).
The interesting question now is, what time scale is created by the requirement that CO2 grow as 1 + exp(t). That depends crucially on what one takes for preindustrial CO2, which determines the unit for CO2 level. Different units for different pundits; mine will be 285, YUMV. (The poster suggested 287.4 on the basis of fitting 161 years of HadCRUT3 data but that may be unwarrantedly much precision for such a hard-to-estimate number so I’ve rounded it a bit. Excel Solver estimated 287.8 with a Hansen delay of 10 years, 286.2 for 30 years, and 285.2 for 50. Fitting CDIAC emissions and land-use-change data to the Keeling curve gave a much better fit at 285 years than 287, so for the purposes of illustrating the follownig I’ve gone with that as a round number for the time being though clearly this needs closer inspection.)
Looking at the Keeling curve (the seasonally corrected column in NOAA ESRL’s record) we note the level for January (remember it’s seasonally corrected) of the following years, before and after subtracting 285 (keeping one decimal of precision as possibly meaningful here) along with the CAGR computed as (pow(45.8/31.5, 1/15) – 1)*100 and likewise for the next two ratios spanning 15 years.
1960 316.5 31.5
1975 330.8 45.8 2.5%
1990 354.2 69.2 2.8%
2005 378.2 93.2 2.0%
One sees from this that exponential growth of anthropogenic CO2 is not a great model for CO2 during 1960-2005. Taking preindustrial CO2 to be 260 ppmv makes it a much better model, but CDIAC data shows a variation in CAGR for emitted CO2 (again counting land use changes) similar to the table’s, making the Hofmann-Butler-Tans exponential model something of a procrustean bed. I discussed this with Pieter Tans at AGU (Hofmann was his boss back then) and we agreed that all the evidence pointed to a recent decline in the CAGR of anthropogenic CO2—let’s hope that decline continues! (The recent uproar over the 6% rise in CO2 emissions from 2009 to 2010, namely 8.626 GtC to 9.139 GtC, neglected that 2009 declined by 1.5% over 2008 which stood at 8.749 GtC. The CAGR for the two years is therefore 2.2%. Yet to my knowledge no one ever pointed this out to the public, not even Fox News, instead allowing this little outburst of alarmism to stand based on a single year! 2003 rose 6% over 2002 and no one complained then. From 1850 to 1980 the CAGR of cumulative fossil fuel emissions (more appropriate than annual emissions when correlating with the Keeling curve) hovered around 5% as can be seen here. Draw your own conclusions.)
Granting that close examination of both emitted and resident CO2 makes the exponential model an imperfect fit for recent CO2, that discrepancy is more important for future extrapolation than for fitting the past, where an exponential model is not so terrible for fitting the whole 160 years of HadCRUT3, particularly in light of cumulative emissions over that period as noted above.
A rough estimate of the time taken to increase anthropogenic CO2 (column 3 of the above 4-row table) by a factor of e (2.718) in the recent past can be had by dividing ln(93.2/31.5) = 1.0848 into the 45 year span of the table, giving 41.5 years. So for the purposes only of defining a time scale applicable to recent climate and not for making climate projections, we ask what it will take to double preindustrial CO2, equivalent to making exp(t) = 1 in the new CO2 units. (That is, 1 + exp(t) = 2.) That is when t = 0 in the time scale appropriate for the formula 1 + exp(t).
Using 93.2 as the figure for exp(t) in 2005, we evaluate ln(285/93.2) as 1.118. That tells us that t = -1.118 in 2005. Using the 41.5 year number from above, that means t = 0 at 41.5*1.118 years after 2005, namely 2005 + 46.4 = 2051.4. (Do not infer from this that CO2 will actually hit 285 + 285 = 570 ppmv in 2051, the exponential model is not that trustworthy.)
Working backwards, we find that t = -1, -2, -3, -4 at the following years: 2010, 1968, 1927, 1885.
But if (for the sake of simplifying the arithmetic) Hansen delay were 41.5 years then those dates would actually be for t = -2, -3, -4, -5. (Hansen delay of 41.5 years means that today’s climate is the result of the radiative forcing 41.5 years ago or one time unit on the new time scale.)
But looking back at the tabulation of exp(t) vs. ln(1 + exp(t)) for t from -2 to -5, over much of that period there is not much difference. Even when most of the noise is filtered out, as I had hoped to do, the odds are poor that one could detect so small a difference.
That’s why my belief that one could observe climate sensitivity and Hansen delay together in HadCRUT3, which was based on an assumed difference between exp(t) and ln(1 + exp(t)), is unwarranted for modern secular climate.
So why would I not notice this when fitting?
The answer is that when the random noise exceeds the difference between the two functions, every little dip in noise creates a local minimum in the fit. I said early on in this thread that I’d only found a local minimum, and asked if there were more. Well, this analysis shows that there will be lots more.
I confirmed this empirically with Solver, using the GRG Nonlinear method. Wherever you start from, Solver will find a local minimum very nearby, with only slight changes in the SAW parameters and NatCO2 (= b in the above), while maintaining a constant ratio between ClimSens and exp(d/48) (or exp2(d/33.3) where exp2(x) = 2^x). Neither Solver nor I thought to look further afield for other local minima, though I did ask people early on if they could find other local minima and planned to do so after replying to the comments. I have now done so.
The constant ratio can be found using ClimSens = 2.0 which Solver says corresponds to GWDelay of -2.73 (“temperature causes CO2”) and 3.0 for which GWDelay = 16.7. 2/exp(-2.73/48) = 2.117 while 3/exp(16.7/48) = 2.118. One cannot tell these apart at all just by looking at HadCRUT3.
Why 48 instead of 41.5 (or 33.3 instead of 28.7) is an excellent question that will have to be looked into. However this comment is already way too long, which means (a) that I need to stop now and (b) at this length the odds of containing no arithmetic errors are pretty slim. Will gladly field all such as well as any other faults you find with this analysis.
Posters are not carefully peer-reviewed so no one could have been expected to spot this obscure error unless they’d already thought long and hard about it themselves. Posters should be thought of as idea-generators that may well benefit from debugging and refinement. One result stemming from advertising my poster here is the discovery of the constancy of s/exp(d) between climate sensitivity s and Hansen delay d in a suitable time scale, seemingly 48 years. Thanks to Judith for bugging me to post it!
The key to the whole controversy here lies not in how closely
multi-parametric curve-fitting can match an arbitrarily filtered version of
HADCRUT3, but in how closely that index and VP’s decomposition
correspond to physical reality.
Particularly egregious in the latter respect are his two basic hypotheses
that “global temperature” has NO natural low-frequency variations beyond
what his strictly periodic SAW function and other sub-Hale-frequency
components provide. If one accepts these premises, then there immediately
follows the idea that all lower-frequency variations (seen as “trend” from
the limited perspective of a human lifetime) must be due to anthropogenic
causes, i.e. AGW. The graphs by a frequent WUWT commenter that I managed
to find and link to last Friday provide clear-cut empirical refutation of
this misguided reasoning.
The first graph shows an average ~0.7K rise during the 20-th century of
urban temperature anomalies relative to their non-urban counterparts in the
continental USA, based on geographically representative century-long
records. To varying degrees, a similar non-climatic transient
discrepancy–more a logistic function than a pure exponential–corrupts the
great majority of century-long station records world-wide. This corruption
has never been adequately removed in any of the “global temperature”
indices, certainly not in HADCRUT3. On the contrary, it is preserved and
misattributed to “greenhouse effects.”
The second graph shows the spectral power density of the 20-yr rate of
change (ROC) in the del 18O isotope found in GISP2 ice cores over the last
8000 years. Multidecadal oscillations indeed dominate such changes. They
are, however, of considerable bandwidth and are not harmonics of any 151-yr
oycle. This indicates irregular, chaotic oscillations–not strictly
periodic cycles.
The last graph shows the GISP2 power density without any ROC high-passing of
data; this provides the most complete spectral view of natural variations
during the Holocene. Clearly the most powerful of these are hitherto
unexplained wide-band trans-centennial and quasi-millenial variations,
imbedded in a spectral continuum of “red noise” typical of diffusive
processes. (See also the spectral graph from Liu et al (2011) linked to by
Rasey commenting on Jonas’ recent WUWT guest post.)
Pratt’s basic hypotheses are tantamount to the presumption that in 1850 all
of these complex natural processes abruptly ceased and were replaced by an
exponential rise (AGW) and a strictly periodic “oceanic” oscillation (SAW),
which he attributes to deep earthquakes releasing geothermal heat through
the sub-oceanic crust. Despite a sharp decline in academic standards since
the 1960s, it is doubtful that even first-year grad students in geophysics
would drink such Kool Aid. Earthquakes are episodic, time-limited
phenomena, whose spectra thus cannot be bandlimited, let alone be confined
to the discrete spectral lines of any periodic process. And the relatively
miniscule geothermal heat flow has been long rejected as a credible climate
driver by oceanographers who actually measure such flows.
Nevertheless, the simplistic notion that climate variations consist of an
analytic trend plus multidecadal periodic cycles hidden by higher-frequency
“weather noise” remains endemic among those who feature themselves as
“climate scientists.” What Pratt seems to have discovered here is that
HADCRUT3 was likely constructed on such basis by those who insist that
global temperature MUST show AGW. All it takes for such construction is
a)perform an FFT on a 151-year series of data stitched together from
shorter records, b)suppress the inconvenient zeroeth and first harmonics
before using IDFT to transform the remaining FFT coefficents back to the
time domain, and then c) supplant the supressed harmonics with an analytic
trend correponding to AGW expectations. Voila, a numerical recipe for a
contrived index guaranteed to make a seductive propaganda poster.
Your thoughtful comments are greatly appreciated, John, especially since they’re more likely to look like the sort of referee reports one might expect for such a paper (if Climate Etc. doesn’t talk me out of writing it) than much of what I’ve been hearing here. Let me respond to those for which I feel I have a reasonable answer.
Your first point, about UHI if I understand you, is perfectly valid. However please understand that I’m using CO2 as a relatively well-quantified proxy (thanks to both the CDIAC data and the Keeling curve) for all climate-relevant side-effects of rising human population and technology, of which CO2 emissions is just one component. Those effects that are compatible with the Arrhenius logarithmic law, in particular all greenhouse gases including H2O rising with temperature, seem very unlikely to be separable using just HADCRUT3. I therefore do not claim to be accounting for no-feedback sensitivity of climate to CO2, but rather for everything that humans might be doing to raise temperature.
To the extent that other effects such as black carbon etc. don’t follow the Arrhenius law, some sign of this might be observable in the secular residual as a departure from that law. The “bump” in MRES following a very flat 1860-1960 is the only candidate in my fit for such a departure. I am not claiming proof of this, merely pointing out the possibility. Beyond that small remark, I freely admit that I am unable to separate out the influence of UHI on climate, and make no claim at all to have done so. It is there as an effect at some level that I do not know how to measure observationally. I would be extremely suspicious of any attempt to remove it from the temperature record because that seems both difficult (can you do it?) and risky (getting it wrong could mislead everyone along the food chain from scientists to policy makers).
Particularly egregious in the latter respect are his two basic hypotheses that “global temperature” has NO natural low-frequency variations beyond what his strictly periodic SAW function and other sub-Hale-frequency components provide.
I’m only claiming this for what can be seen in HadCRUT3, which the poster itself establishes in the sense given there. There may well be other datasets exhibiting such variations, for example satellite data, the Argo data slowly coming to hand, etc. but my particular effort has the extremely narrow goal of describing low-frequency components of HadCRUT3 by exhibiting and describing them.
I have done this by first defining what I mean by a “low-frequency component” with the benefit of a filter very carefully defined for this purpose. I then described the thus-defined low-frequency components of HadCRUT3, namely as SAW + AGW + MRES, which I refer to as MUL for multidecadal climate. And I’ve described the rest of HadCRUT3 as the sum MUL + SOL + DEC.
This analysis is exact in the sense that the sums are exact. What is up for grabs is whether components I’ve put in one category should be in another. That would constitute a more or less different hypothesis. I have tried to be clear that my description of HadCRUT3 is only one possible such hypothesis. One could for example try out other definitions of “multidecadal” based on different filters to see what sort of a difference if any that made to my current picture of HadCRUT3 as graphed in Figures 10 and 11.
Note that I don’t say the low-frequency components; to the contrary, in the poster’s conclusion I say “Whether SAW describes a single phenomenon or several is an excellent question.” Maybe it’s all seismic events at the core-mantle boundary, maybe only half, maybe none and it’s some blend of thermohaline events, volcanism, etc. These alternatives puzzled me sufficiently as to prompt me to add deep seismicity to that list.
I would be extremely interested in seeing other hypotheses formulated in this analytic way, that is, analysis into proposed components. One can then formulate more precisely objections such as that there may be other components I’ve overlooked . I would expect the first step in doing so would be to define what that meant in the context of describing HadCRUT3: what does “overlook” mean when all components sum to HadCRUT3? It can only mean “confused with” or “mistaken for” as I’ve acknowledged repeatedly here.
Earthquakes are episodic, time-limited phenomena, whose spectra thus cannot be bandlimited, let alone be confined to the discrete spectral lines of any periodic process. And the relatively miniscule geothermal heat flow has been long rejected as a credible climate driver by oceanographers who actually measure such flows.
This is entirely correct, and my hypothesis in no way makes use of plate tectonics which give rise to the types of seismic events you evidently have in mind. The Earth’s crust would appear to be much too thin relative to its area to have the sort of inertia needed to create even quasiperiodic phenomena, though I’m sure I’m skating on thin ice there so to speak.
The mechanism I have in mind is instead the rotation of the Earth’s core relative to the crust, which is an inevitable result of the Moon’s tidal drag on Earth combined with the relatively inviscid mantle acting as a kind of lubricant for that rotation. The core is an entirely different venue for seismic events than the crust, being far more massive to begin with. The core-mantle boundary becomes increasingly viscous with increasing pressure at increasing depth, whence one can expect increasing “friction” leading to build-up of stress that is suddenly released on a quasiperiodic basis, possibly sychronized both with and by resonances in the cavity occupied by the mantle.
Using a (very) ballpark figure of one revolution of the core relative to the crust per millennium it is not unreasonable to expect such events to occur on a centennial time scale. Moreover some combination of the basic sawtooth mechanism (sudden thermal disturbance followed slow return to equilibrium) could conceivably operate in parallel with oscillations amplified by resonances shaped by spherical harmonics in the mantle cavity, governed by the speed of sound in the mantle. I’m far from being an expert on the sorts of oscillations that can occur between the core and the crust, though I’m starting to get motivated to become more of one. I’ve always enjoyed working with differential equations and have gotten a lot of mileage out of them.
Despite a sharp decline in academic standards since the 1960s, it is doubtful that even first-year grad students in geophysics would drink such Kool Aid
You say “even” when it is the grad students who know which their bread is buttered on. Signing on to a crackpot theory by someone not even in the business would almost certainly be a terrible career move. Even those crackpot theories that eventually pass the test of time, like plate tectonics, quasicrystals, and many other examples, might not pass that test before the signer comes up for tenure. Would you give tenure to such a silly person?
To summarize, I stand by everything I claimed on the poster. To the extent that your criticisms are sound it seems to me that they are criticisms of claims I have not made. (But I agree it is extremely easy to read my poster and think I am claiming certain things; we’ve seen plenty of examples of this during the past two weeks.)
One has to admire your courage in taking full ownership of a conceptual edifice built entirely upon a nonorthogonal decomposition of HADCRUT3—one that depends critically on the available record-length for the values of “SAW” parameters. I only fear that it’s a sandcastle destined to be washed away by the next unpredictable climatic wave. Have a merry Christmas!
John, actually all five sine waves of the SAW portion are almost perfectly orthogonal. Truncating HadCRUT3 to 151 samples would make them perfectly so. Hence orthogonality cannot be the right criterion for objecting to SAW.
A more reasonable objection would be that the basis implied by the three AGW parameters is not orthogonal to that of SAW. This is in fact true, and for the decade since the problem of teasing apart global warming and the ocean oscillations was first raised in 2000 (about the same time “AMO” was coined) this failure of orthogonality has been a major obstacle to solving that problem.
Gram-Schmidt to the rescue! What I have done can be described as using Gram-Schmidt to orthogonalize the 6-9 dimensions implicit in my account. This is not feasible in the presence of a lot of noise, which is the point you’re implicitly making here. But I believe I’ve shown your presumption of noise for 1850-2010 to be greatly overstated. That interval of time is surprisingly free of artifacts other than those I’ve been able to account for.
I make no claims about anything before 1850 or after 2010. In particular I do not claim either to forecast or hindcast (though I would not be proud of a model that hindcasted absurdly, as many peoples’ models do). Any idiot can extrapolate, and I have no qualms about rendering aid to idiots (up to a point anyway—I wouldn’t admit them to our graduate program).
Does this address any of your concerns at all?
My basic objections, both physical and analytic, are not quite what you depict here. Alas, they are too numerous for a 10wpm typist such as I to explicate much further.
As long as you cling to the premise that closely fitting a sharply low-passed version of HADCRUT3 (which fails many ex-ante validation tests as a geophysical signal) reveals something highly meaningful about the real world, you’ll remain unreachable. Even a white-noise series upon sufficient low-passing will exhibit quasi-sinusoidal behavior, which can be closely fit at the cardinal points over short stretches by FFT harmonics. Perhaps Emanuel Parzen, who used to teach at Stanford, can take the time to acquaint you with the intricacies of detection of real-world signals characterized by a continuous spectrum and with the pitfalls of ascribing significance to the lowest-order harmonics of short records.
@John S: Perhaps Emanuel Parzen, who used to teach at Stanford
He left Stanford within a month or so of when I entered Stanford’s Ph.D. program as a student, more than four decades ago.
can take the time to acquaint you with the intricacies of detection of real-world signals characterized by a continuous spectrum and with the pitfalls of ascribing significance to the lowest-order harmonics of short records
Appreciate the suggestion, John. Next time I’m in Texas I’ll look him up.
With two samples respectively 1 and -1, or four samples alternating 1, -1, 1, -1, I’d agree with you. I would call three thousand samples very closely tracking three cycles of a sine wave a very different matter, to the extent of wanting to predict that the next thousand samples would be likely to track one cycle of a sine wave. Wouldn’t you?
Just to clarify: what I had in mind by “very closely tracking” was in other language a high signal-to-noise ratio. Channel capacity is more than just a matter of bandwidth as you seem to be implying. Whatever claim one makes about the information that can be extracted from a signal however aggressively filtered must be scaled by the log of 1 plus the signal to noise ratio.
Time and again, your response seizes upon the incidental, while ignoring the substantive.
Any competent signal analyst, not just Parzen, is keenly aware that an exact Fourier decomposition of ANY bounded series of N real-valued data points consists of N complex-valued coefficients specifying the amplitude and phase of a HARMONIC series of sinusoids. The analysis tacitly ASSUMES an N-periodicity to the data, which assumption is never satisfied by real-world geophysical signals with a continuous power density spectrum. If such a signal is properly recorded over DIFFERENT record lengths, the series of harmonics changes accordingly. Thus the F. decomposition is not unique, nor is it a CONSISTENT estimator of the inherent signal characteristics. As the record length is varied, it is particularly the periodicity of the lowest-order coefficients that changes most dramatically. This analytic fact has nothing to do with signal-to-noise ratios, which your naive analysis of 161 (not 3000) yearly averages of HADCRUT3 is incapable in principle of revealing. Your fanciful SAW component is as much an artifact of nakedly assumed exponential trend as it is of record length.
.
As a final thought here, I can only suggest that terpsichorean skill is never a substitute for analytic competence.
I responded just now here to John S’s immediately preceding comment.
the poster explains “We unify all multidecadal ocean oscillations as a single phenomenon. ”
Baloney. When I questioned this, Vaughan was totally unable to name even ONE ocean oscillation that he could attribute to any of this supposed saw tooth. It is fallacious.
It would be more honest to state:
“We unify everything that does not fit our assumptions as a single phenomenon. ”
There is nothing more to it than that.
Baloney. When I questioned this, Vaughan was totally unable to name even ONE ocean oscillation that he could attribute to any of this supposed saw tooth. It is fallacious.
Anyone reading the exchange between us starting here will see that (a) I named the AMO and the PDO and (b) you flatly contradicted me on true statements about signal processing, dismissing them as irrelevant rubbish. This has been your style all along.
As long as you continue to refuse to pay attention to my arguments and blow them off as the ravings of a lunatic the returns on these discussions have been and will remain zero.
on the contrary VP, we learn a lot about GG so the returns are not 0. keke
Vaughan, you earlier pointed me to column AA , but this does not render of libreOffice. Could you ( or anyone ) briefly describe what the number look like , just in the most simple terms?
Up to a rounding error they’re all zeros. The only point of that column is to confirm that F3(HadCRUT3 − SAW) − F3(AGW) = F3(HadCRUT3 − (SAW + AGW)) even at the very first and last datapoint.
The factor of 1000 in the left hand side of the equation (column Z) is to scale K to mK for Figure 6. I used to do the scaling inside Figure 6 itself by using EVALUATE but became suspicious that possibly not all versions of Excel were handling EVALUATE the same. I now think that suspicion was unwarranted. It would clearer not to have mK units mixed in with K units in the spreadsheet columns.
I was hoping getting the spreadsheet to run on all editions of Excel since 2000 would be sufficient. (Even that amount of compatibility was a lot of work.) Getting it compatible with CALC would be much more work; for starters I’d have to figure out why the charts don’t work in CALC. Anyone see what I could change to make charts work in CALC?
Thanks but I was not asking for a description of what it represented, I got that. I was wanting a very rough description of the values. All big ? less in the middle? typical values at the end.
=(FOPDIFmKy-MRESy*1000)*1000000
That means that column is in nK, right? What sort of order are values around 2010?
A plot many be quicker than words.
I have got a lot of the content by coding the runny means explicitly. Not as tidy but it works in L.O.eg
=AVERAGE(OFFSET($N$1:$N$400,ROW()-1-10,0,2*10+1,1))
I’m sure that could be done in a more general way but I hate spreadsheets and don’t intend to spend the time to become proficient.
I think there are some constants that are not getting filled or something. Some things look not right. eg CK1 ;)
“Up to a rounding error they’re all zeros”
What size are these rounding errors? A lot of mine are displaying as one digit : 0
They start getting significant in 1987 ;)
Don’t have any faith in that yet, but is what I would expect in principal.
As I said in my reply, “Up to a rounding error they’re all zeros.”
Specifically, here are the values for 1989-2010
-1.38778E-08
-2.77556E-08
2.77556E-08
-1.38778E-08
-1.38778E-08
-2.77556E-08
0
0
-5.55112E-08
0
-5.55112E-08
5.55112E-08
0
-5.55112E-08
0
-5.55112E-08
0
0
0
0
0
5.55112E-08
The reason for multiplying by a trillion was so that if the law failed even to one part in ten to the nine, the failure would show up in that column as a number greater than 1, or ### when too large to fit the column (invariably the latter when you force it to fail). The “rounding error” I spoke of is about ten to the minus 17, which becomes ten to the minus 8 when multiplied by a trillion.
Damn, I expanded the other such check by mistake, column AK, very sorry about that. Here’s column AA. It’s still all rounding errors that have been scaled by 10^9 but fewer exact zeros because the formulas being compared are more complicated than for AK.
-3.36398E-08
-3.71925E-08
-4.2434E-08
0
-3.18634E-08
-6.90559E-08
-6.90559E-08
-5.28466E-08
-2.17604E-08
-4.44089E-09
3.5083E-08
7.10543E-08
-1.5099E-08
-2.57572E-08
-7.37188E-08
-1.06581E-08
-5.50671E-08
-7.99361E-09
6.03961E-08
1.33227E-08
-7.81597E-08
8.52651E-08
I’m sure that could be done in a more general way but I hate spreadsheets and don’t intend to spend the time to become proficient.
I don’t particularly like them either. In fact this is the first time in my life I’ve ever done any sort of project in a spreadsheet, I’m more of an APL/LISP/FORTRAN/C/C++/Java/MATLAB hacker (I even once was on an APL program committee decades ago). Excel is a bit like APL and MATLAB, they’re all weird but you go to the computer with the language it speaks, not the language you speak.
To keep the spreadsheet completely vanilla I avoided all VBA (Visual Basic Apps), which saved me from having to learn it. However there was no way I was going to leave out the charts. I still have no idea how do charts in a way that will work in both Excel and CALC, which is a real shame since I expected CALC would have no trouble with Excel.
Vaughan Pratt | December 17, 2012 at 8:44 pm said: ” to confirm that F3(HadCRUT3 − SAW) − F3(AGW) = F3(HadCRUT3 − (SAW + AGW)) even at the very first and last datapoint”
Vaughn, instead of; all of you guys playing ”make belief” and wasting your lives on empty childish talk and calculations; why don’t you analyze: IF ALL THAT ”DATA” IS CORRECT, for a start?? That gospel has nothing to do with the reality. Data placket from thin air, only makes people to go bananas. You guys are a perfect example. .Nobody knows what’s the temp on the 99,9999% of the planet for last year – on those places the temp doesn’t correlate with the data collected on FEW places for you; what will happen when you wake up? Is the reality so scary for you? ::: http://globalwarmingdenier.wordpress.com/unavoidable-two-hurdles-to-cross/
Incidentally the reason that anything less than 1 is displayed as 0 in columns AA and AK is that I formatted them to print integers (aka reals to 0 decimal places). That way the column only needs to be one character wide: 0 means the law is good down to one part in a trillion, anything else (invariably a huge integer that doesn’t fit and is therefore formatted as ###) indicates failure of the law. There seemed no point in allocating more digits to these two check columns.
stefanthedenier | December 17, 2012 at 10:30 pm |
Vaughn, instead of; all of you guys playing ”make belief” and wasting your lives on empty childish talk and calculations;
Hey, why have you forsaken me? wot, no more complaints about forgeries, etc. Why leave me to dry, when you could spice up my life?
lsvalgaard | December 17, 2012 at 10:57 pm asked: ”Hey, why have you forsaken me?
no, I didn’t forsake you; I’m waiting for you to apologize to those people that you mislead. OR, to demonstrate: how did the people counted the sunspots for the last 1000years?!
”wot, no more complaints about forgeries, etc”. It wasn’t complaining, it was pointing to you that: by plotting ”your sunspots” against data harvested from thin air – your forgery is twice as misleading.; nothing personal. The sooner you admit your CON, the better for the people that trusted you.
Here is what was your guidance: to forge sunspots:: http://globalwarmingdenier.wordpress.com/2012/08/25/skeptics-stinky-skeletons-from-their-closet/
the ”Flatearther’s” phony GLOBAL temp charts, fit your sunspots… aren’t you ashamed?! Read that post, see that you have being duped by similar opportunist as yourself
Very amusing. But a bit incoherent. It is not clear if you are claiming that sunspots do not exist, cannot be seen, or something else. For your info: I have seen sunspots myself, people have seen sunspots with telescopes for 400 years and with the naked eye for thousands of years, and we have spacecraft that see sunspots today. For more info: I claim that sunspots do not have any strong influence on the climate. But, as I said, you are rather incoherent so why knows what you think you have uncovered [other than an underused brain].
Leif
Why do you need Stefan to spice up your life when you already have Vuk?
tonyb
Well, Vuk, has his wit, but he’s not close to StephanDen’s class. Leif’s right, that part of his brain is underused.
======================
climatereason | December 18, 2012 at 4:27 am said: ”Leif, Why do you need Stefan to spice up your life when you already have Vuk?”
Tony, would you ask Vuk; to read my comment below at: ”December 18, 2012 at 6:04 am” he will be grateful to you; he needs to know those two real facts, thanks, and merry Christmas!
|kim
Yes, Stefan is unique.
tonyb
I had been thinking of kim as unique. However once you get to know the regulars here they’re all unique: you can pretty much guess the signature at the top from just the body of the comment if it’s a regular. ;)
lsvalgaard | December 18, 2012 at 12:06 am mislead again: ”It is not clear if you are claiming that sunspots do not exist, cannot be seen, or something else”
A: sunspots always existed, b] for the first time were discovered by Very powerful filter in 2004-6AD. Then, you and others; used phony GLOBAL temp charts, and forged the sunspots to fit those misleading charts = sick, destructive opportunism.
#2: ”For your info: I have seen sunspots myself, people have seen sunspots with telescopes for 400 years and with the naked eye for thousands of years, and we have spacecraft that see sunspots today”’
A#2: yes, we have spacecraft that see those sunspots. B] anybody who believes you: should go tomorrow in the backyard, and count the sunspots (if cloudy, do it next day) . Then they will know about your integrity. C] telescope magnifies the sunlight; would burn human eye much quicker than looking with the naked eye at the sun.
For people that in doubt: point the telescope at the sun and put paper below – the paper will burn in seconds – that same paper will not burn, if you leave it exposed to the sunlight.
L Svalgaard; the challenge stands: ”for you personally to demonstrate: how did people saw sunspots for thousand years; or to apologize, in writing – AND to promise that: you will tell less lies in future. Is that clear now? Stop playing Sargent Schulz. You are a shameless, destructive con. The Sun can be seen from everybody’s yard, no need to go far, for the experiment. Go for it; easy to prove it – the sunspots are there, count them. If the Chinese were monitoring sunspots for thousands of years, wouldn’t be 1,4 billion of them now.
I have with my own eyes seen sunspots since the 1960s. Anybody can see naked-eye spots at sunset when the sun is dimmed by smoke [e.g. from fires] or haze. Such sightings are a-plenty.
Here is how you can see sunspots yourself without burning out your eyes: http://spaceweather.com/sunspots/doityourself.html
This method has been used for almost 400 years. Try it yourself and report back here.
Leif
I am beyond help according to stefan as I am apparently a leadng phoney skeptic ( I find the ‘leading’ bit quite flattering)
The idea that you have been forging sunspot data all your life raises conspiracy theories to a new level
tonyb
Vaughan Pratt | December 17, 2012 at 9:44 said: ”As I said in my reply, “Up to a rounding error they’re all zeros.”
Vaughn, instead of those meaningless numbers; there is more interesting experiment for you: to help Svalgaard; and count the sunspots tomorrow. We would like to see: which one of you will see more sunspots – you can use tinted glasses, because they have being invented long time ago. If you help us; Santa will like you even more. BUT, if Svalgaard counts more sunspots – he will get the lolly and toys. P.s. for both of you: don’t forget to send me the postcards!!!
Q. What would Climate Etc. do without stefanthedenier?
A. It would replace him with a computer program.
Five lines of code and five hundred choice retorts ought to do it.
stefanthedenier is very amusing, i doubt a computer program could do that.
lsvalgaard | December 18, 2012 at 1:38 am
usually i don’t go on something that is obviously wrong, but did now. whoever was writing that tread, had the phony global warming as target.
Confusing sun-flares and magnetic outbursts, with ”SUNSPOTS” – because is discovered now that: there is correlation; is a cheap trick!!!
We’ve experimented; if people did know that sunspots exist; would they have found a way to see them? verdict: no way Hose! Sun-flares are not new knowledge. b] if something obstructing the sun (in front of the sun) can be seen. BUT, ON THE SURFACE off the sun – even now needs to be computer manipulated!!!
2] projecting on paper has same problem: high beam of the car headlight is much safer to experiment: if an insect goes in-front – will show it on the wall. BUT, if is few spots of mud on the headlights; doesn’t project it + PLUS cannot be seen with directly looking at the light COMPARE THE STRENGTH OF CAR HEADLIGHTS, WITH THE STRENGTH FROM THE SUN. Confusing different things, is the trick of the trade, but not science!!! the powerful light from the sun, without that powerful NEW filter; you cannot even see other stars at midday; you are talking on the surface of the sun. For knowledgeable person is easy to detect, that he is jumping from one thing to other; like in 3 cards game..
I.e. because the moon spins around the earth – the universe spins around the earth also; but much slower… ?!?!?! wow! I burned my eyes looking at solar eclipse, when I was 8y old – i had the smoked glass. BUT seeing the moon in front of the sun – and seeing sunspots on the SURFACE of the sun – is different as me seeing the monitor in front of me, AND seeing you from Australia. BUT, for whoever was writing that post, is same thing. … That’s more suitable for Tony Brown, don’t impose it on honest people. Chinese can computer manipulate today, to make an image of the surface of the sun / sunspots… but 100y ago, 2000y ago?. Separate when you talk about ”radiation, or sun-flares” with seeing on the ”surface of the sun”, please
John S. has quite succinctly slammed shut the coffin lid on this foolishness:
“Pratt’s basic hypotheses are tantamount to the presumption that in 1850 all
of these complex natural processes abruptly ceased and were replaced by an
exponential rise (AGW) and a strictly periodic “oceanic” oscillation (SAW),
which he attributes to deep earthquakes releasing geothermal heat through
the sub-oceanic crust. Despite a sharp decline in academic standards since
the 1960s, it is doubtful that even first-year grad students in geophysics
would drink such Kool Aid.”
Let’s leave this thread to Dr. V.P. and Dr. stephanthedenier. You boys enjoy your chat.
Pretty amusing to see the admission that it is risky to be wrong and mislead the food chain, and then see the defense which is to not even be wrong.
============
Don, I take it you reject the whole of my reply to John S. then. (Not complaining, just asking. I would expect no less on Climate Etc.)
After you, kim.
This way to the egress.
=======
Oops, I went before you instead, how rude of me.
lsvalgaard | December 18, 2012 at 1:38 am said: ”I have with my own eyes seen sunspots since the 1960s. Anybody can see naked-eye spots at sunset when the sun is dimmed by smoke”
L Svalgaard, let me help you, to put you out of misery, regarding your ”old sunspots” but you have to say, thanks, here we go::
Sunspots cannot be seen, for two different reason; without that special filter – AND ONLY FROM THE SATELLITE, + computer manipulation:::
#1: around the individual sunspot, the surface of the sun that is emitting stronger lights, is NOT SMOOTH – the light beams released, don’t go in same direction; same as: in-front of the sunspot is as crossfire of light beams. B] it means as: between the headlights on your car, you can see the radiator, if you really try. BUT, if the car had 1000 headlights and on many of them, the beams were crossing each other and going in different directions; no way Hose, to see the radiator. C] to put a powerful filter, to block the ”stronger sunlight” the weaker one from the sunspots would be blocked as well. Reason you cannot see the thousands of star at midday; is because their light is not as powerful as from the sun. Most of them are even from different angle, but no help.
#2: second reason is very important, pay attention: in the atmosphere are particles of dust + H2O + CO2 + SO2 and other trash. They are distorting / dispersing the sunlight coming from the sun:::, LIKE CHANDELIERS, can you dig it?! first, sunlight doesn’t arrive as beams in different colours like on rainbow – than in the atmosphere is sooo much dispersed; to see a sunspot…, ?!…?!Outside, from a satellite, the second factor can be avoided, BUT:
3] your brain-trust is writing that: they were absorbing sunspots 1100 AD… that is 850years before Gagarin went up… 2] you state that: you have seen sunspots in 1960’s; were you there with Gagarin?… well, he was told not to look at the sunlight… because is more powerful there. Now, will you apologize, AND tell your brain-trust: to stop lying and misleading sunspots with solar eclipse and similar crap? L Svalgaard, honesty is the best policy! It same goes for your supporters!!!!!!! Have some dignity and apologize
Despite all the detailed arguments about implementation, what is fundamentally wrong with all this is that the multidecadal residual MRES is calculated against the distorted F3(AGW) and NOT against the proposed model.
Since AGW exponential has NO higher frequencies to removed it makes not sense to filter it before calculating the residual.
This step is superfluous, and has no purpose other than to transform a function that does fit into one that does.
What is being tested and fitted here is not the CO2 model that is being proposed but something fundamentally different in nature, the second line in figure 3.
All that is being done here is incorrectly applying a filter which, by happy coincidence, deforms an exponential model that does NOT match the observational data in to some function which does look like the data, for which we have no analytic model .
The conclusion of the presentation :
“… the only significant contributors to
modern multidecadal climate are SAW and AGW,”
is a false statement . What was tested and analysed was not AGW but F3(AGW) , that has a fundamentally different form.
We can see from figure 3 that if mutidecadal climate matches F3(AGW) to “within a mK”, it differs from the proposed model by 140mK.
That is a deviation of the model from the chosen temperature data of about 14%.
The claim in the conclusion is clearly false. The rest is just the magician waving his cape before pulling the rabbit from his hat.
@gg: Despite all the detailed arguments about implementation, what is fundamentally wrong with all this is that the multidecadal residual MRES is calculated against the distorted F3(AGW) and NOT against the proposed model.
Normally I wouldn’t say “Baloney” to nonsense like this. However since Greg likes blowing off other people with such epithets, why should he have the exclusive right to them?
One would have to be brain-dead to believe what Greg just claimed here after all the explanations by Pekka, Jim D, etc. to the contrary.
I’m coming to the conclusion that Greg is a ***** (can’t say the word because Judith will strike it out as she’s done in the past).
darn those typos.
“This step is superfluous, and has no purpose other than to transform a function that does fit into one that does. ”
obviously this should read:
“This step is superfluous, and has no purpose other than to transform a function that does NOT fit into one that does.”
I decided to modify Vaughan’s Figs 2 and 3 so that the smoothed values are shown at the weighted average time of the corresponding raw data. The weights used for time are the same as for temperature values.
The results are shown here.
These graphs contain all the same data points. The only difference is that the smoothed points are moved horizontally at both ends. This is probably a less misleading way of showing the same results.
This comparison tells more on what happens at the end. Here I show 21 latest smoothened data points from both series as points, not line. The 1990 point is shifted very little left from the nominal date due to truncation of four years from the high side The displacement increases with time so strongly that the latest to averaged dates are only 2 months apart. They tell very nearly the same information.
I decided to modify Vaughan’s Figs 2 and 3 so that the smoothed values are shown at the weighted average time of the corresponding raw data.
Yesss!
This is the variant I was referring to that increases the temporal accuracy at the expense of frequency accuracy. (Well, the frequency accuracy was already lost on account of Excel’s AVERAGE, all that this time-shift does is to improve temporal accuracy.)
A pause now while we wait for this to sink in with Greg…
Don’t blame this on Excel, the frequency and phase was lost because of your ineptitude and carelessness, not because of the average() function.
Pekka has found a way to greatly improve the phase distortion though the frequency response of the filter still changes at every step.
Don’t blame this on Excel, the frequency and phase was lost because of your ineptitude and carelessness, not because of the average() function.
Give this “ineptitude” stuff a rest, Greg. Wait until it’s clear what’s going on in my spreadsheet before jumping to conclusions. This behavior was completely clear to me back in March. What Pekka explained just now is exactly one of the approaches Jake Askeland and I discussed back then.
The sense in which AVERAGE creates a frequency error is because the window gradually shrinks to half its width. This results in the frequency response of F3 as plotted in my Figure 5 gradually moving to the right. The cutoff moves from frequency 1.0 to 2.0 during this period (so from period 21 to period 11 when filtering out HALE, but also from 11 to 5 when filtering out TSI as part of constructing Figure 9). The impact on MRES is that HALE (which is completely rejected when away from the end) starts to leak into MRES near the end. That is the entire extent of the frequency error: simply leakage from higher frequencies that F3 was designed to block.
By writing the average of each window into the center of the window as Pekka just did, there is no timing error. However I felt that the frequency error was a bigger concern—-fixing the timing error merely moves the filter output in time without changing its amplitude. Yes that aligns nicely with a steep curve when it’s climbing 100 mK within the space of a window, as Pekka demonstrates, but that is not the problem you’ve been making it out to be for the past two weeks since a big error like that will occur almost identically in Figure 2 and therefore the two errors cancel.
An error in F3(AGW) is completely meaningless. The real question is how MRES behaves. The difference between AGW and F3(AGW) does not show up in MRES and is completely irrelevant to the research done in the poster.
Thanks Pekka, that is a lot closer to the unfiltered functions than I expected it to be. There is still some slight warping of the coeffs but it close enough to see a more realistic fit. (not good enough for silly mK claims but good enough to see how the models work).
I thought the idea was a bit ad hoc and hard to quantify its accuracy but to judge by eye it’s a leap in the right direction, at least for the analytic function. This suggests it is too bad for the data either though eyeballing the exponential does not tell us in a rigorous way what it does for different forms.
The obvious drawback is that we are losing some length exactly where we need it to assess whether these models are fitting recent data. That is precisely where a strong CO2 model will start to diverge. But against the rigorous option of cropping as soon as we lose the claimed accuracy in the filter , ie 25y form the end, its a great help.
I have to go out now but I’ll compare that version of F3(DATA) to my synthetic projections later.
http://i50.tinypic.com/2nvtmdy.png
Yours is F3_Pek(DATA-SAW) mine was F_exact(DATA-ex)
If the trend in the data would be linear, all smoothed values would fall exactly on top of the raw values calculated for the same date. The model AGW is expontial, i.e. a convex function. Thus the smoothed value is a little higher. The difference is the larger the more smoothing there is. Closer to the end the averaging period gets shorter. Therefore the smoothed value gets closer to the raw value. This is visible as very minor bending in the comparison of AGW with F3(AGW).
In the above F3 refers to the calculation of the spreadsheet, not to the result one would get by extrapolation of the AGW formula and applying full F3 filter to that. Extrapolation + full F3 would maintain the same relative deviation from the raw model value.
“Extrapolation + full F3 would maintain the same relative deviation from the raw model value.”
Could you just clarity that? Same as what?
Are you saying Extrapolation + full F3 would be the same as the unfiltered analytic function?
I found an endpoint error of 0.1 mK ,which is down at the level of pass band distortion that VP initially noted : 0.4% of fullscale.
Greg
Looking carefully at the curves AGW and F3(AGW) that I posted you can see that the thinner AGW is almost in the center of the thicker blue line around year 1900 when the value of the exponential contribution was very small. Gradually the thin line moves to the lower edge of the blue line when the value of the exponential part grows. The deviation of F3(AGW) from AGW is proportional to the exponential contribution of the value up to 1990 beyond which point the filter starts to get significantly truncated. That reduced the difference between F3(AGW) and AGW just enough to be observable in the graph.
The deviation of exact full F3(AGW) calculated from the extrapolated AGW continues to grow in proportion to the exponential part of the value indefinitely. The difference between the full F3(AGW) and truncated F3(AGW) is, however, barely visible, when the weighted average is used for both time and anomaly, because the AGW is close enough to linear over the period of 22 years which is the full width at half maximum of the impulse response and thus a reasonable measure of the effective period for calculating the weighted average.
For the asymmetric truncated filter that produces the latest data point the full width at half maximum is about 15 years and thus not very much smaller than that of the full filter.
Pekka: “The difference between the full F3(AGW) and truncated F3(AGW) is, however, barely visible, when the weighted average is used for both time and anomaly, because the AGW is close enough to linear over the period of 22 years ”
Trying to judge the scale by eye it would seem that the difference between the analytic fn AGW and F3_Pekka(AGW) is about 5mK max. You say F3_full(AGW) is “barely” different.
Could you provide numbers on both of those so we have some clear knowledge of the magnitude of the worst case difference?
In particular what is the deviation F3_full(AGW) – AGW at the end where it will be largest?
Do you have this F3_Pekka() in the form of a spread sheet cell function so this can be dropped in and used?
Thanks.
Oops, I commented too quickly, Greg latched on this really fast. Please ignore my disparagements, of which I am overendowed.
@GG: The obvious drawback is that we are losing some length exactly where we need it to assess whether these models are fitting recent data. That is precisely where a strong CO2 model will start to diverge. But against the rigorous option of cropping as soon as we lose the claimed accuracy in the filter , ie 25y form the end, its a great help.
In retrospect I should have made my point the way Pekka did instead of just saying it in English in 10^2 words. A picture is worth 10^3 words.
I am truly grateful to Pekka for getting Greg off the dime about the “rigorous option of cropping.” Had Greg not been badgering me about it for two weeks I would not have brought that up.
stefanthedenier | December 18, 2012 at 6:04 am |
Sunspots cannot be seen, for two different reason; without that special filter – AND ONLY FROM THE SATELLITE, + computer manipulation
Here are Sergio Cortesi [from Locarno Solar Obs.] and I seeing and counting sunspots without any special filter and from the ground and with no computer involved: http://www.leif.org/research/Sergio-and-Me.jpg
lsvalgaard | December 18, 2012 at 10:26 am said: ”Here are Sergio Cortesi [from Locarno Solar Obs.] and I seeing and counting sunspots without any special filter and from the ground and with no computer involved”
that photo shows two people looking at a silhouette; not counting sunspots.
it’s same as if Tony was showing a mouse eating a cup of grain from the bushel – as proof that: the WHOLE planet is cooler by 0,12C, because of it – or looking at a bucket of water, and declaring that: the temp of all the seven seas are warmer by 0,03C.
I always had binoculars and a telescope, not big one, but understand what can be seen and what cannot. L Svalgaard, why you are not commenting about ”the two factors”, i pointed to you? or apologize; instead of showing a photo of yourself?
OK, finally got a chance to look at this in excel (which doesn’t BTW).
The limits on the sliders ensure no one strays too far from the ‘local’ solution built in and in any case fiddling by hand is unlike to produce anything useful on that many params.
Requires someone fairly skilled in using the excel “solver” or some other external fitting tool.
Putting blinkers on the spreadsheet and challenging anyone to do better by fiddling with the sliders is not a very fair test and absence of responses says more about the means that were offered than how good/bad the model is.
All this helps people understand is that parameter fitting is a bit more complicated than fiddling with sliders.
Excel’s inability to handle a negative value did not impress me greatly. I set min properties to allow some negative range and the slider rolled round to 65535 instead of -1 and made a huge mess, though entering a negative in the cell below gives expected results. Of course then you can’t use the slider and each minute chagne becomes a chore.
Excel’s inability to handle a negative value did not impress me greatly
That drove me nuts too.
though entering a negative in the cell below gives expected results. Of course then you can’t use the slider and each minute chagne becomes a chore.
Exactly right. If you want to muck with the min properties do it the way I did with the tShifts, namely by adding 1000. Only a few idiot savants are comfortable subtracting 65536 in their heads. Recognizing 973 as −27 is a tad easier; at least it separates the sheep from the goats.
You will be pleased to know LibreOffice does not have this bug with sliders!
The sliders look broken in LO but this is only because the min/max values do not get imported correctly (perhaps because they are called maximum and minimum). If you go to designer mode and reassert these values the sliders work. Though I did find I needed to force a draw of the graph to see the result , it did not seem to update automatically.
I don’t know whether saving this in LO and reopening in Excel would provide an xls that could be read by both programs.
So that fixes a lot of the problems with running this in LO.
Use explicit functions for the runny mean filter and put the slider limits in and you have most of the functionality back already.
I would have thought a little work would fix things if you want it to work in LO as well. Didn’t take me long to fix these two issues and I never work with either.
You will be pleased to know LibreOffice does not have this bug with sliders!
If I knew the Excel-using world could easily switch to LO I’d redo all this myself in a flash. (I do have LO on my desk, on multiple machines.)
I don’t know whether saving this in LO and reopening in Excel would provide an xls that could be read by both programs.
That’s a really excellent suggestion. At my end what it would entail would be redoing the charts from scratch in LO (unless you’ve done this already), saving them in LO, and testing whether Excel can read the result.
Thanks for that, I’ll add it to my rapidly growing list of projects arising out of agreeing to Judith’s request to post my poster here. Talk about a hostile reaction! I think I’ll wait a while before banging my head on a wall that way again.
Putting blinkers on the spreadsheet and challenging anyone to do better by fiddling with the sliders is not a very fair test and absence of responses says more about the means that were offered than how good/bad the model is.
Methodologically this is a fair point. If someone finds a point in the 9-dimensional space I provided here that (a) lies outside my limits and (b) makes sense I will gladly reset those limits (in case the plaintiff can’t).
… but in the mean time you’ll leave them in place to ensure no one does.
and just to make double sure you impose the additional condition that they do it in the same 9-space you “locked” your result to .
and just to make double sure you impose the additional condition that they do it in the same 9-space you “locked” your result to .
So you’re ok with the Rossander parameters then? They’re just as good a model of global warming?
Have you checked how they hindcast?
and just to make double sure you impose the additional condition that they do it in the same 9-space you “locked” your result to .
Isn’t weakening that condition a bit like allowing Houdini’s competitors to escape from a bathtub in which a cat is holding them underwater with one paw?
Did the college you got your degree from offer a course in logic?
I should add that I hardly ever kick students out of my classes except when they’re being so disruptive that they’re interfering with what the other students are getting out of the class. Greg Goodman would be such a student. His approach to challenging the teacher is disruptive beyond all reasonable bounds.
The appointments-and-promotions committee of wherever it is he teaches would appear to have very different criteria as to what qualifies their faculty for tenure.
Requires someone fairly skilled in using the excel “solver” or some other external fitting tool.
Greg makes a good point here. Let’s wait two days and see where he stands on this. I’m guessing he’ll be in the top 2% of skilled Solver users by then. Solver’s a fun tool.
Dr. Pratt,
Don’t let the minor criticisms of your work here deter you from submitting a paper on this stuff. You can count on the institutionalized confirmation bias in the climate science’s alleged review process to get you a pass.
Somehow, this will be prominently featured in the AR5. The Dr. Prof. V. Pratt Effect (deep earthquake crusty heat thingy) will be famous, by this time next year. It may even be enshrined as a law, like the AHH law.
The only downside I see here is if the deniers claim that your Pratt Effect deep earthquakes could have caused the warming from 1970 to 2000.
http://fallmeeting.agu.org/2012/eposters/eposter/gc23c-1085/
Is that your mathemetician hat? You may need a bigger one.
Don’t let the minor criticisms of your work here deter you from submitting a paper on this stuff. You can count on the institutionalized confirmation bias in the climate science’s alleged review process to get you a pass.
Appreciate your support, Don. Let me know if you’re ever institutionalized yourself and I’ll pick out a suitable card.
The only downside I see here is if the deniers claim that your Pratt Effect deep earthquakes could have caused the warming from 1970 to 2000.
What are you talking about, Don? They caused the warming from 1910 to 1940. Listen up, you’re not paying attention!
Well Doc, I am way too clever to have wasted my time reading this whole thread. Did you present any evidence for your deep earthquake done it theory? A hint: imagination and numerology don’t qualify as evidence.
Maybe the mole people could help you out. They know what’s going on down there better than we do. Get in touch with Superman. He knows where to find the little subterranean buggers. Don’t put on your explorer hat and go looking for them yourself. They can be hostile to snoopy surface dwellers.
Thanks for the Superman movie, Don. At the end Lois Lane says “It’s almost as if they were saying, you live your lives and we’ll live ours.”
Too bad the skeptics aren’t less like Luke and more like Lois Lane. To climate skeptics the scientists are mole people to be strung up, or at least jailed in those jurisdictions that frown on lynch mobs. ;)
To climate skeptics the scientists are mole people to be strung up, or at least jailed in those jurisdictions that frown on lynch mobs. ;)
A largely self-inflicted problem. If only more climate scientists had publicly distanced themselves from the hiding of data, hiding the decline, sabotaging of peer-review and the science process generally, and the subsequent official attempts at covering all this up, then today they could possibly have been credited with having some integrity, and be seen as being bona-fide rather than agenda-driven.
The advantage of the particular story you’re brainlessly repeating here, Memphis, is that the half of the population that still rejects global warming is incapable of seeing how ridiculous the reasoning behind that story is.
That story is therefore eminently suited to its purpose.
Oh come come Vaughn. How can you seriously expect the public to believe experts who keep schtum about crookery ?
Vaughan Pratt is an example of a scientist (if that is the correct term for him) who practices, dishonesty, obfuscation, diversion, avoidance, misrepresentation, strawman tactics. I wouldn’t trust anything he says. Furthermore, his tactics suggest that many other climate scientists behave the same way. That damages their credibility.
Vaughn,
Just to be clear, unlike some others here I wasn’t accusing YOU of dishonesty and/or coverups etc etc. But since this has come up, I would though be interested to hear your take on the dishonesty/malpractices of Mann, Jones and the other Climategaters.
How can you seriously expect the public to believe experts who keep schtum about crookery ?
Nixon didn’t keep schtum about crookery, Memphis, he very distinctly said “I am not a crook.” Draw your own conclusions about those who say they’re not crooks and those who don’t.
For the half of the public you have in mind, I don’t expect them to place any credence whatsoever in those who actually know what they’re talking about. That’s what so cool about elections, no one knows which half is going to win until all the votes have been counted. Only then can we tell who the real experts were.
who practices, dishonesty, obfuscation, diversion, avoidance, misrepresentation, strawman tactics.
…which are all abhorrent practices that Peter Lang would never in a lifetime stoop to, no matter what benefit might accrue to him in doing so. Right, Peter? Please say yes.
Incidentally you may have met your match with Greg Goodman, who in my estimation has managed to out-shout you in criticizing my outrageous claims. For starters Greg has at least a year of training in signal processing over you, maybe even more though it’s unclear how much of that he’s managed to retain.
If you disagree please take this up with Greg rather than me since I’ll have to recuse myself from that competition for rather obvious reasons.
You’re not addressing the question that was put to you Vaughn.
In question here is not expertise of the experts, but their honesty and integrity. Experts can make the best conmen of all.
The way VP steers clear of the climategate-type issues seems to speak of the way ‘noble’ cause corruption of climate science is endemic and acceptable ‘çonsensus’ behaviour. The elephant in the chat-room.
Hey Memphis, if I want to point up a fallacy in someone’s argument, all I have to do is call them a liar and then it’s obvious what the fallacy in their argument was. They were lying.
Is that the point you’re making? If so then I hereby call you a liar.
Apparently you’ve lost that argument. You can win it back by calling me a liar. Go right ahead.
This could take a while.
The way VP steers clear of the climategate-type issues seems to speak of the way ‘noble’ cause corruption of climate science is endemic and acceptable ‘çonsensus’ behaviour. The elephant in the chat-room.
Wow. I bet that argument never occurred to Aristotle.
So are you saying that we could disprove theory X if only we could see how vitriolic the correspondence was between scientists debating theory X? For which X would this apply to? The heliocentric theory of planetary motion? Relativity? Wave-particle duality? Quantum mechancis? Plate tectonics? Quasicrystals? Your wife cheating on you?
It’s a complete mystery to me why you think a theory of the universe founded on vitriolic correspondence has even half a leg to stand on. It’s a very novel approach to the scientific method, wouldn’t you say?
You continue to avoid the issue put to you Vaugh – ie, how can you expect the public to believe climate scientists in general, when they avoid distancing themselves from those of their number found to be cheating?
In the absence of such distancing, the perfectly logical conclusion is that the çlimategate crooks were not just a few rottem apples in the barrel, but rather that the whole barrel is rotten. So from here in the commonsense cheap seats, since the ‘rotten’ consensus is CAGW, CAGW too is put in question.
Note that I am neither criticising your arguments in this thread, nor calling you a liar. I also fail to see how putting a question to someone (you, in this case) can possibly make anyone (me, in this case) a liar.
Vaughan
None of your reply to my comment
had any relevance to it. My prima facie conclusion is : you have no (relevant) answer.
Insisting for an direct answer to the whether a man has stopped beating his wife implies that he has at one time been beating her.
Insisting that a person must distance himself from some other specific persons implies that he has been close to them.
Answering those questions when the implications are not valid does not make sense.
Every scientist should distance herself or himself from improper practices but they need not present judgment on any other persons if they don’t wish to do that. Few of us know enough about the details to tell the extent of wrong-doings. Nothing has been confirmed in a court to help in that. To me it seems clear that the emails tell at some level of wrong attitudes and that certain activities have been unwise. I could add a few more details to what I feel confident on, but I know too little to present a condemnation of any person involved.
Pekka,
So you don’t believe data was hidden, FOI resisted, requests to delete incriminating emails made, journals arm-twisted, the Decline hidden from policymakers, coverup ‘Investigations’ of the aforementioned run, and so on?
Or you count those as normal science not warranting comment, let alone criticism?
Punksta,
Did I say so?
I didn’t say anything on those specific points in either direction, and I don’t see any reason for telling what I believe on them and how strongly.
It’s really ridiculous to require people to make such declarations of belief.
Pekka
Your reluctance to distance yourself from the science fraud of your colleagues, is 99% of the reason for your profession’s disastrous credibility. It’s not ridicuous for honest scienists to speak up, it’s ridiculous if they do not.
What I’m ready to say and what’s more meaningful for me to comment is that I don’t believe that anything essential is left hidden or that any significant errors in data based on instrumental records were left uncovered by the questionable actions.
On the multi-proxy analysis of the paleoclimatic records some delays in figuring out the methodological errors and weaknesses was caused by the wrong resistance on the critique of the skeptic community. Related to that the error was made to use the Hockey Stick graph in an inappropriate way that has caused damage to climate science.
The above are observations about the outcome of the activities as seen now years afterwards. I don’t comment further on the processes that led to these outcomes.
Punksta,
I honestly don’t know what has happened. I don’t accept the claim that the emails and other confirmed facts can tell that on the level required for condemning people. There are email comments that look bad but they are not sufficient proof.
It has been confirmed that the British FOIA was not followed fully but the responsibilities are not as clear. The law was new at the time and there were also genuine questions on the role of international commitments, which affected the application of the law.
Heh, naive and calculating, an amusing combination. CAGW in a nutshell, but it’s not so amusing.
================
Conservative cartoonist Bruce Tinsley complained this week about George Zimmerman having been tried by the liberal media before he had been tried in court for the killing of Trayvon Martin.
Yet I gather from Memphis, Tomcat, Punksta, and kim that the conservative media sees no problem in trying Mann in their jurisdiction and finding him guilty.
So, you four: please explain to everyone here why the rules Tinsley wants to apply to the liberal media do not apply to the conservative media.
Vaughan Pratt, did you really just compare a criminal case where many facts were unknown or uncertain and under investigation to a scientific case where just about everything is known and documented despite no official investigation? If so, I think you have your answer.
Pekka Pirilä:
Plenty of scientists know advocacy groups distort science “for the cause.” Not only do they not condemn that, many of them have praised things like Real Climate and Skeptical Science.
That’s the real problem. The real problem isn’t the outrageous dishonesty by people like Phil Jones and Michael Mann. The real problem is the rampant spread of misinformation by people who support the “global warming cause.” Not only do they have a larger influence, they are the ones who enable the more blatant forms of misinformation.
By far and large, scientists have allowed skeptics to be painted as dishonest/stupid while their own “side” has been free to spread just as much misinformation.
I swear, that autofill feature will be the death of me.
“Vaughan Pratt | December 28, 2012 at 1:45 am |
Conservative cartoonist Bruce Tinsley complained this week about George Zimmerman having been tried by the liberal media before he had been tried in court for the killing of Trayvon Martin.
Yet I gather from Memphis, Tomcat, Punksta, and kim that the conservative media sees no problem in trying Mann in their jurisdiction and finding him guilty.
So, you four: please explain to everyone here why the rules Tinsley wants to apply to the liberal media do not apply to the conservative media.”
Do you deliberately pick things which are so incomparable?
Can’t find some public figure similar and have similar case to Mann.
What is point using such dissimilar cases?
Now, what you didn’t say was George Zimmerman does can legal case against some of networks- as I recall, believe NBC.
If that is what you mean, then it’s somewhere vaguely in the realm of being comparable to Mann.
It could be similar because then the similarity: the topic of free speech.
And this means both could be about matters on the public record.
As the matter of Mann is about what is in the public record [as compared to something is not, such as what he may or may not done to his wife or how well he treats puppies]. And what NBC said about George Zimmerman is in news stories [a public record].
Now, George Zimmerman wasn’t a public figure until the news media
made him into one. And one still has the difference of Zimmerman not being public servant- the public has not hired him and are not paying him a salary.
But it’s slight improvement in comparison of Zimmerman’s “crime” of murder with a “crime” of Mann being an idiot.
Somebody’s getting his head beaten into the ground without anyway to defend himself.
================
VP: “I am truly grateful to Pekka for getting Greg off the dime about the “rigorous option of cropping.” Had Greg not been badgering me about it for two weeks I would not have brought that up.”
That’s rich.
You were lambasting me and wasting my time for about a week . The penny finally dropped you admitted you had made a mistake and apologised for badgering me. Now you say it was me badgering you.
You asked me to assume everyone was working from good will. Such an assumption is a good starting point but like all assumptions it has to be subject to correction in the face of evidence to contrary.
Pekka has found a method that reduces the errors you introduced by faulty implementation of the filter. This is a marked improvement, however, it does shorten that critical period at the end which is the acid test for any high CS model.
If your method can’t do that , the result has little interest.
@gg: You were lambasting me and wasting my time for about a week.
During that week you were sweetly responding to my unwarranted badgering, and were mystified as to how anyone as kind and appreciative as you could possibly deserve such a heavy-handed hostile treatment from me.
Did I get that right, more or less?
Here is the difference between F3_defective() used in the poster and F3_full() calculated with a full window.
http://i49.tinypic.com/2zylcgh.png
This is the elephant in the room. Talking of mK accuracy when you have 154mK distortion giving the _illusion_ that your CO2 model is fitting the data is a joke.
Note the end value is 154mK ahead of the poster’s “F3(AGW)” , that is somewhat worse than the difference of 140mK when compared to the non filtered function as I had previously done.
As Pekka points out the filtered exponential function will get progressively further above the analytic F3 as the slope increases.
Insisting on the same filter being applied to all curves just adds another 14mK to the error.
Greg, since you’ve indicated a willingness to listen to Pekka on this point but not to me, I’ll save my breath. If Pekka deigns to respond, great, if not then there’s certainly no point in my doing so since you’ve assessed my IQ at below 50. The Cool Hand Luke quote has gotten too old to bear repeating.
Incidentally you mentioned you have tenure. Do you also have students?
Insisting on the same filter being applied to all curves just adds another 14mK to the error.
Greg, no one in the world has a clue what you mean by this, least of all you. You’re just spraying a 30-round clip of technical-sounding ammunition in the hope that one of the rounds might hit me. That approach to science won’t even get you an Ig Nobel Prize.
VP ” The Cool Hand Luke quote has gotten too old to bear repeating.”
Indeed, but this does not stop you mentioning it again does it?
Last time you posted it , it was you that needed the slap round the head you were implying and you ended up admitting you were wrong. Let’s see if you do any better this time.
VP: ” If Pekka deigns to respond, great, if not then there’s certainly no point in my doing so since you’ve assessed my IQ at below 50.”
I don’t think you have an IQ below 50, you are showing great imagination and creativity in the ways you find to avoid responding directly to this issue.
First time you summarily dismissed it “fallacious” but did not say why.
Second time you said you had missed it the first time, so clearly you did not even read it before dismissing it.
Third time, having asked for a link, you “forgot” to reply
Fourth time you avoid replying by going to the cinema again.
Don’t worry about the additional 14mK to the error, the main issue is the140mK divergence of your CO2 model that you are masking by distorting the exponential into to something totally different while pretending you are showing the residual of the exponential.
You seem to think you can just say the word “linearity” and the problem will go away. It will not. You use the linearity argument to say the defective filter implementation will affect both the analytical functions and the data “almost identically”. However the absolute numerical value of the distortion is far from “identical”. I have provided calculations showing they are not the same yet you chose to ignore the facts.
We have seen that your defective filter has the effect of stretching the data forward in time. Now look at what happens when you do that “identically” to an exponential rise and a flat line.
The exponential gets distorted downwards due to earlier lower values being plotted later. Pekka has shown that if you correct for this you get a result very close to both the unfiltered AGW model and the model filtered with a correctly applied F3_full().
If you stretch essentially flat data you will have essentially no downward distortion.
A form which is rising less than the exponential, like the last 25y of the data, will suffer a lesser absolute distortion.
So the effect on the residual is far from your assumption of “almost identical”. In fact it’s “almost 140mK”.
Pekka has shown that the improved F3_Pekka(AGW) is very close to AGW, which is also very close to F3_full(AGW).
Since SAW has no frequencies <22y and also nearly flat at the end that will not be notably affected by a correctly applied F3_full() NOR the F3_defective() used in the spreadsheet.
So what happens to the 140mK deviation between the proposed model AGW and the botched F3_defective(AGW) ?
Well it gets _incorrectly_ pushed into the lower frequency bands. Not because it is a short term (the true difference in filtered and unfiltered AGW is small as Pekka has shown) but because anything that is left from F3_defective() is what DEFINES what goes into in the lower bands.
If we look at figure 11 we can see where most of it ends up in SOL. It we look at figure 9 we see the result of exactly the same issues in the Hale and Dec filters means it gets pushed down further.
Despite the solar minimum being clearly over by 2010 we see TSI line
still plunging, not even slowing down. In fact we see some more slight of hand because that line goes off the chart. The graphic has been cropped to "hide the decline" in a physically unreal drop what is the final value of TSI? What is in $AD$212 ?
I will check later when I get to the machine with Excel. But its between -0.07 and -0.08 K. Hale plot line is also still falling in 2010 which is physically unrealistic.
So incorrect filtering is causing the exponential rise, that does not fit recent climate in recent years to end up being attributed to the Hale and TSI bands. Mostly it would seem , the latter.
No slight of hand; it seems Excel fails to plot TSI 2010 last point shown is 2009,0.0616 ; LO seems even less precise.
$AD$212=0.066
$AC$212=0.017
Well, far be it from me to cast aspersions but looking at sheet “9 Sol” that crates the graphic presented as figure 9 we can see that the y2 axis is explicitly defined to end at -0.06 hence truncating the downward plunge in the data.
One is lead ask whether a professor of such reknown would have made a similar error in a physics paper and cropped off the end of a significant down turn in that data.
It is interesting to note that it is the down turn in what is attributed to sol that absorbs the rise in AGW that is at odds with the surface data.
So Vaughn, first your attempt to repeat Wood’s greenhouse experiment ends in failure now your toy computer model of CO2 warming gets deservedly torn a new ashhole. Are you planning your next disaster du emeriti yet? Your fans can hardly wait. Maybe you should consider being an entertainer. That’s the only thing working for you so far.
” Maybe you should consider being an entertainer. That’s the only thing working for you so far.”
I’m sure his grandchildren love the bedtime stories, though I find it annoying rather than entertaining in a scientific debate.
I’d rather not consider the idea that’s he’s managed to reproduce and if he did then I’m going to go ahead and imagine that the apples fell far from the tree.
http://www.swpc.noaa.gov/SolarCycle/sunspot.gif
Pratt,
You need an exit strategy. This has gone on far too long. You are really looking foolish and dishonest. Your ducking, dodging, and lame attempts at rope-a-doping your friend Greg aren’t working for you. Why don’t you just declare that Greg is a tool of the oil industry, and be done with him?
Don Montford: You need an exit strategy.
His exit strategy is to try to refuse any criticism. He will now refuse to “talk” to me because if I don’t bow to his superiority complex and kneel down before him it is a waste of his time.
despite the fact I’ve taught him about filters he still thinks this is a one way process and he is here to “explain” to us, not to have his work questioned.
Initially I thought fig.3 was showing the model and filtered temperature, after all that is what it looks like. Once I noticed that the second line was claimed to represent an exponential CO2 model as well , I burst out laughing.
Then I went into the detail of how the so-called sawtooth was derived and realised it was a contrived excuse to remove anything that deviated from the exponential model , that rested on false claims of its “representing” ocean currents that are totally without substance. Then I realised we were being conned.
The circular logic is blatantly obvious to anyone who is not a IQ 50 moron. By his own claims, this excludes the author, so he must have realised this long ago.
That the saw tooth is caused by seismic activity at convenient times, for which he has NO physical evidence, is just the stuff of fairly tales.
It took me a while , due to the time wasted in pointless argument with Prof.Pratt, to realise where the obvious discrepancy between AGW and F3_defective(AGW) was going.
I spotted it earlier lurking in the TSI band.
The author presents this a proof that the recent flattening of temperature is totally due to decadal solar variations. Whereas in reality it is a consequence of his botched application of an otherwise good filter and his definition of that solar bands being that with gets past F3.
I have already posted that F3_defective(AGW) has an error that increases up to 156 mK at the end. I have also estimated the comparable error in F3_defective(DATA) is between -18 and +38 mK.
That leaves the remaining discrepancy being projected down into Hale , TSI bands. This is corroborated by the fact that the plunging TSI plot does not match the profile of any of the physical solar indices.
The current _post_ 2010 peak is turning out to be very weak. However the preceding minimum was not a plunging minimum as is depicted in TSI in figure 9 or SOL in figure 11.
It would seem that the author initially fooled himself. However, having made such a public presentation of it, he lacks the humility to admit it has serious problems.
Perhaps he could add that to his list of impossible things to do before breakfast for tomorrow.
Pratt,
You should have followed the sage advice of John S. and sought some help:
“As long as you cling to the premise that closely fitting a sharply low-passed version of HADCRUT3 (which fails many ex-ante validation tests as a geophysical signal) reveals something highly meaningful about the real world, you’ll remain unreachable. Even a white-noise series upon sufficient low-passing will exhibit quasi-sinusoidal behavior, which can be closely fit at the cardinal points over short stretches by FFT harmonics. Perhaps Emanuel Parzen, who used to teach at Stanford, can take the time to acquaint you with the intricacies of detection of real-world signals characterized by a continuous spectrum and with the pitfalls of ascribing significance to the lowest-order harmonics of short records.”
+1
Exit strategy: walk away.
It won’t work in knife fight and it doesn’t work in science.
Hav no expertise ter intervene here, but whenever did that stop
any one, say FACTS are sacrosanct. As David Springer says, ‘Write
that down.’ The visuionary.. ‘guesses,’ make us take the imaginative
llleap in the
dark,but ‘FACTS’ (Nature’s feedback,) are sacrosanct. or anything
goes (like the song,) dreams or reality? Modellers in cloud towers etc
Sorry about me bandaged fingers!!
Just a detail probably but Prof Pratt got the period of his filters wrong as well as messing up by running them into the buffers.
=OFFSET(MRFy, -Target, FiltCol4, 2*Target + 1, 1)
ie. width = 2*Target + 1
The 21 data points used by BoxFilter with a “target” of 10 defines a 20 year interval so the 21 year Hale frequency he was aiming to remove did not even match the filter.
The exact same formula also fails to get the other filters where they were supposed to be and so don’t match the sinc functions plotted in figure 5.
VP. ” Greg Goodman would be such a student. His approach to challenging the teacher is disruptive beyond all reasonable bounds.”
Sorry if you find being corrected when you screw up “disruptive” . Perhaps if you learnt a little humility and stopped imagining the rest of the world were you freshman students you may learn a thing or two yourself.
Like how to count once you run out of fingers and toes.
looking at this again the period from -10y to +10y is indeed 20y but each point is a 12m average so it could be said to extend 6m either side of 20y giving total of 21y.
However, the Hale “cycle” is not exactly 21y nor a pure sine function to targeting it so precisely does not remove all the solar signal.
Nicola Scafetta’s paper:”Empirical evidence for a celestial origin of the climate oscillations and its implications” which also used Hadley data and did detailed spectral analysis shows significant energy at 22y and beyond.
But since this method has been shown to fit zero CO2 warming just as well as Prof. Pratt’s 3K/doubling detecting the Hale component really does seem to matter.
Fiddle Factors.
One of the less obvious and undocumented features of this spreadsheet is the fiddle factor call FComp. The values used can be seen in $AB27:$AE27
[sourcecode]
FComp1 FComp2 FComp3 FComp4
1X 1.5X 1.5X 1.5X
[/sourcecode]
Having determined the defective F3 filtered result, it gets multiplied by 1.5 before being called HALEy : each element in the HALE column. Similarly for TSI and ENSO. These amplified values are then subtracted to calculate “residual” (RES2, RES3, RES4) for the next stage of the filtering.
So what is subtracted is NOT the filtered result but 1.5X the filtered result.
Now all the filter coefficients shown in the impulse responses table add to 1.0 so there should be no need to scale the results.
There is no mention or explanation of these fiddle factors in cell AB38, which explains the filters, nor anywhere else that I can see. The $NAMES sheet comments them as “filter compensation” , compensation for what?! They seem totally arbitrary and without justification.
So what effect do they have?
Simple, they scale up by 1.5 the size of what gets attributed to HALE , TSI and ENSO.
I have already noted how the progression of TSI in figure 9 is physically unrealistic in that it carries on plunging when the solar minimum was reached in 2008.
What this is doing is artificially exaggerating the fall in HALE and TSI to compensate for the increasing deviation of an unrealistic AGW model that does not match the climate record.
Since Prof Pratt is no longer replying to comments we will have to imagine what justification he may wish to present for these fiddle factors.
To sum up:
Vaughn Pratt is taken to school.
No film at eleven.
Cell AN38 gives more detail on the filters , including the comment “BIENNIAL is the residue (no ANNUAL thanks to Nyquist). ”
The annual signal was “removed” by taking the 12m average of the monthly data and sub-sampling every 12th point.
This is mathematically identical to using a 12m running mean as an anti-aliasing filter before sub-sampling.
The severe distortions in amplitude and phase from a simple running mean can be seem from the frequency plots in the spreadsheet and presented in figure 5.
Now while a 12m running mean will total remove a 12 sinusoidal function, it is totally incorrect to suggest that it will effectively remove sub-annual variation. It will not. Worse it will cause serious distortion to sub annual variations and those between 1 and 2y length.
The lack of correct anti-alias filtering before sub-sampling will mean that residual sub annual signal will be present, worse it will be distorted by the RM filter used and the subsequent sub sampling will cause these residuals to “alias” as longer periods in the result.
The preceding F3 filters will have effectively removed sub annual variations from the data, so what remains in the residual being called BIENNIAL will contain all the defects of poor anti-alias filter and the sub sampling.
This issue demonstrates, once again, the author’s lack of understanding of basic signal processing techniques.
LINEARITY.
The F3 filter is well designed in terms of the form of the frequency response but is only applied correctly in the central 110y of data. The 25y on each end are not filtered as intended. This is almost 1/3 of data.
The last 25y period is of particular interest since this is where the CO2 model diverges from reality so the incorrect implementation of the filter matters.
As Pekka has explained, in this period the ‘fitler’ is not longer a convolution filter since no longer has a fixed kernel. Neither is it a uniform transform, however it is still algebraically linear. This is also confirmed by the check column CK1.
This means that the numerical error introduced into F3(AGW) is equal to the error in F3(DATA-SAW)
Now since SAW was calculated to remove the deviation of the data from the model the latter term will have exactly the same long term rise as the exponential. This can also be seen in Pekka’s graphs where he corrected most of the error in the F3 filter. http://pirila.fi/energy/kuvat/VPmodif_2_3.jpg
So having distorted the data to rise at the same rate as the exponential AGW, both quantities have the same slope and are effected in the same way by the botched filter implementation.
However, since the real, unmodified data is much flatter, it will NOT be affected in the same.
This was my initial concern is seeing the AGW model being bent down to resemble the data. Similarly the distortion of the data by subtracting SAW bends the flat portion of the data up towards the exponential.
I initially, incorrectly attributed that to the filter being non-linear when I should have said non-uniform. The result is the same: the distortion to DATA is not the same as the distortion to AGW since they do not have the same rate of change in the last 25y.
sleight of hand not slight
Exaggerated CO2 “LAW”
From the poster:
“The two parameters in assumption 3 are computed directly from
the Keeling curve at 1975 and 2005, respectively 314 and 381
ppmv. By assumption 2 the corresponding excesses were 44 and 91
ppmv, hence doubling in 30/log2(91/44) = 28.6 years.”
From the spreadsheet:
“FIT CDIAC CO2 DATA AND KEELING CURVE”
So the reader is left with the impression that the CO2 model has been fitted to accepted datasets for CO2. However, the alert reader will notice that 314 and 381 cannot give residuals of 44 and 91 from any reference point, so what’s going on?
It turns out that 314 is the Mauna Loa CO2 from the beginning of the Keeling data in 1958 yet 44 is the residual from 1975; 378 is from 2005 and so 91 is residual relative to some time later. That value is not in the data supplied with the sheet.
This does not make any huge difference to the model but shows 1958 was considered then changed to 1975, without any reason being presented. The confused mess in these figures again showing sloppy work by Emeritus Professor Pratt.
So with “Keeling curve” data available at monthly resolution why pick just two points near each end? What about the middle? An how is this fitted to the CDIAC data which is not present ?
Examination of the CDIAC emissions data shows three distinct periods of growth 1960. Each of these periods can be fitted quite well with a simple exponential model but the growth rates (and hence the exp coeffs) are very different. So how is this mapped to one exponential function?
Answer: more fudging and slight of hand.
It is not possible to fit an exponential to Keeling that has a credible initial value of pre-industrial CO2 for the simple reason that the growth has been far from constant. However, if you only take two points and a base line CO2 level, it will always be possible to “fit” an exponential. However, whether the result has any useful physical interpretations is highly questionable.
Projecting the current high rate of growth back to 1800 with give an unrealistically low value because CO2 has not been increasing at the current rate since that time. Constraining the fit to have a reasonable base CO2 level will cause it to under-estimate almost all of the Keeling period then ramp up at a totally impossible rate once it crosses Keeling at the second forced fit point.
PAST AND FUTURE
TRENDS
The curves below show
past CO2 and business-as-
usual future CO2 on a log
time scale. Future is
simply the extrapolation of
SAW and AGW.
The resulting “model” has a fantastic rate of growth that does not match any of the data it is claimed to be derived from. Projecting such a badly constructed model out to 2100 as is shown in figure 7 is totally unjustifiable and wilfully misleading.
I think this says it all about Pratt’s poster.
Not to put too fine a point on it, of course. ;-)
“It’s worse than dead Jim, his brain’s missing”.
Thought the spreadsheet claims to use CDIAC emissions data, the data is not to be found and does not appear to be referenced anywhere, though it would seem that is was used in some way to estimate the pre-industrial level of 287ppmv this working is not included in the spreadsheet.
However, I already did a similar exercise two years ago and found three periods of exponential growth provided a good model for emissions of CO2 since 1750 as described above. The initial pre-1900 period is nearly flat when plotted on the scale of recent emissions. The three exponential model, and the data are shown scaled to fit Mauna Loa along with “Pratt’s Law”
Simply scaling emissions to concentration levels makes the underlying assumption that rise in atmospheric CO2 is primarily due to human emissions. Going along with that assumption how does Pratt’s Law of CO2 shape up?
http://i48.tinypic.com/snouvl.png
The post 1960 exponential is almost totally obscured by the MLO Keeling data and provides a very close model of this period.
The notable deviation of the single exponential Pratt’s Law model from the M.L data on which it claims to be based on, is evident. It only crosses the Keeling curve at the start and the end. It does not ‘fit’ the Keeling curve. In fact it shows a distinctly different curvature from the data on which is it supposed to be based.
Since the “forcing” effect of CO2 is often represented as a log of CO2 concentration and that is the basis of what is presented in the poster, a log plot is more relevant to this discussion.
http://i50.tinypic.com/2eq450n.png
Now we start to see how defective Pratt’s Law really is.
The difference of base levels is well within margin of error and does not represent an important difference in the models. However, it bears no resemblance to “business as usual” as it claimed to do.
Current “business as usual” is the exponential growth since 1960. That was shown in the first graph to be very close to exponential and well matched to the Keeling curve. Log of exponential is a straight line. Anything claiming to be “business as usual” must be essentially straight in the log plot.
Thus the rapidly rising log plot of Pratt’s Law can in no way be taken to represent “business as usual”.
It is hard to imagine someone who has spent their life in research and teaching of the hard physical sciences could fail to see how unsuitable such a model was.
Like John Lennon said to Dick Cavett “It’s not so hard to imagine, if you try, Dick”.
The hard part is zeroing in on exactly which imagined scenario is the right one. Fer instance, his PhD advisor is famous enough – Donald Knuth – so that a student could right his coattails into a tenured position at the same university. His CV says he had quintuple bypass surgery 20 years ago. That’s a long time on a heart-lung machine and those are infamous for causing cognitive impairment.
http://heartdisease.about.com/cs/bypasssurgery/a/pumphead.htm
Early onset senility is another. Hit in the head with a bag of quarters by a two bit hooker. Who knows.
Urgh. After the escalation in irrelevant ad homs in this end of thread, it will be difficult to find a more ignoble comment than David Springer | December 27, 2012 at 6:22 pm. But, hey, who knows.
That indeed was a disgusting comment by Springer. Too bad that this is such a rinky-dink comments area that Prof Pratt’s former students are out of the picture. Those are the people that can attest to his ability to educate on methods of logical problem solving.
Pingback: Climate Scientists’ Road to Hell | Digging in the Clay
Pingback: Climate Scientists’ Road to Hell | Watts Up With That?
This ‘Road to Hell’ is wonderful, available @ Verity Jones’ place or @ Watts Up.
==========
A fine piece of work. Rather unlike Vaughn’s poster in that regard.
We had guests for Christmas, obliging me to take a break from Climate Etc. for a week.
I was rather expecting this thread to have fallen silent in the meantime. I was therefore chuffed (tonyb and Latimer A. can explain) to find people pounding away in the meantime at my AGU poster, and I mean seriously pounding. Up the level 20 more dB and I could become another Michael Mann type celebrity (assuming that’s any fun).
It would appear to have hit a nerve, so much so that several people seem to feel that their cause would be seriously threatened were my IQ over 70. It is therefore paramount that they give cogent arguments as to why it is below 70, for example because undergoing heart surgery destroys one’s ability to think. (Damn, why didn’t my cardiologist mention that possibility two decades ago? How common is this side effect?)
The detailed mathematics offered in the past week’s analysis of my paper has overlooked a point I have made repeatedly:
ALL I CLAIM TO HAVE DONE IS GIVE ONE POSSIBLE ANALYSIS OF HADCRUT3 AS A SUM OF THREE TIME SERIES, MUL, SOL, AND DEC.
I asked if anyone had any plausible alternative analyses. So far only one single person in the entire four weeks since my post has offered one, namely Mike Rossander. I have commended Mike for doing so, both on Climate Etc. and on WUWT where he first posted his analysis. Mike in his response and to his credit has been gracious, polite, and understanding in his assessment of the status of his analysis.
I would encourage those who’ve spent the last week complaining about esoteric and totally irrelevant details of my spreadsheet to see if they can improve on Mike’s alternative analysis of HadCRUT3, not just in being gracious, polite, and understanding but going beyond that and offering a scientifically meaningful analysis of HadCRUT3 as a sum of time series that demonstrate whatever point it is that they’d like to make.
Those unable to improve on an incompetent analysis are even less competent. Now that you’ve set yourself such a low bar, let’s see you clear it!
Vaughan
Thanks for the name check. ‘Chuffed’ is a lovely old fashioned English slang phrase which has taken on a new lease of life recently.
Here is an urban dictionary of English slang.
http://www.urbandictionary.com/define.php?term=chuffed
Previously the word ‘chuffed’ was associated with steam engines-highly appropriae for a thread on climate change. Both G S Callendar and the current head of the IPCC were involved in steam engineering and all its co2 connotations.
In that respect ‘the steam engine chuffed laboriously up the incline to the station’ would be appropriate.
Vaughan is using the word however in the sense that he is pleased or proud of himself. (buy ‘chuffed’ souvenirs including mugs from the site)
Vaughan has every reason to be chuffed, having produced such a long lasting thread that he has conducted with such good grace. A very happy New year to him
tonyb
(Damn, why didn’t my cardiologist mention that possibility two decades ago?)
Actually the article talks about just that. You know too much to have bothered to click on it of course. ROFLMAO
Vaughan Pratt
It appears that, rested up from the holiday festivities, you are now “tossing the gauntlet out” to those who believe their IQ exceeds 70 to challenge your multidecadal CO2 temperature analysis.
Not being a statistician, I will readily admit that I could find absolutely no fault with the past analysis (once you satisfactorily cleared up a few skeptical questions).
My only remaining skepticism had to do with the use of this simple correlation for predicting the future “to within a millikelvin”: namely, that the correlation ignored two real constraints on future atmospheric CO2 increase, from human emissions upon which the entire correlation is based.
These are
– and dramatic changes in the rate of growth of human population (the “generators” of the human emissions)
– an upper limit to the amount of carbon contained in all the fossil fuels remaining on our planet
If these two constraints are factored into your correlation, the temperature by 2100 arguably comes out around 2,000 millikelvin lower than your analysis would show.
Therefore, it would seem to be prudent to, at least, address these constraints, if nothing more by mentioning them and their likely impact on the temperature projection by 2100.
Thanks for allowing me to re-open the discussion to a point that was never adequately debated.
Max.
“Those unable to improve on an incompetent analysis are even less competent. Now that you’ve set yourself such a low bar, let’s see you clear it!”
No analysis is better than a bogus analysis. Therefore simply deep sixing yours is an improvement. Not much challenge in that. Nor much fun either. It took you how long to produce this piece of garbage, a year? Rossander made it look stupid in an hour. Ya gotta love that.
Vaughan Pratt | December 28, 2012 at 2:28 am | Reply
“Up the level 20 more dB and I could become another Michael Mann type celebrity (assuming that’s any fun).”
Writing something significant in your field instead of demonstrating your ignorance in climate and statistics might even make you more than a pimple on the ass of Donald Knuth. He must be very disappointed that none of his doctoral students amounted to anything.
I suppose all the attention this is getting is because it’s a top notch example of my initial reaction which I illustrated with quotes:
There are three kinds of lies. Lies, damned lies, and statistics. ~ Disraeli
With four parameters I can fit an elephant and with five I can make him wiggle his trunk. ~Von Neuman
Then the truly hilarious thing. A guy familiar with Excel spends an hour to reparameterize your filters to get an even *better* fit with ZERO CO2 sensitivity. So the Sky Dragon nonsense is supported equally well by your wonderful (I really mean that, it’s a brilliant lie) spreadsheet.
There’s a popular expression Vaughn that goes “A theory that explains everything explains nothing”.
I suppose it’s popular because it’s like a mini-cosm of global circulation models. This whole AGW facade is built in the same manner. A tweak here and a tweak there and pretty soon you’re talking to von Neuman’s elephant and he looks real at first blush but he’s really an illusion on closer examination.
No exit. Egods, regrets.
============
Horse manure, “Black Swans” and climate projections
Let’s “beat this dog to death”, Vaughan.
“In 1898, delegates from across the globe gathered in New York City for the world’s first international urban planning conference. One topic dominated the discussion. It was not housing, land use, economic development, or infrastructure. The delegates were driven to desperation by horse manure. The horse was no newcomer on the urban scene. But by the late 1800s, the problem of horse pollution had reached unprecedented heights. The growth in the horse population was outstripping even the rapid rise in the number of human city dwellers.”
http://www.uctc.net/access/30/Access%2030%20-%2002%20-%20Horse%20Power.pdf
“In 1894, the Times of London estimated that by 1950 every street in the city would be buried nine feet deep in horse manure.
One New York prognosticator of the 1890s concluded that by 1930 the horse droppings would rise to Manhattan’s third-story windows.”
Today’s statistical calculation methods and tools did not yet exist, yet these were all projections made based on the best knowledge of the time (late 19thC). And there were apparently real concerns all over the world about anthropogenic pollution from horse manure (APHM) – real enough to hold a global APHM conference (like Kyoto) to deliberate about how to address this potential future threat.
Although the internal combustion engine had been invented a few decades earlier, the prognosticators did not foresee the rapid replacement of horse carriages with the automobile.
As we know today, the “Black Swan” (that was already waiting in the wings in the 1890s) made all the projections as worthless as the horse manure itself.
—————————————————————————-
Now we shift 130 years to the present.
Again, statistical calculations are made. But, this time, it’s not about horse manure, but about human CO2 from all those internal combustion engines that saved the day plus from electrical power generation that helped make life better and longer for humans than it was back in the days of kerosene lamps and wood-burning potbellied stoves.
This CO2 is believed to be a significant cause of the recent warming, which has been observed for several decades.
And here we have a brilliant scientist, tying past climate changes to one factor alone: human CO2 emissions, by statistically eliminating all other known possible factors as “background noise”.
He makes one fatal error, however.
As a second step, he uses the correlation between CO2 emissions and temperature, which he has established, to project CO2 and warming far into the future, to the year 2100. He then implies that his projection is accurate to one-thousandth of a degree C.
Others, who are better qualified to judge the statistical approach of step 1, can do so.
I can only see that he has made the basic “horse manure” error of the earlier planners.
There are many estimates of future human population growth, but they all agree that the rapid growth of the 20th century is over. Most agree that we will see a growth from today’s 7 billion to 10 to 10.5 billion by 2100, which would represent a growth rate of one-fourth that seen in the second half of the 20th century (when the CO2 emissions grew exponentially).
Remember, these are the human beings that are generating all that CO2 that is allegedly causing the warming.
Just like the internal combustion engine (the “Black Swan” in the 1890s) was already hiding in the wings, so is the expected sharp slowdown in future population growth there today (today’s “Black Swan”).
Ignoring a “Black Swan” that has not yet signaled its appearance, when making a projection for the future, can be excused.
But ignoring one that is already staring you in the face is inexcusable.
Max
The excess atmospheric concentration of CO2 is all signal, with virtually no noise content.
Watch that value increase according to theoretical predictions as we continue to burn fossil fuels.
The No Regrets policy is to migrate away from fossil fuels.
Somebody in the administration told the previously opaque EIA to meet with analysts that have no agenda other than doing the bean counting correctly:
http://www.platts.com/RSSFeedDetailedNews/RSSFeed/Oil/7375088
The EIA operates outside of the peer-reviewed scientific research process.
They can issue reports with little to no provenance and no individual authorship accountability.
The ASPO should suggest to the EIA to publish at least a review article to some peer-reviewed journal.
At least the IPCC builds on a peer-reviewed foundation. Not the US Energy Information Administration, however.
Hide the decline at all costs.
WHT
I’m sure you will agree that future human CO2 emissions will in some way be linked to future human population growth rates, i.e. if population grows rapidly humans will emit more CO2 in the future than if population grows slowly..
And I’m sure you will also agree that humans cannot emit more CO2 from fossil fuel combustion than there is carbon in all the remaining fossil fuel resources on Earth.
That is the point I am making to Vaughan Pratt – and it is my critique of his CO2 temperature projection to year 2100.
As far as the accuracy of the WEC 2010 estimate that we still have 85% of all the fossil fuel reserves that were ever on our planet, I have seen less optimistic estimates (Hubbert, etc.), but none that are more optimistic, so I see this as sort of a upper limit.
But, hey, if you have better info, by all means bring it out.
I’m always ready to learn new things.
Max
WHT, could your impulse response model be introduced into the spread sheet in place of the totally inappropriate and incompetently fitted single exponential? That kind of approach seems a lot more realistic to me.
Would the delay introduced by your impulse response account for Hansen’s supposed “pipeline” effect?
I am a fan of doing the complete systems approach, sure.
Transient diffusional responses in the temporal domain always have these long tails. Because the physics relies on similar master equations, both heat diffusion and particle diffusion (CO2 sequestering) will give the appearance of a 50% pipeline effect.
The excess CO2 hanging around is 50% of that burned, while Hansen’s thermal pipeline is also at 50%.
This is Fickian random walk in action, clearly seen in Hansen’s classic 1981 paper.
Thanks for the reply. Yes, it seems Hansen was capable of producing some useful science in his prime, before he decided to compromise his objectivity to play naive politics.
The whole of climate science seriously needs some proper system analysis.
You say the 50% ties in with Hansen, which is interesting. My question was more specifically about the delay. Can your impulse response be characterised by a typical delay time, similar to the fixed offset of 19y that VP is fitting here?
Presumably, in view of the nature of the response, this would be a kind of 1/e type time constant rather than a fixed period but could some number be put on it , that would remain reasonably constant over the whole period, despite the change in amplitude and rate of growth?
@manacker: And I’m sure you will also agree that humans cannot emit more CO2 from fossil fuel combustion than there is carbon in all the remaining fossil fuel resources on Earth.
Certainly, Max, but what’s to stop them from turning to renewable biofuels once they’ve exhausted the world’s nonrenewable fossil fuels? Biofuels are just as good at emitting CO2.
In principle there is enough carbon on Earth to duplicate Venus’s atmosphere, at least in mass (to within a factor of two since Earth’s total carbon is harder to estimate precisely than Venus’s) if not in temperature (Earth intercepts only half the solar irradiance Venus does). At the present rate that could take a very long time, but any prediction based on the present rate is meaningless given that it is much greater than it was even a mere half a century ago.
According to the CDIAC, the demand for carbon-based fuels has been doubling every 30 years or so over the past century. There is speculation that this rate will slow based on extrapolation of population, peak oil and gas, etc., and that may well be, but it is interesting nonetheless to calculate when the mass of Earth’s atmosphere will equal that of Venus if it doesn’t.
Arguments that most of Earth’s carbon is definitely beyond the reach of humans may be valid for the 22nd century, but become unconvincing beyond then: (a) the future is hard to predict, and (b) advancing human technology is a two-edged sword.
Incidentally I appreciate both your good humour and your focus on the big picture, Max. I’m finding it increasingly difficult lately to make the considerable investment of time required to respond to those who lack both.
Vaughan, I am sure that you appreciate that ideal biofuels are net zero emitters due to their growth taking in CO2. However, yes, current biofuels are dirty because fossil fuels are used in the process of getting them ready for use. However, I do believe that fossil fuel resources we haven’t dreamed of yet will become usable by the end of the century and the 30-year doubling will be maintainable up to 2100 resulting in 1000 ppm CO2e if there is no pull back from recovering these resources. Look at methyl clathrates, for example. These are available in cold-water coastal zones and apparently only need warming up a little to extract the methane.
VP:”I would encourage those who’ve spent the last week complaining about esoteric and totally irrelevant details of my spreadsheet to see if they can improve on Mike’s alternative analysis of HadCRUT3, ”
How many times does the same point have to be proven? An equally good result can be obtained with ZERO AGW. I see no point in duplicating that result.
Perhaps in stead of evasive generalities you could make some comment that explicitly refers to what someone _actually_ wrote. Explain why you consider pointing out that the AGW function that is at the heart of your so-called analysis is a totally unsuitable model is “esoteric and totally irrelevant”.
Is fitting an exponential to the post 1960 CO2 rise shown in the MLO too esoteric for you?
Maybe you could answer as to why you chose to fit just two points of the monthly data of the Keeling curve you adopt to represent recent CO2 rise and allowed it to deviate systematically for the rest of that period.
Perhaps you could explain why having NOT fitted your model to the available data you pretend that projecting it out to 2100 represents “business as usual”.
You constantly complain that your IQ is being underestimated, yet there are only two explanations I can see for proposing that your model represents “business as usual”: either you are incompetent or you are being deceitful.
Which is it Professor?
Maybe he needs some time to digest. As far as IQ is concerned a little over 40% of people put on heart-lung machines, according to this study by Duke published in New England Journal of Medicine in 2003. Pratt’s surgeon in the early 1990’s probably didn’t know as the syndrome was, at best back then, country club locker room gossip.
http://heartdisease.about.com/cs/bypasssurgery/a/pumphead.htm
5 years later 42% of bypass patients had “significant” cognitive impairment. Significant was defined as at least a 20% decrease in test scores. Now if someone goes into the operation with an IQ of 150 (high genius) he’s still likely to be eligle for Mensa (IQ 125+) coming out the other side but he ain’t going to be the genius he once was.
The reason I happen to know about this is people were wondering about Bill Clinton who didn’t seem like the same guy post-bypass surgery in 2004.
http://www.drmcdougall.com/misc/2008other/080412clinton.htm
That is interesting, I’d never heard of this problem before. A well kept medical secret.
Whatever the cause, bypass surgery or simply age catching up with us, once we get past the age of forty we all need to recognise that we need to reassess our abilities. Our senses fade, reactions slow and mental faculties loose their edge. Sadly, some are harder hit than others.
This whole presentation is riddled with logical and methodological errors that one would not expect from with Prof. Pratt’s academic record.
Instead of his condescending attitude and disingenuous attempts to paper over the cracks later, he would do well to reassess his own capabilities and check his work before going public with it.
greg goodman | December 29, 2012 at 2:32 am |
“Instead of his condescending attitude and disingenuous attempts to paper over the cracks later, he would do well to reassess his own capabilities and check his work before going public with it.”
That’s good advice for a lot of golfers I know. Maybe they just do it for the fun of it.
there are only two explanations I can see for proposing that your model represents “business as usual”: either you are incompetent or you are being deceitful.
With remarks like yours, not to mention those of Mike Jonas and David Springer, it is ironic that denizens of this blog would complain that scientists posting here don’t stick around to field comments. Presumably the denizens here imagine that scientists debate points with each other in the manner of a bar-room brawl. While it true that scientific debate can become heated, there is a level in tone below which a scientist is automatically disqualified as not arguing in good faith.
@GG: How many times does the same point have to be proven? An equally good result can be obtained with ZERO AGW. I see no point in duplicating that result.
We are evidently at an impasse on “equally good.” As I’ve pointed out repeatedly, replacing my three AGW parameters with seven additional shape parameters constitutes quite enough overfitting to disqualify the Rossander model as “equally good.” And as I’ve pointed out in my response to Mike Jonas, 99.992% is not much of an improvement over 99.99% if with nothing but a little more precision in estimating my original parameters 99.997% is easily achieved.
Had I realized anyone would seriously object to my model on the ground that an R2 of 99.99% could be improved on with an additional 0.002% by using a grossly overfitted model I would not have stopped fitting at an R2 of 99.99%. (The poster incidentally conservatively claimed only 99.98%; I had not expected this to turn into a race.) I would be interested to see whether Rossander can as easily achieve 99.997% with small adjustments to his overfitted model, whose ten independent shape parameters (I needed only 3) make it simply a bunch of sine waves that could just as well have been obtained using a Fourier transform.
Perhaps in stead of evasive generalities
Since you’ve been evading my responses I would level that charge at you. Accusing me of “evasive generalities” is just one of your own many evasive generalities. Mike Jonas does the same when he characterizes my (evidently failed) attempts at explaining parameter estimation to him as a “long rambling jumble of nonsense.” “Magic” (as per Arthur C. Clarke) would be more polite.
Explain why you consider pointing out that the AGW function that is at the heart of your so-called analysis is a totally unsuitable model is “esoteric and totally irrelevant”.
My apologies, a retraction is in order. I retract “and” and replace it with “or”. I should also have given a more complete list of the problems with your objections: in this case your “totally unsuitable” is contradicted by three papers: Arrhenius’s 1896 paper proposing a logarithmic dependence of surface temperature on CO2, Hansen et al’s 1985 paper pointing out that the time needed to warm the oceanic mixed layer would delay the impact of global warming, and Hofmann et al’s 2009 paper modeling the dependence of CO2 on time as a raised exponential. Since the formula I referred to as the “Arrhenius-Hofmann-Hansen” law is constructed from those three principles alone, with nothing extraneous, the ball is now in your court to demonstrate that the formula is “totally unsuitable.” Are you suggesting science has no formula at all for the impact of rising CO2 on temperature, or that you have a better one. If the latter please provide it.
Is fitting an exponential to the post 1960 CO2 rise shown in the MLO too esoteric for you?
I’m not sure what you’re referring to here, but if you mean the exponential fit that Max Manacker insists on using then that’s too inaccurate by an order of magnitude compared to the quality of fit obtained with Hofmann et al’s raised-exponential fit in their 2009 paper. Why do you want to replace an accurate fit with such an inaccurate one?
Maybe you could answer as to why you chose to fit just two points of the monthly data of the Keeling curve you adopt to represent recent CO2 rise and allowed it to deviate systematically for the rest of that period.
The “deviation” you complain about lies within the annual deviations of the MLO itself, and is an order of magnitude smaller than what it would be with Max’s exponential model, which falls far outside the MLO’s annual deviations, as I’ve pointed out to Max on numerous occasions. This accuracy is what makes the Hofmann et al raised exponential model entirely suitable for this purpose. However my analysis would have not changed appreciably had the Mauna Loa observatory never been built, obliging us to fall back on the CDIAC estimations of CO2 emissions and land use changes discounted 55% for nature’s efforts at cleaning up our emissions.
There is the further point that although I use the MLO data as part of the parameter estimation, I do not judge whether the model is a good fit to HadCRUT3 in terms of the MLO data but in terms of its quality of fit to HadCRUT3, for which I consider an R2 of 99.99% a good fit and 99.997% after making some very small changes to my parameters an even better one.
Perhaps you could explain why having NOT fitted your model to the available data you pretend that projecting it out to 2100 represents “business as usual”.
All I claim is that my model is an excellent fit to HadCRUT3. This is demonstrated with the obtained R2. Although the Hofmann law is an excellent fit to the Keeling curve, contrary to your claim, the quality of that fit does not enter into the computation of R2 when assessing the fit of my model to HadCRUT3.
However much too much time has been wasted on this thread by attention to details of the poster that my conclusions do not depend on. Hence for the purposes of this thread I am more than happy to retract both the panel at lower left plotting CO2 from 4 MYA to 2100 and the whole of the right column. This will allow us to focus on my conclusions, which so far no one has supplied any reason for me to retract that I haven’t already responded to. Please respond directly to my responses, otherwise people may begin to think the obduracy is at your end. That’s certainly how it looks to me.
That level was reached and breached without slowing down a couple of weeks back. Things definitely have not improved since that time…oh, the hilarity of GG et al. lurking about, “Where is he?” ” Has he shown up yet?” ” Uh, I tell you man, he afraid of us.” “Yeah, Yeah! He must be afraid of us.”
This sort of dialog has worn thin and in the past couple of days has reached a particularly low point. Please be advised that people who have cared for heart patients who have suffered such damage were painfully aware of effects on mental functioning well before the study came out. It is not a recommended viewing. Your contextual use of the heart-lung machine to slur isn’t clever. But it is repugnant. Nor does it appear to be supported by evidence presented on this blog.
@GG et al. A demand for a retraction? Get real!!! It was an AGU poster; it was presented on the blog in an open manner; there has been extra-ordinary effort to follow-up often ignoring scurrilous aspects in many comments; and there are no guarantees in life. The fact that Dr. Pratt posted and invited comments does not mean your are entitled to life-time follow-up service. You are not owed a thing. Questions not answered? I would recommend adopting a more civil approach or better yet take it off-blog where you will not be tempted to look for ‘pretty’ snark points for the cause. You claim to be serious but your manner betrays you.
Thanks, mwgrant. With the obvious conflict of interest I had recused myself from making your point. Now that someone else has made it I feel comfortable withdrawing from what I’ve been unable to distinguish from a midnight brawl between unruly teenagers. While serious debate can be productive, this has been neither.
I also appreciate the support of Pekka, Jim D, WHT, and others who have had the same difficulty as me in understanding the complaints of Goodman, Jason, Springer, and others. The latter’s preference for an analysis that hindcasts terribly using all ten of my shape parameters over one that hindcasts well using only three of them plus the three AGW parameters continues to mystify me. And Stephen Mosher’s comment was one of the first to appreciate the subtle point that an R2 of 99.98% (now up to 99.997%) was meaningful when fitting to a curve drawn at random from a 14 dimensional space using only 9 parameters.
Since I’m at least half to blame for the existence of this thread (though not entirely as I would not have posted here without Judy’s persistence in asking me to post my analysis) I probably owe the thread a summary of my perspective on the outcome up to this point. I realize there are still some unsatisfied enquiring minds out there, but we’re now past week 4 and I got the feeling that all the satisfying that was going to happen (if ever) had happened by the end of week 1.
Vaughan Pratt | December 29, 2012 at 12:12 pm | Reply
“While it true that scientific debate can become heated, there is a level in tone below which a scientist is automatically disqualified as not arguing in good faith.”
Pansy. Cloistered academic pansy. If you can’t take the heat get out of the kitchen.
A pansy with a double standard by the way.
You need me to start quoting from Climategate the behaviors of your colleagues when they think no outsiders are listening?
Let’s start with Ben Santer:
“Next time I see Pat Michaels at a scientific meeting, I’ll be tempted to beat the crap out of him. Very tempted.”
Is that how science works now? If you can’t prove something by experiment you beat the crap out of anyone who brings attention to your failure? Nice. Real nice.
The only difference between Santer the scientist and the blog denizens you castigate here is that we aren’t two faced saying one thing in private and another in public. You ought to try that sometime you hypocritical piece of white academic trash.
Speaking of Pat Michaels, here’s the middle of an exchange between Pat and Vaughan:
http://judithcurry.com/2010/11/18/michaels-controversial-testimony/#comment-12896
This was one of the first thread where Vaughan commented, I believe.
Pat Michaels still owes an answer somewhere else in that thread, btw.
I trust that everyone enjoyed their Christmas, and that the New Year lives up to their hopes and expectations – well, most of the hopes and expectations anyway.
IMHO the reason that this thread has lasted so long and received so many comments is that Vaughan Pratt has posted a contentious document and then (a) studiously ignored all information that shows it to be a dud, and (b) continued to throw out irrelevant challenges.
My initial detailed criticism (http://judithcurry.com/2012/12/04/multidecadal-climate-to-within-a-millikelvin/#comment-276275) should have been sufficient to make VP retract, or at the very least reconsider. There was no reply to that from VP either here or on WUWT. When I addressed VP’s “NAT+HUM” idea (http://judithcurry.com/2012/12/04/multidecadal-climate-to-within-a-millikelvin/#comment-276324) there was again no reply by VP. When I provided a “simple summary” of what was wrong, I did at least get a reply from VP, but it avoided the point (“The “emperor has no clothes” gambit. Oh, well played, Mike. Mate in one, how could I have overlooked that? ;)”) and then went into a rambling obfuscation. When I referred to Mike Rossander’s calculation (http://judithcurry.com/2012/12/04/multidecadal-climate-to-within-a-millikelvin/#comment-277044), again there was no reply from VP.
And so it has gone on for over 3 weeks – and not just me of course as others have been pointing out errors too.
But the absolute killer was Mike Rossander’s calculation. There should have been no need for MR to do this, as the fundamental errors in VP’s post were already crystal clear. But since VP was obfuscating, what MR did was invaluable. What MR did was to show that VP’s calculations were equally valid with NO CO2 forcing at all. Thus VP’s argument was destroyed.
Let me remind you of what that argument was:
“The hypothesis then is that multidecadal climate has only two significant components: the sawtooth, whatever its origins, and warming that can be accounted for 99.98% by the AHH law […]”.
Following MR’s calculation, the situation was that VP’s exact same sawtooth method was shown to give exact same support to the negation of the hypothesis, that is, that multidecadal climate has only one significant component, the sawtooth, with no warming at all from AHH law.
Consequently, VP is left with no support at all for his original hypothesis.
This thread has gone on for far too long, thanks to VP’s utterly obdurate and truly unscientific approach. It’s time for VP to let go.
Let me respond to Mike Jonas, who seems particularly concerned that I’ve been ignoring him all along. If he still feels that way after the trouble I’ve gone to below to disprove this, I can at least satisfy him on that score by ignoring him from here on.
My initial detailed criticism (http://judithcurry.com/2012/12/04/multidecadal-climate-to-within-a-millikelvin/#comment-276275) should have been sufficient to make VP retract, or at the very least reconsider. There was no reply to that from VP either here or on WUWT.
Mike’s first sentence here is the “since I’m right and you’re wrong you must retract” argument. With equal logic I could complain that since I’m right and Mike is wrong he should withdraw his objections. Mike’s errors are just as obvious to me as mine are to him.
Mike’s second sentence is easily refuted by my many responses here to the various objections he’s raised here and repeated at WUWT, specifically my responses directed to him
here,
here,
here,
here, and
here.
Mike also repeated Greg Goodman’s objection that my speculative column on the far right of my poster was vague about ocean oscillations, to which I responded here with pointers to a large body of literature on ocean oscillations that were just as vague. For example Mantua and Hare in their 2002 paper “The Pacific Decadal Oscillation” write “While 20th Century PDO fluctuations were most energetic in two general periodicities—one from 15-to-25 years, and the other from 50-to-70 years—the mechanisms causing PDO variability remain unclear.” Mike’s and Greg’s impression that the PDO is a well-understood and sharply defined phenomenon could not be further from the truth.
Judging by the title of his WUWT post, Mike’s main objection would appear to be that I was using circular logic. I pointed out that I was fitting a model to data to determine its parameters. This is a very standard procedure that can easily look like circular logic to those who’ve never had to fit a model to data themselves. Yet Mike continues to object that parameter estimation is circular logic, for example where he says “No, you used the formula, but picked parameters to match the temperature. Those parameters included at least a time-delay and an arbitrary number for climate sensitivity.” This shows a complete lack of understanding of the process of parameter estimation by least-squares fitting. To Mike this process, at least as I tried to explain it to him, is nothing but a “long and rambling jumble of nonsense.”
His other main objection is the much more substantive one that Mike Rossander’s fit of 99.992% with zero sensitivity proves that anything can be proved using my approach. Since this point was a new one, and moreover was the best response to date to my challenge to improve on my analysis of MUL as a sum of curves, I responded on WUWT where Mike R had originally commented. I pointed out there that to get to 99.992% without help from the AGW curve, Mike R. had to put all 10 shape parameters into play independently when I was only using 3 independent shape parameters. Since that raises the number of coefficients to that of the dimensions in the image of F3 this could have been foreseen by Fourier in 1820, as I pointed out and as Mike J. has studiously ignored ever since. Moreover Mike R. had to use considerably more precision in the parameters than I was using in order to reach 99.992%.
It hadn’t occurred to me that people would seriously consider 99.992% better than 99.99%, which is where I stopped when adjusting the sliders manually, thinking that should be “good enough.” So I put a bit more effort into getting a really good fit, without introducing even one new shape parameter let alone 7, and using at most one more digit of precision when it helped, not the several Mike R. used.
I was easily able to reach an R2 of 99.997% using the following parameters (in the natural units shown on row 24 rather than the slider units on row 26):
SAWTOOTH PARAMETERS
ToothW 152 years (i.e. period tau)
Trigger 1924.5 AD
Amplitude: 0.177 degrees C
SHAPE PARAMETERS
Scale4 0.14 X
Scale5 0.55 X
tShift4/5 0.025 tau (1/40 of a period)
CO2 ACCUMULATION PARAMETERS
Delay 14.4 years
NatCO2 287.4 ppmv
AGW PARAMETER
Climate sensitivity: 2.86 degrees C/doubling
Resulting R2:
99.997%
You can easily verify this for yourself with a few clicks on the sliders.
So I can’t say I find an argument based on cranking up 99.99% to 99.992% terribly compelling when 99.997% is achievable without either extra parameters or more than one extra digit of precision in the parameters.
This fit does however result in the standard deviation over the period 1860-2000 being 1.44 mK. My title was based on the period only up to 1950, whose standard deviation with my original parameters was 0.544 mK,. Pekka, John S, and others have persuaded me in the meantime that a century is too short a period to be meaningful. I would therefore stick to the larger period 1860-2000 and retract “millikelvin” in favor of “millikelvins.” (Mike R’s fit has a standard deviation of 2.2 mK for 1860-2000.)
(Regarding 1860-2000 rather than 1850-2010, I have never considered the first and last decade as meaningful when talking about multidecadal climate; in fact I demonstrated this statistically on a climate blog in February 2010, some 18 months before Santer et al made a similar point in their paper on that topic.)
One objection that several people besides Mike J. have raised is that SAW is not the totality of ocean oscillations. This is one of the many strawman arguments leveled against my poster. Here’s the conclusion of my poster in its entirety:
“We infer from this analysis that the only significant contributors to
modern multidecadal climate are SAW and AGW, plus a miniscule
amount from MRES after 1950.
Whether SAW describes a single phenomenon or several is an
excellent question, see our speculation on the right. What we can
say is that the three curves in the figure to the upper left give one
plausible account of multidecadal climate, MUL, since 1850. This
in turn leads to the analysis shown at lower left, namely
HadCRUT3 = MUL + SOL + DEC.
We are unaware of other analyses claiming millikelvin precision.”
Note the complete absence of any mention of “ocean oscillations” in the conclusion. The “speculation” referred to, which mentions ocean oscillations in general but neither AMO nor PDO in particular, is just that and no more. There may well be other explanations of SAW. One explanation that should appeal here is that SAW is merely a hallucination and that the whole of MUL is a purely natural phenomenon having no connection whatsoever with increasing CO2 emissions.
Although I’ve previously addressed Mike J’s objection at WUWT concerning ocean oscillations (as noted above in this comment), Mike is correct that I did not address his claim at WUWT “This shows that the sawtooths have been carefully manipulated to “reserve” the 1970-2000 temperature increase for AGW,” for which my apologies. But again this shows his lack of understanding of parameter estimation: any “careful manipulation” of the parameters has been done by HadCRUT3 itself, which alone is responsible for how the nine parameters found their way to a least-squares fit.
With the seven additional parameters opened up by Mike R’s analysis of MUL it becomes possible to find a least-squares fit that makes the oscillations bend up in the last three decades without invoking CO2 (albeit very artificially as Pekka has noted). However as David Springer keeps reminding us, the more parameters the less meaningful the model, and on that basis I would say any model as overfitted as Mike R’s is not terribly meaningful.
Regarding the last sentence of my conclusion, “We are unaware…,” that was true (as far as anyone here seems to be aware) at the time I wrote it. Since then we have Mike R’s analysis as a sum of independent sine waves (effectively obtainable by Fourier analysis) with its standard deviation of 2.2 mK. So now there are two descriptions of MUL. I am not at all surprised to find climate skeptics preferring Mike’s description over mine, given that mine tries to fit the current understanding of the impact of rising CO2 on temperature to the data while Mike’s uses gross overfitting to show that one does not need CO2 to explain recent global warming.
To summarize, my previous many responses in this thread to Mike J’s objections to my poster would seem to undermine his claim that I’ve been ignoring them. My own diagnosis is that the problem would seem to lie with Mike, who still appears not to understand either the point of parameter estimation or how it works, instead dismissing it as nothing but a “jumble of nonsense.” This may well be my fault for not explaining the concept sufficiently clearly, but in that case there are plenty of other places where he can read about it.
VP: Mike also repeated Greg Goodman’s objection that my speculative column on the far right of my poster was vague about ocean oscillations
…. The “speculation” referred to, which mentions ocean oscillations in general but neither AMO nor PDO in particular, is just that and no more.
I did not specify the far right column of your poster, this is in your cover sheet at agu.org where is does specify AMO by name.
http://fallmeeting.agu.org/2012/eposters/eposter/gc23c-1085/
“The second and third harmonics correlate well with the principal ocean oscillations, e.g. AMO”
I questioned this specifically saying it did not match either 50 or 75y , you replied with more vague bullshit about AM that neither proved anything nor was specific enough to be a testable claim. Then you brought in PDO by name, which you were equally unable to back up.
VP :Mike’s and Greg’s impression that the PDO is a well-understood and sharply defined phenomenon could not be further from the truth.
More lies. I did not say PDO “is a well-understood and sharply defined phenomenon ” , you are putting words into my mouth and then claiming I am wrong. Incredible.
It is you who is claiming the 50 and 75y cycles you are fitting represent ocean oscillations:
>>
In any event the former seems to correspond to the AMO and the latter to what some authors call the PDO and others the PMO
>>
Poster:
THE QUASISAWTOOTH
We unify all multidecadal ocean
oscillations as a single phenomenon,
namely a sawtooth. The n-th harmonic…
That says nothing about what I may consider AMO and PDO to be, it is you that named them in a failed attempt to justify removing any deviation from your model.
I challenged you to back up that claim and you can not.
There is nothing to retract *from*. An AGU poster, and a blog article for that matter, is no more than the proverbial “Run it up the flagpole and see if anyone salutes.”
No one saluted. If your poster was worth a tinker’s dam it would be in Nature not Judy Curry’s blog. I’d say “Oh how the mighty have fallen” but in your case never being more than a pimple on Donald Knuth’s butt is neither mighty nor a great distance to fall from. LOL
Vaughan Pratt
If I understood Mike Rossander’s calculation as cited by Mike Jonas above, it shows that your poster linking human CO2 emissions to multidecadal climate in the past record does not hold water statistically.
Likewise, I have suggested that your future projection, which ignores constraints on population growth and total carbon content in fossil fuels. also makes no sense.
So it looks to me like your analysis is DOA, Vaughan, unless you want to try emergency resuscitation.
Of course, it’s up to you.
Max
“Likewise, I have suggested that your future projection, which ignores constraints on population growth and total carbon content in fossil fuels. also makes no sense.”
Never mind such speculative reasoning , it also ignores that actual data from which it is supposed to be derived , as I detailed here:
http://judithcurry.com/2012/12/04/multidecadal-climate-to-within-a-millikelvin/#comment-280683
Out of 54y of monthly data , ie 648 data points, he chooses to fit to just two of them while allowing the model to systematically deviate over the rest of the period:
http://i46.tinypic.com/nr0r45.png
So I again pose the question at the end of my last comment:
Perhaps you could explain why having NOT fitted your model to the available data you pretend that projecting it out to 2100 represents “business as usual”.
You constantly complain that your IQ is being underestimated, yet there are only two explanations I can see for proposing that your model represents “business as usual”: either you are incompetent or you are being deceitful.
Which is it Professor?
@GG: Out of 54y of monthly data , ie 648 data points, he chooses to fit to just two of them while allowing the model to systematically deviate over the rest of the period: http://i46.tinypic.com/nr0r45.png
Greg’s graph seems to suffer from the same failing: out of 648 data points Greg chooses to fit to the same two that I do while allowing his model to systematically deviate even more over the rest of the period.
For some reason he doesn’t explain, Greg, seems to think his fit is better. But if you look at the upper left graph here you’ll see that his “triple-exponential” fit for the period 1960-2010 has an R2 of 98.98% while what he calls my “totally inappropriate” fit based on the same two points he uses has an R2 of 99.56%.
manacker: If I understood Mike Rossander’s calculation as cited by Mike Jonas above, it shows that your poster linking human CO2 emissions to multidecadal climate in the past record does not hold water statistically.
Rossander’s own analysis of what he showed can be seen here, where he wrote ” It was an exercise that took about 15 min and was intended only to illustrate the dangers of over-fitting one’s data.” He illustrated it by using ten shape parameters when I was using only three. My response here gave the calculations showing that ten shape parameters was overfitting while three was not in the case of the image of my F3 filter. So far no one has proposed a serious objection to that calculation—in fact when I first gave it on this thread back in week 1 Steven Mosher said he found it reassuring and that I should have given it on the poster.
The question of overfitting was initially raised by Pekka, and it certainly is a delicate point that has to be reasoned about carefully. The role of the high R2 is to add one or two dimensions to the image of F3.
Rossander didn’t add any parameters to your spreadsheet and he actually used fewer than you because he completely eliminated all the parameters contained by the Hansen, Hoffman, Arseholiness law you concocted.
You’re duplicitous in the extreme and not very adept at it either.
To me it looked like VP wiped the floor with his detractors. No one demonstrated a better fit with less variables than VP, and Rossander’s curves, when back-projected, give unreasonable sub-century fluctuations that would dwarf the LIA and MWP, and would have been noticed. VP allows natural fluctuations to remain small both now and in the pre-industrial period.
VP has a ramp and the detractors have a sine wave that appears like a ramp on the incline.
k*sin(w*t) ~ k*w*t for w*t << 1
That's why one argues the physics, not numerology.
It is no surprise that you can fit an upward curve with harmonic functions in a limited window, but sometimes an upward curve is just an upward curve. Even Girma’s sine-and-line are more credible than Rossander’s harmonics, in fact, and that is saying something.
Yes, if you extrapolate Girma’s trend 200 years, it looks like this
http://img26.imageshack.us/img26/7849/girmatrendology.gif
Of course Girma will deny it. Yet that is what he fit to.
I see he went to a parabola rather than the line he used to use, which is a step in the right direction. If he just used VP’s function, it would fit even better.
Rossander set climate sensitivity to ZERO to make a point. Try setting it to the no-feedback sensitivity of 1.1C and then employ Excel Solver to optimize R2. The goal would be to use fewer parameters than Pratt and/or improve the fit and/or concoct a better narrative. I’d also suggest throwing in the published uncertainty in the temp record and let solver diddle within that temp range too. In fact I suggested this to Pratt and since it’s his baby the onus should really be on him to demonstrate there’s no other way the model works. Then he can make an argument from ignorance (GOOOOOLLLY GEE I can’t mek it wurk any udder whey than wit senshititivityity at 2.8C) like the rest of the climate monkeys.
Solver is an add-in for (at least) Excel that comes with Office 2003 and beyond.
Webby
If you extrapolate ANY trend 200 years, you are silly.
I have not seen Girma do that, by the way.
Max
Webby
The absolutely dumbest thing you can do is “extrapolate” – especially over longer time periods (see Taleb).
Vaughan Pratt’s Figure 7 is an excellent example of this.
Extrapolating Girma’s trend 200 years is another.
Don’t do dumb stuff, Webby. You’re smarter than that.
Max
Yeah, he sure wiped the floor by lying , ignoring criticism and generally being condescending and pig-headed.
When I called him on the lying he went into a sulk for a couple of days then came back like nothing had happened.
He botched his filter, then wasted about a week of arguing before conceding the point.
Having taken time off for Christmas , hoping this mess would all be forgotten, he comes back to evade as never before.
Rather than reply to any of the points raised in a credible way he dismisses everything that has been said by anyone since he last deigned to evade by saying it was all “esoteric and totally irrelevant”.
I still await an explanation of how he considers making a defective model fit to just two points out of 648 available data sufficient grounds for pretending it represents “business as usual” and projecting it 90y into the future.
Matt’s model does not hindcast because it was never intended to and was not required to. The “challenge” was to come up with another fit with “millikelvin” accuracy. He did, and so established the Emeritus Prof. Pratt’s method was incapable of distinguishing his supposed 3K/double model from ZERO CO2 warming. QED.
Even with the false claims , circular logic and unscientific methods the presentation still fails to distinguish what it claims to show from ZERO AGW, it is a total FAILURE. A farce.
What he wiped the floor with was his own credibility, which is now a soiled rag.
He seems a great fan of Cool Hand Luke. Perhaps he thinks if he keeps playing his losing hand long enough , everyone will feel sorry for him, get bored and go away. He can then wipe off his bloodied reputation and limp off claiming to have won.
I get the impression you don’t like the curve he gets from Arrhenius, Hoffmann and Hansen which he used to prove his point, but you haven’t yet rebutted the reasoning for using this as the AGW curve and how it accounts for 90% of the change seen in the temperature record by itself. The point of the poster is completely missed in the ensuing discussion which is that the AGW explains a lot and you don’t have to come up with harmonics of no known origin to explain more than a small part of the variation.
Jim D “I get the impression you don’t like the curve he gets from Arrhenius, Hoffmann and Hansen which he used to prove his point, but you haven’t yet rebutted the reasoning for using this as the AGW curve ”
Yes I have, I suggest you try reading my posts before trying comment on them , you may make less of an ass of yourself.
If you have an intelligent comment having read what I posted by all means come back and discuss.
What was the resolution about using AGW as a first-order fit? I only saw a lot of discussion about end effects from you.
Actually Greg makes a fair point in quoting me as saying “We unify all multidecadal ocean oscillations as a single phenomenon, namely a sawtooth.” So far no one seems to have objected to MUL as the multidecadal part of HadCRUT3 (and it would be strange to do so given that MUL + SOL + DEC is exactly HadCRUT3, the connection of SOL with the solar cycle is clear, and DEC obviously contains nothing multidecadal). Hence one can only assume that Greg doesn’t like my analysis of MUL as essentially SAW + AGW. He, Mike J. and David Springer all apparently prefer the Rossander analysis of MUL.
As I understand Mike’s objection (and perhaps the same thing is at the heart of Greg’s and David’s concern), he feels that SAW should bend up more so that AGW doesn’t climb so steeply. If there’s some way of rearranging the analysis that brings this about I’d be very interested in seeing it.
VP’s sawtooth bears no resemblance to the PDO, the AMO, or anything in the real world.
Even WUWT contradicts Greg and Mike on this point. See this WUWT article on that topic, in particular the fourth graph titled “PDO+AMO vs USHCN2” following the sentence “This was the jackpot correlation with the highest value of r-squared (0.83!!!).”
Compare that graph with my Figure 4, which I’ve dated and truncated similarly at 1905 for ease of comparison. For the period 1905-1975 SAW and PDO+AMO are in excellent agreement. The difference comes only after 1975 where SAW just barely makes it back to zero while D’Aleo’s graph climbs steeply!
All that Greg, Mike J. etc. need at this point is a shape like d’Aleo’s that bends up at the right that can be described with three parameters.
Reading further on in that same WUWT post, the 12th comment (not counting replies to comments), by Bob Tisdale at January 25, 2008 at 5:15 pm questions D’Aleo’s sharp rise at the right, suggesting it should be much flatter. Here’s his comment in full.
Anthony, I, like many, believe natural Pacific Ocean oscillations–ENSO and PDO/IPO–affect global climate, temperature, and temperature records more than climatologists are willing to accept. I’ve graphed PDO and ENSO against global temperature data numerous ways and my results agree with Mr. D’Aleo’s for the most part. And I’ve included the AMO in many of these investigations as well. The PDO is responsible for most of the dip in global temperature during the mid 20th century, leading one to question why aerosols are used to duplicate that temperature drop in GCMs. It doesn’t help GCM credibility.
I do, however, have a problem I can’t resolve. Possibly you can help, Anthony. I cannot duplicate Mr. D’Aleo’s graph of the PDO and AMO on Page 6 of the linked ICECAP report, which is your graph above with the title “PDO+AMO vs USHCN2″. As a reference, a graph of PDO data is here: http://jisao.washington.edu/pdo/ Note how the PDO dips drastically in the late 1980s. This drop to negative values is not reflected in the D’Aleo graph. Adding AMO data doesn’t help. Refer to the AMO graph here. http://www.aoml.noaa.gov/phod/d2m_shift/inline_fig.jpg Note the temperature scale of the AMO—tenths of a degree. Compare it to the scale of the PDO—degrees. Since the global area covered by both indices is approximately the same, adding the AMO to the PDO doesn’t raise the sum enough to make the drop in the PDO disappear. Smoothing it with an 11-year running average filter doesn’t make it go away either. For my own investigations, I would love to be able to make that drop in the PDO disappear, but I can’t.
(The first graph Tisdale cited has since gone missing, but is presumably similar to this one. The others are still there.)
Bob Tisdale’s wish to make that drop disappear is echoed on this thread by seemingly every one of my critics who’ve complained that the drop in SAW near the end isn’t what PDO+AMO does. Actually I wasn’t aware that PDO+AMO drops like Tisdale claims it does, I merely let HadCRUT3 and the AHH law guide least-squares fitting to a good fit (one with a high R2). I find it fascinating that high-accuracy fitting of a scientifically defensible model of AGW can separate out the natural component in a way reflective of what Tisdale claims to be actually seeing. I would have thought the ability of a model to make such predictions is a point in its favor.
Regarding retractions, I’m comfortable retracting the abstract as it was written months before the poster. As far as I’m concerned the poster has replaced the abstract.
He botched his filter,
I can quite imagine it would appear so to those unfamiliar with the difference between an impulse response and a frequency response.
then wasted about a week of arguing before conceding the point.
I recall conceding that I’d been badgering you unduly about Gaussians. Is that the point you had in mind?
Early on you claimed that cause of the downturn at top right in Figure 3 was different from that in Figure 2, and that the latter downturn was instead due to a turndown in climate in the past decade. The mistake I made was in underestimating the difficulty of explaining why the latter is wrong – initially I’d expected this would be obvious in a minute on the ground that a ten-year natural decline could not possibly be visible when the filter cuts off sharply at 21 years, but apparently Greg thinks the natural downturn should be visible.
I still await an explanation of how he considers making a defective model fit to just two points out of 648 available data sufficient grounds for pretending it represents “business as usual” and projecting it 90y into the future.
With close to 1500 comments I can sympathize with Greg’s difficulty in keeping track of my responses to everyone. With regard to the appropriateness of the Hofmann law and my fit of it to the Keeling curve, I commented on Dec. 5, the second day of this thread, here where I said Embarrassingly I discussed the poster with Pieter Tans, one of the coauthors of the Hofmann et al result cited in the poster, for ten minutes without recognizing his name until he pointed it out. Ouch! But he didn’t complain, other than to point out that the exponential part of their law was weakening lately with the 1974 oil crisis and increasing prices for all fossil fuels, with which I fully agreed. I plan to redo the work using actual emissions data reconciled with the Keeling curve in place of the exponential. While I expect that to make very little difference to my numbers since they model only the past, I do agree with Tans that the exponential law is a pessimistic predictor of the future on account of this decline in the rate of rise of emissions—the problem there is how to estimate the likely future decline.
Hopefully that Dec. 5 comment of mine, making the point that the exponential law is a pessimistic predictor of the future, addresses Greg’s concern. If not then I may have misunderstood his concern.
@Jim D (to GG): you haven’t yet rebutted the reasoning for using [the AHH law] as the AGW curve ”
@GG: Yes I have, I suggest you try reading my posts before trying comment on them , you may make less of an ass of yourself.
The main argument Greg gave against the AHH law is that it is “totally unsuitable.” So far he’s given no stronger argument against it than that. It was therefore easily rebutted when I wrote your “totally unsuitable” is contradicted by three papers: Arrhenius’s 1896 paper proposing a logarithmic dependence of surface temperature on CO2, Hansen et al’s 1985 paper pointing out that the time needed to warm the oceanic mixed layer would delay the impact of global warming, and Hofmann et al’s 2009 paper modeling the dependence of CO2 on time as a raised exponential. Since the formula I referred to as the “Arrhenius-Hofmann-Hansen” law is constructed from those three principles alone, with nothing extraneous, the ball is now in your court to demonstrate that the formula is “totally unsuitable.” I would be very interested in seeing a more substantive rebuttal than “totally unsuitable” (whatever that means).
Do you retract your claim that the raised exponential you call AGW can be projected out to 1000 ppmv and >4 deg,C AGW by 2100 and that this represents “business as usual” ?
Yes. I distinguished between “extrapolation” and “projection” here. I now realize many people don’t make any such distinction: they think extrapolation is prediction. Rather than waste further time debating this to death it is simpler if I simply retract those two panels at lower left, since they add nothing to the point of my poster. The point was to give a succinct description of multidecadal climate, with the AGW part being physically based and the SAW part being merely a succinct description of MUL – AGW, namely a filtered sawtooth.
@Mike Jonas: The sawtooth was created as the difference between Hadcrut3 and AGW.
Correct.
That sinewaves could be fitted to it proves nothing.
Certainly: anyone can Fourier transform a signal to represent it as a sum of sine waves, that’s not interesting. What’s interesting (to me if not to you) is that almost all of SAW seems to consist not merely of random sine waves but of the second and third harmonics of a sawtooth. What are the odds?!? I found that sufficiently surprising as to warrant including it as part of the poster.
Rossander gets a better fit with fewer variables. Don’t forget he removed a curve completely when he zeroed out climate sensitivity. No more Hansen-Arhenius-Whoever Law. I’m being kind in saying dropping that whole equation is just one parameter too. Occam’s Razor makes Rossander the winner. Deal with it. Pratt will have to if he wants this to be argued in the literature. Absent that it’s on a par with having it published by Principia Scientific. In fact I’m sure they’d love to have it so they can show the model working with zero climate sensitivity. ROFLMAO
No need to laugh.
Dembski
Uncommon Descent
The AGW curve represents most of the behavior with only three parameters. A single harmonic requires three parameters (wavelength, amplitude and phase), but that will not be a promising fit as a first-order approach the way AGW is. There may be other curves where you may think of a harmonic first, but not this one for sure.
Do you have a point about Dembski and Uncommon Descent or do you simply like guys with a double PhD in statistics and philosophy of science from University of Chicago with a masters in divinity from Princeton thrown in for good measure? Jealous maybe? A anonymous loser like you should be.
Jim D, estimating that VP wiped the floor with his detractors:
> No one demonstrated a better fit with less variables than VP, and Rossander’s curves, when back-projected, give unreasonable sub-century fluctuations that would dwarf the LIA and MWP, and would have been noticed.
Vintage December 29, 2012.
Since MiniMax has nothing against that, we should hear him talk about an analytic extrapolation as if it was real prediction.
And let’s not forget Don’s Behemoth.
…but that doesn’t back-project too well either. 0.06 C per decade gets quite cold quite fast in the pre-industrial era.
As always, VP avoids the main points.
The sawtooth was created as the difference between Hadcrut3 and AGW. That sinewaves could be fitted to it proves nothing. Therefore showing that Hadcrut3 = AGW + sawtooth is simply circular logic – it’s what VP started with.
With Hadcrut3, we’re talking about a measure with approx +-100 millikelvins error bands. VP’s talk about his very exact fit (“99.99%”) is simply ridiculous – the measure he’s fitting to isn’t itself anything like that accurate.
A couple of times, I have referred to VP’s work as being “unscientific”. By this, I mean that VP has gone way over the top in trying to deflect criticism, instead of trying to make genuine assessments of the evidence.
I’ll give some examples from VP’s latest (December 29, 2012 at 3:58 am) comment:
VP says “Mike’s and Greg’s impression that the PDO is a well-understood and sharply defined phenomenon could not be further from the truth”. This is disingenuous, at the very least. The point with the PDO (and AMO) was that VP’s sawtooth bore no resemblance to actual measurements within the period of VP’s study. There is and never was any need to understand the PDO or AMO at any higher level. VP’s obfuscations here and elsewhere serve to deflect attention from the fact that VP’s sawtooth bears no resemblance to the PDO, the AMO, or anything in the real world.
VP says ” I pointed out that I was fitting a model to data to determine its parameters. This is a very standard procedure that can easily look like circular logic to those who’ve never had to fit a model to data themselves.”. Another attempt at deflection. The circular logic claim did not relate to the process of parameter-fitting, but to its starting-point (temperature – AGW). Incidentally, parameter-fitting is generally a perfectly valid technique. When used properly, its results are verified by real-world testing. In the case of VP’s model, there is no attempt to do this.
VP says “One objection that several people besides Mike J. have raised is that SAW is not the totality of ocean oscillations. This is one of the many strawman arguments leveled against my poster.” and points out that in the poster’s conclusion there is no mention of ocean oscillations. Again this is a disingenuous attempt at deflection. The poster’s hypothesis begins with these words: “I collect all the so-called multidecadal ocean oscillations into one phenomenon I call a quasisawtooth, namely a sawtooth lacking its first harmonic or fundamental.”. Clearly, the realisation has subsequently dawned on VP that his sawtooth bears no resemblance to the ocean oscillations. By the end of the poster, all pretence that the sawtooth relates to anything in the real world has disappeared.
Notice that in the above points, I refer to the “real world”. In the end, all science has to relate to the real world. VP’s sawtooth does not. That alone shows that VP’s analysis is worthless.
Absolutely, I made many of the same points here;
http://judithcurry.com/2012/12/04/multidecadal-climate-to-within-a-millikelvin/#comment-280994
VP: “Since you’ve been evading my responses I would level that charge at you. Accusing me of “evasive generalities” is just one of your own many evasive generalities. ”
Oh, the old irrefutable accusation ploy again. If you have something to say, say it, link to it so that I can respond, don’t make vague, blanket statements.
GG: Is fitting an exponential to the post 1960 CO2 rise shown in the MLO too esoteric for you?
VP: I’m not sure what you’re referring to here, but if you mean the exponential fit that Max Manacker insists on using then that’s too inaccurate by an order of magnitude compared to …
Have wild guess. Am I referring to the three graphs I have linked to myself and the detail discussion of the pretence that your AGW represents “business as usual”, or am I talking about something manaker posted but I just did not say so, in order to give you the chance to act dumb again and divert the discussion?
VP: The “deviation” you complain about lies within the annual deviations of the MLO itself,
Wrong.
http://i46.tinypic.com/nr0r45.png
The raised exponential has a definite curvature even on a log plot that is systematically to one side of MLO data, it is not “within the annual deviations”. MLO is essentially a simple exponential growth beyond the 1975 point you chose to fit on. Even by the end of the fitting period it is clear that your model has greater slope than MLO even of log plot. You even draw attention to its upward curvature as a key feature. Whatever your reasons for choosing that model, it does not reflect “business as usual”.
GG: Perhaps you could explain why having NOT fitted your model to the available data you pretend that projecting it out to 2100 represents “business as usual”.
VP: All I claim is that my model is an excellent fit to HadCRUT3. This is demonstrated with the obtained R2.
No, that is not “all you claim”. That is another false statement.
PAST AND FUTURE
TRENDS
The curves below show
past CO2 and business-as-
usual future CO2 on a log
time scale. Future is
simply the extrapolation of
SAW and AGW.
VP: Hence for the purposes of this thread I am more than happy to retract both the panel at lower left plotting CO2 from 4 MYA to 2100 and the whole of the right column.
So what’s with conditional retraction? Either you retract or you don’t. I can understand that you now want to walk away from that untenable projection to focus on something else, so let’s have a clear statement on this.
Do you retract your claim that the raised exponential you call AGW can be projected out to 1000 ppmv and >4 deg,C AGW by 2100 and that this represents “business as usual” ?
@VP: The “deviation” you complain about lies within the annual deviations of the MLO itself,
@GG: Wrong.
http://i46.tinypic.com/nr0r45.png
Since only Greg knows what formulas were used to create that chart I’m afraid I’ll have to leave it to him to explain why it gives a different conclusion from this chart. Here are some of the differences.
* Unlike Greg’s chart the plots are labeled with the formulas generating them (and just in case that’s not enough, the MATLAB/octave code generating them can be found here).
* Another difference is that the vertical axis (CO2) is plotted on a linear rather than log scale so as to make the curvature of the Keeling curve easier to see.
* It should be clear that Hofmann’s law (what Goodman labeled as “Pratt’s law”) lies within the annual deviations of MLO, just as I claimed.
* The curvature of the Keeling curve is much greater than any exponential that touches it in two points.
* An exponential fit hindcasts absurdly, namely to zero when the ice core data from Vostok etc. would suggest 280-290 as a more reasonable hindcasting target.
* The exponential curve is clearly swinging down through the Keeling curve in 2010 and will undershoot it thereafter. Granted the Hofmann curve is slightly on the pessimistic side as I’ve been saying since Dec. 5, but any exponential fit to the Keeling curve is grossly optimistic as the chart should make clear.
Yes, he truncated at 1970. By the time you get to 1900 that green curve is going to look quite bad. If you are looking for a function that fits the century, the green one isn’t it. Taking into account the log axis, the deviations are less than 1% which is the annual variation in the Keeling curve. I am not sure GG is reading his graphs correctly.
…indeed VP plotted that green curve above, and it is quite bad at 1900.
Pingback: Climate Scientists’ Road to Hell | 2012 The Awakening
re: Vaughan Pratt | December 29, 2012 at 11:48 pm
Looks like some progress at last. Unfortunately [unfortunate, that is, only in the context of this dialogue] I am away and unlikely to be able to contribute for the next fortnight.
Regarding the PDO dip in the 1980s: The dip was relatively short, though quite strong, in a generally warm phase. The PDO returned to positive territory in the 90s. We don’t know the precise relationship between PDO (or AMO) and global temperature, in particular we don’t know if it is linear and we don’t know what time delays are involved or what other factors affect the relationship.
However, I note that in my Hadcrut3 data, downloaded 14/10/2012 from http://www.cru.uea.ac.uk/cru/data/temperature/hadcrut3gl.txt, the global temperature is overall prettty flat during the 1980s within a longer warming trend. This does not show in your version of Hadcrut3.
But I think that this is getting too much into the minutiae. The major criticisms stand.
[I’m out of time]
Jim D | December 30, 2012 at 2:45 pm |
…indeed VP plotted that green curve above, and it is quite bad at 1900.
I previously suggested you read the relevant posts before making comments on them in order to prevent making an ass of yourself. You should have listened.
You would look less stupid if you commented on my graph having looked at it rather than looking at Pratt’s botched replication equally derived from not looking at it.
@VP: The “deviation” you complain about lies within the annual deviations of the MLO itself,
@GG: Wrong.
http://i46.tinypic.com/nr0r45.png
VP: Since only Greg knows what formulas were used to create that chart I’m afraid ” I’ll have to leave it to him to explain why it gives a different conclusion from this chart.”
OH, you meant to say within the seasonal variations of MLO.
Up until this moment you have not shown _any_ plot of your AGW against Keeling so don’t get too smart about redressing that omission almost a month later.
With or without the seasonal variation, the basic proiblem remains the same: you only fit to two points and model systematically deviates from the form of MLO. It does not fit MLO , it does not represent “business as usual”.
Once again , if you bother to read my comments before pretending to dismiss them you may be more coherent.
I pointed this out in the paragraph directly preceding the one you quoted but to make it even easier for you to avoid reading it third time here a link to the post:
http://judithcurry.com/2012/12/04/multidecadal-climate-to-within-a-millikelvin/#comment-280208
You will find both log and linear plot where shown to “make it easier” to see how MLO is a straight exponential not your raised exponential and an explanation of how log and linear fits were derived.
I presume someone of your experience is familiar with the use of a log plot when exploring relations resumed to be exponential. It “makes it easier” to see the difference between the exponential increase in MLO and the super exponential increase on the model you are pretending to fit to it.
So now you have seen the log plot, the linear plot and the detail of the log plot let’s try again…..
VP: All I claim is that my model is an excellent fit to HadCRUT3. This is demonstrated with the obtained R2.
No, that is not “all you claim”. That is another false statement.
PAST AND FUTURE
TRENDS
The curves below show
past CO2 and business-as-
usual future CO2 on a log
time scale. Future is
simply the extrapolation of
SAW and AGW.
VP: Hence for the purposes of this thread I am more than happy to retract both the panel at lower left plotting CO2 from 4 MYA to 2100 and the whole of the right column.
So what’s with conditional retraction? Either you retract or you don’t. I can understand that you now want to walk away from that untenable projection to focus on something else, so let’s have a clear statement on this.
Do you retract your claim that the raised exponential you call AGW can be projected out to 2100 with 1000 ppmv, greater than 4 deg,C anthropogenic warming and the claim that this represents “business as usual” ?
Greg, you are invited to plot your green curve back to 1900 to back up what you say, but by 1970 it is already clearly deviating, so I will go with VP’s rendition until I see it. Your plot also shows a 1% deviation for VP’s curve which is within the annual variation which you unfortunately omitted.
Jesus. For the third time! You are invited to read the friggin post I linked to, where this was presented fully and explained. Is that too complicated for you?
You may like to help Prof Pratt in explaining what the hell the size of the seasonal variation has to do with whether the non-fitted curve systematically deviates from the MLO data over its full length and what this implies about it’s relevance when projected 100 years hence.
His model does not fit the data and does not represent “business as usual”.
The good thing about a natural log scale is that a deviation of 0.01 units is a 1% deviation in the value, so you can see that VP’s line is accurate to 1%. How accurate is MLO as a global CO2 value? 1% might be a good guess, so VP’s value is within the uncertainty and, as a bonus, gives reasonable values as you asymptote to pre-industrial times.
So I asked about how relevant the badly fitted curve is when projected out to 2100 as Prof Pratt does in his presentation and you reply by saying it “gives reasonable values as you asymptote to pre-industrial times.”
Are you doing this on purpose or do you really have your head up your arse?
VP himself has said that there is no reason a mathematical expression should project to 2100 correctly. It was just there for entertainment. If CO2 use continues to double every 30 years like it has for the last 5 doublings, then it would reach 1000 ppm in 2100. Take it or leave it.
If CO2 use continues to double every 30 years like it has for the last 5 doublings, then it would reach 1000 ppm in 2100.
Yes, exactly, that’s what the phrase “business as usual” means in climate jargon. One cannot predict “business as usual,” one can only say what the CO2 will be in the event of business as usual. Likewise no one can predict that you will down ten scotches this New Year’s Eve, but they can say that if you do then your blood alcohol concentration will likely be over 0.08%.
> [N]o one can predict that you will down ten scotches this New Year’s Eve, if you do then your blood alcohol concentration will likely be over 0.08%.
Make that “very likely”, unless you’re Big Dave or Cap’n.
@GG (to Jim D): Are you doing this on purpose or do you really have your head up your arse?
Translation (less colourful but with a better chance of reaching a meeting of the minds): “Might you have overlooked that I’m using a piecewise raised-exponential fit to the Keeling curve?”
Greg himself has never said this, instead distinguishing his preferred fit from Hofmann’s raised-exponential law (which he misattributes to me) by calling it a “triple exponential” law, a strange terminology which mystified me until just now.
My current guess is that Greg’s law is simply Hofmann’s law elaborated to change the doubling period at suitable break points, in contrast to Hofmann’s fixed doubling period. Absent formulas, code, or clear explanation this is purely a guess, but nothing else I could think of made any sense.
Based on the CAGR (compound annual growth rate, which as a percentage is very close to 70 divided by doubling period in years) of human-emitted CO2 as plotted here, at first glance it might seem reasonable to break emitted CO2 into regions where the CAGR is roughly constant.
I have avoided doing so (and therefore stuck to Hofmann’s law) for two reasons.
1. Piecewise anything costs additional parameters per piece. This need not be problematic when fitting a model to a curve drawn from a very high-dimensional space and/or with a high signal-to-noise ratio. However in any situation where there’s a risk of overfitting, every extra parameter brings you closer to overfitting (von Neumann’s five parameters that can wiggle the elephant’s trunk). Such a situation calls for a careful cost-benefit analysis: can the improvement in fit be achieved without overfitting?
As Mike Rossander’s example makes very clear, with just a few more parameters one can easily overfit to F3(HadCRUT3). So if I can get an R2 of 99.997% with one piece, why pay two more whole parameters (the cost of one more piece) if it doesn’t even get me to 99.998%? 99.997% is already way overkill! Greg’s “triple exponential” costs four additional parameters (the new doubling period, and how long it should run for, i.e. where to put the next breakpoint, times two pieces). That’s exactly the number of additional parameters Mike R had to use (7 more shape parameters, less the 3 AGW parameters). Rossander intended his model to be an overfit, whence a three-piece model of CO2 in place of a one-piece one will be just as much of an overfit.
2. While it’s hard to tell without more details from Greg, I suspect he’s comparing apples and oranges with his red curve here labelled “global-CO2-emissions.1751_2007.dat scaled to Mauna Loa”. The former is the CDIAC data for annual human CO2 emissions, the latter constitutes the accumulated emissions. Comparing these is wildly inaccurate, as I’ll now argue.
In the following I’ll use Greg’s pre-industrial estimate of 295 ppm and the conversion 1 GtC = 0.47 ppmv. The latter is obtained as 28.97/12/5.14 where 28.97 is the average molecular weight of air, 12 is the atomic weight of carbon, and 5.14 is the mass of the atmosphere in petatonnes.
The current level of 394 ppm represents an accumulation of (394 − 295)/0.47 = 211 GtC. Last year we emitted about 10 GtC, so there is no way this accumulation of 211 GtC could possibly have resulted from one year’s emissions, which is what global-CO2-emissions.1751_2007.dat tabulates. Scaling it to Mauna Loa as Greg does results in a scaling factor that is off by a factor of twenty! That’s wildly inaccurate. (Were Greg pointing this out to me he’d say I’d “botched” it.)
For the comparison to make physical sense one must use the cumulative emissions. Cumulatively we’ve emitted over 500 GtC. This is larger than the above 211 GtC that has accumulated in the atmosphere, but that’s accounted for in terms of Le Chatelier’s principle, which says that adding a chemical (CO2 in this case) to a system will shift its equilibrium resulting in a certain fraction of the CO2 being taken up by the land and ocean.
If in place of Greg’s 295 ppmv pre-industrial level we take the more conventional 280 ppmv level, and assume that 56% of emitted CO2 has been absorbed by land and ocean since 1850, and also include the extra atmospheric CO2 resulting from land use changes (also tabulated at CDIAC), we obtain this plot (the black plot). Note that there is no exponential or other mathematical formula governing the plot, which is simply emitted CO2 as tabulated by CDIAC, scaled by 0.47*0.44.
The black plot runs straight through the middle of the whole Keeling curve!
Mike Jason would complain that the 44% was circular reasoning, but I would call it parameter fitting.
But wait. If there are no exponentials in this fit, what does it have to do with whether piecewise exponentials are good or bad?
Well, if you integrate a piecewise-exponential formula whose doubling periods change only modestly between pieces, the huge accumulation by the time you reach each breakpoint tends to dwarf the changing CAGR of the annual emissions. So even though the annual emissions might not be well modeled by a single raised exponential, the cumulative could be.
Eventually if one piece gets long enough it will come to dominate, and then it becomes appropriate for the cumulative plot itself to shift to a new doubling period. The theme running through this thread, namely that we’re headed for a more optimistic scenario (longer doubling period than in previous pieces), is predicated on the most recent piece of the annual emissions continuing at its recent relatively low CAGR for much longer than the previous pieces.
While I have no quarrel with this optimism, neither do I endorse it. Predicting anything is hard, especially the future. When it comes to fortune telling I’m an agnostic.
Theists view agnostics as atheists, while atheists view them as theists (how could anyone fail to see that the atheist position is the only scientific one?). As an agnostic on this thread I get hit with this a lot from both sides.
The goal of my poster was to analyze/describe HadCRUT3. Could I have improved on 99.997% with more than a one-piece raised exponential model of CO2? Maybe, but (a) why? and (b) I’d be starting to overfit.
Simple as that.
http://clim.stanford.edu/CDIACKeelAgree.jpg
Which underlines my observation that _accumulated_ emissions (see the title), when scaled to fit MLO do match quite closely. You pulled 44% from somewhere, I scaled to fit.
My three exp model was a fit to _accumulated_ emissions. A simple log plot of emissions (without any fitting) clearly shows three distinct periods that are close to being straight in a log(y) plot. ie three periods of fairly constant _exponential_ growth.
This is neither surprising nor controversial.
Having seen three rates of growth I fitted straight lines to the log plot to compare the rates of growth.
In view of the title of the graph and the explicit legend for each of the lines it’s unclear why this is so hard for you to understand.
http://i48.tinypic.com/snouvl.png
Yet more evasive pettifogging:
@GG: OH, you meant to say within the seasonal variations of MLO.
Huh? If I told you I took an annual vacation to the Bahamas you’d pretend not to understand me on the ground that I should have said a seasonal vacation?
I said “annual” and I meant “annual.” “Annual” connotes frequency while “seasonal” connotes underlying cause (my annual pilgrimage to the Bahamas is in the northern winter season). This distinction is nicely exemplified at this URL, which uses both terms appropriately: “the atmospheric CO2 content is characterized by annual oscillating variation. The variation is caused by seasonal variation in the amount of photosynthesis”.
Pretending otherwise serves only to undermine your credibility.
VP: Huh? If I told you I took an annual vacation to the Bahamas you’d pretend not to understand me on the ground that I should have said a seasonal vacation?
No , I would understand it to mean I went once a year, not once a month. That is why I thought your “annual deviations” referred to deviations in annual MLO not the subannual variations.
That misunderstanding has not bearing how good you fit (or rather isn’t) , the systematic deviaiton is still there and remains unaddressed.
Interesting that once again you prefer to indulge is pissy arguments about wording rather address the science.
The question is whether your model fits the recent data well enough to be projected 90y into the future. It doesn’t and you know it doesn’t that is why fall back on attempting to deflect the discussion elsewhere.
The question is whether your model fits the recent data well enough to be projected 90y into the future. It doesn’t and you know it doesn’t
I’ve lost count of the number of times I’ve told you I don’t claim this. You’re basing this on a wilful misreading of my “extrapolate” as “project.” Please stop doing this, will you, it just makes you look stupid. Anyone can extrapolate but only God can project.
VP: Since only Greg knows what formulas were used to create that chart I’m afraid I’ll have to leave it to him to explain why it gives a different conclusion from this chart.
Duh, Mr Genius (Emeritus) , it is the _excess_ CO2 that is rising exponentially not the absolute atmospheric concentration.
If you bothered to read my post you would know exactly how I derived the base line co2 for 1960 and fitted a simple exponential growth corresponding to exponentially increasing human emissions.
By this stage it is clear that you must have read it and simply being obtuse in order to avoid addressing issues. To save others digging back here it is again.
http://judithcurry.com/2012/12/04/multidecadal-climate-to-within-a-millikelvin/#comment-280208
>>
Simply scaling emissions to concentration levels makes the underlying assumption that rise in atmospheric CO2 is primarily due to human emissions. Going along with that assumption how does Pratt’s Law of CO2 shape up?
http://i48.tinypic.com/snouvl.png
The post 1960 exponential is almost totally obscured by the MLO Keeling data and provides a very close model of this period.
The notable deviation of the single exponential Pratt’s Law model from the M.L data on which it claims to be based on, is evident. It only crosses the Keeling curve at the start and the end. It does not ‘fit’ the Keeling curve. In fact it shows a distinctly different curvature from the data on which is it supposed to be based.
Since the “forcing” effect of CO2 is often represented as a log of CO2 concentration and that is the basis of what is presented in the poster, a log plot is more relevant to this discussion.
http://i50.tinypic.com/2eq450n.png
Now we start to see how defective Pratt’s Law really is.
The difference of base levels is well within margin of error and does not represent an important difference in the models. However, it bears no resemblance to “business as usual” as it claimed to do.
Current “business as usual” is the exponential growth since 1960. That was shown in the first graph to be very close to exponential and well matched to the Keeling curve. Log of exponential is a straight line. Anything claiming to be “business as usual” must be essentially straight in the log plot.
Thus the rapidly rising log plot of Pratt’s Law can in no way be taken to represent “business as usual”.
It is hard to imagine someone who has spent their life in research and teaching of the hard physical sciences could fail to see how unsuitable such a model was.
>>
But now you have seen a possible way out in adopting Jimbo’s stupidity and disingenuously adopt his ridiculous claim.
Vaughan Pratt | December 30, 2012 at 9:40 pm |
>>
If CO2 use continues to double every 30 years like it has for the last 5 doublings, then it would reach 1000 ppm in 2100.
Yes, exactly, that’s what the phrase “business as usual” means in climate jargon.
>>
OH really , Professor (Emeritus) , is that “exactly” what the jargon means?
It is recognised by the IPCC, and anyone with at least two brain cells still connected to a supply of oxygen, that there has been a vastly accelerated rate of growth in human emissions since around 1960. This is what is presumed to be responsible for a large part of the late 20th c. temp rise that we are all supposed to be panicking about .
When the IPCC refer to “business as usual” it is the current rate of growth that they are using in models not Pratt’s Law.
So, I ask you again, does your model characterise the recent data well enough to project it 90 years hence.
Don’t divert elsewhere, answer the question.
So, I ask you again, does your model characterise the recent data well enough to project it 90 years hence.
I’m sorry, but I’m not allowed to argue anymore. If you want me to go on arguing, you’ll have to pay for another five minutes.
Duh, Mr Genius (Emeritus) , it is the _excess_ CO2 that is rising exponentially not the absolute atmospheric concentration.
Ok, so let’s have a clear statement from you on this point. Is this the same as “raised exponential” (as used in my poster) or do you mean something different by it?
Don’t divert elsewhere, answer the question.
So as your latest attempt to divert the discussion you ask me another question and say don’t divert. Brilliant move Prof. ‘mate in one as you would say.
(He’s running a tab.)
Well if I haven’t paid, why are you still arguing?
Gotcha there!
Gotcha there
He seems not to know what a “tab” is. Language problem?
I’ve told you once, I’ve already paid you.
Ah, that must be why I’m still arguing. Wondered about that.
When the IPCC refer to “business as usual” it is the current rate of growth that they are using in models not Pratt’s Law.
If it’s all the same to you, would you mind attributing Newton’s First Law of Motion to me instead of Hofmann’s Law? Since both attributions are equally inaccurate it should make no difference to you, but as a big fan of Newton’s Law I’d really appreciate that misattribution.
Incidentally there is virtually no difference between your “triple exponential” law and Hofmann’s Law. So if you think the latter sucks, yours isn’t much of an improvement. Nothing new under the Sun, as they say.
Vaughan Pratt | December 31, 2012 at 4:58 am |
GG: The question is whether your model fits the recent data well enough to be projected 90y into the future. It doesn’t and you know it doesn’t
VP: I’ve lost count of the number of times I’ve told you I don’t claim this. You’re basing this on a wilful misreading of my “extrapolate” as “project.” Please stop doing this, will you, it just makes you look stupid. Anyone can extrapolate but only God can project.
More word games to avoid answering the question , I’ve lost count of the number of times you’ve started some stupid argument about wording as a ploy to avoid respond to criticisms of the science in your presentation.
Now if you prefer the word “extrapolate” that’s fine by my.
VP: All I claim is that my model is an excellent fit to HadCRUT3. This is demonstrated with the obtained R2.
No, that is not “all you claim”. That is another false statement.
PAST AND FUTURE
TRENDS
The curves below show
past CO2 and business-as-
usual future CO2 on a log
time scale. Future is
simply the extrapolation of
SAW and AGW.
VP: Hence for the purposes of this thread I am more than happy to retract both the panel at lower left plotting CO2 from 4 MYA to 2100 and the whole of the right column.
So what’s with conditional retraction? Either you retract or you don’t. I can understand that you now want to walk away from that untenable projection to focus on something else, so let’s have a clear statement on this.
Do you retract your claim that the raised exponential you call AGW can be EXTRAPOLATED out to 2100 with 1000 ppmv, greater than 4 deg,C anthropogenic warming and the claim that this represents “business as usual” ?
At this point I confess I have no idea what Greg is talking about. At first I thought, based on his graph here, that he was plotting a (non-raised) exponential curve. But then he wrote “Duh, Mr Genius (Emeritus) , it is the _excess_ CO2 that is rising exponentially not the absolute atmospheric concentration.” which led me to believe that perhaps he was plotting a raised exponential after all. However the combination of the piecewise linearity of his “triple exp() approximation” and the y-scale running from 5.7 to 6.0 (ln(300) = 5.7, ln(400) = 6.0) would seem to contradict this and bear out my first impression with the modification that his green curve is piecewise linear rather than linear.
But after staring yet longer at http://i50.tinypic.com/2eq450n.png I decided it didn’t matter which it was. First his fit to MLO (the green plot) at 1962 or so is about twice as bad as mine (the brown plot) anywhere. Second, his exponential for 1962-2050, linearized by the logarithmic y-axis, is simply Manacker’s old argument for a 0.5% CAGR, which is completely unphysical. Third, he circumvents the bad hindcasting by making his linear fit a piecewise one, which is meaningless: every curve has a piecewise linear approximation, but that’s overfitting. Moreover his pieces are a terrible match to the CDIAC emissions data, which are much closer to a single smooth exponential than to the very badly piecewise exponential curve implied by Greg’s graph. The logarithmic y-axis hides just how bad that fit is; that MLO is veering up and away from Greg’s green curve at 2010 is much clearer with a linear y-axis.
On that basis I’d say Greg was the one who should be retracting.
The one good thing I can say about Greg’s chart is that it very nicely makes the point that two fits that are close together on the data to date can quickly diverge in the future. This makes the important point that extrapolation can be next to useless for predicting the future.
A particularly compelling example of this is the top of a Gaussian compared to the top of a cosine. These look almost identical, yet when extended the Gaussian settles down to zero in the limit while the cosine oscillates forever between -1 and 1. The respective behaviors of these two curves near x=0 (the y-axis) are so similar as to give no hint of this future divergence.
Examination of the last two decades of this plot suggests that both Hofman’s and Manacker’s laws (respectively the red and green curves) are leaving 2010 at an angle to the Keeling Curve, which arguably splits their tangents there down the middle. As I’ve said repeatedly on this thread, Hofmann’s law seems overly pessimistic, but Manacker’s law seems just as overly optimistic. The truth may well run through the middle there.
All that aside, I’d still be interested what Greg meant by “it is the _excess_ CO2 that is rising exponentially not the absolute atmospheric concentration” since I’m having difficulty reconciling that with Manacker’s exponential fitting: it sounds more like Hofmann’s raised exponential fitting.
I’ve been trying to figure out why Greg has picked 295 ppmv as the value for preindustrial CO2 in his charts. 280 ppmv is the traditional value, the Vostok ice cores registered 284.7 in 342 BC (Petit et al, Nature v.399 (6735) pp 429-436, 1999), and I used 280 when fitting the CDIAC data directly to the Keeling curve here on the assumption that 44% of emissions remained in the atmosphere.
I’ve just figured it out. Greg has omitted the contribution of land use changes!
Slash-and-burn impacts atmospheric CO2 considerably by reducing the amount of CO2 nature would have removed from the atmosphere in the absence of humans. Richard Houghton’s estimate of this amount between 1850 and 2005 can be found at this CDIAC data page.
If Greg adds this data to the emissions tables he used and redoes his fit, he’ll find he needs to set preindustrial CO2 to a more reasonable value. Looking forward to seeing what his graph here looks like when redone to take land use changes into account. He may have to drag the point at 1960 down even further, making his green plot an even worse fit to the Keeling curve.
Greg’s use of a log scale for y-axis tends to hide the fact that his curve is a worse fit to the Keeling curve than Hofmann’s (when suitably parameterized). I’ll try taking the derivative instead of the log, which I expect will have very much the opposite effect, namely making the quality of the fits much clearer instead of much more obscure. TBD.
GG: The question is whether your model fits the recent data well enough to be projected 90y into the future. It doesn’t and you know it doesn’t
If GG’s basis for “It doesn’t” is that his projection is better, then he’s wrong about that as I’ve just been arguing. “You know it doesn’t” is not even wrong, it’s just Goodman’s way of expressing anger. Mike Jason behaves similarly. Mike Rossander and Fred Haynie, who commented near the end of Jason’s Dec. 13 “circular logic not worth a millikelvin” WUWT post, are polar opposites to Goodman and Jason with regard to both accuracy and restraint.
Has any other anthropogenic source of CO2 been overlooked here besides land use changes? Overlooking the latter forced b up to 295. If so it might be necessary to reduce b below 280, even to 260 conceivably! I have a candidate, but this comment is already too long so also TBD (perhaps before the TBD above).
I wonder if prof pratt has asked greg why greg has picked 295 ppmv as the value for preindustrial CO2 in his charts. I am thinking the answer might be that greg is using the quasi-preindustrial CO2 level, which is exactly 295.2 ppmv. Perhaps greg will explain it to prof pratt and eliminate this latest attempt at mis-direction.
@Don Monfort: Perhaps greg will explain it to prof pratt and eliminate this latest attempt at mis-direction.
Thanks, Don, your impartiality here is much appreciated.
I see that prof pratt’s quasi-defense of his quasi-model based on his quasi-sawtooth has resumed.
You can call me Quasi Wabbit, Don. ;)
Although this bar-room brawl might not look terribly constructive, I’ve actually found it an interesting source of ideas. The latest is the one that might justify lowering the assumed immediately-preindustrial CO2, the natural base b, below 280 ppmv as I hinted just above.
I asked what other anthropogenic sources of CO2 might be being overlooked besides land use changes (without which Greg estimates b at 295 ppmv). It occurred to me very belatedly that the feedback that’s been amplifying temperature also amplifies CO2, for example the CO2 being emitted from the oceans as they warm. That has just as much right to be called anthropogenic CO2 as feedback-amplified warming has to be counted as part of anthropogenic warming (namely none at all according to some here). (Not claiming any originality here, just belated thinking.)
What’s missing is a counterpart of Richard Houghton’s estimate of the contribution to increasing CO2 of land use changes since 1850.
One way to estimate all such overlooked sources of anthropogenic CO2 at the one time is to make Hofman’s raised-exponential law fit the Keeling curve better. As I pointed out earlier Hofmann287 (the Hofmann fit with natural or preindustrial base b = 287 ppmv) already fits somewhat better than Manacker’s plain exponential, though GG is right that Hoffman287 sags in the middle.
The best fit of a raised exponential to the Keeling curve is when b = 260 ppmv (i.e. the exponential is raised by 260). I pointed out this excellent fit three years ago here. You can compare the quality of the Hofmann260 and Manacker fits here.
The fit of Hofmann260 is so good that one can even identify local deviations that obviously no reasonably smooth curve could hope to fit well. One theory is that these are well correlated with volcanic eruptions, although Arno Arrak prefers to blame then on La Nina cooling incidents whose timing accidentally followed an eruption, an interesting idea that however is statistically whittled away at by each such “accident.” Whatever the cause, the quality of the Hofmann fit makes them pretty visible.
Manacker’s Law models total CO2 as growing at 0.41% CAGR while Hofmann’s Law with Hofmann’s choice b = 280 ppmv claims 2.23% CAGR. Taking b = 260 reduces the CAGR to 1.67%.
My spreadsheet obtained 287.4 by a least squares fit of the Arrhenius-Hofmann-Hansen law to HadCRUT3. That gives an even higher CAGR of 2.55%. Hoffman260 should therefore be more appealing to Climate Etc. denizens than Hoffman287.
I don’t have any further thoughts about all this at the moment. I’ll certainly be interested in other people’s thoughts.
Dr. Quasi Wabbit,
I am with you on this one. Doc. We need to revisit Kyoto with a more ambitious agenda. We must stamp out farming, along with ending the burning of fossil fuels. Hunter gatherer is the way to go. We can get close to that, if we in the industrialized nations reduce our economic activities to the level of backward, poverty stricken Romania (steffy’s homeland). Then all we got left to worry about is getting scorched by the heat from seismic events at the core-mantle boundary.
Vaughan Pratt
Thanks for (indirectly) responding to my posts to you on the subject of CO2 and temperature forecasts (or projections or extrapolations) to year 2100.
I would certainly agree that “Hofmann’s Law” has fit pretty well for a world where human population grew by a compounded 1.7% per year. It arrives at an exponential function for the human-caused increase in CO2 concentration, rather than the entire concentration.
I have made no attempt to relate the past CO2 growth rate to any exponential function, except to note that it increased at an exponential rate of around 0.45% per year and over the past few decades it appears to have stabilized at an exponential rate of around 0.5% per year.
To “extrapolate” Hofmann’s Law of human-caused CO2 increase to a world where human population growth is expected to slow down sharply to around one-fourth of the previous rate is obviously foolish, unless one also reduces the expected exponential CO2 increase accordingly.
I have taken the expected sharp drop in population growth into account and have estimated that the per capita use of fossil fuels would continue to increase, reaching a 30% higher level by 2100 compared to today (it grew by 20% over the past 40 years).
Incorporating these two changes and using UN projections for 21st century population growth, I arrive at a 2100 level of a bit over 600 ppmv (this is a bit higher than IPCC scenario B1 and right around scenario A1T1).
The rate of growth fits pretty well to a curve based on a continuation of the recent exponential growth rate of total atmospheric CO2 (around 0.5% per year).
Forecasting is a dangerous business, Vaughan – even if you call it “extrapolating”.
No matter how logical your bases seem at the time, it’s always best to do a “sanity check” on such forecasts.
Global warming of 4C above today’s level as you project would take an atmospheric CO2 concentration of around 1000 ppmv, at IPCC’s mean ECS prediction.
This is higher than ANY of the IPCC projections and is the level expected by combusting all the remaining fossil fuels on our planet, so it is “virtually certain” (in IPCC terminology) that this level will NOT be reached from human CO2 emissions by 2100.
Max
manacker, the new IPCC RCP8.5 scenario is higher than VP’s projection. 8.5 W/m2 is more than two doublings of CO2. Granted, they were looking for an extreme case to bracket climate change, but their narrative for this scenario justifies the numbers as a possibility. You can Google RCP8.5 to find out more about its assumptions.
Jim D
I’m not too interested in “leaked” sneak previews of what IPCC may end up publishing in AR5 as an “extreme case”, but rather what has already been published in AR4.
There are several computer-generated “scenarios and storylines”.
http://www.ipcc.ch/pdf/special-reports/spm/sres-en.pdf
The most “extreme” case (A1F1) ends up with ~860 ppmv CO2, based on “very rapid and fossil fuel intensive economic growth”, population leveling off at ~10.5 billion by 2100 and no climate initiatives.
Other cases also assume the same population growth but a slower economic growth which is also less fossil fuel intensive.
Cases B1 (580 ppmv); A1T (607 ppmv); B2 (630 ppmv) A1B (706 ppmv); A2 (790 ppmv).
None are as high as Vaughan’s estimate or an extension of the Hofmann curve (1070 ppmv) – which also lies above the “maximum physically possible” from human fossil fuel combustion.
Tying future human CO2 growth projections to human population growth projections and adding in a 30% estimated increase in per capita CO2 emissions by 2100, gives you a CO2 level of 640 ppmv (or a bit higher than IPCC case B2). See plot:
http://farm9.staticflickr.com/8223/8341489731_732d01ac4e_b.jpg
This appears to be a good “upper limit” case as far as I can estimate.
IPCC AR4 calculated a 2.4C temperature increase (above 1980-1999 average) for this case, or around 2.1C above today’s temperature.
Of course, if the latest Lewis and Schlesinger estimates of ECS are used, the warming is only around half of this or 1.0C above today’s temperature.
Yawn!
Max
Max,
The RCP scenarios are not leaked information. They have been published several years ago to form a common basis for work towards AR5. Specifically RCP 6.5 was developed at IIASA and published in 2007
http://www.iiasa.ac.at/web-apps/tnt/RcpDb/dsd?Action=htmlpage&page=welcome
and
http://webarchive.iiasa.ac.at/Research/TNT/WEB/PUB/TFSC_74_7/long_term_scenarios.pdf
In the latter it’s called A2r.
Pekka
Thanks for straightening me out on RCP 6.5.
But I’ll stick with the AR4 projections for now.
Max
Jim D and Pekka
I checked the “most extreme” case A2r in the attachment you cited, Pekka..
It has CO2 rising to around 830 ppmv.
Sorry ’bout that, Jim.
1000+ ppmv is still “more extreme” than the “most extreme” case of IPCC.
Guess you’d call this Vaughan’s “more than most extreme” case, right?
Max
Vaughan Pratt, you have been a real trooper to keep up the interchanges.
On the issue of extrapolation/prediction/forecasting and so on: do you think that your model makes accurate forecasts for the next 5 – 35 years? I wrote that future data are the only reasonable test of your model. Do you agree with that?
Vaughan Pratt | January 1, 2013 at 9:21 pm said: ”preindustrial CO2, the natural base b, below 280 ppmv as I hinted just above”
Vaughan, since human invented how to produce fire artificially -> was creating deserts around the planet.- CO2 level was obviously more than double than now. Will not even try to guess how much it was at different times; because if I did – I would have put myself on your and Don Monfort’s level. Even today is different amount of CO2 on different places and the amount goes up and down every day – depends before or after rain. Because I’m not a ”Carbon Molester” as you, Jim D and Don.- it’s relevant how much CO2 is; so, what’s the fuss about?
During Sherlock Holmes times – people were burning few logs, to boil water for one cup of tee -> CO2 released in the city / now electricity is produced outside the city – where CO2 is desperately needed by the trees / crops.
For how long you guys are planing to keep molesting the ”ESSENTIAL’ CO2?!?! All three of you are exhaling CO2, for your vocal cords to use it – to badmouth CO2. … ? Professor, you professor… what kind of nutters you are cloning from yourself? send them to my blog, for them to learn the truth
Happy new year!
VP: If GG’s basis for “It doesn’t” is that his projection is better, then he’s wrong about that as I’ve just been arguing.
I’m saying actually fitting an exponential to the MLO data without placing constraints on the constant base level provides a much better fit to that data than imposing a speculative base level and only using two points from the whole MLO data set. In that respect my fitted exponential better characterises the MLO data than your AGW model. That much is clear for all to see in the first graph I presented.
http://i48.tinypic.com/snouvl.png
I’m also saying that extrapolation of _any_ exponential function that far outside the calibration period will have huge uncertainty because of nature of exponential functions. I’m sure I don’t need to explain that to you.
I am not suggesting extrapolating mine one is good idea, I simply plot the two side by side to show how seriously your poor fit deviates from a good fit in just 40y let alone 90y.
I am pointing out that your single exponential is a very poor fit to the post 1960 rise which is supposed to be causing alarming AGW, because you only use two data points from this period when there is 640 individual monthly averages available. As such it does not represent “busness as usual.
I am noting that your single exponential systematically deviates from the MLO data. It crosses in 1975 will less slope, is more concaved over the entire length and then leaves around 2010 with a notably steeper slope. As such it does not represent “busness as usual.
You will note on the first of my graphs (linear scale), that actually fitting an exponential to MLO gives a lower initial value about 275ppm. This should not be taken as an estimate of pre-industrial since post 1960 growth is far higher and cannot be taken as being representative of earlier emissions. The point is, that if an exponential model is to be assumed, this is the fit that you get for post 1960 growth ie “business as usual “. This plot shows how poorly an attempt to fit a single exponential to the whole of 1750-2010 period represents the recent data.
http://i48.tinypic.com/snouvl.png
An exponential that already has an exaggerated slope by 2010 is going to be far worse by 2100.
You said you were “more than happy” to retract your extrapolation to 2100 and the claim that this represented business as usual “for the purposes of this discussion.
I asked you to clarify whether that was just an attempt avoid addressing the issue here or whether you were prepared to truly retract this “future = SAW+AGW” claim.
So far you have avoided replying to that simple question three times now. It is odd how reluctant you are to clearly state your position on key issues. Let’s try again. FOURTH time of asking:
VP: All I claim is that my model is an excellent fit to HadCRUT3. This is demonstrated with the obtained R2.
No, that is not “all you claim”. That is another false statement.
PAST AND FUTURE
TRENDS
The curves below show
past CO2 and business-as-
usual future CO2 on a log
time scale. Future is
simply the extrapolation of
SAW and AGW.
VP: Hence for the purposes of this thread I am more than happy to retract both the panel at lower left plotting CO2 from 4 MYA to 2100 and the whole of the right column.
So what’s with conditional retraction? Either you retract or you don’t. I can understand that you now want to walk away from that untenable projection to focus on something else, so let’s have a clear statement on this.
Do you retract your claim that the raised exponential you call AGW can be EXTRAPOLATED out to 2100 with 1000 ppmv, greater than 4 deg,C anthropogenic warming and the claim that this represents “business as usual” ?
> No, that is not “all you claim”. That is another false statement.
I believe that Vaughan here means that this is his main claim.
If you disagree with that, that means you can show us a claim in that blog post that goes beyond this.
A claim is a substantiated assertion pertaining to the subject matter.
Not some kind of speculative remark.
Something we could call a thesis, i.e. the conclusion of the overall construction of the post.
***
So please back up this assertion by providing a quote.
A quote containing a claim.
Many thanks!
Well if “what Vaughan means” is something other than what he presented to AGU at the fall meeting and the rest of the world here, then he needs to retract the bits that were incorrect and not “what he meant”.
Until he does so I see no justification for you speaking on his behalf.
Likewise, I can only comment on what he actually wrote here which includes a non-factual statement, aka a false claim.
What you “believe” he meant is of no interest to me.
Many thanks!
” With either dataset, the model forecasts a 4 C rise for 2100.”
Is that a claim? Quasi-claim?
Don Montfort,
The quote:
> With either dataset, the model forecasts a 4 C rise for 2100.
(1) comes from the paper, which is not what has been asked, and is (2) an arithmetical consequence of the model, which is arguably a weaker claim than claiming that you’ve modelled **is an excellent fit to HadCRUT3**.
It is a weaker claim because you need more than Excel to excel in showing it, as Vaughan excellently done here.
> Well if “what Vaughan means” is something other than what he presented to AGU at the fall meeting and the rest of the world here, then he needs to retract the bits that were incorrect and not “what he meant”.
A simple quote would suffice.
Put up or shut up, pretty please with some sugar on it.
Science mushes on, AK!
http://www.alaskadispatch.com/article/forget-global-warming-alaska-headed-ice-age
Now the top is getting as cold as the bottom too.
Willard: “Put up or shut up, pretty please with some sugar on it.”
Which part of : “What you ‘believe’ he meant is of no interest to me.” Are you having trouble with?
The expression of “for the purposes of this thread” ain’t that tough to understand either.
You still owe us a quote.
And just to make sure we agree about the meaning of the word quote, here’s one:
> Figure 7 was careful to say “extrapolate” and not “forecast,” and to make business-as-usual CO2 a condition, but in hindsight I should have left it out altogether to avoid any confusion.
http://judithcurry.com/2012/12/04/multidecadal-climate-to-within-a-millikelvin/#comment-275293
You still owe us a quote.
A quote that looks like what was quoted after the “>”, uttered by the same person.
Willard
You are making a fool of yourself by harping on the difference between an “extrapolation” and a “projection”.
Vaughan’s chart shows temperature (from human CO2 emissions) rising by 4+degrees by 2100.
If he did not want to “project” this, he should simply have left it out of his presentation.
Simple enough.
Max
Thick as a brick.
We have evidence that Vaughan does seem to make a distinction between extrapolation and prediction:
> I did not make any predictions. I did extrapolate the model in a side bar (on the left), but extrapolation is not prediction. I don’t claim to know whether the doubling time of CO2 emissions will increase or decrease over this century. Even if it increases for population (i.e. population grows more slowly in future), any matching decrease in doubling time for per-capita energy consumption will offset that increase and CO2 emissions will therefore continue to follow the curve. We have no way of knowing, and guessing wrong could be bad.
http://judithcurry.com/2012/12/04/multidecadal-climate-to-within-a-millikelvin/#comment-274619
His projection simply follows from his model.
You don’t like his projection, deal with his model.
Or better yet, propose a better one.
***
That Vaughan wanted to show this extrapolation in his poster does not necessarily (an important modality for skeptiks) entail that he is commited to discuss it here.
Not that he hasn’t commented on this projection already.
Vaughan’s not owing any knee bending here.
Willard (thick as a brick)
I have made a projection (see above post to Jim D). Bases and sources are shown
When someone plots a graph showing future development as part of a “poster” or paper, it can be called an “extrapolation”, a “projection”, a “forecast” or a “prediction”.
It can also be called a “pipe dream”, a “crystal ball look into the future”, a “wet dream”, a “scare story” or really anything you want to call it.
Unless you want the reader to assume that it is a serious projection of what might actually occur in real life, you had better label it (in bold letters, so no one overlooks it) as something that has nothing to do with reality.
Got it?
(Or are you really “Willard the dullard” – as thick as a brick?)
Max
Y’all predict, project, forecast, and extrapolate warming, yet it is cooling. The Dismally Scientific fools among you predict, project, forecast, and extrapolate disaster from warming, yet the warming of the last two centuries was a great boon for all life, including, almost irrelevantly, humans.
Who do we think we’re kidding?
============
The fact that X can do something does not necessarily imply that Y did or will do the same.
In our case, Vaughan has clearly delimited the scope of his analysis.
And this scope does not go as far as predicting anything.
Thick as a Brick.
willard,
I wonder if pratt appreciates you being silly, on his behalf.
Some buddy said something about claims. This is my turf.
If you want to have a personal chat with him, you can easily find his email.
Wow you work in insurance
Yeah, and gold digging too.
haha. As I was driving home, the prospecting pun occured to me and I hoped to make it home in time to beat you to it. Alas, I did not.
The whole, projection, prediction, forecast, debate must be very interesting to folks in rhetoric. Question. If I belong to a profession that is “defined” by making predictions, what care should I take when I start making “projections” instead of predictions. Seems to me that at times, folks want to have it both ways. Listen to my projection as if it were a prediction, but if im wrong, recall that it was only a projection.
One reason why you cant simply garner the meaning of the text by looking at what the words say but should also take notice of what they do ( hint I have an affinity for some of Staney fish’s work )
If Vaughan had said he personally was predicting 4 C by 2100, even I would understand complaints about that wording in a scientific paper, but he said that the stated model was forecasting 4 C, which is a much softer phrase.
Mosh,
Sure, there is a rhetorical side in science. In fact, there’s a rhetorical side of every human endeavour. Harré’s proposes that we model man as a rhetorician:
> [W]e should look upon speech and action in a human being as persuasive, as expressive, as being used in the light of the orator, rhetorician, propagandist, etc. wishes them to be seen.
This quote comes from **Arguing and Thinking**, by Michael Billig, a guy who takes Protagoras so seriously as to make the contradictory process the root of human thought.
You’d like this book, perhaps even more than me.
***
I’m not sure how far we can a terminology protect a gullible population from abuses of statistical inference. In any case, this could be the responsibility of many institutions: professions, corporations, govs, medias, scientific, etc.
Ruling out connotations might always be tough. It might even be impossible to do so, considering the fact that they’re connotations.
But we should try first.
willard,
This post is about the AGU poster, willard:
“The title of this post is taken from my AGU Fall Meeting poster presentation on the afternoon of Tuesday Dec. 4 (tomorrow).
You can view the poster from the comfort (?) of your terminal at where you can click on the View-ePoster tab.”
Check out the link, willard. If you need help, just ask. You will find the quote I left for you above came from the poster. Here it is again:
” With either dataset, the model forecasts a 4 C rise for 2100.”
Is that not a “claim”, willard? I will help you. Yes, it is a claim.
Case closed. Enough of this foolishness.
That couldn’t be clearer. Vaughan Pratt’s model forecasts a 4C rise for 2100. In previous responses to me up thread he denied he’d made any forecasts or projections. That’s just one of the many lies he’s told on this thread along with the frequent obfuscation, deceit, misrepresentation, avoidance and habitual dishonesty. The man has no professional, intellectual or personal integrity. he is a disgrace to climate science and joins with many of his peers he act similarly.
@Peter Lang: In previous responses to me up thread he denied he’d made any forecasts or projections.
I was referring there only to my poster, which makes no forecasts or projections, only an extrapolation anyone could have made for themselves based on the AHH formula in a side panel unrelated to the poster’s flow.
That does not mean I never forecast. For example I forecast that Peter Lang will never in his lifetime acknowledge that solar panels are plummeting in price.. (I bought my 7.5 KW of rooftop solar PV panels 3.5 years ago, which are currently saving me 90% of my previous electricity costs with no help from subsidies, but would have saved $20K more if I’d waited for panel prices to drop.)
joins with many of his peers he act similarly.
Faint praise. Had Peter said I was even worse than my peers I would have taken it as a serious mark of respect. ;)
Don neglected to follow the instructions he quoted above: “The title of this post is taken from my AGU Fall Meeting poster presentation on the afternoon of Tuesday Dec. 4 (tomorrow). You can view the poster from the comfort (?) of your terminal at where you can click on the View-ePoster tab.” Don omitted the last step, whence his confusion: he quoted from the abstract instead of the poster. Whether by mistake or playfulness I wouldn’t know, though he’s certainly been pretty playful up to now.
As I said here, the poster subsumed the abstract.
I must however take part of the blame: AGU provided a direct link to the poster, which for reasons I don’t understand I was unable to find when I responded to Judith’s request for a post on Dec. 3 (the day before the presentation). I made do with the only AGU link I could find at the time that would take the reader to the poster, and wrote “You can view the poster from the comfort (?) of your terminal at where you can click on the View-ePoster tab,” in the expectation that those able to follow technical posters could also follow instructions. So far I haven’t seen any counterexamples. ;)
@Don Monfort: Enough of this foolishness.
You go first, Don. ;)
Don Montfort,
I asked for a claim from the blog post. You provided a claim which was not from the blog post.
We must distinguish what is being done in the poster and what is being done here. In the poster, Vaughan made a descriptive and a speculative claim. Here, Vaughan wants to talk about the descriptive claim he made.
Since you’re so good at reading Vaughan, I’ll let you decipher which is which.
In other words, you want Vaughan to talk something he already said many times was off topic. Not because he recanted them, but because people confuse projection with prediction. Just take a look at what Peter Lang just said.
Is that too difficult to understand?
***
Vaughan takes responsibility for this possible confusion and wants to stand that aside. Why? Not because this claim is contentious, simply because it’s just a consequence that has no importance whatsoever for what he seeks as feedback here.
OK. You don’t like “4 C”. We get that. But now, please stop looking like a stupid cow looking at a passing train.
This is not where you should look, Don. This is just a result that obtains after his model runs in the future, assuming constant evolution. The weaknesses are earlier than that.
Playing mindgames about conterfactuals will have to wait another thread. I can play them if you really do need to play. If you can’t even get a quote right, chances are you won’t find this fun.
I think he’s just trying to score debating points with his fellow skeptics, Willard. If he succeeds it will say more about them than about Don, who in their eyes will have been a success.
Vaughan Pratt said,
This is another statement of Pratt’s ignorance or dishonesty, or his inability to think rationally and logically.
Yes, the costs of solar panels are decreasing. But to what when they drop from 10 times to expensive to a little bit less too expensive. The comments are selective and silly, or more likely just misleading. If his system was not connected to the grid and it was providing power cheaper than supplied by the grid, or anywhere close to that, then his numbers may have some relevance. At the moment they are just nonsense. The claimed savings are complete nonsense.
http://www.cato.org/publications/policy-analysis/humanity-unbound-how-fossil-fuels-saved-humanity-nature-nature-humanity
On that basis, subsidies for solar power are >1000 times higher than for fossil fuels, >200 times more than for nuclear and can’t even provide power through the night. Imagine running our hospitals with solar panels. What a joke. The sun goes down in the middle of a hear transport, after the faulty heart has been removed and the Doctor says mate, sun has gone down. Your replacement is sitting on the window sill. I’ll come back tomorrow. Do you reckon you can hold on that long? All the best.
Does the dishonest maths professor understand what orders of magnitude means?
@Peter Lang: Yes, the costs of solar panels are decreasing.
For obvious reasons I’d be very interested to know if PL has ever acknowledged this online before. All my previous attempts at doing so have failed.
subsidies for solar power are >1000 times higher than for fossil fuels
That’s very interesting. The most widely cited number for fossil fuel subsidies is $630B for 2012 for the planet, type
630 billion fossil fuel subsidies
to Google, or drop the 630 for a wider range.
For the sake of round numbers I’ll assume 10 Tw of fossil fuel power for 2012 and 10,000 hours in a year, feel free to refine those if it seems necessary. That’s 100 petawatt-hours of fossil fuel energy for the year. $630B divided by that many watt-hours equals 0.63 cents of subsidies per KwH.
A thousand times that much comes to $6.30 in subsidies per KwH of solar PV. Now I get around 30 KwH a day out of my $50K system (before panel prices plummeted), and have had it for around 1300 days for a total of 40,000 KwH. Hence a quarter of a million dollars in solar PV subsidies have been going to someone.
Since that “someone” is not me, Peter Lang would appear to have stumbled on an even bigger scam than the Enron debacle. As the whistle-blower here Peter could potentially get billions here. As the one drawing this to his attention I would happily settle for a mere 10% commission on anything he gets from my pointing this out. Fair enough, Peter?
Vaughan Pratt,
Another example of your continuous misrepresentation and lying. You know that we are comparing subsidies for electricity generation. You know that because the quote is comparing subsidies for solar power, nuclear power and coal fired electricity generation.
You know full well that the subsidy for fossil fuels you are quoting is not for electricity generation. You know this because I’ve told you every time you’ve raised this. You ignore the facts and continually post the same misrepresentation.
That is being dishonest. In your case it is clearly habitual.
Half a billion in subsidies went to Solyndra alone.
I suppose with California’s heinous residential electricity rates a team of squirrels running inside a wheel connected to a generator would be cost effective so long as acorns aren’t being subjected to any environmental taxes.
At $0.11/kWh unlimited from the electrical co-op where I live in south-central Texas solar panels could be free and it still woudn’t be worth it. I looked into it as recently as two years ago and panel cost then was about 50% of the installed cost.
It’s moot now. Instead of getting my electricity cheaper I reduced my need for it instead. The ground temperature where I live is 72F year-round below about 3 feet underground. So I excavated a hillside and built partially underground. Now I use about $50 worth of electricity from the grid every month. Your system at $50,000 in capital cost, even if it lasts forever and has no operating expenses, is costing more than $50/mo. in lost interest income. And it has a service life of 25 years at best so you’re losing an additional 4% per year of the principal. Your economic math in the PV system sounds about as realistic as your AGU poster. I doubt it’s cost effective even at California electric rates.
Hi Brandon –
In light of my seemingly gratuitous insult, your polite response is admirable. That is what I would call “pulling a Fred Moolten” and it is what I normally aspire to. In the present case, I failed. Sorry about that.
In the future my reference will be “riding a parallel track”. Any reference to your name will be complimentary, only. Hope that helps to make amends.
bi2hs
Vaughan Pratt,
Is it true your poster says:
Here is what we can read on the general information tab:
> We analyze and compare the monthly global land-sea surface temperature datasets HADCRUT3 and HADCRUT4 for 1850-2010 by subtracting two analytically modeled components and demonstrating with a suitable low-pass filter that the residue contains no significant fluctuations with periods longer than the 22-year Hale cycle. It follows that the two components are essentially all there is to recent multidecadal climate thus understood. With either dataset, the model forecasts a 4 C rise for 2100.
To know what is on the poster, one needs to click on the view eposter tab, which leads to this document:
http://fallmeeting.agu.org/2012/files/2012/12/GC23C-1085.pdf
On this document, we can read on the bottom left:
> The curves below show past CO2 and business-as-usual future CO2 on a log time scale. Future is simply the extrapolation of SAW and AGW .
Extrapolation can be helpful when we can’t do much more.
All this for one little trivial box.
PS: “Business-as-usual” might not be the most precise term here, Vaughan: “by inertia” or “all parameters held constant”, perhaps?
Willard,
Thank you for confirming that Pratt’s poster says:
He denied to me he’d made any forecasts.
He lied.
That is just one of many times.
As I said, he is a habitually dishonest. And people like you who try to bury the fact in spin and obfuscation, instead of admitting to the fact he lied, are little better.
The major issue for me is not just that one maths professor who is an ardent supporter of the ‘Progressive’s’ beliefs including CAGW, lied. It is that many of the supporters of the CAGW religion say nothing to try to stop the high priests and disciples of the CAGW orthodoxy from being dishonest.
> Thank you for confirming that Pratt’s poster says […]
It was a pleasure to prove that you can’t read, Peter Lang.
A poster is a poster.
An abstract is an abstract.
The meaning of “forecast” in the abstract has to be interpreted as “projection”. This is what is being written in the poster.
Here’s another formulation of what Vaughan did:
> My analysis is nothing more than one way to decompose HadCRUT3 — it certainly doesn’t rule out the possibility of better decompositions. A better one would be great!
http://judithcurry.com/2012/12/04/multidecadal-climate-to-within-a-millikelvin/#comment-274309
Go ahead and try to find somewhere where Vaughan says he’s not decomposing.
Some may extrapolate that Vaughan’s a litch, and therefore will never decompose.
Willard,
More obfuscation. Why would anyone trust anything any of you doomsayers say?
willard –
Not that I would in any way make excuses for my friend Peter – I have to say that it might be better if you didn’t assert that he can’t read. I’m quite sure that he can read…
What is interesting, IMO, is how despite his ability to read, his biases color how he reads, what he ignores, fails to assimilate, fails to understand, fails to take into account, fails to address, etc.
He is certainly not alone in letting his biases affect his reading, but he does often provide a textbook case of motivated reading.
Peter Lang,
Here’s our conversation so far:
– Does V’s poster contain the word “forecast”?
– No, it was the abstract, and it meant “projection”.
– Thank you for confirming that V’s poster contain the word “forecast”.
– The please was all yours. V’s not saying what you’re implying.
– More obfuscation.
David Mamet could not have done better.
Perhaps mike?
And thanks to josh, for his unbiased opinion on Peter’s biasness. Too funny. All we needed was some more comedy on this thread.
Joshua says,
Another brilliantly constructive comment by Joshua (not!).
But, Joshua, do you think you, with your incessant ideological drivel and mind that automatically repels any ideas that might not fit with your ideology no matter how rational and logical they might be, might be a much better case of what you accuse me of?
> I’m quite sure that he can read…
Properly?
Perhaps.
If his life depended on it, I’m sure he would.
But not in his comment when he says he’s being “confirmed”.
In any case, point taken.
It has been proven that Peter Lang has not properly read Vaughan’s abstract, which he insisted to call a “poster”, and my explanation to him.
Peter, Joshua is rather spot on here, as is willard.
You havent take care to read all the relevant documents and understand what the author means. As with any document or set of documents constructing a meaning is not as starightforward as ‘reading the words”. Luckily, Dr, Pratt is here to explain what he was trying to get at. What was important in his mind and what was not. Of course, we need not take him as an authority on his own text and its “meaning”, but it would take a powerful argument to overtake it.
The core text is the poster. the abstract speaks for the poster, summarizes the poster, its an advertisement for the poster. We would read the abstract and then go find dr, Pratt and watch him present his poster. ( at the AGU hall, its quite fun. a mad house ) So, the core claims are in the poster.
The core claims center around the decomposition of Hadcrut3/4.
The extraploation/projection/forecast/prediction out to 2100 is not a central claim. I wouldnt even call it a claim. If it were a central claim, the argument would be structured differently. If it were a central claim you would see him arguing about why he thinks the future will actually proceed along a BAU pathway. I dont know anyone who believes that emissions will proceed along a BAU pathway, but we all show what one could expect if that were the case. Of course it wont be the case, and we all know it wont be the case. Nevertheless, folks show a BAU scenario. I always just view it as a ‘marker’ or benchmark, a wag, line in the sand.
Anyway, once you understand the core text, the poster, you can start to look at the abstract. We dont judge books by their title, or cover or foreward, forewards, abstracts, prefatory material is typically subordinate to the chief text. Its suppose to guide or control your reading, but very often you will find tension between the synopsis and the full text. Some folks have made whole philosophical careers over the subtle interchange between a foreward ( which is writen after the text) and the text ( which appears after the foreward ) In any case, where the abstract and the text are in tension, normal practice is to give the text priority.
Here we also have the advantage of asking Dr. Pratt and he makes it clear what is important and what is not important.
That said. Do you find the prospect of 4C warming to be comforting or concerning?
You’d make a good teacher, Moshpit.
willard –
Just to clarify (because I respect your opinion, and I’m interested in this question as an observer of blog exchange).
I think of it as analogous to the difference between hearing and listening…
If there is no intent to reach any sort of mutual understanding, there is likely to be a big gap between the two.
Peter may have read your comments carefully and simply not understood. In that case whether he read it “properly” would be an interesting question. Can someone read something properly if they haven’t understood it?
Or he might have understood but simply failed to assimilate, or take into account, or to address – for whatever reasons. Would those failures imply “improper” reading? – I think maybe not (and I think those explanations are more likely than the “failed to understand” explanation.
“Properly” seems to me to be inherently subjective. I’m quite sure the he thinks (and I would assume Don likewise) that he’s read it “properly”
—-
None of that can support a conclusion about what he “can” do, however, if there is an intent for good faith dialog (or as you suggested, if his life depended on it). The problem here is that since good-faith intent is lacking, it is not possible to know that he “can” do from this example. However, I think we can see that in other exchanges where Peter seemed to have good-faith intent, he “can” read.
Is that last part what you meant by “point taken?”
I think Mosher has explained this, from the abstract:
“With either dataset, the model forecasts a 4 C rise for 2100.”
It was a hook to boost attendance for the real poster, which made no such claim, unless one looks at chart #7.
It seems to me that pratt is playing the ‘I want to be a famous climate scientist game’. My last word on this thread.
Joshua,
By point taken, I meant to express that my bowing to your analysis.
Just like I’ll do for your latest one.
As long as you know what I meant, all is well.
***
Don,
Thanks for playing and you can thank Providence that I’m not Big Dave.
Moshtwit,
You miss (or intentionally avoid) my point entirely. Vaughan Pratt has been avoiding direct answers to direct question, obfuscating, diverting and making misleading statements throughout this thread and previous threads. He is frustratingly dishonest – like a slimy lawyer-politician. His prattle about renewable energy is a classic example. That was my main point. Earlier on this thread he said to me he misleading said he had not made any forecast/predictions/projections, whatever. He lied. But that is not just one occurrence. If you are of a mind to accept this behaviour and condone it, that’s your business.
You asked:
Well the answer depends on the impacts, doesn’t it? You remember? The question you didn’t want to answer. So you flew into one of your Moshtwit aggressive, arrogant, totally unwarranted abusive tantrums saying, in part, no one has the right to ask you, the Great Moshtwit, questions. Because, in your pompous, arrogant opinion about yourself, only you have anything of value to say and only you and other down in the weeds computer jocks like you have influence. What a twit. But all you want to talk about is down-in-the-weeds irrelevancies. You said: ‘we’ve moved on; its all about impacts now’. Yet, when you were asked “what are the impacts?” you flew into one of your insulting rants.
As far as I am concerned you are just an arrogant, pompous, big ego, twit – Moshtwit.
When you can provide a reasonable answer to the question I asked (What are the impacts?), I may, perhaps and over an extended period of time, reconsider my opinion of you. In the meantime, you are just a twit.
Pity to come down to this level, this is what the climate blog sites degenerate to.
yes, Don.
If i wanted to “fault” Dr. pratt for anything I would fault him for “deceptive” advertising. The abstract advertises or highlights a projection that is really not a core aspect of the main text. Personally, i hate writing abstracts just because of the temptation. On the other hand, since I know each and every claim about Xc warming in 2100 is based on a dozen assumptions, I’m never intrigued by them. its like a product claiming new and improved. cynical I know. Anyway, Im sure Dr. Pratt has done enough penance for a loosely written abstract. He provided his code for people to check. i dont give a rats ass if he didnt write a perfect abstract.
The abstract and poster are after all just advertisements for the actual math. he gave you the real math, screw the text.
Peter, Dr. Pratt doesnt owe you answers. You have no power to command answers from him. I tried to explain this to you before. And tried to give you an object lesson. you don’t get to set the agenda. Recall what happened when you tried. And guess what. I dont get to set the agenda. And I cannot command people to answer my questions. Now, when i taught of course I could command answers. As a boss I can command answers. But here? Doesnt work that way. Do you understand what posing a question does?
Peter, do you understand the difference between
A) you having the right to ask a question. AND
B) you assuming that others have an obligation to answer?
I’ll try to explain again. you have every right to ask questions. You should not assume that others feel an obligation to answer.
Somehow, arrogance is related to that. have you ever heard the phrase
“you spot it, you got it?”
He who smelt it dealt it.
Steven,
Unlike some others on this thread who have been stonewalled by the prof, I am not qualified to evaluate the maths. However, I have had some experience and success at extracting the truth out of people, who strongly preferred not to give it up. Pratt reminds me of some of the more slippery of the lot. My professional opinion is that he is dishonest.
Moshtwit,
You asked:
Next comment you rebuked me for asking questions including this:
And this self-promotion:
You really are a pompous, arrogant twit, aren’t you? Who gives you the right to advise me whether I am allowed to ask questions or not. Who on Earth do you think you are? Why do you think you have the right to ask me questions but I don’t have the right to ask questions?
Go back and play with the other infants you clearly like to bully in your sand pit, Twit!
Just out of interest, were you an abused child? Is that why you act as you do?
Scratch your itch.
On January 2, 2013 at 11:49 pm, Don Montfort wrote:
> My last word on this thread.
On that same thread, a bit later (January 3, 2013 at 1:01 am):
> My professional opinion is that [Vaughan] is dishonest.
We will leave it at that.
For the moment.
> Earlier on this thread he said to me he misleading said he had not made any forecast/predictions/projections, whatever.
Citation needed.
Not that I’m demanding it.
It’s just needed.
For Peter’s claim sake.
Since it’s my its, here’s a first scratch:
> If my spreadsheet could predict I could get rich off it. My spreadsheet doesn’t have a clue about the future, all it can do is extrapolate. Anyone can extrapolate trends, the only use that is in setting the odds when placing bets. It’s hard to make any money betting when the odds are reasonable and the bookie takes his cut.
http://judithcurry.com/2012/12/04/multidecadal-climate-to-within-a-millikelvin/#comment-276700
Would that be a good example, Peter?
I’ll wait for your answer by finding all the sentences that contain the word “dishonest” in the thread.
Not that I’m demanding anything, mind you.
Perhaps I should quote them. What do you think?
Peter, let me explain again for about the 10th time.
You are allowed to ask questions. Nobody can stop you from asking them. The fact that you ask them should prove this to you.
However, you cannot SUCCESFULLY command ANSWERS.
That is, you can ask, but you cannot sucessfully command others to answer. I am sorry you dont have that power as I’ve pointed out before.
A policy maker can ask questions and expect or even demand an answer. Their questions matter, yours do not. Mine dont matter either.
As I said, when I taught, i could command answers. What is bathos?
and if a student could not answer or would not answer i could use non linguistics measures to assert my power. Also as a boss if I ask an employee what he thought about say.. which chip is better, the nvidia or the ATI, he would have to answer or risk me taking action.
So, when you badger people here to answer your questions, my suggestion to you is this: you dont have the power to command answers, so you are better off not pestering people with questions. Especially questions that are stupid or off topic or assume facts not in evidence.
Of course some people have success ordering others around. That itself is an interesting topic, willard is a good source and follows these things quite well. So to repeat. you can ask questions. you do ask questions. nobody owes you an answer. especially when the questions are dumb
Moshtwit,
Let me explain to you for the 10th time: don’t waste your time trying to lecture me on what I can and can’t do, ask, say or how I say it. Get it, yet? Dope! (‘Dope is your term directed to others, frequently)
Who do you think you are? Dope!
What right do you believe you have to tell others on this web site what they can and cannot say? Dope!
Are you suffering attention deficit syndrome? Are you feeling insignificant? Not getting the attention you feel you deserve? Out of your depth in the real world where your beliefs are of no significance? Want your job back preaching to children again? (pity help the children you taught)
Please, Moshpit, answer this question: “Is your bully boy behaviour a result of abuse you’ve suffered? Perhaps the social scientists here may be able to help you with your personal issues.”
While I am at it I’ll point out for the benefit of other readers, your attempt to mislead with your latest comment. In your latest comment you are trying to make out you didn’t say: “You dont get to ask questions.” .
This is your latest comment:
[Perhaps Moshtwit should reference where I ever said I can command answers]
Below is what I asked Mosher originally and some of Moshtwit’s respknses (to me and others).
I asked the following:
He has never answered that perfectly reasonable question. Instead he flew into an abusive tantrum including telling me I don’t have the right to ask questions, e.g. here: http://judithcurry.com/2012/11/20/whither-wither-climate-science/#comment-270011
What an infantile response to my perfectly reasonable question to his unsubstantiated statement about his beliefs.
Peter, I’ve asked you two questions in my last comment in this subthread.
I’m still waiting for your answers.
Steven Mosher: That said. Do you find the prospect of 4C warming to be comforting or concerning?
You did not ask me, but here is my answer: I find Vaughan Pratt’s analysis merely to state that it is possible, on present data, to find a low-dimensional (i.e. few parameters) model that has a modeled increase of 4C by 2100. His model goes into the archive of models that have been fit to extant data. By 2025 it may be possible to evaluate the accuracies of all the model predictions for 2012 – 2025, and reach a reasonable conclusion as to which model(s) might most be relied upon for planning the subsequent 75 years. There are models that predict a couple decades of cooling, and models that predict a century of cooling. Each model fits some subset of the extant data. You can pick a model that ignores data you don’t want to model (years 0 – 1850 perhaps), or criticize a model that fits data you think are less important,
Do you find the prospect of a 4C cooling to be comforting or concerning? Which ever outcome you worry about the most — 4C warming, 4C cooling, oscillations within 1C of the mean over the last 15 years — there’s a model for that.
I believe the question was :
> Do you find the prospect of 4C warming to be comforting or concerning?
And I believe Marler the statistician’s answer was: yes, no & maybe:
You #QuarterBacks, go and answer
> Does possibility P1 worry you?
with
> Look, another possibility P2!
> There are a so much of other possibilities P1, P2, …, Pn to worry about, or not.
!
;-)
willard –
My takeaway from MMarler’s comment is that the question as originally posed is unintelligible.
You have to specify p(4C) if you want to restrict answers to concern or comfort. Get it now?
If not, what is your one word answer for 0.0 < p(4C) < 1.0?
;)
bi2hs
> My takeaway from MMarler’s comment is that the question as originally posed is unintelligible.
Please, bluesea, channel your inner Chewbacca and say that Mosh’s question makes no sense.
Channeling our inner Chewbacca might always be possible: we could conjecture that with enough parsomatics, any speech act can become unintelligible.
Let’s call this the Chewbacca Conjecture.
This conjecture is inspired by Searle’s Principle of Expressibility.
A obvious lemma is that conversation space where both the conjecture and principle hold makes for a NeverEndingAudit.
Please, bluesea, channel your inner Chewbacca and say that Mosh’s question makes no sense.
Inner Chewbacca responds:
“Given 0.0 < p(4C) < 1.0: Quick! Are you comforted or concerned?"
Do you think this is what Moshpit meant?
If you were Moshpit, what do you think he meant?
What information would it take to make it an intelligible question?
What could you ask Moshpit to help you get that information?
There’s no need to channel your inner Chewbacca, BlueSea.
You have Moshpit right in front of you and
your intuition pump next to your inner Chewbacca.
Few statements are intelligible by themselves, if any.
And we could render them unintelligible with the help
of the Chewbacca theorem.
PS: Possibility ain’t exactly probability :-P
blueice
” Do you find the prospect of 4C warming to be comforting or concerning? ”
is a perfectly sensible question. Do you find the prospect of the world cooling by 10C comforting or concerning? Do you find the the prospect of the impact of a huge comet with earth comforting or concerning?
Lets try some more. Do you find the prospect of losing 1 minute of sleep tonight comforting or concerning?
you see what i am trying to understand from people like peter is ‘what would be important to them?” Note, I dont need to say anything about the probability of these events, I’m just talking about the mere prospect of it. Now, I suspect that people do not want to answer this question, but rather they want to change the subject to its likelihood. But thats not the question. So, let me put the question to you a bit differently. Last time the average temp of the earth was 20C there were allegators at the north pole. Cool. Right now the avaerage temperature of the planet is 15C. Humans evolved and adapted to a world that has been between 12C and 14C. Would you trade our world of 15C for a world at 10C? would you trade our world at 15C for one at 20C? perfectly sensible questions.. which if you see far enough down the argumentative road, you will refuse to answer
arrg correction between 12 and 16C …
Moshtwit says:
So is the question I asked Moshtwit>
But instead of answering my question he went off on an abusive rant and claimed I had no right to ask questions. Since then he’s tried to imply he never said that and what he meant to say is I have no right to expect an answer (as if I didn’t know that already, just as everyone else blogging on a web site knows; only teachers demand answers if they ask a question!)
What a twit!
From fifteen more likely to adapt well to twenty than to ten.
=================
Steven Mosher
Did not intend to cause offense. Here’s the deal.
I have been engaged with willard in a fruitless attempt to promote a charitable interpretation of Marler’s response to your (sensible) question. willard seemed to imply that Marler’s response was not germane.
My point is that Marler is a statistician. He might easily interpret your question as: “Does 0 < p(4C) < 1 give you comfort or concern?" But I failed to calculate that my little insight also slights willard as being unable to follow the conversation.
Now he has thrown it back in my lap and refuses to let on that he really does follow the conversation. I call that "pulling a Brandon Shollenberger" (sometimes Brandon could stand to give an inch.)
To answer your question, a 4C increase in temperature by 2100 makes me uncomfortable. Somewhere, there will likely be permanent unusual trouble in paradise. Perhaps a little bit of hell on earth. However, the overall long term impact, IMO, will be much more positive than negative. Could take awhile, though.
bi2hs
BlueSea,
As I see it, MattStat took Moshpit’s question and returned to V’s result. This is fair enough, since the thread is about V’s post more than Moshpit’s question. I don’t think it does answer Moshpit’s question, or if it does, it says “here are the conditions under which I could, but for now, no comment”.
But Moshpit’s not asking if we should worry about a situation because of the plausibility of its happenstance (or whatnot, i.e. something to which the statistician is used to respond), but about the mere counterfactual case.
Forget about any kind of way of estimating the possibility, and imagine it happens: how do you feel? You have to get your intuition pump going, however uneasy “phenomenological” approaches make you without (and even with, in case of MattStat) a statistical point of view. This kind of wondering can lead to interesting thought experiments.
This is how you answered right now. Thank you. Had I acknowledged MattStat’s response, it might have been clearer. So thank you for that too.
Please do not confuse me from Chewbacca. When you have a chance, go read about Searle’s principle. Contemporary philosophers have become dry enough to inspire formally-minded minds.
Thanks blue. that is a fair answer.
Peter, un fool yourself. You have every right to ask questions. if you expect or demand people to answer them, you will be disappointed.
Let me repeat that. You can ask questions. No one can stop you. No one tries to stop you. ( and they dont take judiths blog offline because of your comments ) While you can ask questions, you are not important enough or powerful enough to demand answers. And you are not endearing enough to seduce people into answering your questions. you are not clever enough to ask smart questions or thought provoking questions. I hate to be the bearer of bad news, but thems the facts maam.
So, does the prospect of 4C of warming give rise to any form of concern in your mind? any form whatsoever? without knowing the impacts exactly are you confident that there is no reason whatsoever to even consider the question?
of course, you need not answer. In fact, I command you not to answer and since you do as I tell you you wont answer these questions. Now obey, and ignore the questions.
willard(@nevaudit): As I see it, MattStat took Moshpit’s question and returned to V’s result. This is fair enough, since the thread is about V’s post more than Moshpit’s question. I don’t think it does answer Moshpit’s question, or if it does, it says “here are the conditions under which I could, but for now, no comment”.
Fair enough.
I prefer rankings to absolutes, so i’ll say that I am less concerned about a 4C increase than I am concerned about a 4C decrease. In a followup, steve mosher has taken probabilities out of his question explicitly, so they are irrelevant to my potential answer. But the 4C did derive from VP’s post; and mosher’s view is almost always completely one-sided.
Moshtwit,
You’r repeating yourself. In response to your repetitious silly and mostly abusive comments, I’ve already told you a dozen times in response, don’t bother trying to tell me what I can and cant say. You are not powerful enough or important enough to tell me what I can and can’t say. Get it? Dope!
By the way, initially you tried to tell me I don’t have the right to answer questions. Now you are trying to change what you said. hmmm!
There is marvelous assymetry in adapting the human race to hotter or to colder. There is nothing yinyang about it; one is clearly bad and relatively difficult, the other good and relatively easy.
====================
Moshtwit, That should have said: “By the way, initially you tried to tell me I don’t have the right to ask questions.”
By the way, Moshtwit, you still haven’t answered my original question that, in trying to avoid answering set you off on your abusive rant. The question was and still is: “what are the impacts?” My question was in response to you unsubstantiated assertion that, the debate has moved on; its now about the impacts”. Since making that assertion you’ve avoided talking about the impacts and continue to talk about temperatures.
It makes one wonder why computer nerds think they are so smart, despite having next to no real world experience, and why they think justifies their arrogance. But, I guess you meet all types, on line.
http://www.worldbank.org/en/news/2012/11/18/new-report-examines-risks-of-degree-hotter-world-by-end-of-century
The World Bank commissioned a report about the impacts of 4 C specifically. They are mainly concerned with poorer nations.
blueice2hotsea:
That’s an interesting thing to hear. Could you give an example or two of where you think I should have given an inch? I won’t argue any examples you give so I’m not going to derail any conversations. I’m just curious what you have in mind.
MattStat,
In backgammon, there is this rule of thumb to check out what happens if you throw a very awful roll, say a double 5. If you have a choice between two decent moves, but one who kills you with a 5-5, it might be wise to choose the other one. It’s just a rule of thumb, which has to coexist with other ones, which are not all coherent. But unless you can make Monte Carlos in your head, you don’t have much choice to follow such rules of thumbs, or at least rely on your intuition.
Now, imagine you’re playing ClimateGammon. Like backgammon, you have two dice. Unlike backgammon, you don’t know exactly how many sides your dice have. And you also roll once per lifetime.
Such thought experiments should show that there are limitations with the assumption that we need strict probability orderings to make sense of the climate predicament. One could argue that they won’t be sufficient. One could even argue that they should be necessary either.
My point here is not to discuss these thought experiments, but to show the power of thought experiments.
Brandon Shollenberger –
Oops. Responded to you here.
blueice2hotsea, as far as insults go, that’s one of the most minor ones I’ve ever gotten. I’m not bothered by it. The only part that bugged me is I’ve never heard you say it before. It made it sound like you use my name behind my back or something. That wouldn’t offend me, but that sort of thing always feels awkward.
Anyway, no worries. It takes a lot more than that to bother me. Heck, you might even be right about me!
Another bogus claim from the Doc:
“Don neglected to follow the instructions he quoted above:”
Your link opened on the abstract, right? In the abstract you wrote:
” With either dataset, the model forecasts a 4 C rise for 2100.”
Was that a lengthy typo, or were you advertising chart #7, introduced by, “PAST AND FUTURE TRENDS”, on your quasi-poster?
You are certainly being disingenuous. How much longer will you carry on embarrassing yourself here? That is a rhetorical question. I am no longer amused by your behavior. Out.
@VP: … in the expectation that those able to follow technical posters could also follow instructions. So far I haven’t seen any counterexamples.
@Don Monfort: Your link opened on the abstract, right?
Still no counterexamples. ;)
If Don and Peter are disputing that the Hofmann CO2 model together with Arrhenius log law fitted to current data extrapolates to 4 C at 2100, they need to show why this ‘model’ doesn’t forecast 4 C by 2100. The phrase is perfectly correct in defining the model and its ‘forecast’, which of course depends on Hofmann’s CO2 model projected to 2100. The statement is one of plain mathematics with the caveat built into the word ‘model’.
Try to catch up, jim d. Pratt and his surrogate are arguing about whether he said the forecast thing in the abstract or the poster, without letting on that he said it at all. And the surrogate added the twist that he really meant projection, if he said forecast, which is the same thing. And according to them, I didn’t read the poster. I think greg has had enough of this BS and has taken a hike.
You are not nearly as smart as jim s.
Joshua,
Do you think it fair to say that Don has not grasped what is being conveyed by Jim D’s comment, or would you rather say that that he’s unresponsive to Jim D’s confirmation that the word “forecast” might very well be kosher in its context?
willard –
I missed this earlier:
I think there is no way to know which is the case. The bottom line is that it seems to me that Don has no intent to actually discuss these issues in good faith. Given his orientation (assuming I’m right), it isn’t possible to judge one way or the other. If he really did care about good faith exchange of perspective, we might conclude that his errors are due to a lack of understanding, as I can’t think of any other explanation for repeated non-responsiveness.
The poster, Don. Not the abstract. The poster.
Here:
> The title of this post is taken from my AGU Fall Meeting **poster** presentation on the afternoon of Tuesday Dec. 4 (tomorrow). You can view the **poster** from the comfort (?) of your terminal at where you can click on the View-ePoster tab.
Have you followed these instructions, Don? In fact, have you read them?
***
If you do read Vaughan’s response, you’ll see that he’s even giving you the benefit of the doubt.
Not that he’s can’t be playful from time to time. See his retraction for instance:
http://judithcurry.com/2012/12/04/multidecadal-climate-to-within-a-millikelvin/#comment-276654
***
Simply reading you back what Vaughan said on this thread will suffice to make you regret your attitude, Don.
Stop the clowning, willie. The abstract is a summary of the poster. It had prof pratt’s picture on it, so we can reasonably presume that he wrote the abstract. With me so far, willie? He wrote it.
The quote about a forecast of 4 C by 2100, obviously refers to the poster chart #7, which I would not have been able to point out, if I had not read the poster. Clear, willie?
Prof pratt wants readers to believe that he very accurately modeled the recent climate and that his model is suitable to predict/extrapolate/forecast/whatever our future climate. The takeaway from his abstract and poster is that we will be seeing 4 C by 2100, if we continue our wicked ways. Hell, it could a be lot hotter than that, if we have a few of those deep-earthquake-heat-mantle BS thingys, in the interim.
I will sum up for you, willie:
Pratt claims (it says ALL I CLAIM, so don’t start a semantic BS argument over what a claim is):
“ALL I CLAIM TO HAVE DONE IS GIVE ONE POSSIBLE ANALYSIS OF HADCRUT3 AS A SUM OF THREE TIME SERIES, MUL, SOL, AND DEC.”
In the abstract to his poster Pratt says:
” With either dataset, the model forecasts a 4 C rise for 2100.”
That obviously refers to chart #7, in the poster. Headline for the chart #7:
“PAST AND FUTURE TRENDS”
Have you looked at chart #7, willie? There is no HADCRUT3 to analyze for the several decades leading up to 2100. What is the purpose of that chart, willie? Ask prof pratt. Maybe he will answer you instead of obfuscating. Also, ask him if he wrote that abstract.
Now, if you continue to amuse me I will reply to your next lame defense of your hero.
Don Montfort,
Seems that you’ve just discovered that Vaughan’s decomposition of HadCrut3 can make him project a 4 C rise in 2100, with the parameters held constant.
Not that he believes that these parameters will be held constant. Why do I make this mental attribution?
Because he said so.
Now, look at your own mental attribution:
> Prof pratt wants readers to believe that he very accurately modeled the recent climate and that his model is suitable to predict/extrapolate/forecast/whatever our future climate. The takeaway from his abstract and poster is that we will be seeing 4 C by 2100, if we continue our wicked ways.
With all due respect, Don, I’d like a quote for that claim.
You know what a claim means, I presume?
I have no reason to trust your reading skills.
***
To make this projection, all Vaughan needed to do was to decompose HadCrut3 the way he did, and project its function, with parameters held constant.
If you have a problem with this projection, you should take it with his decomposition function.
If you do wish to argue that you don’t accept his decomposition function because of his projection, please go right ahead:
http://en.wikipedia.org/wiki/Affirming_the_consequent
Read it again, willie. I didn’t claim that prof pratt claimed that he wants readers to believe this and that. What is it with this claim BS, all the time? I don’t have to give you any more stinking quotes. Done that. And you failed to answer my questions. Bad willie.
pro·jec·tion
/prəˈjekSHən/
Noun
1. An estimate or forecast of a future situation or trend based on a study of present ones.
2. The presentation of an image on a surface, esp. a movie screen.
Synonyms
protrusion
He said forecast, but he meant projection. Try something else, willie.
The projection would be the CO2 level, and the forecast would be the temperature for that CO2 level.
Thanks, jim d. And what would be the extrapolation, and who’s on first?
No one can forecast a CO2 level, unless you can forecast human behavior, but given a CO2 level, you can forecast a temperature. This is why the IPCC labels their scenarios projections. Hofmann’s curve is a projection (especially into the future). Arrhenius’s law makes a forecast on that projection.
Don,
I did not claim that you claim that Vaughan claims he believed what you claimed he believed.
I asked for a quote in Vaughan’s work that would substantiate the belief you’re attributing to him.
The sentence you’ve quoted so far ain’t evidence of such belief.
Without such evidence, all we can say is that you are projecting quite a lot into Vaughan’s abstract and poster.
Thank you for spelling out such projection.
I don’ know. No wait, he’s on third.
What’s on third. You are late to the game, rabbette.
‘Prediction is very hard, especially about the future’ is also connected to baseball, but has been attributed to both Yogi Berra and Niels Bohr, so possibly Yogi was quoting Bohr.
You are wrong, jim d. I can forecast a CO2 level, just like pratt has forecast/projected/extrapolated that the earth will be 4C hotter by 2100 (see the chart #7, that they don’t want to talk about). I just look at the past CO2 trends, perform a little numerology, pretend my method is solid as a rock, and I extrapolate.
We already knew why the IPCC labels their scenarios projections, jim d.
You are projecting.
@Jim D: You are projecting.
Or forecasting. Or extrapolating. Monfort seems to view these as interchangeable.
A climate skeptic who is stopped in traffic on a state highway just after passing a blind corner, who sees a car in the rear view mirror coming around that corner at high speed and desperately braking to avoid a collision, would refuse to extrapolate that car’s velocity at impact and therefore would take no action to avoid the inevitable collision.
With that analogy I infer that I have the mentality of a climate skeptic. Two days ago, 10 miles south of Carmel, CA, while traveling north on scenic coastal Route 1, SR 1, with five occupants in my car and all their luggage in the trunk, a car ahead of me stopped to turn left across oncoming traffic. I pulled up behind it to wait for it to make the turn. A red Nissan SUV came around the blind corner right behind me at high speed and rammed into the left side of my car. Although I saw it coming two seconds before it hit me I made the fatal mistake of assuming it could stop in time and that all would be well. Had I thought faster I would have just barely squeezed between the car ahead and the cliff on the right to avoid the collision.
Unfortunately I didn’t. The red car was unable to stop in time, and you can see the result here. (The back of the red Nissan is just visible behind my car where we’d pulled off SR 1 onto the road into the Rocky Point Restaurant where this happened. My German-made car is rock solid and the front of this Japanese car was quite a mess.)
Worse yet, the impact made the trunk inaccessible. Passports, meds, clothing, cash, drivers licenses, credit cards, cameras, computers, etc. were all suddenly inaccessible to us. A solid metal wall separated the trunk from the back seat.
The mentality of today’s climate skeptics is exactly the mentality of my thinking one second before the collision. All has been well in the past several decades of my driving career, so why should the next second be any different?
Why indeed?
In a single second I paid the high price of that line of that thinking, and how!
(For those with Google Earth, Streets & Trips, or any other program knowledgeable about GPS coordinates, my exact location when stopped behind the left-turning car was N 36.40286, W 121.90892. You can see the blind corner right behind me.)
Climate skeptics can rationalize anything, even this. It will be very informative to see how they go about their work in this case. I’ll be taking notes.
“Although I saw it coming two seconds before it hit me I made the fatal mistake of assuming it could stop in time and that all would be well. Had I thought faster I would have just barely squeezed between the car ahead and the cliff on the right to avoid the collision.”
Sounds like the cliff might have been more fatal.
And any distance traveled from dead stop and with less than 2 seconds
wouldn’t be far.
The analogy with matters of climate is puzzling. Me, you, and everybody on this board could not hope to do anything about CO2 emission- we aren’t in a driver seat. Obama isn’t even in a driver seat, yet he sits
there apparently doing nothing.
But then again it’s not about climate, it’s about some paper which is apparently inadequate.
Perhaps panic isn’t warranted?
And any distance traveled from dead stop and with less than 2 seconds wouldn’t be far.
Excellent point, except that it would have been just far enough that he’d have rammed the car in front of me instead of me.
Vaughn makes the classic warmist mistake. He believes thinking faster is equivalent to thinking better.
Vaughn, you thought the car behind you could stop in time. How would arriving at that mistaken conclusion earlier in time have changed anything?
This is what climate modelers do with computers. Because the computer can crunch number faster than they can they mistakenly believe it produces better answers when all it really does is produces the wrong answer faster.
LOL
You need to up your game in the critical thinking department there Vaughn.
P.S. Vaughn
Your first thought was probably the best thought anyhow. If you’d partially turned in the direction of the cliff and the car behind you had done the same he’d have pushed you over the cliff. You had no way of knowing how he’d swerve to avoid hitting you and you chose exactly the safest option which was to remain pointed straight ahead so if you were hit from behind it wouldn’t send you into the opposing traffic lane nor over the cliff but rather straight ahead in your own lane.
Congratulate yourself for a perfect reaction at the time and kick yourself in the ash for over-thinking it afterward.
Not too fast.
Not too slow.
Just fast-and-slow enough.
Goldilocks.
Vaughan, I just spotted this. If you want an analogy from this, I think the better one is the Nissan driver taking a blind corner at high speed. That is what we are doing with climate change. We don’t see well enough ahead to continue at the same speed as we have been going. Best to slow down and leave room for braking distance.
Vaughan Pratt: Or forecasting. Or extrapolating.
Do you think that the result of your modeling work provides a sound basis for any expectation about the future? If so, why? If not, is it merely a work of art? The only important question is whether its implication for the future should be given any serious consideration. Whether you call it “forecasting” etc is of much less importance.
Vintage December 9, 2012 at 3:52 pm:
> [M]y main goal is not to predict climate, or even explain it, but only to describe the multidecadal part of HadCRUT3. Explanations enter only as a motivation for descriptions that are at least consistent with the known physics and that are analytic by virtue of belonging to the class of functions containing the constant functions and closed under linear combination, exponentials, logs, and sines. The multidecadal part seems to lend itself it to simple such descriptions.
http://judithcurry.com/2012/12/04/multidecadal-climate-to-within-a-millikelvin/#comment-275240
Our emphasis.
Steven Mosher | January 3, 2013 at 12:08 am |
>>
yes, Don.
If i wanted to “fault” Dr. pratt for anything I would fault him for “deceptive” advertising. The abstract advertises or highlights a projection that is really not a core aspect of the main text.
>>
Well you may say you think it is not a “core aspect” but it is there in figure 7 and the claim is in the panel above it.
PAST AND FUTURE
TRENDS
The curves below show
past CO2 and business-as-
usual future CO2 on a log
time scale. Future is
simply the extrapolation of
SAW and AGW.
He said he was “more than happy” to retract that part “for the purposes of this thread”. I have asked him clearly four times now to clarify whether he was prepared to actually retract it and he has avoided replying to the question on all four occasions.
I can only take that as a negative. The pseudo retraction was an attempt to divert the discussion away from this issue. I called him on it and he was unable to respond.
What else is there in the poster? What else is the point of it?
The whole point of this exercise is attribute virtually ALL of the late 20th c. rise to CO2 fit a high climate sensitivity model to it and project/extrapolate the defective model out to 2100.
As he said in comments , all he did is what anyone else could do once the model is fitted. Which is of course what it was all about.
Without that, the fact he incorrectly filtered and over fitted HadCrut3 would not interest anyone. It’s a big SO WHAT?
Greg Goodman,
That seems pretty clear to me. No maths needed to understand his entire objective has been to try to support his belief. When asked questions, he obfuscates. He is habitually dishonest. Something I have found on perhaps a dozen previous threads.
@Peter Lang: He is habitually dishonest. Something I have found on perhaps a dozen previous threads.
Whereas people have found Peter Lang to have been habitually dishonest on a hundred previous threads, given that he posts on many blogs whereas I post almost exclusively on Climate Etc. Evidently I have a long way to go to overtake Mr Lang.
The premise that climate alarmists are liars while climate skeptics are honest is a creation of climate skeptics that has no other basis than that the skeptics are utterly convinced of their own honesty. The adjective “delusional” comes to mind here.
No one but these skeptics believe that the skeptics have any worthwhile science to contribute.
Vaughan Pratt,
Substantiation please for this assertion: people have found Peter Lang to have been habitually dishonest on a hundred previous threads
More dishonesty, more straight out lying lying. Just making stuff up whenever it suits him. No integrity.
“The adjective “delusional” comes to mind here.” Sure does for Pratt.
Be careful what you’re wishing for, Peter.
VP: “Whereas people have found Peter Lang to have been habitually dishonest on a hundred previous threads, given that he posts on many blogs whereas I post almost exclusively on Climate Etc. Evidently I have a long way to go to overtake Mr Lang.”
So you admit being habitually dishonest yourself then, just less so than P.L.
Good to see you are able to admit it. Finally.
@Peter Lang: Substantiation please for this assertion: people have found Peter Lang to have been habitually dishonest on a hundred previous threads
God, where to begin? Using Lang’s criterion for dishonesty, which as far as I’ve been able to tell is that those making statements he disagrees with must be dishonest even when they’ve never heard of him, one can easily find people disagreeing with him on a great many threads.
While there’s the possibility that he’s posted on fewer than a hundred climate threads in his lifetime, his ubiquity on Climate Etc. alone, where he’s posted in far more threads than I have in say the past six months, makes the chances of that less than one in a hundred.
Perhaps someone can help me here, but I’ve been unable to find a single thread where Lang did not apply at least one of the epithets in the impressive list attributed to him by Stephen Gloor back in 2010:
fraudulent
dishonest
greenwash
evangellistic
deep green religion
irrational
incompetent
gullible (like Uni of Melbourne and the academics for endorsing it).
I say fraudulent because of the many false and misleading statements throughout, eg
Gloor politely suggests “that you do indeed modify your language or back up your fraud claim with data and/or modelling other than the hand waving you are engaging in here.” Had Gloor applied Lang’s standards he would simply have called him a liar.
This has been Lang’s modus operandi on every thread I’ve encountered him on, where he’s systematically applied such epithets to those disagreeing with him. He responded to Gloor’s comment above with a ninth epithet (that he’s applied repeatedly since arriving at Climate Etc), “Coming from you, that is an example of extreme hypocracy.” Gloor, unruffled, responded “Thank you Peter for your considered and reasonable reply. I think we can see quite well how extreme your views are. Mine are somewhat more moderate however I am more advocating now limits to growth before considering energy supply whatever that will turn out to be. I see you dodged the fraud thing – are you retracting these statements?” To which Lang replied with a single sentence: “I see you dodging the economics issue, as always..”
Buck dodgers of the 21st century, if you ask me. An easy accusation to make as we’ve seen here.
Look at the whole thread here, where Lang repeatedly accuses his challengers of dishonesty. At the bottom of that page Ronald Brak sensibly suggests to Lang “And dude, relax. We’re not paid to do your bidding, and getting upset about it when we don’t do what you want us to do is just pushing you that bit closer to chucking a massive heartie.”
While I was basing my “hundred threads” estimate on Lang’s apparent definition of dishonesty, one could reasonably ask whether anyone has ever directly applied the epithet to Lang with its more usual meaning. Lang seems to pick on those too polite to accuse him directly of being a liar, but one can readily find circumlocutions such as CBDunkerson‘s “The continuing fictional works of Peter Lang” that amount to the same thing, which I didn’t have to search far for: it’s in the same thread containing Ronald Brak’s comment above.
Further down in that comment, CBDunkerson insightfully asks, “Seriously, truth time now… you’re really an ANTI-nuclear campaigner out to drive people away from the technology by promoting totally irrational arguments in favor of it. Right?” resonated strongly with me. I’ve had exactly that feeling myself for some time now. Those opposed to nuclear should thank Lang for his strenuous efforts regardless of his actual intentions.
A clear mistrust of Lang is expressed by MikeH at this thread who uses the euphemisms “vastly inflated” and “exaggerating” where Lang would be more direct.
A year ago David Arthur writes in the Australian, “Gday Peter Lang, I have encountered your continued remarks in these pages over and over again.” Unless Arthur is exaggerating the “over and over again” that should bring the score closer to a hundred. At the same thread others come as close to accusing Lang of dishonesty as good manners on the Internet normally allows.
I challenge Mr Lang to produce any sentence of mine where I myself directly accuse him of lying (as opposed to merely challenging his statements). It simply is not netiquette (see “Accusing people of lies as opposed to mistakes (especially with no basis for either accusation)”) to do so, regardless of my private opinion of his assertions. In that regard Lang is no respecter of netiquette. Nor is he alone on this thread in that regard.
Predictably Lang will respond to the above in the same manner as he has done on every thread cited above. Unless it raises a new point, responding would make the argument circular, which Mike Jonas would surely object to.
This not to say that Lang treats all his critics in the same way. BNC host Barry Brook suggested to Lang here “It is fine to put more faith, a priori, in authoritative bodies such as ABARE or the IEA, but that is quite a different matter to dismissing someone’s arguments just because you don’t judge them ‘appropriate’ to comment. That would rule out commentary from most people on almost every topic — high undemocratic and quite unfair if they are arguing something that is logical and supported.” Lang responded politely to this criticism, “Barry, I accept all that. I’ll avoid doing so in future.” Either Lang construed “doing so” very narrowly, or construed “in future” as “for the next 50 minutes,” as his very next comment on that thread was the response to Stephen Gloor I quoted at the top of this comment, the one accusing Gloor of “hypocracy.” (I don’t know about circular posters but at least I can write a circular comment.)
Vaughan Pratt: God, where to begin?
Peter Lang is the tar baby.
Vaughan Pratt said,
I don’t see that Pratt’s comment substantiates his assertion that “people have found Peter Lang to have been habitually dishonest on a hundred previous threads“. In fact, I don’t see one.
What Pratt has done is he has trolled though some three years of comments I’ve posted on web sites and selectively pulled out bits I’ve said and totally ignored to context or the response. If people want to look for that they can go to the links Pratt provided and read the context and responses. most of the threads are dominated by Greenies, ‘Progressives’ socialist types and my language is response to theirs. Many of the bloggers here who hold those ideological beliefs behave similarly on many web sites. Gloor and Arthur are two of the extreme ‘Progressive’, CAGW Alarmist bloggers. They appear on mane web sites. One of the pieces Pratt quoted was about the Conversations 13 articles written by the Australian activists CAGW extremist climate scientists for ‘The Conversation’ and coordinated by Professor Lewandowski https://theconversation.edu.au/the-false-the-confused-and-the-mendacious-how-the-media-gets-it-wrong-on-climate-change-1558. Pratt didn’t reveal that fact did he. Very selective. Misleading. Misrepresenting is a habit of his. Habitually dishonest.
Pratt is cunning, clever but I wouldn’t trust him with anything. His selective quoting in this comment is another example. More I see of his writings and put it together with him being an Emeritus Professor, the more I fear academia does not have the integrity it had. The fact he can write like this, and believe it is acceptable, suggests to me that academic scientists do not have the integrity of professionals or senior business people. The fact that other scientists who are blogging here support him endorse his behaviour strengthens my growing belief that scientists’ personal, academic and professional integrity is not what it used to be and certainly not as high as for engineers, lawyers, doctors, economists to name just four disciplines.
So, Pratt asserted
and set out a long comment to substantiate the assertion. But he didn’t provide a single example of where I’d been dishonest. But as usual, he tried to bluff his way around that by posting many comments showing where I’d responded to CAGW Alarmists using the same sort of language many of them use much of the time. But not one example to substantiate his assertion. This is another example of his deviousness.
Pratt cannot be trusted with anything. His is habitually dishonest.
@GG: If i wanted to “fault” Dr. pratt for anything I would fault him for “deceptive” advertising. The abstract advertises or highlights a projection that is really not a core aspect of the main text.
“Advertising” to whom? At the time I posted to CE on December 3 the abstract was dead and gone months earlier, and played no role in my poster presentation. Anyone talking about the abstract is doing so purely to be a nuisance and not to advance anyone’s understanding of anything. Your efforts to be a nuisance serve no purpose other than to make you look stupid.
Nowhere near a stupid as you look attributing Mosher’s comments to me.
Sorry if you find my asking difficult questions like asking you to clarify you pseudo retraction a “nuisance” . A simple yes or no answer would have sufficed.
Sorry if there was some misunderstanding.. I was refering to the rhetorical role the ‘abstract” plays in a set of documents. It serves the function of an advertisement.
> I have asked him clearly four times now to clarify whether he was prepared to actually retract it and he has avoided replying to the question on all four occasions.
Vaughan issued a formal retraction on Dec 14th:
http://judithcurry.com/2012/12/04/multidecadal-climate-to-within-a-millikelvin/#comment-276654
More than that, Vaughan set up a brand new thought experiment for Greg, to which he has yet to respond:
http://judithcurry.com/2012/12/04/multidecadal-climate-to-within-a-millikelvin/#comment-276671
What about Macy, Greg?
“Vaughan issued a formal retraction on Dec 14th:”
http://judithcurry.com/2012/12/04/multidecadal-climate-to-within-a-millikelvin/#comment-276654
LOL, You mean there was a retraction hidden amongst all that ‘baffle ’em with bullshit’ stuff about locally Euclidean 9-dimensional manifolds that ended with : “Hmm, better stop before I spout even more abstract nonsense. ”
Perhaps you repost the bit about retraction, I can’t seem to find it.
What about Macy, Greg?
***1
It was not a real retraction, Greg, because your demand is simply unjustified and a bit silly.
Vaughan was just pulling your leg.
In fact, he was poeing your leg.
The magnificience of it was that it we can surmise that it was a valid, i.e. he was not sokalizing you.
***
He did reconsider some things, though, but you’ll have to scratch your own itch for now. You need to invest more into a counter-claim for me to care. Let’s say I’m just mentioning it because you might be interested to know.
I can provide you this hint, though: you could find these concedos when he was conversing with less magnificent truth seekers than you.
Greg Goodman, January 3, 2013 at 3:15 am:
> Well you may say you think it is not a “core aspect” but it is there in figure 7 and the claim is in the panel above it.
Vaughan Pratt, December 14, 2012 at 5:18 pm:
> In the main progression flowing from top left to the conclusion and discussion of mechanisms, there is not a single word about or hint of the future, not even extrapolation let alone projection.
http://judithcurry.com/2012/12/04/multidecadal-climate-to-within-a-millikelvin/#comment-276605
So if we ignore the figure and the text panel that refers to extrapolation and misleadingly claims this represents business-as-
usual..
PAST AND FUTURE
TRENDS
The curves below show
past CO2 and business-as-
usual future CO2 on a log
time scale. Future is
simply the extrapolation of
SAW and AGW.
… there is not a single word about the future. BRILLIANT.
So, apart from the parts where he talks about the future, he doesn’t talk about the future.
Who could fault such impeccable logic? You are an absolute genius willard.
> So, apart from the parts where he talks about the future, he doesn’t talk about the future.
Right on, Greg.
And the parts where he talks about the future are not part of the core aspect of what he’s talking about.
Perhaps because what he’s talking about does not depend upon it?
Seems that Vaughan says so the paragraph just before I just quoted to you:
> There is a side bar on the left that does extrapolate the main results, but it was intended only as a sidebar (the border is color-coded accordingly, off the red-orange-green-blue-violet resistor-rainbow progression) making the obvious extrapolation, which anyone could have made themselves without my help . I said explicitly that it was “simply the extrapolation of SAW and AGW” precisely so that people wouldn’t think I was making a projection.
http://judithcurry.com/2012/12/04/multidecadal-climate-to-within-a-millikelvin/#comment-276605
Again, let me repeat that this comment was posted by Vaughan on December 14, 2012 at 5:18 pm.
My own emphasis.
***
Now, you do seem to appreciate logic. I too appreciate logic. Vaughan too, since he kinda invented dynamic logic [1]. So here’s a logical argument for you:
(1) Vaughan’s forecast directly follows from his result.
(2) Greg wants his forecast retracted.
If Vaughan retracts a forecast that directly follows from his result, what do you think this entail?
Let me give you a hint:
http://en.wikipedia.org/wiki/Modus_tollens
It’s not exactly that, since we’re talking about a retraction of a claim, and not the negation of an assertion, but that should give us a good approximation.
***
Oh, and do you know what “business as usual” mean in that context?
***
[1] http://en.wikipedia.org/wiki/Dynamic_logic_(modal_logic)
Greg,
He won’t retract it because it’s going to be the centerpiece (in a sly way) of his paper that will pass pal-review with flying colors.
Chart #7 is like the dramatic Al Gore chart from the dramatic academy award winning motion picture. It’s hockeysyckesque. Pratt is going to be famous, like Al and Mikey. Can you blame him for refusing to answer embarrassing questions?
Don,
I thought you spoke your last word.
I thought your word meant something.
I thought you were a professional.
What were you saying about honesty, again?
***
But let’s repeat what was already said:
Vaughan won’t retract it because it’s done, it’s OK, and it follows directly from his main point.
***
You have a problem with his main point?
It seems you do.
But can you contest it?
I’m sure you can.
Go for it, tiger!
I changed my mind, willie. That doesn’t make me dishonest. You are not very bright.
“Vaughan won’t retract it because it’s done, it’s OK, and it follows directly from his main point.”
Now you have stepped in it, willie. The extrapolation/projection/forecast follows from his main point. His alleged main point being that he has modeled past recent climate down to a millikelvin, as he proclaims in big red letters with exclamation points on his quasi-poster. What the unskeptical are supposed to believe is that with such a fine model one can simply extrapolate to find out what is going to happen in the future.
“PAST AND FUTURE TRENDS”
But you don’t get any of that, do you willie.
The prof would be better off without your help, willie. You are just mimicking his evasiveness, without his competence.
> Now you have stepped in it, willie.
It’s not the first time I tell you so, Don.
Please read again my first comment to you in this thread.
You’re not a very good truth seeker, Don.
> I changed my mind, willie.
A promise is a promise, Don.
You broke your promise.
You broke your promise while editorializing about honesty.
I know it’s not impossible for honest people to break promises from time to time, but I mean, come on, Don.
Let’s say it’s just “funny”.
Don –
Just out of curiosity….
Have you ever vowed to stop writing comments in response to me in the past, only to break that vow? Perhaps multiple times?
What would it suggest to you if someone repeatedly made such vows only to subsequently break them? Would it just be an issue of someone who continuously “changes [his] mind,” or do you it think it might suggest another conclusion?
INTEGRITY ™ — I Just Changed My Mind
Oh, joshie
I have made very few vows, during my lifetime. I take that kind of thing seriously. I have honored all my vows and my oaths to perform various hazardous duties in the service of my country. I have never made a vow on a non-consequential matter to a ridiculous anonymous clown shooting his mouth off on the internet.
INTEGRITY ™ — I Can Do What I Please Because You’re Just a Clown
You are a clown, willie. And you are a liar. I never issued any promise here. Now, I will show you how it works. Talk to the hand, willie. I promise to not waste any more of my time engaged in circular inconsequential banter with your silly clown ass.
Here’s what you said, Don:
> My last word on this thread.
What was that speech act?
Looks like a promise to me.
Perhaps were you only making a prediction?
Predictions seem difficult when they’re about what you will do in the next two hours.
INTEGRITY ™ — It’s Inconsequential
Don –
I’m guessing that you don’t go along with my use of the word “vow.” No problem. Allow me to rephrase:
Have you ever said that you were going to stop writing comments in response to me in the past, only to “change [your] mind”?
Perhaps multiple times?
What would it suggest to you if someone repeatedly made such statements of intent only to subsequently contradict those stated intents? Would it just be an issue of someone who continuously “changes [his] mind,” or do you it think it might suggest another conclusion?
Greg,
He won’t retract it because it’s going to be the centerpiece (in a sly way) of his paper that will pass pal-review with flying colors.
Chart #7 is like the dramatic Al Gore chart from the dramatic academy award winning motion picture. It’s hockeystickesque. Pratt is going to be famous, like Al and Mikey. Can you blame him for refusing to answer embarrassing questions?
Don for the win!
> Can you blame him for refusing to answer embarrassing questions?
“Are you agreed that beating your wife was a mistake?”
This sentence has already appeared above.
The truth lies above.
What a magnificient thread.
Let’s hope there are seven truth seekers.
The Magnificient Seven.
“God parsomatics can be fun.”
yup.
man are you dense.
What do you suppose, the future is simply the extrapolation means?
What do those words mean to you?
To me, and to dr. Pratt, they mean don’t take this too seriously because it is SIMPLY an extrapolation. not a prediction,
however, if you want to have a kitten and over interpret what He has written, please amuse yourself with your misreading, but dont for a single moment believe that the rest of us are bound by your mis reading. Some kooks looked at the mayan calendar and thought they knew what it clearly said. I’ll class you with them. Good in math horrible in interpreting the meaning of a text.
How did that happen? This thread is really getting ridiculous. sorry for my contribution. It would be nice if Judith stepped in and and mediated this foolishness.
Don,
You asked for mediation. That was mediation.
All this happened before on the thread. It always happen after the first few serious answers Vaughan try. And when he sees he’s dealing with a gentleman like you, he changes his tune and lampoons with some kind of formal wit.
This is a good way to see when gentleman like you can follow the conversation.
So when he sees buffoons like you “get the truth out of him”, as you said, he takes truth for a ride, so to speak, just to see if you can handle truth handlers like him.
In our case, Vaughan never wished to retract what directly follows from his function. He only expressed a wish not to discuss it furthermore. He discussed it enough as it is.
***
You just can’t follow the conversation. (Joshua can correct that sentence if he pleases.) Thus you’re now onto this “dishonest” dirty trick with comrade Peter over there. I eat such dirty tricks before breakfast.
Please try me.
You are hyperventilating, willie.
Wow. Just wow.
Forget the ad hom slurs back and forth plus the inane “willardisms”; Vaughan Pratt’s “Figure 7” speaks for itself.
It is a scary curve showing 4+C greenhouse warming from CO2 by year 2100; whether it is intended by the author to frighten the reader or not, that is exactly the result.
Vaughan would be well advised to remove this piece of lunacy from his poster – because it only makes him look stupid (which he is not).
Ignoring real-life constraints (population growth rates, maximum possible CO2 from all fossil fuels) when making an extrapolation is living in an ivory tower bubble and is foolish, no matter what you call the extrapolation.
Max
Quod vide
http://judithcurry.com/2012/12/04/multidecadal-climate-to-within-a-millikelvin/#comment-282123
Yeah, the figure speaks for itself, but it needs a megaphone. Thick as a Brick.
And let’s forget the main contribution from his gentle party. Can we also forget everything that was said that contains an ad him? That would make us forget about this prescription:
> Forget the ad hom slurs back and forth plus the inane “willardisms” […]
Let’s recall instead what Vaughan told about our gentle party’s standpoint:
http://judithcurry.com/2012/12/04/multidecadal-climate-to-within-a-millikelvin/#comment-276677
My emphasis.
That was almost three weeks ago.
Thick as a brick.
Your act is not convincing and it’s wearing thin, willie. We can see prof pratt’s lips move when you speak.
I’m not trying to convince you, Don. Just trying to read to you what Vaughan already said on this thread a few weeks ago.
The truth lies above. Including Vaughan’s wit.
Why a truth seeker like you would want to start a food fight, Don?
Do you spit when you say “truth”, Don?
“Ignoring real-life constraints (population growth rates, maximum possible CO2 from all fossil fuels) when making an extrapolation is living in an ivory tower bubble and is foolish, no matter what you call the extrapolation.”
Max
That is a point that Hoffmann makes in the very paper from which Pratt pulls the idea of single raised exponential. In fact that paper is primarily about exactly that, the link between population and CO2 rise.
In that context a crude fit to the whole period of both works to establish the idea that the two “track” each other.
Combining that idea with a simple log(CO2) for temp model suggested over 100y ago and a variable Hansen delay as a fiddle factor. is entirely Pratt’s work. It is unfair to project that onto the authors of any of the constituent parts as thought they worked together to create this “Law”. Or that any of them would want to be associated with it.
This ad hoc relationship is Pratt’s Law. Odd that he objects to taking credit for it.
On the December 31, 2012 at 5:36 am, Vaughan answered that one:
http://judithcurry.com/2012/12/04/multidecadal-climate-to-within-a-millikelvin/#comment-281488
That was only a few days ago.
Still no response from Greg about his triple exponential.
Nothing new under the Sun.
Non nova, sed nove.
Willard: “Still no response from Greg about his triple exponential.”
No question, no response. Nothing new under the sun.
This is just YET ANOTHER attempt by Prof Pratt to avoid addressing questions about his presentation. I never said Hoffman’s model sucks, so his comment is disingenuous and untruthful, if fact I have not criticised directly on the Hoffman part of Pratt’s Law.
“virtually no difference” is YET ANOTHER of Prof Pratt’s slight of hand techniques: criticise something in such a vague way that the criticism cannot be refuted. It fails the basic principal of being falsifiable.
He’s tried that one on me before , it didn’t work last time either.
I think Pratt’s Law is a ‘fair’ approximation if one wants to resume the three different periods of different growth in one simple formula.
What I am questioning is his taking just two points out of 648 , producing a model that enters MLO period with lower growth, systematically deviates and leaves with a higher growth rate and then extrapolating this function way beyond the calibration period and directly claiming that this represents ‘business as usual’, That is a false claim.
Anyone with any scientific integrity would address such criticism in an open and honest way. All we get from Prof Pratt is evasion, silly word games and at times down right lies.
Point taken regarding the question not asked.
Let us say that there was still a challenge to meet.
***
My turn:
> I never said Hoffman’s model sucks […]
Vaughan never said you did.
Vaughan included said “if you think […]”.
***
God parsomatics can be fun.
Too bad only God can project.
***
And now this “falsifiable” trick again.
Magnificient.
Oh, and here’s one place where Vaughan might have answered what Greg claims he has not evaded:
http://judithcurry.com/2012/12/04/multidecadal-climate-to-within-a-millikelvin/#comment-280954
That was on December 29, 2012 at 12:12 pm.
Greg does not seem to have responded to that comment.
Only mwgrant did.
@GG: What I am questioning is his taking just two points out of 648 , producing a model that enters MLO period with lower growth, systematically deviates and leaves with a higher growth rate and then extrapolating this function way beyond the calibration period and directly claiming that this represents ‘business as usual’, That is a false claim.
This is the only substantive point Goodman has made so far. While I believe it’s worth responding to, I already commented here on December 5 (the second day of this post) that Pieter Tans and agreed that the result of that way of fitting was probably too high.
What I’d like to know is (i) exactly how wrong Goodman thinks Hofmann’s formula is when parametrized as in my poster, namely with a CAGR for anthropogenic CO2 of around 2.45, (ii) whether his fit of an exponential to the Keeling curve since 1960 (the third exponential of his “triple exponential” or piecewise exponential model) is a better fit than mine, and (iii) is it sufficiently better than my fit to warrant preferring it over mine.
Without answers to those questions I’m unable to respond meaningfully to Goodman’s demand that I retract my supposedly “false claim.” That’s because his rationale for his demand seems to be predicated on answers to these questions that I have so far not been able to ascertain based on what he has written to date. For example his ” I never said Hoffman’s model sucks” that he wrote just now would seem to contradict his preference for his exponential law (at least for the period of the Keeling curve) over Hofmann’s raised exponential law. If the latter doesn’t suck then why discard it in favor of what Manacker has preferred all along (whence my calling it Manacker’s law rather than Goodman’s law). I have argued strenuously in the past that Manacker’s law does suck on the ground that it is neither as good a fit as Hofmann’s law nor as physically motivated.
This ad hoc relationship is Pratt’s Law. Odd that he objects to taking credit for it.
You were objecting to my fit of CO2 to the Keeling curve, calling it “Pratt’s law”. That fit has nothing to do with either Arrhenius or Hansen, it is nothing more than a parametrization of Hofmann’s law (or the Hofmann-Butler-Tans law if we name it for the paper that arose out of Hofmann’s AMU poster).
Or that any of them would want to be associated with it.
Unless there’s a revival of automatic writing we’re not going to find out from Arrhenius or Hofmann. In Hansen’s case you make a good point and I should check with him to see whether he would prefer Goodman’s suggestion of “Pratt’s Law” over my AHH monicker for it. However the AHH law is not the law governing fitting to the Keeling curve, which involves neither radiative forcing nor ocean warming delay.
In fact that paper is primarily about exactly that, the link between population and CO2 rise.
Then you’ve missed the point of Figure 2 of that paper, which brings in GDP. The doubling period for population growth is roughly twice that for growth of anthropogenic CO2. Per capita fuel consumption has a similar doubling period to population growth and it is their product that’s responsible for the much higher rate of human emission of CO2.
Is “Pratt’s Law” a “pratfall” – or simply “prattle”?
The mind boggles.
What a difference an hour an a half can make:
manacker | January 3, 2013 at 10:57 am
> Forget the ad hom slurs back and forth […]
manacker | January 3, 2013 at 12:27 pm
> Is “Pratt’s Law” a “pratfall” – or simply “prattle”?
Thick as a Brick.
I see it’s become a regular f*cking c*nt fest in here.
It’ll never reach that level without your magnificience, Big Dave.
Dr Singer, I thought you PhD was in a science subject, not creative writing. Maybe you should stick to your field of expertise, your grasp of Middle English is a little lacking, you keep making spelling mistakes ;)
No no. Amazingly enough all it took was you making up with quantity for what you lack in quality on the ad homs.
ad homs? Quantity? Where?
You should learn to scratch your own itches, Greg.
But here’s one quote that contains at least one:
> Perhaps you missed this exchange in your shallow perusal. Perhaps you intentionally missed it. Perhaps your brain is weasel-like in size and strength as well as attitude. I’m not sure. But in the interest of making sure you mistakes are not believed by others here it is explained.
http://judithcurry.com/2012/12/04/multidecadal-climate-to-within-a-millikelvin/#comment-274262
That one was almost a month ago.
No need to play dumb.
What the F*** has all that got to do with me ?
Springer: No no. Amazingly enough all it took was you making up with quantity for what you lack in quality on the ad homs.
and you point me to some posts by Springer.
I know it’s getting late but please try to stay awake.
Sorry, Greg. If you insist:
> [I]t may be more rational to believe in magic that to believe that anyone will get a straight answer out of Prof Pratt.
Please argue that it’s not an ad hom, Magnificient One.
Of course, I meant what Vaughan “has
notevaded”, or refused to answer, or whatever Greg Goodman keeps proving by asserting, over and over again, as if by some kind of magic it will turn out true.Easier to seek truth that way, perhaps.
Magnificient.
Good work willy, you’ve managed to understand what I was saying about making falsifiable claims. That’s another of Pratt’s techniques you’ve managed to ape.
That concept of falsifiability is sure interesting, Greg.
How does falsifying work in a conversation?
I thought it worked by first providing quotes, which you never deem to provide.
Then, by discussing what the quotes meant, something you always refused.
And finally by accepting that the whole point was some kind of meeting of the mind, and not trying to win a pissing contest, like you obviously are trying to do for almost a month.
You might know how to spell “falsifiability”, but you don’t seem to know that tune very well.
Willy:
Vaughan never said you did.
Vaughan included said “if you think […]“.
Good, that’s the Pratt “let’s play word games instead” tactic that I’ve called him on serveral times already.
Is he sitting behind you helping with all this now? Your responses are getting more and more like Pratt-like at every post.
I’ll take it as a compliment, Greg.
But no, all I asked Vaughan was if it was OK for me to make sure to clean up the claims in this thread.
And he said:
> Rotsa ruck.
You should not denigrate playing with words, because that’s arguably your most important contribution so far in this thread.
An impressive performance, if you ask me.
And I’ve seen lots of them.
Greg,
Pratt and willieboy, with a Spanish accent.
The claim that, in this thread, I’m only parroting Vaughan can easily be falsified: it suffices to show that I spoke of falsifiability, whereas Vaughan did not.
***
This comment could very well break this promise:
> I promise to not waste any more of my time engaged in circular inconsequential banter with your silly clown ass.
But it depends upon what it really meant.
@GG: This ad hoc relationship is Pratt’s Law. Odd that he objects to taking credit for it.
Sorry, I see now that I misunderstood your terminology. You wrote “I think Pratt’s Law is a ‘fair’ approximation if one wants to resume the three different periods of different growth in one simple formula.” Since this was in the context of dependence of CO2 on time I took your use of “Pratt’s Law” to refer to Hofmann’s Law. If you meant AHH then it’s probably true that I was the first to compose the three principles in a single law.
It remains to be seen whether others view either the law or the name AHH as appropriate. I wouldn’t have thought this thread either a sufficiently large or balanced sample of opinion to base a judgment on it alone.
Judged only by typing, the composition is entirely appropriate. The relevant types are year Y, CO2 level C, and temperature T. The relevant functions are typed thus:
Ha: Y –> Y (Hansen; delays year y to y + d)
Ho: T –> C (Hofmann, converts time to CO2 level)
Ar: C –> T (Arrhenius, converts CO2 level to temperature
If nothing else, at least Ar(Ho(Ha(y))) is well typed, being a function of type Y –> T, i.e. from year to temperature. There may well be problems with one or more of Ar, Ho, and Ha individually, or with either of the two composites Ar o Ho or Ho o Ha. (“o” by itself is the binary operation of composition, which is associative but neither idempotent nor commutative.) Since you’re raised a concern about Ho as being “totally inappropriate” I’m more than happy to continue that discussion in the hope of finding common ground.
a simple log(CO2) for temp model suggested over 100y ago
How are simplicity and age grounds for objecting to a law? Subsequent closer examination since Arrhenius, based on the HITRAN line spectra tables, have shown it to be a fine law, see e.g. Ray Pierrehumbert’s treatment in section 4.4.2 of Principles of Planetary Climate. Figure 4.12 shows the logarithmic dependence of unit optical thickness on CO2 level (expressed there in terms of CO2 paths). Its impact on the OLR spectrum can be inferred from the simple example in Figure 4.5 on p.218. (The poster was written for an audience familiar with this material, namely AGU attendees, and would need to be greatly expanded for a wider audience.)
and a variable Hansen delay as a fiddle factor
You may have misunderstood AHH, which takes Hansen delay to be constant, not variable. Like the other eight parameters of the law this one is varied in order to find the best fit, but once found it is thereafter constant, meaning that it is independent of year y in the formula.
As first pointed out by Hansen et al in 1985, neglecting this “fiddle factor” can result in gross underestimates of climate sensitivity. Uncertainty in that delay is widely recognized today as a major contributor to uncertainty in climate sensitivity.
The method proposed in my poster for reducing the uncertainty in the delay, and therefore in the climate sensitivity, was to fit F(v) to F3(HadCRUT3) to determine the V for which F(V) is the best fit, where Hansen delay is one of those nine parameters. Oddly the only person on this thread who has so far found a serious flaw in this method is me. This makes one wonder whether there is an unwritten rule on climate blogs against joining in any attack launched by its target.
Vaughan Pratt:
I’ve had a number of things I wanted to say, but this thread is too long already. I don’t want to try to see how much has already been said or try to follow discussions when there are nearly 2,000 comments.
That said, the “Hansen delay” is variable in that it’s a parameter in your model, and thus it can be changed. It’s variable because it’s not based on any physical grounds. In fact, it’s barely even based on logical grounds. It’s a crude kludge used to estimate a complex relationship without any way of determining its effectiveness. A parameter like that is basically just a fudge factor.
No. So no. Failing to account for delays in response time can cause such problems. Failing to “account” for it via a method that does not accurately account for it cannot. The fact there is a problem does not mean your solution has to be used. The fact there is a problem does not mean your fiddle factor is justified.
> The fact there is a problem does not mean your solution has to be used. The fact there is a problem does not mean your fiddle factor is justified.
Indeed.
Does somebody say otherwise?
Arguing from necessity is unnecessary.
@Don Monfort: I don’t think he is coming back, Greg.
Don must have missed mwgrant’s comment:
oh, the hilarity of GG et al. lurking about, “Where is he?” ” Has he shown up yet?” ” Uh, I tell you man, he afraid of us.” “Yeah, Yeah! He must be afraid of us.”
One can only infer from this that some people on this thread don’t have any other life. Since I do I’m unable to respond instantaneously to every question put to me. Not that I’m complaining: if I could respond instantaneously I’m sure I’d be long since dead of a heart attack. Pacing oneself is one approach to longevity.
@BS: That said, the “Hansen delay” is variable in that it’s a parameter in your model, and thus it can be changed.
How is that any different from what I said about that parameter? By your criterion the parameter G in Newton’s law of universal gravitation is a variable when most physicists would call it a constant. (There is considerably more uncertainty about G than about many other constants of physics because it’s so tiny.)
It’s variable because it’s not based on any physical grounds.
On the contrary it is based on the time required to warm the oceanic mixed layer, which is an entirely physical phenomenon. I’ve proposed one method of estimating that time; I don’t claim it’s the best, only the best I could come up with by November. Since then I’ve been looking into better ways.
In fact, it’s barely even based on logical grounds. It’s a crude kludge used to estimate a complex relationship without any way of determining its effectiveness. A parameter like that is basically just a fudge factor.
A similar criticism could be made in 1900 of Planck’s law, which Planck claimed governs a complex relationship between hypothetical “oscillators” that no one has ever seen except Planck in his imagination. A parameter like Planck’s constant is basically just a fudge factor in an attempt to distort the well-understood Maxwell-Boltzmann distribution so as to match the observed black body radiation. Simply subtracting one from the denominator of the Wien approximation to achieve this is a really crude kludge that just happens to work but has no physical justification other than Planck’s mythical oscillators.
After considerable discussion with Goodman and Jonas I’d formed the impression that they’re unfamiliar with the techniques of parameter estimation. Do you feel you have a better grasp of those techniques than they do?
The fact there is a problem does not mean your fiddle factor is justified.
I would be delighted if you had a better method than mine for accounting for delays in response time. If you don’t then your complaint that my method is “unjustified” is no more helpful than Goodman’s complaint that my use of Hofmann’s Law is “totally unsuitable.” If neither of you have anything better to offer than what I do then you’re not exactly in a position to complain about my methods.
The same also applies to my best-fit parameters for the AHH Law. Goodman claims that the law in the form F(v) is biased towards exaggerating recent AGW. I can’t accept this bald statement of Goodman’s without some demonstration of how I’ve been able to sneak such a bias into F(v).
I’ve been asking people for five weeks now to give a parametrization V’ (that is, an assignment of values to the nine parameters constituting v) that makes F(V’) a better fit to F3(HadCRUT3) than my F(V). (I don’t consider adding seven new independent parameters a “better fit,” and I’m mystified why David Springer would given his perpetual complaints about too many parameters.) So far the only person to improve on my 99.99% without adding more parameters is me: I achieved 99.997% simply by making very small changes to my poster’s parametrization, without adding even one new parameter let alone seven!
Yet the climate skeptics on this blog persist in claiming that the Rossander analysis with seven extra parameters and an R2 of 99.992% is superior to my analysis, despite mine having no extra parameters and an R2 of 99.997% after slight adjustment!
Well, Judith is running a skeptic blog here so I shouldn’t complain: standard practice for climate skeptics would appear to bear little resemblance to standard practice for climate scientists.
When in Rome do as the Romans. I feel like a Carthaginian in Rome on this blog.
Judith was the one who invited me to post here on this topic in the first place, for which I’m very grateful as the experience has been a real eye-opener.
Regarding Willard, he speaks for himself. If he wants to speak for me, lots of luck, Willard. (I apologize to anyone offended by my replacement of “l” by “r” in my two-word email to Willard, which I had not anticipated being posted in a public forum.)
Vaughan Pratt:
Huh? I never said it was “any different.” I merely explained why one could use the word “variable” to describe your parameter. As for G, it is considered a constant because people don’t change it. You’ve shown you’re willing to change the parameters in your model so that obviously doesn’t apply here.
Your fiddle factor will become a constant when you pick one value and say you’re sticking with it for good. But as long as you allow it to vary, it is variable.
The fact there is a physical basis for saying the response to forcings is delayed does not mean there is a physical basis for your fiddle factor. You are conflating the issue of whether or not there is a delay with whether or not your “solution” is right.
That is, unless you’ve shown some physical basis for your fiddle factor’s form and size. I can’t begin to imagine what it’d be since your fiddle factor is a purely statistical construct, but… I suppose I could have missed that in the 1,500+ comments.
I don’t care to discuss irrelevant people’s level of knowledge. Would you mind if we don’t? I assume if you’re going to basically insult people for how they handle discussions of science you won’t mind if we stick to discussions of science. I mean, I assume you’re not going to create a problem just to blame it on me.
Bull. So bull. I pointed out you’ve demonstrated no justification for including a parameter in your model. Your response is to reverse the burden of proof, saying I can’t prove you wrong therefore you’re right. That’s nonsense. In any modeling effort, you are obliged to show your parameters account for what you say they account for. If you don’t, they are indistinguishable from fudge factors that improve the fit for no legitimate reason. The fact you’ve named your parameter something doesn’t automatically mean the parameter accounts for its namesake.
I’ve raised a simple and legitimate point. I’m happy to answer any questions about it. I’m not happy to listen to you dismiss my remarks with near-derogatory comments that don’t address what I’ve said even as you act superior to others because of how “scientific” you are. So please, address this:
Any response function that involves delays cannot be fully accounted for by a simple time-shift in forcing without significant (and specific) constraints on the forcing curve. If those do not exist, a degree of inaccuracy and bias will necessarily be introduced.
Do you disagree? If not, what is the effect this has on your model?
> Your response is to reverse the burden of proof, saying I can’t prove you wrong therefore you’re right. That’s nonsense.
Chewbacca strikes again.
It suffices that Chewbacca has not proven Vaughan wrong to deduce that Chewbacca has not proven Vaughan wrong.
If we only allowed ourselves deductions, science would be quite tough. By chance we have other means:
> Abduction is normally thought of as being one of three major types of inference, the other two being deduction and induction. The distinction between deduction, on the one hand, and induction and abduction, on the other hand, corresponds to the distinction between necessary and non-necessary inferences. In deductive inferences, what is inferred is necessarily true if the premises from which it is inferred are true; that is, the truth of the premises guarantees the truth of the conclusion.
http://plato.stanford.edu/entries/abduction/
Science contains mostly races to the best explanations, not boxing matches between bloggers with attitudes who argue with necessities such as “A does not mean B” .
As obnoxious as Chewbacca might try to be won’t suffice to shift on Vaughan’s shoulder the need to prove he’s right. All he has to show is that his explanation (a concept we might need to pay due diligence as we go along) is the best we have on the table so far.
Pekka damns the poster with faint praise, willard slings the poster into limbo with quaint phrase.
====================
B.S. to V.P.:
According to my understanding of English, at no point did Professor Pratt say or imply that.
> If he wants to speak for me, lots of luck, Willard.
There’s so much gaslighting going on in this thread that just to account for the claims and counter-claims takes all my time, Vaughan. And contrary to many here, I know my limits. So I have no reason to speak for you: if I quote you, it is to make the point that quotes kill gaslighting.
For all I care, I wish somebody comes in and post a comment that refutes your quest. Not that I believe this would sadden you much: you’re a scientist and a truth seeker.
In my book, gaslighting does not count as a refutation.
Sorry about mentioning a private word. I thought it made my point clearer and I found the expression amusing.
oneuniverse, he didn’t literally say it. What he said was in the form of:
This is actually worse than I described. Vaughan Pratt says to show a flaw in his method I have to go out and find a better approach. If I can’t, I should just shut up. That’s not exactly as I described, but I was trying to be generous.
I could instead write a comment describing the absurdity of demanding people provide a right answer before criticizing a wrong one. Whether or not Pratt’s model is wrong, that’s exactly the argument he advanced in his response to me.
You misrepresented what Professor Pratt said (whether or not what he said was wrong).
You’ve often rebuked people who you say have misrepresented you, and you’ve sometimes accused them of doing so out of dishonesty. Since you’re so sensitive to misrepresentation, I’m surprised that you tolerate it in your own actions. Be consistent in applying your judgements, or, preferrably, admit your error(s), instead of excusing them by saying that what Professor Pratt said was actually worse (I disagree, and in any case, irrelevant), and that you’re just being generous.
You wrote, on another thread, that you’re incapable of self-deception – Brandon Shollenberger has assessed that Brandon Shollenberger is incapable of deceiving Brandon Shollenberger.
Unless you’re also incapable of error, is it possible that your self-assesment was wrong?
oneuniverse, I don’t understand your response. You say:
How do you think admitting and excusing something is mutually exclusive? Excusing something (almost?) always requires admitting it first. In this case, I admitted my description wasn’t truly accurate. I then gave a reason for the inaccuracy. Namely, the inaccuracy is minor and only favors Vaughan Pratt.
I both admitted my “error” and excused it. That’s what I’d expect from anyone. I expect people to acknowledge the errors and explain why they happened. I can’t see why anyone would take issue with that approach. What do you think is wrong with it? Why do you think a person can (should?) only admit or excuse an error, not both?
Clearly I don’t believe that. If I did believe it, I wouldn’t have followed my comment about being incapable of self-deception with:
Oh wait, I did say that immediately after the comment you reference. I guess you’re just asking me a question you should already know the answer to.
Of course, the entire premise of the question is silly in the first place. I’ve admitted plenty of errors on this blog and elsewhere. I obviously don’t think I’m “incapable of error.”
> I don’t understand your response.
Chewbacca’s learning about his Chewbaccattack. We can still expect he will accept arguments from the best explanation. One day.
> How do you think admitting and excusing something is mutually exclusive? Excusing something (almost?) always requires admitting it first. […] I both admitted my “error” and excused it. That’s what I’d expect from anyone.
Yet another parsomatics to make sure a comment makes no sense.
One doesn’t apologize and then provide excuses. If we accept proper manners as somewhat necessary, both are mutually exclusive. This runs contrary to the best practices of auditing and brokering, but let’s not digress.
In my opinion, this is debatable on both counts. In any case, I doubt that Professor Pratt would want you to misrepresent him as you did, however generous your intentions.
In fact, he didn’t say it at all, either explicitly or implicitly. You admit that he didn’t say it literally; you remain silent regarding a possible non-literal expression. (If you didn’t think he might’ve said it in a non-literal way either, why did you make the distinction?)
Thanks Brandon – as you point out, your answer to my question was in your following comment, in which you back-track from the certainty of “You see, I am not capable of self-deception.” by adding “I accept the possibility I am just so good at fooling myself I haven’t noticed.”. An additional possibility is that your skills at detecting your own self-deception (if it exists) are poor.
oneuniverse, I’ll note you didn’t address a major point I made in my comment. You specifically told me to do something that was illogical. I pointed this out; you responded by saying nothing. You told me I should hold consistent standards yet you are failing to meet your own. Instead, you say:
There is no functional difference between my description of Pratt’s argument and his actual argument. The differences were minor. Instead of saying “Prove me wrong,” he said, “Prove you have a better answer.” Instead of saying, “I’m right” he said, “My answer is best.” It’s the exact same fallacious logical structure.
It’s not as though anyone reading the exchange would have been mislead by my remarks. The parallels were obvious, and I quoted Pratt’s words so they were easy to examine. Unless you can show some way in which my description’s inaccuracy would create a problem, I can’t say I’m concerned about it. So please, explain:
What functional difference is there between my description of Pratt’s words and his actual words? How is the logical structure of his argument any different than I portrayed? You say it is, but you’ve given no explanation or reason.
Why in the world would you portray this as backtracking? That is like saying it’s backtracking if a scientist says, “Our data shows X. Issues Y and Z may change that.” Immediately offering additional statements to clarify things isn’t backtracking. It’s clarifying things.
You’re misrepresenting a simple clarification as a change in position. You didn’t admit the standard you demanded I follow was illogical. You didn’t admit any fault in failing to see the answer to your question or in using a nonsensical premise for said question. And yet you’re the one who said:
Chewbacca returns to his old ways:
> You specifically told me to do something that was illogical.
That indefinite description assumes what is being contested. As such, this is a fallacy. It begs the question.
***
Let’s repeat what was being contested in oneuniverse’s admonition, instead of hiding under indefinite description like Chewbacca’s doing (yet again):
> Be consistent in applying your judgements, or, preferrably, admit your error(s), instead of excusing them by saying that what Professor Pratt said was actually worse […]
In that sentence, the verb “excusing” does not mean “to apologize”, which is the meaning that Chewbacca’s injecting for him to say:
> How do you think admitting and excusing something is mutually exclusive? Excusing something (almost?) always requires admitting it first.
***
We can surmise that such parsomatic trick have a better success rate when they are coupled with indefinite descriptions.
We can confirm that quotes kills gaslighting.
***
Common sense should be enough to realize that one either apologizes or tries to justify one’s action. Not that it’s impossible to do both. The justification simply diminishes the apology.
But if common sense ain’t enough, here’s one of my favorite philosopher about excuses:
http://sammelpunkt.philo.at:8080/1309/1/plea.html
***
We hope that Chewbacca will say that J. L. Austin does not make sense.
B.S.:
This is further misrepresentation. Professor Pratt didn’t say anything like “My answer is best.”.
He wrote :
You misrepresented him by writing : “I pointed out you’ve demonstrated no justification for including a parameter in your model. Your response is to reverse the burden of proof, saying I can’t prove you wrong therefore you’re right.”
You’re now claiming that there’s “no functional difference” between your description of Professor Pratt’s argument and his actual argument. Here is a counter-proof (I’m not sure what you mean by “functional difference”, but I’m interpretting it to mean “leading to different results when applied”):
Consider the following scenario, played out under V.P. rules, and your (mis)representation of those rules.
Under V.P. rules
I have a method X. X is not known to be the best method.
You make repeated and, to the extent of your capacity, exhaustive attempts to come up with a better method than X, and fail at each one.
-> You cannot come up with a method better than X
-> X is not known to be the best method
Under B.S.’s (mis)representation of V.P.’s rules
I have a method X. X is not known to be the best method.
You make repeated and, to the extent of your capacity, exhaustive attempts to come up with a better method than X, and fail at each one.
-> You cannot come up with a method better than X
-> X is the best method.
The two “rules” come up with different results. V.P.’s results come up with a correct conclusion regarding method X, your interpreration comes up with a wrong conclusion. The two are therefore not functionally equivalent, and at least in this application, the V.P. rules are to be preferred.
Re: your claim that you are incapable of self-deception (with and without qualification), you wrote:
If the position is unchanged, then the “clarification” was void, with no effect.
Let X be your original position: “I am not capable of self-deception.”
Your modified position (call it X’) admits “the possibility I am just so good at fooling myself I haven’t noticed.”
Given X, is it possible that I (Brandon) have deceived myself? : the answer is “No.”
Given X’, is it possible that I (Brandon) have deceived myself? : the answer is “Possibly.”
X and X’ give rise to different answers, and are therefore different.
B.S.
When I suggested that you “Be consistent in applying your judgements, or, preferrably, admit your error(s), instead of excusing them [..]”, I meant the “or” in a non-exclusive sense (and/or) rather than an exclusive sense (either/or). The word “preferrably” was intended to mean, “if you choose to do only one of the two, I’d rather you chose this one”. I should’ve written “and/or” instead of “or” (or otherwise expanded the comment) to eliminate that ambiguity – my mistake. (If the “or” is interpreted as “either/or”, my suggestion still makes sense, and is in line with my original intention, but is incomplete).
You may consider it a fault that I hadn’t read your follow-up comment – others might consider it a virtue, given their evaluation of the quality of your first comment – but I side with you on that one. However, what I wrote was correct (that you’d written on another thread that you’re incapable of self-deception.). The question itself was reasonable, and its premise was not “nonsense” – it wasn’t even a premise. If you prefer, you can shorten the question with minimal loss of functionality (but some loss of intended humour) to “Is it possible that your self-assesment was wrong?”.
oneuniverse, your entire “counter-proof” used to claim I misrepresented Vaughan Pratt is dependent upon you misrepresenting matters. You refer to one quote by Pratt while ignoring the quote I specifically referenced. As you’ll recall, Pratt said:
This is effectively telling me to shut up if I can’t find a better answer. I pointed this out from the beginning. You never refuted my interpretation, and now you offer a “counter-proof” based upon quoting a different statement all together. I don’t understand why you would offer a lengthy discussion based upon ignoring the quote actually being discussed.
I asked you to justify your claim. You responded by ignoring the quote we were discussing. Similarly, you ignore my point when you say:
Of course they’re different. I never disputed that. What I said is immediately clarifying a remark does not constitute backtracking. It’s just clarification. Your response in no way addresses that point. Instead, you argue against a strawman which has no relation to what was actually being discussed. You do the same when you go on to say:
I explicitly pointed out you created a false dichotomy between admitting errors and excusing them. Your response is to say you used “or” in an inclusive way. That response makes no sense. There was no “or” between your discussion of admittal and excusing. You combined the two things I discussed with “rather than” not “or.” Your entire response rests on you referring to a word that wasn’t even part of what was being discussed.
You could have admitted the standard you told me to abide by was illogical. You instead choose to defend it in a way that could only make sense if one didn’t read the sentence in question… while quoting the sentence. Rather than admit an obvious error, you doubled down on it. Unless you start following your own standards, I’m not going to continue a discussion with you.
Chewbacca strikes again:
> That response makes no sense.
Take that philosophy of language!
***
On a related note:
> The aim of this paper is to examine how public figures realize creative forms of apologetic speech in order to minimize their responsibility for misdeeds, while calculating the costs and benefits in producing apology utterances. Based on the analysis of 354 apologies made in the Israeli public discourse between 1997 and 2004, I demonstrate tactics which range on four main categories of minimizing responsibility for misdeeds: compromising the apology’s performative verb (e.g. using the verb sorry or regret instead of apologize), blurring the nature of the offense (e.g. by apologizing for a specific component, rather than the entirety of the offense), questioning the identity of the offended (e.g. claiming that no one should be offended by the act) or questioning the identity of the offender (e.g. explicitly denying direct responsibility for the offense).
http://www.sciencedirect.com/science/article/pii/S0378216608003007
If you work through the logic I presented, you’ll see that the result is unchanged whether the “V.P. rules” are interpreted as rejecting or accepting methods for consideration when they’re not better than method X.
If you don’t accept my disproving counter-example, and still think the “V.P. rules” and “B.S. rules” are “functionally equivalent”, you’re welcome to provide the proof for your proposition.
It wasn’t immediate “clarification” – it was in made in another comment. Calling it a clarification is a face-saving description – you back-tracked (at least partially) – if you prefer, you back-pedalled, or walked back from an unteneable position.
You think I created a false dichotomy. I didn’t (as willard kindly pointed out). Not understanding or having a useful model of how it is that you repeatedly appear to misunderstand simple things I (and others) have written, I tried to help by correcting the only thing I perceived to be wrong with the sentence in question – some faulty phrasing of mine (the “or” clause). This correction led to further (IMO hallucinatory) criticism from you.
We arrive at the same conclusion but for different reasons.
oneuniverse,
You might appreciate this exchange between Chewbacca and Rob Honeycutt at Steve’s not long ago:
[Rob] Steve is using a specific legal terms that doesn’t apply to the situation.
[Chewbacca] It does help to be clear with what you’re talking about.
[Rob] You’re a very petty person when you’re cornered, aren’t you. What I’m saying is very very simple. There is one rarely used legal definition. There is a common definition that completely contradicts Steve’s selective defintion of the word.
[Chewbacca] You’re just making this up
http://climateaudit.org/2013/01/05/agu-honors-gleick/#comment-391269
Perhaps it would make too much sense to read the excuse you had in mind not as an apology but as a justification.
oneuniverse:
Of course, make bald assertions while ignoring what I say and respond to me pointing out your failure by demanding I disprove your position. Pratt wasn’t doing anything wrong so clearly you aren’t either. It’s not like you’re demonstrating the very behavior I’ve condemned all along.
You’re calling me intellectually dishonest based on the notion my clarification “wasn’t immediate” because it “was made in another comment.” The first comment was made at 12:13 pm while the second comment was made at 12:22 pm. Apparently taking nine minutes to make a four paragraph comment means I didn’t clarify things “immediately.”
That’s right. I’m intellectually dishonest because I call something an “immediate” clarification when the clarification was up nine minutes after the original material. #MakesSense
Right… I specifically criticized one thing. You ignored my criticism. I pointed out you ignored my criticism, again explicitly pointing to what I referred to. You then responded by discussing a totally different point while pretending to be responding to the point I raised. And I’m to blame.
Even if I were as wrong as you claim I am, your comments still wouldn’t make sense. They’re dependent upon such blatant non-sequitur it’s fitting you refer to willard here as he’s probably the only one who would think you make sense.
That’s right. You reach the conclusion that… I’m not going to continue discussions with you. That’s a fascinating conclusion for you to reach. As for reasons…
You post stupid comments with nonsensical claims you double down on because you are apparently incapable of admitting obvious mistakes. You call me a dishonest hypocrite while dishonestly committing every offense you attribute to me. In short, your criticisms of me are the most absurd, asinine and insane criticisms I can recall ever getting.
And in case this isn’t clear already, I’m not engaging in a discussion right now. I’m just mocking you. So no, I’m not backtracking or being a hypocrite.
By the way, I highly recommend anyone who wants to judge me as a person follow the link willard provided. The exchange he is referring to is one of the most ridiculous I’ve had on any blog. The fact he suggests I’m the one at fault in it rather than Rob Honeycutt is amazing. I don’t think willard could pick a worse example to criticize me over.
To put it bluntly, if you agree with willard at this point, you’re a loon.
@BS: Your fiddle factor will become a constant when you pick one value and say you’re sticking with it for good. But as long as you allow it to vary, it is variable.
Can you name even one fundamental physical constant that is not a variable in your sense? There are relationships between such constants that are sometimes settled, for example the speed of light in meters is defined as a specific integer, or the dalton as one twelfth the mass of a carbon-12 atom. Maybe some day Avogadro’s number will be a specific integer. However there is no fundamental constant in physics that physicists pick a value for and say they’re “sticking with it for good.”
Such physical constants are known only up to error bounds. That’s not so shocking, but sometimes revisions of physical constants move outside the earlier error bounds, which is more disconcerting.
@BS: That is, unless you’ve shown some physical basis for your fiddle factor’s form and size.
This is a fair comment. The physical basis is by analogy with a fanless heatsink, which delays the temperature rise of the CPU. That and various other such things would need a much more densely packed poster than is practical for a poster presentation, where people are walking past absorbing hundreds if not thousands of posters each day. That part of the development needs to be worked out in a longer paper, which I’m currently working on. I’ll be taking into account the helpful feedback I’ve been getting here.
I assume if you’re going to basically insult people for how they handle discussions of science you won’t mind if we stick to discussions of science.
If it came across as an insult then I’m sorry about that. Let me rephrase it as “so far I haven’t had even close to a meaningful discussion of parameter fitting with Goodman or Jason, who still haven’t explained why they consider parameter fitting ‘circular.’ ” Is that still insulting?
Your response is to reverse the burden of proof, saying I can’t prove you wrong therefore you’re right. That’s nonsense. In any modeling effort, you are obliged to show your parameters account for what you say they account for. If you don’t, they are indistinguishable from fudge factors that improve the fit for no legitimate reason. The fact you’ve named your parameter something doesn’t automatically mean the parameter accounts for its namesake.
My approach to science is description, then explanation, then theory. The first task in explaining any phenomenon should be to describe it. Without a description any attempt at explanation is shooting at a moving target.
As one possible description of MUL = F3(HadCRUT3) I’ve hypothesized that it can be described as SAW + AGW. The parameters serve the legitimate reason of describing MUL, as a prerequisite for explaining it, which in turn is a prerequisite for a full-blown theory.
If you prefer to regard description as a prerequisite for explanation is being pointless, we’ll just have to agree to disagree. I consider it essential.
If on the other hand you’re ok with describing before explaining, then would you mind saying again what your objection to my description is? I don’t have any particular physical basis as “the” legitimate reason, although seismic events at the core-mantle and mantle-crust boundaries have occurred to me as one possible mechanism. To be more plausible as a mechanism this would need to be worked out in more quantitative detail. I’ve done some of this, but it’s already much too long and detailed for the poster.
Vaughan Pratt:
When I said sticking with it, I meant for the sake of your modeling. As in, a parameter you won’t change at later dates when doing so improves your fit. Whether or not you would “stick with it” for other projects wasn’t a concern to me.
The point was if you update your model in six months, you could wind up with a different value for that parameter. That makes it a variable, not a constant. If I’m writing a program and label something a constant, it never changes (within the program). I think that’s a reasonable standard to apply.
Sorry for being unclear about what I meant.
That’s what I assumed would happen if you kept working on this project. When one has a fiddle factor, the best thing to do is to work on constraining it.
I don’t consider what I quoted an insult, so no. I was referring to other comments you’ve made. I didn’t think it was worth pointing to any specific ones since it’d just sidetrack the conversation, and I don’t think you’d disagree that you’ve insulted people on this page.
You haven’t established the form (and less importantly, size) of your time delay is appropriate. You called this “a fair comment.” However, when I initially made the same point, you basically said to shut up:
You told me I’m not in a position to raise an issue you now say is legit. Why? Because I didn’t have a better answer. That’s reversing the burden of proof.
I object to having a legitimate criticism dismissed via a logical fallacy.
Brandon,
Pratt is talking about quasi-parameters and quasi-physics. So don’t try to pin him down to anything specific. Give him some wiggle room.
For my own sake, I’m going to post a brief description of what I’m talking about in my criticism of Pratt’s one parameter. He used the analogy of a a CPU heat sink, so I’ll stick with that. h0 will be a CPU without a heat sink; h1 will be one with a heat sink. Pratt’s parameter takes the form of:
Where t is time in seconds and n is some amount of time set by the parameter. This gives us a simple, linear shift of the curve in the time domain. That’s a possible relation between h1 and h0, but it is not the only possible relation. Instead of having h1 always lag h0 by one second, we could have something like:
In this case, the heat sink is more “effective” at earlier times (likely due to limited capacity for heat absorption). The reverse could be true too (likely due to effective dissipation of heat). We could even have a more complicated case:
I pretty much picked random sequences for that, but it’s a possible relationship if various influences change within the machine (additional components turning on, fans turning on, heat exhausts opening, etc.).
If you tried to approximate any of these relationships with a single shift of n, you would introduce errors and biases. If you know the underlying relationship you can figure out what those errors and biases would be, but otherwise you can’t. And that’s the problem I have with Pratt’s delay parameter. It is not only possible that parameter introduces errors and bias. It is possible the fit is improved because of them. If that’s the case, his estimate for the other parameters is actually made worse by including a bad one.
Brandon said, “I’m talking about in my criticism of Pratt’s one parameter.”
Yep, the CPU heat sink is a tad of a stretch, but the fit is just so sexy! As long as you assume there are no longer term climate patterns and that variations in the heat distribution doesn’t impact the efficiency to the heat sink, it is just about as good as any other SWAG.
It would be more fun to compare hadcru4 SH, NH and 30-30 to the model and see if the same 14.5 year lag is required though :)
Captndallas,
Current SSW event over the Arctic proceeding rather nicely and rippling down below to the troposphere:
http://www.cpc.ncep.noaa.gov/products/stratosphere/strat-trop/gif_files/time_pres_TEMP_ANOM_JFM_NH_2013.gif
Very interesting progression of temperatures, wind, and pressure thus far for the winter over the Arctic. It will be difficult for the Arctic vortex to reform this year with any strength. Watch springtime ozone levels over the Arctic as there should be a rather impressive hole this year in March.
R.Gates, “Watch springtime ozone levels over the Arctic as there should be a rather impressive hole this year in March.” That is kinda like turning on the back-up CPU cooling fan :) I sure hope the polar bears have extra sun screen.
Judith is going to have to repaint the walls when this is over.
Only a food fight can save our Magnificient Truth Seekers, right now.
mwgrant: Judith is going to have to repaint the walls when this is over.
Oh no, it’s much more entertaining leaving it as it is. Social anthropologists of the 22nd century could have a field day with climate blogs of the 21st century.
willard (@nevaudit) | January 3, 2013 at 12:00 am |
Don’t worry. I thank God that I’m not you enough for everyone here and then some.
See what I mean, mwgrant?
Man…I knew I should not have walked thru this room on my way to the kitchen…Most places I go folks say, ‘Make yourself at home.’ Here it seems to be ‘Make yourself ad hom.’
Willy: as if by some kind of magic
Well , silly me for trying to post about something ON topic. But you have a point, it may be more rational to believe in magic that to believe that anyone will get a straight answer out of Prof Pratt.
Nice one.
Please don’t look for “brain” on this thread while returning to the living room.
Big Dave has a tendency to get into a sensibility mood when his initiative peters out.
We can almost hear him play the harp.
Greg, here’s what I was trying to be more polite when I said “magic”:
> Since you’ve been evading my responses I would level that charge at you. Accusing me of “evasive generalities” is just one of your own many evasive generalities. Mike Jonas does the same when he characterizes my (evidently failed) attempts at explaining parameter estimation to him as a “long rambling jumble of nonsense.” “Magic” (as per Arthur C. Clarke) would be more polite.
http://judithcurry.com/2012/12/04/multidecadal-climate-to-within-a-millikelvin/#comment-280954
That was on December 29, 2012 at 12:12 pm.
There are about 20 hits for the word “magic” on this thread. I’m not sure the Magnificient Truth Seekers’ position would improve if we could repeal these uses… by some kind of magic.
“We can almost hear him play the harp.”
By “We” do you mean all the personalities in that quagmire between your ears, a subset of them, or just the one that currently sits on the mouth/throne speaking in the royal sense? Eh, Sybil?
V.
http://judithcurry.com/2012/12/04/multidecadal-climate-to-within-a-millikelvin/#comment-282209
Most places I go folks say, ‘Make yourself at home.’ Here it seems to be ‘Make yourself ad hom.’
Ouch.
I caught your ad hom in
my poor ab-dom-en
(apol. Ira Gershwin, It ain’t necessarily so).
Thanks for bringing that one back willy: it’s fine example.
While VP was entertaining guests for several days, I made a number of detailed posts criticising specific points in the presentation. Instead of addressing any of them he dismissed everything, everyone had said in his absence ” esoteric and totally irrelevant details “.
http://judithcurry.com/2012/12/04/multidecadal-climate-to-within-a-millikelvin/#comment-280954
VP:”I would encourage those who’ve spent the last week complaining about esoteric and totally irrelevant details of my spreadsheet to see if they can improve on Mike’s alternative analysis of HadCRUT3, ”
When I objected that was an evasive generality he tried to divert that legitimate objection by playing more word games saying (incorrectly) that it was one of my “own many evasive generalities”.
It was not a generality it was a specific point about a specific thing he said. It was not evasive because in the very same comment he quoted me as saying:
@GG: How many times does the same point have to be proven? An equally good result can be obtained with ZERO AGW. I see no point in duplicating that result.
I has specifically addressed his suggestion and so was not being evasive myself.
So thank you once again for effectively drawing attention to Prof Pratt’s persistent disingenuous replies and untruthful statements.
I’m sure the good Professor will soon be thanking you personally for all the help.
> While VP was entertaining guests for several days, I made a number of detailed posts criticising specific points in the presentation.
No quotes. No links to show that. No summary of these points.
Plain bragging. A magnificient example of falsifiabilism semantics at work. Casual readers will recognize that Greg’s using Chewbacca’s evasive pleading.
***
Perhaps even more magnificient the omission of the fact that Greg did a bit more than that during Vaughan’s absence.
Take that “specific criticism” from Greg’s only link:
> there are only two explanations I can see for proposing that your model represents “business as usual”: either you are incompetent or you are being deceitful.
Now, that’s a specific criticism alright. I mean, how dare he use the words of those to which Vaughan defers for his work?
***
There’s this other specific criticism:
> An equally good result can be obtained with ZERO AGW.
Since Vaughan does not use his result to prove AGW, this point is irrelevant to Vaughan’s conclusion. From falsities, one can infer loads of crap. Greg’s quite magnificient at this logical prowess.
***
Then there’s this other specific criticism:
> Perhaps in stead of evasive generalities […]
Which was answered by the counter-claim that Greg has been evading Vaughan’s responses, which he still does for almost a month, now. This is not that difficult to notice this evasive behavior: Greg does the same with my own comments. As if starting a new thread made people forget about the open loops left in previous ones.
Magnificient magic tricks.
***
Greg’s truth seeking process lack everything to be felicitous.
Perhaps this process seeks something else.
A food fight, perhaps?
I bet we’ll see in the next open thread Greg will open.
Vaughan crunched numbers and obtained crunched numbers.
What a crook.
Greg since dr. Pratt assumes the truth of AGW as a premise, you are really missing the logical structure of the argument. the poor soul who argued it was circular reasoning made the same mistake.
As I’ve pointed out repeatedly to Jonas, he’s interpreting parameter estimation as circular logic. Since neither Jonas nor Goodman have uttered a word about parameter estimation one can only conclude that they have no idea what it is, how it works, what are the alternative approaches to estimating parameters, and what are their pros and cons. Both of them keep going round in circles insisting it is merely “circular logic.” Their repetition of this nonsense is the only circular thing here.
Mosher, you really need to check yourself. All you demonstrated with that contribution is that you don’t know much about formal and informal logic.
You said Pratt assumes that AGW is true. I agree.
Assuming that which is to be proven is considered by many to be form of circular reasoning.
http://en.wikipedia.org/wiki/Begging_the_question
Personally I don’t happen to agree. All Pratt did was prove that with a sufficient number of free variables you can create any possible waveform. Vaughn rationalized what appears to be a perfectly uniform exponential curve and coined a term for it The Hansen, Hoffman, Arrhenius Law. Then he used a number of variables to create another curve which, when combined with the HHA curve, produces a curve very similar to a smoothed version of the HADCRUT3 temperature record.
This was my initial assessment – that it was an exercise in curve fitting. The somebody named Rossander proved my point by eliminating the HHA curve (AGW = zero) and then used the remaining variables to recreate the same HADCRUT curve.
It’s important to note that Rossander added no variables but rather deleted whatever number of variables comprise the HHA law. AND Rossander’s fit was better than Pratt’s which just added insult to injury.
Thanks for playing, Stevie.
@GG: It was not a generality it was a specific point about a specific thing he said. It was not evasive because in the very same comment he quoted me as saying: “@GG: How many times does the same point have to be proven? An equally good result can be obtained with ZERO AGW. I see no point in duplicating that result.” I has specifically addressed his suggestion and so was not being evasive myself.
What we need here for 22nd century social anthropologists is a complete list of everyone in 2013 agreeing with Goodman’s notion of “equally good,” namely that Rossander’s R2 of 99.992% with seven extra parameters is just as good as an R2 of 99.997% with no extra parameters. So far we have Springer, Jonas, Goodman, and Manacker. If you agree with these four please sign up here so that climate skeptics can claim a consensus on the superiority of Rossander’s fit over mine.
Vaughan Pratt
Your “sign up here” post smacks of finding a (shudder!) “consensus” opinion on the validity and logic behind your poster or behind various critiques of it..
Others have questioned the bases of your statistical analysis regarding past development of human-caused increase in atmospheric CO2.
I have concentrated on your Figure 7, which “extrapolates” the observed human-caused CO2 trend for almost a century to the far-distant year 2100, where you arrive at CO2 levels exceeding 1000 ppmv and a resultant temperature increase of (gulp!) 4C.
I have simply pointed out a) that your “extrapolation” of human-induced CO2 increase does not take into account expected future trends in human population growth, and b) that your 2100 level of 1000 ppm exceeds CO2 increase that would occur from consuming all the optimistically estimated fossil fuel resources remaining on our planet.
I have shown you that, by taking these estimates into account, one arrives at a CO2 concentration by 2100 around 600 ppmv (similar to estimates made by IPCC in AR4) and a temperature increase of around 2C (using IPCC’s mean ECS estimate of 3.2C).
IOW, your claim of “multidecadal climate to within a millikelvin” is very likely to be off by 2000 millikelvins.
I have then pointed out to you that we will be able to check out your Figure 7 long before year 2100, and by 2030 (when most of us should still be around) we will either have 0.6C warming above today or your projection (‘scuse me, extrapolation) will have been falsified by the facts on the ground.
Your responses have been limited to waffles but no direct replies to my critique.
Instead, your snarly “mouthpiece” (or sockpuppet?) Willard has come back with some irrelevant posts without addressing the specific points I critiqued.
So that’s where we’ve left it.
And as far as I’m concerned that’s where it will end.
Max
I am with Eli rabbette on this one, Vaughan. I believe that both the Rossander model and your quasi-model are equally boring and trivial. You need another list.
Why do you spend any more time on boring and trivial stuff, Don Don?
But if you are up to do stuff you don’t care about, you can tell us what is a forecast in estimation theory.
Perhaps all of those who felt the heat after you yet again torched a thread, Big Dave?
Is there a personality rattling around in your head that doesn’t babble?
Do you really think that acting like a Rottweiler Puppy [1] will impress anyone except those who have to endure that act on the face of losing theirs?
If you continue like that, you’ll never become a Big Dog, Big Dave.
[1] http://redwing.hutman.net/~mreed/warriorshtm/rottweilerpuppy.htm
All I want to do is evoke a response and I thank you for yours.
You know you shouldn’t feed the trolls. But in my case you can’t resist. I’m the irresistable troll. If that isn’t your preciuous redwing book of pigeonholes you might want to see about adding it.
By the way, Big Dave, I disagree about that one:
> You know you shouldn’t feed the trolls.
I believe love and light works best:
http://neverendingaudit.tumblr.com/tagged/LoveAndLight
Best by test, as Bobby Fischer said.
http://neverendingaudit.tumblr.com/post/466386695
Willard: “No quotes. No links to show that. No summary of these points. ”
You have been following this thread since 6 Dec. , you have shown you are adept a searching the thread. You know when VP was absent , you have read my comments, you are well able to find them again (as anyone is) by searching for “guests” or the ” esoteric and totally irrelevant details “ quote I gave.
There is no need for me to post a “summary” , just go and read if you are interested.
Willy: “Which was answered by the counter-claim that Greg has been evading Vaughan’s responses…”
A claim which I dismissed yet again in my very last post which you are choosing to ignore at the same time as posting a response to. So , yes, if you play the same silly games as Pratt I will similarly refuse to be fooled and refuse to take the bait.
Willis: “Since Vaughan does not use his result to prove AGW, this point is irrelevant to Vaughan’s conclusion. From falsities, one can infer loads of crap. ”
No! He _assumes_ that all later 20th c. rise is due to AGW as his starting premise. He then arbitrarily attributes anything that does not fit this assumption to some fictitious “ocean oscillation” which contrary to his claims does not match any known ocean oscillations and for which he has no existing physical evidence. Having removed anything that differs he proudly displays a small residual. The blatant circular logic has already been amply pointed out by others.
“From falsities, one can infer loads of crap. ”
This has been an extraordinarily long thread but I think you have summed up Prof. Pratt’s presentation in a nut shell there.
Thank you, once again, for your contribution.
> The blatant circular logic has already been amply pointed out by others.
Vaughan’s argument ain’t circular:
> Actually what I’m doing is assuming AGW is true and fitting parameters. If AGW is not true then the parameters are meaningless, but if it is true then these are best esimates [sic.] of those parameters under reasonable hypotheses of why AGW is true , e.g. the blanketing effect of CO2 and the time needed to warm the ocean’s surface layer.
http://judithcurry.com/2012/12/04/multidecadal-climate-to-within-a-millikelvin/#comment-275959
That was vintage 12 December 2012.
***
Vaughan’s argument is quite simple:
1. He assumed F(v).
2. He introduced F3.
3. He found F(V) at the surface of F(v) very near F3(HadCRUT3).
http://judithcurry.com/2012/12/04/multidecadal-climate-to-within-a-millikelvin/#comment-276654
That’s why Vaughan can say that F(V) offers a goddam good fit of F(v), within millikelvins.
I say “millikelvins” because he amended his title during the discussion. Searching for “millikelvins” should be enough to find where.
The argument would need to be tightened up if we wer talking to a logician (e.g. to go from “very near” to “goddam good fit”), but it is our hope that our magnificient truth seeker will be able to cope with the missing gaps.
If not, the truth lies above.
***
Here would be a circular argument [1]:
1. Greg prefers empty generalities to quotes.
2. Greg presumes I can guess what he considers his “critiques”.
3. Greg prefers empty generalities to quotes.
A non circular argument would be:
1. Greg prefers empty generalities to quotes.
2. Greg presumes I can guess what he considers his “criticisms”.
3. Greg should provide quotes instead of presuming I can guess what he considers his “criticisms”.
A magnificient truth seeker we have there.
[1] Inspired by Douglas Walton’s example there:
http://en.wikipedia.org/wiki/Circular_reasoning
You’re making a fool of yourself, Willard. Aside from childish pedantry and other forms of nitpicking you’ve demonstrated competence in precisely nothing relevant to the math or science in dispute. Fool.
Stop yapping and bite into the logic of the argument, Big Dave.
Oh, you noticed that too. I don’t think he’s done anything but cut and paste from earlier posts since he started this farce.
Cutting and pasting arguments that are being ignored by our magnificient truth seeker might be a better way to reach understanding than to imperiously declaim over and over again the same arrests void of any substantiated arguments.
willard (@nevaudit) | January 3, 2013 at 11:08 pm |
“over and over again the same arrests”
Jim Hansen molesting coal miners again?
Look, a blackened squirrel.
He _assumes_ that all later 20th c. rise is due to AGW as his starting premise.
You’re confusing the output of least squares fitting with the input to that fitting, which had the form F(v) (v a 9-tuple of variables) with no particular choice of the nine parameters in mind. For the past five weeks I’ve been challenging people to disprove that this is the least squares fit by giving values for the 9 parameters that improve on it. If what you call my “starting premise” is wrong then you will have no trouble whatsoever in finding values for my 9 parameters that improves the fit. If however you are only able to do this by using additional parameters then you have proved nothing.
Rossander was able to find a good fit with AGW = 0 by opening up seven previously unused parameters but as I immediately pointed it is obvious that this is possible without even having to perform that exercise: it is wayoverfitted.
The only person to respond to my challenge using the original 9 parameters was me. Since people were taking Rossander’s R2 = 99.992% seriously using all ten shape parameters, I made very tiny changes to my original fit, without introducing new shape parameters, and was easily able to improve it to R2 = 99.997%.
That you refuse to accept this difference between Rossander’s fit and mine suggests that I must have hit a nerve here. Even Rossander admits that it wasn’t intended as a serious response to my challenge but was merely intended to show the dangers of overfitting, which I felt he’d done very nicely. I don’t see any disagreement between Rossander and me on this point.
which contrary to his claims does not match any known ocean oscillations
Are you denying it matches PDO+AMO? As I’ve said before and which you have pointedly ignored, it matches D’Aleo’s plot of PDO+AMO extremely well prior to the 1970’s. At WUWT Bob Tisdale challenged D’Aleo’s claim that PDO+AMO rises sharply after the 1970s, pointing out that the separate data for PDO and AMO did not support D’Aleo’s plot after 1970.
I have never claimed that the separate harmonics of SAW correspond to separate ocean oscillations; in fact I don’t even believe that. One should do the same as D’Aleo and studying PDO+AMO as a unified phenomenon.
You fail to take into account that Rossander removed all the variables that go into forming the Hansen, Hoffman, Arrhenius “Law”. I believe he actually reduced the number of variables required to reproduce your arbitrarily smoothed HADCRUT3 record by eliminating the AGW variables altogether.
VP:” Actually what I’m doing is assuming AGW is true and fitting parameters. If AGW is not true then the parameters are meaningless, but if it is true then these are best esimates [sic.] of those parameters under reasonable hypotheses of why AGW is true , e.g. the blanketing effect of CO2 and the time needed to warm the ocean’s surface layer.”
He’s mis-stating what he’s doing there.
AGW is not a binary option, it’s a continuous property , for which he has the CS parameter, So saying it is either “true” or “not true” in meaningless.
Most sceptics agree it’s “true”, the debate is over how much , not “if”.
What he is assuming , as I said above, is that ALL late 20th warming is AGW. That is contentious.
He has also recognised in comments that he was just hitting on a local minimum and that having tried other starting points the “solver” latched on to another local minimum close to the new starting values.
His conclusion is that decadal hadCrut3 can be expressed as just SAW + AGW. But since AGW is assumed and SAW is defined from the residual from subtracting AGW .
The form of SAW was not an established model or any real effect for which there is any physical evidence, it is just a story made up to fit the residual.
The whole exercise proves nothing more that what he built into it
> His conclusion is that decadal hadCrut3 can be expressed as just SAW + AGW. But since AGW is assumed and SAW is defined from the residual from subtracting AGW .
Indeed, on the basis of both premises he reached one conclusion.
> The whole exercise proves nothing more that what he built into it.
Indeed, that makes it analytical, or at the very least non-ampliative:
http://www.blackwellreference.com/public/tocnode?id=g9781405106795_chunk_g97814051067952_ss1-108
But this has nothing to do with circularity.
***
Had Vaughan offered a conclusion that goes beyond what he assumes, the Magnificient Truth Seekers would be all after him.
And in fact they already did, when they tried to compel Vaughan to retract his use of the word “forecast”.
Well I never asked Vaughn to retract a damn thing. I can’t begin to tell you how glad I am not to be in the group you call the magnificent truth seekers as that’s evidently a prerequisite.
The reason I can’t begin to tell you is because I haven’t begun to care about how you choose to categorize people. I’m a bit curious how you categorize the multiple personalities competing inside your noggin for ownership of the mouth organ.
Of course you are one of the Magnificient, Big Dave. As I said the first time, no thread can reach as much magnificience here as when you’re actively participating.
What would the Magnificient Truth Seekers do without their comic relief?
Over a month ago I exposed the truth that this was simply an exercise in curve fitting as famously stated by Von Neuman: “with four variables I can fit an elephant and with five I can wiggle his ears” and Twain’s “three kinds of lies”. Pratt fit an elephant and by so doing created Twain’s third kind of lie, lying with statistics.
There is really nothing else substantive to say so if I say anything I try to give it some entertainment value. I’m glad to see you recognized it in a fleeting moment of lucidity.
> There is really nothing else substantive to say […]
Don’t forget Box’s “all models are wrong”, Big Dave.
Doubling substance can be that cheap for you.
What he is assuming , as I said above, is that ALL late 20th warming is AGW. That is contentious.
Actually it was the opposite: I parametrized HadCRUT3 with no prior expectation of how the late 20th warming would be apportioned between SAW and AGW, and let least squares fitting find the best fit. There is nothing in my parametrization that favors either one: the best fit might well have had a climate sensitivity of 0.1, which would have made SAW swing strongly upwards. As it turned out this did not happen with the least squares fit.
The whole exercise proves nothing more that what he built into it
You have a vivid imagination. I built nothing into F(v) (the function with 9 variables) that would favor AGW over SAW. I just wanted to know how the best fit would apportion things in the late 20th century.
The form of SAW was not an established model or any real effect for which there is any physical evidence, it is just a story made up to fit the residual.
Sorry, how does SAW favor anything? Prior to performing the least squares fit there is nothing in SAW that expresses any kind of favoritism.
Foolish Willard.
My initial assement of the poster was confirmed weeks ago by Rossander.
I only need to take down the piece one time. After that I’m just here to have some fun at the expense of dipshiits like you and Pratt.
I don’t recall your answer to Vaughan’s response about Briggs, Big Dave.
Here it is:
http://judithcurry.com/2012/12/04/multidecadal-climate-to-within-a-millikelvin/#comment-275551
It was on the 10th, but you might have missed it.
But then you made 7 comments on that day in that thread alone…
He didn’t respond to more of mine than I failed to respond to his. Count ’em up if you don’t believe me. Go boy! Count!
Why would I try to substantiate claims you make, more so when it would divert us from the fact that your big trump was a major FAIL, Big Dave?
I don’t know why you choose to regain consciousness long enough to read these blogs. I can’t even begin to imagine what your further motivations are. It would be surprising if you knew as well. Maybe ask your shrink about it not me.
> In mathematics, an inverse function is a function that undoes another function: If an input x into the function ƒ produces an output y, then putting y into the inverse function g produces the output x, and vice versa. i.e., ƒ(x)=y, and g(y)=x. More directly, g(ƒ(x))=x, meaning g(x) composed with ƒ(x) leaves x unchanged.
http://en.wikipedia.org/wiki/Inverse_function
@DS: He didn’t respond to more of mine than I failed to respond to his. Count ‘em up if you don’t believe me. Go boy! Count!
David Springer is entirely correct here. I have failed to respond to almost all of his comments. How to apportion the blame?
I don’t blame you. I wouldn’t respond to me either. But then again I wouldn’t have produced a ridiculous exercise in curve fitting and have the expectation that anyone would take it seriously so I wouldn’t be in the position of being bombarded with negative criticism in the first place.
Surely you weren’t so stupid as to believe that putting your poster child about a highly controversial and emotionally charged topic up for comment on an unmoderated blog would have produced something other than what subsequently transpired?
My take is that you’re just wanting something, anything, to do in our dotage to keep your mind occupied and lacking the mental prowess to do anything noteworthy in computer science you decided to dive into a controversial subject outside your ostensible expertise. It isn’t atypical for someone in your position to do this. Typically it’s unvarnished politics though. Try running for city council. That’ll get you all the negative attention you need and maybe more.
Is that all you’ve got, Magnificient Truth Seekers?
willard, Stalin would never approve of you calling anyone Big Dave, either. Be safe my friend.
Say it ain’t so…
http://english.pravda.ru/opinion/columnists/28-12-2012/123335-americans_guns-0/
Big Joe.
VP: “Actually it was the opposite: I parametrized HadCRUT3 with no prior expectation of how the late 20th warming would be apportioned between SAW and AGW, and let least squares fitting find the best fit. ”
I recall you explained in comments that you fitted the residual from AGW exponential initially without constraining the fit , ie a simple fourrier style analysis to see what was there. A sensible exploratory step IMO.
It was then that you noticed the 2/3 ratio of two components in freq and amplitude that stood out and gave birth to your sawtooth hypothesis. You noted the fundamental was missing so locked that at zero.
You then “locked” the frequencies into your sawtooth model. It is then , having locked the form of the residual that you do the LSQ you described here.
So it is simply the “proportion” of AGW and deformed sawtooth that you are freely fitting. You have imposed the form of the residual based on what was left when you initially fitted just the exponential.
It would seem that there is strong element of induction in that method. It will tweak in the exact parameters to minimise the residual but is unlikely to deviate far from the forms you have imposed before doing the LSQ.
In imposing those conditions and “locking” into your chosen 9-space you are to a large extent locking the result.
This is in response to GG’s comment above.
Greg has quite accurately described how I converged on SAW, including the “strong element of induction” with which I fully agree.
The only point I would add is to:
It was then that you noticed the 2/3 ratio of two components in freq and amplitude that stood out and gave birth to your sawtooth hypothesis. You noted the fundamental was missing so locked that at zero.
Had it been only the 2/3 frequency and amplitude ratios I would have described the two oscillations as being rationally related, a phenomenon more often encountered in celestial orbits than in climate. However they also shared a positive-going zero crossing to within months in the best fit. This three-way coincidence led me to ask what one gets by summing sin(nx)/n, not just for n = 2,3 but all positive integers n.
The result turned out to be precisely a sawtooth, which struck me as both a simple way of accounting for this three-way coincidence (frequency, amplitude, and phase) and one that (as Greg himself has pointed out) naturally occurs in geophysics as a result of sudden events perturbing equilibrium followed a return to equilibrium that may be far from complete when the next such event occurs.
Seismic events and volcanoes are sudden, but I couldn’t see much connection, nor a mechanism by which they would be even quasiperiodic—they seem too random and the spring constants and masses too small relative to the friction losses.
However the Earth’s core is known to rotate faster than the crust, presumably as a result of the Moon’s tidal drag on the Earth slowing it down. The masses, spring constants, and friction losses are much more appropriate here for a second order differential equation that is not too heavily damped compared to plate tectonics.
Fourier analysis of tidalites suggests that half a billion years ago the Earth year consisted of around 400 days, with a proportionately shorter length of day, LOD. Much more on this can be seen in Christopher Coughenour’s 2009 PhD thesis.
Assuming conservation of both energy and momentum one can calculate that in the intervening half billion years part of the rotational energy of the Earth was transferred to the Moon, raising its potential energy (relative to the Earth, namely in effect by increasing its altitude) at the same time as decreasing its kinetic energy (namely by reducing its orbital velocity). Unlike Miskolczi’s misapplication of the virial theorem to air molecules, the Moon undergoes no significantly orbit-altering collisions, whence the Moon’s kinetic energy decreases by exactly half the potential energy increase, easily confirmed by other ways of computing the same thing.
One can further calculate that the net gain in energy of the Moon (namely half the increase in its potential energy as noted above) is less than the rotational energy lost by the Earth as it slows. In the long run this energy surplus is necessarily dissipated as heat generated by friction, turbulence, and fracturing. (Were the Earth a solid crystal ball, conservation of energy would prevent these orbital changes from occurring: the Earth could not spin more slowly and the Moon could not gain potential energy by moving away from the Earth while slowing down.)
Turbulence in both the ocean and the inviscid mantle (the part that flows freely like a liquid), as well as frictional drag at the core-mantle and mantle-crust boundaries where the mantle starts to solidify due respectively to increasing pressure and decreasing temperature, should account for most of this dissipation.
While I don’t currently know how to apportion this dissipation between the ocean and the mantle, it seems at least plausible to me that most of it should go into the mantle. If so then one can calculate that about 10% of the net accumulating geothermal energy of the Earth’s interior would arise from tidal drag involving the mantle, which plays the same role as the boundary between the brake pads and the disc or drum of your car. In effect the slowing crust is applying the brakes via the mantle to the core. Since the mantle lubricates the crust-core boundary one can expect some slippage resulting in the core always rotating a little faster than the Earth over billions of years, lapping the Earth once every one or two thousand years by some estimates.
(As a side remark, a large proportion of the remaining 90% can be attributed to the Earth’s internal nuclear reactor, namely decay of radioactive elements in the Earth. This decay is also where Earth’s ongoing supply of helium comes from, in the form of alpha particles, without which there would be no helium on Earth as it escapes quickly to space once it reaches the surface.)
These circumstances seemed to me to set up appropriate conditions both for sudden seismic events at the hardening mantle-core and mantle-crust boundaries and for waves in the inviscid part of the mantle. This fluid cavity between the crust and the core could well harbor resonances leading to standing waves whose effect would be analogous to the human vocal tract’s influence on the glottal pulses created by the glottis slamming shut every 10 ms, selectively amplifying certain harmonics to create formants F1 through F5.
To take this line of reasoning to the next stage one would need to use spherical harmonics to calculate the likely resonances. If they suggested amplification at the frequencies observed in the ocean oscillations (in the same way your shower amplifies certain frequencies of your singing) then this would strengthen this “filtered sawtooth” hypothesis. In this case the spherical harmonics would play an important role in the filtering by which the various harmonics of the putative sawtooth are attenuated or enhanced.
I have no quarrel with the objections that have been raised against my sawtooth model, namely that this sort of corroborative detail is still greatly lacking. I tried to convey the appropriate level of uncertainty in the choice of language in the purple boxes of the poster, my apologies if I did not succeed.
Vaughan Pratt, “Had it been only the 2/3 frequency and amplitude ratios I would have described the two oscillations as being rationally related, a phenomenon more often encountered in celestial orbits than in climate.”
Want a chuckle? When A. M. Selvam does her thing to isolate common frequencies in non-ergodic systems, she uses the Golden Ratio. One of the common frequency pairs should be 0.381 and 0.618, or close to 2/3. The 0.618 being 1/GR and the 0.381 being 1-1/GR. She found common frequencies for the Earth climate system to ~1500 years. Selvam is of the impression that self-organized criticality is a soft science looking for a home, with climate science being a wonderful application.
http://amselvam.webs.com/earlsel/socpp.PDF
There are quite a few interesting coincidences, but the “exactly half” does not apply in non-ergodic systems.
Oh, doc
That is a very elaborate theory you have on that mantle-crust-boundary-crust-core-fluid-heat-glotis thingy. Nobody will ever be able to prove it wrong, doc.
If that is really a quasiperiodic phenomenon, then you may have discovered the earth’s quasi-control knob, at the same time you came up with the most amazingly accurate climate model of all time. Or did you think of this deep heat theory, long before you needed an excuse for periods of warming that could not be blamed on CO2?
I will admit that you are far more creative than I. I would have come up with something less plausible, like mischievous little aliens in another galaxy trying to scare us into thinking we are going to overheat by turning some kind of undetectable ray on us, quasiperiodically.
Keep up the good work, doc. We aren’t paying any attention to Eli the rabette. According to your pal little stevie, Eli is just a jealous you-know-what, for calling your hard work boring and trivial.
By the way, Eli also said that your climate science is about as appealing to him as an ersatz carrot (as he wrinkled his little nose).
@cd: When A. M. Selvam does her thing to isolate common frequencies in non-ergodic systems, she uses the Golden Ratio.
Oddly Arj Selvam is a clothing designer in Perth who applies the Golden Ratio to his clothing designs. Now we have to find an A. Selvam that doesn’t use the Golden Ratio in his or her work. ;)
@DM: Nobody will ever be able to prove it wrong, doc.
My problem is the opposite: finding resonances that prove it right. Currently it’s missing that kind of detail, without which it is just one of various places to start looking for a 150-year sawtooth.
Or did you think of this deep heat theory, long before you needed an excuse for periods of warming that could not be blamed on CO2?
I’ve known about the core rotating well before I noticed the sawtooth structure. However it was not until several months after noticing the latter that it occurred to me that there might be a connection between the two. In between I’d been trying to come up with mechanisms that could explain multidecadal oscillations and drawing a blank.
The fact that the ocean is thermally connected to the mantle much better than the land got me to thinking about the mantle, which I already knew participated in the thousand-year or so rotation of the core. On the one hand it was just another straw to grasp at, on the other it was better than all the other straws I’d given up on.
Keep up the good work, doc. We aren’t paying any attention to Eli the rabette.
Thanks, but Eli might consider that a non sequitur re cuniculum. Overreading bunnies is every bit as bad as overfitting data. Josh is not so hungry for words that you need to put them in his mouth, he can do that without your help. ;)
I have found many speculations as possible and attractive as Vaughn Pratt’s mantle moving one. I would be the first to congratulate him if he were right, but that blessing will go to whoever proves it.
================
kim
Let’s let the thermometers out there “prove whether or not VP was right” with his Figure 7 projection:
If it warms by 0.2C from today to 2020
And then warms another 0.4C from 2020 to 2030
(Plus the same per decade until 2050; i.e. 1.4C above today’s temperature).
Then the VP
projectionextrapolation will have been proven right.If not it will have been proven wrong.
Max
@manacker: If it warms by 0.2C from today to 2020
And then warms another 0.4C from 2020 to 2030. Then the VP projection extrapolation will have been proven right.
On the contrary, I forecast some cooling from 2020 to 2030, similar to the coolings that have occurred in every “even” decade since 1870. (An even decade is one whose years have an even third digit, such as 2007 and 2027 but not 2017 or 2037.) Hence if it “warms another 0.4C from 2020 to 2030” I will have been proven wrong, not right.
Meh, provisionally proven, though I would be impressed.
===============
It would be interesting to see a forthright response to this comment from the dr. prof., but I ain’t holding my breath.
Be careful what you’re wishing for, like Peter should have.
@w: Kudos for the civility of your last comments, Greg.
Seconded.
Will comment when I get a chance. (Some comments require more thought than others.)
Well, let’s not jump to conclusions, it is a new year now. Perhaps this will herald a genuine attempt to see what this analysis can and can’t tell us about disentangling natural and AGW signals.
We’ve just survived the end of the world once, I remain optimistic.
Kudos for the civility of your last comments, Greg.
Damn, yet again WordPress fooled me into posting too high.
Vaughan Pratt | January 5, 2013 at 4:34 am |
“Damn, yet again WordPress fooled me into posting too high.”
Yeah. WordPress should have some sort of sobriety test built into it.
Since I have not investigated the topology of that space, that last phrase would better expressed: there is a danger that you are to a large extent pre-determining the result.
If the residual of that exp() was a sawtooth, then conversely the residual of the sawtooth will be an exponential. Since both have already been determined by the initial fitting of the AGW exponential, it is likely this is already near a local minimum.
Without unlocking the sawtooth that was determined from the initially assumed exp, this may even be a broader minimum within that constrained 9-space. The space that you are fitting in is the one that conforms to your initial assumption that the late 20th rise can be attributed to a scalar multiple of the exponential you have derived from emissions (and land-use) data.
That expresses more clearly the point I was making.
As a quick aside, could you explain what the x1.5 Fcomp factors are for, they compensate for what? I could not find an explanation
I don’t think he is coming back, Greg. He is busy putting the finishing touches on his paper and rounding up the usual suspects to serve as reviewers.
You and the prof. have reached a Mexican standoff, largely due to the good Dr.’s tactic of intermittently pretending not to understand the Engleesh.
This thread is in need of a summation. Due to popular demand, I will attempt to wrap it up, so we can all go home. Want to see it? Here it is:
An exchange of comments between the learned, Prof. Pratt, and the learned and cogent, Jim S., (not to be confused with Jim D., who don’t know squat) starting with the following comment:
http://judithcurry.com/2012/12/04/multidecadal-climate-to-within-a-millikelvin/#comment-277544
John S. | December 17, 2012 at 6:19 pm | Reply
The key to the whole controversy here lies not in how closely
multi-parametric curve-fitting can match an arbitrarily filtered version of
HADCRUT3, but in how closely that index and VP’s decomposition
correspond to physical reality…(the comment continues, it’s good, read it all)
and the schooling of our guest lecturer continues for a few rounds, until the pummeled Prof. Pratt fails to answer the bell after this comment:
http://judithcurry.com/2012/12/04/multidecadal-climate-to-within-a-millikelvin/#comment-281976
John S. | January 2, 2013 at 7:13 pm |
Time and again, your response seizes upon the incidental, while ignoring the substantive.
Any competent signal analyst, not just Parzen, is keenly aware that an exact Fourier decomposition of ANY bounded series of N real-valued data points consists of N complex-valued coefficients specifying the amplitude and phase of a HARMONIC series of sinusoids. The analysis tacitly ASSUMES an N-periodicity to the data, which assumption is never satisfied by real-world geophysical signals with a continuous power density spectrum. If such a signal is properly recorded over DIFFERENT record lengths, the series of harmonics changes accordingly. Thus the F. decomposition is not unique, nor is it a CONSISTENT estimator of the inherent signal characteristics. As the record length is varied, it is particularly the periodicity of the lowest-order coefficients that changes most dramatically. This analytic fact has nothing to do with signal-to-noise ratios, which your naive analysis of 161 (not 3000) yearly averages of HADCRUT3 is incapable in principle of revealing. Your fanciful SAW component is as much an artifact of nakedly assumed exponential trend as it is of record length.
As a final thought here, I can only suggest that terpsichorean skill is never a substitute for analytic competence.
END
Nice to see Don reading the thread, even if we see his lips moving.
***
Will Vaughan survive the niceties of his analytical behemoth?
Those of you in the back who witnessed too many times such academic combats, please keep quiet.
Let Don enjoy the suspense.
Vaughn’s requested willard for a reviewer.
============
http://www.woodfortrees.org/plot/hadcrut4gl/mean:1200/mean:120/plot/gistemp/mean:1200/mean:120/plot/best/mean:1200/mean:120/plot/crutem4vgl/mean:1200/mean:120
The worst thing to do is take rising curves and try to fit it with harmonics only like Rossander did. It is clear that the filtered line curves upwards in all the temperature records. Harmonics are indefensible as the main component, unless you assume this is less than a quarter of a wavelength. I would only trust harmonics that are shorter than half the record length, as VP’s main one is.
Jim D,
Jimmy, any deficiencies in Rossander’s cursory effort, don’t add any credibility to Pratt’s methods and results. It don’t work that way, Jimmy.
Pekka has strong warmist sympathies, but he ain’t that impressed with this one:
Pekka Pirilä | December 15, 2012 at 5:47 am
Vaughn
While I disagree on much of the recent critique on your work, I’m still not convinced that it allows for particularly useful conclusions at any level of detail. Many different factors have contributed and it’s difficult to imagine that many of them would not be independent and add up roughly independently to the total. Some factors (volcanic and solar) that contribute to the rise of period 1910-40 are known at some quantitative level. Taking them off based on some estimated coefficients would probably leave a residue that’s similar in overall shape but with a less pronounced SAW. Some alternative parameterization could certainly change the earliest and latest decades significantly. It’s certainly nice to have as few free parameters as possible but that’s by no means a proof that the model is more correct than an alternative that needs one or two more parameters.
Your model summarizes nicely the main low frequency features of the data but is there more to it. I’m not convinced except that I’m convinced that creating anything as plausible without a major AGW contribution is probably impossible. (The presentation of AGW might differ significantly from your delayed Hoffman in its details and its strength could also differ.)
Pekka Pirilä | December 16, 2012 at 4:45 am | Reply
Vaughan,
I have spent some time to figure out some minor technical details of the workings of your worksheet but wrote my recent comments rather rapidly as responses to Jim D’ s comments.
I have still the basic skepticism concerning the significance of being able to fit the data at the mK level. It seems too likely that there are several factors that influence the results at that level even after filtering and that must be essentially independent. Approaching the problem from that end I have the feeling that the perfectness of your fit over the period 1860-1950 cannot have any fundamental significance but must be due to the freedom that you had in choosing the model.
The Rossander model shows a clear signature of overfitting as it creates a spurious residual oscillation with a period of the 6th harmonic. Such a 6th harmonic means that it comes from overfitted 2nd and 3rd harmonics. Such overfitting was needed to produce the rapid temperature increase of recent decades that’s more naturally reproduced by AGW.
Your model does not show any similar signatures of overfitting and that’s certainly a great virtue – but as I wrote above I do still think that this just cannot be as significant as it appears.
But lets go back to what the model might indicate, when taken seriously. Your model has the SAW as a periodic function with period of 151 years. Can we think that 160 years of data (including the problematic ends) can provide significant evidence for such periodicity. I don’t think so. What we can see is that there’s oscillatory variability of peak-to-peak amplitude 0.3C in that part of the data where the approach is best applicable.
There’s less variability at both ends, but does your fit show that this is a true property of the Earth system?
I don’t think so, because the approach cannot really resolve what happens closer to the ends of the period. The lesser variability is your input to the process, not an outcome. The Rossander experiment tells that it’s almost possible to fit the whole rise with the harmonics only, fitting a fair share of it would probably be much easier. Just looking at your SAW tells that it would not be unnatural to think that the variability component would be at a level 0.1-0.2 C above your SAW around year 2000.
On the other hand I have not changed my mind on the observation that making a plausible fit without a major role for AGW does not appear possible. In this connection what’s called AGW may contain some natural longer term trend in addition of the anthropogenic contribution. Such overall AGW could well be 0.7 C rather than your 0.9 C, but hardly less than 0.6 C. Curve fitting is inefficient in separating different contributions to the long term trend from each other. Only the recent decades (last 50 years or so) have a clearly anthropogenic signature.
Pekka Pirilä | December 15, 2012 at 6:44 pm |
Jim,
You are on right track. Extrapolating the Rossander parameterization beyond the fitted period tells that the temperature was year 1800 as high as in 2010 and that there will be a sharp drop to the minimum of 1840 (little lower than 1850) by 2050.
I didn’t want to say that the Rossander fit is plausible but only that the success of this alternative fit tells about the significance that the quality of Vaughan’s fit has. The strong smoothing applied seems to make it relatively easy to find functions that fit the data well. There’s a clear
difference between the qualities of the fits over the period 1870-1950, where Vaughan’s fit is really accurate to about 1 mK while Rossander’s parameters lead to the oscillation with 10 mK full amplitude. Even so his observation adds to my reservations, which were based on the implausibility of the idea that Vaughan’s fit would really tell about some causal explanation for the variability (other than that given by smoothing).
As the comments picked by Don Monfort tell, I have my doubts on the ultimate significance of the fit of Vaughan. Even so I find it interesting and worth presenting. At the minimum the fit summarizes nicely some main properties of the time series. Having such a summary is helpful when it’s remembered that it can also be misleading.
The central part of the fit that’s obtained by dropping 10-15 years from both ends is dictated by the data. (I don’t mean that the parametrization would be totally dictated but the filtered values are.) Near the end the situation changes as the smoothing becomes one-sided and the values of the extreme years have relatively little weight in the comparison of the model with the data. The most important implication of this is that the quality of the fit doesn’t tell whether the single “SAW tooth” with smooth behavior both before and after is more representative to the data than another one that keeps on oscillating with a comparable amplitude and that makes the share of AGW less.
The example of Rossander tells that it’s possible to fit even the whole recent rise with oscillations adding a few more free parameters, That particular fit is not credible but it makes a point. To me it would be more natural that the oscillatory behavior so strongly present in the SAW continues rather than dies out and has its role in the recent rise – and also in the still more recent flattening. An AGW -like rising component would still be needed for a plausible fit but it would be somewhat weaker than in Vaughan’s model.
The smoothing that Vaughan applies is so strong that it removes signals that could be considered relevant in studying changes in climate. There’s so much variability in 5-year moving average that more smoothing is certainly needed but not quite as much as in Vaughan’s spreadsheet.
But I repeat:
There’s nothing wrong in doing and presenting such an analysis. It would be wrong to claim that it proves much, but it does certainly suggest something – and somewhat different things to each one who looks at it carefully.
Greg, and possibly Don, have realized that CO2 grows with an exponential curve. They possibly (?) even recognize the century-old Arrhenius log law that related temperature to CO2, but they seem very reluctant to use these together the way VP did to show consistency with the main part of the long-term temperature record.
Pekka,
Since you’re issuing a pretty standard comment for the genre, I see no reason for Vaughan not to acknowledge that his poster’s scope has limits. Physics-minded readers may certainly take this exercise in curve fitting with a grain of salt. In fact, Vaughan does so himself, as I underlined ut infra.
I do agree with you that summaries can be misleading, if only because it is a truism. I will simply note you used the expression “a few more free parameters” to characterize Rossander’s fit can also be a bit misleading. For politeness’ sake, let’s just say because the predicate “may be misleading” does not add much information about the quality of a claim.
(Please don’t mind my last comment, dear Pekka, for it is only there to show Don some academic combats styles. His truth seeking endeavours seem to have deprived him of such experiences.)
Jim D
It’s a bit more complicated than you picture it.
Human-caused CO2 grows with an exponential curve tied to human population growth.
More people => more human CO2 (pretty obvious, actually).
Over the past 40 years the CO2 has grown even slightly faster, as the per capita CO2 emission has increased by 20%.
Therefore, it is reasonable to assume that future growth of human-caused CO2 will also grow with human population growth – with a possible increase in per capita CO2 emissions, similar to we have seen in the past.
Human population growth over the second half of the 20th century was at a record high at 1.7% exponential growth rate.
Most projections for the future (incl. those used by IPCC) estimate that the exponential population growth rate will slow down sharply from the 20thC rate to around one-fourth of this rate, growing from today’s 7 billion to 9 to 10.5 billion by 2100.
Using the 10.5 billion estimate and adding in an estimated 30% increase in per capita CO2 emissions by 2100, would get us to 640 ppmv CO2 by 2100 (a bit more than IPCC’s “middle” case B2 in AR4).
This estimate assumes no “climate initiatives”. If there is a gradual shift away from fossil fuels to nuclear, renewables, biofuels or whatever, this would result in a lowering of this estimate, so I would see it as an “upper estimate” within the reasonable range.
Assuming that human CO2 emissions are going to continue at the same exponential rate we have seen in the past would get us to 1040 ppmv (Vaughan Pratt’s Figure 7), a level that is most likely not even possible to reach because of the constraint in total fossil fuel availability).
I have pointed this out to Vaughan.
He has “chastised” me for “predicting the future”.
But, of course, that is exactly what he is also doing with his Figure 7.
And his projection is not even logical, it’s simply “statistical”.
Max
manacker, the CO2 emission growth rate has held steady at 2% per year, higher than the population growth rate. This is because of population development. More people in China and India and Asia in general getting cars and A/C. There is likely to be a continued rise of energy demand in excess of population growth, and I don’t think population can be used to predict the rate of global development. In fact a strong negative correlation exists between population growth and development, as the most developed countries have a small population growth rate, so that a flattening global population is consistent with global development leading to higher fuel consumption per capita.
> But, of course, that is exactly what he is also doing with his Figure 7 [ “predicting the future”].
Not at all.
Vaughan said so in his poster.
Vaughan also said so many times in this thread, just in case people confuse prediction with projection and extrapolation.
Repeating this misrepresentation is on the verge dishonesty.
This misrepresentation is also a bit misleading too, since that has little to do with Jim D’s point to which this is supposed to be responsive.
Thick as a brick.
***
A quote showing that there ain’t enough carbon in the Earth to reach 1000 ppm would be appreciated.
Don’t look now, willard, but Housekeeping is finagling to expand their closet into your office. Your mission, should you choose to accept it….
===================
Jim D
Thanks for confirming exactly what I said: human CO2 grew at 2.2% per year while population grew at 1.75% per year. IOW the per capita use of fossil fuels and CO2 emission increased by around 20% over the 40-year period.
It is reasonable to assume that human CO2 emissions will continue to grow at a slightly higher level than population, despite the fact that there is considerable pressure on fossil fuels (economic as well as environmental) and the carbon efficiency of all nations is continuously improving (especially in the developed nations). So it is likely that the per capita use of fossil fuels could increase by a further 30% until 2100.
This gets us to ~640 ppmv CO2 by 2100 – not 1,040 ppmv per Vaughan Pratt’s projection in Figure 7.
But, Jim, you are beating a dead horse here.
If you want to believe Vaughan Pratt’s Figure 7 projection to year 2100, go right ahead.
I don’t, for the reasons I’ve outlined.
Max
PS I don’t even think Vaughan himself believes his Figure 7 as a “projection” (that’s why he calls it an “extrapolation”.
‘Nuff said.
Willard
Check WEC 2010 for an estimate of the total inferred possible fossil fuel resources on our planet at end-2008 (a figure much higher than the proven reserves).
http://www.worldenergy.org/documents/ser_2010_report_1.pdf
This rather optimistic estimate tells us that end-2008 we still had 85% of ALL the fossil fuel reserves that were EVER on our planet. Several other estimates (Hubbert, etc.) estimate the remaining fossil fuels much lower.
IOW the first 15% got us from 280 to 383 ppmv (end 2008).
So the next 85% will get us to:
383 + 0.85*(383-280) / 0.15 = 967 ppmv
That’s it Willard.
Ain’t no’ mo’
Vaughan’s projection (‘scuse me, “extrapolation”) of 1040 ppmv by 2100 is physically impossible to reach from human combustion of fossil fuels, even if we burned them all 100% up by 2100.
Max
> I don’t even think Vaughan himself believes his Figure 7 as a “projection” (that’s why he calls it an “extrapolation”).
Notwithstanding the non sequitur introduced by the “that’s why”, we can confirm Vaughan’s belief: he told so many times. Including to Thick as a Brick.
I wonder when people will realize that Vaughan would be grateful if somebody came along and refuted his work.
That would be progress.
Less time wasted.
Perhaps the beginning of a fruitful collaboration.
But no.
All we have is this.
Thank you for the citation and for the calculation that inspired me your new nickname, MiniMax.
Pratt has the most reliable team reviewers lined up already, kim:
http://www.youtube.com/watch?v=9c2Wu4_vDlc
I bet you can guess who that is in the middle.
Pekka Pirilä : “Having such a summary is helpful when it’s remembered that it can also be misleading.”
That little caveat seems to be missing from the poster presentation.
“There’s nothing wrong in doing and presenting such an analysis. It would be wrong to claim that it proves much, but it does certainly suggest something – and somewhat different things to each one who looks at it carefully.!
Of course looking at it carefully is the exact opposite of the function of a poster presentation, which is intended to give a quick, take home message. The quick message I got when I first saw this, and why I took a detailed look, was that it presented a high sensitivity model that claims to be amazingly accurate (which the “uncareful” reader is likely to imply makes it is a very good model).
Prof Pratt has still not addressed the false claim that neither the Hoffman exponential nor Pratt’s Law accurately represent recent change of the MLO era and as such do not represent “business_as_usual” suitable for extrapolation to 2100 as he does.
Though he has tried to walk away from that claim and to marginalise its importance in the poster, this is what everybody wants to know about. Indeed climate sensitivity and what it means for the future is the key point of interest in all this and is the part of the poster that a casual reader it likely to retain.
My conclusion is that the poster presentation is highly misleading and having seen Prof Pratt’s responses over the last month I would say intentionally so.
It appears he adheres to the Schneider school of thought where being honesty has to be balanced with being “effective”. I’m sure Prof Pratt would bring his Heisenberg philosophy back in at this point.
The poster is certainly very “effective” which accounts for it being less than honest.
Greg,
We seem to have very different views on what a scientific conference is like and what it’s participants expect from posters.
My experience tells the participants are not fools and that they have in general a critical attitude towards the posters. They expect that each poster has something to tell but don’t expect that the posters provide strong answers to important open questions.
The posters and also the short contributed presentations at conferences tell very often about a research that has not (yet) reached the level required for a full paper in a highly regarded scientific journal.
December 6, 2012 at 12:16 pm, Vaughan Pratt was addressing this comment to an undefined “David”:
> Put me in your column, David. I’m not convinced myself, though I’m certainly very curious. My analysis is nothing more than one way to decompose HadCRUT3 — it certainly doesn’t rule out the possibility of better decompositions. A better one would be great!
http://judithcurry.com/2012/12/04/multidecadal-climate-to-within-a-millikelvin/#comment-274309
In any case, it sounds like a reasonable response to Pekka’s comment, a comment which is to be expected when witnessing an exercise in curve fitting.
Pekka,
Thank you for your forthright and plausibly reasonable opinion. You ain’t one of Prof. Pratt’s slavishly loyal sock puppets.
For the same reasons that Greg has outlined, I also believe that Pratt’s poster and his dogged, dogeared defense of his publicity seeking propaganda is deliberately misleading. If he continues to pretend that there is nothing wrong with his BS and gets it through pal review into a highly regarded scientific journal, you will realize that we are correct.
Here’s the thing, Pekka. Without the following BS, few would find Pratt’s presentation interesting:
From the abstract, which the sock puppets don’t want readers to notice:
“It follows that the two components are essentially all there is to recent multidecadal climate thus understood. With either dataset, the model forecasts a 4 C rise for 2100.”
This points to chart #7 in the poster, which is headlined:
“PAST AND FUTURE TRENDS”
Hey, we got this thus understood model of recent multidecadal climate trends nailed to the millikelvin, so we can simply extrapolate to get the future alarming trends, and you all might want to wake up and start getting scared (see title of our poster).
“Multidecadal Climate to Within a Millikelvin”
And in case you missed it, we scream at you in big bold red letters with exclamation points and a big red blinking neon arrow, to call your attention to chart #6.
“YES! WITHIN MILLIKELVINS!”
Then in our conclusion, we remind you again of our special, unprecedented accuracy:
“We are unaware of other analyses claiming millikelvin precision.”
Maybe that is because no one else has ever been so foolish and bold to make such a bogus claim.
> Prof Pratt has still not addressed the false claim that neither the Hoffman exponential nor Pratt’s Law accurately represent recent change of the MLO era and as such do not represent “business_as_usual” suitable for extrapolation to 2100 as he does.
Yet again, a quote for that claim would be nice.
You have not read the poster yet it seems. See fig 7 and the panel above which I have quoted here at least five times. He also tried to say in comments this was Hoffman’s fit not his but I’m not going to restart detailed arguments at this stage. Just read the poster.
Bah, what is this with reading the object of the discussion, this ‘poster’ thingie Pratt will forever stand beside, grin and dingo hat frozen solid? Doncha know that in the Enchanted Grove, academic combats style rules, my Precious?
====================
Speaking of “accurately”, Greg should reread what he wrote:
False claim. Neither. Nor. Do not.
***
Greg is simply repeating himself, and without quoting the claim in the poster he’s supposed to contradict with his assertion, an assertion to which Vaughan already answered many times, the latest time was yesterday:
http://judithcurry.com/2012/12/04/multidecadal-climate-to-within-a-millikelvin/#comment-282375
We can clearly see that Greg’s comment practices are misleading and dishonest. In this case, he’s trying to prove by assertion:
http://en.wikipedia.org/wiki/Proof_by_assertion
The window of opportunity to have a conversation is not as wide as Greg might think.
“many times’ , clearly not.
In fact I had missed that reply which was over 24h after my comment. I’m not saying he should have been quicker, but I can not check back on all comments in the thread every time I visit.
However, having admitted that my point about the exponential being too steep was substantive and Pieter Tans had apparently raised the same issue and he had agreed with him, he fails to address my objection that this makes his claim that his AGW function represents “business_as_usual” a false claim.
Instead he moans that he is “unable” to asses how important the difference is because I don’t do it for him. That is one of the lamest evasions he’s come up with.
If he can fit an exponential to 1750-2007 he can fit it to 1960-2010 of MLO (or MLO + land use if he prefers).
There’s still a substantial rise but even a small difference in such a function blows up rapidly.
http://i48.tinypic.com/snouvl.png
I’m flattered that he agrees with me on the technical point about the fit. Sadly he typically avoids the implication that this means his claim that the extrapolation represents “business_as_usual” is unjustified.
I begin to feel this is the first thread you read at Judy’s, Greg.
Here’s another time Vaughan answered something related to the claims (notice the plural) you try to prove by assertion:
http://judithcurry.com/2012/12/04/multidecadal-climate-to-within-a-millikelvin/#comment-280954
That time, it was December 29, 2012 at 12:12 pm.
Perhaps was it too long ago?
Greg,
Considering your recurring quietness after being shown that many of your conceptions (e.g circularity) are not quite effective, I would not bring the question of honesty on the table.
But if you’d rather speak to me than to Vaughan, let us discuss that Schneider quote and the virtues it underlies.
Interestingly, this quote resurfaced yesterday at Judy’s. Is it where you got your inspiration?
I’ve seen a short film of a young Stephen Schneider, I’m talkin’ late ’60s early ’70s, in which he was properly skeptical about future climate because he recognized how ignorant he was. Along the line, he lost that recognition and the course of his career, not just one kick ass quote, amply demonstrates that deception was his game, even if only self-deception about the state of his understanding.
Comin’ in to Heathrow, slow,
Carryin’ what he oughta know.
=====================
Don Montford reproduced Jim S’s technically detailed comment just above which makes the same point as I made here : http://judithcurry.com/2012/12/04/multidecadal-climate-to-within-a-millikelvin/#comment-282465
I’m not interested your petty philosophical word games about where this is circularity. The point I, Jim and Don are making is that the out-come is a result of the method. Call that whatever you will.
Both those comments were met with “quietness”.
Greg,
Small correction. I mis-stated that it was Jim S. It is John S., and he very elegantly and thoroughly cleaned Pratt’s clock.
Thanks, I did not recall there being two Jim’s. Apologies to John .
Greg,
You were claiming that Vaughan’s argument was circular.
It was shown to you that it was not.
Thank you for acknowledging this.
***
If you are now saying that this was not what you had in mind, I can show the audience that you once did.
If that is so, please tell me that you had not a circular argument in mind.
***
If you are now saying that this argument was not that important, that it was only some kind of philosophical word game, than I can show the audience that you considered this argument more important than that when you were more confident about it.
If that is so, please confirm that what your argument from circularity was not important.
***
Either way, this has nothing to do with philosophical word games. This has everything to do with what your argument was and the weight you thought it had.
You’re trying to mislead the audience.
And the fact that you are now hiding your stack behind Don’s behemoth only shows how dishonest you are.
Greg,
Of course vaughan’s outcome is the result of his method.
how could it be otherwise?
The circularity charge has been made by people who dont understand what Dr. P is claiming and who dont understand the actual structure of a circular argument.
I suppose we could go around demanding retractions from those folks.
gosh wouldnt that be fun
We can do better than to ask for a retraction, Mosh: we can make Greg realize that his own argument is analytical too.
@DM: John S., and he very elegantly and thoroughly cleaned Pratt’s clock.
With a grubbier clock, Don, I might not have able to provide as timely a response to John S. I’m grateful for that. ;)
Its pretty damn clear that you havent been to AGU, dont know what a poster is, and fail to understand the purpose of doing one
Steven,
Let’s stipulate (in hopes of making some progress) that the “it’s circular” argument is not persuasive. Does that mean that Pratt’s poster presentation is credible? What about the criticisms meticulously enumerated by John S.? Has Pratt or any of his sock puppets laid those issues to rest. All I have seen in response to John S. is some sheepish unconvincing stammering from Pratt and dumbstruck silence from Pratt’s little puppets.
Does John S. know what he is talking about, Steven?
How about Pekka? Are his reservations justified? Would you suggest that any significant changes be made to Pratt’s hyped-up, publicity seeking presentation, if it were given to you for review prior to publication in a serious science journal?
“Let’s stipulate (in hopes of making some progress) that the “it’s circular” argument is not persuasive. Does that mean that Pratt’s poster presentation is credible
##############
what an odd question. Do you not understand logic? there are two separate questions. Is dr. p credible, and have his critics who focused on “circularity” understood him. Granting its not circular says nothing ,nothing about its ‘credibility’. Imagine some dope claimed that vaughans math was an ad hominum. That is basically what the circular crowd are doing. Nobody ever claimed that ‘if its not circular, then its credible” so, you have a strawman lurking there.
“What about the criticisms meticulously enumerated by John S.? Has Pratt or any of his sock puppets laid those issues to rest. All I have seen in response to John S. is some sheepish unconvincing stammering from Pratt and dumbstruck silence from Pratt’s little puppets.
Does John S. know what he is talking about, Steven?
############################
I’ll have look at his list again, the stupid is pretty thick around here so its hard to keep them all straight, especially when they cant even understand what a circular argument is and is not.
How about Pekka? Are his reservations justified? Would you suggest that any significant changes be made to Pratt’s hyped-up, publicity seeking presentation, if it were given to you for review prior to publication in a serious science journal?
##########
Are the reservations justified? What did vaughan say.
When I see folks describe dr. Pratts poster as a hyped up publicity seeking presentation, i must question their sanity. It’s clear to me that you have no idea whatsoever what an AGU poster is and why folks do them.
let me explain by using an example. you make a proposal to the AGU, steve mc did one year. I’ve done it too. They read your abstract. If they like your proposal, you can get asked to give a 15 min presentation along with about 10000 other people giving presentations. If your stuff is less interesting they invite you to do a poster. Talking to Mc… he was like.. doing posters sucks. It sucks because you stand there with 10000 other guys in front of your poster board thing and folks walk by and sometimes ask you questions. A lot of work for no fame or glory. Cause its not about fame or glory its about sharing early work with other people and getting feedback. So John Ng stopped by the one I worked on and gav stopped by. carrick stopped by. Nice little chats and thats it.
you folks are making a huge deal of this because Dr. Pratt got to shine here at Judith’s. plain and simple you are a jealous little bitch, and its not very becoming.
On the technical merits, Vaughans work is interesting and clever. it proves nothing about global warming. We know c02 causes that. I view it as interesting approach to an intractable problem , separating out internal variablity from external forcing. Its rather like the C02 fit that Muller did. And people have similar reactions.
What an odd reply, Steven. Why do you keep harping on circularity? Easy target? Who cares if his critics who have focused on circularity understood him? I was trying to get past that nonsense by focusing on more substantial criticism. Don’t you get the logic and practicality of that, Steven?
And you give me a childish, dumb, insulting, cowardly reply without even familiarizing yourself with the criticism of John S., who towers over you intellectually the way that I am sure that I dwarf you physically.
You used to be reasonable, interesting, and informative, before you were taken in as mascot by Muller and the BEST team. Did they give you a little beany, a plastic decoder ring and a certificate making you an honorary cub-climate-scientist?
Enjoy your next tea with Prof. Doctors Pratt, Leif, Muller, et al, and be very thankful that I am not invited to the party. If I am a bitch, I certainly ain’t a little one.
Here it is again. I have not seen a reply from Pratt or any of his little puppets. Give it a shot, Steven. Do a good job and you could become head sock puppet- cheerleader:
John S. | January 2, 2013 at 7:13 pm |
Time and again, your response seizes upon the incidental, while ignoring the substantive.
Any competent signal analyst, not just Parzen, is keenly aware that an exact Fourier decomposition of ANY bounded series of N real-valued data points consists of N complex-valued coefficients specifying the amplitude and phase of a HARMONIC series of sinusoids. The analysis tacitly ASSUMES an N-periodicity to the data, which assumption is never satisfied by real-world geophysical signals with a continuous power density spectrum. If such a signal is properly recorded over DIFFERENT record lengths, the series of harmonics changes accordingly. Thus the F. decomposition is not unique, nor is it a CONSISTENT estimator of the inherent signal characteristics. As the record length is varied, it is particularly the periodicity of the lowest-order coefficients that changes most dramatically. This analytic fact has nothing to do with signal-to-noise ratios, which your naive analysis of 161 (not 3000) yearly averages of HADCRUT3 is incapable in principle of revealing. Your fanciful SAW component is as much an artifact of nakedly assumed exponential trend as it is of record length.
.
As a final thought here, I can only suggest that terpsichorean skill is never a substitute for analytic competence.
Mosh,
You might like this exchange between Don’s Behemoth and Pekka:
John S. | December 12, 2012 at 7:17 pm |
> The crucial fact of the matter is that CO2 never leads T coherently in ANY frequency range, including those of the Milankovich cycles.
Pekka Pirilä | December 12, 2012 at 7:23 pm |
> It’s irrelevant for the argumentation on the source of the persistent rise of CO2 concentration observed at Mauna Loa and elsewhere over 50 years. This subject has been discussed so many times that there’s no reason to go back to it again.
John S. | December 12, 2012 at 7:27 pm |
> The crucial fact of the matter is that CO2 never leads T coherently in ANY frequency range, including those of the Milankovitch cycles.
Can you feel the comedy of menace?
Steven Mosher: you folks are making a huge deal of this because Dr. Pratt got to shine here at Judith’s. plain and simple you are a jealous little bitch, and its not very becoming.
You should reread Don Monfort’s reply to that post at January 5, 2013 at 10:44 pm | , especially his quote of John S on Fourier transforms.
I agree with Vaughan Pratt that orthogonality of the functions is not a major concern; of note, the changes in the low frequency components with sample duration are driven by the orthogonality requirement. The same problem is much reduced if you do not require the obtained sinusoids to be orthogonal. But it is not an empty criticism of Pratt’s modeling. It’s something any experienced time series statistician will think of, and requires some response (as Pratt did give.)
I think your ad hominem attack is deplorable, and devalues Dr. Curry’s blog.
Vaughan Pratt
I honestly admire you for posting your poster here – and letting several skeptics tear it apart.
You’ve also got a loyal “snarling dog” supporter in “Thick as a Brick” Willard.
Too bad he’s not a bit brighter.
Max
Coming from a crook who just tried a rule of three on me and who tastelessly tries to steal the nickname he so gallantly won instead of trying to come up with his own, I’ll take it as a compliment.
I honestly admire you for posting your poster here – and letting several skeptics tear it apart.
Thanks, Max (I think). ;)
Mosh,
See how Don just can’t wait.
Too much suspense, perhaps.
Do you think he took the time to read Vaughan’s responses to Pekka before writing this?
Let’s help him out:
http://judithcurry.com/2012/12/04/multidecadal-climate-to-within-a-millikelvin/#comment-274480
Reading this thread has solidified my lack of respect for two individuals. The first is David Springer who said:
Given the bigotry I’ve seen Springer post on this blog, that didn’t surprise me. On the other hand, I was somewhat surprised by the sheer juvenility displayed by Steven Mosher:
I haven’t read even half the comments on this page, but I worry what else I’ll find. I wonder how many other people have shown a willingness to throw off even the most basic chains of civility.
Brandon –
That comment makes no sense.
Bull.
Joshua, your parody of me overlooks the fact I always follow remarks like that with an explanation of my position. It’s actually fitting you’d intentionally misrepresent things given the subject of my comment.
That is, assuming it was an intentional parody. You could also just be really bad at simple conversations.
> You see, I am not capable of self-deception.
http://judithcurry.com/2012/12/30/year-in-review/#comment-281541
In some circles it’s considered civil behavior to call a spade a spade, so to speak, and uncivil to pretend it doesn’t exist. There’s a bunch of c*nts having a tosser in this thread now. Nothing constructive is happening. I calls ’em as I sees ’em. Anyone don’t like it too f*cking bad.
At the point you have to repeatedly go out of your way to avoid moderation, you should suspect you’re doing something wrong. You may think cursing to insult people is civil, but I don’t think you’ll find much support for that view.
David Springer: In some circles it’s considered civil behavior to call a spade a spade, so to speak, and uncivil to pretend it doesn’t exist.
It’s uncivil to call a person a “spade”.
It is uncivil here, though not perhaps in a movie by Quentin Tarantino, to use language that has to be ****’d out. I do hope you won’t waste our time with that junk again.
> It’s uncivil to call a person a “spade”.
In particular if it’s a Red Queen.
It’s Eleanor then willard…
http://en.wikipedia.org/wiki/To_call_a_spade_a_spade
Matthew, you ignorant slut. That expression has nothing to do with race and predates the use of “spade” as slang for a negro by centuries. I refuse to let ignoramuses like you determine what constitutes politically correct speech. Got it? Write that down.
David Springer: Got it? Write that down.
It’s uncivil to call a person a “spade”.
Brandon Shollenberger | January 5, 2013 at 11:45 pm | Reply
“Reading this thread has solidified my lack of respect for two individuals. The first is David Springer who said:”
You say that like someone gives a shiit about your opinion. LOL
Really? I thought it was just a random comment at the end of a long thread nobody would pay any attention to. I thought that was how I wrote it. What exactly did I write that makes it sound like I think someone cares about my opinion?
Yeah, I guess you’re right. The comment wasn’t meant to be noticed. That must come naturally to you by now, huh?
David Springer, you aren’t making sense. Of course I expected my comment to get noticed. That doesn’t mean I believe someone “gives a shiit” about it. Noticing and caring are not the same thing.
If you’re going to insult somebody, you should try not saying stupid things in the process.
> David Springer, you aren’t making sense.
Chewbacca strikes again!
Brandon, Being freed from chains is a good thing. It used to be fashionable to slap another man. Just as charlie murphy
I may have misunderestimated your sense of humor, Stevereeno.
Dr. Curry, if you don’t have time to moderate, do you think it might help to
at least occasionally leave a note or comment asking commenters at your blog to desist from obscenities and accusations of dishonesty etc. – to observe basic netiquette ?
It’s in “BLOG RULES” which appears as big bold letters at the top of the blog.
I read them and began my presence here by obeying them and even chastised a few people for breaking them.
Then I discovered that the blog rules here are like the rules of the road in Tapei where a stop sign is a recommendation not a command. I experienced a high degree of culture shock upon first observing the traffic in Tapei. I’ve participated in enough blogs to no longer be shocked by lax or non-existent or preferential enforcement of rules of civility.
Maybe you should try a moderated blog if this one doesn’t suit you.
The number one rule for driving in taipei is this.
Nose position is everything. forget the signs, Nose position is everything. takes about two seconds to figure that one out.
So, i’m driving around taipei with this fighterjock ( known to all as a guy with the “right stuff– as they said of him in the book ) and he says.. “Shotime nose position is everything.” Dont ask why they call me Shotime.
That must have been heaven for you, stevie. Careening though the streets of Taipei next to a fighterjock, with the right stuff. How long did you boys careen?
The number one rule for driving in taipei is this.
Nose position is everything.
When I moved to Boston in 1972 I quickly learned this rule there. As someone more familiar with the unwritten rules of driving in Australia and California I was amazed at just how well it worked in Boston, especially when entering the tunnel to Logan Airport.
You’ve read the blog rules, so you know the host has asked for the usual netiquette stuff to be observed. Vaughan Pratt, Pekka Pirilä, Matthew Marler and many others here have, unsurprisingly, been able to communicate their thoughts without resorting to obscenities and insults. It’s been your choice to incorporate ad hominem attacks, slurs and personal insults in your comments.
Your Tapei analogy doesn’t work for me as an explanation since you don’t metaphorically run the risk of getting run over by a surprised truck-driver if you observe the ‘stop insulting the guest poster and fellow commenters’ sign (for example).
BTW, since you wondered whether Dr. Pratt is perhaps no longer able to make the first-class and foundational contributions to computer science that he has made in the past, you may want to read the following, which show him still able to stimulate and progress the field. His contributions post-1994 have also been substantial :
Communes via Yoneda, from an Elementary Perspective (V.Pratt 2010)
The Yoneda Lemma without category theory: algebra and applications (V.Pratt 2009)
Mosh,
The suspense thickens and thickens. Do you think Don can wait any more? Let’s help him wait by recalling these two previous exchanges between John S and Vaughan:
Here’s a first one:
John S | December 11, 2012 at 7:28 pm
> “A multi-parametric decomposition of HADCRUT3″ would be a far more honest title, but would lack the topical sex appeal.
Vaughan Pratt | December 12, 2012 at 2:26 am
> I went back and forth on that. Sex appeal won out over boring for the poster version. For the journal version I’m considering “On the complexity of secular global climate.” Hopefully that’s boring enough for you. :)
Let’s hope omnologos don’t mind much John S’ accusation of dishonesty.
***
Here’s a second one:
John S. | December 18, 2012 at 8:04 pm |
> One has to admire your courage in taking full ownership of a conceptual edifice built entirely upon a nonorthogonal decomposition of HADCRUT3—one that depends critically on the available record-length for the values of “SAW” parameters. I only fear that it’s a sandcastle destined to be washed away by the next unpredictable climatic wave. Have a merry Christmas!
Vaughan Pratt | December 18, 2012 at 11:45 pm |
> John, actually all five sine waves of the SAW portion are almost perfectly orthogonal. Truncating HadCRUT3 to 151 samples would make them perfectly so. Hence orthogonality cannot be the right criterion for objecting to SAW.
I can’t find an answer where John S contests or accepts SAW’s orthogonality. Perhaps we should read Don’s comments so see how we could generate some touchdown dances. I’m sure Don would appreciate.
heh.
Don takes a poster he doesnt understand, finds a criticism he doesnt understand and wonders why nobody takes his attempts to referee seriously.
I must say willard, that its fascinating to watch how well you do merely by focusing on the structure of claims and the structure of responses to claims, without much regard for the substance of the claim. It’s like you understand rhetoric and logic or something
little stevie is back,
I have already provide links to the complete exchanges that willy has creatively edited for the benefit of Dr. Pratt. I won’t bother to rehash that again. Let willy have his fun.
It’s refreshing that you accuse me of not understanding the poster. The other clever little sock puppet repeatedly accused me of not having read it at all, after I had cited numerous portions of same poster. He never explained how I was able to provide accurate quotes, without benefit of reading the crap.
I recall from early on in this thread that you apparently did not understand the poster, because at some point your opinion of it’s significance was turned right around by new understanding derived from a single magical comment from Dr. Pratt. I don’t recall that you have made any substantive comments on the technical criticisms/observations of Greg Goodman, John S. , MattStat, et al. Unless you want to count whining about the largely inconsequential circularity arguments as technical comments.
When I don’t understand things I find interesting, I get help. Over the holidays I had the pleasure of entertaining in my home a gaggle of eggheads, including my distinguished physicist father-in-law and a couple of Stanford Phds who made me a lot of money back in my Sand Hill Road venture capitalist period. They unanimously, with various levels of bemusement, find Dr. Pratt’s poster to be uninteresting. I got the impression they were being kind out of professional courtesy.
Now back to that little bitch thing. We come from different zipcodes in MI, stevie. I grew up with the brothers in a federal housing project, in Detroit. Where I come from you don’t call 10 year kids little bitches, unless you are armed and crazy. Let’s chalk that remark up to you being a little naive, pudgy whiteboy with a loose mouth and what you imagined is a comfortable distance between us. If you really think that the only criticism of Dr. Pratt’s little phenomenolgical model fitting exercise is motivated by jealously, then you got other problems too.
> I must say willard, that its fascinating to watch how well you do merely by focusing on the structure of claims and the structure of responses to claims, without much regard for the substance of the claim.
Thanks, Mosh. I’m glad you dig. Once we keep track of what is being claimed and follow the commitments behind these claims and have an eye for presuppositions, it’s possible to mediate all this. Understanding’s almost unnecessary. But we already knew that, ain’t it, Don?
I’m sure there’s a niche for that kind of work.
Our Magnificient Truth Seekers sure know how to push the limits of justified desingeniousness perhaps where none has went before.
Perhaps even worthy of an audit.
***
I believe that scientists have their ways to talk to one another. Without really focusing on understanding what’s going on, one can still see when an exchange is scientific or not.
As if the science game had its own rhetorical patterns we could connect to speech behaviors.
I thought of this hypothesis in April 2011. Here’s what I told Vaughan back then:
> I again lost sleep by returning to your Amazon thread. I have the
feeling that real scientists speak in a way that can be recognized as
science. Speaking like a scientist is an art that should be
recognizable by its form.
Here’s the Amazon thread, BTW:
http://www.amazon.com/forum/science/Tx3TXP04WUSD4R1/16
Seems that VS was not the first to try that trick.
***
In other words, I believe I’m rediscovering that language is a social art.
PS: Google that one up, Don. You’ll see why my nickname is Willie. You can call me “Van”, too.
PPS: No, Don. I’m not this guy for real. It’s just a character. I myself am only a Ninja. Who cares who I am.
PPS: No, Don, I’m not really a ninja. It’s just an old Internet joke.
War and street-fighting are social arts too, willy. I am better at that sort of thing than at word games with anonymous internet buffoons. My guess is that your interests and abilities are limited to the finer ( non-ninja) social arts. Try not to stray too far from the safe zone, willie:) I said that with a smile, in hopes it doesn’t scare you too much.
(now watch the clown holler about me breaking a solemn promise I made to a certain anonymous internet buffoon)
ha WVOQ. old favorite.
I imagine one could get a good article or perhaps a book out of this
You broke that promise a while ago, Don.
Let me repeat that promise:
> I promise to not waste any more of my time engaged in circular inconsequential banter with your silly clown ass.
That was January 3, 2013 at 1:22 pm.
There is no need to prove that you wasted time in a banter with me since then.
***
Here are three definitions for the word anonymous:
I believe that you can say that my case falls under the second case. Even if I write under a pseudonym, I still write under a name, a name which is my honor. And I believe that I have a recognizable voice.
But we could surmise if the two other definitions applies to you. Even if “Don Montfort” is your real name, you still are quite unknown to me. And I’m not sure what distinctive character to help me recognize you.
That’s why I only call you Don, Don. Not Big Dave, MiniMax, Chewbacca, and now Tar Baby.
The unassuming threat might help me here.
Let me think about it.
What about “Don Don”, Don?
You sure look like a don, with all these PhD’s hanging around your house on week-ends and your brilliant career cracking to truth out of meek subalterns, and your chevaleresque name, and your overall demeanour.
Don Don. Sounds about right.
You are so predictable, willy. It’s just that I got amused at you again for your frenetic comical stalking. You got a bad case of Donitis, willy. Your behavior reminds me of the many women, who stalked me and complained about promises, long after I made it clear that I no longer found them interesting. I bet if I were a woman, you wouldn’t be doing this. Am I right, willy? Now please don’t despair, if I go back to ignoring you for sometime.
If you really wish to ignore me, Don Don, you should stop mentioning me altogether, with or without the use of names, nicknames, or descriptors.
But before you do, Don Don, it might be nice if you acknowledged my request about the IPCC’s definition of projection I quoted just for you, and if you’d give us a definition of what you think “forecast” means in our context.
You know, cleaning up claims an all.
Have a good one, Don Don.
I must have missed your request about the IPCC’s definition of whatever. I don’t want to hurt your feelings, but I am only skimming over most of your foolishness. But don’t bother repeating your request, as I don’t care about the IPCC’s irrelevant definitions. If you are getting back to trying to deny that Pratt said “forecast” but meant anything but that, then you are just making a fool of yourself, again. I posted recently some comments that clearly show that Pratt was OK with the word forecast. He used it himself, and prediction in response to a comment by Mark B:
http://judithcurry.com/2012/12/04/multidecadal-climate-to-within-a-millikelvin/#comment-283345
But you have alraeday seen that, you tedious little dope.
> If you are getting back to trying to deny that Pratt said “forecast” […]
That’s false, Don Don. What I said is that Pratt never said “forecast” in the poster. What I said is that, in the poster, the word “forecast” was given an explicit meaning, whereby it was not to be considered a prediction.
In our context, the word “forecast” has a meaning which is not what I believe you think it is.
The IPCC definition should provide you a good hint as to what this meaning is.
***
Not that you do care about “the IPCC’s irrelevant definitions”, mind you.
Not that this lack of care prevents you from extrapolating yourself:
> We already knew why the IPCC labels their scenarios projection[.]
Now, if you don’t care about how the IPCC defines “projection”, why would you dogwhistle anything like that?
***
Thus you’re accusing Vaughan of using a concept you don’t know the usage.
Not only you don’t know the usage, you don’t care about it.
You’re a magnificient truth seeker, Don Don.
Willard(@nevaudit) AT January 6, 2013 at 4:27 pm | Reply
That’s a funny post. Most sinusoidal decompositions of real data sets yield non-orthogonal functions, but they have to be nearly orthogonal in order for any one to have statistical significance at the standard levels. That is because the exact spacing and duration of data series necessary to produce orthogonal decompositions with the frequencies that best match the data are seldom encountered. For readers patient and persistent enough to have come this far, there is a paper called “Non-Othogonal Spectral Analysis” by statistician/anaesthesiologist Emery Brown, published in one of the biological rhythms journals about 14 years ago. In discussion in graduate school I called the same procedure “slow Fourier transforms”.
Do you think that speaks well for John S’ reading of Vaughan’s poster?
I dunno willard,, Don seems all wrapped up in his life story of coming from the projects to the 82 air borne. Don’t suppose he got taken off his game do ya.
Pratt had no problem with his forecast of +4 C by 2100 being called a forecast, early on in this thread. I guess the beating his credibility has taken since has chastened his boldness.
Mark B (number 2) | December 5, 2012 at 8:24 am | Reply
Dr Pratt,
This is a quote from your paper:
“With either dataset, the model forecasts a 4 C rise for 2100?
Does this mean a rise from the current temperature (2012) or from the vague “pre industrial” value. (If it is the latter, can you please say what the temperature is assumed to be at the moment, on the same scale?)
Furthermore, I don’t see any decimal point with zeroes after it, just “4C”, Does this mean that you cannot actually predict the future temperature to an accuracy of 0.001 degrees C (1 millikelvin)?
Also do you have a temperature change prediction for the next 10 years?
manacker | December 5, 2012 at 11:15 am | Reply
Mark B
Assume that Vaughan Pratt will answer your specific question regarding the 4C warming forecast to 2100.
But let’s assume for now this refers to the warming from today and do a quick “sanity check”.
We have 88 years to go, so that means an average decadal warming rate for the rest of this century of 0.45C per decade. This sounds pretty high to me (three times what it was during the late or early-20th century warming cycle). But maybe that’s what you get from an exponential curve.
But how realistic is this projected warming?
Let’s assume that other anthropogenic forcing beside CO2 (aerosols, other GHGs) will cancel each other out, as IPCC estimates was the case in the past.
Using the IPCC mean 2xCO2 climate sensitivity of 3.2C (and assuming there will be as much warming “in the pipeline” in 2100 as there is today, this means we would have to reach a CO2 level of 932 ppmv CO2 by 2100 to reach a warming of 4C (all other things being equal, of course).
This is unrealistic, since WEC 2010 estimates tell us there are just enough total optimistically inferred fossil fuels to reach around 1030 ppmv when they are all gone.
Let’s assume, on the other hand, that Dr. Pratt is referring to 4C warming since industrialization started (a pretty arbitrary figure, as you point out, but a concept that is often cited). On this basis, there has been ~0,8C warming to date, leaving 3.2C from today to year 2100.
Using the IPCC climate sensitivity of 3.2C, the CO2 level by 2100 would need to double by 2100, from today’s 392 to 784 ppmv, to reach this warming (the high side IPCC “scenario and storyline”A2 is at this level, with estimated warming of 3.4C above the 1980-1999 average, or ~3.2C above today’s temperature).
So, on this basis, Dr. Pratt’s estimate would agree with the high side estimate of IPCC.
I’d question the realism of this “high side” estimate by IPCC, since it assumes that the exponential rate of increase in CO2 concentration will jump from the current rate of 0.5% per year to 0.74%per year, despite a projected major slowdown in human population growth rate.
But I guess that only shows that you can demonstrate anything with statistics.
Max
Vaughan Pratt | December 5, 2012 at 3:29 pm | Reply
Furthermore, I don’t see any decimal point with zeroes after it, just “4C”, Does this mean that you cannot actually predict the future temperature to an accuracy of 0.001 degrees C (1 millikelvin)?
It depends on whether you’re predicting average temperature for one year such as 2097 or one decade such as the 2090?s or twenty years. SAW + AGW can be evaluated to ten decimal places at any given femtosecond in time. But that’s no good for a forecast because you have to add SOL and DEC from Figure 11. Double their joint standard deviation and you get a reasonable figure for the uncertainty of a prediction in any given year. For any given decade the uncertainty decreases, but I wouldn’t want to forecast to two decimal digits so far ahead.
But even one digit isn’t that reliable because of unknowns like those Max refers to.
What does “forecast” mean in that context, Don?
@DM: Pratt had no problem with his forecast of +4 C by 2100 being called a forecast, early on in this thread.
Huh? In response to Mark B’s comment that you’re referring to I said that forecasting was unreliable. If you think unreliability is not a problem then I’m sure glad you aren’t my car mechanic!
Very slippery and pedantic, doc. The issue is not reliability of forecasting, it is whether or not you said “With either dataset, the model forecasts a 4 C rise for 2100″ and included that forecast in your poster, as chart#7. “PAST AND FUTURE TRENDS”. FUTURE TRENDS sounds suspiciously like a forecast, doc.
Anyone can see from reading the comment from Mark B and your response that the two of you were talking about the level of accuracy of a +4C “forecast” using your little model , which you included in your poster as chart #7. In an intervening comment manaker said this:
“manacker | December 5, 2012 at 11:15 am | Reply
Mark B
Assume that Vaughan Pratt will answer your specific question regarding the 4C warming forecast to 2100.”
You made no objection to either Mark B, or max calling it a forecast of +4C. And you carried on talking about forecast and prediction. So you were talking about your +4C forecast, that you announced in your abstract and then included in your poster, as chart freaking #7. This ain’t rocket science, doc. It’s plain English. Got it?
The part of Mark B’s comment that you chose to answer, while ignoring the rest, was this:
Mark B: “Furthermore, I don’t see any decimal point with zeroes after it, just “4C”, Does this mean that you cannot actually predict the future temperature to an accuracy of 0.001 degrees C (1 millikelvin)?”
You replied:
VP:”It depends on whether you’re predicting average temperature for one year such as 2097 or one decade such as the 2090?s or twenty years. SAW + AGW can be evaluated to ten decimal places at any given femtosecond in time. But that’s no good for a forecast because you have to add SOL and DEC from Figure 11. Double their joint standard deviation and you get a reasonable figure for the uncertainty of a prediction in any given year. For any given decade the uncertainty decreases, but I wouldn’t want to forecast to two decimal digits so far ahead.
But even one digit isn’t that reliable because of unknowns like those Max refers to.”
You did not say, as you now imply, that you had made no forecast cause forecasting ain’t reliable. We can see that you are explaining to Mark B, why your +4C forecast does not contain any decimal digits. Period.
And you feign to wonder why some of some of us consider you to be dishonest.
And I see that Dr Pratt has not found the wherewithal to reply to this:
John S. | January 2, 2013 at 7:13 pm |
Time and again, your response seizes upon the incidental, while ignoring the substantive.
Any competent signal analyst, not just Parzen, is keenly aware that an exact Fourier decomposition of ANY bounded series of N real-valued data points consists of N complex-valued coefficients specifying the amplitude and phase of a HARMONIC series of sinusoids. The analysis tacitly ASSUMES an N-periodicity to the data, which assumption is never satisfied by real-world geophysical signals with a continuous power density spectrum. If such a signal is properly recorded over DIFFERENT record lengths, the series of harmonics changes accordingly. Thus the F. decomposition is not unique, nor is it a CONSISTENT estimator of the inherent signal characteristics. As the record length is varied, it is particularly the periodicity of the lowest-order coefficients that changes most dramatically. This analytic fact has nothing to do with signal-to-noise ratios, which your naive analysis of 161 (not 3000) yearly averages of HADCRUT3 is incapable in principle of revealing. Your fanciful SAW component is as much an artifact of nakedly assumed exponential trend as it is of record length.
.
As a final thought here, I can only suggest that terpsichorean skill is never a substitute for analytic competence.
Don Montford,
Yes. That sums up what he does when asked a question he doesn’t want to answer, or when something is explained to him that he doesn’t want to admit he didn’t know.
What you so accurately describe is one of Pratt’s commonly used methods of deception, misrepresentation, avoidance, obfuscation.
I couldn’t believe at first that an ‘Emeritus Professor at prestigious university Stanford’ would do such a thing. Not just once, but frequently. But he has demonstrated many many times in response to my comments on previous threads.
He is basically dishonest and should not be trusted on anything he says.
Time and again, Stanford Emeritus Professor Vaughan Pratt’s response seizes upon the incidental, while ignoring the substantive.
Could you tell us what was the substance of John S’ comment, Tar Baby?
Now you dunnit, Brer Willy.
===========
Don Montford
No. He was too busy trolling web sites to find comments I’d made so he could quote out-of-context extracts. And after all that he wasn’t able to find one example to support his assertion that “people have found Peter Lang to have been habitually dishonest on a hundred previous threads.”
What a troll.
> He was too busy […]
Peter Lang should have been careful about what his wish.
Peter Lang follows through his proof by assertion without providing evidence. Dishonesty, in Peter Lang’s universe, could very well be interpreted as “what Peter dislikes”.
Tar, baby, tar!
Oh how cute. Wee Willard Winkie is still making enfeebled cries for attention. Isn’t that just precious?
MarkB | December 4, 2012 at 2:08 pm
> When you’re incapable of commenting on content, just spit in the writers’ general direction? Thanks for contributing and giving climate skeptics a good name.
Another oldie but goodie:
MattStat/MatthewRMarler | December 4, 2012 at 2:27 pm | Reply
This is the most recent of 2 decades worth of work trying to identify periodic filters and decay rates that can smooth the observed trend and get a relatively straightforward function of CO2 as a result. This is either the Holy Grail or else a carefully constructed flimsy imitation. That is: if this is the signal of CO2, you have constructed the best filters to reveal it; if this is not the signal of CO2, you have constructed the best filters to reveal something conforming to someone’s expectations.
Whether you have found the signal of CO2 is as uncertain as with all the other phnomenological model fitting efforts.
The best test of models is how well they are matched by future data. What is your model for the data collected after the last of the data used in estimating model parameters? What is your model for the next 30 years, say possibly 3 models as Hansen did for 3 realistic CO2 scenarios?
What is your estimate of the transient climate effect, say a doubling of CO2 over a span of 70 years?
There is an apparent period of 1000 years or so, that produced the Minoan Warm Period, Roman Warm Period, Medieval Warm period, etc. That is, it is “apparent” to some. If you subtract out the best estimate of that periodic function, how much remains to be accounted for by CO2?
Remember to smile, wink and chuckle when you say “millikelvin accuracy” and “99.98%” aloud.
Don should beware that MattStat’s opinion on curve fitting is common knowledge. Here’s what he says at Tony’s regarding any kind of curve fitting, including the beauties of the skeptic climateballs:
http://wattsupwiththat.com/2012/12/13/circular-logic-not-worth-a-millikelvin/#comment-1172624
Asking we wait for another jury in 70 years is an interesting rhetorical gambit. It deserves due diligence.
***
Interestingly, this comment starts with MattStat’s explanation as to why he does not buy the circularity argument, however one might try to call it.
That should be enough to freshen some of Don’s Behemoth heavily breathed reply.
***
There’s an interesting discussion between Vaughan and Mike Rossander, if Don would deem to care.
Willard(@nevaudit): Asking we wait for another jury in 70 years is an interesting rhetorical gambit. It deserves due diligence.
I am glad that you think it deserves “due diligence”, which sounds a little more positive than “interesting” (which is frequently used deprecatorily.) One of the definitions for “transient climate response to CO2 doubling” is the effect of a doubling of CO2 at the end of a 70 year period in which atmospheric CO2 has doubled. Climate Etc posted an essay by Isaac Held in which he derived a value of 1.3C for the transient climate response to a doubling over 70 years. You could work with a doubling over 100 years, or a 70% increase over 70 years, etc. I did not invent the concept; I was just curious to know if Vaughan Pratt would use his model to create some scenarios. A true “prediction” can’t be made because the result will depend on the future volcanic eruptions and other influences on albedo, but you can run the model for each of a couple dozen stochastic processes for the future volcanic activity. If the model is accurate enough, then the model run with the realization of the stochastic process that most matches the future record ought to be a reasonably accurate model for the evolution the mean global temperature.
Willard(@nevaudit),
I must say that you have been very disciplined, accurate, clever and persistent at following the structure of the dialogue here. I usually try to avoid long repetitive dialogues, and I usually try to avoid addressing persons and I try only to address ideas. but I have reread a bunch of your posts, and I want to complement you on keeping your head when some (the always unnamed “some”) about you were losing theirs and blaming it on you.
Thanks for the kind words, MattStat. My reward is that this thread helped me underpin important ingredients of argumentative gaslighting, for which I am greatly indebted to the Magnificient Truth Seekers.
Kudos to you too: it takes courage to go at Tony’s and explain to a guest blogger that his title and main argument are patently false. One might even be tempted to argue furthermore that they were misleading too. We still have time for that.
Mike J’s answers to you at Tony’s were quite marvelous, BTW.
Mahvelous. Simply mahvelous. LOL
You’re as queer as a three dollar bill, Wee Willard.
Yes, willy is somewhat clever. And maybe he has done Dr. Pratt a dubious service by running interference and throwing crackback blocks in the good Doc’s defense. We could even believe that willy’s trolling has been perversely admirable, if we believe Dr. Pratt when he protests too much:
“ALL I CLAIM TO HAVE DONE IS GIVE ONE POSSIBLE ANALYSIS OF HADCRUT3 AS A SUM OF THREE TIME SERIES, MUL, SOL, AND DEC.”
But I don’t think it’s too much of a stretch to see a contrived warmist-alarmist agenda in Prof Pratt’s poster:
http://judithcurry.com/2012/12/04/multidecadal-climate-to-within-a-millikelvin/#comment-282910
I don’t believe Dr. Pratt ever answered you on this one, Matt. Unless you count the sock puppet:
Matthew R Marler | January 6, 2013 at 5:48 pm | Reply
Vaughan Pratt: Or forecasting. Or extrapolating.
Do you think that the result of your modeling work provides a sound basis for any expectation about the future? If so, why? If not, is it merely a work of art? The only important question is whether its implication for the future should be given any serious consideration. Whether you call it “forecasting” etc is of much less importance.
willard (@nevaudit) | January 6, 2013 at 11:33 pm |
Vintage December 9, 2012 at 3:52 pm:
> [M]y main goal is not to predict climate, or even explain it, but only to describe the multidecadal part of HadCRUT3. Explanations enter only as a motivation for descriptions that are at least consistent with the known physics and that are analytic by virtue of belonging to the class of functions containing the constant functions and closed under linear combination, exponentials, logs, and sines. The multidecadal part seems to lend itself it to simple such descriptions.
http://judithcurry.com/2012/12/04/multidecadal-climate-to-within-a-millikelvin/#comment-275240
Our emphasis.
PS:
Matt, have you gotten the impression from reading through this interminable thread that Dr. Pratt got this?:
“Remember to smile, wink and chuckle when you say “millikelvin accuracy” and “99.98%” aloud.”
Vaughan Pratt | December 12, 2012 at 1:14 am
> [Y]ou [Greg] are quite correct, the spreadsheet says quite clearly that the R2 is 99.99%. I don’t know how I screwed up there, but clearly I lied when I claimed the R2 was only 99.98%. So sue me.
http://judithcurry.com/2012/12/04/multidecadal-climate-to-within-a-millikelvin/#comment-275922
Don Monfort: Matt, have you gotten the impression from reading through this interminable thread that Dr. Pratt got this?:
Did you get the comment I wrote that Dr. Pratt might have found the Holy Grail?
You didn’t answer my question, Matt.
Holy Grail? Yes, I did see that. And if you tell me that Prof Pratt has found it, I will have to reconsider my previously expressed opinions on his quasi-model and his quasi-ethics. I am sure that any opinion you expressed on this topic would very likely be well informed, well thought out and certainly honest. What are the chances?
I ain’t a mindless unreasoanable brute, Matt. I just play one occasionally on threads that have devolved into hatchet fights. I got rough with my pal stevie to teach him a useful lesson. Oh, he ain’t scared or anything but he won’t reply to me directly. He thinks I threatened him. Just a non-germinating seed I planted in his little head. I would never harm my friend steve. Haven’t done that kind of thing since I was transformed from a teenage thug to man, by the 82nd Airborne. Since then I have only committed officially sanctioned violence as a public service in furtherance of truth, justice, and the American way.
All-American. ‘Member teasing the girl scouts on the bus back from F-Village?
========
Are you asking me, kim? Maybe if you were more specific. Time? Place?
ha, the bitch is back.
How dare Vaughan protest when seeing constant misrepresentation!
Let’s put this sentence in context:
> Vaughan Pratt: Or forecasting. Or extrapolating.
This was following up Jim D’s:
> You are projecting.
which was in response to Don‘s:
> We already knew why the IPCC labels their scenarios projections, jim d.
http://judithcurry.com/2012/12/04/multidecadal-climate-to-within-a-millikelvin/#comment-282080
incidentally the same kind of projection we are just witnessing, by the same commentator:
> I don’t think it’s too much of a stretch to see a contrived warmist-alarmist agenda in Prof Pratt’s poster[.]
***
Speaking of the IPCC, here’s its definition of projection:
> A projection is a potential future evolution of a quantity or set of quantities, often computed with the aid of a model. Projections are distinguished from predictions in order to emphasize that projections involve assumptions concerning, for example, future socioeconomic and technological developments that may or may not be realized, and are therefore subject to substantial uncertainty.
http://www.ipcc.ch/pdf/special-reports/srex/SREX-Annex_Glossary.pdf
Our emphasis.
This should never be emphasized enough, considering the gaslighting of our Magnificient Truth Seekers.
***
Interestingly, Vaughan followed up this pun with an interesting gedankenexperiment:
> A climate skeptic who is stopped in traffic on a state highway just after passing a blind corner, who sees a car in the rear view mirror coming around that corner at high speed and desperately braking to avoid a collision, would refuse to extrapolate that car’s velocity at impact and therefore would take no action to avoid the inevitable collision.
Waiting to wait for 20 years of data before slowing down would seem like an odd position to take.
***
Sometimes, answers can be discovered by more advanced techniques than CTRL-F, for instance by reading what one found by CTRL-F’ing.
***
As a suggested exercise, let the reader search for “hard constraints”.
The flashy VW(VaughnWillardwagen) crashed recklessly and helplessly into the large ebony traffic pacifier in the middle of the intersection. Extrication crews approach gingerly, masked and dangerous. I need a new bug.
===============
Don Monfort: I don’t believe Dr. Pratt ever answered you on this one, Matt. Unless you count the sock puppet:
It’s his choice what to respond to.
I am aware that it’s Pratt’s choice on what to respond to, Matt. I have seen him exercise his right many times to avoid answering inconvenient questions. And it is my choice to keep reminding Pratt and my faithful readers that Pratt has not responded to numerous inconvenient questions. Repeating questions people don’t want to answer is something professional interrogators do. I hear it’s used a lot these days, since Obama has put a stop to just about everything else. Are we clear now?
Were your questions inconvenient, MattStat?
@DM: But I don’t think it’s too much of a stretch to see a contrived warmist-alarmist agenda in Prof Pratt’s poster:
Attribution of motive is unfortunately all too common in the climate debate, Don. Are you claiming that I’ve deliberately rigged things so that the MUL ( = F3(HadCRUT3) ) curve proves something you don’t believe in? Please state what you think I have “contrived” here, how I managed to “contrive” it, and what would be a more realistic analysis of what HadCRUT3 can tell us.
I can assure you I have no motive. I would be not merely thrilled but famous if I could find a logically watertight argument showing CO2 is not the hazard climate scientists claim it is. Most such arguments contain obvious flaws, including those by Don Easterbrook, Harry Huffman, etc. Richard Lindzen does a much better job than most in hiding those flaws. For all I know John S is another except that so far I’ve only seen objections to my reasoning and not alternative analyses.
Warmer sustains more total life and more diversity of life, cooler less. That makes warmer less hazardous, from a useful frame of reference, that is, Life.
Presuming, of course, that CO2 is puissant enough to warm.
=====================================
I wouldn’t be too sure of that, Kim. Very cold oceans are bursting with aquatic life. Perenially frozen land is the more barren because it prohibits green plants which are the primary producers in the food chain. But land is less than a third of the earth’s surface and is not the primary habitat. Diversity is likely higher too in the current circumstance. Stasis is the enemy of diversity. When conditions never change a relatively small number of species take it over. The redwood forests of the US Pacific Northwest are the prime example. Few other plants can compete with them for the available sunlight they’re so well adapted to the unchanging climate there. I marvel at the diversity of plant life that appears and disappears with the changing weather conditions here on the Edwards Plateau in the places where I removed the dominant species Mountain Juniper from the hillside. The location is further a hillside which ends at a large deep lake. There’s a great diversity in plant life as well on the approach to the water. The Mountain Juniper cannot tolerate having their roots submerged for very long so periodic floods keep them at an elevation near the edge of the 100-year flood plain. Some tree species, such as Chinese Tallow, can tolerate immersion a foot or two up their trunks for weeks on end. Mexican Hemp trees can do the same and innumerable shrubs I can’t name can do the same. So the more diverse the growing conditions (short of permanent ice) appears to me to encourage diversity of species as well.
Sun storm in color,
Van Gogh and von Goethe.
The Vermillionaire.
=============
@kim: Warmer sustains more total life and more diversity of life, cooler less. That makes warmer less hazardous, from a useful frame of reference, that is, Life.
Lobsters taste better after they’ve been reassured on this point.
You might find things better to your taste if you didn’t deliberately immerse yourself in the confining frame of reference of a lobster’s undeliberated end. For the lobster, I feel pity, and yes, for you, too.
===========
Vaughan Pratt
kim is correct in saying that “warmer is better”.
You’ve just demonstrated that “hotter” is not.
It’s all a matter of (pardon the expression) “degree”.
(And there is no way that AGW is going to get us to lobster boiling temp., even in your- ahem – “extrapolation”.)
Max
Max makes a good point: as long as > 99% of Earth’s carbon remains sequestered we won’t be seeing > 100 C surface temperatures . The atmosphere today contains 5148*.392*12/28.97 = 836 gigatonnes of carbon (GtC), which is a miniscule fraction of Earth’s carbon.
But one cannot compare the ecology of the planet to a lobster pot. The large differences in scale, duration, and ecological diversity can make what might seem an inconsequential change to a lobster hugely important to the stability of the planet, particularly it’s biosphere.
This article on goldfish water temperature illustrates the significance of even 3 degrees C for something just a little larger than a lobster pot. “The best temperature range for most Goldfish is sixty-eight to seventy-five degrees, and some breeds prefer even warmer temperatures.” … Yet “sudden changes of temperature can kill the fish, even within the ranges mentioned.” “When the water is about 80 degrees Fahrenheit [less than 3 C above 75 F], it is not good for goldfish because dissolved oxygen levels may drop too low.”
Now increase the scale from a goldfish tank to the planet and it becomes plausible that an increase of even one degree C sustained over one century could have not only positive but also negative benefits. (I’m all for the positive effects.) One century is long enough to reap both the benefits and hazards of higher temperatures, yet too short to give the biosphere adequate time to adapt.
Some species will do fine, for example humans with their air conditioning and tremendous mobility. However others that have already retreated to the highest latitudes and/or altitudes they can reach to escape the heat will find themselves in a corner with no further place to go. And those retreating to the equator to escape decreasing ocean pH will be similarly cornered there.
I’m not saying this is either a good thing or a bad thing, I’m just pointing out possible impacts of increasing temperature.
Speaking of sock puppets…
It just bubbled up into my awareness center that when WebHubColonoscope disappeared so did Chief Hydrologist and Captain Kangaroo. What’s up with that?
I think Chief disappeared a bit earlier, but that’s just an impression.
Both disappearances might have been caused by BartR’s.
Fred Moolten resurfaced. Who made him disappear, again?
David
I said that about a month ago when they were hammer and tongs at each other but I was joking. However now Im wondering if one was the alter ego of the other. Surely not?
tonyb
Fred’s wife passed away and his interest in blogging appears to have passed away with her. Don’t know about the others.
I’m claiming that Chief Hydrologist and WebNutTelescope disappeared simultaneously. Claims are your self proclaimed specialty, Wee Willard. Surely you won’t let that claim pass by unmolested.
What’s the matter David? Miss me? I left a message prior to Christmas – http://judithcurry.com/2012/12/09/stratospheric-uncertainty/#comment-276290
Sockputtetry is never my intention – everyone knows my name. Just a bit a bit of fun but I have decided that the game has lost it’s edge and revert to a less colourful persona for those such as you who lack the intellectual subtlety for poetry.
I took a road trip. Put away the SUV and grabbed the Aussie made Ford Falcon from the garage. Put my partner in the drivers seat, put some Shakira in the CD player, put the seat way down, pull a blanky up to my neck, close my eyes and sense the world slip-streaming away. One of the great pleasures of the age of individual mobility. One other is pushing a big road bike hard through the Kiama Bends as the sun rises over the Pacific – but that’s another story.
I spent Christmas with my 84 year old mom – baking turkey and making trifle from scratch in a Bohemian crystal bowl I gave her many years ago. It is a bit of a tradition – we drag the bowl out every year. I then headed up the Liechardt Hughway though inland Queensland. The entire country is verdant, rich and ripe for the fires now breaking out everywhere. Fire is both unavoidable and ecologically essential in the Australian landscape – something to fear but not to be regretted.
I can’t speak for webby – he can barely speak for himself – but I just didn’t open my laptop for a couple of weeks. Life goes on without you David.
Glad to have such great news from you, Chief!
Speaking of sock puppetry:
> On the one hand, you have a sock puppet; and on the other, you have no sock puppet.
http://neverendingaudit.tumblr.com/post/5643366233
tony b
Debating with one’s self is not a “win-win” endeavor.
The gratification of knowing you will always win is by greatly diminished by the shame of losing every time.
But I can’t see the expansive and philosophical Chief as the same person as the nerdy and surly Webby. And the Cap’n is also his own man.
Fred Moolten is not a pseudonym (if our denizen is the REAL Fred Moolten). Besides, he’s much too polite and refined to be confused with either of the others.
So I don’t see a combined sock puppet act there.
Max
The Chief (RIE) returns!
Welcome back.
We have missed your words of wisdom and invite you to cast some more of your pearls to the swiney denizens here.
Cheers.
Max
kim,
The sock puppet must have had a stroke, precipitating the abrupt encounter with the pacifier. That last bit of yammering was entirely unintelligible.
> That last bit of yammering was entirely unintelligible.
Please leave “you make no sense” to Chewbacca, Don.
Tell me what you don’t understand.
You can even use quotes.
So, you are getting used to me calling you sock puppet. I think I will change it to a more appropriate: sock puppette. Is that OK, willie? That rhymes with gillette (jee-lay-te), which is what they would call you in Brasil.
Whatever pleases you, Don.
Oh, do you know the story about Nigel Persaud, Don?
Sorry to have disappeared for a few days. I just dropped my sister off at SFO last night — she’d been visiting for ten days and I realized I was being unsociable by spending all my waking hours on this thread so I took a break. .
Greg’s question about FCompn for n = 1,2,3,4 is high on my priority list — actually I’d almost finished my reply when the fox (fire) ate my homework so I had to start over. Will answer it shortly (and shorter since I’ve had a practice run). The really short answer is that for n = 1 it has no effect while for n > 1 it’s a scaling factor for the one-octave bands HALE, TSI, and ENSO to compensate for the midpoint of each of those three bands being relatively low down on the slope of F3.
Meanwhile my threshold for what I have time to respond to is gradually rising as other obligations on my calendar come due, so if I don’t respond at first then by all means pose the question/challenge again with a different wording in case that makes a difference. I’ve run out of time to respond to those calling me dishonest—besides which responding is pointless: if I actually am dishonest then why would anyone believe my response?
John S as usual comments more politely than some here, and also at a technical level closer to Pekka’s, so I’ll respond first to his comment here.
John S. Time and again, your response seizes upon the incidental, while ignoring the substantive.
For the sake of being agreeable, let me make your criticism true by seizing upon the incidental in your next sentence.
John S: Any competent signal analyst, not just Parzen, is keenly aware that an exact Fourier decomposition of ANY bounded series of N real-valued data points consists of N complex-valued coefficients specifying the amplitude and phase of a HARMONIC series of sinusoids.
1. You mean sequence, not series. A series is the sum of a sequence.
2. “Bounded” is redundant — every finite sequence is bounded.
3. “Consists of N” should be “consists of N/2.” You’ve neglected Nyquist’s theorem, which makes the remaining N/2 coefficients mere aliased copies of the first N/2 with no more physical meaning than a reverse-rotating wagon wheel in a cowboy movie. The input can be recovered perfectly losslessly from the output using only the first N/2 coefficients. (There is no contradiction here since N/2 complex numbers consist of N real numbers, same number of real dimensions as the input.)
4. Although the complex-valued treatment of anything, whether Fourier analysis or quantum field theory or whatever, greatly simplifies the algebra, it does so only for those well-grounded in that technique. For everyone else it only makes things … well, more complex. My late compatriot and colleague Ron Bracewell, author of The Fourier Transform and Its Applications, has argued (I can’t put my hand on where right now) that Fourier analysis can be explained just fine without complex numbers. After some initial reluctance (since I’d always taught Fourier analysis in terms of complex numbers at MIT) I came around to his point of view (which is how it was explained when I was in school but I had come to think this was old-fashioned and hence bad). This is why you won’t find any use of complex numbers either in my spreadsheet or here (though they’re always only a millimeter away just like parallel universes, ready when algebra becomes necessary).
But’s that’s all just merely incidental.
The analysis tacitly ASSUMES an N-periodicity to the data, which assumption is never satisfied by real-world geophysical signals with a continuous power density spectrum.
Let me prolong my agreeability by postponing responding to the first half of this sentence. The second half is spot on. I hammered my signal processing and image processing students over the head with that when I was teaching. It’s particularly relevant with speech, where a glottal cycle has a period on the order of 10 ms which doesn’t give much room for analyzing that cycle as a sum of 3-5 formants. That’s just as challenging as analyzing 160 years as a sum of “formants,” which is all they are. One can no more assume that a harmonic of the speaker’s pitch will continue unphaseshifted in the next glottal cycle than do the same for a harmonic of SAW. The violent events that create glottal cycles thoroughly reset the phase of the harmonics whose respective amplitudes define the formants.
If such a signal is properly recorded over DIFFERENT record lengths, the series of harmonics changes accordingly.
Again absolutely true. And if I were doing Fourier analysis it would be an excellent objection, because the fundamental would then be determined by the record length.
Instead what I’m doing is hypothesizing an analysis based on the sinusoidal appearance of detrended HadCRUT3 consisting of 160 annualized datapoints. In other words it is absolutely false that I “tacitly ASSUME an N-periodicity to the data” as you put it.
To illustrate this, had those datapoints faithfully followed exactly a quarter of a period of a sinewave to a precision of 1%, corresponding to an SNR of 40 dB, I would have described the signal as a sinusoid with period of 640 years, even though N was only 160. Had the SNR been significantly less than 40 dB I would have said I was much less confident about this interpretation. Likewise if it had been 60 dB, corresponding to a precision of 0.1%, I would have been correspondingly more confident about that description.
(Note that this is at the opposite end from Nyquist’s theorem, which puts a limit on undersampling. For N = 160 Nyquist’s theorem applies for sinusoids of period less than 2 datapoints, i.e. 2 years for annual datapoints.)
Far from being “merely incidental” as you claim, SNR is fundamental when analyzing signals in tight corners like this. You and I seem to have remarkably different views on the importance of SNR in extracting information from signals. Where I come from it’s of fundamental importance.
Sorry about the null link to John S’s comment, which (cross fingers) is here.
That’s nice, Vaughan.
You have said:
“ALL I CLAIM TO HAVE DONE IS GIVE ONE POSSIBLE ANALYSIS OF HADCRUT3 AS A SUM OF THREE TIME SERIES, MUL, SOL, AND DEC.”
Why wasn’t that the title of your poster?
> That’s nice, Vaughan.
I thought he was Dr. Quasi Wabbit for Don Don.
Does this “that’s nice” ring like an apology to you, Vaughan?
I mean, he really said some nasty things about you these last few days.
Why wasn’t that the title of your poster?
Thanks, Don. If I make that the title of the revised version I’ll credit the suggestion to you.
To be more precise Vaughn gave one of an infinite number of numerical ways to generate a curve that matches HADCRUT3 with decadal smoothing applied to reduce the complexity. What remains to be proven is that parameters used in the fit can be matched with processes in the real world. So far no one appears to be buying that bit about it. When Curry, Pirali, and Mosher all pan a lukewarmer presentation that IMO is solid indictment – a consensus of indicators if you will.
You didn’t answer the question, Pratt. Another dodge. Here it is again:
“ALL I CLAIM TO HAVE DONE IS GIVE ONE POSSIBLE ANALYSIS OF HADCRUT3 AS A SUM OF THREE TIME SERIES, MUL, SOL, AND DEC.”
Why wasn’t that the title of your poster?
Vaughan Pratt: You mean sequence, not series. A series is the sum of a sequence.
That’s true of a regional dialect of English. In statistics a time-ordered sequence is called a “time series”.
I use the phrase “time series” myself with your meaning, but when I omit “time” then I say “sequence.” In any event I wasn’t aiming to make a substantive point here, which would have defeated my purpose of trying to make John S’s criticism true. ;)
Vaughan Pratt: ;)
At last a wink. :-)
Don’t let it bother you. Your sister told me, back when we were dating, that you’re an ass who can only be tolerated in small doses. Ten hours is a small dose. Ten days is LD100.
You certainly hold true to your penchant for seizing upon the incidental—in this case very wrongly.
Apparently neither you nor Bracewell are aware that DFT analysis applies as well to complex-valued as to real-valued data. In both cases N data points produce N complex-valued coefficients for the BILATERAL spectrum. For real-valued data, the coefficients are complex conjugates at corresponding positive and negative frequencies; for complex-valued data they are distinct there. All of them fall within the Nyquist interval. And nowhere do I dismiss the importance of S/N ratios; I merely note that your curve-fitting analysis cannot tell us anything about them. In fact, as long as any nonlinear trend is assumed a prori, you get nonorthogonality and the separability of the low-passed data into components SAW, ASW , and RES is frivolous not only in the physical sense, but also in the analytic.
Much as you would like for your critics to dance to your samba, I have more fruitful uses for my time.
This is not so bad, Vaughan:
“In fact, as long as any nonlinear trend is assumed a prori, you get nonorthogonality and the separability of the low-passed data into components SAW, ASW , and RES is frivolous not only in the physical sense, but also in the analytic.”
John S.’ characterization of your stuff as FRIVOLOUS sounds less scathing than Eli’s BORING AND TRIVIAL. Things are looking up for you, Vaughn.
I don’t think “frivolous” means “trivial” in that context, Don Don.
Seems like your behemoth is a partisan of #OverlyHonestMethods.
Have you noticed how he forgot to adress MattStat’s point about orthogonality?
The skeptics are missing the point of the original post at the top. Look at the first Hadcrut curve presented. Would anyone in their right mind try to fit that with harmonic functions only? VP came up with a curve that not only fits its low frequency shape rather well, but is also consistent with AGW based on a CO2 growth rate that is consistent with the Keeling curve. That is his starting point.
> Would anyone in their right mind try to fit that with harmonic functions only?
Define “right”.
@John S: Apparently neither you nor Bracewell are aware that DFT analysis applies as well to complex-valued as to real-valued data.
Apparently you’ve forgotten that you wrote Any competent signal analyst, not just Parzen, is keenly aware that an exact Fourier decomposition of ANY bounded series of N real-valued data points consists of N complex-valued coefficients. (Bold-face mine.)
In the case you spoke of here, namely real inputs, an important case and arguably the only case relevant to climate science until someone invents the complex thermometer, the exact Fourier decomposition consists of only the first N/2 coefficients, the rest being merely their aliased counterparts, namely their complex conjugates. These contain no information whatsoever that is not already in the first N/2 coefficients. They are irrelevant and can be dropped without any loss of information whatsoever.
I have two questions for you, John.
1. When Fourier analyzing climate data, when would you have occasion to use complex-valued climate data?
2. Do you seriously believe there are people who’ve been teaching signal processing and image processing for decades who aren’t “aware that DFT analysis applies as well to complex-valued as to real-valued data”?
If you’ll pardon my saying so, you seem a little out of touch.
If you feel I’m criticizing you unfairly I’ll be happy to stop. You go first.
@Jim D: Would anyone in their right mind try to fit that with harmonic functions only?
@willard: Define “right”
Right mind (brain?) warm and fuzzy, left mind cold and analytical.
While no one in their left mind would think to model a rising curve with a sine wave, many of this blog’s denizens would appear to be in their right mind, largely warm and fuzzy.
And a few that will go unnamed here have minds that come across as cold and fuzzy. Even Intelligent Design can’t explain their origin.
> And a few that will go unnamed here have minds that come across as cold and fuzzy. Even Intelligent Design can’t explain their origin.
The Ancients consider a cold and moist person phlegmatic, though I’m not sure they had brains in mind. Since water is the origin of everything, there’s no need to explain it. Contemporary political theorists and art critics alike might call them Blue dogs.
Sources tell me that Big Dave has a patent on a complex thermometer. He still hesitates between two names, the first one being the Intelligent Thermometer. Warm and Fuzzy would make a good tag line.
I thought of a third question for John S. This one’s a bit more technical, and draws a sharper line between the case of real inputs that he assumed initially and that of complex inputs that he switched to in order to make the last N/2 coefficients relevant.
3. How should the Nyquist-Shannon sampling theorem be restated in order to make it true for the case of complex inputs?
Complex signals aren’t mentioned in the Wikipedia article so one must look further afield for an answer. The search is made more complex by the fact that many people use “complex” to mean merely “consisting of more than one sine wave”.
VP:
You continue to dance around the substance of my criticism, most lately with gratuitous displays of professorial pedantry. Briefly, my main objections are:
1) The synthesized HADCRUT3 index, whose observational basis is very paltry prior to WWII and is corrupted by systematic UHI bias, is not a bona
fide temperature time-series–let alone “climate” per se.
2) Its yearly average values can always be decomposed EXACTLY over any
finite interval as a linear superposition of discrete (line spectrum)
sinusoidal harmonics by DFT analysis, which always ASSUMES N-periodicity.
Those sinusoids, however, are NOT consistent estimators of the
characteristics of any APERIODIC signal with a CONTINUOUS power
density spectrum.
3) The removal of any nonlinear trend destroys the orthogonality of
decomposition. It effectively puts an artificial constraint upon your SAW
component, whose last “tooth” looks nothing at all like the results of more
rigorous filtering of the same index.
4) Your physical attribution of apparent “trend” all to AGW ignores the fact
that there are broad-band, quasi-millennial oscillations evident in the most
reliable temperature proxy records. Such attribution has as much
scientific credibility as fitting an exponential to a segment of the
forward face of a shoaling random wave. AHH is not any established “law,”
but a grossly oversimplified, unproven conjecture, contradicted by the
persistent phase lag of CO2 relative to temperature.
5) Without establishing properly the characteristics of the underlying
CONTINUOUS signal, the closeness of fit of any parametric scheme at the
sampled cardinal points tells us no more about the S/N ratio than would the
exact DFT decomposition–trend and all.
That said, I’m happy to answer your quaint questions. In geophysics,
directional data from current meters and anemometers are routinely treated
as complex-valued. Furthermore, even in cross-spectrum analysis of pairs
of real-valued series the F. decomposition of the bilateral
cross-covariance function necessarily produces a complex-valued result.
Thus in well-designed program suites the computational treatment is always
done over a BILTERAL frequency interval, with spectral estimation from
real-valued series treated simply as a special case. And that interval
extends from minus to plus Nyquist (reciprocal of twice the discrete data
sampling rate). Contrary to your pedantic diversion here, nowhere have I
suggested that the N DFT coefficients produced from N real-valued data
points need be distinct.
Frankly, the very fact that all of this needs to be explained repeatedly to
you speaks volumes. Your teaching experience notwithstanding, I understand
all too well the primitive appeal of trend plus periodic cycle plus
high-frequency noise models of real-world data in the minds of geophysical
amateurs. That you would defend such adamantly, resorting to fanciful
notions of tidally-driven cavities in the core-mantle interface as the
reason for the periodicity of your wholly artificial SAW component puts your
arguments beyond the scientific pale. Count me out of your next dance
session.
@John S: 1) The synthesized HADCRUT3 index, whose observational basis is very paltry prior to WWII and is corrupted by systematic UHI bias, is not a bona fide temperature time-series–let alone “climate” per se.
I’m fine with that. As I’ve said repeatedly, I analyzed only HadCRUT3, not the “real” climate however that’s defined. To the extent that HadCRUT3 is not a faithful reflection of real climate, the same holds of my analysis. If you happen to have a dataset for “real” climate I’d be happy to see what difference it makes.
2) Its yearly average values can always be decomposed EXACTLY over any finite interval as a linear superposition of discrete (line spectrum) sinusoidal harmonics by DFT analysis, which always ASSUMES N-periodicity. Those sinusoids, however, are NOT consistent estimators of the characteristics of any APERIODIC signal with a CONTINUOUS power density spectrum.
I’m fine with that too. But how is it relevant here? My analysis employs multiple regression, not DFT. They’re far from being the same thing, in fact DFT would be terrible for my analysis for precisely the reason you give.
3) The removal of any nonlinear trend destroys the orthogonality of decomposition.
I’m definitely not fine with that. Not only is it false sometimes, it’s false always.
Let S admit an orthogonal decomposition (necessary in order to have an orthogonal decomposition to destroy in the first place). Let S+T be S distorted by the addition of some nonlinear signal T. Detrending S+T by T gives back S, which admits the original orthogonal decomposition. How has this “destroyed orthogonality?”
But perhaps you meant something else.
It effectively puts an artificial constraint upon your SAW
component, whose last “tooth” looks nothing at all like the results of more rigorous filtering of the same index.
If you’re referring here to the question of exactly how much PDO+AMO should trend up after 1980, I’ve recently come to realize that this question has become such a large can of worms in the past two years that it can’t be addressed on a scale smaller than a whole post, in fact several posts. As indeed it has been, since around the beginning of 2011, at WUWT, Open Mind, etc. There’s no way this can be adequately summarized in the middle of this comment, it needs to be addressed elsewhere.
4) Your physical attribution of apparent “trend” all to AGW ignores the fact that there are broad-band, quasi-millennial oscillations evident in the most reliable temperature proxy records. Such attribution has as much scientific credibility as fitting an exponential to a segment of the forward face of a shoaling random wave.
That would be a reasonable argument for Rossander’s fit as a sum of several sine waves, with AGW set to zero. But that works both ways, and I would consider setting AGW to zero to be circular logic: it assumes what you’d like to prove, namely that AGW is in fact zero.
AHH is not any established “law,” but a grossly oversimplified, unproven conjecture, contradicted by the persistent phase lag of CO2 relative to temperature.
You’ve said the same to Pekka here on December 12. Your “never” and “ANY frequency range” in your reply, taken literally, implies that the CO2 in the observation tube in John Tyndall’s ratio spectrophotometer increased as a result of heating the tube. Would you be willing to weaken your claim at least a tad?
5) Without establishing properly the characteristics of the underlying CONTINUOUS signal, the closeness of fit of any parametric scheme at the sampled cardinal points tells us no more about the S/N ratio than would the exact DFT decomposition–trend and all.
Again I’m fine with that. But would you conclude therefore that low-pass filtering cannot improve SNR when the noise is at a much higher frequency than the signal? That’s the basis for my approach to analyzing multidecadal climate.
In geophysics, directional data from current meters and anemometers are routinely treated as complex-valued.
I’m fine with that. I can easily see treating 2D data of that sort with complex numbers myself.
Furthermore, even in cross-spectrum analysis of pairs of real-valued series the F. decomposition of the bilateral cross-covariance function necessarily produces a complex-valued result
I’m certainly fine with that since the F. decomposition of anything produces a complex-valued result. Does the 2D structure of a covariance matrix enter as well here?
Thus in well-designed program suites the computational treatment is always done over a BILTERAL frequency interval, with spectral estimation from real-valued series treated simply as a special case. And that interval extends from minus to plus Nyquist (reciprocal of twice the discrete data sampling rate).
My apologies, I just realized you already said exactly this here. Very sorry for putting you in the position of having to repeat it.
So it would seem that we disagree mainly on (i) whether PDO+AMO climbs sharply after 1980 (the second paragraph in this Wikipedia definition of AMO bears on this but does not take sides), and (ii) whether temperature leads or lags CO2. You say leads, I say the question is ill-posed when there’s a positive feedback. (There was no feedback in Tyndall’s experiment, in particular no water emitting CO2 after being heated.)
Which raises a fourth question.
4. Given an op-amp (operational amplifier) oscillating on account of a positive feedback, which is leading, the input or the output?
Contrary to your pedantic diversion here, nowhere have I
suggested that the N DFT coefficients produced from N real-valued data points need be distinct.
That wasn’t the basis for my complaint. A DFT implementation designed for N real inputs need not produce N complex outputs in the first place. Doing so is both unnecessary and wasteful as it converts N floating point numbers into 2N such when it only needs to produce N. (Though programmers are so sloppy nowadays that it’s become old-fashioned to pay attention to such niceties. Those of us who started out programming computers built from relays and vacuum tubes didn’t have that luxury.)
This is the kind of dumb gratuitous crap that should keep John S. coming back to help you, Vaughan:
“You’ve said the same to Pekka here on December 12. Your “never” and “ANY frequency range” in your reply, taken literally, implies that the CO2 in the observation tube in John Tyndall’s ratio spectrophotometer increased as a result of heating the tube. Would you be willing to weaken your claim at least a tad?”
You are a worse little nitpicker than willy. Take up fishing, or something.
This might be a bit more than a nit, Don Don.
Trust me on this.
Or better, follow the conversation.
Or best, stick to planting non-germinating ideas in the audience’s mind.
You like fishing, Don Don?
Sanctus simplissimus! Of course ANY arbitrary trend T can be ADDED to any
orthogonally decomposable signal S to form a data series D = T + S, and the
signal subsequently recovered EXACTLY in the noiseless case by subtracting
the KNOWN T. But with only D known in the real-world case, and it taking
the form D = T + S + n, where n is noise, only ESTIMATES of T and S can be
obtained from finite records. Your primitive idea that noise is a
predominantly high-frequency phenomenon is contradicted by all known noise
models; low-pass filtering removes signal and noise components
idiscriminately.
What makes nonlinear trends particularily onerous in this context is the
spread of their spectral content throughout the Nyquist baseband. Unlike
with linear trends, all the F. components are potentially affected. Thus the
vital property of orthogonal decomposition–independence amongst all its
basis functions–gets destroyed by SUBTRACTING the estimated trend in
mixed-mode decompositions such as yours. All of your components, including
the SOL filtered by F3, become inextricably entangled.
Physical understanding is only obfuscated by appealing to vague, abberant
notions of “positive water vapor feeback.” No one has ever produced a
credible root-locus plot in the complex s-plane of the system function for
such fantastic feedback. There simply are no op-amps active anywhere in
the planetary climate system. GHGs act entirely PASSIVELY, simply
absorbing LWIR and redistributing the thermal energy through molecular
collisions with radiatively “inert” gas constituents and through isotropic
radiation. Thus the phase relationship between cause and effect is not
ambiguated as the AGW camp desperately would like to have it.
I would suggest that you thoroughly re-think the relationship of your
all-too-perfectly-fitting computational findings not only to proper signal
analysis, but to physical reality. The strictly deterministic multidecadal
climate that you insist upon flies in the face of everything that is known
about geophysical fluid dynamics vis a vis the discoveries by Lorenz of
chaotic behavior. The lower troposphere is heated primarily by moist
convection, not radiation. Despairing, at this point, of ever getting you
to recognize the crucial difference between processes with continuous, as
opposed to discrete, spectra, I leave you to take pride in saving
microsecnds of CPU time at the expense of greater generality of DFT
programming.
Vaughan Pratt, I hope you remember that I liked your poster, and that I am just chatting.
In the case you spoke of here, namely real inputs, an important case and arguably the only case relevant to climate science until someone invents the complex thermometer, the exact Fourier decomposition consists of only the first N/2 coefficients, the rest being merely their aliased counterparts, namely their complex conjugates. These contain no information whatsoever that is not already in the first N/2 coefficients. They are irrelevant and can be dropped without any loss of information whatsoever.
That’s provably true only for stationary time series. In the case of non-stationary time series, such as evoked potentials, it has been shown empirically that there is information in the phases. Were you to insist, I could track down some references. The importance here is that we can’t tell whether the climate system measurements constitute a stationary multivariate time series. Assuming that it’s stationary, or at least that the non-CO2 driven part is stationary, permits the estimation of some models, but may force us to look in too restricted an area of mathematics for us to achieve adequate accuracy.
Almost all of my time series experience has been in modeling non-stationary multivariate time series: results from experiments with distinct starting and ending points, or synchrony with external clocks.
Any time series, or process generating the measurements, that you assume to be stationary you should assume to continue for an indefinite future. If you are not willing to make that assumption (which is what leads all of us to make “predictions” et al from your model), then you should provide some reasoning to justify a claim that the data or residuals are a stationary series for a while, and then stop being stationary; or were non-stationary up to the late 1800s and then became stationary, or some such.
I hope that you write up your paper for publication (perhaps responding a little to suggestions made here), and that it gets published. I also hope that you do not bet a lot of money, yours or someone else’s, on the model being true. Grants and work to find a physical basis for the non-CO2 parts of your model strike me as reasonable; efforts to reduce CO2 emissions are hardly justified. It should go without saying, so I’ll say it, that these are only my opinions.
It has been sporting of you to hang around here and respond to criticisms. And I can’t leave off without saying Happy New Year!
Happy New Year to you too, Matthew!
Your point about stationary series needing to continue is a great one. I now see why you were asking me why I wanted to describe HadCRUT3 if not for prediction. And it also gives a convenient excuse for using the model to extend the available data to avoid end effects when filtering. Circular to be sure, but surely better than underutilizing data near the end. Whether that’s the optimal solution to avoiding such underutilization is a great question.
I certainly don’t assume that “business as usual” is about to come to an abrupt halt, nor that permafrost methane is about to greatly magnify global warming.
What I’m most confident of is that the Hale cycle will swing up for 2010-2020 exactly as it has for every “odd decade” since 1870, and that this decade will therefore warm much more like 1990-2000 than 2000-2010. Moreover for 2010-2020 it will slow down again. As they say, “it’s the Sun, stupid.”
I’m also confident anthropogenic CO2 will continue to increase by 5/3 % a year for at least the next decade, and that therefore AGW will continue to follow the curve it’s currently on.
Thanks for the encouragement to publish. The suggestions made here have had a big influence on my thinking. Any paper coming out of this will certainly reflect some of that. (I have a backlog of papers I owe people so this may not be right away. Had AGU not had a hard deadline the poster would still be just a glint in my eye.)
Don Montfort
No.
Actually the title was “Multidecadal climate to within a millikelvin”.
The text stated:
”With either dataset, the model forecasts a 4 C rise for 2100”.
We’ll see how it works out.
I’m personally sure that by 2100 it will be too high by at least 2000 millikelvin, for reasons already stated..
But since none of us will be around in 2100 to see if the
forecastextrapolation to 2100 is correct, we will only be able to check theforecastedextrapolated trend line.Following the
forecastextrapolation, we should see by (year, ppmv CO2, °C above today) :2020: 415 ppmv, 0.2°C
2030: 449 ppmv, 0.6°C
2040: 491 ppmv, 1.0°C
2050: 543 ppmv, 1.4°C
2060: 608 ppmv, 1.9°C
2070: 689 ppmv, 2.4°C
2080: 791 ppmv, 3.0°C
2090: 917 ppmv, 3.7°C
2100: 1075 ppmv, 4.4°C
Let’s simply check out year 2020 (most of us should still be around) to see if the “extrapolation” held to “within a millikelvin”, at 0.2°C above today’s temperature.
And, if that was OK, let’s see how well the “extrapolation” held for 2030, at 0.6°C above today’s temperature.
Show and tell time.
Max
Yes, I know that was the title, Max. I was hoping that he would/could explain why
“ALL I CLAIM TO HAVE DONE IS GIVE ONE POSSIBLE ANALYSIS OF HADCRUT3 AS A SUM OF THREE TIME SERIES, MUL, SOL, AND DEC.”
would not have been more appropriate and more honest, than the title he did make up. On the off chance that he replied, I would go on to ask him why all the hype in the poster, if his claims were allegedly so modest. I enumerated some of the hype, in a previous comment. I will cut and paste for the sock puppets convenience:
Here’s the thing, Pekka. Without the following BS, few would find Pratt’s presentation interesting:
From the abstract, which the sock puppets don’t want readers to notice:
“It follows that the two components are essentially all there is to recent multidecadal climate thus understood. With either dataset, the model forecasts a 4 C rise for 2100.”
This points to chart #7 in the poster, which is headlined:
“PAST AND FUTURE TRENDS”
Hey, we got this thus understood model of recent multidecadal climate trends nailed to the millikelvin, so we can simply extrapolate to get the future alarming trends, and you all might want to wake up and start getting scared (see title of our poster).
“Multidecadal Climate to Within a Millikelvin”
And in case you missed it, we scream at you in big bold red letters with exclamation points and a big red blinking neon arrow, to call your attention to chart #6.
“YES! WITHIN MILLIKELVINS!”
Then in our conclusion, we remind you again of our special, unprecedented accuracy:
“We are unaware of other analyses claiming millikelvin precision.”
Maybe that is because no one else has ever been so foolish and bold to make such a bogus claim.
> [T]he abstract, which the sock puppets don’t want readers to notice: […]
Don Don breaks another promise, but hey, he’s the don.
Let it be noted that those lousy sock puppets themselves quoted the full abstract:
> We analyze and compare the monthly global land-sea surface temperature datasets HADCRUT3 and HADCRUT4 for 1850-2010 by subtracting two analytically modeled components and demonstrating with a suitable low-pass filter that the residue contains no significant fluctuations with periods longer than the 22-year Hale cycle. It follows that the two components are essentially all there is to recent multidecadal climate thus understood. With either dataset, the model forecasts a 4 C rise for 2100.
This abstract was quoted to show that the claim on which Don Don keeps quoted is not the main claim of Vaughan’s work, even it Don Don gets all worked up by it.
This forecast, when properly understood, is a trivial consequence of the main claim, which is that “two components” could describe “recent multidecadal climate thus understood”.
In other words, Don Don is still at the first step of the conversation started a few days ago.
With his quest against the word “forecast”, a word whose definition is none of his concerns, Don Don is casting himself as a climate Don Quixote.
This sentence:
> This abstract was quoted to show that the claim on which Don Don keeps quoted is not the main claim of Vaughan’s work, even it Don Don gets all worked up by it.
could be reduced to
> This abstract was quoted to show that the claim on which Don Don gets worked up is not the main claim of Vaughan’s work.
This sentence could also be reduced to:
> Don Don simply does not like the word “forecast” in an poster that deals with a result from estimation theory.
Don Don is tilting.
This the kind of stupid rationalization that we are accustomed to, from Vaughan’s little sock puppette:
“This forecast, when properly understood, is a trivial consequence of the main claim, which is that “two components” could describe “recent multidecadal climate thus understood”.”
So, you are saying that allegedly describing recent multidecadal climate allegedly thus understood with two suspect components, entitles Pratt (or presumably anyone) to boldly forecast a +4C roasting by 2100. Thank you for clearing that up for Dr. Pratt, puppette.
I wonder how many iterations of his model Vaughan went through, until he got the answer that he set out to find? Would Dr. Prof. Vaughan have made up a zippy poster for the AGU meeting to hype his findings, if he had calculated little or no CO2 influence?
Why did Pratt put chart #7 in his poster? And why did he refer to it as a forecast in his abstract, if it ain’t a forecast? Put your semantic quibbling hat on now, puppette and help us understand the proper way. I don’t think your master is going to answer.
Come on puppette. When I rattle your cage, you got to squeal. We expect it now.
> When I rattle your cage, you got to squeal.
Do you tell that to everyone of your conquests? Too bad you can only fantasize about that domineering position therein!
I thought dons knew when to cut their losses.
***
When will you apologize to Vaughan? Perhaps a retraction?
Wouldn’t be great if you knew what it is to be Vaughan Pratt, Don Don.
You do seem like a powerful man, Don Don. Perhaps you should hire HB Gary agents to read all his correspondence with AGU.
***
Not that you care for such things, but have you noticed how MattStatt distinguished projections from scenarios, Don Don? The IPCC also distinguishes the two concepts.
FYI. In case you change your mind. Not that you ever do.
If you only knew
What it is to be Who.
We doff Bart’s chappoo
To such rannygazoo;
Silly frissons at
Millikelvin precision,
On Mulberry Street,
The willard heard Who.
==========
@DM: Yes, I know that was the title, Max. I was hoping that he would/could explain why “ALL I CLAIM TO HAVE DONE IS GIVE ONE POSSIBLE ANALYSIS OF HADCRUT3 AS A SUM OF THREE TIME SERIES, MUL, SOL, AND DEC.” would not have been more appropriate and more honest, than the title he did make up.
Sorry, Don, but you’ve been joking around so much I can never tell when you’re asking a serious question or just enjoying yourself commenting randomly on Judith’s blog.
Ok, assuming you really did intend this as a serious question, here’s how I would answer it seriously.
I chose my title because
(a) it was short (quarter the length of what you’re suggesting);
(b) it was thought-provoking (“What? That’s insane!” seems to have a common response in this blog);
(c) I was able to justify it at the time (even if this thread has in the meantime changed my mind on some details); and
(d) the multidecadal component MUL (the component that the title was designed to draw your attention to) is representable with a relatively simple analytical formula fitting multidecadal climate (defined as F3(HadCRUT3)) with a residual whose standard deviation was on the order of a millikelvin. In six words, “Multidecadal climate to within a millikelvin.” Rather than put the rest of the poster in the title I put it in the poster.
With regard to (d), all three components of the formula for AGW are physically justifiable, al backed up by peer-reviewed articles in quality journals. SAW on the other hand is clearly a wild card whose main justifications are:
(i) it’s a linearly filtered sawtooth: sawtooth forms arise naturally in geophysics, and filtering is a common phenomenon in nature; and
(ii) in conjunction with AGW it can give a better fit than has proved possible using five sinusoids (many thanks to Mike Rossander for his skill in pointing the analysis of my poster in this quantifiable direction).
While I didn’t claim a specific physical justification for SAW, or even that it arose from a single mechanism, I did suggest it was worth looking for physical justifications and proposed one place to look, namely the Earth’s rotating core as a mechanism that might induce such oscillations. That these oscillations show up more strongly in the ocean is consistent with the ocean’s better thermal contact with the mantle, relative to the land.
With regard to (c), in the poster the standard deviation of MRES for the century preceding the evident bump at 1970 in Figure 6 was less than 0.6 mK. At the time I did not know whether the bump was meaningful or not, but it seemed to me at the time that the mere fact that it coincided with postwar uncontrolled emissions could constitute an explanation of it, thereby justifying omitting its contribution to the unexplained variance, which would then have justified “to within a millikelvin” for the entire period (neglecting the decade at each end, which as everyone including me keeps saying are meaningless).
In the meantime the constructive criticism here has persuaded me that this interpretation of Figure 6’s 1970 bump may be too iffy to consider a serious explanation and I’m willing to settle for my current 1.5 mK for 1860-2000, i.e. all of MRES except the decade at each end where significant end-effects enter. (The roll-off of F3 is such that the second decade from each end is not significantly impacted by end effects.)
Why 1.5 mK? In response to Rossander’s very different parametrization I made very small changes to my parameters which raised the R2 of MRES for 1860-2000 from 99.990% to 99.997%, handily beating Mike’s 99.992% and corresponding to a standard deviation of around 1.5 mK. (The variance of MUL is .06.)
As a test of whether 1.5 mK is significant, one could ask what standard deviation can be achieved by replacing the three AGW parameters by seven new shape parameters (in addition to the three I used, thereby bringing the total number of shape parameters to ten). With that many more parameters one would expect a much better fit, yes?
That’s a serious question in case I hadn’t made clear I was now taking you seriously.
Using four more parameters than me, and using Excel’s Solver for an exhaustive search, Rossander was only able to bring the standard deviation of MRES down to 2.2 mK.
Furthermore I seriously doubt that he could find a hundred-year interval within the interval 1850 to 2010 and a choice of all ten shape parameters that yielded a fit on the order of half a millikelvin.
So in answer to everyone objecting to “within a millikelvin,” I would say it’s significant because it’s hard to achieve 1.5 mK using just sine waves. Having an intrinsically rising curve like AGW helps here. And until such a curve enters it is impossible to ask how best to apportion the last four decades of HadCRUT3 between the periodic and rising components of the model because the latter is by definition zero and therefore “deeply flawed” as Rossander himself described his fit.
On the question of whether 1.5 mK is really so shocking, Greg Goodman wrote here, Let’s put this another way : 1% residual with a 14 parameter model having slugged that data so hard it can barely wiggle. (The standard deviation of MUL is 0.6 K so a slightly more accurate percentage is 0.0015/0.6 = 0.6%.)
Greg’s point could be interpreted either as a minus or a plus for me.
Minus: At around 1% I haven’t achieved such a shockingly small residual after all so why am I trying to make it look smaller than it really is?
Plus: It shows that “to within a millikelvin” is not the absurdity for geophysics that it might seem at first. Given that physics experiments often have residuals whose standard deviations easily reach 0.001% of that of the data or better (considerably better in the case of quantum electrodynamics, not much better in the case of the gravitational constant G), 1% accuracy in fitting is a commendable target but hardly an outrageous one given that the data originates from many millions of readings.
That was my reasoning at the time. I would accept that my reasoning may have been mistaken in some respects, but I would not accept that it was dishonest because any such mistakes were not apparent to me at the time. And even now I don’t see any mistakes that warrant anything more than adding the letter “s” to the end of my title, assuming we take Goodman’s logically defensible position that anything even half a millikelvin higher must disqualify “within a millikelvin.”
Many thanks to Judith’s denizens for indicating improvements to my poster. I was hoping for some when I posted here and I have not been disappointed in that respect. Nor have I been disappointed in the overall tone, which has been even more boisterously enthusiastic than usual.
I still owe Greg Goodman responses to a couple of his comments, e.g. on fitting to the Keeling curve, FComp, etc., which I’ll get to in a day or so.
While I’ll continue to post short comments when they only take a minute to write, I regret that I’m finding it necessary to be more selective in what I respond to more comprehensively as each of these takes several hours to compose, otherwise my other obligations will be short-changed. As just one of several such, the sudden emergence of two MOOC startups have left our department temporarily short-handed and I’ve been drafted to our Ph.D. admissions committee which is just now getting into full swing. (I served on it almost every year I wasn’t on leave or sabbatical until my retirement in 2000.)
Vaughan,
It’s entirely up to you, whether or not to take questions seriously. I have been assuming that you could tell the difference between a joke and a serious question, or I would have made my intentions clear. Maybe this explains why you have ignored many inquiries from myself and others that seemed serious and relevant enough to warrant a response. Some of us thought that you were purposely ducking-and-dodging. And when you have answered questions/replied to comments with more than one issue, you have often selected one of the softer parts to nibble at and ignored the meat. That is largely why (in my humble opinion) that this thread has gone on for so long and why it has devolved into a food fight.
Sorry, I don’t know the answer to the question you asked me above, and I am no longer sufficiently interested in this thread to try to consult with someone who could help me with a reply. I am sure Pekka could help you, but he seems to have had enough of this foolishness.
Are you going to include chart #7, in your paper? That’s the last question I have for you. Please take willy the troll with you when you go, or he may have to be tranquilized and relocated to another blog forcibly.
Seriously doc, I hope you do some thinking about what went on here, before you continue with climate modeling as a hobby. I am sure the Team doesn’t like you dabbling in their business.
lol!
Nothing quite like it when a “conservative” steps up to the plate to demonstrate their conceptualization of accountability.
Nothing quite like it.
oh, it’s little josh
I thought willy the troll was still on duty. I hope he ain’t too sick. What, no Christians to harass today, joshie? Are conservatives interchangeable with Christians, josh-u-a?
Carry on, you snide little dummy. Even Mosher is repulsed your silly little pencil-neck pimplefaced persona. Have I made myself clear, josh-u-a? Are you sure you aren’t that pencil-neck moron Peter Gleick? You look just like him, with ethics to match.
> Please take willy the troll with you when you go, or he may have to be tranquilized and relocated to another blog forcibly.
You’re in no position to bargain anything, Don Don, and Vaughan already told you that I was speaking for myself.
Here’s what I am offering you now, Don Don:
Please apologize to Dr. Pratt for the scam operation you’re running since the beginning of the thread on his back.
A real apology, like a man of honor would do.
For your own sake.
In the void is virtue, and no evil.
Oh, willy is back. Feeling better? I missed you yapping at my heels like a little scrawny loudmouth chiuaua. Do you smell something on my shoes, or is your unnatural interest in me got something to do with me being a big rough man? Your therapist needs to review this thread.
Give me some examples of what you are accusing me of, from the start of this thread, or shut your face. I will save you some time, willy. I did not participate in the start of this thread, nor the middle. You are an annoying, lonely little moron. Join a gym, or something.
Don Monfort | December 15, 2012 at 11:50 am
ken,
When one has gotten tenure and numerous grants by stomping on mice, one has no reason to tackle elephants.
Food fight #1 Rule:
Make sure everyone’s full.
====================
Only a food fight could rescue Don Don.
This won’t be one.
Says the one wallowing in pudding. Try breast-stroking out of it. Keep your nose up.
========
@willard: A real apology, like a man of honor would do.
Don waste your time.
@DM: I have been assuming that you could tell the difference between a joke and a serious question, or I would have made my intentions clear. Maybe this explains why you have ignored many inquiries from myself and others that seemed serious and relevant enough to warrant a response. [Boldface mine]
My complaint about joking around was specifically aimed at you. Greg Goodman, Mike Jonas, John S and several others have maintained a serious tone throughout that you haven’t come near to matching until this comment of yours. But while this one is obviously intended seriously, your previous comments to date make it impossible to take even this one seriously. Your others have been indistinguishable from you just joking around on this blog in order to have fun without making any serious points or inquiries. This puts you in David Springer’s BWAHAHAHAHA camp, as distinct from those who focus on sharply defined technical points clearly and seriously, and who therefore deserve to be taken seriously.
I’m not saying don’t make jokes, I’m just suggesting that when you want to be taken seriously, you might have more luck if you made it clearer that this is what you want, as you did just now.
Oh no, it’s dr. ALL I CLAIM IS…blah…blah…blah…
Kim has spotted your little yapping chiuaua sock puppette drowning in the pudding. Don’t you think it is time to retire the long-in-the-tooth, dogeared little mutt? If you don’t send him home before you leave, he will be here yapping in defense of your foolishness in perpetuity, assuming someone rescues him from his impending pudding ending. That’s alliteration, ain’t it doc?
How is your series of slapstick parodies of Wood’s parody of a physics experiment going, doc? I am willing to help, at least financially. Got some Scotch tape and Saran Wrap Premium for you, doc. And an old oven thermometer with a busted glass that still sorta works. Should I send it over to Stanford, before they find out what you are doing and revoke your privileges?
I don’t recall seeing one comment from Judith on this thread, since her initial statement at the start of this ugly marathon, that she found your quasi-poster “intriguing”.
My guess is that she is too kind to give a guest colleague the thumbs down. Or maybe she hasn’t read this stuff. There is evidence of that. Anyway, let’s go with your colleague Eli rabette’s assessment:
boring+trivial
FIN
manacker: The text stated: ”With either dataset, the model forecasts a 4 C rise for 2100”.
Max, there are a lot of comments on this thread by now so it would be quite understandable if you missed this one.
This was in response to Don Monfort, who claimed “You will find the quote I left for you above came from the poster. Here it is again: With either dataset, the model forecasts a 4 C rise for 2100.” [Emphasis mine.]
That quote most definitely did not come from the poster, contrary to what Monfort claimed. If you believe otherwise please state which of the four columns it appears in.
That quote does appear in the abstract, but the abstract is now five months old and has since been superseded by the poster. I did not present the abstract at AGU.
Following the
forecastextrapolation, we should see by (year, ppmv CO2, °C above today) : 2020: 415 ppmv, 0.2°C …“We should see?” Either you missed this or you imagine you’re God (s’ok, a lot of people get that feeling). An extrapolation is not a forecast. As I pointed out on the second day of this post, five weeks ago, a high R2 is no guarantee that an extrapolation to a future time will bear any meaningful relationship to what actually happens at that time. Prediction is hard, especially the future.
Those who want to fault my poster by quoting from a way-out-of-date abstract can feel free to do so without further objection from me. I simply don’t have the copious free time it takes to keep pointing out (a) that the poster has superseded the abstract and (b) an extrapolation is not a forecast, nor a projection, a prediction, a prophesy, nor any other kind of statement about a future real world, only about a future mathematical world which need bear no relationship to reality (as is often the case about mathematical worlds).
This is not to say that my fit to the existing data is ideal. Goodman has complained that my fit of CO2 to the Keeling curve is “totally inappropriate,” despite its remaining within the annual (= seasonal) fluctuations. Goodman’s ground for this is an exponential fit at this graph that (a) while a better fit to the Keeling curve than mine in the middle (that’s a no-brainer) is worse at both ends, and (b) has no physical basis, unlike Hofmann’s raised exponential. I’ll say more about this in response to Goodman’s recent challenges including this one.
> I did not present the abstract at AGU.
Too bad. They had a Noble prize in reserve in case you did.
This is just more disingenuous BS, Pratt. So I made a mistake and said poster instead of abstract. You linked to the abstract, which was for what Pratt? The freaking poster, right? And co-incidentally the freaking poster had a chart that said something about FUTURE TRENDS and +4 freaking C by 2100. Following me so far, doc?
VP, whining:”Those who want to fault my poster by quoting from a way-out-of-date abstract can feel free to do so without further objection from me.”
A man’s wife has had enough and calls the police to report that her abusive husband beat the hell out of her on Friday. When the cops come the husband protests that he is innocent, because he ain’t beat the @#$^!, since last Tuesday or Wednesday.
Give it up. doc. The consensus climate science Team says you are boring and trivial.
Quoth the Rabett, Evermore.
==============
> Trend estimation is a statistical technique to aid interpretation of data. When a series of measurements of a process are treated as a time series, trend estimation can be used to make and justify statements about tendencies in the data, by relating the measurements to the times at which they occurred. By using trend estimation it is possible to construct a model which is independent of anything known about the nature of the process of an incompletely understood system (for example, physical, economic, or other system). This model can then be used to describe the behaviour of the observed data.
http://en.wikipedia.org/wiki/Trend_estimation
Our emphasis.
@Don Monfort: So I made a mistake
Mistake forgiven. Don.
But I gather from your tone that you expect your mistakes to be forgiven without any reciprocation on your part. My apologies if I’ve misinterpreted your tone.
So what. Global temperature curve fitting is boring and trivial, given free choice of parameters or french curves.
Seems like you’re in violent agreement with Stanford Phds who made me a lot of money back in my Sand Hill Road venture, Eli.
Who starts the bi-partisan process, Don Don, perhaps?
Don Don sweats diplomacy.
willard belts out galley strokes @ Lepanto. Whoa, which way are we going?
==============
OMG! Prof. Dr. Pratt. Emeritus and Causus Belli. If the Eli rabbette is not on your side in this war, you are toast.
Eli and Vaughan are scientists. Both are war-like players, like Gordie Howe and Maurice Richard were. Mr. Hockey had his own ways to score hat tricks. Once set on a mission, nothing could stop The Rocket.
Don Don is another kind of warrior altogether. He says he seeks truth and interrogates. We only see him fighting the windmills of his mind:
@DM: OMG! Prof. Dr. Pratt. Emeritus and Causus Belli. If the Eli rabbette is not on your side in this war, you are toast.
Saint Robert Bellarmine to Galileo: “If the Pope is not on your side in this war, you are pane tostato..
It’s dawning on Vaughn, it’s the artillery and the slavery.
===============
I don’t think the sock puppette knows the real identity of Don Senor Dr. Eli Rabbette.
Don Don masters the concept of sock puppetry as well as the concept of forecasting.
Not that he would care.
@DM: I don’t think the sock puppette knows the real identity of Don Senor Dr. Eli Rabbette.
Smirk when you say that, DM. ;) Only you have the Google chops to link ER to JH, right?
With those chops DM could be out making real money instead of frittering away the rest of his life posting rubbish on blogs.
@ER: Global temperature curve fitting is boring and trivial, given free choice of parameters or french curves.
That’s for sure. Mike Rossander demonstrated this very convincingly by using seven additional shape parameters. French curves could do the same thing if they came with R2 readouts.
Willieboy, tell Dr. Pratt the jig is up. And before any of the local schoolmarms has a fit, NO! I am not a racist. I am talking about the dance Dr. Pratt has been performing.
Eli rabbette has been sent here by the Team to inform Vaughan that he has failed to pass muster. Stop the hoofing. There will be no paper in prestigious science journal. He will not be making the Team. If he keeps this up, they may have to send Tamino, or even Gavin, over here to put an end to this embarrassing foolishness. They don’t need your help, Dr. Pratt. Your poster is not only wrong, it is boring and trivial. (watch willy freak out)
Don Don might never get the game scientists play.
willard, the winner of the plucked chicken pitching contest and still The Whirled Chumpeen.
===========
Not all science is a game, Wee Willard. In yet another proof that even a blind squirrel finds an occasional acorn you’ve recongized the climate science is just a game. The problem is this game isn’t being played with Monopoly money. It’s being played with OPRM (Other People’s Real Money) which makes it less than entertaining for those footing the bills.
I was alluding to this book, Big Dave:
http://books.google.ca/books/about/Winning_the_Games_Scientists_Play.html
There exist games with real money, you know.
Let’s try this other link:
http://www.amazon.com/Winning-Games-Scientists-Play-Sindermann/dp/0738204250
Here’s an interesting of the word “game”:
> The game therefore is to come up with two curves we can call NAT and HUM for nature and humans, such that HadCRUT3 = NAT + HUM + shorter-term variations, where NAT oscillates without trending too far in a few centuries, and some physically justifiable relation between HUM and the CDIAC CO2 data can be demonstrated.
http://judithcurry.com/2012/12/04/multidecadal-climate-to-within-a-millikelvin/#comment-276314
I don’t recall you thanking MiniMax from correcting one of your sarcastic remark, which you can find by searching for “/sarc”.
While I disagree with with MattStat’s praise of willard, I would like to say I’m happy to hear him criticize the behavior I condemned not long ago. I hope others feel like he does rather than how Steven Mosher feels:
I hope uncivil behavior that contributes nothing to discussions is never condoned by the general population of this blog. People who reject basic rules of civility are a blight upon any place that encourages open discussion. Heck, they’re a blight upon the world in general.
Chewbacca | December 4, 2012 at 5:58 pm |
> Wagathon, you’re a loon.
http://judithcurry.com/2012/12/04/multidecadal-climate-to-within-a-millikelvin/#comment-273855
Chewbacca | December 4, 2012 at 7:32 pm |
> If by “better” you mean better at showing you’re a loon… yes.
http://judithcurry.com/2012/12/04/multidecadal-climate-to-within-a-millikelvin/#comment-273891
Chewbacca | December 4, 2012 at 8:36 pm |
> I’d say that comment pretty well demonstrates it. Either people who disagree with you, including our hostess, are hypocrites and apparently ignorant, or you’re a loon. Guess which seems more likely.
http://judithcurry.com/2012/12/04/multidecadal-climate-to-within-a-millikelvin/#comment-273908
Uncivil behavior can be entertaining to watch. This thread probably has the record for number of comments in it on this blog thereby demonstrating its ability to entertain and engage.
Don’t bother thanking me as I know that stick up your ass prohibits it.
To show our gratitude, Big Dave, I could not find better words than Peter Webster’s, the husband of Judy I believe, written yesterday evening:
http://judithcurry.com/2013/01/06/improving-weather-forecasts-for-the-developing-world/#comment-283556
Thank you, Big Dave.
So civil.
The mommy, mommy boy is now saying, “You do it too”? This is a confusing page.
> This is a confusing page.
Chewbacca is feeling blue.
Deaf Vader is loosing his grip.
Those were Chewbacca’s first comments in the thread.
***
Here’s Chewbacca, January 8, 2013 at 2:20 am:
> You post stupid comments with nonsensical claims you double down on because you are apparently incapable of admitting obvious mistakes. You call me a dishonest hypocrite while dishonestly committing every offense you attribute to me. In short, your criticisms of me are the most absurd, asinine and insane criticisms I can recall ever getting.
http://judithcurry.com/2012/12/04/multidecadal-climate-to-within-a-millikelvin/#comment-283651
In other words, oneuniverse makes no sense.
***
Finally, here’s Chewbacca, fourteen minutes later:
> People who reject basic rules of civility are a blight upon any place that encourages open discussion. Heck, they’re a blight upon the world in general.
what? you think its good to be in chains? I called Don a little bitch, because it happens to be true. Of course now Don wants to step outside since we live so close to each other. You get the whole point of slapping another man now brandon. No such thing as uncivilized talk.
Hey, I broke an X-style tire iron the other day. Almost broke my butt, too.
============
I notice you left off “jealous” Mosher. Are you trying to hide you pathetic attempts at mind-reading, or are you just being lazy? It’s hard to tell given you’re apparently a loon:
You are a punk, stevie. A cowardly punk.
Eli never goes to McDonalds or Walmart
Willard, you should thank manacker for taking you to school. Don’t be an ingrate.
——————————————————————————————–
manacker | January 5, 2013 at 6:44 pm |
Willard
Check WEC 2010 for an estimate of the total inferred possible fossil fuel resources on our planet at end-2008 (a figure much higher than the proven reserves).
http://www.worldenergy.org/documents/ser_2010_report_1.pdf
This rather optimistic estimate tells us that end-2008 we still had 85% of ALL the fossil fuel reserves that were EVER on our planet. Several other estimates (Hubbert, etc.) estimate the remaining fossil fuels much lower.
IOW the first 15% got us from 280 to 383 ppmv (end 2008).
So the next 85% will get us to:
383 + 0.85*(383-280) / 0.15 = 967 ppmv
That’s it Willard.
Ain’t no’ mo’
Vaughan’s projection (‘scuse me, “extrapolation”) of 1040 ppmv by 2100 is physically impossible to reach from human combustion of fossil fuels, even if we burned them all 100% up by 2100.
Max
I wonder Eli, if the Georgia Guidestones are to be believed, how many ppm of CO2 would 6,500,000,000 bodies be responsible for when they are disposed of or do you plan to sequester to keep Giai happy?
I was asking for a citation, Big Dave. I will thank him for it. Thank you for reminding me.
***
As for MiniMax’ number, I believe he threw the smallest reasonable optimum he could find to contradict Vaughan’s extrapolation. Hence the new nickname. Perhaps he should have said:
> Ain’t no less, within the bounds of justified disingenuousness.
Since that only shows that there are hard constraints that we should take also into account beside his curve fitting, something Vaughan granted one month ago, MiniMax might have been trying to force an open door.
***
Do you think it’s kosher for MiniMax to assume linearity in his calculations, Big Dave?
Max used the most generous estimate of remaining fossil fuel that he could find. Why don’t you try to address it substantively instead of semantically, Wee Willard? Can you do that?
Do you think it’s kosher for MiniMax to assume linearity in his calculations, Big Dave?
Willard the dullard
You miss the point once again, it seems.
Flatly assuming that human CO2 emissions are going to continue at the same exponential rate when human population growth is expected to decline sharply to one-fourth the past rate is stupid.
Assuming that human CO2 emissions from fossil fuels by 2100 will exceed all the carbon contained in all the remaining fossil fuels on our planet is idiotic.
VP’s Figure 7 does both.
If you are too dull to grasp this, then you are beyond help.
End of discussion.
Max
Willard the dullard
No linearity assumed by me. Simply tied future human CO2 emissions to expected future human population growth and added in a per capita increase in fossil fuel consumption similar to the one seen in the past.
Sorry – it appears you’ve missed the point once again.
It’s really not that complex, Willard – you just have to open your mind.
Max
Response over there:
http://judithcurry.com/2012/12/04/multidecadal-climate-to-within-a-millikelvin/#comment-283747
***
See also this page:
http://www.ipcc.ch/ipccreports/sres/emission/index.php?idp=71
to see that semantical matters are not to be dismissed that easily.
You evidently can’t handle the truth, Wee Willy.
Allen et al, Nature, 2009
no paywall copy:
https://edit.ethz.ch/iac/people/knuttir/papers/allen09nrcc.pdf
Figure 1.B
Cumulative carbon emissions to date are about equal to the amount left in probable reserves. It’s given in gigatonnes carbon. I can do the math if you can’t so it’s stated in parts per million in the atmosphere.
Manacker was being EXCEEDINGLY generous to you in giving the the probable reserves at 85% of total instead of 50%. The 85% number is derived from possible improvements in cost of recovery. No more fossil fuel will be extracted when it takes more energy to recover than the energy contained in the recovered fuel.
If you actually knew your ass from your elbow about the so-called consensus science you’d know that a practical limit of of some 500ppm in atmospheric carbon due to anthropogenic emission widely accepted. 1000ppm is a fringe estimate and Manacker rightly states it as such.
Listen up, dummy. Total warming is calculated by the usual suspects as a consequence of longevity of excess CO2 in the atmosphere and the time it takes for the full warming effect of it to be realized. The mantra goes that when atmospheric CO2 peaks at whatever value, whether it’s 500ppm or 1000ppm warming will continue long after that. Refer to Vaughn’s repeated example given in this thread of a CPU passive heat sink which is the gist of physical explanation. I don’t agree with this. Empricial evidence suggests the heat sink is saturated from a higher forcing in a matter of weeks. The upper ocean is well mixed, which is why they call it the mixed layer, and peak temperature of it lags peak forcing by no more than a few months. The great majority of the ocean which lies below the mixed layer is 3C so in the long run the warmer mixed layer can only be cooled by the slow rate of energy exchange with the frigid depths.
Get a clue.
One clue is increased activity of the biosphere in response to higher CO2 levels and, presumably, more energy, possibly heat(?), in the system. This would function as a negative feedback to rising CO2 levels. Doubtless, says the skeptic, as yet unknown such feedback mechanisms are to be recruited as CO2 levels rise, thus lowering AnthroCO2 residence time, and decreasing time to approach the limit of whatever so called equilibrium is possible in this temperospatially chaotic little Deus et Machina we gots here.
=============
The legend of Figure 1 leads with:
> Idealized emissions. Shown are three idealized Co2 emission paths (a) each consistent with total cumulative emissions (b) of 1 trillion tonnes of carbon […]
How does this relates to MiniMax’ demonstration of idiocy, Big Dave?
***
Panel (c) does not preclude the possibility of reaching 4C in 2100.
I thought MiniMax said this was physically impossible.
David Springer
As you point out to Willard, I cited a most optimistic estimate by WEC on the “inferred possible total fossil fuel resources” remaining on our planet (at 85% of the original total).
Most other estimates I have seen (Hubbert, etc.) are much less optimistic. The “usual” estimate is that we have consumed 50% of all the fossil fuel resources to date, as you also stated.
In this case, future CO2 level from human combustion of fossil fuels would be constrained to the same as occurred in the past or ~110 ppmv above today’s level = a bit more than 500 ppmv, rather than a bit less than 1000 ppmv).
Willard just has a hard time getting his head around the fact that there are physical constraints, which a simple extrapolation ignores.
(Even IPCC has some problems with this concept, but their projections are not quite as ludicrous as Vaughan Pratt’s Figure 7.)
Max
With the comfort of my Asus ProArt, I now can see that panel (c) does seem to rule out 4C as unlikely. I’m not sure it excludes it as a physical impossibility, but let’s stand that aside for the moment.
For I still can’t read what’s the maximum C value by 2100 on that panel.
What’s your reading on this panel, Big Dave?
> Willard just has a hard time getting his head around the fact that there are physical constraints, which a simple extrapolation ignores.
MiniMax just has a hard time forcing an open door.
That there are physical constraints we should not ignore if we want to make a reliable forecast, which in turn will help us simulate scenarios, has never been doubted by anyone here except by MiniMax’ projected interlocutors.
Perhaps we should build a measure of theorical idiocy, and revise Box’ dictum accordingly: all models are idiotic.
MiniMax,
Still forcing an open door with Vaughan’s figure.
Your calculation:
> 383 + 0.85*(383-280) / 0.15 = 967 ppmv
assumes lots of things. The most important one is that you’re applying a rule of three.
A rule of three assumes linearity.
That is, you assume that burning X bits of CO2 has the same proportional effect in the atmosphere than burning X + Y bits of CO2.
Perhaps your model assumes a very (and I mean very) big ocean?
Willard
My model makes no assumption of the ocean or biosphere, simply that the same amount of the CO2 emitted by humans will continue to “disappear” out of the atmosphere somewhere (we do not know where).
15% of all the fossil fuels that ever existed got us from 280 to 383 ppmv (in 2008, when the estimate was made).
So the remaining 85% will get us to 967 ppmv when they are all gone
= 383 + 0.85*(383-280)/0.15 = 967
Pretty simple, actually.
In actual fact, the amount “remaining” in the atmosphere has declined by around 5 percentage points (out of a bit more than 50) since Mauna Loa records started*, but I have assumed it will remain at the same percentage it was over the past
*You can check this out for yourself (CDIAC and Mauna Loa data).
Max
Willard
To save you the trouble of checking out the slight decline since the 1950s in the percentage of CO2 emitted by humans that “remains” in the atmosphere, I’ve plotted the data.
http://farm9.staticflickr.com/8344/8200196434_ebb7559913_b.jpg
I have not assumed that there would be a further decrease in this percentage.
Max
> My model makes no assumption of the ocean or biosphere, simply that the same amount of the CO2 emitted by humans will continue to “disappear” out of the atmosphere somewhere (we do not know where).
And that is supposed to be non-idiotic?
Willard
What’s “idiotic” about it?
What is your estimate?
What is the basis for your estimate?
Go, baby!
Or, if you have no better estimate, admit it.
Max
Minimax,
You said that Vaughan’s estimate was idiotic. You offered your own estimate, which comes from a simple rule of three, and other interesting assumptions.
I never used the word “idiotic” before as a theoretical construct before, and am not committed to define one.
Therefore it makes sense to ask if you find your own estimate non-idiotic.
Your concept, your commitment.
***
You mentioned that there are many other estimates of how much Co2 remains to be burned on Earth. What are your other references, with links and all?
Many thanks!
Willard
Link has already been cited for WEC 2010 study but I will repeat, since you appear to have missed it.
http://www.worldenergy.org/documents/ser_2010_report_1.pdf
Wiki also has estimates with data from several sources; these lie well below the WEC estimate of “inferred total fossil fuel resources”, which I cited (and which is several times higher than the “proven recoverable reserves” estimate).
Another source (with lower estimates):
http://www.theglobaleducationproject.org/earth/energy-supply.php
As David has pointed out, the WEC estimate is a very optimistic estimate of remaining fossil fuels on our planet – other estimates are less optimistic.
Hope this helps.
Max
Willard
Other estimates of oil, gas and coal reserves can be found here:
http://www.worldcoal.org/resources/coal-statistics/
http://www.purdue.edu/discoverypark/energy/assets/pdfs/cctr/outreach/Basic9-Reserves-Oct08.pdf
http://exclusiveeconomy.com/2011/03/top-15-world-oil-reserves/
http://www.rediff.com/business/slide-show/slide-show-1-nations-with-the-worlds-largest-oil-reserves/20110128.htm#1
http://www.bp.com/sectiongenericarticle800.do?categoryId=9037178&contentId=7068624
http://www.eia.gov/analysis/studies/worldshalegas/
Enjoy!
Max
Thanks, MiniMax!
Too bad WebHubTelescope’s not here to share all this mana!
***
Since you’re here, I noticed this sentence from Big Dave’s cite:
> Meinshausen et al. argue that emission levels in 2050, or cumulative emissions to 2050, are robust indicators of the probability of temperatures exceeding 2 °C above pre-industrial values by 2100. Allen et al. take an even longer view, exploring the impact of CO2 emissions over the entire ‘anthropocene’. They argue that keeping the most likely warming due to CO2 alone to 2 °C will require us to limit cumulative CO2 emissions over the period 1750–2500 to 1 trillion tonnes of carbon.
https://edit.ethz.ch/iac/people/knuttir/papers/allen09nrcc.pdf
I’m not sure what difference these two views, or if that matters for our discussion. In any case, this seems to be where the “trillion tons” we often hear comes from. Let’s suppose so.
Now, a bit later, they say:
> So with more than 0.5 Tt C released already since pre-industrial times, it may well turn out that we can only afford to release less than the same again, possibly much less, with many times that amount in fossil-fuel reserves remaining underground.
This last sentence is backed up by this reference IPCC, Carbon Capture and Storage, which I believe is over there:
http://www.ipcc.ch/publications_and_data/ar4/wg3/en/ch4s4-3-6.html
Do you know where I should check?
***
Now, I’m not sure that this quantity should be interpreted as
> The “usual” estimate is that we have consumed 50% of all the fossil fuel resources to date.
I believe the authors are referring to the quantity left to consume until we reach 2C, not all there is to consume.
In fact, the authors clearly state that we still have many times that amoung of fossil-fuel reserves remaining underground.
Am I correct?
***
Now, do you know how many times 0.5 Tt C there is still left to burn?
The authors said many.
Let’s suppose it’s twice as many. That makes 1.5 Tc C. If that’s the case, and considering the Golden Rule, we get to 3C, right?
Let’s hope it’s not more than thrice.
Willard
The WEC 2010 estimate equates to around 2.5 trillion tons of carbon or around 9.2 trillion tons of CO2. (This is 5x your 0.5 trillion tons C).
At 50% “remaining” in the atmosphere, this would get us just short of 1000 ppmv when it’s all used up.
Using IPCC’s mean ECS of 3.2C, this would get us to 4C warming above today, when all fossil fuels are gone.
At today’s consumption rates, this would occur in ~300 years
There is no doubt in my mind
a) that we will not reach anywhere near this level by 2100 as VP’s extrapolation projects
b) that there will be an economically and politically viable alternate to fossil fuels long before they run out (there already is in nuclear for the biggest part of the future load)
But, Willard, as nice as this exchange with you has been, I think we’ve beaten this dog to death and should move on.
See ya around.
Max
MiniMax,
I hope we’ll remind ourselves of this exchange next time the urge to talk about scientific humility will come up.
And I hope this suffices to make myself clear, if I may borrow your words.
Thanks for all this,
w
Meanwhile, here’s a relevant paragraph:
That’s on page 75 of the srccs_whole.pdf.
Arithmetic might very well be as important for discounting than it is for counting.
IPCC = International Pretenders for Climate Catastrophe
Equipment time out. That’s two grand comments, and I need to rotate the tires on this bus.
============
Since my preferred activity has been cancelled because of the bushfires in NSW, I’ll return to the dialogue here. But first I would like to endorse comments by oneuniverse and others, calling for civility.
1. We have now established (Steven Mosher, please note!) that there was indeed a circular argument in the poster.
A reasonable definition of ‘Circular Argument’ is “The circular argument uses its own conclusion as one of its stated or unstated premises. Instead of offering proof, it simply asserts the conclusion in another form, thereby inviting the listener to accept it as settled when, in fact, it has not been settled. Because the premise is no different from and therefore as questionable as its conclusion, a circular argument violates the criterion of acceptability.” (T. Edward Damer, Attacking Faulty Reasoning. Wadsworth, 2001)
Vaughan Pratt commented: “@Mike Jonas: The sawtooth was created as the difference between Hadcrut3 and AGW.
Correct.”
(http://judithcurry.com/2012/12/04/multidecadal-climate-to-within-a-millikelvin/#comment-281100)
Thus Vaughan Pratt has confirmed that the poster started with SAW being created as temperature minus AGW. The optimisation process fitted sinewaves to SAW and certain parameters to AGW with the objective of finding the best fit of AGW+SAW to temperature. At no time was SAW an independent entity, because the optimisation process automatically adjusted SAW whenever AGW changed in order to preserve the relationship: temperature = AGW + SAW.
So when the poster found that “multidecadal climate has only two significant components: the sawtooth, whatever its origins, and warming that can be accounted for 99.98% by the AHH law …..”, it was only stating its initial premise. That’s circular logic, pure and simple.
2. It might still be possible to salvage something from the calculations, if it turned out that SAW was meaningful, in a real-world sense.
Vaughan Pratt’s comment (that I linked above) continues:
“Certainly: anyone can Fourier transform a signal to represent it as a sum of sine waves, that’s not interesting. What’s interesting (to me if not to you) is that almost all of SAW seems to consist not merely of random sine waves but of the second and third harmonics of a sawtooth. What are the odds?!? I found that sufficiently surprising as to warrant including it as part of the poster.”
As others have pointed out, this counts for nothing. The period being analysed would have had to cover more than one oscillation of SAW in order to establish it as a ‘sawtooth’. It didn’t.
The key test of SAW, to my mind, is to see if it bears any meaningful relationship to anything real. Vaughan Pratt did at one stage suggest that SAW might represent the ocean oscillations, but the poster backed away from this idea, and anyway the components of SAW bear no resemblance to AMO, PDO, etc, so we can dismiss this as a possibility.
The poster’s findings are therefore of no value, and there is absolutely nothing that can be predicted from them.
> So when the poster found that “multidecadal climate has only two significant components: the sawtooth, whatever its origins, and warming that can be accounted for 99.98% by the AHH law …..”, it was only stating its initial premise.
I’d like a quote of one of Vaughan’s “initial premises” (an oxymoron) that accounts for the words “significant” and “can be accounted for 99,98% &tc.”, pretty please with sugar on it.
If that’s impossible to do, the “argument from circularity” can be dismissed as a meme powered by cargo cult logic.
Vaughan Pratt has confirmed that “The sawtooth was created as the difference between Hadcrut3 and AGW.”
The premise was therefore that global temperature has only two components, AGW and SAW. That comfortably satisfies the need for SAW to be a “significant” component – there are only two components and SAW is one of them. Another premise was that the other component, AGW, is (ie. 100%) AHH law. The “99.98%” refers to the accuracy with which the calculations are claimed to have matched it, with the proviso that it “could be brought even closer to 1 with a good story for MRES”.
Q.E.D.
Mike Jonas,
To posit:
[P1] Here is a sawtooth.
does not commit any petitio principii if the conclusion’s main proposition is not:
[C] There exists a sawtooth.
Vaughan’s argument predicates something of the sawtooth which is not contain in his positing of one. He applied some techniques from estimation theory, which are needed to get the predicates he had in his conclusion. These predicates are not include in P1, but from estimation theory.
Therefore, your argument qualifies as cargo cult logic.
Congratulations!
***
Please stick to the argument from predictivity, as you now are appearing to appreciate. At least this is less obviously refutable.
Unless, of course, you acquired some knowledge of some estimation theory since the first time Vaughan probed about it.
Mike,
please un fool your self and read willard.
“To posit:
[P1] Here is a sawtooth.
does not commit any petitio principii if the conclusion’s main proposition is not:
[C] There exists a sawtooth.
######################################################
Let me boil this down for you. Vaughan asks you to grant him three can openers
1. Grant me a saw tooth that is composed of ocean cycles.
2. Grant me a filter to remove Hale and higher cycles.
3. Grant me AAH
IF you Grant him those 3 he will deliver, Hadcrut to a milikelvin
NOT circular.
There is no circular argument . Let me put it another way. VP proves nothing. He demonstrates that if you grant him 1,2 and 3, he can decompose hadcrut to a milikelvin. AGW is assumed. IF You dont believe in AGW, leave the effin thread. This is not meant to convince you.
Dr. Pratts decomposition is interesting to those of us who already believe in #3. Thats easy to grant. #2 is likewise easy to grant, remove the tiny solar signal. That leaves us with #1.
Why is #1 interesting? Well as Eli notes it gets really interesting if one can wrap some more physics around it.
So lets repeat the how this argument is structured. There are three grants. If you give VP those he gives you the world. Now you can counter argue using the following paths
1. Argue technicalities about his precision and the nuts and bolts of his methods. Meh, a milikelvin here a milikelvin there..audit him.
2. Deny him his grants. In economics these are called can openers
Ordinarily we grant guys their can openers and then argue about
the can opener later.
So, lets look at VPs can openers. Nobody will seriously deny VP can opener #2. So, maybe you’d like to deny #3. Well err, sky dragons are next door. That leaves #1
Now of course folks can just call the saw tooth a made up thing, err cause it is a made up thing. But, it gives other folks a place to dig, knowing that if they can put credence into #1, that Vaughans demonstration becomes something much more meaningful.
So the upshot of Vaughan’s argument is this. Focus on #1. there mght be something interestng there. THAT is his argument in a nutshell.. grant me 1,2,and 3.. I give you milikelvins.. 2 and 3 are consensus can openers.. therefore the interesting bit of information in this argument is Number 1.
We could also proceed otherwise and have #1 left as a residual to explain.. explain that and you have solved the multidecadal variation problems
That is very good, stevie. Now it’s certain that the “circularity” arguers will see the error of their ways and they will grant Pratt all the can openers he needs, and you and willy can put your giant brains to work on extinguishing the nuts and bolts criticisms of John S. Greg G, et al. And maybe Pratt will do as Eli rabette suggests and come up with something, anything, that ties his curves to physical stuff. He got he free can openers he asked for, where the freaking cans?
I know you want to apologize, stevie. But your foolish, stubborn pride won’t allow. I will give you some more time. Think about it.
> And maybe Pratt will do as Eli rabette suggests and come up with something, anything, that ties his curves to physical stuff.
Which was Moshpit’s point too. And Vaughan would agree. In fact he does, because he said so so many times.
Eli, like Wittgenstein, might have been a shortcut.
***
What’s the point of curve fitting if you’re not a #QuarterBack? It helps get you a description of that damn thing you wish to explain. Then if you’re lucky, you get to have all these nice predictions, which might not mean much since they happen once in a lifetime.
To discover the future, sometimes you need to create the tools to have a chance to look at it. In any case, that Pluto is a planet ain’t decided by telescopes alone.
More #GameOfScience, less #ClimateBall, pretty please with some sugar on it. Not that I mind playing #ClimateBall.
So, who’s on first, again?
I don’t see any of the “circularity” crowd jumping on the bandwagon, stevie. They still don’t get it. Your explanation was theoretically/esoterically OK, but it may have been too technical. Try some BS analogy. Vaughan uses that trick a lot. You could get another merit badge from Muller. Has he ever sent you that check, stevie? Try this crap on them, stevie:
It’s like going to see those highly contrived, comically implausible Hollywood movies, or watching those pseudo-spectacular magic shows, in Las Vegas. If one wants to be entertained, one has to suspend disbelief.
Come on guys. Give Pratt his can openers. It’s like we are all sitting around the seance table holding hands and we need to give Prof. Dr. Vaughan control of the ouja board. He cant lead us to the millikelvins, if we don’t play along.
Cargo Cult logicians accuse the father of Dynamic Logic of getting crunched numbers aver crunching numbers with a number cruncher.
An Hollywood synopsis:
Steven Mosher “please un fool your self and read willard:.
What willard wrote – “Grant me a saw tooth that is composed of ocean cycles.” – is tosh. SAW is not composed of ocean cycles, and by the end of the poster there is no attempt to claim that it does..SAW never ever was anything at all in its own right. Right from the start, and throughout the calculations it was defined and maintained as exactly temperature minus AGW.
Steven Mosher again “IF You dont believe in AGW, leave the effin thread.”.
What a ridiculous statement. My criticism isn’t anything whatsoever to do with AGW, it’s to do with the poster’s circular logic, which I have established pretty thoroughly. It would appear that your objection is based on your belief in AGW. Well, take another look – belief in AGW is irrelevant, the point is that the poster’s conclusion that temperature = AGW + SAW was its premise, and this has been explicitly confirmed by Vaughan Pratt: “The sawtooth was created as the difference between Hadcrut3 and AGW. Correct.”. And also by yourself, where you say “VP proves nothing” (with which I agree).
it’s to do with the poster’s circular logic, which I have established pretty thoroughly
You have established it purely by calling non-circular logic circular, and by nothing else. Those accepting your logic believe you.
Using your logic I can establish that you’re wrong, namely by stating that you’re wrong. If those accepting your logic believe you but not me then they are being inconsistent.
> My criticism isn’t anything whatsoever to do with AGW, it’s to do with the poster’s circular logic, which I have established pretty thoroughly.
Cargo cult logicians are the true masters of the proof by assertion [1]. Notice here the variant “with a tap on your own back”. Deaf Vader must be training them.
[1] http://en.wikipedia.org/wiki/Proof_by_assertion
Steven Mosher: So the upshot of Vaughan’s argument is this. Focus on #1. there mght be something interestng there. THAT is his argument in a nutshell.. grant me 1,2,and 3.. I give you milikelvins.. 2 and 3 are consensus can openers.. therefore the interesting bit of information in this argument is Number 1.
We could also proceed otherwise and have #1 left as a residual to explain.. explain that and you have solved the multidecadal variation problems
That was a good post.
I do not accept AAH as “true” but it “might be true”, so it is worthwhile to find out what else is deducible if it be true.
Mike Jonas: The poster’s findings are therefore of no value, and there is absolutely nothing that can be predicted from them.
With or without Dr. Pratt’s agreement, I think that most interested people will take the extrapolations of his model into the future as “predictions”, for all practical purposes. If the future course of Earth mean temperature departs sufficiently from the extrapolated values (say 1000 millikelvins by 2032), I think we’ll all take that as a disconfirmation of his model (subject to reasonable adjustments for aerosols and such.) In the event that his model proves to be accurate (I already expressed doubts about that), then people will be motivated to find physical explanations for his sawtooths and such.
It is likely that the Pratt model will have been forgotten, in a couple of weeks. Presuming this thread has died by then. Eli the rabbette says that there is no way Pratt will get a paper published, in any of the Team’s journals. That leaves E&E, and Newsweek.
The important thing would be to tie the curves to physical stuff convincingly.
Eli said, “The important thing would be to tie the curves to physical stuff convincingly.”
Give the rabett a carrot. Connecting the little dots is the fun part and with climate to within a millikelvin in the title, expectations high. Since the accuracy of the data set used, to about +/-0.15C anomaly, this could get entertaining :)
@Rabett: The important thing would be to tie the curves to physical stuff convincingly.
That would be one way. Another would be to weaken the circularity objection by showing that the approach does not automatically stuff the last four decades of temperature into AGW as some have been claiming. This could be done by manufacturing artificial climates in which SAW is responsible for more of the recent rise than AGW and showing that the method is capable of reporting just how much more.
There are a number of faults in the poster that this thread has drawn attention to; a rewrite that addressed the main concerns would be an improvement.
There are also novelties such as the 20-year HALE cycle, that AFAIK has never before been pointed out as a significant component of HadCRUT3, as well as the notable lack of any multidecadal signal between HALE and PDO+AMO (as Joe D’Aleo calls what I’ve been calling SAW). In the five weeks since I posted here no one has been able to point to anything in between HALE and SAW that is larger than the few mK deviation of MRES (standard deviation of 1.44 mK with the parameters that give R2 = 99.997%). I stand by my claim that HadCRUT3 contains no such thing.
Ultimately publishability is up to the handling editor, except in unusual cases where the board steps in and overrides him or her. I saw the latter happen once when perhaps the most famous open problem in lattice theory, posed 60 years ago, was eventually solved using Kuratowski’s little-known Free Set Theorem. At a meeting of the full board of the Journal of the American Mathematical Society, the board acknowledged the referee’s extremely high praise but nevertheless rejected the paper for lack of “interaction with other areas of mathematics.” (So much for the purity of pure mathematics. Lattice theory is widely used in the theory of programming languages, perhaps the board hated anything related to computation.)
@cd: with climate to within a millikelvin in the title … Since the accuracy of the data set used, to about +/-0.15C anomaly, this could get entertaining :)
Millikelvin precision is easily achieved with enough parameters, as we saw with the Rossander fit which used all ten shape parameters. With only three shape parameters one has to sit down and calculate whether there is any statistical significance to a given R2.
If some method applied to random data typically produces an R2 of only say 95% on account of using only a few parameters, but when applied to HadCRUT3 it produces an R2 of 99.997%, then even MattStat might grudgingly admit that this method, however implausible it might seem, has identified a property of HadCRUT3 sufficient to distinguish it from purely random data.
Now the property might just be the boring one that the data is HadCRUT3. Ruling out that possibility is difficult as we’ve seen here already. One has to study the method to see to what extent it has been tuned to HadCRUT3.
If close scrutiny reveals no favoritism for HadCRUT3, then millikelvin precision becomes a significant property. One can then ask how a dataset with an alleged accuracy of only +/-0.15 C could possibly yield an R2 corresponding to millikelvin accuracy. That would be a statistical impossibility, surely you’d be more likely to win the lottery!
What people continue to ignore here is that I do achieve millikelvin accuracy, and furthermore not with the ten shape parameters that Rossander had to use but only three.
Arguing that this is a statical impossibility, which is what many seem to be arguing here, does not undermine my case, it supports it!
@Marler: most interested people will take the extrapolations of his model into the future as “predictions”, for all practical purposes.
Hopefully policy makers have enough sense to ignore how “most interested people” interpret extrapolations. This should be part of Policy Making 101. Using extrapolations as predictions is asking for trouble.
I noted earlier how amusing it was to hear that it is risky to be wrong and mislead the herd, in conjunction with the defense of not even being wrong.
===============
vp, “Millikelvin precision is easily achieved with enough parameters, ..” True, but justifying the parameters physically is the challenge. Since there is a 14.5 year lag plus, SAW and AGW, all the noise is built into SAW with a number of reasons for the lag possible. One possible reason for the lag is the data. The ocean part of the data for most o the 160 years was sampled below the “surface”. Since the response to a forcing 5 to 10 meters below the “surface” would be slower in some cases that at the surface, SAW and the lag could be an artifact of the data :)
You should get a more rapid response to solar that penetrates to that “surface” which is at depth, than AGW which is a response to the energy accumulated at that depth. It could be that the data “averages” things that might need to be considered independently.
Also the difference between the initial and first “Surface” would be about 14% in a radiant model, I think it is (n+1)^(-1/4) (?) roughly since temperature and energy have that unfortunate non-linearity.
Pratt,
You referred to your +4C extrapolation as both “forecast” and “prediction” in a comment early in this thread that I have presented numerous times. You only dropped the “forecast” characterization, when you realized under pressure how ridiculous it is. You are dishonest:
Don Monfort | January 8, 2013 at 12:21 pm |
Very slippery and pedantic, doc. The issue is not reliability of forecasting, it is whether or not you said “With either dataset, the model forecasts a 4 C rise for 2100″ and included that forecast in your poster, as chart#7. “PAST AND FUTURE TRENDS”. FUTURE TRENDS sounds suspiciously like a forecast, doc.
Anyone can see from reading the comment from Mark B and your response that the two of you were talking about the level of accuracy of a +4C “forecast” using your little model , which you included in your poster as chart #7. In an intervening comment manaker said this:
“manacker | December 5, 2012 at 11:15 am | Reply
Mark B
Assume that Vaughan Pratt will answer your specific question regarding the 4C warming forecast to 2100.”
You made no objection to either Mark B, or max calling it a forecast of +4C. And you carried on talking about forecast and prediction. So you were talking about your +4C forecast, that you announced in your abstract and then included in your poster, as chart freaking #7. This ain’t rocket science, doc. It’s plain English. Got it?
The part of Mark B’s comment that you chose to answer, while ignoring the rest, was this:
Mark B: “Furthermore, I don’t see any decimal point with zeroes after it, just “4C”, Does this mean that you cannot actually predict the future temperature to an accuracy of 0.001 degrees C (1 millikelvin)?”
You replied:
VP:”It depends on whether you’re predicting average temperature for one year such as 2097 or one decade such as the 2090?s or twenty years. SAW + AGW can be evaluated to ten decimal places at any given femtosecond in time. But that’s no good for a forecast because you have to add SOL and DEC from Figure 11. Double their joint standard deviation and you get a reasonable figure for the uncertainty of a prediction in any given year. For any given decade the uncertainty decreases, but I wouldn’t want to forecast to two decimal digits so far ahead.
But even one digit isn’t that reliable because of unknowns like those Max refers to.”
You did not say, as you now imply, that you had made no forecast cause forecasting ain’t reliable. We can see that you are explaining to Mark B, why your +4C forecast does not contain any decimal digits. Period.
And you feign to wonder why some of some of us consider you to be dishonest.
> It depends on whether you’re predicting average temperature for one year such as 2097 or one decade such as the 2090?s or twenty years. SAW + AGW can be evaluated to ten decimal places at any given femtosecond in time. But that’s no good for a forecast because you have to add SOL and DEC from Figure 11. Double their joint standard deviation and you get a reasonable figure for the uncertainty of a prediction in any given year. For any given decade the uncertainty decreases, but I wouldn’t want to forecast to two decimal digits so far ahead. But even one digit isn’t that reliable because of unknowns like those Max refers to.
Unreliable forecasts have a prospective status that don’t make them projections, and certainly not predictions. Mere extrapolations.
Very tough to get, that.
***
You, #quarterbacks, notice how Don Don silently ropes-a-dope out if his “trend” schtick out of a sudden! Let’s not wonder why.
That ought to make you brag about getting the truth out of people. And if that’s not enough, talk about your tough childhood, or your military career, or other honourable ventures.
And if that does not work, whine about the Wizard.
That is really lame, willyboy. Read the rest of it. All he is saying in your cherry-picked sentence is that he he is not stupid enough to make that prediction with any decimal places. He is happy with the +4C forecast. He did say forecast more than once, and prediction. Didn’t he, willyboy? Resume your stalking, troll. Hey, why don’t you point out the mistakes or transgressions of your side once in a while? You are a phoney, willyboy.
Vaughan Pratt: Using extrapolations as predictions is asking for trouble.
You come down supporting the idea that your modeling result has no implications. For example, there would be no point in searching for the physical basis of the non-CO2 portion of your model; that it does not provide an impetus for CO2 reduction, and that the 4C rise by 2100 is totally uninteresting.
It seems now that your only claim is that no other model with an equal R^2 values has fewer parameters. Why ought anyone pay attention to that?
Not. Even. Wrong. And look how exercised everyone got. Hey, that’s academic combat rules in the Sacred Grove.
==================
> In this paper the author reflects on what forecasting is, defined therein as prospective analysis (as opposed to simulation and prediction proper). As such, the paper constitutes a significant departure from the mainstream view of forecasting by shifting the emphasis from the predictability paradigm to the impact paradigm, from forecast as discovering to forecast as creating the future. Today we have access to tools that have a wide range of applicability and are of various degrees of sophistication, depending on the particular future-directed task at hand, and also having a better understanding of the role of forecasting. We are better equipped, technologically and hopefully also cognitively, to manage the future. It is easy to recognize that this author’s stance towards the future — prospects and events that loom on the horizon — is distinctly proactive and not merely submissive or reactive. Though some of the issues raised in this paper have been discussed elsewhere by the author and other writes, the paper offers a coherent, well rounded, synthesis of epistemological assessment of forecasting, and as such is likely to be of interest to both producers and users thereof.
http://scistat.cilea.it/index.php/genus/article/view/153
@Matt: It seems now that your only claim is that no other model with an equal R^2 values has fewer parameters. Why ought anyone pay attention to that?
Because a small number of parameters makes it a more understandable description. Description should precede understanding. I don’t believe in trying to explain something that one can’t describe.
Geologist: I saw a really complicated pattern in the clouds this morning, I don’t know how to explain it. Maybe you can help.
Meteorologist: What sort of pattern?
Geologist: It was so complicated I can’t even begin to describe it. Lots of wiggles all over the place.
Meteorologist: Then I’m afraid I’m not going to able to help you understand what happened this morning.
The primary purpose of science is to understand the universe: particles, life, electricity, chemistry, stars, etc. Such an understanding can benefit many areas: engineering, architecture, forecasting, related sciences, etc. With good description can come good understanding—I don’t see how understanding is possible without it.
Forecasting is an admirable application of science but it’s hardly the only one. Moreover it’s not a particularly reliable one given the future unknowns. My interest is in science for its own sake as well as for its many applications.
Vaughan Pratt: The primary purpose of science is to understand the universe:
I think that there are at least 3 equal primary purposes of science: understanding (not the whole universe, but parts of it); predicting (as with weather, tides, eclipses, etc); and making things that work (or stuff that works, as in the case of medicines, fuel etc.)
Model fits and misfits sometimes drive exploration to find out what is the cause, as when model misfits to the orbits of the outer planets stimulated the search for an extra planet, and the subsequent model fits showed that the discovered planet indeed accounted for most of the previous model misfits. Should your model values, conditional on the future concentrations of CO2 and adjustments for aerosols, fit the measured values close enough, then someone will take up the search for whatever it is that is generating your residual processes. In this and other ways, prediction is a test of understanding, and a guide to understanding.
Kudos again for hanging in here. I’ll try to let you have the last words to this and my other post today, should you choose to respond.
@MJ: But first I would like to endorse comments by oneuniverse and others, calling for civility.
Thanks, Mike, I appreciate that. I too would like to endorse those comments.
Thus Vaughan Pratt has confirmed that the poster started with SAW being created as temperature minus AGW.
Poster? You said nothing about a poster when you stated flatly “The sawtooth was created as the difference between Hadcrut3 and AGW.” It was indeed: I detrended the temperature (as many have done before me) and then worked on the problem of finding a hypothesis that might account for the detrended temperature (as again many have done but not with my resulting hypothesis).
You’ve now rephrased what I responded to as something I would have flatly denied. In fact I would have said it was not even wrong because the concept of defining SAW as HadCRUT3 − AGW doesn’t even make sense as far as I can tell.
Taken literally, it would result in Figures 6 and 8 and the top two curves of Figure 11 being perfectly flat, which would be nonsense.
One might try instead defining SAW as F3(HadCRUT3 − AGW). But that makes no sense either as it would have the opposite effect: MRES would be far bigger because that definition of SAW would be seriously distorted by F3 and R2 would be much smaller.
I simply can’t think of any sensible way to define SAW as “temperature minus AGW” that could be reconciled with either my poster or what I’ve said so far in this thread.
I suspect you may be confusing the notion of hypothesis with the notion of residual. SAW is one possible hypothesis out of many for the residual HadCRUT3 − AGW (necessarily without F3). RES1 (column AN of the spreadsheet) is the further residual resulting from subtracting my hypothesized SAW to yield
HadCRUT3 − (SAW + AGW),
which the multidecadal filter (MRES FILTER in the poster, F3 in the post) transforms to MRES in column AB.
You can see all this by following the logic of the spreadsheet as laid out in rows 45-47. Auxiliary functions like BoxFilt4 and Window4 are defined in the last sheet of the workbook labeled “17 NAMES”. No use of Visual Basic Apps, VBA, by the way, that would have been a big mistake.
Furthermore that SAW hypothesis is made before parameter estimation via multiple regression. At the time of making the hypothesis there was no commitment to any particular values of the parameters: the best fit could have made the period of the sawtooth 1000 years and ClimSens 0.273 C/doubling for all knew or cared.
Contrary to the impression many here seem to have, I have neither an agenda, an axe to grind, or even a penny from any taxpayer’s pocket. I would if I applied for and got a grant to do this stuff from NSF or NOAA, so from that standpoint Heartland or David Koch would be a safer source of funding, but then Greenpeace would judge me as being as evil as Stanford which takes money from Exxon.
I just want to know the real answer, not the answer people on both sides of this furshlugginerly interminable debate keep trying to foist on me. Especially since they’re not the same answer.
Since the skeptical CE denizens are obviously troubled by some problem with the reasoning that’s leading to the obviously false conclusion that ClimSens is way up where the taxpayer-fleecing ideologues have pegged it, I may be able to help.
Picture me exactly as Peter Lang does, a consummate liar with a put-upon conscience trying desperately to get out. Got that? Easy, wasn’t it?
Now picture my conscience having an out-of-body experience floating above me and exposing my evil plot to the world as follows. (Think Ghostbusters and plasma.)
(shrill voice) “The evil professor below me is trying to dupe you into believing that the part of climate that correlates badly with the rising CO2, call it the natural part, is a sawtooth. Why would he pick a sawtooth, of all things? The reason is obvious: that shape will drag down the natural part at the right in order to artificially inflate the artificial part, AGW.”
Oddly, in nearly six weeks no one, not even CE’s resident physicist Pekka P, has thought to raise that as a serious complaint.
Whoa, what is the average IQ of CE?
Speaking as someone who was originally trained not as a computer scientist but as a physicist, that is the sort of rational complaint I could take seriously.
And no, that was not my conscious conscience speaking but its subterranean counterpart, my subconscience if you will, that hangs out with my subconscious, about whose motives I have not hitherto thought to inquire. Maybe my subconscience knows that my subconscious has an evil twin, in which case I may need to get in touch with them both and tell them to cut it out. (For a Linux-related body of ancient history on that, google the phrase “my mind and my body keep playing tricks on each other” in quotes.)
To quote David Springer, HAHAHAHAHA. (Oh do shut up, evil subconscious.) By the way, David, your hair is green. Did you know that?
Relax. If we’ve warmed the earth up, it’s been a good thing.
=============
Eli, who would not; with a hot fox & those French curves? Enough red meat, for any buck…
Liberty curves, please.
Give me Liberty, or curve my taste!
=============
Willard; that’s just what I’ve been throwin…
#YouQuarterbacks, you go get that #ClimateBall and start throwing whatever pleases you!
Who let Brent Musburger in here?
Steven Mosher…
Setting us models implies a level of physics.
And foil.
Do you need foil, Eli?
Vaughan Pratt – your statement of me that “You have established it purely by calling non-circular logic circular, and by nothing else.” is nonsense. I have spelled out repeatedly how and why the logic is circular. In your poster, you claimed to have shown that global temperature is made up of two components, AGW and SAW. But you began by DEFINING SAW as temperature minus AGW. That is not me “calling it” circular logic, that is me demonstrating that it is circular logic..
You even seemed to be implicitly agreeing with me on this, when you replied to Eli Rabbett’s “The important thing would be to tie the curves to physical stuff convincingly.”. You said “That would be one way. Another would be to weaken the circularity objection by showing that the approach does not automatically stuff the last four decades of temperature into AGW as some have been claiming. This could be done by manufacturing artificial climates in which SAW is responsible for more of the recent rise than AGW and showing that the method is capable of reporting just how much more.”.
I agree with Eli Rabbett that his would be one way of dealing with the circularity, because it would add something which was not already built into the premise. I have already said as much in some of my comments. But the poster did not do this, so the circularity remains.
I am not sure that your alternative approach – manufacturing artificial climates – would deal with the problem. Maybe it could, but surely it would be much better simply to show that SAW has a real-world meaning. That would settle the matter beyond all doubt. But, of course, the poster did not do this and so again the circularity remains.
> Vaughan Pratt – your statement of me that “You have established it purely by calling non-circular logic circular, and by nothing else.” is nonsense.
Chewbacca strikes again!
> I have spelled out repeatedly how and why the logic is circular.
Deaf Vader feels the Force and says “What?”.
Mike,
You are refusing to play Pratt’s game. The game is that he gets to define his can openers any way he chooses and you have to grant him that privilege. It’s like when you go to those highly contrived, wildly implausible Hollywood movies. You don’t get to have any input into the writing of the script, or the selection of the actors, or direction. They take care of that hard creative work for you and deliver to you the spectacular and entertaining millikelvins, with nicely colored charts. And logically, it ain’t circular. They also get to define what circular is. It’s part of the game, Mike. You can’t win.
So you have to grant Pratt his can openers and let him go behind the curtain to perform his calculations, which have been revealed to be suspect, and come up with his millikelvins and his forecast/prediction accomplished through simple extrapolation. And if you want to prove him wrong, you have to do it by playing his game, by his rules.
If you don’t want to play by the rules, then you got to leave the effin thread, or little stevie the pudgy, cowardly nerd will call you a little biatch. And it is all logical, Mike.
> You are refusing to play Pratt’s game.
Listening ™ — The Game Where You Can’t Say “What?”
@DM: It’s part of the game, Mike.
Mike has made a plea for civility which you’re ignoring, Don.
@DM: You can’t win.
Mike can if he stays civil. You can’t because civility is clearly not your thing so far. Only you can change that
@Jason: In your poster, you claimed to have shown that global temperature is made up of two components, AGW and SAW. But you began by DEFINING SAW as temperature minus AGW.
“Began” where, and what do you mean by “define?”
If you’re talking about the poster, that begins by defining SAW as a filtered sawtooth where the harmonics are attenuated to varying degrees, with the fundamental completely blocked, the next two harmonics untouched, and the next two after that attenuated and slightly phase shifted. The shape of SAW is controllable by three parameters, which I equipped with three sliders so that interested parties could get a feel for the variety of shapes so representable. Three more parameters, namely period, phase, and amplitude, serve to fit that shape to HadCRUT3; one would use the same three parameters to fit a sinewave to it.
If however you’re referring to the two-year-long process by which I arrived at the poster, in order to see the pre-1970 oscillations more clearly I detrended HadCRUT3 with an estimate of CO2-induced global warming, without however committing to any particular climate sensitivity. Had it turned out that climate sensitivity CS should be say 1.1 C/doubling in order to make sense of the oscillations I would not argue against that since I have no motivation to. I would much prefer that the world was safe from the impact of CO2.
I then performed a joint fit of one sine wave to the residual (joint with CS as a parameter), noticed it was not a great fit but that the residual bore a strong resemblance to the result of two sine waves beating, and tried two sine waves. This improved the fit considerably without however making any significant difference to CS.
Many months later I noticed the 2/3 and zero-phase coincidences in frequency and amplitude, which subsequently led me to hypothesize a sawtooth. At that point I defined SAW as just the 2nd and 3rd harmonics of a sawtooth. Later I noticed that the fit improved when bringing in the next two harmonics. In such situations there are almost always resonances that can reshape the waveform; in speech these resonances give rise to what are called formants.
Are you calling that process “circular logic?” And if so where is the circularity? Detrending is standard practice, as is multiple regression. How is what I’ve done in any way different from standard practice in science? Is there a particular step that you would consider such a departure? If so please identify it.
Vaughan Pratt – you ask: “Began” where, and what do you mean by “define?”
“Began” is where the logic starts, ie. the premise.
“Define” is as in “The sawtooth was created as the difference between Hadcrut3 and AGW”.
In your mind, SAW and the sawtooth are different things. You see the sawtooth as some unknown climate feature, and you see SAW as the sum of some sinewaves. But the sawtooth was not arrived at by observing or analysing a climate feature, it was arrived at by subtracting AGW from temperature. You failed to provide any climate meaning for the sawtooth. You thought at one point that it might be ocean oscillations, but gave up on the idea. The sinewaves were not arrived at independently, they were forced to add up to the sawtooth by a raft of meaningless parameters and three filters. In other words, you simply did whatever it took to force SAW to equal the sawtooth. The sinewaves have no climate meaning. The parameters have no climate meaning. The filters only removed, they added nothing. There was no addition of any value of any kind to SAW in order to make it anything other than just the sawtooth. So in climate terms SAW and the sawtooth are the same thing. Their one and only ‘climate’ attribute is the original definition – temperature minus AGW.
With the sawtooth/SAW having no climate meaning, there is nothing left to support an ECS of 2.83 for AGW. With the sawtooth/SAW being nothing but temperature minus AGW, it achieves nothing to show that AGW plus the sawtooth/SAW equals temperature. You ask “where is the circularity?”. That’s the circularity.
You describe your ‘two-year-long process’ in some detail, but you can’t get anything meaningful by sinewave-fitting purely on its own when you have less than one iteration of the full cycle..It can be a very useful tool, but only if in the end the sinewaves map to something real. Yours don’t.
VP:
“Had it turned out that climate sensitivity CS should be say 1.1 C/doubling in order to make sense of the oscillations I would not argue against that since I have no motivation to. I would much prefer that the world was safe from the impact of CO2.”
I suspect, based on your behavior on this thread, that you would not have found that result acceptable. It is not what you set out to find. It ain’t alarming. You wouldn’t have run to the AGU with that poster. Back to the drawing board, until you found +4C by 2100.
I could be wrong, but you have not indicated that you have an open mind on the subject. You keep arguing about circularity, when the criticisms do not depend on whether your method meets your plausible definition of circularity, as it relates to your peculiar suspect method. See Mike Jonas’s latest excellent summation of what’s wrong with your stuff and just substitute BS where he says “circular”, because he doesn’t get your quasi-rationalization for claiming your work ain’t circular.
And this is a serious comment. Just like the many I have made that clearly demonstrated that you are not being honest, when you stubbornly claim that you didn’t mean “forecast”, when you said “forecast”. Pretty near everyone who has read this thread knows you are trying to fool us. You had a distinguished career in other fields. This is not the way to go out. In my humble opinion.
Don Monford –
It could be that Vaughan Pratt genuinely did not set out to find a high ECS, but you need to go back to the IPCC report to understand that it was inevitably what he would find. The IPCC attributed “all” of the 20th century warming to CO2. To do this, they plugged CO2 into a climate model and calculated what ECS would fit the temperature rise (they call this “constrained by observation”). They came up with an ECS of 3.2, with huge error bars because the fit was terrible. Basic theory would only give them an ECS of 1.2, so they came up with a cock-and-bull story of “positive feedbacks” in order to get it up to 3.2.
So now if you compare the 20th century temperature with AGW at an ECS of 3.2, they are close at the start and there is quite a good match for the last 30 years, simply because that is what the IPCC was fitting ECS to in the first place. The divergences in the middle are “explained” as unknown natural variation (“unknown” as in “we don’t know what natural feature caused it”) or as being caused by aerosols which are estimated to come and go at convenient times but no-one actually knows why.
In his study, Vaughan Pratt followed the same basic process of mapping AGW to the start and the last 30 years, so it was virtually inevitable that he would arrive at an ECS close to the IPCC’s ECS.
@Jonas: “Began” is where the logic starts, ie. the premise.
Good, thanks. From the standpoint of a nonlinear multiple regression (which is what I’m performing here) the logic of the poster is self-contained. Hence the “beginning” is inside the poster. Let me review the process.
The goal is to model the multidecadal part of HadCRUT3. I model it as a sum of two functions, SAW and AGW. I define the SAW model as a filtered sawtooth using three “shape” parameters to describe the filtering, and base the AGW model on published work originating with Arrhenius, Hofmann, and Hansen. I jointly fit SAW and AGW to HadCRUT3 using three parameters each so as to minimize the variance of the multidecadal or F3-filtered residual MRES (after truncating the first and last decades, without which end effects might result in a worse fit, i.e. a smaller R2).
@Jonas: With the sawtooth/SAW being nothing but temperature minus AGW, it achieves nothing to show that AGW plus the sawtooth/SAW equals temperature. You ask “where is the circularity?”. That’s the circularity.
Nowhere in this process do I define SAW as “HadCRUT3 minus AGW.” If I did the residual would be zero and R2 = 1, and then I’d agree with you that the reasoning is circular.
Are you perhaps arguing that the process of hypothesis formation should be counted as part of the logic? Hopefully not, since this is not how science works. If a scientist wakes up one morning with a hypothesis that she’s written on a sheet of paper while asleep, and the hypothesis turns out to explain the data well, no one is going to fault her for having written it while asleep. Nor is she under any obligation to say how she arrived at it (though naturally some people will be curious, and fascinated if she tells them how she found it).
@Jonas: So in climate terms SAW and the sawtooth are the same thing. Their one and only ‘climate’ attribute is the original definition – temperature minus AGW.
That’s the definition of detrended temperature, not of SAW. SAW is a proposed model of detrended temperature. You’re letting the fact that a model of something should be a good fit make you want to identify the model with what it’s modeling, but that’s not how science works. The something and the model are distinct things, even when they are extremely similar.
Is that terribly different from what I wrote in my conclusion: “Whether SAW describes a single phenomenon or several is an excellent question.” I’m happy to speculate on possibilities, but in the end none of those possibilities might pan out and SAW could be completely meaningless just as you claim.
Perhaps I can’t associate SAW with a specific physical phenomenon, but you can’t prove it’s meaningless. Merely looking at a random string of letters and declaring that it’s meaningless hardly counts as a proof, especially if unbeknownst to you it’s actually an important encrypted message.
You explained that very well Mike, but I get that Pratt is a prisoner of the IPCC. He eats consensus climate dogma. That is what I was talking about. He set out to prove the case for business-as-usual alarmism. He armed himself with a big load of confirmation bias, and off he went on his quest to create a DIY millikelvin .99999999 R2 climate model that would put the pro’s GCMs to shame. It’s still obviously a work in progress. My guess is that he will be presenting another poster at AGU next year, the year after, and…
I can’t wait to see the results of his parodies of Wood’s parody of a physics experiment, which I hear he plans to present just after hell freezes over.
@DM: Pratt is a prisoner of the IPCC.
With equal logic the California Highway Patrol could drag in a motorist they dislike on the ground that he’s a prisoner of the Sicilian Mafia, even if he’d never heard of them.
I have no connection whatsoever with the IPCC or anyone in the slightest bit related to it. If they lie as much as you do, Don, then I hate them as much as you do.
I’m getting a little tired of Vaughn’s false claim of Rossander using all 5 shape controls (two parameters each). SAW4 is not being used by Rossander. I kind of wonder whether Pratt even looked at it.
Pratt continues to ignore the fact that Rossander deleted at least three other variables when he set climate sensitivity to zero. The name of those three variables are Hansen, Hoffmann, and Arrhenius.
I don’t think y’all are going to be able to make an honest man out of Pratt. He’s too old and set in his ways to change now.
Pratt is further being dishonest by claiming he’s using fewer variables.
Pratt is using SAW2, SAW3, SAW4, and SAW5.
This can be tested by setting the scale to zero on any of them and watching the fit change drasitically. Rossander uses SAW1, SAW2, SAW3, and SAW5 but then Rossander eliminates AGW entirely by setting it to zero.
I encourage everyone to examine the spreadsheet with Rossander’s results and see for yourself that Pratt is dishonest.
(S1, P1 etc. are names local to this comment, used just for convenience.)
V.P.’s model :
Doesn’t use 1st harmonic
Uses 2nd harmonic, no scaling or shift
Uses 3rd harmonic, no scaling or shift
Uses 4th harmonic, scaled by S1, shifted by P1
Uses 5th harmonic, scaled by S2, shifted by P1
(AFAIK) S1, S2, P1 were fitted to minimise MRES
M.R.’s model (different S1, P1 etc. to V.P.’s model, of course) :
Uses 1st harmonic, scaled by S1, shifted by P1
Uses 2nd harmonic, scaled by S2, shifted by P2
Uses 3rd harmonic, scaled by S3, shifted by P3
Doesn’t use 4th harmonic
Uses 5th harmonic, scaled by S4, shifted by P4
(AFAIK) S1, S2, S3, S4, P1, P2, P3, P4 were fitted to minimise MRES.
That’s 5 more variables fitted to HadCRUT3 for the same section of the analysis. Eliminating AGW removes only 3 variables derived from the HadCRUT data-set (the other two are from the Mauna Loa CO2 data-set, which is not the dependent variable).
It’s not as straightforward as adding up the number of fitted parameters, since the form and complexity of the function is different. This was pointed out early on by Prof. Pirilä in his comment about “effective degrees of freedom” and the subjective choice involved in picking the compostion of the function.
(At least for the first order effect – perhaps the effect of T on CO2 is significant enough to affect the analysis at the millikelvin scale, I don’t know)
You evidently can’t count.
Pratt uses 3 SAW filters with two variables each + however many variables it takes to make AGW which I’m not opposed to agreeing is three with the caveat that two variables related to Mauna Loa are left out.
That’s nine variables for Pratt.
Rossander uses 4 SAW filters with two variables each and eliminates the three variables comprising AGW.
That’s 8 variables for Pratt, 5 for Rossander.
Learn to count.
I suppose I need to learn how to subtract.
9 variables for Pratt (3 SAW filters, two vars each) + 3 vars for AGW.
8 variables for Rossander (4 SAW filters) + 0 vars for AGW.
I’m disappointed that AGW’s ears aren’t wiggling.
Adding multiple harmonics with no shift simply aligns edges so you get a great big effect when they all line up. That’s what makes bridges collapse is the line up. Put anything in the bridge to phase shift one or more harmonics and you avoid the collapse. Did you fall off turnip truck yesterday or what?
Morever, Rossander’s configuration generates the rising side of a sine wave with a frequency of 200 some years. Unlike Pratt’s configuration Rossander’s accurately models the last 15 years of HADCRUT3 where it went flat because the top of the long sine wave is flat. Pratt waves his hand and says ignore those last 15 years it’s just a glitch.
Incredible.
David Springer: , Rossander’s configuration generates the rising side of a sine wave with a frequency of 200 some years. Unlike Pratt’s configuration Rossander’s accurately models the last 15 years of HADCRUT3 where it went flat because the top of the long sine wave is flat.
An actual point. Well done.
Does this mean that Pratt and his mealy-mouthed minions will stop talking about Rossander?
Matthew R Marler | January 9, 2013 at 4:25 pm |
David Springer: , Rossander’s configuration generates the rising side of a sine wave with a frequency of 200 some years. Unlike Pratt’s configuration Rossander’s accurately models the last 15 years of HADCRUT3 where it went flat because the top of the long sine wave is flat.
An actual point. Well done.
@DS: 8 variables for Rossander (4 SAW filters) + 0 vars for AGW.
Haven’t you forgotten ToothW (D26), David? How else can Solver pick frequencies for the harmonics?
In his original post at WUWT Rossander wrote, ” I played with a few initial parameters to see what they might do, then fired off Solver with the instruction to modify the parameters below with a goal of maximizing cell U35 (MUL R2).”
Rossander then lists the 12 parameters he authorized Solver to modify. As far as he’s concerned he used 12 parameters.
In hindsight we can use the fact that Solver achieved R2 = 99.992% by setting SAW4 to zero to justify taking control of SAW4 away from Solver and zeroing it manually ourselves. This would bring Rossander’s parameters down to 10. By the rules I’ve been playing by this is fair play.
But since Solver is allowed to set all five amplitudes of the individual harmonics independently, Amp (M26) becomes redundant, that is, these six parameters are not linearly independent. This further brings Rossander’s parameters down to 9, the same number as I’m using.
I don’t see any room for further reducing the count for Rossander’s fit.
But since it’s the same number of parameters as mine, it would now be a tie were it not for the fact that we can break the tie with R2.
Never expecting this sort of competition, I had rounded my parameters to plausibly round numbers without worrying about the fifth digit of R2. Using one extra digit of precision in a couple of the parameters, very small changes to my poster’s parameters brought the 99.990% in my spreadsheet (conservatively reported as 99.98% in the poster) up to 99.997%.
So with the same number of parameters, we have 99.992% against 99.997%.
This sounds better in terms of variance of MRES as a fraction of that of MUL expressed in parts per million instead of percentages. Using AGW we get 3, replacing AGW by additional SAW parameters gives 8. Smaller is better in this case.
Rossander also said No other constraints were applied. That’s evidently incorrect as he appears to have overlooked Solver’s checked-by-default box constraining all otherwise unconstrained variables to be nonnegative. Solver found that the solution could be improved by decreasing SAW4 but when it reached zero Solver had to stop because of the checked box.
Further on Rossander wrote My analysis was trivial, limited and deeply flawed. It had to be so because it was based on no underlying hypothesis about the factors being modeled (other than the ClimSens control value). It was an exercise that took about 15 min and was intended only to illustrate the dangers of over-fitting one’s data.
With more time Rossander would presumably have noticed the oddity about SAW4, diagnosed it, and unchecked the box.
I discussed all this at WUWT three weeks ago. However with over 2000 comments here plus those on WUWT including two each by Rossander and me on this topic I can’t say I blame people for losing track of what everyone’s said in the past five weeks.
One thing that’s been nagging at the back of mind since then is that 2 more parameters (those for SAW4) should have totally nailed it. What would have happened had Rossander unchecked that box?
I tried this just now (I included Amp for old time’s sake) and Solver gave me the following fit.
D26 ToothW 1783.15…
G23 Shift 1 2219.30…
G26 Scale 1 761.44…
H23 Shift 2 4268.41…
H26 Scale 2 598.68…
I23 Shift 3 4550.48…
I26 Scale 3 1271.08…
J23 Shift 4 2741.42…
J26 Scale 4 521.23…
K23 Shift 5 3283.39…
K26 Scale 5 577.08…
M26 Amp 3748.51…
(Paradoxically Solver seems to have sent SAW4 into negative territory only to bring it back out later on. This could well have happened via continuous changes to Shift 4, J23, while J26 was negative. As John S would point out this is more easily understood in terms of the 2D geometry of the complex plane.)
The envelope, please…
R2 = 100.000%
Fourier would have smiled and said “That’s what it should have been.”
In those days mathematicians were mathematicians and didn’t need no stinking computers to see the obvious.
But this also shows how dangerously close 9 parameters are to overfitting. The “3 vs. 8” outcome would seem to show that although 9 parameters is not completely overfitted it’s in a very tight corner.
For my poster to have even a prayer of being publishable this corner needs to be considerably enlarged. I certainly wouldn’t attempt to publish it as is. Pekka made much the same point in his first reaction to the poster, and I’ve since been mulling over the various ways of addressing this serious concern.
Climate Etc. to the rescue. Thanks to Judith for founding and hosting it.
Vaughan Pratt:
For what it’s worth, my initial reaction to this paper was, “Too many parameters to care.” That hasn’t changed. Until I’m given some reason to believe over-fitting isn’t a serious issue, I have little interest in the approach. That attitude is only heightened by the fact one of your parameters has an inherent error (and possibly bias) associated with it.
An R2 score of 99.9x% makes me think “over-fit” long before it makes me think “well-described.” The phrase, “too good to be true” comes to mind.
@BS: An R2 score of 99.9x% makes me think “over-fit” long before it makes me think “well-described.” The phrase, “too good to be true” comes to mind.
Are you limiting yourself to just geophysics here, Brandon, or physics in general?
What about quantum electrodynamics, for example?
Vaughan Pratt, you have a tendency to ask me questions I can’t see the relevance of. For example, earlier you asked me about the level of knowledge of other posters. It wouldn’t bother me much except you seem to then ignore my responses. It makes me wonder why you bother asking. It seems to just waste both of our times.
In any event, that comment was meant exactly as stated. I didn’t place any limitations on it because I didn’t intend any.
V.P.:
Another obstacle to publication seem to to be the results (reported in the draft version of the paper) for HadCRUT4 – one more parameter required for the SAW fit, and the loss of the interesting pattern (with its suggestion of corresponding physical causes) in the sawtooth’s harmonic components.
(On the other hand, MRES is still flattened to within a millikelvin over the period 1870-2010, and only small changes needed to be made to the AGW parameters)
Is this comment still on the table, Don Don, or you like to play both the good and the bad cop at the same time [1] ?
[1] By same time, I mean 7:35 – 6:10 = 1 hour and 25 minutes.
The sad part of this is that even caught red handed in the lie Pratt goes on with it. At this point, under that circumstance, I suspect psychosis.
By the way, I have both Pratt’s and Rossander’s spreadsheets open on my desktop simultaneously for easy comparison. I’m not making this up. Has anyone else, even Pratt, bothered to do that?
Get off the effin thread, David. You ain’t following the rules. Must not question the Wizard.
> Must not question the Wizard.
I thought you did, Don Don
Question the Wizard.
Many, many, many times.
And I thought he did answered.
Even when you despaired for his responses.
Even when you called him dishonest.
Over and over and over again.
Even questions about stuff you know nothing about.
Even questions about stuff you don’t care about.
Questions where you already had your answers ready-made.
Ready-made answers about his motives.
Sinister motives.
Without acknowledging the responses.
Without hearing them.
Rope-a-doping to another question.
To another remark.
Completely oblivious to your own failings.
Magnificiently committed to your own truth seeking.
Ignoring basic collegiality.
Not civility, Don Don, collegiality.
This has nothing to do with the Wizard’s rules, Don Don.
Just basic rules of scientific conversation.
You are an idiot, willy. You don’t get to decide how internet blogs operate. This is not an ivory tower, you dummy. Pratt stuck his face out here knowing that he would get some good slaps. He deserves most of them. Now resume your trolling as the delusional self-appointed arbiter of the rules of scientific discussion. If you keep up the pace of stalking non-believers that you have set for yourself, this could easily be a 4,000 comment thread, in another week or so.
> You don’t get to decide how internet blogs operate.
You don’t either, Don Don, and I never said or implied I did.
I’m just telling you what you did so far in the thread.
If you don’t like it, you know what to do.
How low are you willing to go to win this game of #ClimateBall, Don Don?
Have you ever read Musashi’s **Five Rings**?
Thank you for the kind words,
w
PS: The subject was “scientific conversation”, not “internet blogs”, by the way. Not that you care about such distinctions.
You are an idiot, willy:
“PS: The subject was “scientific conversation”, not “internet blogs”, by the way. Not that you care about such distinctions.”
I am not limited to your choice of subjects. I don’t like or respect you. Why would I feel obligated to follow your lead, you dummy? Troll on.
Glad that you tacitly agree that your comment was tangential to mine, Don Don.
You are also free to write in Klingon, if you feel like it.
You must not have noticed that the conversation we are having is on an internet blog. Also, I am not a scientist, and I very mcuh doubt that you are, except in your own mind. Now I don’t have any more time to satisfy your desperate need for attention. I have some volunteer work to do. May I be excused, you little twit?
> You must not have noticed that the conversation we are having is on an internet blog.
We are not even having a conversation, Don Don. As far as I’m concerned, you pretend to have a conversation to place words. It would have a more powerful effect if you could instigate a food fight, but you have found someone who believes in Love and Light.
Even if we suppose (for argument’s sake) that we do have a conversation, this would has no relevance whatsoever with what I was telling you.
More importantly, that you’re free to do something does not entail that it’s a good idea to do it.
***
Please do continue, Don Don. By the end of the week, I might have some time to make a compendium of your most magnificent contributions
on this thread.
There is no fast way of wielding the long sword.
Prat started out by implying Judith’s house is infested by deniers:
“In any event this poster is offered as a preliminary report on work still in progress. One reason for advertising it here at an early stage is that the denizens of Climate Etc. seem well motivated to poke holes in theories of global warming, which I view as a positive benefit of skepticism, as distinguished from flat denial. There seems to be a lot of the latter here too but I haven’t found it as useful.”
Compare and contrast:
(1) Judy’s denizens well motivated to poke holes in [such and such], viewed as a positive benefit of skepticism, as distinguished from flat denial.
(2) Judy’s denizens are infested by deniers.
According to Don Don, (1) and (2) are more or less equivalent.
A magnificient truth seeker we have there.
Water adopts the shape of its receptacle, it is sometimes a trickle and sometimes a wild sea.
Erratum:
(2) Judy’s
denizens areinfested by deniers.Let’s ask Dr. Pratt:
Why did you start out this discussion with this gratuitous slap at “a lot” of your audience?
“…as distinguished from flat denial. There seems to be a lot of the latter here…”
Was that collegial? A good way to start a scientific discussion?
I don’t expect an answer. I am extrapolating.
We can surmise that Vaughan anticipated your act, Don Don, and that he did not expect to have seven Magnificient Truth Seekers.
We can wonder why the sudden backtracking to the blog post, which was, whether you care or not, the topic of my first question I asked you on the thread.
Is you stack of chips still behind your behemoth, John S.?
LB.
“Prat started out by implying Judith’s house is infested by deniers:”
#############################
This is your claim and you supply a quote to support it. let’s see if the quote supports the claim.
1. Pratt implied
2. Judiths house was infested
3. By deniers.
Now lets look at the quote:
In any event this poster is offered as a preliminary report on work still in progress. One reason for advertising it here at an early stage is that the denizens of Climate Etc. seem well motivated to poke holes in theories of global warming, which I view as a positive benefit of skepticism, as distinguished from flat denial. There seems to be a lot of the latter here too but I haven’t found it as useful.”
#######
what does pratt claim.
First off he doesnt imply anything. He makes an observation and tempers that observation with the language of uncertainty. This works in the opposite direction of an implication. What does he observe
1. The denizens SEEM well motivated to poke holes.
2. Poking holes is a positive benefit.
3. Poking holes is better than flat denial.
4. There Also SEEMS to be alot of flat denial here.
5. Vaughan doesnt find flat denial useful
So, lets get a the agreeab;e stuff out of the way. Vaugh says ” alot” and Don reads this as “infested” contrasting those two we can see the power of connotation and spin. Don has represented Pratt poorly. Lets rewrite Vaughans last sentence:
” There seems to be a lot of the latter here too. I find the vermin who play this flat denial game to be disgusting”
There seems to be a lot of the latter here too.commenters who scurry in and out like cockroaches leaving disgusting comments and destroy judiths lovely house”
See, if vaughan wrote stuff like that, then Dons paraphrase would be a bit better. But vaughan didnt write that. he wrote that he didnt find flat denial USEFUL to HIM. he didnt call it stupid, he didnt personalize, he didnt call out individuals.
What is the difference between “flat denial” and “poking holes”
Flat denial consists of refusing in some way shape or form to a dialogue. Let’s practice some flat denial. Note, flat denial is not wrong, it is merely not useful to Pratt. Flat denial comes in many forms
1. Is your poster peer reviewed? no? ok I refuse to engage you.
2. You used hadcrut. Thats fake data. i refuse to engage.
3. Do you have code and data? no? ok I refuse to engage.
4. Your a liberal. I dont believe a single thing you say
5. Who pays you? Koch? I refuse to let you on the stage
6. Have you read Hnasen 2012? ok, get back to me when you have
7. You make no sense.
8. Your wrong, because the sun dunnit
many many ways to “No” to a conversation. here is a hint. If you are a skeptic and have been asking for a debate, flat denials dont work as a debating tactic.
Did VP imply that Judiths house is infested with deniers? No, he made the observation that some like to poke holes and that is what he is looking for, while there are a lot of comments that are just flat denial and he finds that less useful.
My own experience answering comments after writing a post is that vaughan is correct. The hole poking is stimulating. Friction loves company. the flat denials are useless, sometimes funny, sometimes annoying, distracting, entertaining.. blah blah.. but they are not useful to the OP
I just read the first few lines, stevie. I will decline to reply in detail. You are another little punk with a bad case of Donitis. I really burn you monkeys, don’t I?
I bet we meet on the street one day, stevie. I would recognize you anywhere. When I come up to you and introduce myself, you will run. It won’t take me long to catch you by the scruff of your fat little neck. But I won’t hurt you. At the most a vigorous dutch rub. I’ll drag you to the nearest decent bar and buy you some drinks.
You take this crap way too seriously for your own welfare, stevie. There are some dangerous people lurking the internet. You already have Willis ready to beat your little heiny. He is old, but wiry. Be careful, pudge.
The olive branch just offered to Moshpit was touching, Don Don.
So, was these two examples you just game really non-collegial, Don Don, or is it something else, like, I don’t know, for instance that when some “ivory tower” guy speaks of denial makies you blow a fuse, a fuse you need to defuseafterwards?
Do you think that was an olive branch, willy? Ask little stevie what he thinks. Better yet, you two should get together. I believe that his roommate, Charles, left him some time ago and I haven’t heard that pudge has found anyone else. You two have a lot in common. Big heads, loose mouths and an unnatural, unhealthy interest in a certain ex-thug. You could call stevie Don Don, and he could call you little biatch. You could act out your fantasies on each other. Also, stevie is expecting a big check from Muller. But it’s been a while, so take some cash and groceries.
I did not know I needed to ask Mosh about what you meant, Don Don. Does it mean you have to ask Mosh for what you mean too?
The olive branch I had in mind was under the link under “defused”, which did not work.
Here it is:
http://en.wikipedia.org/wiki/Minimisation_(psychology)
This is the thread that never stops giving.
Note to Vaughn: You’ve really gone above and beyond in keeping this baby going. Thank you.
Note to Don Montfort: You’re grossing me out talking about willie and stevie sitting in a tree. Please stop.
Vaughan Pratt – Your comment about artificial climates triggered a train of thought, and I’m starting to think that there might be a bit more circularity in your logic. The question is this: In the optimisation process, is it possible that there was a bias towards the harmonics of a sawtooth, and that the final value of 2.83 for ECS came about because it was the value that gave the best match to those harmonics? I note that 2.83 is not the IPCC’s figure, although it is within the IPCC’s range. In other words, is it possible that the finding of the ‘second and third’ harmonics in SAW wasn’t something interesting that just happened to emerge from the calculations[*], but was, intentionally or unintentionally, an objective of the optimisation process? Call this one confirmation bias instead of circularity, if you prefer, but then confirmation bias is itself a form of circularity.
[*]”What’s interesting (to me if not to you) is that almost all of SAW seems to consist not merely of random sine waves but of the second and third harmonics of a sawtooth. What are the odds?!? I found that sufficiently surprising as to warrant including it as part of the poster.”
Vaughan Pratt http://judithcurry.com/2012/12/04/multidecadal-climate-to-within-a-millikelvin/#comment-281100
Mike, while skeptics might feel that I have (consciously or subconsciously) underestimated the contribution of ocean oscillations, The Team has expressed entirely the opposite opinion, claiming I’ve overestimated it. Just search for all occurrences of “Pratt” here for example. I emailed Tamino’s coauthor Gavin Schmidt for his view on this little spat and he stuck up for Grant Foster, aka Tamino. The Team doesn’t like me any more than you do.
While each side will naturally suspect bias, the suspected biases in this case are opposite and hence tend to cancel.
Which is fine by me since I have no particular axe to grind here regarding either side of this debate. I have no interest other than in finding plausible models of what’s going on. I could care less whose agenda any given model supports, I don’t have an agenda. Anyone accusing me of having one could only do so if they had one of their own.
Groucho Marx would have said that if you don’t like my models I have others. In his case it was principles rather than models. In my case I don’t have other models, which would seem to lob the ball back into your court.
If there are other models then it’s up to you to produce them. I’ve been completely unable to do so. I’ve been saying this for quite some time now, what else can I say?
No agenda. Yes that makes sense. Wool gathering is usually not associated with any particular goal. It’s an end unto itself. In other words my initial assessment that you’re simply marking time in your dotage is further confirmed.
doc,
Both sides could be disliking you for different, valid reasons. And hey, maybe it’s just because you don’t have the goods. There are other models, doc. Take your act over to realclimate and I am sure they will school you on the subject.
Hmmmm. At least you got as far as a moderator’s “[edit]”. Several years ago I was banned on Richard Dawkins’ blog for posting, without comment, a link to a Roy Spencer paper. As far as I can tell, I am also banned on RealClimate.because if I enter a comment there nothing happens.
I really do think that your poster doesn’t achieve anything. The fitting of the harmonics to SAW could have been interesting, because the characteristics of SAW itself are not subject to the circular logic that I complained about. However, SAW doesn’t seem to match up to anything in the real world, and the fit to the harmonics seems to be an outcome engineered at least partly by the way the optimisation process was set up.
When you say ” In my case I don’t have other models, which would seem to lob the ball back into your court.”, that could be interpreted as a claim that your model stands until someone produces a better one. Indeed I think you commented along that sort of line earlier, but I’ll take it at face value. I haven’t tried to create an alternative model, but if I were to do so I would try to incorporate relevant major known (or major possible) natural factors, along with AGW of course but starting with the generally accepted ECS of ~1.2 rather than the IPCC’s 3.2 using unsubstantiated “feedbacks”.
In any case, I would like to repeat my earlier appreciation of your having the courage to post all of your workings for scrutiny. If only everyone did that, climate science would be a much better place.
I am currently being encouraged to publish a ‘parameter-fit’ in a different climate area, so you can look forward to criticising that if I ever get there.
@DS: Wool gathering is usually not associated with any particular goal.
Wasn’t that Senator Proxmire’s rationale for his Golden Fleece award, awarded 168 times? Scientists aimlessly gathering wool by fleecing the taxpaying public.
re; Proxmire fleecing the taxpayer
Reader’s Digest has prior art dating back to the 1960’s in my direct recollection. A monthly column “That’s Outrageous” of some specific bit of how taxpayer money was spent.
I would bet dollars against donuts that government spending has been lampooned in heiroglyphics on pyramid walls 4000ya+ and somewhere in every other culture where there were tax collectors. There’s probably cave art from the ice age where Ayla complained about the witch doctor on the public dole and he should get off his lazy ass and go on mammoth hunts like the other men.
And the c*nt fest goes on…
Steven Mosher | January 3, 2013 at 12:16 am |
“Peter, Dr. Pratt doesnt owe you answers.”
A good thing too because he doesn’t have any answers. All he has is Prattle.
HAHAHAAHAHAHAAHA – I kill me sometimes.
@DS: I kill me sometimes.
With non-zombies, once is enough.
Ah. So that’s what happened. You didn’t actually survive the quintuple bypass but were successfully re-animated to become one of the living dead. Probably few people who knew you noticed any change.
> were successfully re-animated
This is just the official story, Big Dave.
Litches are self-made wizards.
Say why does the above debate kinda make me, within a millikin,
think of … (
http://www.sportsgrid.com/media/all-blacks-haka-pregame/
There were Vaughn and Willard like minds calculating epicycles.
==========
Yes. this is highly ritualized. One problem is that a good number of scientists are not accustomed to the ritualistic displays. dr. VP is, however, a quick learner. read willard, read the amazon thread. another good resource is ‘men in groups’.. somewhere around here I have longish study that used that book as a guideline
You should join the navy, stevie. They got a lot of men in groups.
Hey Mosh, I was wondering whatever happened to Alex St. John and discovered he’s a global warming denier. LOL
By the way, the incident with the Hummer. It turns out my recollection was correct. The out of towners were 3 Japanese men from Sega. One online recounting describes “almost drowning them”. I’ve now added detail to it. How he almost drown them was charging off the side of the road into a drainage ditch which was deeper than even a Hummer could cope with sinking the front half of the vehicle. I can’t recall who told ME the story but I think it was on a trip to Microsoft with two of Dell’s emergent technology guys.
On a trip to Intel in Portland with the same two guys when we were arriving on campus from the airport in our rental car the ruralish road leading up to it had a double rainbow going across the road. I guess those aren’t all that uncommon there. Anyhow, one of the other guys, completely deadpan, says “Intel people are such showoffs”.
I’m pretty sure that was some 3D graphics API that Intel was pushing that year. Can’t even remember the name of the API now but I should have a CD with it on there buried somewhere. It went nowhere fast.
The three shouts are divided thus: before, during and after. Shout according to the situation. The voice is a thing of life. We shout against fires and so on, against the wind and the waves. The voice shows energy.
In large-scale strategy, at the start of battle we shout as loudly as possible. During the fight, the voice is low-pitched, shouting out as we attack. After the contest, we shout in the wake of our victory. These are the three shouts.
http://archive.org/stream/MiyamotoMusashi-BookOfFiveRingsgoRinNoSho/Book_of_Five_Rings_djvu.txt
Matthew R Marler | January 9, 2013 at 4:25 pm |
Actual points roll off Pratt like water off a duck’s back. Ad homs are just as productive as actual points with a character like Pratt but more fun so when I run into these kind of bullheaded asshats who are legends in their own minds I go the ad hom route because that at least has some entertainment value for lurkers/spectators in the mud slinging sports.
A rare moment of logical clarity. Chairman Mao would have approved of this self-assessment. Well done, David Springer.
“A rare moment of logical clarity.”
Speak for yourself.
Oh wait. You are.
Dr. Pratt,
The “Millikelvin” analysis seems to have developed from your earlier presentation, “The Logic of Global Warming” (subtitled “A Bitter Pill”) from 2011.
The “Millikelvin” poster has the Arhennius-Hoffman-Hansen law:

The 2011 presentation has a similar function, the Arhennius-Hoffman law :

The newer Arrhenius-Hoffman-Hansen law rises more steeply in the 21st century (0.27/decade in 2000-2050, 0.54/decade in 2050-2100) than the Arrhenius-Hoffman law, even with the 15 year Hansen delay added (0.24/decade in 2000-2050, 0.38/decade in 2050-2100). The difference is more pronounced in the 22nd century.
The poster specifies that the AGW parameters of 2.83, 287 and 15 (Hansen delay) were estimated by a least squares fit of F3(AGW(y)) to F3(DATA – SAW). May I ask how the 1.837 factor in AHL was derived – in a similar way?
Also, were you to speak without your scientific cap on, how much trust do you have in this type of model to predict mean surface temperature for the next five or ten decades (given an emission scenario following Hoffman).
In the 2011 presentation, you appear to present the model as the persuasiding argument why the bitter pill of AGW’s reality cannot be pushed aside, but on this forum you seem less optimistic about the reliability of this type of model’s predictive skill – do you feel that the general predictions of rising temperatures for the next century are likely correct?
Sp. “persuasive” not “persuasiding” ..
Great questions, oneuniverse.
May I ask how the 1.837 factor in AHL was derived – in a similar way?
Yes except that it completely neglected Hansen et al’s 1985 paper pointing out that warming the ocean delayed the impact of CO2-induced radiative forcing. I therefore arrived a year ago at the low value of climate sensitivity that Hansen et al had predicted I would 26 years earlier. (How’s that for a successful multidecadal prediction by The Team?)
how much trust do you have in this type of model to predict mean surface temperature for the next five or ten decades (given an emission scenario following Hoffman).
No more than that of a bookie making a living off predicting the outcome of horse races. Knowing when to lay off a risky bet is a big part of that.
do you feel that the general predictions of rising temperatures for the next century are likely correct?
What, me worry? ;)
If you replace “are likely correct” by “can be ignored” I would answer with a most definite “no.” Generally speaking things look bad, what with the West Antarctic ice sheet slip-sliding away into the tropics, the Greenland glaciers retreating, animals beating a retreat to the coolth of higher altitudes and latitudes, and a host of other apocalyptic signals.
However one cannot ignore St Paul’s forecast to the little church at Corinth in 1 Corinthians 15:51-52: “we shall all be changed—in a moment, in the twinkling of an eye.”
Whereas the Mayan calendar forecasted doom, given that recent US elections have emphasized the positive aspects of change I interpret Paul’s forecast as more upbeat: we shall all be saved.
Exactly how remains to be seen, but I remain optimistic.
He bet on CO2,
Put all on the gas.
Had he bet on Ol’ Sol Ball,
He’d be a free man at las’.
================
Thanks, Vaughn, there is Bambi with a bright red nose. All the better for the Polar Bear’s nutrition; it’s the circle of climate life.
===========
Thanks also for the Portrait of Mathematan Gray. Glowing in the grip of frozen ideology, shattered with horror at Gaia’s warming cradle.
=============
@kim: there is Bambi with a bright red nose.
Bambi is to Rudolph as the morning star is to the evening star?
Climate Etc. is nothing if not educational.
Doc ,
You forgot to include increasingly severe monster storms, our kids not getting to experience snow, cats sleeping with dogs, and school massacres, on your list of signs of the it’s-worse-than-we-thought climate apocalypse.
There is a pathology afflicting most climate science practitioners and practitioner wannabes, called Save the Earth Syndrome. This is complicated in many of them by the related I Wanna Be a Hero Syndrome. It’s easy for the sensitive, caring types to catch this stuff, because it makes them feel good about themselves. Who could be against saving the world. It’s just damn comforting to occupy the moral high ground in the political and social battles against the untermensch knuckledraggers . It’s like who could rationally and morally be against gun control? Guns kill people, duh. Spending mo’ money and mo’ money to help the poor. They are poor, they need money. We can borrow it from China. Simple enough for ya? Gay marriage. Why not? Brothers with sisters, fathers with daughters, man with beast, multiple life partners. No problem. Consenting adults (the beasts don’t seem to mind either). Who’s it gonna hurt? No more school massacres. No more little black kids in Chicago, Detroit, Philly, LA, the Bronx and Staten Island too cut down in senseless Tea Party gangbanger drive-bys. Moral high ground. Easy choices. Hopefully, Obama will seize the opportunity of his recently won glorious mandate and fix these things by one big Moral High Ground executive order. Right, doc? Did I hit all the right notes? I am trying to be more politically correct, and with it.
> we shall all be saved.
Some argue that Paul meant “shaved” and was prophesying a conspiracy of barbers.
An anecdotal sign that global warming has reached catastrophic (if not cataclysmic) levels:
I saw a dog chasing a cat – and it was so hot, they were both walking.
max manaker,
I hope you are not implying that the signs of apocalypse enumerated by the doc and myself are anecdotal. There is incontrovertible evidence for some of this stuff. Take the snow thing. The kids in the whole of Panama have not seen snow in their lifetimes. And so it goes right round the world from Panama, to Addis Ababa, to Manila, Maui, etc. That’s a lot of data points.
And you must be aware of the bitter cold in China and Russia this winter, that has been well documented on your TV screen.
Vaughan Pratt: What, me worry? ;)
If future temperatures were to match your modeled values, you would call that a meaningless coincidence, right?
;)
If future temperatures were to match your modeled values, you would call that a meaningless coincidence, right?
No, I would call that “business as usual.”
When I say that the future is hard to predict I mean that the unusual is hard to predict. Predicting the usual is a no-brainer.
Betting on the odds-on favourite is a no-brainer, but one with little to no money in it. Predicting which of the twenty-to-one starters is going to win has a lot more money in it, but it’s a crap-shoot that in the long run you won’t win unless you’re considerably smarter than your bookie.
Many thanks for the reply, Professor Pratt.
V.P.:
Oops, sorry for the formatting error – this a hopefully corrected version :
Many thanks for the reply, Professor Pratt.
V.P.:
I’d say it’d be more apocalyptic (as per Dr. Venkman’s “dogs and cats, living together” dictum) if the animals were migrating to environments
*more* likely to result in their extinction ;) Having said that, I acknowledge that a common view is that humanity is doing exactly that – not a physical migration, but an enforced anthropogenic man-handling of the entire biosphere towards a bad neighborhood in Earth’s “state space”, where we risk being stabbed by shadowy tipping points, mugged by run-away processes and distressed at the sight of an anoxic ocean vomiting over the local fauna.
With respect to the West Antarctic, ice has been calving from the peripheries of the West Antarctic ice-sheet and floating towards the tropics to melt for a long time, as a natural process in the sheet’s existence. The rate of flow’s been higher in the last few decades than the previous, but the conditional and speculative forecasted break-up of the West Antarctic ice-sheet isn’t due for centuries or millenia (AFAIK). The time span matters, not in a “nothing to worry about” sense, but for practical planning and sorting of priorities.
Matthew Marler:
Vaughan Pratt:
According to the longer land-based instrumental BEST temperature index, “business-as-usual” for the period of the instrumental record was
rising temperatures since 1800 or so (consistent with most paleo temperature reconstructions covering the last few centuries), with an
increase in the warming rate for the last quarter of the 20th C. The contribution of AGW (according to the AHH formula) during 1800-1900 was about 0.05 degrees, considerably less than the estimated temperature rise of over 0.3 degrees. Even if one scales the land-only rise downwards to bring it in line with the less responsive global index, the number is at least twice as large, suggesting that some of the ‘secular’ rise of 20th C temperatures may have been due to non-anthropogenic (or at least non-GHG) causes.
I meant to include this Wood-for-Trees graph to illustrate the last paragraph:
http://tinyurl.com/BEST-and-HadCRUT4-60yr-mean
Sorry, that had some 24 year averaging mixed in as well..
This link for the 60 year means (with 12 year means as well) :
http://tinyurl.com/BEST-and-HadCRUT4-60yr-mean-v2
Also, I apologise if the “bad neighborhood” passage was interpreted as dismissing the risks of AGW – that was not the intention. However, I would say that a feature unifying all the apocalyptic GW scenarios is that none of them are happening (but if the trends – increasing temperature, decreasing pH, increasing sea levels – continue for centuries, then we will face significant challenges).
Vaughan Pratt: No, I would call that “business as usual.”
Doesn’t “business as usual” refer to the future of CO2? My question was about future temperature. Your model values for future temps are computable from the future trajectory of CO2 concentration and your filter coefficients (because you assumed implicitly that the background is stationary.)
I think that you are trying to have your cake and eat it too. That is, I think that you want to exempt your model from testing against future data (by declining to call your model values “predictions” etc), while at the same time claiming that the model values for the future are exceedingly important because that’s what the future will be like if CO2 increases continue.
@MM: Doesn’t “business as usual” refer to the future of CO2?
That’s an excellent point, Matthew. If I understand you correctly, instead of “assuming business as usual” I should have said “assuming stationarity.”
I’d been meaning to drop the portion of Figure 7 after 2012 from the paper anyway since
(a) it plays no role in the description of HadCRUT3, which only goes up to 2012;
(b) stationarity is a strong assumption especially given that rapidly increasing warming, whether of natural or anthropogenic origin, appears to lead to increasingly chaotic climate; and
(c) even an R2 fantastically close to 1 is no guarantee at all of future behavior, as evidenced by my favorite example of this, namely a curve that’s an equally good fit to the peak of a Gaussian and the peak of a sine wave. Modeling it as the former predicts convergence to zero. Modeling it as the latter predicts oscillation between plus and minus 1. These barely distinguishable curves have dramatically different futures!
As a case in point for (c), the least-squares fit of SAW+AGW to HadCRUT3 implicitly entails a fit to the Keeling curve with an R2 of 99.56% (which incidentally is better than Goodman’s “triple-exponential” fit which only achieves R2 = 98.98%, which I’ll comment on later this evening in a reply to Greg’s long-neglected Jan. 2 comment). However an even better R2 of 99.84% is achievable by taking preindustrial CO2 to be 270 instead of the 287.4 in my poster. Extrapolating this to 2010 gives CO2 = 963 ppmv instead of the 1227 ppmv in my poster. The corresponding temperature extrapolation is then 0.3 C lower, quite a decrease.
While this is not quite as unstable as the Gaussian-vs-sinusoid example, it’s a practical working example of what can go wrong in extrapolating what on the face of it seems to be a fantastically accurate fit.
Not quite as bad as the long-since-deceased Amazon butterfly responsible years later for the havoc wreaked by Hurricane Sandy, but the same general idea.
Concerning these R2 figures, I’m about to reply to Greg about CO2 fitting, which you can find by searching for xyzzy in a comment by me on this thread other than this one.
The corresponding temperature extrapolation is then 0.3 C lower, quite a decrease.
Ooops, that should have been 1 C lower. I typed log (decimal log) where it should have been lb or log2 (binary log). A more serious difference!
Is Vaughn’s star half empty or half full? A little prince thinks it is half scared to death.
=========
Look. yer can argue all yer like, guys, but what’s missing is
the BALEFUL glare )
http://www.youtube.com/watch?v=6fYIUdVNFgU
(Say, which team do yer like, the reddies or the blackies?)
This thread is like Freddy Krueger or Jason – someone needs to cut its head off to keep it from coming back from the dead. And even that probably won’t work.
GaryM: This thread is like Freddy Krueger or Jason
That’s something to do with movies, right? I never saw them. If I remember correctly (I am not sure which movies they were in), I stayed away on purpose. It’s an option.
I’m massively entertained at willard tilting at windmills while free men stroke the galleys’ oars.
============
Yikes, I’ve awakened in the Hotel Millikelvinornia.
======================
kim
Bad news. You can’t leave (2,198 comments).
Max
812 to go.
No, 811.
s/N << 1
Yes it is.
+1
Feel free to complain about this to Judith, Josh, but she probably has better things to do with her time than turn CE into the sort of preaching-to-the-choir blog that the more heavily moderated climate blogs have become.
Where does Rabbett Run land in that spectrum?
Uptwinkles. He’s treed. Er, gone to ground.
========
Commentary on Dr. Pratt’s analytical skill, in specific relation to climate science:
http://climatechangedispatch.com/home/10289-the-famous-woods-experiment-fully-explained
# BCD 2012-06-29 12:18
“Therefore, if the humidity inside Pratt’s acrylic greenhouse was much higher than that in the polyethylene greenhouse, this can easily explain why a difference of temperature up to 15° C , or even more, was recorded.”
How could this be? First, Vaughan took measurements in late November, the humid season in Palo Alto. The NWS recorded fog the day before and several days after. That’s likely why he had to wait a week for the second experiment. As everyone knows, cardboard absorbs humidity.
Second, thin films like the 1/2 mil polyethylene Vaughan used (literally, Saran Wrap Premium) is porous, but the glass and 3/8″ Acrylic plate on the other boxes were impermeable. Have you noticed when you wrap hot food the Saran Wrap fogs up, but quickly clears? Osmotic pressure drives humidity through a permeable membrane.
So Vaughan’s cardboard boxes had humidity from San Francisco fog the day before (plus maybe that morning), which evaporated once made into greenhouses and pointed at the sun in the early afternoon. The Saran Wrapped box could vent the water; the glass and acrylic-topped boxes could not. The drier air in the Saran Wrap was more conductive, so it cooled the box by conduction and internal convection.
Vaughan failed miserably to isolate variables. “Cargo cult” science.
Robert 2012-06-29 14:05
Apparently Vaughan wasn’t particularly concerned with what REALLY caused the end result, just the end result. Typical climate “science” where it doesn’t matter what the variables really are as the only thing they care about is that the output “proves” their hypothesis.
For much the same reasons Mann et. al. won’t debate or discuss their hypotheses with anyone that looks any further than the end result.
I think you summed it up very nicely for anyone that actually understands how science works and how a proper experiment is conducted. It will go right over the heads of the faithful.
I found the conclusion to this article truly magnificent.
Don’t you agree, Don Don?
Yes willie, I agree. Like makeshift phenomenological model fitting, monkeying around with saran wrap and cardboard ain’t going to do it. He should know better.
What was your favorite quote of that conclusion, Don Don?
Mine was:
> If difficulties persist, please contact the System Administrator of this site and report the error below.
You are confused, willy. That is not the conclusion. Looks like a busted link, maybe referring again to the docs little ‘experiment’:
http://boole.stanford.edu/WoodExpt/
Very nice cardboard boxes. Ain’t they, willy? And he’s got three of them, willy. Didn’t Woods have only two boxes? Vaughn’s quasi-experiment is what, 50% better?
That crap is funnier than this millikelvin BS. How much longer can you keep this fawning, ludicrous defense of Vauhan’s foolishness going, willy? Don’t you have any self-respect?
> Looks like a busted link.
My mistake, Don Don.
I’m sure I clicked on “Read More” from The Famous Wood’s Experiment Fully Explained by ALBERTO MIATELLO, PSI.
You know, the article that is supposed to describe Nassif Nahle’s revolutionary experiment. You know about Nassif Nahle, right?
The site looks like a scam, Don Don. Please, have a look around. You’ll feel at home.
On Pratt’s website about the Woods experiment replication he concludes by promising to use actual rock salt panes and then write up the results. A year or two later I write to Pratt asking if the rock salt replication and results were going to be published. He replied that he tried using rock salt panes but that he could not publish because the temperature varied drastically depending on where inside the box he placed the digital temperature sensor probe.
Ask him about it.
What is Wood’s Experiment?
An answer here:
http://neverendingaudit.tumblr.com/post/9045003039
A more complete discussion over there.
An interesting website, or so I’ve heard. Some analysis revealed no traces of denial. Perhaps a hint of minimization, but that is all.
The only thing I find interesting is from your first link, willy:
“I am disappointed that a scientist like Judy would repeat what smacks of junk science without even raising an eyebrow, and worse yet, proposing that a perfectly sound name be changed to “Tyndall effect” without bothering to check whether there is any substantive justification for this urban legend that originated with Wood’s parody of a physics experiment.”
Coming from the same clown, who spent a lot of time and maybe 35 bucks on a series of parodies of Wood’s parody, that is a bizarre statement.
doc pratt,
Did you really say that?
Maybe Judith invited you to do this post, knowing that you would be humiliated. And you fell for it.
> Maybe Judith invited you to do this post […]
Click on “Source”, Oh Magnificent Truth Seeker, and see if it leads to a post.
> Maybe Judith invited you to do this post, knowing that you would be humiliated. And you fell for it.
You should promote this hypothesis, Don Don.
With your magnificent power to put ideas into people’s head, as you did with Mosh, I’m sure it will catch like fire.
Did you know that one definition of the action “to scam” was “to deprive of by deceit”, Don Don?
“JC comments: This is an invited guest post. I think that this is an intriguing analysis, but I have not looked at this in any detail. ”
Maybe she should change her initials to JCYA.
Naw, Dave, simply reporting curiosity. Had the flaw been as egregious to her as it has been to others, I doubt we’d have seen it.
Mantle moving. Hmmm. I’m intrigued but I haven’t looked into it. My greatest detail was about a foot and a half, as a child, when I decided to dig to China.
=================
> Coming from the same clown, […] that is a bizarre statement.
Here are the two claims contained in that statement, Don Don:
– Judy repeated what smacks of junk science without even raising an eyebrow;
– Judy proposed a perfectly sound name be changed without bothering to check whether there is any substantive justification for what appears to be an urban legend.
Do you disagree with these claims?
Since an urban legend is a kind of scam, please beware that your opinion bears quite a weight.
Is this collegial, willyboy?
“I am disappointed that a scientist like Judy would repeat what smacks of junk science without even raising an eyebrow, and worse yet, proposing that a perfectly sound name be changed to “Tyndall effect” without bothering to check whether there is any substantive justification for this urban legend that originated with Wood’s parody of a physics experiment.”
“Click on “Source”, Oh Magnificent Truth Seeker, and see if it leads to a post.”
I was referring to the post we are commenting on, moron.
You asked me about:
“I found the conclusion to this article truly magnificent.”
I thought you were referring to this, from the post that I linked to in the comment to which were replying, you moron:
“Moreover, a technical physics analysis of those experiments, can better clarify the real mechanisms of heat transmission between soils and atmosphere, or solid and gaseous materials.”
If it was something else, I don’t give a flying crap.
You play some very silly gotcha games, willy. Boring and trivial.
You’re a scam, Don Don.
> Is this collegial, willyboy?
Yes, Don Don. Vaughan simply expressed disappointment.
Please tell me about this urban legend about which you took interest.
Or shall we say this scam?
Your opinion on scams bears some weight, Don Don.
Made you look, willy. You lonely little dope.
You lost control of your feet, Don Don.
You went on a scam site to find a discussion at Judy’s.
Not any kind of discussions.
The SkyDragons’.
Are you really willing to magnificently seek the truth following the Sky Dragon’s path?
This path does not seem in you.
You’re more of an act to deprive of a collegial conversation by use of deceit.
You must never lose control of your feet, Don Don.
Willard, so as not to repeat myself let me rephrase my earlier suggestion as an Aristotelian syllogism.
Major premise: Trolls waste your time.
Minor premise: Don is a troll.
Conclusion: Don waste your time.
Capiche?
Vaughan,
Scams like Don Don’s waste more than time.
One has to wonder, how much the agent provocateurs have cost us too. Any idea?
An agent provocateur is one kind of commenter, Tom.
A scammer is another.
Don Monfort wipes up the floor with Willard.
Film at 11.
Vaughn Pratt kisses Willard’s ass.
No film at 11.
> Gaslighting is a form of psychological abuse in which false information is presented with the intent of making a victim doubt his or her own memory, perception and sanity. Instances may range simply from the denial by an abuser that previous abusive incidents ever occurred, up to the staging of bizarre events by the abuser with the intention of disorienting the victim.
http://en.wikipedia.org/wiki/Gaslighting
They are very good at deluding themselves, David. Vaughan the Wizard of All Science sets out to “duplicate”and dispatch, what he derisively calls Wood’s “parody of a physics experiment”, with freaking Scotch tape and Saran Wrap Premium. How is he doing?
Maybe when he said “duplicate” he meant “extrapolate”, or more likely he meant “pretend to quasi-duplicate”. And he is disappointed with Judith. He should shut up now and just rest on his laurels. He seems to have distinguished himself in the field of computer science, before he went astray trying to be a hero to the climate alarmists.
Why am I being so disrespectful? Because I watched his act for weeks on this thread, and it became obvious he is a publicity seeking stubborn obfuscator; in my humble opinion, which is almost always correct and justified to a millikelvin. That’s my story and I am sticking to it, no matter what anybody says about circularity, or anything else. I am the Wizard of All Opinions, Emeritus, Casus Belli, period.
> That’s my story and I am sticking to it, no matter what anybody says about circularity, or anything else.
Thus Don Don carries Tar Baby’s torch,
no matter what.
Planting seeds in little heads,
no matter what.
Vaughan’s making him do it,
no matter what.
Period.
[Vaughan]: Well, predicting is hard, especially future’s anomalies.
[MattStat]: Yeah, this is a bummer. But how do you think that people –
[Don Don]: Hey guys, you talking Doritos?
[MattStat]: Come on, Steve. Don’t do this again.
[Don Don]: I just thought maybe you were having the old Doritos discussion.
[Vaughan]: Dude, for the last time: we’ll tell you if we ever have a conversation about Doritos.
[Don Don]: You promise?
[MattStat]: Of course, Steve. We know how you love Doritos.
[Vaughan]: Yeah, man. Everyone knows.
Cf.
http://harvardlampoon.com/comedy/61/
[Vaughan]: Well, predicting is hard, especially future’s anomalies. However I am the Wizard of All Science, Emeritus, Casus Belli, and I have gone behind the curtain and conjured up a millikelvin with R2 .999999 ad infinitum climate model using Excel Solver with just two freaking components, you see maite (that’s pronounced with a long i).
It follows that the two components are essentially all there is to recent multidecadal climate thus understood. With either dataset, the model forecasts a 4 C rise for 2100. And you can find that forecast accomplished by simple extrapolation from my infallible model in my famous AGU poster. See Chart #7 “PAST AND FUTURE TRENDS”. And you better get scared, cause +4C is some darn scary apocalyptic cripey, maite. You can bet your jar of Vegamite on that , maite. And my lonely little sock puppette yapping chiuaua willyboy, will be along soon to lick my boots and parrot everything I say. Thanks willy. Your dog biscuit is in the mail, maite.
FIN.
Vaughan Pratt | January 11, 2013 at 2:31 am |
@DS: 8 variables for Rossander (4 SAW filters) + 0 vars for AGW.
Haven’t you forgotten ToothW (D26), David?
Yes but both you and Rossander (Solver) put values into it so it doesn’t really alter my point that Rossander used fewer variables than you did.
What Solver did was use tooth width to increase base frequency to beyond the length of the record with phase such that you get a rising edge and where the it peaks in the past 15 years going flat on the top.
Solver had to do that because you put all the action in the AGW curve which appears to be a simple exponential leading to an earth temperature equal to the surface temperature of the sun. Solver also used the primary harmonic which you eschewed because it needed the amplitude in it to replace the amplitude of the contrived AGW signal that Rossander eliminated.
You’re much better off asking questions than answering them, by the way.
It could take the Wizard quite some time to decide whether the issues you raised in this comment are “serious” and thus deserving of a reply from the Wizard.
Seems to me that to answer your points he would have to demonstrate a better understanding than yours of the operations of Solver, or show that he can get his results without using Solver as a crutch. But that is just the opinion of a non-Emeritus untermensch knuckledragger.
Don Don might be expecting a response by acting like a scamming non-elephant since, as he said December 15, 2012 at 11:50 am:
> When one has gotten tenure and numerous grants by stomping on mice, one has no reason to tackle elephants.
[1] http://judithcurry.com/2012/12/04/multidecadal-climate-to-within-a-millikelvin/#comment-276876
Not that whatever Vaughan does won’t change anything.
Don Don has Tar Baby’s story as a seed to plant in people’s mind.
No matter what.
Period.
FIN.
@DM: Seems to me that to answer your points he would have to demonstrate a better understanding than yours of the operations of Solver, or show that he can get his results without using Solver as a crutch. But that is just the opinion of a non-Emeritus untermensch knuckledragger.
With experience trolls develop a sixth sense for their boundaries: as soon as they sense they’ve overstepped one they back off slightly.
In this nice example, Don WYT extends the bait gently instead of beating me over the head with it.
In this case Don is wasting his own time.
@DS: Yes but both you and Rossander (Solver) put values into it so it doesn’t really alter my point that Rossander used fewer variables than you did.
Your fellow skeptics could help strengthen the case for global warming by agreeing with you. But I fear the odds are slim.
That’s about what we expected, doc. How much longer will you carry on like this?
FIN?
What is your favorite treat, willy? Cracker? Or doggie biscuit? The Wizard wants to know.
You are malingering, willy. You haven’t yapped at my heals in ages. Dr. Pratt is preparing a package for you and he wants to know your preferred treat: Willy want a cracker? Or would you prefer doggie biscuits? And would you like a jar of Vegamite with that, or the pomey original, Marmite?
Don Don should not belittle Marmite:
On December 15, 2012 at 6:51 am, Pekka observes:
> This thread brings to my mind that people are fighting windmills.
On December 15, 2012 at 11:04 am, Don Don jumps to conclusion and on another subthread:
> If that comment was meant to belittle the contribution of greg goodman to this thread, it is mis-directed and ludicrous.
http://judithcurry.com/2012/12/04/multidecadal-climate-to-within-a-millikelvin/#comment-276860
On December 15, 2012 at 11:10 am, Pekka dodges the tackle:
> Max thought it was about him, you relate it to Greg. It was not that specific – and I don’t make strong guesses on Greg’s motives.
On December 15, 2012 at 11:47 am, Don Don can’t admit that his target does not wear the colour he thought:
> Oh, my mistake. How could anyone have thought that you were talking about greg, or Max? I suppose we will always have to wonder about the identities of the windmill tilters. It was a dumb comment, Pekka.
On December 15, 2012 at 2:51 pm, Greg thanks Don Don:
> Thanks for the supportive comment but I didn’t take that as a personal attack, neither do I think it was “dumb” taken in its entirety. Though I was unclear whether is a reference to Don Quixote or those opposed to wind-turbines (frequently mis-named as windmills).
Don Don seems to have a knack for windmills, misdirection, and ludicrousness. Like any scam artist would.
Don Don does not seem to appreciate belittling.
That’s very important and germane stuff, willyboy. But is that all you could come up with, after ominously announcing that you would be spending all your waking hours trying to dredge up some BS on me that you could throw out as a distraction? You really like to smell my butt, don’t you willy.
You are getting progressively creepier, willy. Sneak some change from your mom’s purse and go down to the corner 7-11. Mingle with the customers and staff. Buy a candy bar. You need human contact. But don’t do the yapping at the heels and butt sniffing thing, willy. They will beat the crap out of you.
Meanwhile, back at the cuunt fest…
You probably heard we aint in the fact finding business, we’re in the flappin’ our kunt lips business and cousin business is a boomin’. ~ Lt. Aldo Willard Raine in “Inglorious Basterds”
And cousin, bizness is a boomin’ ~.
The exchange between Don Don and Greg did not end with Greg’s remark.
Don Don’s response, posted on December 15, 2012 at 6:02 pm, starts with this:
> You are welcome, greg. Maybe Pekka’s comment wasn’t that ‘dumb’, but would be more aptly described as ‘hypocritical’: […] It’s a pot and kettle kind of thing, if you know what I mean.
http://judithcurry.com/2012/12/04/multidecadal-climate-to-within-a-millikelvin/#comment-277022
Nor the hypocrisy, nor the pot and kettle kind of thing have been explained.
Pekka made Don Don do it.
Vaughan Pratt | January 11, 2013 at 1:18 pm | Reply
@DS: Yes but both you and Rossander (Solver) put values into it so it doesn’t really alter my point that Rossander used fewer variables than you did.
VP: Your fellow skeptics could help strengthen the case for global warming by agreeing with you. But I fear the odds are slim.
DS: Science isn’t a democracy. I thought you might have learned that somewhere along the line. Please write it down. It may appear on a later quiz.
Big Dave conflates democracy with intersubjective verifiability:
> Intersubjective verifiability is the capacity of a concept to be readily and accurately communicated between different individuals (“intersubjectively”), and to be reproduced under varying circumstances for the purposes of verification. It is a core principle of empirical, scientific investigation.
http://en.wikipedia.org/wiki/Intersubjective_verifiability
No I’m actually conflating it with the ad populum fallacy. I presume anyone interested can google it if they don’t know what it is. I’m out of your league Wee Willie.
Here you go, Big Dave:
> The argumentum ad populum can be a valid argument in inductive logic; for example, a poll of a sizeable population may find that 90% prefer a certain brand of product over another. A cogent (strong) argument can then be made that the next person to be considered will also prefer that brand, and the poll is valid evidence of that claim. However, it is unsuitable as an argument for deductive reasoning as proof, for instance to say that the poll proves that the preferred brand is superior to the competition in its composition or that everyone prefers that brand to the other.
http://en.wikipedia.org/wiki/Argumentum_ad_populum
I suppose it was that part you wanted emphasized, Big Dave?
***
Since you are almost asking for my help, here’s the entry for Scientific Consensus:
> Scientific consensus is the collective judgment, position, and opinion of the community of scientists in a particular field of study. Consensus implies general agreement, though not necessarily unanimity. Scientific consensus is not by itself a scientific argument, and it is not part of the scientific method. Nevertheless, consensus may be based on both scientific arguments and the scientific method.
http://en.wikipedia.org/wiki/Scientific_consensus
Is that the concept you had in mind?
In this case it would be a consensus of skeptics and Vaughn specifically stated such a consensus would weaken my case (“strengthen the global warming consensus”). He may have mistyped or was being subtle. Either way the only one that fell for the joke was Wee Willard.
What were you saying regarding what you called scientific democracy, Big Dave, again?
I thought you were saying that it was a fallacy or something.
You saying you thought anything at all is almost a contradiction in terms. What passes for thought in that pea brain of yours is generally not considered as such by more advanced thinkers. All you do is play semantic games and you’re not even very good at those despite all the practice. I mean the response about speaking to masses and the connection with the speed of light was really, really lame. You might thank me for rescuing you by making a far better connection with masses in church, dummy.
Your ‘science is not a democracy’ does not work, Big .
willard seems under the illusion that intersubjective verifiability is a core principle of the climate science of CO2 control knob modeling. It ain’t, which might be from the absence of empiric reproducibility in it. Mass such illusions have engendered belief in future catastrophe rather than open-eyed observation of the world, and universe around us.
At best, this climate affair is a wake-up call.
===========
There’s not need to reproduce Big Dave’s states of mind to intersubjectively verify that his point about science not being a democracy does not work. My argument does not rely on any semantic games, and thus also refutes the claim behind his latest dirty trick.
Stop projecting your own beliefs into my mind, kim. To presume that models are central to climate science runs against the very idea of having models in the first place. Wegman learned the hard way that running someone else’s code does not suffice to reproduce his result in a way that verifies it.
Pretty weak, willard. What is central to the catastrophes alarumed are the models which have minimized natural forcings, exaggerated water vapour feedback, misplaced, possibly backwards, clouds, and which attempt tuning with a CO2 control knob. Observational science is not reproducing the projections of the models for purposes of verification.
Hey, you brought it up, ‘intersubjective verifiability’, and I thank you for that.
===============
By the way, I’m glad you could feel the rays. I’ll have to turn up the power to really penetrate, though, won’t I?
======================
Most welcome, kim.
Models are unnecessary to know that dumping CO2 in the atmosphere at the rate we actually do ain’t the brightest idea around.
Models are only central to believers in the exactitude of numbers.
Models play a central part in the lines of online pea princesses.
Heh, we dump it in at a rate exceeded twenty-fold yearly by Nature, and there’s no trace in the record of us having done so.
==========================
Er, no trace in the temperature record, that is. I understand people argue about whether or not there is a trace in the CO2 level record, but at the rate we add, i don’t see why that couldn’t be detected. Prawly is. Now temperature’s another story. Hey, I’ve been through Missouri, show me the way to your fair.
==========
And why, oh willard of awes, why are you dodging my point about ‘intersubjective verifiability’. That’s your curtain you tried to draw over the subject.
==============
Dear Gretel,
Here are the breadcrumbs so far:
I said that the “science ain’t a democracy” has no bite.
You replied: yes, but reproducibility.
I said that reproducing ain’t verifying.
You seemed to reply: yes, but sensibility and yes, but models.
I said that these were pea princesses games.
Your reply follows the main lines:
But CAGW, mostly a strawman eating a red herring,
But records, mostly a false claim.
Notice that your last moves misses a “yes” or a “no”.
Notice how your last moves replaced it with abuses.
And now we have: you’re dodged my point about reproducing.
Perhaps you don’t get what I meant when I mentioned Wegman?
The breadcrumbs easily show that this claim is untrue,
The breadcrumbs easily show who’s dodging what.
Please mind your breadcrumbs, dear Gretel.
Very interesting correlation with Rossander and wet/dry cycles in interior US.
Dig it. When we let Excel ‘Solver’ do its UNBIASED wiggle fitting thing it comes up with a fundamental sawtooth frequency of 215.68 yrs.
So’s I figures it’s only fair to now go snooping around for other climate related observations with that approximate frequency.
http://tenaya.ucsd.edu/~dettinge/PACLIM/Yu02.pdf
I direct your attention figure 2 in this study published in PACLIM 2002 proceedings.
Look at that lovely spike at 215 years exactly in spectral intensity in in figure 2.A taken from carbon 14 production rates.
And in figure 2.B the same spike taken from a different spectral proxy using Mg/Ca ratio in Rice Lake.
This is smoking gun kind of stuff.
It’s called the DeVries Cycle and variously given at 180-220 years. Interesting that Solver pegged it to millimillenial accuracy as reported in Stuiver and Braziunas (1992) @ 215 years.
The following is another citing/sighting of the cycle finding it has been going for many thousands of years.
Presence of the Solar de Vries Cycle (∼205 years) during the Last Ice Age
http://onlinelibrary.wiley.com/doi/10.1029/2000GL006116/abstract
http://ars.els-cdn.com/content/image/1-s2.0-S027737910500048X-gr4.jpg
And here we see De Vries Cycle intensity modulated by geomagnetic field strength over the past 11,000 years.
It just occured to me that Excel ‘Solver’ found the Carbon-14 production rate cyclicity at millimillenial accuracy.
HA
I kill me sometimes.
VP once again demonstrates expertise in handwaving in way of rebuttal. Methinks the overstepping was the professor’s not mine.
Vaughan Pratt | January 11, 2013 at 1:34 pm |
@DM: Seems to me that to answer your points he would have to demonstrate a better understanding than yours of the operations of Solver, or show that he can get his results without using Solver as a crutch. But that is just the opinion of a non-Emeritus untermensch knuckledragger.
VP: With experience trolls develop a sixth sense for their boundaries: as soon as they sense they’ve overstepped one they back off slightly.
I am pretty sure that he was accusing me of overstepping and backtracking, David. But he clearly was just creating a distraction to avoid addressing the Solver issues you raised. No surprise there. I wonder why he didn’t waste some more of his Emeritus, Casus Belli time by reminding me once again that I am wasting my time. He says that I am not making any money here. Should one assume that Wizard of All Science, Emeritus is getting paid to read and reply to my inconsequential time-wasting comments? I mean what other interest would he have?
Vaughan Pratt – you say “Perhaps I can’t associate SAW with a specific physical phenomenon, but you can’t prove it’s meaningless.”.
Neither the sawtooth nor the sinewaves have been associated with any specific physical phenomenon. Not in the poster, and not in the subsequent discussion. So the situation at this moment in time is that none of them have any known meaning. Therefore they are, in the true sense of the word, meaningless.
Until someone finds a meaning, they remain meaningless and your work remains worthless. That is basically what the entire poster and discussion boils down to: no climate meaning = no climate value. But as I have said more than once, as soon as a climate meaning is identified for either the sawtooth or the sinewaves, the situation changes and you potentially have a worthwhile study.
Pratt, will now fall back on debunking the circularity argument, which you have not mentioned. Or he will throw out some other red herring. I’ll buy you a drink the next time I am in NSW, Mike. Australia is my favorite place, outside the U.S.A.
Don Don will now tell Mike has “quite succinctly slammed shut the coffin lid on this foolishness” and suggest to leave the thread, not unlike he did three weeks ago:
http://judithcurry.com/2012/12/04/multidecadal-climate-to-within-a-millikelvin/#comment-277703
FIN.
Sounds fishy.
Neither the sawtooth nor the sinewaves have been associated with any specific physical phenomenon. Not in the poster, and not in the subsequent discussion.
On the contrary, both my poster and the subsequent discussion associates SAW with “all multidecadal ocean oscillations as a single phenomenon.” Early on both you and Goodman claimed that the SAW shape in the poster’s Figure 4 bore no resemblance whatsoever to the shape of PDO+AMO, which for all practical purposes would be “all multidecadal ocean oscillations as a single phenomenon.”
For ease of comparison with PDO+AMO I’ve truncated the poster’s Figure 4 at 1905 here, and added dates to the x-axis. Now compare it with the first chart here. Its blue curve claims to plot PDO+AMO.
I make two claims.
1. Prior to 1980 SAW and PDO+AMO look pretty similar.
2. A sawtooth is a shape that occurs naturally in the presence of a series of thermal shocks.
What difficulty are you having with either of these claims?
Vaughan Pratt –
1. Your poster initially suggests that the sawtooth or SAW might represent ocean oscillations, but it backs off from that idea later on, saying “whatever its origins”. Clearly you realised that it bore no resemblance to actual ocean oscillations.
2. You are now trying to claim that “Prior to 1980 SAW and PDO+AMO look pretty similar”. Well that’s no surprise, because it’s not “prior to 1980” that’s the problem. Your sawtooth was created as temperature minus AGW. AGW could not match the temperature oscillations before 1980, so of course the sawtooth matches those. But the sawtooth then flattened out, because the later temperature rise was “reserved” for AGW..
Given that PDO+AMO is a very good match to temperature, as shown in the chart that you posted, naturally the sawtooth deviates from PDO+AMO from 1980 onwards in exactly the same way that it deviates from temperature from 1980 onwards. It is that deviation which shows that the sawtooth does not represent anything in the real climate.
3. Who cares whether a sawtooth “occurs naturally in the presence of a series of thermal shocks”. You haven’t shown that your particular sawtooth has any relevance to climate.
@MJ: SAW might represent ocean oscillations, but it backs off from that idea later on, saying “whatever its origins”.
You’re misinterpreting me. I did not “back off” from that idea. No one knows what the origin of the ocean oscillations is. Considerations of regionality suggest they have more than one origin, whatever those might be. However if a single filtered sawtooth can account for them so accurately this raises the possibility that they have a single origin, which I explore in the rightmost column. That’s what I meant by “whatever its origins.”
SAW is a model, which you flatly contradict, pretending that it’s the same thing as detrended temperature, which it isn’t. Detrending the temperature, which people have been studying for years, is merely a way of arriving at any of several hypotheses that might explain the shape of detrended temperature. SAW is proposed as one possible hypothesis that could explain the shape resulting from detrending (“explain” in the sense used in statistics). One could easily propose other models in place of the filtered sawtooth model, and any of them worked at all well I’d have to acknowledge them as having done so.
Clearly you realised that it bore no resemblance to actual ocean oscillations.
How could I “realise” that when in your next breath you admit very grudgingly that it does resemble actual ocean oscillations prior to 1980 as plotted by D’Aleo and Easterbrook?
of course the sawtooth matches those.
Why “of course”? Are you saying that if HadCRUT3 were modified slightly then SAW would obligingly bend around and fit itself to that new shape? I think not. If that happened I’d agree we had a circular SAW. SAW does not model any old shape, it models a filtered sawtooth. That’s a special shape.
It certainly would happen if you put all five sine waves into independent play, as I showed after unchecking the “keep all unconstrained parameters nonnegative” box that Rossander left checked: it would always give an R2 of 1.00000 no matter what you changed HadCRUT3 to, even if you changed it to something that looked nothing like a sawtooth.
Let me ask you something. Suppose we set all three shape parameters to zero, so that SAW now only had three parameters, namely width, amplitude, and trigger.
1. Would you expect SAW to still be able to track changes made to HadCRUT3?
And if not,
2. Would you expect SAW to now be a much worse fit to HadCRUT3, i.e. that the three shape parameters are playing a big role in making SAW match pre-1980 temperature?
It is that deviation which shows that the sawtooth does not represent anything in the real climate.
As I pointed out here and again here, oceanographer Bob Tisdale has objected that actually it’s D’Aleo and Easterbrook’s (D&E’s) representation of PDO+AMO after 1980 that “does not represent anything in the real climate.” Tisdale says “Note how the PDO dips drastically in the late 1980s. This drop to negative values is not reflected in the D’Aleo graph.”
Unlike D&E’s plot, SAW does conform better to what PDO+AMO would look like after allowing PDO to “dip drastically.” Hence given the choice between SAW and D&E’s guess at what PDO+AMO should look like after 1980, SAW would seem closer to “real climate” for the entire period from 1850 to 2010.
@VP: Suppose we set all three shape parameters to zero
…by which of course I meant the three that I fine-tuned using the three unlocked sliders. Rossander went in the opposite direction, effectively unlocking the other seven parameters that my fit kept locked.
Vaughan Pratt –
The whole problem has always been in the later years, where you “reserved” the temperature increase for AGW thus removing it from the sawtooth. That is why the sawtooth flattened out in the later years.
The shape of AGW was exponential, so the amount allowed for AGW in the earlier years was small. Since the sawtooth was created as the difference between temperature and AGW, the further back you go the more the sawtooth matches temperature, and (to the extent that they drive temperature) ocean oscillations.
You ask what if “HadCRUT3 were modified slightly”. In that case, the sawtooth would automatically take up the exact modification, because it is defined as temperature minus AGW. Since SAW is optimised to match the sawtooth, then it is perfectly possible that SAW would also change accordingly. It would all depend on the nature of the modifications and of the optimisation algorithm.
re “PDO+AMO”. You are making a big fuss about the dip in the PDO in the 1980s and ignoring the major discrepancy with your sawtooth from then on. I agree with you and Bob Tisdale that there was a dip in the PDO around 1985 and that it appears not to be reflected in the Easterbrook/d’Aleo graph. But that dip in the PDO occurred alongside a rising AMO (AMO hit its lowest point in 1975, and was generally climbing after that). Since we don’t know a lot about how PDO and AMO affect global temperature, there isn’t much we can deduce from this part of the 1980s. However, both AMO and PDO were in rising trends from 1987 onwards, so we can safely deduce that the sawtooth by remaining flat from 1987 onwards cannot represent ocean oscillations.
As I said earlier, the whole problem has always been in the later years, where you assumed that all of the temperature increase was caused by AGW.
Vaughan Pratt – You are playing a rather silly game. In your January 14, 2013 at 5:21 pm comment, in reply to my
“SAW might represent ocean oscillations, but it backs off from that idea later on, saying “whatever its origins””,
you say
“You’re misinterpreting me. I did not “back off” from that idea. No one knows what the origin of the ocean oscillations is.”.
That is a ridiculous reply. The origin of ocean oscillations has never been an issue here. Your original article clearly states “The hypothesis then is that multidecadal climate has only two significant components: the sawtooth, whatever its origins, …..”.
“Whatever its origins” applied fairly and squarely to the sawtooth and nothing but the sawtooth. The origin of the sawtooth is not even a minor part of your argument that you might have forgotten somehow. It’s at the very core.
This is yet another in the long series of obfuscations and diversions by which you have wasted our time and attempted to keep your circular logic going. It’s getting very tiresome.
@MJ: The whole problem has always been in the later years,
I think we can all agree on that…
@MJ: where you “reserved” the temperature increase for AGW thus removing it from the sawtooth.
… but not that.
Had Solver (or anyone twiddling with the sliders) wanted to make AGW smaller in 2000 it could easily increase Trigger (one of the six unlocked slider-controlled SAW parameters) from 1926 to 1986 so that SAW will explain the entire rise from 1970 to 2000 instead of AGW doing so. Furthermore SAW flattens out after that point thereby explaining the flat period 2000-2010. (Wonder if I could get a grant from Heartland or David Koch to write that up.)
SAW is no more biased than oxygen or guns. It is completely neutral on that point. It is just as suited to proving that AGW did nothing during 1970-2000 as it is to arriving at the opposite conclusion. Modeling ocean oscillations with SAW certainly did not “reserve the temperature increase for AGW.”
@MJ: Since the sawtooth was created as the difference between temperature and AGW, the further back you go the more the sawtooth matches temperature, and (to the extent that they drive temperature) ocean oscillations.
That would happen if and only if SAW was a good model of the ocean oscillations before there was AGW. Are you saying it is? (Please say yes so we can agree on something.)
(Good break point.)
@MJ: You ask what if “HadCRUT3 were modified slightly”. In that case, the sawtooth would automatically take up the exact modification, because it is defined as temperature minus AGW.
This is an experimentally verifiable statement. I modify HadCRUT3 slightly and then we both watch the sawtooth “automatically taking up the exact modification” as you predict. Seeing your prediction coming true is going to vindicate your WUWT post and utterly humiliate me, agreed?
Of course if you mean unlocking the seven parameters Rossander unlocked then your prediction will obviously come true, but Fourier could have predicted that in 1820 without a computer since that’s just doing Fourier analysis. No one would be surprised by that.
What I mean is with only the unlocked parameters allowed to be adjusted. Those are the only ones I allowed myself to use to achieve R2 = 99.997%.
(I also claim I can achieve R2 = 99.97% with all shape parameters locked and set to zero with the exception of Scale2 = Scale3 = 1 (1000 in the gray cells), but for now that’s another story…)
Before doing this experiment, are we agreed on these terms concerning whether 3 or 10 shape parameters are put into play?
Since we don’t know a lot about how PDO and AMO affect global temperature, there isn’t much we can deduce from this part of the 1980s. However, both AMO and PDO were in rising trends from 1987 onwards, so we can safely deduce that the sawtooth by remaining flat from 1987 onwards cannot represent ocean oscillations.
Is that your strongest argument? Say yes, since I think it is. It’s way stronger than all your others.
The universally acknowledged problem in this subject is that from 1987 onwards the temperature is rising so rapidly that no one knows how to apportion that rise between AMO, PDO, and CO2 radiative forcing.
On the face of it this problem would seem unsolvable. However all is not necessarily completely lost. I propose the following method. Have a competition to produce independent models of the natural and artificial components of multidecadal HadCRUT3 and evaluate them according to (a) how reasonable each is separately, and (b) how well their combination fits the data.
One such is my SAW+AGW. However much you may hate it as having no basis in reality, at least it’s a model that (a) I offer an explanation, whether climate skeptics like it is a separate question, and (b) it fits the data moderately well.
All you need to do to show it is truly meaningless is to find some other pair of models, one each for the natural and artificial variations, each more plausible than SAW and AGW respectively, that also fits the data when combined.
If you propose the D&E model for PDO+AMO, fine, but then (a) you need to specify it in a less circular way than they do (currently it fails your circularity test since they subtracting their idea of AGW), and (b) you also need some sort of model of AGW and not just some random curve you draw by hand.
I posed this challenge six weeks ago. So far the responses have been nothing better than a refusal to view it as a reasonable challenge. That’s just stonewalling.
It will be interesting to see whether professional climate scientists stonewall that challenge.
@MJ: That is a ridiculous reply. The origin of ocean oscillations has never been an issue here. Your original article clearly states “The hypothesis then is that multidecadal climate has only two significant components: the sawtooth, whatever its origins, …..”.
Of course the origin of ocean oscillations is an issue. My poster very plainly says “The two principal novelties in our work are the sawtooth model of ocean oscillations and the observability of Hansen delay in the global temperature record, which we discuss in turn. We conjecture that the former results from seismic events where the inviscid mantle becomes more viscous, due to decreasing temperature above and increasing pressure below.” And my post here says “I collect all the so-called multidecadal ocean oscillations into one phenomenon I call a quasisawtooth, namely a sawtooth lacking its first harmonic or fundamental. Sawtooth waves occur naturally as the result of a sudden perturbation away from equilibrium followed by a slow return to equilibrium.”
That’s my conjecture as to why the natural component of multidecadal global climate has the sawtooth shape, namely that thermal shocks in the mantle are transmitted to the ocean. They’re not visible in the land only because it’s a much better thermal insulator than the ocean.
You seem to want to hear something that the poster does not say.
Vaughan Pratt – Now it seems it’s you who is getting confused between the sawtooth ans SAW. You have confirmed that the sawtooth is created as the difference between temperature (Hadcrut) and AGW. Therefore any modification to Hadcrut is necessarily an identical modification to the sawtooth.
It is you who surmised that ocean oscillations are reflected in temperature, but I would agree that it is a reasonable supposition. However, there are likely to be other things showing up in the global temperature, so it isn’t possible to equate temperature with ocean oscillations exclusively. Since your AGW stays small for a while before increasing exponentially, obviously your sawtooth matches temperature pretty well in the early years and therefore would reflect ocean oscillations too in those early years to the extent that temperatures reflect ocean oscillations.
I couldn’t care less how many parameters you use to match anything. As I have explained several times, your logic has gone wrong before you even start parameter-fitting.
Your challenges are just plain silly. Until you have a climate meaning for what you have done, you have nothing. You need to tell us what your sawtooth and/or your sinewaves actually mean, in climate terms, and to demonstrate how they have that actual meaning. Until you can do that, you have nothing and no-one else has to do anything.
@MJ: You have confirmed that the sawtooth is created as the difference between temperature (Hadcrut) and AGW. Therefore any modification to Hadcrut is necessarily an identical modification to the sawtooth.
Here are two arguments against your claim here, a weak one and a strong one.
Weak argument: I’ve told you many times that SAW is not created by subtracting AGW from HadCRUT3 but by filtering out all of the harmonics of a sawtooth save 2-5 and significantly attenuating 4-5.
Strong argument: Those who can read Excel spreadsheets can verify for themselves that SAW is created by adding the second through fourth harmonics of a sawtooth, with the third and fourth sharply attenuated.
Even if I lied to you and said that SAW was created in the way you claim, or by insider trading on the New York Stock Exchange, or any other way, that would not change the fact that the spreadsheet computes it as above and not in the manner you claim.
Evidently you’re having difficulty reading my spreadsheet. While I will take the blame for not having made the formulas in the spreadsheet clearer, I can’t take the blame for having computed SAW by subtracting AGW from HadCRUT3 because it isn’t true. Look at the code, for heaven’s sakes.
Saying the code is doing something it isn’t simply proves you can’t read Excel. Those who can will wonder what you’re talking about.
@MJ: I couldn’t care less how many parameters you use to match anything. As I have explained several times, your logic has gone wrong before you even start parameter-fitting.
There are two fundamental problems here.
First, it is natural for someone whose logic has gone wrong to think that it is the other party that is being illogical. You can’t resolve the dilemma of who is being illogical simply by claiming the logical high ground. As Kurt Goedel showed in the proof of his second incompleteness theorem in 1930, anyone able to prove they are logical is illogical (more precisely, proof of consistency implies inconsistency).
So if you claim to be able to prove you’re the logical one, according to Goedel you’ve lost the argument right there because you are necessarily illogical.
Second, if you think that there’s no difference between fitting a model with one parameter and fitting one with fifty parameters. I can assure you that the latter can achieve a far better fit. With the former the only thing that can be achieved is fitting a trend line (the parameter being its slope, assuming centered data).
@MJ: Your challenges are just plain silly.
I wonder if it’s possible to modify the proof of Goedel’s second incompleteness theorem to show that anyone who can prove they’re not silly is silly.
@MJ: You have confirmed that B
The logical structure of this argument with Mike Jonas can be reduced to the following form.
@VP: A
@MJ: Aha, you said B.
@VP: No, I said A
Two days later:
@MJ: You have confirmed B.
@VP: No, I said A.
Another long pause, long enough for most to have lost track.
@MJ: But you said B.
@VP: Ahem, no, I distinctly said A.
And then much later…
@MJ: C’mon, admit you said B.
@VP: Ah, what’s the use?
Pekka is right that I like to be brief and a little cryptic (or at least I tend to, whether I like to is a different matter, I certainly don’t aim to), which may be a contributing factor here. For those who may have just tuned in, for the past six weeks A and B can perhaps be stated less cryptically as follows.
For convenience let DGT (for detrended global temperature) denote the result of detrending global temperature GT (defined as the dataset HadCRUT3) by anthropogenic global warming, AGW. That is,
DGT = GT − AGW.
A and B in my previous comments are two propositions about a curve SAW also plotted from 1850 to now. (Hence SAW is the same type as GT, AGW, and DGT.)
Proposition A is the hypothesis that when SAW is defined as a certain analytic function it models the multidecadal component of DGT remarkably accurately.
Proposition B is the definition SAW = DGT.
The values of R2 for the multidecadal component of the residual after fitting these respective definitions of SAW to DGT are 0.99997 and exactly 1 respectively.
No matter how carefully I state A, Mike keeps hearing it as B, and accuses me of circular logic.
Had I said B I would agree with Mike that it is circular. That’s consistent with R2 being exactly 1. Moreover had my abstract been accepted by the AGU program committee with B in place of A it would be prima facie evidence that one can get obviously circular logic accepted for presentation at AGU. (Must try that sometime, under a pseudonym of course as I would find it terribly embarrassing if they did actually accept something that stupid.)
It would be interesting to know
(a) what proportion of the world’s population would mistake A for B, and
(b) how well that correlates with climate skepticism.
Sounds like willard; is stickin with his five bucks…
red meat, anyone?
Hmmm… either Vaughn needs more time than usual to come up with a handwaving comeback for Solver finding the frequency of the De Vries Solar Cycle or another relative has come to visit.
Ostensibly, given his assertion that he doesn’t have a dog in the AGW hunt, he should be quite pleased that an inanimate wiggle fitting algorithm with no knowledge of solar cycles dug that out of hadcrut3.
Or maybe his disinterest in GW causation wasn’t quite truthful.
Or maybe he’s ticked because it wasn’t him who found the connection with the real world so if he mentions it in his paper, which I don’t how he can avoid now, he’ll have to give me credit for it.
Stay tuned to this channel for the next episode of “Vaughn Pratt Schooled on a Blog”.
I didnb’t mention it, because the odds are so much against it, but Vaughn might be taking a break to do what scientists are supposed to do and attempt to falsifiy his own hypothesis. The reaction of an actual scientist, versus the liberal ideologists infesting Stanford, would have been to thoroughly investigate the solutions that could be found at various different values for climate sensitivity.
I suggested to Vaughn weeks ago that he should set sensitivity to, instead of Rossander’s 0.0C, try 1.1C instead, which is the no-feedback climate sensitivity, and see what the solution looks like. I suspect the solution will be quite elegant and the details more easily connected to the real world.
“I suggested to Vaughn weeks ago that he should set sensitivity to, instead of Rossander’s 0.0C, try 1.1C instead, which is the no-feedback climate sensitivity, and see what the solution looks like.”
I think that Vaughan begged his sister to come back for another visit to give him an excuse for not showing up here to face more criticism and ridicule. And he is still busy working on his series of ill-conceived parodies that he had hoped would debunk what Vaughanie calls “Wood’s parody of a physics experiment”.
VP, I still have most of that Scotch tape I offered to contribute to your years-long effort to get mentioned by Wikipedia as the fearless debunker of Wood’s Parody. I did use the Saran Wrap Premium on some left-over pork chops, but I could rinse it off when I am done with it and send it over to Stanford, along with the half-roll of Scotch tape and the old oven thermometer with the broken glass. Don’t be too proud to accept help, doc.
Don, you saw that all Rossander was left with to fit Hadcrut3 then was his harmonics. This is like using a spoon to cut a steak. It is possible, but clearly difficult because it is the wrong tool. Look at the curve at the top of this page again, and suggest just harmonics for it, and most people would just laugh.
> Don, you saw that all Rossander was left with to fit Hadcrut3 then was his harmonics.
What makes you so sure that Don Don saw any of this, Jim D?
Not that Vaughan blames Don Don:
> I discussed all this at WUWT three weeks ago. However with over 2000 comments here plus those on WUWT including two each by Rossander and me on this topic I can’t say I blame people for losing track of what everyone’s said in the past five weeks.
http://judithcurry.com/2012/12/04/multidecadal-climate-to-within-a-millikelvin/#comment-284581
Matt:If future temperatures were to match your modeled values, you would call that a meaningless coincidence, right?
VP:No, I would call that “business as usual.”
When I say that the future is hard to predict I mean that the unusual is hard to predict. Predicting the usual is a no-brainer.
Betting on the odds-on favourite is a no-brainer, but one with little to no money in it.
Matt:Doesn’t “business as usual” refer to the future of CO2? My question was about future temperature. Your model values for future temps are computable from the future trajectory of CO2 concentration and your filter coefficients (because you assumed implicitly that the background is stationary.)
I think that you are trying to have your cake and eat it too. That is, I think that you want to exempt your model from testing against future data (by declining to call your model values “predictions” etc), while at the same time claiming that the model values for the future are exceedingly important because that’s what the future will be like if CO2 increases continue.
Tru dat on the cake eating, Matt. I would state it a little differently: He wants his model’s freaking FORECAST to be tested against future data, but he wants to be able to claim, when his forecast fails, that he didn’t make no steenking forecast. It was just an inadvertent, accidental, innocent EXTRAPOLATION.
This post provides a counter-point to what Vaughan said earlier:
> With experience trolls develop a sixth sense for their boundaries: as soon as they sense they’ve overstepped one they back off slightly.
http://judithcurry.com/2012/12/04/multidecadal-climate-to-within-a-millikelvin/#comment-285140
In this case, Don Don returns to his placing of the word “FORECAST” oblivious to the fact that he does not care about the specific meaning of this concept and about the fact that he’s been told over and over again that this use was kosher in that context, even if Vaughan chose to use “extrapolation” instead.
#YouQuarterbacks, oversell your results: talk about extrapolation. An #OverlyHonestMethod that will insure you a Nobel prize, no doubt. And pretty girls too.
We can see that overstepping is only a momentary thing.
A mark has a short-span memory and infinite trust to give.
***
We can predict that MattStat will get more ice time in the stories Don Don’s planting in the audience’s head.
Sorry about that, Mike.
Nothing personal.
It’s just boundaries, you know.
I will stipulate, that it was not the Wizard of all Science V.P., Emeritus, Casus Belli, who put his FORECAST of +4C by 2100, into HIS poster, as chart #7 “PAST AND FUTURE TRENDS”. And I will further stipulate that the Wizard was not talking about that FORECAST, or any other FORECAST, when he said the following in HIS abstract to HIS freaking poster:
“With either dataset, the model forecasts a 4 C rise for 2100.”
As of now, we do not know who put that chart#7 “PAST AND FUTURE TRENDS” that FORECAST +4C by 2100, into mr. prof. dr. Wizard’s poster. Maybe it was a very elaborate typo. Or maybe the doc wrote it in his sleep. He says that scientists do that and you can’t question them about it. And no, I am not going to look for the quote.
(I felt I had to pretend that it ain’t a FORECAST, so little willy would not blow a freaking gasket trying to convince us that our eyes are lying to us.)
I am glad to see that you got out of the 7-11 alive, willy.
Do you know what has happened to your little cowardly pudgy friend, stevie mosher? He hasn’t been around since nobody was curious enough to ask why those big sweaty fighterjocks with the right stuff that stevie loves to hang with nicknamed him “Shotime”? Little stevie is upset, but I am glad that nobody asked. We don’t really need to know about what those boys do behind-closed-doors.
(It won’t take willy long to come sniffing and yapping. Pathetic.)
On December 7, 2012 at 5:16 pm, BlueSea thanked Vaughan for sharing his poster:
http://judithcurry.com/2012/12/04/multidecadal-climate-to-within-a-millikelvin/#comment-274670
On December 9, 2012 at 6:02 pm, Vaughan thanks BlueSea for noticing that Vaughan does not claim the description holds true outside the observed operating range:
So, more than one month ago, Vaughan says that, had he to redo his poster, he’d consider dropping the figure.
Why, one may ask? Because, according to him, it could avoid some confusion.
But then, what to do with the conclusion of his abstract?
Et cetera.
***
Speaking of forecasts, on January 2, 2013 at 11:22 pm, Jim D distinguished the concepts by articulating them together:
> No one can forecast a CO2 level, unless you can forecast human behavior, but given a CO2 level, you can forecast a temperature. This is why the IPCC labels their scenarios projections. Hofmann’s curve is a projection (especially into the future). Arrhenius’s law makes a forecast on that projection.
http://judithcurry.com/2012/12/04/multidecadal-climate-to-within-a-millikelvin/#comment-282038
On that reading, Vaughan’s not forecasting CO2 level, only what temperature will obtain given the trend of his it has according to SAW.
***
I’m not sure this analysis coincides with mine or with Vaughan’s. Concepts seldom have crisp denotation, even technical ones. Such pluralism does not prevent the users of such concepts to understand one another. When you don’t know what another person means, you ask what he means.
In our case, we clearly see that BlueSea, Vaughan, and Jim D agree about this: make business-as-usual CO2 a condition for the forecast attenuates its scope and its strenght. This is why Vaughan considered talking about an extrapolation.
***
FIN?
No, that’s not up to me to say that.
And I myself believe that this non-conversation partakes of a #NeverEndingAudit.
***
Language is a social art. Sometimes, it can be used to deprive of by deceit. This use of language can rightfully be called a scam.
Don Don storification of Vaughan’s non-use of the word “forecast” is such a scam.
***
For the same reason that we surmised the Chewbacca Conjecture (i.e. that it is possible to make sure anything makes any sense), we could surmise another conjecture:
[DDC] Anything can be interpreted as the product of dishonesty.
For the sake of alliteration, I’m tempted to call it the Don Don’s Dishonest Conjecture, even though it’s the basic move in Tar Baby’s playbook.
Don, I’ve been waiting for you outside.
Don’t kid me, stevie. I know you are not stupid. Anyway, it’s way too cold.
@DM: I know you are not stupid.
Coming from Stephen Hawking that might mean something. Coming from Don Waste My Time Monfort it is less than faint praise.
For your sake, Don, don’t use that expression in Sicily. They’ll waste more than just your time.
Would those big dark sweaty hostile Sicilians punish me, like how Tamino kicked your culo up between your ears and ran you outta town?
I been to Sicily, doc. Tracking down some pretty rough miscreants. I found that as long as you are about the biggest dude on the island and you are as well armed as the locals, you don’t have any problems. But you must know all that, since you have spent so much time there yourself. If you ever get in trouble with the local authorities, call on me. Don’t bother calling for help from the U.S. Consulate, with your accent.
Stevie is smarter than you are. I am pretty sure that he has realized that I am (mostly) funnin with him. And I might not dislike you half as much as you think I do, doc. Maybe some day, after a lot of reflection, it will dawn on youse what I am doing to you rascals.
What happened to little sniffing and yapping, sniffing and yapping willy? Did you fire the frenetic little mutt? You are learning. The Wizard will get along better here without willy.
Keep the dialogue with your countryman, Mike Jonas, going. He is a scholar-gentleman and you might learn something. But don’t ever respond to Springer. That clever uncivil beast will tear you up. But you already knew that.
don, I’ve always been outside. My location is public. That is why I have to laugh when guys bluster about stepping outside. I’m already there.
I never blustered about stepping outside, stevie. Although, I did lead you to form that ideation in your own little head. And I already know that I could find you easily. I am not interested. Now that we all know how brave (or foolish) you are, maybe you should give it a rest. Are we clear now?
Thank you, willy. Many of us were somewhat interested in knowing the approximate date that it dawned on Dr. Pratt that HIS assertion that HIS model had FORECAST +4C by 2100, was a dumb thing to publicize..
So, according to your thorough research he first started backtracking, on or about December 9, 2012 at 6:02 pm. If you had read the comments I posted links to several times, you would know ( like the rest of us know) that Pratty was comfortable discussing his +4C FORECAST/PREDICTION with two different commenters ( Mark B, and manaker) on December 5, and he did not object to them using that characterization, and he in fact called the +4C call both FORECAST and PREDICTION and never mentioned extrapolation.
So now we have Pratt’s backtracking decision bracketed. In the military science we would radio the arty the terse command: “battery six, hotel echo, fire for effect”. If they had 5 guns operating, then 30 rounds of high explosive fragmentation shells would be on the way. Game over. You have done a good job of spotting for us, willy.
There is no other reason to include chart #7 “PAST AND FUTURE TRENDS” in that poster, other than to PREDICT/FORECAST the alleged dangerous increase in temps of 4C, by 2100. He could have left out the part about “FUTURE TRENDS”. But his poster would have been rather dull, without the red temperature line shooting up in hockeystickesque fashion. Case closed! BOOM! BOOM! BOOOOM!
Here it is again:
http://judithcurry.com/2012/12/04/multidecadal-climate-to-within-a-millikelvin/#comment-283345
Don Monfort | January 7, 2013 at 12:09 am | Reply
Pratt had no problem with his forecast of +4 C by 2100 being called a forecast, early on in this thread. I guess the beating his credibility has taken since has chastened his boldness.
Mark B (number 2) | December 5, 2012 at 8:24 am | Reply
Dr Pratt,
This is a quote from your paper:
“With either dataset, the model forecasts a 4 C rise for 2100?
Does this mean a rise from the current temperature (2012) or from the vague “pre industrial” value. (If it is the latter, can you please say what the temperature is assumed to be at the moment, on the same scale?)
Furthermore, I don’t see any decimal point with zeroes after it, just “4C”, Does this mean that you cannot actually predict the future temperature to an accuracy of 0.001 degrees C (1 millikelvin)?
Also do you have a temperature change prediction for the next 10 years?
manacker | December 5, 2012 at 11:15 am | Reply
Mark B
Assume that Vaughan Pratt will answer your specific question regarding the 4C warming forecast to 2100.
But let’s assume for now this refers to the warming from today and do a quick “sanity check”.
We have 88 years to go, so that means an average decadal warming rate for the rest of this century of 0.45C per decade. This sounds pretty high to me (three times what it was during the late or early-20th century warming cycle). But maybe that’s what you get from an exponential curve.
But how realistic is this projected warming?
Let’s assume that other anthropogenic forcing beside CO2 (aerosols, other GHGs) will cancel each other out, as IPCC estimates was the case in the past.
Using the IPCC mean 2xCO2 climate sensitivity of 3.2C (and assuming there will be as much warming “in the pipeline” in 2100 as there is today, this means we would have to reach a CO2 level of 932 ppmv CO2 by 2100 to reach a warming of 4C (all other things being equal, of course).
This is unrealistic, since WEC 2010 estimates tell us there are just enough total optimistically inferred fossil fuels to reach around 1030 ppmv when they are all gone.
Let’s assume, on the other hand, that Dr. Pratt is referring to 4C warming since industrialization started (a pretty arbitrary figure, as you point out, but a concept that is often cited). On this basis, there has been ~0,8C warming to date, leaving 3.2C from today to year 2100.
Using the IPCC climate sensitivity of 3.2C, the CO2 level by 2100 would need to double by 2100, from today’s 392 to 784 ppmv, to reach this warming (the high side IPCC “scenario and storyline”A2 is at this level, with estimated warming of 3.4C above the 1980-1999 average, or ~3.2C above today’s temperature).
So, on this basis, Dr. Pratt’s estimate would agree with the high side estimate of IPCC.
I’d question the realism of this “high side” estimate by IPCC, since it assumes that the exponential rate of increase in CO2 concentration will jump from the current rate of 0.5% per year to 0.74%per year, despite a projected major slowdown in human population growth rate.
But I guess that only shows that you can demonstrate anything with statistics.
Max
Vaughan Pratt | December 5, 2012 at 3:29 pm | Reply
Furthermore, I don’t see any decimal point with zeroes after it, just “4C”, Does this mean that you cannot actually predict the future temperature to an accuracy of 0.001 degrees C (1 millikelvin)?
It depends on whether you’re predicting average temperature for one year such as 2097 or one decade such as the 2090?s or twenty years. SAW + AGW can be evaluated to ten decimal places at any given femtosecond in time. But that’s no good for a forecast because you have to add SOL and DEC from Figure 11. Double their joint standard deviation and you get a reasonable figure for the uncertainty of a prediction in any given year. For any given decade the uncertainty decreases, but I wouldn’t want to forecast to two decimal digits so far ahead.
But even one digit isn’t that reliable because of unknowns like those Max refers to.
FIN?
Perhaps the revelations about the honesty of the CAGW Alarmists should be summarised on the “Trusting the [CAGW Alarmists]” thread.
I replaced “Experts” because we all know what an expert is, don’t we?
Expert (definition): a drip under pressure.
@PL: Expert (definition): a drip under pressure.
Is Peter Lang disclaiming any expertise in his area? This would be useful to know.
A good argument has a good premise and a good conclusion. Don Monfort has neither: his premise is that his opponent is dumb, which is news to no one (has he ever assumed otherwise?), and his conclusion is nonexistent because he had to stop after running out of breath, or perhaps quarters for his neighborhood portal to cyberspace.
Monfort’s sole objective on this thread is to discredit its content by ridiculing it. This technique predates the Neanderthals. Were Senator Proxmire still alive today he would present his famous Golden Fleece award to researchers Dominique Brossard and Dietram A. Scheufele for their very recent astounding discovery that ridicule works. (To her credit Brossard admits she was “not surprised.”)
To be fair I must admit that I myself was in some doubt about the value of ridicule before seeing this study. However baffling Monfort may find the intricacies of modern climate research, I can see he’s well ahead of me on the value of this ridicule thing. Even Neanderthals could have shot my arguments down that way. (No, of course I’m not saying Monfort is a Neanderthal, give me a break.)
“If Proxmire were still around”
I already told you Proxmire stole the Golden Fleece schtick from Reader’s Digest “That’s Outrageous”.
Reader’s Digest is still being published. Another favorite repeating series of articles in it I recall from my youth was “I Am Joe’s [heart][liver][pancreas][thyroid][etc].
Your work here makes me wonder if they ever had one titled “I Am Joe’s Hyperactive Imagination” or “I Am Joe’s Inflated Ego”.
I don’t think you are dumb. I said that you have had a distinguished career in other fields, but you are making a clown of yourself dabbling in climate science.
You just don’t get the climate science. Both sides in the climate game say so, as you have proudly pointed out. But you are extrapolating from a political adage that says something like; if both sides condemn you, you must be doing something right. I don’t think it works that way in the physical sciences.
“Perhaps I can’t associate SAW with a specific physical phenomenon, but you can’t prove it’s meaningless.”
Did you expect that to be taken seriously? It doesn’t work that way, doc. Nobody has to prove that you are wrong. The burden of proof is on you. And Rossander allegedly being wrong, doesn’t make you right. You need to go back to the drawing board. Just like you had to rethink your ill-conceived efforts to “duplicate” Wood’s parody of a physics experiment, with Scotch tape and Saran Wrap Premium. A Neanderthal would have known better. I am sure most of them knew when to use a spear, instead of a club. And how is that years-long “duplication” effort going?
Now I suggest that you stop wasting your time reading and responding to my comments, and telling me I am wasting my time. And if you want to avoid ridicule, don’t act like a pedantic little clown.
Just ignore the editorializing, the hyperbole, the insults and answer the questions, like a scientist would. What about David’s points on the implications of using Solver? Is Solver the most robust can opener that you could have used to do your analysis? Did you try anything else and come up with the same results? Did you ask any of your geophysicist pals, if that deep earthquake stuff you dreamed up made any sense? Did you look for any supporting evidence for events occurring, when you speculated they occurred?
If you want to be taken seriously, you have a lot of work to do. Go back and argue this crap on Tamino’s blog. Maybe you will learn something there.
I didn’t find your reply, if any, to this interesting comment:
Tom Scharf | December 6, 2012 at 12:43 pm |
If only the real world was made up of physical processes that were limited to sine waves.
It isn’t. And even if we assume that there are X “significant” sources in a signal, Each X has it own waveform morphology, usually not even cyclic, which is composed of a fundamental and Y different “significant” harmonics. And of course it is entirely possible the fundamental is of zero magnitude (and the signal comprised of only harmonics). Now throw in the fact that signals that are modulating via frequency and/or amplitude (i.e. all real signals) exhibit frequency side lobes. Even signals that are cyclic, but have distinct phase changes exhibit a large amount of interference in lower frequency bands. And guess what? Real signals don’t line up with the center bands of each freq bin, making discriminating signals of close frequency near impossible to discriminate. I could go on.
The point is that doing frequency analysis on mixed real world signals with a bunch of unknowns is simply scrambled eggs. In my experience if you can’t see the signal with your eye in the timeline with this type of analysis, you aren’t likely to find it using frequency analysis. FFT’s are useful to more precisely measure certain types of cyclical signal characteristics of signals you know are already there, less useful for finding them.
Is the return from a frequency bin a fundamental, harmonic, side lobe, phase distortion? With this type of signal, probably all of the above and more.
You.cannot.unscramble.this.with.a.FFT. It’s not a very useful tool for this type of data.
@DM: I didn’t find your reply, if any, to this interesting comment:
Tom Scharf | December 6, 2012 at 12:43 pm |
Interesting but irrelevant since (a) I don’t use Fourier analysis for precisely the reasons Tom gives and (b) he did not refer to either my poster or spreadsheet but instead merely expanded on the second half of his comment from two days earlier. I replied to the latter here two hours after AGU ended, where I addressed Tom’s concerns about hindcasting and about the inappropriateness of frequency analysis without first detrending, with which I fully agree.
To clear the air on the latter point, in place of Fourier analysis I first “detrend” using multiple regression and then frequency analyze using wavelets. The former removes SAW and AGW simultaneously (i.e. I treat both as “trends” in a Laplacian sense), after which the latter uses approximately orthogonal (the point of FCompn for n = 2,3,4) and self-similar wavelets octave by octave to produce MRES then HALE then TSI then ENSO leaving BIENNIAL as the final residual.
(The former might not look simultaneous but is because of the identity
(h − s) − a = h − (s + a)
and linearity of F3. The first wavelet in the latter has the form
I3′ − I3’@I3 where I3 is the impulse response corresponding to the frequency response F3, I3′ is I3 stepped up an octave, and @ denotes convolution.)
Some such as Tom Scharf and John S argue against analyzing HadCRUT3 as a sum of sine waves fitted to a preordained window (which is what the Fourier transform does and which I don’t do). Others such as Dave Springer argue for it on the basis of the alleged superiority of Rossander’s sinusoidal analysis. Apologies to all but I’ll be unable to comment further on either of these two kinds of criticisms with anything more than a link to this comment, and will have to leave the question of the validity of such criticisms to others to judge.
(Aww, but that’s no fun.
True that.)
Look doc, whether or not the many similar criticisms of your analysis mention Fourier, the common theme is that you are engaged in forced curve-fitting and you ain’t bothering to relate it to anything physical. This is how Tamino put it, when he tore you a new one on his blog:
“All you’ve done is an exercise in contortional curve-fitting, while ignoring (and apparently denying) the physics (e.g., aerosol cooling which is very real). And when I won’t buy into your theory, you get all huffy and apparently can’t find anything more “scientific” than to accuse me of exactly what you yourself have done — make it personal rather than scientific.
And that is why I don’t care to argue with you about it. If you think your model is so good, publish it in the peer-reviewed literature. That’s how science is normally conducted.]”
It’s too bad that your little tenacious sock puppette wasn’t there to yap at Tamino, in your defense.
And your response to Tom Scharf’s first comment is typical of your flippant dismissals of criticisms/questions that you need to address, if you want to be taken seriously:
“Tom Scharf | December 4, 2012 at 9:00 pm | Reply
If you extend the graph backwards 200 years using your constructions, what happens?
My suspicion is nothing good related to the best observations we have. And what does that say about any predictive power it may have?
If you run the same analysis from 1700 to present, do the results results completely change?
All these numerical constructions that assume the big bang was at year ~1850 are a bit disconcerting. All these will yield an infinite increasing trend of some sort if you want them to. It’s too open to confirmation bias to be reliable, I give it about a 1000% chance that this analysis was tuned iteratively and significantly. Did the author work out his methods independent of the data? Not likely. Torture data until exponential drops out? Be honest with yourself.
Frequency analysis of temperature data just seems inappropriate if you ask me. It may help identify some cyclical signals buried in the noise, but using it as a tool to identify an overall trend is risky business. The typical first step in frequency analysis is to remove any underlying trends, else they corrupt the analysis significantly. Hanning / Hamming windows do this, etc.”
I will paraphrase your terse reply: Show me that yours is bigger than mine and you win, Tom.
” Vaughan Pratt | December 5, 2012 at 3:58 am | Reply
Frequency analysis of temperature data just seems inappropriate if you ask me.
If you have a more appropriate analysis then you win. Go for it!”
Nobody is obligated to prove that your method is wrong, or to come up with a “better” model that doesn’t relate to anything meaningful anyway. What would be better about it? Almost nobody is even slightly interested in trying to beat your millikelvin .999999 ad infinitum world record, doc. Maybe it’s because what you are doing is frivolous, boring, and trivial. Try a little introspection, doc. We are just trying to help you here:)
> [W]hether or not the many similar criticisms of your analysis mention Fourier, the common theme is that you are engaged in forced curve-fitting and you ain’t bothering to relate it to anything physical.
Don Don quietly switches from “you have not answered Tom Scharf’s point about FFTs” to another bait: “but Tamino”.
***
> [Y]our response to Tom Scharf’s first comment is typical of your flippant dismissals of criticisms/questions that you need to address […] It’s too open to confirmation bias to be reliable, I give it about a 1000% chance that this analysis was tuned iteratively and significantly. Did the author work out his methods independent of the data? Not likely. Torture data until exponential drops out?
Tom Scharf’s conjecture is not an argument. There is no need to respond to an ad hominem.
Scharf’s main point was shown as a strawman. A strawman which Don Don now ignores, which is a bit sneaky, considering that Don Don can’t sing both Scharf’s and Big Dave’s tunes at the same time.
***
> Nobody is obligated to prove that your method is wrong, or to come up with a “better” model that doesn’t relate to anything meaningful anyway.
Unless, of course, one claims that Vaughan’s method is wrong, or that there exists better models. Which looks a lot like what Don Don over and over again did on this thread.
***
Don Don does not seem to realize that he has some responsibilities over his own claims. Not toward me, of course: he has no respect for me.
But what about himself?
@GG (Jan 2) I’m saying actually fitting an exponential to the MLO data without placing constraints on the constant base level provides a much better fit to that data than imposing a speculative base level and only using two points from the whole MLO data set. In that respect my fitted exponential better characterises the MLO data than your AGW model. That much is clear for all to see in the first graph I presented. http://i48.tinypic.com/snouvl.png
(Sorry to be so slow in replying. The necessary programming kept getting interrupted by departmental obligations, car insurance forms, xyzzy, etc.)
Besides Rossander, Greg, you’re the only other one taking the trouble to offer detailed concrete alternatives, which I really appreciate.
Presumably you’re comparing the yellow plot in your chart http://i48.tinypic.com/snouvl.png labeled “exponential fit [1975:2005] to summed emission data” with the magenta plot labeled “Pratt’s Law” (more accurately, Hofmann’s Law with Pratt’s parameters—and I would similarly call yours Manacker’s Law with Goodman’s parameters).
I wonder where the yellow went. It shows up weakly on my monitor, and disappears entirely in the interval 1960:2010.
I also wonder what the formula is for your yellow plot. For my magenta plot it is 287.4 + 1.02518^(y – 1823.6). I couldn’t find the formula you used for your yellow plot so I made one up that seems to fit well, namely 1.00452^(y – 588.8), corresponding to a CAGR of 0.452%.
My poster uses the Keeling CO2 values for 1975 and 2005. However it could just as well have used the values for 1960 and 2010.
After much futzing around I eventually came up with these four charts. The top row makes all the plots pass through the Keeling values of CO2 for 1975 and 2005, as done in my poster. The bottom row instead uses the endpoints, namely 1960 and 2010. Visually there’s a big difference, but from a statistical standpoint as measured by R2 the differences are relatively small.
The left column in these four charts shows the fit of three models to the Keeling curve, while the right column exhibits the corresponding derivatives or slopes showing the year-to-year increases in CO2 measured in parts per million by volume or ppmv.
The three models are:
red: as in my poster, based on 287.4 as preindustrial CO2
green: 270 for preindustrial, which fits the Keeling curve better
blue: 0 for preindustrial, i.e. purely exponential, as proposed by Max Manacker a year ago and adopted by Greg last month.
When 1975 and 2005 are used as the points to fit these three models to, as in the top row, the differences are not at all clear. Using 1960 and 2010 (the bottom row) gives a clearer picture in the left column.
The R2’s are as follows, starting with the best using the two points 1975 and 2005.
Green (Hofmann 270): R2 = 99.84%
Red (Hofmann 287.4 as per my poster): R2 = 99.56%
Blue (Manacker/Goodman): R2 = 98.98%
With the two points 1960 and 2010, R2 improves slightly for blue while worsening slightly for red and green.
Where the difference really becomes obvious is in the slope of the data and that of the models, shown in the right column. Taking the derivative of CO2 instead of its log as done by Goodman gives a very different picture that I would argue makes for a clearer separation than with logs.
In the right or derivative or slope column, regardless of which two points the model is forced to pass through, whether 1975-2005 or 1960-2010, the green curve is the best fit. The red curve is a bit steeper. However the blue curve is way too shallow to be plausible.
Greg said my red curve (from the poster) was “totally unsuitable” and proposed his blue curve instead. This analysis arrives at a different conclusion.
I may well have “botched” this analysis as Greg likes to say. If so I would be very interested in seeing his “unbotched” version.
The MATLAB/octave functions producing these four graphs can be found as FitKeel.m and FitDerKeel.m in http://clim.stanford.edu/
Mike Jonas | January 11, 2013 at 10:45 pm | Reply
Vaughan Pratt – you say “Perhaps I can’t associate SAW with a specific physical phenomenon, but you can’t prove it’s meaningless.”.
MJ: Neither the sawtooth nor the sinewaves have been associated with any specific physical phenomenon. Not in the poster, and not in the subsequent discussion.
Actually I found that the Rossander (Solver) solution with climate sensitivity set to zero reconfigured the sawtooth frequency to 215.68 years. That figure is within a milli-millenium (ha) of the De Vries Solar Cycle.
Solver has no knowledge whatsoever of solar cycles so it coming up with precisely the De Vries Solar Cycle period is highly significant.
If Vaughn were really interested in the right answer he’d follow up on this like stink on shiit.
But he isn’t interested in the truth. He’s interested, evidently, in vindicating his warmist colleagues at Stanford. I mean look at the history. He didn’t set out to replicate Woods. He set out to falsify it. And he failed. With this next mini-disaster he didn’t set out to find patterns in Hadcrut3 that would lead to greater understanding of the climate he set out to prove that Hansen and the other usual west-coast liberal academic suspects were on the right track.
Pathetic, innit?
I hope it gets published as is. I have enough ammunition now with the Solver fit to the De Vries Solar Cycle period to make Svensmark green with envy and make Pratt look like an ideologic piker.
So, go through how great the method is again, please?
===================================
Vaughan Pratt | January 16, 2013 at 2:19 am |
That’s probably not possible. If we set climate sensitivity to zero then SAW1 is required to generate the late 20th century rise. The alternative to AGW is a low frequency oscillation such that the rising edge coincides with the rising edge of hadcrut3 trend in late 20th century.
The frequency of the primary oscillation with sensitivity is, remarkably, 215 years which is the De Vries Solar Cycle. This gives us a better fit at the end of the temp record because SAW1 stops ascending right when the so-called pause begins.
I would stipulate that the pause in the record is critical and that your HHA Law does not account for it. You try to pretend those last 15 are unusable. I’ll grant you they’re unusable in the AGW hypothesis. A real monkey wrench. The long period oscillator however fits it perfectly. It hardly seems fair you get to throw away the inconvenient data when there’s a perfectly good, if not politically correct, hypothesis that accounts for it.
So I’d challenge you to not throw out SAW1. Doesn’t it seem just a bit odd to you that you can’t even use the fundamental frequency? All you do is use the harmonics to clean up some bumps.
So, speaking of ditching SAW1 as you do, perhaps you can explain how, in the real world, we can have harmonics from a fundamental that isn’t there? LOL
Vaughan Pratt –
Let’s go through this point by point.
1. MJ “You have confirmed that the sawtooth is created as the difference between temperature (Hadcrut) and AGW”.
VP “I’ve told you many times that SAW is not created by subtracting AGW from HadCRUT3”.
Vaughan Pratt December 29, 2012 at 11:48 pm:
“@Mike Jonas: The sawtooth was created as the difference between Hadcrut3 and AGW.
Correct.”
My statement that the sawtooth is created as the difference between temperature (Hadcrut) and AGW is correct.
2. MJ “As I have explained several times, your logic has gone wrong before you even start parameter-fitting.”.
VP “First, it is natural for someone whose logic has gone wrong to think that it is the other party that is being illogical.”.
I have explained several times why your logic is wrong (conclusion equal to the premise). Getting your logic wrong is not at all the same thing as being illogical.
3. MJ “I couldn’t care less how many parameters you use to match anything.”.
VP “if you think that there’s no difference between fitting a model with one parameter and fitting one with fifty parameters. I can assure you that the latter can achieve a far better fit”.
I simply don’t care how many parameters you used, because what you were trying to fit parameters to was, in climate terms, meaningless. I said nothing about whether there was a difference between parameter sets.
4. MJ: “Your challenges [for others to put forward better hypotheses] are just plain silly. […]Until you can [tell us what your sawtooth and/or your sinewaves actually mean, in climate terms, and to demonstrate how they have that actual meaning], you have nothing and no-one else has to do anything.”.
VP “I wonder if it’s possible to modify the proof of Goedel’s second incompleteness theorem to show that anyone who can prove they’re not silly is silly.”
The scientific method does not require anyone to put forward an alternative hypothesis in order to demonstrate that a given hypothesis is false. It is enough to show that the given hypothesis is false. To try to claim otherwise, as you have done, is, I contend, silly. In claiming this I am admittedly assuming that you are familiar with the scientific method. If you are not then I withdraw the “silly”.
5. VP “The logical structure of this argument with Mike Jonas can be reduced to the following form.[…]”
I think not. For example, it contains:
VP: A
@MJ: Aha, you said B.
@VP: No, I said A
Since we don’t know what A and B are, it is hard to argue this without going through every possible A and B. However, I think B must be my “the sawtooth was created as the difference between temperature (Hadcrut) and AGW”. Since you clearly did say this, and since you have confirmed it (both covered above), I contend that your ‘logical structure’ is – ahem – inaccurate.
——-
Throughout this whole exercise, you have obfuscated so consistently – as illustrated by all the above – that it is difficult to believe that you are genuine in your arguments.
Please stop wasting everyone’s time, and address the one essential point – the one that will settle the matter – by demonstrating that what you have done is climate-meaningful.
@MJ: I have explained several times why your logic is wrong (conclusion equal to the premise).
And I have explained several times why your logic is wrong (conclusion different from the premise).
Gosh, a stalemate. Is there any way to break it? You’ve proposed to do so by claiming the logical high ground. You could do that by demonstrating that in the area of logic you have a distinguished career of several decades of published research in logic while I’m a trained circus monkey. Go for it.
The way I would break it would be to argue that the difference between your explanation and mine is that it is clear both from the poster and the spreadsheet that my conclusion is different from my premise.
One can see this from
(a) the definition of SAW in the poster, namely as a sum of harmonics of a sawtooth, as opposed to detrended global temperature (DGT);
(b) the code defining SAW in the spreadsheet, namely as for (a); and
(c) the fact that if SAW was equal to DGT then R2 would equal 1.
Rossander made the mistake of leaving the no-negative-parameters box checked. When this bug is fixed, using exactly the same parameters he handed to Solver, R2 jumps from 99.992% to 100.000%. Enough parameters (two extra in this case) does make the argument essentially circular.
Though perhaps not as circular as this argument between you and me has become, as evidenced by your need to repeat yourself, having run out of fresh arguments.
You should love the analogy of a sawtooth. That is because the only effectiveness in pushing the global warming hoax has been through analogy–greenhouse, polar bears, rising sees, calving glaciers…
However, given the obvious periodicity of your ‘sawtooth’ no one can be surprised that it will be statistically correlated with–‘day and nigt,’ Your analogy is as falacious as all AGW alalogies.
Humanity does not cause ‘day and night,’ rightt? Just as GCMs themselves can never be validated, neither can Sagan-like analogies inventied to impress the scientificically ignorant.
doctor, doctor
You must have missed this part:
MJ:”Please stop wasting everyone’s time, and address the one essential point – the one that will settle the matter – by demonstrating that what you have done is climate-meaningful.”
But if you could do that, we would have heard about it six weeks ago. Right, doc?
The only plausible case that you can make is that it is possible that your analysis is meaningful. That is just boring and trivial.
I strongly suggest that you drop your desperate campaign for acceptance of your curve-fitting and spend your time more productively. Forget about the paper. The rabbette and tamino have made it clear that it will not pass Team review. Make some money using your special talent. Write a book.
“Contortional Curve-Fitting for Dummies”
I foresee another possible money making opportunity for you, doc. If The World’s Foremost Authority, Prof. Corey ever dies, you can take his place on the lecture circuit:
Vaughan Pratt | January 16, 2013 at 9:01 pm | Reply
“One can see this from
(a) the definition of SAW in the poster, namely as a sum of harmonics of a sawtooth, as opposed to detrended global temperature (DGT);”
Actually it’s not. You left out the first harmonic SAW1. You’d have to include it to make your statement true. But you can’t. Because what you did was create AGW and substitute that for the first harmonic. Unfortunately AGW is an exponential and it doesn’t fit the last 15 years of temperature. The Rossander fit includes the fundamental harmonic, excludes AGW, tracks that last 15 years perfectly as a result, and achieves a better fit.
You set out to prove something and the proof is flawed. Deal.
@MJ: Since you clearly did say this, and since you have confirmed it (both covered above), I contend that your ‘logical structure’ is – ahem – inaccurate..
How you choose to misinterpret anything I might have said has no bearing on what the spreadsheet does. Since it’s the results of the spreadsheet that you’re taking objection to, the only fact that matters here is how the spreadsheet defines SAW.
Even if I’d lied and said that SAW was defined as DGT, that would not change the fact that the spreadsheet does not define it that way. Only the spreadsheet’s definition of SAW has any relevance to your objections to what the spreadsheet is doing.
Anybody can see this for themselves simply by looking at the spreadsheet. It defines the unit or unscaled sawtooth UnitSAW in column L as the sum of the first five harmonics of a sawtooth in columns G:K. It then scales UnitSaw by the amplitude Amp (M26) to define SAW.
It would be impossible for the spreadsheet to define SAW to be DGT since DGT doesn’t even exist in the spreadsheet! Nowhere does the spreadsheet subtract AGW from HadCRUT3 I have no clue where you got that strange idea from. Certainly not from the spreadsheet.
Now what is true is that many months before I wrote the spreadsheet I hypothesized that DGT could be accurately modeled as a sawtooth. When you stated that SAW was obtained by subtracting AGW from HadCRUT3, the only interpretation that made the slightest sense was that you must have been referring to the process of hypothesis forming, and therefore agreed with that.
Had you phrased it as “SAW is defined as DGT” I would certainly have disagreed with that since it is flatly false and total nonsense besides. I had not been expecting a nonsensical statement from you so that weird interpretation never even occurred to me.
But I fear that you are deaf to this point, since I’ve made it before and you act as though I hadn’t by continuing to twist my meaning.
However there is no advantage to you in twisting my meaning when the spreadsheet contains the only authoritative definition of SAW. It only makes those who can read spreadsheets wonder about you. (Or about me for joining you in continuing to beat what anyone should be able to see is a very dead horse at this point.)
How about:
DIY Climate Science: for Dummies
@MJ: Throughout this whole exercise, you have obfuscated so consistently – as illustrated by all the above – that it is difficult to believe that you are genuine in your arguments.
I have responded in what I thought was good faith to a great many of your objections. As far as I can tell your definition of “obfuscation” is any response to your criticisms that you had no counterresponse to. So if from your view I made 13 “obfuscations” as you call them, then from my view those were 13 sound arguments that you couldn’t knock down other than by classifying them as obfuscations. That’s called scoring debating points: you’re hoping the judges can’t tell the difference between a sound argument and an obfuscation. That in itself is an obfuscation.
Regarding your concern that I’m not arguing in good faith, I actually do believe both you and Greg Goodman are genuine in your arguments, However I am only willing to continue arguing as long as both sides accept that the other side is arguing in good faith. If you are unwilling to accept even that much of me then I must regretfully withdraw as I am unable to argue on such terms.
Please … address the one essential point – the one that will settle the matter – by demonstrating that what you have done is climate-meaningful.
You’ve asked that so often I’ve gotten tired of responding to it. Authors are under no obligation to even respond to their hostile critics, let alone engage with them at unreasonable length. The poster was written for an AGU audience and was received graciously at FM2012 by its many visitors during that afternoon, whatever its shortcomings. I’m happy to answer questions about it on Climate Etc., but not when formulated as “What’s your middle name? What’s your middle name? What’s your middle name? Shoot him, he’s an IPCC spy.” (Ben Affleck’s Argo).
However genuine you and Greg Goodman may have been in your arguments, your good faith is not reflected in your hostile tone, which is atypical not only of scientific circles but even in ordinary company as mwgrant pointed out here when he replaced my “scientist” with “individual.”
So how can I tell you’re nonetheless arguing in good faith? I’m not even sure myself.
@MJ: The scientific method does not require anyone to put forward an alternative hypothesis in order to demonstrate that a given hypothesis is false.
Pop quiz for MJ.
1. (a) What do you mean by “the” scientific method? History shows that many scientists have screwed up badly. Would you attribute this to their reliance on “the” scientific method or their failure to rely on it?
1. (b) Evaluate your evidence for 1 (a) in the light of this article.
2. Assess the merits of hypothesis evaluation as true-or-false vs. ranking of multiple hypotheses.
Nobody has to prove anything to you, Pratt. Virtually nobody cares if you think you are the king of the contortionist curve-fitters. Nobody cares that it isn’t a Fourier analysis. That doesn’t make it meaningful. Nobody cares if Rossander (who is he?) has used more parameters in his meaningless curve-fitting model. That doesn’t make your model meaningful. Nobody cares if you brag about having the only millikelvin R2 .9999999 ad infinitum indiscriminate curve-fitting model. You have to prove that what you have done has some physical meaning. You got a lot of work to do. Surely, the AGU will let you present your quasi-analysis again next year. Hey, your debunking of the Wood’s parody of a physics experiment may be done by then. You could do a double.
Isn’t it time to stop now, doc?
Oh, I almost forgot. Nobody cares whether your analysis is circular. Let’s say it isn’t. It is still meaningless, until proven otherwise.
On January 16, 2013 at 1:08 pm, Don Don claims:
> Nobody cares whether your [V’s] analysis is circular.
Here’s the latest iteration from our Cargo Cult logician:
> This is yet another in the long series of obfuscations and diversions by which you have wasted our time and attempted to keep your circular logic going.
Vintage January 15, 2013 at 11:09 pm. Twelve hours earlier than Don Don’s comment.
Don Don’s claim is false.
Boom.
Not that Don Don cares the veracity of his claims.
***
Here’s how Don Don paraphrased V’s stance on January 11, 2013 at 12:04 pm:
> That’s my story and I am sticking to it, no matter what anybody says about circularity, or anything else.
Don Don does seem to imply that what our Cargo Cult logician’s purporting about V’s circularity matters a bit. But this was so five days ago. Perhaps Don Don’s now realized that to endorse Cargo Cult logic might be ill-avised against a logician.
Whatever Don Don’s realizations, we now seem him create some boundaries between his position and Mike J’s, as predicted. These are soft boundaries, since Don Don’s not openly standing against Cargo Cult logic.
He now avows not caring for it anymore. More than that: he voices his opinion as everybody’s. If nobody cared about logic, this would make sense. If our Cargo Cult logician kept talking about circular logic without caring about logic at all, that would make sense too.
Boom.
Shank a you velly much. What is your mother tongue?
=============
You are really a lame little mutt, willy. This is just the latest example of the tired and ludicrous tactic used habitually by you and your puppette master; ignore the substantive, zero in on something inconsequential and pretend that allegedly refuting it makes your case. Why didn’t you try this crap to defend your Hero Wizard, when he was unceremoniously run off Tamino’s blog?
Circularity is not MJ’s “one essential point”. MJ doesn’t need the circularity argument. He doesn’t want to waste any more time on it. He doesn’t care about that. It’s esoteric. Read what he said, mutt. It’s something else that kills your Hero’s story. Pratt has something he must prove , and he obviously can’t do it. He is the one losing sleep over this. The rest of us are just amused. Except for the frenetic little Hero worshiping mutts.
Don Don now claims that the circularity argument was not substantial.
This claim is false.
Here’s the title of our Cargo Cult logician’s post, Don Don:
Circular Logic not Worth a Millikelvin.
http://wattsupwiththat.com/2012/12/13/circular-logic-not-worth-a-millikelvin/
Here’s the intro:
Here’s the conclusion:
Boom.
With even Monfort advising Jonas to give up his circularity argument, it will be interesting to see just how long Jonas will persist with this lost cause based on his failure to distinguish between a model of detrended temperature and the detrended temperature itself.
Perhaps if R2 had been 85% instead of 99.99% he might have found it easier to distinguish them. Judged by eye, 99.99% is visually indistinguishable from R2 = 100.000…%, which obviously would be circular.
“@Mike Jonas: The sawtooth was created as the difference between Hadcrut3 and AGW.
Correct.”
http://judithcurry.com/2012/12/04/multidecadal-climate-to-within-a-millikelvin/#comment-281100
Creating and defining are not exactly the same things:
[M] The sawtooth was created as the difference between Hadcrut3 and AGW.
[V] It was indeed: I detrended the temperature (as many have done before me) and then worked on the problem of finding a hypothesis that might account for the detrended temperature (as again many have done but not with my resulting hypothesis).
[M] Thus Vaughan Pratt has confirmed that the poster started with SAW being created as temperature minus AGW.
[V] Poster? You said nothing about a poster [and] now rephrased what I responded to as something I would have flatly denied. In fact I would have said it was not even wrong because the concept of defining SAW as HadCRUT3 − AGW doesn’t even make sense as far as I can tell.
.
Here’s the first exchange between M and V, vintage December 7, 2012 at 2:20 pm:
[M] What you have done is to start with the AGW component as calculated by the model (which is coded to match the temperature).
[V] What do you mean “coded to match the temperature”? Are you saying that the predicted global warming curve was obtained simply by cloning the data points of the observed warming curve? Had I done that I’d agree with you that this would be utterly stupid.
Only Cargo Cult informal logic can show such magnificent proof by asserting ad nauseam a misspecified concept (i.e. circularity) about a strawman.
No wonder Tony liked it.
And a next iteration, a few days later, on December 14, 2012 at 7:19 am :
[M] Simple summary: Vaughan Pratt assumed that climate consisted of IPCC-AGW and something else. His finding was that the climate consisted of IPCC-AGW and something else.
The answer came on the very same day at 10:05 pm:
[V] The “emperor has no clothes” gambit. Oh, well played, Mike. Mate in one, how could I have overlooked that? ;) Mike, I would agree with your “simple summary” with two small modifications: replace the first F by F(v) and the second by F(V). My clothes will remain invisible to the denizens of Bill Gates’ case-insensitive world, but Linux hackers will continue to admire my magnificent clothing […]
That our Cargo Cult logician kept repeating his circularity argument (even after MattStat tried to reason him at Tony’s) might explain why Vaughan turned into an informal mode.
For good measures, here’s the exchange between MattStat and our Cargo Cult logician :
[M, December 13, 2012 before 8:45 am]: VPmK was a stunningly unconvincing exercise in circular logic […]
[MattStat, December 13, 2012 at 9:13 am]: That is over-wrought. […] Pratt merely showed that, with the data in hand, it is possible to recover the signal of the CO2 effect with a relatively low-dimensional filter. No doubt, the procedure is post hoc. The validity of the approach will be tested by data not used in fitting the functions that he found.
[M, December 13, 2012 at 1:04 pm]: We have a few people with logic problems here. Of course it’s circular. Circular Logic is when you claim to have proved something that you assumed in the first place. […] Yes it’s true that VP published his data, methods and result. I congratulated him on publishing all the data and workings, and I truly meant it. If only all climate scientists did that then surely climate science couldn’t have got into its current mess. But the result was still obtained by circular logic.
[MattStat, December 13, 2012 at 4:41 pm] In filtering, there is a symmetry: if you know the signal, you can find a filter that will reveal it clearly; if you know the noise, you can design a filter to reveal the signal clearly. Pratt assumed a functional form for the signal (he said so at ClimateEtc), and worked until he had a filter that revealed it clearly. The thought process becomes “circular” if you “complete the circle”, so to speak, and conclude that: since he found what he assumed, then it must be true.
[M, December 13, 2012 at 5:08 pm] VP’s claimed results flowed from his initial assumptions [BOOM!]. That’s what makes it circular. […] So (a) the logic was circular, and (b) it was tested anyway and found wanting.
[MattStat, December 13, 2012 at 9:12 pm] When results follow from assumptions that’s logic or mathematics. It only becomes circular if you then use the result to justify the assumption. You probably recall that Newton showed that Kepler’s laws followed from Newton’s assumptions. Where the “circle” was broken was in the use of Newton’s laws to derive much more than was known at the time of their creation. In like fashion, Einstein’s special theory of relativity derived the already known Lorentz-Fitzgerald contractions; that was a really nice modeling result, but the real tests came later.
[M, December 14, 2012 at 2:02 am] Oh the perils of re-editing a comment in a tearing hurry. You correctly point out that what I said “VP’s claimed results flowed from his initial assumptions. That’s what makes it circular” was wrong. The correct statement is “VP’s claimed results are his initial assumptions [BOOOM!]. That’s what makes it circular.“
***
A truly magnificient exchange.
I vote that we let the contortionista curve-fitting clowns have the last word. They are a danger, only to themselves.
At the very least, everyone should agree that by looking at the right side of the poster, we can see a big box called MECHANISMS.
Perhaps we could all agree that this box was left empty too.
Funny. How many times have you claimed you were going to take your ball and go home, only to be humiliated as you crawl back and asks for more punishment? The only logical conclusion is that you enjoy the humiliation in addition to the punishment. Addictions are funny things, aren’t they Don?
Hey, you and Vaughn are at cross purposes here, in the Hotel Millikelvinornia.
===========
josh-u-a
-another little sniffer-yapper with a bad case of Donitis
-and this one is a bigoted little hypocrite too
The votes have not all been counted yet, josh-u-a. And I will give the contortionista meaningless curve-fitters the last word, when I am ready. I know as long as I keep jerking his chain the compulsive little sock puppette sniffer-yapper will soon show up with a brilliant knee-jerk alleged rebuttal. So you see josh-u-a, there is no danger of me being last.
Have you ever made up your mind on the existence of God, joshie? You know as long as you are sitting on the agnostic fence, it doesn’t seem right that you go around harassing and ridiculing Christians/conservatives/Republicans/deniers for believing in Intelligent Design. If your brilliant mind can’t rule out the existence of God, you also cannot rule out the possibility of Intelligent Design (the God can do anything, joshie). That’s if your judgement is not clouded by bigotry.
Joshua,
As we now can see, Don Don’s turning to hyphenated epithets. Do you think he’d be able to outrace mike using mike’s favorite technique?
I don’t think Don Don used “you’re a bigot” before on this thread. As a matter of fact, only Chewbacca used it before now, against Big Dave.
Do you think Don Don showed us all the tricks from his playbook yet?
willard –
I haven’t seen anything from Don recently that I haven’t seen from him before. He does have a few more tricks not displayed in this thread – one of my favorites was when he implied that I’m a self-hating jew.
Haven’t seen the liberal use of hyphens like this before, although the “josh-u-a” is not new. I guess that he’s trying to emulate mike, although he’s clearly a pale imitation.
BTW – did you see Brandon’s meltdown on the other thread? Looks like he’s joined with kim and Don in my fan club.
http://funny.ph/funny-pictures/dog-just-cant-stop-humping/
With only 105 comments needed to reach the magical figure of a quarter of 10,000 comments, which will surely stand as a record for Climate Etc for a long time, I would really appreciate a little more harassment than I’ve been receiving lately. Surely y’all can come up with a hundred mean things to say about me. Otherwise I’ll have to generate my own content, which is sort of cheating in a roundabout way.
Hey, be brave; connect the De Vries Cycle with mantle moving. It’s there, I just know it.
=======
Of course, Dr. Wizard and his sidekick, willy the stalker/sniffer/yapper, are just innocent bystanders. Too rough for you here, doc? Why don’t you go back to tamino’s blog and try your song and dance act there, again. Or you could shut up and submit your paper for publication. Ain’t that what sighintists usually do, doc?
Here willy! Here willy!
Indeed, Don Don, it’s just a flesh wound:
MJ:”Please stop wasting everyone’s time, and address the one essential point – the one that will settle the matter – by demonstrating that what you have done is climate-meaningful.”
Spot the presuppositions!
Whre is little willy to intervene, when Tamino goes upside the doc’s head:
Vaughan Pratt | February 27, 2011 at 11:24 am |
[edit]
[Response: This is not your blog, and you are not welcome to post a 2400-word essay masquerading as a comment. I’ve said I don’t want to argue with you about it, now let’s be even clearer: based on your statements (including, perhaps especially, your ramblings in this “comment”) I think you have absolutely nothing of value to add to the discussion. Furthermore, your comments about “period” and “oscillation” confirm my opinion that discussing it with you is a waste of time.
Feel free to post on your own blog how brilliant is your orgy of indulgent curve-fitting, and how mean, stupid, closed-minded, and unscientific I am. I’ll respond directly to your ideas when they pass peer review and appear in GRL. I won’t be holding my breath.
I stated in response to Ron Broberg that this post was not about him. It’s about you.]
After all his other failed baits, Don Don now switches to another matter.
Bait and switch. Switch and bait. Don Don’s scams are n
***
To answer Don Don’s accusation (“where were you”), let it be noted that I actually asked Tamino to support his claim that
> Often they involve some mysterious “cycle” (usually a 60-odd year cycle) which is claimed to be “obvious” but doesn’t stand up to analytical scrutiny.
The “often”, the “”obvious”” and the “does’nt stand up” all deserve citations.
Tamino did not answer that question.
Tamino’s a blogger with an attitude.
***
We now see that Don Don’s latest accusation has no merit.
Boooom.
Not only it has no merit, but it shows that Don Don has not read Tamino’s, except perhaps to find some baits and switches for his scam.
Tamino slaps the doc, Ouch!
Ooops, upside da head
I say
ooops uspide da head
Vaughan Pratt | February 26, 2011 at 1:50 am |
I came to this website when it was drawn to my attention that people were criticizing me behind my back for reasons I could not discern. I tried to start up a dialog aimed at understanding what the complaints were, but instead of getting a straight answer I get the following.
I have very good reason to believe you don’t understand the statistics of period analysis … you’ve just fallen into the all-too-common trap of thinking that it’s “obvious” … you don’t understand the evidence for aerosol cooling … I think your theories have no merit.
Whoa, where to begin?
On other blogs, one way to identify the climate skeptics is that they’re the ones who talk in that dismissively pseudoscientific way. I guess it doesn’t work on this blog.
Maybe someone else on this blog can explain to me what I said that got Tamino’s back up in this way.
I don’t wish to argue with you about it.
I’ve heard that many times from climate skeptics, but even then never after just a single exchange. This is the first time I’ve heard it from a non-skeptic. Usually it’s the non-skeptics that are the patient ones.
I am unable to take seriously any attack on my presumed views when the attackers refuse to even tell me what they believe those views to be. The alternative is to be cast in the role of Kafka’s Joseph K., who was never told what he was charged with. Without knowing the basis for the original criticisms I can’t even defend myself from them on some other blog.
I have no idea what I said to deserve such an uncivil welcome on this blog, but it’s not my idea of how science is normally conducted.
[Response: I said that I have good reason to believe that you don’t understand the statistics of period analysis. That’s because you argued that the so-called cycle is “obvious” when there’s no analytical justification for such a claim — you just think it “looks” obvious. And in fact I’ve analyzed it in depth (period analysis is my area of expertise), and the claim cannot be justified on the basis of the data. This isn’t a criticism of you personally, but of the claim that you made.
I said you don’t understand the evidence for aerosol cooling because you attribute it to “infers the extent of aerosol cooling from the temperature rather than vice versa.” This reveals an ignorance of the literature, otherwise you’d know that the extent of aerosol cooling is estimated from the measured aerosol optical depth due to volcanic eruptions and their consequent impact on global temperature, and estimates of aerosol emissions during the 20th century. Again, I made no criticism of you personally, but of the claim you made.
And now you are the one who decides to “get your back up.” You start by accusing me of criticizing you “behind your back” as though I were whispering in the hallway to some school chum, trying to conceal what I was saying. This is wrong, offensive, and frankly, rather childish. Then you play the part of the wounded, when I only criticized your ideas (and with very good reason) but you are the one who’s decided to make it personal. Your silly remark about “uncivil welcome” and “not how science is normally conducted” completes your delusion of martyrdom.
All you’ve done is an exercise in contortional curve-fitting, while ignoring (and apparently denying) the physics (e.g., aerosol cooling which is very real). And when I won’t buy into your theory, you get all huffy and apparently can’t find anything more “scientific” than to accuse me of exactly what you yourself have done — make it personal rather than scientific.
And that is why I don’t care to argue with you about it. If you think your model is so good, publish it in the peer-reviewed literature. That’s how science is normally conducted.]
Why can’t you put the link to the post, Don Don?
Go for it.
Here’s one:
http://tamino.wordpress.com/2011/02/26/mathturbation/
The title is interesting, don’t you think?
Sheds an interesting light on an “uncivil welcomes”.
Speaking of which:
> [Y]ou play the part of the wounded, when I only criticized your ideas (and with very good reason) but you are the one who’s decided to make it personal. Your silly remark about “uncivil welcome” and “not how science is normally conducted” completes your delusion of martyrdom.
is self-contradictory.
***
Tamino’s peanut gallery also shows what happens when people let their prejudices get over their reading.
Worse, Tamino remains convinced that Vaughan tried to explain away AGW with periodicity.
Tamino is a blogger with an attitude.
Here’s the link of the comment Don Don just copy-pasted:
http://tamino.wordpress.com/2011/01/30/amo/#comment-48831
Notice the date: February 26, 2011 at 1:50 am
***
Now, readers can find other comments by Vaughan Pratt in that thread.
It’s not difficult to see that Tamino became offensive after being quite defensive.
Pearls before Swine, eh Vaughn? Hey, this de Vries Cycle moves my mantle.
=============
We now see that Don Don is getting to the essence of his abuse.
Could it be shortened to a tweet?
No tweet, that’s too sweet;
Posted Hotel Rules insist:
Only a titter.
=======
A reminder of most Hotels’ Rules:
http://judithcurry.com/2013/01/18/blog-commenting-etiquette
TWEET:If you think your model is so good, publish it in the peer-reviewed literature.
I see that Judith is still observing our foolishness on this thread. OK, everything else goes, but Amos and Andy is out. Do you still think Pratt’s story about the sawtooth is intriguing, Judith? I have not noticed a comment from you, since the start of this immortal little chat.
> OK, everything else goes […]
As if Don Don needed Judy’s moderation to see what goes.
A word from our moderator:
http://judithcurry.com/2013/01/16/hansen-on-the-standstill/#comment-287028
Vintage January 18, 2013 at 12:18 pm.
Two weeks ago in this comment I addressed Greg Goodman’s claim that my fit to the Keeling curve was “totally unsuitable” based on his graph purporting to show a better fit (the yellow curve). Since I was having trouble reading Greg’s graph I expanded it to make it more visible at the upper left of this graph (the yellow curve became blue, labeled “Manacker”), and also plotted the corresponding annual rises on the right hand side in order to show the differences even more clearly.
Unlike all my earlier graphs, this one seems to have been much less controversial. In particular no one so far, not even Greg himself, has objected to my claim that the green graph at upper left (labeled Hofmann 270) is a better fit to the Keeling curve than either the red one (labeled Hofmann 287.4, the fit from my poster) or the blue one (Greg’s proposed improvement to my red one but labeled Manacker since Max proposed it well before Greg).
Absent further complaints I’ll go with the green curve, Hofmann 270, in future.
Thank you, doc. We were all very concerned about that graph thing. Can we put a wrap on this thread now? I am just kidding you, doc. I know this stuff is important.