Plausible scenarios for climate change: 2020-2050

by Judith Curry

A range of scenarios for global mean surface temperature change between 2020 and 2050, derived using a semi-empirical approach. All three modes of natural climate variability – volcanoes, solar and internal variability – are expected to act in the direction of cooling during this period.

In the midst of all the angst about 1.5oC or 2.0oC warming or more, as defined relative to some mythical time when climate was alleged to be ‘stable’ and (relatively) uninfluenced by humans, we lose sight of the fact that we have a better baseline period – now. One advantage of using ‘now’ as a baseline for future climate change is that we have good observations to describe  the climate of  ‘now’.

While most of the focus of climate projections is on 2100, the period circa 2020-2050 is of particular importance for several reasons:

  1. It is the period for meeting UNFCCC targets for emissions reductions
  2. Many financial and infrastructure decisions will be made on this time scale
  3. The actual evolution of the climate over this period will influence 1) and 2) above; ‘surprises’ could have adverse impacts on decisions related to 1) and 2).

Global climate/earth system models have little skill on decadal time scales. To address this issue, CMIP5 and CMIP6 are conducting initialized, decadal scale simulations out to 35 years. While I haven’t seen any CMIP6 decadal results yet, I do follow this literature. Punchline is that there is some skill in simulating the Atlantic Multidecadal Oscillation (AMO) out to 8-10 years, but otherwise not much overall skill.

I have previously criticized the interpretation CMIP5 simulations as actual climate change scenarios – instead, these simulations show the sensitivity of climate to different emissions scenarios. They neglect scenarios of future solar variability, volcanic eruptions, and the correct phasing and amplitude of multidecadal variability associated with ocean circulations. The argument for dismissing these factors is that they are smaller than emissions forcing. Well, cumulatively and on decadal to multi-decadal timescales, this is not necessarily true.

And in the CMIP6 era, we now have sufficient information and understanding so that we can generate plausible scenarios of volcanic and solar forcing for the 21st century, as well as for the AMO.

I have developed a semi-empirical approach to formulating 21st century climate change scenarios that rely only indirectly on climate models. Multiple scenarios are generated for each driver of the forecast (natural and anthropogenic), with an emphasis on plausible scenarios (rather than extreme scenarios that cannot completely be ruled out).

Note: in what follows, many references are cited. I don’t have time now to pull together a full bibliography, but I have provided hyperlinks to the key references.

Manmade global warming

The approach used here is to use as much as possible the new information becoming available for CMIP6: new emission scenarios, new considerations regarding climate model sensitivity to CO2.

Similar to the recent IPCC SR1.5 Report, no attempt is made to use CMIP6 Earth System Model outputs. Following the IPCC SR1.5, scenarios of global warming are driven by scenarios of cumulative emissions. The individual cumulative emission scenarios between 2020 and 2050 are then translated into a global temperature increase using a range of values of the Transient Climate Response to Cumulative Carbon Emissions (TCRE). This approach is illustrated in the following figure:

Figure 1: CO2-induced warming as a function of cumulative emissions and TCRE. Millar et al

Emissions scenarios

For the forthcoming IPCC AR6, a new set of emissions scenarios (SSP) have been issued.

The 2019 World Energy Outlook Report from the International Energy Agency (IEA) challenges the near term SSP scenario projections through 2040. They examined three scenarios: a current policy scenario (CPS) where no new climate or energy policies are enacted by countries, a stated policies scenario (STPS) where Paris Agreement commitments are met, and a sustainable development scenario (SDS) where rapid mitigation limits late 21st warming to well below 2°C. Both the IEA CPS and STPS scenarios can be considered as business-as-usual where either current policies or current commitments continue, but no additional climate policies are adopted after that point.

Figure 2 compares the IEA fossil fuel emissions projections to scenarios being used in the IPCC AR6. The figure indicates that the IEA CPS emissions are between the SSP2- RCP4.5 and SSP4-RCP6.0 scenarios and the IEA STPS scenario is slightly below SSP2-RCP4.5.

Figure 2: Annual CO2 emissions from fossil fuel and industry in CPS and STPS IEA scenarios compared to the range of baseline scenarios examined in the SSP Database, as well as a subset of the baseline and mitigation scenarios chosen for use in the forthcoming IPCC AR6 report. Ritchie and Hausfather (2019) https://thebreakthrough.org/issues/energy/3c-world

In view of these considerations, I select a single scenario for consideration here: SSP2-4.5. For the timescale of this analysis (2020-2050), there is little difference between 4.5 and 6.0, and we are not currently on the 7.0 trajectory.

Cumulative emissions for SSP2-4.5 calculated from 2020 to 2050 are reported in Table 1 for both cumulative CO2 and cumulative C (carbon). Cumulative C is used in calculating the transient climate response to cumulative carbon emissions (TCRE); note that 1000 GtC is the carbon content of 3667 GtCO2.

Table 1: Projections of cumulative CO2 (GtCO2) and C concentrations (GtC) between 2020-2050, for 3 SSP emissions scenarios. Data from IIASA database.

For reference, the IPCC SR1.5 Report assessed that amount of additional cumulative CO2 emissions (50th percentile) from a reference period 2006-2015 to keep additional warming to within 0.5°C is 580 GtCO2, and to keep additional warming to within 1.0°C is 1500 GtCO2.

TCRE

Translating the emissions scenarios into a global temperature increase has traditionally been conducted using global climate or earth system model simulations. However, the CMIP6 simulations using the new SSP scenarios and their analysis are currently underway. The recent IPCC SR1.5 Report chose to use values of the transient climate response to cumulative carbon emissions, or TCRE, to relate global temperature change to the cumulative emissions in the SSP scenarios.

The amount of warming the world is projected to experience from emissions is approximately linearly proportional to cumulative carbon emissions (for an overview, see Matthews et al. 2018). This relationship between temperatures and cumulative emissions is referred to as the transient climate response to cumulative carbon emissions, or TCRE. For a give value of TCRE, we can calculate the amount of warming expected over a future period in response to scenarios of cumulative carbon emission.

The IPCC AR5 provided a likely range for TCRE of 0.8°C to 2.5°C. Matthews et al. (2018) state that the current generation of full-complexity Earth-system models exhibits a range of TCRE values of between 0.8 and 2.4°C, with a median value of 1.6°C. An observationally-constrained TCRE estimate gave a 5%–95% confidence range of 0.7 −2.0°C, with a best-estimate of 1.35 ◦C (Gillett et al 2013). A more recent observationally-constrained estimate is provided by Lewis (2018), who determined a best estimate of 1.05°C.

In view of these assessments, I select the following values of TCRE for scenarios: 1.0, 1.35, 1.65, 2.0°C as constituting a range of plausible values.

Table 2 provides calculations of the amount of warming between 2020 and 2050, based on SSP2-4.5 and four values of TCRE. As expected from the range of TCRE values used here, there is a factor-of-two range in the amount of emissions-driven warming expected for the period 2020-2050.

Table 2: Warming scenarios (oC) for 2050 from a 2020 baseline based on the SSP2-4.5 cumulative emissions scenario (GtC) and four values of TCRE (oC)

Projections of natural climate variability

Scenarios of future variations/changes are presented for 2030-2050 for the following:

  • Solar variations
  • Volcanic eruptions
  • Decadal-scale ocean circulation variability

Solar variations

With regards to solar scenarios for the 21st century, there are two issues:

  • How much total solar insolation (TSI) will change
  • How much warming, given a specific TSI.

According to the IPCC AR5, the influence of the Sun on our climate since pre-industrial times, in terms of radiative forcing, is very small compared to the variation of radiative forcing due to added anthropogenic greenhouse gases: 0.05 W/m2 vs. 2.29 W/m2. Thus, the IPCC AR5 message is that changes in solar activity are nearly negligible compared to anthropogenic forcing.

This interpretation has been challenged:

  • There is substantial disagreement on trends in solar activity, even in the satellite era. Several papers in the last decade have claimed that solar activity in the second part of the 20th century was higher than any time in the past 10,000 years. Some studies claim that the Sun could have contributed at least ∼ 50% of the post 1850 global warming.
  • The IPCC AR5 considered only the direct solar effects on global temperatures. It has been found that over the eleven- year solar cycle the energy that enters the Earth’s system is of the order of 1.0–1.5 W/m2. This is almost an order of magnitude larger than what would be expected from solar irradiance alone, and suggests that solar activity is getting amplified atmospheric processes. Candidate processes include: solar ultraviolet changes; energetic particle precipitation; atmospheric-electric-field effect on cloud cover; 
cloud changes produced by solar-modulated galactic cosmic rays; large relative changes in its magnetic field; strength of the solar wind.
  • The relations between solar variations and Earth climate are many and complicated. Most of them work locally and regionally, and many are non-linear. Strong solar influences have been seen in the Pacific and Indian Oceans and also in the Arctic, among other regions.

As summarized by Svensmark (2019), satellite data demonstrate that TSI varies by as much as 0.05–0.07% over a solar cycle. At the top of the atmosphere this variation amounts to around 1 W/m2 out of a solar constant of around 1361 W/m2. At the surface, this is only 0.2 W/m2, after taking geometry and albedo into account. Model simulations and observations have shown a response of global surface temperature to TSI variations over the 11-year solar cycle of about 0.1oC (Matthes et al. 2017).

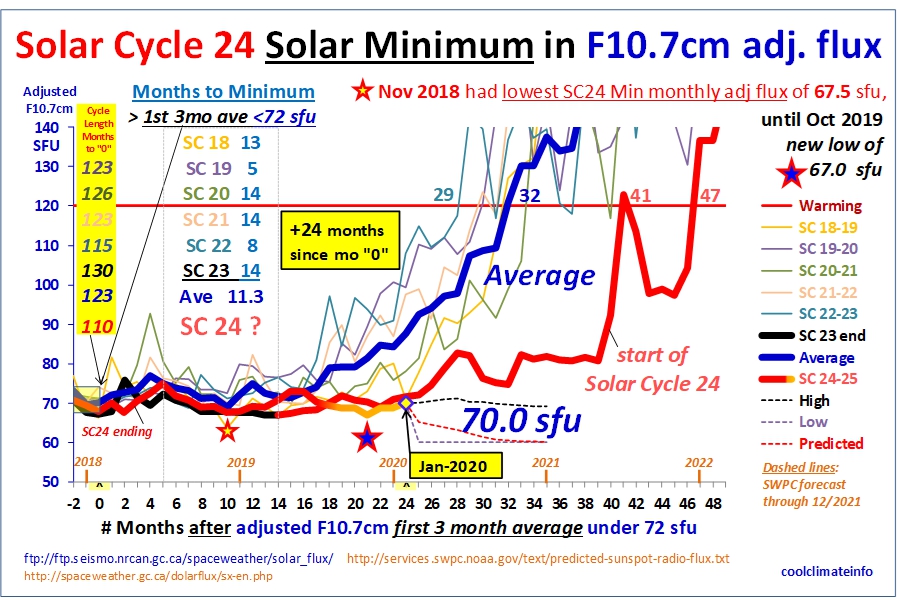
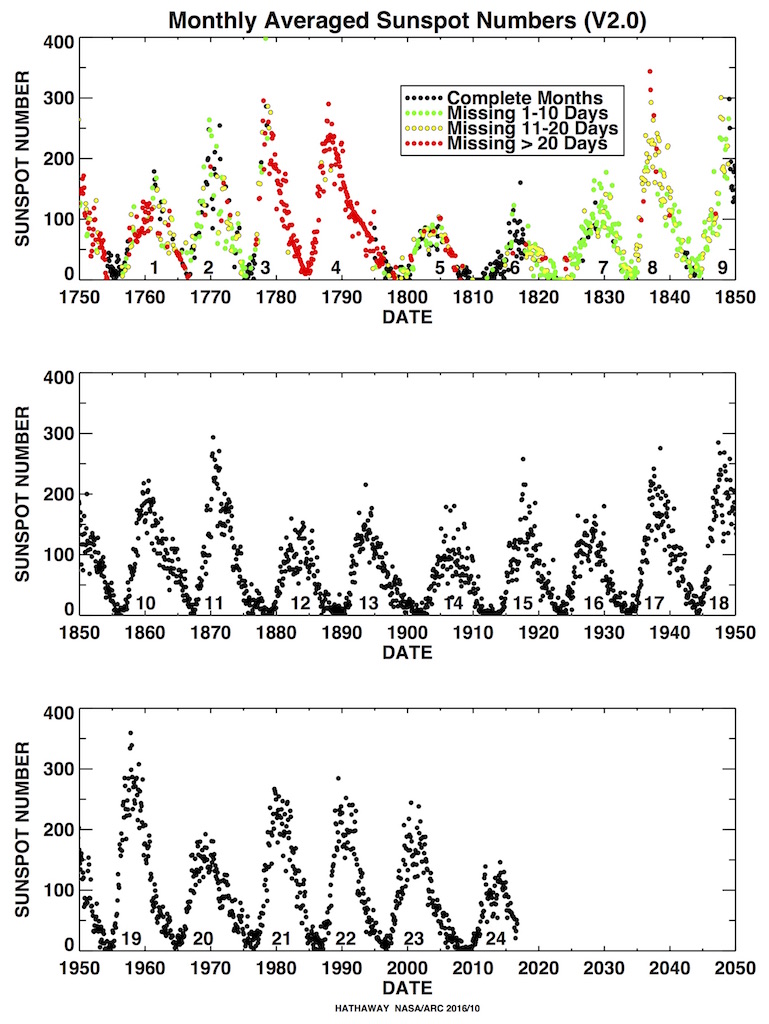
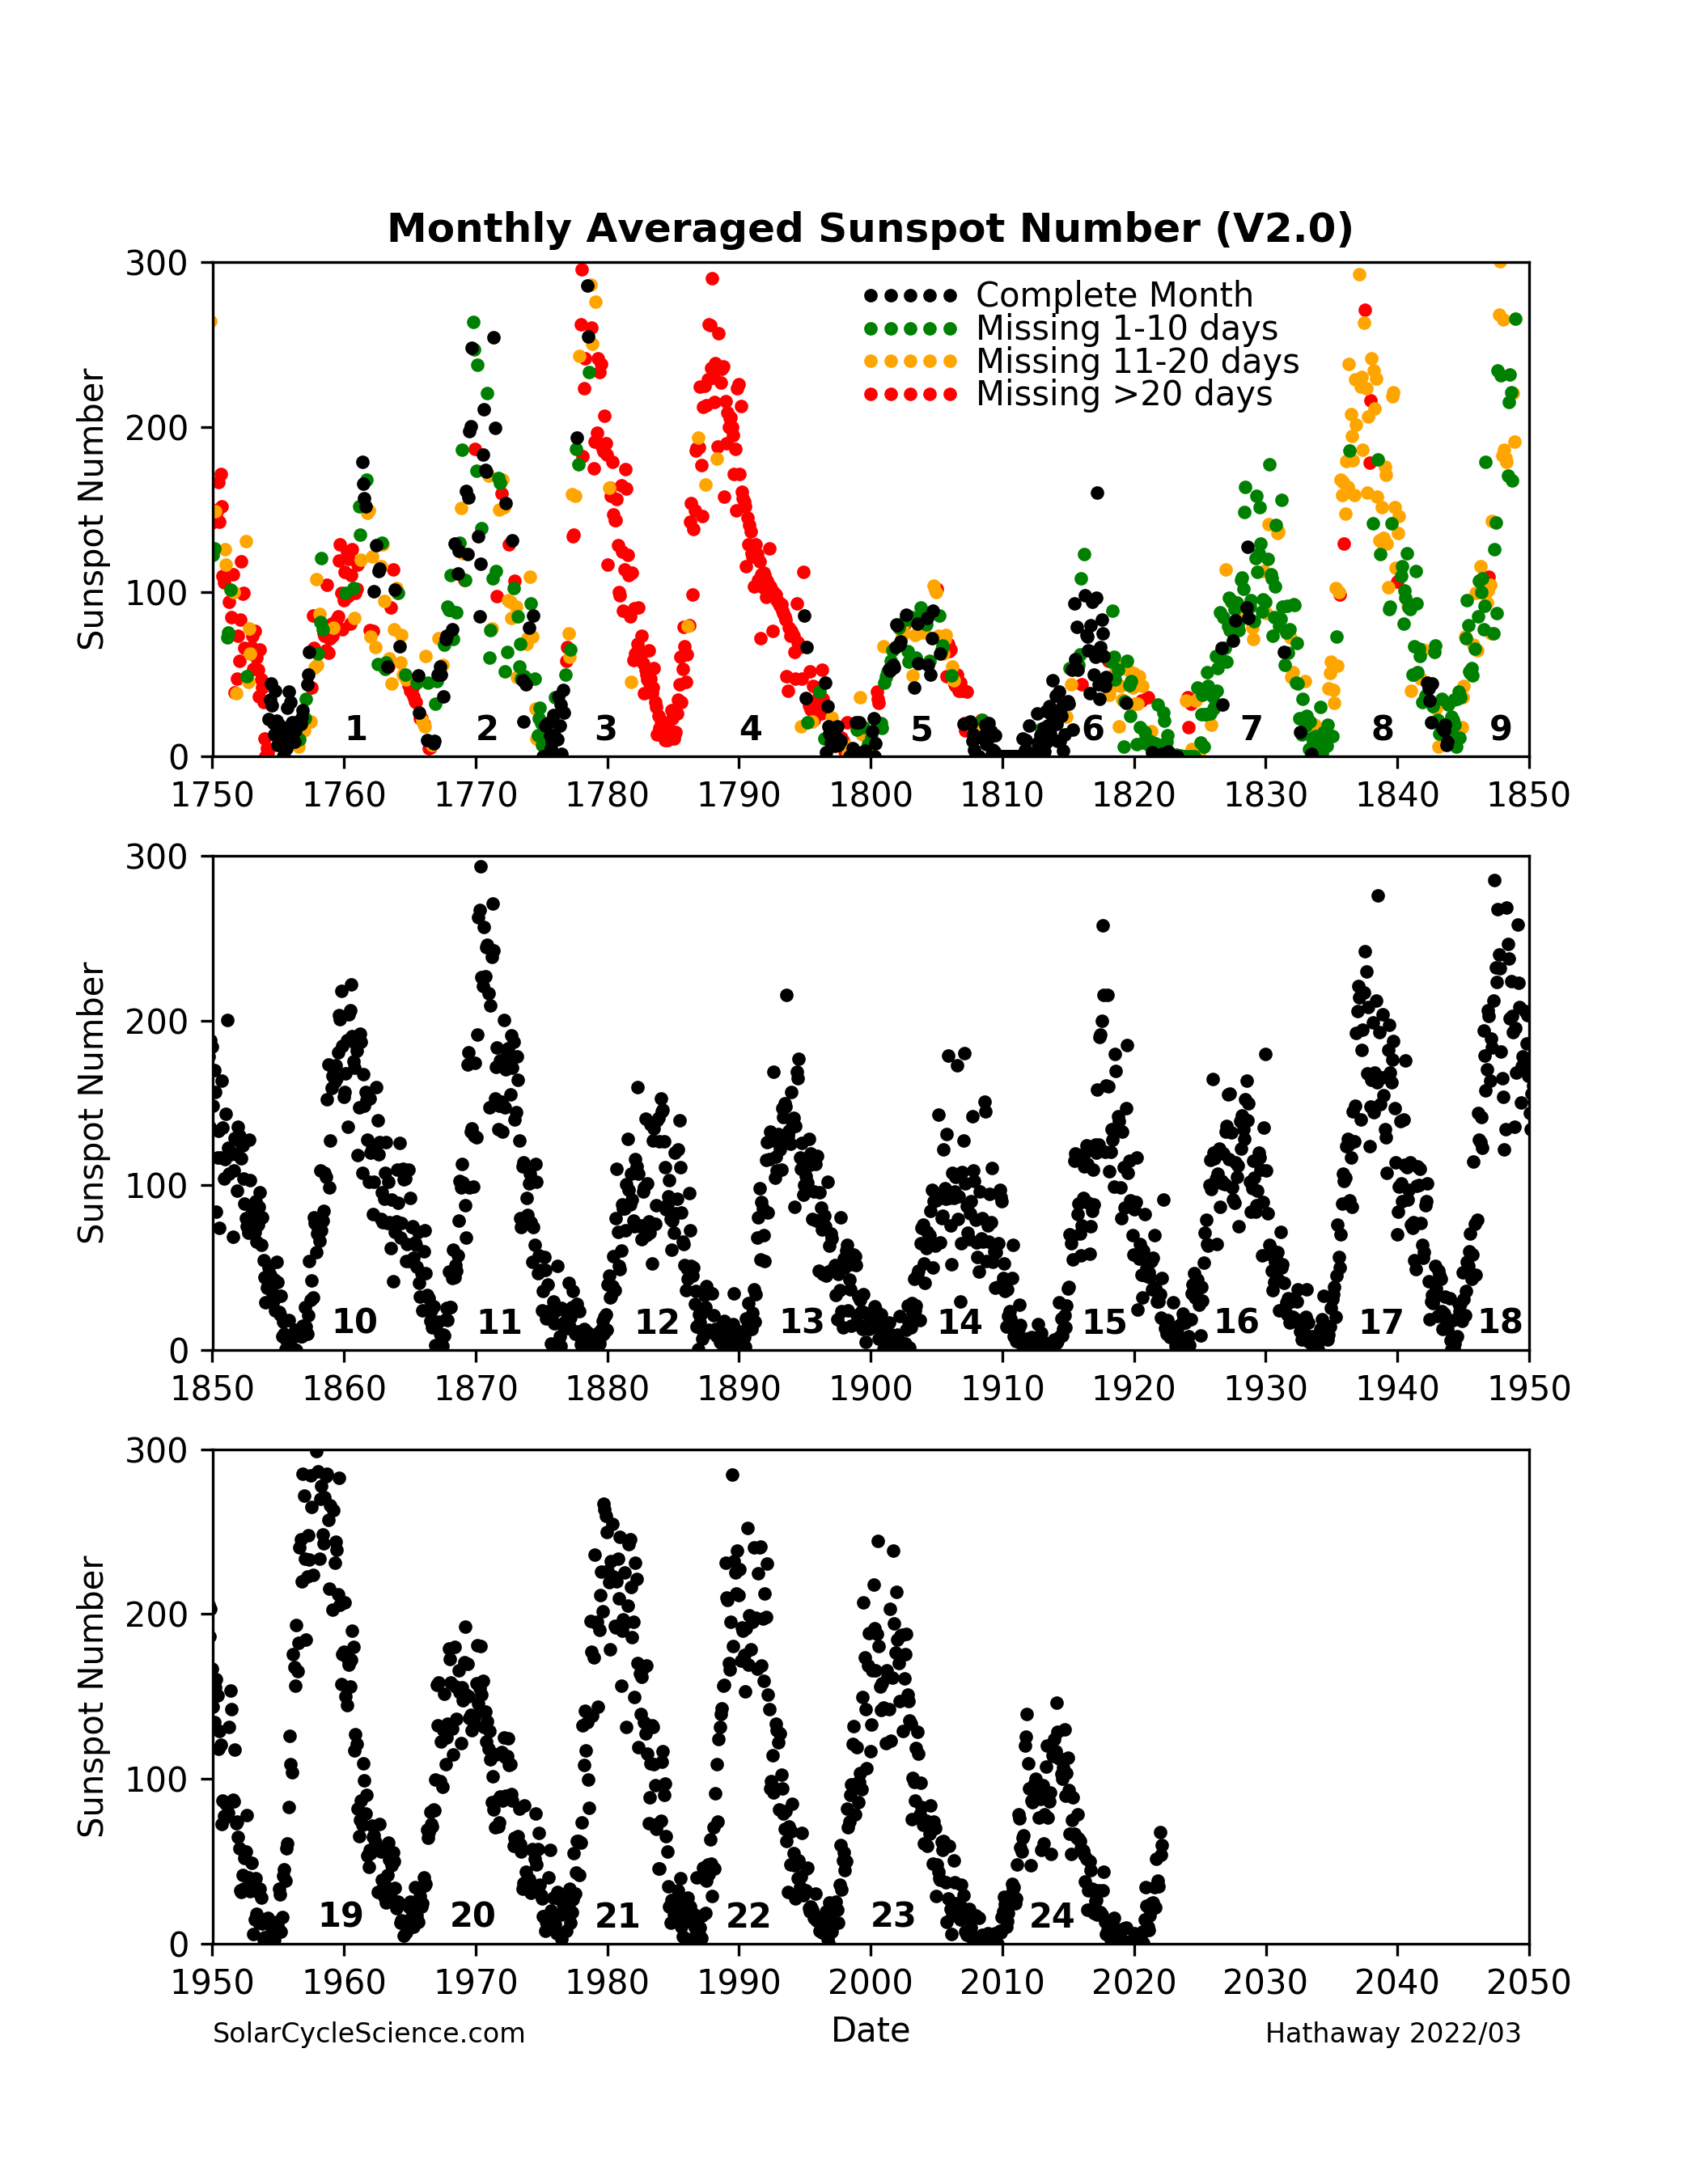
The current solar cycle 24 is the smallest sunspot cycle in 100 years and the third in a trend of diminishing sunspot cycles. Is the Sun is currently moving into a new grand minimum or just a period of low solar activity? Many solar physicists expect the sun to move into a new minimum during the 21st century: a century-level low, although several predict a minimum comparable with the Dalton or even the Maunder Minimum.

In CMIP5, climate projections were based on a stationary-Sun scenario, obtained by simply repeating solar cycle 23, which ran from April 1996 to June 2008, which is the third strongest solar cycle since 1850. Clearly, such a stationary scenario is not representative of true solar activity, which exhibits cycle-to-cycle variations and trends. Therefore, in CMIP6 more realistic scenarios were developed for future solar activity, exhibiting variability at all timescales (Matthes et al. 2017). Matthes et al. present the following two scenarios (Figure 3): a reference scenario and a Maunder minimum scenario for the second half of the 21st century.

Figure 3: CMIP6 scenarios for solar forcing (TSI): reference scenario (top); Maunder minimum scenario (bottom). Matthes et al. (2017)

If a Maunder minimum-scale event were to occur in the 21st century, how much cooling would this cause? As summarized by Svensmark (2019), a majority of reconstructions find only small changes in overall secular solar radiative output: since the Maunder Minimum, TSI is believed to have increased by around 1 W/m2, which corresponds to 0.18 W/m2 at the Earth’s surface – this is the same magnitude of the amplitude of the 11 year solar cycle. Jones et al. (2012) used a simple climate model to estimate that the likely reduction in the warming by 2100 from a ‘Maunder minimum’ scale event to be between 0.06 and 0.1 °C. Fuelner and Rahmstorf (2010) estimated that another solar minimum equivalent to the Dalton and Maunder minima would cause 0.09°C and 0.26°C cooling, respectively. Meehl et al. (2013) estimated a Maunder minimum cooling of 0.3°C.

These calculations ignored any indirect solar effects, which would arguably increase these numbers by up to a factor of 3 to 7. Shaviv (2008) used the oceans as a calorimeter to measure the radiative forcing variations associated with the solar cycle. Shaviv found that the energy that enters the oceans over a solar cycle is 5–7 times larger than the 0.1% change in TSI, thus implying the necessary existence of an amplification mechanism. Scafetta (2013) showed that the large climatic variability observed since the medieval times can be correctly interpreted only if the climatic effects of solar variability on the climate have been severely underestimated by the climate models by a 3 to 6 factor. Svensmark (2019) made a comparable argument using borehole temperatures for the period since the Medieval Warm Period, finding an amplification of a factor of 5 to 7 over the warming expected from a drop in TSI. If an amplification factor is included of these magnitudes, then a surface temperature decrease of up to 1oC (or even more) from a Maunder minimum could be expected.

Three scenarios for solar variability are used here:

  • No variability (CMIP5)
  • CMIP6 reference scenario, with factor of two amplification by solar indirect effects
  • CMIP6 Maunder Minimum scenario, with factor of four amplification by solar indirect effects (note: the period 2020-2050 has lower values of TSI than the reference scenario, but the actual Minimum is in the latter half of the 21st century).

Note: the CMIP6 values of changes in TSI are ‘eyeballed’ from Figure 3 (I did not download the CMIP6 solar projections). I would greatly appreciate other interpretations of the values of surface cooling to infer from the CMIP6 solar scenarios.

Table 3. Scenarios of solar cooling (oC), relative to the CMIP5 solar cycle

Volcanoes

The 21st century CMIP5 climate model simulations did not include any radiative forcing from future volcanic eruptions. While volcanic eruptions are not predictable, a scenario of zero radiative forcing from volcanoes in the 21st century is a poor assumption. Further, assuming a repeat of the 20th century volcanic radiative forcing is not a very good assumption, either.

In the past decade, there have been two major paleoclimate reconstructions of volcanic eruptions in the recent millennia. Gao et al. (2008) examined ice core records and their following reconstruction for sulfate ejection from volcanic eruptions. A more recent reconstruction by Sigl et al. (2015) is provided below, presented in terms of global volcanic aerosol radiative forcing. These reconstructions put into perspective the relative low level of volcanic activity since the mid 19th century.

Figure 4: Reconstruction of global volcanic aerosol radiative forcing for the past 2500 years. Sigl et al. (2015)

Because volcanic eruptions are unpredictable events, they have generally been excluded from twenty-first century climate projection protocols. Most recent projections either specify future volcanic forcing as zero or a constant background value. Bethke et al. (2017) explored how sixty possible volcanic futures, consistent with ice-core records, impact climate variability projections of the Norwegian Earth System Model (NorESM; ECS=3.2C) under RCP4.5. Clustered occurrence of strong tropical eruptions has contributed to sustained cold periods such as the Little Ice Age, where the longer- term climate impacts are mediated through ocean heat content anomalies and ocean circulation changes. Extreme volcanic activity can potentially cause extended anomalously cold periods.

Figure 5: Annual-mean GMST. Ensemble mean (solid) of VOLC (stochastic volcanic forcing; blue), VOLC-CONST (average 1850-2000 volcanic forcing; magenta) and NO-VOLC (red/orange) with 5–95% range (shading) and ensemble minima/maxima (dots) for VOLC and NO-VOLC; evolution of the most extreme member (black). Bethke et al. (2017).

Based on the results of Bethke et al. (2017), three volcanic scenarios for cooling are used, related to the decadal values shown in Figure 5:

  • No forcing
  • 50th percentile value: mean forcing
  • 95th percentile value: large forcing

Figure 6. Decadal means of GMST relative to pre-industrial. Ensemble mean (solid) with 5–95% range (shading) of VOLC (blue) and NO-VOLC (red).

Table 4 shows the decadal scenarios of volcanic cooling, consistent with Figure 6.

Table 4. Decadal scenarios of volcanic cooling (oC). From Bethke et al. (2017)

Internal variability

Variations in global mean surface temperature are also associated with recurrent multi-decadal internal variability associated with large-scale ocean circulations. However, separating the internal variability from forced variability is not always straightforward owing to uncertainties in external forcing.

The multi-decadal internal variability (50-80 year band) has been estimated to have a peak-to-peak amplitude of global surface temperature as high as 0.3-0.4oC (Tung and Zhou, 2012), accounting for about half of the late 20th century warming. DelSole et al. (2010) estimated a peak-to-peak global temperature change of 0.24oC from internal variability. By contrast, Stolpe (2016) estimated a maximum peak-to-peak amplitude of 0.16oC. Knutson et al. (2016) used the GFDL CM3 model, which has strong internal multidecadal variability, to identify several periods that exceed 0.5oC for global mean surface temperature, indicating that data records of ~160 years are too short for a full sampling of multi-decadal internal climate variability.

Most analyses have identified Atlantic Multidecadal Variability as having the dominant imprint on global and Northern Hemisphere temperatures. Identification of ENSO as a driver of global mean temperature variations or response signal remains contentious, with conflicting results. Bhaskar et al. (2017) characterizes ENSO as a secondary driver of variations in global mean temperature, accounting for 12% of variability over the last century, with ENSO and global mean surface temperature mutually driving each other at varied time lags.

Not taking multi-decadal variability into account in predictions of future warming under various forcing scenarios may run the risk of over-estimating the warming for the next two to three decades, when the Atlantic Multi-decadal Oscillation (AMO) is likely to shift into its cold phase.

Analysis of historical and paleoclimatic records suggest that a transition to the cold phase of the AMO is expected prior to 2050. Enfield and Cid-Serrano (2006) used paleoclimate reconstructions of the AMO to develop a probabilistic projection of the next AMO shift. Figure 7 shows the probability of an AMO shift relative to the number of years since the last regime shift. The previous regime shift occurred in 1995; hence in 2020, it has been 23 years since the previous shift. Figure 7 indicates that a shift to the cold phase is expected to occur within the next 15 years, with a 50% probability of the shift occurring in the next 6 years.

Figure 7. Probability of an AMO regime shift relative the number of years since the last regime shift. Source: Enfield and Cid-Serrano (2006)

The timing of a shift to the AMO cold phase is not predictable; it depends to some extent on unpredictable weather variability (Johnstone, 2020). Johnstone’s analysis shows that low-frequency changes in North Atlantic SSTs since 1880 are objectively identified as a series of alternating ‘regime shifts’ with abrupt (~1-year) transitions dated to 1902, 1926, 1971 and 1995 (Figure 8).   In the recent historical record (back to 1880), these sharp changes punctuate longer quasi-stable periods of 24 years (1902-1925), 45 years (1926-1970), and 24 years (1971-1994), while the latest, and warmest regime on record has persisted with little net change from 1995 through 2019 (25 years). Previous cool shifts in 1902 and 1971 shared similar -0.2°C amplitudes, following extended periods of relative warmth (1880-1901), (1926-1970). A negative (cool) shift within a shorter time frame (~5 years) might be tentatively inferred from a steep 2015 SST decline in the subpolar North Atlantic, behavior that might presage broader North Atlantic cooling based on early subpolar appearance of the most recent cool shift of 1971.

Figure 8.   Annual SST anomalies in the subpolar (blue) and tropical (red) North Atlantic. A sharp subpolar cooling is evident in 2015. Johnstone (2020)

Guided by the above analyses, three scenarios for global temperature change associated with the AMO are presented in Table 5.

Table 5. Decadal scenarios of temperature change from internal variability (oC), associated with a transition to the cool phase of the Atlantic Multidecadal Oscillation. 

Integral scenarios of temperature change: 2050

The final integral temperature change is the sum of temperature changes driven by

  • Emissions (4 scenario)
  • Volcanoes (3 scenarios)
  • Solar (3 scenarios)
  • AMO (3 scenarios)

There are 108 possible different combinations of these scenarios.  Table 6 shows extreme high and low warming scenario, plus the scenario using all of the mid range values.

Table 6. Integral scenarios of global mean surface temperature change for 2020-2050.

All of the components of natural variability point to cooling during the period 2020-2050. Individually these terms are not expected to be large in the moderate scenarios.   However, when summed their magnitude approaches the magnitude of the warming associated with the moderate values of TCRE – 1.35 and 1.65 oC. If the natural cooling exceeds the expected value, or TCRE is at the low end (1.0 to 1.35oC), then there could be net cooling.

The possibility and probability of 21st century decades being characterized by net cooling has been addressed by several papers. This depends on model value of ECS, and the magnitude of the predicted natural variability. Knutson et al.  (2016) used the GFDL climate model (relatively high value of ECS; high internal variability) to determine that probability of global temperature trend <0 for period of 20-30 years is 2%.  Bethke et al. (2017) used NorESM (ECS=3.2C) with RCP4.5. This paper examined the combination of scenarios of internal variability and volcanic eruptions. They found that occurrences of decades with negative GMST trend become more frequent if accounting for volcanic forcing, with the probability increasing from 10% in NO-VOLC to more than 16% in VOLC. The probability of decades with negative GMST trend more than doubles from 4% to 10% if the analysis is limited to the first half of the century—before the stabilization period of RCP4.5. Volcanic-induced cooling becomes increasingly important in facilitating neutral or negative temperature trends on longer timescales, in conjunction with natural internal variability effects.

In summary, decade(s) during the period 2020-2050 with zero warming or even cooling should not be particularly surprising.

Conclusions

Three main conclusions:

  • We are starting to narrow the uncertainty in the amount of warming from emissions that we can expect out to 2050
  • All three modes of natural variability – solar, volcanoes, internal variability – are expected to trend cool over the next 3 decades
  • Depending on the relative magnitudes of emissions driven warming versus natural variability, decades with no warming or even cooling are more or less plausible.

If you prefer your scenarios on the high side, you can include scenarios with RCP7.0 and TCRE=2.4oC, but these values don’t change the fundamental narrative presented here. You can also add 1.2oC to the values in Table 6, to make the numbers look higher. But if you want plausible scenarios, look to my Table 6, which I think bounds the range of plausible outcomes for global mean surface temperature from 2020-2050.

But what about the 2nd half of the 21st century and 2100? Uncertainties regarding emissions are much greater in the 2nd half of the 21st century. The CMIP6 solar scenarios (Reference and Maunder) show more cooling in the second half of the 21st century. Volcanic eruptions could be larger in 2nd half of 21st century (or not). After the projected cool phase of the AMO, a return to the warm phase is expected, but there is no confidence in projecting either a warm or cold phase AMO in 2100.

Apart from the ‘wild card’ of volcanic eruptions, the big uncertainty is solar indirect effects. Based on the literature survey that I’ve conducted, solar UV effects on climate seem to be at least as large as TSI effects. A factor of 2-4 (X TSI) seems completely plausible to me, and serious arguments have been presented for even higher values. I also note here that almost all estimates of ECS/TCR from observations do not include any allowances for uncertainties associated with solar indirect effects. Scafetta (2013) included solar indirect effects in an estimate of ECS, and determined an ECS value of 1.35 oC.

Neither the effects of AMO or solar indirect effects have been included in attribution analyses of warming since 1950.

So why does this analysis ‘matter’?

  • For those that are urgently worried about the impacts of AGW and the need to act urgently to meet deadlines related to emissions, the natural climate variability may help slow down the warming over the next few decades, allowing for time to make prudent, cost effective decisions that make sense for the long term.
  • Failure to anticipate and understand periods of stagnant warming or even cooling detract from the credibility of climate science and may diminish the ‘will to act.’

I look forward to your comments.  I encourage you to critique and check my numbers, especially related to solar.


229 responses to “Plausible scenarios for climate change: 2020-2050

  1. Steinar Midtskogen

    I think it will be very interesting to follow the arctic ice extent towards 2050. Since the good data is based on the satellite record, which began when the AMO shifted into the warming regime, it has been difficult to attribute the ice loss correctly.

    It will also be interesting to see how temperatures in Svalbard will behave, in particular the winter temperatures. In the late 30’s Birkeland and Hesselberg noted that winter temperatures had risen about 6C in just a couple of decades (before winters cooled again), and there was a similar warming between 1995 – 2015. Will history repeat?

    Their 1940 paper can be found here, by the way:
    http://www.ngfweb.no/docs/NGF_GP_Vol14_no4.pdf

    An interesting read in the light of what we now know (and don’t know) about the NAO and AMO, for those who can read German.

    Now, these variations are somewhat local and have limited impact globally, but what happens next in the arctic should tell us something about the polar amplification of global warming. It may not be as clear as some seem to think.

    • Agreed. I’ll have a follow-up analysis to the stadium wave perspective on Arctic sea ice extent, but seems to be following in lockstep. Seems that we have passed the minimum in the Bering Sea, with the minima moving on to the eastern Arctic. Shift to cold AMO will be game changer for sea ice in the Western Arctic (and also for Greenland mass balance).

      • Steinar Midtskogen

        It’s worth noting that sea ice around Spitsbergen this winter, as well as temperatures, seem more like the 1990’s than it has been since (in spite of a very positive NAO this winter). It’s of course too early to tell whether this is a sign of a trend shift.

        Every single month since 2010 or so at Svalbard airport has been above average (110 consecutive months, I believe). Now, this is the cold 1961-1990 average, and next year “normal” weather will be the warm 1991-2020 average. If this reference shift coincides with a climate trend shift, there will be much “colder than average” weather up there towards 2050. I think the 1961-1990 climate reference has made the polar amplification of global warming seem larger than it actually is.

  2. Coming from a biological/medical background, I have been wondering: Do you think the Earth acts according to a positive or negative feedback system? In other words, could higher global temperatures set off or signal volcanic activity/eruptions while lower temperatures mitigate eruptions? In this way, an average temperature is maintained.

    I realize this is simplistic, but it has crossed my mind.

    • caffeine withdrawals

      If what JC says is correct, then the climate’s net feedback is slightly positive.

  3. Surface warming across the first two decades of the 21st century was ~0.2°C/decade, as people can confirm with sources such as:

    http://www.ysbl.york.ac.uk/~cowtan/applets/trend/trend.html
    https://www.esrl.noaa.gov/psd/cgi-bin/data/testdap/timeseries.pl
    http://climexp.knmi.nl/select.cgi?id=someone@somewhere&field=cmst
    https://climexp.knmi.nl/selectindex.cgi?id=someone@somewhere

    As the 2018 IPCC Special Report notes:

    “Estimated anthropogenic global warming matches the level of observed warming to within ±20% (likely range). Estimated anthropogenic global warming is currently increasing at 0.2°C (likely between 0.1°C and 0.3°C) per decade due to past and ongoing emissions (high confidence).”
    https://www.ipcc.ch/site/assets/uploads/sites/2/2019/06/SR15_Full_Report_High_Res.pdf

    This flies in the face of previous claims you’ve made, where you said 0.2°C/decade was not a good bet. Yet in your post, you simply move the goalposts to 2020 – 2050, without examining how your claims fared for the 1997 – 2019, 2000 – 2019, and 2002 – 2019 time-periods. In casting doubt on the ~0.2°C/decade forecast (which you called “the AGW dominated prediction”), you used the same line you’re using now: ‘natural factors will stop the warming trend from reaching that level’. But that idea of your’s failed, to the point that you’re now including ~0.2°C/decade in your range of “plausible” scenarios, as per your table 6 (i.e. 0.7°C for 2020 – 2050).

    So if your predictions for the past failed, why should people rely on your claims for the future?
    Why shouldn’t they think you’re again under-estimating the magnitude greenhouse-gas-induced AGW, as per “the AGW dominated prediction”?

    I’ll leave folks with an alternative projection from the heavily-cited climate scientist Veerabhadran Ramanathan, along with your previous claims:

    https://twitter.com/AtomsksSanakan/status/1227843565704896514

    “Yes, but the very small positive trend is not consistent with the expectation of 0.2C/decade provided by the IPCC AR4. In terms of anticipating temperature change in the coming decades, the AGW dominated prediction of 0.2C/decade does not seem like a good bet, particularly with the prospect of reduced solar radiation.”
    https://judithcurry.com/2012/02/07/trends-change-points-hypotheses/

    “However these data end up being analyzed, the trend since 1997 is very small, much smaller than the decadal trend of 0.2C that we have been led to expect by the IPCC for the early part of the 21st century.”
    https://judithcurry.com/2012/10/21/sunday-mail-again/

    “This pause in warming is at odds with the 2007 IPCC report, which expected warming to increase at a rate of 0.2 degrees Celsius per decade in the early 21st century. The warming hiatus, combined with assessments that the climate-model sensitivities are too high, raises serious questions as to whether the climate-model projections of 21st century temperatures are fit for making public policy decisions.”
    https://judithcurry.com/2014/10/09/my-op-ed-in-the-wall-street-journal-is-now-online/

    “Attention in the public debate seems to be moving away from the 15-17 yr ‘pause’ to the cooling since 2002 (note: I am receiving inquiries about this from journalists). This period since 2002 is scientifically interesting, since it coincides with the ‘climate shift’ circa 2001/2002 posited by Tsonis and others. This shift and the subsequent slight cooling trend provides a rationale for inferring a slight cooling trend over the next decade or so, rather than a flat trend from the 15 yr ‘pause’.”
    https://judithcurry.com/2013/06/14/week-in-review-3/

    “A year earlier, Jan 2011, I made it pretty clear that I supported Tsonis’ argument regarding climate shifts and a flat temperature trend for the next few decades […].”
    https://judithcurry.com/2013/07/27/the-97-consensus-part-ii/#comment-353668

    • The jury is still out on the impact of the 2015/2016 ENSO and positive bubble of Pacific Decadal Variability on the multi-decadal trends. The stadium wave analysis and analysis of Tsonis et al. does not purport to ‘predict’ very short term climate variability.

      My new essay is about a range of possible scenarios for the next 30 years.

      • Re: “My new essay is about a range of possible scenarios for the next 30 years.”

        I know. But if you were wrong in your predictions of past trends, then that undermines the credibility of your subsequent forecasts. You tacitly admit this, since (as I showed in my previous comment) you pointed to supposed failures of past IPCC forecasts to undermine the credibility of their subsequent forecasts. Well, if it’s OK for you to do that to the IPCC for the better part of a decade, then it’s OK for me to do it to you now.

        Re: “The jury is still out on the impact of the 2015/2016 ENSO and positive bubble of Pacific Decadal Variability on the multi-decadal trends.”

        The 2015/2016 El Nino is long-gone; it’s 2020 now, not 2016. A post-1997 AGW-induced warming effect remains, even after subtracting out the effect of ENSO and other factors. That’s been shown over and over in the literature. Some examples (the first 3 papers listed being better than the last 2):

        https://www.carbonbrief.org/guest-post-why-natural-cycles-only-play-small-role-in-rate-of-global-warming
        “A limited role for unforced internal variability in twentieth-century warming”
        “Causes of irregularities in trends of global mean surface temperature since the late 19th century”
        “Observation-based detection and attribution of 21st century climate change”
        “The life and death of the recent global surface warming hiatus parsimoniously explained”
        “The extreme El Niño of 2015–2016 and the end of global warming hiatus”

        Re: ” The stadium wave analysis and analysis of Tsonis et al. does not purport to ‘predict’ very short term climate variability.”

        Tsonis is reported as saying the warming of 1980s and 1990s was over. He was wrong, since warming continued through the 2000s and 2010s at around the same rate as the 1980s + 1990s (possibly at a greater rate). And it makes no sense to claim that the 2000s + 2010s are “short term”, while the 1980s + 1990s aren’t.

        “We are already in a cooling trend, which I think will continue for the next 15 years at least. There is no doubt the warming of the 1980s and 1990s has stopped.”
        https://www.telegraph.co.uk/news/earth/environment/climatechange/10294082/Global-warming-No-actually-were-cooling-claim-scientists.html

        Also, when in 2014 you compared the IPCC’s view to the stadium wave analysis and the analysis of Tsonis et al., you said the IPCC view predicted that the “hiatus” would end with the next El Nino. So your previous appeal to the 2015/2016 El Nino is actually a tacit admission the IPCC was right in comparison:

        “Implications for the future: I. IPCC AR5 view
        .
        The hiatus will end soon, with the next El Nino”

        https://judithcurry.com/2014/03/04/causes-and-implications-of-the-pause/

        I’ve done my homework on your position; that’s how I know you’re wrong. Anyway, I’ve got other stuff to do, so I’ll be away for awhile.

      • Last response to this line of comments. Any climatic trend that is dominated by a single very large event associated with natural variability (e.g. major volcanic eruption, super El Nino) is not usefully interpreted as having anything to do with AGW.

        The underlying AGW trend is usefully evaluated by looking at the trend connecting the two large El Nino events (1998, 2016), with factoring out any solar and volcanic forcing. This eliminates strong ENSO events as a factor, and both are within a warm AMO phase.

      • If it’s a 12-man jury, at least 9 have already voted as 2019 is the 2nd warmest year, which means AGW has largely replaced the 15-16 El Niño warming and that portion can no longer be the cause of warming to 2nd place. There’s a little sliver of 15-16 El Niño left, and it will expire soon.

      • There has been a bubble of (warm) Pacific decadal variability since 2015, when that diminishes or turns cold, I will re-evaluate.

      • Tsonis was concerned with changes in the dynamical Earth system – climate shifts on decadal scales that determined the trajectory of surface temperature variability. It is an Earth system paradigm more correct – and with such broad scientific support – in ways that are far beyond the statistically questionable trends and semantic tricks dreamed of in Atomski’s linear world.

        Post hiatus heat in oceans – caused by SST/cloud feedback predominantly – doesn’t dissipate overnight – especially with sun warmed SST in a quiescent Pacific Ocean.

        https://watertechbyrie.files.wordpress.com/2020/01/ceres_ebaf-toa_ed4.1_anom_toa_shortwave_flux-all-sky_march-2000tojune-2019.png

      • https://i.imgur.com/DqHhzpM.png

        The 15-16 El Niño to the GMST to 102, GISS. The that was lost. Gone to space. Can’t come back. A great deal of the energy that took the GMST back to 98 in 2019 cannot have come from the 15-16 El Niño. It is subsequent to that.

        And it worked it’s way back to 98 with not a lot of help from the PDO:

        https://i.imgur.com/ltaaNOv.png

      • It might help if you could manage to put together a coherent sentence. Maybe not. Net up is warming – and it is all in SW.

        https://watertechbyrie.files.wordpress.com/2020/01/ceres_ebaf-toa_ed4.1_anom_toa_net_flux-all-sky_march-2000tojune-2019.png

      • (yes, robert, can’t imagine that it makes a difference whether he’s coherent or not)…

      • The ’16 nino has come and gone, however, it was replaced by a predicted nino at the solar min. (predicted by the one and only javier, denizen here at Climate, Etc) Give it time. No one here’s going anywhere for a while. Grab a snickers — wait, watch & see just how warm (or cool) the 2020s will be…

      • Re: “Last response to this line of comments. Any climatic trend that is dominated by a single very large event associated with natural variability (e.g. major volcanic eruption, super El Nino) is not usefully interpreted as having anything to do with AGW.
        The underlying AGW trend is usefully evaluated by looking at the trend connecting the two large El Nino events (1998, 2016), with factoring out any solar and volcanic forcing. This eliminates strong ENSO events as a factor, and both are within a warm AMO phase.”

        I already cited peer-reviewed sources to you that removed the effect of ENSO, solar forcing, and volcanic forcing; after correcting for those factors, the underlying AGW trend continues, including post-1998. So you’re literally asking for something that was already given to you.

        If you’re not going to address those peer-reviewed analyses, then tamino (Grant Foster) has shown the same thing elsewhere, with a warming trend of 0.19°C/decade both before and after adjustments:

        https://tamino.files.wordpress.com/2020/01/nasa_adj.jpg
        https://tamino.files.wordpress.com/2020/01/exo3.jpg
        [ https://tamino.wordpress.com/2020/01/16/2-of-global-warming-since-1979-due-to-other-things/ ; update to: “Global temperature evolution 1979–2010”]

        Re: “There has been a bubble of (warm) Pacific decadal variability since 2015, when that diminishes or turns cold, I will re-evaluate.”

        You’re moving the goalposts in an inconsistent manner:

        You were happy to claims there was a pause in warming when you cherry-picked warm El Nino years like 1997/1998 and 2001/2002 as your start-points, while ending your trend on cooler La Nina years. Yet now all of a sudden, you want to wait for climate variability to stabilize before looking at trends.

        You claimed you would evaluate the trends in 2021 (even though you were perfectly willing to claim a pause even earlier, in at least 2011 or 2012). Yet you’ve now moved the time of evaluation back to an unspecified date in which a “a bubble of (warm) Pacific decadal variability […] diminishes or turns cold”. Maybe by then people like me will be gone, so no one will remain to make sure you address your false predictions?

        “I’ve stated before that it will be another 5 years before we have the appropriate prospective on the current temperature fluctuations and whether or not the early 21st century pause is over.”
        https://judithcurry.com/2016/03/06/end-of-the-satellite-data-pause/

        You said that it was “climate model apostles” you wanted to ask for more time to pass before model-based projections were assessed. You complained that the moved the goalposts from 10, to 15, to 17 years. Yet here you are, moving the goalposts beyond 22 years (from the beginning of 1998 past the end of 2019) before you address the continuing warming trend that debunked your forecasts. Would the ‘Judith Curry apostles’ be happy with that?

        “I understand that 15 years is too short, but the climate model apostles told us not to expect a pause longer than 10 years, then 15 years, then 17 years. Looks like this one might go another two decades.”
        https://judithcurry.com/2013/07/27/the-97-consensus-part-ii/#comment-353549

      • This:

        “You said that it was “climate model apostles” you wanted to ask for more time to pass before model-based projections were assessed. You complained that the moved the goalposts from 10, to 15, to 17 years.”

        Was meant to be:

        “You said that it was “climate model apostles” who wanted to ask for more time to pass before model-based projections were assessed. You complained that they moved the goalposts from 10, to 15, to 17 years.”

      • It is more the Pacific Ocean state than ENSO. Gives global cooling in IR offset by warming in SW in CERES data.

        https://www.mdpi.com/climate/climate-06-00062/article_deploy/html/images/climate-06-00062-g002-550.jpg
        https://www.mdpi.com/2225-1154/6/3/62

        The comment linked was a playful response to the comment quoted below from JCH. But Atomski is as intransigent. “The idea that the science of climate change is largely “settled,” common among policy makers and environmentalists but not among the climate science community, has congealed into the view that the outlines and dimension of anthropogenic climate change are understood and that incremental improvement to and application of the tools used to establish this outline are sufficient to provide society with the scientific basis for dealing with climate change.” (Palmer and Stevens 2019) He could indeed be a case study for a congealed and horrendously simplistic consensus communicated in an adversarial manner dripping with condescending denigration.

        Nothing is bad for climate science. It’s the biggest winner in global history.

        As for Schneider, he’s one of the 20 smartest men in the world. Of course, the smartest man in the world hangs out here. And with as little domain knowledge beyond narrow talking points repeated ad nauseum. .

        I suspect what he would say is, he’s talking about low clouds in the eastern Pacific that are far far away from the Arctic Ocean, and that the arctic situation is very different for a several reason. So a couple: one, the sun almost disappears; two, there is this white chit up there.

        Just a few more months. New low cloud study out of humungous (sic) computer. that will rock the boat. Sorry, he’s going to be right. JCH

        With Pacific states modulating the global energy dynamic over decades to millennia – it is more a matter of some bits of science being better than others. And having the capacity to discern the difference.

        https://judithcurry.com/2020/01/25/week-in-review-science-edition-117/#comment-909485

        It was – btw – from memory – 40 smartest people (not – OMG – men) under 40 in some magazine or other. What rocks are these people hiding under?

    • Atomsk’s Sanakan: Yet in your post, you simply move the goalposts to 2020 – 2050,

      “Time marches on.” In February 2020, the 2020-2050 ca 30 year epoch is highly relevant for anticipating and planning for 2050 – 2100.

  4. Here’s a wild thought: Given the catastrophic effects of signifiant cooling (mass starvation), does increased CO2 act as “insurance” against it? In that sense is more CO2 a (net) good thing?

    • plants die off altogether at 150 ppm co2 and works best at 1500 ppm co2.
      at the depth at the last glacial period earth hit an all time low of 180 ppm co2, a hair short of extinct all complex life on earth.
      co2 has been on a gradual decline for hundreds of millions of years,
      and is destined to drop to exctinction levels without human interference,
      i.e recycle co2 back into the atmosphere where it belong,
      to levels that the plants evolved to.
      so in that sense, its a good thing to have a good safety margin.

      earth history has seen a correlation as well as an inverse correlation
      stretching for hundred million years in a row, thus it can be concluded that co2 is not a major factor in earth climate, and it can also be concluded that there is no feedback in either direction,
      or else temp and co2 would not both diverge nor converge for 100 million years in a row, ergo co2 makes no significant difference for climate,
      but it does make a significant difference for plants. http://www.biocab.org/carbon_dioxide_geological_timescale.html

      • Libor Zurek

        “earth history has seen a correlation as well as an inverse correlation
        stretching for hundred million years in a row, thus it can be concluded that co2 is not a major factor in earth climate, and it can also be concluded that there is no feedback in either direction,
        or else temp and co2 would not both diverge nor converge for 100 million years in a row, ergo co2 makes no significant difference for climate,”
        No such things can be concluded. If I push car in one direction on flat road, and no other forces will be involved at that time, I would be the dominant force moving the car. But if the road slopes, if someone else starts pushing in opposite direction, i car breaks engage, or the truck rams the car in the opposite direction, not only will I not be the dominant force but I may well be smashed.

  5. I read elsewhere today that planting vast amounts of trees – 1.2 trillion are reportedly planned – could also be a fourth long-term cooling factor. Above you mention three such factors, that may each trend toward cooling. The ‘trees effect’ is said to be due to a combination of dark albedo and evaporation effects, and this is said to be well-documented in the literature. Could tree planting on such a scale be an important factor to be considered, or is it more likely to be swamped by other factors? Or is the science on it just too uncertain to say one way or the other?

    • David
      Prior to human tree and vegetation removal natural forests and plant cover was as extensive as it could possibly be.
      Temperatures during this interglacial were higher than current, so the tree and global temperature theory has little substance.
      Regards

    • Abe say where you want to plant all these trees?

      God say do it out on Highway 61.

      Abe say “whut?”

  6. stevefitzpatrick

    Hi judith,
    I suspect there will be doubts among many who work in climate science about the potential of ocean and solar cooling effects.
    If you ignore the potential contributions from ocean and solar effects, a simple extapolation:
    http://www.woodfortrees.org/plot/hadcrut4gl/from:1970/mean:13/plot/hadcrut4gl/from:1970/trend
    suggests somewhere near 0.17C per decade (or near 0.51C higher by 2050). It could be 0.1C or 0.2C lower than that, based on the recent lack of volcanoes, but any greater cooling would take exceptional volcanic activity. So 0.3C to 0.51C warmer by 2050 would be my most defensible guess. Of course, predicting is hard…. especially about the future.

    • stevenreincarnated

      I don’t see why there should be doubts as to how much cooling a change in ocean heat transport can cause when so many studies have been done on it using their models. Basically at least as much cooling as we have experienced warming can be achieved fairly easily.

  7. If I may, from a broad perspective we really do not have a good handle on the trajectory of the planet’s climate. Yet we are suppose to spend trillions of dollars on CO2 mitigation?
    I smell a rat. Strikes me a lot of folks are jumping on the climate-change band wagon to unjustly enrich themselves.
    A more reasonable approach lies with the prudent use of energy, with economics the key driver. Yields a middle-of-the-road approach that inherently reduces emissions without bankrupting the poor and middle class.

    • Mike, you have hit the the issue squarely on its head. The principle driver that underpins the polarization between a true climate science community and a highly politicized climate science community is the manipulated redirection of massive capital expenditures at the behest of the IPCC’s fear based climate change projections. All becomes clear when you follow the money.

  8. As a layman I follow the sea ice extent https://wp.me/p6gnn1-5Az and it seems to recover from low values in recent years. Nevertheless, ecologists say that it is a result of fresh water from icebergs diluting the salty sea so that it freezes at higher temperature. Can partial recovery of sea ice be an ominous sign?

  9. Can this article be obtained as a pdf or other format document please?

  10. JC, I had no idea you were working on such a post and didn’t expect it. I especially like table 6 (although IMO it underestimates solar, but that’s neither here nor there). Thanks and bravo for this terrific work!!

  11. Without another Kimikamikaze, natural variability has no chance of stalling anthropogenic global warming.

    • Jch

      Don’t forget that in his 2005 paper about the extremely cold 1740 winter which followed the rapidly warming period from 1695 Phil jones admitted that natural variability was much greater than he had hitherto realised

      Tonyb

      • People can be wrong about their realizations. We just went through the stadium wave. Whatever happened, it immediately vanished.

      • Jch

        These particular realisations are backed up by instrumental records and numerous historical documents

        Tonyb

      • I suppose it depends on interpretation
        https://archive.epa.gov/epa/sites/production/files/styles/medium/public/2016-07/models-observed-human-natural.png
        Earth’s temperature is a balancing act

        Graph displaying that models accounting solely for natural factors understate current climate trends by ~1 degree F, compared to models that include human factors, which accurately predict observed temperatures.Models that account only for the effects of natural processes are not able to explain the warming observed over the past century. Models that also account for the greenhouse gases emitted by humans are able to explain this warming.

        Click the image to view a larger version.Earth’s temperature depends on the balance between energy entering and leaving the planet’s system. When incoming energy from the sun is absorbed by the Earth system, Earth warms. When the sun’s energy is reflected back into space, Earth avoids warming. When absorbed energy is released back into space, Earth cools. Many factors, both natural and human, can cause changes in Earth’s energy balance, including:

        Variations in the sun’s energy reaching Earth
        Changes in the reflectivity of Earth’s atmosphere and surface
        Changes in the greenhouse effect, which affects the amount of heat retained by Earth’s atmosphere

        These factors have caused Earth’s climate to change many times.

        Scientists have pieced together a record of Earth’s climate, dating back hundreds of thousands of years (and, in some cases, millions or hundreds of millions of years), by analyzing a number of indirect measures of climate such as ice cores, tree rings, glacier lengths, pollen remains, and ocean sediments, and by studying changes in Earth’s orbit around the sun.[2]

        This record shows that the climate system varies naturally over a wide range of time scales. In general, climate changes prior to the Industrial Revolution in the 1700s can be explained by natural causes, such as changes in solar energy, volcanic eruptions, and natural changes in greenhouse gas (GHG) concentrations.[2]

        Recent climate changes, however, cannot be explained by natural causes alone. Research indicates that natural causes do not explain most observed warming, especially warming since the mid-20th century. Rather, it is extremely likely that human activities have been the dominant cause of that warming.[2]

      • With ACO2 at ~265 ppm, NV can push it around a bit. Getting pretty clear with ACO2 at ~`400 ppm, NV is a bit punch drunk. The GMST has not experienced a good old-fashioned cooling since 1905.

      • ordvic: Graph displaying that models accounting solely for natural factors understate current climate trends by ~1 degree F, compared to models that include human factors, which accurately predict observed temperatures.Models that account only for the effects of natural processes are not able to explain the warming observed over the past century. Models that also account for the greenhouse gases emitted by humans are able to explain this warming.

        The question addressed by Judith Curry is whether the natural processes have been adequately/accurately represented in the models. And by implication, whether the effects of CO2 have been accurately accounted for.

    • JCH, You said: “With ACO2 at ~265 ppm, NV can push it around a bit. Getting pretty clear with ACO2 at ~`400 ppm, NV is a bit punch drunk. The GMST has not experienced a good old-fashioned cooling since 1905.”

      According to all the sources I’ve seen 1940 to 1977 was a cooling period:
      https://images.newscientist.com/wp-content/uploads/2007/05/dn11639-2_800.jpg?width=778

      • ordvic, its not so much interpretation as it is the starting point of a graph,
        we have measured temperature data since 1659,
        so theres no valid reason to start a graph later when trying
        to display a correlation between temp & co2,
        but there is an invalid reason, if you wish to hide the fact that earth
        has been recovering from the depth of minor ice age,
        and instead are pushing for a hypothesis that as co2 rises, so does temperature. here is a more through rough graph on the recovery
        and the relation with co2 in that recovery https://c3headlines.typepad.com/.a/6a010536b58035970c0120a7c87805970b-pi

  12. Ireneusz Palmowski

    The weakening of the geomagnetic field in the Western Hemisphere has a pronounced effect on winter temperatures in North America during low solar activity. This can be seen in the temperature difference in winter in North America and Europe.
    In June 2014, after just six months collecting data, Swarm confirmed the general trend of the field’s weakening, with the most dramatic declines over the Western Hemisphere. But in other areas, such as the southern Indian Ocean, the magnetic field had strengthened since January. The measurements also confirmed the movement of magnetic North towards Siberia. These changes are based on the magnetic signals stemming from Earth’s core.
    http://www.esa.int/var/esa/storage/images/esa_multimedia/images/2014/06/magnetic_field_changes/14582173-1-eng-GB/Magnetic_field_changes_pillars.jpg
    http://www.esa.int/ESA_Multimedia/Images/2014/06/Magnetic_field_changes

  13. Ireneusz Palmowski

    The level of galactic radiation is currently close to the level of 2009.
    https://cosmicrays.oulu.fi/webform/monitor.gif

  14. Ireneusz Palmowski

    In North America, strong stratospheric intrusions may be associated with a weakening of the geomagnetic field.
    https://www.cpc.ncep.noaa.gov/products/stratosphere/strat_int/gif_files/gfs_o3mr_150_NA_f000.png
    https://www.cpc.ncep.noaa.gov/products/stratosphere/strat_int/

  15. Judith Curry: we lose sight of the fact that we have a better baseline period – now.

    Excellent! I think that needs to be repeated often.

    Thank you for a good essay.

  16. A brilliant analysis and summary!

    Question to Judy or others: It is often said that the MWP was only a “regional” and not a global event and hence doesn’t show up e.g. in the latest PAGES2K graph.

    Is this generally accepted or contested, and does it matter for judging modern warming and the possible role of solar indirect effects?

  17. Ireneusz Palmowski

    In periods of very low solar activity, latitudinal circulation is blocked in the Pacific both at high latitudes and at the equator.
    https://www.cpc.ncep.noaa.gov/products/precip/CWlink/blocking/real_time_nh/500gz_anomalies_nh.gif
    http://www.bom.gov.au/archive/oceanography/ocean_anals/IDYOC007/IDYOC007.202002.gif

  18. Ireneusz Palmowski

    This is the circulation in the polar vortex in the central stratosphere.
    https://earth.nullschool.net/#2020/02/13/2100Z/wind/isobaric/10hPa/orthographic=-111.83,68.02,448

  19. Judith Curry, Upon rereading this, and the comments to date and your responses, I do think that this is a fine essay. If you do assemble a full reference list, I hope that you will add it into the pdf from this essay, and post the full pdf on an accessible place like ResearchGate while you shepherd it through review and publication in a journal. It would make a good “perspective” piece for Science Magazine, imo, but I recall you told us that you had withdrawn from AAAS.

  20. Reblogged this on Climate Collections.

  21. Most analyses have identified Atlantic Multidecadal Variability as having the dominant imprint on global and Northern Hemisphere temperatures. Identification of ENSO as a driver of global mean temperature variations or response signal remains contentious, with conflicting results.

    Is there coupled ocean and atmosphere chaotic spatio-temporal pattern too far? Most recent – and certainly post hiatus – ocean and atmospheric warming is associated with SST in the tropical and subtropical oceans and positive marine boundary level stratocumlus feedback. Large changes in TOA radiant flux from changes in ocean and atmospheric circulation (Loeb et al 2012) driven by solar modulated – in part – polar annular modes (Lockwood et al 2010, Ineson et al 2015, Lam et al 2014). A working theory called the gyre hypothesis (Oviatt et al 2015).

    The latest Pacific Ocean climate shift in 1998/2001 is linked to increased flow in the north (Di Lorenzo et al, 2008) and the south (Roemmich et al, 2007, Qiu, Bo et al 2006) Pacific Ocean gyres. Roemmich et al (2007) suggest that mid-latitude gyres in all of the oceans are influenced by decadal variability in the Southern and Northern Annular Modes (SAM and NAM respectively) as wind driven currents in baroclinic oceans (Sverdrup, 1947).

    We find a marked 0.83 ± 0.41 Wm−2 reduction in global mean reflected shortwave (SW) top-of-atmosphere (TOA) flux during the three years following the hiatus that results in an increase in net energy into the climate system. A partial radiative perturbation analysis reveals that decreases in low cloud cover are the primary driver of the decrease in SW TOA flux. The regional distribution of the SW TOA flux changes associated with the decreases in low cloud cover closely matches that of sea-surface temperature warming, which shows a pattern typical of the positive phase of the Pacific Decadal Oscillation. Large reductions in clear-sky SW TOA flux are also found over much of the Pacific and Atlantic Oceans in the northern hemisphere. These are associated with a reduction in aerosol optical depth consistent with stricter pollution controls in China and North America. A simple energy budget framework is used to show that TOA radiation (particularly in the SW) likely played a dominant role in driving the marked increase in temperature tendency during the post-hiatus period.

    The dynamical Earth system paradigm suggests that the system is pushed by greenhouse gas changes and warming – as well as solar intensity and Earth orbital eccentricities – past thresholds at which stage the components start to interact chaotically in multiple and changing negative and positive feedbacks – as tremendous energies cascade through powerful subsystems – cryosphere, lithosphere, hydrosphere and biosphere. Some of these changes have a regularity within broad limits and the planet responds with a broad regularity in changes of ice, cloud, Atlantic thermohaline circulation and ocean and atmospheric circulation. Where these thresholds are – or even what the control variable is in many cases – are unknown and perhaps unknowable.

  22. Pingback: Climate Over The Next Three Decades | Transterrestrial Musings

  23. And none of it makes a jot of difference to pragmatic responses. A multi-gas and aerosol strategy – CFC’s, nitrous oxides, methane, black carbon and sulfate. Ongoing decreases in carbon intensity and increases in efficiency and productivity. Technical innovation across sectors – energy, transport, industry, residential and agriculture and forestry. Building societal resilience to natural disasters. Reclaiming deserts and conserving and restoring savanna, forest, woodlands, wetlands and soils.

    Of these new ‘Shared Socioeconomic Pathways’ – No. 5 – intended I suppose as a cautionary tale – a high emission scenario – is closest to the spirit of economic and democratic freedom.

    SSP5 Fossil-fueled Development – Taking the Highway (High challenges to mitigation, low challenges to adaptation)

    This world places increasing faith in competitive markets, innovation and participatory societies to produce rapid technological progress and development of human capital as the path to sustainable development. Global markets are increasingly integrated. There are also strong investments in health, education, and institutions to enhance human and social capital. At the same time, the push for economic and social development is coupled with the exploitation of abundant fossil fuel resources and the adoption of resource and energy intensive lifestyles around the world. All these factors lead to rapid growth of the global economy, while global population peaks and declines in the 21st century. Local environmental problems like air pollution are successfully managed. There is faith in the ability to effectively manage social and ecological systems, including by geo-engineering if necessary.

    With the acknowledgement of carbon cowboys and nuclear engines – mitigation is fast tracked.

    https://www.youtube.com/watch?v=HDuwmnME0T0

  24. To my great surprise I learn here that until now the CMIP5 (and CMIP6?) models and scenarios did not incorporate variations of “natural” parameters such as solar activity, oceanic oscillations or volcanic activity.
    Judith’s new estimates will be considered diabolical because they remove the urgency of mitigation actions at any cost.
    All having been focused on GHGs to the exclusion of anything else, one can take the conclusions, projections and recommendations to decision-makers of the IPCC (AR5 SR15L) as lies by deliberate omission or a tremendous global hoax.

  25. CO2 concentration growth is unresponsive to human emissions changes. (https://tambonthongchai.com/2018/12/19/co2responsiveness/ ). The correlation of temperature to cumulative emissions is probably spurious as it is comparing two time series with positive trends for which one can always show correlation.
    CO2 concentrations follow temperature changes on all time scales so nearly all of the recent increase of atmospheric CO2 can be attributed to recent warming (since the little ice age) . It seems that a better estimate of CO2 forcing would be to fit the Keeling curve and project that to 2050. That curve could be considered an upper bound for anticipated CO2.

    • https://i1.wp.com/i90.photobucket.com/albums/k247/dhm1353/Law17511960.png

      CO2 levels rose 20ppm from 1750 to 1900 while cumulative emissions were only 5ppm over the same period. Whatever we were doing land usage wise over that 150 year period, you could probably double or triple that (at least) over the last 120 years. Land usage could easily account for half of the observed rise in atmospheric carbon dioxide concentrations. (and even more if there’s a temperature component to the rise) Surely, this basic fact should be considered in any analysis of alleged contributions of human emissions.

  26. Need to sell some red hats and need to know what to print on the front– ‘make climate great again,’ or ‘keep climate great.’ what does western science say, recognizing that all western science is, anthropogenic…

  27. A very smart lady once wrote:
    “… reliable prediction of the impact of carbon dioxide on the climate requires that we understand natural climate variability properly. Until we understand natural climate variability better, we cannot reliably infer sensitivity to greenhouse gas forcing …”

    From a layman’s perspective, if the above statement is still true, the word “prediction” should be replaces with SWAG (scientific wild a** guess).

  28. “The individual cumulative emission scenarios between 2020 and 2050 are then translated into a global temperature increase using a range of values of the Transient Climate Response to Cumulative Carbon Emissions (TCRE)”

    The correlation between temperature ans cumulative emissions is spurious. Therefore the regression coefficient of temp against cumulative emissions (the tcre) is illusory. It has no interpretation in the real world. This whole tcre and carbon budget line of inquiry in climate science is statistically flawed and vacuous.

    https://tambonthongchai.com/2018/05/06/tcre/

    https://tambonthongchai.com/2018/12/03/tcruparody/

  29. There is much to know. What’s missing is the courage to do nothing to the economy until we actually know much more. Instead, nihilistic ideologues in Western civilization — mostly in the government-education complex (who only know how to spend the money others have earned) — demand that we hand our future over to them at the expense of our common sense, proven best interests and individual liberty.

    • Actually the way to handle the uncertainty is to invest in low cost policies that will definitely have an impact if there’s a problem, and in low cost ways to increase our policy options when it would be expensive to address the ones we have directly.

      • To determine levels of “cost” y (rather than just “price”) you need to include externalities in your calculations.

      • Externalities invariably degenerate into mud-slinging exercises because the “measurable” tend to be subjective. Stick with items that are not particularly controversial. Simplifies the effort, which I believe is the point of Joshuas suggestion.

      • It happens – ‘The possible effect of climate change on the expansion and fall of Rome has long intrigued historians. Recent developments in the study of modern climates intensify that interest, and conferences, compilations, and monographic studies involving the ancient climate appear at an accelerating rate.’ ~Michael McCormick, et Al.

      • Joshua, yes externalities need to included in both the cost of the interventions and the assessment of the impacts. The point here is that we have a pretty certain cost estimate of the intervention, but a very uncertain value to their impacts.

      • Business as usual is to identify risk and internalize externalities. Ozone depleting chemicals is the perfect example. Here’s another.

        https://watertechbyrie.files.wordpress.com/2014/06/diesel-bc.png

      • RIE internalising externalities simply involves enlarging the boundaries of the system being considered to include previously excluded costs and benefits. It can be done in both static analysis and dynamic analysis (e.g. when forecasting future system states).

        BAU scenarios by and large project a system forward on the basis that a set of assumptions based on current system behavior don’t change. Their link to bringing externalities into an analysis is at best tenuous.

      • ,,. internalising externalities simply involves enlarging the boundaries of the system being considered to include previously excluded costs and benefits. It can be done in both static analysis and dynamic analysis (e.g. when forecasting future system states).M

        You mean like installing anti-pollution equipment? And it is usually best done with nuts and bolts

      • So we’re agreed then, not BAU.

      • I wish people would stop telling me what I agree with.

      • You contribute two non-sequiturs and now you sulk when someone tries to help you clarify your thoughts.

      • Business as usual is just how business is usually done – not something that you define as a term in static or dynamic analytics to seem to appear smarter than you are I presume. Carbon cowboys are defending agriculture from pissant progressives – as an alternative to doing nothing. The nuts and bolts cost of pollution reduction is the real cost of externalities – not hyper inflated paper estimates. Risk management – as I said – is business as usual.

        https://watertechbyrie.files.wordpress.com/2019/06/hele.png

      • HAS –

        > yes externalities need to included in both the cost of the interventions and the assessment of the impacts. The point here is that we have a pretty certain cost estimate of the intervention, but a very uncertain value to their impacts.

        I think it’s misleading to say we know the “cost” of the intervention. We may be close to knowing the “price” but calculating the cost is extremly complicated because it requires pricing externalities (positive and negative)..

        IMO, the big problem is that people assume that the externality ratio is positive, becsuee the benefits of something like access to fossil fuels seems obvious.

        You make similar assumptions when you suggest that it’s easy to determine how to invest in low cost policies.

        My view is that we should be using a principle of avoiding low probability but high damage function risk as a key input variable.

        And even “price” is a fairly useless metric. Who pays the price? What is the price relative to their level of wealth? Those are important questions, imo. That adds an explicit focus on a moral component – but ignoring the moral or philosophical questions doesn’t actually eliminate them from the equation. Imo, they should be addressed in an explicit manner.

      • A multi-gas and aerosol pollution reduction strategy – CFC’s, nitrous oxides, methane, black carbon and sulfate – for which the technology is well advanced in developed economies. Ongoing decreases in carbon intensity and increases in efficiency and productivity. And technical innovation across sectors – energy, transport, industry, residential and agriculture and forestry. Building resilience to weather extremes whatever the cause. Reclaiming deserts and conserving and restoring savanna, woodland, forest and wetland. Pragmatic responses are obvious.

        https://watertechbyrie.files.wordpress.com/2017/06/hele-e1550170804379.jpg

        Today, over one billion people around the world—five hundred million of them in sub-Saharan Africa alone—lack access to electricity. Nearly three billion people cook over open fires fueled by wood, dung, coal, or charcoal. This energy poverty presents a significant hurdle to achieving development goals of health, prosperity, and a livable environment.

        The relationship between access to modern energy services and quality of life is well established. Affordable and reliable grid electricity allows factory owners to increase output and hire more workers. Electricity allows hospitals to refrigerate lifesaving vaccines and power medical equipment. It liberates children and women from manual labor. Societies that are able to meet their energy needs become wealthier, more resilient, and better able to navigate social and environmental hazards like climate change and natural disasters. https://thebreakthrough.org/articles/our-high-energy-planet

        Low cost and low carbon electricity technology is emerging – however – in the decades to 2050 nations will access the cheapest and most reliable power to deliver their development needs. In many places in the world this is high efficiency/low emission (HELE) coal technology – ultra low polluting and in accord their Paris NDC’s.

      • Joshua I did a response and seemed to have lost it, so if it appears forgive two replys. The quick version is I don’t disagree that both costs and benefits are hard to assess because of externalities, but my point was future uncertain impacts are even harder to assess properly than today’s costs.

        What is often ignored is the value of delay in making decisions like this. Wait til 2030 and we’ll be better able to judge future impacts. This may avoid unnecessary action, but we may have lost a decade in doing something if that’s necessary. To deal with this we should do today what we can justify (e.g. energy efficiency often pays for itself), but also invest in low cost actions (e.g. monitoring systems) that will help us act if everything does turn to custard, i.e. we should act to increase our options in the face of the uncertainty.

      • HAS –

        > but also invest in low cost actions (e.g. monitoring systems) that will help us act if everything does turn to custard.

        I like this. Yes, I would agree that is a rather straight forward cost to assess. I.e., not much potential for external costs from putting a monitoring system online.

        I think we can agree that such straight-forward low cost steps would be an obvious target – and possibly a momentum creating bipartisan pathway for diffusing the diametric pulls of ideological energies that characterize the climate policy space.

        But at the risk of repeating myself, I often see people conflating cost and price, as if they’re one and the same – i.e., as if externalities don’t exist – which can mean that the putatively low or high price (typically fossil fuels and renewables, respectively) doesn’t actually reflect true costs (because they haven’t been internalized into price). It’s a pet peeve.

        So then, IMO, it’s a matter of balancing the tension along two axes. The first is the axis of tension between acting too soon and incurring costs that will prove unnecessary in the long run, and waiting to the point where addressing risk becomes much more expensive because of the delay. The second is the related axis of tension between taking small steps because they are clearly low cost, and not taking steps where costs are unknown (largely because the ratio of positive to negative externalities is effectively incalculable) but which would target low probability/high damage risk.

      • Where we likely diverge us the point at which “justification” is necessary, or how it is defined.

        Is buying a service contract for my new dishwasher justified? I know that the law of averages tells me no, otherwise Lowe’s wouldn’t be offering to sell it to me. But sometimes, to hedge against low probability/high damage risk, I buy such insurance.

        But imagine a scenario where buying such insurance became a polarizing, ideological cleavage point. One group, the red clad anti-insurancers call anyone buying such insurance Chicken Littles. And the blue clad pro-insurancers attacked insurance-rejecters for being indifferent to the children who might have to eat off of dirty dishes.

        There are inherent tensions here with no right and no wrong. We can account for a variety of factors when we evaluate justifisbility, and we can reasonably weight those factors in a variety of ways. The problem I see is when people weaponize the tension to advance a tribal agenda.

      • No real disagreement from me on this. The point is that different people have different risk preferences, so will weight the options differently. In pluralistic democratic societies we use the democratic process to help make those tradeoffs when the consequence impact on us all (dishwashers we can each pick our own risk).

        But we should at least try and reduce the uncertainties caused by imperfect information. I also do think building a consensus on the obvious stuff and improving options is likely to be much easier, even if some would prefer we bet the farm or others to completely ignore what could be happening.

      • “The old climate framework failed because it would have imposed substantial costs associated with climate mitigation policies on developed nations today in exchange for climate benefits far off in the future — benefits whose attributes, magnitude, timing, and distribution are not knowable with certainty. Since they risked slowing economic growth in many emerging economies, efforts to extend the Kyoto-style UNFCCC framework to developing nations predictably deadlocked as well.” https://thebreakthrough.org/articles/climate-pragmatism-innovation

        HAS and Joshua may agree on unicorns all they like.

      • > “The old climate framework failed because it would have imposed substantial costs associated with climate mitigation policies on developed nations today in exchange for climate benefits far off in the future —

        If you’re going to invoke my name in a response, then you might at least actually address the points I raised. This statement ignores the difference I spoke of between cost and price, and the issue of externalities.

        > Since they risked slowing economic growth in many emerging economies,

        That risk is a direct function of the will of developed economies – which can choose to mitigate any such risk. Risks to emerging economies can and do come from many sources, outside of “the old climate framework.” Developed economies chose to not mitigate or hedge those risks on a day to day basis. It is a fallacy to argue as if risks to emerging countries were a direct function of “the old climate framework.” And the descriptor of “failed” is a false binary. The “old climate framework” has arguably produced marginal gains that would be absent without that framework. It is unclear that a different “climate framework” would have been likely to be implemented, let alone more effective in terms of outcomes.

      • HAS –

        > In pluralistic democratic societies we use the democratic process to help make those tradeoffs when the consequence impact on us all (dishwashers we can each pick our own risk).

        I offer two caveats there. 1) our pluralistic democracy is corrupted by powerful entities that buy influence and, 2) there are known problems in how humans address risk, in particular long time-horizon, low probability high damage risk, and particularly if that risk has absorbed the energy of polarized identity warfare.

        Just leaving it in the hands of OUR imperfect pluralistic democracy – in its current polarized state – seems to me will end up in meaningful action, either to mitigate risk or empower consensus processes, only at the point when/if the signal of the threat manifests absolutely unambiguously in the day to day lives of citizens of wealthy nations. At that point, the people facing those conditions will have to hope isn’t to late.

      • One can very usefully ignore each and any of Joshua’s points. But in fact I haven’t ignored his cost and price construct gleaned from endless days on climate blogs and delivered ad nauseum with his usual brand of sophistic rhetoric. I have simply demonstrated the irrelevance in any economically rational analysis.

        The point of addressing externalities in the Pigovian sense is to internalise costs as either penalties – or better yet – eliminating externalities directly through pollution control. As I have suggested is in the normal course of business as usual risk management. But these are actual impacts of pollution and not Joshua’s fantastic fossil fuel accounting. The least he could do is respond rationally to my sound economic, technical and social points.

        Paris succeeded exactly as designed. A 3 billion ton increase in energy emissions by 2030. All in accordance with explicit provisions of Nationally Determined Commitments delivered in Paris in 2015. It doesn’t seem to have been caused by big business in the west. 🤣

        The world – specifically developing nations – is simply not interested in – or ready for -much more of his renewables at excessive prices paid for by taxes discussed for 30 years now. The world has moved on even if Joshua and ilk haven’t.

      • > But these are actual impacts of pollution and not Joshua’s fantastic fossil fuel accounting.

        What is the difference between the externalities to which you refer, and those I am talking about? Could you be more specific?

    • Put your hand on your heart and promise to save the planet with cows.

      • I have no problem with buffalo roaming the plains as in days of yore… but, in as much as I don’t live there, my opinion should be the least considered.

      • It is not about buffalo per se – but of mimicking natural grazing cycles over 5 billion hectares of global grazing land.

        Think about it when you next hear someone rant about the climate impacts of cows.

  30. Prof. Curry is doing here level best try to predict global temperatures in the coming 30 years by incorporating the best knowledge we have about natural climate cycles upon global temperature. She is to be greatly commended for her (well reasoned) efforts.

    However, I need to respectfully point out something important points that she is missing.

    A. One Terra Watt of lunar tidal energy is dissipated in the deep oceans This is capable of providing half of two Terra Watts of mixing energy required to maintain the large-scale thermohaline circulation of the deep oceans (responsible for the over-turning of cool deep ocean water deep).

    B. Lunar tides disipate plays a crt

    1.. The El Nino part of the ENSO cycle is initiated by close alignments between the lunar tidal cycles associated with Synodic and Tropical months.
    These cycles closely align every seasonal year and also roughly every 4.5 years.

  31. Sorry, I accidentally hit the post comment button while I was composing my message. One in a million chance.

    Prof. Curry is doing here level best try to predict global temperatures in the coming 30 years by incorporating the best knowledge we have about natural climate cycles upon global temperature. She is to be greatly commended for her (well reasoned) efforts.

    However, I need to respectfully point out something important points that she is missing.

    A. One Terra Watt of lunar tidal energy is dissipated in the deep oceans This is capable of providing half of two Terra Watts of mixing energy required to maintain the large-scale thermohaline circulation of the deep oceans (responsible for the over-turning of cool deep ocean water deep). I believe that this process allows the lunar tides to influence the observed changes that we see in the world’s mean atmospheric temperature.

    References:
    1. Wunsch C., Moon, Tides and Climate, Nature, Vol. 405, p. 743 15 JUNE, 2000
    2. Egbert G.D. and Ray, R.D., Significant dissipation of tidal energy in the deep ocean inferred from satellite altimeter data, Nature, Vol. 405, pp.775 –778, 2000

    B. Lunar tides are responsible for sub-decadal warming of the world’s mean temperature via their role in initiating El Nino events. This allows the time-rate-of-change of the world HadCRUT4 (land + sea) mean temperature anomaly to be described by a simple sinusoidal combination of the 9.1-year and 20.2937-year lunar tidal cycles that is of the form:

    https://1.bp.blogspot.com/-6ND957p_2lY/XZyGc72BaNI/AAAAAAAABz4/RgbaUBZ4aT0UB0bdr2UCr5h2o4ZndgFOQCLcBGAsYHQ/s1600/Delta_Temp_eq.jpg

    Reference:
    1. Wilson, I.R.G. and Sidorenkov, N.S., 2019, A Luni-Solar Connection to Weather and Climate III: Sub-Centennial Time Scales, The General Science Journal, 7927

    https://www.gsjournal.net/Science-Journals/Research%20Papers-Astrophysics/Download/7927

    https://1.bp.blogspot.com/-hGFQX7E8Oro/XZyEWZ7KtHI/AAAAAAAABzs/mpSn4NgZA8EJAImelda3zgHfieNkNkfUgCLcBGAsYHQ/s1600/Delta_Temp_model.jpg

    Any predictions about future temperature changes will need to take into account the effect of these lunar tidal cycles upon the world’s mean temperature.

    C. The influence of the lunar tidal cycle on world mean temperature produces a natural quasi 60-year cycle in the Earth’s climate system. This is also accompanied by a longer-term Gleissberg-like (88.5 years) and De Vries-like (208.0 years) tidal cycles that are synchronized with similar cycles in the level of solar activity.

  32. Very nice analysis. Folds in all the main arguments, concludes on balance ‘relative’ cooling likely next 30 years. Fits what we know about 20th century. Warming ~1920-1945, cooling to ~1975, warming (attributed to AGW) ~1975-2000, or 2015 if add in second big ENSO. Cooling is inferable from ‘nowish’ to 2050ish.

    If so, is one of two simple ‘facts’ that will finally kibosh CAGW. The other is lack of acceleration in sea level rise.

    My own view is that the CAGW ‘fever’ will have broken by 2030, not 2050. The continued failure of models and predictions is one big factor. The other is growing failure of supposed mitigation solutions, whether Paris Accord or renewables.

    • Consolidating sea level acceleration estimates from satellite altimetry

      Abstract
      … GMSL based on ESA data on the 1991–2019 period within ± 82° latitude exhibit an acceleration of 0.095 ± 0.009 mm/yr2. The corresponding value for the TPJ data is 0.080 ± 0.008 mm/yr2 for the 1993–2019 period and within ± 66° latitude. The ERS-1 satellite was launched shortly after the large Pinatubo eruption in 1991. The satellite observes a decrease of 6 mm in GMSL during the first 1.7 years until the launch of TOPEX/Poseidon. The distribution of sea level acceleration across the global ocean is highly similar between the ESA and TPJ dataset. In the Pacific Ocean regional sea level acceleration patterns seem related to the El-Niño Southern Oscillation (ENSO) whereas around Greenland a clear negative acceleration is seen.

    • istvan, they seem to be bungling the climate science, the economics & the political science of this thing. It will be interesting to see exactly which of these bunglings will prevail the most in the coming years.

  33. A short statistical note. The climate displays spatio-temmporal variation at many scales: day/night, seasonal, multidecadal oscillations, etc. This fact is well known. An implication is that any relationship between subtle solar variation that might have produced as much as 0.5C of the observed warming since the late 1880s, will have a weak statistical relationship between measured solar output and temperature change; for example, a low value of R^2 between measured solar change and measured temperature change, and will probably not appear “statistically significant”*. at conventional levels such as alpha = 0.05. This is a sort of Limbo-land of weak relationships, such as the diagnosis of clinical depression or malignancy of the tumors of some body tissues, where diagnosis is not a reliable as we would want.

    *I should note for completeness that leaders of the American Statistical Association have written to the editors of many journals deprecating the use of the phrase “statistically significant”, but it will have to do for now for situations like this where a short phrase for a complex concept and lengthy analysis is handy:

  34. RationalClimate

    Very glad to see the discussion of solar indirect effects. Strikes me that this aspect needs a lot more research.

  35. I previously posted on a comment on how your history of inaccurate temperature trend forecasts undermines the credibility of your blogpost’s current forecast:
    https://judithcurry.com/2020/02/13/plausible-scenarios-for-climate-change-2020-2050/#comment-909500

    So I’ll now add some additional comments on other aspects of your blogpost.

    The take-home message is that your projections are just you again under-estimating the magnitude of anthropogenic, greenhouse-gas-induced warming relative to natural factors; mainstream climate models (including from CMIP5) do a better job on this than you.

    Re: “Scafetta (2013) showed that the large climatic variability observed since the medieval times can be correctly interpreted only if the climatic effects of solar variability on the climate have been severely underestimated by the climate models by a 3 to 6 factor.
    […]
    Scafetta (2013) included solar indirect effects in an estimate of ECS, and determined an ECS value of 1.35 oC.”

    You seem to be talking about this paper:

    “Discussion on climate oscillations: CMIP5 general circulation models versus a semi-empirical harmonic model based on astronomical cycles”

    That paper is “climastrology”. It uses p-hacking and mechanism-free curve-fitting to claim that movements of Jupiter and Saturn are impacting Earth’s claim on multi-decadal time-scales. That’s been ripped apart, both in the blogosphere and the peer-reviewed literature, consistent with Scafetta’s other debunked work. Why are you relying on work that bad?

    https://skepticalscience.com/its-planetary-movements.htm
    https://tamino.wordpress.com/2012/03/22/mathturbation-king/
    http://blog.hotwhopper.com/2016/02/wuwt-failed-predictions-nicola-scafetta.html
    “Agnotology: learning from mistakes”
    “On the alleged coherence between the global temperature and the Sun’s movement”

    There are many problems with Scafetta’s paper. But the most straight-forward one is that his model predicts no warming (see his figures 25 – 28 and 30 from his paper), when warming actually continued through 2019, as I mentioned in my initial reply to you and consistent with the model-based, AGW-dominated warming forecast you objected to.

    Re: “Neither the effects of AMO or solar indirect effects have been included in attribution analyses of warming since 1950.”

    That’s a brazenly false statement. For instance, you used to work with Berkeley Earth. Did you forget that they did that type of analysis for the AMO?:

    “A new estimate of the average earth surface land temperature spanning 1753 to 2011”

    You literally co-authored a paper in which they mentioned that:

    Paragraph 29 of section 5 of: “Decadal variations in the global atmospheric land temperatures”

    Anyway, there are plenty of studies taking the AMO into account, often noting that its impact on global temperature (if any) is dwarfed by that human-made increases in greenhouse gases (GHG). For instance:

    “Causes of irregularities in trends of global mean surface temperature since the late 19th century”
    “A limited role for unforced internal variability in twentieth-century warming”
    “Testing the robustness of the anthropogenic climate change detection statements using different empirical models”
    “The Atlanto-Pacific multidecade oscillation and its imprint on the global temperature record”
    “Contribution of Atlantic and Pacific multidecadal variability to twentieth-century temperature changes”
    “The life and death of the recent global surface warming hiatus parsimoniously explained”

    Re: “Shaviv (2008) used the oceans as a calorimeter to measure the radiative forcing variations associated with the solar cycle.”

    Looks like you mean this paper:

    “Using the oceans as a calorimeter to quantify the solar radiative forcing”

    It uses data such as ocean heat content (OHC) to make its conclusion. Yet climate models that don’t include the large, indirect solar forcing you hypothesize do fairly well in representing the increase in OHC in response to radiative forcing. It’s human-made increases in GHG forcing that’s primarily driving the OHC increase. For example:

    “Ocean warming: From the surface to the deep in observations and models”
    “Observed and simulated full-depth ocean heat-content changes for 1970–2005”
    “Quantifying human contributions to past and future ocean warming and thermosteric sea level rise”
    “Anthropogenic aerosols, greenhouse gases, and the uptake, transport, and storage of excess heat in the climate system”

    “How fast are the oceans warming?” [DOI: 10.1126/science.aav7619]
    “Industrial-era global ocean heat uptake doubles in recent decades”

    Re: “Is the Sun is currently moving into a new grand minimum or just a period of low solar activity?”

    The cooling effect of a solar minimum would be dwarfed by the warming impact of human-made increases in GHGs. That’s been shown in study after study:

    “Implications of potential future grand solar minimum for ozone layer and climate”
    “On the effect of a new grand minimum of solar activity on the future climate on Earth”
    “Impact of a potential 21st century “grand solar minimum” on surface temperatures and stratospheric ozone”
    “What influence will future solar activity changes over the 21st century have on projected global near-surface temperature changes?”
    “Could a future “Grand Solar Minimum” like the Maunder Minimum stop global warming?”
    “Deep solar minimum and global climate changes”
    “Regional climate impacts of a possible future grand solar minimum”
    “Possible impacts of a future grand solar minimum on climate: Stratospheric and global circulation changes”

    You could object that those studies use climate models that don’t include the large, indirect solar forcing you hypothesis. But, as I discussed above, those models have made better temperature trend predictions (in response to radiative forcing) that both you and the sources you rely on. More on this below, for the curious:

    “The ‘pause’ in global warming in historical context: (II). Comparing models to observations”
    “Volcanic radiative forcing from 1979 to 2015”
    “Reconciling warming trends”
    “Natural variability, radiative forcing and climate response in the recent hiatus reconciled”
    “Reconciling controversies about the ‘global warming hiatus’”
    “Evaluating the performance of past climate model projections”
    “Assessment of the first consensus prediction on climate change”

    There are other problems in your analysis. But it’s not my job to rebut each and every one of the flawed tactics you use to reach the pre-determined conclusion that the relative magnitude of greenhouse-gas-induced AGW is exaggerated.

    • I’m still waiting for you to rebut ONE of my arguments.

      • Excellent reply

      • Anyone with at least one functioning eye can see the point-by-point rebuttal, showing that forecasts you made failed, sources you relied on were debunked or did not support your conclusion, you acted as if evidence did not exist when it actually did, and climate models that left out the large indirect solar forcing you hypothesized predicted the temperature response to forcing well (better than you did, and thus their forecasts are more credible than your’s).

        You can claim all you want that no rebuttal was given. But not everyone is blind. I guess that’s what need to do for your to make tweets like the one below:

        https://twitter.com/curryja/status/1228082324920655872

      • What do you do if you live in a society that is blinded by scientific ignorance and hysteria? There is no point in using scientific logic and reasoning to try and present a case that goes against the baying of the mob. Any senses that scientific principals will prevail over superstition and willful ignorance have long been quashed by the zealotry of those who adhere to the religious cult of global warming.

        When asked what caused a 0.7 C increase in global temperature between 1970 and 2010, the scientifically illiterate mob screams out loud, “Carbon [-dioxide] emissions by humans! Only Climate Deniers would claim otherwise!”.

        When asked what caused a 0.6 C increase in global temperature between 1900 and 1940, the scientifically illiterate mob screams out loud, “What are you talking about? Well, it must be human emissions too!”

        Even someone with a scintilla of scientific knowledge knows that the observed warming in global temperatures between 1900 and 1940 could not be caused by human-emitted CO2 since these emissions did not start rising significantly until after WWII.

        Ask your self the question, if the 0.6 C warming between 1900 and 1940 was not caused by human CO2 emissions, how can you claim that most, if not all, of the 0.7 C warming between 1970 and 2010 was caused by human CO2 emissions?

        No rational scientist could make such a claim, yet this is what most of those who slavishly follow the cult of global warming believe.

      • astro, i’ve got my own take on early twentieth century warming. The earth, i believe, is more sensitive to warming when the oceans are in a state of temperature equilibrium. In the early twentieth century the oceans were closer to equilibrium temperature than the late twentieth century. Therefore, it is plausible that elevated levels of CO2 caused early twentieth century warming, too. Similar surface warming back then would have been accompanied by less ocean warming at depth. (all that said, i don’t believe that the rise in atmospheric co2 is caused by emissions)…

      • Anyone with at least one functioning eye can see the point-by-point rebuttal…

        Well, atomsk, why don’t you ask Dr Curry what she means by rebuttal if she doesn’t think that ONE was given? Is it better to create these awkward standoffs than it is to make the effort towards stopping talking past each other? Communication is a two way street and it might help if you were to climb down off your high horse & start engaging (instead of denigrating).

      • Thank you. In one comment, cite something I said. Then rebut my comment with evidence. Setting up strawmen to knock down, or saying climate models make good predictions, are not what I regard as a rebuttal our counter-argument.

      • Atomsk’s Sanakan: Anyone with at least one functioning eye can see the point-by-point rebuttal, showing that forecasts you made failed, sources you relied on were debunked or did not support your conclusion,

        I see disagreement, but all sources have their limitations, and I do not find yours to be definitive — merely parts of the complex disputation . Judith Curry cites plenty of disputants.

      • Re: “Thank you. In one comment, cite something I said. Then rebut my comment with evidence. Setting up strawmen to knock down, or saying climate models make good predictions, are not what I regard as a rebuttal our counter-argument.”

        I literally quoted what you said in your post in bold and with quotations, multiple times. Then I explained what was wrong with what you said, with cited evidence backing it up. For instance, I quoted your statement “Neither the effects of AMO or solar indirect effects have been included in attribution analyses of warming since 1950,” and explained why it was wrong, with cited evidence.

        Do you want to understand why so many scientists don’t bother to respond to a lot of your blogposts, Curry, to the point that you’re complaining about that on Twitter? One reason is because they know (from prior experience) that you’ll respond like this. If someone rebuts what you say, you’ll simply assert no rebuttal was given. If someone does what you request, you’ll act as if they didn’t. Another example occurred when above that you asked for someone to looks at the global temperature trend between 1998 – 2016, factoring out any solar and volcanic forcing… in response to a comment in which I cited multiple sources that did that:

        https://judithcurry.com/2020/02/13/plausible-scenarios-for-climate-change-2020-2050/#comment-909511

        Why should people continue to spend their time addressing your points, when you’re just going to act as if they didn’t?

        And Matthew Marler: I have next-to-interest in persuading you, since I’m familiar with the type of responses you give. Saying over and over that ‘things are complex’, ‘people on blogs disagree’, ‘I don’t accept what you say [but I’m not going to address the cited, published evidence],’ etc. is not a cogent response.

      • I cited numerous papers to the contrary. We disagree. I am convinced that my understanding (along with cited papers) is much greater than yours. I could spend time refuting the papers you mention (to the extent they are relevant to my arguments), but I have better things to do. In the meantime, you can work to make your arguments effective so that maybe others will pay attention.

      • Atom(-ant)sk’s Sanankan,
        I have tried to use argumentum ad absurdum to show you that there is a potential flaw in your overall argument but it has not seemed to have broken through, so I will ask a direct question.

        No matter how wonderful you think that your models are at describing reality if the bulk of the warming in the early part of the 20th century was not caused by human-emitted CO2 [i.e. the warming must have a natural cause], how can you claim that the bulk of the warming in the latter part of the 20th century and early 21st century is mostly the result of human emitted-CO2? The short answer is that you can’t!
        I (personally) think that the real problem here is that we have someone who thinks he knows how nature should work, and we have another person that carefully observes the changes in nature around her and asks {without presupostion] why they are taking place. Her arguments may not be perfect but I believe that they do uncover some genuine flaws in the currently accepted narrative.

        Your claim that the latest models have factored in all the other sources, other than human-emitted CO2, that affect the world’s mean temperature is actually contradicted by the very people who have played a central role in developing these models:

        Causes of differences in model and satellite tropospheric warming rates

        Benjamin D. Santer, John C. Fyfe, Giuliana Pallotta, Gregory M. Flato, Gerald A. Meehl, Matthew H. England, Ed Hawkins, Michael E. Mann, Jeffrey F. Painter, Céline Bonfils, Ivana Cvijanovic, Carl Mears, Frank J. Wentz, Stephen Po-Chedley, Qiang Fu & Cheng-Zhi Zou
        Nature Geoscience volume 10, pages 478–485 (2017)

        https://www.nature.com/articles/ngeo2973

        The bottom line: “We [i.e. the authors] conclude that model overestimation of tropospheric warming in the early twenty-first century is partly due to systematic deficiencies in some of the post-2000 external forcings used in the model simulations.”

      • What Wiley Coyote, aka Atomsk, is doing is what he always does. He cites papers that may or may not be relevant while refusing to engage the science in any detail.

        Just one thing he says is obviously wrong. He says that GCM’s skillfully simulate ocean heat content. This is utter nonsense. Many of the CMIP6 models don’t even do a good job of matching past surface temperatures or SST. The ocean atmosphere interface is very complex and models don’t have anywhere near the physics to get the energy transfer right unless they are explicitly tuned to past data. That is not skill at all and offers no confidence they will be accurate going forward. Models can only be right because tuning causes cancellation of large errors for some output measures.

      • There is a new generation of models being contemplated to to overcome the baked in deficiencies of current generation models. Yet it is on these that Atomki precariously hangs his hat. One would need to be very full of themselves to argue with someone with the stature of Tim Palmer in the field of climate computing.

        “What is needed is the urgency of the space race aimed, not at the Moon or Mars, but rather toward harnessing the promise of exascale supercomputing to reliably simulate Earth’s regional climate (and associated extremes) globally. This will only be possible if the broader climate science community begins to articulate its dissatisfaction with business as usual—not just among themselves but externally to those who seek to use the models for business, policy, or humanitarian reasons. Failing to do so becomes an ethical issue in that it saddles us with the status quo: a strategy that hopes, against all evidence, to surmount the abyss between scientific capability and societal needs on the back of 2 less-than-overwhelming ideas: 1) that post processing (i.e., empirically correcting or selectively sampling model output) can largely eliminate the model systematic biases that would otherwise make the models unfit for purpose (12) and 2) that incremental changes in model resolution or parametrization can overcome structural deficiencies that otherwise plague the present generation of models (13).” Tim Palmer and Bjorn Stevens 2019 – https://www.pnas.org/content/116/49/24390.full

        Models do not include decadal – or more generally internal – variability at all reliably as is generally agreed.

        “Indeed, the reconstruction of this pair of modes for regional climate indices (Fig. 3b, c) manifests as a multidecadal signal propagating across the climate index network (with certain time delays between different indices)—a so-called stadium wave (refs. 20,35,36,37)—which we will refer to as the global stadium wave (GSW) or, when referring to the global-mean temperature, Global Multidecadal Oscillation (GMO), although, once again, the oscillatory character of this phenomenon is impossible to establish due to shortness of the data record. The phasing of indices in the GSW is consistent with earlier work (ref. 20), which analysed a limited subset of the Northern Hemisphere climate indices (Supplementary Fig. 6). The global-mean temperature trends associated with GSW are as large as 0.3 °C per 40 years, and so are capable of doubling, nullifying or even reversing the forced global warming trends on that timescale.” Sergey Kravtsov et al 2018 – https://www.nature.com/articles/s41612-018-0044-6

        Thus we have Atomski who hopes against all evidence and with such conviction that models are right – and who has a seemingly wilful ignorance of a wealth of natural science on vigorous internal variability – and they’re his least annoying attributes?

      • Claim by Atomsk: “You could object that those studies use climate models that don’t include the large, indirect solar forcing you hypothesis. But, as I discussed above, those models have made better temperature trend predictions (in response to radiative forcing) that both you and the sources you rely on.”
        Reality:
        https://i.imgur.com/Nei8ahF.jpg
        The figure shows the spatial correlation between obs. SST and tos (model mean). The rest is silence.

      • Atomsk’s Sanakan: I’m familiar with the type of responses you give. Saying over and over that ‘things are complex’, ‘people on blogs disagree’, ‘I don’t accept what you say [but I’m not going to address the cited, published evidence],’ etc. is not a cogent response.

        What I wrote was that the “refutations” that you cite have problems of their own. Consider the “debunking” of Scafetta’s work:sure, his approach has a high type 1 error rate and the result can’t be relied upon solely for planning purposes. However, there might be real processes with weak signal strength responsible for his findings. Statistical analysis methods developed so far likely have a low power for detecting influences of the size likely involved in generating global warming.

        This isn’t “it’s complicated”, it a recognition of low statistical power in this setting.

        More to the point, Judith Curry has cited the criticisms of his work.

      • Second that.

      • Re: “In the meantime, you can work to make your arguments effective so that maybe others will pay attention.”

        Please feel free to take your own advice. Then you would not need to construct (incorrect) narratives about why competent experts don’t agree with you, and climate science experts won’t hire you, because you’re on an (imaginary) blacklist. The reason the vast majority of experts don’t agree with you and aren’t bothering to engage your blogpost, is because your arguments are bad + you have no cogent defense of them. There’s a reason your above commentary is not in a peer-reviewed journal, but instead on a non-peer-reviewed blog, in contrast to published temperature trend forecasts.

        “I cannot understand why more people don’t view all this as I do”
        http://www.culturalcognition.net/blog/2014/8/19/what-exactly-is-going-on-in-their-heads-and-in-mine-explaini.html#comment21020927

        https://issuesinsights.com/2020/02/28/the-academic-blacklist-climate-alarmists-dont-want-you-to-know-about/

        https://twitter.com/curryja/status/1228082324920655872

  36. Ireneusz Palmowski

    The decrease in the geomagnetic cut-off rigidity over North America means increase of ionization in the upper troposphere. In during of low solar activity is causing increased precipitation, especially thunderstorms.
    http://sol.spacenvironment.net/raps_ops/current_files/rtimg/cutoff.gif

  37. Ireneusz Palmowski

    The long-term decrease in high-energy UV radiation causes ionization changes in the atmosphere. Ionization in the lower stratosphere and upper troposphere increases.
    http://www.iup.uni-bremen.de/gome/solar/mgii_composite_2.png

    • Ireneuse:
      Did you just say the average surface temperature of the sun has been steadely decreasing.. Could it be for the last about 20,000 years? That is how long I say Mother Nature has been removing heat from the oceans to keep the average surface temperature of the earth constant.

      • Ireneusz Palmowski

        I did not say that the average surface temperature of the Sun is falling. I said that the high-energy UV falls, which occurs during solar eruptions.

      • Ireneusz Palmowski

        It means that solar eruptions are less numerous and weaker.

  38. Shaviv (2008) used the oceans as a calorimeter to measure the radiative forcing variations associated with the solar cycle. Shaviv found that the energy that enters the oceans over a solar cycle is 5–7 times larger than the 0.1% change in TSI, thus implying the necessary existence of an amplification mechanism.

    Shaviv like most of the early researchers missed the real solar cycle influence on the ocean, instead, they all relegated solar to a minor influence. He like Svensmark and everyone haven’t made the right TSI connection in drawing that wrong conclusion; there aren’t other ocean amplification factors 5-7X greater than TSI.

    There is ocean heat accumulation under high TSI of absorbed solar energy at depth with a lagged surface response due to upwelling time, that produces the solar cycle top and post-maximum El Ninos. This is part of the common error of omission people have made by separating ENSO activity from the effect of solar activity, making the solar portion look much smaller.

    My work indicates net positive SST growth from a solar cycle occurs if the cycle maximum sunspot number exceeded 95 per month (F10.7cm @ 120sfu). The last solar cycle #24 produced a TSI impulse at the beginning of the cycle, powering the 2009/10 El Nino, and thereafter the climb to the TSI maximum and subsequent fall drove the SST growth and fall at nominally 0.5C/W/yr, a solar sensitivity factor I derived and tested empirically.

    https://i.postimg.cc/Dyd56phF/AGU-Fig13.jpg

    One concern for the Solar forcing for CMIP6 paper is the TSI they are using shows secular increases/decreases in the past solar minimum floor which not all of us agree with, carried forward in solar projections. The progression of solar cycles in this version is better than the RCP8.5 SC23 repeating cycles forever series, however, the solar activity uncertainty beyond one solar cycle out is far too great to make credible solar or climate predictions. Scenarios are thus invoked, but which solar model to use, which direction to go?

    Today there are many earnest predictions for SC25 maximum that range from the very low to very high sunspot projections using different methods. No one cooking the solar books for AR6 or CMIP6 can have any confidence today in whatever is used from 2030-on until this cycle plays out in one direction or another, whether the sun perks up normally or not from today’s level, something we should know in two+ years, by 2022/23, if it’s anything like SC24.

    https://i.postimg.cc/YC0NhswP/SC24-Minimum-in-F10.jpg

    In spite of Prof. Zharkova’s popular GSM theory, today the odds are still good the next many cycles will have maximum counts above 95 SN (120sfu F10.7cm), under those circumstances, the ocean will continue to warm, but from TSI being high enough, and not from CO2 or GHGs or MMEs; yet the odds may change by 2022/23 if a low SC25 max stays below 95 SN which will lead to net ocean cooling by 2030.

    Another concern with CMIP6 is the new attention to solar particle effects will likely detract from the TSI considerations mentioned, particle effects that definitely don’t add 5-7X the TSI forcing, not even close, not even a sig fraction of TSI. The thermosphere doesn’t warm the ocean (particles), absorbed sunlight warms the ocean via UV/TSI, so UV/TSI >> particles.

    I strongly advise against having confidence in any model run past SC25.

  39. ” A range of scenarios for global mean surface temperature change between 2020 and 2050, derived using a semi-empirical approach.”

    I sort of object to the term scenario here.
    This is the term given to the models used by the IPCC to avoid saying they made a prediction to cover themselves when they get their predictions wrong.
    Would prefer the term outcomes to scenarios to avoid giving credence to that sort of behaviour.


    All three modes of natural climate variability – volcanoes, solar and internal variability – are expected to act in the direction of cooling during this period.

    There are over 70 different reasons now available for explaining where the missing heat is hiding or why we have not seen the effects but they are just around the corner. Perhaps it is a good thing that you have condensed the arguments into 2 reasonable and one unknown grab bag as it should be.
    On this score though only volcanoes can be expected to cause cooling.
    Despite some very good presenters on solar here we just do not know where solar will go.

    • All three modes of natural climate variability – volcanoes, solar and internal variability – are expected to act in the direction of cooling during this period.

      Volcanic cooling is over-rated imo, with presently no reason to think more volcanic activity can be expected over the next three decades. Even if there is more activity the impact will be smaller than is now expected.

      In 2014 I noticed solar cycle declining phase temperature drops from each cycle shown below (arrows), which lead to more investigation and the determination of the empirical sensitivity factor I mentioned before.

      https://i.postimg.cc/0rR1sQK8/Had-SST3-falls-with-TSI.jpg

      It’s been almost thirty years since Mt. Pinatubo, ‘the big one’, which didn’t change the ocean cooling rate afterwards any more than the effect of the sun’s already falling energy during the declining phase of SC22, which cooled at virtually the same rate under the SC24 declining phase falling TSI from 25 years later that lead to a record 2-year temperature drop without big volcanic eruptions:

      https://i.postimg.cc/C55TwXGp/Solar-vs-Volcanic-Cooling.jpg

      The overall temperature drop from Mt. Pinatubo was minor compared to the now quantified and predictable solar cycle influence on the ocean.

  40. https://i.imgur.com/zKSNlnf.png

    From the paper:
    https://i.imgur.com/6ZeilJJ.png

    As or the missing heat, Trenberth, a brilliant scientist, correctly stated it either went into the oceans or was instead reflected back to space.

    If it had been reflected back to space, there is no way to find it.

    So he correctly indicated the place to solve the scientific mystery was in the oceans, where, if it di go into them, it could be found. Obviously, if it was not found, then it was reflected back to space.

    The final accounting has to wait for deep ARGO, but I rather doubt it changes anything. A lot of it was reflected back to space.

    The people who were claiming Trenberth violated the 2nd law are, well, I would get moderated.

    And, it has come back to haunt us.

    • Not wishing to pick on you, but I have to.
      Trenberth violated the 2nd law.
      “So he correctly indicated the place to solve the scientific mystery was in the oceans, where, if it did go into them, it could be found.”

      “If it did go”.
      “If it was not found.”
      I’m sorry but this is a cop out whichever way you choose to look at it.

      There is no mechanism either way to explain it JCH.
      Which is why, instead of saying , my assumptions are wrong, both you and he doubled down in opposite directions.

      So not where but how, how did it go into the oceans?
      And why are the greatest minds unable to find it?
      Perhaps global heat put a hat, coat,dark glasses, false mustache and a cloaking device on [that is supposed to be humour].
      Without a valid mechanism, without tracking ability, it is just plain unscientific.
      Then “A lot of it was reflected back to space.”
      You are not allowed to make up stuff.
      Again how was it reflected back into space and why was this not detected. What was the mechanism.
      More clouds?
      Why didn’t the records show a particularly cloudy year?

      Please, if you make these arguments, show some logical reasoning. If not, just let it be.

      “Obviously, if it was not found, then it was reflected back to space.
      The final accounting has to wait for deep ARGO, but I rather doubt it changes anything. A lot of it was reflected back to space.”

      • I am a simple soul and only have a degree in physics and engineering, so don’t understand the special exemptions of “Climate science”, which can be stated as proven by the agreement of lots of scientists denying the observations. A sort of reverse Einstein or Feynman approach.

        This debate seems to accept this new science rather than challenge the Emperor’s New Clothes climate science approach. The most obvious unference of the tropospheric results is that the heat didn’t disappear, it was never there, save your time looking for it.

        Engineers like me are bit rough about beliefs as the basis for construction/action. WE can only use the physics that has been proven by observations and they can safely apply to make things that work 99.99% of the time. I have tried hard to understand GHE and back scatter on this basis of what is proven to happen with my limited degree levels Thermodynamics and quantum physics.

        I still don’t get the basic premises claimed for the heat disappearing into the oceans, where most of jt just came all the way from? to lurk with other poorly considered heat inputs that can vary much more, like the dominant solar absorption and lower level submarine volcanoes delivering c.1W/m^2, variably in the short and long term. More variability than the missing 1 or 2W/m^2. Good place to hide what isn’t there in the noise, in the oceans whose periodicity is well below the crucial threshold of one academic career and/or departmental grant funding?

        Back to heat returning to Earth to hide in the oceans. This was never the story of modellers before their theory was proven wrong as regards increased GHE. It only takes one, as Einstein observed. We have many deniers, satellites and balloons that can test models predictions, and they failed.

        The IR electro magnetic. radiative energy from the surface was supposed to be scattered around in the troposphere on its way to space and thus create a better smart insulator between surface and space, as a small part (4%) of the same effect from water vapour (96%). Hence vary the lapse rate from the surface which becomes warmer as result. Both of these GHE effects are weak compared to the strong control of water vapour to maintain equlilibrium, whose major effect is to control insolation as ocean surfaces warm through cooling by evaporation and cloud formation. THis is not slow to respond to human or natural perturbations. Its nearly instant and very capable negative feedback in global climate terms, highly variable with SST, and currently at around 150W/m^2 negative feedback, that increases exponentially with SST almost instantaneously, because vapour pressure does. Hence NO TIPPING POINT.

        The GHE effect is supposed to modify the lapse rate so the initial gradient was lower, but the hundred times greater water vapour effect is to maintain equilibrium. Which will win? Right?

        AS for the CO2 GHE the predicted effect doesn’t occur where predicted by the models, so there is much less IR at the necessary frequency to transfer anywhere else, and no temperature gradient to cause conduction to the net warmer oceans oceans. Or reverse convection. I’m still on basics. So the conclusion appears to be that either the IR radiated heat was never there, or it radiated somewhere else. Two things puzzle me about heat hiding in the oceans from the colder air above, a strange new anti science that believes the opposite of what I thought I knew, without the need to prove it. Just assuming it and forcing models to fit the assumptions is the new proof. The 737 Max engineering approach? Modelling science. Obviously I must be wrong, but is it because i challenge a false consensus, or because i missed some key physics – but let them explain why:

        1. The oceans are warmer than the atmosphere on average and are recognised to control the atmosphereic temperatures above them and on land, hence summer hurricanes, etc., the effects are modified by the land locally (its the 1,000 times heat capacity, majority of the solar heat absorbed by the 2/3 cover, I think?). Land temps seem largely irrelevant to me in this global discussion, they are local weather, dependent on which way the winds blow. Average SSTs over 2/3 of the Earth’s surface are the dominant control of 30 year global temperature. Not where we live, or dodgy weather stations.

        2. I understand the infra red scattering of emitted IR at the particular frequencies involved is reabsorbed and re radiated within tens of metres as it makes its way slowly to space, establishing an equilibrium where losses of IR photons to space match arrivals from the surface. Energy band absorption and re emission happens in minute fractions of a second, the whole effect at an overall exponentially decaying rate with increasing CO2 concentration due to the limited amount of bands to saturate (nb: I also note CO2 concentration as a percentage of water vapour is a minimum in the tropics where gas density is lowest and water vapour highest, due to the temperature.

        POINT If the temperature doesn’t rise as projected at some time during continual satellite observation then the GHE never happened, the energy was never there to hide anywhere, and the GHE theory is wrong. Is there something wrong with my crude understanding of physics 101? Please correct me if wrong in fact, with provable science, though. NOt modellers guesses.

        Perhaps I missed something in my ignorance of proven science I have not applied or never knew?

        OBSERVATION ON SCIENTIFIC METHOD:
        It seems whenever the basic laws of physics are apparently denied in climate “science”, it is by an army of pseudo scientist priests who create their own modelling science using assumptions they can’t justify to prove their single case, rather than testing it. Anti science.

        I suggest this is such a key event, they must avoid their models being wrong, rather than accepting the failure of their overtly wrong predictions by observational test, and looking for the reason it doesn’t work like that, or “science” – as it used to be called in the 20th Century.

        The old science was mainly wrong, so real scientists kept trying new theories to answer the question of cause and effect. “I know how HARD it is to really know things”. These guys, and their funding authority the UN IPCC , only have one theory, climate change is man made and caused by CO2, so it can’t be wrong or they are:

        1. out of a job, and

        2. their expensive remedy (that also can’t work on a clear engineering basis at massive economic cost), is also pointless. AKA the undeliverable and unsupportable waste of money on an ineffective energy supply.

        nb: Nobody will live to see the failure of the fraud that enriches its insiders, as the supporting disaster always lies ahead, just not detectable yet.

        THE POLITICS AND ENERGY REALITY: The renewable subsidy and carbon trading racket this undeliverable fraud on the energy consumer is used to falsely justify, e.g. that mostly natural climate change justifies CO2 reduction and excessive energy prices to reduce energy use this protection racket enables, must cause the partial destruction of 200 years of technological and economic progress in the West, directly resulting from energy use per person enabling humanity to address the problems of protecting us from nature. Hygiene, sewers, power and water to the home, transporation, medicine/health care, modern agriculture and defences aha aghinst natural disasters are all driven by energy use per person.

        The UN IPCC doesn’t like that, they want a developing world norm, powered by “renewables”, that they control the use of. Natural power. Why they hate nuclear, because its far more intense than fossil, zero CO2 and far more sustainable than wind or water power in resource use terms, so removes their main argument. But its unnatural, people created it, and we can rise above nature, which is seen as bad, for most, just not them.

        They don’t even understand this, it doesn’t allow them to control impoverished people dependent of their elite “leaders”, the feudal/religious systems of the 3rd World many IPCC politicians and “scientists” come from, that we in the West managed to throw off, and they are trying to re impose.

        Note this is now turning to controlling modern agriculture which has largely ended famine globally, except in areas controlled by the feudal/religious regimes of Mullahs and war lords. I aawait the science o taxing of Nitrogen use justfied by a itrogen footprint that is BAD, with no provable supporting science, just more models, paid to “prove” the claim of badness.
        .
        This problem won’t happen in the developing countries, who aren’t rich and happy enough to be engineering deniers in their post industrial ignorance, yet. So the UN IPCC developing world and Western Malthusian socialists cannot actually impose their dystopian UN inspired mediocrity on the World, rather they will transfer power from West to East to create some global mediocrity.

        This climate pseudo science, and the reality of energy use and economic development, has to be exposed before we can deliver a progressive, socially just and most developed world, at todays standards or better, through the availability of plentiful cheap energy to all. Which is sustainable using nuclear energy for as long as humans last, when the fossil is really a reserve fuel, not a commodity any more.

        nb: Anyone off grid living in a cabin in the backwoods with an expensive solar panel and battery need not reply. You can keep your gun in your dead cold hand. I focus on the majority of city dwelling apartment occupying masses who depend completely on grids to survive – gas, water and electricity grids, and liquid fuel distribution which is about 1/3 of total energy use. All are provided by commercial providers that they have no control over, but the government can manipulate by law..

        Impoverishing the West through a pointlessly regressive energy policy imposed by governments on the basis of a problem that isn’t real won’t save the human planet, it will self evidently slow its development and the rise of the developing counties to prosperity. As with the nonsense of Western banks not funding the fossil fuel powered grids essential to delivering 1st World level of energy use by the mass of people in the 3rd World. Tye Chinese and Russians will deliver that infra structure, because they can and the developing nations know renewables can’t deliver remotely enough energy 24/7.

        Renewables simply don’t have the energy when needed to power most large economies, why they were dropped when steam took over. Energy physics 101.

        Power to the people!

        Who will save us from this global conspiracy of stupidity, imposed for the profit and power of cynical commercial and political elites by delusional zealots who will pay for it in the loss of their own quality of life to no observable benefit of any kind?

        But I digress ;-).

      • “So not where but how, how did it go into the oceans?”

        Seriously? You seriously asking this question?

        Sunlight.

      • “And why are the greatest minds unable to find it?”

        Long before the missing heat, they started a project called ARGO. Trenberth said it was a travesty the great western societies had now machines that could measure and track the flow of energy through our home planet. So minds, obviously greater than yours, had already started working on it.

        And I am sorry, but this could not be more logical. They had observations that the energy should be in the planetary system. They expected it to be found on the surface. It was not there.

        A real scientist is not going to just let that go. A scientist has to know why. Sorry if that offends your highly defective logical capabilities. So, it was either reflect back to space, or it went into the oceans.

        If it was reelected back to space, it cannot be found out there. Do you know a spaceship company that can send bounty hunters to the outer galaxies to bring back the missing heat? How can a logical person not get this?

        So Trenberth, to figure out the mystery, said they had to look for it in the oceans. Again, perfect logic. If found, found. If not found, it went back to space before being absorbed.

        At the time, ARGO was just beginning.

        Pielke Sr. and Trenberth and Willis actually chronicled the arrival of ARGO results on Pielke Sr.’s blog. If Trenberth is half baked, so is Pielke, as it was obviously a perfectly rational scientific activity to him.

        Again, you see a conspiracy in anything, and it just gets extremely obnoxious.

      • “Why didn’t the records show a particularly cloudy year?”

        The divergence was way longer than a year. It coincides with the negative phase of the PDO, which will likely be found to be a periodic flip in low clouds.

        The travesty was that the Great Wester Societies, despite all the heated apartments and condos and suburban sprawl – all that jazz, had no means of accurately measuring and tracking the movement of energy throughout the earth system.

        Which you dipczzhits turned into Trenberth is violating the 2nd law, and obviously thought the word travesty meant “I’z travetstaed they ain’t enough sozzzalust warming.”

        There’s literally no helping you.

      • (trenberth’s mechanism was an increase in wind speeds along the equator)…

      • brianrlcatt | February 16, 2020 at 9:49 am|
        I have tried to expain how simple High Schoool science explains the Ice ages. At present we are in the Ice Making stage of the new Ice Age. 20,000 years ago the averags surface temperature of the sun began to drop. The radiant heat reflected to the black sky began to drop.To replace the lost heat from the sun, Mother Nature began moving water vapor from the oceans to the poles. This the simple explanation. Some of this is explained lower in this entry.

      • JCH this is an important issue.
        “So not where but how, how did it go into the oceans?” Sunlight.’
        the non infrared stuff penetrates 30-100 meters and is absorbed. It should heat up the top layer detectably.
        It doesn’t.
        “And why are the greatest minds unable to find it?”
        Because it is not there. It cannot go into the deep ocean.
        The wavelengths just cannot go there. If it heats up the top layer and then goes deep ARGO detects it.]
        It doesn’t.
        “A lot of it was reflected back to space.”
        “f it was reflected back to space, it cannot be found out there.”
        Show it happened, with increased clouds or increased albedo. It did not happen.
        That is why it is a mystery to the great man.
        He understood the second law needs to be obeyed.

        Brian, there are a lot of conundrums.
        CO2 causing a GHG effect is real.
        It has been around for a very long time and the world is basically in equilibrium.
        Ramanathan postulates that there is some magical continued energy input which has to go into the oceans.
        The fact that the temperature of the atmosphere adjusts rapidly each day with sunrise to the “right temperature” and that in going heat balances outgoing heat when that equilibrium is reached seems to escape most people. Even ones who claim to have inquiring minds are rather closed.
        Go to Dr Roy Spencer’s site or even science of doom for an explanation of the real GHG effect.Physics and engineering degrees will cut it easily.
        JCH and a lot of others here including me are are on the same page re GHG.

      • Fonz – I refer to that as the KimiKamiKaze – the Devine Wind – named after Kim, who used to recite poetry here about clouds saving the earth from the sozzzulist scientists by cooling it. Saved the home island from an armada twice, but not from my Dad and the USMC.

        But Trenberth’s mechanism is simple: sunlight.

        The missing energy was missing sunlight. It either went into the ocean, or it was reflected before being absorbed. He could not have made a simpler case. If it had gone into the oceans and come back out, the GMST would have been higher. So it was either in the oceans or it had been reflected harmlessly back to space before the earth system could absorb it.

      • angech – as was answered, the ARGO system was not set up to specifically do that. You don’t like the answer, tough luck. They said it might be possible to tease it out of the data if it was there, so your side waited for somebody else to try that. Nobody ever did. Time was going to answer the question for free as ARGO results continued coming in.

        Trenberth said it would come back to haunt us, and it has. Whatever caused the missing heat was going to stop causing it, and then you get Knutson’s spring-back warming.

        The Devine Wind stopped. Boom, big warming. Was it the cause? Maybe. You silly folks want to attribute to the 15-16 El Niño. It really never was the 15-15 El Niño, and time, as it always has since FF emissions started bumping up the thermostat, will completely erase ENSO as a cause of anything.

  41. Geoff Sherrington

    Dr Curry writes “One advantage of using ‘now’ as a baseline for future climate change is that we have good observations to describe the climate of ‘now’.” I agree.
    A major impediment remains in the quest to separate historic effects into natural and anthro. It is the uncertainty of past temperature measurements.
    Some of the global effects discussed above relate to estimates of global change of 0.1 ⁰C to 0.n ⁰C. This sits uncomfortably with thermometers often read to the nearest 1.0 ⁰C. The alleged historic global T changes are tiny effects swimming in a sea of thermometry noise.
    One scientific improvement to the uncertainty of past T estimates was to adjust them. This did not induce confidence in the method, especially when adjustments often exceeded the imagined magnitude of the global change by several times. Yes, adjustments at some stations at some times exceeded 1 ⁰C, sometimes 4 ⁰C . And yes, there is ample evidence of adjustments cooling the past and making the trend to warmer.
    Another scientific improvement was to bury the peoper, actual uncertainty estimate of T. Those greyed splotches on temperature time charts, purported to show uncertainty, are usually little more than artistic brush strokes with no validation.
    A third scientific improvement was to cherry pick. Thus, for but one example, we see official Australian temperature series starting in 1910, when early records note some big climate excursions just before then.
    Fourth, we have national temperature/time series like Australia’s with recent additions of hot stations raising the average temperature by selective choice.
    Fifth, we have past T excursions noted, but ignored, like the Australian possible 0.1 ⁰C the BOM discusses about the change from F to C scales.
    Sixth, the possible warming resulting from the change from liquid-in-glass thermometry to resistance thermometers and their various housings.
    ………………..
    There are more “improvements” than just these six.
    Society applies high standards to those measuring data used in critical applications. (We used to ask if it was work good enough to give confidence to fly in an aircraft, but the Boeing 737 has influenced that narrative.)
    …………………..
    None of my colleagues nor I, who have studied this topic for decades, has any confidence that the past temperature records are fit for most of the many uses to which they are put in climate research.
    Goodbye past T data, hello to the 21st Century. Geoff S

    • Air temperature measuring thermometers in standardized Stevenson’s shelters with natural air circulation are indicating their own temperature.

      The liquid-in-glass thermometers show the temperature the liquid has acquired, and the resistance thermometers show the temperature the resistance has acquired.
      They do not show the air’s temperature, because they are not capable to do so.
      These thermometers were good enough two centuries ago, when they showed it was colder or warmer.
      The data collected by these measurements cannot be used for precise climate changes monitoring.
      First they are not calibrated to measure air’s temperature in standardized Stevenson’s shelters with natural air circulation.
      Second the inside shelters walls infrared radiation is what these thermometers are capable to measure.
      Third the energy transfer to the thermometers from and to the natural circulated air is very slow and weak process compared with the inside shelters walls infrared radiation towards thermometers.

      Remember how the Celsius scale was invented.
      The glass tube with bulb. The bulb was dipped in the melting ice – it was for
      = 0 oC.
      Then the bulb was dipped in the boiling water – it was for
      = 100 oC.

      Now, has it been dipped the thermometers’ bulb in the melting ice when it shows = 0 oC air temperature ?

      No, of course not. When thermometer shows = 0 oC air temperature, the actual air temperature is a few degrees oC below zero already.

      http://www.cristos-vournas.com

      • Use Satellite SSTs from now, or 1979 -. “Since (satellite) records began”. I find the land surface temperature debate rather fatuous, as also con trails, when the larger problem is obvious. It’s the oceans, not the land, that dominate global climate, saving long term tectonic movement, and control solar insolation that keeps us comfy at just above freezing for most of the ice age cycle and 8’ish degrees above for10Ka after 100Ka interglacial events. Until both poles are clear of land, Antarctica is onthe Equator and things warm up a bit, 200 MIllion years or so ahead. Possibly. Fo . Even then, SST will control climate, by evaporation and the consequences of evaporation. Does any serious physicist really doubt this dominant control? I exclude hard of physics UN climate scientists.

        . Most of the planet is poorly covered weather station wise, especially the wet bit that controls the dry bit. .The raw data on land is of unverifiable quality, disparately gathered, shamelessly doctored by activists in NASA, the UK MET Office, and other UN IPCC supported NGOs, et al , whose only mission, like investment salesmen, is to make us think temperatures can only go up, and its human’s fault. Shame they won’t live to see the next ice age.

        Why not use satellite SSTs only. We have then since records began, for them that was 1979’ish? They cover the 2/3 of the Earth’s surface and use consistent measurement technique everywhere (OK there is a cloud problem but not over 30 year averages). . The ocean surface temperature is the one where all the stored planetary surface heat is, that controls the land based climate. See Hurricanes/cyclones. The oceans maintain the planetary surface temperature in space by modifying solar insolation as a strong negative feedback, releasing the water valour that cools the oceans at a current rate around 100W/m^2 and makes the clouds that control the insolation by reflection, with a power of 50W/m^2. This has effectively instant response, as in clouds in the tropics, fog/mist at night, etc. – including to any small AGW, so no tipping points are actually possible, with plenty more room for clouds and an exponentially increasing evaporation effect.

        Q: What flat lines the relentless interglacial that ignored Dryas coolings and burgeoning CO2?
        A: Exponential increase in evaporation and consequential clouds The increased precipitation is observational evidence. Physics 101.

        The only powerful feedback to perturbations wasn’t troubled for long by Super Volcanoes, asteroids, etc. The odd extinction of surface organics, but equilibrium soon restored, by the oceans.

        So why not take the single satellite measurement technique, or multiple SST satellite measurement techniques by multiple satellites, 7/365?

        These are demographically indifferent, with less chance for “adjustment” by NASA, temperatures of the ocean surface that controls the climate long term. The land stuff is interesting, but dependent on oceans, that control the land climate. Readings from ship intakes are interesting, but only as a reference check, not as a way to measure a change so small we wouldn’t have seen it had people not been paid by the UN IPCC to prove people were warming the planet, not nature.

        .Odds and sods about planes contrails interesting, why not add boats burning much more bunker oil? But this is the short term effect of regional trade routes, not a 4 Pi global average. Satellites are the only way for us to do that, as we aren’t fish any more, and can’t send a smart shark, or whatever..

        The change involved is so small we can only see it because a lot of “scientists” have been paid to look for a tiny and probably natural cyclic change and make it look bigger and monotonic with partial time scale graphs with massive y-axis abuse (Brian BBC Cox, Manfred Mann, et al). Disparate technologies can only be compared by their anomalies/changes, and ONLY satellites in polar orbits offer consistent coverage of the planet using a single measurement technique and instrument everywhere, so can provide the baseline reference. Obs.

        Have I missed something? Haven’t time to read it all, and much is Don Quixotes charging tiny non issue windmills on hobby horses. Size matters. Short term,, over a few hundred years before the neo glacial slowly imposes itself and the oceans fall again, its the SUN, the SEA, and the ATMOSPHERE. The big hot thing in the sky at 340W/m^2 incident on Earth and warming up the oceans with over 100W/m^2 absorbed by them, that turn the atmosphere into smart lagging by evaporation that modifies cooling levels at a current 100W/m^2 and reduces incoming radiation hence insolation to maintain SSTs, with a current level of albedo feedback of 50W/m^2, whatever it takes to maintain equilibrium is available, from the oceans, on demand, not slowly. No tipping point possible. Warming perturbation is easily meet with matching cooling response.

        The rest is incidental in human time scales.So lets measure SSTs. QED. IMO

        PS Climate science isn’t rocket science, if your head is not up your own models and instead looking instead at physical reality, using real proven physics..

  42. Ireneusz Palmowski

    The graph indicates that the AMO cycle has already reached its peak.
    https://climexp.knmi.nl/data/iamo_hadsst_ts_1990:2021_19812010a.png

  43. Ireneusz Palmowski

    The Western Pacific remains warm, which affects the high average troposphere temperature.
    https://www.ospo.noaa.gov/data/sst/anomaly/2020/anomp.2.13.2020.gif

  44. The energy coming from the sun to the Earth’s surface is called solar energy. Sun energy is generated in its nucleus mainly through the thermonuclear reaction of hydrogen fusion into helium. In the form of electromagnetic waves this energy is then transmitted from the nucleus towards the surface of the Sun and further on in the surrounding space. The Sun’s energy is generated in its core. Gravitational pressures compress and heat the material in the core to over 15 million degrees Celsius or about 27 million degrees Fahrenheit.
    The average surface Temperature varies over the Millinium. The last Ice age lasted 12,000 years. I believe this one began obout 12,000 years ago. that is when the average surface temperature began to drop.

  45. The average surface Temperature varies over the Millinium. The last Ice age lasted 120,000 years. I believe this one began obout 20,000 years ago. That is when the average surface temperature began to drop.

    • Looking at the Vostok Ice Core you will notice two things are simillar. The lowest CO2 is similar, and the highest is also similar on all four previous Ice Ages. Mandoes not arrive until later. The lowest is at the end of the Ice Melting. Probably less than a third of the way into the Ice making stage of the previous Ice Age. where the watrer level is at its lowest. The Highest CO2 level is the point where the green foliage has grown enough to overcome the CO2 produced my Mother Nature.This new Ice Age you can see where man shows up.

  46. All of the components of natural variability point to cooling during the period 2020-2050. Individually these terms are not expected to be large in the moderate scenarios. However, when summed their magnitude approaches the magnitude of the warming associated with the moderate values of TCRE – 1.35 and 1.65 oC. If the natural cooling exceeds the expected value, or TCRE is at the low end (1.0 to 1.35oC), then there could be net cooling.

    This is a very clear and helpful scientific prelude to the following 3 decades. We will see which will prove greater – natural cooling trends or CO2 warming.

    There’s a third player of course. However earnestly the climate data custodians protest their impartiality, the conflict of interest in this case is the biggest that has ever existed for any scientific measurement in history. There is massive and overwhelming incentive to nudge up the temperatures, and there are 101 ways that this can be done and kept hidden. And human nature is what it is. I suspect we will continue to see an unbroken string of hottest evuh events and statistics. But what is happening in the real world God only knows – until it comes to your doorstep.

  47. Thinking of tonyb, the past history of the AMO has reached its peak, and global cooling is right around the corner:

    https://i.imgur.com/JtZ80OG.png

    Thinking gladiators, watching natural variability die, as it always does:

    https://i.imgur.com/k2z6Tvx.png

    • WFT could stand a TSI upgrade. PMOD is a poor representative of the solar input and trend, as PMOD is outdated (not updated) and proxy-tuned.

      The SORCE record shows a very slight trend increase since 2003, with the current minimum still above the last minimum.

      https://i.postimg.cc/cHdzPrhp/SORCE-2003-to-2020.jpg

      The trend is useful, but the duration of high levels above the red line threshold of 1361.25 W/m^2 SORCE TSI in the image, equivalent to 95 v2 SN and 120 sfu F10.7cm, is the important factor as to whether enough solar energy is delivered to drive warming.

      El Nino is not a separate force apart from the impulse response to, and the accumulation of absorbed solar from TSI variation. Solar max El Nino(s) are directly driven by TSI spikes that lag sunspot peaks above the threshold level, ie, as in the 2015/16 El Nino.

      https://i.postimg.cc/kXrsDC3k/AGU-Fig10.jpg

      As solar-driven natural variability carries on as always ruling the climate with an iron grip, watch AGW suddenly whither away to the nothingness it is.

      • Brian R Catt

        As solar-driven natural variability carries on as always ruling the climate with an iron grip, watch AGW suddenly whither away to the nothingness it is.

        SORRY if I have to send this to see if it works. You are a random Joe …This is a test, I’m trying to find out how to do block quotes in this weird WordPress programming language format. I will annoy another next, until I find out how this introverted Geek UI works. Perhaps I should have used normal quotes?

    • jch

      I am flattered that you are thinking of me. When are you going to get the phrase ‘da paws’ trademarked? If Greta can do it so can you.

      . I don’t think I have ever claimed that I believe global cooling is right round the corner.

      tonyb

  48. One of the very first decadal forecasts punched Da Paws right in the nose.

    https://i.imgur.com/VTigSCn.png

    • Most of the time during the pause the forecast you cite ran too hot. The cause of the pause was the cause before the pause.

      https://i.postimg.cc/T15WB1XN/AGU-Fig5.jpg

      The high solar activity before 2003 drove the warming step up into the 2000s, and the long duration low activity thereafter until 2011/12 paused the warming, until the top of the solar cycle exceeded the threshold.

      I believe the climate modellers incorporate the solar cycle influence indirectly but through improper physics and attribution which gives results sometimes resembling reality, or rather an expected reality, such as in the case of the period defined by your red dashed lines, where their over-confidence in the early stages of SC24 when solar activity was low belied their anticipation it would take off normally, not slowly as it did.

      This is the exact issue I addressed and warned against up thread for SC25, we just can’t tell very well now when the cycle will take off or peak, which has climate implications similar to the previous cycle pause, especially for dry summer heat and drought the longer the low activity persists, and for cold and ice in the winter as we’ve seen in recent years.

      Natural variability, earth’s energy imbalance is driven by solar variability.

      • Decadal forecasting was/is thought to be impossible, and yet, their forecast was remarkable accurate, and will be again. ’cause they include initial conditions and amazing algorithm and because they use ACO2 as the control knob.

        As did the guys who predicted warming over the first two decades of the 21st century would be .2 ℃ per decade, and that is shaping up to be almost the precise number.

        Which is why TN Palmer has said GCM have been remarkably accurate for the task they were asked to do: evolution of the GMST.

      • JCH the GCMs are fake science because CO2 is a warming outcome, not a warming driver, with “A” CO2 as just a small fraction of Mauna Loa CO2, lagging and not well-correlated:

        https://i.postimg.cc/Ss1m27JG/MME-vs-ML-CO2.jpg

        After the annual signal is removed by taking the 12-month change, it is easy to see the sea surface temperature sets the atmospheric CO2, so CO2 from any source isn’t driving the ocean, therefore, “A” CO2 isn’t the control knob:

        https://i.postimg.cc/MGtX0bmx/CO2-v-SST.jpg

    • Tim Palmer’s off the cuff remark was in the context of complaints that they had underestimated warming. That isn’t one of the very many problems of current generation model trajectories in opportunistic ensembles.

      https://watertechbyrie.files.wordpress.com/2019/12/palmer-and-stevens-box-2.png
      https://www.pnas.org/content/116/49/24390

      The planetary energy balance is the difference between how much solar radiation reaches Earth and the sum of outgoing reflected solar and emitted thermal radiation to space. A positive top-of-atmosphere (TOA) imbalance indicates that the planet is taking up heat, with ≈93% ending up as heat storage in the oceans and only ≈1% of the excess energy warming the atmosphere [1]. The remainder melts snow/ice and warms the land surface. Over long timescales, global mean net TOA downward radiation can be approximated as the difference between changes in radiative forcing and climate response [2,3,4]….

      At decadal timescales, when internal variations in the climate system dominate, the link between TOA radiation and surface temperature is more complex. https://www.mdpi.com/2225-1154/6/3/62/htm

      Non-unique CMIP6 solution trajectories may be running hotter – they are ad hoc choices between 1000’s of feasible solutions – because of higher expectations of cloud feedbacks – but they are still missing internal variability.

  49. Go back to 1880 or use Tonyb data to 1630.
    Scott

  50. I suggest the Fourier analyses of the observational realty of multiple proxies and direct measurements have determined strong cyclic components and, crucially, NO monatonic component at any significant level in the power spectrum. Which means no AGW effect. No models requires to check this, only contrary observation using this approach. There are arguments about the solar nature of the clearly observed cyclic causes. Weather is nota valid argument to deny the dating of cosmogenic radinuclides BTW, ebacause the most conservative time for them to fall to Earth is 1 year, a lot less that 11 years, and MUCH less than the year cycles clearly detected in the analysis. And NO AGW signal. None. Zip. etc.

    Just sayin’. The work of Ludecke and Weiss looked for cycles, then for corresponding effects. Steinhilber and Scafetta at least looked for variabilities attributable to solar wind changes using cosmogenic nuclides. The two corroborated each other. Tightly. The approach is clearly a credible prediction tool, as well as hindcasting at r=0.84. Better than yer CO2 and Temp.

    The forecast is down. From 2000 for decades, the only way is down. Then up. Then down, most probably slowly into the neo glacial as the last interglacial impulse is lost to space, as were all the others, both 100Ka and 41Ka. Better summary coming by PM.

  51. Sorry, I meant “monotonic”. And the cycles are circa 90, 210, 500 and 980 years. No post post editing in WordPress.

    • No post post editing in WordPress.

      (☹️)…

    • “Sorry, I meant “monotonic”. And the cycles are circa 90, 210, 500 and 980 years. No post post editing in WordPress.”

      THis is to see if i can quote using just quote character in WordPress.

    • Sorry, I meant “monotonic”. And the cycles are circa 90, 210, 500 and 980 years. No post post editing in WordPress.

      And now with the HTML

      Geek commends, unnatural act with a keyboard..

  52. Congratulations on your willingness to depart from the “CO2 as control knob” narrative which has dominated climate science for many years.

  53. 1. Earth’s Without-Atmosphere Effective Temperature Calculation:

    So = 1.362 W/m² (So is the Solar constant)
    Earth’s albedo: aearth = 0,30

    Earth is a rocky planet, Earth’s surface solar irradiation accepting factor Φearth = 0,47 (Accepted by a Smooth Hemisphere with radius r sunlight is S*Φ*π*r²(1-a), where Φ = 0,47)

    β = 150 days*gr*oC/rotation*cal – is a Rotating Planet Surface Solar Irradiation Absorbing-Emitting Universal Law constant
    N = 1 rotation per day, is Earth’s sidereal rotation period

    cp.earth = 1 cal/gr*oC, it is because Earth has a vast ocean. Generally speaking almost the whole Earth’s surface is wet. We can call Earth a Planet Ocean.
    σ = 5,67*10⁻⁸ W/m²K⁴, the Stefan-Boltzmann constant

    Earth’s Without-Atmosphere Effective Temperature Complete Formula Te.earth is:

    Te.earth = [ Φ (1-a) So (β*N*cp)¹∕ ⁴ /4σ ]¹∕ ⁴

    Τe.earth = [ 0,47(1-0,30)1.362 W/m²(150 days*gr*oC/rotation*cal *1rotations/day*1 cal/gr*oC)¹∕ ⁴ /4*5,67*10⁻⁸ W/m²K⁴ ]¹∕ ⁴ =
    Τe.earth = [ 0,47(1-0,30)1.362 W/m²(150*1*1)¹∕ ⁴ /4*5,67*10⁻⁸ W/m²K⁴ ]¹∕ ⁴ =

    Τe.earth = ( 6.914.170.222,70 )¹∕ ⁴ = 286,36 K

    Te.earth = 288,36 Κ
    And we compare it with the

    Tsat.mean.earth = 288 K, measured by satellites.

    These two temperatures, the calculated one, and the measured by satellites are almost identical.

    http://www.cristos-vournas.com

  54. Hi Dr. Curry, you say:
    Is the Sun is currently moving into a new grand minimum or just a period of low solar activity? Many solar physicists expect the sun to move into a new minimum during the 21st century: a century-level low, although several predict a minimum comparable with the Dalton or even the Maunder Minimum. …… If a Maunder minimum-scale event were to occur in the 21st century, how much cooling would this cause?
    ……. After the projected cool phase of the AMO, a return to the warm phase is expected, but there is no confidence in projecting either a warm or cold phase AMO in 2100.

    Timing of the next solar grand minimum is the critical factor of the natural variability that governs the North Hemisphere’s temperature trends. However there is an elephant in the room, nothing to do with the CO2, in form of a undercurrent periodicity which is due to peak in about 60 to 70 years. Since the ~60 year AMO periodicity characteristic for the NH is at its peak the next 30 years will lead to some cooling but the extent of it depends on if and when the next solar grand minimum occurs. In this link
    http://www.vukcevic.co.uk/NH-GM.htm
    I looked at possible alternatives:
    – If the grand minimum (GM) doesn’t start during the next 4-5 cycles then cooling will be minimal, about 0.2- 0.3 degrees (faint blue line)
    – Since grand minima tend to last (intriguingly?) around 60 years, if a the next GM is about to start with SC25 then it’s greatest effect might coincide with the AMO just lifting of the floor with total fall of about 0.7- 0.8, since the cumulative solar GM cooling is about 0.5C (dark green line).
    In about 60+ years time the AMO will be hitting next peak and any pending solar GM may well be over, resulting in the temperature rise of about 0.5C on the current level. It could be expected that the NH’s temperature gets up to about 1.5C on preindustrial levels. From there on is all way down hill.
    (i compiled the above estimate couple of years ago)

    • Vuk, thank you for the svalgaard santa pic. i sent it to my dad, who turned 90 years young on christmas day, and he really enjoyed it. (makes you think twice about sending a kid to the mall to see santa)…

    • If a Maunder minimum-scale event were to occur in the 21st century, how much cooling would this cause?

      Minor cooling, ice ages are causes by ice. Major ice ages are caused by a lot if ice, little ice ages are causes by lesser amounts of ice.

      It takes warm higher, thawed oceans to cause a major ice age with accumulated ice. It takes warm higher, thawed, oceans to cause a little ice age. We are warmer, oceans are higher, but it will take a few hundred years to accumulate the sequestered ice that will advance to cause the next little ice age. The solar changes do cause immediate correlations, but they are blips compared to the longer term results of ice sheet advances that requires years of more snowfall during warmer times.

      Study the ice core data, temperatures and ice accumulation rates, the truth can be found in the data.

  55. I just tripped over this while doing serious research on Maurice Strong et al. For those of you yet to see the reaction in the IPCC bunker in Geneva to the news that the people are realising the truth and rejecting their fascist dogma, here it is:

  56. Pingback: Believable eventualities for local weather trade: 2020-2050 – Daily News

  57. Judith,
    As I commented before the numbers on energy are wrong from a number of sources. Firstly eyeballing the CO2 spectrogram I estimate that CO2 obscures less that 2.4% of the relevant spectrum which limits in-band energy supply to about 9W per square metre of which 7.5 W is already absorbed (between Water and Carbon Dioxide). This makes scenarios near and above 1.5W per square metre CO2 “back radiation” impossible. I’d encourage you to more closely define the limits to inbound energy and apply those limits to ensure you are not evaluating over unity scenarios.

    One of my constant criticisms of the state of Climate Science today is that climate scientists assume outbound energy must equal inbound energy. As an engineer I KNOW this is not true – there are always losses. The proper approach is
    Inbound radiative energy + non-radiative energy gains – Non radiative losses = Outbound radiative energy.

    Non radiative energy gains and Losses are real and significant and you can’t hope to know the energy balance if you haven’t quantified all gains and losses within about 2 orders of magnitude of your resultant net forcing (say half a watt per square metre) . This means all energy transformations adding or subtracting 0.001 W per square metre or more should be included in the balance. You’ve not done this so your Net forcing numbers are likely to be significantly wrong.

    For example photosynthesis.
    6CO2 + 6H20 + (energy) → C6H12O6 + 6O2

    Photosynthesis activity rises with CO2 estimated about 15% since 1990 or around 0.5 % per annum. While hard to estimate I estimate that total photosynthesis extraction of inbound energy is around 6W/square metre so half a percent increase represents an energy term of -0.03 Watts per square metre per annum. It’s cumulative as the biosphere expands and the current 15% increase represents additional broadband inbound energy consumption around -0.9 Watts per square metre.(wpsm) overwhelming the estimated 0.6 wpsm warming bias from CO2

    In addition to this there is increased transpiration activity from the increase in foliage surface area that produces cooling that I have not yet estimated. Combining these figures suggests that the net effect of CO2 increase is cooling.

    There are biological processes that both add (cellular energy I estimate at about 3W per square metre) and subtract (conversion of cholesterol to vit-d), none of which are CO2 mediated but do influence the net balance and are not evaluated.

    Wind energy and wave energy is partly sunk into the planets kinetic energy and is extracted from the climate system that way.

    The planets kinetic energy is more than 200 billion times annual insulation and if only a small fraction leaks into/out of the climate it is set to have a major impact on planetary climate. For example the centripetal force of earth’s rotation causes a gravitational potential difference between the equator and poles which causes polward water and air currents. Those currents produce friction… how much?

    Judith, at the very least an estimate of CO2 photosynthesis sinking of broadband inbound light energy and associated increase in leaf area transpiration cooling must be included in forecasts because it is CO2 mediated , cumulative and if my estimates are anywhere near correct could increase sufficiently enough to offset the entire remaining in-band energy available to the CO2 greenhouse process (plus feedback).

    Please consider these issues in your work.

    • Further to my comment. Climate science ate the beginning has justified the unlimited in-band energy input assumption (no saturation) by making an assumption that as the partial pressure of CO2 increases so will the width of the absorption band. I think you should take time to examine this assumption. This was assumed because Mars had a thin CO2 line earth a wider one and Venus wider still roughly in line with atmospheric pressure.

      I believe this is incorrect, the width of the CO2 line is caused by the Doppler effect of gas molecules travelling at high speed toward and away from the observation platform. Given a gas at a different temperatures consist of many particles travelling at a speed given by a normal distribution around the velocity average for a gas at that temperature. Molecules travelling away from the observer have an emission wavelength longer than the median by an amount that is velocity (temperature) dependent and emitting molecules travelling toward the observer have an apparent shorter wavelength. This gives the blurred absorption band we see where the width of the line depends on the TEMPERATURE of the gas which in turn depends de on atmospheric density and solar input to each planet, Venus is hotter than earth which is hotter than Mars explains the difference in bandwidth between the planets.

      If my physics is correct then energy input to CO2 process is fixed – not variable and CO2 warming will saturate at around +1.5wpsm relative to now.

      As it is I am unconvinced that even if the unlikely physics relating partial pressure to line width was true that bandwidth would expand fast enough to accommodate the infinite energy assumption.

  58. Mars’ Effective temperature calculation
    Te.mars

    (1/R²) = (1/1,524²) = 1/2,32
    Mars has 2,32 times less solar irradiation intensity than Earth has
    Mars’ albedo: amars = 0,25

    N = 1 rotations/per day, Planet Mars completes one rotation around its axis in about 24 hours
    Mars is a rocky planet, Mars’ surface solar irradiation accepting factor: Φmars = 0,47

    cp.mars = 0,18 cal/gr oC, on Mars’ surface is prevalent the iron oxide

    β = 150 days*gr*oC/rotation*cal – it is a Rotating Planet Surface Solar Irradiation Absorbing-Emitting Universal Law constant
    σ = 5,67*10⁻⁸ W/m²K⁴, the Stefan-Boltzmann constant
    So = 1.362 W/m² the Solar constant

    Mar’s Effective Temperature Complete Formula is:

    Te.mars = [ Φ (1-a) So (1/R²) (β*N*cp)¹∕ ⁴ /4σ ]¹∕ ⁴

    Planet Mars’ Effective Temperature Te.mars is:
    Te.mars = [ 0,47 (1-0,25) 1.362 W/m²*(1/2,32)*(150*1*0,18)¹∕ ⁴ /4*5,67*10⁻⁸ W/m²K⁴ ]¹∕ ⁴ = 213,59 K

    Te.mars = 213,59 K
    The calculated Mars’ effective temperature Te.mars = 213,59 K is only by 1,7% higher than that measured by satellites.

    Tsat.mean.mars = 210 K !

    http://www.cristos-vournas.com

  59. Pingback: Weekly Climate and Energy News Roundup #399 -

  60. Pingback: Weekly Local weather and Power Information Roundup #399 – Daily News

  61. “Clustered occurrence of strong tropical eruptions has contributed to sustained cold periods such as the Little Ice Age”

    That is a myth and is backwards. Most large tropical eruptions occur soon after very cold northern hemisphere winter periods and on a warm burst. They typically slightly warm 1-3 subsequent northern hemisphere winters via a positive AO/NAO influence.

  62. “Is the Sun is currently moving into a new grand minimum or just a period of low solar activity? Many solar physicists expect the sun to move into a new minimum during the 21st century”

    My findings on the ordering sunspot cycles and centennial minima show that this centennial minimum effects only cycles 24 and 25. The bulk of the increased negative AO/NAO conditions during a centennial minimum occurs roughly between the peaks of the first and last sunspot cycles of the centennial minimum. Which in the Dalton Minimum was through 1807-1817, and in the Gleissberg Minimum 1885-1895. Silverman, 1992, shows no observed auroras through most of the colder years of the Dalton Minimum for Europe. The potential period for the greater amount of negative AO/NAO conditions through this centennial minimum would be 2015 to around 2025. But in 2017-18 there was a Jovian configuration type that drove the heatwaves of 2003, 1976, 1934, and the remarkably mild 1686 in the Maunder Minimum. By now there is only a five to six year window for increased negative AO/NAO states typical of the central part of a short centennial minimum, which could make this one of the mildest centennial minima for over 1000 years.
    The global context of increased negative AO/NAO conditions is increased El Nino conditions and a warm AMO phase, which reduce low cloud cover (increase in the Arctic). Which is the pattern we have seen since 1995 with the weakening of the solar wind since then. The globe cools when the solar wind is stronger like in the early 1900’s and in the early-mid 1970’s, because it drives colder ocean phases via positive AO/NAO states, at seasonal to inter-annual scales.

  63. “The timing of a shift to the AMO cold phase is not predictable; it depends to some extent on unpredictable weather variability”

    I do not agree that weather variability is unpredictable, and evidence that weather variability is solar driven, is then also evidence that the AMO is solar driven and not unforced and internal.
    At the scale of solar cycles, while the AMO remains in its warm phase, cooler anomalies are more likely around sunspot maximum, like the 2013-15 cool blob, and the warmest anomalies are typically around sunspot minimum. Prediction of the transition to the next cold AMO phase is dependent on prediction of the solar wind strength, which the length of this centennial solar minimum is central to.

    http://www.woodfortrees.org/graph/esrl-amo/from:1880/mean:13/plot/sidc-ssn/from:1880/normalise

  64. Any modelling including irrelevant CO2, but excluding all important contrails, is totally futile. It would be a lengthy discussion explaining why CO2 is totally overestimated as a GHG, or why GHGs overall overrated. As matter of fact most of the “GHE” is due to clouds anyway.

    However, the evidence is overwhelming if you only look at where and when the warming occurs. It is exactly where air travel is located, that is mainly in the NH, less in the SH, none on Antarctica.

    https://www.climate-debate.com/forum/attachments/uah.png

    Btw. Antarctica should be specifically sensitive to a GHG CO2, since there is extremely little vapour, if it would play any role at all.

    Also the “when” is extremely revealing. If we plot global temperatures against solar activity, we see autonomous warming starting in the 1970s. This again is far too late for CO2, but perfectly fits the evolution of air travel.

    https://www.climate-debate.com/forum/attachments/airtravel0.png

    https://www.climate-debate.com/forum/attachments/airtravel1.png

    Now can even explain why the so called projected “hot spot” is not happening. Even though contrails are heating the planet, they also dim the sun for all the weather system underneath. This dimming inhibits evaporation as much as the warming due to contrails promotes it. The net effect is largely neutral, or even negative.

    https://wattsupwiththat.files.wordpress.com/2012/02/image25.png

  65. Amazon’s Jeff Bezos pledges $10bn to save Earth’s environment
    “This global initiative will fund scientists, activists, NGOs – any effort that offers a real possibility to help preserve and protect the natural world. We can save Earth.” https://www.theguardian.com/technology/2020/feb/17/amazon-jeff-bezos-pledge-10bn-fight-climate-crisis
    Amazon unveiled its “climate pledge” last year, which aims to reach the goals of the Paris Agreement 10 years early, and commits the retailer to operate on 100% renewable electricity by 2030 https://www.cnbc.com/2020/01/15/jeff-bezos-anyone-who-denies-climate-change-is-not-being-reasonable.html

  66. Thank you Judith for an excellent discussion. I could wish it to be a bit less nuanced, but I understand the necessity. You don’t want to be categorized.

    The summary might be that with the knowns, and the known unknowns, and allowing for the unknown unknowns, the world is going to get either cooler or warmer or stay about the same. Place your bets.

  67. Well I’m no expert as Juddith is but ive been saying the same for a couple of years. A minor change in the earth’s orbit around the sun, change in the Sun’s radiance, change in earth’s magnetic field, variances in earth’s ones core & crust, changes in earth’s inner makeup & gas releases such as methane all contribute to our planets climate. Humans do also, but to what extent? Coal fired plants do have to disappear from the surface of this planet.

    • “Coal fired plants do have to disappear from the surface of this planet.”

      Why?

    • Why do coal fired plants need to disappear? Perhaps explaining would help…..

      Coal fired plants are only a problem where they are unscrubbed. So scrub emissions so only clean CO2 and water vapour is left, and what is then the problem?

      In the UK we rose to prosperous developed status on coal over 200 years. China is doing the same, faster. Should have scrubbed their chimneys. But people, who were dying on all kinds of incurable diseases back then, probably didn’t die much sooner because of that , mainly of the poverty and overwork imposed by greedy elites they were later lifted from by the social reform that forced the capitalists to share the wealth generated by increased energy use per person doing the work. It got better as a little wealth was allowed to trickle down to the people and was also used to clean up using the surplus we generated. We have far lower levels of pollution from generation and vehicles now, mainly because we prefer clean gas, and also paid to clean our buildings, although much of that was using coal for direct heating, which we largely ended using gas, and bit of oil where the grid didn’t go.

      It really is important to understand the subject and be specific about the statements we make, it all depends how the energy is purified from primary fuel to do work, and how the emissions are treated. Gas is clean, for example,. I don’t agree CCS is necessary for coal, because CO2 is not a real problem, and certainly not a pollutant, ask the plants. But other emissions are pollutants and do cause avoidable problems for people, as do particulates. Scrubbing and filtering is affordable given coal is the cheapest available fuel, and plentiful. The benefits of plentiful cheap energy from coal to society vastly outweigh the problems, when generated in modern technologies. Gas has no such problems, but only in fact.

      While we have gas, gas powered cars would be far better in cities than electric, as no charging points are necessary, we have a gas grid and could recharge quickly, perhaps liquify gas at gas stations. However, given cars are now so clean, home heating at 90% efficiency is by far the best use of this fuel. City centre mass transit needs improving, coukd be gas or electric, more busses less bicycles on the scarce road space. BIkes are not a commuting option except for a few who must use them and some overpaid virtue signallers, using the space for clean mass transit is far more logical, BTW. Facts before politics?

      ICE Vehicles: I also attended a lecture recently by an automobile expert academic from IC who is also ex Shell and real World business who pointed out that in some cities cars now clean the air they use, the exhausts are cleaner than the intake air….. that is how far we have come in emissions control.

      POINT: The dogmatic statement of problems that aren’t real and solutions that don’t work, or are totally unnecessary in fact, run throughout this discussion. Because politics and belief come before the quantified science and technology in the pubic debate. So much easier to avoid the quantified facts that made us developed and properous. Our “developed” economy is under threat from people with undeveloped minds. We die in harmony with nature. etc.

  68. What a splendid discussion! Thank you, Brian. That reminds me that we have progressed from high carbon to low carbon fuels over the millennia – wood to coal to oil to gas to nuclear – without any need for regulation or supervision. I’m also reminded that when we developed fire we developed the risk of burning down forests and dwellings, and that is an ominous note for nuclear power…

    Perhaps if the Chinese were not totalitarian they would have developed cleaner cities by now. They still use a lot of bicycles.

    Didn’t Boris commute for years by bicycle? Lots of clang associations here, sorry…

    • Jim: Thank you. While I have added economics to the natural energy generation progression, and also the ability of wealth to protect us ever better from natural famine, pestilence, disaster and war, I was building on the work of Cesare Marchetti who Prof Colin McInnes introduced me to, along with Vaclav Smil and Jesse Ausubel. Serious physicists addressing the energy subject without CO2 bias. They covered energy reality long ago. As did Doug LIghtfoot in Canada and David MacKay.

      Link below includes Colin’s killer one page review of the subject for the Scottish Herald, on energy intensity, also David MacKay’s synopsis and ebook.

      https://www.dropbox.com/s/0hpoulzcmaa82od/Energy%20Intensity%20Papers.zip?dl=0

  69. Pingback: Plausible Scenarios for Global Warming – Hoax And Change

  70. Pingback: Plausible Scenarios for Global Warming – Right Rant

  71. Pingback: PLAUSIBLE SCENARIOS FOR GLOBAL WARMING | Simply America

  72. Pingback: Climate – Living in a Tunnel

  73. Judith – “All three modes of natural climate variability – volcanoes, solar and internal variability – are expected to act in the direction of cooling during this period.”

    Since the early 1800’s Totals Solar Irradiance has been increasing to a peak circa 1950 with a mild decrease through present day, though still higher than the early 1900’s.

    In your assessment of natural variability, is there a significant delay in the effect of TSI such that the earth should still be warming and how is that factored into your model of natural variability

    • Doug Sterling: I agree with that, except to add the logarithmic effect is reducing with CO2 concentration, not increasing. Cool. No runaway, an obvious nonsense when the main feedback of 150W/m^2 from evaporation and albedo increases exponentially with temperature. And yes, the observations in the low tropical troposphere disprove GHE amplification of the smaller natural GHE as modellers theorise. The observations say no. So they are wrong.

      joe – Dallas: Also re solar effects, the effects are shown to be due to solar winds linked to cloud formation by cosmic fay effects, observed by variable cosmogenic radioisotopic density, not irradiance.

      The natural evaporation control of the dominant oceans compensates for variable solar radiance and can maintain a roughly stable equilibrium surface temperature as irradiance varies. But the effect of higher cosmic ray flux when solar winds are low is to form more cooling clouds, and cosmic ray flux cannot be controlled by the oceanic response, so the ocean SST lowers to establish a new equilibrium SST that maintains the solar insolation level, effectively.

      So low solar winds deliver a cooling SST effect. And vice versa. Variable solar irradiance is largely compensated for by the oceanic SST response. There is obviously some link between sunspots, solar activity and solar winds, but its certainly is not 1:1 in power or timing. Perhaps the Parker Probe will tell us more, but its not there for long, or is it?

      Observations? Peak was around 2,000 when the three main cosmic ray cycles demonstrated in the cosmogenic particle record by Steinhilber, and then found in the various proxy temperature records by Ludecke and Weiss, combined positively, so reinforced. All are three are now declining, but the temperature we use to determine global effects is 30 year average, so reduction in that average can be expected from 2015 as the tail stops rising and all values in the average are trending down. I think?

      Steinhilber 2009 – Cosmogenic basis: DOI/10.1029/2009GL040142
      https://www.dropbox.com/s/dqkzwqzix52b2tf/Steinhilber%202009.jpg?dl=0

      Ludecke & Weiss 2017- ST Proxies: DOI: 10.2174/1874282301711010044
      https://www.dropbox.com/s/vm960l6x456e5zz/L%26W%20Fourier%20Plot.jpg?dl=0

      Given the inevitability of the natural cycles detected in the observed record, I suggest that this is the most probable future, as the effects are proven and characterised and there are no proven offsetting causes of significance arising from any AGW effect, which would have monotonic signal that is not seen in the observations. i.e. The natural effects are real, confirmed by observations, versus modelled predictions which are not confirmed by observations, and Fourier frequency analysis is well proven physics. e.g. It’s not climate science. Its real deterministic science. So provable. QED.

      With apologies to a far greater physicist: For climate science to be proven, “reality must take precedence over public relations, for nature cannot be fooled.” Actual scientific criticism, in this spirit, as to the reported data and methods published above, welcome.. CEng, CPhys.

      • brianrlcatt
        Weaker solar wind increases El Nino conditions and drives a warm AMO phase, as since 1995.
        https://www.linkedin.com/pulse/association-between-sunspot-cycles-amo-ulric-lyons/

      • Do you have any evidence using spectral/frequency analysis that El Ninos are cyclic. from whatever cause. Solar, gravitational, etc. ?

        I have seen none. The causal warming occurs in the most active area of the ring of fire, consistent with seismic activity, which suggests submarine ocean warming to me. But no clear cycles, which I would expect from a recurring event in the “solid” Earth, as with the MIlankovitch cycles that produce observed volcanic maximums at times of peak gravitational hence seismic stress. But not on time scales of a few years. Seasonally from the changing range of Diurnal gravitational/solid tides, and at MIlankovitch period maximums, yes, but nothing in between. Yet…..

        I am hoping to find someone who understands how the planetary gravitational effects on the Earth combine over time., Jupiter being the large player here, together with the moon and Sun. Insight welcome, particularly with references to scientific literature.

      • I would suggest that it concerns monthly-seasonal scale solar wind speed variability driving anomalies in the annular modes and teleconnected to the trade winds. There is strong tendency for slow solar wind at or just after sunspot minimum and an associated El Nino episode, but at sunspot maximum it can go either way, it’s all very messy.

      • Solar winds are messy? This recent communication from Nicola Scafetta may be of interest, it addresses these issues.

        https://rdcu.be/b2ep0

        https://rdcu.be/b2enx

      • This addresses these issue, the gas giants order lots of the biggest seasonal to inter-annual scale variability in the solar wind strength.

        https://www.linkedin.com/pulse/major-heat-cold-waves-driven-key-heliocentric-alignments-ulric-lyons/

  74. Professor Curry;
    You write “The amount of warming the world is projected to experience from emissions is approximately linearly proportional to cumulative carbon emissions”. Could you please explain further why the amount of warming due to CO2 is linearly proportional and not logarithmic? I had thought that the logarithmic nature of CO2 greenhouse warming is well established in physics, and that any other theorized warming effects of CO2 (such as inducing positive warming feedback by water vapor) have not yet been validated by empirical evidence. Am I misunderstanding something?

  75. Pingback: Weekly Climate and Energy News Roundup #399 – Climate News Live

  76. As an unrepentant lukewarmer, it has long been my opinion that some combination of natural and anthropogenic processes has locked an increase of roughly two degrees C above pre-industrial into the earth’s climate system.

    The illustration below, dated 02/20/2020, contains my latest graphical analysis for predicting where Global Mean Temperature, as measured by HADCRUT4, will likely end up by the year 2100.

    https://live.staticflickr.com/65535/49580315897_bf2587ab7a_o.png

    As was the case with Beta Blocker’s Parallel Offset Universe climate Model first presented here on Climate Etc. in 2015, this latest graphical analysis is totally self contained. Every element of the analysis can either be read directly from the illustration or else can be readily inferred from some other graphical or text element shown on the same illustration.

    KEY ASSUMPTION:

    The 1850-2019 HADCRUT4 Global Mean Temperature record includes the combined effects of all natural and anthropogenic climate change processes as these have evolved through time over the past one-hundred seventy years. These same processes will operate from 2020 through 2100.

    ANALYSIS METHOD:

    The data plot for HADCRUT4 Global Mean Temperature 1850-2019 is sourced from the woodfortrees.org online interactive data plotting application.

    Major discrete trends in 1850-2019 GMT data are visually identified from the HADCRUT4 data plot and approximate decadal trend rates are assigned.

    Based on past warming patterns in GMT trends, upper and lower boundaries are identified for the post-2020 prediction envelope using maximum and minimum rates of +0.19 C/decade and +0.05 C/decade, respectively.

    The maximum and minimum Year 2100 end points of +2.7 C and +1.3 C are expanded by 0.3 C above and below to establish the GMT prediction envelope’s boundary. The difference between +2.7 C and +1.3 C is split to produce a ‘more likely’ final Year 2100 end point of approximately +2 C above 1850 pre-industrial.

    Under the assumption that the 1850-2019 HADCRUT4 GMT record includes the combined effects of all natural and anthropogenic climate change processes, as these have evolved through time over the past one-hundred seventy years, plausible ‘more likely’ and ‘less likely’ pathways within the Year 2100 GMT prediction envelope between 2020 and 2100 are identified.

    The ‘more likely’ GMT pathway between 2020 and 2100 is consistent with the historical pattern of warming, then cooling, then warming that occurred in an ever-upward stepwise progression between 1850 and 2019.

    ANALYSIS CONCLUSIONS:

    The ‘more likely’ Year 2100 end point scenario places the rise in global mean temperature at approximately +2 C above 1850 pre-industrial. End points significantly above or below +2 C are possible but are judged to be less likely.

    • What is the causal basis for these predictions? Extrapolation of monotonic short term trend data when in fact its demonstrably cyclic? The only supportable science, based on observations of temperature , FIg (i), and clearly well correlated solar causes Fig (ii), says temperatures will cool this century, as all the three main cycles observed in the record move into the declining phase of their cycles. AKA cooling. Fig (iii).

      Similar but not identical to the period from 1000 BP to the 1650’ish/Little Ice Age. It won’t be as warm as now for another 1,000 years, all based on the natural cyclic record we have found in the last decade of progressive climate science, Not the IPCC political science variety.

      The first cycle to turn positive again is the 200 year cycle at 2100, with a short perturbation from a smaller 70 year cycle at 2060, while the 500 and 1,000 year cycles will be descending for 250 and 500 years respectively, to the next Little Ice Age in 2500 or so. See Graph 3. THat’s what the natural reality we observe says, but not monotonic short term models that ignore the dominant natural cycles. I used round number periods. Hope that is clear.

      If you prefer real deterministic science to models that can’t, this is it. New science using proper tested physical sciences done in the last decade. Emprical evidence DERIVED from observation says the opposite to the claims of modellers that observations prove wrong, in fact. Supported only by their beliefs, not observations. Which to trust?

      Fig (i)
      https://www.dropbox.com/s/j277fmptjah8wea/L%26W%20Fourier%20Plot%20Anotated.jpeg?dl=0
      Fig (ii)
      https://www.dropbox.com/s/abprulsn4f5wkxo/Steinhilber%20Graph%202009.jpg?dl=0
      Fig (iii)
      https://www.dropbox.com/s/771k4cahlxndt7l/Ludecke%20und%20Weiss%20Graph.jpg?dl=0

  77. “All three modes of natural variability – solar, volcanoes, internal variability – are expected to trend cool over the next 3 decades”

    Therein lies the greatest error in climate science, the internalisation of natural climate variability, and its separation from its solar forcing. The elephant in the room is the AMO. If the solar wind temperature/pressure had not declined since 1995, the AMO and Arctic would not have warmed. The coldest AMO anomalies in the early to mid 1970’s, the mid 1980’s, and the early 1990’s, were during the strongest solar wind conditions of the space age. I expect the AMO to cool again from the mid 2030’s when the solar wind strength picks up again, with the colder anomalies tending toward sunspot cycle minimum, as also occurred with the three cold AMO anomalies around 1904, 1914, and 1924.

    • Steven Yaskell

      As regards this incredible oversight, I have consequently grown mystical after several publications on solar science. I harken back to Galileo and his treatment by the Catholic Church, even Giordano Bruno on the same matter (and much more harshly). Even Aristarchus. Again and again I’ve reasoned, preached, begged: dead ears. “It cannot possibly be!” they say, “since I cannot imagine it!”

      • The main evidence is staring everyone in the face, that during centennial solar minima, the AMO is warm, and El Nino conditions increase. Yet everyone focuses on the idea that inter-decadal global surface temperature changes should follow forcings, and look to lower sunspot numbers or aerosols for the 1970’s global cooling. With proponents of solar forcing then inventing lags for post 1995 global warming, and AGW proponents saying there’s the warming we warned you about. Both blind to how ocean phases act as negative feedbacks to net changes in climate forcing.

  78. Pingback: Energy & Environmental Newsletter: March 2, 2020 - Master Resource

  79. Pingback: Weekly Climate and Energy News Roundup #399 | Watts Up With That?

  80. The proximate cause of 21st century warming is SW changes primarily as a result of SST/cloud feedback in the eastern Pacific.

    https://www.mdpi.com/climate/climate-06-00062/article_deploy/html/images/climate-06-00062-g002-550.jpg
    https://www.mdpi.com/2225-1154/6/3/62/htm

    Energy is stored in oceans.

    https://watertechbyrie.files.wordpress.com/2020/03/lin3.jpg

    And ultimately warms the atmosphere as energy is lost to space. Focus on surface warming as a measure of anthropogenic warming is empty noise.

    https://watertechbyrie.files.wordpress.com/2018/10/mei-v-hadcrut1.png

    The Pacific state shifts at decadal to millennial scales – making predictions impossible.

    e.g. https://journals.ametsoc.org/doi/full/10.1175/JCLI-D-12-00003.1?mobileUi=0