by Judith Curry
The National Academies Press has published a new document: Frontiers in Decadal Climate Variability: Proceedings of a Workshop.
Excerpts from the Overview and Introduction provide context:
Many factors contribute to variability in Earth’s climate on a range of timescales, from seasons to decades. Natural climate variability arises from two different sources: (1) internal variability from interactions among components of the climate system, for example, between the ocean and the atmosphere, and (2) natural external forcings, such as variations in the amount of radiation from the Sun. External forcings on the climate system also arise from some human activities, such as the emission of greenhouse gases (GHGs) and aerosols. The climate that we experience is a combination of all of these factors.
In September 2015, the Board on Atmospheric Sciences and Climate and the Ocean Studies Board of the National Academies of Sciences, Engineering, and Medicine convened a workshop to examine variability in Earth’s climate on decadal timescales, defined as 10 to 30 years. During the workshop, ocean and climate scientists reviewed the state of the science of decadal climate variability and its relationship to rates of human-caused global warming, and they explored opportunities for improvement in modeling and observations and assessing knowledge gaps. This report summarizes the workshop presentations and discussions.
A major line of inquiry discussed at the workshop is the degree to which natural variability modulated human-caused climate change during the recent warming slowdown, as well as during past periods of increased or accelerated warming, such as from 1970 to 1998. Also discussed was the extent to which previous results are a function of data coverage or remaining biases in sea surface temperature (SST) reconstructions.
The specific mechanisms driving decadal variability, not only in the Pacific but also in all of the ocean basins, are subjects of intense scientific inquiry.
Because the storage of heat in the ocean has been implicated in the recent warming slowdown as measured by GMST, participants discussed the limitations of using GMST as the primary metric of global climate change. Many participants supported the notion that, because 93 percent of the excess heat from GHGs is stored in the ocean, sea-level rise, or sea-level rise together with GMST, may be a more appropriate metric of global climate change.
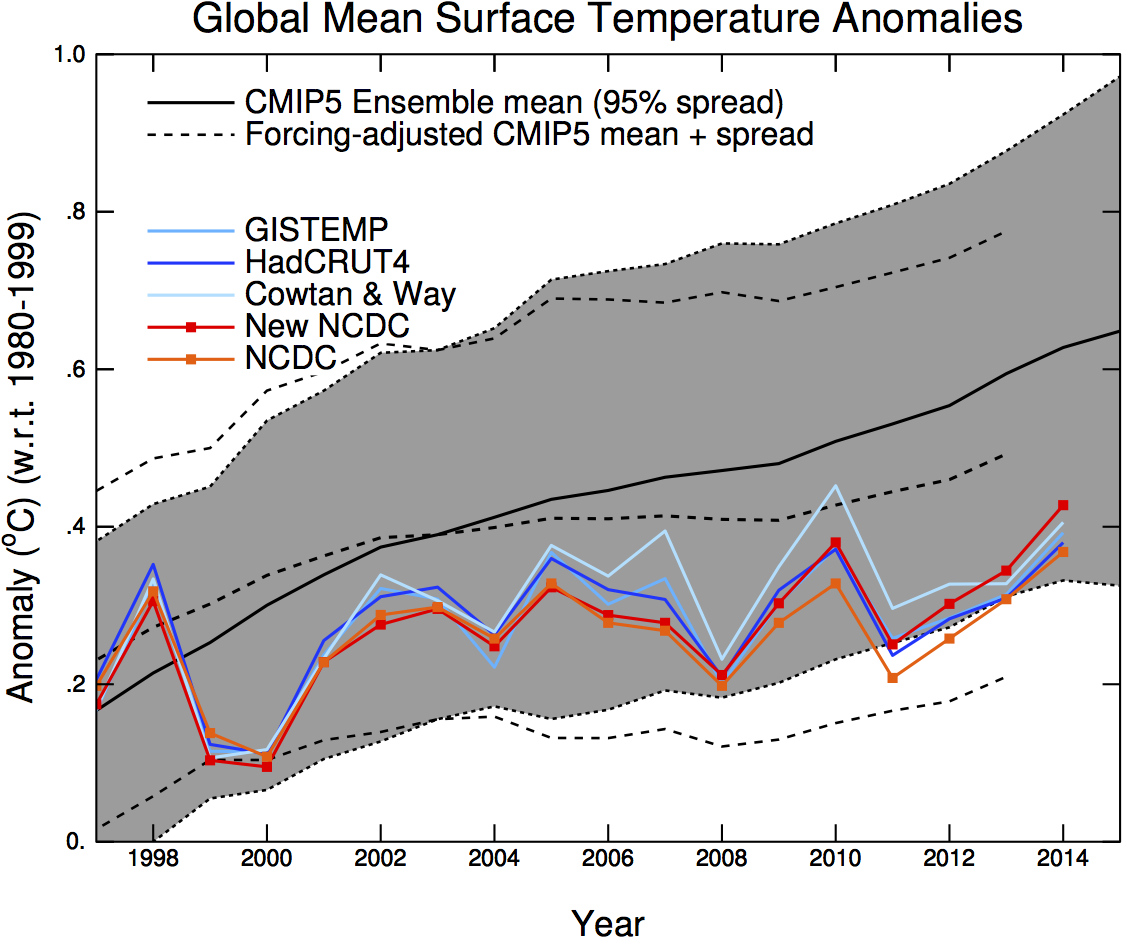
Variability at decadal timescales is a well-known feature of the climate system. Climate models produce periods of slower and more accelerated warming, although a specific slowdown in the GMST warming trend in the early 2000s was not directly projected by climate models (the warming trend during this period was near the lower edge of the 5-95 percent range of projections from the Coupled Model Intercomparison Project Phase 5. Much remains to be learned before scientists will be able to make skillful predictions of variability on these timescales, however.
The slowdown in the GMST warming trend during the early 2000s spurred a lot of research aimed at identifying variability in observations and models, as well as attributing its mechanisms.
- What physical mechanisms can explain recent as well as past decadal variability?
- How much of the variability in recent trends in surface warming is due to internal, natural variability versus external forcing, and how does this attribution vary as a function of timescale?
- Given what is known today about the controls on decadal variability, what can be said about the future?
- Are such accelerations and slowdowns predictable?
- What observations, data synthesis, and improvements in climate models might be needed to provide comprehensive answers to such questions?
- Finally, what is the best way to measure the influence of human-emitted GHGs on the global climate?
- Is GMST the best metric?
- Misc insightful statements from the text:
The closing section on Frontiers and Research Opportunities identifies the following knowledge gaps:
Although much progress is being made toward understanding decadal variability, as presented at the workshop, important questions remain, in particular in separating the contributions of each proposed driver. Many of the mechanisms examined might be driving decadal variability, but what is driving the mechanisms themselves? For example,
- If Pacific Decadal Variability (PDV) is a combination of different modes, how can they be parsed out? What role does each play? What is the mechanism for each mode?
- Although the North Atlantic Oscillation (NAO) seems to drive Atlantic Multidecadal Variability (AMV), what drives NAO multi-decadal variability?
Other knowledge gaps include the following:
- The connection between Arctic sea ice loss and mid-latitude weather, and the consequential regional effects;
- The role of and quantitative data on stratification of the deep Southern Ocean;
- The relative importance of atmospheric vs. oceanic bridges in linking stochastic processes at mid-to-high latitudes (how does local atmospheric forcing produce remote response(s) on decadal timescales?); and
- How heat trapped in the ocean will be transported into the deeper layers in the one or two decades and how that might affect global temperatures in the future.
In addition to improving prediction capabilities, addressing the gaps in knowledge of decadal climate variability could lead to better-informed climate change attribution studies, that is, the ability to detect the signals of anthropogenic climate change and internal variability distinctively for certain events with much greater accuracy. Both the prediction of decadal climate variability and attribution of specific climatic events and trends can be used to better inform decision makers.
JC reflections
It is certainly gratifying to see this topic being addressed by the NAS, since decadal variability is too often dismissed by the ‘establishment’ as climate ‘noise.’ The questions asked in the report, and the knowledge gaps, raise the important unresolved issues.
There are no particularly new insights in the report, and there is much interesting (and recent) research on this topic that didn’t get mentioned. The most scientifically interesting chapter is the one on Modes and Mechanisms of Internal Variability, particularly Mechanisms Driving Pacific Decadal Variability (specifically, the work of Antoinette Capotondi). There is also an interesting section The Role of Uncertainty, mostly from the work of Baylor Fox-Kemper, that addressed uncertainties air/sea exchange rates and the deep storage of heat in the ocean.
What is missing from the report is the longer term context of multidecadal to millennial variability, and the importance of paleoclimate observations. Without this context, we are not going to make much progress on understanding and predicting the decadal variability in the Atlantic, Pacific, Indian Oceans.
The report of course includes the ‘obligatory’ statements:
- The Earth system (land, atmosphere, and ocean) continues to steadily warm through time in response to increasing greenhouse gases (GHGs) in the atmosphere from human activities.
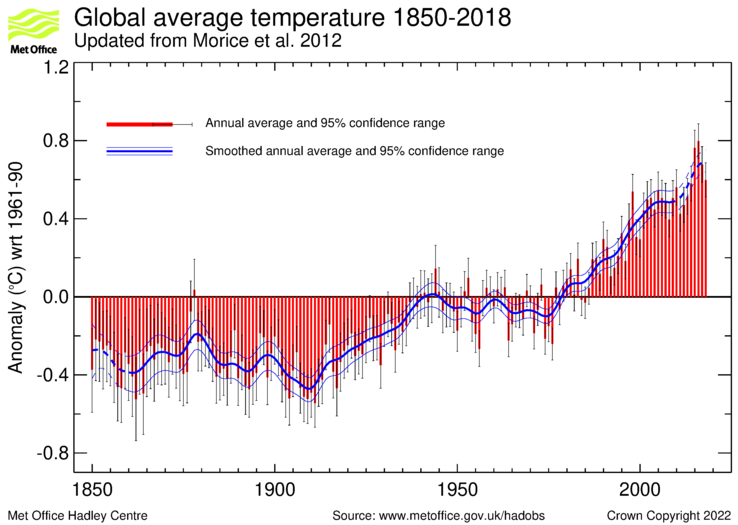
- A slowdown in the rise of GMST is not equivalent to a slowdown in global warming. Viewed over long time periods (50+ years), there is a persistent increase in GMST. However, it remains important to understand the decadal variability in GMST that is observed over shorter time periods.
- Longer trends (50 years or more) in observed global mean surface temperature (GMST) in the recent century largely reflect increases in anthropogenic greenhouse gases.
Until these issues and knowledge gaps are sorted out, we don’t have the basis for making the above statements with high confidence.
Here’s to hoping that the climate community is ready to take more seriously the natural climate variability on time scales from decades to millennia.
Leave a Reply