
By Judith Curry
It is therefore suggested to use either the more robust tropospheric temperature or ocean surface temperature in studies of climate sensitivity. – Cederlof, Bengtsson, Hodges
The discrepancies among temperature datasets, not to mention the temporal changes in individual datasets, fuels much debate about exactly how much the Earth is warming. Previous CE posts on this topic can be found [here].
An important new paper on this topic has just been published by Tellus:
Assessing atmospheric temperature data sets for climate studies
Magnus Cederlof, Lennart Bengtsson, Kevin Hodges
Abstract. Observed near-surface temperature trends during the period 1979–2014 show large differences between land and ocean, with positive values over land (0.25–0.27 °C/decade) that are significantly larger than over the ocean (0.06–0.12 °C/decade). Temperature trends in the mid-troposphere of 0.08-0.11 °C/decade, on the other hand, are similar for both land and ocean and agree closely with the ocean surface temperature trend. The lapse rate is consequently systematically larger over land than over the ocean and also shows a positive trend in most land areas. This is puzzling as a response to external warming, such as from increasing greenhouse gases, is broadly the same throughout the troposphere. The reduced tropospheric warming trend over land suggests a weaker vertical temperature coupling indicating that some of the processes in the planetary boundary layer such as inversions have a limited influence on the temperature of the free atmosphere. Alternatively, the temperature of the free atmosphere is influenced by advection of colder tropospheric air from the oceans. It is therefore suggested to use either the more robust tropospheric temperature or ocean surface temperature in studies of climate sensitivity. We also conclude that the European Centre for Medium-Range Weather Forecasts Reanalysis Interim can be used to obtain consistent temperature trends through the depth of the atmosphere, as they are consistent both with near-surface temperature trends and atmospheric temperature trends obtained from microwave sounding sensors.
Citation: Tellus A 2016, 68, 31503 [link to full manuscript]
The most significant aspect of this paper is incorporation of the ECMWF Interim Reanalysis dataset:
An independent approach is to compare temperature from operational analyses as done in numerical weather prediction. As was originally proposed by Bengtsson and Shukla (1988), this requires a dedicated data assimilation system to avoid systematic biases. In this study, we make use of recent re-analyses from the European Centre for Medium-Range Weather Forecasts (ECMWF). A main objective of this study is to explore whether the ECMWF Interim Reanalysis (ERAI) data set can reproduce credible temperature trends over a significant period of time.
However, global temperature records of the troposphere can only be used for limited time periods as data are only available globally with suitable accuracy since 1979 because of limited upper air observations from the Southern Hemisphere (SH) and the tropics before this date. Radiosonde data on their own have not been considered, because except when controlled and integrated into data assimilation, these data are subject to significant network and instrumental changes. For this reason, we do not intend to use observations from the free atmosphere directly but instead use re-analyses, though we will also use temperatures derived from microwave sounders for comparison.
As part of the re-analysis process, the observational data undergo an advanced data bias control. Satellite and aircraft data, assimilated by the re-analyses, have undergone systematic evaluation for the period after 1979, and we therefore believe that the re-analysis data can be considered as a reasonably independent robust source of tropospheric data
An alternative to using the tropospheric temperatures is to use sea surface temperatures (SSTs). The atmospheric temperature approximately 2 m above the ocean surface on average does not differ from the SST in a significant way, and temperature trends calculated over many years are expected to be the same as that of the SST.
The main results are summarized in the figures and tables below:

Fig. 1. Global mean surface temperature trends for the period 1979–2013 for ERAI, GISSTEMP and HadCRUT4.

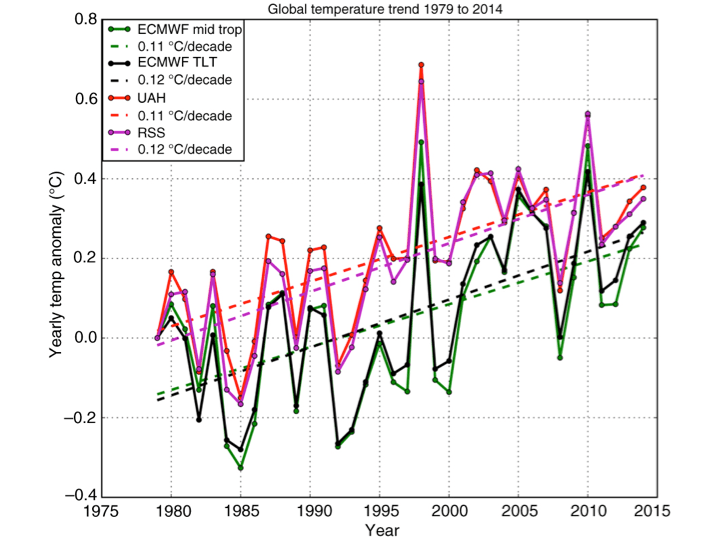
Fig. 3. Global mean upper air temperature trends for the period 1979–2013 for ERAI, UAH and RSS.
 From the Discussions and Conclusions:
The results show that surface air temperature changes over land are significantly larger than those over the oceans. This is to be expected because of the limited heat capacity of land surfaces compared to the ocean as was already demonstrated in early climate simulation studies. Other possibilities could be associated with changes in surface albedo such as reduced snow cover in winter that will act as a positive feedback factor. There is also the possibility that urbanisation effects have been underestimated as has been suggested from some studies. It could also be that ERAI has a systematic cold bias in the free atmosphere over land, but this is not very likely, as we do not see this over the oceans.
The surface temperature trend over land stands out. It is about twice as large as the temperature trend of the mid-troposphere. In the mid-troposphere, the trend is similar to that over the ocean. A possible explanation could be the drying out of the land surface leading to reduced fluxes of water vapour from the ground accompanied by a larger lapse rate.
Another area with a large warming trend is in the Arctic, most likely due to reduced sea ice cover in summer and autumn. The Arctic warming trend is most pronounced in ERAI with the largest values in the Russian sector. Such values are consequently not a direct effect of increasing greenhouse gases. It is most likely due to reduced sea ice in summer and autumn that in turn can be a secondary effect of climate warming but with no apparent warming response at upper levels.
It is also interesting to note that the trend in the lapse rate is also increasing, meaning that the temperature difference between the surface and the mid-troposphere is increasing during the period. This increase occurs over most land areas including higher latitudes, the Arctic and Antarctic regions. Weather situations in high latitudes with reduced inversions could add to such a development. Typical of the Arctic climate are pronounced boundary layer inversions that at low solar angles often persist during the day. A more detailed examination of the vertical structure of the trend shows that the near-surface temperature trend is approximately 2.5 times larger than that in the mid-troposphere. The difference is largest over ocean suggesting an additional contribution from reduced sea ice coverage. The reason for the enhanced warming of the boundary layer is not clear but is probably a combination of circulation changes and surface boundary conditions.
In the situation of a sustained warming or cooling of the climate caused by changes in radiative forcing (greenhouse gases, solar irradiation or volcanic eruptions), the temperature change through the troposphere should stay approximately the same for all vertical levels because of the strong vertical coupling due to fast atmospheric processes such as convection and constant large-scale horizontal mixing. In the case of net positive forcing, the tropospheric warming is expected to be slightly larger in the upper troposphere. This is because of the influence of the moist adiabatic lapse rate at higher tropospheric temperatures. However, with present minor temperature changes and data limitations, this cannot be uniquely determined.
The minimum temperature increase in the mid-troposphere, as suggested from ERAI and most clearly indicated over land, is somewhat puzzling. Comparison with GCM simulations, to be reported elsewhere, shows that this does not occur in model simulations. A possible explanation might be that model simulations have difficulties to handle the magnitude of different convective processes over land including the effect of limited horizontal resolution preventing a more realistic parameterization of mixed dry and moist convection.
The ERAI data are not free from systematic errors, which may affect trends. However, the large amount of different observations now used in the ERAI data assimilation suggest that the biases caused by changing observations over time are unlikely to corrupt the trend calculations and in any case not more than trends calculated from one set of specific observations.
We have highlighted in this article the problem with surface temperature trends over land. However, it is important to point out that SST trends are also problematic, particularly prior to the availability of reliable satellite observations. Available data sets have been composed by merging different types of observations in a partly subjective way that is not possible to fully reproduce.
We have also used available independent MSU data provided by UAH and RSS. There are minor differences between the two data sets as well as the corresponding values calculated from the vertical temperature profiles of ERAI. Comparing TLT of UAH and RSS with that calculated from ERAI shows a close agreement with the exception of the ocean TLT trends for UAH that are lower than the other two.
Tropospheric temperature trends are affected by gradual changes mainly in space observations both with respect to quality and coverage, but further improvements are expected with new re-analyses having more advanced bias control. We therefore strongly suggest that tropospheric temperature trends from re-analyses should replace surface temperature trends in future climate validation studies. If we use the temperature trend of the layer 700–400 hPa or any other similar measure, instead of the surface temperature trend, then this is probably a better representation of the global tropospheric temperature and presumably a more robust quantity to assess climate change.
JC reflections
In principle, the global reanalyses provide the best approach for developing truly global temperature datasets. The assimilation of multiple different types of data not only improves spatio-temporal coverage, but reduces the biases that would be associated with individual datasets. The reanalysis process provides a dynamically consistent way for providing a truly global dataset that does not rely on kriging, extrapolation or other infilling methods.
The ECMWF reanalysis agrees pretty well with the UAH and RSS tropospheric temperature analysis. While ECMWF uses the same basic datasets, it assimilates radiances from the satellite (rather than the temperature retrievals) as well as the radiosonde data. Hence this constitutes independent verification of the UAH/RSS analyses of tropospheric temperatures.
The differences between ECMWF and the land surface temperature datasets are striking.
ECMWF reanalyses currently don’t add much elucidation to the sea surface temperature debate, since sea surface temperatures are a boundary condition for the reanalysis process. ECMWF SST analysis relies heavily on satellite and buoy data in recent years.
The most interesting point (to me) in the paper is this:
Another area with a large warming trend is in the Arctic, most likely due to reduced sea ice cover in summer and autumn. The Arctic warming trend is most pronounced in ERAI with the largest values in the Russian sector. Such values are consequently not a direct effect of increasing greenhouse gases. It is most likely due to reduced sea ice in summer and autumn that in turn can be a secondary effect of climate warming but with no apparent warming response at upper levels.
This is a particularly interesting result, since the direct retrievals of upper level temperatures by RSS and UAH are not deemed to be reliable at high latitudes. The ECMWF reanalysis of upper level temperatures is arguably more reliable in the Arctic, but how reliable is a subject requires more investigation. The absence of upper level warming in the Arctic leads the authors to conclude that the surface warming trend in the Arctic is not a direct consequence of increasing greenhouse gases. Any GHG impact on Arctic sea ice is lost in the decadal scale variability of ocean heat advection and cloudiness changes (which may have a component from GHG warming), further supporting my contention (shared by the IPCC) that we do not have confidence in attributing a substantial fraction of the recent Arctic sea ice decline to GHG warming. This important point is lost in the public alarm surrounding the decline of the Arctic sea ice.
This paper is also important in that it establishes the ECMWF Interim Reanalysis as a useful data set for examining regional and temporal climate variability in recent decades. Of particular relevance are plans for ERA-CLIM2:
The five main objectives for the ERA‐CLIM2 project are:
- Production of an ensemble of 20th-century reanalyses at moderate spatial resolution, using a coupled atmosphere-ocean model, which will provide a consistent data set for atmosphere, land, ocean, cryosphere, including, for the first time, the carbon cycle across these domains;
- Production of a new state-of-the-art global reanalysis of the satellite era at improved spatial resolution, which will provide a climate monitoring capability with near-real time data updates;
- Further improvement of earth-system reanalysis capability by implementing a coherent research and development program in coupled data assimilation targeted for climate reanalysis;
- Continued improvement of observational data sets needed for reanalysis, in-situ as well as satellite-based, with a focus on temporal consistency and reduction of uncertainties in estimates of essential climate variables;
- Development of tools and resources for users to help assess uncertainties in reanalysis products.
IMO, this is where true progress lies in terms of understanding the global temperatures (not to mention the water and carbon budgets).

The fact is that we can’t account for the lack of the missing hotspot at the moment and it is a travesty that we can’t.
The lack of the hotspot is really a show stopper. It precludes that an increase in convective heat transfer is compensating for the surface warming effect.
This means that the heat must be getting blocked on the way in. Basically it points to changes in cloud cover.
This paper is interesting in that picks up the land+sea problem which I pointed out on this site recently. Because of differing heat capacities you can’t simply add temperatures. It is physically wrong.
https://judithcurry.com/2016/02/10/are-land-sea-temperature-averages-meaningful/
The oceans are the Earth’s calorimeter. For years I have only used SST for any radiative or energy budget calculation. SST has plenty of problems historically but these are not going to be reduced by muddying the waters ( no pun ) by mixing in land temps. That will just make more of a mess.
In the absence of meaningfully complete OHC data, SST is about the best we’ve got.
If we want to know how much hotter land has got SAT may be of use, with the usual caveats. If we want to do energy budget and climate sensitivity we should be using SST.
Agreed — and with the pause there also has been a hiatus in sloppy scientific thinking. The pause neutered the alarm; and, now a calmer society’s cooler minds can more easily be heard above the grinding din of the global warming propaganda machine. The Earth has been down this path before, with or without our understanding of it…
https://evilincandescentbulb.files.wordpress.com/2015/01/yan-et-al-2014-csb-graphsstgraph.jpg?w=640&h=302
“The absence of upper level warming in the Arctic leads the authors to conclude that the surface warming trend in the Arctic is not a direct consequence of increasing greenhouse gases.”
Oh great.
Another bit of actual science which will cause social problems for me.
Thanks Judith.
:)
“Another bit of actual science “
No science there, just assertion. And it’s very weakly based. It relies on eyeballing their figs 2 and 4, which are respectively shade plots of surface and upper. Both show arctic warming, but the upper rather less, it seems. But they use the same color scheme for both, and variation everywhere of the 700-400 hPa level is less. And in any case, how much can one rely on ERAI 700-400 here? Satellite coverage is weak, radiosondes sparse. What else?
The issue I have is not that more warming is occurring at the surface than aloft. That seems corroborated by both sonde and satellite.
The issue I have is how that precludes warming from being a/the cause of sea ice loss. It’s not necessary to invoke AGW – it appears Arctic Sea Ice varied in the past. But I’m not convinced that the lapse rate disproves AGW.
And, for what they’re worth, the models seem to predict more warming at the Arctic surface than aloft.
Of course, it could easily also be that natural sea ice loss causes warming as much as warming causes sea ice loss. But I don’t see how we can eliminate either on the bases of lapse rate changes.
http://climatewatcher.webs.com/HotSpot2015.png
TE, did you notice that the lapse rate vertical diagram in the paper shows warming at the upper troposphere and cooling in the stratosphere? Does this agree with the information you have been gathering?
Nick: ” Satellite coverage is weak, radiosondes sparse. What else?”
I guess the point of reanalysis is weighing integrated evidence to gain confidence. And I think what you are saying, and I agree, is that it would be great if they had specified more of their decision making process to reach their conclusions.
Why do they accept the land record as put forth by HAD and GISS with a caution of suspicion of urban bias when they throw out the SST to revise it to one free of faulty calibration?
The paper seems to leave huge unmodeled contradictions open for speculation. Why surface:TLT ratio 1.1 Six years ago the ratio was thought to be 0.8. Why Land:SST ratio a whopping 4.3 (0.26/.06)?
Nick, what do you think the actual ratios are?
“Nick, what do you think the actual ratios are?”
Over what time? But anyway, I have no idea. They are different places. You just have to observe.
Hmmm… That is interesting.
The ERA indicates a Hot Spot.
http://www.tellusa.net/index.php/tellusa/article/viewFile/31503/47988/206108?type=test.png
It’s skinny and subdued, but it’s there.
“It’s skinny and subdued, but it’s there.”
What was expected was a tropical hotspot. As shown in a global average, you’d expect attenuation.
The usual worry with using reanalysis over time is homogeneity. Data sets and their measurement change. As this paper says:
My bold. The cite of Simmons et al is only part of their story; that paper says
This is getting circular. They cite Simmons to support a match between reanalysis and surface indices, but Simmonds doesn’t say that. I don’t see where ERAI is “examined carefully”.
Of course you are doing what you accuse others of: Liking stuff that disagrees with your worldview and trashing stuff that doesn’t. I’m all for removing speculation from climate science papers since that would remove alarmism but I won’t hold my breath. However one is challenged to find any reason why Russian winters warming up slightly is anything to worry about and why it is extrapolated across the poles by Giss/Best & now Hadcrut rather than treated as an obvious anomaly that is likely natural in origin.
‘agrees with your worldview’ I meant. Having been accused of projection by Racehorse I was a little rushed in reminding him of his own.
What was the average surface temperature of the tropics over the Phanerozoic Eon? Is this chart about right?
https://html2-f.scribdassets.com/235ko6pvuo4jol5p/images/22-20227bbb57.jpg
Source: https://www.academia.edu/12082909/Some_thoughts_on_Global_Climate_Change_The_Transition_from_Icehouse_to_Hothouse
For readers who may not be aware of my reason for asking this question, it is that the tropics are the hottest area and if the warming in the tropics for say 3 C global average temperature increase is not a serious threat, then our GHG emissions are not a serious threat. I explain the point further with two additional charts showing global average temperature, average temperature at poles, and tropics to poles temperature gradients for the past 520 million years here: https://judithcurry.com/2016/07/12/are-energy-budget-climate-sensitivity-values-biased-low/#comment-796768
“The differences between ECMWF and the land surface temperature datasets are striking.” Indeed. They are even more striking from around 1998, the approximate year of a phase change in PDO. Just the simple fact that there is such a lack of consistency between the satellites and the ground should give reasonable people pause. But with the ‘science is settled’ mantra still prevailing I guess that is due to another lack of consistency between alarmists and reason.
“They are even more striking from around 1998”
Where do you see that?
Or indeed, “the differences between ECMWF and the land surface temperature datasets” anywhere?
Hi Nick: https://kenskingdom.wordpress.com/2016/08/02/interim-pause-update-july-2016/
Do any of the other indices show a pause? And does WFT use the updated UAH indice: http://woodfortrees.org/plot/rss/from:1998/trend/plot/uah/from:1998/trend/plot/hadcrut3gl/from:1998/trend/plot/hadcrut4gl/from:1998/trend/plot/gistemp/from:1998/trend
Anthony Cox,
No global indices, including UAH V6, show a pause of more than a few months. But please, stick to the current topic. What differences between ECMWF and land temps are striking?
“A few months”; I thought I provided a link which contradicts that. Oh well. What is your opinion of any differences, striking or otherwise, between ECMWF and the other indices bearing in mind: “The surface temperature trend over land stands out. It is about twice as large as the temperature trend of the mid-troposphere. In the mid-troposphere, the trend is similar to that over the ocean.”
“I thought I provided a link which contradicts that. Oh well.”
It purports to contradict it. But fails on just the matter of reading numbers. The slope shown (global) is 0.000075. Which sounds small (but definitely positive) but is in units of °C/month. It would be 0.09°C/cen. Which you could still say is small (but positive), but it’s actually wrong. Slope of UAHV6 from Feb 98 to May 16 is 0.346 C/cen. July will be more.
As to the other part, there’s nothing new there – it’s just the usual observation that according to RSS (deprecated) and UAH V6 (but not 5.6), the troposphere has been warming slower than the surface. Different places.
“the troposphere has been warming slower than the [highly adjusted] surface [recons. which exclude 70% of the globe]”
I thought approximate PDO change was 2003’ish.
This is how cycle analysis completely fools skeptics:
http://blogs.c.yimg.jp/res/blog-37-32/nishiokablog/folder/568710/46/25839546/img_0?1392626118
The looked mid-century cooling and assumed the negative phase of the PDO lasts for decades. In actuality, the positive phase and the negative phase can be very short. But what really matters is the trend direction. The direction the PDO is trending is usually the direction the GMST is trending. The one glaring exception is ~1985 to ~2014; the PDO trended down and the GMST trended up until a brief period between ~2005 and ~2012, which was when the downward trending PDO finally went big negative… briefly.
The NOAA PDO shows this; from ~1985 to ~2014, way more blue than red:
http://www.carbonbrief.org/wp-content/uploads/2016/06/NOAA-PDO-Index.png
The NOAA PDO number for July is +18, so it is skating close to negative territory.
Nothing like the version of the PDO seen here with way more blue than red.
https://www.nwfsc.noaa.gov/research/divisions/fe/estuarine/oeip/ca-pdo.cfm
Will the real index please stand up?
Using that exact data, looking at all that red allows skeptics to miss the obvious trend, which should have caused a regime change. It did not.
try again
Ken Stewart does 12 month running means and monthly anomalies: https://kenskingdom.wordpress.com/2016/04/08/the-pause-update-march-2016-complete/
The pause is there!
A pause in UAH is pointless.
“Pointless”. How witty. Not all temperatures are equal.
Enjoy pointlessness.
Meanwhile:
https://pbs.twimg.com/media/CoYiOVQWYAA3K0d.jpg
And the latest on the skinny little pause saving 2016 La Niña:
http://www.ospo.noaa.gov/data/sst/anomaly/2016/anomnight.8.1.2016.gif
https://wattsupwiththat.files.wordpress.com/2015/05/michaels-102-ipcc-models-vs-reality.jpg
Where I live they haul off the big trash once a month. If they have the same service where you live, you’ll soon be able to get rid of that graph.
There is not a single observation of the earth that supports the silly notion of an ongoing pause in global warming:
http://www.aviso.altimetry.fr/fileadmin/images/data/Products/indic/msl/MSL_Serie_J2_Global_IB_RWT_GIA_Adjust.png
“The pause is there!”
No it isn’t. Read the graph (which is wrong anyway).
Ah the pause deniers. Despite this being still the hottest of hot topics among consensus scientists, this vocal minority still insist there is no pause once you adjust it away or squint and ignore the more accurate satellites that don’t exclude 70% of the globe.
“A possible explanation could be the drying out of the land surface leading to reduced fluxes of water vapour from the ground accompanied by a larger lapse rate.”
Driven by the warm AMO.
Is land actually drying, I though precip over land hasn’t changed much and slightly increased. Same for evap. But that’s just my impression, not sure IIRC.
Infrared radiation can warm land surfaces, but cannot penetrate more than a few molecules deep over water.
And if those molecules didn’t transfer heat to other molecules, they’d boil off.
Given that similar warming occurred in the Arctic in the early years of the 20th century, it seems logical that the same natural forces were at work then as they are now. Some cirumspection and historical perspective have to advance greater understanding and add to the science.
“The absence of upper level warming in the Arctic leads the authors to conclude that the surface warming trend in the Arctic is not a direct consequence of increasing greenhouse gases. Any GHG impact on Arctic sea ice is lost in the decadal scale variability of ocean heat advection and cloudiness changes”
I too found the discussion of Arctic temperatures extremely interesting and in keeping with other analyses that point to dynamics other than GHG’s for the loss of Arctic sea ice.
During the 70s to early 90s radiosonde and dropsonde data found a cooling trend in the western Arctic as detailed in Kahl 1993 “Absence of evidence for greenhouse warming over the Arctic Ocean in the past 40 years”. http://www.nature.com/nature/journal/v361/n6410/abs/361335a0.html
The warming in the Arctic coincides with changes in wind directions due to the Arctic Oscillation which drove thick multiyear ice from the Arctic. (Rigor 2002) The resulting ventilation of subsurface heat, as well as the release of heat when open waters freeze, along with the cyclical intrusions of warmer ocean waters, presents a far more parsimonious explanation for Arctic warming than GHGs
For the Arctic Ocean, the only study of temperature trends is that of Kahl et al. [ 1993], …
We have concerns about this result, especially because the radiosonde and dropsonde temperatures rely on individual thermistor measurements at, respectively, the beginning and end of telemetered time series. …
If rising CO2 increases positive NAO/AO, as the IPCC models suggest, that would only cool the Arctic. A rational explanation for the increase in negative NAO/AO since the mid 1990’s that has driven the Arctic warming since then, is the decline in solar plasma strength:
http://snag.gy/PrMAr.jpg
“The differences between ECMWF and the land surface temperature datasets are striking.”
Really? Where? The paper says:
Table 1 shows almost identical trends (top row) for global land, and very similar for NH land.
Judith, I agree with your assessment of the reanalysis approach. It is a very interesting paper, but I am puzzled by Figure 1 which shows a large difference between the ERAI and HadCRUT4 in recent years. I have downloaded ERAI monthly and annual estimates for global temperature from the University of Maine Climate Change Institute and graphed the anomalies along with HadCRUT4 estimates and they show a much closer match when using the same reference period. For example the 2010 difference between the two in Figure 1 is about 0.1C with HadCRUT4 higher, whereas I found a difference of only 0.02C with HadCRUT4 higher. For 2005 the UM CCI version of the ERAI estimate was higher than HadCRUT4 by 0.04C whereas Figure 1 shows the ERAI about 0.1C lower than HadCRUT4. I don’t know if there are different versions of ERAI out there or if I may have messed up when converting reference periods to match, but I am puzzled.
I would be interested to see if anyone else has compared the ERAI versus HadCRUT4 to confirm what is shown in Figure 1.
I think my comment of August 2, 2016 at 8:59 am probably explains your finding.
Thanks Nic. Apparently the ERAI version provided by UM CCI is the adjusted version with a closer match to HadCRUT4.
Sometimes I feel like making things much cooler in summer, or maybe making the nights warmer in winter to save getting firewood…
Then some cloud comes across and does just that. No global nothing. No sun-this or GHG-that. A massive and instant effect on temperature, all done with cloud.
Trouble is, the temperature is easier to record than the cloud. In the Age of Publish-or-Perish, the temp stands forever, the cloud is forgotten. It’s discriminatory!
– ATTC
mosomoso,
Don’t worry. Foolish Warmists will come up with a proxy for cloud cover, no doubt.
Maybe the tree rings that didn’t show the right temperatures? Their growth changes were obviously due to clouds! . . . or rain, or disease, or CO2, or drought, or . . .
Bugger. Maybe tree ring proxies aren’t so good – for anything.
Cheers.
An Ode ter ATTC.
Of clocks ‘n clouds.
Clocks yer can wind up.
Clouds are more like
herdin’ cats, not fleecy
sheep. GC modellers in
misty towers dislike
clouds, they muck up
their spaghetti graphs
too much.
We find our serf’s verses amusing. She may expect extra acorn meal and a pickled pig’s tail.
– ATTC
Second the motion Moso. The serf is most deserving of the treats that will go her way.
Cheers!
Your fan always,
Richard
Methinks our serf is being tossed delicacies above her station. Give her pickled pig’s tail and next she will be demanding cows ear broth. In my day serfs were happy wth sucking on charred hazel twigs.
Tonyb
Sorting friends from enemies here, thx Peter
and Richard …ahem Tony. ( Me next
Serf Underground will be on Seven Deadly Sins
and that includes Wrath!)
3° — 2° — 1° — one-half
is global warming just a laugh?
Judith,
O/T – could you post an in-depth article on the damage function and the evidence that CO2 emissions are a serious threat to GDP (and to human well-being, life expectancy, poverty, health, standard of living, etc.) this century.
We’ve had 30 years of debate about temperatures, but very little evidence that CO2 emissions are a serous threat.
Or that the CO2 increase is not natural.
CO2 increase not being natural is pretty easy to demonstrate. Just calculate the amount of air in the atmosphere and compare that to the amount of fossil fuels being burned.
Doesn’t prove anything. It is grounds for suspicion…
Or that the CO2 increase is not natural.
We are natural, any CO2 increase that we promote is also natural.
We have put amount 2x of CO2 into the atmosphere, and the atmospheric amount has increased by x, the other x has gone into the land and the ocean where it shows up as acificiation. What more do you need than this carbon budget?
That’s not proof. It’s barely evidence. It’s just a logical fallacy called “post hoc ergo propter hoc”. Or perhaps “cum hoc ergo propter hoc”. More commonly called “correlation does not imply causation”.
AK,OK, so you are just suspicious, not convinced. How suspicious?
Suspicious enough that I’d to see Humanity switch to some other energy source than fossil fuels.
But not so suspicious that I’d be willing to see energy prices impacted, or the Industrial Revolution threatened, or World Government, which is a much more existential threat to Humanity.
Of course, since I’m convinced that it’s already in progress, without any of those things, that might bias my opinion a little.
I’m also convinced the best option, by far, is to pursue ambient CO2 capture and solar power→gas/liquid fuel, which would, in a couple decades or so, develop a mature industry in ambient carbon capture. That way, if it turns out that bringing net emissions to zero doesn’t stop the increase in atmospheric pCO2, some sort of negative emissions scheme can be developed. Not from scratch.
OTOH, when people knee-jerk characterize anything except their own socialist agenda as “doing nothing about climate change”, I’m pretty sure “climate change” isn’t exactly at the top of their agenda.
AK,
Well said on this bit:
However, the solar bit is just nonsense – it’s advocacy for an irrational belief.
Actually AR5 WG2 did a pretty good job of this. Agreed, this is a topic that needs more elucidation
Hi Judith, thank you,
The answer I am seeking would be in WG3 but it’s not. There is no simple clear summary of the estimated economic impact per degree of global average temperature change. However, there are hundreds of pages trying to make a moral argument for action. I’d like to understand what is the damage function and what is the evidence for it. I’d also like to the estimated total economic impact over the rest of this century, e.g., like the red line in the chart below (with confidence limits) but recalculated using objective, unbiased selections of ECS, TCR, GHG emissions rates, damage function, discount rates.
http://anglejournal.com/site/assets/files/1727/lang_1.png
The assumptions, key inputs and discussion of the issues are here: http://anglejournal.com/article/2015-11-why-carbon-pricing-will-not-succeed/
This chart seems to be based on overestimates of the benefits and underestimates of the costs of mitigation. Links posted recently on a CE thread say:
http://reason.org/files/social_costs_of_regulating_carbon.pdf , (also see: http://papers.ssrn.com/sol3/papers.cfm?abstract_id=2759505 ) in which case, as you have said frequently, only no regrets mitigation policies should be considered. They must be net beneficial irrespective of any hypothesized reduction in climate damages.
I haven’t seen a convincing analysis demonstrating GHG emissions are a significant threat.
I’d like someone to rerun the DICE analyses plotted in the chart above but with a range of objectively selected inputs for:
– ECS, TCR
– CO2-eq emissions rates
– damage functions
– abrupt climate change to warming and to cooling
– realistic participation rate
– discount rates used in practice:
I searched AR5 WG2 for “Damage Function”. I got only one return, but to a document prepared by WHO and UNEP, IPCC-XXXVIII/Doc. 3 https://www.ipcc.ch/apps/eventmanager/documents/7/030420140912-Doc.%203%20-%20Approved%20Summary%20for%20Policymarkers.pdf
This bit is interesting “Losses are more likely than not to be greater, rather than smaller, than this range (limited evidence, high agreement).” Who is the high agreement between? I’d suggest it is high agreement between the people who are involved in IPCC and believe in CAGW. It’s not objective.
That would be the calculations that go into the social cost of carbon ($40 per tonne, for example). This has been widely reviewed here and elsewhere.
I wish we would stop calling it the social cost of carbon, when it is the net external cost of CO2 emissions.
-1=e^iπ,
I’d suggest a more correct name is a “biased, ideologically driven, group think developed estimate of net external cost of CO2 emissions”
The estimate depends on a pile of assumptions all of which are highly uncertain (especially the damage function) and mostly selected to exaggerate damages on the high side.
They call it “social cost of carbon” because they’re socialists.
Nothing to do with real costs, any more than “social justice” has anything to do with real justice.
It’s just a buzz-word. It means something like: “hey, we’re all socialists together here.”
Maybe it should be the capital cost then. Might get more buy-in from both sides.
JimD: “Maybe it should be the capital cost then”
What capital cost?
As far as I can see, the burning of fossil fuels over the past tow or three centuries have been an almost unmitigated benefit to the human race.
Funny hot you self-flagellating anti-everything “Liberal” bedwetters never seem to appreciate that, do you really think you would have enjoyed living in mud huts with none of the benefits of the Industrial Revolution?
And that benefit has gone to the fossil fuel companies. Rising CO2 leads to rising temperatures and sea levels, and these have a cost. Who pays? Those who gain the benefit should also put up the cost which is a small fraction of the price, by the way, at least for the more efficient fossil fuels like oil and gas.
Jim D: “And that benefit has gone to the fossil fuel companies.”
All the improvements in the human condition that have taken place since the Industrial Revolution are solely due to our exploitation of fossil fuels, and you assert that the only benefits are to the fossil fuel companies?
You really are totally deranged.
Only an idi0t could say something as silly as that. Or a socialist.
The point is, there is a benefit at present and a cost in the future. Who should pay? It is a moral question.
There’s provable benefit in the future as well. But “cost”? That’s unknown. If any.
$40 per tonne according to estimates.
Jim D | August 4, 2016 at 8:27 pm |
And that benefit has gone to the fossil fuel companies.
Yes, all that happened was that fossil fuel companies got richer. Nothing else changed. Everyone else carried on living in mud huts etc etc.
Why are the quoted confidence intervals only 1.95sigma ~ 2sigma?
Are these statistical or systematic confidence levels or a quadrature combination of both?
Especially for observational data, should the confidence level be set at 5sigma?
Just for fun, consider global warming at a rate of 1 C per century. This is a rate of 0.01 C per annum. Dividing by 365 (ignoring leap years for the hell of it), gives around 0.00003 C per day. Unfortunately, this increase cannot be measured, any more than 0.01 mm change in global sea level – a fraction of the thickness of a human hair.
So when do you measure the 0.00003 C?
What if you are a second early or late?
Does the equation of time make a difference, and what about leap seconds? What a great load of foolish Warmist rubbish!
You’d have to be really, really, gullible (or completely deluded) to believe in this sort of nonsensical heat accumulation. Obviously some are just that silly.. Pity.
Cheers.
Probes for every pocket of each tooth…
https://www.theguardian.com/us-news/2016/aug/02/dental-floss-proof-works-guidelines-dropped
and go easy on the floss while you save the world from trash and your gums for good.
I think it worth repeating some comments that I made by email yesterday about this is interesting and useful paper.
It says (Section 3.1) that lower SST trends for ERAI are mainly related to the SH and the period prior to 2001. I understand from ECMWF that there was a discontinuity in their SST data in 2001, leading to SSTs that are “quite uniformly about 0.1 K cooler than HadCRUT4 from 2002 onwards” (Simmons and Poli 2015 DOI:10.1002/qj.2422, which explains the cause).
The main ERAI data on their server have not been adjusted for this SST discontinuity. However, adjusted Global and European monthly surface (2 m) air temperature timeseries are made available at http://climate.copernicus.eu/sites/default/files/repository/Data_for_month_4_2016_plot_3.txt (to April 2016; month_6_2016 to June 2016, etc. Map using the adjusted data are at http://climate.copernicus.eu/resources/data-analysis/average-surface-air-temperature-analysis/monthly-maps/april-2016 , etc). The 1979-2014 GMST trend based on this data is 0.161 K/decade, almost the same as for HadCRUT4v4 (0.158) but well above the 0.12 figure for the unadjusted ERAI data that is given in the paper.
It is notable that despite HadCRUT4 having sparse high latitude coverage (and missing the large air temperature warming occurring over sea ice prior to it melting), and an expectation that SST will warm slightly less than ocean surface air temperature, it shows the same trend since 1979 as the adjusted globally-complete ERAI 2 m air temperature data.
Nic, I also downloaded from UM CCI the CFSR and ERAI SST data. Even though the annual global temperature averages for these two data sets are fairly close, there is a large discrepancy in the SST annual averages. From the 1979-2015 annual global SST estimates I get a slope/intercept of 0.0163/20.169C for the CFSR and 0.0059/18.123C for the ERAI. Notice the +2C higher intercept on the CFSR versus ERAI and much lower slope on the ERAI. Maybe this ERAI SST data has not been adjusted like the ERAI global temperature data provided by UM CCI or maybe there is a much different handling of Arctic SSTs between the two data sets? This is a much larger discrepancy that what you noted above for ERAI versus HadCRUT4 SST. Do you have any explanation for this?
oz4caster, SFAIK ECMWF do not publish adjusted ERAI SST data. But one can make a rough adjustment oneself by increasing their main global SST data by 0.1 K from 1 January 2002 on. An adjusted GMST time series can then be formed from the weighted average of the thus adjusted SST data and the unadjusted ERAI 2 m land air temperature data. It shows the same trend over 1979-2014 (0.161 K/decade) as ECMWF’s adjusted 2 m GMST despite being based on ocean SST not ocean 2 m air temperature.
Thanks Nic. But even if I were to adjust the ERAI SST by 0.1C since 2002, it would hardly put a dent in the 2C intercept difference between the CFSR and ERAI global SST trends. I am aware there was a problem with the CFSV2 SST in late 2015 and early 2016 that required some changes by NCEP. That problem manifested as a large low anomaly area off the northeast coast of Brazil in the Atlantic, but I doubt that it would account for the large discrepancy in the intercepts either since it only affected about half a year of data.
FYI, here is an example of the CFSV2 SST/SSTA problem from 2016 (UM CCI has not corrected their archive of historical maps):
http://pamola.um.maine.edu/Reanalysis_daily/images/WORLD-CED2/SST_anom/2016/CFSR_WORLD-CED2_SST_anom_2016-02-01.jpg
Ya just make adjustments
dont post your code
dont defend the adjustment in papers..
just you know adjust it.
I found this interesting
“The maps and graphs in this section are based on pre-release data from ECMWF’s ERA-Interim reanalysis and therefore are subject to change should a significant production problem be found to have occurred. The release of the maps and charts usually happens a few days after the last observations of each month have been made but the underlying data products are not made publicly available until they have been checked.
Standard ERA-Interim values have been adjusted to compensate for two production issues:
Values over sea are taken from the background forecast model not the analysis, to avoid a detrimental effect of analysing biased air-temperature observations from ships.
Values over sea prior to 2002 are further adjusted by subtracting 0.1OC. This accounts for a change in bias that arose from changing the source of sea-surface temperature analysis.
In addition, the pre-release ERA-Interim data used in the monthly summaries for March and April 2016 were reduced by 0.15OC for the month of March to offset an error in the SST analyses used in the standard production of ERA-Interim. Pre-release values for February 2016 were also affected slightly by this error. Final ERA-Interim data for public release have subsequently been produced by rerunning the period in question using corrected SST data. The final values for February and March 2016 are used in the monthly summaries from May 2016 onwards.”
Pingback: Dos trabajos científicos de julio que cambian la discusión del “cambio climático” | PlazaMoyua.com
With so many touches and retouches the land record is like a painting. But, we’re not dealing with the works of talented artists here. We cannot ever refer to their products as great works, any more than we would look at a tally of sunspots as anything more pedestrian ciphering and that hopefully is not actually the fanciful scorecard of self-proclaimed prophets.
Received via email from John Christy:
This important paper was published using the newly released v6.0 of UAH
data, known as beta2. There was one update after the paper was
submitted that slightly modified the weighting functions of the newer
AMSU to better match the older MSU which impacted the relative trends of
land v. ocean (but did not alter the global or hemispheric trends.) The
beta 5 version (b5) has been added here to Table 2 (shown above) to show
the differences.
ERA UAHb2 UAHb5 RSS
0.09 0.19 0.16 0.17 GL Land
0.11 0.08 0.09 0.11 GL Ocean
0.11 0.11 0.11 0.12 GL All
0.12 0.19 0.17 0.19 NH Land
0.13 0.09 0.11 0.15 NH Ocean
0.13 0.13 0.13 0.16 NH All
One point of the paper is well taken – that measuring the temperature of
bulk quantities which have considerable mass (troposphere or ocean) will
better inform us of any accumulation of joules of energy in the system –
the key GHG signature.
John C.
curryja,
With great respect, joules which can be accumulated must be climatological joules, deifined differently to the joules with which I am familiar. Talk of accumulating joules in water, for example, is just silly.
1 joule will heat 1 g of water by 0.24 C.
The water will then commence to cool, losing energy. At night, objects heated during the day will cool. The energy absorbed during the day is dissipated.
No CO2 induced warming. None.
No offense intended, but continued energy accumulation from an intermittent heat source is just impossible.
I would appreciate factual correction if I am wrong. Energy accumulation in capacitors, or similar, is a total different thing of course.
Cheers.
Obviously, “deifined” must be as defined by the Warmist deity. Either that, or I actually managed to catch the spell checker off guard.
Cheers.
I think 99% of the energy accumulated goes into the ocean, so it is sufficient to measure the ocean heat content’s change to get most of the story from that perspective. However, what matters as much is the energy imbalance and that implies that the surface has to warm to respond to increasing forcing. Perhaps these results mean the surface has to warm more than previously thought because the troposphere lags in restoring the lapse rate in some areas, which is needed as a step for the radiative balance at the top of the atmosphere to be restored.
Jim D,
Or perhaps not. Have you anything useful to say?
Cheers.
Jim D: “I think…”
[Citation required]
Calculation based on 0.5 W/m2 and how much it warms the ocean and atmosphere.
Jim D ” so it is sufficient to measure the ocean heat content’s change … “
So you measure that with an Acme Ocean Heat Content Meter? or how?
It’s called Argo.
JimD: “It’s called Argo.”
You mean the system that Karl, Trenberth et al decided was insufficiently accurate because it validated the existence of the Pause, so replaced its data with ships’ engine room inlet temperature data read from inlet temperature gauges that were originally accurate to ±2° and were seldom or ever checked throughout the life of the vessel?
THATArgo?
Actually Argo demonstrated that the OHC was rising throughout the “pause”, but the skeptics ignored that of course. Argo is not ships, it is drifting floats, and these measure deep temperatures globally (OHC).
Ken W,
Firstly, Jim D needs to locate the Gore Ocean Heat Accumulator. This amazing device accumulates more heat day by day, without ever losing heat by cooling. Each day, a little hotter.
Al Gore inserted one into the interior of the Earth, which he claims has now accumulated millions of degrees.
The Gore Ocean Heat Accumulator is currently lost. The foolish Warmists lost track of it after it had accumulated the missing heat. Kevin Trenberth rightly characterised this fumbling effort as a travesty.
Unfortunately, the Ocean Heat Accumulator cannot release any of the heat it has accumulated, for measurement purposes. Otherwise it would cool down, of course.
This explains why any foolish Warmist would need an Acme Ocean Heat Content Meter, as you rightly surmise. I understand that it was lost along with the missing heat, and the Ocean Heat Accumulator.
All part of the rich tapestry of climatological endeavour, I guess.
Cheers.
Yes indeed. “The top two kilometers of the ocean are warming at a miniscule 0.02°C per decade*” according to Argo data. Gee whiz! Of course that was after they adjusted the initial cooling signal that really worried them. And lets not talk about the XBT/Argo calibration discrepancy that Levitus prefers to pretend is a rise in temperature that is coincidentally right at the switchover point.
*https://wattsupwiththat.com/2014/03/02/argo-temperature-and-ohc/
Judith’s comment is that the OHC is a key indicator, and I mentioned yes, especially since 99% of the accumulated energy from forcing goes into it. The increase rate of OHC is especially important because it measures the imbalance by which surface warming so far falls short of the forcing change. This shortfall is important because it implies warming in the pipeline logically leading to >100% attribution of warming to forcing changes. That is, all this and more due.
Jim D
the energy imbalance [] implies that the surface has to warm to respond to increasing forcing.
Eh??
So, the models have been carefully tuned to reproduce … what? exactly?
http://forecastpod.org/?powerpress_pinw=46-podcast
Model result – northern hemisphere is frozen over
Observation – the northern hemisphere is not frozen over
find the bug in the model that froze the northern hemisphere = tune the model
JCH, It’s one thing to fix a bug when you know the computer is giving the wrong answer. It’s something else to rely on a machine to tell you something that you don’t know and can’t check. Just the same, I’m happy that the NH isn’t frozen over.
https://pbs.twimg.com/media/CoydY7vVIAEk__i.jpg:large
They’ve been tuned to reproduce the late 20th century warming under late 20th century pCO2 increases. With the assumption that without external “forcing” the climate would stay at “equilibrium”.
What is “they”?
The natural course of the climate is not equilibrium, it’s cooling. Without mankind, the climate would be significantly cooler now.
JCH,
You can’t even define the climate. However, I note that you have now realised mankind produces quite a lot of heat.
Gee, how amazing! Next you’ll be pointing out that additional heat makes temperatures rise!
Foolish Warmist!
Cheers.
You’re pointless.
AK, It seems they’ve been tuned to reproduce one or the other dataset, with the assumption that it is correct.
JCH
The natural course of the climate is not equilibrium, it’s cooling. Without mankind, the climate would be significantly cooler now.
So before mankind appeared, there was steady cooling ?
Taken a step further, before the Industrial Revolution, there was steady cooling ?
Cooling, yes, blame Milankovitch. We should be cooling in this part of the cycles. Clearly we are not, so something else is going on.
Ken W,
The models are carefully tuned to agree with the past as determined by foolish Warmists.
Unfortunately, Nature does not always agree with the models. As far as foolish Warmists are concerned, Nature is wrong. Mann, Schmidt and the rest of the bumbling fumblers are in charge. You must obey!
Or you may choose to believe facts are facts. I’ll back Nature.
Cheers.
You are doing a horrible job of backing nature.
JCH,
Foolish Warmist. Nature wins every time. Wandering Woebegone Wayward Warmists can have all the tantrums they want.
Nature cares not, and ensures that the future is unknowable for all intents and purposes. Maybe you could attempt another string of witless comments.
If you are trying to be gratuitously offensive, you’re not succeeding terribly well. Do you want some tips?
Cheers.
KenW: “So, the models have been carefully tuned to reproduce … what? exactly?”
A bloody good excuse to raise taxes on just about everything, create a Global massive, unelected, unrepresentative, unaccountable and totally useless bureaucracy and for tens of thousands of worthless climate “scientists” and their hangers-on to fly around the world – often in personal jets – holding parties in five star resorts on the pretext that they are creating reports that will “save the World™”?
Other than that…
Link?
AK: “[…]– often in personal jets –[…]
Link?”
By all means.
Have two.
After taking a private jet to COP21 (on taxpayers’ dime), John Kerry mocks doubters as uneducated and ‘insane’
http://michellemalkin.com/2015/12/08/after-taking-a-private-jet-to-cop21-on-taxpayers-dime-john-kerry-mocks-doubters-as-uneducated-and-insane/
It happens every time: the millionaires, billionaires, and “public servants” — Prince Charles, Al Gore, Ted Turner, Richard Branson, Hollywood celebs, presidents, prime ministers, etc. — swoosh into the confab in their tax-payer provided jets, or their own private Learjets and Gulfstreams, to preach to the rest of us on why we must reduce our “carbon footprints” and submit to a UN-mandated “carbon budget.”
http://www.thenewamerican.com/tech/environment/item/21826-un-paris-climate-confab-luxury-limos-and-learjets
Plenty more where they came from.
@catweazle666…
Maybe you should try again. Neither of those links has any mention of scientists in personal jets. I doubt even Michael Mann or Kevin Trenberth would classify the likes of “John Kerry”, “Prince Charles, Al Gore, Ted Turner, Richard Branson, Hollywood celebs, presidents, prime ministers, etc.”, or “Michael Bloomberg (Media mogul and former NYC mayor), Tom Steyer (real estate tycoon and Democrat fundraiser), Hank Paulson (former Goldman Sachs CEO), Brad Pitt, and Angelina Jolie, to name a few” as “scientists”.
Neither do the writers of those articles. They call them “AGW alarmists”, “millionaires, billionaires, and “public servants””, “elites”, “millionaire-billionaire jet-setters”, and “Hypocritical, smug, condescending, egotistical, and arrogant”. But not “scientists”.
AK,
“”Hypocritical, smug, condescending, egotistical, and arrogant”. But not “scientists”.”
Describes Mann, Hansen, Schmidt and all the rest quite succinctly, doesn’t it?
Cheers.
AK: “Maybe you should try again. Neither of those links has any mention of scientists in personal jets.”
Which bit of “and their hangers-on” are you having difficulty with?
And perhaps you also failed to notice, but I posted “scientists” in quotes, not scientists without quotes.
Read harder!
Useful understanding of the climate.
‘We wait until their boots are rotting off of their feet before we start our revolution.’
Something like it…
Yes, with the art of model tuning, the socialists are going to overthrow the capitalists.
Nationalists.
Reblogged this on CraigM350.
‘The natural course of the climate is not equilibrium, it’s cooling.’
Neither you nor anyone else has any idea what the climate would have done. There is evidence that changes of 1ºC or more in one century are unusual, but not unprecedented, and nobody knows if absent human influence temperatures would have gone up less than 1º, would have gone down, or would have stayed the same.
If anything, the fact that sea levels kept rising thousands of years argues that either temperatures were also rising, or the ice sheets react really, really slowly to temperature changes and were still adjusting from the LGM.
All atmospheric temperature records give different curves because various adjustments made to smooth out natural variability in the data are based on different assumptions about the existence and the magnitude of correlation between invariant data.
Using secret formulas and touting 80% forecasting accuracy (which is infinitely better than our best global warming climate models), the annual Old Farmer’s Almanac published late last year says the US will experience an unusually harsh 2016/2017 winter across most of the nation. The prediction of the accuracy has perhaps already been confirmed by a recent elderberry growth spurt in Washington this year. The forecast is for a lot of snow beginning mid-December and lasting possibly into late February.
“The prediction of the accuracy has perhaps already been confirmed by a recent elderberry growth spurt in Washington this year.”
I am predicting a harsh winter in the UK too.
The rowan berries are at least a month early, and have what looks like a record crop.
Funny how trees can be infinitely better at predicting the medium term weather than tens of thousands of “scientists” with literally billions of dollars’ worth of massively powerful supercomputers, isn’t it?
But they can, and I’ve never known them to get it wrong.
Interesting article about ice age teminations and monsoon records from Nature and resilient earth blog. Goes back 640,000 years with proxy.from stalligintites.
http://theresilientearth.com/
Scott
I sincerely doubt the authors of the study would agree at any level with the comments made about CO2 and warming that are made on that website.
JCH,
I sincerely doubt that anybody apart from yourself is overly concerned about your doubts, regardless of the sincerity of your beliefs.
If you could show a falsifiable hypothesis relating to the alleged heating effects of CO2, maybe you could allay the sincere doubts of others that foolish Warmists practice Cargo Cult Science, and not the real stuff.
Cheers.
Interesting article about ice age teminations and monsoon records from Nature and resilient earth blog. Goes back 640,000 years with proxy.from stalligintites.
http://theresilientearth.com/
Scott
JCH | August 4, 2016 at 2:21 pm | Reply
I sincerely doubt the authors of the study would agree at any level with the comments made about CO2 and warming that are made on that website.
You may expect it see it strongly endorsed on Heartland Institute and Friends of Stalliigin & Tonic billboards.
Well, one would have to be drunk on something…
One example of author DNA:
In conclusion, our synthesis indicates that the superposition of two orthogonal modes explains much of the variability (64–100%) in regional and global climate during the last deglaciation. The nearly uniform spatial pattern of the global temperature EOF1 (SI Appendix, Fig. S6) and the large magnitude of the temperature PC1 variance indicate that this mode reflects the global warming of the last deglaciation. Given the large global forcing of GHGs (139), the strong correlation between PC1 and the combined GHG forcing (r2 = 0.97) (Fig. 5A) indicates that GHGs were a major driver of global warming (140).
Fig. 5.
My reflections are this is a waste of time.
Reblogged this on Climate Collections.
catweazel666.
“Funny how trees can be infinitely better at predicting the medium term weather than tens of thousands of “scientists” with literally billions of dollars’ worth of massively powerful supercomputers, isn’t it?
But they can, and I’ve never known them to get it wrong”
Was this satire? If not, could you relate the support you have for a position that seemingly no one else in the scientific community has. I find no papers, no studies, and very little enthusiasm even in the “woo” forums I visited. Your belief would be what the most kindest call, “Weather folklore” or .”old wive’s tale.” I try to keep an open mind about our amazing universe, but this seems as wildly implausible as beliefs that most consider superstitions. Your usage of “infinitely better” reminds me of a friend that claims to exaggerate a million times a day.
johnvonderlin: “Was this satire?”
NO.
Absolutely anything but. It was a judgement based on well over half a century of observation. “Barbecue summer” mean anything to you, for example?
“If not, could you relate the support you have for a position that seemingly no one else in the scientific community has.”
If by that you mean the “climate scientific community”, you appear to mistake me for someone who has even a minuscule amount of respect for its prognostications. I need support from the likes of Mann, Hansen, Karl, Cook etc. like I need hepatitis.
Even tabloid horoscopes are a massively more accurate projection of the future than the auguries of climate “scientists”.
Catweazle,
I’m sad to hear it wasn’t satire. I was glad to see that you had no evidence of the veracity of your “infinitely better” claim other than the look-back recall of an old man’s questionable memories. Or can you share your diary entries that indicate the years of berry profligacy that you’ve checked against weather records?
Though skeptical, in general I keep an open mind about things. But, until you can show me some evidence, other than your opinion, I’ll rate your claim as highly dubious.
Thanks for the the “barbecue summer” reference though. Researching it I see once again that Mother Nature frequently humiliates those that claim to know more about something than they actually do, climatologists included. I might note that Dr. Curry’s business is involved in weather predicting. Perhaps, she uses the Rowan Berry Oracle too and will set me straight.
Being curious why somebody would make such an unscientific claim on a science forum, I researched your screen name. Was a Catweazle a chimera, the hybrid of a Hyperbole and a Woo? Why no, it’s a fictional eccentric 11th Century wizard transported in time to modern days. From Wikipedia: “Catweazle mistakes all modern technology for powerful magic, (an example of Clarke’s third law), particularly ‘elec-trickery’ (electricity) and the ‘telling bone’ (telephone). How drolly appropriate as your totem..
Heh, I’ve really rattled your cage haven’t I, John?
What a thin-skinned individual you must be. An academic, right?
Concerning my relationship with science, starting back in the 1960s as a chemical engineer – a profession with a very heavy reliance on some fairly advanced physics, thermodynamics and reaction kinetics, thus considerable dependence on some very heavy maths, and involving a measure of computer modelling, for example for the purpose optimisation of bubble caps for distillation columns, a deceptively trivial task, and subsequently moving into IT, becoming managing director of my own company with a global client base, I have done very nicely out of my understanding of both the theory and practice, and I find it most offensive that the good name of the art is being dragged down and made a laughing stock by the activities of very many of those in the so-called profession of climate “science”.
So you can keep your sarcastic snark, I am damn sure that my credentials – both theoretical and practical – are at least a match for yours.
I quote:
‘Another area with a large warming trend is in the Arctic, most likely due to reduced sea ice cover in summer and autumn. The Arctic warming trend is most pronounced in ERAI with the largest values in the Russian sector. Such values are consequently not a direct effect of increasing greenhouse gases. It is most likely due to reduced sea ice in summer and autumn that in turn can be a secondary effect of climate warming but with no apparent warming response at upper levels.’
What’s wrong with the Arctic Oscillation mechanism long known to bring warm air from the mid latitudes to the Arctic when surface pressure falls in high latitudes. Doesn’t anyone here/there/anywhere know about the Northern Annular Mode?
Anything known before 1970 has been conveniently forgotten and erased from the history books. Climate science did not want to be without its own revisionism.
But then every once in while someone throws a monkey wrench into the tidy little package. Like NASA’s new study identifying geothermal activity under the Greenland ice sheet that has the establishment in a dither wondering if it is Al Gore’s million degree mystery spot.
And the next thing you know out goes a call to a hit man, if not to snuff out an inconvenient fact then to silence a troublesome employee.
Some, perhaps a great deal of the present economic malaise can be put down to distortions in the marketplace introduced at the behest of the environmental lobby. Many of these distortions are indirect acting to increase the price of housing to make it more ‘energy efficient’. Many operate via changes to land use planning.
There is a great deal of stupidity required in order to meet the dictates of those who cry ‘sustainability’. Can these eco-environmental Nazis not see that the planet is greening? Doesn’t that greening represent increased economic capacity, enhanced sustainability?
Why has the oil price collapsed? Haven’t the proponents of the ‘peak oil’ argument noticed? Don’t they look? Do they live in a cocoon of self indulgent wistfulness?
The ordinary man has a modicum of common sense. White is not black. Black is not white. The wheel turns.
JCH
Piomas increase Nino 3\4 index dropping
Now for a massive August temp fall.
Are you ready!!!!
Of course the problem with arrogant predictions is they always go wrong.
Possibly the hottest July in the record.
Nino 3.4:
http://www.tropicaltidbits.com/analysis/ocean/nino34.png
Nino 1+2
http://www.tropicaltidbits.com/analysis/ocean/nino12.png
All forecasters are now saying a weak La Niña, and there is speculation there may not be a La Niña. Odds for one are far from overwhelming.
Either way, global heatwave continues unabated.
http://www.smh.com.au/federal-politics/political-news/turnbull-government-order-csiro-uturn-towards-climate-science-20160803-gqk2pr.html
I’m guessing that was the same forecasters who wrongly predicted a weak or even non-existent el nino based on early indications.
So hottest year on record coming up JCH.
Prepared to call it now or do you need more data?
Pingback: Weekly Climate and Energy News Roundup #235 | Watts Up With That?
There should be a break over at about 2003 on the temperature chart. A regression line from 1979 To 2003, and a new one from 2003 to now. Satellite temperature series ( the ONLY Global measure) Raw surface temperature series before GISS or NASA or ? Adjustments show a distinct separate trend for these two periods. We shall be seeing the satellite and raw surface trend turning decidedly downward as we approach 2020, and a steep acceleration down after that. See Paullitely.com for details.
Pingback: En viktig artikel! - Stockholmsinitiativet - Klimatupplysningen
Pingback: Tellus-artikeln - Stockholmsinitiativet - Klimatupplysningen
Thank you for presenting this paper, and for linking to it.