
by Zeke Hausfather
Global temperatures are adjusted to account for the effects of station moves, instrument changes, time of observation (TOBs) changes, and other factors (referred to as inhomogenities) that cause localized non-climatic biases in the instrumental record.
While the impact of adjustments that correct for these biases are relatively small globally (and actually reduce the century-scale warming trend once oceans are included) there are certain regions where the impact of adjustments on temperature trends are large. The United States, in particular, has large adjustments to temperature data that have the effect of nearly doubling the warming trend since 1900. The U.S. is somewhat unusual in that most of its historical temperature records were collected by volunteers rather than civil service employees. This has the benefit of giving the U.S. many more records than most other parts of the world, but contributes to the fact that stations in the U.S. tend to have quite a few systemic inhomogenities.
There are two specific changes to the U.S. temperature observation network over the last century that have resulted in systemic cooling biases: time of observation changes at most of the stations from late afternoon to early morning, and a change in most of the instruments from liquid in glass thermometers to MMTS electronic instruments. Back in July I posted a general introduction to U.S. temperature adjustments that looked at the relative effect of each adjustment. Here I will focus in detail on the Time of Observation adjustment, which is responsible for the majority of the change in U.S. temperatures vis-à-vis raw data. In a future post I will address the pairwise homogenization algorithm, which attempts to correct for factors like the MMTS transition and the impact of urbanization on temperature trends.

Figure 1: Recorded time of observation for USHCN stations, from Menne et al 2009.
Until the late 1950s the majority of stations in the U.S. record recorded temperatures in the late afternoon, generally between 5 and 7 PM. However, volunteer temperature observers were also asked to take precipitation measurements from rain gauges, and starting around 1960 the U.S. Weather Service requested that observers start taking their measurements in the morning (between 7 and 9 AM), as that would minimize the amount of evaporation from rain gauges and result in more accurate precipitation measurements. Between 1960 and today, the majority of stations switched from a late afternoon to an early morning observation time, resulting a systemic change (and resulting bias) in temperature observations.
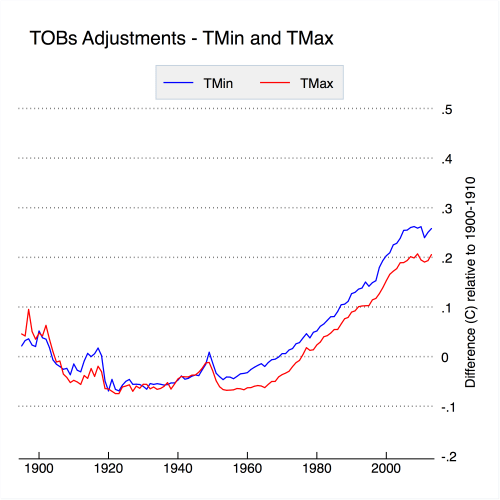
Figure 2: Net impact of TOBs adjustments on U.S. minimum and maximum temperatures via USHCN.
The net effect of adjustments to correct for time of observation changes is shown in Figue 2. TOBs adjustments increase the amount of warming in the historical temperature record by just under 0.3 C, with similar adjustments to both minimum and maximum temperatures. This adjustment alone is responsible for the majority of the difference between raw and adjusted temperatures reported by NCDC.
Interestingly enough, the time of observation adjustment developed by Karl et al 1986 is not strictly necessary anymore. Changes in time of observation in station records show up a step changes in difference series compared to neighboring stations, and can be effectively removed by the pairwise homogenization algorithm and similar automated techniques. For example, Berkeley Earth has no explicit TOBs adjustment, but gets a U.S. temperature record effectively identical to that of NCDC’s adjusted record. Similarly, when NCDC’s pairwise homogenization algorithm is run without the TOBs adjustment being applied first, the end result is very similar to what you get when you explicitly correct for TOBs, as discussed in Williams et al (2012).
What Impact Does Time of Observation Have?
So why does changing the time of observation create a bias in the temperature record? Astute observers will be aware that weather stations don’t take a single temperature measurement at the observation time. Rather, they use what are called minimum-maximum thermometers that record both maximum and minimum temperatures between resets of the instrument. The time at which the instrument is reset and the measurements are written down in the observers logbook is referred to as the time of observation. An image of a common minimum-maximum thermometer is shown in Figure 3.
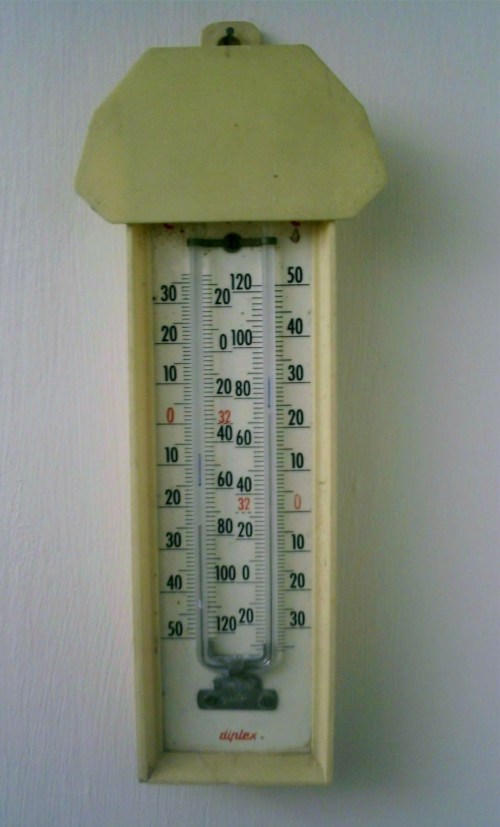
Figure 3: Example of a minimum-maximum thermometer via Wikipedia.
At first glance, it would seem that the time of observation wouldn’t matter at all. After all, the instrument is recording the minimum and maximum temperatures for a 24-hour period no matter what time of day you reset it. The reason that it matters, however, is that depending on the time of observation you will end up occasionally double counting either high or low days more than you should. For example, say that today is unusually warm, and that the temperature drops, say, 10 degrees F tomorrow. If you observe the temperature at 5 PM and reset the instrument, the temperature at 5:01 PM might be higher than any readings during the next day, but would still end up being counted as the high of the next day. Similarly, if you observe the temperature in the early morning, you end up occasionally double counting low temperatures. If you keep the time of observation constant over time, this won’t make any different to the long-term station trends. If you change the observations times from afternoons to mornings, as occurred in the U.S., you change from occasionally double counting highs to occasionally double counting lows, resulting in a measurable bias.
To show the effect of time of observation on the resulting temperature, I analyzed all the hourly temperatures between 2004 and 2014 in the newly created and pristinely sited U.S. Climate Reference Network (CRN). I looked at all possible different 24 hour periods (midnight to midnight, 1 AM to 1 AM, etc.), and calculated the maximum, minimum, and mean temperatures for all of the 24 hours periods in the CRN data. The results are shown in Figure 4, and are nearly identical to Figure 3 published in Vose et al 2003 (which was used a similar approach on a different hourly dataset).
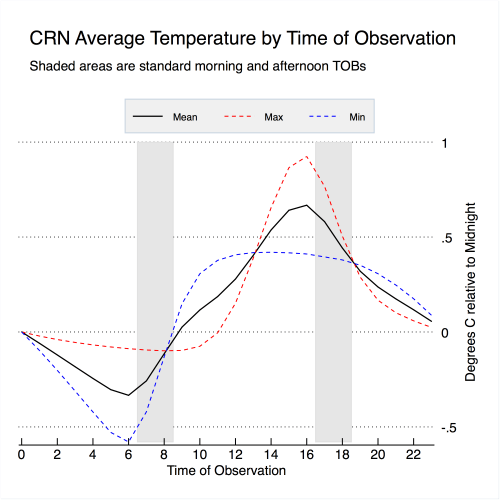 Figure 4. Impact of observation time on resulting temperatures (relative to midnight) based on 2004-2014 USCRN hourly data.Shaded areas reflect most common morning and afternoon observation times.
On average, observing temperatures (and resetting the minimum-maximum thermometer) in the early morning results in reading about 0.15 C cooler than if temperatures were observed at midnight. Observing temperatures in the late afternoon results in temperatures about 0.45 C warmer on average than if temperatures were observed at midnight. Switching from an afternoon time of observation to a morning time of observation would result in minimum, maximum, and mean temperatures around 0.6 C colder previously measured.
What Would Happen to the Climate Reference Network if TOBs Changed?
Another way to look at the impact of time of observation changes is to use the “perfect” Climate Reference Network (CRN) hourly data to see exactly what would happen if observation times were systemically changed from afternoon to morning. To do this I took CRN hourly data and randomly assigned 10 percent of stations to have a midnight time of observation, 20 percent of stations to have a 7 AM observation time, and 70 percent of stations to have a 5 PM observation time, similar to the U.S. Historical Climate Network (USHCN) prior to 1950. I then had 50 percent of the stations that previously had afternoon observation times shift to morning observation times between 2009 and the start of 2014. This is shown in Figure 5, and results in a time of observation shift quite similar to that of the USCRN shown in Figure 1, albeit over a 5 year period rather than a 50-year period.
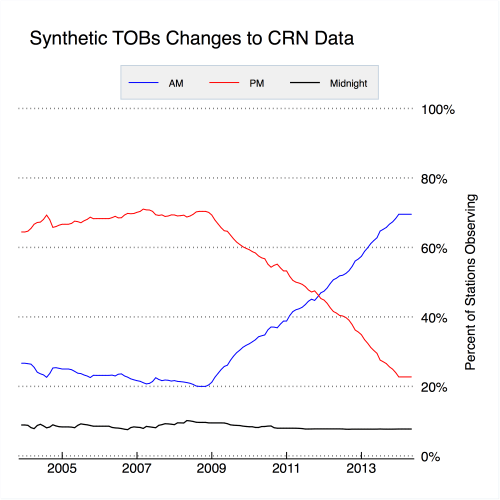
Figure 5. Synthetic observation times applied to hourly CRN data. Small wiggles are due to new stations entering the network between 2004 and 2014.
To determine the impact of changing observation times, I look at two scenarios: one where the time of observation is changed as shown above, and one where the time of observation remains unchanged for all stations. To calculate U.S. temperatures for each, I convert the temperature data into anomalies relative to a 2005-2013 baseline period, assign stations to 2.5×3.5 lat/lon grid-cells, average all the anomalies within each grid-cell for each month, and create a contiguous U.S. temperature by weighting each grid-cell by its respective land area. This is similar to the process that NOAA/NCDC use to calculate U.S. temperatures. The results are shown in Figure 6.
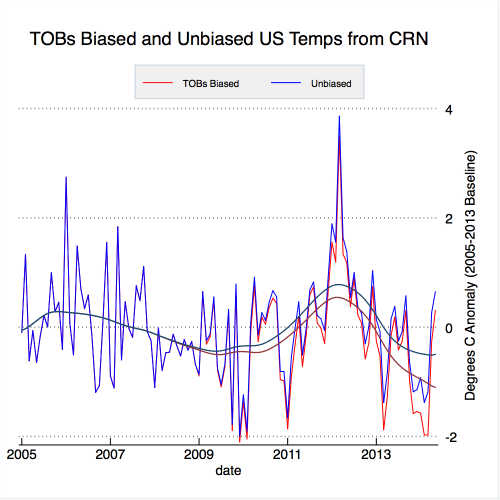
Figure 6. Contiguous U.S. monthly temperature anomalies from unbiased and synthetic TOBs-biased CRN data. Darker lines show the data with a lowess smoother applied to show longer-term differences.
When the time of observation is systematically changed from afternoon to morning in the Climate Reference Network, a clear cooling bias emerges. Temperatures are consistently lower in the TOBS biased data after the shift in observation time for daily minimum, maximum, and mean temperatures. The net effect of the TOBs bias is shown in Figure 7.

Figure 7. Bias introduced to contiguous U.S. monthly temperatures by synthetic TOBs adjustments. Green line shows the data with a lowers smoother applied.
There is a cooling bias of about 0.5 C introduced to the conterminous U.S. temperature record from CRN data by shifting observation times from 5 PM to 7 AM in 50 percent of stations. Interestingly, there is a strong seasonal cycle in the TOBs bias, with the largest differences seen in February, March, and April, similar to what Karl et al 1986 found. This bias of 0.5 C is of similar magnitude in the minimum, maximum, and mean temperatures. It is slightly larger than the ~0.3 C TOBs adjustments made to USHCN data (shown back in Figure 2) for two reasons: first, the percent of stations shifting from afternoon to morning is slightly higher in my synthetic CRN data than what actually occurred in USHCN; second, not all observers actually record at 7 AM and 5 PM (they tend to range from 7-9 AM and 5-7 PM, and later morning and afternoon readings result in slightly less bias as shown in figure 4).
It is clear that the shift from afternoon to morning observations in the United States introduced a large cooling bias of about 0.3 C in raw U.S. temperatures. As contiguous U.S. temperatures have risen about 0.9 C over the last century, not correcting for this bias would give us a significant underestimate of actual U.S. warming. While some commenters have hyperbolically referred to temperature adjustments as “the biggest science scandal ever”, the reality is far more mundane. Scientists are working their hardest to create the most accurate possible record of global temperatures, and use a number of methods including tests using synthetic data, side-by-side comparisons of different instruments, and analysis from multiple independent groups to ensure that their results are robust. I’d suggest that those who doubt the efficacy of their approaches do what I did: download the data and take a look for yourself.
JC note: As with all guest posts, keep your comments relevant and civil.

Given the many peculiarities of temperature measurements, why not just rely on satellite data? Less prone to manipulation, whether innocent or malicious.
Hi Mike,
Satellite data is adjusted a lot more the surface data, unfortunately. See the “trend correction” table (and references) here: http://en.wikipedia.org/wiki/UAH_satellite_temperature_dataset
There is no perfect instrumentation, apart from newer networks like the CRN.
Good work. I’ve asked on other sites why Judith didn’t have a problem with the temperature adjustments that others on WUWT etc. have. Now I know why. If anything, the adjustments underestimate the temperature rise. Whether that is from CAGW or not, or whether CAGW is a problem – those are separate issues with which a skeptic or lukewarmer may argue. But this work kills the false-adjustment/the warming is all in the adjustment arguments. I’d noticed the adjustment argument had fallen off the front-page (until recently). I guess this is why.
Clarity comes with small steps.
Satellites adjust one known instrument, as opposed to millions and millions of historical surface adjustments of data points which NCDC knows almost nothing about.
“Satellite data is adjusted a lot more the surface data, unfortunately.”
The difference being, satellite data is adjusted to match a real thermometer at (as as near as physically practical) the point the satellite is measuring. IOW, it is more accurate to say the satellite data is calibrated, vs surface data being adjusted (based on statistical data from thousands of sites at thousands of locations). Yes, this is repeated for many locations, but for satellite data outliers are investigated and reasons for them discovered. For surface data, it’s just adjusted based on bulk statistics. I know which is more likely to be “correct”!
“Satellites adjust one known instrument, as opposed to millions and millions of historical surface adjustments of data points which NCDC knows almost nothing about”
stuck on stupid, goddard is
http://journals.ametsoc.org/doi/full/10.1175/1520-0426%282000%29017%3C1153%3AMTTDCA%3E2.0.CO%3B2
Goddard: Satellites adjust one know instrument
Spencer:
“Scientists face many challenges when attempting to produce data with long-term stability from sequentially launched, polar-orbiting satellites whose original missions were to support operational forecasting. This paper describes the completely revised adjustments to the Microwave Sounding Unit (MSU) deep-layer tropospheric temperature products first reported in Spencer and Christy (1990). These data originate from nine different satellites, the first being launched in late 1978, and their periods of operation varied from about a year (TIROS-N) to over six years (NOAA-11 and -12). The version presented here is termed version D, and is thus the third major revision to these datasets. For details on the background of the MSU data, the reader is referred to Spencer et al. (1990), Christy (1995), and Christy et al. (1998).”
“Version A of these products was constructed by a simple merging procedure in which biases were calculated and removed from the individual satellites (Spencer and Christy 1992a,b). We updated version A after discovering that the eastward drift of NOAA-11 over its 6-yr life span caused a spurious warming effect to develop due, as we believed, to the fact the satellite was sampling the earth at later times during the local diurnal cycle (version B, Christy et al. 1995). ”
…
Following the release of version C in mid-1996 there was the typical delay in the appearance of the published results (August 1998), during which we discovered a temporal component to the instrument body temperature effect (discussed later) that was interannual, not just intraannual as documented in version C. This effect appeared to introduce an artificial warming in the time series of both T2 and T2LT. Elsewhere, Wentz and Schabel (1998) discovered that the vertical height of the satellites was a critical parameter affecting T2LT and kindly shared their results with us before their paper was published (also August 1998) and just before our version C galley proofs were returned to the printers (thus it is mentioned but not applied to version C in Christy et al. 1998). Their important finding is that altitude losses of only 1 km cause artificial cooling in T2LT while having virtually no effect on T2. The accumulated downward fall of the satellites over the 1979–98 period was over 15 km, and thus became a rather substantial factor requiring attention. In addition, corrected NESDIS nonlinear calibration coefficients for NOAA-12 became available in this period (between release of version C and publication) and were needed for any further versions.
And look at all the complexity? 4000 equations!!! call tonyB
“In version D, presented here, we apply the new NESDIS calibration coefficients to NOAA-12 and then account for and remove the effects of orbit decay and the diurnal effect of orbit drift individually from the original satellite brightness temperatures (sections 2a and 2b). We finally calculate, by solving a system of over 4000 linear equations, the coefficients of the MSU’s instrument body temperature needed for each satellite to eliminate this spurious effect (section 2c). Relative to version C, the global impact of version D is characterized by a more negative trend for 1979–98 of T2”
“The basic problem of this research is to determine how to merge data from nine instruments to produce a useful time series of deep-layer atmospheric temperatures. In constructing the previous versions of the MSU data (A, B, and C) we relied exclusively on the observations obtained as two satellites monitored the earth simultaneously, that is, as a coorbiting pair, to adjust the data for errors. Corrections were applied which eliminated major differences between the various pairs (e.g., intersatellite difference trends and annual cycle perturbations; Christy et al. 1998). In general, when data differences between two satellites were found, a decision was made as to which satellite was correct and which was in error, based on local equatorial crossing time variations or other factors. Some aspects of the temperature differences (trend and annual cycle) of the one deemed in error were then removed, forcing a good (but somewhat contrived) match with the one deemed to be correct.”
Kneel
“The difference being, satellite data is adjusted to match a real thermometer at (as as near as physically practical) the point the satellite is measuring. ”
. read the paper linked above
read this
http://journals.ametsoc.org/doi/abs/10.1175/1520-0442(1992)005%3C0858:PARVOS%3E2.0.CO;2
UHA and RSS are fine products but they are not “adjusted” to match a real thermometer.
Zeke Hausfather, who is recording all the other variation in temp between the hottest and the coldest minute in 24h?! Aren’t the other 1338 minutes more important than the other only two minutes?! Did ever anybody told you that: there isn’t any uniformity in temp for the other minutes from day to day? That sandpit job in ”collecting data” is used to rob the pensioners and give the money to the Warmist Organized Crime (WOC) to which you belong…
When the truth is known – people will ask for money back, with modest interest! Think about then, when you go to bed; because I have already the real proofs of the scam. And that: the phony ”global” warming doesn’t exist.
That’s mostly what I look at for 1979 on. In order to see the historical record you have to rely on the old measuring technics that have to be adjusted as they describe. Since they have the raw data, it would be nice to see the graphs plotted just as they are perhaps sticking to just the period that used the particular technique of the time. Otherwise since most of us are not scientifically astute or don’t have the time we have to rely on the experts.
Mike
Satellite data Also has a TOB adjustment. It also has and adjustment for changing location ( orbital decay) and has an adjustment for changing sensors.
To see how bad the situation is with satellites just compare UHA with RSS.
lastly
no satellite team will produce their code from end to end. You can’t check there adjustment codes.
Long ago we tried to get access to the code and were denied.
Wow. Didn’t know that.
Satellite data should not have a TOB bias?
Thanks, Steven, and even greater thanks to Zeke for very understandable and fairly deep explanation.
“Long ago we tried to get access to the code and were denied.”
Maybe you didn’t ask nicely.
Andrew
angech
Satellite data should not have a TOB bias?
Another rocket scientist. yes, when you work with satellite data one of the horrible things you have to account for is the actual time of day they pass over.. DUHHHHHHH.
Here is Spencer
“A NOAA polar orbiter is nominally “sun synchronous,” meaning whenever it observes a particular spot on the earth at nadir, the local time on the earth is constant from year to year, usually being referenced to the crossing time over the equator [i.e., local equatorial crossing time (LECT)]. In practice, however, all of the spacecraft experienced an east–west drift away from their initial LECT. The morning satellites (about 1930/0730 UTC; NOAA-6, -8, -10, -12) remained close to their original LECTs, but after a few years would drift westward to earlier LECTs, for example from 1930/0730 to 1900/070.3 The afternoon satellites (about 1400/0200 – TIROS-N, NOAA-7, -9, -11, and -14) were purposefully given a small nudge to force them to drift eastward to later LECTs to avoid backing into local solar noon. NOAA-11, for example, drifted from 1400/0200 to about 1800/0600 during six years, becoming essentially a morning satellite. Figure 3 displays the LECTs for the northbound (ascending) pass of each of the spacecraft during their operational service.4
As a satellite drifts through new LECTs, it consequently samples the emissions from the earth at changing local times, in effect allowing local diurnal cycle variations to appear in the time series as spurious trends. This is particularly true for the afternoon spacecraft since the temperature change is greater as the afternoon (northbound) pass drifts to new times than the nighttime (southbound) pass. Thus there is a net trend in the daily average of the measured temperature.
For T2, the net effect of the drift is to introduce small artificial changes. For example, over oceans, Tb tends to rise to a peak in late afternoon as the troposphere warms due to the combination of mechanisms affecting the vertical transport of heat, that is, convection which transports sensible and latent heat combined with direct solar heating of the atmosphere. However, over bare ground, Tb may decrease as the skin temperature, which contributes more to Tb over land than ocean, becomes cooler after local noon. Over vegetated regions, the effect on Tb of an eastward drift is a combination of tropospheric warming and surface cooling and is difficult to detect for a few hours of orbit drift in the daily average. Only in land regions such as the Sahara Desert do we see a systematic drop in Tb shortly after solar noon. Globally, these effects are very small for the inner views (i.e., T2) of the MSU. We find, however, that Tb of the outer view positions used in T2LT cool at a greater rate during the drift than the inner view positions. The net impact is to introduce an artificial warming trend almost everywhere in T2LT.”
Thanks Hugh. Zeke has the patience of a saint.
Way too much is wasted on dealing with adjustments, heat islands, biases, trickery, etc. Take the case that shows the most warming or warming rate even using the most cheating, and the temperature is still well inside the bounds of the past ten thousand years and it is not headed out.
People ignore actual facts about actual data. Even worst on worst on worst temperature is still inside bounds.
All should work on understanding the well bounded cycle of the past ten thousand years. We are still on that same cycle and most do not even try to find out what caused it. All should work on understanding the well bounded cycle of the past 50 million years. Earth went from a warm, ice free world to and ice age world, using very well bounded cycles. There was only one million years of all this that the cycle bounds grew larger and larger, but that changed back to the more normal small cycles for the most recent ten thousand years.
Right,
https://curryja.files.wordpress.com/2015/02/figure-2.png?w=500&h=500
~1900 to 1990, less than 0.1 C of bias after switch to MMTS major bias. Really looks like all those volunteers screwed up right?
oops,
https://curryja.files.wordpress.com/2015/02/figure-2.png
Hi capt,
I’m not sure what point you are trying to make. TOBs adjustments are done to USHCN raw data prior to the PHA, which deals with MMTS (see the chart of PHA corrections below). I’ll have another post at some point discussing the PHA and MMTS corrections in more detail, though I provide an overview here: http://judithcurry.com/2014/07/07/understanding-adjustments-to-temperature-data/
https://curryja.files.wordpress.com/2014/07/slide17.jpg
Zeke, “I’m not sure what point you are trying to make. TOBs adjustments are done to USHCN raw data prior to the PHA, which deals with MMTS (see the chart of PHA corrections below).”
That is the point, TOBS adjustments were made prior to finding out that MMTS adjustments were needed. Had the MMTS adjustments been made first there would have been little or no need for TOBS adjustments.
LIG max/min, one series, mmts new series, no TOBS adjustment required other than obvious breaks.
The transition from afternoon to morning observations started in 1960 or so. MMTS instrumental transitions happened in the 1980s. While some TOBs changes did occur during the period of MMTS transition, the two are distinctly different and mostly unrelated.
I should also point out that both Berkeley and NCDC (in Williams et al 2012) do what you are suggesting and do not include an explicit TOBs adjustment; rather, they use the pairwise homogenization algorithm to detect TOBs inhomogenities in the same way they detect instrumental changes (MMTS) and other factors. As I mention in the article, you end up with pretty much the same CONUS temps where you do an explicit TOBs correction or just use a more generalized pairwise breakpoint detection approach. This is because TOBs changes tend to show up as nice step changes in neighboring station difference series.
Zeke, “While some TOBs changes did occur during the period of MMTS transition, the two are distinctly different and mostly unrelated.”
Unless you had a remarkably gradual shift in time of observation for LIG max/min starting in 1960 I don’t believe that is a valid conclusion. Requesting the cooperative network to shift to 8-9 AM resets for rain gauges would have had very little TOBS influence or you would see a step change at that point. The gradual rise in required adjustment looks more like local area impacts, the suburban effect and shelter ageing.
Capt,
Both MMTS and LiG min/max thermometers are equally affected by TOBs bias. MMTS (at least the ones used by co-op stations) do not record hourly temperatures and provide a daily min/max value that needs to be reset at the observation time just like old LiG min/max thermometers.
Zeke, “Both MMTS and LiG min/max thermometers are equally affected by TOBs bias. MMTS (at least the ones used by co-op stations) do not record hourly temperatures and provide a daily min/max value that needs to be reset at the observation time just like old LiG min/max thermometers.”
Right, but adjustments should be instrument specific. A digital max/min has other factors that can be included rather than a generic TOBS.
“The transition from afternoon to morning observations started in 1960 or so. MMTS instrumental transitions happened in the 1980s. While some TOBs changes did occur during the period of MMTS transition, the two are distinctly different and mostly unrelated.”
There are some other interesting transitions between 1970 and 1980 that likely impact airport stations. With more pilots calling to get destination weather reports equipment would be accessed more often. That could inspire a few more undocumented moves to save steps until digital was affordable.
Zeke,
Do I have this correct? The actual maximum and minimum temperature readings are adjusted up or down to correct for the time of observation effect on “average ” temperatures? Surely the maximum temperature should not be adjusted nor the minimum. Those temperature readings would record the actual temperature max or min reached over the observation period.
Whilst the adjustments might correct for the “average” temperature, the past actual recorded Maximum temperature (now adjusted) will be 0.5 C lower relative to the current Maximum temperature (now adjusted) because of the adjustment? Or have I missed something?
Zeke, “Both MMTS and LiG min/max thermometers are equally affected by TOBs bias. MMTS (at least the ones used by co-op stations) do not record hourly temperatures and provide a daily min/max value that needs to be reset at the observation time just like old LiG min/max thermometers.”
They equally have a TOBs effect but the magnitudes of the effects aren’t equal. Since there is a solar radiant bias for CRS and most MMTS, the Daily Tmax is more closely related to local solar max. So a 1800 hrs reset time would have less TOBs impact in summer and southern states. However, if you correct for TOBS in these cases you would be also correcting to instrument bias. That would make it nearly impossible to isolate micro-site biases based on instrument type, i.e. tree and building encroachment reducing surface wind velocity at the station.
Also the changes in TOB are not random from ~1980 and tend to shift to PM which would reduce TOB bias in many cases, especially summer and southern stations as mentioned. Operators could be switching observation times to improve accuracy e.g. 1800 hrs for summer and 0700 hrs for winter which would also make it easier to tell the local newspaper or new station what the most recent high and low temperatures were.
I didn’t redo all your CRN stuff but Watkinsville GA and Merced, CA provided a quick spot check.
Zeke,
I use the stations prior day as the baseline for calculating it’s anomaly. I still need to better understand the double count bias, by using the prior day as the baseline, if they change observation time, as long as they do it only once it doesn’t show up as a change in the anomaly but one time.
A number of folks have been saying of late that NCDC/GISS doesn’t share their raw data or code. This is not true.
Raw data for the world can be found here (the QCU files): ftp://ftp.ncdc.noaa.gov/pub/data/ghcn/v3/
For the U.S. here: ftp://ftp.ncdc.noaa.gov/pub/data/ushcn/v2.5/
Their code is here: ftp://ftp.ncdc.noaa.gov/pub/data/ushcn/v2/monthly/software/
GISS has all their code here: http://data.giss.nasa.gov/gistemp/sources_v3/
An independent group called Clear Climate Code even rewrote GISS code in python awhile back: http://clearclimatecode.org/gistemp/
Oh Zeke, your attempts to justify your ‘adjustments’ but completely ignoring the most obvious bias, UHI effect, tells me you are being rather disingenuous with your protestations that everything is OK with the data.
Hi jbenton,
Its not like I was the lead author of a major paper published in JGR on UHI in the U.S. or anything (which, I should mention, is linked in the post): http://onlinelibrary.wiley.com/doi/10.1029/2012JD018509/abstract
For folks interested in UHI, my presentation at the AMS meeting back in 2011 might be relevant: https://www.youtube.com/watch?v=9zXRZQ3ASa4
Nope jbenton2013, you are missing the point, if the “adjustment” is related to TOBS even though there is no need to adjust for TOBS, then what might be instrumentation bias, siting bias, or other impact are wrapped up into one.
Since Karl, 1986/89 already figured the problem had to be due to TOBS because of all the new super accurate MMTS systems had that stellar lab accuracy, TOBS was implemented prior to Quayle 1991 noting that different shelters had different solar and surface wind variation bias than CRS. If you start from scratch you would find a Surburban Heat Island effect since most airports are in the burbs.
It really doesn’t matter for the overall temperature record but it does complicate attribution of the cause of the adjustment. And when you adjustments happen to impact your baseline average you get to answer more questions than normal.
You know what I can’t understand… such great lengths are gone to to adjust the temperature records here in the U S (which are probably the most thorough and accurate of any country in the world since the 1800’s) yet the vast majority of the world has not even had a reliable recording process for much of that 200 year period. Who is making the estimates for global temperatures outside the U S during those 200 years and what are they basing it on? It seems to me that people could come up with any numbers they wanted. Let me be blunt…. I do not have any faith or confidence in NOAA/NCDC considering the over bias and political agenda held by some in charge there. They are cooling the past globally and warming the present at their own whim and there is no way to hold them accountable.
Congress will hold a hearing
No leading skeptic will stand up, swear to tell the truth, and accuse NOAA of wrong doing. Not a single one.
Malicious doing need not be shown, merely ignorant doing.
=================
Steven,
I don’t know why you keep talking about skeptics, the hearing is about asking Nasa to explain it’s adjustments and methods. I could certainly be wrong but why would they ask skeptics anything unless they were expert on Nasa methods. As far as I know none are. I know it is a lot of political theater but it seems to me they just want Nasa on the hot seat.
Rohrabacher is the one famous for bringing Mars into the climate debate, and asking how toxic CO2 is. There is no telling where he is coming from on this one. Probably something he read on a blog.
simple ordvic.
because the congressional hearing will make fools of anyone who wants to stand up raise their hand and swear to NOAA wrong doing.
Democrats should call Pielke Sr as a witness. And ask what he thinks about the charges of data manipulation.
Skeptic vs Skeptic… great theatre..
“Skeptic vs Skeptic… great theatre.”
____
They should charge admission & have a concession stand.
Even HAL was hoping to get the truth from the great computator himself.
https://www.youtube.com/watch?v=38EDhpxzn2g
There is a message here for everybody…
Who decides who and isn’t a “leading skeptic”?
ROFLMAO
Steven Mosher. For the better part of 4 decades I’ve certified data and reports that have legal liability. Let me know when you are willing to sign off monthly with a block that says I, Steven Mosher, certify under penalty of law…
When I report to the government, I can’t continually “adjust” historic data without real documentation.
“Who decides who and isn’t a “leading skeptic”?” I am guessing Rohrabacher has a Rolodex.
Bob Greene: When I report to the government, I can’t continually “adjust” historic data without real documentation.
Are you asserting that BEST has not supplied “real” documentation? there is no way that BEST can certify any of the raw data that they start with, such data come to them “as is”.
More BS from Mosher. I have accumulated massive evidence that the US adjustments are bogus and incorrect. I would love testify and hope to have the opportunity. I can’t imagine anyone testifying under oath that they are correct
R. Gates | February 22, 2015 at 5:51 pm |
“Skeptic vs Skeptic… great theatre.”
They should charge admission & have a concession stand.
…..
Colorado tobacco included.
Steve Goddard
I think the original historic US data is of very variable quality as much of it was collected by volunteers with other things to do. Algorithms and complex statistics has tuned this indifferent material into something unrecognisable to the original data.
That doesn’t make it fraud but it does mean a great over reliance on suspect data.
Tonyb
“More BS from Mosher. I have accumulated massive evidence that the US adjustments are bogus and incorrect. I would love testify and hope to have the opportunity. I can’t imagine anyone testifying under oath that they are correct”
That will be special. I hope the democrats call Anthony as a witness if you are called for the republicans.
Can you imagine being responsible for single handedly discreting the skeptics as a whole. Owngoal coming.. congress calls goddard to testify
And now if they DONT call you, you’ll know exactly what they think of you.
Wait it looks like Goddard fell for the taunt..
He has raised his hand to be called to Congress.
how did I know he could not resist.
Now of course there are two outcomes
A) they wont call him.. in which case he’s a nobody
B) they will call him and we can have skeptic versus skeptic..
Hi Zeke – I am glad you are documenting this subject. You might find these papers useful.
Pielke Sr., R.A., T. Stohlgren, W. Parton, J. Moeny, N. Doesken, L. Schell, and K. Redmond, 2000: Spatial representativeness of temperature measurements from a single site. Bull. Amer. Meteor. Soc., 81, 826-830.
https://pielkeclimatesci.files.wordpress.com/2009/10/r-221.pdf
Pielke Sr., R.A., T. Stohlgren, L. Schell, W. Parton, N. Doesken, K. Redmond, J. Moeny, T. McKee, and T.G.F. Kittel, 2002: Problems in evaluating regional and local trends in temperature: An example from eastern Colorado, USA. Int. J. Climatol., 22, 421-434. https://pielkeclimatesci.files.wordpress.com/2009/10/r-234.pdf
Among are findings (in agreement with you) is
“Time of observation adjustments are therefore essential prior to comparing long-term trends.”
In terms of the TOB bias, in addition to the average correction, what is also needed is the uncertainty in this value.
Each step in the homogenization needs to also have reported the uncertainty. These other steps are significantly less clear in terms of how they are done than the TOB adjustment.
I also recommend you look at our papers
Pielke Sr., R.A., C. Davey, D. Niyogi, S. Fall, J. Steinweg-Woods, K. Hubbard, X. Lin, M. Cai, Y.-K. Lim, H. Li, J. Nielsen-Gammon, K. Gallo, R. Hale, R. Mahmood, S. Foster, R.T. McNider, and P. Blanken, 2007: Unresolved issues with the assessment of multi-decadal global land surface temperature trends. J. Geophys. Res., 112, D24S08, doi:10.1029/2006JD008229. http://pielkeclimatesci.wordpress.com/files/2009/10/r-321.pdf
and the Comment/Reply
Parker, D. E., P. Jones, T. C. Peterson, and J. Kennedy, 2009: Comment on Unresolved issues with the assessment of multidecadal global land surface temperature trends. by Roger A. Pielke Sr. et al.,J. Geophys. Res., 114, D05104, doi:10.1029/2008JD010450. http://pielkeclimatesci.wordpress.com/files/2009/10/r-321b.pdf
Pielke Sr., R.A., C. Davey, D. Niyogi, S. Fall, J. Steinweg-Woods, K. Hubbard, X. Lin, M. Cai, Y.-K. Lim, H. Li, J. Nielsen-Gammon, K. Gallo, R. Hale, R. Mahmood, S. Foster, R.T. McNider, and P. Blanken, 2009: Reply to comment by David E. Parker, Phil Jones, Thomas C. Peterson, and John Kennedy on “Unresolved issues with the assessment of multi-decadal global land surface temperature trends. J. Geophys. Res., 114, D05105,
doi:10.1029/2008JD010938. http://pielkeclimatesci.wordpress.com/files/2009/10/r-321a.pdf
Best Regards
Roger Sr.
Thanks Roger. I’ve read a few already, but I’ll take a look at the rest.
Also, the U S only accounts for about 2 percent of the land mass on earth. Getting accurate measurements of the entire globe (past and present) is a much bigger problem. How NASA and NCDC can make claims like “2014 was the hottest recorded year on earth” is ludicrous, unscientific, and fraudulent…. more evidence that they have a political agenda.
Dave
Not all temperature stations are created equal.
I would be highly dubious of the data from many stations especially those outside the core countries. Reliable continuous records from Albania or Algeria?
Tonyb
people assume the US is most reliable
You can test that.
Statistically the US is one of the worst.
so much for the theory that the US should be the most reliable
“Statistically the US is one of the worst.”
Here is some quantification of that. The US is unusual in relying heavily on volunteers. In ROW, the observers observe at uniform times.
Thanks Nick.
I cannot count the times I have heard
1. The US is one of the best
2. Look at these problems in the US.
3. therefore, the ROW must be WORSE.
Un examined premise #1
Typcally americans make this mistake
> Not all temperature stations are created equal.
Not all temperature stations are not created unequal either.
I’d rather say that temperature stations are what they are, and nothing else.
Willard
I must say the piece you did on contrarian is becoming more and more solid.
i was also shocked when I went back to some stuff I wrote in 2007.
its on here have a look
Satellite data is the most reliable data.
I agree about satellite data, but that is only a few decades old, plus it can be manipulated by anyone in charge of it. Ever since this man-made global warming/hockey stick hypothesis (and that is all it is, a hypothesis) the scientific community seems to be bound and determined to cool the past century and a half through “adjustments” and to use any means to warm the present. It all stinks.
@Stephen Mosher
:) Good come back. Gotta hand it to you though – when you are on form it’s fantastic stuff. It’s just….well…you aren’t always on form….
If you want to live in the clouds like Peter Pan, it’s the data for you:
https://33.media.tumblr.com/f03566cde1fa7b14cf790dff9890d604/tumblr_mvbvv99gNI1qkiyi1o1_400.gif
Compare RSS and UHA.
NOT.
1. Both do big adjustments for changing time of observation, location, and sensors.
2. neither provide their code.
3. two groups working from the same sensor data differ dramatically
4. they both cant be reliable
5. Meers ( of RSS) claims the surface temps are more reliable.
5. Meers ( of RSS) claims the surface temps are more reliable.
He would not say that if he lived in Neverland.
Just take the ensemble mean of the sats. That solves the divergence issue. Works so well with the GCMs.
Do Cowtan and Way know about the problems with the sats?
5. Dr. Mears says: “As a data scientist, I am among the first to acknowledge that all climate datasets likely contain some errors. However, I have a hard time believing that both the satellite and the surface temperature datasets have errors large enough to account for the model/observation differences. For example, the global trend uncertainty (2-sigma) for the global TLT trend is around 0.03 K/decade (Mears et al. 2011). Even if 0.03 K/decade were added to the best-estimate trend value of 0.123 K/decade, it would still be at the extreme low end of the model trends. A similar, but stronger case can be made using surface temperature datasets, which I consider to be more reliable than satellite datasets (they certainly agree with each other better than the various satellite datasets do!). So I don’t think the problem can be explained fully by measurement errors.”
The surface temp datasets agreeing with each other is not surprising. How does that make them more reliable than the sats? The coverage of the sats and uncertainty of 0.03/K decade ain’t bad. If the sats are good enough for Cowtan and Way, they are good enough for me. And I don’t care what did or didn’t happen, before 1979.
Don the point would be skeptics opine about UHA and RSS without even reading the underlying documents or science.
Their Over confidence is misplaced
That would undoubtedly be true of some skeptics, Steven. But I don’t care about them, as they are not likely to be getting paid with my money to do climate science. And they aren’t controlling the narrative. Small fry. Fringe actors. The misplaced overconfidence of the consensus crowd is more problematic. Wouldn’t you agree, Steven?
Stephen Mosher writing about skeptics: “their over confidence is misplaced”
Or their faith in normal unbiased scientific practises has been undermined.
You seem to want to lump all people who are skeptical of the CAGW meme and the political consequences that follow from it together in the same “discount special for sale” bin. This is as bad as some skeptics who lump all those alarmed about AGW into the “kool aid” room, along with accusations of hoax, plans for world domination, and other libertarian talking points.
IMO when you talk in this way you sound (to me anyway) faintly ridiculous. It’s a shame because it distracts from the very many valid points you make in connection to your area of expertise. There are many skeptics who might regard the temperature records with suspicion but are otherwise unconcerned by them and that they are not in contradiction to their view that we do not appear to be heading for a thermageddon.
But after climategate, surely you must agree that faith that scientists working on world temperature series are completely free confirmation bias has been undermined? Surely it’s not unreasonable to be suspicious?
Posts like Zeke’s go along way to building confidence that homogenisations are reasonable and are being handled appropriately, but TBH you somewhat undermine them with some of your replies, which sound over confident and defensive at times. I say, let your arguments speak for themselves and don’t dress them up in skeptic bashing in order to make yourself seem properly balanced. I think it’s confusing.
Agnostic.
have you noticed that folks with good questions address Zeke and people who just want to fight.. ask me.
wink.
“And they aren’t controlling the narrative. Small fry. Fringe actors. The misplaced overconfidence of the consensus crowd is more problematic. Wouldn’t you agree, Steven?”
depending on the topic that case could be made.
Steven Mosher | February 23, 2015 at 5:56 pm |
Agnostic.
have you noticed that folks with good questions address Zeke and people who just want to fight.. ask me.
wink.
————–
Yes, well perhaps that is because Zeke actually can answer good questions with some degree of clarity.
Hi Zeke – You wrote
“There is no perfect instrumentation, apart from newer networks like the CRN.”
I assume you are kidding. :-) The CRN does not monitor absolute humidity and thus cannot compute long term trends of moist enthalpy (correct me if I am wrong). This is of major importance if one wants to use surface temperature to monitor “warming” and “cooling”; e.g. see
Pielke Sr., R.A., C. Davey, and J. Morgan, 2004: Assessing “global warming” with surface heat content. Eos, 85, No. 21, 210-211. http://pielkeclimatesci.wordpress.com/files/2009/10/r-290.pdf
Also, you wrote
Satellite data is adjusted a lot more the surface data, unfortunately. See the “trend correction” table (and references) here: http://en.wikipedia.org/wiki/UAH_satellite_temperature_dataset
Basing your conclusion on wikipedia is hardly a robust source. Please contact the UAH and RSS groups directly on this. The wikipedia article is clearly a biased discussion of this subject.
Roger Sr.
The CRN isn’t perfect (a poor choice of words), though it notably better than any other climate observation network that I’m aware of.
Regarding satellites, I don’t base my conclusions on Wikipedia; I simply use it as a convenient summary of the studies sited therein, particularly Wentz and Schabel 1998 (http://www.nature.com/nature/journal/v394/n6694/full/394661a0.html) and Mears and Wentz 2005 (http://www.sciencemag.org/content/309/5740/1548). The combined adjustments for orbital decay and diurnal drift dramatically change the trend vis-a-vis the prior method. The general point is that satellites are themselves subject to large adjustments, and are not by definition a more robust and bias-free measurement of surface temperatures than thermometers.
Than thermometers irregularly handled? Are you just jealous of the data source. Naw, you have too much credibility with me for that conclusion.
=============
“Basing your conclusion on wikipedia is hardly a robust source. Please contact the UAH and RSS groups directly on this. The wikipedia article is clearly a biased discussion of this subject.”
both UHA and RSS have “adjusted” the past.
Neither provides code to the public to document what they do.
They differ in substantial ways.
Its a good product but its an entirely different animal.
For one, its not a direct measurement. Its created by microwave radiative transfer theory.
UAH techniques are documented in published papers, as I understand the situation.
jim2
back in the day when folks like me were demanding temperature code from hansen and jones and noaa so we could see the adjustments
a dude named magicjava was going after satellite code.
he didnt have much luck. he was a skeptic who did real work.
an inspiration.
here a random like to his work
everyone forgets the skeptic who tried to get satellite code from NASA and JPL and how he was blocked
I dont
http://magicjava.blogspot.com/search/label/Raw%20UAH%20Temperature%20Data
Steven – I poked around magicjava’s site a bit. He was supplied some of what he requested:
…
NASA has responded to my FOIA request.
In a nutshell, they provided me with a link to the AMSU-A Radiative Transfer Algorithm documentation and said they had no information on the scan depths for the footprints of channel 5 on the AMSU and didn’t have the vector data they use to synthesis AMSU channel 4.
…
I’m not going to read the entire blog, but I do agree with you (if this is what you mean) that all code and data used in UAH and RSS should be publicly available. This, assuming there aren’t any national security issues.
yes jim2.
magic went for soup to nuts and ran into ITAR.
I thought the ITAR excuse was bogus.
However the ITAR code was at the source of the data chain.
At the back end we have the adjustments made by UHA and RSS.
This stuff is at the opposite end of the pipeline far away from the ITAR
stuff.
Hmm for a brief while at berkeley we had a guy looking at redoing UHA and RSS.
A lot of work. needs some rocket science
Mosh,
In you attempts to find uhi, what was a station compared to to see if it was affected by uhi?
If you look for a year over year uhi, you might not find warming that survives winter, but how did you try to find it?
Micro.
the vast majority of the work operates according to the skeptical premise.
A) UHI infects the long term global average
B) If you remove urban stations the trend will go down.
So. define urban and rural and test this.
Other approaches:
Compare a urban only network with a rural only network
Compare PAIRS of stations. rural versus urban.
so you can do any number of variations on these.
compare tmax, tmin, tave. compare by season. ect ect etc.
Or take a Ross Mckittrick regression style approach
Steven Mosher commented
How does BEST’s pairwise homogenization not homogenize UHI impacted and Rural stations together making a mess of both of them?
Steven Mosher | February 23, 2015 at 8:46 pm |
Micro.
the vast majority of the work operates according to the skeptical premise.
A) UHI infects the long term global average
B) If you remove urban stations the trend will go down.
So. define urban and rural and test this.
________________
Wouldn’t the correct experiment compare urbanizing and non-urbanizing stations as compared to urban vs. rural? The effect isn’t about whether a station is, today, urban, but about how the surrounding area has changed over the temperature record of the site.
Or to be perhaps even more precise, isn’t the right test between stations where virtually no man-made changes have happened within a radius where they might affect a temperature change versus those where man- made changes have occurred?
I don’t believe they exist, or if they do the ability to correctly identify them programmatically. This is the same issue with all of the changes to the data, the ability to programmatically identify and correctly adjust the data and to be able to validate it. Getting it 99% right still means there over a million wrong.
> Please contact the UAH and RSS groups directly on this. The wikipedia article is clearly a biased discussion of this subject.
Because the UAH and RSS groups are clearly not biased on this subject, no doubt.
Zeke
Some 5 years ago I wrote an article on the loose methodology employed in the reading of thermometers and the compilation of records.
Neither the max min thermometer nor the Stephenson screen were universally adopted until the 20th century and the manner in which thermometers were read and the time of observation issues were often complained about by the scientists of the day over a century ago.
Dr Julie’s hann wrote a particularly good book on climate in general and the manner in which readings were taken. Published in 1903 it amply illustrates that even into the 20 th century there was often much to be desired in the way in which readings were taken around the world. The US was not immune to this due to the volunteers used who received variable training.
https://archive.org/details/pt1handbookofcli00hannuoft
Page 7 In this 1903 book references the time of observation and the controversy that surrounded it.
Whether what was written down was reliable is a matter of conjecture and this must be borne in mind when any adjustments are made.
Camuffo and jones received a 7 million euro eu grant to manage the ‘Improve’ project which looked at and adjusted seven historic temperature records. What has come out of it was a detective story worthy of Sherlock Holmes but whether it is right is a matter of conjecture.
I doubt if BEST has been given the resources to examine the historic record in the same forensic manner of Camuffo and Jones.
We must not make the mistake of thinking historic anecdotal thermometer readings are necessarily any more reliable than anecdotal historical observations.
Tonyb
There are problems with daily max, atmospheric temperature changes rapidly (I witnessed two total solar eclipse on a clear day). Quarter of an hour of the early afternoon sunshine on a cloudy day could make lot of difference to the days max, not so sure about daily min, never been up that early in the morning.
Forget about Stephenson’s screens, temperature sensors should be buried in the open ground at some 20-30 cm depth where daily min-max do not penetrate. At least worth of an experiment. Perhaps time for another email to the MetOffice.
Vuk
I’m there tomorrow so I will suggest it to them and take the credit if it works. If it doesn’t I will point out the idea came from you
Tonyb
Tony
I am told Met Office is a Civil Service department, as such it does not admit to, but also does not deny an external counsel.
Vuk,
In NZ ground temperatures are recorded daily at many sites. It is important information required for a variety of agricultural purposes. Usually data is obtained at several depths at each measuring site. Sensor depths include 5 cm, 10 cm, 20 cm, 30 cm, 50 cm, and 1 m. Some of these records go back to the 1950’s. It is possible to compare the trends for earth and air temperatures from the same sites (first you need to learn how to extract the data from the NIWA database).
One would have to guess that similar data exists for the UK, and for many other countries. You just need to figure out how to get access to it, and when you have it what to do with it.
The more I read about this subject the more I am convinced that the scientists are nuts who claim they have some sort of understanding of the earth’s past temperatures. If past readings in the U S can’t be trusted and have to be adjusted by some artificial and subjective set of algorithms, how can the scientific community have any understanding or confidence in the past temperatures of the rest of the world. Record keeping in most of the world has never been nearly as accurate as it has been here in the U S. For scientists to claim they have some accurate sense of historic global temperatures is crazy. And now they claim 2014 was the warmest year on earht in recorded history. Well. that recorded history is more full of holes than swiss cheese. Why would any scientist make a claim like that unless he was trying to advance an agenda? It is all a big fraud where grants and political philosophy are more important than the truth.
Dave
I’m not sure I’m ready to declare anyone with a mental disorder quite yet, but given the incalculable number of moving parts in this evolving system with thousands of actors over many decades, I think everyone is way too confident that they are representing reality at every one of the tens of thousands of sites.
This is not a shot at anyone. It is simply an impossible task.
And then there are the enormous uncertainties across the rest of the globe.
Kudos to all for trying, but it seems to be beyond reach of the very brightest minds.
Some things are just unknowable.
Amen. Seems like the culture has formed around th option that if one is transparent about ones methods it is enough. In “real” science material and methods not only have to be stated but shown to not effect the outcome. Behold, mostly Mosh but sometimZeke seemingly taking refuge in the fact that without adjustments the post 50s trend would be one way or another and perhaps skeptics better shut up because it is not good for their side.
Again not to single thee folks out, but makes mr shake my head. Sigh post modern science has become too complicated
Dave, I think you hit the nail on the head. I don’t doubt that BEST and others do what they think is correct, but the data they have to work with is clearly fraught with errors. Garbage in, garbage out I’m afraid.
What baffles me is the near complete lack of any experiments to try and get at some of the errors or to design validated methods for both data collection and data analysis. I can only guess that is because such experiments would take time and it is more gratifying to play with computers and generate the next “key” conclusion.
Hi Zeke
Thank you for the replies. A major advantage of the satellite data is its near global coverage.
In terms of the long term surface temperature trends, the reason that they are receiving such attention is that they are used as the primary metric to diagnose global warming. However, with the recent “hiatus” and claim that a significant fraction of the heat is being transported into the deeper ocean, this diminishes the value of this 2-D “global warming” metric.
I discuss this in my weblog post
https://pielkeclimatesci.wordpress.com/2011/09/20/torpedoing-of-the-use-of-the-global-average-surface-temperature-trend-as-the-diagnostic-for-global-warming/
See also
Pielke Sr., R.A., 2003: Heat storage within the Earth system. Bull. Amer. Meteor. Soc., 84, 331-335. http://pielkeclimatesci.wordpress.com/files/2009/10/r-247.pdf
Roger Sr.
If it takes over 100-200 years, as some estimate, to turn over the ocean the warming of the sea surface will continue to warm the deep ocean for decades even if the sea surface temp falls as long as the surface temp remains above the moving average temp for whatever the ocean turnover rate is.
I think this common sense fact has been used by climate scientist to announce: “Yes there is a pause in surface temp rise but the oceans are still warming, without adding.”
The fully informative scientist would add that it’s because the current sea surface temp is still in process of recovering from effects of a few hundred years of Little Ice Age. It’s not trapping new heat from the energy budget.
The latest Holocenic drop came perilously close to the attractor of glaciation. We need a little leeway for that circling moth.
==============
:) And we better save some of that good stuff for future generations as the paleo-chart says they are gonna need it.
The ocean does not “turn over”. There are zones where deep water is pumped up by Ekman wind shear. There are zones where new deep water is formed, mostly at the edges of the polar ice caps. There are dead ends where water is trapped.
https://geosciencebigpicture.files.wordpress.com/2012/01/2500-metre-age-from.png
These are Carbon isotope inferred 2500m (deep) ages by Gebbie and Huybers. Interestingly, the oldest water on earth seems to be off the coast of California at 1500 years old. The youngest bottom water is in the north Atlantic near a major area of deep water formation and it is 300 years old.
The point here is that below the mixed layer the ocean is impressively stable. The median age is 850 years and an eyechrometer average appears about the same.
Gymnosperm, I understand that’s water at 2500 meters? The “oldest water” is likely to be elsewhere, in deeper waters. Also, I don’t want to sound stupid, but could these carbon isotope ratios get altered by organic matter raining from above, getting chewed on by bacteria, which in turn release CO2? Am I being stupid, or can this influence the carbon cycle as you see it?
Deep ocean is essentially meaningless without explaining what it means. Do they say stored in the abyssal oceans? Who is they? How much do they say is stored there? Do they say stored 0 to 2000 meters? Who is they? How much do they say is stored there?
Zeke – One more comment. In my Public Comment on CCSP 1.1 – https://pielkeclimatesci.files.wordpress.com/2009/09/nr-143.pdf
I made the following recommendation
“The major issues with the surface temperature trend data that have not been addressed satisfactorily in the CCSP Report are summarized below:
1. The temperature trend near the surface is not height invariant. The influences of different lapse rates, heights of observations, and surface roughness have not been quantified……
.
What is the bias in degrees Celsius introduced as a result of aggregating
temperature data from different measurement heights, aerodynamic roughnesses, and thermodynamic stability?
[the more recent paper
McNider, R.T., G.J. Steeneveld, B. Holtslag, R. Pielke Sr, S. Mackaro, A. Pour Biazar, J.T. Walters, U.S. Nair, and J.R. Christy, 2012: Response and sensitivity of the nocturnal boundary layer over land to added longwave radiative forcing. J. Geophys. Res., 117, D14106, doi:10.1029/2012JD017578. Copyright (2012) American Geophysical Union. http://pielkeclimatesci.files.wordpress.com/2013/02/r-371.pdf
examines this issue with respect to thermodynamic stability].
2. The quantitative uncertainty associated with each step in homogeneity adjustments needs to be provided: Time of observation, instrument changes, and urban effects have been recognized as important adjustments that are required to revise temperature trend information in order to produce improved temporal and spatial homogeneity. However, the quantitative magnitudes of each step in the adjustments are not reported in the final homogenized temperature anomalies. Thus the statistical uncertainty that is associated with each step in the homogenization process is unknown. This needs to be completed on a grid point basis and then summed regional and globally to provide an overall confidence level in the uncertainty…
What is the quantitative uncertainty in degrees Celsius that are associated with each of the steps in the homogenization of the surface temperature data?
There are several other issues that are mentioned in the Report as being issues, but are dismissed as unimportant on the larger scales, but without quantitative assessment of their importance. These effects include the role of poor microclimate exposure and the effect of temporal trends in surface air water vapor in the interpretation of the surface temperature trends.
There is also the question of the independence of the data from which the three main groups create global data analyses (page 8 Chapter 3). Figure 3.1 presents the plots as “Time series of globally-averaged surface temperature….datasets.” The inference one could reach from this is
that the agreement between the curves is evidence of robustness of the trends plotted in the Figure. The reality is that the parent data from which the three groups obtain their data is essentially the same.
The Executive Summary even states “Independently-performed adjustments to the land surface temperature record have been sufficiently successful that trends given by different data sets are very similar on large (e.g. continental) scales.”
The data used in the analyses from the different groups, however, are not different but have very large overlaps! This statement in the Executive Summary is incorrect and misleading.
The report needs to answer this question,”
Best Regards
Roger Sr.
Dr. Pielke
In an average year there could be about 30 days when geomagnetic daily index exceeds 60, due to the solar flairs and mass ejections. To avoid any effect on the satellite borne temperature sensors shielding required might render sensor inoperative, so some compromise would need to be engineered, or data corrected.
Are you aware of any articles where the problem is addressed?
Thank you.
roger, thank you for saying this, this is what I want to see:
The quantitative uncertainty associated with each step in homogeneity adjustments needs to be provided: Time of observation, instrument changes, and urban effects have been recognized as important adjustments that are required to revise temperature trend information in order to produce improved temporal and spatial homogeneity. However, the quantitative magnitudes of each step in the adjustments are not reported in the final homogenized temperature anomalies. Thus the statistical uncertainty that is associated with each step in the homogenization process is unknown. This needs to be completed on a grid point basis and then summed regional and globally to provide an overall confidence level in the uncertainty…
Judith
“The quantitative uncertainty associated with each step in homogeneity adjustments needs to be provided: Time of observation, instrument changes, ”
Go read the original work on TOBs for example.
The errors and uncertain are clearly laid out. Your issue was the principle problem I had years ago with adjustments.. how was the error /uncertaintypropagated.
let me explain how how The TOBS adjustment was developed.
For the entire US hourly station data was selected. Then a portion of that data was held out for validation. From the in sample data an adjustment model was created that looked at the geography ( lat/lon) time of year, sun position, ect , and a correction factor was calculated. Some are positive some are negative. Some are small, some are large.
Then the model was tested on the held out data. The reports conatin everything you want to know about the standard error of prediction and the uncertainty.
Folks who have questions can just go read this stuff.
Now no one has explained these 1986 papers in detail on the web.
That doesnt mean that there is a problem with the uncertainty calculations. Folks can go read them and come back with informed questions.
On the other hand we could also see that in the grand scheme of the global temperature TOBS is US centric problem. There are couple exceptions which I can talk about, but TOBS is a US problem. The problem has been solved for decades. resolved again later.
Then resolved again using entirely different methods.
The resolved yet AGAIN by folding all adjustments into a comprehensive adjustment approach ( Berkeley )
There is zero evidence that a tOBS correction can be ignored
There is Zero evidence that the uncertainty calculated for the correction
was done improperly.
There is no evidence that changing that uncertainty ( as a though experiment ) will have any material effect on any interesting climate science question.
There ARE better areas to mine for uncertainty. areas that have been understudied.
Adjustments aint one of them. Its reached the point being highly technical arguments over mousenut values.
Dr. Curry,
According to NASA when they declared 2014 to be the warmest year EVER, our planetary temperature records begin in 1880. Lets postulate for a moment that the temperature record of the entire planet since 1880 that NASA used to identify 2014 as the warmest is pristine, with 0.01 degree resolution and 0.01 degree standard deviation (necessary to conclude that a +0.02 degree anomaly represents a record).
How does that eliminate, or even reduce the attribution problem?
Given the time history of planetary temperature that we have (or say that we have), postulating that it is accurate, knowing that the current climate is well within its historical bounds over the last few thousand years, and noticing a recent trend line with a positive slope of ~1 degree/century, how do we apportion the total change among all the factors KNOWN to affect the climate, determine the subset of the total change for which ACO2 is responsible, and go from there to there to reasonably declaring that ACO2 poses an existential threat to the biosphere that demands that we impose strict controls over and taxes upon every activity that produces a ‘carbon signature’?
In other words, have we certainly and unambiguously determined that ACO2 presents us with a problem that demands a solution? And do we have any evidence that ANY or ALL of the proposed ‘climate policies’ would have any measurable effect on the planetary temperature, which is the purpose for which they are ostensibly being imposed?
Roger (and Judy),
This is one of the reasons why the analysis the Williams et al (2012) did was so important; they looked at the sensitivity of the homogenization results to all the different tweakable parameters (use of metadata, breakpoint size, number of neighbor stations used, etc.). ftp://ftp.ncdc.noaa.gov/pub/data/ushcn/papers/williams-etal2012.pdf
There is active work being done on this by the International Surface Temperature Initiative benchmarking team (of which I am a member). See our recent paper for example: http://boris.unibe.ch/59043/1/gi-3-187-2014.pdf
There’s a couple of paper such as this one which show the necessity for a TOBs adjustment using hourly data.
Here’s one for Canada
http://journals.ametsoc.org/doi/abs/10.1175/2009JAMC2191.1
Assuming one were really skeptical you ‘could’ put together synthetic cases to prove the point.
This brings up a point I don’t recall ever seeing mentioned: the effect of nearby trees on temperature measurements. By reducing the amount of circulation down to the ground level, tall trees may actually introduce a cooling effect, as demonstrated by the use of wind machines for certain types of frost protection.
Similar effect might be expected from natural wind, assuming nearby tree profiles allow.
I would guess, from first principles and without research, that the effect of trees would be to lower the minimum recorded temps at some times, and on average, with greater effect from greater height. Cutting down a tree (or trees) would introduce a sudden change, which could be accounted for. But the gradual growth of nearby trees between such cutting might also introduce an apparent cooling trend which remains uncorrected for.
@ AK
“The principle of the system is to move heavy cold air to prevent stratification, and allow the warmer inversion layer air to replace the colder air near the ground.”
The theory as I heard it:
Still air is a superb insulator. In fruit groves with no breeze and a clear sky, the vegetation sees the night sky at 3 K and through radiation tries to cool to that temperature. As it radiates through the transparent air and cools, the still air acts as an insulator and prevents the ambient air, well ABOVE freezing, from keeping the fruit at ambient. The fans are to keep a supply of relatively warm ambient air flowing over the fruit, keeping it at above freezing ambient.
Smudge pots take a different tact. They impose a cloud of opaque smoke at above freezing ambient temperature between the fruit and the 3 K night sky, so that the fruit doesn’t try to cool.
The Same principle keeps frost off the car windows in an open carport, while a car parked in the driveway right behind the one under the carport on a clear, quiet night gets frosted windows. The car in the driveway radiates into the 3 K of space, and, insulated by the still air around it, cools below the dew point, gets a wet windshield, cools further, and the water on the windshield freezes. Meanwhile, the car under the carport remains dry and frost free. Neither windshield get frost on a windy night since the wind keeps both windshields at ambient and above the dew point.
While the above sounds reasonable to me, it may also be wrong.
Absolutely not. Trees protect from frostbite, and it is considerably warmer at clear night conditions under a tree than under open sky.
Trees cut both day time highs and night time lows. They are used to protect plants from frostbite by placing them on north side / uphill at NH. During a still night, cold air also flows downhill and trees and shrubs can be used to guide / stop it hurting nonhardy plants.
Me knows, grown in the woods.
cooling trends have been supposed for trees.
warming trends have been supposed for trees.
it could be trees. it could be unicorns.
Zeke, there is no doubt that TOBS adjustments are valid and appropriate. There are some who claim otherwise; hopefully your post can enlighten them. NCDC’s own published US GHCN v1 TOBS provides the same result you derive.
But the big issue is UHI. GISS website uses Tokyo to explain, and says the proper treatment is to artificially warm the past (supplying UHI that was not present) to conform to the present containing it. (And leave properly sited rural stations alone.) Yet on balance, for both the US and the world, the raw past has been cooled rather than warmed. And this is demonstrable on average, for ‘pristine’ rural stations (spot checking US surfacestations.org raw versus GISS, or Rutherglen by BoM in Australia with their algorithm) and for carefully maintained and suitably adjusted (station moves, instrumentation) urban stations. A current example is Reykjavik, where IMO’s Trausti Johanssen has provided a clear, careful explanation of what adjustments were made for what reasons. That carefully adjusted record is the GHCN raw. Both GISS and NCDC then adjust the IMO adjusted to cool Reykjavik’s warm past (1940s) and warm its ice years (late 1960s). The IMO itself says both are wrong. Another example is De Bilt, Netherlands, the home observatory for KNMI. Others include Darwin and Sidney airports in Australia. And the sample of all reasonably complete GHCN with records >100 years (omitting some in the US so as not to US overbias the global sample N=163 shows 2/3 warmed, 1/3 cooled. For the entire N=163, raw is +0.42C/century, adjusted is +0.76C/century. So the warming adjustments are more numerous and much larger than cooling adjustments. Good statstical evidence of an overall warm bias in NCDC GHCN v2. Except for the US this is every station in GHCN with a century record missing less than 10% data. Given the selection criteria, that is not a small cherrypicked subsample, rather another indication of subtle potential flaws.
And there is also glaringly obvious and highly dubious NCDC stuff like the Maine trend difference between 2013 Drd964x and ‘new improved’ 2014 nClimDiv. That is not a UHI homogenization issue. It is newly remanufactured climate history, applied to 42 states out of 48 (CONUS) and nearly doubling the warming trend/decade from what was official using Drd964x in 2013. This does not inspire confidence or trust in an administration with clear agendas, and prone to distortions like in the 2014 National Climate Report.
“A current example is Reykjavik, where IMO’s Trausti Johanssen has provided a clear, careful explanation of what adjustments were made for what reasons. That carefully adjusted record is the GHCN raw.”,/i>
Not true. Paul Homewood is trumpeting the 0.4°C difference between GHCN and TJ’s record. After endless fuss about GHCN’s “fabrications”, they are now blasted for not “fabricating”. The GHCN unadjusted record was first compiled in about 1992, and actually goes back further than the IMO docs.
Nick, sorry, wrong. I went and researched Reykjavik before writing it into my book essay. You are asserting Trausti Johanssen of IMO made his narrative up? Or that the IMO’s own public carefully adjusted records are wrong? Or that GHCN raw is not IMO adjusted? You are provably wrong on all counts. Defending the indefensible is not wise.
And, you also misrepresent Paul Homewood’s critique supported by Trausti himself, the IMO senior record keeper.
You need to up your game.
“That carefully adjusted record is the GHCN raw.”
That statement is clearly wrong. Paul Homewood says:
“The GHCN unadjusted are not exactly the same as the IMO figures. As Trausti points out, the latter have been carefully adjusted where necessary, e.g. Reykjavik between 1931 and 1945, when the station moved.”
Interesting pics of thermometers. How many digits to the right of the decimal point can you get out of those?
Depends on how many meters you have and how many times you read them.
The amount of error is probably less important than the difference between shore and highland, shade and sun, sand desert and peaty swamp. I’m kinda not very impressed by slight changes, though they sometimes may have very visible consequences locally.
Hi, Zeke. In recent decades the precipitation time of observation shifted from warmer times of day to a cooler time (12Z). Precipitation tends to be heavier in the warmer times of day, especially in summertime, so this observation time change might make it seem that days of heavy precipitation have increased due to no longer splitting heavy afternoon rains between two days.
I looked at the daily precipitation data for several sites some years ago. It seemed to show such a TOB effect, but my sample was small and I did not investigate further.
David Smith
Measuring precipitation is always troublesome due to inhomogeneity. For example, I recently had two calibrated rain gauges installed within 1km of each other, each providing very different readings every time some rain came through. I ended up with an angry client demanding I replace whichever of the gauges was ‘malfunctioning’.
Years back, I lived in a neighborhood where it seemed one side of the neighborhood would always get a significantly different amount of rain than the other. There were a couple times it rained on one side of the neighborhood but was sunny on the other side.
I’ve always wondered what caused that.
Brandon,
Micro climates only miles apart or (hundreds of meters apart with elevation change) create significant differences. I lived near Colorado Springs for 20 years. The south side of the city (where the airport is) is almost desert with about 14 inches of rain per year. The north side has almost twice that (from memory). The biomes reflect this difference.
That makes sense, but it always weirded me out that the difference in rainfall wasn’t consistent. One storm would rain on one side of the neighborhood but not the other, but the next storm might reverse the pattern.
One time it was really weird. There were rain clouds, but they were only here and there. In-between them was clear sky. I was able to walk from one end of the neighborhood to the other without getting wet by weaving through the parts that weren’t being rained on. I think I crossed between sides of one street a dozen times.
I’m sure there’s some name for those sort of clouds, but it was really weird to me. I had never imagined you’d be able to stand with your hands out and have one in the rain and the other in the sun.
looked at rain data.
dont want to touch it.
the spatial variability is pretty scary (technical term)
“I looked at the daily precipitation data for several sites some years ago. It seemed to show such a TOB effect”
Rain per day is not a treasured statistic. Rain is cumulative – generally quoted in per annum. There is no min/max average, as with temp.
Dear Zeke
“If you change the observations times from afternoons to mornings, as occurred in the U.S., you change from occasionally double counting highs to occasionally double counting lows, resulting in a measurable bias.”
I have very hard to see the problem except only at the moment you change TOB.
The max is the max in any of the 24 hours and the minimum likewise. I can’t se the problem of double counting except for that single day when you change TOB. It doesn’t matter if the max happened just before the reset or after the reset and the same for the minimum. The said double counting (that really is not double counting) needs some larger changings from day to day, and they will change back again giving double counting the other way.
An other matter is if the average daily temperature always is computet as the simple average of max and min.
And the real average of a lot of measurements over 24 hours must differ from the max-min derived. How is that treated?
Hi Svend,
If you have hourly temperatures (e.g. as in the CRN data), then time of observation clearly doesn’t matter. If you keep the time of observation constant, while the choice of TOBs will effect the average max and min temps a bit, it won’t have any impact on the trend. If you change the TOBs, however, you will end up with trend biases. Take a look at Figure 4 in my article; it shows how the min, max, and mean of all CRN station data changes based on the time of observation (relative to midnight).
One of you must be wrong Zeke, I would wager Robert is wrong
Robert Way above ” a couple of paper such as this one which show the necessity for a TOBs adjustment using hourly data.”
I checked for my self with Boulder for 2014, and must admit there is more than 0.5C between 6 morning and 3 afternoon for max temp, as far as i have done it right. I believe the large difference is caused by very large temperature swings at that place. Afternoon is the higher.
Reading all of these comments, my conclusion… any scientist who claims to understand the accurate past and present temperature readings around the earth for the last 150 years is blowing smoke up your butt. And for any government agency- NOAA/NCDC- to make a claim that last year was the warmest year on record for the earth is outright unsubstantiated crap. Come on scientists, admit you do not have the data and also admit that you have no idea of the exact impact of CO2 levels in global temperatures. Bring some integrity back to science.
Dave,
It’s all about the error bars, as several folks keep coming back to. If the error bars are similar to your signal (temperature change) then you really don’t have much. In GST we are looking at a 1 deg temperature change over a hundred years with an error bar the can’t be much less than half a degree at best.
I think Rud lays claim to the Blowing Smoke characterization.
Yes, but not that particular metaphor.
In the global waming debate how much of a difference could “correcting” past U S temperatures make? The U S is a tiny fraction of the surface of the earth. It seems that there must be hugely inaccurate, and unreliable, temperature records over the past 100-200 years for a large majority of the earth. How can climate scientists know what those historic temperatures were with any accuracy. How can they then deduce that 2014 was the “warmest year on record in the history of the earth.” To me, as a layperson, this seems like a politically motivated statement, not a scientific one.
davidandrews723: In the global waming debate how much of a difference could “correcting” past U S temperatures make?
That is the question that the ongoing analyses are designed to answer. To me, the result so far has been “Not very much”. Brandon Shollenberger recently wrote that it could add 20% to the estimated global mean temperature change since 1850. I think Steven Mosher has written “Not enough to change the basic scientific claims.”
Ya Matthew that’s my judgement.
If somebody asked me “Do you think that re doing the land temperature series YET AGAIN, will yield a result that changes something fundamental, I would say NO. ( oceans much more likely )
That is, people have sliced the data 10 different ways. NOAA, CRU, GISS, JMA, BE. Independents: Zeke, me, jeffid, nick stokes, chad and MORE.
People have averaged the data six ways from sunday.
People have adjusted different ways, not adjusted..
And today we still know what we knew when we started
A) C02 is a GHG. more will warm the planet all else remaining equal
B) How much? between 1.5 and 4.5 C per doubling
C) was the MWP warmer? hmm maybe, cant tell for sure.
So, I dont think anyone thinks that redoing the series one more time will yield any game changing insights.. otherwise they would fund it or some amatuer would do his own and be king temperature.
Dave,
Tobacco smoke enemas were a popular consensus medical treatment for a hundred years, particularly for drowned persons. Fancy devices that included a bellows hung near places where folks might drown, much as defibrillators are now placed in gymnasiums. A picture of a typical kit and this treatment’s history can be found here: http://www.todayifoundout.com/index.php/2014/05/origin-expression-blow-smoke-ass/
I have read in a mid Nineteenth Century American country recipe book, of the treatment for the victim of lightning strike. It was to place the person in a barrel of cold water. If, after three days the victim had not resuscitated, salt was to be added to the water.
Those were the days, my friends, they thought they’d never end.
==============
Nothing worse than people who have all the answers and don’t even know half the questions that should be asked.
These new thermometer networks seem very laserdisc-not necessary and quickly obsolete.
Tactics
NOAA is accused of data tampering.
One such “tampering” is adjusting for TOB
Zeke just demonstrated using CRN that IF you change the Time of Observation, you will introduce a BIAS.
Historical question: Who first suggested this in 2007 as the best way to settled the issue?
http://climateaudit.org/2007/09/24/tobs/#comment-107771
read the whole thread 7 years ago.. and still ZERO evidence that the TOBS adjustment is A) un needed B) Wrong as performed.
NOAA attempt to remove this the TOB bias
Faced with the demonstration ( suggested by mcintyre no less) that this bias is real and needs correction.
There isnt a single skeptic who will say they were wrong about accusing NOAA.
Even when Roger Sr says change of TOBS introduces a bias
Even when Rud, says its needed.
Demonstrations dont work. Skeptical experts who agree are ignored.
Faced with the fact that their suspicions about TOBS were wrong
what happens next?.
Do people say… well I had a theory about TOBS being bogus, guess I was wrong.
Nope. Instead we get DIVERSION to a different topic.
Current Diversions
A) satellite are better:
B) what about UHI
C) MMTS — yet again
D) Dont Trust the government
E) What about 2014 being the hottest year
F) Other countries are unreliable
G) we know nothing before stevenson screens
H) The pause
I) What other metrics would be better
J) Iceland records
K) Maine records
There you have it. Now folks are constantly berating climate scientists for not following the scientific method. And what do we see here.
A claim was made, specifically by Goddard, that NOAA were manipulating and changing data in fraudulant ways. TOBS is one of those adjustments.
Zeke has just demonstrated the necessity of a corrrection for TOBS.
Some skeptical thought leaders concur; roger Sr. and Rud.
However, I have yet to see a single denizen stand up and say
‘ I guess I was wrong about TOBS”
L) Trees, what about trees?
Trees are “un needed” !
I think people need to be reminded about the first graph in the previous thread about raw and adjusted temperatures. Given that TOBS occurred post 1960, it had very little impact on the global BEST temperature. Is it even worth arguing about? In fact trends in the last 100 years have not been much affected by adjustments.
https://curryja.files.wordpress.com/2015/02/figure-1-homogenizationgloballand.png
C’mon Jim D, give them something to talk about.
JimD, as said on that thread, temperature adjustment is an interesting tempest in a teapot, albeit an interesting one. Trust in government/goverment competence is a bit shaken by indelible facts like DrD964x conversion to nClimDiv.
Look at the BEST chart you just reposted. Even IPCC AR4 did not attribute the ~1920-1945 rise to CO2. Yet the attribution of the ~1975-2000 rise was all GHG. No natural variation. So now the pause has falsified the GCMs, and so their estimates of sensitivity, upon which the whole CAGW meme depends. No obscuring of that stark reality, in both adjusted land surface and satellite observations. Even though Cowtan and Way tried. And England tried. Essay Unsettling Science. And Trenberth tried, essay Missing Heat. And more recently, Marotzke tried. See Lewis at Climate Audit.
” Is it even worth arguing about? ”
It is hilarious. starting back in 2005 and again in 2007, Numerate skeptics have concluded that it is NOT worth arguing about.
yet, they continue. This admits a few explanations.
None of them favorable to skeptics.
They are becoming the equivalent of dragon slayers
Steven Mosher: Numerate skeptics have concluded that it is NOT worth arguing about.
It was worth the work that you all have done and are doing, and it has been worth careful examination of the results. Brandon Shollenberger wrote that the “adjustments” all together might add 20% to the size of the global mean temperature increase since 1850 (iirc, apololgies if I misquote.) “That’s about the size of it.”
Matthew R Marler:
The quote you reference was only in relation to BEST. I’ve pretty much never gotten involved in discussions of other temperature records (aside from when I discussed the stupidity of the “zombie station” nonsense people were spouting). That’s because I think the available temperature indices are low-quality work which give us a general idea of things but are disturbingly imprecise given the claimed importance of global warming. I cared about BEST because it was supposed to improve that situation, and people say it has, but I think that’s wrong.
In regard to BEST, it’s important to realize my criticisms of it aren’t limited to how much its adjustments affect its global results. I’ve been criticizing BEST for some time now, but until a couple weeks ago, I had no idea its adjustments had such a significant impact on its global results (since BEST was never up-front about it). A month ago, I wouldn’t have guessed the results were as large as 20%.
I think there are important issues to work out with temperature indices. I think there has been unethical behavior regarding the temperature indices, including with BEST. I think one could even argue “fraud” for people managing temperature indices knowingly exaggerating the certainty of their results. That is the extent of my position.
I think it is foolish to claim global warming is an artifact of fraudulently adjusted temperatures or things like that, but I think it is also understandable. It is easy to demonstrate there has been unethical behavior by the people managing the temperature indices. It is also easy to demonstrate people have routinely exaggerated the certainty of the temperature indices, and in fact, still do so. On top of all that, there is no indication anyone has ever been punished for any of this, suggesting it has been tacitly accepted.
It is easy to see why claims of “fraud” still happen. It’s also easy to see how to get them to stop, or at least be far less common. The answer is not for people like Steven Mosher to tell people skeptics shouldn’t talk about the temperature record. If anything, that will just encourage accusations of “fraud.”
Oh, I should point out the 20% figure is only for the BEST record back to 1850. BEST hasn’t told people what effects its adjustments have over the earlier portion of its record. It hasn’t even published the data for the figures it tells people proves adjustments don’t matter for its results. I don’t know how posting a couple pictures, without data, which only show results for part of their data set, is supposed to allay people’s concerns.
While I’m offering caveats, I should also point out that 20% figure is only for land temperatures. I’ve spent very little time examining ocean data. We have far more information about land data, thus I figure it ought to be more reliable. If there is a great deal of trouble in resolving things for the more reliable data, I’d hate to imagine what my happen with the less reliable data.
In any event, I think adjustments which increase one’s results by 20% certainly deserve attention and discussion. I’m baffled at the idea skeptics shouldn’t spend a healthy amount of time on them. If 20% isn’t enough to matter, what is?
Plus, that 20% figure is just for the effect on the global trend. There are a number of other issues related to BEST’s adjustments, including the massive loss of spatial resolution they cause and how they help cause significant changes in BEST’s stated uncertainty levels. You know, the uncertainty levels BEST has admitted knowing are smaller than they ought to be…
Jim D:
Well that’s my take too. I don’t see the point in relying exclusively on empirical homogenization in BEST.
Were I them, I’d provide the metadata only breakpoint corrections as the standard product, and provide the empirical homogenization as an experimental product.
I’d also be interested in seeing the differences in run speed for metadata only breakpoint analysis vs empirical + metadata analysis, if somebody has the numbers for it.
Incidentally there was a discussion of temperature adjustments, UHI and homogenization on Lucia’s blog on this thread.
One thing I was looking at there was the comparison of BEST against CRUTEM3:
https://dl.dropboxusercontent.com/u/4520911/Climate/Temperature/BEST-CRUTEM4.png
Note that BEST is running “warm” compared to CRUTEM3 until circa 1975, after which it runs cooler. My suspicion is the main difference is in the geographical distribution of stations sampled by the two methods. (This probably also explains the difference prior to 1900.)
If empirical homogenization were causing a warming bias, I think it’s hard to explain why the sign flips after 1975.
I’d love to perform the same analysis for BEST, no-adjustment, metadata only adjustment and empirical + metadata adjustments. Zeke or Steven—-when you performed the analysis you reported on in your last post on Judith’s blog did you happen to save the gridded datas, and if so, could you post a link to them?
C-Line Man.
Carrick:
Do you really think so? I don’t. I could think of a dozen reasons we might see the changes shown in your graph around 1975, including many unrelated to BEST’s “empirical breakpoint” calculations. We definitely couldn’t explain your graph if all that mattered were homogenization, but that’s obviously not the case.
Brandon:
It’s my best guess, which is different than being convinced.
I agree there are other possibilities, but if we believe that adjustments are relatively unimportant (Nick’s work seems pretty persuasive here as independent validation of BESTs work), to me the most plausible candidate is spatial sampling effects (note this is really tempo-spatial, since there could be differences in the amount of annual data used at the same site between the series).
The best way you check that is re-run BEST using the same stations that CRUTEM3 has. Or equivalently the same stations as GISTEMP land only.
Speaking of which, I suppose I should produce the same figure comparing BEST trend to GISTEMP land only (250km and 1200km both). I haven’t verified that the pattern repeats for that other data set.
Anyway, the other way you can check it (more indirect) is to model the effects of the variation in spatial sampling and see whether you can replicate the pattern using the changes in the distribution of stations for the two series over time. That requires more work than I have available, and from experience it’s rarely persuasive to the less math inclined.
I suppose the real effort should be spent speeding up their code so it doesn’t take so long to run or use so many resources. Having gone through the code, I have ideas on this, but I simply don’t have the time to devote to it right now. Oh well.
Over zealous spell corrector. The word is “temporo-spatial” not “tempo-spatial”.
Carrick:
My working hypothesis is BEST’s baselining procedure introduces artificial agreement for the 1900-2000 period. This causes the homogenization process to have little net effect in that period as homogenization’s effect on the data’s agreement is diminished if other effects already increase the data’s agreement.
Under that hypothesis, one interpretation is the change you show at 1975 is unremarkable in regard to BEST’s homogenization as it is outside the period where BEST’s homogenization has a discernible effect on wide-scale trends. The caveat to this is a different choice of baseline period could potentially change the nature of your results.
A different interpretation I’ve toyed with is based on an assumption about your graph. I assume your 50 year trends are centered, so that the 1975 data point uses data up to 2000. If that assumption is correct, it’s interesting to note the change you highlight comes at about the same point you start using data outside the baseline period. It is conceivable changes in the effects of BEST’s homogenization/baselining would cause changes like you found.
Interpretations like these may be completely off-base. I don’t know. I haven’t spent much time looking into them. I’d like to confirm them or rule them out. It’d be pretty easy to do. Unfortunately, BEST doesn’t publish its “no-empirical breakpoint” results so I can’t.
All I can really do is wait for Steven Mosher to come by and tell me how I’m an idiot because BEST has tested all this and it doesn’t matter. And then when I point out claiming to have done tests without publishing your results (or even the details of the tests) is unconvincing, I can have him yell at me some more.
Because that’s all BEST has done when I’ve tried to get them to make their results fully available for people to examine, not just publish their raw data and code.
Brandon, just wanted to mention I saw your comment: Good point about the baselines. I can check this of course by varying the filter width. If the feature where the “downturn” is robust against filter width (within reason), then we can conclude it’s not about baselines.
I’ll look at it this evening or later today.
You guys have the code.
run it.
improve it. that’s the whole point of sharing code.
In SVN if you bothered to look ( find that password yet brandon?)
you should find some earlier versions of this along with some
UHI tests that were done on my specifications.
Robert does have a complete archive of everything. Some of this will probably be used if the paper we have been asked to work on continues forward.
That paper will be focusing on comparisons of global approaches
to local estimation versus local efforts.
That work is especially tedious because to diagnose why we have a different estimate for say France, you have to separate station effects
( did we use different stations) from method effects.
If either of you are really interested, then I would say you should join the author list. I can probably make that happen.
Want to work on the problems of getting local scale correct using our approach? I’ll approach the lead author
Carrick, for what it’s worth, I don’t think looking at how BEST differs from another temperature index is ever going to be conclusive as using a different index adds a number of confounding factors. Short of directly testing BEST’s code, I think the best approach is to just look at how BEST’s results evolve over time.
That’s something I was working toward back when I was working with BEST’s gridded data, I did some analysis of 50 year trends. It’s been a while so I’m going off memory, but I believe I pretty much couldn’t find 50-year cooling trends after 1950 yet could find them throughout the rest of the record.
Assuming my memory is right, I’d like to test that in a more systematic way. Even if it’s not an artifact of BEST’s methodology, it seems like something which deserves some attention.
Brandon Shollenberger, here in short is a problem that I think is more important than the remaining problem of “How much do the BEST adjustments misrepresent the climate change (given the well-documented problems of the raw data themselves)?”
Meanwhile, assume for the sake of argument that the rate of heat loss due to evaporation will increase 5% per 1C increase in surface temp. Assume Stefan-Boltzmann law is reasonably accurate. Assume that DWLWIR increases 4 W/m^2 and that the temperature warms up. When it has warmed 0.5C, evapotranspiration heat loss will have increased by 2W/m^2, and radiative heat loss by about 2.8W/m^2 — implying that the DWLWIR increase of 4 W/m^2 can not raise the Earth surface temp by 0.5C. Obviously these are approximations (based on flow rates by Trenberth), but there is no justification for ignoring the change in the evapotranspirative heat loss rate.
I posted that at WUWT in response to one of Steven Mosher’s apparently unending series of comments that “radiative physics” is all that matters.
That 5% per 1C is within the range of estimates reported by O’Gorman et al “Energetic Constraints on Precipitation Under Climate Change”, 2011, Surveys in Geophysics, DOI 10.1007/s10712-011-9159-6, one of the papers recommended to me by Pat Cassen. The range is 2%-7%, with the lower estimates based on GCMs and the upper estimates from regressions of rainfalls vs temperatures in various regions of the Earth.
Warming since 1850 (that is, change in global mean temperature) is likely in the range 0.7C – 1.1C Compared to the biases in the recorded temperatures and the “best” estimates of the uncertainty in the mean temp change, the bias in the models resulting from poor modeling of advective/convective and evapotranspirative surface cooling rate changes is huge.
Romps et al and Laliberte et al, discussed here in recent months, have made signal steps forward by getting away from modeling base on equilibria, even though some of their specific assumptions do depend on equilibria, such as assuming that the Clausius-Clapayron relationship is accurate.
Matthew,
The differences in trend for LAND ONLY run the gamut depending in where you start from -10% to plus 30%.
It varies over time start at around -10% if you start at 1753, peaking at 30% in the early 1800’s and then dropping rapidily to around 18% in 1850
6% in 1900, then it goes negative after mid century.
Overall, If you look at all 40000 series and take a simple difference between the linear trend of Adj and the linear trend of raw
this is what you find
A) the median adjustment is ZERO
B) the mean adjustment is slightly negative.
However, this weights an adjustment to a small series as heavily as a long series. Further while the distribution of trends sews negative the overall effect is different depending on
A) the spatial region you look at
B) the temporal region you look at.
The fundamental question we aim to answer was this;
Are NOAA and GISS and CRU manufacturing a trend by doing their adjustments. Are they cooking the books as people charged.
Or even are they just accepting adjustments because they go up.
I think our test answers that question.
Then of course people switch from fraud charges to “perfection” issues.
are we exactly like NOAA, how do we differ, why do we differ, is the adjustment too much, too little. Is it significant?
For me these are practical, technical questions, that really have nothing to do with the core tenets of climate science. Err in my opinion nope.
I didnt get into this data to find a 10% difference, or 25% difference.
I got in because some folks though the record was off by 50%. For example see the Mckittrick paper on UHI. When you combine the land with the ocean you need HUGE changes in the land to make any difference in the global number. Take Curry and Lewis. They consider a start period
post 1874 and end period in the last 15 years. Those periods will give you a delta T for sensitivity. The land portion of that delta T is small, so it would require big changes in the land to drive the answer outside the IPCC bounds. In other terms, If your goal were to show that the IPCC got something wrong ( say sensitivity boundaries) then you really have to find big errors in temperature. Small deviations 10,20 30% will change answers at the margins. so lets say your estimate of TCR moves from 1.9 to 1.7.
Meh.. Now in this charged environment we have the opposite.
In this charged environment yearly temperature records become front page controversy. Meh. .01 or .02 become politically important.
So I see nonsense on both sides. I see lousy GCMs predicting rapid temperature rise.. and then what? Opps.
I see some skeptics predicting as it were that if you look at the data you will find fraud and hoax.. And when you look, what do you find? hmm a bunch of similar answers that differ by 5, 10, 20%. Not exactly what Goddard or Booker promised folks.
Are those differences important? depends on your perspective. If you want to salvage a skeptical talking point of course its interesting. If you are focused on improving the record.. well you have a tougher choice.
Is improving the record going to get you published? Now Cowtan and Way found an interesting avenue to hook into an interesting issue–the pause and GCMs.. I’m not sure that any more improvements will have similar scientific impact. If this were engineering people might say.. hey polish that bowling ball some more. Even there It depends. One of my clients just cares about getting stuff 80% right. the last 20% isnt worth the money to him. Not important.
Today for example I’m looking at 40 forecasts I did. 50% are dead on.
35% are off by 10%, and 15% are crap. One guy wants another pass at improving the forecast and other guys are good to go. I give the code to the dude who wants to take another shot at improving things and the rest of the team pushes the go button. These choices in business and science are far more practical ( what do you want to do ) than people want to admit.
All that said I am trying to put together a database so that people can find the really odd adjustments, but will take some time. Understand I’m building this database for people from data that is already public and its not rocket science to do it. Just takes time.
Mosh or Zeke
Two direct questions
At what stage do you think the US temperature record became reliable! as you do know the number of volunteers that recorded the temperature data plus all sorts of disparate organisations from river stations and railways don ‘t you? They were using all sorts of non standard instruments and where they used continuous data thermographs they were accurate to 2 degrees F
Second question. How close would your data match the real life printed temperatures for say 1880 to 1890 for a specific US location by each month. This is thE actual physical data I observed in the US weather review year books I looked at this afternoon in the Met office library.
You are trying to spin scientific gold from the most unlikely material
Tonyb
Tony
Why is nobody addressing your concerns about the accuracy of original temperature readings? Could it be that they agree but there is reluctance to say so? Plus the idea of a global temperature index appears to be scientifically meaningless; derived in the beginning only to push the global warming agenda.
Richard
Steven Mosher:
I don’t know what is involved in being part of “the author list,” but I find it difficult to believe your offer is serious given you mock me in the same comment you made it. If it is serious, I would be happy to work with BEST. I probably wouldn’t have much to contribute on that particular paper, but there are plenty of things I could do to improve your guy’s product.
Heck, I’ve previously offered to fix issues with your website because you guys failed to update it to account for changes in your methodology. I could have had it done in a couple days. Instead, it took months, and you guys didn’t make any note of the changes. Not only is that bad practice, it means people reading your guy’s original paper will have nothing which directly informs them of what has changed.
I’d wager 90% of criticisms of BEST stem, at least in part, from BEST not even attempting to make things clear. If you want people to trust your results, you shouldn’t just hand them code and data and say, “Here, spend a couple months examining it.” You should do simple things like:
1) Explain what decisions go into your methodology.
2) Explain what effect those decisions have.
3) Explain why those decisions were made.
BEST’s papers don’t do that. Neither do the appendices or methodological descriptions you’ve posted. The only way a person can figure out 1) is to examine the code. The only way a person can figure out 2) is to rerun the code for every issue. The only way a person can figure out 3) is to… well, they can’t. You guys haven’t explained the reasons for most of your decisions, and people can’t read your minds.
If you guys have truly done the work to examine the issues like you say you have, all of those should be simple to do. It would take time, but anyone could do the writeups. I would be happy to. Heck, I’d have done it already if I had any way to.
Instead, I’m stuck with questions like, “What is the impact of BEST’s homogenization on its results over its entire record” because you guys just don’t publish basic results of tests you’ve performed. You don’t even discuss them unless you get too much media pressure to ignore.
Tonyb: You are trying to spin scientific gold from the most unlikely material
More like, they are trying to make the highest quality brass possible with the ingredients available.
tonyb, regarding your questions to Mosher, are you familiar with this site? It is a way for you to answer your questions for yourself.
http://berkeleyearth.lbl.gov/station-list/
Matthew
You cant turn lead into gold no matter how many algorithms you use. Very many of the pieces of data in the US came from voluntary observers with jobs and who had other things to do, a good percentage of who used ‘non standard instruments’. Much of the data is as anecdotal as my material is supposed to be.
I would like to know how closely the data now being produced by Mosh relates to the printed temperatures I saw in the US weather Review Month books from that period.
tonyb
Steve Mosher: Small deviations 10,20 30% will change answers at the margins. so lets say your estimate of TCR moves from 1.9 to 1.7.
That’s about right.
The other problem that people mention is the “sampling bias” in the placement of the thermometers, which is even worse for ocean data than for most land data. Even if there were no error whatever in the thermometer readings themselves, you would have a biased estimate of what is wanted (the true mean global temperature at each time); there is nothing I have read of so far that you can do to reduce that bias. Even if you do the extra jackknifing that Brandon Shollenberger requested (and I supported the request, for what amount to PR purposes), you can’t estimate the bias. If, unknown to us, the bias changed over time (because of changes in the regional distribution of temperatures), then the change in bias is incorporated into the estimate of the “trend”.
Compared to those problems (bias and random variation), here is a large unknown: a 2% increase in cloud cover would prevent the warming effect of increased CO2; will a 7% increase in water vapor pressure, or 12% increase in lightning ground strike rate, or a 2% – 7% increase in rainfall rate be accompanied by a 2% increase in cloud cover? That is one of the big known unknowns that is more important than the last refinement in the standard errors of the temperature estimates.
Matthew R Marler
That’s a topic I wouldn’t know enough to comment on. I probably wouldn’t care about it if I did, either. I’m not worried about what issues are “important.” What I’m worried about is the ability to find answers to the questions I have.
If people want me to believe global warming is a serious problem I need to take meaningful action to address, they need to be able to answer the mundane questions I might have. Thus far, most of my questions remain unanswered. Or if I’ve gotten an answer, it’s only because I’ve put a non-trivial amount of effort into finding out what the answer is, usually involving doing some of my own analyses.
I participate in discussions of topics which interest me. The modern temperature record didn’t interest me until BEST came about. It was supposed to do a lot of things that would answer a number of questions I’ve long had. It didn’t, so I’ll keep discussing things in the hopes BEST will eventually live up to its promises.
That could well be true. Personally, I think a range that large for something as simple as the temperature record is troubling. Being expected to accept that large a difference in something so simple inspires no confidence in me results generated from more complicated things such as GCMs are accurate enough to warrant changing my views on global warming.
In case I haven’t been clear, my feelings about global warming are nothing more than, “Total apathy.” I follow the global warming debate because some technical topics in it interest me, and I think it’s a great demonstration of something I’ve long believed: the world is insane.
Beyond that, I don’t see why I should care. Nobody has given me any compelling reason to believe I should.
Fear Ice, Brandon; set about estimating the best manner and timing to release AnthroCO2 to ameliorate glaciation. I’ll eventually get around to helping Jim Cripwell measure it.
=============
Tonyb: You cant turn lead into gold no matter how many algorithms you use.
Is anybody claiming that they have gold? I called it brass. I could go with pewter, if you think one of the ingredients actually is metaphorical lead.
For the other common metaphor, they have made a leather purse, not silk, by stitching together a bunch of sows’ ears. Or maybe a football, considering how much it has been kicked around.
Brandon Shollenberger: Personally, I think a range that large for something as simple as the temperature record is troubling.
It isn’t “simple”. “Troubling”, I can agree with. The BEST team have neither created nor increased the troubles.
Tony
‘At what stage do you think the US temperature record became reliable! as you do know the number of volunteers that recorded the temperature data plus all sorts of disparate organisations from river stations and railways don ‘t you? They were using all sorts of non standard instruments and where they used continuous data thermographs they were accurate to 2 degrees F
sept 19th, 1942.
What one does is calculate a prediction about what a reliable station would have recorded had it been reliable . There is no magic date when this happens. There is the data. The data have known problems and unknown problems. You only have the data. You take the data, you make assumptions, you calculate a prediction. That prediction has an error.
Second question. How close would your data match the real life printed temperatures for say 1880 to 1890 for a specific US location by each month. This is thE actual physical data I observed in the US weather review year books I looked at this afternoon in the Met office library.
It would depend upon what records you were looking at and whether of not it actually corrsponded to a station we used. Any given station can be represented differently in all 14 sources. It would also depend on.. How they calculated that record. Whether there were other sources for that record. Whether the books you looked at were the same records as the US holds or whether they were corrected. Whether they were copies or originals ( the hand written forms ). And whether you transcribed what you claimed you saw properly. and whether you compare it to the correct record in our system. In short what you think is “real life” printed form is just another record. doing chain of custody is fun. try it.
That said
One of the goals of ITSI is to put all level 0 data ( written forms ) on the web so that multiple people can check them rather than just one guy. Until then we prefer to work with data that everyone can check.
Matthew R Marler:
Issues like this are why I haven’t spent much time looking at ocean data. I get people say land data isn’t that important since oceans cover so much of the planet, but if higher quality data has problems that change results, there’s little reason to assume lower quality data will not.
For what it’s worth, I’d accept it not redoing the homogenization steps during uncertainty calculations if BEST approached the situation appropriately. I get computational overhead can be an issue. In BEST’s shoes, I might just do a series of tests to estimate what effect not redoing the homogenization has on my results. I’d then publish the results along with details of the tests and estimate a “scaling factor” to apply to my uncertainty levels. I’d then add a note wherever necessary informing readers the listed uncertainty levels are believed to be understated by that amount (if multiple issues were approached this way, I’d list each one here).
Not only did BEST not attempt to inform people how much they are unederstimating their uncertainties, they didn’t even bother to make it clear they weren’t redoing their homogenization calculations. That’s not okay. Users need to be informed of things which negatively impact your results.
I think “simple” may be a matter of perspective. Creating a modern global temperature record is simple in comparison to many things, including many things related to the global warming debate. The methodologies aren’t particularly complicated. The calculations aren’t difficult. It’s mostly just a matter of time and effort.
I probably shouldn’t use words like “simple” to describe these sorts of things though. Trigonometry is complicated to some people :P
Brandon you’ll be glad to hear that the web site is being re done.
It all depends on funding.
I too would love to have that level of documentation for you.
but you’ll have to live with what had to live with when I joined.
It was better than what I got from hansen or anyone else, so I dont want to make perfection the enemy of the good.
again, whatever suggestions, improvements, etc you have, they only get “tickets” if I get a mail.
Steven Mosher:
I don’t get that. Many of the changes to the website I’ve called for would take only an hour or so to implement. It shouldn’t be an issue of funding to make the site more informative. You don’t need to redo the entire site to add information or clarifications to it.
See, I can’t accept that. You set standards for what should be done. BEST hasn’t lived up to those standards. That’s bad. That’s bad even if other groups also failed to live up to those standards.
And really, while other groups were initially far less up front with their methodology and data, nowadays it seems they’re better. Every time I’ve looked for an explanation of something GISS or HadCRUT does, I could find the answer. I could usually even find a clear description of what they did. I could usually even find at least some commentary on what effect it has, if not some results detailing it.
With BEST, that’s not the case. I’ve read every paper and post BEST has published. There are still tons of details I don’t understand the reasoning behind. There are some aspects to the methodology I would have never even realized existed if nor to examining the code. That’s bad. A person should be able to understand what was done and why by reading the documentation published along with the results.
Yeah, see, if anyone else were responsible for handling “tickets,” I would send some in. I can’t find the motivation to do it with you being responsible for handling them though. After BEST changed its approach/methodology, I pointed out a number of contradictions in what BEST said. It turns out BEST had failed to update a number of its descriptions. That should have been simple to resolve.
Instead, you repeatedly misrepresented what I said, as well as what BEST said, while insulting me. A couple months after you repeatedly smeared me in public over this, BEST changed its website without you or anyone else at BEST ever acknowledging I had been right.
I don’t care about credit, but it’s not acceptable for BEST to make changes to fix problems I say exist while BEST representatives publicly smear me for pointing them out. This is especially true if you make the changes secretly so nobody knows they were made, making it practically impossible for anyone to realize your comments smearing me were baseless.
Even if you do somehow think that’s acceptable, I’m sure you can understand why it makes me think pointing out more errors to you wouldn’t be worth the trouble.
Brandon Shollenberger: I follow the global warming debate because some technical topics in it interest me,
A worthy approach.
Thank you for your several responses to my comments here.
Steve,
Its just that every lukewarmer and skeptic is here because we have seen intentional deceptions. That is our alarm. Whenever anyone tells you on a highly spun political issue that “we are readjusting history for correctness,” eye open wide. The argument that it is an insignificant amount may be true but if it is worth doing it is worth documenting the change and uncertainty calculations with great detail and transparency.
Here is my perception.
You maybe got interested the topic because some alarmist shouted FRAUD and HOAX.
Upon review you find.. Opps, not fraud.. that theory is busted.
How do you save the hoax theory and save face?
You say.. its not fraud, but its not perfect, not best practices, not optimal, still uncertain, could be better, I want all your work in progress, what about this nit, blah blah
It’s familiar to me cause I kinda followed the same path. I know that game all too well. Look back in 2007. sounds reasonable until you look squarely at your motivations for getting involved. Folks dont follow the climate debate because they are interested in inconsequential stuff in the weeds.
And it doesnt even have to start that way. Consider climate audit.
Steve M is very careful. he never goes a bridge to far. Then watch what happens when others pick up his work.. he finds a problem.. others claim its fraud. Then he gets held responsible for their excesses. oh boy. Another example.
Most scientists make measured statements about arctic ice. one or two guys yell death spiral. Then there is hell to pay. for everyone else.
This aint normal science.
So you build a Tesla Coil; when all you really had to do was adjust the point gap and set the timing.
“This aint normal science.”
What is it now?
I never realized Steve M had suggested using CRN hourly to test TOBs. Nice catch Mosh.
man we spilled a lot of blood.
I used to be a TOBS denier.
Actually it was me a few days earlier too
and you will see that I raise Judiths issue,the hottest year issue, Roger’s issue ( I think) and propose a CRN test.
back when I was skeptical of this stuff
http://climateaudit.org/2007/09/17/hansen-says-no-thanks/#comment-106823
“Posted Sep 18, 2007 at 9:39 AM | Permalink
RE 111.
JerryB you are the TOBS god.
I’ve started reading Karl.
http://ams.allenpress.com/archive/1520-0450/25/2/pdf/i1520-0450-25-2-145.pdf
A couple of thoughts.
1. This would be very nice paper for SteveMc and/or yourself to hold court on, Especially now.
2. Time series are adjusted using this model in order to remove BIAS, The adjustments, the argument
would go, should recover the true mean. However, the adjustment is an estimate with an error.
This error does not make its way into the final error terms of the temperature series. Do you think
this is an issue when people want to make claims about “hottest year on record”
3. It might be a ripe time to revist Karls work, especially with some CRN sites producing continuous
data from 3 sensors. A TOBS validation of sorts.”
I haven’t seen much skeptic discussion of TOBS. The main concern i see is the very substantial adjustment at many stations relative to the raw data. Apart from the rationale for each of these adjustments, the concern that I have is their integral impact on uncertainty in the resulting temperature data set. The magnitude of the adjustments don’t seem consistent with with uncertainty estimates less than 0.1C.
The uncertainty is critical, since it relates to ‘warmest year’ claims, estimates of trends, and comparisons with climate model simulations/projections.
==> “The uncertainty is critical, since it relates to ‘warmest year’ claims, estimates of trends, and comparisons with climate model simulations/projections.”
Seems it might also relate to “pause” claims also. Funny you forgot to mention that.
Yes, could not agree more Judith. Especially after Gavin Schmidt’s big MSM splash about GISS 2014 warmest evah! (by 0.02C, with the little detail that there was only a 32% chance of that conclusion being correct since (misestimated) error is on order of 0.1C, omitted from the PR). BEST earned a lot of my respect on that one. More reasons not to trust government climatologists. More reason that the homogenization ‘tempest in a teapot’ is still important and interesting in the larger politicized context of CAGW pushed by the Obama administration.
Oddly enough, Josh is right. A greater uncertainty range would also affect the pause. I’m impressed, Josh! Good work.
we estimate the monthly uncertainity in temperature to be on the order of
.5C
That .5C includes everything
Judith,
“The magnitude of the adjustments don’t seem consistent with with uncertainty estimates less than 0.1C.”
Agreed.
No, actually Joshua, it may only allow the “pause” to be longer – if, you are talking about statistically significant warming. If the error bars are larger, then it would be more difficult to say that something was statistically significant and therefore that definition of “pause” would end up extending the length of the pause.
“The main concern i see is the very substantial adjustment at many stations relative to the raw data. Apart from the rationale for each of these adjustments, the concern that I have is their integral impact on uncertainty in the resulting temperature data set”.
Boom. That’s it right there. People like Mosher and Hausfather run around answering to questions and issues that were *not* raised.
Temperature agencies apply numerous clever techniques to increase temporal and spatial coverage. Applying the strict criteria, but for station exclusion, a host of stations would get knocked out of the reckoning and the confidence in detecting small trend changes would decrease. The agencies however include as many stations as possible – which no one forced them to – and reduce the spread of the confidence intervals for yearly anomaly values.
The land record is not as good as it is made out to be.
Our hostess says:
One thing which confuses me is BEST has acknowledged its uncertainty levels are both too small and somewhat biased on the temporal dimension, yet it still published a report discussing the “warmest year” claims based upon its uncertainty levels.
How can you acknowledge your uncertainty levels are too small yet turn around and claim we can make comparisons between years based upon those uncertainty levels?
Joshua
‘Joshua | February 22, 2015 at 6:38 pm |
==> “The uncertainty is critical, since it relates to ‘warmest year’ claims, estimates of trends, and comparisons with climate model simulations/projections.”
Seems it might also relate to “pause” claims also. Funny you forgot to mention that.”
Go look at my comment from 2007, were I raise the exact same concern as Judith.
My experience, having done what she is doing, went like this
1.. First you think they are cheating about TOBS
2. Then you see evidence that they are not. Opps
3. You shift to the uncertainty issue and try to show
this makes them wrong about something else.
Here is the point I would make, when you are going through this process no one can point it out to you. you just cant see it.
when it is all done.. you can look back.. thanks to internet.. and see it.
I was pretty shocked when I found the comment above made back in 2007,
Judith,
“The magnitude of the adjustments don’t seem consistent with with uncertainty estimates less than 0.1C.”
Agreed.
###################
I will repeat this again. the uncertainty level for monthly Temperature at a station is 0.5C . That’s what we published. Dunno why
people cant read.
uncertainty in ANOMALY is different.
Bill –
==> “No, actually Joshua, it may only allow the “pause” to be longer…”
Only longer?
Please explain further.
==> “then it would be more difficult to say that something was statistically significant and therefore that definition of “pause” would end up extending the length of the pause.”
hmmm.
Seems to me that uncertainty runs both ways.
The “pause” is covered by “estimates of trends”. Duh!
we estimate the monthly uncertainity in temperature to be on the order of
.5C
That .5C includes everything
Not according to this guy
http://meteo.lcd.lu/globalwarming/Frank/uncertainty_in%20global_average_temperature_2010.pdf
http://multi-science.metapress.com/content/t8x847248t411126/fulltext.pdf
According to his work it should be +/-0.98 C.
watch Shub the revisonist historian
“The agencies however include as many stations as possible – which no one forced them to – and reduce the spread of the confidence intervals for yearly anomaly values.”
Historically the complaint raised by prominent skeptics was the OPPOSITE. That the record was corrupted by agencies DROPPING STATIONS.
there are many threads on this and a SPPI “paper”
http://wattsupwiththat.com/2010/08/03/a-new-must-read-paper-mckitrick-on-ghcn-and-the-quality-of-climate-data/
“Revisionist”
Mosher, you think I owe allegiance to objections you imagine BEST addressed by their methodology even though they were not mine?
A methodology that incorporates all manner of junk data produces junk output. A method that drops data with no clear reasoning produces junk output.
The fact that BEST chose a method to not throw data away *does not imply the problems that arise with incorporation of bad data will go away*. There are trade-offs for every decision. If bad data is not dropped – as a selling point and a talking point to counter skeptic narratives – they need to be chopped by arbitrary, computationally-derived breakpoints and the relative positions of the broken-up temperature segments need to be satisfactorily determined. The station non-drop badness is methodologically diffused throughout the data.
Global climate change is a long-term question w.r.t to the temperature. It does not need incorporation of every thermometer on the surface of the earth to be calculated.
Revisionist or willfully ignorant.
A charge was made. NOAA is dropping data.
One approach to address that is to calculate the answer with ALL data.
Logic:
NOAA drop data ( Watts and D’aleo in SPPI); therefore answer skewed
and fraud.
The implication? if you DIDNT DROP DATA, then the answer would be different.
How to test?
Well a bunch of us tested it ONE WAY: we used the smaller set
Suppose there are 5 stations ABCDE
NOAA drop 2 ABC
Skeptic claim… You dropped DE fraud
So we tested it by looking at only ABC for all time
Answer: no difference.
But skeptics were not convinced so muller said.. test it the OTHER WAY
use all the data.
If you have a suggestion for how we can convince those of you who dont believe that we landed on the moon pass it along.
Captain Stormuller’s Visit to Climate Heaven.
===================================
Joshua, I said “MAY only make the pause longer”, not that it would definitely. Yes, if the error bars are smaller, it could work the other way and shorten the “not significant” trend. Perhaps, I should have said “may simply” instead of “may only” as that is closer to what I meant.
Mosher, I agree that some skeptics raised the dropping of stations as a red flag. I accept that BEST tried to not drop stations in its method. But NOAA *did not* increase the number of stations in response, did they?
I also find it interesting you are allowed to bait commenters with ‘moon landing’ remarks while their responses are deleted in deference to the guests (i.e., you).
The ideal is this: high-quality stations, at high-density over land masses.
If a small number of high-quality stations are selected to cover a large geographic region (say, SA), the confidence limits would be wide(r) owing to lower coverage
If a larger number of stations are chosen to provide spatial coverage, confidence limits would be wider owing to poor data quality.
The fact that there’s not way around is not skeptics’ fault. It is no one’s fault.
As with many things, I had taken the instrumental record on faith. I now have a better understanding of what data is actually available and its quality. It was GISS and NOAA who oversold their product and forced examination of the state of the records. BEST did not. But the underlying problems are common to all agencies.
The broad contours of the global instrumental temperature curve are likely the same regardless of the method of calculation. But the error bounds, associated caveats, clear statements of underlying assumptions, and the quality of the product will be vastly different, if a responsible organization calculates a global temperature.
Mosher,
I guess I was wrong about TOBS. And station moves, and changes to MMTS. And I have said this before.
When it came to looking at global surface temperatures, I started in the wrong place – Goddard’s blog. It took me at least a year of reading to realise he was wrong. You and Zeke have between you convinced me that the adjustments are necessary and pretty much as good as we can make them.
But given that you refuse to accept my story of how I became a scpetic in the first place, why would you believe me that you changed my mind about BEST?
I would not say they are as good as we can make them.
we didnt set out to a good homogenizer
say what????
I will repeat that we did NOT set our to make the best homogenizer
we could make.
We set out to make a homogenizer that would illustrate that other people were not cheating. fully automated. no human intervention.
So, you are gunna find all sort of problem cases with it. I have piles of them. The random stuff people have found is nothing compared to what you can find if you look in a systematic fashion. This is pretty normal for any statistical approach to data cleaning. Most people are used to thinking of cleaning, correcting as a hands on job. I will tell you that in my 9-5 job ( not berkeley) the last thing we want to do is a hands on data cleaning job. Data too huge. So you build a set of techniques for cleaning fixing changing stuff and then you start the process of improving that. So I am not happy with the adjustments the algorithm makes in many cases I do know that the algorithm illustrates that the charges of fraud being leveled were bogus. Overall the median adjustment was ZERO, the mean adjustment was negative. Over space and time they varied. but not systematically
Improving the adjustments isnt very high on our list of things to do unless we find something that is an easy improvement which effects thousands of cases. Put another way.. tinkering with the details isnt going to change fundamentals. This attitude drives certain people nuts. meh.
Mosher,
Thank you for clarifying what I meant by ‘pretty much’.
:)
It’s the machines wot dunnit.
=============
your welcome jonathan.
there is no end to fluff issues that folks will find.
dirty secret. my experience as a critic of GISS and CRU is that you start out hoping to crush them. You start out hoping to overturn everything they argued. total victory.. retract the papers.
then.. Opps
so you shift to minutia. ha, I even went to look for stations
that they had misplaced in the ocean. I looked at msiaplced stations.. all sorts of little things. You see the dream here is that a little mistake will cascade into a huge problem..
having made all these arguments before its fun to watch people make them again.
moshe, would you prefer ‘that other peoples’ errors were irrelevant’ to ‘that other people were not cheating’? Your phraseology suggests bias on your part, which I doubt was there in that form.
=================
Making a fully automated hands-off homogenizer only displaces the necessarily arbitrary choices that need to be made in a data-quality afflicted, data-sparse domain, to other parts of the chain of inference.
Good data is the *only* legitimate rescuer of poor data.
BEST deserve many congratulations – for their open data, and methods, and for attempting different methods, and additionally, for their affiliated team members appearing online to answer questions in person. That’s about it. On the other hand, BEST are deluding themselves if they believe their data product is qualitatively superior to other methods.
I. Zeke just demonstrated using CRN that IF you change the Time of Observation, you will introduce a BIAS.
Not true, he said it could introduce a warmer or colder bias. The graph CRN being sinusoidal has numerous values at 2 different times of the day for each of the max,min and mean temps where the readings are indentical ie change the time but no change in bias, Agreed?
Just draw a line across at any level apart from the max and min values,
Sheesh.
read the chart.
In the US we could have picked two times such that a change in TOBS had No efffect.
As a matter of history, we landed on the moon
As a matter of history the tobs changes happened at times that cooled the record.
we did land on the moon
Deliberately missing the point Steven.
Very few people here dispute the TOBS changes happened at two times that produced cooling changes.
What I pointed out was Crn chart has thousands of matching TOBS at different times, just draw a line across at nearly any level and you will find 2 x,y intersects per day giving two different times.
Hence you are wrong to state changing the TOB will introduce a bias.
It certainly can, it most probably will but it most definitely does not have to introduce a bias.
Science, mate.
“At first glance, it would seem that the time of observation wouldn’t matter at all. After all, the instrument is recording the minimum and maximum temperatures for a 24-hour period no matter what time of day you reset it. The reason that it matters, however, is that depending on the time of observation you will end up occasionally double counting either high or low days more than you should”
So what fraction of the data in the USA has consecutive identical readings of max or min?
“So what fraction of the data in the USA has consecutive identical readings of max or min?”
Double counting doesn’t mean entering the same reading twice. If Monday afternoon is very hot, and you read at 5pm, you’ll write down the Mon max at 3pm, then on Tuesday the Monday value at 5pm.
go get the unadjusted daily min max data and count.
do back to climate audit 2007 and get the station data that jerryB posted
do your homework
But here is what I can tell you.
TOBS is not a problem.
Move on to better problems. where you have a chance of winning.
JC SNIP I asked a simple question on a technical thread.
You, more than anyone, are the reason I have no faith in BEST or other temperature reconstructions. JC SNIP
Nick, in that case, what number of days per year does one of the hour reading stations record a maximum reading smaller than that of 5 O’Clock the previous day?
OK Judy I am out of here
I am trying to keep the dialogue productive.
vukcevic – On your question
http://judithcurry.com/2015/02/22/understanding-time-of-observation-bias/#comment-677118,
this is one the UAH and RSS groups need to answer.
Roger Sr.
Thank you.
Steven Mosher – You indicate that the quantitative uncertainty of the TOB has been calculated-
http://judithcurry.com/2015/02/22/understanding-time-of-observation-bias/#comment-677141
Please provide the values (the standard deviation) for the different regions of the USA, or the cite to the actual pages in the report where this is done.
Roger Sr.
Section 5 of Karl et al 1986 covers what Mosher was discussing: ftp://ftp.ncdc.noaa.gov/pub/data/ushcn/papers/karl-etal1986.pdf
in 2007 this is what Steve McIntyre wrote about the issue
“Posted Sep 23, 2007 at 10:13 PM | Permalink
I mentioned this once before, but the logical way to check TOBS is through a new analysis using CRN data which is hourly. Empirically calculate the effect of 5pm versus 12 am measurements for stations in the same area.”
1. Mcintyre proposes a test.
2. Zeke does the test.
3. Skeptics change the topic
why?
There was another CA post on UHI and found that hundreds of locations worldwide reported as heavily rural were really local airports at developing cities.
Yes.
Here is my suggestion.
1. There is no fraud.
2. Adjustments for TOBS, MMTS, Station moves are not a problem.
The BIG issue. the most important issue is
A) UHI
B) microsite.
In short I am telling you all that the best arguments are there.
In short I am telling you that ANTHONY’S work , real work,
is more important than Goddards. Period.
And further, that the sooner skeptics ( or whatever you want to be called)
ditch the BAD arguments and focus on the GOOD arguments, the sooner we can have a real debate
TOBS is not an issue
in 2005 the late great skeptic John Daly posted JerryB’s work
I thought TOBS was a crock. It made no sense. I went and got jerryB work. he was right. You need to correct for TOBS.
So I stopped arguing about TOBS cause the issue was and is dead.
“Mosher said: The BIG issue. the most important issue is
A) UHI
B) microsite.
In short I am telling you all that the best arguments are there.
In short I am telling you that ANTHONY’S work , real work,
is more important than Goddards. Period.”
Good summary. Good to know. Thanks to you and Zeke
for spelling it out. (again). But, it is important to see it more
than once and in different ways.
Thanks Bill.
I look at it like this. We all talk about falsification of AGW. And ever since I been looking at this stuff ( oh its fraud, oh 50% of the warming is adjustments ) the dream of folks has been to find something to be a final nail in the coffin. Find something to prove AGW wrong. Cause Popper said.
Well Opps you can hunt in temperature data all you like, willy wonka didnt hide the gold ticket there. he didnt hide it in TOBS, didnt hide it in adjustments.. The only two places that haven’t been beat to death as much as TOBS and Adjustments is UHI and Micro site.
ya wanna be productive? ya wanna make a difference?
ya wannabe a Mcintyre? Then dig in UHI and micro site.
I cant promise you a gold ticket.. maybe bronze. I will take one last look at it myself..
The monolithic “skeptics” beast raises its ugly head!
assuming what you say about skeptics changing topic as you describe is accurate, and at this point I do
we are talking about data that is less than 200 years old, out of which extraordinary claims are made as to how that data relates to distant past and future trends
tough sell
assuming that all adjustments to the data are scientifically sound, It is very difficult for me to believe that measurements that have gone through so many iterations can be trusted to .0 and .00
in most other sciences, I doubt they would
tough sell
(the photo of the thermometer is downright funny)
in terms of goal post moving
I observe predicted heat being re-branded as ‘missing’
a prediction of no snow re-branded as more snow
a warming world re-branded to a ‘warm, cold, we don’t know what to expect’ world
topped off with suggestions that one who thinks the above has some sort of psychological disorder
extraordinary claims demand extraordinary evidence
especially when you are teaching children that their world is endangered
+1
Zeke – You wrote
“This is one of the reasons why the analysis the Williams et al (2012) did was so important; they looked at the sensitivity of the homogenization results to all the different tweakable parameters (use of metadata, breakpoint size, number of neighbor stations used, etc.).”
This is not what we are asking. We want to know what is the standard deviation when a value (e.g. the TOB) is selected for use in the adjustment process.
Roger
Roger,
Karl et al found standard errors of 0.1 to 0.2 C associated with the adjustment at individual stations held out of sample for testing. They discuss details of geographical patterns of standard errors in their paper.
See their Figure 8, for example: http://i81.photobucket.com/albums/j237/hausfath/ScreenShot2015-02-22at31815PM_zps887ea0e3.png
Zeke, you truly have no idea if the readings on a particular day were taken at 3:30 or 7:30, rather than the suggested 5:00?
here
ftp://205.167.25.101/pub/data/ushcn/papers/karl-etal1986.pdf
orginal paper.
variances and standard error are there.
The only uncertainty question I could see looking at this back in 2007 and 2008 was how this uncertainty was carried into the FINAL analysis
That is, when you adjust there is an uncertainty that should be carried forward.
Steven Mosher – You wrote
“Some skeptical thought leaders concur; roger Sr”
Please refrain from the pejorative term “skeptic” to apply to me. It completely misrepresents my perspective. Its use is designed to marginalize.
Roger Sr.
is ” some thought leaders” better?
By the way, I’m not unconcerned about your issue
“JerryB..
The plots of the errors in the TOBS model look kinda substantial… Bigger than the
instrument errors.. am I reading that right.. If so, then you have a time series
with an instrument error of ‘e’ and then an adjustment made to that record using a model
that has a error of ‘2e’.. but when final calcs are done, somebody pretends that
the error in the adjustment model vanishes.. Maybe I’m misunderstanding..
Anyway. Other folks out there go ahead and read
http://ams.allenpress.com/archive/1520-0450/25/2/pdf/i1520-0450-25-2-145.pdf
if you want to see how USCHN does its TOBS adjustment to raw.
( opens can of worms)”
Roger Pielke:
Indeed it does. As does calling people trolls, “sea lions” (a new one for me introduced it appears by the kind people on Anders blog), asking them if they believe in moon landings etc. These are mostly behaviors and labels that come up when they don’t agree with Mosher on certain points.
Some of the commentary is intemperate. But it appears Mosher wants to keep it that way, which is unfortunate.
It appears he also intends to act like a verbal bully to limit comments from people he can’t easily respond to. People who say dumb things are easy to dismiss. People who aren’t sold the bill of goods on technical grounds are harder to wave away, so you get the bullying.
C Line Man.
Yeah – if only those “warmunists” would stop calling us “skeptics,” we’d put an end to this squabbling and agree that the temp records have been tampered with by frauds to scare the public.
Are you suggesting that either Roger Pielke or I think the temperature record was tampered with? What a stupid comment.
I think that hand-wringing about name-calling is a smokescreen, a “bill of goods,” if you will.
Compare and contrast:
==> “People who aren’t sold the bill of goods on technical grounds are harder to wave away, you get the bullying.”
and
==> “Are you suggesting that either Roger Pielke or I think the temperature record was tampered with?”
So let me make sure I get this: Someone analyzing temp records is trying to deceive, to get others to believe things that aren’t true (i.e., sell a bill of goods), and “bullying” those who aren’t deceived… but isn’t tampering.
I apologize for my stupidity.
Joshua, if you want to know what I actually think, the best way to do this is to phrase your comments in the form of a question, and not to resort to your usual tactics of overanalyzing what I and other people wrote.
I in no way am claiming BEST is engaged in deceitful behavior, the bill of goods translating here roughly into “being sold the whole package without regards to the variable quality of the contents”.
I am totally going to quibble about the parts of their product that I think are weak, because I think the product can be improved. My criticisms limited to their empirical homogenization algorithm and to the particular choice of kriging function they use (azimuthally symmetric, spatially invariant).
With the empirical homogenization algorithm in particular, there seems to be substantial spatial smearing:
https://dl.dropboxusercontent.com/u/4520911/Climate/Trends/Nick-Best-GISS-1924-2008.jpg
Roughly, their homogenization algorithm uses a 2500-km radius to search for the 25 best correlated pairs out of a maximum of 300 stations searched. You can see these parameters in their code (which I’ve downloaded and studied):
options.ScalpelEmpiricalMaxDistance = 2500; %km
options.ScalpelEmpiricalMaxPairs = 300;
options.ScalpelEmpiricalBestPairs = 25;
To what this radius means, here it is superimposed on South America:
https://dl.dropboxusercontent.com/u/4520911/Climate/Temperature/BerkeleyEarth-Homogenization-Radius.png
Now the problem with the 2500-km number, is when you have limited stations, and you are exceeding the bounds where statistically you’d expect good correlation:
https://dl.dropboxusercontent.com/u/4520911/Climate/Best-correlation-length.png
then what you are in danger of doing (and probably are doing) is correlating against noise. When you do this, one inevitable result is going to be over smoothing. Notice that nowhere is the correlation above 0.5 at 2500-km. In many places (the tropics) it is much less than 1000-km in fact.
Now apparently I’m a troll, a sea lion (branded so by the good, kind people of Anders blog) and worse for making these observations and not willing to be silent about what I think are issues that aren’t getting addressed.
To be clear, I don’t demand that Mosher or anybody address my issues. I’m perfectly capable of doing addressing these issues on my own, and given time (and a lack of response from them) will probably do so and if I find something interesting, I will publish the results.
But if they don’t have the time to respond, they can at least try to keep it civil. And I don’t have to accept everything they’ve done in order to endorse the parts I like and be critical of the parts I think need work.
If you have technical questions or comments, I will respond to them. I find this constant tribalistic behavior that you engage in to be unproductive and typically will ignore it when I encounter it.
Ciao.
C Line Man.
The third link was mangled apparently. here it is again:
https://dl.dropboxusercontent.com/u/4520911/Climate/Best-correlation-length.png
This is taken from a BEST write-up.
Carrick
‘Notice that nowhere is the correlation above 0.5 at 2500-km. ”
take a station.
Now I want to find the best 25 correlators.
I can search all stations, but that will be a stupid waste of time.
I want to search fast. at 2500km the correlations are all low
So I want to search closer than that.
Give me a bucket of stations no further than 2500.
Also check the min requirements as they are important as well.
Now, one simple thing to do with monthly data is the following.
With a station matrix at every month calculate the ACTUAL range to the top 25.
Simple .
Joshua.. We Agree with carrick on the Longitude Issue. Infact, we wrote about it
he shows our charts. below, but not the text.
“In Figure 2 we show similar fits to Figure 1 using station pairs restricted by either latitude or longitude. In
the case of longitude, we divide the Earth into 8 longitude bands and find that the correlation structure is very
similar across each. The largest deviation occurs in the band centered at 23 W, which had reduced correlation at
short distances. This band is one of several that included relatively few temperature stations as it spans much of the
Atlantic Ocean, and so this deviation might be primarily a statistical fluctuation. However, the deviations observed
in Figure 2 for latitude bands are more meaningful. The latitude bands show decreasing short-range correlation as
one approaches the equator and a corresponding increase in long-range correlation. Both of these effects are
consistent with decreased weather variability in most tropical areas.
Though not shown, we also find that the East-West correlation length is about 18% greater than the NorthSouth
correlation length. This is consistent with the fact that weather patterns primarily propagate along East-West
bands.
The variations discussed above, though non-trivial, are relatively modest for most regions (except perhaps
at the equator). As previously noted, when considering large-scale averages the Kriging process described here is
largely insensitive to the details of the correlation function, so it is expected that small changes in the correlation
structure with location or orientation can be safely ignored. Hence, the current construction applies only the simple
correlation function given by equation (14). However, developing an improved correlation model that incorporates
additional spatial variations is a likely topic for future research.”
The discussion of this problem GOES WAY BACK, it goes back to the days of the Air vent and JeffId and some stuff I found in a CRU paper on GHCN-D
Mosh
I am getting it in the neck from people like Eliza and bad Andrew for defending you and the met office so please reply to my reasonable questions
http://judithcurry.com/2015/02/22/understanding-time-of-observation-bias/#comment-677491
Tonyb
Carrick –
==> “I in no way am claiming BEST is engaged in deceitful behavior, the bill of goods translating here roughly into “being sold the whole package without regards to the variable quality of the contents”.”
Lol! Pardon my stupidity in making an assumption that when you said someone one was selling a “bill of goods,” you were saying that they were being deceptive and trying to pull the wool over someone’s eyes.
==> “To be clear, I don’t demand that Mosher or anybody address my issues”
How generous you are for not demanding that they do something that you have no say in whether or not they do.
==> “But if they don’t have the time to respond, they can at least try to keep it civil. ”
Do you mean like not accusing people of selling a bill of goods?
Steven Mosher:
My worry is that, once you go out far enough, you start getting correlations by chance. We can see this happens well beyond 1000-km from Robert’s analysis:
https://dl.dropboxusercontent.com/u/4520911/Climate/Best-correlation-Figure2.png
Probably if you did something besides ordering the top 30 by correlation (remember there is measurement error so the ordering is not accurate), you could get rid of bias, and end up with a measure that provides uncertainty bounds with it.
It’s the thing a good statistician could help you with in terms of devising improved testing (ideally unbiased central value plus uncertainty range associated with the empirical breakpoints).
Carrick.
look at the yellow line. why is 2500 selected?
you have a concern that some of the 25 will be far away.
take one station that started this.
http://berkeleyearth.lbl.gov/station-list/station/157455
or you can just run a huge job on the whole dataset
Steven Mosher:
I guess I need to go through your literature again. Maybe there’s a snippet that justifies the cut-off range.
The yellow lines aren’t speaking to me.
I’d still pick something around 1000-km, and given the amount of noise (vertical scatter) I’d look at multiple combinations.
Again, I wouldn’t sweat this if you were getting answers consistent with other methods.
But the problem here is your result with the empirical homogenization is novel. And novel results always require further work to justify, it’s just the nature of research.
Yeah I know… combinatorics with that many stations can be a hassle. More than anything else, a serious effort at speeding up the code is needed (not simply just running it on faster computers).
> Its use [the S word] is designed to marginalize.
A blast from the past:
http://thebreakthrough.org/index.php/voices/roger-pielke-jr/the-irrelevance-of-climate-skeptics
Does it mean honest brokers marginalize skeptics?
Thanks for that clear explanation, Zeke.
@Zeke: itt would be nice if you explained how from Tmin Tmax you compute the Tavg as that appears to the calculation showing the most bias. It would be hard to comment on your explanation if one does not know the method used to draw out the Tavg.
@Mosher, since you are on a skeptic site and we are talking about it perhaps you should remove point 3.) It is just a taunt.
Timothy,
Because traditional min-max thermometers only give you a single minimum and maximum value for each day, tavg is traditionally defined as (tmax + tmin) / 2. While an average of hourly readings is strictly speaking more accurate, it would introduce problems when trying to compare time series of min/max data with hourly data.
Since the amount of heat going out increases by the 4th power with temperature increasing should not the true average temperature of the earth, reflecting the average amount of energy received and emitted that day be higher than a half of the max and min temperatures? Probably a silly question.
The lapse rate, pick one, is supposed to be linear, right? If the lapse rate were linear, we wouldn’t see a difference in min/max of the annual temperature variation. But if you go to the link below, select channel 5, 2012 as an example, and examine 14, 25, and 26 Kft traces; you will see a marked reduction in the range of max minux min.
Does anyone know what this does not comport with a linear lapse rate? (I bet Dr. Curry does. :) )
http://ghrc.nsstc.nasa.gov/amsutemps/amsutemps.pl
That should have been “max minus min,” not “max minux min.”
There are two problems at least.
1. TOBS was changed, starting around 1960. The change is necessarily a step change at each station, although it doesn’t show up on day one it would typically show up within a year (“there is a strong seasonal cycle in the TOBs bias, with the largest differences seen in February, March, and April“). The TOBS change would surely have been made primarily in the 1960s, with nearly all stations having changed by ?1980?. Yet the TOBS adjustment graph shows an accelerating adjustment all the way from 1960 to ~2000. Were there really less stations changing back then, and more 30+ years later?
2. The article states “While some commenters have hyperbolically referred to temperature adjustments as “the biggest science scandal ever”, the reality is far more mundane. “. The article addresses only TOBS. The next article we’re told will address liquid to glass changes. But the change which is the main cause of the scandal is neither of these. It is adjustments for UHI. So there is no justification in this article for dismissing the concerns.
NOAA make no adjustments for UHI
GISS do
Mike Jonas,
Look at Figure 1. TOBs changes didn’t end in the 1980s; some stations are still changing today. Part of it is that volunteer observers often stick with the time they have always done observations, and changes occur when the observer retires and someone else takes over.
The next article will cover pairwise homogenization, which covers both MMTS transitions and UHI. The former is the larger of the two biases, interestingly enough, at least since 1960 or so.
Mosh,
NOAA makes no explicit adjustment for UHI. The PHA does end up effectively removing most of the UHI signal, however, as discussed in our paper.
ya, i think its important to clarify the explicit adjustments from those adjustments that happen as a consequence of the adjustment approach.
Somebody else makes the adjustments. We do not make adjustments . We just use them in our data.
Why do people keep saying we adjust the data and fiddle with the records?
Duh.
“Rather than correcting data, we rely on a philosophically different
approach. Our method has two components:
1) Break time series into independent fragments at times when
there is evidence of abrupt discontinuities, and
2) Adjust the weights within the fitting equations to account for
differences in reliability.
The first step, cutting records at times of apparent discontinuities,
is a natural extension of our fitting procedure that determines the
relative offsets between stations, expressed via bi
, as an intrinsic
part of our analysis. We call this cutting procedure the scalpel.
Provided that we can identify appropriate breakpoints, the necessary
adjustment will be made automatically as part of the fitting process.
We are able to use the scalpel approach because our analysis method
can use very short records, whereas the methods employed by other
groups generally require their time series be long enough to contain a
significant reference or overlap interval.
The addition of breakpoints will generally improve the quality
of fit provided they occur at times of actual discontinuities in the
record. The addition of unnecessary breakpoints (i.e. adding breaks
at time points which lack any real discontinuity), should be trend
neutral in the fit as both halves of the record would then be expected
to tend towards the same bi
value; however, unnecessary breakpoints
introduce unnecessary parameters, and that necessarily increases the
overall uncertainty. ”
Reading the papers is fundamental
TOBS changes happened.
we landed on the moon
Figure 1 shows how they changed over time given the records we have.
One has to fiddle with a great many sow’s ears to make that huge silk purse called a global temp.
Seems the temp trend could be up or pausing right now. Good to know it’s doing what it’s always done – when it wasn’t going down, of course. But now we can observe with mock precision.
Meanwhile, the greater part of the earth and the deep hydrosphere await understanding and investigation. Oh well, can’t get around to everything when one has climate theories to promote.
Zeke, thank you. Do you have any direct data on TOBS bias? I see models and a numerical experiment with recorded data, but no direct long-term comparison of a 7 am readout vs 2 pm readout by 2 thermometers side by side. Could you kindly point me to such a study? Karl’s study used a model, not a real thing.
Does the CRN hourly data in the post not count as direct data? Puzzling question.
Wrong
.
ftp://205.167.25.101/pub/data/ushcn/papers/karl-etal1986.pdf
Steven – I only speed-red your reference, could not find a side-by-side comparison. All I find is a lot of reasonable assumptions, but no hard data.
Karl didnt use a model.
A side by side comparison is INFERIOR to what zeke did.
You take the hourly series itself.
A) calculate min/max at time X for 10 years
B) calculate min max at time Y for 10 years.
If you did side by side you’d have to worry about shifting calibration
in one of the sensors. So, use the same sensor and collect the data for 10 years.
Same sensor.
Now test: Does changing the TOB change the final answer WITH THE SAME SENSOR
Much better test design than side by side as there is no sensor to sensor bias to control for
Steven, Karl calls it a model. If you disagree with him, fight with him. I am only a bystander.
Steven – of course with a TOBS test you would read thermometer A at 7 am and thermometer B at 2 pm for a year, then switch them for a year. You don’t sound skilled in controlled experiments.
George you dont need two thermometers and you dont WANT two thermometers.
You have 100’s of thermomters.
They record hourly for YEARS.
you have the hourly record.
Now
A) calculate the min/max at 7AM
B) calculate the min max at Noon.
Curious George,
That is rather the point of the analysis I perform using CRN data. Having hourly data lets you set any time of observation you want for the same station, effectively making any station “side-by-side” itself for the purposes of the analysis.
Zeke, thank you for a reply. There is a study of a German transition from traditional glass mercury thermometer measurement stations to the new electronic measurement system, http://notrickszone.com/2015/01/14/germanys-warming-happens-to-coincide-with-late-20th-century-implementation-of-digital-measurement/, where a side-by-side run of the old and new equipment for 8.5 years found that the new equipment yielded a temperature reading 0.93 C higher on average.
While this is not exactly a TOBS adjustment, I wonder if the BEST algorithm found this instrumentation-induced trend and corrected for it. I don’t believe that Germans wanted to introduce a temperature shift, and the discrepancy is too large to explain by just a better accuracy of the new equipment.
I may not understand “hourly data”. Is it simply a temperature reading once every hour, or is it a minimum temperature and a maximum temperature for every hour? I hope that we can agree that the first method does not yield correct daily min/max values if they happen to occur at 6:30 and 15:15.
Curious George,
I second your request for a statement on that issue.
Hi Curious,
I’m less familiar with the German case, but there is an analogue in the MMTS example in the U.S. where side-by-side tests were used extensively. The challenge there is that MMTS instruments required an electric current (unlike old LiG thermometers), and in many cases stations were moved as well as instruments changed at the same time, making a simple correction easy. I discussed this in more detail back in 2010: http://rankexploits.com/musings/2010/a-cooling-bias-due-to-mmts/
In both cases the result on the temperature series should be characterized by separate step changes in minimum and maximum temperatures; as long as all the stations in the network weren’t all transitioned at the same time, these step changes should be relatively easy to identify in the difference series via pairwise homogenization approaches. I’d expect that both Berkeley and NCDC would do a good job at removing this bias, as its the type they were designed to deal with, though I haven’t looked at the German example in detail. In the U.S. they seem to do a good job of removing most of the bias related to MMTS transitions.
I’ll cover automated homogenization and sensor changes in more detail at some point in a future post.
Zeke – On http://boris.unibe.ch/59043/1/gi-3-187-2014.pdf
this is what is needed.
This is the uncertainty with step 1 in the adjustment. However, this information needs to be included when this adjustment is reported (i.e. +/- degrees C).
We need the same type of uncertainty assessment with respect to the other steps.
Roger Sr.
P.S. The excellent hourly CRN analysis you did should hopefully put to rest any question on the need for the TOB adjustment.
Roger,
Thanks. As I mention in the post, I suspect that the explicit TOBs adjustment will be eliminated at some point in the future, and pairwise homogenization will be used to remove TOBs bias. In that case the tests that we discuss in the paper could effectively capture both in the standard error estimates.
Zeke- P.S. On Tom Karl’s analysis on the TOB uncertainty, I had seen that before. Why is it not included when trend data is presented?
Roger Sr.
While the error in aggregate would not be as large as the error for any given individual station, I do not know why uncertainties in TOBs adjustments are not rolled into overall series uncertainties (though, being independent from other sources of uncertainty, they would be added in quadrature).
So you have this time series going back to eras when people would think you and me walking down their street were aliens, and likely devils. They had hand blown thermometers. Maybe church trumped science on Sunday and they took the measurements as they could. Maybe they had a hangover and didn’t even get to the thermometer until Tuesday and just cobbed in the data.
Statistical uncertainty does not even approximate true uncertainty. The BE brute force approach handles astatistical uncertainty as well as it can be handled, but even brute force cannot capture systematic time and culture dependent biases we can barely imagine.
More circling the wagons around an instrument record that will never be able to provide a global average temperature accurate to tenths of a degree.
Give it up boys. You’re in denial. Prior to satellite era the spatial coverage was woefully inadequate. Prior to electronic instruments the precision of mercury in glass min-max thermometers was not enough. It’s not adequate. Deal.
M) but spatial coverage. we estimate you need between 185 and 235 stations
I would love to see a link to the study that temporal/spatial coverage over the global ocean was adequate for global average temperature. Not your misspelled uncapitalized quote taken directly out of your ass “M) but spatial coverage. we estimate you need between 185 and 235 stations” but an actual peer reviewed study.
Good luck.
Phil Jones had a paper many years ago on the topic – i’ll try to find it
david
The 185 -235 figure comes from our paper.
next, the lowest figure I have seen comes from Shen. put down your video game and read climate audit, its discussed there.
As Robert notes Jones also has a paper.
you can also just use one station, but your error gets big.
So you will gave a “station” versus accuracy plot.
Its easy. you have our code. run it. make the plot.
Mosh
Third try to get an answer;
—— —–
Mosh
I am getting it in the neck from people like Eliza and bad Andrew for defending you and the met office so please reply to my reasonable questions
http://judithcurry.com/2015/02/22/understanding-time-of-observation-bias/#comment-677491
Tonyb
David,
I think you’re right that the intention is to be able to ratchet down certainty claims about warming. But that could work both ways if the pause continues, or worse.
“The pause” is contained entirely within the 35 year-long satellite record.
Mosher is in denial. Temperature series for mid and high latitude southern oceans is essentially non-existent before the satellite era. Moreover, while satellite and ground instrument record agree very well over Europe and United States where the best instruments are deployed there is not satisfactory agreement across most of the rest of the planet with satellite showing very little warming trend and instrument showing significant warming trend. The few odd temperature series in South America, Africa, and Asia are unreliable in other words. But here you have people like Mosher trying to tell you the record from 1880 to 1980 is usable for Global Average comparisons with the truly global data beginning in 1980 from MSU instruments aboard satellites.
Incredible the depth of dishonesty these people will go to trying to convince others the record is adequate.
The instrument record prior to 1980 is grossly insufficient for global average temperature to tenths of a degree.
David
Like my extended CET, BEST is good for showing the direction of travel of temperatures.
Accuracy to fractions of a degree? I think not. The difference is that I admit historic records cant show that degree of accuracy. Hubert Lamb recognised that 50 years earlier
tonyb
Direction of travel? About right. I could live with that.
I still don’t know for sure if the people of Marble Bar, having been overlooked for everything else, would not have been willing to extend the world’s longest heatwave back in the 1920s. I mean, nobody was going to build an Opera House there.
But allowing for pranks, defects, drunken postmasters, UHI, and people just filling in numbers which seem right (I’ve done that!), a direction of travel, if kept deservedly vague and expressed in common language, might be an acceptable “finding”.
But whence all this precision? A couple of months back we had a rainy day which the BoM didn’t record for some reason. So it’s a completely dry day as far as the yearly totals are concerned, and as far as posterity will be concerned. Except that it rained.
Direction of travel? Yeah, fair enough. Enough readings over enough time and area could give you that much.
Not global troposphere trend, Tony.
David
I wouldn’t bet the house on a global average being scientifically accurate prior to 1980 when we have access to data from Automatic weather stations which, if properly sited, should give us a reasonable estimate of the trends.
Coincidentally that coincides with satellite data, although that measures a slightly different matrix of course. It would be interesting to see a comparison of the two, always accepting that even after 1980 our land temperature coverage is by no means comprehensive and has that awkward habit of stations changing position.
tonyb
mosomoso
I have come to realise over the last few years that Mosh’s historic temperatrure data expressed as numbers is every bit as anecdotal as my historic weather data expressed in words.
As George Orwell might have said;
Written numbers good
written words bad
tonyb
‘What matters it how far we go?’ his scaly friend replied.
‘There is another shore, you know, upon the other side.
The further off from England, the nearer is to France,
Then turn not pale, beloved snail, but come and join the dance.
Will you, won’t you, will you, won’t you. will you join the dance?
Will you, won’t you, will you, won’t you, won’t you join the dance?’
H/t The Mock Turtle.
“You know a trillion times more about art than me. But I’ve learned that it isn’t necessary to know all that much. You just make what you wanna see, right? It’s a game, right? It’s like being paid for dreaming.”
― Tom Robbins, Skinny Legs and All
‘Sweet dreams are made of this,
Who am I to disagree.’
– Annie Lennox.
For those of us who record an observation at 7 AM on an NWS B-91, it is totally obvious that the minimum temperature is repeated from the previous day. One can use hourly data to synthesize any climate they wish by selecting an artificial start and end of day.
We are really in the weeds now. Reminds me of the Star Trek episode “Wolf in the Fold,” when Spock told the computer to calculate the last digit of Pi. How many CPU and human hours will be wasted on arguing about the obvious?
I think that I understand that making the TOB adjustment is worthwhile for the weathermen who are concerned about the change in weather from yesterday until today. It would seem to me that the TOB adjustment should NOT be used by anyone concerned with climate over decades to centuries. Just use the max/min data. The rare pair of identical adjacent data points may well be an accurate representation of reality in a century of data.
See figure 6.
Zeke. Interesting, but…
You cannot read the MMTS thermometer shown in Figure 3 to any accuracy that you can make meaningful estimates of differences of 0.15° or 0.45°. Your measurement error just isn’t that good, no matter how many million data points you have.
For all the comparisons, I never saw any statistics on standard deviations, means and statistical tests for differences of means. Surely, you aren’t suggesting that SD=0. Are you saying that in your examinations of data
Why doesn’t today’s missed high or overestimated high, or low, average out over a period of several days? If you are saying it doesn’t, then you should have some statistics that show it doesn’t.
TOB adjustments may be a very valid data treatment. However, it would never fly in the manner presented in anything I’ve been involved with for since about 1975. As I mentioned in a comment to Mosher, would you be willing to sign off on this and accept legal liability? Remember, these “adjustments” and data treatments are the basis for controlling the global economy.
N) but uncertainty.
Let me understand your argument. unless Mosher signs a document,
NOAA tampered with data?
Unless Mosher signs a document, TOBS isnt needed?
sure I’ll sign.
Steven, no. Are you willing to take personal, legal liability for the correctness of the data treatment, integrity of data? Are you willing to withstand an audit? In my world, if you are found to have tampered with data you stand a chance of the EPA showing up with badges, Glocks and no sense of humor. In my world every “adjustment” of data, every time, must have a documented reason for the adjustment or you get to pay a fine. So, if an audit of climate data adjustments are conducted you are willing to be the designated felon? I think I’d be a bit more circumspect about data quality and adjustments.
Ah, yes. I, too, have dealt with the environmental rigors imposed by the government on chemical plants. Not saying it isn’t necessary, but the Fed does enforce laws at the point of and gun and prison time is a real possibility.
Hi Steven, I’m Ron. I know you’ve been busy here tonight and I think you have many valid points on the good work by many on TOBS. I would like to switch topics to one I am engrossed in for one moment and ask you: Do you believe that skeptics are wrong to suspect that CMIP5 is systematically over projecting forcing/sensitivity? If one or the other is the cause of the pause does it matter? And, if not why didn’t M&F simply do a study on climate variability compared to model variability to see if there was intersection considering the current forcing/sensitivity rate? I believe they refer to it as adjusted forcing.
I value your opinion and by the way I trust you that you don’t need to sign.
“Do you believe that skeptics are wrong to suspect that CMIP5 is systematically over projecting forcing/sensitivity? If one or the other is the cause of the pause does it matter?”
The models over predict the warming.
That can be due to several things as I’ve explained before.
1. bad observations during the period of comparison
2. bad inputs( forcing) for the period of comparison
3. bad model.
4. some combination
Under bad model I would say that the models may be over sensitive.
In our work we started down this path of investigation but kinda got side tracked.
1. I think if you use Cowtan and Way or Berkeley its less of an issue.
2. I’d like to see actual forcing versus the projected forcing and I’d like
to seee models re run with accurate forcing.
3. LOTS of ppossibilities here . missing physics, wrong physics.
4. Most likely
The thing is that without rigorous re testing its hard to pin it down
to one thing. Models take a lot of time to run.
I dont really see models saying anythin conclusive so their flaws really arent that critical. They are a good guess at the future. meh
Thanks Steven. So from your thoughtful answer I extract that you are not a fan of models. But if you had your career invested in them and you needed to show that they were still in the error bars, would you devise a study of the adjusted forces versus variability and see if the 15-year cycle is too short not to be masked by variability? Or, would you do a perilous and difficult diagnosis to break down adjusted forcings to tease out radiative forcings from climate sensitivity and ocean uptake and calculate variability by difference of all those factors in a much more complicated equation?
“Thanks Steven. So from your thoughtful answer I extract that you are not a fan of models. ”
My past life involved helping to build, operate and test the most sophisticated models we had for predicting the performance of imaginary aircraft fighting against imaginary threats in an imaginary world. None of this could ever be tested or calibrated. yet it was used to make Billion dollar decisions vital to our countries defense. Models were all we had.
So you love to hate them and hate to love them. They are a tool. period.
“But if you had your career invested in them and you needed to show that they were still in the error bars, would you devise a study of the adjusted forces versus variability and see if the 15-year cycle is too short not to be masked by variability? Or, would you do a perilous and difficult diagnosis to break down adjusted forcings to tease out radiative forcings from climate sensitivity and ocean uptake and calculate variability by difference of all those factors in a much more complicated equation?”
endless budget? I’d do both. For the simulations I worked on were were given 6 months to prepare for a test. 3 months to run it and get too few data points and 3 months to write it up and then rinse repeat.
Every proposal for changing the design of experiments was rejected as being too expensive. go figure. it is what it is
Thanks! Another study just published by Nature using models to establish likelihood of hiatus continuing. They don’t mention if the models could be wrong but they give a 25% change of hiatus continuing for another 5 years. A twenty-one-year hiatus has less than 1% likelihood using the models starting in 1999. One would think it would call for reconsideration if models remain outside 95% bars for 5 more years.
Here’s the abstract: http://www.nature.com/nclimate/journal/vaop/ncurrent/full/nclimate2531.html
I’m just curious. If the hiatus has lasted for 16 years, why is the 15-year trend through 2005 stronger than the 15-year trend through 1998?
Doesn’t that sort of indicate the hiatus, if there actually is such a thing, was caused by something after 2005?
Bob,
I will (and have in my papers) “sign off” on current adjustments as the best attempt to assess global temperatures. Are they perfect? Probably not. Will they improve with time and more researchers working in the area (e.g. as is happening with the ISTI process)? Yes. Thats how science works.
This is intended to be a simple example, hence the lack of discussion of various of effects across the U.S. and the focus on the mean bias; papers discussing adjustments in the academic literature (Karl et al 1986, Williams et al 2012, etc.) focus a lot on uncertainties.
“That’s how science works” Zeke that simple demonstration wouldn’t have gotten you past the second undergraduate analytical chemistry lab. It’s simple statistics. Are the means from each of your treatments statistically different? I believe I’ve read your references, but I’ll go back and reread them. However, you were comparing temperature means without any statistical test to show significant differences. Did your references look at that treatment? If so, why didn’t you use their errors and do even simple statistical demonstrations that the means were different? Absent that, your simple demonstration lacked scientific rigor and is less than convincing.
Zeke, I’m a chemist. Three degrees and post doc. My second graduate minor was analytical chemistry. I’ve spent 40 years in industry doing “sciency” stuff. Climate science seems to be a very different beast than any science I’ve been associated with.
bob Greene: Climate science seems to be a very different beast than any science I’ve been associated with.
It isn’t laboratory science. Not much is controlled, and not much is recorded accurately as wanted day in and day out, and the recording devices change irregularly without adequate documentation. I did pass introductory chemistry, and this is one of the ways that science has been done. It is more like the problems associated with dating specimens in paleontology than like measuring blood electrolytes.
Bob,
Sweeping generalizations about scientific disciplines are not immensely productive. This is a blog post intended for a (mostly) non-technical audience. If you want a more robust discussion of uncertainties arising from temperature homogenization, read Williams et al 2012: ftp://ftp.ncdc.noaa.gov/pub/data/ushcn/papers/williams-etal2012.pdf
Or our new ISTI paper on benchmarking (which is coauthored by Ian Jolliffe, who is not exactly a statistical lightweight :-p): http://boris.unibe.ch/59043/1/gi-3-187-2014.pdf
> Zeke, I’m a chemist. Three degrees and post doc. My second graduate minor was analytical chemistry. I’ve spent 40 years in industry doing “sciency” stuff.
Bob, I’m a ninja, and your argument is invalid.
Willard flails fancifully, hard shell creaking.
===============
Zeke and Steven,
Thanks for putting up these posts, explaining things, and answering our questions. Letting us peak behind the scene helps in understanding just what global temperature is and what goes into it. It may not be something of use to most byt it’s always nice to learn and pick up new information.
you’re welcome.
Zeke Hausfather, thank you again for another good presentation.
Very informative. My understanding of temperature measurement continues to improve. Thank you.
Zeke Hausfather and Steven Mosher, I have now read all of the comments (and some challenges to you were worth reading, esp those of Pielke Sr), and I thank you again for your many answers.
no problem.
he asks good questions. And knows the literature and writes good stuff.
I got a lot of good ideas by reading his work
It’s all urban heat island effect. Put all the stations 1 km away from concrete structures and G.I. sheet roofs to remove UHI. UHI alone can account for 0.7 C warming since 1960.
That would be quite an interesting result if you could show it to be true. We made a stab at looking at global UHI impacts back in 2011 here, if you need any inspiration for your approach: http://wattsupwiththat.com/2011/12/05/the-impact-of-urbanization-on-land-temperature-trends/
The challenges are finding a good enough measure of urbanity, dealing with uncertainty in station locations (a problem in many areas outside the U.S., where lat/lon coordinates aren’t always accurate), and ensuring that your method doesn’t suffer from spatial coverage biases between urban and rural sets (I tend to prefer station pair comparison methods for that reason).
I look forward to seeing your paper.
Dr. Spencer had done that back in 2010.
http://www.drroyspencer.com/2010/03/global-urban-heat-island-effect-study-an-update/
In that case, I look forward to seeing Christy’s paper. Note that absolute temperature differences related to UHI don’t necessarily automatically translate into trend biases.
World population increased by 4 billion from 1960 to 2014. Average population density increased by 30 persons per sq. km (excluding Antarctica). Equivalent to UHI warming of 0.7 C. That’s a minimum. Higher population density, higher UHI. People can’t live in the ocean and few stay in Antarctica.
The fastest warming areas (across Canada and Russia) have a low population density, so maybe that means UHI fails the first test as far as its global influence goes. Clearly something else is going on that is more important.
Yes that something else is natural ocean cycles. After all, the ocean also warmed but no UHI in ocean. The D-O event 11,000 years ago warmed the Arctic region, Greenland and Northern Europe. It was attributed to thermohaline circulation. Today it’s UHI plus ocean cycles – PDO, ENSO, AMO, etc.
Areas of low population density also tend to have fewer stations, and those are in any case situated in or near human habitations.
In any case, if UHI isn’t a big factor in those areas it doesn’t preclude it from being a factor in others.
> Yes that something else is natural ocean cycles.
There’s a vortex full of alternative explanations.
For a start, why don’t you give one alternative explanation and its radiative forcing to demonstrate that it is enough to cause the observed warming. Then enumerate it one by one in a process of elimination.
Since the whole ocean, Atlantic and Pacific, has warmed, as well as unpopulated land areas, doesn’t that rather rule out UHI as being much of a factor, and, being a net warming, it also wouldn’t be ocean circulation changes.
Perhaps, but it does affect the measured global temperature rise, potentially making the measured rise slightly greater than it actually is, and in a world where tiny fractions of a degree are significant…
@Jim
The largest unpopulated area, Antarctica, cooled since 1979 according to satellite data. No UHI in Antarctica. UHI has been measured long before greenhouse effect became popular.
The most rapid warming last century was 1979-1998. Coincidentally, or perhaps not, PDO index was at a warming phase during the same period. And the slight cooling in 1945-1978 coincided with PDO cool phase. Why should we rule out UHI and ocean cycles when they are the most likely culprits?
Imagine that we had a dataset from lousy thermometers located at junkyards and dumps and measured by drunk monkeys. We strike a line or curve of some sort through this sorry data and measure the scatter about it in sophisticated ways to measure uncertainty. By this time we have nearly forgotten that our “un” certainty derives entirely from the certainty of the original line, which is really not certain at all.
All of this needs to be done and you have convinced me that TOD is a legitimate correction. Thank you. We just can’t flatter ourselves that we know either the certainty or uncertainty of the trend.
Dr. Strange Love
lets look at the temperature of the air where there are no cities, no buildings, no humans, no trees, no pavement.
http://www.ncdc.noaa.gov/bams-state-of-the-climate/2009-time-series/mat
The air over the ocean has warmed about 1C since 1850
The air over the Land has warmed about 1.5C since 1850.
That gives you an interesting maximum estimate for a potential UHI effect.
There are some other ways as well to create a boundary for the effect size you are hunting for.
Did NCDC ‘homogenize’ the ocean temperature data to account for the different methods used in measuring temperature? It started with buckets of seawater, then water from intake port of ships, then drifting buoys, then satellites from space. The measurement depth vary from 0.04 inch to 70 feet. The warming bias is anywhere from 0.3 C to 0.7 C. Not to mention the bias from “homogenization”
By the way, before buoys and satellites, I wonder if the ships measure the temperature at same times and same places all the time. Did they cover even 0.1% of the world’s ocean area? I guess all of these are ‘homogenized’ too.
Dr.
we are talking about MAT
not SST.
you get an F.
Here is another hint.
raw SST… is warmer before adjustments
Steven
All NCDC, GISS and CRU use SST in their combined land and sea global temperature. For your info:
“Overall, the SST data should be regarded as more reliable because averaging of fewer samples is needed for SST than for HadMAT to remove synoptic weather noise.” (IPCC AR4)
So you chose MAT to mislead? You get an F minus
All my criticism of SST remain and tell me how much warmer is raw SST. Can ‘homogenization’ cure all my criticism? That is the issue you did not answer.
Here Dr. Love
You dont even have to use temperature from land stations to get the temperature over land
http://onlinelibrary.wiley.com/doi/10.1002/grl.50425/epdf
This gives you another estimate at the potential for UHI bias in the record.
Please note. A Big UHI signal would be easy to find.
From your trusted study:
“We have ignored all air temperature observations and instead inferred them from observations of barometric pressure, sea surface temperature, and sea-ice concentration using a physically based data assimilation system called the 20th Century Reanalysis.”
Translation: We don’t trust observations so we used a model to simulate the temperatures. And we conclude the IPCC is correct because our model said so. You can readily judge if the authors are scientists or computer gamers.
Wrong again. quack
Quack hand waving will not prove your point. This will help you win a point. Give me a valid physics equation expressing air temperature (T) on land as a function of SST, barometric pressure (P) and sea ice concentration (I). If you have one, I will nominate you to be awarded the Nobel Prize in Physics.
What these computer gamers had done is a multiple regression analysis using a general function:
T = A (T) + B (SST) + C (P) + D
Using empirical data, they determined the coefficients A, B, C and D. Then they used this general function to compute for T. Then concluded it works! Of course. It’s circular reasoning.
Zeke and Steve, (commenters too)
Thank you for this great posting and your responses to commenters, even the nitpickers. It has provided me a lot of useful new detail about the “sausage-making” aspects of temperature data handling. The process you describe might not always be pretty, but the product looks good to me. As a skeptical lukewarmer, I still hold the chance that minor mistakes in the process might have been made, but can see no indication of bad faith manipulation, hoax, fraud, conspiracy, or any of the other silly accusations I occasionally read, mainly elsewhere. Congratulations on a huge amount of careful, productive effort.
One of the advantages of working at a power station is that we continuously log weather data using calibrated instruments that have traceable accuracy. I took the temperature records and did the analysis for time of observation at 16 hours across the day. TOBs is real. However, it varies month to month, probably related to day length, and year to year. The correction can also be significantly larger than the numbers quoted by Zeke.
Though my data is only for one site, hence anecdotal, I think that a single number used for all sites for the whole year ( I may have read the article wrong, so could be corrected) is the wrong approach. Has anyone validated that the method is appropriate? From the denizens, there must be other engineers out there who have access to good data that could be analysed.
they dont use a single number
Hi Chris,
Its always cool to see folks play around with some data themselves to look at things like this. There isn’t a single adjustment per se; Figure 2 in my post shows the net effect of all TOBs adjustments across the network, not the adjustment done to each station. You can read about the algorithm NCDC uses to adjust for TOBs in Karl et al 1986: ftp://ftp.ncdc.noaa.gov/pub/data/ushcn/papers/karl-etal1986.pdf
Berkeley Earth does something somewhat different, using difference series between each station and its neighbors to pick up step changes in temperatures localized to individual stations. This approach appears to be fairly effective at detecting TOBs changes, as well as instrument changes and other inhomogeneities.
Zeke Hausfather, you say:
In regards to BEST’s implementation, is this based on any particular tests people could look at? I get the general idea can work well, but I’d assume each individual implementation would need to be tested. And if so, I’d think people would be entitled to see the results of the tests.
Brandon,
Offhand I don’t think we did any explicit comparison between Berkeley’s empirical adjustments at TOBs breakpoints and the Karl et al adjustments (though that sort of analysis would be interesting!). Rather, I was basing my statement on the fact that we (and Williams et al) get CONUS-wide results effectively identical to the standard NCDC record when eschewing an explicit TOBs correction and letting the automated homogenization handle it.
http://static.berkeleyearth.org/posters/agu-2012-poster.png
Zeke Hausfather:
I hope you understand why getting the same answer is not a convincing argument for many people. If not, I can provide numerous examples where that argument has been used in climate debates to defend bad methodologies. Quite simply, getting the same answer does not prove the methodologies being used are doing a good job. That would also happen if both methodologies suffered from similar problems (or problems which cause similar effects).
Moreover, I’m not convinced you guys are actually getting the same answer. Steven Mosher presents something I’ve previously used to explain some of my concerns. The central figure in that suggests to me NCDC and BEST got dramatically different results on scales like that of a country like the United States. That is highly relevant, even if those differences might wash out when taking a global average.
ToB effects are predominantly a United States thing. It doesn’t inspire confidence they are being handled properly if the methodologies used to account for it can result in significantly different temperature patterns for the United States. That’s exactly what the link Mosher provides shows.
You guys obviously don’t have to agree with me, but I hope you’ll at least consider why people might find your argument unconvincing.
“This approach appears to be fairly effective at detecting TOBs changes, as well as instrument changes and other inhomogeneities.”
It’s fairly effective at removing genuine discontinuities between neighboring stations not related to artificial discontinuities. Absent metadata you simply can’t separate the wheat from the chaff in discontinuities between neighboring stations. Yet you pretend you can… incredible.
he misses the point yet again.
Why not collect a few stations from around the globe where there have definitely been no factors for change beyond what the local climate can force? I’ll bet for an unbiased person with bush sense there will be very few such stations since the factors external to climate are so numerous at any given site over long periods. Try countless, instead of numerous.
Then worry about time bias. Maybe.
But wait, there’s more.
Next, better count only days where there was no cloud cover whatever, since cool and warm often just means there was cloud about to lower maxima and raise minima. If you are interested in pure temps for comparison, you have to ditch every day with a wisp of cloud (What? You’re not sure how cloudy it was, let alone for how long and what part of the day or night? Pity.). Next, you have to know about the length of time in each day for which a temp, high or low, was sustained. So you may have to go anecdotal – yuk! Afternoon thunderstorms (southerly busters) in the fifties and seventies in eastern Oz would certainly have given a disastrous bias to many summer readings. The day may have been a scorcher, but a southerly before reading time has blown away your heat.
Sydney’s genuine max record of 2013 cannot compare to the wide-spread heat of 1939, the record which got broken so briefly. Both were parts of severe heatwaves, but it was 1939 which killed more than any other natural event in our history. Also, the difference between the harbour site and observatory site – separated only by a short paddle – on Jan 18 2013 was enormous, much greater than the normal discrepancy. This is why the simple number recorded at the observatory gives an accurate but hopelessly thin account.
When you have a few sites which satisfy the standard of purity, don’t draw any conclusions or graphs. Just allow commonsense to digest the information for what it is worth, which won’t be much. There are no terrific statistics, but it would be nice to have some good ones.
By the way, I seriously doubt you will find a station anywhere in the world which meets a standard of purity. I’m intrigued by the extremely high monthly and yearly max temps recorded in my part of NSW between 1910 and 1919. But if it all comes down to a drunken postmaster or a sheet of tin left under a Stevenson screen, I’ll live with it. Stats being pretty junky by their very nature, why worry?
I’ll settle for a bit of overall warming since the 1850s, and maybe a boost after the 1980s, maybe followed by a pause.
But, for the life of me, I can’t see why it matters.
And I did just say something dumb when I spoke of a “southerly before reading time”. I should have said, southerly before potential max time. Namely, you had a hot day but it couldn’t do its full heat thing because of a tendency to suck up cool southerlies in the afternoon. Obviously, reading time can’t affect the max. But how do you compare the heat of the 1970s with that of the 1990s? Why bother? Two different regimes.
Good idea.
once we realize there is bias in the record we have three choices.
1. Ignore the bias.. RAWIST
2. Use perfect Stations.. PURIST
3. Adjust…………………….PRAGMATIST
Its funny but after years of this I still have people who say on one hand the record is biased, but on the other hand, dont touch raw data.
#2 is a much more interesting discussion.
Then there are faux helpers on #3.
For #2 and #3 I watch what people DO not what they say.
are they doing work or assigning me homework.
One reason Why we share code is to give you power to do your own work, or make our work better. Think of it as a test of good faith.
When I asked hansen for code and he gave it I worked with it.
Go look at climate audit. pretty effin simple.
When I asked tamino for code he gave it. I put it into a package for people so they could use it.
I have no idea why it matters if global temps are up a bit, down a bit or pausing a bit. What else have they ever done?
But, as Lady Bracknell said of Jack’s smoking, a man should always have an occupation of some kind. If you like doing this, and other like you to do it, carry on. But why not treat it as a theoretical exercise done for curiosity, or simply because someone is happy to pay for it to be done? I, for one, admire your BEST exercise…as exercise! I’m sure much has been learned and experienced in the doing. And I admire your personal industry and commitment, Steven.
But a stitched together global temp isn’t even as good as its many dodgy parts, dubiously adjusted (Rutherglen!) or dubiously unadjusted, since we need to allow for further quality leakage due to the stitching and stretching. The fact that it presents well as a final product can’t change what it is.
You can assemble mashed spam into something that looks like a lamb roast, but that doesn’t make one a pragmatist. A pragmatist treats mashed spam as mashed spam. That said, there can be some limited value in the shaping and presentation, whether educational or even artistic.
Anyway, no probs either way. Few things could be more trivial than a global temp, even if we knew it.
http://upload.wikimedia.org/wikipedia/commons/a/ab/GHCN_Temperature_Stations.png
Warmunists go to great lengths casting doubt on whether the Medieval Warm Period was global and argue that it may have been confined to small fraction of total surface. Yet the same brokers argue that instrument data almost exclusively from that same fraction of total surface reflects a global average.
Incredible. Classic example of talking out both sides of their mouths.
No, they simply point out that nobody has established the MWP was warmer. You want it to be warmer, write the simple paper required to establish it. The world’s smartest man should be able to do that by March 1st, I would think.
Steven Mosher | February 22, 2015 at 6:03 pm |
“It is hilarious. starting back in 2005 and again in 2007, Numerate skeptics have concluded that it is NOT worth arguing about.”
Correct. The absurdity of trying to establish global average temperature from an abysmal lack of temperature series across most of the globe prior to 1980 makes the adjustments argument silly.
Yet the warmunists continue. This admits a few explanations.
None of them favorable to warmunists.
Warmunists are the new deniers. They are becoming the equivalent of dragon slayers.
David
I wouldn’t bet the house on a global average being scientifically accurate prior to 1980 when we have access to data from Automatic weather stations which, if properly sited, should give us a reasonable estimate of the trends.
Coincidentally that coincides with satellite data, although that measures a slightly different matrix of course. It would be interesting to see a comparison of the two, always accepting that even after 1980 our land temperature coverage is by no means comprehensive and has that awkward habit of stations changing position.
tonyb
Over 100 years or more I am skeptical that there would not be extremely high correlation between a very small scattered number of the most “pristine” locations and global temperatures.
Put the efforts into ensuring the limited sites are as accurate as possible and use them as a proxy for the overall.
Working with thousands of sites and then using innumerable equations and all sorts of work arounds may be inherently inferior to ensuring that a few sites are spot on and reflect a better record of historical temperatures.
Yes, it is amazing they allowed the satellites that measured the surface air temperature to fall out of the sky after the Medieval Warm Period, and then the corrupt dummies put up satellites in 1978 that don’t even know how to measure the surface air temperature. WUWT?
JCH
What do you think the Chinese were trying to do with all their fireworks and rockets 1,000 years ago. They were visionaries even then and knew they had to deal with their skeptics of the day with a better way to measure temperatures.
And then of course they launched all those ships that could have housed the the Nina, Pinta and Santa Maria in Captains Quarters, and may have provided Columbus his first leftover Chinese takeout.
err tony
satillites change position ( orbital decay)
they change time of observation ( drift)
and the sensor changes with different platforms.
all need adjustments.
ask yourself what is the tmin and tmax for a satellite?
why just one measure for the whole day or month? WTF?
what hour was that?
want to freak out? go look at daily raw for a satellite.
I once hoped for the discovery of a Chinese temperature record in cricket chirpings. They’ve done better: Tibetan tree rings untouched by the hand of Mann.
===========
Mosh
Just substitute the word thermometers for satellites in your first paragraph
Tonyb
tony B I know that was my point.
go look at satellite raw files.
Psst dont ask Springer or Brandon to assist, they will screw it up.
David in TX, that quote is strange given in 2010, Steven Mosher co-authored a book which made a huge deal out of the temperature record, how it was adjusted and whether or not those adjustments properly accounted for things like UHI. Early in his book, he and his co-author say:
Later, when discussing CRU they say:
And their book is filled with things like:
And:
Telling everybody just how important it is to get an accurate understanding of the UHI effect because it is important we make sure the global temperature record is accurate. That was what Mosher published, in a book, in 2010. But now, he tells everybody:
Apparently people should have realized this was a stupid subject to argue about in 2005 or 2007, hence why Mosher published a book arguing about it 2010.
(References for the book and quotes within, as well as many more, can be found here.)
wrong again.
2005 and 2007 comment is about TOBS.
UHI is different as I continue to say, along with Micro site its the only issue worth talking about. that was true in 2007 when we figured out TOBS. that was true in 2009, 2010, 2015.
historically the story of climategate does start in the temperature record.
see Willis’s FOIA.
simple fact.
I’ve asked, and not heard a good answer, whether or not the satellites are calibrated at least partly in reference to Jones’ 1990 Chinese UHI study. I’ve never figured out yet whether the question is just ignorant, or can’t be answered.
=============
I just realized I misread Steven Mosher’s comment. Mosher has made quite a few comments saying skeptics shouldn’t argue about the temperature record, and when I saw this comment, I mistakenly thought this comment was more of the same. It wasn’t. If I had read the entire exchange it had happened in, I would have realized that. I screwed up because reading threaded comments in chronological order (such as in an RSS feed) makes it easy to not look at context.
I am confident my point would hold for other comments Mosher has made, but in this case, it is definitely wrong. Sorry about that.
Steven Mosher, I’m glad I made this mistake. It shows you will continue to respond to me after all, despite your suggestion on the last thread you won’t. I guess you’re happy to respond to me when you have an easy chance to show I’m wrong. It’s just when I refrain from making stupid blunders you’ll ignore me.
Thank you brandon
The NUMERATE skeptics who gave up the arguments against TOBS were JerryB who then convinced me in 2007 and I believe NicL in a post he did
in the 2010 time frame somewhere on JeffIds I think it was in a comment.
The UHI issue ( which I still think COULD bear fruit ) played a role in history of climategate. Changes in how one calculates temperature for a region also played in a couple of studies. One study ( I believe rob wilson ) covered at climate audit I recall he did his own canadian recon, and later people would revisit Yamal with raw/adjusted.
This is just from memory. so YMMV
“I’ve asked, and not heard a good answer, whether or not the satellites are calibrated at least partly in reference to Jones’ 1990 Chinese UHI study. I’ve never figured out yet whether the question is just ignorant, or can’t be answered.”
Well, its an ill formed question.
Specify which satillite
Specify which SDS
Then read the validation documents provided for that SDS.
They all have them.
UHA and RSS are data products BUILT FROM multiple SDS.
calibration of a TLT product would be done against radiosondes.
The sensor is ‘calibrated” to the zero of ‘space’ , but the data product is
calibrated to radiosondes.
Somewhere I have the data flows, but I cant do all your homework. This deal of me doing your homework in exchange for the lunch your mom packs is getting old
Heh, if the answer is important, you’ll throw it up after lunch.
New excuse, moshe ate my homework.
=====================
I see you attended the brandon school of reading comprehension.
TOBS dave, the issue is TOBS..
in 2005 and 2007 what did numerate skeptics find out about the TOBS fraud?
Zeke,
Does the “Best” methodology detect and correct for any TOB bias caused by the adoption of daylight saving in the USA. More particularly, there is a long and complex history of the use and non-use of daylight saving. The time of switch-over has not been consistent, some states adopting it, others not, some counties adopting it, others not, some states opting in then out then in again etc.
The raw data might or might not always indicate how the observations relate to the standard time.
Rob R, you beat me to it!
there is no explicit correction for any given bias
Hi Rob,
The adoption of daylight savings time would be a particularly interesting bias since it affected a lot of stations simultaneously. I’ll look into it a bit more.
Zeke Hausfather, a very plausible explanation, thanks. The uncertainty is at least comprehensible.
Just for clarification:
TOB is always standard time, not daylite saving, I assume?
According to Karl, TOB biases TMin and TMax differently, also depending on latitude and time of year, as the warmest / coolest times of day change. This bias also varies for stations on the eastern / western edges of time zones, or on the eastern / western slopes of hills among other things.
Using the hourly data, as you did, for individual CRN stations, is it now possible to verify the regional distributions in the TOB “model” developed by Karl et al in1986?
How well do the adjustments calculated by “… pairwise homogenization algorithm and similar automated techniques” correlate with theoretical regional values?
KenW, Good point. To really understand why TOBS is needed by NOAA you would need to have adjustments identified by instrument type, cause of observation shift (1960 request, daylight savings time, synoptic weather reports (6 hour relative to GMT) etc. ).
Does anything change much when you ran a sundown to sundown phase arrangement vs. a sunrise to sunrise arrangement?
captd. Springtime, days trending warmer, autum trending cooler, etc. etc etc. The adjustments could be pretty dynamic, not just a breakpoint here or there!
The CRN stations could however, over time, provide a baseline to help get at least some of the noise out of the system.
ken
The point of Zeke’s work is to show
A) there is a potential Bias when you change TOB
B) Given the data we have about the change in TOB the adjustment
makes sense.
C) Therefore: there is NO FRAUD
Is NOAA’s approach perfect? I dunno. Zeke may not know.
but giving him additional homework on work that NOAA did is a little bit cheeky.
You ask good questions. If you think the answers will destroy AGW
as a theory, get the data. you can be the next brandon.. err wait..
Steven, I wasn’t accusing anybody, and not tryin destroy anything. I find Zeke’s approach of using the CRN hourly data to determine what the biases should be – ingenious. I only note that the Karl paper states that the biases aren’t constant, rather that they vary with regions and seasons and other things too. They produced maps, which must have been painstaking in 1986.
The CRN data appears to me to be quite valuable in this respect. If somebody with the resources were to reproduce the Karl maps using real data, then this could be used to check a lot of what we’re spending a lot of time arguing about here. Steven, I wasn’t accusing nobody, and not tryin destroy nuthin.. I find Zeke’s approach of using the CRN hourly data to determine what the biases should be – ingenious. I only note that the Karl paper states that the biases aren’t constant; rather that they vary with regions and seasons and other things too. They produced maps, which must have been painstaking in 1986.
The CRN data appears to me to be quite valuable in this respect. If somebody with the resources were to reproduce the Karl maps using real measured data, then this could be used to check a lot of what we’re spending time arguing about here.
comment mangled – read first half only!
“C) Therefore: there is NO FRAUD”
Right – there’s no fraud in the attempts to cope with messy piles of data.
The fraud comes in with those that want to ignore or obscure the model failure in order to continue to exploit ‘global warming’ for political gain:
MODEL: IPCC5 (RCP8.5): 4.2C/century
MODEL: IPCC4 Warming High: 3.2C/century
MODEL: Hansen A: 3.2C/century ( since 1979 )
MODEL: Hansen B: 2.8C/century ( since 1979 )
MODEL: IPCC4 next few decades: 2.0C/century
MODEL: Hansen C: 1.9C/century ( since 1979 )
MODEL: IPCC4 Warming Low: 1.8C/century
———————————————————————
Observed: NASA GISS: ~1.6C/century ( since 1979 )
Observed: NCDC: ~1.5C/century ( since 1979 )
Observed: UAH MSU LT: ~1.4C/century (since 1979 )
Observed: RSS MSU LT: ~1.3C/century (since 1979 )
MODEL: IPCC5 (RCP2.6): 1.0C/century
Observed: RSS MSU MT: ~0.8C/century (since 1979 )
Observed: UAH MSU MT: ~0.5C/century (since 1979 )
———————————————————————
Denier: 0.0C/century
errata: MODEL: IPCC4 Warming High: 4.0C/century
Mr Mosher, I have a question re your continuously repeated “there is no fraud”.
Can you explain, as others have pointed out, why quite a lot of the ACTUAL adjustments bear no relationship to the calculated effect of all adjustments.
I have seen a maximum overall adjustments figure of about 0.8C mentioned, but I have seen many adjustments of individual sites of more than 1.0C.
How in your opinion does that happen?
Applying TOBS or any other adjustment is putting makeup on a pig. It’s still a pig. Spatial and temporal coverage is not adequate for a global average temperature.
http://appinsys.com/globalwarming/GW_Part2_GlobalTempMeasure_files/image004.jpg
http://appinsys.com/globalwarming/GW_Part2_GlobalTempMeasure_files/image005.jpg
Most of the ocean has no coverage. .
Not until satellites started covering everything except the poles does a global average temperature pass the giggle test.
Write that down.
Ken W.
I’m glad you think it was a good idea
http://climateaudit.org/2007/09/17/hansen-says-no-thanks/#comment-106823
AC
‘Mr Mosher, I have a question re your continuously repeated “there is no fraud”.
Can you explain, as others have pointed out, why quite a lot of the ACTUAL adjustments bear no relationship to the calculated effect of all adjustments.
1. NOAA adjustments?
2. CRU adjustments?
3. NWS adjustments?
4. Or our predictions of adjustments?
I will talk about our predictions. Given the data we make a prediction for each site. We predict what the data WOULD HAVE LOOKED LIKE
if the site acted like it’s neighbors. To make that talk easy I will speak of them as adjustments. but technically they are not. They never get used.
Now, if you do a total census of the adjustment to series lasting anywhere from 7 months in length to 250 years in length you will find this:
median: the median adjustment is ZERO
mean: the mean adjustment is negative (hmm like 5/100ths)
the max and min are Really huge
Of course the end effect of a large adjustment to a short series is mousenuts. And further the adjustments are not spatially or temporally uniform. SO in the end.. you have sums of adjustments that will be positive in some space-times and negative in other space-times
########################################
I have seen a maximum overall adjustments figure of about 0.8C mentioned, but I have seen many adjustments of individual sites of more than 1.0C.
How in your opinion does that happen?
####################################
In our system it happens easily. Stations are effectively compared with there neighbors. The easiest way for it to happen is that if there are 100 bad stations that are all bad in the same direction and bad at the same time and bad in similar magnitude surrounding an innocent station.
we do some work to mitigate that.
you also get big changes where a bunch of good stations surround a bad one. then that one can get spanked hard.
Some long series never get touched.
I currently dont have a detailed written explanation for all 40K.
Ken,
The effect of TOBs is indeed not universal. I could have created maps showing how changes from afternoon to morning across the CRN network (and tied it into Karl et al’s related discussion), but that was too much work for a blog post. On the other hand, I could just suggest that folks interested in the nitty gritty read Karl et al or Vose et al :-p
.
David,
There is a reason why the ocean has little to no coverage: those are maps of land stations. For ocean temperature data go here: http://icoads.noaa.gov/
Hi Zeke – With respect to quantifying the uncertainties, please do separately for maximum and minimum temperatures. As we report in
McNider, R.T., G.J. Steeneveld, B. Holtslag, R. Pielke Sr, S. Mackaro, A. Pour Biazar, J.T. Walters, U.S. Nair, and J.R. Christy, 2012: Response and sensitivity of the nocturnal boundary layer over land to added longwave radiative forcing. J. Geophys. Res., 117, D14106, doi:10.1029/2012JD017578. Copyright (2012) American Geophysical Union. https://pielkeclimatesci.files.wordpress.com/2013/02/r-371.pdf
Part of our abstract reads
“Based on these model analyses, it is likely that part of the observed long-term increase in minimum temperature is reflecting a redistribution of heat by changes in turbulence and not by an accumulation of heat in the boundary layer. Because of the sensitivity of the shelter level temperature to parameters and forcing, especially to uncertain turbulence parameterization in the SNBL, there should be caution about the use of minimum temperatures as a diagnostic global warming metric in either observations or models.”
This issue is important well beyond the UHI regions, including high latitude winter sites on land (anywhere with a stably stratified boundary layer).
When the mean temperature is used in BESt, CRU, NCDC GISS, etc it obscures a proper interpretation of the causes of trends. This is likely one reason that the satellite and ocean heat data show significantly less global warming in recent years than does the surface temperature data. \
Best Regards
Roger Sr.
This may be an ignorant question, but is “mean temperature” just the midpoint of min and max? If so, is that a reasonable assumption for latitudes where the length of a day varies over the year? Or are there corrections for that?
Ken, an excellent question. The Met Office says “The ‘mean daily temperature’ is the average temperature in each 24 hour period, measured at 1.5 metres above ground level.” As such, it was probably impossible to determine until relatively recently. My guess is that a (Tmin+Tmax)/2 is usually substituted, but of course, that introduces a bias – and that may well be what we are discussing. What are relative advantages of the mean versus (Tmin+Tmax)/2 I don’t know, I am not a meteorologist. The first one may be measurable now, but the second one has much longer historical data. Why don’t we just stick with it?
the goal is to create a series that goes back in time.
in the begining folks only recorded daily min, daily max.
To connect to that history Tave is defined as (tmin+tmax)/2
It is an ESTIMATE of the daily average.
Steven,
“It is an ESTIMATE of the daily average.”
An honest answer. I’ve never accused you of being responsible for the quality of the data you have to work with.
But could CRN hourly data also be used to determine how far Tavg might be off depending on latitude and season? or at least quantify a part of the possible error?
The reason I ask is because I’m not sure that changes in CO2 concentration would affect Tmin and Tmax equally everywhere, all the time. But that’s another thread.
KenW
‘But could CRN hourly data also be used to determine how far Tavg might be off depending on latitude and season? or at least quantify a part of the possible error?”
sure. but there would not be any point to it from reconstructing the past.
Thank you for nice and informative article, such information is much needed.
I hope you’ll continue the series with explanation of other factors playing role in homogenisation adjustments.
Some time ago I was doing my own comparison of USHCN raw versus adjusted and average difference of about 0.5 C upwards was one of things I noticed in it. That would be well explained by this article if there weren’t other effects. What it does not explain is spread of adjustments (ranging from -1 C to +2 C) and some outliers (extreme adjustment of +5 C at one station). Plus I would expect UHI adjustments to push the result a bit down from the 0.5 C average. So I am definitely interested in more details on how temperature adjustments are made.
Do you really believe that Russian temperature records from, say, 1917-1950 are reliable?
Do you honestly believe that Chinese temperature records from, say, 1913-1980 are reliable?
Do you seriously believe that Sub-Saharan African temperatures from, say 1850-1975 are accurate?
Do you really believe that oceanic temperatures from, say 1800-1970 are accurate? (as we know, the oceans cover 70% of the earth’s surface).
I don’t.
During the Medieval Warm Period they kept perfect records, and the records remained perfectly kept through the early years of the recovery from the Little Ice Age. Then they went to heck.
LIA ….. doesn’t that stand for the Little Information Age?
Diogenes –
Do you think that the Earth is warming? Do you think the warming has paused?
Joshua-
I think there’s little doubt that there has been no significant measurable surface temperature warming for almost two decades.
Has the Earth warmed since the end of The Little Ice Age? Probably (that is, of course, a guess), but in truth climatology has no accurate knowledge of the magnitude.
I have spent a lot of time in a field where people would be far more honest if they’d simply say, “I don’t know” rather than delude themselves and others with inaccurate/dishonest answers.
Do you think that the Earth is warming?
On a monthly basis?
Easy – global average temperature increases about 4C from January to July.
Then global average temperature decreases by ~ 4C from July to January:
https://wattsupwiththat.files.wordpress.com/2013/03/clip_image0041.jpg
Is the pause continuing? Only time will tell, but the pause 2001-2014 is evident:
http://www.cru.uea.ac.uk/cru/data/temperature/HadCRUT4.png
I don’t believe any of those temperature records you mentioned can be considered accurate. I don’t believe the entire basis for the warmists’ claims about how much the earth temperature has increased since the start of the 20th century. I certainly do not believe their claim that 2014 was “the hottest year ever in recorded history.” This is not science. It is propaganda, pure and simple. It is really tragic, and I can’t understand how any real scientist would put up with this obvious attempt to pervert science for social and poitical goals. Any scientist that buys the arguments of Hansen, Mann, Schmidt, etc. should be ashamed of themselves.
Good gawd, he rejects the recovery from the Little Ice Age!
We need a few to be from the show me state to balance the hair on fire progressives. That’s just fair. :)
they are all LIA rejectionists!
And while we’re at it, those “precise” temperature readings of the Arctic and all the dire ice melt fail to mention that they sailed wooden boats through the Northwest Passage over 100 years ago. No, the arctic is not warming and the sea ice is not melting…. and the polar bears are doing great, by the way.
The evidence that there is tampering is overwhelming at all levels. As an asideissue it just ain’t warming!, so in the end, GISS, NOAA adjustments ect will end in the dust bin of scientific fraud history bin. LOL
https://stevengoddard.wordpress.com/2015/02/23/huge-scandal-just-not-that-one/
OK so if we have to wait another F@@ 10 years to really nail the issue.
BTW IPCC is probably finished as an institution anyway (hint read the newspapers)
Eliza
I was at the met office today and met Dr Richard betts. The idea that him or any of his colleagues there are involved in some sort of giant conspiracy that deliberately reduces past temperatures is nonsense.
However, I do think the temperature record is wholly inadequate and scientists put far too much credence on information that is little better than anecdotal. See my question to Mosh a few minutes ago.
Tonyb
“The idea that him or any of his colleagues there are involved in some sort of giant conspiracy that deliberately reduces past temperatures is nonsense.”
It’s not nonsense. Anybody who understands human nature understands that people tend to try and get over on people if they can get away with it. It’s a daily reality.
Andrew
Think means, motive, and opportunity. Who’s got ’em?
Andrew
It is the warmists who are claiming the earth is on the verge of catastrophe, so the onus is on them to prove the numbers they rely on are accurate. I believe there are warmists who are intentionally manipulating and misrepresenting the numbers because they are promoting a cause, not science. The whole field of climate science has been distorted and people are playing fast and loose with history, which they have no way of accurately portraying, in order to predict a future based on a sketchy hypothesis of the powers of CO2.
Bad Andrew
The historic temperature data that Mosh uses is every bit as anecdotal as my written material is supposed to be. The trouble is that I recognise the flaws in my material whilst he thinks his are the gold standard.
tonyb
tonyb,
Mosher and Zeke are both well aware of how sub-standard the material they use is. The product they push, however, relies on the very same material. They just choose to keep pushing, rather than doing the right thing and getting real jobs.
Andrew
no tony.
I dont think they are the gold standard.
the difference is simple.
Tony B Unfortunately My father (WMO expert ) was the person who was responsible for correcting all the weather measurements in Bolivia
and Paraguay from 1964 to 1977 so yes unfortunately Goddard/Homewood are correct the raw data was correct for SA from 1964 onwards anyway. Sorry, but it has been fraudelently adjusted to show warming In Bolivia and Paraguay 100% certain. I suppose the USA Congress will decide eventually whether there was fraud or not.re GISS ect….
eliza
that wasn’t my point.
I think that organisations such as the Met Office and BEST are over reliant on data that is of very variable quality-some good and some very bad. They then subject it to all sorts of indignities and the end result is unrecognisable to what they started with.
Consequently people look at piece of data A and see that Mosh or the Met Office have turned it into piece of data B and cry foul.
Variable data, over complicated algorithms and complex analysis is a more likely answer than outright fraud.
tonyb
Not only that, people from different agencies *differ* between each other on the impact of these local adjustments. Tim Osborn of the CRU thinks adjusted local records are less biased while Steven Mosher of BEST thinks adjusted local records are useless for local trends.
If BEST follows a different methodology and arrives at the same final result as other agencies, one can infer (a) the adjustments make no difference, in which case the question becomes ‘why do it then’, or (b) the same nature of errors are present in the BEST pipeline except in as yet under-recognized, under-reported areas of the pipeline.
So much effort spent trying to rehabilitate garbage data. We don’t need 1,000 US stations to determine if the earth has a fever.
The USCRN shows a decade-long cooling trend. The satellites show a decade-long cooling trend. The most pristine USHCN stations with a 1 rating show insignificant warming for the last century.
http://notrickszone.com/2014/08/20/analysis-of-23-top-qualty-us-surface-stations-shows-insignificant-warming-only-0-16c-rise-per-century/#sthash.NqWG4SbF.f3rhfJuX.dpbs
10 years ago the alarmists didn’t dare pollute the datasets with historical African temperatures, or historical SSTs from the Southern hemisphere because everyone knew they were garbage. But now all those data are being dumped into the algorithms, and predictably you end up with GIGO.
I have been looking around the BEST site trying to get a better sense of what you do, more on a macro than a micro scale. I am curious as to why you present results as “Regional warming since 1960 (°C / century)”, which is essentially a linear extrapolation of the past 50 yrs. of data and effectively doubles the temperature increases. Isn’t it more typical to present this type of data as Deg./decade? To be clear, I am looking here: http://berkeleyearth.lbl.gov/city-list/ as well as here: http://berkeleyearth.lbl.gov/country-list/
Elsewhere, here: http://berkeleyearth.org/summary-of-findings you stick to discussing what the data actually says: Global land temperatures have increased by 1.5 degrees C over the past 250 years
Berkeley Earth has just released analysis of land-surface temperature records going back 250 years, about 100 years further than previous studies. The analysis shows that the rise in average world land temperature globe is approximately 1.5 degrees C in the past 250 years, and about 0.9 degrees in the past 50 years.
I meant to add that if I just look at the city or country data as tabulated it leads me to conclude that warming is more than 2 deg. C per century.
I don’t think I was as clear as I want to be in the above comments, so I will try again.
If you go to the Berkley Earth web site and click on Data/Results by Location, you get to a slick page that allows you to review the summary results for BEST’s temperature data reanalysis. You can look at it by City, Country, State or Station. The summary provides “regional warming since 1960 in deg. C per century. For example if you look up Canada you see 3.64 +/- .44. Abu Dhabi is 3.61 +/- .62. Bolivia is .67 +/- .29, and so on. This strikes me as an odd way to show the summary results of a data reanalysis project the intent of which was to determine whether or not other analyses of the data (collected between 1850 and 2014) were verifiable. If I understand what has been done, it appears that BEST took the “actual measured” temperature change between 1960 and 2014 and extrapolated it to 2060 and tabulated these results. Why wouldn’t they show the results of their data reanalysis for 1850 – 2014. If the answer is that they believe the measurements prior to 1960 were less reliable than those afterwards, then why wouldn’t they just show the summary results of their data reanalysis from 1960 – 2014? If they wanted to show a century long summary, why wouldn’t they have summarized the period from 1914 – 2014? By the way, all of the other summary data they present on other sections of their website cover only the measurement period and make no attempt to go beyond the present measured data. I am not accusing anybody of fraud or mannhandling the data or of using poor statistical methods. Others are doing a fine job of that. I am just saying that the way they are summarizing their results (which is what most people look at) can be confusing if not down right misleading.
I would hope that Zeke or Mosher would provide some clarification.
On another topic, it appears that error bars (+/-) in the summary tables is on average around .5 deg C (in my scan I have seen a range of .20 – .62). Seems low to me, but I’m sure that I could understand how they get there if I had the intestinal fortitude to dig through their code. It would be really helpful if either Zeke or Mosher could explain (in simple terms that this old reasonably well technically educated scientist/engineer can understand) how these error bars comport with the error bars of +/- .05 deg C that they associate with their “warmest year” analysis issued recently and highlighted on the web site.
LLN
Typical Mosher wise ass response.
This is an enlightment to the basic intelligence of “climate Scientists”who decided this person should run their Institution. http://economictimes.indiatimes.com/news/politics-and-nation/harvard-university-withdraws-rk-pachauris-invitation-for-india-conference-after-fir/articleshow/46337234.cms
Anything coming from this institution is highly suspect
Eliza
This is the third time I have tried to get Mosh to answer a straightforward question that relates to your original comment. Lets hope he sees this one.
Mosh
Third try to get an answer;
—— —–
Mosh
I am getting it in the neck from people like Eliza and bad Andrew for defending you and the met office so please reply to my reasonable questions
http://judithcurry.com/2015/02/22/understanding-time-of-observation-bias/#comment-677491
Tonyb
your questions are answered.
Mosh
You replied but that’s a different thing to answering my question.
Tonyb
Tonyb,
Generally U.S. data isn’t used prior to 1895, as things were a bit wonky before that and the co-op network had yet to be set up. Berkeley tries to go further back, but you end up with pretty big error bars rather quickly.
http://berkeleyearth.lbl.gov/regions/contiguous-united-states
Zeke
I am confused here. You say generally US data isn’t used before1895 but then link to a graphic going back to the start of the 19th century.
So US data prior to 1895 IS used then, as a stand alone country file And also as part of a global record?
Tonyb
Different groups us U.S. data back to different points. NCDC uses U.S. data back to 1895 in the USHCN dataset and back to 1880 or so in the GHCN analysis. HadCRUT uses U.S. data back to 1850. Berkeley uses it all the way back to 1750 or so. Of course, the further back you go the larger the uncertainty and errors become.
tony, there are stupid questions.
there is No magic date when a network becomes ‘reliable” as if that were a black and white decision.
as for vague questions about un specified records.. my answer is
it depends.
If you want to get involved in “old weather” there are protocols for transcribing. That work goes on. join as a volunteer
KenW | February 23, 2015 at 10:12 am
You asked an excellent question.
“…. is “mean temperature” just the midpoint of min and max? If so, is that a reasonable assumption for latitudes where the length of a day varies over the year? Or are there corrections for that?”
This has been looked at in the past (I would need to do some searching to find the paper on it). However, at least for the CRN sites, this can be looked at easily and I hope Zeke does this and provides us with a quantitative result.
Roger Sr.
I had a min-max thermometer when I was seven years old. I took about one day to figure it that it had to be reset twice a day, or late at night.
The TOBS adjustment is based on the theory that tens of thousands of historical observers were both stupid and irresponsible.
Or, perhaps, it could be based on the time that observers reported resetting the thermometer… https://curryja.files.wordpress.com/2015/02/figure-1.png
Zeke,
I think those observations need adjustments, too.
Andrew
“I had a min-max thermometer when I was seven years old.”
That must have been painful. when did you have it removed?
please take that thermometer to congress when you testify for all skeptics.
Further their instructions are to reset it once
B-28 section 3.2
I talked about this on climate audit years ago.
http://www.nws.noaa.gov/directives/sym/pd01013015curr.pdf
The instructions say to take the minimum, maximum, and current temperature. This should allow suspected double-counts to be identified pretty easily. If temps were taken late in the afternoon and the current temperature matches the max temperature for the following day it may be a double-count. If it doesn’t match exactly, it’s not a double-count. In the morning, the current temperature would have to match the minimum temperature of the following day to be a double-count. If it doesn’t match exactly, it’s not a double count.
If there was no such evidence of double-counts for any given station for any given month, introducing a TOBS adjustment to that monthly data would be unjustified and improper.
Since the overriding goals is to determine if the earth has a fever, there is no reason to insist on using average temperatures, especially when you suspect that the minimum or maximum temperature record may be polluted by TOBS issues. Minimum or maximum temperature trends alone should also be adequate to chart any trend. If a station reset only in the afternoon over a period of time, the minimum temperature trend should still be reliable. If a station reset only in the morning, the maximum trend should be reliable. Why not try to use good data instead of rehabilitating polluted data?
Because nearly all stations in the U.S. changed their TOBs from afternoon to morning at the request of the National Weather Service? If there were a forgotten trove of long fully homogenous temperature records to use, it would be pretty nice. Unfortunately, we are stuck with the historical temperature record, where there are only a handful of stations in the world that have remained at the exact same location with the exact same instrument and observation time with no major changes to micro- or meso-scale environments over the last 100+ years.
Thanks for the reply Zeke. As a thought experiment, let’s take a station that took readings in the afternoon, then changed to a morning observation. Before the change the maximum temperature series may be polluted by double-counts, but the minimum temperatures should be free of TOBS bias. After the change the minimum temps may be polluted by double-counts, but the maximum temps should be free of TOBS bias.
Every temperature series already splices the record together to account for “discontinuities”, and every temperature record already reports anomalies. So why not take each such station, use the minimum temperature anomalies up until the change, then do a one-time shift to maximum temperature anomalies? That way, each station has one single change, and there is no need to go back and “adjust” every single data point for TOBS. As a bonus, the underlying raw data is the best available, not polluted by the double-counts suspected to introduce a systemic bias.
At the very least, this type of analysis could serve as a reality check for the TOBS adjustments being applied to each station. If the TOBS adjustments are being properly applied, the two different approaches should lead to a very similar anomaly record.
KTM,
Perhaps I’m misunderstanding you, but thats exactly what is done. Minimum and maximum temperatures are analyzed separately, and the step change associated with the TOBs is removed for both. No other corrections beside the removal of this step change are done to account for TOBs.
No KTM the instructions say to reset after taking the temperature
Goddard is asserting that since he had a thermometer at age 7, therefore all observers must have reset it twice a day
The operators instructors guide specifies one reset.
Zeke, what I’m saying is that as it is now the Tmin and Tmax are TOBS adjusted separately, averaged, then reported as a single average temperature anomaly series.
What if instead of doing that to use the raw Tmin to calculate the anomaly up until the change in reading time, then used the raw Tmax to calculate the anomaly after that, and spliced them together to report a single anomaly series? The unpolluted Tmin would capture the anomalies before the change, and the unpolluted Tmax would capture the anomalies after the change.
This would capture any changes over time to the climate of the station, without requiring any TOBS adjustments to be applied, and I think it would be a good reality check to see if the TOBS adjustments now being applied are proper.
I apologize for reposting my comment: The Met Office says “The ‘mean daily temperature’ is the average temperature in each 24 hour period, measured at 1.5 metres above ground level.” As such, it was probably impossible to determine until relatively recently. My guess is that a (Tmin+Tmax)/2 is usually substituted, but of course, that introduces a bias – and that may well be what we are discussing. What are relative advantages of the mean versus (Tmin+Tmax)/2 I don’t know, I am not a meteorologist. The first one may be measurable now, but the second one has much longer historical data. Why don’t we just stick with it?
Hi Curious,
Generally folks tend to define Tavg as (Tmax + Tmin)/2 even when hourly observations are available to ensure a consistent definition. If you are using just hourly data it doesn’t matter much. If you are combining it with min/max data, than inconsistent definitions of Tavg are ill advised.
Paul Homewood shows NOAA in 2014 giving a global temp. for 1997 is 58.24 degrees; in 1997 the global temp. for 1997 is 62.45. Is the difference TOBs.?
Mosher says no problem, they are just estimates. I take him at his word. Apparently in Climate World this interpretation is just part of their Standard Operating Procedures.
I hope this example comes up during the Congressional hearings. Having been involved in a lot of legislative hearings, I can assure you the reaction by Committee members and staff will be something like, “Say what?”
Mosher thinks it is scientifically defensible. I say, how will it play in Peoria?
Most likely the difference is due to methods.
I believe that NCDC used to use a method called first differences.
http://www.ncdc.noaa.gov/monitoring-references/docs/peterson-vose-1997.pdf
However FD has some serious problems as a method. We discussed this on Climate Audit and Air Vent, concluding that the method was broken.
NCDC has since switched to a much better method ( as I recall ) using EOF.
The difference could also be due to adding stations.
No gold here. dig elsewhere
On the issue of using the average of the maximum and minimum temperatures to calculate a mean versus more frequent daily measurements, one paper that examined this is
A statistical estimate of daily mean temperature
derived from a limited number of daily observations
Masumi Zaiki, Keiji Kimura, and Takehiko Mikami: 2002. GRL
http://onlinelibrary.wiley.com/doi/10.1029/2001GL014378/pdf
Roger Sr.
Thank you Roger, will read tomorrow… too…late…now…
Thanks Roger this always comes up.
WUWT has a nice post on it somewhere
Hello Roger,
They show that with enough information you could correct pretty good if you have at least 2 readings a day. Looking at the range of values of the coefficients they calculated for various months however, one could easily make an awful mess of things too.
If anything, it shows the magnitude of the problem for anybody using fewer than about four(!) readings a day.
Interesting also that it seems sometimes worse to read three times a day than only twice! (Table 1)
thanks again
ken
In looking for the work on the computation of the mean temperatures, I came across the informative pdf below.
http://climate.atmos.colostate.edu/pdfs/climatologyreport-00-3.pdf
There are some very relevant findings for Zeke’s analysis of the homogenization issue and its uncertainty. Here is an excerpt from the report
“Results of temperature comparisons of ASOS and the predecessor HO-83 prior to the present report were made by McKee et al (1996), Schrump and McKee (1996) and McKee et al (1997a). A summary of the results included the following:
.
ASOS is accurate to +/- 0.3°F relative to a calibrated field standard instrument.
The HO-83 (predecessor to ASOS) had a warm bias with respect to a calibrated field standard averaging 0.57°F and a range from near zero to more than 1.0°F.
Local effects at night due to site relocation are quite variable, usually negative, with a few having ASOS minimum temperatures more than 1°F cooler than the previous location even though the location change was less than one mile horizontally and 100 feet vertically.
.
Local effects in the daytime and solar heating in the maximum temperatures show that the HO-83 has another bias which is quite variable and is at least 1°F warm at some locations.”
The conclusion in their report is that
“The analysis of AS9S temperature observations compared with NWS coop site leads to two preliminary conclusions. One conclusion is that the determination of a single bias adjustment value for each season cannot be done with great accuracy. If the need is for an estimate within 0.5 -1.0°F, then it probably can be met. A second preliminary conclusion is that estimates of ASOS climatic averages for periods on the order of 10 years appear quite good but are dependent on the identified biases remaining
rather stable over time.”
Roger Sr.
http://i81.photobucket.com/albums/j237/hausfath/tavg_ushcn_discrete_adjustments_zpse71d6663.png
There are two amazing things in this graph from Zeke.
1. TOBS adjustment is almost linear since 1940 when it would be supposed to be random.
2. Stronger, it is almost identical to the other adjustments which are also supposed to be random.
Even if what Zeke says about TOBS makes sense, the probability that his explanation is correct is close to zero.
1. TOBS adjustment is almost linear since 1940 when it would be supposed to be random.
WRONG.
see figure 1 in this piece.
Steven Mosher,
“WRONG.”
Talk to Zeke.
TOBS adjustment is approximately linear since 1960 and honogeneization since 1940.
The probability of having two extraordinary and independent causes producing so similar effects is very very low.
What makes you suggest that TOBs and homogenization adjustments have similar effects? Look at their respective impact on min and max temps.
https://curryja.files.wordpress.com/2014/07/slide17.jpg
Zeke,
But it’s the result that counts.
There are two independent phenomena which by default are supposed to have random effects.
For historical reasons, the first seems to have an extraordinary directed effect.
It is not too problematic.
The second phenomenon, against all odds, is not random, very curious.
In addition, it is parallel to the first.
The assumption of independence is positively unacceptable.
Phi,
Adjustments to U.S. temperatures are dominated by two large non-random systemic biases: changes from afternoon to morning observation times, and the CRS to MMTS transition. Neither would be expected to have random effects.
“There are two independent phenomena which by default are supposed to have random effects.”
That is your theory.
Looking at the data….
Theory busted. please speak to mr feynman on your way out.
Zeke; One “large non-random systemic bias: a change from afternoon to morning observation times,..” I ask again, could you please quantify it? Has it been measured? Calculated? Guessed?
Curious,
https://curryja.files.wordpress.com/2014/07/slide11.jpg
Zeke posted that in July. The USHCN was picked by the Global Change Research Program in the 1980s to be the US climate baseline.
CaptDallas, thanks for posting a graph of a number of meta-records. Do you have anything to contribute for my question?
“Zeke; One “large non-random systemic bias: a change from afternoon to morning observation times,..” I ask again, could you please quantify it? Has it been measured? Calculated? Guessed?”
Quantify IT?
Figure 1. Shows you the number of stations, when they observed
and how they changed.
Figure 2 shows you the amount of bias that is removed.
in 1986 a test was conducted using hourly data to predict the TOB bias for the US. Depending on the place and time you get different Bias’
The purpose was to create a prediction code that could correct for changes in TOB. that is covered in Karl 1986
The approach was tested again in 2006
http://www.ncdc.noaa.gov/oa/about/2003rv20grl.pdf
Data for the analysis were extracted from the Surface
Airways Hourly database [Steurer and Bodosky, 2000]
archived at the National Climatic Data Center. The analysis
employed data from 1965 –2001 because the adjustment
approach itself was developed using data from 1957 –64.
The Surface Airways Hourly database contains data for 500
stations during the study period; the locations of these
stations are depicted in Figure 2. The period of record
varies from station to station, and no minimum record
length was required for inclusion in this analysis.
Zeke,
“Adjustments to U.S. temperatures are dominated by two large non-random systemic biases: changes from afternoon to morning observation times, and the CRS to MMTS transition. Neither would be expected to have random effects.”
CRS to MMTS transition causes a linear effect since 1940 ???
There is clearly a very big problem of interpretation with these adjustments. One should therefore only use raw data.
Curious, “CaptDallas, thanks for posting a graph of a number of meta-records. Do you have anything to contribute for my question?”
Its on that graph. Times of observations changed to closer the actual High or Low so the information could be reported quickly. There was a reason for the TOBs changes not considered in the statistical approach for determining TOBS bias, people want to know the day’s high and low temperature that day. That would be a large non-random change.
Your question should be, “For a non-random change why is Zeke/NOAA assuming a random error distribution?”
Zeke – “Figure 2 shows you the amount of bias that is removed.” How do you know whether to remove a -0.1 deg bias or a +0.3 deg bias? How much in January? … in December?
George READ KARL
The bias is different depending on the station location, month, etc
Steven, just tell me how you determine the magnitude of the bias. I got a strong impression that it is not experimentally. What remains is a calculation, estimate, or a guess – correct me by all means if it is something else. An informative answer might be e.g. “we calculate it using Karl’s methodology.”
Phi, what is interesesting is Zeke’s Tobs only graph which shows half (0.3c) of the warming from 1980 on (0.6C) is TOBS only.
I am not a learned scientist as the ones participating above, but I believe that Mosher is right when he continues to highlight “UHI is different as I continue to say, along with Micro site its the only issue worth talking about. that was true in 2007 when we figured out TOBS. that was true in 2009, 2010, 2015.”
Goddard/Heller gets a lot of stick, but his argument is that the problem is not so much TOBS as the use of “fake” stations creating the current warming.
https://stevengoddard.wordpress.com/2015/02/23/zeke-still-hiding-behind-tobs/
Maybe I have missed it, but I don’t see the issue mentioned above of NOAA non exisiting stations creating a warming bias through adjustments. Is this verifiable and does it warm the present thus creating a biased warming signal?
Evan Jones was writing about the microsites somewhere and that appears to be an issue. I gather there will be a paper involving A. Watts and his work on US siting issues. So, as I see it, the key issues are UHI, the micro sites and the non exisiting stations creating a warming bias by being included in the US record and possibly globally.
Any informed comments on these issues rather than TOBS. Are this extensive discussions about TOBS a diversion away from the real issues?
I for one would like to know.
Seems more like to clear the air and set the stage, the fire and works to come.
===============
Opps
has the following definition + add your definition
operations
operations is used in Slang Military
The word Opps is used in Slang, Military meaning operations
“Any informed comments on these issues rather than TOBS. Are this extensive discussions about TOBS a diversion away from the real issues?
I for one would like to know.”
Yes. I can just relate my experience and Zeke has his perspective.
When I started working on this is 2007 there were several issues
1. Station drop out
2. Adjustments
3. UHI
4. Micro site.
Well, I plowed through number 1, zeke did as well, clear climate code, nick stokes did, people from both sides. In the beginning I was convinced that dropping stations had to have some impact. OPPS. zeke and nick and I wrote a post on it for WUWT.
Then I started to look at adjustments, SHAP, filenet TOBS ( the old stuff)
I was sure it was all hidden there. After plowing through and coming up empty handed.. what next ? UHI
UHI has been more difficult to handle. Zeke and I did some work together before Berkeley.. he’s done papers.. we joined berkeley and did more work.
We published a paper that said “no bias” ( effectively ). Well, Im still not happy with that result. I expected something. A couple of internet guys made good coments, one reviwer ( Ross ) also had a interesting argument.
So if you look at my blog you’ll find some projects I started to look at that problem yet again..
Microsite. Anthony is doing real work. He would not spend a lot of time on it unless there were some interesting results. His first effort was mixed results
His second effort ( over two years in the re-making .. zeke found a problem)
should be interesting.
Want to know what matters?
Look were people are willing to devote some effort. Years ago I pointed out some of this TOBS stuff to skeptics.. They didnt want to probe.. didnt wantto get the data.. hmm that tells me they really are NOT convinced that something is there.
I’ve dug in all four areas.. station drop out,, adjustments.. UHI.. micro site.
The only areas where the problems were tough and the answers uncertain was UHI and microsite. The only area were skeptics who respect their own time work is in those two areas.
basically.. more brains on those two problems please.. the other stuff is just a distraction.
ask evan where he thinks the gold is
Steven,
You use the acronym OPPS above. What does that stand for? I assume you mean “oops” from its context here and in the other places you’ve previously used it. If so, consider my correcting you as just a small needed adjustment to get things more accurate, my own sort of TOBS adjustment, (Totally Obscure Badinage Spelling)
Pick the ever-changing two important spots on the planet Earth, that are in line with the Sun. Each hour using GMT, when the time is correct take the two measurements at the same time(pro/anti), always in relationship with the Sun and the Earth. Used like a timing light; take the product of the two hourly values and do what you will with them… Post the results in the newspapers. After twenty years our satellite work will show the real global T trend. We would all know exactly what was happening around us on a daily basis, in an hourly format. It would be in a form that is understandable to everyone. Bullets are more accurate than the shotgun approach. I think. This method would be much less expensive and I feel would also provide a better product. If after twenty more years we can all see that this idea does not have legs… no problem there either, you could blame it all on me.
Just a thought but still going for the gold…
Since the areas to be measured every hour would be known in advance, we could then have ships on station to verify what the real conditions are, against what the satellite data reports over the oceans. Calibration would be then be easy compared to what is being attempted today.
Hi John,
The infilling done in USHCN rather by definition has no effect on the trend. This is discussed in depth in the following posts:
http://rankexploits.com/musings/2014/how-not-to-calculate-temperature/
http://rankexploits.com/musings/2014/how-not-to-calculate-temperatures-part-2/
http://rankexploits.com/musings/2014/how-not-to-calculate-temperatures-part-3/
as well as this post here:
http://judithcurry.com/2014/07/07/understanding-adjustments-to-temperature-data/
Regarding microsite bias, there is lots of interesting work that has been done and is ongoing on these issues.
See Fall et al for microsite bias, for example: http://onlinelibrary.wiley.com/store/10.1029/2010JD015146/asset/jgrd16904.pdf?v=1&t=i6ifuwn6&s=53bbf36014de70352e2c05f0c9e70c47102af857
Or my recent paper on UHI: ftp://ftp.ncdc.noaa.gov/pub/data/ushcn/papers/hausfather-etal2013.pdf
The data must be adjusted to average, makes sense to me. Otherwise if would be like…. Well if you took everyones salary, averaged with out regards to degrees, experience, and then started trying to find groups discriminated against….
I wonder if this is what it’s like at an astrologers’ convention?
http://theastrologypodcast.com/2014/06/16/modern-vs-traditional-astrology-debate/
Well, as I listened to Mark Levin today On the drive home, he discussed some interesting studies on wage gap.
err well adjusted wage gap.. that was adjusted by a statistical model..
here is a related story.
http://www.huffingtonpost.com/christina-hoff-sommers/wage-gap_b_2073804.html
Thx Mish, interesting.
Otherwise there would be an opportunity to start a company with reduced costs to beat out competitors.
And business hates a cost gradient!!
Do they create imaginary women and compare their imaginary salaries to other imaginary (sorry, synthetic) salaries for validation, to come up with a world wide average of women’s salaries to within hundredths of a cent?
Oh wait, I get the point. Someone else used statistics somewhere, on some issue, therefore BEST’s claims of accuracy, prediction and attribution in support of global decarbonization must be valid.
Got it.
Gary, it is Academia, not the real world, they can do whatever they like, there are no consequences for failure or being wrong.
Just look at all their predictions, just look at GCMs, none of it matters to them.
For instance CAGW didn’t work for them when warming was neither accelerating or catastrophic, so it went back to Climate Change, which has nothing to with people. The talk about “Extreme weather events” which are actually getting less extreme and less frequent.
The even Hype every Storm, Hurricane, Cyclone and Tempest, but when they reach somewhere that can actually take measurements they are not as extreme as they said.
Hansen said parts of New York would be under water by now, it isn’t but nobody takes any notice.
There are no consequences for any of these people, none at all. They just keep getting their pay checks and Grants etc.
No garyM
The logic is simple. Some people demand raw data. Some people decry the use of statitistical models to correct data. they see that and they say
Fraud. Hoax.
pointing out that every discipline does this should focus people on what matters.
A) Why was the adjusting done
B) how was it done
C) strengths and weakness
D) can we improve it
E) was it independently tested
F) do other people get similar answers.
or we can discuss how the republicans will beclown themselves by calling the only skeptic stupid enough to make multiple fraud charges to the witness table.
talk about Own goal.
Yeah, except I wasn’t talking about the fecklessness of congressional Republicans (who are mostly progressives anyway), I was talking about the pseudo-science of global average temperature.
GaryM –
==> “Yeah, except I wasn’t talking about the fecklessness of congressional Republicans (who are mostly progressives anyway),..
As often as I’ve read it, I still get a kick out of that.
Elizabeth Warren is looking for a speechwriter.
here is the thing garyM
The republicans have some good arguments to make INSIDE of the science.
they dont have to be cranks.
Further, they have some good arguments on Policy.
they dont have to be cranks
But Gore said hot. We said Not.
dumb.
Mosher
“….they don’t have to be cranks.’
Absolutely correct. They have blown more saves than the Detroit Tigers bullpen. They come out of the dugout with a chance to win it all and serve up one long ball after the other.
All they have to do now is just shut up. Tape their mouths closed.
The ball diamond is the science. Play on that field. Bring your best stuff and outscience the other team. Win between the foul lines and stop playing to the crowd in the stands.
They are all stoned or drunk anyway.
“pointing out that every discipline does this “, I think you might just have a problem making that statement fly for “Every Discipline”.
Nobody, but Nobody in Industrial Process Control goes back and alters historical data, they use Real Satistics, based on the process history to read the Current process and React to change. Identify the Cause of the change, correct the cause of the change and then carry on.
Not take the current “change” and go back and re-write the process history to MAKE IT FIT.
That is the difference between the real world and Academia, in the real world it would have consequences. Like parts not fitting together, $millions lost in lost production etc.
I wonder why Mosher won’t advise Democrats on what to do.
Andrew
Yes, the wage gap is a great example of why data must be adjusted before averaging. Essentially dealing with covarying parameters.
And one that should be friendly to the the conservatives understanding of TOBS!
If the republicans call Goddard, I have already said I would advise the democrats to call Anthony and Peilke. That way they can repudiate him under oath.
“That way they can repudiate him under oath”
Repudiate him with what? Their opinions?
Andrew
I’d advise the Dems to call Mosher to the stand and submit BEST Squiggly Lines under oath.
Andrew
Steve Mosher,
“But Gore said hot. We said Not. dumb.”
I stand second to none in my contempt for the Republican congressional ‘leadership’. But comparing them unfavorably to Al Gore, who makes GW Bush look like a Rhodes scholar and Richard Nixon look like Thomas More, is hilarious
And what is with the “we?” You – a Republican? Really? Yer a funny guy.
All of which evades (again) my point. I have made no defense of Republicans, or skeptics or anyone. If you want to argue with them, knock yourself out.
My point was (again) that “Global Average Temperature” is pseudo-science.
There might be some way to calculate (with huge margins of error) the total or average (?) global heat content of the Earth’s climate (depending of course on how you define it), but no one alive today is anywhere close to being able to do so. BEST included.
GAT is a PR campaign.
I was looking at the Memme 2009 link. The chart has about 350 pm stations and 750 am stations and a little over 100 midnight stations. In fig. 2 he has about 1040 or so total stations, so are the zombies mid-night or mixed in with am/pm group :)
Come on he is a scientist, you don’t expect him to be able to do simple arithmetic do you?
Even th AM/PM add up to 1100, so he must have thrown out 160.
AC Osborn, All I expect is a highly intelligent sounding explanations that don’t include much common sense :
The TOBS adjustment is based on statistics that doesn’t consider confounding factors like most of climate science statistical analysis.
There was an unusual number to time of observation changes recorded but no one considered why there would be so many changes. If you are wanting to get the daily high and low temperatures so you could report them to the local paper or news outlets, you would collect that info as soon as possible, especially if there is a new high potential record. When that is done the accurate Tmax and Tmin are recorded for the proper day and there is no step change that requires TOBs adjustment.
When you ignore that confounding factor you can convince yourself that TOBs adjustment is required, determine what bias it would cause and some uncertainty margins that are completely wrong because you assumed there are no confounding factors. Since the time of observation changes could have resulted in zero bias, you have to include that in your analysis, not just the worst case.
How about a process that eliminates TOBs completely?The simplest way to do this would be to report a single Tmax and single Tmin for each station for each month. Of course this would have the downside of reducing the count of measurements by a factor of 30! But it would have the benefit of eliminating TOBs. It would be a simple matter to calculate this statistic across all temperature stations. What would be the trend and how would this trend compare to other methods?
An elementary statistics course presents the concept that there are multiple ways of analyzing data. First principles are that there is the max, min, mean, median and mode. Higher principles address computation of variation and standard deviation. All of these statistics being helpful for indicating the true behavior of the data. It appears to me that those reporting historical temperature data have forgotten these principles. A number is reported and great efforts are made to justify it. But why not report all statistics for the data and, if the data is adjusted, why not report the values of those adjustments and from whence they are derived?
TOBS is a US problem only, but even in the USA there are and were stations where trained professionals took the readings, and did it correctly.
Thus one should compare non-TOPS-corrected and TOPS-corrected with professional stations and notice the change.
(Which is exactely what he who may not be named is doing:
https://stevengoddard.wordpress.com/2015/02/23/zeke-still-hiding-behind-tobs/
so I better shut up.)
The TOBS correction is validated using just the type of comparison that Goddard is screwing up.
Zeke & Mosh
Thanks for a very informative thread.
A couple of thoughts:
1 – Obviously, this only applies to US data, which has a long history of being recorded to a fairly good standard (i.e. to a documented and standardised methodology and equipment), but for which there is a systematic change to adjust for. In this context the TOB adjustment appears to have good justification in preventing a spurious trend in the longer term measurements. Not particularly relevant to the rest of the world, where data quality issues are different (e.g. poor equipment or maintenance, loss of longer term records through conflict or natural disasters, unreliability of observation etc).
2 – As I understand, unless the time of observation is particularly close to the time of Tmax or Tmin (where ‘double counting’ would be a frequent occurrence),, the double counting will only occur for days where there is a marked jump in temperature (so, in the case of morning readings, where the second night is appreciably warmer than the first and so Tmin occurs at the start of the 24 hours). Yet the TOBS correction gets applied to all the data. As such, on most occasions.it is actually applying a (relatively small) adjustment to raw data that is accurate, but occasionally is applying the similarly small adjustment to a datum point that is significantly inaccurate. Now, this probably all cancels out in the end, but it is perhaps something (else) for Zeke to look at with the CRN comparison – how frequent are double counts, and is there a better way of correcting so that only the actually incorrect data are adjusted (I suspect probably not)?
Ian
The historic US temperature record was compiled mostly by voluntary observers at random times, with little guidance and using sometimes sub standard equipment that was rarely calibrated. They were invariably situated in very rapidly growing communities with all that entails. The observers changed frequently, so continuity of record is problematic
There are undoubtedly some very good records within the historic data but the wheat needs to be sorted from the chaff before it is put through an algorithm and subjected to statistical manipulation.
Of course the records in many other countries that make up the ‘global’ record is far worse. .
tonyb
Statitistically, not anecdotally, the US is one of the worst records.
tonyB has already been informed of this upthread by Nick Stokes and me.
with numbers of course, not arm waving.
With the US record however we have the advantage of many many records.
That allows you to statistically sort wheat from chaff and even test your algorithm that does this.
I’ll give you an example of how thats done.
1. Take CRN which starts in 2002. Its 110 stations, three sensors, calibrated.
2. Calculate the US temperature using everything BUT these “gold standrd” stations.
3. Compare that to the answer you get using only uncalibrated stations.
Answer: They match. Why? because the over sampling, after bias adjustments, reduces the noise.
Then You could do the following. Use USHCN which has been “hand selected” its 1000 or so stations. Do the same kind of comparison.
hand selected versus the “crap” stations. Result.. Same answer.
Reason, See above.
The bottom line is that even when you have an un calibrated imprecise network you can still compute a good estimate. And you can check that estimate by doing out of sample testing.
As you go further back the accuracy of your estimate decreases, but it is still the best indication of what temperatures were.
Mosh
I know this having read the original ‘ US monthly weather review’
However having looked at many other records from other countries it remains amongst the best of a Very bad lot. Suitable for a country let alone a global record? No, unless the wheat is sorted from the chaff first and there is an awful lot of chaff.
Tonyb
tony. reading isnt science. one man reading a selection of documents isnt science. its the beginning. And you’ve drawn a conclusion ( with no error bars) without even looking at approaches to the problem.
When you have a network that has poor calibration, changing observation practices, this shows up in a statistical analysis. You have to look at everything.
You can see this just by checking good stations ( CRN) versus the rest of a network.
Go look at Nicks work again (GHCN adjustments in ROW) . Until you understand the math, you dont have a leg to stand on.
Mosh
I have drawn this conclusion after reading you for many years, plus Zeke plus Nick and I did follow many of the CA threads. I have also troubled to look at the original data as noted in the US monthly weather review dating to 1872 plus many other records. What do you think I collected on my web site?
The current global record is not fit for purpose because of the nature of the data used in it. I accept that you and others are doing their best to improve it. But if the US record is amongst the bEst , it shows how poor other parts of the record are.
Will sorting the wheat from the chaff substantially change the record? I don’t know, but the certainty surrounding the fractional temperature changes is misplaced. Is the general direction of travel correct?
. Probably for large parts of the record, bit the error bands need to be better expressed
Tonyb
Ian,
I am an official observer, and I measure the temperature at 2 PM today with current temperature 30 C, and record 30 C as max, and reset max/min. Tomorrow I again read the temperature at 2 pm and although the current temperature is 20 C, the max/min thermometer still reads 30 max. Of course, I immediately realize the max/min reading is garbage and I will not reset max/min at 2 PM again. The TOB adjustment applies only to fictitious observers.
The thread is being longish and I don’t have the guts to read it all any more, but I’d like to ask one more question.
How relevant is to stick to min-max temps (which tobs adjustment is needed for), when in reality there can be only a short period of bright sky, bringing the min and max further from the average temperature? I look out, see a cloudy day, which has been cloudy all day through. Were it sunny for a moment, it would be much warmer. Be it bright during the night, were the minimun much much colder. I small change in cloudiness at these latitudes at winter can affect a lot (Arctic amplification!) on min and max. When water vapour works as a feedback, I don’t see a dangerous heating. What I see is rather dull, grey, extremely mild day, with – well, a lot higher temps but still very very far from hot.
to build a historical record you need to use Tave.
‘Global temperatures are adjusted to account for the effects of station moves, instrument changes, time of observation (TOBs) changes, and other factors (referred to as inhomogenities) that cause localized non-climatic biases in the instrumental record.’
Before these adjustment can be made in scientific meaningful way , you must know what the effects where and how they where seen . In reality this is often is not the case , so adjustment are made not on the basis of knowledge but on the basis of a ‘good guess ‘ which opens the door right up to those looking to make the ‘right type ‘ of adjustments which support their outlooks .
“He who controls the past controls the future. He who controls the present controls the past.”― George Orwell, 1984
For some the book 1984 is not a warning but a instruction manual .
Zeke,
Thank you for your analysis. I wrote back in July, following your earlier post, that, given the motivated reasoning and desire to show more or less global warming by the opposing sides, adjusting the U.S. records is only likely to create more distrust. I suggested using the U.S. records, as recorded, with asterisks and footnotes to explain the likely TOB, UHI, and other issues. I’m OK with the integrity of the adjustments and the small and therefore inconsequential changes to the overall record, as you and Mosh point out. However, Rud Istvan and others pointed out several sites where there appear to be major adjustment issues. I did not see any response from you.
The “small and inconsequential changes” might not and should not make a difference if climate science were not so polarized. However, when NOAA and NASA stage a publicity stunt to claim .02 and .04 degrees C, less than the .07 claimed margin of error, are a new all time global temperature high, its obvious to me that motivated reasoning (and resulting propaganda) are replacing the science of climate science. Unfortunately, your analysis does not change that.
“However, Rud Istvan and others pointed out several sites where there appear to be major adjustment issues. I did not see any response from you.”
There are 40,000 sites. The are all checked for inconsistency with their neighbors. Each has a different story. A correction algorithm that is 95% right
will generate 2000 sites with adjustments that are wrong. The global effect of this is marginal since the over all effect is marginal. The response we have given is this: The explanation of the adjustment is the code. Its the best explanation. Go read it. But in general stations are adjusted by a weighted vote of the neighbors. Doesnt get any simpler than that. You want more depth. read the code. run it. output whatever you like
‘Use the force, read the source.’
This makes me smile.
I read some scienceofdoom recently where some of the mathematics of climate was browsed. Got a nabla poisoning.
Doug,
Very good point. Go back to the originals.
Then provide estimated adjustments with appropriate error bars.
Scott
Doug, Scott.
we give you the code and data.
Now its your turn.
I’m not doing your homework.
If you think your approach is winning.. just DO IT
What I find most fantastical about the zeal of the climate modelers is how they will compose such contorted arguments to justify their claim of a scientifically significant warming trend of about 1 degree C over the last century. Meanwhile natural climate variability is on the order of 10 degrees year over year and on daily temperature variability is often on the order of 20 degrees.
The rational person must wonder how it can be that a 1 degree variation over a century can be so important in the context of the ten-fold variation that we experience on a continual basis. Simple statistical analysis shows that spending anything but the slightest effort on minimizing the 1 degree variation is simply a waste of time, money and resources. The temperatures mankind will experience for the foreseeable future will be determined on natural climate forcing that mankind cannot control and cannot even forecast!!!!!
Dan W.,
I was thinking the very same thing yesterday… and ten years ago.
Warmers still pushing.
Andrew
Tobs & Land-based measurements
Ok I’m convinced the TOBS adjustment is necessary and correctly done. Of course a correction that is larger than the signal is not ideal. But i never thought it would affect the global total anyway. The total is affected by the Arctic (particularly Siberia) and the ocean data that comprises 70% of the total but which is a complete mess prior to Argo, with jumps all over the place as various different methods were used, none of which were properly calibrated. So it is popular for arch-alarmists to say that the sea is still warming based entirely on a step-change due to an instrumentation change that was just ignored by Leviticus. The only legitimate measurements are post 2003 and they show no significant warming. That 70% of the globe cannot be calibrated prior to 2003 means the effort from 1900 onwards must be particularly iffy. However I can easily accept the globe has warmed in that time by a miserly 0.6K/century. And so what? The real question is whether it is natural or manmade and the difference between models and measurements – as Dr Mears observed – tells us we really still don’t know that. To admit it though is difficult when your job depends on it.
NASA
The NASA Giss adjustments are in dispute because they have blatantly cooled the past and reduced the 1998 peak which coincidentally or not, suits an alarmist narrative of the type we expect from Hansen, Schmidt et al. This manipulation is most apparent when regarding Steven Goddard’s animation of progressive Giss plots. That plot alone tells you there has been mischief afoot. They have the distinct (though unscientific) advantage of being able to match the data to their models rather than the other way about. If the satellite datasets were not around to stop them then I bet the match would be spot on!
Satellites versus Land-based measurements
The satellites quite simply have better coverage and the two datasets do not diverge enough to worry about them. As satellites treat all instruments equally then the adjustments are far more consistent and as the sea is captured as well as the land then everyone should be persuaded that satellites must be more useful. So why are they not? Because only the land-based datasets show 2005 and 2010 higher than 1998 and the satellites show almost no warming over the last 18 years! In any other field we’d automatically prefer the satellites post-1979 but this field is so laden with duplicitous propaganda and false or misplaced ethics that they avoid anything that disturbs their thermageddon hypothesis. Good grief, some alarmists still deny that the hiatus even exists.
“I’d suggest that those who doubt the efficacy of their approaches do what I did: download the data and take a look for yourself.”
is there a download link that goes with that? Seems like there should be one with an invitation like that… Where can I download the data from?
Apologies if this has already been answered somewhere in the comments, yes I have searched for data and download before posting, but honestly it feels like the link should be in the article itself. or an UPDATE download data here sort of thing.
Let me see if I can better explain my contempt for this debate about how to best massage statistical constructs of “Global Average Temperature.”
And I am sure i have some of the following details and maybe the order wrong (I have never know in what order the entrails are stuffed in the intestine to make sausage either), but the central point remains.
First you take a single station, and use it as a proxy for a much larger, (sometimes huge – see Antarctica and the oceans) area.
Then you take TMin and TMax as proxies for average daily temperature.
Then you calculate anomalies, as measured against a WAG of an average, as proxies for a trend.
THEN you start with massaging based on TOBS, station moves, station breaks, etc.
Then you “adjust” stations where there is deviation from the assumed average/trend.
Then you “adjust” years, decades and centuries old data based on modern changes in technology and analysis.
And finally you declare a “WARMEST YEAR EVER!!! (by 2 hundredths of a degree).”
Which the politicians then use to con the stupid voters (TM Jonathan Gruber) into voting for more central planning of the energy economy, more taxes, and more power for your fellow progressives.
Forgive me if I don’t give a rat’s a$$ who the GOP congressional ‘leadership’ call as witnesses about anything.
The “TOBs bias” adjustment is a classic example of junk science done by ambitious geophysical novices who fail to understand, inter alia, the basic distinction between daily average and mid-range temperatures.
Because of the irregular, harmonic-rich diurnal cycles of temperature, max-min thermometers can establish only the mid-range temperature Tmax-Tmin over the period of observation between resets. The true daily average requires that the temperature be recorded at a sufficiently high sampling rate to avoid aliasing the turbulent fluctuations that are responsible for the actual extrema, which don’t occur on the hour as a rule. Thus hourly sampling is not sufficient to show accurately the persistent high-side bias of the so-called “Tmean” = (Tmax-Tmin)/2 over monthly time-scales.
The whole idea that the true daily average (midnight to midnight) can be somehow well-approximated via empirical adjustments based on the time of reading max-min instruments is hopelessly naive.
historically Tmax and Tmin were recorded.
Tmax+Tmin/ 2 is an estimator of the integrated temperature over the day.
nobody IS TRYING TO ESTIMATE the true daily average.
we are constructing a consistent record of what was recorded.
your grade: D-
Steven, I agree with you. The Met Office disagrees. Their grade: D-
If, in your mind, “Tmax+Tmin/ 2 is an estimator of the integrated temperature over the day,” then you don’t even get an F; you simply show that you never went to a proper school.
IMO you calculate rising and falling slope from daily min/max, you can also calculate the slope of the seasonal change as well.
John, please suggest a better estimator for 1800-1950 time frame.
So it’s the Global Integrated Temperature?
Oh, that’s just so much better. Why didn’t you say so before? I now vote for decarbonizing the global energy economy.
RE: Steven Mosher | February 24, 2015 at 5:59 pm
“. . . nobody IS TRYING TO ESTIMATE the true daily average.
we are constructing a consistent record of what was recorded.”
I’ve obviously missed something. I, like many others here, thought that the issue was, or at least we were given the impression; that you were adjusting ‘a consistent record of what was recorded’. I’m not sure if I understand the dfference between constructing and adjusting, as used here . . .
Mouse nuts indeed.
It’s a model.
Johnny.
It’s easy.
Go get 5 minute crn data.
Calculate the average per day
Calculate tave
Now see how well tave estimates the average.
Then take the slope of tave
Predict the slope of the averages
It’s only been done hundreds of times by guys who like you don’t get it.
Finally the historic metric is tave. You can work with that or pound sand
There are papers on this. You fail Google too
Mosher:
The scientifically naive invariably think it’s “easy.” The presumptuous invariably think everybody’s their inferior. I’ve learned over the decades not to waste time with the pretentious polemics of either–especially those who have no solid grasp of the issues being raised. Good luck preaching to the unwary amateurs.
Another graph unencumbered by errors bars:
https://curryja.files.wordpress.com/2015/02/figure-2.png?w=750&h=750
What I’ve learned from reading articles posted to this blog by the “Berkeley Group: is that climate scientists don’t understand statistical error analysis and propagation of errors. Nor do they appear to understand statistical and systematic errors.
There seems to be a total disdain for anything reeking of experiment. Data are just numbers to be manipulated.
Yes, that’s right. There is no respect for data as observations from nature. Instead they are treated as mere numbers on a spreadsheet.
Amen!
Seek, picking up on something Bob Greene noted above, what would you be willing to certify, if under penalty of law, from your efforts? That the methods are sound? That the output is correct? Within what tolerances? Will you certify the quality of the input data? What will you certify?
Thanks for once more addressing the issue of data adjustments.
Indeed those adjustment turn out to rather be data manipulation and corruption.
Besides the questionable validity of those data adjustments vs. raw data, another important question should also arise regarding the constant evolutions of those adjustments.
TOBs adjustments depend on the period at which the measurements have been made. But once those adjustments are made, they are not supposed to change with time. Yet the constant evolutions of historical records tell another story.
1/ With HADCRUT4 data series, the Hadley Centre has introduced new adjustments compared to previous HADCRUT3 data series :
http://www.woodfortrees.org/plot/hadcrut4gl/from:1985/plot/hadcrut3vgl/from:1985
One can observe that news corrections almost always in the “warming direction”, but why ?
Has anyone assessed the validity of HACRUT4 adjustments compared to HADCRUT3 ones ?
I guess the answer is the unfortunately that nobody knows except those who have defined those adjustments.
2/ Data adjustments appears to be obviously “fluctuating” and indeed corrupted.
When looking at US Temperature record as published in 2000 (data up to 1999) :
http://www.giss.nasa.gov/data/update/gistemp/graphs/FigD.txt
(See also graph fig6 of Hansen et al 1999 : http://pubs.giss.nasa.gov/docs/1999/1999_Hansen_etal_1.pdf)
– Warmest year is 1934
– 1998 only ranks 4th after 1934, 1931 and 1921…
But in their new paper published 1 year later, in 2001, Hansen et al introduced new adjustments making 1998 tight to 1934
http://onlinelibrary.wiley.com/doi/10.1029/2001JD000354/pdf
This situation has been maintained up to 2007
http://icecap.us/images/uploads/NEW_RANKINGS.pdf
In 2007, NASA GISS made a fruitless attempt so that 1998 ousts 1934 as Hottest U.S. Year
http://www.bloomberg.com/apps/news?pid=newsarchive&sid=aBBQO5XgLQu4
The “trick” has been discovered by McIntyre and NASA had to step back.
But the record published in 2012 (data up to 2011) reached the objective of ousting 1934 as warmest year in the US :
http://data.giss.nasa.gov/gistemp/graphs_v2/Fig.D.txt
Compared to the 2000 publication :
– 1998 average temperature anomaly has been “adjusted” by +0.35°C
– 1934 average temperature anomaly has been “adjusted” by -0.21°C
See also Hansen et al 2010
http://pubs.giss.nasa.gov/docs/2010/2010_Hansen_etal_1.pdf
This is no more data adjustment but data corruption !
3/ looking at individual weather stations, one can also observe significant and questionable adjustment evolutions :
Few examples of how to hide the inconvenient truth that temperature have been warmer in the past, despite small anthropogenic signature :
Station Data: Reykjavik (64.1 N,21.9 W)
– Old adjustments : the 30’s are clearly warmer than current period.
– New adjustments : Current period becomes much warmer. But why ?
Station Data: Punta Arenas (53.0 S,70.8 W)
– Old adjustments : 1st half of 20th century is clearly warmer than current period.
– New adjustments : Current period is slightly warmer ??
Conclusion :
The inconvenient truth is that temperature data sets look to be constantly manipulated and corrupted by questionable adjustments and nice “tricks” whose aim is “to hide the decline”.
When observations do not support your favorite AGW theory and falsify inefficient models’ outputs, then…modify the data…
That’s climate science way but that’s junk science.
NASA is apparently deleting inconvenient data, showing how GISS has unduly manipulated US historical temperature records.
Links to http://www.giss.nasa.gov/data/update/gistemp/graphs/FigD.txt and http://data.giss.nasa.gov/gistemp/graphs_v2/Fig.D.txt are out of date, whereas they were still valid few weeks ago…
Correct links for Punta Arenas are the following :
– Old GHCN V2 data : http://data.giss.nasa.gov/cgi-bin/gistemp/show_station.cgi?id=304859340004&dt=1&ds=1
– New GHCN V3 data : http://data.giss.nasa.gov/cgi-bin/gistemp/show_station.cgi?id=304859340000&dt=1&ds=14
How global cooling has been transformed into global warming !
BTW, it’s primarily the English-speaking countries that use min-max temperature readings to estimate the “mean.”
Please link to other countries mean temperature handling.
It’s common knowledge among experienced professionals that, outside the English-speaking world, other countries use a great variety of methods in determining the “mean monthly temperature,” which is the customary datum used in climatological work. Depending on your knowledge of foreign languages, you’ll be able to find links at the web-sites of their respective met services.
John – we are talking mean DAILY temperature. Learn to read.
Mean monthly temperature is invariably based on much-variegated methods of estimating the mean daily temperature. As evidenced by 1-minute data world-wide, the daily mid-range temperature is a poor, high-side-biased estimator of the true diurnal average. Learn to think analytically.
The keys to understanding TOBS is understanding what is meant by “depending on the time of observation you will end up occasionally double counting either high or low days more than you should”
How often are temperatures double counted in the synthetic exercise?
What is not being acknowledged here is the manual recording of the ambient temperature at time of reading max-min thermometers. Double counting can be minimized by the clerical procedure of simply flagging any equality between that temperature from the previous day’s reading and one or the other currently registered extrema.
The double counting is not the best explanation. I took real data from Boulder and made max for any 24 hour period in a form of running max.
If you then take the difference between the results with 8 hours change, you see that when there are peaks they appear around noon.
There are also negative peaks but they happen at night.
The peaks happens when the temperature changes from day to day.
Boulder has large variations, so the average of theese max readings can change more that 0.8C by changing reading time from morning to afternoon.
People are people, Zeke. How does it look if say the week day observations were evening but the weekends were morning? What about if you randomised 15% (ie about once a week) of the observations?
Because I think you’ll find reality is that people aren’t automatons and didn’t always consistently read at the same times of the day even if policy said they should and even if they wrote down the time they said they did…
Pingback: Can Adjustments Right a Wrong? | Watts Up With That?
Hi Zeke-
http://wattsupwiththat.com/2015/03/06/can-adjustments-right-a-wrong/
Are you going to respond on this WUWT post. If you do, I suggest posting at both there and on Judy’s weblog.
Roger Sr.
Hi Roger,
The folks at WUWT provide a critique of TOBs adjustments today that, ironically, provides a pretty good validation for those adjustments. They compare the Kingston USHCN station to a nearby pristinely sited USCRN station. The Kingston station had its time of observation shifted at 4:30 PM. If we do the same shift to the hourly Kingston CRN data, we get quite similar results:
http://i81.photobucket.com/albums/j237/hausfath/Kingston%20TOBS%20adj_zpszxqf6otf.png
In this case we find:
Mean USHCN Kingston TOBs adjustment: -0.74
Correct USCRN Kingston TOBs adjustment: -0.70
We’d expect month-to-month variations, as the factor driving bias (double counting highs and lows) is highly stochastic and weather-dependent and won’t be captured perfectly by prescriptive models. I see the fact that the mean and stdev of the adjustments to the USHCN station as quite similar to the mean and stdev of the “ground truth” adjustments based on the USCRN station as evidence that they are doing a reasonable job of correcting for tobs-associated biases in the mean.
The temperature record is now a wolfpack’s breakfast.
thanks to Roger Sr and Zeke for the courteous and enlightening discussions and data.
Scott