
by Tony Brown
Is our popular understanding of the ‘Little Ice Age’ (LIA) correct, as being a predominantly cold era lasting 500 years, leavened by a few brief warm spells?
The canonical description of the Little Ice Age is reflected in this quote [link]:
‘The Little Ice Age is a period between about 1300 and 1870 during which Europe and North America were subjected to much colder winters than during the 20th century. The period can be divided in two phases, the first beginning around 1300 and continuing until the late 1400s. There was a slightly warmer period in the 1500s, after which the climate deteriorated substantially. The period between 1600 and 1800 marks the height of the Little Ice Age.’
The nature of the LIA has been a matter of some contention. The beginning, end and overall severity of this period has been hotly contended by scholars such as Groves, Fagan, Lamb etc., though its extent is thought to roughly coincide with the period 1300-1850 as stated in the title of Professor Brian Fagan’s excellent book ‘The Little Ice Age-How Climate made History 1300-1850’.
Even more hotly disputed is its geographic spread –regional, hemispheric or global.
Some five years ago I started a project I termed the ‘Little Ice Age Thermometers’ to investigate the likely extent and depth of the LIA worldwide, but with a prime focus on the UK, through Central England Temperature, (CET) to 1659, compiled by Manley and now maintained by the Met Office, we have instrumental and numerous other written and physical records reaching through much of the LIA.
The purpose of this paper is to determine the extent and severity of the climate in the area broadly defined as Central England, for the individual years during the period commencing 1538 and portray it graphically in a number of ways. In order to maintain an interesting and largely non-technical narrative, the historic context, graphics and comments are in section 1, whilst conclusions and observations are in section 2. Finally, the more technical background to determining the temperature profile of each year is mentioned in Section 3, together with a variety of important caveats, additional observations, references and links that are integral to this article.
The temperature data and related articles arising from the Little Ice Age Thermometers project collected to date are here [link].
In 2011 I carried out a reconstruction that extended CET from 1659 to 1538 thereby incorporating another part of the epoch, in particular that cold part of the latter half of the 16th century made famous in Breughel’s paintings [link]. The calculations and numerous references relating to this article are here [link].
Here is the graph from ‘The Long Slow Thaw’ starting in 1538 which was updated to 2014 to show the recent uptick-this was said to be the warmest year in the record.
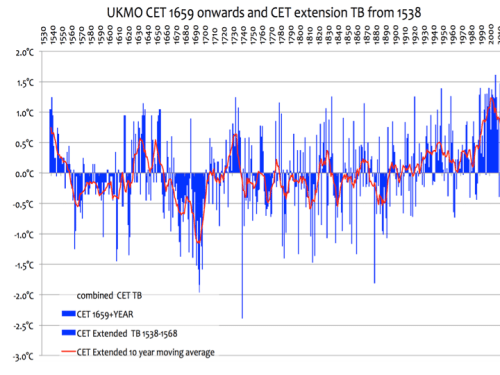
Figure 1-CET from 1538 to 2014
Additional CET data are shown in section 3.4 and 3.7.
Currently the author is extending CET through the 13th and 14th centuries in order to determine the apparent descent into the LIA during that time frame and eventually hopes to have a complete CET from 1086 to 1659, albeit from a slightly broader area and with decreasing levels of accuracy as we delve back in time. The earliest part of this timescale is especially prone to legends, superstitions and reliance on religious interpretations.
In carrying out the reconstruction from 1538 it should be noted that, as the normal temperature range within the British Isles is relatively narrow, anything ‘exceptional’ can often be unearthed from the numerous archives or academic material. At best, we can believe in the general direction of travel of the local instrumental record – but not on their accuracy to tenths of a degree. As Hubert Lamb noted regarding historical reconstructions, ‘we can understand the tendency but not the precision’ so looking at the direction of travel of temperatures is more profitable than expecting precision in the reconstruction to fractions of a degree.
With that overall context and as noted earlier, the purpose of this paper is to determine the extent and severity of each of the years in Central England from 1538 to the present day and then make observations on the findings. Looking at the overall temperature profile for a complete year, rather than merely examining exceptional winters, adds another perspective to our understanding of the period, so it is that criteria-the mean CET for each year- that have been used in order to try to define our understanding of the climate of Central England for the period. Individually severe winters are mentioned in 3.4 and 3.7.
To provide meaningful categorisation of temperature groupings, the point at which a year or a decade can be described as a genuinely cold LIA type occurrence needs to be defined, and in turn to assign other temperature profiles to the remaining years. This is detailed in section 3.1 and 3.3.
Briefly, the selected criteria are:
- up to and including 8.92C is a ‘Little Ice Age type’ cold year (LIA year) shown by a blue dot.
- from 8.93 to 9.019 is moderate; green dots
- from 9.20 to 9.78 is warm; orange dots
- above 9.79 is very warm; red dot
When the entire record to 1538 is examined in two different formats using
the data derived from these criteria, it looks as follows:
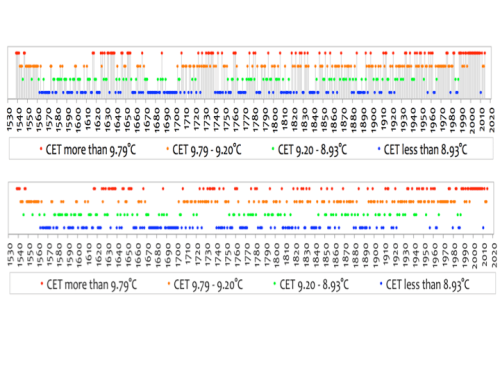 Figure 2 and Figure 3-Annual temperature profiles of extended CET
The parameters used to highlight years of varying degrees of warmth produces some surprises. The first is the sheer variability than can be observed in Figures 2 and 3, with the intermittent nature of genuinely cold years being juxtaposed in close proximity to years with a very different temperature profile. Other observations are discussed in Section 2, but any extended periods when the cold clearly predominated are rather limited, with 1670 to 1700 being the most notable. The early 1560’s to around 1625 also has a high proportion of cold years interrupted by warmer ones.
Are the data valid as being reasonably representative of CET and the wider UK climate over the years? Allowing for exaggeration and short memories by chroniclers, some 15 accounts of the changing climate and other references (see sections 3.5 and 3.10) seem to reinforce what our eyes are telling us. Professor Brian Fagan, writing in his book ‘The Little Ice Age,’ succinctly summarises the reality of the vagaries of the climate that can be observed:
“The little ice age of 1300 to about 1850 is part of a much longer sequence of short term changes from colder to warmer and back again which began millennia earlier. The harsh cold of the LIA winters live on in artistic masterpieces….(such as) Peter Breughel the elders ‘hunters in the snow’ (see Figure 9) painted during the first great winter of the LIA but there was much more to the LIA than freezing cold and it was framed by two distinctly warmer periods. A modern day European transported to the heights of the LIA would not find the climate very different even if winters were sometimes colder than today and summers very warm on occasion too. There was never a monolithic deep freeze rather a climatic see saw that swung constantly back and forwards in volatile and sometimes disastrous shifts. There were arctic winters, blazing summers, serious droughts, torrential rain years, often bountiful harvests and long periods of mild winters and warm summers. Cycles of excessive cold and unusual rainfall could last a decade a few years or just a single season. The pendulum of climate change rarely paused for more than a generation.”
So what is happening? Here are the four seasons from the Met Office data;
 Figure 4-CET seasonal showing decadal change
Cold winters in general -which can exhibit the greatest annual temperature range of any season-are becoming increasingly absent, as noted by the Dean of Brasenose College, Oxford-compiler of a major book on historic climate- in 1898:
“By 1708 the middle aged would say, where are our old winters?”
Other seasons have also warmed to a greater or lesser extent.
Eyeballing the graph in Figure 1, a rapidly warming trend from around 1700 can be observed. It rose from the nadir of the coldest LIA period around 1690 and came to a crashing halt with the winter of 1740 which heralded the coldest year in the series. This caused Phil Jones of CRU to write an article on the period in 2006 confirming:
‘The study, therefore, highlights how estimates of natural climatic variability in this region based on more recent data may not fully encompass the possible known range.’
(See section 3.5 for full reference)
The considerable natural variability that Dr Jones observed in 2006 can be clearly seen in all the charts and was graphically described by Professor Fagan above. Whilst it is easy to note the short term changes as the weather oscillates between very warm and very cold years, the longer term effect is not so easy to discern. People – especially farmers in this essentially agricultural age that typified much of the earlier record – are very much affected by harsh winters or hot summers. But what sort of overall climate did they experience through their lifetime? To enable longer term trends to be viewed that could help smooth out the short term ‘noise’ caused by the considerable annual and decadal variations, a different format is required. Accordingly a formula was devised by the author to note the real world impact of the changing climate on a person aged 70 years old. This reflected the cumulative temperatures experienced during a three score and ten lifespan, and which would account for any longer term climatic cycles that may exist.
The mean average of each year and each decade was calculated that assumed a succession of British ‘Everyman’ was born at the start of each decade in the record and who died on the last year of the decade 70 years later. The average temperature experienced during each 70 year lifetime is seen here.
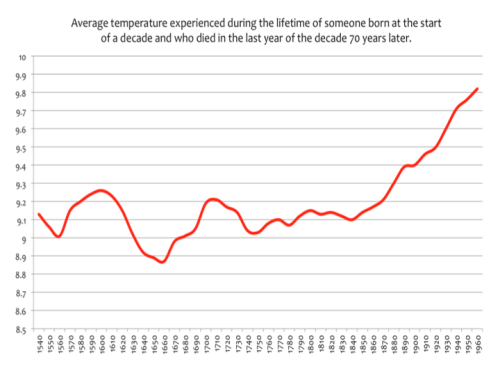 Figure 5-British Everyman of age 70
The low point can be clearly seen with someone born around 1660, who then experienced the worst few decades of the LIA. With some slight deviations a steady upwards trend can then be observed throughout the rest of the record. British Everyman has lived in an increasingly warming world for some 350 years. The criteria used are shown in section 3.4
There is one final set of graphics to be shown, two of which were shown previously as Figures 2 and 3. To these have been added for comparative purposes, data for sunspots and data for volcanic eruptions. Both of these are said to affect weather and to cool the climate. The very low sunspot counts occurred during the Sporer minimum, 1450 to 1550; Maunder Minimum , 1645 to 1715; Dalton Minimum, 1790 to 1820. The volcanos shown are those top 12 that had the greatest emissions according to an index called the VEI.
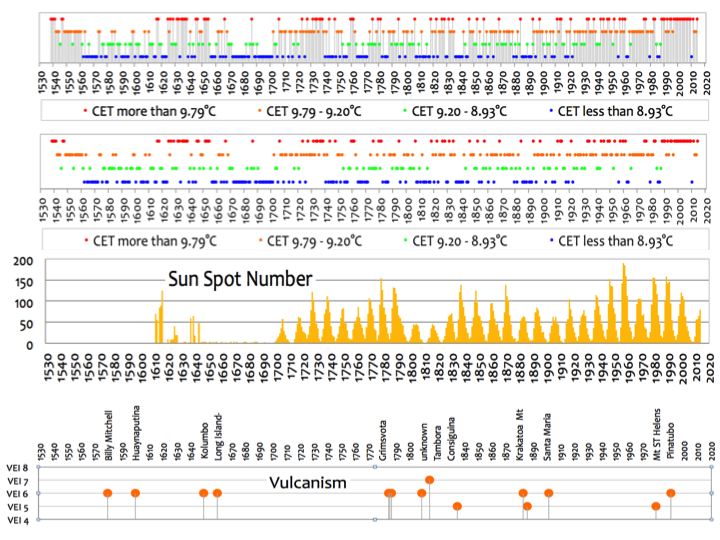
Figures 6, 7, 8 and 9
Further observations and comments regarding the four sets of data referenced above-including those on volcanos and sunspots, are made below in Section 2.
Section 2 Observations and comments
Some 70 % of the period from 1538 to the modern day could be classified as the LIA. Its intermittent nature perhaps better appreciated in scientific circles than in the popular imagination.
Whilst the various charts, such as Figures 6 and 7, together with Met office and other data referenced, demonstrate many individual cold years and more surprisingly perhaps, many warm ones as well, what can’t be discerned is one long uninterrupted block of blue representing very cold years extending from the beginning of the record and expiring sometime in the middle of the 19th century, thus matching the ‘official’ definitions of the LIA.
So clearly the period wasn’t one monolithic cold era. Indeed, this occurrence of warm and very warm years amongst the cold and moderate ones clearly confuses our popular understanding of this period. (See 3.9 for the scientific definition) Whilst the era might be characterised as generally cold with many moderate to very warm spells, it might also almost be characterised as generally warm with many moderate to very cold years.
Another notable feature is the sheer variability than can be observed in Figures 6 and 7, with the intermittent nature of genuinely cold years being juxtaposed in close proximity to years with a very different temperature profile. Any lengthy periods when the cold clearly predominated are rather limited.
A sporadic reduction of LIA type years from its low point in the 1690s can be discerned, but they still recur with some regularity for much of the record, even to the present day.
There is obvious warming in the reconstructed early part of the record, but as yet no analysis of available research material has yet been carried out to determine if this trend continues.
There is also obvious warming in recent years. Whilst the 30 year period from the early 1980s to today shows continued variation in the temperature profile, it is too short to determine if it may be indicative of a more permanent very warm trend that will be unique in the record.
The most consistently warm period appears to be the early 1920s to mid-1950s when for over 30 years no overall cold years were recorded (although there were some cold winters) this mildness is reflected in the Farmers quotes of the era referenced in Section 3.5.
Undoubtedly the period from the early 1920s to today in particular have shown a noticeable lessening in the frequency of cold years, although they have not disappeared entirely.
The British experience, as far as the available records go, seems to indicate that the LIA could be said to have finished as late as the early 1920s as far as cold years-if not very cold winters- are concerned. This seems a little far- fetched until literature such as this is examined from Bradley and Jones 1993 entitled ‘Little ice age summer temperature variations their nature and relevance to recent global warming trends’ whereby the authors state: ‘unusually warm conditions have prevailed since the 1920s probably related to a relative absence of major explosive volcanic eruptions and higher levels of greenhouse gases.’
In 2006 Jones confirmed that the very warm 1730s decade (see Section 3.5) indicated natural variability greater than at first realised.
The effect of sunspots on the climate is contentious. Looking at the data in Figure 8, it appears that the impact of the second half of the Sporer minimum on temperatures is difficult to discern. The Maunder minimum however appears to largely coincide with colder years, whilst the Dalton minimum is more mixed. However, there had been many cold years prior to the onset of these sunspot minimums and cold years returned after they had finished, so the relationship appears unproven and may be coincidental, where there is some correlation.
Moving on to the volcano data shown in Figure 9 – where impacts are as contentious as that of sunspots – it is said the massive 1258 eruption and a group of others a few decades later (outside the time scale of this article) helped to precipitate the LIA. Whilst there may appear to be some cause and effect with some of the volcanos listed, it is again by no means clear cut, as cold years often occurred prior to eruptions and returned when any effect of the sun screening emissions must have been washed out of the atmosphere. This is Hubert Lamb’s take on the matter, in the context of an appraisal of his work on the subject;
‘This painstaking work, using scientific reports from the well-documented eruption of Krakatoa in 1883, and also from Iceland, the Mediterranean, Alaska, Greenland, Kamchatka, and elsewhere, led to his thesis which developed an assessment of the world’s volcanic eruptions since 1500. His paper, ‘Volcanic dust in the atmosphere… A chronology and assessment of its meteorological significance’, was published by the Royal Society in 1970. And with its publication, the Lamb Dust Veil Index entered the scientific literature.
“My investigations had shown that beyond reasonable doubt that great volcanic eruptions do affect the weather and climate for several years afterwards, while suspended materials – not only the fine dust, but minute droplets and even gases – thrown up into the atmosphere by the blast are still present.”
The study showed that it was the greatest explosions in the low latitudes between about 30°N and 30°S that most regularly yield products that spread around the world, and that the most regular effect of such eruptions was a weakening of the strength of the global circulation. Whereas an eruption in the middle and high latitudes tended to strengthen the circulation in that hemisphere.”
This web site [link] describes the Smithsonian institute volcanism programme which provides details of eruptions throughout the world over thousands of years.
These larger eruptions as an explanation for the variable climate-at least in Britain- appear inconclusive, although undoubtedly those large volcanos with especially great amounts of sun veiling emissions can have a temporary effect on weather. The Laki eruption of 1783 (not listed) for example, is accompanied by a record in the Exeter Cathedral library (seen by the author) which describes the giving of alms to the poor due to the severity of the season.
It is perhaps the British Everyman (Figure 5) that is most intriguing. Despite heat-waves and extreme cold winters, hot years and cool ones, the British Everyman found the yearly effects of the weather over an entire life span of 70 years were translated into climatic swings and roundabouts, with few lifetimes overall being lived out in the cold spectrum. What is also intriguing is that whilst the low spot was that of someone born around 1660, over the next 350 years the trend has been inexorably upwards, which can be confirmed by also eyeballing the more conventional depiction of temperatures in Figure 1.
The data relate to complete calendar years rather than winters. Undoubtedly the severity and frequency of the very cold winters that allowed the famous ‘Thames frost fairs’ are getting less, which would impact on the overall average temperature, possibly helping to cause the long term temperature rise. See 3.7 for further references on severe winters. But this raises several questions, amongst them being; are less severe winters the main reason for the long term warming trend? What caused the severe winters and the severe Lia type years in the first place and what has caused them to diminish? Why was there so much warmth in between the cold years, in short why has climate been so variable?
Conclusions
By eventually comparing the era post 1538 to pre 1538 values back to around 1086, it should be possible to determine how ‘typical’ the climate over the last 500 years or so has been. It can also be determined whether we are now entering a new era typified by a climate substantially different to the past and one not merely reverting to some sort of ‘norm’ that many believe occurred during the MWP, Roman and Minoan period, when there were said to be centuries of mostly warm and settled weather. The present does not look so very different to other points of the period surveyed in this paper, with several notable periods of warmth and widespread heat-waves and droughts comparable to the modern era.
This leads us back to the theme of this paper which questions whether the LIA, as it is popularly-if not scientifically- characterised, is misunderstood and misnamed? The answer must be Yes. A prolonged era of rapidly changing temperatures with some notable periods of cold interspersed with some notably warm periods-neither of them especially extended- suggests the term LIA is a misnomer. (See 3.9 to see how the term was originally used in a scientific context). The climate variability from hot too cold with every variation in between throughout the record is noticeable, as is the rapidity with which these different climate states occur. As Brian Fagan noted:
‘The pendulum of climate change rarely paused for more than a Generation.’
The climate appears to be achieving some stability over the last century after the observable violent perturbations that punctuates the record. In trying to determine likely future behaviour we need to look to the past, and our mistaken popular notion of a monotonically cold period lasting 500 years does not help our understanding.
Bearing in mind the scientific definition of ‘The Little Ice Age (see 3.9) as having lasted some 4000 years, perhaps we need to determine if this period has as yet definitively ended and that can only be done with hindsight.
Section 3 Background information
This section contains technical information, explanations on the compilation of temperature profiles, historic temperature data, links, caveats and other information integral to the development of this article.
Although there is a great deal of instrumental, observational, academic and other records, trying to determine the relative cold or warmth of any CET year in the context of conferring on it the status of a genuinely cold ‘LIA type’ year that fulfils our understanding of this term, requires somewhat arbitrary calculations, so the criteria used to determine the various temperature profiles used in this article have been determined as follows;
The nadir of the LIA, according to CET and many academic studies, was the decade commencing 1690. Every year in it ranged from ‘very cold’ to ‘cold’ in terms of the temperatures we ‘usually’ expect in Britain, which normally has a temperate maritime climate. So this can be reasonably described as a LIA decade overall, with a decadal average of 8.107C.
The various years that comprised this decade -ranging from 8.92 to 7.25C- would all reasonably qualify as LIA years. There have been individually colder years in the record (lowest year was 6.84C in 1740) so these would also obviously fit the criteria as well. Now, even in Britain, anything above 8.92C would not be automatically thought of as a warm year, so the author has divided the data further as explained in 3.2
3.2 Criteria used for temperature groupings
The author anecdotally remembers half a dozen exceptionally cold winters and years, a number of years that were moderate and many that in British terms were overall warm or very warm, with the latter two groupings increasing over the last few decades. These were good for the garden and farming in general and sitting through an uncomfortably cool year recently, that played havoc with my garden, illustrated the differences in our perception of what may be comfortable and what isn’t.
So personal anecdotal experience can be joined to the actual Met office temperature record and other data, such as falls of snow, dates of birds nesting, dates of flowering of spring bulbs, onset of Autumn and harvest dates etc. In this context the chosen parameters can be seen as overall a reasonable representation of the changing climate through my lifetime, which criteria can then be usefully applied as a benchmark to the entire historic record to determine how the old compare to the modern.
The format enables us to highlight years that are ‘similar’ to each other by the use of colour coding and to make a distinction between the different climate states that lie within temperature parameters broad enough to overcome the problems of not knowing historic temperatures to fractions of a degree.
Definitions:
- up to and including 8.92C are an LIA year. (Blue dots)
- from 8.93 to 9.019 is ‘moderate’; green dots
- above 9.20 is ‘warm’; orange dots
- above 9.79 is ‘very warm’; red dots
3.3 It will be appreciated that mixing in all the seasons means that a cold winter might be negated by warmer than normal other seasons and might consequently be relegated to a status other than being a LIA year. In short, LIA type winters do not always translate to LIA type years.
However, looking at the overall temperature for a complete year rather than merely exceptional winters adds another perspective to our understanding of the period, so it is that criteria-the mean CET for each year- that have been used in order to try to define our understanding of the climate of Central England for the period.
3.4 LIA ‘Everyman’ criteria.
The monthly mean CET data from 1659 are here [link].
The estimated CET prior to this date (estimated CET temperatures calculated according to the formula used by Van Engelen, Buisman. And Unsen of the Royal Netherlands Meteorological Institute [link]):
- 1538 10.30C 1539 10.30C 1540 10.50C (would have been even hotter if it were not for the cold winter)
- 1541 10.20C 1542 9.70C 1543 9.50C 1544 9.50C 1545 9.20C 1546 10.00C 1547 9.90C 1548 9.50C
- 1549 9.50c 1550 9.50c 1551 9.40c 1552 9.51c 1553 9.50c 1554 9.00c 1555 9.40c 1556 9.60c
- 1557 9.40c 1558 9.70c 1559 9.40c 1560 9.30c 1561 9.00c 1562 8.80c 1563 9.30c 1564 8.00c
- 1565 8.30c 1566 9.20c 1567 8.80c 1568 8.80c 1569 8.70c 1570 8.60c 1571 8.80c 1572 8.50c
- 1573 9.50c 1574 9.40c 1575 8.90 1576 9.10c 1577 9.10c 1578 8.90c 1579 8.90c 1580 9.00c
- 1581 9.10c 1582 9.10c 1583 9.40c 1584 9.10c 1585 9.40c 1586 8.90c 1587 9.00c 1588 9.10c
- 1589 9.00c 1590 8.90c 1591 8.90c 1592 8.80c 1593 9.10c 1594 8.20c 1595 8.90c 1596 9.10c
- 1597 9.10c 1598 9.30c 1599 9.30c 1600 8.90c 1601 9.00c 1602 9.20c 1603 9.20c 1604 8.80c
- 1605 8.90c 1606 8.90c 1607 9.60c year was very warm until December. 1608 7.80c 1609 8.00c
- 1610 9.30c 1611 9.10c 1612 9.10c 1613 9.10c 1614 8.70c 1615 8.70c 1616 10.20c 1617 10.20c
- 1618 9.10c 1619 9.10c 1620 8.40c 1621 7.90c 1622 8.20c 1623 8.90c 1624 9.80c 1625 9.50c
- 1626 10.10c 1627 9.10c 1628 9.90c 1629 9.10c 1630 9.10c 1631 10.10c 1632 10.00c 1633 8.90c
- 1634 9.90c 1635 10.20c 1636 10.40c 1637 10.20c 1638 10.30c 1639 8.80c 1640 9.10c 1641 9.30c
- 1642 8.90c 1643 9.20c 1644 8.80c 1645 10.20c 1646 9.80c 1647 9.10c 1648 9.50c 1649 9.40c
- 1650 9.10c 1651 10.10c 1652 10.20c 1653 10.30c 1654 10.30c 1655 9.10c 1656 8.90c 1657 8.60c
- 1658 8.50c Note Instrumental record starts. Following for comparison purposes only 1659 8.83c
- 1660 9.08c 1661 9.75c 1662 9.50c 1663 8.58c 1664 9.33c 1665 8.25c 1666 9.83c
This is derived from my previous post Long Slow Thaw, with accompanying data and references [link].
Decadal averages to date and the average from 2010-2014 inclusive were used to calculate those born in the 1950 and 1960 decade.
3.5 Confirmation of cold and warm periods in date order
References cited below can be found [here].
Growing warmth is confirmed by Professor Dr C. Pfister the noted historian and geographer who identified Heat waves in 1525 and 1616 (authors note; roughly comparable to Europe 2003/2010)
In a paper ‘The year-long unprecedented European heat and drought of 1540 – a worst case’ in the journal Climatic Change an international group of 32 scientists shows that in 1540 Western Europe suffered a heat wave and ‘Megadrought’ that were broadly similar to the modern European heat waves of 2003 [link]
The compilation book ‘Climate since AD 1500’ edited by Phil Jones and incorporating work by a number of scientists, notes the warm periods around 1550 and 1630 and the cold intervals that separated them;
In this account from 1610 John Taylor, talking of the hills around him in Deeside Scotland, remarked that “the oldest men alive never saw but snow on the top of divers of these hills both in summer as in winter.” (From ‘The Little Ice Age’ by Brian Fagan)
A brief breakdown in the cold trend in Britain was observed in the diary entry of Samuel Pepys for January 1660/61-the year the Royal Society was established- when he wrote:
“It is strange what weather we have had all this winter; no cold at all; but the ways are dusty, and the flyes fly up and down, and the rose-bushes are full of leaves, such a time of the year as was never known in this world before here.”
That summers could still be hot was felt during 1666 when the UK had an extremely hot dry summer (brought on by a blocking high pressure system over Scandinavia). The hot dry North easterlies helped spread the devastating Great fire of London in 1666. The following winter, however was so cold that the great oak trees of the English Midlands split. (Humidity has a great part to play in temperatures)
The growing warmth of the early part of the 18th Century was noted here by Hubert Lamb on page 12 and 13 of his study ‘Climate present past and future’ [link]
“The remarkable turn of the climate of Europe towards greater warmth from soon after the beginning of the eighteenth century and affecting all seasons of the year in the 1730’s seems to have produced little comment at the time, though by then the temperatures were being observed with thermometers and entered into regularly maintained observation books in a number of places.”
The annals of Dumfermline Scotland from 1733/4, recorded that wheat was first grown in the district in 1733. Lamb wryly observes that was not correct, as enough wheat had been grown further north in the early 1500’s to sustain an export trade (before the 1560’s downturn).
This from a 2005 paper by Jones and Briffa [link] about the very warm period noted in old records and especially CET;
” The year 1740 is all the more remarkable given the anomalous warmth of the 1730s. This decade was the warmest in three of the long temperature series (CET, De Bilt and Uppsala) until the 1990’s occurred. The mildness of the decade is confirmed by the early ice break-up dates for Lake Malaren and Tallinn Harbour. The rapid warming in the CET record from the 1690s to the 1730s and then the extreme cold year of 1740 are examples of the magnitude of natural changes which can potentially be recorded in long series. Consideration of variability in these records from the early 19th century, therefore, may underestimate the range that is possible.”
That there was a gradual warming** of winter temperatures-the severity of which had substantially reduced the overall mean annual temperature during much of the earlier historic record- was noted by Reginald Jeffery in his book ‘Was it Wet or was it fine,’ written in 1898.
“By 1708 the middle aged would say where are our old winters?”
In their summary in Chapter 33 of their book ‘Climatic variations over the last 500 years’ P D Jones and R S Bradley in talking of regional evidence for Europe note; ‘from the evidence presented –in the book- the climate since 1500 has varied between extremely warm and extremely cool decades.
’…from warm temperatures during some decades of the early 16th century conditions began to gradually cool during the second half of the century. ‘Only a few short cool episodes lasting sometimes up to 30 years appear to have been synchronous on the Hemispheric and global scale. These are the decades of the 1590-1610’, the 1690-1710’s, the 1800-1810’s and the 1880’s to 1900. Synchronous warm periods are less evident although the 1650’s, 1730’s, 1820’s, the 1930’s and 1940’s appear to be the most important.
A farmer from Buchan in North East Scotland, one of the snowiest parts of lowland Britain, wrote in the agricultural section of the local newspaper during the exceptionally mild winter of 1933/34.
“1934 has opened true to the modern tradition of open, snowless winters. The long ago winters are no precedent for our modern samples. During the last decade, during several Januarys the lark has heralded spring up in the lift from the middle to the end of the month. Not full-fledged songs but preliminary bars in an effort to adapt to our climatic change.”
It then goes on to say:
“It is unwise to assume that the modern winters have displaced the old indefinitely” and also “Our modern winters have induced an altered agricultural regime,”
3.6 Putting the present into context with the geologic past.
See also this article by Ian Plimer The Past is Key to the Present: Greenhouse and Icehouse Over Time.
3.7 Many papers and books have been written about some of the extreme winters of the past and the famous Thames Frost fairs. As Mann and Jones mention when quoting Lamb 1977 in their own 2004 paper ‘Climate over the past millennia’ there were only 22 frost fairs on the Thames recorded between 1408 and 1814. Whilst not definitive, as river conditions prior to and post this date may have precluded some frost fairs even if the weather was suitable, it can be seen that the actual number recorded over some 400 years was relatively small
The following is an account of the frozen Thames and great frosts: [link]
Below is the Met office data showing the status of mean CET years from 1659 in a ranking from coldest to warmest, that would be reflected in FIgure 1 above [link].
3.8 Does CET have wider relevance to other parts of the world?
My article ‘The Long Slow thaw’ explored this in Section 6 entitled “Can CET represent a wider geographic area and establish the existence of a Hemispheric ally significant cooling period?” [link]
The Met office, KNMI, Mike Hulme, Hubert Lamb and Mike Lockwood were amongst those believing CET had a wider significance as a reasonable (but not infallible) temperature proxy that might reflect European Wide, Northern Hemisphere or even some sort of Global proxy. However, it is not the intention of this paper to claim that its findings and observations are relevant to any region other than Britain, although this is obviously a topic that warrants further examination at some point.
3.9 How the phrase ‘Little Ice Age’ came about
In 1940 Francis Matthes wrote in a report of a Committee on glaciers that; ‘glacier oscillation of the last few centuries have been among the greatest that have occurred during the last 4000 years perhaps…the greatest since the end of the Pleistocene ice age.’ The previous year Matthes had written in a survey on behalf of a Committee on Glaciers for the American Geophysical Union ‘we are living in an epoch of renewed but moderate glaciation ‘a little ice age’ that already has lasted about 4000 years’. Both quotes are from the book, ‘The Little Ice Age’ by Brian Fagan.
3.9 Volcanos The dates, names and VEI of the most active Volcanos used in figure 9 are shown here in tabular form;
Name VEI Year
Pinatubo 6 1991
Mt ST Helens 5 1980
Novarupta 6 1912
Santa Maria 6 1902
Mt Tarawera 5 1886
Krakatoa 6 1883
Consiguina 5 1835
Tambora 7 1815
Source Unknown 6? 1809
Grimsvota 6 1783-85
Long Island- PNGuinea 6 1660
Kolumbo (Santorini) 6 1650
Huaynaputina 6 1600
Billy Mitchell 6 1580
3.10 The references used in this article were detailed in Section 4 onwards from [link] and [link].
A number of very hot summers interrupt the multi-century period often termed the LIA, but some scientists note that an average approximate 96-year cycle characterized much of the period. This was in contrast to the shorter cycles that dominated the preceding MWP and subsequent modern warm period. Tree-ring proxies and marine deposits of g. bulloides note that cyclic behavior in the North Atlantic and there appears to be some similarity between the CET record extension and proxy data from the same basin (N Atlantic). This is explored in Gray et al 2004. “A tree-ring based reconstruction of the Atlantic Multidecadal Oscillation since 1567 A.D.”
JC note: As with all guest posts, keep your comments relevant and civil.

TonyB,
Thanks you. Looks really interesting. I’ll come back after I’ve completed my submission to the Australian Senate Select Committee into Wind Turbines. I expect my submission will bring an end to wind power in Australia and to the (mandatory) Renewable Energy Targets. :)
We wish you all the luck in the world, Peter. Take those things Down!
Why? If they are cost effective to the owner?
Rob Starkey – do you think benefitting the “owner” is sufficient reason to not oppose wind? What if it only does so to the dis benefit of non voluntary forced participants? I think that is Peter’s concern. (Please excuse me if this post is out of place. I am overseas and the browser alignmeny looks very sketchy)
I think the government should start writing me checks. I will say things like “all who voted for it are blessed angels sent to save the Earth” and other like nonsense.
It will be “cost effective” for me and serve the same purpose as the eco crucifixes that blight the landscape so many places.
THx, Tony.
I like the graphs backing up yr claims and conclusions of
natural variability even in the LIA. I especially like Figure 5,
‘Average temperatures experienced during the life-time of
someone born at the start of a decade and dying in the last
year of a decade 70 years later.’
When the Hockey Stick, with its lack of natural variation was accepted as actual bedrock science, the warmies set themselves up to be blind-sided by the pause.
This is great work, and urgent work. A reader may take certain details and interpretations with a grain of salt, but so too does the author.
The CET does not have to represent much more than a certain geographical area to be of enormous interest. However, it suggests lots about climate further afield, and a prudent suggestion is valuable without specifics that aren’t available.
From the CET and from the work of Lamb and now Brown we are reminded that few if any things climatic are new, and that stability is not to be found in the climate of any era. Anyone shocked that enormous blizzards in the US should be counter-balanced by intense summer cyclones in Australia in 2015 needs to be told about 1899, just for starters. Queensland’s cyclone Mahina with its phenomenal wave surge was separated by days from the Great Blizzard, which reached well into Florida. Not worth knowing lots about?
Those who say we can’t draw conclusions from scraps of knowledge about past climate might well be right. But if drawing conclusions about the result of a game is silly after five minutes, it’s a lot sillier to be drawing conclusions immediately after the starting whistle, regardless of how informed you think you are.
So bravo, tonyb.
Mosomoso
The extent of climate variability during the period surprised me as did the juxtaposition of warm and cold years. Climate is not a constant.
Why climate keeps changing is beyond the scope of this paper although sunspots and volcanos seem unsatisfactory as any sort of definitive answer.
I am most fascinated by the periods of warmth within the LIA and in particular the long slow recovery noted from 1660.
tonyb
Tony: You should be aware that according to this paper (pg 317), the HadCET record includes “noninstrumental weather diaries.”
http://www.metoffice.gov.uk/hadobs/hadcet/Parker_etalIJOC1992_dailyCET.pdf
And from 1723-1760s, observations were taken in unheated rooms, not true outdoor settings, and that no daily series can begin “before about 1770.”
They were adjusting temperatures even back then!
David
Please follow my links. In a previous article I wrote at great length about the nature of the CET record from 1659. I also met David Parker at the Met Office last year who created the 1772 record.
Camuffo and Jones did a lot of work for the EU funded ‘Improve’ project.in interpreting temperature records that were taken in all sorts of places from unheated rooms to balconies. That is why I think the records should be taken as an indication of the direction of travel and not as a precise measurement
Personally I think that taking instrumental and other records, crop, observational, first snow etc is a good way of getting to know the evolution of climates.
tonyb
I’m sure the Camuffo and Jones adjustments are transparent, documented, and available. Say it’s so, Tony.
=================
kim
the outcome is a 500 page book which I have ploughed through twice so you don’t have to;. all the methodology is there.
http://www.isac.cnr.it/~microcl/climatologia/improveb.php
tonyb
Cui bono, or is it science? I trust your opinion.
A problem, from my point of view, is that Phil Jones is a man who knows better than he has said. As you point out, he is capable of good science, and as I point out, he is capable of shame. So far he’s been so paralyzed with shame as to be unable to bestir himself to actions required to remove the cause.
===================
“That is why I think the records should be taken as an indication of the direction of travel and not as a precise measurement”
direction of travel is metric.
to say something scientific and falsifiable about it, you have to assign a number.
to assign a number to it, you must use the best estimates of the individual data points.
there is no way to get away from of problem of individual measurements.
saying the word “tendency” doesnt help, unless you define what you mean by tendency, how you determine it, and how you test whether you claim is true or not.
“The CET does not have to represent much more than a certain geographical area to be of enormous interest.”
How so? CET is taken at a single point on the planet’s surface. What does that say about all the other points?
“However, it suggests lots about climate further afield.”
How can one point’s data say something about climate further afield? Have you discovered some new theorems about the way climate works, that one surface point provides information about temperature elsewhere?
CET correlation reflects the Northern Hemisphere’s and ultimately the global changes
http://www.vukcevic.talktalk.net/CET1690-1960b.gif
Simple answer: CET is not a point for data but the blurred but still useful portrait of a place during a long period. It has significance as such. It does say something, just not everything. It suggests much, especially when we line it up against eg the MIng record. It is a valuable and suggestive portrait though it can only suggest. And it is rare. Better a curl of smoke to indicate a fire than clear air.
If that is not acceptable to you as a study or pursuit, fine. That I can understand, since there are great weather differences right now between England and other parts of the NH. England cannot stand alone as exact proxy for wider areas, or even areas of the Isles beyond CET.
Fine to ignore if you insist on absolute precision. So long as you then say nothing on the subject of climate or you discover numerous satellite and Stevenson screen thermometer records going back through the LIA. Those records will need to be even better and more numerous than what we have had since 1980. Then we can ditch some, but by no means all, of the CET
The CET is what it is, a long, interesting, inexact portrait of a place and its weather. If that place could somehow have been climatically insulated from the rest of its world for a millennium, let us know. The CET will still have value for its part of England, and you will still be in no position to comment on the subject of climate. Because there are no short climates, and even CET is just a glimpse.
“How can one point’s data say something about climate further afield? Have you discovered some new theorems about the way climate works, that one surface point provides information about temperature elsewhere?”
Exactly the argument against surface station data homogenization.
“How can one point’s data say something about climate further afield?”
Unless it’s a single tree – YADO61 – on a remote Siberian peninsula, then it can be used as a proxy for the whole World.
After ‘hiding the decline’, naturally.
Right, David?
Using today’s theorems it should reflect at least 1200km in all directions.
David,
The same way people can say 2014 was the hottest year on record globally without having records for large segments of the global.
> CET is taken at a single point on the planet’s surface. What does that say about all the other points?
I thought it was a triangle between Lancashire, London, and Bristol:
http://www.metoffice.gov.uk/hadobs/hadcet/
Then CET would require at least three points, right?
“How can one point’s data say something about climate further afield?”
I assume you can point me towards somewhere that you made that point about Mann et al’s “Teleconnection” of a selected few trees in a small part of the USA, being representative of the entire globe’s climate at that time?
No?
On yer bike lad.
I have a completely different interpretation of Figure 5. I would say you could draw a horizontal line up to 1850 with equal amounts of warm and cold periods on either side, but after 1850, that no longer applies. Clearly a shift into a rising regime occurred after 1850.
JImd
The rising regime clearly began much earlier than 1850 but if we take your observation for the sake of argument, are you in effect saying the tiny amounts of additional co2 from that time stopped the most persistent LIA periods?
If we affected temperatures so drastically even from 1850 no amount of mitigation now will work as there is no way we can ever get back to 1850 levels of co2 emissions.
tonyb
Tony, we (most of us) realize that CO2 couldn’t have kicked in until after about 1950 – but I understand that the air in England got very dirty with the industrial revolution. Are effects of this particulate discernible in the record?
Sure we can, Tony. Just need to go back to
the stone age. Wood fires are “green”, don’t-cha-know? :)
Jim D: I would say you could draw a horizontal line up to 1850 with equal amounts of warm and cold periods on either side, but after 1850, that no longer applies. Clearly a shift into a rising regime occurred after 1850.
That is supported as well by the results of Kelly and O’Grada that I reference below. They use a “change-point algorithm” (details in the paper), and the only change-points that they identify are near the end of the 19th century (not exactly the same year for each series of data.)
JimD,
Are you saying you’re skeptical?
Jim D.
see my cluster analysis. basically the same thing.
cold years ( 6.8C to 8.3) vanish after 1900 and over 80% of them happen before 1850.
I imagine if I took Tony’s whole series that the analysis would move this
date back or slightly change the clustering.
another way to look at it is with Hot years ( 9.97-10.95)
there are 49 hot years.
in the 200 years prior to 1850 there were roughly 25% of the total
and in last 20 years 25% of the total..
lastly geography cant be ignored when looking at England and assessing variability.
Looks like much the same ol’ same ol’ climate see-saw
to me. Down it goes in 1880, up it goes in 1990, lots
of jiggles in between – and down again since.
https://curryja.files.wordpress.com/2015/02/slide1.png
What are are supposed to learn about climate change from just HadCET?
By the way, over its entire record HadCET shows 0.94 C of warming (slope*interval).
What you might learn is that climate actually changes. Just as sea levels began rising after the 1700s, just as Arctic ice shrunk radically then expanded substantially over the 19th century, so temps rose overall after 1850. Climate change. Not worth knowing about?
Or is something else meant by the common English term “climate change”. Those who have hijacked the term want it for their own exclusive use? We’ll have to take it from their cold, dead hands?
mosomomo: Where is the data supporting your claims? (I’m interested, really.) Links please.
For Arctic ice in the 19th century check out Banks and RS (oft quoted) on the post Napoleonic melt. For ice increase, check the expeditionary and whaling logs/reports subsequent to Napoleonic period, they’re all over the net. Much of this is in Tony Brown articles.
For sea levels, I’m assuming you’d know Jevrjeva etc. It’s hardly obscure stuff. But also check the records of many old gauges, some affected by glacial rebound, subsidence and other distorting influences, but all interesting. Very available on the net these days. Messy affair, but one gets a picture. When you consider how high and low sea levels have gone in the last twelve thousand years, it’s surprising how sluggish this rise has been.
For temps? You’re skilled in finding rising temps, just look back a bit further. I’m pretty sure most places put on a degree or two post 1850. I’m not certain, however, since we’ve had brutal temp extremes in Oz since they first hoisted a Union Jack at Sydney Cove. And we have had Stevenson screens for a lot longer than certain climate mullahs would like to acknowledge. On the whole, though, I think things have warmed in one line or cycle since 1850, and maybe in another line or cycle since 1980. Judging from the 1970s cooling fuss, I’d say that’s just as well.
“What are are supposed to learn about climate change from just HadCET?”
Do you think we should stick to
computer gamesclimate models, David?I mean, that’s what you “real” climate scientists get your “data” from, isn’t that so?
> Do you think we should stick to computer games climate models, David?
http://geosci.uchicago.edu/~archer/cartoons/climate-models-vs-skeptic-models-small.png
Yes, alas, models are an easy target these days, but still, what a handy future excuse.
=============
Heh, willard, your model boxer has gone 15 rounds, exhausted himself, and been decisioned by an opponent who isn’t even there. And he coulda been a contenduh.
=========
Ah, models are a weapon, not a failed attempt to understand.
Have you noticed the stadium, Koldie? Wave with it.
What I noticed was that it was both falsifiable and falsifiable in a relatively short term. What can you tell me about the term?
==============================
Well put Kim. The implications of the cartoon are quite striking and it is telling that the creator labelled it “the scientific debate” on climate change. It seems to say stick with the first/only explanation and only a rube would question it. In time past similar cartoons could defend the beleif in a charioteer explaing the travels of the sun, special creation for the complexity of life, phlogiston theory, demon possession… I was thinking scientific process of theory building placed great importance on challenging the evidence supporting existing theories as part of a prequel to proposing new theories. But this carton seems to support a form of “science” where the reigning champion dogma should go unquestioned until perhaps an opponent arises ex nihlo.
Oh, but I love the cloud reference. Out of it comes an angry bee, stinging anaphylactically.
===============
Thinking about it, it is worse than I put it. It s ludicrous to suggest you can develope a method of roughly accounting for the past that provides specifics for the future and everyone should keep their mouth shut unless they have a competing model that explains the past and accounts for the future. No competing model is needed for crackpot theories (homeopathy, astrology for example). You just say “we don’t know and your illumination is false and unhelpful as it does not square with demonstrated evidence”.
Nine of what I’m saying is meant to be a criticism of any particulars of climate science, but rather of the self appointed defenders of climate alarmism who are attacking the basics of the scientific approach in order to enshrine a set of dogmas. At best if they are correct, their methods may help a battle, but long term they weaken science and progress. While they despise any rain on their parade, if you banish the clouds things will soon be unbearable.
> It is ludicrous to suggest you can develope a method of roughly accounting for the past that provides specifics for the future and everyone should keep their mouth shut unless they have a competing model that explains the past and accounts for the future.
If this is ludicrous, chances are this is not what it is being suggested.
The crowd is not silent. The ring seems available to anyone who’d like to present better methods, better data, better theories. In science, the best explanation wins.
AGW is the 800 pound gorilla to beat. Adjectives planning engineers may wish to hurl won’t change that fact.
When will Willard wonder well. The opponent neither Willard nor the cartoonist can see is named by Willard himself: ‘better data, better methods, better theory. The punch drunk look in Willard’s boxer’s eyes shows that his champion has met his match.
The problem, Willard, is that the models have blown a tame monkey AGW up into the size of an 800 lb gorilla CAGW. And then the gorilla entered it into the ring against puny observations. Heh, observations didn’t have to land a blow, the model boxer flailed the air with haymakers, landing heavily only on the children.
One for the Boxing Commission. They’ve got to put on a better show or the participants will go watch clouds.
==================
Don’t confuse the AGW gorilla with the CAGW straw man Denizens burn on every thread, Koldie.
If the moon is made of cheese, the truth is out there.
Willard, the models have failed. What intrigues me is the cartoonist’s mention of clouds. That is either magnificent unintentional irony, or he’s slipped a fast one over on you.
===================
Wow! Looks like kim’s metaphor meter got pinned at 11.
==> “landing heavily only on the children.”
Think of the children. For God’s sake, think of the children.
It’s highly amusing that Willard thought that was a killer cartoon. The cartoonist has, probably accidently, created a marvel. It can be interpreted by the easily persuaded alarmist wannabe to be a snide and telling putdown of the skeptics. It can be interpreted by the skeptic as exemplary of the ignorance and credulousness of the alarmists.
======================
I’m just thankful that someone like you is there to think of the children, kim.
dagnabbit –
Pick one of Josh’s cartoons. Any one. At random
It’s a cartoon, kim. A caricature. But your concern is duly noted.
Thank the man/woman for his/her concerns, willard.
Heh, nice structure, eh, J? For reasons that seem completely unfathomable to you, your equivalence fails. I’ll just leave it at that.
========================
Yeah, well, kim –
If only I had you insight, wisdom, intelligence, compassion, knowledge, and good looks, I’d be able to see the “failure.”
That’s’ why I’m so thankful that there’s folks like you around. You know, for the sake of the children.
You are welcome, even though snide.
==============
> What intrigues me is the cartoonist’s mention of clouds.
Either he knows you, Koldie, or he knows about Mr. T’s pick-up lines.
Or maybe he just knows about climate modelling.
actually its not the same.
the annual standard deviation in monthly temperatures is decreasing.
in a statistically significant way ( 99%).
the annual range ( hottest-coolest month) is also decreasing
Please provide evidence/references for your assertion. Raw? Adjusted? Adjusted by whom, BEST with regional expectations that ( per a previous comment of yours on a previous thread) are designed to reduce field expection error, not reproduce actual local temperatures? So you assert here your algorithm is working as designed to reduce regional variation. Except that isn’t right either (by your own previous rebuttal to my comments on BEST station 166900) simce does not produce an actual temperature anywhere. So which is it? This comment is wrong, or your previous theead comment was wrong? And that darned internet thingy allows all denizens to go find and check both for themselves. And those darned backed up hard drive thingys allows snapshots of both.
Rud.
The chart she posted.
The data it uses.
“So you assert here your algorithm is working as designed to reduce regional variation. ”
HUH, not even talking about Berkely
talking about the chart she posted.
chart she posted and the underlying data.
It is not “same ole same ole”
read tonys text again and try to follow
Models? We don’t need no stinkin’ models!
http://coetail.com/gotanda/files/2013/12/stinking-badges-e1351004026154.jpg
“British Everyman has lived in an increasingly warming world for some 350 years”
Surely not. It looks from the chart as if he lived in a world whose temperature fluctuated about a very similar level up to about 1950. Thereafter he lived in a rapidly warming world.
Isn’t that what the chart shows?
So you don’t think that the approximately 2 degree C rise in Temperature between 1690 and 1700 (10 years) is more rapid warming than 1.5 degrees in 65 years then?
Or add on another 30 years to 1730 for a total rise of 3.25 degrees in 40 years?
A C Osborn
Well, it was a rise sufficient enough to have impressed Phil Jones to write an article about the period, even if it doesn’t impress MIchel. Hubert Lamb wrote about it as well.
tonyb
Hi Mr. Osborn
CET as many other areas has large inter-annual variations comparable to the averaged multi-decadal rises you mentioned (see Link1)
However, looking at the longer term changes (if you assume that temperatures are not entirely random) the CET’s summer and winter temperatures often run in cycles out of phase, with spring and autumn more or less a direct transition between the two. Thus, neither winter nor summer is a good representative of the annual trends while the spring temperature, with very minor exceptions, is an almost perfect match for the annual trend. When the summer and winter cycles get in phase strong short term rise or fall does occur, and one could say that the ‘history is repeating itself’ see Link2)
From Fig. 1, it looks like temperatures were nearly as high
as today in 1540, 1640, 1740, …., 1940, etc. And they are being
measured differently than 500 years ago so big error bars.
BillW
Yes, I was surprised by the extent of past warmth. A decade ago I assumed that the modern warm period was bound to be much warmer than the last 700 years or so as the comparison was being made with what is termed the LIA.
The 1340s also seemed warm although I have yet to finish the analysis of the decades surrounding it.
tonyb
“Isn’t that what the chart shows?”
Michael, it depends on how you tilt your head. How far are you tilting your head and in which direction?
I believe the evidence suggest the LIA started around 1200 and lasted longer than 500 years.
The following is a link to a paper that has a reference to Koch’s “East Greenland Ice”, Copenhagen, 1945. Source: Lamb, H. H. Climate, History and the Modern World, 2nd ed. Routledge, 1995, 433 p.
http://www.geoscience-environment.com/lia/report1.pdf
See also: Alley, R.B. and Ágústsdóttir, A.M., Fawcett, P. J. Ice-Core Evidence of Late Holocene Reduction in North Atlantic Ocean Heat Transport, in Mechanisms of Global climate Change at Millennial Time Scales, Geophysical Monograph 112, Peter U. Clark, Robert S. Webb, and Lloyd D. Keigwin, eds. American Geophysical Union, Washington, 1999, 394 p.
Frederick
As mentioned in the article I was startled to see that an interpretation could be that the LIA ended in the early 1920’s (Or perhaps we are still in it if you take Matthes interpretation)
There was certainly an extended period when the cold periods were most prevalent . At both ends of the record and in the middle the warmer periods are noticeable. I would like to see an explanation for the rapid climate oscillations and for the relatively stable periods of either cold or warmth that we can observe throughout the record.
tonyb
The article is an important contribution in understanding past and consequently current climate change. Natural variability underpins multi-decadal variability including temperature rise in the recent decades
http://www.vukcevic.talktalk.net/CET1690-1960a.gif
Correlation with the northern Hemisphere’s and global temperature changes since 1880s should not be ignored.
http://www.vukcevic.talktalk.net/CET1690-1960.htm
———
David Appell : What are are supposed to learn about climate change from just HadCET?
Far more than from all the climate models combined.
vuk
We are aware of heat-waves in the record around as warm as the modern ones of 2003, for example. We are also aware of periods of cold much more intense than today. So we have a temperature high point and a temperature low point which suggests the known limits of climate variability in the period surveyed, which to date we haven’t exceeded in the modern era.
Phil Jones accepted this I think with his 2006 work.
tonyb
Give that man a cigar.
Tonyb,
Your charts give a very good picture of the “noise” that makes it so hard to measure the “average” climate. Thanks.
The variability surprises me very little though. In fact I can (almost) describe our weather here in central Europe as basically two conditions, East and West.
When it comes from the West it means:
In Winter -> mild and damp, sometimes stormy
In Summer -> chilly and damp, hard to plan a picnic.
From the East means:
Winter -> clear, dry and icy cold
Summer -> clear, dry, hot. Barbecue every evening! (2003 is still referred to here as the “Super Sommer”)
When it flips from one to the other we get nasty storms.
Some years one or the other condition dominates, other summers or winters are half and half and sometimes it goes back and forth weekly. In order to really understand the LIA you would almost have to break it down on a monthly basis.
It all depends on how the high and lo pressure systems develop. I’m sure others can explain that much better. It would be interesting to know why one or the other type of system dominates during particular periods of time.
One thing is fer sure though; Those cold years were tough on the serfs!
Ken
There is a very interesting book by Kington of CRU whereby he describes the characteristics of each decade for the last few hundred years. It is noticeable how certain conditions, such as storminess, drought, heat etc can dominate for years at a time, then be replaced by another climate state.
As regards ‘average’ I think we try too hard to see this non existent condition at the expense of the numerous nuances that represent the local and regional variations.
tonyb
Absolutely, tonyb. I’m often reminded of this:
http://36.media.tumblr.com/tumblr_lse4sluYiV1qfvq9bo1_1280.jpg
KW . Tough on serfs – yes. Let them eat gruel. (
It is mostly due to the Arctic jet stream meandering, which in turn responds to what is going on in the upper levels of the atmosphere. One major factor that appears to have effect is a less known aspect the solar activity, not so much the sunspots but the ‘geomagnetic storms’. Current N.E. American cold weather spell may be a good example.
above is a reply to : KenW | February 20, 2015 at 4:22 am |
Tony,
My congratulations on a most thoroughly researched and accessibly written paper. There is a such a lot in it, and of course it builds on your fine work over the past few years. As a quondam historian I like the way that historical records can tell us about what it was like to live in a particular time. Thomas Turner’s Diary of an English Shopkeeper has lots of references to the weather, hot, cold, dry, wet. In an age when food was often scarce (see Turner again), the state of the weather was important to everyone, something that people today forget, given that we are so insulated from it.
Again, a great piece of work!
Thank you Tony for a very informative paper. This work should intregal part of any discussion about the long term global temperatures.
I am curious about the sources you will be relying on as you work back to 1086. Do you have a sense of the nature of the sources and do you expect them to change the further back you go in any significant way?
Thanks.
nottawa rafter
I am currently working on reconstructing the 13th and 14th century. During this period there are many good references from diaries to manorial rolls and also science papers, as the era is supposed to herald the descent into the LIA.
Many have ploughed this furrow before me, such as Lamb and Groves so there is quite a bit of material, although historical climatology is an unfashionable branch of climate science these days. The 15th century seems to have far fewer references and is more of a closed book to me.
1086 is the lower limit as the Domesday book has many references to the size of farms and what they grow, such as those on nearby upland Dartmoor which are still visible to this day and can be tied in with crop records and tree lines.
Undoubtedly the earlier stuff in particular can be riven with religious connotations and whilst interesting some must be completely discounted although others can be tied in with references from other sources. For instance extreme weather on the coast is often observed by a number of interested parties from sailors to parish clerks.
tonyb.
At least the Great Survey was up front, it was about taxing the people and their labors. It was the last word on things.
http://en.wikipedia.org/wiki/Domesday_Book
It has been about a thousand years now, how many pages have been torn out or redacted? It looks like they took Xmas very seriously, back in the old days.
So, tony, was Laura Lyons mother to Miss Marple?
Heh, gotcha, A. V.
==============
Upon review, you got me. Your comment is not the least bit cryptic, though the record’s from a hallowed crypt.
=========================
TonyB, please let me join in the general appreciation and praise of your outstanding and dedicated work, and also your exemplary commitment to public discourse that is reasoned and civil! Truly you are becoming a “Level 1+2” figure in climate-science public dialogue!
Good on `yah, Tony Brown!
Tide-gauge analysis supports your finding of a warming trend, as shown in the recent work of Carling Hay, who is another young candidate for a “Level 1” scientists transitioning to a “Level 2” public spokesman.
http://static.hwpi.harvard.edu/files/styles/profile_full/public/eps/files/hay.jpg
Her recent article Probabilistic reanalysis of twentieth-century sea-level rise boils down to this simple idea:
• Many tide gauges are contaminated by linear trends (glacial rebound, for example).
• Sea-level linear trends drop out when we examine sea-level rise-rate acceleration; thus the effects of climate-change are seen more clearly.
http://www.realclimate.org/images//haysl13.jpg
These analysis methods are robust and mutually consistent, eh Climate Etc readers?
Good on `yah, “Level 1+2” scientists like Tony Brown and Carling Hay!
The global sea ice extent is at the 30-year average. Nature must be contaminated by a trendless trend.
TRENDS
• Northern Sea-Ice Declining relentlessly.
http://nsidc.org/arcticseaicenews/files/2015/02/figure-3.png
• Southern and Greenland Ice-Sheets Sliding relentlessly.
http://www.skepticalscience.com/pics/icesheetGRACE.png
• Meltwater “lid” on Southern Oceans Strengthening ceaselessly.
Summary Neither sea-level nor ice-mass support rational climate-change skepticism.
The accelerating demise of rational climate-change skepticism is evident nowadays to *EVERYONE* — young scientists especially — eh Climate Etc readers?
http://www.cejournal.net/wp-content/uploads/2009/03/arc_antarc_1979_2007.gif?w=600
In fact, across the globe, there are about one million square kilometres more sea ice than 35 years ago, which is when satellite measurements began.
~DailyMail (re, Antarctic sea ice hits new record)
FOMBS picks another basket of cherries.
Fan
Don’t you know how the game is played? In a couple of years, the study by Ms Hays , et al will be superceded by some other superstars of the week and the new heroes will trash her work and find that it is worse than we thought. Why publish if you can’t end with that obligatory and headline grabber.
I thought you would have caught on by now.
Tide gauge measurements are understandably noisy at about 2mm/year.
Satellite measurements are remarkably linear at about 3mm/year.
Ground water use alone can account for the difference.
There may be real problems in this world but I don’t think a few inches in a century of sea level rise is one.
Fan
Thanks for your kind comments. I don’t mind being compared with young scientist Carling Hay at all.
tonyb
TonyB, please let me say that plenty of folks (including me) appreciate the blend of good science and good collegiality that you and Carling Hay *BOTH* practice so excellently!
FOMD,
Dr. Brown kindly has documented history. Hay changed it.
Big difference.
FOMD,
And changed history without consideration of this: ” This especially applies to interpretation of acceleration in GMSL using only the 20-year record of from satellite altimetry and to evaluations of short records of mean sea level from individual gauges.”
http://onlinelibrary.wiley.com/doi/10.1029/2012GL052885/full
This is an absurd argument. One line of evidence disagreed with history, and a very spotty history that was written down by people who had a poor understanding of geology.
JCH,
Detail please?
The paper referenced shows a 60 sea level cycle and suggests that any evaluation of SLR focused on a short term 20 year satellite based evaluation should include consideration for that cycle. I don’t see where Hay has taken that into account. And Hay changed history (lowering 90 years worth) to get their results showing an increasing (accelerating) SLR. Even IPCC “AR5 appears inconclusive w/r/t expectations of extreme SLR but indicates as NOAA does that SLR has increased since at least 1850. (pp 285-291)”
I appreciate your feedback, but not with some broad sweeping commentary lacking in detail.
Once again, TonyB has documented history, the paper I cited shows a 60 year sea level cycle (historic), and Hay changed it.
Danny – since there most likely is no cyclic physical sense to 60-year ocean cycles, I do not see how anybody can account for them. I do not believe in them anymore than I would believe in tea leaves.
JCH,
You sound skeptical! Did you read the paper? (C&W show one)
I’m not banking on the 60 year cycle, but cannot refute. Please note the citations page: http://onlinelibrary.wiley.com/doi/10.1029/2012GL052885/citedby. But if IPCC makes no specific claim to SLR, and the only way that an extreme (?) change comes about is by making changes to historic records you’ll just have to forgive that I’ll be waiting for further data. Seems to me that to do otherwise would be feeding in to alarmism. And I’m not much for that in either direction. Why would you reject one scientific paper and accept the Hay paper so willingly? Why do you challenge a standing paper, claim my argument based on that is “absurd” and not do the same when FOMD puts out Hay (weeks old)?
From 1900 to 1980, the graph conforms very closely to the PDO. The PDO has a physical basis: it changes direction in trend based upon periods of La Nina dominance and El Nino dominance. The peaks, or troughs, are around 40 to 45 years apart. In 1983 the sea level, just like the surface air temperature, diverges from the PDO, and by sheer serendipity, conforms to the AMO, which is a wanderer.
http://www.nature.com/nature/journal/v517/n7535/images/nature14093-f4.jpg
JCH,
I’m by no means a “knower”, I’m a learner. So would you revisit my questions so I don’t have another wordy post. I appreciate the reference to the PDO, C&W came up with 54 years, and the paper I cited showed a +/- 60 year cycle and has been cited numerous times. Not debating, wondering. Thanks
Actually the paper says there may be a 60-year cycle and there may not be one.
It is important to point out that even if a 60-year oscillation is occurring in GMSL, it is still a small fluctuation about a highly significant rate of rise. Modeling a 60-year oscillation does not change the estimated trend in any reconstruction time-series of GMSL by more than 0.1 mm yr−1 (Table 1),
The other guy who said there is a 60-year cycle that needs to be accounted for is Michael E. Mann. I think I read on Clinate Audit and WUWT and in the National Review that he’s a really nice guy and a great scientist from RealClimate!
I would say Hay and Mitovica have revealed the actual history, but we’ll see how Chambers and White and Holgate, etc. see it.
JCH,
Found a link where Willis deconstructed and refuted in detail.
Re:”I would say Hay and Mitovica have revealed the actual history, but we’ll see how Chambers and White and Holgate, etc. see it.” That sounds like we agree that Hay’s view needs support prior to acceptance. Adjusting 90 years of history, then saying SLR is increasing at a greater rate justs sets my radar off.
And if there indeed is a 60 year cycle correlated with PDO or not, it seems wise council that it be considered over a shorter term (even if satellite based) 20 year view. Having said that, the melting Greenland ice related water has to go somewhere. Please correct if you see a problem with my thinking.
The pro is most likely not a cycle, but it’s peak to peak is no more than 45 years. It’s not 60. The 60-year cycle is an optical illusion.
SB – AMO
Lol. SB PDO is likely not a cycle. The AMO is a wandering hitchhiker.
JCH,
Thought there was a code to which I had no solution, or was speaking in tongues.
a fan of *MORE* discourse: Her recent article Probabilistic reanalysis of twentieth-century sea-level rise boils down to this simple idea:
That looks like a good paper. Would it be possible and permissible to release a copy from behind the paywall?
Surely the contamination extends to change of rate of change of rate. She couldn’t possibly have only examined rises, could she have?
==============
This why I worry about with really smart people. Matthew R. Marler thanked me for providing this link like 24 hours ago.
JCH: Matthew R. Marler thanked me for providing this link like 24 hours ago.
So true! I hadn’t read it yet, and did not recognize it as the same paper. This has been happening to me more and more as I approach 68 years old.
Through the Looking Ice.
==================
Marry me, lol.
Friday the Thirteenth came on Friday this month, and I’m much marred. I expect a month of blue moon Sundays before recovery.
H/t Al, you know, me.
==================================
It must be there, Tony, and easy to pass by since it is a much vaguer phenomenon than the physical descriptions upon which you are keyed, but there must be much contemporaneous comment on the human causes of the weather, the manner in which guilt was assumed by the human beast in days gone by.
The guilt was assumed through social means, and not the present economic ones, and had the disadvantage of not having the hook of physical science upon which to hang. Nonetheless, the correlations noted, or rather, narrated, certainly had real consequences.
Mebbe I need a little cuppa cha, like I earlier thought Alice might be sharing with Pogo, as they discuss that Man has hitched himself up out of the Little Ice Age, and remains thoroughly there encased.
===============
kim
you are right in as much it was often assumed that ‘man’ was the cause of bad weather. In ‘The Long slow thaw’ I cited a study that connected witchcraft and weather. I wonder if after Henry viii Britain then diverged from Catholic countries as we no longer had indulgences so people could no longer buy off their guilt.
Seems to be a modern parallel there with carbon offsets as being the price to pay for a modern indulgence of a plane trip.
tonyb
More parallels than I can pursue. I’ll quibble though; didn’t Anne invoke communal guilt for a famous storm?
================
Here’s a parallel. The Spaniards, in 1588, embarked expecting a miracle of nature from God and had the faith it would arrive. Are modelers embarked prematurely expecting a miracle from models, and with the faith that one will arrive?
===================
Kim
Lamb did an interesting reconstruction of the weather conditions around the Spanish Armada. It certainly saved our (Francis) Bacon.
I think you are right that man blamed himself for a wrathful weather god for many centuries.
Kington notes this contemporary description from that period. In the spirit of the day can you revert to medieval couplets?
”a colder time in world was never seene
the skies do loure the sun and moon was dim
summer scarce known, but the leaves are greene
the winter’s vast drives water o’er the brim…
nature thinks scorn to do his duties right
because we have displeased the god of light.
Titania’s speech in Midsummer nights dream also seemed to speak of the dislocation of the seasons around that time. I appreciate the latter is fictional AND anecdotal but many writers wove the weather into their writings.
tonyb
tonyb –
Further on the witchcraft angle — from Burns, Witch Hunts in Europe and America:
“European peasants believed themselves capable of distinguishing between ordinary bad weather and bewitched weather. Magical bad weather diverged from expected norms: unusually cold winters, late frosts, cold and wet summers, destructive thunderstorms, hailstorms.”
I’m intrigued by the interplay among portent, prediction, expectation, and the actual events, both weather and political, not only naval. The populace knew big things were in the air. Was the perception of disorder in the air(sorry, had to; atmosphere would have been better) derived from the burgeoning dread of human events, or did the disturbed weather enhance the coming tumult.
I know all sides were sure God was on their side, at least trustingly hopeful. It seems we’re all at sea.
================
Thankfully down to a hundredth of a degree. I’m stickin with 1 John 5:20
@tonyb
> It certainly saved our (Francis) Bacon
Genghis Khan assembled two separate armadas, at great expense of course, to invade Japan
Both fleets were scuttled in transit by typhoons (the Japanese “divine wind”)
One can only imagine the fate of the Khan’s soothsayers ! :)
Don’t horse the scarers.
For those of us who do not have the time to read long technical essays like this it would be useful to begin with a summary of findings or at least an abstract.
David
That is why it is ordered in the manner it is with the key information contained in sections 1 and 2 and figures 1, 2 and 3.
tonyb
Good point David. I believe that Judith’s way of presenting technical material on her blog site is best. ie. Give an overview with perhaps some selected quotes with links back to the original paper wherever it may have been published.
Blogs are not IMO an appropriate place for the publishing of long and technically involved material. I had read tonyb’s post with interest (as I always do) but found it difficult to get my head around all the information and come up with any takeaway for future reference.
One of the ironies going on here is that climate variability and climate extremes increase at the beginning and at the end of interglacials. If we really are perspicacious and sensible enough to truly detect and interpret such climate changes, we would get an early warning of impending glaciation.
Highly amusing that a possible portent of doom by cold is interpreted as doom by man’s heating. When will they ever learn? When will they ever learn?
==============
Climate science, and their policy masters, have found a nice fat solid branch to stand upon while they saw it off from the tree.
===================
There are some massive rocks on my property that the Laurentide Ice Sheet left behind- some time ago. Have a sneaking suspicion it won’t be the last time big boulders end up in my front yard. I do wonder how far they traveled.
They will not learn. It is not in their interest. Cf “Precautionary Principle”.
TonyB —
Very interesting investigation.
A couple of typos:
“9.019” should be “9.19” when describing orange dots
You have two sections numbered “3.9”.
oops, I meant green dots
Harold
Thanks. I will correct on my originals.
Tonyb
Geoffrey Parker’s “Global Crisis: War, Climate Change and Catastrophe in the Seventeenth Century,” begins with the word “Global.”
From Amazon.com’s blurb:
“Revolutions, droughts, famines, invasions, wars, regicides – the calamities of the mid-seventeenth century were not only unprecedented, they were agonisingly widespread. A global crisis extended from England to Japan, and from the Russian Empire to sub-Saharan Africa. North and South America, too, suffered turbulence.”
I have read that very dense book. Unfortunately the further he ventures from Europe, the shakier the links become. History, certainly. Climate induced? Maybe some. But more probably not.
When has history flowed laminar? Ah, de Nile, that old woman river, she keep on rollin’, along.
===========
Tony, a very small question, with very little relevance to your work as a whole, but as you know already, us denizens can be very detail oriented: why is the 1982 El Chichon volcanic eruption (VEI 5) in Mexico not included?
john
I obtained a list from the smithsonian of the top twelve and that wasn’t on it. Other lists might include it.
tonyb
Thanks, Tony. Knew there had to be a reason.
Tony in your figure 1 the two periods 1650-1700 and 1960-2010 appear to be equal but opposite departures from the average. Yin and yang. I’m sure if you could poll those who lived through each period you’d find warm departure was greatly preferred over the cold.
Here’s yer adjustment … Global Warming is phasing out, right now!
Climate Change: mostly unrelenting cold punctuated by interglacial periods lasting about 10,000 years, the current interglacial being about 12,000 years. Is the next ice age, overdue?
Let me start by saying the variability of the Little Ice Age temperatures in an overall cooling trend fits into the points I am making below about how the climate system may change.
In addition I equate the state of the climate of today being very similar to the state of the climate around 1275-1300ad just before the Little Ice Age commenced. I try to explain in this article why I think it is possible for the climate to head toward another Little Ice Age going forward from here.
http://c3headlines.typepad.com/.a/6a010536b58035970c01bb07ddce01970d-pi
Note this particular chart is from the Antarctica Ice Core, but is representative of charts of temperatures taken from other Ice Cores.
What stands out is for the last 5000 years or even a bit more, is the fact that the global temperature of the earth has been in a slow gradual downtrend with intervals of warmth. The data indicating the items that drive the climate cycle gradually, those being Land /Ocean Arrangements,The Mean State of the Climate, Initial State of the Climate, Milankovitch Cycles, to name a few are taking the climate in a slow gradual downward trend. They are however being superimposed most likely by solar variability fluctuations which give the jig/saw pattern downward but with intervals of warmth.
Let me clarify what I mean by Mean State Of The Climate, and how I differentiate it from the Initial State of The Climate. What I am referring to by Mean State Of The Climate , is the temperature gradient between the equator and the polar regions.. An Ice Age having a greater temperature gradient in contrast to Inter-glacial. The greater the gradient the more likely this indicator is pushing the earth into a colder mode.
Initial State Of The Climate is simply what part of the globe is currently in glacial conditions versus non glacial conditions and how far from the threshold of Ice Age Conditions versus Inter- Glacial Conditions the average temperature of the globe is currently. I would say neutral. From the data I have seen it looks like average global temperatures have been as high as 70F(21.0c approx.) to as low as 48F(9.0c approx.) Currently at about 15C.
What strikes me at this current climate interval of time are the factors that are driving the climate into a gradual overall cooler trend are still in play , while now being in concert with two factors that will superimpose themselves on those factors driving the climate into a gradual cooler trend. Those two factors being a prolonged minimum solar period with the associated secondary and primary effects ,and a weakening Earth Magnetic Field , which at the very least will enhance solar effects. Galactic Cosmic Ray Penetration coming to mind.
This period also similar to the start of the Little Ice Age which followed the Medieval Warm Period. The only slight differences this time ,in contrast to that time is the gradual cooler trend of the climate has advanced slightly more ,and the Magnetic Field of the earth is weaker. The big unknown however is how weak will solar become going forward and for what duration of time?
If solar matches or exceeds Little Ice Age variability into a weaker state then the climate going forward should exceed conditions attained in the Little Ice Age , to some degree eventually all other things being equal. By all other things being equal I mean volcanic activity similar to the Little Ice Age period of time , no random impact ,or perhaps some other unknown factor that could be out there . An example ,galactic cosmic ray concentrations in the vicinity of the earth which I have no idea what they are, and what they were back then in contrast to today.
With the climate there is always going to be the unknown x factors which make it extremely hard to get it right, but this is my best take on things.
I want to add one last item and that is land/ocean arrangements /Land Elevations in my opinion are extremely favorable for cooling overall in both Hemispheres.
Hear, hear. Not shown, but not shown to be not. At least, Dear Gaia, hear.
====================
This seems to be very well done analytical work for a possible working theory. At least, from my viewpoint as a common citizen. Although I may not have come across it due to lack of reading/searching on my part, this adds an interesting way of looking at the climate over a interglacial/glacial cycle.
I would be interested to know what you think might be the main factors that cause an ice age to even occur in the first place. Particularly since the ice ages occupy such a small span of time (taken as a whole) compared to all the amount of time when there were no permanent sheets of ice on the planet. Also, there doesn’t seem to be any consistency in the timing of the ice ages.
Changes in the sun? Certain changes to the earth itself?
Thanks,
GeoffW
Many thanks; bookmarked.
Y’all come down and see us some time. We’ve had some record temperatures. Color them blue.
It is Global, after all. Blue, too.
http://news.yahoo.com/warnings-blizzards-sweep-across-middle-east-110300793.html
Al Gore must’ve traveled incognito to Jerusalem. Or there’s an MSM conspiracy to suppress the news that the Gore Effect no longer requires his living presence. Talk about a Zombie Apocalypse.
=======================
Tonyb
Great and fascinating article. Thanks so much for your hard work and rationale response to controversy.
Still looking for Paraguay, Australia and other estimate and adjustment data from BEST. The 3 P stations and a couple from JoNova identified ones in Australia would help dispell the adjustment mythical beast.
A lovely job here though with the little ice age. Thanks.
Scott
Tony B, Good essay.
you might like this paper:
The Annals of Applied Statistics
2014, Vol. 8, No. 3, 1372–1394
DOI: 10.1214/14-AOAS753
© Institute of Mathematical Statistics, 2014
CHANGE POINTS AND TEMPORAL DEPENDENCE IN RECONSTRUCTIONS OF ANNUAL TEMPERATURE:
DID EUROPE EXPERIENCE A LITTLE ICE AGE?
BY MORGAN KELLY AND CORMAC Ó GRÁDA
University College Dublin
We analyze the timing and extent of Northern European temperature
falls during the Little Ice Age, using standard temperature reconstructions.
However, we can find little evidence of temporal dependence or structural
breaks in European weather before the twentieth century. Instead, European weather between the fifteenth and nineteenth centuries resembles uncorrelated draws from a distribution with a constant mean (although there are occasional decades of markedly lower summer temperature) and variance, with the same behavior holding more tentatively back to the twelfth century. Our results suggest that observed conditions during the Little Ice Age in Northern Europe are consistent with random climate variability. The existing consensus about apparent cold conditions may stem in part from a Slutsky effect, where smoothing data gives the spurious appearance of irregular oscillations when the underlying time series is white noise.
Their conclusions are concordant with yours. I sent a copy to Prof Curry. She may forward it to you, or if you let her email to me your email address I can email you a copy.
Thanks for posting this, I was looking for this paper (you sent it to me previously) but i couldn’t find it. Will forward to Tony also
I have just resent it.
…looking at the colored dots in the article, if you back out the UHI effect, the period 1975-2015 (40 years) looks a lot like 1615-1655 (40 years). The latter period includes 1620, when the pilgrims landed in Plymouth and when half the population during the first winter. There are many places in the US where as many people easily would have died during some of the winters from 2010 to the present, if not for the benefits of the inexpensive abundant heating oil that modernity provides.
“Briefly, the selected criteria are:
up to and including 8.92C is a ‘Little Ice Age type’ cold year (LIA year) shown by a blue dot.
from 8.93 to 9.019 is moderate; green dots
from 9.20 to 9.78 is warm; orange dots
above 9.79 is very warm; red dot
###############
now that’s funny.
1. overly precise criteria applied to a record that has varying accuracy
over time.
2. No sensitivity analysis WRT the crieria
Start here
http://en.wikipedia.org/wiki/Cluster_analysis
There are tons of approaches. identify what kind of problem you have and
test one. The biggest issue I see is the varying accuracy across time.
That is.. 8.92 C on a 1850 measurement has more uncertainty.
Finally,
if you want some temps to add to your work, go get the Lewis and Clarke Series. hmm, as I recall its daily temps.
example
http://lewisandclarkjournals.unl.edu/read/?_xmlsrc=1804-03-31-1.xml&_xslsrc=LCstyles.xsl
and how he calibrated
http://lewisandclarkjournals.unl.edu/read/?_xmlsrc=1804-01-31-1.xml&_xslsrc=LCstyles.xsl
Mosh
The likely inaccuracy of historic reconstructions and Lamb’s dictum on understanding the tendency of the temperature trends rather than its precision is precisely why I am trying to get away from temperatures measured to fractions of a degree.
Having broader bands makes it easier to slot years into them. I am comparing like for like situations across the centuries.
in that spirit how about measuring historic BEST to half a degree rather than a small fraction?
tonyb
Tonyb
Good on you.
Scott
The problem is your clustering is not objective in any way. This is a difficult field, but A few minutes work can illustrate some things.
here. Below i show you how to determine the number of clusters in 1 dimensional data. I selected a range of 3:6 clusters and the algorithm will find the optimal number of clusters in that data. using a traceable and transparent methodology. Just google Ckmeans.1d.dp for the method description.
You will see that it recommends 5 clusters.
The chart gives an entirely different view of things than you do.
as the first cluster (coldest) disappears at 1900: In other words
We can call LIA something between 6.86 and 8.3. There are 28
years in this cluster. 85% of them happen before 1850, 100% by
1900. Defined this way, we are definately out of the LIA by 1900,
See below for the clusters suggested by natural jenks breaks
jenks
style: jenks
[6.86,8.3] (8.3,8.91] (8.91,9.37] (9.37,9.97] (9.97,10.95]
However, If you demand 4 clusters.. This is the best clustering
jenks <- classIntervals(Temp$Annual, n=4, style="jenks")
jenks
style: jenks
[6.86,8.41] (8.41,9.18] (9.18,9.88] (9.88,10.95]
###########################################################
library(classInt)
library(Ckmeans.1d.dp)
cet <-"C:\\Users\\smosher\\Desktop\\UHI\\cetml1659on.dat"
Temp <-read.table(cet, skip=7)
colnames(Temp) <-c("Year",month.abb,"Annual")
Temp <- Temp[Temp$Year < 2015,]
fit<-Ckmeans.1d.dp(Temp$Annual,k=c(3:6))
k<-length(fit$centers)
plot(x=Temp$Year,y=Temp$Annual, col=fit$cluster,pch=fit$cluster,main= 'Optimal Clustering',xlab="Date")
abline(h=fit$centers,col=1:k,lty='dashed',lwd=2)
legend("bottomright",paste('Cluster',1:k),col=1:k,pch=1:k)
Ckmeans.1d.dp returns 5 clusters, each containing 28, 77, 105, 97, 49 elements, respectively.
Cluster means:
[1] 7.937857 8.684156 9.159333 9.654124 10.319388
Within-cluster sum of squares:
[1] 3.002071 1.728670 1.649053 2.551151 3.005082
kfit <-kmeans(Temp$Annual, centers=5)
kfit$centers
[,1]
1 9.654124
2 9.159333
3 7.937857
4 10.319388
5 8.684156
jenks <- classIntervals(Temp$Annual, n=5, style="jenks")
jenks
style: jenks
[6.86,8.3] (8.3,8.91] (8.91,9.37] (9.37,9.97] (9.97,10.95]
28 77 105 97 49
# Testing 4 clusters per tony
jenks <- classIntervals(Temp$Annual, n=4, style="jenks")
jenks
style: jenks
[6.86,8.41] (8.41,9.18] (9.18,9.88] (9.88,10.95]
33 130 136 57
]http://i61.tinypic.com/iwn820.png
http://i61.tinypic.com/iwn820.png
tonyb,
Thats what error bars are for. Notice how large they are prior to 1850 or so:
http://static.berkeleyearth.org/img/decadal-comparison-small.png
Mosh
Sincere thanks for your detailed post.
Tonyb
Zeke
I was being somewhat facetious as I am sure mosh realised. All temperature reconstructions need error bars or some method of categorisation that recognises the I accuracy of themo,eters and the problems with methodology. Cet and best both have the upwards trend that has been going on for centuries.
Tonyb
“The likely inaccuracy of historic reconstructions and Lamb’s dictum on understanding the tendency of the temperature trends rather than its precision is precisely why I am trying to get away from temperatures measured to fractions of a degree.”
1. data have no trends.
2. trends are created by applying a model to data. the statistcal model
has the trend. The analyst makes a choice of what model
to use. Choose a different model, you get a different trend.
why? data in an of themselves have no trend or tendency.
data models have trend terms. data just is.
3. in short you are replacing more reliable ( the data) with the less reliable
( the estimation of a trend FROM that data and your CHOICE of
statistical model )
4. The fractional number dont mean what you think they mean.
The are estimates which minimize error.
Hi Steven
Your scepticism bring Best out of you.
With the CET longest record data, Tony’s historic perspective and the most recently the ‘vukcevic’ annual method calculations applied, the CET is not only the best climate data available but the Best ++, if I may say so.
all the Best to you.
vuk
“Hi Steven
Your scepticism bring Best out of you.”
#############
it’s not scepticism.
Tony has a perspective.
once I saw his classification approach I had a pretty good hunch
that
A) he had no idea how to do this in a methodical fashion.
B) He probably selected cutoffs that told a story he liked. its a huge temptation.
same thing with Hansen using a cutoff for rural in his nightlights.
that was the thing that got me started on classification work.
a good number of my 9-5 data mining problems are classification related.
narly business. waay too much to learn..
Mosh
As according to you I had no idea what I was doing regarding methodology how on earth could I then deliberately select criteria that suited my ‘agenda.’ Come on, apply a little more logic here
You could do this by recognising that there is more than one Logical way to skin a complicated cat in an accessible fashion. Dividing CET into four categories suits the temperature variations that can be observed. It also allows for the reducing amount of accuracy that is likely to be possible as I delve further back in time.
Categorising temperatures in this way is not unusual as I have tried to tell you numerous times. See van engelen methodology that is referenceD in the article.
BTW I would not expect you to manipulate data to suit your ‘agenda’ so please have the same expectations of me.
Tonyb
Tony dividing data into classes is not done how you did it.
I see no METHOD that other can replicate
Further your classes are not optimal. This is just math.
The standard assumption is that ALL ANALYSIS is subject to observer bias. We REMOVE that charge by showing that we used good methods.
You havent done that. So the presupposition imposed by methodolical skepticism ( there is observer bias until you show otherwise) is left un rebutted.
This is not personal. ALL researchers are subject to observer bias. That is WHY we publish methods and data.
That is why we test methods.
Your method has an effect of hiding a change. Thats because your class 1 is too warm.
tonyb: “BTW I would not expect you to manipulate data to suit your ‘agenda’ “
Hmmmm…..
I must say Tony Brown, did an excellent job on presenting the data for Central England.
The question is how representative is this for other parts of the globe overall?
It is a very hard question to answer. I nevertheless believe enough evidence has been presented in other parts of the globe which suggest other parts of the globe experienced similar effects through out this time period.
One example that comes to mind is the year with out a summer in New England, around 1816 I believe..
A fair point, Scotland for example being on the same latitude as –e.g., Alaska.
Tony, I do not know if this would help but here is a list of volcanic events from 1650-2009 many of which you do not indicate on your volcanic chart. Just thought I send this ,hope you see it.
Table 1.Volcanoes of greater than or equal to VEI of 5 from 1650 to 2009. This list of large volcanic eruptions since 1650 was used as the baseline list for comparison against solar activity, i.e. periods of reduced sunspot count to determine any apparent associations. 5* = a class five VEI with potentially large date uncertainty, P* = plinian large class eruption, assumed >VEI 5. The study did not include activity associated with geological hot spots or caldera (super volcano) sites. Source: Smithsonian Institute.
Volcano Location Year VEI
1. Shiveluch Kamchatka Penninsula 1650 5
2. Long Island N.E. New Guinea 1660 6
3. Usu Hokkaido, Japan 1663 5
4. Shikotsu Hokkaido, Japan 1667 5
5. Gamkonora Halmahera, Indonesia 1673 5*
6. Tongkoko Sulawesi, Indonesia 1680 5*
7. Fuji Honshu, Japan 1707 5
8. Katla So. Iceland 1721 5*
9. Shikotsu Hokkaido, Japan 1739 5
10. Katla So.Iceland 1755 5
11. Pago New Britain 1800 P**
12. St.Helens Washington State, USA 1800 5
13. Tambora Lesser Sunda Islands,Indo. 1815 7
14. Galungung Java, Indonesia 1822 5
15. Cosiguina Nicaragua 1835 5
16. Shiveluch Kamchatka Penninsula 1854 5
17. Askja N.E.Iceland 1875 5
18. Krakatau Indonesia 1883 6
19. Okataina New Zealand 1886 5
20. Santa Maria Guatemala 1902 6
21. Lolobau New Britain 1905 P*
22. Ksudach Kamchatka Penninsula 1907 5
23. Novarupta Alaska Penninsula 1912 6
24. Azul, Cerro Chile 1932 5+
25. Kharimkotan Kuril Islands 1933 5
26. Bezimianny Kamchatka Peninsula 1956 5
27. Agung Lesser Sunda Islands, Indo. 1963 5
28. St. Helens Washington State, USA 1980 5
29. El Chichon Mexico 1982 5
30. Pinatubo Philippines 1991 6
31. Hudson, Cerro So. Chile 1991 5+
Salvatore
Thanks. I will have a read through and incorporate it in my original.
Tonyb
Tonyb, read essay Blowing Smoke in your gifted copy of ebook of same name and factor the findings into your thinking. Although it is generally true that only VEI 5 and above are likely to inject stratospheric aerosol, not all do. St. Helen’s did not at all, and Agung just a blip (measured as atmospheric transmissivity using LIDAR at MLO). You will get some non-correlarions. CET should show no affect from those two VEI 5, but should reflect El Chichon and Pinatubo+Hudson cooling rather strongly for a period of 2 up to 3 years. Regards.
This is an interesting observation compared to–e.g.,
The last big chill (not long ago during the Dalton Minimum, 1790–1830) occurred at a time corresponding with a period of reduced solar activity – measured by fewer sunspots – as also occurred before that, during the Maunder Minimum (1645–1715 ) and Spörer Minimum (1460–1550). “My opinion is that we are heading into a Maunder Minimum,” according to Mark Giampapa (solar physicist at the National Solar Observatory). “I’m seeing a continuation in the decline of the sunspots’ mean magnetic field strengths and a weakening of the polar magnetic fields and subsurface flows.”
@ wagathon
Re influence of sunspots on Global Temperature:
This paper, http://agwunveiled.blogspot.com, which has been linked on this site a couple of times already in different threads, claims that the temperature anomaly since the invention of the thermometer is reproduced with a 95+% correlation coefficient by considering only the time integral of the observed sunspot number. CO2, anthropogenic or otherwise, is ignored.
The paper makes no claim as to the mechanism, beyond some speculation, only that the observed historical temperature anomaly can be reproduced by inserting the sunspot numbers into the supplied equation.
“If we’re entering a Maunder Minimum,” says Giampapa, “it could persist until the 2080s.”
Bob, sunspots come and sunspots go – no change in temp on the earth. Sunspots are only the new superstition, nothing more! BUT: if you are superstition person, as some others: -eat plenty of garlic to be safe, and if you want complete protection – carry your rabbit’s foot with you anyway you go.
If you don’t have a rabbit’s foot – order one – until you get one, stay indoors, otherwise the sunspots will get you some day! The safest place from the sunspots is under the bed, stay there!!!
@ stefanthedenier
“Bob, sunspots come and sunspots go – no change in temp on the earth. Sunspots are only the new superstition, nothing more! BUT: if you are superstition person, as some others: -eat plenty of garlic to be safe, and if you want complete protection – carry your rabbit’s foot with you anyway you go.
If you don’t have a rabbit’s foot – order one – until you get one, stay indoors, otherwise the sunspots will get you some day! The safest place from the sunspots is under the bed, stay there!!!”
Hi stefan,
I read your piece that you linked elsewhere on this thread:
https://globalwarmingdenier.wordpress.com/2012/08/25/skeptics-stinky-skeletons-from-their-closet/
and enjoyed it a lot.
Thanks,
Bob
TonyB,
You didn’t write this for me, but you wrote this for me. Much to absorb.
Many, many thanks!
Tony, another great job. Terrific read. My one semihumorous comment concerning your everyman graph is that everyman’s life expectany in 1800 was about 25 years, same as Rome at the time of Galen. See Gaia’s Limits.
I have been doing some research into how globally extensive the MWP (which you are working back toward) and the LIA were. The reason is that after Mann’s hockey stick effort to erase them from the Northern hemisphere failed thanks to MM, the main response (other than to continue defending the indefensible) asserts they were only regional rather than hemispherical or global. Archeology of Greenland’s Viking settlements shows wiithout doubt both covered at least the Atlantic portion of the Northern Hemisphere. Ljundqvist’s 2010 paleoproxy reconstruction shows they were both at least NH. Some papers to the contrary based on Alaskan glaciers and lakes (so not NH) have been shown contaminated by McIntrye. Both Landsner’s unpublished and Loehle’s published 2008 reconstructions suggest it was global, and the LIA portions broadly follow your CET ( without the decadal resolution, of course). Even Marcott shows the LIA (but not the MWP owing to temporal resolution) Essay Lets Play Hockey Again. There are at least 321 papers suggesting MWP was real at least for NH, of which 29 suggest global SH also. Most recently an ikaite paleoproxy from the Antarctic penninsula in 2012. Bit of a slog to check them all. But still slogging. Regards.
glad to see you are working on that.
Question. Looking at the reconstructions you like, what is the answer to
the following question.
if the temperature of the MWP is X.
what is the LIA?
X- what?
a range is cool..
Heh, where?
=========
Steven, intentionally a trick paleoproxy resolution question? Take Tonyb’s high resolution CET Fig. 1 10 year smooth. From LIA to now about +2.3C. Yet Fig. 5 70 year “everyman” smooth for the same period gives only +0.9C. Coarser resolution washes out significant multidecadal variation and understates Δtemperature swings. Cannot directly compare annual or decadal Δtemperature to Δpaleoproxies. This is part of the ‘alignment/calibration’ issue. You probably knew that. Mann even got that grossly wrong—spliced temperature onto paleoproxies in his ‘Nature trick’ to ‘hide the decline’. Climategate, the gift that keeps on giving. You have probably read Montfort’s The Hockey Stick Illusion.
Highly recommended to any denizen that has not. Cheap. iBooks.
Marcott’s reconstruction has an average resolution of 180 years and a median resolution of 120. That is how his thesis turned the MWP into a little blip, almost removing it. See my essay Lets Play Hockey Again in ebook Blowing Smoke (also a previous guest post here). His Science 20th century spike constitutes academic misconduct IMO. Essay A High Stick Foul, also a previous guest post.
I really don’t like any of the Mann gang’s stuff: faulty statistics (short centered PCA) on top of known faulty treemometers (bristle cones) on top of gross treemometer selection bias (Yamal larch). Steve McIntrye has also pretty much kaiboshed the more recent but ecumenical PAGES2K.
My own favorite paleoreconstructions use NO treemometers. There are several other paleoproxy types available. Varve cores from undisturbed sediments (without Tiljander road construction inverted by PCA step 1), alkenone UK’37 cores, diatom Mg/Ca cores, pollen and formamin mat cores, speleothems, glacier ice core δ18O, ikaites,… These have coverage around the world, land and sea.
With the above huge resolution caveat, the data you ask about is:
Source MWP-LIA LIA-‘now’ Resolution
Tonyb CET na(yet) +2.3C 10 yr
‘’ +0.9C 70 yr
Landsner n=27 -1.1C +0.6C ~100 yr
Loehle n=18 -0.7C +0.8C ~100 yr
Marcott n=73 -0.6C NH INVALID ≥120 yr
-0.5C SH INVALID ≥120 yr
Ljundquist -0.7C NH +0.6CNH (includes some treemometers)
Like I said above to Tonyb, it is a real data slog, paper by paper. Category 1, calibrated temperatures but at different resolutions, as in this comment. Category 2, qualitative temperature (Vikings grew barley in Greenland; ok what is the minimum barley growing seasonal temp? Ditto grapes in England…). Category 3, qualitative. (Vikings settled in Greenland during the MWP, but did not survive the LIA). Eventually one can work out ‘a preponderance of the evidence’, maybe even ‘beyond a reasonable doubt’. That is where I am headed. Glad you ‘agree’.
Thanks for the encouragement. This is a much harder slog than I realized when started it for a book essay. Maybe some day a guest post. Thanks for the encouragement, Richard.
Oops, table response to Mosher did not post correctly; wrapped around. Just four columns. Top ‘row’ is the column headers minus spacings. All wrapped rows also minus spacings. Anyone interested can unwrap it. Sorry, late on a Friday workday my time; I took off early to write the comment. No time to fix this evening. Other comments were grabbed out of lunchtime.
Steven, intentionally a trick paleoproxy resolution question?
Nope.
here is my interpretation of what you wrote
Source MWP-LIA LIA-‘now’ Resolution
Tonyb CET na(yet) +2.3C 10 yr
‘’ +0.9C 70 yr
Landsner n=27 -1.1C +0.6C ~100 yr
Loehle n=18 -0.7C +0.8C ~100 yr
Marcott n=73 -0.6C NH INVALID ≥120 yr
-0.5C SH INVALID ≥120 yr
Ljundquist -0.7C NH +0.6CNH (includes some treemometers)
Landser MWP-LIA == -1.1C
Loehle == -.7C
Marcott == -.6C
Lund == -.7C
Is that about right? you think the MWP was roughly .6C to 1.1C
warmer than the LIA?
Thanks for answering..
hmm maybe for compariosn I might want to say LIA from 1600-1700
which looks to be the floor.
Hope this threads. Mosher, No. You missed the whole point. On decadal resolution, 2.3C. On proxy scale resolution >100 years, maybe 0.7-0.8C, no different than IPCC from about 1850. You want ‘slow and low’, pick low resolution. In which case CAGW is largely falsified. You want fast and high, pick high resolution like 3 decades parameterizing CMIP5 from 1975-2005, in which case CAGW results. But the two cannot be ad hoc mixed together without Mike’s Nature trick. Climategate 2009.
What you perhaps imply, and Mann did, was paste high and fast temps onto the near end of low and slow proxies. Now if you want that mathematically, we can do it for you. But your boss Mueller already did so graphically, on YouTube, and then said it was unacceptable.
Apples and oranges make fruit salad. Tonyb CET says that on BEST relevant resolution scales, delta T from the LIA to now is maybe 2.3C, nearly 3x the rise since roughly IPCC 1850-1880, and also about 3x the rise in BEST since then. Just is. And, although I do NOT believe this is sufficient for attribution, if I did it would be about 0.5/2.3 or maybe 20% CO2 and 4/5 natural variation. Oops.
Rud.
Im not talking about tony’s work .
you talked about recons. I asked about recon.
not tony.
So Try again.
MWP is X
the period 1600-1700. is Z
X- Y =Z
what is Y?
a range is cool.
side commentary is un necessary.
But I was only talking about Tonyb’s post and high resolution results in comparison to the rest. Explicitly. The topic of this thread. One detailed reply suffices. Demanding answers to a vaguer question because you do not like an on point specific answer to a specific question is bad debating form. G’Night.
What is your estimate for Y
I can’t figure it out from what you wrote.
Honest question. It’s unrelated to Tony.
You said you were working on paleo.
Simple question.
Oh, you mean guesstimate. Well, by my measure, the millennial scale changes are on the order of a couple of degrees.
===============
“if the temperature of the MWP is X.
what is the LIA?
X- what?”
Disingenuous.
Even by your standards.
It’s an actual simple question.
Dont know why Rud won’t answer it.
He could say
.6C-1.1C and be done with it.
Note I didnt ask for citations,
Didnt ask for analysis
Just a range..
Rud
Also look forward to the MWP/LIA global connection. Oppo et al 2009 and Rosenthal et al 2013 have found a connection in the Pacific; the 2013 study describes subsurface sediment research with inter-ocean impact.
Richard
rls, yes and Crowley and Unterman 2013 volcanic forcing tends to agree with Oppo and Rosenthal.
https://lh4.googleusercontent.com/-OvQHzJy8gFU/VLF3XHImAqI/AAAAAAAAMGM/X1vv5Tx0kiI/w689-h411-no/oppo%2Bover%2Bmann.png
Oppo 2009 versus da Mann-O-matic
https://lh3.googleusercontent.com/-8KA13zjtJ0o/VOexbaIoZFI/AAAAAAAAMyo/Oaauc3Cbjzs/w971-h503-no/cet%2Bbest%2Band%2Bthe%2Bvolcanoes%2B1200%2Byears.png
Crowley and Unterman 2013 for just the northern hemisphere.
Captain
What’s your take on the Rosenthal et al study? It is a study of deeper ocean temperatures using MG/CA ratios of a subsurface planktonic foraminifer that calcify at 75-100 meters depth. The authors conclude that that the temperatures at that depth in the tropical pacific are lower today than during the MWP and also that those waters are sourced from the southern pacific and northern pacific, and the arctic, hence the entire pacific intermediate water temperature (IWT) is lower today than during the MWP. They have some in depth discussion about OHC and ocean circulation that loses me but may be an explanation regarding water circulation and a homogenous IWT.
Regards,
Richard
PS: May have some time to kill this August in FL. Hauling costumes to Cape Canaveral for my granddaughter’s dance studio. They will be performing for a cruise line for a week and I’ll be looking for something to do.
Thanks misthreaded in haste to start dinner. See above, and again thanks.
rls, “It is a study of deeper ocean temperatures using MG/CA ratios of a subsurface planktonic foraminifer that calcify at 75-100 meters depth.”
The area they are in probably has the best field accuracy for Mg/Ca so I suspect their work is better than average due to location. Surface and Sub-surface proxies are a bit difficult because the “bugs” are biased toward survival. If you have hot calm conditions there is a greater likelihood of an unusual thermocline forming, but the general temperature trend should be close to the same. Since they use Mg/Ca that is why I gravitated towards them. Uk’37 can have a large field error >2C due to current variations and the depth ranges the bugs like.
As far as representing the entire Pacific IMW I would have to consider a bit more uncertainty, but it should represent general climate tendencies rather well.
August in South Florida should be a nice balmy 92F with a feels like 105+ :) One of the few times of the year is try to find anvil head cloud air conditioners.
rls, this might be a better check of the Oppo 2009.
https://lh3.googleusercontent.com/-yDCxZf6z9SQ/VOjaA6KuPqI/AAAAAAAAMzc/f0Phy6H1izo/w937-h559-no/estimating%2Btropical%2Bmwp%2Blia%2Brange.png
That is using just the tropical volcanoes included in the Crowley and Unterman 2013 volcanic forcing reconstruction. The BEST surface air temperature is just for reference. I had to interpolate a lot to get the tropics back that far in time so the uncertainty would be huge. Based on that though the tropical oceans would likely still be recovering heat content lost during the high volcanic activity period.
There are several other tropical SST reconstructions that agree well with Oppo 2009 including the nino3.4 region so I would say they are very solid.
Mosher will disagree of course because there is ZERO evidence of long term persistence according to his circle of friends.
Rud
bit of an issue with your 25 year life expectancy statement
it is my understanding is that modern life exp. average has increased largely due to childhood mortality improvements
the main driver beyond lower modern birth rates
if one made it to adulthood in the old days odds went up
I think one could find many examples of 70 yr life spans during the time covered by CET
and LIA
ancients too
once heard main honcho at JHU School of Public Health state that modern medicine only accounts for about 3% of modern life expectancy increase
Of course. The natural max expectancy has not changed much. Rivals John Adams and Tom Jefferson both lived to a ripe old age (and, cue scary, died within hours of each other on the same day–July 4 1826).
But the average LE in the US has progessed from about 25 in 1800 to about 76 now:) My semihumorous only point. Tonyb’s “Everyman” hs. Much more educational use, upon which I made a more serious comment to Mosher above.
should add ‘after childhood’
Rud Istvan: Some papers to the contrary based on Alaskan glaciers and lakes (so not NH) have been shown contaminated by McIntrye.
Is there a typo or an omission? How is Alaska not NH?
I was thinking he meant ‘so not North Atlantic’.
===========
The Alaska glacier/glacier lake papers were supposed to disprove that the MWP covered the entire northern hemisphere. What Steve Mac showed is that they relied on totally suspect/contaminated/misinterpreted sediment proxies. He is the expert there. I am just remembering for you what he found.
Sorry was not clearer. Alaska is of course in NH, but was supposed by these papers to prove MWP was not NH wide, only regional to North Atlantic.
Was rushing after work to prepare dinner on Friday night while still commenting. Am now slowing down after dinner, with hopefully clearer expressions. Is a good example of why I do better writing essays taking weeks/months of polishing rather than blogging daily comments. Just is.
Rud, MWP and LIA never existed; only concocted to con the people that: the planet gets warmer / colder at a drop of a hat. Honest people call those times as: Dark Ages and Renaissance. The overall global temp was exactly as today. Creating a ”global” warming because of a pitbog in England = it only proves that: the Poms are the biggest liars. Stop writing crap before you learn the truth: https://globalwarmingdenier.wordpress.com/2012/08/25/skeptics-stinky-skeletons-from-their-closet/
I think that’s peat bog. I’m glad to see some sensible talk though. ;)
Stefan,a good one. Had not seen that. TY.
R Graf | February 20, said: ”I think that’s peat bog. I’m glad to see some sensible talk though”
Thanks R Graf, and point taken – I need to learn a bit more English… because you sods with English as first language don’t want to take charge and present the truth to the public…
Tony Brown is struggling to determine the “impact” of the variability, not so much the quantum. A few nasty winters do not affect your food production or warmth of your house (unless they are early, long and nasty). But those that come with diminished crops or access to heating fuel (wood) do.
I suggest that the above temperature data be compared to the advance and retreat of valley glaciers in Europe. While glacial growth is dependent on the rate of snow fall and melt, not on temperatures in the summer per se (all glaciers will advance if more snow falls in the winter than melts the rest of the year), the cumulative effect of small temperature changes when conditions are near stability (accumulation = melt), could demonstrate an experience of prolonged cold and wet winters and diminished crop yields. People remember the cumulative effect as this is what produces the material effects that define their lives.
Doug
“A few nasty winters do not affect your food production or warmth of your house”.
You have obviously not spent winter in Scotland in a one-fireplace cottage. The colder it gets outside, the closer ya need be to the fire; gets tuff to do household chores, shower, etc. Good though for gettin in bed and snuggling under the covers.
Keep warm
Richard
Below is an excerpt from the paper Matthew Marler sent ,which is not representing the point Tony Brown’s article I feel is trying to get across which is ,not that there was not much variability of the climate during The Little Ice Age ,but rather the MEAN climate with variability taken into consideration was colder then the our present day climate (1850-present), as well as the Medieval Warm Period that proceeded it..
Therefore the more correct interpretation of The Little Ice Age should be random climate fluctuation superimposed upon an overall lower mean temperature during the period of time The Little Ice Age took place, that being 1300ad-1850ad.
This article in my opinion is trying to down play the significance of the Little Ice Age and for that matter the Medieval Warm Period that proceeded it ,into nothing more then random climate variability which is not the case.
If I were a betting man I would bet this article would not attribute the recent global warming trend (which has now ended post 1998 ) to random climate fluctuation.
This is what the AGW movement is constantly trying to accomplish by down playing past climatic events in contrast to the so called great warming climatic event we have now. Which is not true.
My two cents worth.
Excerpt from the article.
However, we can find little evidence of temporal dependence or structural
breaks in European weather before the twentieth century. Instead, European weather between the fifteenth and nineteenth centuries resembles uncorrelated draws from a distribution with a constant mean.
Our results suggest that observed conditions during the Little Ice Age in Northern Europe are consistent with random climate variability.
Salvatore del Prete: Therefore the more correct interpretation of The Little Ice Age should be random climate fluctuation superimposed upon an overall lower mean temperature during the period of time The Little Ice Age took place, that being 1300ad-1850ad.
The authors say that if there was a “Little Ice Age” onset of the sort commonly described, then it must have occurred before their temperature series were started, so they can not rule it out.
“Stationary throughout the recorded interval up to about the end of the 19th century” is a reasonable summary of the AOAS paper and TonyB’s essay. Neither one of them can identify an end of the Medieval Warm Period, or an identifiable subinterval of the interval between the Medieval Warm Period and the “Modern Warm Period” that is a distinct “Little Ice Age”..
I don’t disagree with your “more correct” interpretation, but I don’t think it disagrees with what Kelly an O’Grada wrote.
Thanks for all the hard work Tony – I had wondered about the mix of seasonal warmth and cold in the CET record and the number of warm years during the LIA s quite surprising. I would not argue for a name change though – the main reason it is called LIA has less to do with English summers or winters and more to do with advancing and retreating glaciers – in both the Alps and in Greenland. Greenland’s retreating ice is still uncovering Viking artifacts! (Something for the blogger who posted the massively melting Greenland ice-cap to put in his pipe and smoke on).
Greenland’s mean temperature very much depends upon meridional variability of the jetstream – and if you look at the ice-core records of about 30-50 kyr BP, major changes of 2-3 degrees occurred in cycles, rising very abruptly (almost from one year to the next), and declining more slowly. Such rapid change can only be caused by a major shift in wind direction. These warming/cooling periods occurred at 4-5 points within a 10 kyr beat-cycle, and in a quasi-Fibonacci series (8:5:3;2:1:1)…..this strange cycle can just about be discerned for the Holocene – but without a major peak at 5 kyr BP. The modern warm period is the last in the series, and clearly cooler at its peak in Greenland than the previous peaks there. It would appear that the LIA hit a lower point than previous Holocene troughs – perhaps as low as the Younger Dryas cold period just before the Holocene proper.
I have sought for explanations of these cycles without success – the best idea comes from my colleague Jackson Davis, who sees a damped oscillator at work, but quite how the signal communicates in the oceanic and atmospheric environment is hard to imagine. And the 10 kyr ‘beat cycle’, which is very clear in the Greenland record, can be very exact – at least when the glacial regime is at its most stable – could that be a major solar event, such as a mega-flare? This then sets off the resonant damped oscillator working through long ocean cycles? I can’t really see the latter.
Further, the Antarctic also has warming and cooling events – often dismissed as ‘noise’, but Davis and I may be able to firm up their cyclic nature – they vary according to proximity to the coast, and enough data correlates from site to site to suggest they are not simply random noise. The periodicity appears to get shorter toward the end of the Holocene – as with the Arctic data.
My best guess is that solar far-UV and upper atmospheric changes control the meridional phases of the jetstream – which then strongly affects wind direction and heat transfer/rain/snow accumulation. In the UK this is manifest as blocking high pressure systems – heatwaves in summer, intense cold in winter, but ameliorated by our maritime climate. The extremes would be greater on the Continent and further in to Eurasia. China for example, measures the peaks and troughs in terms of ‘famines’.
It is not clear what happens with the Sun in the LIA and warm periods – sunspots are a rough guide to magnetic levels – for example, the current low sunspot cycle is coincident with low magnetic status as well as lower UV. In the CET record, it looks like the low point from 1650-1700 trails the sunspot low by several decades. One possible explanation would be that the enhanced vorticity of the earlier decades sucked heat out of the North Atlantic at a steady rate – that heat is stored in surface waters down to 200m and it would be drawn upward slowly until the reservoir was exhausted – leaving the North Atlantic much cooler for several decades until the gyres re-accumulated the heat stores. This cooler status of the North Atlantic might then feed into the oceanic conveyor system with a long cycle response (500 years to Antarctica, and 1500 years for a full global cycle). Antarctica has a curious see-saw pattern – colder when the north polar regions are warmer. The ice-cap is isolated from the rest of the world’s climate system by the southern ocean and the southern jetstream – but a meridional shift there would create a major change – maybe the two poles respond differently to the same triggers?
That is perhaps why the MWP/LIA are hard to spot in Antarctica, but can be picked up in South America, New Zealand and southern Africa.
What is so outrageous about global warming hype is the virtually complete lock out of all talk of repeating cycles – though some discussion now arises about the shorter ones like the AMO/PDO because of the ‘pause’. The IPCC models clearly show that AGW is identifiable (in the model) only after 1950 – the previous warming from 1920-1940 was of equal rate, and accounts for half the centennial rise. They then expect us to agree that from 1950-2000 there were no natural cycle peaks (when the AO, NAO, AMO, PDO and ENSO all had peaks!) – well, they don’t even mention cycles, let alone peaks!!! If we give AGW a generous 51% (IPCC’s ‘most of the warming since 1950 is AGW’…..then that means 75% of the centennial rise is natural!
This can be derived from the published science – yet any commentator is excoriated for questioning the ’emissions must be controlled’ diktat of all the world’s leaders and the science academies – when a 50% reduction would (eventually) deal with about 12% of the driving force. But then, you all know this!
Peter
Thanks for all this. It warrants several re reads as there is lots of information.I agree that not enough attention is paid to repeating cycles. If you look back far enough they can be clearly seen. Climate is not static, indeed the range of temperatures and climatic states in juxtaposition is sometimes astonishing.
There is no better reflection of this than the huge difference in Britain between last winter and this one. We can see these rapid changes throughout the record
Tonyb
Good insight and plausible mechanisms, not yet shown or fully elucidated.
===============
Kim, Wyatt and Curry’s stadium wave paper is a partial NH start. I think we have much to learn about our blue planet’s oceans. Regards.
“In the UK this is manifest as blocking high pressure systems – heatwaves in summer, intense cold in winter,”
With a weaker solar signal there is increased negative NAO which gives increased low pressure and wetter/cooler conditions in summer months for the UK.
As for Greenland temperatures and the polar see-saw, note how much of the detail of GISP temperature moves in the opposite direction to those on CET, e.g. around 1666 and 1686, and the drop from the 1690’s to the 1720’s. The coldest years of Dalton (1807-1817) and the equally cold 1836-1845. 1538-41 was very warm in Europe, and also parts of the 1610’s were very warm, with a relatively large solar cycle maximum in 1615:
http://snag.gy/ODJIQ.jpg
http://climexp.knmi.nl/data/tcet.dat
Tony, my take on the climate( much abbreviated).
The climate most likely acts as a two tier system in that it has slow moving cycles such as Milankovitch Cycles ,Land /Ocean Arrangements to name some that gradually move the climate toward a warmer or colder climate but superimposed on this gradual cycle are forces, and events that can create counter abrupt climatic trends or just shorter less dramatic climatic trends (such as solar variability with associated primary/secondary effects ,random extra terrestrial/terrestrial events) especially when the climate is near the glacial/inter- glacial threshold condition which the slow moving cycles in the climatic system bring the climate toward and away from over long periods of time.
Climatologist many of them try constantly to isolate an item that may influence the climate without considering it in the context of the entire spectrum of items that may be impacting the climate at that given time or the state of the climate at that given time and think they can somehow come up with an explanation as to why the climate changes. Wrong , wrong and wrong.
Salvatore
Plausible. I fully agree that climatologists Try to isolate one part of the process and don’t recognse that it is part of a wider system that itself is constantly changing.
Add to this the likelihood that we only know a small number of the parts that make up the climate system and you have the perfect recipe for some people to jump to conclusions?
Tonyb
It’s always intrigued me how severe conditions associated with El Nino can set up a ferrous seeding of the Pacific, with iron-rich Australian dust taking wing on howling dry Spring westerlies. Nino feeds Nina. Crafty.
But what doesn’t fit the deeper narrative (ugh, that word) is not for pondering. It’s like that big, hot, plasticky ball we are not supposed to ponder. When they say planet, they mean crust only. Earth’s internals only matter when the climate authorities need to detain a volcano or two for interrogation over an awkward climate fact.
Don’t worry, the volcanoes are released after questioning. The authorities are really interested in them.
Mosomoso, I like this reference. Few realize how much windborne dust fertilizes the oceans, where iron is apparently the planktonic limiting nutrient, with plankton responsible for about 50% of biomass synthesis. Now, that affects CO2 sequestration some. But it affects ocean heating from incoming SLR (sunlight) a LOT. After all, the energy sequestered by photosynthesis is not available to heat either the ocean or the armosphere. In the terrestrial tropics, this is experimentally at least 1%. So mybe same or more in the oceans. I knowmod no studies…See Gaia’s Limits. Now that wnwrgy conversion is greater than the supposed TOA radiation imbalance (0.6 to 250 or some such).
We forgot the planet is alive!
Exactly. Your data is the best I have seen for The Little Ice Age. Could not be presented better.
Very fascinating. The variability is very interesting and also demonstrative of the likely high nonlinearity of the whole system.
I just learned about sahara dust (spoiling lots of imagery). Talk about a nonlinear influence: directly coupling circulation with radiation. Wonder if this plays in at all.
Thanks.
http://blogs.agu.org/wildwildscience/files/2014/09/SaharanDustStorm_iss_2014251_lrg.jpg
Search ‘Boedele Depression’ which fertilizes the Amazon Basin, and uh, elsewhere. Its dust’s been everywhere, man.
=================
Tony
Interesting study, as always. Particularly interesting is Figure 4, showing the seasonal temperatures, and the winter temps 1659 – 1709, going from ~2C to ~4C and back to ~2C in 50 years. There’s got to be a clue to the big picture there. Also, for me, separating out the seasonal temps, makes sense; need to understand the pieces before fully understanding the whole. And finally, are there lags, other than seasonal lags between the seasonal temperatures? Maybe the same chart, using 10 year Moving averages would reveal some hidden information.
Just heard, US government is, or will be, pushing less meat consumption. And will connect the effort to climate change policies. Less meat = less heat?
Keep warm
Richard
I’ve been having a grand time watching Washington’s cherry blossom bloom dates confounding the global warming alarmism machine. Even the Smithsonian scientists were quick to point out suggestively when the facts suited them that, “On average, flowering plants are blossoming 4.5 days earlier in 2000 than in 1970.″
The nation’s National Museum went so far as to release the results of a, “30-year study of flowering plant species common in the Washington, D.C. metro area.” and ruminate like fat cows chewing their cud about the apparent fact that, “This trend of earlier flowering is consistent with what we know about the effects of global warming.” We are treated to such scholarly observations like, “The minimum temperature has been going up over these years and the early arrival of the cherry blossoms appears to be one of the results.”
Of course, the last few winters have been bringing down the average, especially last year and likely this year as well. However, since later blooming dates do not fit a, “trend toward earlier blooming of flowering plants [that] may be a result of global warming,” we probably won’t hear much coming out of the government bureaucracy.
The evidence of government scientists aside, a 2008 study by Aono and Kazui, of the full-bloom date of cherry tree blossoms from the 9th Century in Kyoto, Japan, was far less alarming: They noted several cold periods, 1220–1350, 1520–1550, 1670–1700, and 1825–1830. However, the temperature began to increase almost linearly after 1830. The Japanese study also discovered, “the existence of a widespread ‘Medieval Warm Period’ around the year 1000, as well as the LIA [Little Ice Age].”
Think this might adjust the mannians?
(not to mention the smithsonians) maybe.
W, thanks. You just fit another BIG piece ( I will track down references) to an emerging new paper/post book idea stimulated by Tonyb. Cherry blossoms in DC and Tokyo! 900+ AD to 1950+! I was slogging through a regional/hemispherical/global natural variation paleoproxy temp thing. See response to Mosher above. Very difficult. More Steve McIntyre turf, even though he never chose to tackle the issue (deconsteuctive critique is easier and faster than new construction.) No! Impossibly wrong approach. Swamped by hopelessly uncertain pseudo precision and lack of comparability. Duh!
Do the ‘proof’ qualitatively and historically. Lots of work ahead, but lends itself pictorially to my writing style! Equally convincing if less precise, when precision is BS anyway (which point becomes a whole major section of the paper just written mentally). Now, I will have to learn a bit from Tonyb about rigorous historical research methods even though reading history is my second most favorite thing after reading hard science. But understanding rigorous historical methods cannot be harder than understanding GCM model parameterization. Regards.
Sounds great, Fyi– With the exception of 4 cherry trees that were cut down December 1941 in apparent retaliation by unknown jacks against the attack on Pearl Harbor, Washington D.C.’s storied blossoms are the product of a gift from Japan in 1912 of 3,020 cherry trees–i.e., twelve varieties comprised of as follows: Somei-Yoshino, 1,800; Ari ake, 100; Fugen-zo, 120; Fuku-roku-ju, 50; Gyo-i-ko, 20 (planted on the grounds of the White House); Ichiyo, 160; Jonioi, 80; Kwan-zan, 350; Mikurumagayeshi, 20; Shira-yuki, 130; Surugadainioi, 50; and, Takinioi, 140. (See, History of the Cherry Trees, http://www.nps.gov/cherry/cherry-blossom
Little Ice Age climate reconstruction from ensemble reanalysis of Alpine glacier fluctuations
M. P. Lüthi1,*
1VAW Glaciology, ETH Zürich, 8093 Zurich, Switzerland
http://www.the-cryosphere.net/8/639/2014/tc-8-639-2014.pdf
Apparently those glaciers had numerous ins and outs.
Meanwhile, in Alaska, the Mendenhall glacier retreat is exposing a forest encased just 1,000-1,500 years ago:
http://www.livescience.com/39819-ancient-forest-thaws.html
Tony, looks like you may need to show what real temperatures look like someday.
GAME ON:
http://dailycaller.com/2015/02/20/republicans-to-investigate-climate-data-tampering-by-nasa/
ordvic
interesting. As I say I am ambivalent as to whether data has been deliberately tampered with and would want to see more examples than those that have come to light so far.
An investigation of the nature you mention might help in clarifying the situation as it will be high profile and presumably be understandable to the layman. or will it rapidly become a partisan bun fight?
tonyb
Yeah, I too am, as you say, ambivalent. Republicans also have a knack of shooting themselves in the foot.
I think it’s a mighty fine idea to get everyone interested in the history of temperature. The more the better, the further back the better.
All in favor say Aye.
==================
Aye et al.
Sounds like fun! Aye Aye ;-)
Aye aye mate
good.
depending on who the republicans call as witness.. it could be very interesting..
Do you think Pielke will call TOBs adjustment fraud?
Anthony ?
evan jones from anthonies team ?
Christy? when he did his own TOB adjustments
Who in the climate skeptic camp will walk into congress, take an oath
and call it fraud?
maybe they will call Goddard.. in which case this will be really fun.
Bound to be a fight. Can a study team be found to honestly delve into the temperature issues. Wagman group faced major accusations to discredit them and smears from the team. Maybe Dr Steve Koonin and the team from the APS get presentations from the various groups. Still no closure on the APS review of a year ago.
Scott
Scott
We saw with Mosh’s thread a few days ago how difficult it is to put over the technical reasons for adjustments. So whether a group of partisan questioners will ever extract anything meaningful from a grouping of scientists who are not always able to put their data over in a clear fashion remains to be seen.
More to the point will anyone ever accept the findings if it doesn’t match their preconceptions??
tonyb
tonyb
thanks for everything you do. The time of obs TOBS changes sure could be identified along with the original readings. Then any station moves or technical changes to move stations out of jet blast at airports or urban heat island impacts. But always provide the original measurements on the forms from NOAA. Data error bars would be easily to 0.5C which would show lots of hotest year ties.
thanks again for your work and courtesy.
Scott
Correcting Pierrehumbert
Sea level rise has increased from around 2mm/year to around 3mm/year, somewhat consistent with the addition from ground water use. Is 3mm/year sea level rise (2mm of which are from climate change) an emergency? I don’t think so.
multiple lines of research confirm that the climate signature of human-caused greenhouse gas increases has already risen well above the background noise level.
Sorry Ray, 1910 to 1945 warming is about the same as 1979 to present warming. And the 1979 warming is less than even the low end models
(see above ).
and at the rate our fossil fuel burning is increasing, we could go well beyond doubling.
Well, of course, the developed world has DEcreasing CO2 emissions. And as I’ve noted, both Greenpeace and Exxon agree we’ll be
soon DEcreasing emissions as a planet:
http://energydesk.greenpeace.org/2015/01/26/official-chinas-coal-consumption-fell-2014/
http://image.slidesharecdn.com/exxonmobil2012energyoutlookdcfr-120523113128-phpapp02/95/exxon-mobil-2012-energy-outlook-19-728.jpg
industrial civilization looks like a force of much more than geological proportions. take a deep breath.
He states that the effects of carbon dioxide will last “several centuries,” whereas “several millennia” would be closer to the truth. The carbon dioxide we emit while dithering about what to do will cause essentially irreversible changes to our climate.
This is an embarrassing statement, even for Ray P.
Was the Eemian irreversible?
Was the last glacial maximum irreversible?
Was the Holocene optimum irreversible?
People like Ray know that CO2 exits the atmosphere at a rate proportional to the amount in the atmosphere and that rate has been increasing:
https://chartsgraphs.files.wordpress.com/2009/09/hansen_pnas_fig.png
He knows that it’s a relatively simple matter to calculate if CO2 were to stop today, we would be back at pre-industrial in about a century, but somehow still exaggerates to a millenia.
And why does CO2 leave the atmosphere? Because living creatures consume it!!!
You remember, ORGANIC chemistry? The one with carbon molecules?
It’s so important because carbon is the basis of organic life?
Oceans can delay warming by taking up heat (indeed they are, as ocean observations confirm), but the warming will be made up with a vengeance once the oceans stop taking up heat, as they eventually must.
Sure, ocean heat may warm the atmosphere, but at the same century to millenial time frame at which it circulates. Ocean heat will migrate to the atmosphere when the atmosphere is colder than the oceans, meaning the moderation continues.
By the way, since warmer ocean waters don’t sink, how are we getting all those warmer waters into the deep?
Scott
Dr Koonin resigned from his job chairing the climate change committee. Also, they have the option of not issuing a new statement.
Richard
There’s Trouble and it starts with ‘T’ and it rhymes with ‘C’ and it stands for Cool.
=============================
rls, any more on this? Is there a story here?
Mark,
In my little search found this WSJ article: http://www.wsj.com/articles/climate-science-is-not-settled-1411143565
If I were cynical I might have a guess (unsubstantiated) having to do with “going against the grain”.
RLS,
Thank you for the reference to Dr. Koonin. Sent me looking. When one with such standing seperate from the conversation puts in to words,so much more elequently than I could, that which I’m thinking I can’t decide if it’s just my confirmational bias or a reality check. Once again, I learn more from a simple comment on this blog than I would even have thought to seek. As a member of APS if he’s skeptical about the nuts and bolts of the CAGW model based projections at least I’m in good company. Maybe he should be part of the intellectual posting as a reasonable source.
Thanks Danny, I read the WSJ article when it first came out and was hopeful that Koonin would be able to bring some sanity to the APS position. Silly me!
I hadn’t heard that he has taken himself out of the picture. I find this very troubling.
He’s still listed as a fellow since 1980, and still has a voice. He doesn’t deny CO2/anthro but questions the models, projections, and policy based on same. Maybe he’s less constrained and can be a voice of reason in the conversation. My first time to see the WSJ article. I’m sooooo behind.
Pierrehumbert had a piece in response to the Koonin WSJ article.
http://www.slate.com/articles/health_and_science/science/2014/10/the_wall_street_journal_and_steve_koonin_the_new_face_of_climate_change.html
JimD,
Put my perceptions on the open thread.
What makes him a “voice of reason”?
A quote from Pierrehumbert says it all: “Without belaboring the point, let’s just say that Koonin’s arguments are not the sort of thing that would emerge from a period of deep reflection by some brilliant mind turning serious attention to the subject. Rather, they are the sorts of things one could pick up in a weekend surfing a few of the more willfully ignorant skeptic’s blogs.”
JCH
“What makes him a “voice of reason”?”
He reminds us what my introductory text on atmosphere and oceans says: understanding each part of the atmosphere and oceans is not equivalent to understanding the whole. He tells us that we know not enough. That more must be done to improve our observation capability and too little is known of cloud interactions and ocean circulations. Funding needs to go toward getting answers. I would not be surprised to see him and Dr Curry leading an effort to improving our knowledge of the atmosphere and the oceans.
Richard
But what if we are unlucky and climate sensitivity turns out to be at the high end of the range?
Ray P, like many extremists, is in denial of actual observations:
MODEL: IPCC5 (RCP8.5): 4.2C/century
MODEL: IPCC4 Warming High: 3.2C/century
MODEL: Hansen A: 3.2C/century ( since 1979 )
MODEL: Hansen B: 2.8C/century ( since 1979 )
MODEL: IPCC4 next few decades: 2.0C/century
MODEL: Hansen C: 1.9C/century ( since 1979 )
MODEL: IPCC4 Warming Low: 1.8C/century
———————————————————————
Observed: NASA GISS: ~1.6C/century ( since 1979 )
Observed: NCDC: ~1.5C/century ( since 1979 )
Observed: UAH MSU LT: ~1.4C/century (since 1979 )
Observed: RSS MSU LT: ~1.3C/century (since 1979 )
MODEL: IPCC5 (RCP2.6): 1.0C/century
Observed: RSS MSU MT: ~0.8C/century (since 1979 )
Observed: UAH MSU MT: ~0.5C/century (since 1979 )
———————————————————————
No Change: 0.0C/century
Recall that Hansen C was the scenario of zero emissions starting at 2000.
That is to say that doing nothing has been more effective than what doing everything was ‘modeled’ to be.
We would indeed be unlucky if sensitivity turned out to be at the high end of the range. That would mean that we’d now be desperately cold without man’s effort, with temperatures stalling out and the end of easy fossil fuels near.
The higher the sensitivity, the colder we would now be without man’s efforts. You’d better hope that sensitivity is low, because that means we’ve recovered naturally from the coldest depths of the Holocene. There isn’t really any luck about it, though.
======================
Dr Curry
If you see this do you know the basis for Dr Koonin’s resignation? Is the team attacking him or the government threatening his funding?
Loosing him on the APS panel is discouraging. Your presentation to the group and the back and forth was so enlightening.
Scott
I think that Koonin felt speaking out publicly on the topic of the POPA Committee was a conflict of interest, so he resigned so that he was free to speak out publicly. Hopefully the APS committee will proceed in an effective manner, but I have heard absolutely zero about this in recent months. Judy
Scott in 2005 skeptics THEMSELVES looked at TOBS and agreed that a correction was needed.
evan jones working with Anthony admits that changing TOBS introduces biases.
Christy himself argues that changing TOB introduces biases.
How is fraud to remove bias?
Isnt the real fraud those who argue that the bias should stay in the record.
Mosh
Thanks for the courteous reply. I didn’t mention fraud for like tonyb I don’t see that as likely. But am concerned about changing the data and then not linking the originals. Making adjustments one can trace but providing originals and change provide a tracking mechanism for outsiders.
Do agree with your point and am appreciative of BEST statement of accuracy on the temperature record and your and Zeke engagement.
Thanks again
Scott
Scott
I am at the Met Office on Monday and the idea that any of the scientists I will meet are indulging in fraud I would find incredible. That is not to say the global temperature is by any means perfect, but it is highly complex and scientists are often their own worst enemies in trying to explain things clearly.
I would need to see a much more comprehensive selection of ‘fraudulent’ temperatures that had no simple explanation before I would start to view AGW as a hoax or conspiracy perpetrated by frauds. A view that doesn’t always make me popular with other sceptics.
tonyb
Tony
Given the adjustments, adjustment of the adjustments, estimates and other mathematical gyrations not to speak of the equations that could fill the Library of Congress, I am not sure anyone is in a position to criticize your work.
They certainly can feel self satisfied and comfortable with their “superior” work, but anyone with a little circumspection knows the true uncertainty, not the kind from Statistics 202, but the kind derived from watching all the sure things fall on their face, and watching the billion to one shots happen all to frequently, they will know the uncertainty about what actually has happened, is to large as to be incalculable.
There is way too much hubris and smugness in the establishment.
nottawa rafter
When the answer relies on novel proxies and highly complex statistical interpretations it is difficult to see why the climate establishment is so certain they have a thorough grasp of the climate story, whether that is the historic temperature record or why the climate behaves as it does.
tonyb
Tony B,
Thanks for your post and incredible work. You have opened my eyes to the value of Historical Climatology. You strike me as the real deal.
FOMD,
Your chart shows decreasing Antartica sea Ice “mass”. NASA shows record area:http://www.nasa.gov/content/goddard/antarctic-sea-ice-reaches-new-record-maximum/#.VOfU5_nF_CY
Please provide your source.
Danny OT a bit but concerning the SLR & previous thread on Hays study, I didn’t see in her study any reference to Houston & Dean on their global SLR analysis about 2009. They found no acceleration.
I would give you a link but I’m 1,000 miles south of home (thank goodness) and don’t know how to do that with my phone.
It has been several years since I read it and never see it referenced by other studies.
Houston and Dean
The 60-year cycle scientist:
https://www.youtube.com/watch?v=uibjA2VCf6A
I doubt he would support a single word Danny says here.
JCH,
Do you have a suggested source for evaluation of dates prior to H & D’s 1930? What date would you prefer? And, if that date is chosen is it subject to an algorithmic modification of historical information I.E. Hays?
I hope TonyB doesn’t add historic Sea levels to his body of work as it can all be wiped out at the push of a (computer) button. If folks don’t care for H&D’s “cherry picked” date of 1930, why is the date of 1900 “cherry picked” by Hays not in question vs. the 1870 record as discussed here: http://www.realclimate.org/index.php/archives/2011/07/is-sea-level-rise-accelerating/. If there was a +/- 2mm/yr in 1870 why am I worried about a +/- 1mm change now (could that be thermal expansion)?
This all seems like more of the same. NOAA has 1.7 mm/yr in their record. Why would I rely on Hay’s computer generated 1.2mm/yr (lowered from 1.6/1.9mm/yr) and why would I ignore H&D? If the studies are “cherry picking” dates are we not now “cherry picking” studies as they fit a purpose?
Regional acceleration in ice mass loss from Greenland and Antarctica using GRACE time-variable gravity data
http://faculty.sites.uci.edu/velicogna/files/2013/07/slide2.jpg
a RealClimate “denizen”
JCH,
How do you reconcile this: http://www.nasa.gov/content/goddard/antarctic-sea-ice-reaches-new-record-maximum/#.VOijgPnF_CY
Interesting video.
Good thing we know that he a rent-seeking, statist, one world government promoting, poor children in Africa starving, AGW cult member, and so we can just dismiss what he had to say. Otherwise, we might be tempted to think that he’s a careful scientist, and that ACO2 emission mitigation policies might be worth considering.
Danny,
Watch the video.
Danny, for balance here is another view of the Antarctic sea-ice expansion. Basically fresh water freezes more easily, and suddenly there is a lot more fresh water around Antarctica for some reason.
http://www.climatecentral.org/news/antarctica-ice-melt-sea-level-18155
How do you reconcile this: …
It’s interesting.
JCH,
No reconciliation at all. The charts provided indicate a “mass” loss. The link I provided indicates record ice. Is it area vs mass?
From the link you provided to RC, the last para:”Taken as a whole, these results show that there is no significant contradiction between our understanding of Antarctic sea ice and the observation that it is, in average, expanding. We can explain sea ice trends in the Antarctic rather well if we take into account the full range of changes in winds that have occurred. The average expansion of Antarctic sea ice was not anticipated, but it hardly represents any sort of existential threat to our fundamental understanding of the climate system as a whole. It’s merely an interesting scientific challenge.”
I read the mechanism of change, but if there is “record ice” how can there be “mass” loss? This became no clearer from this read. In fact, this reinforces that we don’t understand “global” climate. Heck, we’re not even getting the regions right.
Danny, it’s apples and oranges. The “mass” loss refers to glacial mass which doesn’t include sea ice unless it is “fast” as in not floating. Floating sea Ice wouldn’t impact sea level.
CaptDallas,
Thank you. So when NASA says record, they’re including sea ice (and just like in my water will not change sea volume)? When the “mass” chart shows the loss it’s referring to land. And as long as the temps remain low the area on land (glacier) ice remains but can be affected by the westerlies discussed in the RC link if those winds are warm enough. So the glaciers could be thinning, reducing mass all while area is expanding. This explains why the Gt loss is shown in this: http://onlinelibrary.wiley.com/doi/10.1002/2014GL061052/full
Seems I should ignore the NASA “record”.
Danny –
=>> ” I read the mechanism of change, but if there is “record ice” how can there be “mass” loss?”
Did you watch the video? Your question has a lot of gravity. Remember, be GRACEful.
Joshua & JCH,
I just finished the video. RCP8.5 shows (according to Dr. Chambers) +/- 1 m SLR by 2100. He also gently affirmed the indications of a 60 year cycle, and affirmed 1.8mm/SLR (which Hays has changed) historic. I learned quite a bit and he stated the current SLR is roughly equal to that of the 1930’s so I need to research that as to from where that water came. He also said PDO +/- 30 yrs as Jim D said. Interesting that a significant SLD (drop) occurred in 2011 and most was evaporated and fell on central Australia but has since re-evaporated and soak in to the ground. If that’s happened enough to create a SLD, wonder if same might be occurring today with the ice/snow in US & Canada which might then recharge aquifers. We know much, but seems there’s much we do not know. Good video.
Ministers wake up to a new dawn…
http://www.express.co.uk/news/uk/559628/Three-parent-babies-risk-human-race-says-Italian-MPs
and remembered the rainbow.
The contribution of aquifers to sea level rise has large uncertainties.
H/t S. Fitzpatrick.
================
Kim,
I went looking for a paper/study/article by Fitzpatrick w/r/t aquifers and SL and struck out. But, I’m uncertain if that was the message.
Steve Fitzpatrick at Lucia’s Blackboard several years ago. Sorry I wasn’t more explicit.
===============
Kim,
Thank you. No problem. Sometimes I get your “messages” and sometimes I have to ask, being a relative newbie and all. :)
Danny
A couple of years ago I was researching sea level rise and came across the startling fact that drawing down aquifers actually is a bigger contributor to sea level rise than melting glaciers. This article will point you in a variety of directions
http://www.theguardian.com/environment/2012/may/20/world-aquifers-rising-sea-levels
Tonyb
Tonyb,
Thank you. Somewhere I got the impression this whole climate thingy was interlaced and complicated. Hmmm.
Wrong! LIA is concocted by having a picture, people scanting on Thames. Ice for few days became 300y of ”global” ice age. Good example what climatology is…Honest people call it Renaissance. Here is the truth: https://globalwarmingdenier.wordpress.com/2012/08/25/skeptics-stinky-skeletons-from-their-closet/
Oh, well, time to weigh in with some Karl Brandi, found by Miss Wedgwood. He was talking about a man, Charles the Fifth, but as long we’re anthropomorphizing climate here among friends:
“Neither prejudice nor ingenious selection can make a convincing picture of a man, but only the strictest devotion to historic truth. Our knowledge must rest on the accumulated tradition and observation of centuries. Only by unfolding the material gradually and carefully, only by conscientiously recognizing its peculiarities and its limitations, can we draw valid conclusions. These are not to be made by rashly over-estimating, and then as rashly decrying. Only in the utmost caution and observation lies the true scientific value of historical work, and only by that can we arrive at a truer knowledge of things as they were and as they are.”
From Book Three, Chapter II of ‘The Emperor Charles V.’
I liked the ‘as they are’ at the end.
==================
A useful exercise in climate science consumer product evaluation would be for someone with the necessary qualifications to perform a detailed element-by-element comparison of the approach Tony Brown uses in producing his CET temperature reconstruction with the approach Michael Mann uses in producing his latest version of the Hockey Stick, as embodied in Mann 2015:
https://climateaudit.files.wordpress.com/2015/01/2014-bas-hockey-stick.png
Mann 2015 is being presented by the mainstream climate science community as an accurate and reasonably precise reconstruction of Global Mean Temperature for the past 1000 years.
Mann 2015 is worldwide in its spacial extent, and it merges Mann’s pre-1902 temperature reconstructions with the post-1902 instrumental record to form a unitary 1000-year GMT record. Its proxy-based temperature reconstruction for the 900-year period preceding 1902 is considered by its author, and also by the mainstream climate science community, to be as accurate and reliable as is the post-1902 instrumental record.
In contrast, Tony Brown’s CET reconstruction work is based upon data and historical information collected largely from a single geographic region, Central England. Any implications Brown’s CET analysis work might have for assessing millennial climate variability on a global scale must be inferred through appropriate assumptions which allow its conclusions to be extended outward from Central England into the much larger provenance of the entire planet as a whole.
As an exercise in evaluating the scientific credibility of two alternative approaches to performing temperature reconstruction research, Michael Mann’s and Tony Brown’s, it would seem useful to directly compare Brown’s approach to reconstructing the past climate variability of Central England with Mann’s approach to reconstructing the past climate variability of the earth’s climate system as a whole.
An element-by-element comparison of these two approaches to assessing past climate variability might include the following list of evaluation criteria:
1) Temperature Reconstruction Graphical Comparisons: Plots of the two reconstructions normalized to the same dimensional units and placed side by side for visual comparison as examples of climate science research products which employ contrasting approaches to generating their conclusions.
2) Data Quality Comparisons: An assessment and comparison of the respective data provenance facets and the data quality facets of each reconstruction which includes detailed evaluations of the quality of their respective data sources, their respective data collection techniques, and their respective data management and archiving practices.
3) Analytical Methodology Comparisons: An assessment and comparison of the respective analytical methodologies employed by each reconstruction which includes detailed evaluations of their respective data processing algorithms; their respective employment of statistical methods; the assumptions and the analysis criteria used at each stage of their process flow; and their respective approaches to documenting the end-to-end process flow of input-output data streams and data analysis techniques.
4) Post Analysis Conclusions: An assessment and comparison of the respective post-processing methods and techniques used to integrate final data outputs into a logical set of scientifically defensible analytical conclusions.
5) The Overall Scientific Credibility of the Reconstructions: An assessment and comparison of the scientific credibility of each of the reconstructions based upon an overall evaluation of the strength and professionalism of their respective approaches to ensuring end-to-end data quality objectives, a scientifically defensible approach to their analytical methodology, and a defensible approach to developing post-analysis conclusions.
In summary, the assigned task here, for whomever wants to take it on, is to compare and contrast the approaches being used by these two individuals, Michael Mann and Tony Brown, and to determine if there are significant differences in their respective research methods which might affect the scientific credibility of any conclusions they might reach.
An interesting idea BB. The CET series consists of daily records whereas the paleo series used by Mann has never been subjected to any peer review but has obvious problems in that the MWP and LIA do not show up in that series.
While it is agreed that CET needs to be treated as a proxy for the NH and hence subject to wide error bars, the Mannian series would undoubtedly have even wider error bars in a temporal and spacial sense up to the time when he spliced the modern temperature record onto his paleo series.
In this context, any comparison between the two approaches would be tantamount to comparing apples with oranges. The error bars yielded by the two approaches would be the only information of any interest.
Aren’t tree rings considered a poor proxy for climate and
wasn’t Michael Mann’s tree ring HS invalidated by the
divergence?
A study that uses different multipaleo climate proxies,
by Craig Loehl, 2007, I believe corresponds quite well
with the extended CET record.
http://climateaudit.org/2007/11/20/loehle-proxies-2/
Yep Beth. One tree seems a poor proxy in a spacial sense anyway! As for other paleo studies, such as the one by Loele, any series of widely diverse sites would have resolution and comparability issues that would invariably involve wide error bars if used for estimation of trends.
Peter D,
So many questions,
too many interactions,
so much variability,
too much uncertainty.
…
That’s how it goes.
Everybody* knows.
* Well almost everybody.
Exempt a few ‘experts’ of
the Philip Tetlock Study
category.
OK Beth. You get your reward for your pome. +1
When 1934, the year even the grasshoppers starved, got spiked DOWN on the bristlecone test, you knew there was something profoundly wrong with the thought processes of Michael Mann. It’s just a matter since of how profoundly.
Beta, You don’t really expect that to happen do you? There is no comparison. Tony is using questionable historical records of various types to compile a rough record of past climate for a select region and Mann is using questionable methods on various proxies of climate to compile a precise record of past climate by using select portions of the instrumental temperature record and select portions of his reconstructed temperature record.
http://static.berkeleyearth.org/img/annual-comparison-small.png
Mann uses scientifically approved methods to trim instrumental to the 1902 to ~1999 period of extreme accuracy to match is scientifically approved methods to trim his precise reconstruction to 1000AD to 1902AD period of extreme accuracy. He has the backing of total unbiased scientific organizations like the Union of Concerned Scientists and the Fern Bar Twitters of Climate Science, inebriated. Tony just has some blog buddies.
captain
Yeah, but Mann gets paid for his ‘questionable’ methods. I don’t. unless of course my blog buddies are just about to cough up large sums of research money.
tonyb
tonyb, “but Mann gets paid.”
Well yeah, he is a scientific superstar capable of making trees hibernate for years on end. You are the old school gentleman science practitioner serving the greater scientific good without the least concern for materialism, other than possibly a good bottle of wine or an aged steak that even vegan’s find difficult to resist.
I would though include a bit more volcanic stuff specifically Crowley and Unterman 2013.
https://lh3.googleusercontent.com/-HObQNhk_h0E/VOi6D18VxsI/AAAAAAAAMzI/2QurrlFSihk/w927-h533-no/100%2Baverage%2Bvolcanic%2Bforcing.png
You don’t have to use 100 year averages, but something suitable for the setting the CET variability stage would be nice to set you apart from the in it for the money scientific low life. .
Interesting,Tony, especially the CET data set. Your graphs involving it were unhelpful, however, so I looked at some other sources. I knew that the ENSO oscillatuion should show up in CET but the way you mangled the graphs there was no way to detect it. Its basic period is from four to five years and its amplitude at least 0.5 degrees Celsius [1]. That is enough to be observable in the presence of longer term temperature swings. Anyway, I determined that the oscillation is there and its period from 1659 on stayed within the 0.4 to 0.5 year limit at least 80 percent of the time. Its amplitude rose to two degrees Celsius in this time period at least half a dozen times, more than I had observed before. As to cycles, I will go along with a sixty year cycle but nothing else. It is quite likely that the temperature swings introduced by the presence of the ENSO peaks and valleys will randomly introduce temperature variations that cannot be attributed to longer term temperature changes. It is therefore desirable for you or for someone to accurately map the locations of all the El Nino peaks and La Nina valleys in the CET in order to ascertain that temperature variations caused by ENSO can be be accurately mapped. You will need the highest time resolution available. Do not exaggerate peak heights because it will generate noise and hide the signal if you do.
p1] See figure 15 in “What Warming? Satellite view of global temperature change” There are five El Nino peaks there that serve as a key to the ENSO oscillation.
0.4 to 0.5 degree amplitude, 4 to 5 year period is correct.
If Congress seriously investigates NASA’s tampering with temperature data, Big Brother will soon “bite the dust!”
http://dailycaller.com/2015/02/20/republicans-to-investigate-climate-data-tampering-by-nasa/
Thanks, tonyb
Well compiled and interesting – useful information
Nice work, Tony. Good to see you are spending those Big Oil $$$ on something useful! :)
One of the things that irks me about modern “climate science” is the lack of granularity – the notion of a global average temperature being the most egregious example. The work you do is immensely useful in correcting that.
It is no surprise that farmers and graziers are among the least likely groups to buy into CAGW scares. They are possibly the most weather-obsessed people on the planet, for good and obvious reasons. On multi-generational family properties, they have the records that demonstrate that there is no such thing as “normal” when it comes to annual weather. And that all weather is local, and all climate is therefore also local.
Please keep up the good work, if you are so inclined. I just wish we could get a few drops from the CAGW funding ocean to sprinkle on you.
Johanna
Thanks. paleoclimate reconstructions are like a coarse sieve through which the granular annual and regional grains fall.
We are over obsessed with average and global and miss out on the real world day to day happenings in our locality.
tonyb
Tony,
A nice job overall. Sadly though, your rearch failed to incorporate the two largest volcanic eruptions of the past two thousand years and the most active volcanic period of the the past two thousand years, all of which occured after the MWP and all of which had major impacts on global ocean heat content, and as we all know, the oceans dictate the general course of climate.
The two largest excursions (Samalas in 1257 and Kuwae in 1458) were over estimated ie the global effects over estimated by 20-30%
http://www.nature.com/nclimate/journal/v4/n8/full/nclimate2293.html
“I would like to believe your volcanic version of events as that would immediately add several degrees to the LIA temperatures and make much of it warmer than today.”
_____
Tony, you do a great job and I admire your work, but this statement is nonsense. There is no way the most active volcanic periods in the past 2000 years would “add several degrees” to temperatures. Not sure you fully grasp the real dynamics discussed in this paper:
https://staff.ucar.edu/browse/people/5568/OSGC-000-000-010-465
Rgates
But it was YOU who said this!!
Back last year I asked you a direct question as to how much warmer it would have been in this period if it hadn’t been for the constant veil of emissions.
You said up to a couple of degree and I then said it seems strange we are taking our respective positions as I was arguing that volcanos couldn’t have been responsible for the cold years whilst you said they could be and without them the world would be much warmer.
At least be consistent, else you will be like mosh who argues against himself so often I have started to note them down!
tonyb
Tony,
We are warmer today than the MWP. In the coming decades we’ll hit the warmest period of the Holocene, and then we’ll be the warmest since the Pliocene, unless of course we manage or mitigate or geoengineer our way out of the warmer future our Human Carbon Volcano is causing.
Rgates
The 1257 and 1458 volcanos were outside my timing window so it would be inappropriate to have mentioned them . They will be mentioned in the next article or were you referring to other volcanos?
The list came from the Smithsonian and could not include everything as the cause is something that needs to be tackled separately. At this stage I am more interested in the effects. I leave it to others to speculate…
tonyb
I understand, as we’ve discussed before. Sadly, your “timing window” in discussing the cooling that followed the MWP may have missed three of the biggest factors. Additionally, your failure to comprehend how really large volcanoes have an impact well beyond the immediate few years of tropospheric cooling through sea ice and ocean heat content effects seems to be a major blind spot for you.
http://www.image.ucar.edu/idag/Papers/Gleckler_Krakatoa.pdf
http://www.nature.com/ngeo/journal/v7/n2/full/ngeo2040.html
A serious discussion of the LIA period, would need to at least include this paper:
http://www.skepticalscience.com/pics/Miller_2012_LIA.pdf
So, does that mean that climate like the Medieval Optimum and today is the norm, while the LIA was an unusually cold period caused by volcanoes?
BTW: which was/is warmer? And how do you know? Bristlecones?
Rgates
I follow the data, not some model that does not reflect what sort of climate people were actually experiencing at the time. It is not a matter of failing to ‘comprehend’ it is a matter of not seeing in real life what you see in models.
I would like to believe your volcanic version of events as that would immediately add several degrees to the LIA temperatures and make much of it warmer than today. This would also put it into context with the MWP and today as one very extended period of warmth. So I am very happy to agree with you if it wasn’t for the fact that the data doesn’t.
tonyb
Rgates
Your 9.55. Of course I am aware of the Miller paper but it covers a period nearly 250 years before my study so I did not include it.
I have it earmarked for my article ‘tranquillity transition and turbulence’ which exactly covers the era that Miller references. To date I have gathered a lot of data but it is all episodic at present so I could not say definitively whether or not we are in agreement.
tonyb
Arno Arrak | February 20, 2015 at 10:16 pm
I knew that the ENSO oscillatuion should show up in CET
the CET spectral analysis for the last 100 years of relatively accurate data doesn’t show any effect of the ENSO. Strongest spectral component is at 7.7 years, which is associated with lunar tides.
http://www.vukcevic.talktalk.net/CET-sp.gif
the CET is largely affected by westerly blowing winds from the N. Atlantic, the west coast area is well known for excessively high tides.
http://www.tidetimes.co.uk/port-talbot-tide-times
vuk
I live on the south west coast in Devon. Today is an exceptionally high tide. We have just finished our morning walk to the beach to have a look. We rewarded ourselves with a breakfast. This afternoon it will be an exceptionally low tide and we intend to walk along the beach next to Brunel’s Great Western railway in order to see the rocks not normally exposed. We shall reward ourselves with a cup of tea and a toasted tea cake. It is a westerly wind today. It is very difficult to see any change in sea levels since Brunel’s sea wall was built some 170 years ago
It would be useful to think of historic temperatures in terms of tides in as much they have low points and high points which constantly change. The average tide height-like the average global temperature- is a pointless measure as if I drew a line on the beach where it was supposed to be, there would be many times when it was exceeded, many times when it didn’t reach it and a very few times when it actually reached the line and went no further. I am always looking for old tide tables to check if there is a difference in heights over the centuries but they don’t seem easy to come by.
tonyb
Not often is mentioned that for 1910-1940 period the sea lever rise was faster than in the recent decades:
http://www.vukcevic.talktalk.net/SLR.gif
tony –
==> “I am always looking for old tide tables to check if there is a difference in heights over the centuries but they don’t seem easy to come by.”
Take a look at the discussion, of tide gauges over time, in the video clip that JCH posted elsewhere in the thread – vucevik’s “not often mentioned” chart is also discussed.
Oh that Isimbard Brunel, building bridges across rivers,
gorges, flood-plains, tunneling under rivers, harbours.
So much more useful than climate modellers in cloud
towers whiling away the tenured hours.
beth
He was a great engineer. Would that we had the great Victorian visionaries today.
tonyb
Yes, he was indeed great engineer, but French born. Brunels are numerous in the south of France. The most imposing cemetery on Castle Hill, Nice (Cimetière Colline du Château) worth a visit, has a Brunel alley
Or at least his father also Isimbard Brune was.
What was the percentage of G_d fearing teachers in the golden age of Queen Victoria? Was it higher than 60%? Do you think that had any effect on the end product, the students that graduated and what they learned while in school? Think of the engineers of the past vs. the one we were given to run AGW. Who knows what’s up now…
http://earthobservatory.nasa.gov/IOTD/view.php?id=7122
As one can see from this map it shows in order to get a clear picture of how the temperatures reacted to prolonged minimum solar activity (Maunder Minimum 1660-1700) in contrast to a much more active sun(1720-1780) one has to evaluate as much of the globe as possible.
What stands out is how some places actually were warmer during the Maunder Minimum (although not many but some) then they were in 1780.
The significance of this is two fold ,first it shows that if data is derived from the wrong area or a particular place it can be very misleading, and secondly it shows that noise in the climatic system can obscure overall solar effects in certain locations of the globe probably due to atmospheric circulation pattern/oceanic circulation pattern changes in response to prolonged minimum solar activity.
One of the secondary effects I have mentioned in response to prolonged solar minimum conditions, is a more meridional atmospheric circulation pattern in the N.H. due to changes in the distribution of OZONE in the atmosphere in a horizontal and vertical.
This then leads us to Tony Brown’s study which is excellent and shows very clearly in that particular location of the globe (Central England) where he did the study, did react to a degree to changes in prolonged solar minimum activity. Not as much as some other places but on the other hand more then some other places. The upshot being not to much can be derived about the severity or overall extent of the reaction of the climate to changes in response from solar activity or for that matter the extent /severity of the Little Ice Age , from just one particular place on the globe no matter how great the study may be.
Nevertheless if one looks at Tony Brown’s data, it shows clearly that during the Maunder Minimum (1660-1700) and the height of the Dalton Minimum (1800-1820) that the ratio of blue/green dots(cold periods of time ) to orange/red dots (warm periods of time) increases significantly during those two periods of time, which correlate to prolonged minimum solar activity.
Again this has to be taken in the context with what is happening all over the globe as much as is possible, which the map I have provided shows at the start of this article.
As far as volcanic activity, data shows clearly that an increase in major volcanic activity is correlated with prolonged minimum solar activity periods of time. I have the study to show this, from the Space and Science Center headed by Dr. Casey. It shows 85% of all major volcanic eruptions (explosive index of 5 or higher) post 1600-2010 have been in association with prolonged minimum solar conditions.
There are several suggested mechanisms. What, if any, is right?
============
Here’s that same image and similar explaination:
http://images.intellicast.com/App_Images/Article/168_4.gif
http://www.intellicast.com/Community/Content.aspx?a=168
I think all of them have validity. These mechanisms have vary degrees of data to show they may indeed exist.
As this decade proceeds and the current prolonged solar minimum becomes more established once again I think answers will be coming.
This time when low average solar parameters will be attained it will be following 10+ years of sub- solar activity in general (started in earnest in late 2005) as opposed to only 3 or so years of sub solar activity before the solar lull of 2008-2010. That matters.
So, does that mean that climate like the Medieval Optimum and today is the norm, while the LIA was an unusually cold period caused by volcanoes?
AK asked .
My reply is when one takes the approach to try to suggest one item as the sole cause and effect upon the climate in complete ISOLATION from the entire spectrum of items that can influence the climate at any given time along with the initial state of the climate at any given time is heading in the wrong direction.
VOLCANIC ACTIVITY – it can does change the climate on a temporary basis but not enough to cause a Little Ice Age, lasting for hundreds of years especially if it happened many years before the unset of The Little Ice Age.
If I remember Miller, is trying to convey the notion that volcanic activity around 1250 ad somehow brought on the Little Ice Age. I say that is absurd.
I think the high volcanic activity during the Dalton Solar Minimum proves this to be the case in that the volcanic activity although very intense only had short temporary effects upon the climate lasting maybe a year or two.
Salvatore
Was this an isolated comment of yours or did the threading land you here, as we were discussing Miller a little higher up the thread?
http://judithcurry.com/2015/02/19/the-intermittent-little-ice-age/#comment-676456
Temporary effects from volcanos is all I can see in the historical observational references. Miller has a position to defend of course but the first pulse of colder than ‘normal’ weather i.e a departure from the MWP, occurred some decades prior to these volcanos and the climate appeared to revert to an MWP type era again soon after the 1300’s.
I think there are a number of different causes for the climate changes . If we likened it to a coach carrying 50 people the passengers would be constantly shifting seats and the driver would never be the same for long.
tonyb
Hi Gates
There is a gross misunderstanding of causes for the start and the end of the last Ice Age, I made comment or two couple of weeks ago.
Milankovic cycles – yes, driving tectonics in the far north Atlantic
N. A. tectonics – yes, fixing jet stream in meridional flow position for thousands of years.
Reduction of insolation due to Milankovic – NO !
According to the Cambridge University whole Siberia (even now under permafrost) was free of the ice sheet at the dept of the last glacial.
http://www.qpg.geog.cam.ac.uk/research/projects/englishchannelformation/1453389260_3dcecb561c.jpg
Miller et al. emphasizes the background Holocene Milankovitch trend towards colder, greater sea-ice, conditions that the volcanoes helped kick in the same direction. We are in an orbital phase that increasingly favors Arctic Sea ice. The fact that temperatures are now rapidly reverting to, or past, those in the earlier Holocene, and that the Arctic is warming, is an indicator of non-orbital factors superseding the long-term trend, and quickly.
Yep, and those “non-orbital” factors (i.e. external forcing from another source) are very likely the rapid increase in GH gases. This is the fact that most reasonable scientists well recognize and reasonable policy makers trying to figure out what our response and “Anthropocene Management” practices should be.
Gates see my comment above (posted in wrong place)
http://judithcurry.com/2015/02/19/the-intermittent-little-ice-age/#comment-676733
salvadore; volcanoes produce WV, CO2, SO2 and lots of heat – the hot lava is 1500-2000C! Whoever told you that volcanoes cool the planet, told you a big lie, because: Temp Self Adjusting Mechanism (TSAM) readjusts the temp because of the volcanic produced heat; nothing to do with aerosols!
The threading landed me here . Thanks.
Tony ,what do you think of the data displayed on the map I showed showing the temperature changes over various parts of the globe from 1680 to 1780? Do you think is accurate?
It is a few post prior to this one.
Salvatore.
Was it in general much colder in 1780 than it was in 1680? Speaking for Britain and Europe No.
It gradually warmed from 1680 omwards but in that period are also the very warm decades leading up the 1730’s. glaciers had started to recede by the 1750’s
Those temperature differences in the graphic seem much too large to be supportable.
tonyb
Do you think it is accurate . correction
And this is why it is so hard to get a true feeling of the gravity of the Little Ice Age. We know it happened but the data is all over the place.
Your data proves however that at the height of the Maunder and Dalton Minimums the mean temperature in Central England was lower then at other times. Although variability did exist but it was variability about a lower mean temperature.
That is the upshot your data provides for me.
Excellent job! Leads me to question whether there is, in fact, a “climate” or just weather. A climate implies a degree of constancy (perhaps of trend?) not readily apparent in the data except for the Everyman series. Two things could be interesting:
• What is the minimum time to get an Everyman series? A neat thing about 70 years is that it is long enough to go through most known cyclical phenomena at least once.
• How does the duration of the current period of warming/pause compare to that minimum? If less…
John
70 years is an understandable human number and one lifetime seems to cater for most of the cycles we know of. Certainly 2 or 3 generations give us a very good idea as to what is happening and by the time you get to ten generations the full picture is clearly revealed.
I am open to large offers for tv serialisation…
Tonyb
Terday the research study, day after termorrow the movie!
Given the revelations of the Climategate scandal I would not place an iota of credibility on anything published by Dr Jones of The CRU department of UEA. His research had been totally discredited by the
revelation of lies, errors and dissimulations revealed and his refusal to release the data and methodology with which he reached those conclusions. Falsum in uno, faslsem in omibus.
http://www.murdoconline.net/wordpress/wp-content/uploads/2011/01/gisp2-ice-core-temperatures.jpg
As one can see the Medieval Warm Period ,along with earlier warm periods was warmer then today.
Data form many different sources shows this to be so. Here is an example.
I can see that the 8th century which was very warm in Europe, was very cold on GISP2. I can also see that the great period of city building and human expansion worldwide ~4750-4500 BP was also very cold on GISP2.
Yet around 3200 BP at the late Neolithic collapse, and the collapse of civilisations around the Mediterranean including the demise of the Minoans, is very warm on GISP2.
http://snag.gy/TseC7.jpg
With the coldest periods in CET being during solar minima, the solar connection is well apparent. The colder periods follow the magnetic cycle of the Sun, roughly from sunspot maximum to maximum. In the Gleissberg and Dalton minima, the coldest run of years are 1885-1895 and 1807-1817 respectively, from and to about 1 year after the sunspot cycle maxima of the first two weak sunspot cycles. Maunder had more weaker sunspot cycles, but the colder periods still start and finish around sunspot maxima, 1672-1685, and 1687 to 1706.
Given a short solar minimum like the last two, we should very soon be seeing a decade of lots more very low temperatures even by Maunder standards as we saw in Jan+Feb+Dec 2010 and March 2013, and many wet and cool summers.
Pingback: Weekly climate and energy news roundup #169 | Watts Up With That?
R. Gates here is my explanation for Ice Ages and climate change in general.
This is an abbreviated version. My explanation unlike so many others conforms to the data it does not try to make the data conform to the explanation.
From Don Easterbrook – Aside from the statistical analyses, there are very serious problems with the Milankovitch theory. For example, (1) as John Mercer pointed out decades ago, the synchronicity of glaciations in both hemispheres is ‘’a fly in the Malankovitch soup,’ (2) glaciations typically end very abruptly, not slowly, (3) the Dansgaard-Oeschger events are so abrupt that they could not possibility be caused by Milankovitch changes (this is why the YD is so significant), and (4) since the magnitude of the Younger Dryas changes were from full non-glacial to full glacial temperatures for 1000+ years and back to full non-glacial temperatures (20+ degrees in a century), it is clear that something other than Milankovitch cycles can cause full Pleistocene glaciations. Until we more clearly understand abrupt climate changes that are simultaneous in both hemispheres we will not understand the cause of glaciations and climate changes.
. My explanation:
I agree that the data does give rise to the questions/thoughts Don Easterbrook, presents in the above. That data in turn leads me to believe along with the questions I pose at the end of this article, that a climatic variable force which changes often which is superimposed upon the climate trend has to be at play in the changing climatic scheme of things. The most likely candidate for that climatic variable force that comes to mind is solar variability (because I can think of no other force that can change or reverse in a different trend often enough, and quick enough to account for the historical climatic record) and the primary and secondary effects associated with this solar variability which I feel are a significant player in glacial/inter-glacial cycles, counter climatic trends when taken into consideration with these factors which are , land/ocean arrangements , mean land elevation ,mean magnetic field strength of the earth(magnetic excursions), the mean state of the climate (average global temperature gradient equator to pole), the initial state of the earth’s climate(how close to interglacial-glacial threshold condition it is/ average global temperature) the state of random terrestrial(violent volcanic eruption, or a random atmospheric circulation/oceanic pattern that feeds upon itself possibly) /extra terrestrial events (super-nova in vicinity of earth or a random impact) along with Milankovitch Cycles.
What I think happens is land /ocean arrangements, mean land elevation, mean magnetic field strength of the earth, the mean state of the climate, the initial state of the climate, and Milankovitch Cycles, keep the climate of the earth moving in a general trend toward either cooling or warming on a very loose cyclic or semi cyclic beat but get consistently interrupted by solar variability and the associated primary and secondary effects associated with this solar variability, and on occasion from random terrestrial/extra terrestrial events, which brings about at times counter trends in the climate of the earth within the overall trend. While at other times when the factors I have mentioned setting the gradual background for the climate trend for either cooling or warming, those being land/ocean arrangements, mean land elevation, mean state of the climate, initial state of the climate, Milankovitch Cycles , then drive the climate of the earth gradually into a cooler/warmer trend(unless interrupted by a random terrestrial or extra terrestrial event in which case it would drive the climate to a different state much more rapidly even if the climate initially was far from the glacial /inter-glacial threshold, or whatever general trend it may have been in ) UNTIL it is near that inter- glacial/glacial threshold or climate intersection at which time allows any solar variability and the associated secondary effects no matter how SLIGHT at that point to be enough to not only promote a counter trend to the climate, but cascade the climate into an abrupt climatic change. The back ground for the abrupt climatic change being in the making all along until the threshold glacial/inter-glacial intersection for the climate is reached ,which then gives rise to the abrupt climatic changes that occur and possibly feed upon themselves while the climate is around that glacial/inter-glacial threshold resulting in dramatic semi cyclic constant swings in the climate from glacial to inter-glacial while factors allow such an occurrence to take place.
So AGW is random terrestrial event, possibly buffering us from onset of glaciation, and marveling the biome to boot. I suppose I missed a little bit on the way through that, well worth a reread.
=================
Ah, it’s the timing, as I’ve thought all along. So? Develop at all possible speed.
Well, surely there are other options, but that seems safest.
========================
I have no doubt about the precision, it is rather the calibration used to determine the final results.
Tony,
I thought you would be interested in a simulation of LIA cooling:-
Spontaneous abrupt climate change due to an atmospheric blocking–sea-ice–ocean feedback in an unforced climate model simulation (Sybren Drijfhout et al., Univ Southampton 2013)
Univ News item says:-
The model demonstrates that an initial cooling can start with a period of enhanced atmospheric blocking over the north Atlantic, reports the paper entitled “Spontaneous abrupt climate change due to an atmospheric blocking-sea-ice-ocean feedback in an unforced climate model simulation”. In the real world, such north Atlantic blocking patterns are a feature of cold European winters and they allow cold Arctic air to flow further south.
The climate model shows how prolonged atmospheric blocking results in an expansion of sea ice off the eastern coast of Greenland. Surplus sea-ice drifts south and melts leading to a build-up of fresh water which then shuts down warming ocean convection in the Labrador sea between North America and Greenland. This in turn leads sea surface temperatures to drop.
The paper is well worth a read – it was a 1000 year run with sharp ups and downs.
Rgds,
Ann.
anng here is what I think. It is similar to what you just sent
Solar/Thermohaline Circulation/1470 year climate cycle connection –
Southwest Weather, Inc. supports the theory that states the superposition of the DE VRIES – SUESS 210 year solar cycle, and the Gleissberg 87 year old solar cycle creates a solar variability every 1470 years, that impacts the fresh water concentrations put into the North Atlantic, which in turn either weakens or strengthens the Thermohaline Circulation. The effects, depending on the initial state of the climate; that being glacial or interglacial. Since we are currently in an interglacial period, we will examine the Solar/Thermohaline circulation possible connection for this initial state of the climate when solar activity is in a minimum state.
OVERVIEW
The connection between the Thermohaline Circulation and the Solar Cycle is if solar activity should reach a certain level of activity, it could through a modulating effect of the atmospheric circulation, either amplify or reduce the amount of sea ice entering the subpolar North Atlantic. This would then change the fresh water concentration of the subpolar North Atlantic, leading to a change in the North Atlantic Deep Water (NADW) production, which would either enhance or decrease the Thermohaline Circulation.
FOR EXAMPLE:
If solar activity were to reach a certain minimum magnitude (every 1470 years), it could modulate the atmospheric circulation, resulting in a negative Atlantic Oscillation (NAO), which in turn would amplify the transport (due to a stronger northerly wind flow over the North Sea to the Sub Polar North Atlantic, in response to a negative NAO) of drift ice into the Sub Polar North Atlantic, causing the salinity concentrations and the temperature of the Sub Polar North Atlantic waters to decrease. (Density decreases overall despite colder water temperatures)
This would cause a reduction in NADW formation, which would lead to a weakening of the Thermohaline Circulation. The result would be a further cooling in the higher latitudes, due to less northward transport of heat via the Thermohaline Circulation.
This would then have a PROFOUND EFFECT on the temperatures of the Northern Hemisphere much MORE, then what the solar reduction in activity itself would suggest.
Tony writes:
“The effect of sunspots on the climate is contentious. Looking at the data in Figure 8, it appears that the impact of the second half of the Sporer minimum on temperatures is difficult to discern.”
My contention is that there were two solar separate minima, one starting in the 1430’s, and another starting from the 1560’s. The Wikipedia description of the Spörer Minimum being from 1460 to 1550 misses some of the coldest decades in both of those centuries.
http://booty.org.uk/booty.weather/climate/1400_1499.htm
“The 114.25271-year length of secondary solar cycles is supported by [Scafetta, N. Empirical evidence for a celestial origin of the climate oscillations. Journal of Atmospheric and Solar-Terrestrial Physics, 72, pp. 951-970, 2010. ] which discusses an evidence of the existence of 60-year (about half of 114.25271 years) long cycles in nature. The 114.25271-year length of the secondary solar cycle might also be the reason why the Chinese Zodiac is comprised of 12 (about one tenth of 114.25271) years/signs and why the Chinese time counting involves 60-year cycles.” ? http://www.sciencedaily.com/releases/2010/09/100913080827.htm
“This article describes authors’ observation that the seismic activity seems to show better correlation with cosmic rays, as measured by cosmic ray intensity and abbreviated by CRI, rather than with solar activity as measured by sunspot numbers and abbreviated by SSN…….the periods between the Oort and Wolf Minima and between the Spörer and Maunder Minima
contain two rather than one secondary solar cycles merged together. Since both the arithmetic and geometric means of 112.2727 and 116.25 are correspondingly 114.2527103 and 114.25271, both the arithmetic and geometric means of the which are approximately 114.25271”
http://arxiv.org/pdf/1403.5728v2.pdf
The solar minima are on average roughly ten solar cycles apart. The long term mean over 6000 years with my planetary model of the solar cycle is around 108.3 years. Very close to the 107 years that Leif Svalgaard says is the only regular long term periodicity in solar cycle size.
Tony
I have read the paper and the comments. I write to comment on the paper.
There is much interesting information but the conclusions are not clear. Were I asked to peer review it my recommendations would include a call for an Abstract and a Conclusions section.
The take-home message I obtained from the paper is that the LIA was not a period of consistently colder climate than now, but cold winters were more common in the LIA than recently. Is my understanding correct, please? If so then this is an important finding.
Richard
Richard
If this were for peer review (which some have subsequently suggested) I would write it in a different format and include the elements you mention.
However, if you make a definitive conclusion on a blog such as this, some people immediately become adversarial, so I prefer them to look at the data for themselves and take their own message home.
I think your take home message is correct. There were many periods when the climate between then and today would be interchangeable, but undoubtedly there were more (very) cold winters, so overall it was a period of greater variability
Tonyb
You’ll be wanting to note the proper form of Jean Grove’s surname: Grove, note Groves.
You might also want to take into account the second edition of her book, which appeared under the title Little Ice Ages Ancient and Modern, and appeared in 2004 (3 years after her death). The book argues that the glacial record points to periods of cooling which were more numerous and less continuous than was believed to be the case 30 years ago (i.e. when the first edition came out). Cooling in this climatic sequence was not uniform or without interruption, and the LIA had predecessors occurring at intervals of several centuries throughout much of the last 10,000 years.
J Grove
Thank you. I have read volumes 1 and two But not sure if I have read the version you reference. I will check it out. Thank you.
Tonyb
Tony,
Very interesting article on how humans caused a global decline in CO2 during the LIA – Around 1600-1610 to be exact. This is now being given a geological identifiable period of global change brought about as the result of human activity that may be the beginning of the Anthropoocene.
http://phys.org/news/2015-03-epoch-defining-humans-dominate-planet-earth.html
Did humans, volcanoes, and the sun all contribute to LIA cooling? Good questions.