
by Judith Curry
Here’s something that should prove entertaining for a Sunday.
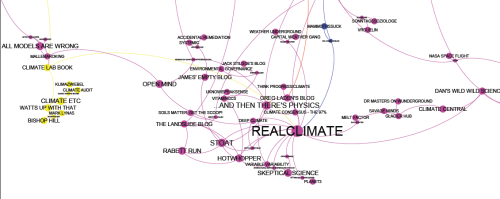
Paige Brown Jarreau has performed a very interesting survey among science bloggers. She has published a fascinating network analysis of science blogs [here]; the survey asked every blogger to list three other regularly read science blogs. The more incoming links, the bigger the dot and name. The links do no show in which direction the link runs. The smallest print is for blogs that participated, but have no incoming links.
Victor Venema has done a blog post with the climate segment of the blogosphere (click on the diagram to blow up):
The title of Victor Venema’s blog is Blog network analysis: WUWT & Co isolated from science. Excerpts:
Emphasized by the automatic coloring scheme is the splendid yellow isolation of WUWT & Co. If there would be no link between WUWT and the Climate Lab Book, they would have no link to science whatsoever. This network analysis could be used to determine who is eligible for a bloggie in the category science.
On the other hand, the purple climate and geo sciences cluster is clearly well embedded in the scientific community. The blogs Climate Etc. and Klimazwiebel often talk about building bridges to the mitigation sceptics. Maybe they should put a bit more emphasis on building bridges to the scientific community. (And I sometimes wonder why they do not want to build bridges to alarmist activists as well.)
JC comments
I responded to this survey, but did not list any blogs that I read regularly (you can see the ones that I read from my blog roll). Paige advertised this primarily on twitter as far as I can tell, so bloggers who are not active on twitter wouldn’t have spotted this. Further, you would have to be somehow connected to Paige’s extended twitter network to have noticed this.
A number things struck me about this diagram. First, the relative ‘size’ of the blog names (related to the number of times mentioned); this does not relate very well to blog traffic in terms of readership, where WUWT has several orders of magnitude more readers than any other blog on the list.
The second thing that struck me was the left vs right hand side of the diagram. All Models are Wrong (Tamsin Edwards), Climate Lab Book (Ed Hawkins), Climate Etc. and Klimazwiebel are relegated to the left hand side of the diagram, along with Climate Audit, WUWT, and Bishop Hill. On the right hand side, the only blogs by practicing climate scientists (at least that I can identify) are RealClimate, Variable Variability (Venema) and James Empty Blog (James Annan). Although there are a number I have never heard of that might be written by practicing climate scientists (e.g. Glacier Hub)
And Venema thinks the right hand side of the diagram represents ‘science’? With HotWhopper, Greg Laden, ThinkProgress, Rabett Run, DeepClimate? Ouch.
Lots of interesting blogs not mentioned here, e.g. SOD.
It would be interesting for someone to do an analysis of the climate blogosphere in terms of blogs that other blogs actually link to in posts, and also blog rolls of individual blogs. ATTP and HotWhopper (among others) link to Climate Etc. very frequently.
In any event, something entertaining to discuss during the holidays.

Climate Change Science is isolated from the world! Is worse than we thought!
From what I understand even the Catholic church has stopped believing its at the center of the universe and yet here we have a true believer producing an elegant diagram to prove that he and his friends occupy that very ground. Congratulations Venema, you should give yourself a hearty pat on the back. It’s the ConsensusCentric model of the Universe
Yer trial starts termorrow.
By order, The CCS Inquisition.
Teh big pitcher. Any questions?
http://minnesotansforglobalwarming.com/m4gw/2010/07/16/greenhouse_gases_in_atmosphere.jpg
Top News Stories of 2014:
1. Global warming hiatus mystery
2. Warming pause outbreak
3. Leftist killing of the free enterprise economy
4. Obama administration scandals
5, Climate science is anti-scientific method
6. Global warming alarmists not very liberal
7. Eurocommunism in turmoil
8. Saudis save economy by lowing gas prices
9. N. Korea dictates US theater policy
10. Plants found that love CO2
Wagathon
You missed out on a bigger story which is that under Obama, America has fallen from 9 th to 21 st in the personal freedom rankings
http://www.dailymail.co.uk/news/article-2841482/US-falls-FRANCE-global-personal-freedom-rankings-plummeting-12-places-Obama-administration.html
You now rank below costa rica.
Tonyb
WHAT ! I can’t believe all those EuroCommie countries ranked ahead of the U.S. in personal freedom. That’s a lot of baloney.
I’m an American and I have just as much personal freedom as I ever had.
OK, I had more when I was single.
Max, OK, Cub Reporter…
There’s no question we have less in the way of privacy rights these days. You’re just not paying attention. I suppose I can understand that given your intellectual laziness in general. However, how you could have missed that you’ve got less rights when it comes to your own medical care is beyond me.
Have you tried starting a new business lately?
Pokerguy, if you believe you have lost privacy rights, would you describe what rights you believe you have lost, and any consequences you have suffered?
I’m not aware of losing any privacy rights, but I haven’t thought about it much because I rarely do things I wouldn’t want people to know about. If you tell me what privacy rights you have lost, I may be able to empathize or at least sympathize.
I really do want to know about your concerns, and I promise I won’t try to make fun of you like I usually do.
Well of course it has dropped, tony.
America has been run by a “tyrant.” Fortunately, Republicans and conservatives realize that, and it shows up in that poll.
Also you will find that since Obama has been elected, a much larger number of Americans feel that their president isn’t a citizen.
A much larger % thinks that their president is a Muslim.
And a much larger % thinks that their president is the anti-Christ.
All under the Obama administration.
Prominent among the variables for personal freedom were tolerance for immigrants, tolerance for minorities, and satisfaction with freedom of choice.
Why do you suppose we have fallen on those measures?
Might not have that much to do with Obama.
Max,
I’m not going to do your homework for you. Read the newspapers and not just the NYT”S. Think more. Question more. You’re not a stupid fellow…although you’ve give no indications of being particularly intelligent. either. Where do you stand on the MAnn lawsuit? If you’re rooting for him to prevail, I can only conclude that you’re genuinely oblivious to the free speech implications of such a victory…or that you simply don’t care. Either way, it doesn’t reflect well on you.
JOsh,
I’ve never seen anyone work so hard at being funny… and failing so abysmally Serious question, do you ever begin to bore yourself? It’s ok, sometimes I can bore myself, but then my standards are higher than yours.
Pokerguy, you can’t remember what you said from one post to the next.
First, you say “There’s no question we have less in the way of privacy rights these days.” (12/28 12:22 pm)
I respond by asking you to “describe what rights you believe you have lost, and any consequences you have suffered” (12/28 8:53 pm)
Next, rather than address my question, you change the subject by bringing up loss of “free-speech,” which is a different issue. (12/29 2:17 pm)
Pokerguy, what you are losing is your memory. Either that or you decided to dodge my question.
Free speech isn’t a right?
Free speech is a right, as is the right to sue someone for abusing that right.
But the topic pokerguy brought up was privacy rights, which he then forgot or didn’t want to talk about.
@MAX_OK
“I’m an American and I have just as much personal freedom as I ever had.”
Ain’t no dry counties in Europe! :-)
R.
I would expect that the (liberal) climate advocacy blogs to “naturally” fall out on the LEFT side while conservative blogs those calling for truth in science, proper use of the scientific method, evidential attribution, Popperian falsification etc. on the RIGHT. As done it was probably either done with tongue in cheek or purely by accident. Usually these things are done by people to prove their point not to show the world as it is. Take it with a grain of salt as they say.
the interesting thing is that climate is a very small segment of the overall study, and the mapping was done objectively (Paige Jarreau doesn’t seem to have a dog in the climate wars)
Judith
That’s a terrible survey if it was limited to a few people that happened to be reading the sporadic tweets of some random and little known web site. Hardly a methodology that inspires confidence in the objectivity or value of this survey.
Tonyb
Indeed, Tony. Web network analysis is a well developed science but this study looks pretty junky. Links and link transiting activity can actually be measured,
This would appear to be more of an “interest” survey than a “science” survey – it’s hard to imagine that anyone who has dared to question the pronouncements of RC by commenting there would classify it a “science blog”.
Another intersting comparison, at least for climate blogs, might be published links – to vs from. IOW, do you link to those who link to you, do you link to only “your” side etc.
Well, summoning the spirits of Wegman and his grad student, mapping social networks has a variety of protocols to insure completeness as well as objectivity. I hope these folks read their Wikipedia, at least.
We know that many of the purple dots are regular readers of Climate Etc., because the text of their posts reference Judith, her topics and her awfulness/wickedness/heresy/whatever. It is a conscious strategem to never link to her, so there’s a bit of extra work involved to tease out her influence.
The kind of work that rarely gets performed in SNA exercises, unfortunately.
A critical part of the original study was the science bloggers who were active on twitter. It would be interesting to compare that list to Tamsin’s on https://twitter.com/flimsin/lists/climatescientists/members
When you read the text that goes with the chart:
“Here it should probably be mentioned that a link is not necessarily a recommendation. I know of some US climate scientists that keep an eye on WUWT to know of the latest nonsense story before the journalists start calling. You can be sure that they do not read WUWT to learn about the climate system. The isolation was to be expected given the quality standards at WUWT, which do not fit to science.” No doubt they never inhaled either.
It is obvious this is the latest round of the 97% meme.
“I know of some US climate scientists that keep an eye on WUWT to know of the latest nonsense story before the journalists start calling.”
______
I think they have better things to do than keep up with the pseudoscience chatter.
I find WUWT quite useful and informative, Gates, so I guess yours is the pseudoscience. (If you are so foolish as to begin name calling be prepared for it to come around to you.)
Most active research scientists struggle to keep up with all the various papers coming out pertaining to their field of specialty and closely related fields, not to mention their own research, plus any additional duties, if they teach for example. With only so many hours in a day, time spend on social media sites will be minimal at best. The word gets out on which sites are worth the time and if a scientist is unaware (unlikely) a quick check on the postings tells them all they need to know.
you’ve got to be up to your eyeballs with half facts, Gates. How could one possibly post as many times as you do at the length you do and possibly know all you think you know? and then you spend a lot of time on this forum while stating that no one in their right mind would spend their time on blogs like this. (!?)
Half truths, no – Partial truths..
How do you know that “most active research scientists struggle to keep up with all the various papers”? Most good scientists spend most of their time doing experiments, a field work, or a theoretical work to explain experimental results. They are in touch with other groups doing similar research.
If you are concentrating on very active researchers who sift through other’s papers and publish articles about a 97% consensus, I feel with you, but I can not help you.
Good Lord, R. Gates! Do you actually believe what you just said? Or do you just want to believe?
He’s a human volcano of nonsense
“Radical Rodent | December 29, 2014 at 12:38 am |
Good Lord, R. Gates! Do you actually believe what you just said? Or do you just want to believe?”
——
That real working scientists don’t have the time to waste hanging out at WUWT? I am sure of it. Except perhaps for a good diversionary laugh, like reading The Onion.
Well they sure found a lot of time to hang out at RC
“Well they sure found a lot of time to hang out at RC.”
_____
It’s simply knowing where the best use of your time is and whether you’re searching for a quick laugh or bit of entertainment or something actually akin to science.
R Gates, I’m sure many will agree with you
A notable omission from the diagram is the data blog ‘ Wood for Trees’ – at least, I couldn’t find it. Though correlation is not causation, it would seem to give some weight to the hypothesis that data is not important to the policy-led post-normal Climate Activist.
97% as applied to blog network analysis.
Hot news!
Rare visitor seen briefly at Real Clmate demonstrating the cutting edge Analysis that shows that 97% of all climate bloggers avoid pseudo scientific web sites such as Real climate and Rabbett Run and visit Wuwt and CLimate etc.
Tonyb
this is at a contrast with Dr Warren Pearce’s & Dr Brigitte Nerlich’s peer reviewed work? ;-) (the big purple dot – high connectivity, is me)
http://exchange.nottingham.ac.uk/research/communicating-climatechange-on-twitter/
http://www.plosone.org/article/info%3Adoi%2F10.1371%2Fjournal.pone.0094785
and Amelia Sharma’ns peer reviewed work?
http://eprints.lse.ac.uk/56519/1/Sharman_Mapping-climate-sceptical-blogosphere_2014.pdf
Methodological issue, those in a cyber ghetto, only talk to each other, thus this is what was found?
“What would it look like if you asked 600+ science bloggers to list up to three science blogs, other than their own, that they read on a regular basis, and then visually mapped the resulting data”
(why not make it 10? ie top 3 would miss out lots of blogs, I read regularly)
Actually this seems to support Warren’s work, he found like seems to talk to like… which explains Sou, Realclimate, etc,etc)
With the exception, that UK blogosphere which was much more diverse (but this was on twitter).
Methodological oversight (human nature)
Blogs like Andthersesphysics, Realclimate, won’t even list sceptic blogs on their blogrolls (less a member of the public, clicks on one and reads it?!) , such is there insular thinking so whilst they ‘read’ the sceptic blogs (a lot, to moan about them) they would never admit it!? ;-)
Sou for example (as did ATTP originally), EXISTS to mock/take down Watts Up With That – how can she possibly say she does not read WUWT !!!
Of course Sou doesn’t list WUWT as one of the science blogs she reads- it’s not a science blog.
Here is the original survey.
http://www.scilogs.com/from_the_lab_bench/a-network-of-blogs-read-by-science-bloggers/
It is nicely done but it comprised of only 600 bloggers who are by no means representative of the Blogging science community and seems to be a self selecting sample of people that happened to respond to a selection process that hardly seems represntative, rigorous and extensive.
Tonyb
Yes, self selection is by far the biggest bias. One can also ask about the response rate but there is no way to know.
OMG – a blog survey on science blogging doesn’t reach the standard of a RCT !!
Oh, the concern!
“the survey asked every blogger to list three other regularly read science blogs?”. What here is the meaning of “blogger”. I presume it means the one person per blog that runs the blog. eg, Judith Curry for Climate Etc, Gavin Schmidt for RealClimate, etc. Now obviously, these people will actually read many science blogs, but they will predominantly read those of their own “side” of the argument. So when asked to nominate only three, the division shown by the chart is inevitable. IOW, it is an artefact of the procedure used.
But it gets worse. By asking only a limited number of “sceptical” bloggers, and a large number of “alarmist” bloggers (and the survey has clearly extended the notion of “scientific blog” quite dramatically on the “alarmist” side only), obviously the link counts will be much higher for the “alarmist” blogs than for the “sceptical” blogs. So the link counts are also an artefact of the procedure used.
And then just for good measure, a dark colour was used for “alarmist” sites, and a pale colour for “sceptical” sites, so that optically the “alarmists” dominated even more.
WUWT lists 50 blogs with “skeptical views”. If the survey had covered all 50, the divide would probably still have been there, but the “sceptical” websites would have dominated.the chart, with the “alarmist” sites looking like the minor side. IOW, the appearance of the chart depends only on the number of bloggers used on each “side” and on the colours used – and nothing else.
Entertaining more than informative is this survey. For some It probably would serve best as a map of the central towns of Consensus & GroupThink versus the outlying suburbs of Skepticvillle and Pseudoscientopia. For others, it probably does provide a good general map of real science being discussed on the web versus pseudoscience and entertainment. For me, a Sunday diversion and bit of cyber chatter as my attention is focused on some early release drafts of some very interesting papers coming out early in 2015. Oh my, what a year it will be!
I would encourage everyone to read or re-read this article as a warm-up for 2015:
http://phys.org/news/2014-11-scientists-distinguishes-science-pseudoscience.html
I agree that CAGW is pseudoscience. It explains everything and is infalsifiable. But what does this have to do with the thread topic? Or don’t you are about that?
From R. Gates’ citation:
Hypothesis testing is the first victim of pseudoscience. The conclusions are already known, and the data and analyses are (consciously or unconsciously) chosen to reach the desired conclusion.
Pretty well describes Mann’s work, doesn’t it?
This quote is key to the understanding of the power of pseudoscience:
“But the most dangerous pseudoscience is not produced (by) amateurish cranks, but by a minority of qualified scientists and doctors. Their pseudoscience is promoted as science by think tanks and sections of the media, with serious consequences.”
Read more at: http://phys.org/news/2014-11-scientists-distinguishes-science-pseudoscience.html#jCp
Well. you are kind of right.
80-90% of science is pseudoscience.
A non-replicatable study is pseudoscience.
Any study used as a basis for Federal purposes (policy, “adjusting data”, etc.) should have to be replicated and reviewed by a team of engineers and statisticians incentivized to provide hostile review.
Over 97% of scientists suffer from consensus bias, are active members of environmental organizations stack peer review panels, etc.
The current problem in science is you can’t trust what you read.
R. Gates – many of your favorite studies would do badly if seriously reviewed. Until serious review is applied to studies used for Federal purposes we don’t know if science is guiding us or misguiding us.
Hopefully, there will always be a minority of qualified scientists attempting to falsify the consensus scientific dogma. In reality, the most dangerous pseudoscience is produced by a majority of “qualified” scientists, the consensus science being protected by group-think and peer pressure. Pseudoscience exists on both sides of the CAGW issue but we all know which side is heavily policed for political correctness. But Gatesy in his wisdom thinks that the essay he links to applies only to the skeptic fold.
Early release drafts of some very interesting papers?
You are obviously referring to my forthcoming article ‘tranquility, transition and turbulence.’
Thanks for the heads up.
Tonyb
I’ll add it to my lengthy list of reading Tony. Can’t wait!
Tony
I also look forward to the article.
Been thinking: It appears that one the assumptions in climate science is that natural variability contributions to SST over time s zero. It also appears that SoD accepts this assumption, but does not accept that a 30 year period is long enough to determine even a 100 year projection. And perhaps even 2000 years is not long enough. With your knowledge of past climate, what do you say?
Richard
Richard
Natural variability can be seen in land temperatures, glacier movements and arctic amplification melting sea ice. That change in temperatures in turn facilitates changes in sea levels.
Logically those would seem to be interconnected and clearly warmer seas also increase it’s volume and therefore it’s height.
Natural variability as regards wind strength and directions levels of sunshine and clouds ate also apparent.
So I have no doubt that sst’s are affected by natural variability but how it can be directly measured with any certainty is another matter.
Tonyb
Tony
Thank you.
Richard
ATTP seems to be the most common thread between the “sides” if I’m understanding the chart correctly. This, plus it seems to show that the “sides” don’t cross over very much.
wow, a model of an echo chamber.
Any study that lists HotWhopper on the side of science has the most bizarre definition of “science” that I can imagine …
w.
Willis, an apt summary. Good catch. Regards.
Willis E wrote:
“David, neither you nor Ms. Hotwhopper seem to understand that there is some sunlight above the Arctic Circle every single month of the year.”
Sure Willis. But it in no way compares to that present during June, July and August, does it? And that’s what you messed up. That’s what you’re scrambling to cover here.
You booted it. It happens to everyone. Man up, like the scientist you pretend to be.
David Appell (@davidappell) | December 29, 2014 at 3:44 am |
David, I wanted to make one more point.
During June, July, and August. the area above the Arctic Circle receives about 17,670 W-months/m2 of solar energy. During the rest of the year it receives about 14,180 W-months/m2 of solar energy.
In other words, the area north of the Arctic circle receives about 55% of its energy during JJA, and about 45% over the rest of the year.
So it is simply not true to say that the solar energy received during JJA “in no way compares” to the energy received the rest of the year.
w.
Grrr … copied down the figures for the full 14-yer length of the CERES dataset, and not the per-year. The per-year figures are 1,240 W-months/m2 for JJA, and 1,013 W-months/m2 for the rest of the year.
Of course, the 55% and 45% figures for JJA and for the rest of the year are correct, and my point remains unchanged—solar input over the rest of the year is not some trivial amount of the energy as you tried to claim. It’s 45% of the yearly total, an amount far too large to ignore.
w.
Why am I suddenly put on moderation???
Willis: You barfed. Deal with it.
Like you say, in 3 months, above the arctic circle receives more than half or most of the sunlight it gets in a year, the other 9 months are therefore, rather dark.
June, July and August are also when most of the ice melts in the Arctic. The minimum is shortly after the period of maximum insolation.
Contrast that to Antarctica, where the maximum ice extent is in the winter, when it is mostly dark, the maximum is shortly after the minimum insolation.
One affects the albedo more than the other.
bobbi is baaaack!
bobbi foolishly utters: “the other 9 months are therefore, rather dark.”
Willis correctly observes: “In May, for example, the downwelling solar above the Arctic Circle averages 417 W/m2 (on a 24/7 basis).”
Is May one of your rather dark months, bobbi?
bob droege | December 29, 2014 at 4:48 pm |
I said nothing of the sort. I said that the split was 55% JJA, 45% the rest of the year … which is certainly not “most of the sunlight” in JJA, it’s only slightly more than half.
And as Don noted, I also said that in May the average TOA solar is 419 W/m2, which is not “rather dark” in anyone’s universe. In fact, at the North Pole the sun never sets in May … “rather dark”? Not …
Bob, let me recommend that you and David and the moonbat over at HotWhopper do what I do—RUN THE NUMBERS FIRST, so you don’t embarrass yourselves with these foolish claims about the timing and extent of the darkness in the north.
w.
I was just pointing out that the arctic gets over half its light in one quarter of the year, so yes compared to June, May is rather dark, as May is not as bright as June.
You know, one of the accepted definitions of most is a majority.
“1.The definition of most is the majority or the greatest amount, degree or size.”
Do you want for me to post the definition of “rather” as well.
The arctic certainly gets more sunlight in June July and August than the rest of the months combined.
But what about the main point on the effect on the albedo?
Your foot is still in it
bob droege | December 29, 2014 at 4:48 pm |
bob droege | December 29, 2014 at 7:33 pm |
Sorry, but “rather dark” doesn’t mean an average of 419 W/m2. And if you had actually meant “May is not as bright as June”, you’d have said so. Good try, though.
Say, that’s some fine and fancy footwork there, bob. You said it was “more than half” OR “most”, so obviously you weren’t using your new-found definition when you wrote it. Impressive tap-dancing, though.
True … but then that’s not what Ms. Hotwhopper and David were claiming … they were claiming that I was analyzing albedo in the darkness, more fools they.
Good heavens, bob, what are you now calling “the main point”? And what is “the effect on the albedo”? The effect of WHAT on the albedo?
Nobody has said a single word to date about a “main point” or about the effect of some unknown something on the albedo, so what on earth are you mumbling about?
And more to the point, there is an active discussion of all of this on the thread itself, where your comments would actually be on topic … so why are you spouting off here, and yet so silent there, droogie?
w.
JC SNIP
Willis, I rarely post on WUWT, since the food fight that birthed the realscience blog anyway.
But I like your WUWT post, it being actual evidence and proper analysis of a positive feedback.
Don’t think you meant to do that, now did you?
I like it here, there is more balance than WUWT and more science.
I post a lot at the international skeptics forum, but not so much on the global warming threads there, it is too one sided there, they don’t put up with much but there is no censorship as long as you behave, you would have better luck at RealClimate.
Troll score for today is 3 bobbies, a droogie and a JC snip.
not bad for two posts, but it’s druggie.
At least she knows when the Arctic is dark.
Yes, David. She thinks that everything north of the Arctic Circle is dark nine months of the year. I know this because when I protested against an albedo study that only used three months of the year, she claimed that I was studying albedo when it was dark … perhaps she hasn’t noticed that even the north pole gets sunlight six months out of the year, and as you go south towards the Arctic Circle you get more months …
So I’d have to say that neither you nor she knows when the Arctic is dark, which is why calling her site “scientific” is hilarious … and why folks pay so little attention to your claims.
My post on the albedo is here.
w.
Willis: Face it, you barfed on that post and Sou, rightly, ridiculed you for your big error. It happens to everyone. Accept your mistake, take your lumps, and try harder next time.
David Appell (@davidappell) | December 28, 2014 at 7:28 pm |
“Barfed”? Is that a new scientific term?
My “big error”? Which error would that be? Sou made the hilarious claim, as did you just above, that I analyzed the arctic in the dark, as though there were only three months of light in the arctic. That’s her big error (and yours) … but what was mine?
In addition, the three months they used for their study (June, July, and August) were cherry picked, as they were neither centered on the solstice, nor centered on the time of greatest albedo.
w.
Willis: You wrote:
“I’m looking at what happens over the whole year, since that’s what really matters. … ”
(te he). Nor is there any “cherry-picking” with looking at Jun-Aug — those are obviously the important months of the Arctic year.
http://blog.hotwhopper.com/2014/12/wondering-willis-eschenbach-looks-for.html
David Appell stupidly said:
“(te he). Nor is there any “cherry-picking” with looking at Jun-Aug — those are obviously the important months of the Arctic year. ”
Maybe more important, hardly THE important ones. You’re as desperate as Sou to say that Willis didn’t know. That’s why you both quote out of context.
David Appell (@davidappell) | December 29, 2014 at 12:17 am |
David, neither you nor Ms. Hotwhopper seem to understand that there is some sunlight above the Arctic Circle every single month of the year. And even at the North Pole the sun is visible for six months out of the year … so if you only look at June-July-August, you’re missing half the sunny days (and more than a third of the incoming solar energy) at the North Pole. And you are missing more and more days of sunshine as you move south towards the Arctic Circle.
Next, if we want to understand the changes in the energy budget of the Arctic, we need to look at the whole year, not just a quarter of the year.
Next, it’s by no means clear that June-July-August are “obviously the most important months”. All of the months are important. Heat that is added in May or September doesn’t magically vanish or become unimportant. It is all part of the energy balance. In May, for example, the downwelling solar above the Arctic Circle averages 417 W/m2 (on a 24/7 basis). You can claim that you should ignore that very large amount of solar radiation, but me, I think it needs to be included along with the other months if we want to understand what is happening with absorbed solar energy above the Arctic Circle.
And in fact, when we look at the trends in absorbed sunlight they are very different depending on whether we look at a quarter of the data or all of the data, no matter which quarter of the data we might pick. Only when we look at the whole year can we understand the overall changes.
Finally, when you select subsets of the data, such as only looking at three months out of the year, you need to find stronger correlations for them to be statistically significant … something which the authors of the original study didn’t mention at all.
So I’m sorry, but neither you nor Ms. Hotwhopper have given any evidence that I made a “big error” as you claim.
w.
PS—by the way, according to Webster’s it’s spelled “tee-hee” …
Oh my!
Next thing we’re going to have David Appell pronouncing that the Arctic only loses heat for three months of the year as well.
Willis: stop scrambling to try and contain your error. You goofed up. Be a man and accept it.
David Appell, a word to the wise – before attempting to ridicule someone, first make absolutely sure that you have your facts straight, otherwise the ridicule will boomerang right back at you.
I know I shouldn’t, but it is slightly on thread, Arctic
night and day topic, and it is the festive season …
Science bloggers were asked which science blogs they read. This explains why none listed WUWT – it may be read by lots of folk but it is not a science blog. On the other hand, hot whopper (a science blog) is read by science bloggers.
WE will tell you what a scientist is and what is science.
http://en.wikipedia.org/wiki/Michael_Mann_%28climatologist%29#mediaviewer/File:Mann4.jpg
Me
Joshua goes to hot whopper so he will no doubt be pleased that are you elevating his status to that of science blogger. Some here unkindly call him other things.
Tonyb
WUWT, its like porn, no scientist is going to openly admit to reading it.
“On the other hand, hot whopper (a science blog) is read by science bloggers.”
Strewth!
You’re funny!
“WUWT, its like porn…”
—–
Please send this to Anthony right away. Besides getting a good laugh, he might find a way of associating it with keywords and drive traffic to his site.
Hmmm.
So tonyb goes of the cheap shot.
Interesting.
Joshua
No I didn’t. I called attention to your visits to Hot whopper and said some here might not call you a ‘science blogger’. I made no shot cheap or otherwise .
You often read far too much into comments and that was one of the times.
tonyb
Dave, you still haven’t said what the error is.
Willis, you barfed on that post and Sou, rightly, ridiculed you for your big error. Accept your mistakes, take your lumps, and try harder next time.
Dave is not likely to say what the error is, because then he would be explicitly explaining what Sou and he are trying to do.
What is the error David?
Dave, you still haven’t said what the error is.
Judith, it took me a while to grok this post (am watching pathetic Jets beat even more pathetic Dolphins…). Had to study the incredulous diagrams and the methodology.
And now wonder why even bothered to spend junk game time on junk…
piled on junk. Lets see, twitter counts. Well, many sentient beings do not twitter. So survey counts do not relate at all to available web counts, although this pseudoGoogle cited site map is about weblogs. So just more statistical fruit salad.
Look on the positive side. This analysis purports to isolate your CE onto the ‘yellow left’. Thank goodness not onto the ‘purple right’.
If this is what the climate debate is coming down to, then “we” are winning under leadership from the likes of you. There is no other possible explanation for such desparate silliness. Up there with Cook’s bogus 97%.
‘and
the queer
old balloon man whistles
far
and
wee.’
h/t e.e. cummings…
and Victor Venema visuals.
Victor Venema has done a blog post with the climate segment of the blogosphere (click on the diagram to blow up):
Beth, highest regards from an American ‘farmer’ to an Australian ‘serf’. I believe we are of the same basic ancestral stock… mine probably even more peasant (just poor farmer Slovaks, not even on the English Empire radar). The best business trip of my career spent days in Sidney and Melbourne, including the final of Australian rules football that year. My goodness! You all are really crazy. At least we Americans take our broken football bones (OK, just modified by forward pass British rugby) AFTER some feeble pad protection. You all don’t even use pads. Beer does not substitute for pads except with respct to immediate pain.
Highest regards from ‘up over’ to ‘down under’. You all rock.
Great compliment coming from you, northern serf. )
Yes, Oz rules football is wild colonial boys, alright.)
Rud Istvan | December 28, 2014
Judith, (am watching pathetic Jets beat even more pathetic Dolphins…). Had to study the incredulous diagrams and the methodology.
That’s American football or gridiron, right?
Where they spend 3/4 of the time doing grid numbers and 1/4 actually playing?
I don’t think these results can be interpreted in the direct way some people want to interpret them. Consider this remark by Victor Venema about the study:
Yet this is the same person who goes out of his way to try to reduce the visibility of sites he doesn’t like, as he explains in a post he links to:
When a person says they think it is immoral to promote a site he dislikes, even in such a simple way, it shows his recommendations are not unbiased or necessarily interpretable in any clear manner.
Similarly, there’s no way to know why people recommend the blogs they recommend. People could choose to promote certain blogs because it is the socially appropriate thing to do, because they’re ashamed of some they read, or because of any number of other reasons. With effects like that, it is difficult to see how one could know how to interpret separation between blogs.
As a simple example, should we believe RealClimate is a highly influential site nowadays? I don’t think so. I think a more likely explanation is RealClimate just happens to be the “right” answer in many people’s eyes.
Brandon: Whose recommendations are ever “unbiased?” Recommending inherently means a judgement.
David Appell, making a judgment does not require being biased. People make recommendations all the time absent bias. For instance, if someone asks me where I go to get a car washed, odds are, I’m not going to be biased about it. The same is true if someone asks what grocery store has the widest selection and/or best prices, So forth and so on.
Bias requires a non-relevant factor be at play in the recommendation. People routinely avoid that.
Brandon, come on. If someone asks you where to get their car washed, you’ll tell them your favorite places. Your biased towards your favorites, which are you favorites for certain reasons.
Recommendation is always bias.
David Appell:
They are my favorites for certain reasons. If those reasons are relevant to the question being asked, they are not biases.
This is a blanket statement which simply ignores the definition of bias. It is only bias if a non-relevant factor is influencing one’s decision. Liking something because it is better quality is not bias. Liking something because it agrees with your preconceived notions is bias.
I already explained this in the comment you just responded to. If you’re going to disagree with it again, please explain how I am wrong. Just saying, “You’re wrong” does nobody any good.
Brandon wrote:
“They are my favorites for certain reasons.”
Yes. Those form your “biases.”
“If those reasons are relevant to the question being asked, they are not biases.”
Those reasons are always relevant — you think certain car washes are superior for certain reasons. So you recommend them, and not others.
“Liking something because it is better quality is not bias.”
Didn’t you ever read “Zen and the Art of Motorcycle Maintenance”? Decisions about “quality” are inherently subjective decisions. They reflect your biases. Hence those choices are biased.
Honestly, I can’t believe anyone would try to argue the opposite. Judgements are a result of bias. So what?
David Appell, if you’re going to claim someone is wrong, you ought to do more than say things like:
I’ve provided a clear and cogent argument based upon the definitions of words. You’ve done nothing to show it wrong save provide your arrogance and attitude.
I get you “can’t believe” people would disagree with you, but if you want to participate in discussions, you should consider why your belief system is so inaccurate.
Brandon: Judgements are biased. Else, why make them?
I’m not interested in playing rhetorical games. Sorry.
David Appell:
It’s fascinating you claim you aren’t “interested in playing rhetorical games” yet that is all your responses have been, lame rhetoric with no substance or topicality.
It’s simple. I made an argument. You can dispute it by trying to find a flaw in it. Or you can keep doing as you have, ignoring it while insisting I’m wrong and should be scorned for disagreeing with you.
People will respect you for behaving in a reasonable manner if you do the former. They’ll do the opposite you if you continue to do the latter. And if you do continue to do the latter, I’ll just start ignoring you as a useless waste of time.
If you get the last word, let that be a hint why.
“Biased” implies the judgment is not fair.
http://ct.weirdnutdaily.com/ol/wn/sw/i37/2/12/6/wnd_9bfc4f6c8b6d7c804c64a68ce717e81a.jpg
Brandon wrote:
“Blah blah blah.”
The whole point of asking for your judgement is to get your answers, given what I know and accept about your biases, which I think mostly overlap mine.
.Really, this is such a dumb argument.
David in TX wrote:
““Biased” implies the judgment is not fair.”
What do you mean by “fair?”
Fair in whose eyes?
==> “David Appell, making a judgment does not require being biased.
And once again, Brandon displays that he actually doesn’t know the difference between fact and opinion.
Quite remarkable, actually.
David –
You clearly don’t understand. Brandon’s opinions (and recommendations) aren’t biased, they just objective assessment of all the relevant information, with nothing extraneous included. Anyone who might include in their recommendations information he didn’t consider are being subjective – because in not aligning with Brandon’s assessment, by definition they’re including extraneous information. And And anyone who doesn’t include all the information that he included are obviously leaving out crucial information because they are being subjective.
In other words, Brandon’s opinions are (and recommendations) are facts.
Davey and his little partner joshie,
Ask me to recommend the hot dog stand within a mile of here that sells the biggest weiner. That’s easy, it’s I forget the name, let’s call it x. I don’t eat weiners, but that’s my unbiased recommendation because it’s the only hot dog stand within a mile of here. Now go eat it.
Joshua: Thanks. That helps make sense of my bewildering conversation with him….
Don –
Read this again:
“. Liking something because it is better quality is not bias.”
And tell me that you actually got through it w/o breaking out laughing.
Now, for your comment:
==> “Ask me to recommend the hot dog stand within a mile of here that sells the biggest weiner.”
Look at these three questions.
“Can you tell me which hot dog stand within a three mile radius sells the biggest wiener?”
“Can you recommend a hot dog stand within a three mile radius?”
“Can you recommend dog stand within a three mile radius that sells a large wiener?
Those all make sense.
Now look at this question:
“Can you recommend the hot dog stand within a mile of here that sells the biggest weiner [sic]?”
That question doesn’t ‘make sense.
How about this question?:
“ Can you tell me which commenter at Climate Etc. is the biggest wiener?”
Do you think that question makes sense? Can you guess what the answer is?
David Appell (@davidappell) | December 28, 2014 at 9:38 pm |
David in TX wrote:““Biased” implies the judgment is not fair.”
Appell: What do you mean by “fair?”
http://www.thesaurus.com/browse/fair
By fair, I mean unbiased. Unbiased is a synonym of fair. Duh. We’ll make sure your dictionary has a Thesaurus for a companion volume.
Appell: Fair in whose eyes?
The eyes of an unbiased observer of course. Duh again.
Do you enjoy looking stupid or does it just come naturally?
David Appell (@davidappell) | December 28, 2014 at 9:38 pm |
David in TX wrote:““Biased” implies the judgment is not fair.”
Appell: What do you mean by “fair?”
http://www.thesaurus.com/browse/fair
By fair, I mean unbiased. Unbiased is a synonym of fair. Duh. We’ll make sure your dictionary has a Thesaurus for a companion volume.
Appell: Fair in whose eyes?
The eyes of an unbiased observer of course. Duh again.
What are we arguing here?
Substance or grammar?
Tune to Buick AM Buzz.
==========
Joshie fell for the weiner. This is a ridiculous discussion. Davey and joshie are in denial that any human can be objective about anything. This is what goes on in the minds of big headed putzes.
Don
“Joshie fell for the weiner. This is a ridiculous discussion. Davey and joshie are in denial that any human can be objective about anything. This is what goes on in the minds of big headed ”
Do you suppose it is related to the philosophy of Relativism; a philosophy common to progressives?
Richard
Yes, it’s Relativism applied with progressive discrimination. When it’s convenient, everything is relative. Morals and ethics are situational. It’s all spelled out in the Soviet Apparatchik’s Handbook. The only constant truth is that progressives are morally and intellectually superior to the untermenschen. Putzes.
JC SNIP I am really tired of this bickering, I would delete this entire subthread but it is too much work to do that
JC SNIP
Sorry, Judith. I didn’t see that.
Why does it not surprise me that David Appell cites “Zen and the Art of Motorcycle Maintenance” as if it were Holy Writ. Heavy man! Heavy!
Venema seems to me to be a strangely self-righteous person who once he finds a reason to dislike someone, can never agree with them again, or even acknowledge their existence. I would just assume he is young and prejudiced, but the former but not the latter is clearly untrue.
Victor Venema seemed to start hating me back when the Skeptical Science consensus paper came out and I pointed out the main problem with it a day later. He made a number of derogatory remarks, and if I remember right, even straight up called me a liar.
Even so, I’ve seen him point out things I’ve said in a positive light since then. He always preceded it with something like, “I’m surprised Brandon said it,” but it’s still something. I’d say he’s (at least) not completely the way you describe.
Brandon, what is the “main problem” with the Cook et al papers?
David Appell, the central problem with the Cook et al consensus paper is the definition of their “consensus.” They counted any endorsement of the greenhouse effect as part this “consensus,” as has been repeatedly demonstrated by examining their discussion of how abstracts should be rated, the ratings they gave various abstract and the explicitly stated reasons given for those ratings.
Such a weak consensus position is practically meaningless, and Cook et al have never been open or honest about it. Instead, they’ve now explicitly claimed, on many occasions, their “consensus” is humans have caused 50+% of the observed global warming.
To make this more troubling, we have authors of the study who explicitly laid out how to analyze the data before doing the ratings now refusing to discuss the results of such analyses, instead making claims that are in no way supported by their proposed analysis.
As an aside, it is just silly to think there can only be one “consensus” position. On any complicated subject, there can be many different consensus positions, each with their own degree of support. The Cook et al authors recognized this when designing their study. They only started ignoring it, and thus conflating the various positions, after they got their results.
And nobody should be surprised to know if they had stuck with their proposed analyses, their results would have been embarrassing.
Brandon
“David Appell, the central problem with the Cook et al consensus paper is the definition of their “consensus.”
It might be more accurate to say that the Consensus they measured was one thing and the consensus they promote or allow to be promoted is something else entirely.
They found a consensus that humans contribute to global warming. They promote or at least allow other to promote their findings as something different.
Steven Mosher says:
I chose the phrasing I chose because the “consensus” Cook et al found doesn’t actually have a coherent meaning. The categories Cook et al used overlap one another. An abstract/paper could fit in both in category endorsing and and a category rejecting the “consensus.”
The reason that happened is simple. They classified abstracts that accept the greenhouse effect as endorsing the consensus. They classify papers that accept the greenhouse effect, but minimize its role, as rejecting the consensus.
There’s obvious overlap. It happened because when designing their study, Cook et al decided to make their categories symmetric when they shouldn’t have. I explained why this is bad, and how they could have done it properly, here:
http://rankexploits.com/musings/2013/why-symmetry-is-bad/
I suspect most people aren’t interested in this aspect of the Cook et al study, but I think it’s an interesting, and perhaps even important, one.
“I chose the phrasing I chose because the “consensus” Cook et al found doesn’t actually have a coherent meaning.”
your comment has no coherent meaning
even a simple word like cup doesnt have a coherent meaning.
I think it would be interesting to see how climate scientist attributed the signal of CO2 by percentiles. Put them into categories of humans affecting less than 20%, 20% to 40%, 40% to 60% etc. or any other scheme. Two individuals who attribute 5% vs 45% have a much different perspective and may have different policy proscriptions than two individuals having attribution of 48% vs 52% and yet now one is called by some a
denier and the other a warmist. The same goes for those above 50%. Saying 55% vs 95% can end up with drastically different policy implications.
Brandon is correct. The other major problem with the POS paper is that their conclusions are based on a small non-random sample of publications by alleged climate scientists. They based their conclusion on a miniscule portion of the 12,000 papers allegedly reviewed by independent “citizen scientists”, who just happened to be the authors of the freaking paper. This would be like an ad agency working for Proctor and Gamble doing a survey of 12,000 dentists and finding that most dentists recommend Colgate. You know how that works.
Here Brandon start with this.
It gives you a reference to a very famous 1973 paper on classification that you should read. Labov on word boundaries and their meaning.
http://www.skilja.de/2012/classification-and-context/
In short, you continue to misconstrue how language works and what experiments tell us about “meaning”
You’d do much better if you avoid the arguments like
“that’s meaningless” or “that has no coherent meaning” Precisely because you don’t have a theory of meaning to back up these types of claims. The same with your repeated tactic of calling people “silly” if they disagree with you or misunderstand you. That tactic simply doesnt work to convince them or others of the correctness of your views. That should be apparent to you by now.
ceresco,
If I remember correctly, the number of abstracts in the that were deemed to be explicitly endorsing AGW with humans causing >50% of recent warming was 64.
“Such a weak consensus position is practically meaningless…”
What’s wrong with that, Steven? Is your objection substantive, or semantic?
Don Monfort:
Yup. It was first reported (by me) as 65, but that was because their searchable database includes a few hundred papers which were filtered out for their analysis (for things like not being climate related).
Steven Mosher:
If you would ever do anything to show I’m actually wrong, rather than consistently make things up about me and what I’ve said to claim I am wrong, I might actually consider your input. As it stands, I’m not going to do your work in figuring out what an argument is just because you say it shows I am wrong.
This is especially true given how often you tell me to read sources I’m quite familiar with, and thus know don’t say what you claim they say. Sort of like how you say:
Which is just a baseless claim you use to dismiss me without having to address anything I say. You could say the exact same thing no matter what the truth is, and it wouldn’t affect anyone ability to your argument because you provide nothing with which is can be justified.
Ugh, typos. The phrase “know don’t say” should be “know they don’t say” and “anyone” should be “anyone’s.” I hate the lack of a preview/edit feature.
(This is about a comment that may be stuck in moderation for the moment.)
“It was first reported (by me) as 65”
I am not sure you were the first to report it, Brandon. I mentioned it very early on, if I recall correctly, on the blackboard, Bart V’s blog, and maybe that wottsup withthat POS. Anyway, great minds think alike. I don’t see how anyone could argue convincingly against any major substantive criticisms you have made regarding the Cook et al POS. I mean it’s such an obvious POS.
JC SNIP violation of blog rules
Don Monfort, I wasn’t trying to take credit with that statement so much as to acknowledge my error, but I’m pretty sure I was the first one to say 65. I wrote a post the day after the paper came out which said (quoting at length since its relevant to David Appell’s question):
I don’t deserve much credit for it though. It was an incredibly easy find. I probably just happened to hear about the paper/searchable database before others who would have found the same thing.
Steven Mosher:
I showed, through simple logic, the definition is incoherent as there is no consistent way to define it. The simplest way to show I am wrong is to provide an actual, coherent definition. I’ll note you’ve chosen not to even try to.
I generally don’t take advice from people on how to construct arguments if their arguments consist of nothing more than, “Nuh-uh!” Similarly, I don’t take advice on attitude:
From people who consistently misrepresent those they criticize, often with nothing more than sheer arrogance. This is especially true when those people consistently fail to provide any sort of actual argument or contribution to the discussions they participate in.
I’m sure you may find my attitude “insufferable,” but given you’ve baselessly called me a liar, falsely claimed I hadn’t read things and simply made **** up about me time and time again, I don’t care.
And I’m not going to pursue this any further. If you want to make more comments which contribute nothing to the discussion, go ahead. I’ll let you have the last word. I hope it’s something which shows more respect to the people of this community than your last ten thousand.
JC SNIP
OK, Brandon. You were very likely the first to say 65, but I am pretty sure I was the first to say 64:) I am not going to look back to find out.
JC SNIP
That could be Don Monfort. I don’t even remember when I realized I should use the number 64. I noticed pretty quickly the number of papers being returned was less than the total subset (I thought there was a problem with how i was retrieving them), but I don’t recall when I actually found out what the “right” numbers were.
By the way, comments like:
And:
Are pathetic. I don’t understand how people making remarks like these could ever expect anyone to take them seriously when they give advice on how people should behave. Taking social advice from people who accuse those they disagree with of having disabilities (which is probably libelous, not that I’d ever sue over it) seems like a terrible idea to me.
Brandon –
==> “…seems like a terrible idea to me.”
It just doesn’t make any sense!
Again, I don’t think this subject is worth much of my time, but it’s my recollection that I got the 64 by badgering dana nutticelli on bart v’s blog for a breakdown of the numbers for each category of endorsement, which I didn’t find in the paper. I don’t know if 65 or 64 is correct. No big deal.
The stuff about apergers and other little tweaks that get directed your way by Steven and myself, just show that we care about you. You got potential. But you need to lighten up, junior:)
JC SNIP I am really tired of this conversation
Nice to see JC not “blow up the threading” by simply noting, but keeping a post that violates blog rules. This is a great first step in preserving threading, but simply deleting the offensive content and substituting “Content deleted but posting kept to preserve threading” would be better. Keeping some offensive posts but not all (obviously there will be some that will go so far that you’ll have to snip content) gets you into a consistency and fairness issue with WordPress.
Snip all offensive content or none (but preserve the shell to keep threading).
I agree with R. Gates when he says:
But I have to disagree when he goes onto say:
There are many reasons to leave some content which violates the site’s rules up while deleting others. The first one which jumps to my mind is to demonstrate what is and is not allowed. You make a note warning people about a rule violation, and you delete content only if they continue to violate rules. That’s far better than simply deleting content and leaving readers no way to judge why it was deleted.
I think that’s actually a problem this site has. It’s hard to tell what the site’s standards are as to what is allowed. I don’t know how many comments get deleted since they generally vanish without a trace, and if I didn’t happen to see them before they vanished, I often have no way to know just what got them deleted.
I did a poor job of editing and explaining my point. The 5% vs 45% was intended to be 55% vs 45%. I meant to say if you have two people who attribute human influence at 55% or 45%, they may have more in common in policy responses than say individuals who are at 10% and 45% or on the other end of the continuum of 90% and 55%. The divide at 50% doesn’t necessarily represent a line of demarcation as to how severe you believe the problem is nor what the public policy response ought to be.
Mi amigo Brandon,
I have had a lot of training and experience in reading people and squeezing things out of them they didn’t even know about themselves. But your light-heartedness has not shown through to me. It must be very subtle. Maybe if you used emoticons. Somehow, I have gotten the mistaken impression that you are generally prickly and thin-skinned. That’s why I recently used the : ) to make it explicit that I was just funnin ya : )
I don’t recall ever seeing Mosher call you the l-ar word. He says your arguments are usually good. Mosher likes good arguments, so I will be sunny and assume he likes you. Look for the good in people, Brandon. Give them the benefit of the doubt, except for these smarmy little warmist trolls.
There was a good discussion about Hypocrisy on NPR this even. It made the point that hypocrisy and contradictions are unavoidable and that the context is important.
//embed.wbur.org/player/onpoint/2014/04/14/hypocrisy-harpers-humanity
Better link, this has partial transcript: http://onpoint.wbur.org/2014/12/29/hypocrisy-humanity-harpers
JC SNIP
I don’t recall berating you in caps lock, Brandon. I won’t say I never did it, because you are so obsessed with these little meaningless episodes that you have probably searched your voluminous files of the blog spats you have had over the years and may have come up with something. Anyway, if I have ever berated you in caps lock it was only to mock you. I have never been angry with you. I agree with you on almost everything. I have been trying to encourage you to lighten up for years. You take yourself too seriously and take offense where often there is none. Now you can show some maturity by moving on. Surprise me.
Sorry about that Judith. I tend to be bad at ignoring things so I often respond even when I probably shouldn’t.
If it helps you any, I don’t think you need to “snip” comments to preserve threading if they’re at the bottom nesting level. The issues with threading getting broken happen when a comment which people have used the Reply feature to respond to gets deleted. If nobody has used that feature to respond to a comment, (I think) you should be able to delete it with no adverse effects.
Thanks brandon, the challenge is that my dashboard shows the comments in reverse time order (most recent first), so I don’t see the threading
Ah, that would make it difficult Judith. Also, your response made me remember something. It’s possible for people to respond to individual comments even if those comments don’t have a Reply button. I believe it can be done intentionally with any comment if you mess with your URL in the right way, but people with a WordPress admin bar (from running a blog) can do it without realizing.
For instance, you made your comment as a response to mine through your admin panel. That causes WordPress to pop the comment up in my WordPress bar as a notification and give me a Reply feature. That’s true even though there is no Reply button for the comment on the page it’s posted on.
So yeah, I’d say your way is definitely the best for how simple/easy it is for you.
It can.
Don.
“The stuff about [hehe] and other little tweaks that get directed your way by Steven and myself, just show that we care about you. You got potential. But you need to lighten up, junior:)
He does not get it ever.
A while back he did some stuff on Mann that I thought was very solid and told him so, but whatever. Next to McIntyre he probably has the most detailed command of all the facts. But when it comes to presentation, all the good just vanishes. It’s quite stunning to watch. here is a guy and you want him to win. You actually want him to do a better job, and he continues to fumble the kickoff. Very annoying. It’s all the more annoying when you see someone with bad arguments ( like goddard ) come across as more reasonable. just stunning.
It would be disturbing if a bright child drew up such a speculative, petulant mess of squiggles in the solid belief it was an “analysis”. Oddly, it seems normal for Victor Venema. One is more dulled than disturbed.
It’s urgent that we dismantle the climatariat in its entirety: alarmists, lukewarmers, coolists…the lot! The capable ones can go back to meteorology or the sort of research where you get wet feet. Publish-or-Perish can just perish.
If Victor has to drive a taxi for a while, at least someone will get to where they were meant to go. (Or am I being optimistic about the directional skills of a climate expert?)
mosomoso: Do you honestly think those who understand and accept AGW are going to go away?? Do you like living on another planet?
I don’t know why you ask those two questions, David. But I can tell you that Victor Venema’s “analysis” is a tragic case of the juvenile aspiring to the infantile. Just in case you missed my point.
That wasn;’t my question. Nice avoidance,
David, you actually asked two questions.
The first one implied a validity which is still in question. I think that those who “understand AGW” will not accept it. You obviously think otherwise. So the question can’t be answered by me without validating something I think to be wrong. (But good try.)
As to dismantling the climatariat, I think that should happen, and urgently. However, I don’t think it will happen. ‘Should’ is not ‘will’. The monster is very big, with lots of tentacles. Too big now to just say whoops. Pity about the trillions and the white elephants.
Your second question seemed to imply planetary disaster due to human activity. Either that, or you are just mass producing comments through this thread with little heed. (Not such a good try.)
David Appell (@davidappell) | December 29, 2014 at 3:24 am | Reply
mosomoso: Do you honestly think those who understand and accept AGW are going to go away?? Do you like living on another planet
—————————————-
Looking at the whole chart it already appears those who invented and accept CAGW have been marginalized in their own little thought bubble. They didn’t go away but rather have been put away. Did you really think that specious, non-falsifiable claims of great future damage to civilization would become global imprimaturs for energy starvation? Do you like living on another planet? LOL
There came a moment for each, when the observing orbs were plucked.
=========================
Personally I don’t expect the climate bedwetters well ever ‘go away’, just as the peak oilers and the population bombers have never stopped their incessant crying. I do expect that people will stop listening, a process I believe has clearly already began.
mosomoso | December 28, 2014
“If Victor has to drive a taxi for a while, at least someone will get to where they were meant to go. (Or am I being optimistic about the directional skills of a climate expert?)”
First mistake, assuming Victor could possibly be a Climate expert.
We have no clue however on his ability of taxi driving in the right direction.
A lot of taxi drivers in Melbourne are students of high IQ, but again this offers no clue on Victor’s ability or past experience iof driving taxis.
The big money was always GIs fresh in at the bus station; it was a ways out to the base.
================
Kim
Reminds me of an experience in 1961, riding a bus across Texas. The bus pulled off the highway and drove across the desert; in the distance a small building. As we approached the building things got clearer, it was a small general store and there was a cowboy outside waiting for us. He threw his saddle on the bus and we drove back to the highway and continued the trip to California. Why did this come to mind? The experience seemed to me a possible move scene and your words seem to me a scene from a novel.
Happy NewbYear
Richard
Kim
The experience seemed to me a possible movie scene and your words seem to me a scene from a novel.
Happy New Year
Richard
Pingback: Tee hee – Stoat
All that graph shows is how incestuous the “alarmist” blogosphere is.
A simple way to show variety would be something like making the sizes of the dots representing each blog proportional to number of views, or number of comments per day or some such.
That would have a hugely different visual impact, I guarantee.
Blog rolls and links across the divide are meaningless. Sou does not ‘link’ to WUWT, she got into the detestable practice of providing links only to archived pages. Skepticalscience practices the same. But Sou would not have a blog to run but for WUWT. Same with ATTP: he has very rarely written original material – almost all his output consists of commentary on other blogs’ material. He is basically a traffic leach and a refuge for commenter refuse.
Given the abject polarization and ghetto-ization of the online climate world, the real thing to map would be on how claims, counter-claims and concepts flow across blogs, irrespective of the more superficial ‘warmist/skeptic’ designations. It would then be interesting to determine whose topics spread wider, whose memes get propagated, whose counter-claims carry the greater impact and who carries greater influence in the overall flow of the climate debate.
==> “He is basically a traffic leach and a refuge for commenter refuse.”
Nice, Shub.
By what (objective) measure do you distinguish the commenters there from the commenters at your site, of WUWT, or Climate Etc.? Do you have any criteria other than whether you agree with most of the opinions expressed?
Perhaps, just perhaps, the fact that he banned you might have biased your perspective a bit?
Oh. Wait. That wouldn’t be bias, now would it? Just as Brandon.
Too funny.
Joshua , as Willis said above, the truth is not a bias.
“ATTP, He is basically a traffic leach and a refuge for commenter refuse.”
Could you comment on the content of this appalling calumny rather than about it ?
Repeating Shub’s putdown is too funny, remember, your repeatedly saying it does not make it true.
No Joshua, this goes way back and you have it the other way around. When he hadn’t banned me yet and I was playing nice, in a moment of weakness I called him a traffic leach on Twitter. This and other such moments of weaknesses pissed AndPhysics off which is why he banned me in the first place.
Remember how andphysics was wotty and how every blog post of his was a topic on WUWT.
I don’t mean to insult the commenters there but it so happens that there was at some point an inordinate number of commenters who were ‘exclusive’ to AndPhysics: you have the Skepticalscience boys who otherwise stay hidden behind the bushes of the internet, you have Steve Bloom and you have BBD who basically don’t comment much any where else, same with Victor, same with Pekka (whom I have seen here but not quite as volubly so). Look at Dana, for instance- have you seen him comment nearly anywhere else at all? At AndPhysics he’s come out of his shell, his comments are just like his Guardian articles. In sum, a lot of people who either elicit a strong reaction or cannot resist from reacting strongly, definitely not a cooler heads coalition.
Shub –
==> “In sum, a lot of people who either elicit a strong reaction or cannot resist from reacting strongly, definitely not a cooler heads coalition.”
Even if your observations about who comments there and where else they do or don’t comment has some measure of accuracy, (e.g., Pekka apparently comments a lot at SOD, and used to comment a lot here but doesn’t anymore for reasons he has described and which are not exactly complementary towards Climate Etc.) – I would say that I see more regular, and respectful, and in-depth discussion there between people who have opposing views than at any other site.
Maybe The Blackboard would be similar in that regard…not sure really, although I know that I got absolutely no traction towards reasoned exchange of view when I went there and figured that I already had one place I could go if I were interested in conversing with people who had no interest in good faith exchange of views (here) – and so I haven’t spent enough time looking at that site to get a good feel for the general level of dialog there.
shub?
you got banned?
thats fricking hilarious.
Thats like Tamino banning Lucia and RomanM
> It would then be interesting to determine whose topics spread wider, whose memes get propagated, whose counter-claims carry the greater impact and who carries greater influence in the overall flow of the climate debate.
I agree.
I wonder why you seem to assume not taking part in the polarization, Shub.
Cause I don’t.
I don’t step beyond ‘robust’ discussion that fellow commenters engage in, I don’t engage in personal attacks, I follow the output of people on both sides of the divide, I go out of my way to interact with people on the ‘warmie’ side: Avoiding ‘polarization’ in my book does not imply not fighting for your point strongly, but leaving conversations in a state you can come back and talk to your opponent once again. I believe there is a misunderstood Climategate email saying the same.
Shub –
==> “I don’t step beyond ‘robust’ discussion that fellow commenters engage in, I don’t engage in personal attacks,”
I think you should revise that to you try, but don’t always succeed, to avoid engaging in personal attacks, and you try to be accountable for it when you fail.
That’s right, Joshua, I try. One way of trying is to keep reading opposing perspectives and interacting with people with opposing/different views. I may be absolutely convinced I’m right on several topics but I am not dumb enough to think others don’t think the same way.
The natural tendency of people is for like-minded individuals to come together as life gets tedious and stressful otherwise. But the means of engaging your opponents, exchanging insults, rotten eggs and the occasional handshake must be kept open. It’s all BS but that’s how I feel about it.
> One way of trying is to keep reading opposing perspectives and interacting with people with opposing/different views.
You seem to presume that this creates less polarization, Shub. The evidence shows that this presumption is far from being obvious.
From a purely strategical viewpoint, the “debate” is asymmetric: there’s one clique whose very existence relies on their ability to muster one, while the established viewpoint, like the caravan, simply moves on. While I am forever thankful for the manufactured dissent created by your social network, and here of course, it amounts to shadow boxing most of the times.
Playing the Very Serious person won’t dispel these facts.
***
As far as your latest victim playing is concerned, your interaction with AT was far from being depolarizing. Must be Manny Calavera’s fault:
https://andthentheresphysics.wordpress.com/2014/09/25/lewis-and-curry/#comment-32509
May 2015 bring you many more ClimateBall joy!
W
Please willard, AndPhysics is quite the funny guy – his verbose comments contain barbs but he won’t tolerate sarcasm from others, even they are not directed at him. In other words, he sets himself up as the perfect target for tweaking. I would do my utmost to get banned by such people than play by their petty little rules. You breathe, you let others breathe – it’s as simple. If you were not paying obeisance to AGW orthodoxy, badgersouth/Hartz would’ve had you drummed out in short order as well.
Give that a try: as an experiment, try poking fun at AGW while being nice to the people in such a forum. See how long you last. And then try being an asshole to near anyone but at the same time an AGW warrior, sorta like BBD, (sorry BBD, not calling you names here, just using your persona as an example). See which one lasts longer.
BTW, I don’t even remember what Manny Calavera wrote in those comments but I bet he didn’t call anyone or their mother any names.
In the larger picture, of course, while it may be comforting to think ‘the science’ and all the associated activism is one large organized mass of human knowledge-driven endeavor, i.e., the ‘caravan’, it is likely a gigantic illusion. The caravan doesn’t care for its warrior-folk and would leave them on the outside in a flash. Again, my rule is simple: if you’re not getting paid to do your stuff (i.e., blog and/or comment) you are just roadkill to the consensus. It doesn’t matter if you are a sceptic or a supporter.
Nicely put Shub. What we want to map is the flow of the reasoning, not people or places. A lot of this can be done semantically because the language tells us what is being talked about. Seeing the reasoning (the growing issue tree) is more complex of course. So far as I know computers cannot do that, but the intelligence community is doing a lot of work on the analysis of message traffic, so who knows what is possible when it comes to seeing reasoning in a community of debate.
By way of explanation, the issue tree is the logical form of complex issues, which I discovered some time ago. See my crude little textbook on this at http://www.stemed.info/reports/Wojick_Issue_Analysis_txt.pdf.
The tree structure arises because a given claim elicits multiple responses, usually questions and objections. Each response then elicits multiple responses, typically replies, questions and objections. Each of these responses then elicits multiple responses, and so it goes, growing exponentially, layer by layer.
In the climate debate case, consider how many unique blog sentences have been written, just debating the science. The issue tree is very large and it keeps growing.
SN – you have identified one of the problems with these sorts of studies.
The “warmist” pages started keeping archive pages so they don’t have to link to skeptical blog. And now some of the skeptic blogs are returning the favor.
This makes some highly linked warmist/skeptic blogs look like they are unrelated.
tonyb, that is covered by SkS under the “It’s not us” category.
Jimd
Ah, so it’s the ‘it’s not us it’s natural variability’ category then?
Tonyb
tonyb, yes, “It’s not us” below has many subcategories, including it is the sun, it is the ocean, other planets are warming, climate has changed before, etc. Everything a skeptic could imagine.
Here too, JimD:
https://contrarianmatrix.wordpress.com/lots-of-theories/
“It would then be interesting to determine whose topics spread wider, whose memes get propagated, whose counter-claims carry the greater impact and who carries greater influence in the overall flow of the climate debate.”
1. Lukewarmer
2. Piltdown Mann
3. Treemometer
I think moshpit wins the meme war.
very true. I salute you.
Did you really coin lukewarmer? You, Fuller, McIntyre, Liljegren, Montford and Watts (as a representative set) coined and framed a lot of 2006-2009 issues. There is no question about it. But bring in academics and they struggle *so hard* to grasp the outlines of the storylines and the people involved.
Take the larger point – A few days back WUWT features a post on ocean pH. At face value, it all looks a bit incriminating for the climate consensus position. Richard Telford at quantpaleo writes a ‘rebuttal’ post on it. Subsequently Skepticalscience picks up on it (so says Dana Nuc). Skepticalscience will doubtless write a rebuttal but they won’t link to WUWT. Measuring, or documenting this flow of constructs is what’s needed but it is not so easily done.
Look at this page as a hierarchical tree of skeptical arguments
http://www.skepticalscience.com/resources.php.
A lot of material but, once again, Skepticalscience are on record they try to link to WUWT as little as possible.
I like the main headings, under which are many subheadings and a few levels.
– It’s not happening
– It’s not us
– It’s not bad
– It’s too hard
– It’s too late
Skeptics variously adopt all of these positions depending who they are arguing with or which WUWT post they are believing at the moment.
Jim D,
Can we add “we don’t know yet”? Not quite as entertaining and allows playing of both sides.
Shub, it depends on what you mean by not easily done. An issue tree is relatively easy but laborious. What I have found to be the real obstacle is that no one wants to catalog the other sides arguments in accurate detail, so there is no sponsor.
Jim D, well I, for one, have not read any WUWT posts for at least a year now, and not posted any comments for many years.
What sort of sceptic does that make me?
That’s what I meant to say David. Skepticalscience, for example, tries hard to pretend some skeptics’ arguments are ‘widespread’ and at the same time tries to find an obscure source to exemplify it, instead of coming out honestly and saying “I read it on WUWT”.
The concept of rebuttal is also very interesting. As a rhetorical position to adopt, you always operate from a position of strength when you are the questioner. As an originator of theory, you carry the burden of fitting or accommodating every little fact with your (pet) theory whereas as a questioner all you need to do is bring a single aspect into focus and argue a counter-point. With the above, it is extremely interesting to now how Skepticalscience will make as though a given skeptic is a primary claimsmaker and proceed to ‘rebut’ the skeptic, instead of answering to the defect or deficit he point to, forgetting that it is climate orthodoxy who’s the primary claimsmaker.
Jimd
You need to add ;
It’s happened before
Tonyb
“Did you really coin lukewarmer? You, Fuller, McIntyre, Liljegren, Montford and Watts (as a representative set) coined and framed a lot of 2006-2009 issues. There is no question about it. But bring in academics and they struggle *so hard* to grasp the outlines of the storylines and the people involved.”
It was actually David Smith who coined it. Then Bender picked it up
and Lucia, Tom and I put some flesh on it and started the drive to popularize the notion.
To this day people still want the battle forced into two camps. I was talking to a journalist the other day and he was kind perplexed cause he found me criticizing both sides. I had to explain that I do this as a ritual of sorts.
> It was actually David Smith who coined it.
At last.
Thank you.
I went to Paige’s site to see how the 600 bloggers were chosen, then noted our hostess had been there before me – no doubt all will be revealed soon.
A bit off topic. But I am looking for helpful suggestions from progressive commenters here on how to preserve the cherished separation of church and state in the face of this:
“Pope Francis’s edict on climate change will anger deniers and US churches”
http://www.theguardian.com/world/2014/dec/27/pope-francis-edict-climate-change-us-rightwing
(by way of NRO)
The pope is supposed to protect us from Jesuits, not BE a Jesuit.
He’s a scientist (Masters in chemistry) and has a moral duty to speak out
Like he spoke out against Galtieri etc? It’s easy to bloviate about climate. All the cool celebs do it.
If he announced that he was skeptical of CAGW, you would say to ignore him: “He’s the Pope fer Chrissake! What do you expect from a Creationist maroon?”
Garym
It’s the Anglosphere who run the climate change show, so thanks to Henry the viii we can ignore the pope and thanks to their continual desire to be wrong about everything we can ignore the Guardian as well.
Tonyb
Church of England challenges BP and Shell over carbon emissions
http://www.christiantoday.com/article/church.of.england.challenges.bp.and.shell.over.carbon.emissions/44292.htm
GaryM
This will of course never happen, but it is what should happen.
The Church of Climate Change should be disallowed under the 1st amendment regarding establishment of a Religion
Suddenly the guy the loony left mocks for passing out crackers and wine as the body and blood of God knows fantasy from reality.
http://opencda.com/wp-content/uploads/2012/07/HYPOCRISY_METER.jpg
how to preserve the cherished separation of church and state in the face of this:
The United States: Did church agree to this separation?
The Vatican City State: What separation?
Weather underground is a science site. Who knew? ROFL
Well, Wiki-bully Stoat (William M. Connolley) is amused:
And he has to crow:
I’m not going to add a third link to Stoat’s “tripe from Alex Harvey”, but he has a link at his post (linked above).
My interpretation of the chart – when you’re failing miserably it sometimes helps to count your social contacts and pretend that you’re popular. When you’re really successful you haven’t got the time to count them or spend loads of time reading everyone else’s blog.
The most obvious points
– would responders admit they read blogs of those they oppose? And if they did, does that explain why they read them?
– your favourite blog is not necessarily the one you read the most as output rate affects how often you read a blog as well as contents.
– ability to post is almost as important, as people don’t like to just read, they like to engage. Warmists are increasingly turning up at sceptic blogs because they’re lonely.
– a blogger might not link to some blogs they regularly read because they have nothing to do with what they blog on.
Not sure that this study tells us much at all.
I’m not exactly sure what Venema is trying to say in his analysis. The Real Climate, SKS crowd don’t indicate they read, or are pointed to as often read by any signifigant number of blogs that fall outside their own cluster. Given that his assertion that the Climate etc., WUWT crowd is isolated (along with accompanying snark) while describing the others as “well embedded” seems… optimistic.
What I see is that the two camps are highly balkanized both from themselves and from the rest of the scientific blogging community. That doesn’t surprise me given the hostility present in Climate Science blogging.
Another thing of note. I would add the caveat that there seem to be indicators certain blogs aren’t necessary truly indicating what they do and don’t read on a regular basis. For example, Hot Whopper doesn’t link to WUWT. Given a quick look at Miriam’s blog her most recent nine posts include seven take downs, refutation pieces etc. for WUWT. One other being a Christmas post. It seems unlikely given the amount of time Hot Whopper devotes to publishing responses to WUWT that WUWT wouldn’t be one of her top read blogs. I’m sure tons of other examples exist. I’m just picking on Hot Whopper as the most obvious response that would be questionable were I evaluating the data.
My suspicion is that respondents from both purple and yellow climate camps wouldn’t want to indicate that a blog of the other colour is one they commonly read… Lest it look like an endorsement. Given the hostile relationship between the two camps that seems to be a reasonable assumption.
In either case the survey is interesting. It does point out some interesting trends both through responses given and those not given. Venema’s analysis though seems to indicate his inability to set aside his own biases more then a truthful analysis of what he actually can see in the presentation though.
“The Hunting of the Snark. An Agony in Eight Fits.
Fit the Second.
The Bellman’s Speech:
…Come listen, my men, while I tell you again
The five unmistakeable marks
By which you may know, wheresoever you go,
The warranted genuine snarks.
…The third is his slowness in taking a jest.
Should you happen to venture on one,
It will sigh like a thing that is deeply distressed:
And it always looks grave at a pun.
Fit the Third.
…But oh, beamish nephew, beware the day
If your snark be a Boojum! For then
– You will will softly and suddenly vanish away
And never be met with again.”
Lewis Carroll.
@Al
+1
Nice analysis, Al. This kind of survey typically provides bad data.
Looking at the number of times a blog is mentioned might give a more objective measure of attention.
If that’s what she intended to measure. As it stands she states that she measured which three science blogs science bloggers read. End of
Or rather, which three science blogs science bloggers say they read.
Either way, it’s irrelevant.
Me: I take reading to be the principal form of attention to a blog. What else is being measured here? But actual mention is better than a survey response. Mention is an objective measure. It is an altmetric.
It is not like no one has done attention research on the blogosphere. It is part of webometrics and is called blogometrics.
“And Venema thinks the right hand side of the diagram represents ‘science’? With HotWhopper, Greg Laden, ThinkProgress, Rabett Run, DeepClimate? Ouch.” – JC
Read Harder.
Ouch!
Michael says “read harder”
http://www.themudflats.net/wp-content/uploads/2013/05/irony-meter.jpg
I wonder what would be shown if one analyzed all the blog rolls of climate related blogs. Probably a more balanced picture.
Eli is of the Groucho school on all this.
What a nice way to show your disdain for the chart and interpretation without actually upsetting it’s author. Of course he would never have understand your putdown anyway so it is all OK [wink, wink].
Judith will be wrapped, however.
Eli, do you mean you would not join a club that would have you as a member? Or some other Grouchoism?
Perhaps this will make Eli’s position a bit clearer about such shenanigans
Then again maybe not.
Eli finds Eli very amusing. Rabettes are known for their silliness.
You would take this issue seriously?
JC SNIP discuss the argument, not the person
Real Climate is the most read blog for warmists but that site only posts a new article sporadically. The number of responses are limited compared to here and WUWT. So either warmists don’t read each other’s blogs very much or they’re very slow readers.
@TinyCO2: The number of responses are limited compared to here and WUWT. So either warmists don’t read each other’s blogs very much or they’re very slow readers.
Or the moderation eliminates the 95% of the comments lacking any technically substantive content.
My comment here is a fine example, and I’d expect it to be moderated down on any blog focused on substantive technical content as it would have no place there.
But they remove stuff they don’t want to hear either which is why they get so little debate going. But regardless, you can’t spend a lot of time reading stuff that isn’t there so if it’s the warmist bloggers’ most read blog, they’re not reading much.
There’s very little technically substantive about climate science, Vaughn. It’s 95% narrative.
My estimate is 96.3 % narrative. There’s probably 3.7 words per square meter that is real.
=============
Even less for a round meter.
TinyCO2 says “So either warmists don’t read each other’s blogs very much or they’re very slow readers.”
Exactly!
They could just be very slow.
Maybe they read journal articles as often as they read blogs.
Quality over Quantity.
Could be. That’s what I do.
The cloud-seeding article in the line reminds me of government-funding to produce ethanol from corn: it’s possible; there’s some money to be made by a small number of people involved in the industry and, we can always use more fuel given that Leftists and libs are distorting the marketplace, causing fuel to be too expensive expensive. And, even given that libs hate the idea — which generally means the idea may have some merit — on balance, it’s a bad idea.
2. The only enduring value of Ben and Jerry will be, Chocolate Therapy ice cream.
And if I quote them twice, I can double the amount of similar quotes. :-)
So what exactly is your point Joshie?
Bushie was the dummy who went for ethanol from corn. Did he not understand the word “ethanol,” or the word “corn?”
No, that would be Bush’s science adviser John Marburger, a Stanford Democrat.
http://en.wikipedia.org/wiki/John_Marburger
Open mouth, insert foot, eh Appell? ROFL
David –
Who are these quotes from?:
and
and
`We will also fund additional research in cutting-edge methods of producing ethanol, not just from corn but from wood chips and stalks or switch grass,” the president said. “Our goal is to make this new kind of ethanol practical and competitive within six years
and
There are more, many more, similar quotes about ethanol from that person. If you can’t figure out who made those statements, try asking someone who isn’t a Bush apologist.
So Bush did all his own research then?
Amazing people, these presidents!
phatboy –
Non sequitur much?
So what exactly is your point, Joshie?
But for those damn chads, history could start before this century for David.
===============
Yeah Bush must’ve wrote this I guess:
Statement of Dr. John Marburger, III
Director, Office of Science and Technology Policy
to the
Committee on Science and Technology
United States House of Representatives
Fiscal Year 2008 Federal R&D Budget
February 14, 2007
http://archives.democrats.science.house.gov/Media/File/Commdocs/hearings/2007/full/14feb/marburger_testimony.pdf
http://www.troll.me/images/stifler-thumbs-up/good-job-dumbass.jpg
Dr. Curry — A fun year-end blog post would be to ask everyone to make their top predictions for 2015. I got the idea from Robert Rapier (I’m a big fan of his), who makes 5 predictions each year.
1. Turkey will buy Greece.
How about forecasting ENSO?
http://iri.columbia.edu/wp-content/uploads/2014/10/figure1.gif
This graph is a classical example of a clique. Not surprising.
http://en.wikipedia.org/wiki/Clique
The two most important days in your life are the day you are born and the day you find out why.’ Mark Twain
Blogs are the spawn of the climate war – and as such can’t possibly by self-reflective enough to discern their purpose. They are the ideological indoctrination camps for the shock troops of the blog battles for the future of the world. Hence they are constrained to stay on message. Whatever the meme of the moment is as long it is consistent with intimations of doom and inclinations to authoritarianism on one side. Blithe insistence that everything is hunky dory on the other. It is all just battling memes
I don’t spend much time at any of the blogs. Apart from the free for all of CE – it must suit me. They all seem equally superficial. It seems clear that being a ‘working climate scientist’ makes not a whit of difference either. There seem few enough scientists who have a more or less coherent picture – and fewer still who blog.
‘Climate is ultimately complex. Complexity begs for reductionism. With reductionism, a puzzle is studied by way of its pieces. While this approach illuminates the climate system’s components, climate’s full picture remains elusive. Understanding the pieces does not ensure understanding the collection of pieces.’ Marcia Wyatt
The truth is out there somewhere – but it is not to be found in blogs generally. No matter how many space cadets with their immutable certainties there are in a row.
Truth doesn’t stand a chance. ~Michael Raupach
As some others have pointed out, methodology is really problematic. If you look at Paige Brown’s broadcast to bloggers you find this:
[i]If I reach my funding goal with this project, I will be able to compensate the first 200 science bloggers who take my survey at least $5 each. I’ll do this via Amazon e-gift codes revealed to each participant once they complete my survey. Bloggers who take my survey will also have the option of donating their money toward a science communication cause/charity, or toward open access publishing fees.[/i]
This isn’t unethical or anything, but it’s certainly not kosher if your objective is an unbiased sample. And when the stated goal of the project “is to understand what makes science bloggers … write about … bad science on the internet,” it’s just too rich for words.
Reblogged this on I Didn't Ask To Be a Blog.
I don’t Anthony Watts will be losing much sleep over a survey like this.
She currently has one comment on the link JC gives. From you know who. And she’s welcome to it.
I took this survey. If I remember correctly. I put top 3 as climate etc, no consensus (Donna laframboise) and bishop hill.
But I read as dozens of blogs daily, including RC, stoat, andtheresphysics,even Sou.. So what does this methodology show, anything?!
But you were asked which SCIENCE blogs you read
Oh, good point me. That certainly eliminates RC, stoat, andtheresphysics, and especially Sou.
Keeling (1995):
http://cio.eldoc.ub.rug.nl/FILES/root/1995/NatureKeeling/1995NatureKeeling.pdf
Bish points to this rather good video on global warming misconceptions.
Global warming is a misconception.
How much of the emitted CO2 — natural + manmade — is absorbed back into the ocean and biosphere?
Why is atmospheric CO2 increasing every year?
Going for quantity over quality David? That might be the best strategy – as you terrible at quality.
Well, for 2014 there were 9.8 gT of carbon emissions. Something around 2-2.5 gT of that was from burning rain forest. 4.2 gT stayed in the atmosphere. 5.6 gT went into the environment with about a 50/50 ocean/land split.
The CO2 level is rising because the partial pressure differential driven ocean absorption and CO2 PPM driven plant growth rate isn’t high enough (yet) to equal emissions. If the emission rate of increase slows (as seems inevitable) the natural sinks will catch up.
The transition should be interesting, at the catch-up.
============
David: Roughly all of the emitted CO2 is absorbed within 5 years, because the flux is roughly a quarter of the total atmospheric mass. We do not know why the CO2 level is rising and it may well be a natural fluctuation, because many of the sources and sinks are independent of one another, and most of them fluctuate naturally.
The increase is not composed of human emissions, so the question is whether it is caused by human emissions. The annual increase is larger than the human emissions but that does not mean that the human emissions are causing the increase. The increase is due to the sum of all the changes in the myriad of sources and sinks, most of which are unknown.
“We do not know why the CO2 level is rising…”
______
1) Yes we do.
2) This doesn’t even qualify as pseudoscience, but simply nonsense.
3) Is this really the level that some “skeptics” are stuck at?
4) I would think that other blogs might really run with this statement, but it seems a bit beneath CE as I don’t think it will get much traction here.
Gates, if you have 1000 sources and 1000 sinks, and all are changing, then the net change is due to all of the component changes. That is science. Your “yes we do” is not science. The fact that one source is larger than the net change does not mean that it caused the net change, far from it.
For that matter there may well have been several changes in individual sources and sinks that exceed the net change, but this is not required. The problem is that none of the sources and sinks are measured. For example, how has the CO2 flux in the Gulf of Mexico varied over the last 100 years? We have no idea. Thus attributing the net change to human emissions is an (unwarranted) assumption of AGW, not an observed fact.
This simpleton statement: “We don’t know CO2 increase is from humans…” gives a perfect example of how SKS can be so useful. This faux-skeptic argument has been given a great review here:
http://www.skepticalscience.com/human-co2-smaller-than-natural-emissions-intermediate.htm
The argument that we don’t know that human fossil fuel use and land use changes are causing the increase in CO2 doesn’t even rise to the level of pseudoscience, but is simple nonsense.
R. Gates,
“The argument that we don’t know that human fossil fuel use and land use changes are causing the increase in CO2 doesn’t even rise to the level of pseudoscience, but is simple nonsense.”
Suggest if you said:”causing some/an increase” might get you further than “causing the increase”.
Gates, at some point you need to actually say what is wrong with my argument. If the SS has a good counter argument, which I doubt, please state it. “Go read this” is not an argument, it is a dodge. You might also consider that simply calling my argument “nonsense” repeatedly makes you look silly. If you do not understand my point try asking a question.
Just to elaborate my point a bit, most CO2 sources and sinks are biological and as such they are sensitive to population change. Natural populations normally oscillate, often dramatically. (Some of the populations in question even oscillate on decade to century scales, forests for example.) Thus the AGW claim that the natural CO2 flux should be steady state is highly unlikely. Summing a lot of oscillators does not produce a steady state, quite the contrary.
Good suggestion Danny T. I could go with that. Suffice to say, the confidence is quite high that sans human activities, it is unlikely that atmospheric CO2 would have ever gone over 300 ppm during this interglacial. Thus, the current rise from 280 or so preindustrial to the current 400 ppm is almost certainly anthropogenic, regardless of whether is primary or secondary effects.
Just a note regarding David Appell’s original question. He refers to “the ocean and biosphere” but the ocean includes a large fraction of the biosphere, so he may mean the terrestrial biosphere. I understand that the ocean floor (which may be a kilometer or more thick) microbial population may comprise as much as 30% of the global biosphere.
The salient issue– is the spike on the end of this graph anthropogenic (directly or indirectly) or not?
http://www.skepticalscience.com/images/co2_10000_years.gif
That’s really all that matters. Conversations about carbon sources and sinks, while very interesting, distract from the central issue of the anthropogenic spike in CO2. Drilling down to sources and sinks and how ocean, soil, plants, etc. will respond to the Human Carbon Volcano is all damned interesting, and being researched intensely every day. But that response is based on one species forcing of the climate and disruption of the natural carbon cycle via fossil fuel burring and land use changes
The R.Gates playbook:
https://hateandanger.files.wordpress.com/2012/04/weasel-words-deceptive-vague-or-hypothetical-words-phrases-that-are-meant-to-deceive-you-into-inferring-that-something-is-a-fact-if-youre-seeing-them-it-probably-isnt.jpg
David W.,
Your original statement was: “We don’t know why CO2 is rising.”
That’s simply not true. They are rising because natural sequestration is being overwhelmed by human activity. That activity includes the burning of fossil fuels and land use changes. It’s just that simple. Remove certain human activity and CO2 levels will stop rising. Why complicate it?
Good point, Danny, if you mean there is a percentage attribution issue. But you will notice that Gates ducked it, while at the same time claiming to agree with you,which is pretty funny. He then simply repeats his argument by assertion.
That there might be a percentage attribution issue with the CO2 increase is not recognized by AGW. When pressed they fall back on a combination of questionable ice core proxy measurements and weak isotope arguments, as though these settled the issue, which they do not.
David,
And, I would still like to see that “some” defined, but so far no luck. And I know I’m not alone.
David W.
Does that spike on the end of this graph:
http://www.skepticalscience.com/images/co2_10000_years.gif
Happen without humans on the planet or not? I am not talking about a ripple of fluctuation between 270 to 280 ppm…I’m talking about the spike– The Human Carbon Volcano. That spike is anthropogenic– either directly or indirectly, it doesn’t matter. Sans humans, it does not exist. Sans humans CO2 remains in the range of 275-280 ppm, until such time as the next glacial advance begins.
R. Gates,
Other than assuming that the difference CO2’s increased concentration caused by man due to the fact that man exists, can you help me to get to this:”Sans humans, it does not exist. Sans humans CO2 remains in the range of 275-280 ppm, until such time as the next glacial advance begins.”
In other words, on what are you basing this statement? Thx.
Gates: regarding your ice core diagram, these bubbles are merely proxies, not measurements of actual atmospheric concentrations. There are good reasons to doubt their accuracy. These problems have been widely discussed so I am surprised that you do not know about them. There is in fact other evidence that CO2 levels vary a lot naturally, which is what one would expect from a biologically sensitive parameter. Hence my conclusion that we do not know.
Gates, you ask “Why complicate it?” Because it is complicated.
Well…
About 210 gT of carbon (not carbon dioxide which is 3.67 times higher) goes in and out of the environment every year.
In the past warming oceans have increased the CO2 level so there is some upward pressure on the atmospheric CO2 level.
http://deforestation.geologist-1011.net
The photosynthesis carbon deficit (the amount of absorption lost due to deforestation) is estimated at around 40 gT (38 gT in 2008). About 156 gt of carbon were released by land clearance between 1850 and 2000.
We are sourcing (emitting) about 2+ gT of carbon and permanently eliminating 0.5 gT of sinking every year by deforestation.
So there are long term trends that are aggravating the atmospheric CO2 level.
The increase in CO2 from pre-industrial levels has increased biota CO2 absorption (by the plants we haven’t deforested) about 50%.
We emitted about 7.8 gt of carbon from fossil fuels, cement etc. in 2014.
About 4.2 gT of carbon was added to the atmosphere in 2014.
So the reality is there are a lot of moving parts to the CO2 level. If we adopted a reforestation policy there would be a significant impact on atmospheric CO2 levels.
“There is in fact other evidence that CO2 levels vary a lot naturally, which is what one would expect from a biologically sensitive parameter. Hence my conclusion that we do not know.”
_______
After reviewing all the data, (really review it directly, not from a secondary blog site) you are entitled to make your own conclusion. The vast majority of climate scientists would disagree with you by reaching a different conclusion after also reviewing all the data (proxy and otherwise). The CO2 reading from Mauna Loa which are highly reliable show the annual cycle and the annual sensitivity to biological activity, but show a strong inter annual consistency, except for the consistent long-term increase from human activity. If ice-core proxies were the only paleoclimate proxy, then that data could be called into greater doubt perhaps, but there are multiple paleoclimate proxies for CO2 levels that point toward the same consistent levels. We can in fact, now extend our confidence in having a good idea of CO2 levels back to at least the mid-Pliocene. Of course error bars increase the further we go back, but again, multi proxy approaches help to constrain the likely range.
“Gates, you ask “Why complicate it?” Because it is complicated.”
_____
The spike in CO2 that began with the industrial revolution is not complicated in the basics. More carbon being added each year than can be sequestered. That much is simple and that imbalance is anthropogenic– directly or indirectly. Yes, if you want to drill down to specific details of carbon sources and sinks it become both complicated and has unknowns.
You might get some traction with your “we don’t know humans are causing CO2 to increase” at one of the pseudoscience sites, or maybe Heartland would pay you to write a paper?
“So the reality is there are a lot of moving parts to the CO2 level. If we adopted a reforestation policy there would be a significant impact on atmospheric CO2 levels.”
_____
True, but the basis of the spike has been fossil fuel use and land use changes. Reducing fossil fuel use and altering land use (including reforestation) all make sense as basic steps to proper Anthropocene Management.
RG the issue of atmospheric CO2 was created by burning down and denuding a significant part of the land area.
If we had the original forest lands we couldn’t pump out enough CO2 to significantly change the CO2 level (significant being above 500 PPM).
As it is the use of static analysis to say 7.8 gT of carbon emissions (and 2 gT of tree burning) annually will go straight into the atmosphere and stay there isn’t accurate either.
There is a race to see if we can burn forest and fossil fuel faster than nature can absorb it. If we stop burning forest the atmospheric CO2 increase will flatten significantly, because we have only 3/4ths the emissions and the land portion of the carbon sink isn’t shrinking. Even if the halt isn’t voluntary, the rainforest countries (and Indonesia in particular) are running out of things to burn.
The extra CO2 and warmth are going to make temperature zone and desert plant growth catch up to emissions – and it looks like it will happen around mid-century.
I can’t be the first one to notice this… I’ll see if some study by one of those professional scientists addresses this.
David Appell | December 29, 2014 at 6:34 am |
“Why is atmospheric CO2 increasing every year?”
Due to modern solar maximum causing fewer clouds thereby allowing more short wave energy from the sun to reach the ocean and warm it which is corroborated by slightly rising sea level during entire time of rising CO2 because warmer water holds less CO2 in solution like a can of soda pop that warms up?
http://en.wikipedia.org/wiki/Modern_Maximum#mediaviewer/File:Sunspot_Numbers.png
Hope that wasn’t too complicated. Need any bits of it explained in smaller words?
Thanks for asking btw. There still exists a possibility you could learn something if you start listening.
The basis of all their nonsense is to ignore anomalies.
ttps://watertechbyrie.files.wordpress.com/2014/06/steinthorsdottir-fig-9.png
https://watertechbyrie.files.wordpress.com/2014/06/steinthorsdottir-fig-9.png
Rolls eyes.
“The Fraud Behind Anthony Watts’s”pHraud”
http://davidappell.blogspot.com/2014/12/the-fraud-behind-anthony-wattss-phraud.html
You don’t really expect anyone to read it do you? Triumph of hope over experience.
I did, Rob Ellison, but mostly out of a ‘scientific prurience’. I apologise. It’s not worth it. Or at least not if you have an interest in Chemistry.
I’d commend you for taking a bullet for the team in that you confirmed the article was worthless. But we knew that already just from knowing the author. In the meantime you caused the traffic to Appell’s blog to skyrocket from 0 to 1 view.
It’s Christmas. I assure you that I will not be doing anything similar again for a while.
“The Fraud Behind Anthony Watts’s”pHraud” is a fraud.
https://wattsupwiththat.files.wordpress.com/2014/12/mwacompilationofglobalocean_phjan82014.jpg?w=720&h=554
https://wattsupwiththat.files.wordpress.com/2014/12/hitimeseries2_med.jpg
The ocean acidity in the 21st century is trendless. The CO2 emissions are going exponential. The two charts agree in the common section that is plotted. So the claim that Feely was cherry picking – using only the newest cherries (most recent data) – appears to be valid. For that matter the 20th century acidity appears to be trendless.
Further – the wild variations in ocean acidity raise a question about what driving acidity. Temperature? Upwelling? Pollution (real pollution like mine runoff – not faux environmentalist pollution)? Other natural processes?
Unless the atmospheric CO2 level has been going up and down like a roller coaster there doesn’t seem to be good agreement between atmospheric CO2 and ocean acidity.
Further – it isn’t ‘Anthony Watts’s”pHraud”’ which “journalist and writer” David Appell clearly knows since he communicated with the author of the graph and mentioned the writer of the original article.
And from the author of the graph:
“Hi Dave,
I’ve considered your request and, along with your lack of effort to follow up on the crucial information I recommended that you review, and given the questions I’ve also posed to you which you haven’t answered, I have to think at this time that your query is not authentic.”
The full 1.5 million data point plot: (the link above):
https://wattsupwiththat.files.wordpress.com/2014/12/mwacompilationofglobalocean_phjan82014.jpg
Like the headlines in The Onion, a quick review of WUWT headlines tells real scientists that “its all for fun and entertainment.” The bigger danger comes from the unsuspecting or uneducated who actually might believe the pseudoscience being delivered. Regarding ocean pH, charts like this from the global ocean give a nice scientific snapshot of trends:
http://earthhabitat.files.wordpress.com/2010/02/global-ocean-acidification.jpg
That’s not a chart “from the global ocean”, gatesy. It’s from the IPCC.
With all the concern over ocean acidification it seems like there would be more current data for you to post Gates.
http://www.epa.gov/climatechange/images/indicator_figures/acidity-figure1-2014.png
The EPA provides that graphic ending in 2012. I would think ocean pH would be like front page news with monthly updates similar to the endanger Arctic sea ice that will be gone by 2015, er 16.
You know, that is what one of the blogs needs, a close to real time ocean pH widget and maybe a polar bear widget so we can watch real science in action.
All real charts of Ocean pCO2 and PH show it plateaued in the 21st century – when the CO2 emissions increase was the greatest.
By 2030 there should be some indication of whether there is a real trend or ocean PH is just going up and down. But the correlation with atmospheric CO2 is lousy.
If you start from 1980 there is a big positive trend, if you start from 1920 the trend is about zero, if you start from 2000 the trend is about zero.
Thanks Captn. It was a quick post where I grabbed something I had held in my “favorites” for a while. Your charts are now in my “favorites” related to ocean pH.
My bigger issue is the way the Anthony posts his headlines, which can mislead the unsuspecting. Clearly global ocean pH has been very likely declining for many decades, and while valid contrary data is always interesting, it is all in the “spin” of that data and what it might led the unsuspecting to conclude. Hence why I liken WUWT headlines to headlines you might see in The Onion. At least, I think that’s the way real scientists view them.
“But the correlation with atmospheric CO2 is lousy.”
_____
Absolutely not true. Not even pseudoscience, but nonsense.
gatesy, gatsey
You like that 2007 outdated POS IPCC chart for the dramatic effect. What did you just say elsewhere about finding data that is counter to your whatever? You are a phony.
Hey Donny boy,
Please show me global ocean data or research that shows that global ocean pH is not trending down and is not correlated with atmospheric CO2 concentrations and I’ll be glad to look at it.
Please no pseudoscience cherry picking though!
Capt. Dallas just showed you charts that are not built for dramatic effect, like your golden oldie POS chart from the IPCC. You are a phony. We all know that.
Donny Boy,
Those charts that the Capt. shared show a high degree of correlation between CO2 and ocean pH. Are you unable to properly understand this data?
I know what captd’s charts show, phony skeptic clown. They show the up-to-date data portrayed in a straightforward, undramatic way. On the other hand, you tried to frighten us with that cherry-picked IPCC propaganda mill Chicken Little dramatization of the data that you keep on file, just for such purposes. And you lecture us on rational skepticism. You are a phony little clown.
“And you lecture us on rational skepticism…”
_____
Someone needs to Donny Boy. Seems a lot of faux-skeptics and pure pseudoscientists running around the blogosphere thinking that being a skeptic means simply denying anything and everything that does mesh with their point of view. Gives real skepticism a bad name.
Just what we needed, another lecture on faux-skeptics, from the phony skeptic. Oh, the unintended irony! Joshie will lurve this one.
‘Although data on the natural variation in the seawater CO2 system are emerging, nearly all high-resolution (e.g. hourly) time series are based on pCO2 sensors, with comparatively few pH time series found in the literature. From a research perspective, the absence of information regarding natural pH dynamics is a critical data gap for the biological and ecological arm of the multidisciplinary investigation of OA. Our ability to understand processes ranging from physiological tolerances to local adaptation is compromised. Specifically, laboratory experiments to test tolerances are often not designed to encompass the actual habitat exposure of the organisms under study, a critical design criterion in organismal physiology that also applies to global change biology [27]–[29]. It is noted that neither pH nor pCO2 alone provide the information sufficient to fully constrain the CO2 system, and while it is preferred to measure both, the preference for measuring one over the other is evaluated on a case-by-case basis and is often dictated by the equipment available.’
http://www.plosone.org/article/info%3Adoi%2F10.1371%2Fjournal.pone.0028983
There are many questions. One is what exactly is being measured.
I always find that Randy the video guy lacks much intellectual depth and always manifests an air of superiority. On it goes without saying is not warranted.
Rob,
Do you just go out and cut and paste anything at all that appears to have something to do with the conversation your trying to jump in on? While your cut and paste was interesting Rob, you missed the mark.
The topic was: Can a correlation be shown in the global ocean between CO2 changes and pH? The measurement and prediction species specific effects and the high-frequency dynamics of pH seen in local ecosystems (the subject of your cut and paste), while interesting, wasn’t the point being made. But jump in anytime with your cut and pastes and ad homs–as I’m sure you will.
I have a Masters in Environmental Science specialising in in water quality and Randy is a video guy.
The question asked was what is actually being measured. What is usually being measured is diffusion of CO2 across a membrane and the resultant change in activity in a reference solution.
You would expect CO2 in water and air to equlibriate – but t says nothing else about the hugely complex chemistry of seawater.
There are many other complex questions – some are asked in the paper referenced. If Randy the video guy JC SNIP
Oh, look. Another warmist who thinks the world began sometime after 1972. So are we supposed to act surprised when the data from before then contradicts their theory?
Does davey have a blog? How cute.
nice work david
Good thing CO2 fertilizes phytoplankton just like terestrial life.
The ocean is, of course, infinitely buffered, so… worries about ocean ‘acidification’ is just another way global warming alarmists look at the world through the wrong end of the telescope.
Yes, and since the missing heat is supposedly hiding in the deep ocean, it’s difficult to explain why the heat is mixing downward without also mixing the CO2.
I think phytoplankton and fish may explain some of that.
Fish poop and dead fish decaying in the bottom of the ocean.
Victor Venema seems to be a fitting companion to the new Lewindowsky survey, wait it’s not Stephan?
Perhaps he has changed his facebook profile to get a more receptive audience.
JC ” the mapping was done objectively (Paige Jarreau doesn’t seem to have a dog in the climate wars)”?
She has a background of warmist leaning views, lectures [ie on risk in climate change] and twitter comments though no smoking dog.
Regardless, the survey is well done at getting an incorrect message about blog sites and interconnectivity by the Lewindowsky motivated questioning technique.
Sou and WUWT have amazing connectivity given that her blog consists of attacking comments on the latter. They are mirror image in content, joined at the hip by warmist despair.
Virtually all warmist blogs mention WUWT with loathing and the comment that “they never read the articles over there” with frequency and complete lack of irony. Climate etc gets a good second run as the villain because it is is so widely read and has the advantage of Judith’s scientific reputation to knock unmercifully.
As Eli so eloquently puts it, who would want to be a member of a group like that ? If nominated he would definitely not run…
Circle of serpent envenoming stern.
=============
I have visited most of the ‘pink’ sites on the diagram, sporadically.
Each visit solidifies my opinion that the Co-Patron Saints of Consensus Climate Science are Saul Alinsky and Humpty Dumpty.
Only under Humpty Dumpty standards of word usage could the activity on those sites be classified as science, and Rule 5 is their guiding principle in dealing with apostates.
Judith –
==> “I responded to this survey, but did not list any blogs that I read regularly (you can see the ones that I read from my blog roll).”
I see that ATTP isn’t in your blogroll – yet you have made a number of comments about that blog….which might suggest that you read it fairly often (not sure, exactly, what criterion you use to determine reading “regularly.”
Are you asking Judith a question, joshie? If she is goofy enough to take the bait and reply, will you accept her criterion for “regularly”, or will you argue that if she read the crap on ATTP more than once, she has to put it on her blog roll.
I think both blogs like WUWT and blogs like RealClimate and SkepticalScience suffer from mirror versions of the same problem, which is that they both tend to latch on to any news item, study, or bit of data that they think supports their narrative, no matter how thin, uncertain, speculative, or tentative it is and whether anyone else has been able to replicate it or not In the case of WUWT, that an mean passing on any idea that seems to explain away any role that carbon dioxide might play in climate change while at RealClimate and SkepticalScience, they play a game that I often see in weird science and conspiracy theory books, which is the idea that if one can find a possible explanation that might explain something that, in the course of the narrative, becomes a likely and then certain explanation. In other words, any explanation that could possibly explain something gets treated as a certain proof. The other game that they play is quite a bit of begging the question. This is what happens when your science is about supporting an agenda, not simply finding the truth.
It is absolutely true that an honest rational skeptic tries to find any data that does not support his/her provisional truths/pet theories. The tendency toward confirmation bias is very strong. Finding exceptions or data that seems to go counter to your provisional truths are the only way that those truths will evolve or that you can discard them and find out what might actually be “true”. The ‘hiatus” is an excellent example. There were several ways of approaching it. Those scientists who saw the plateau in tropospheric temperatures were the first to try an find answers, and have led the way in discovering possible explanations for it– i.e. they are leading the way in the evolution of the science. Some people mistakenly have read too much into the tropospheric hiatus, believing it “proves” AGW does not exist or is very very minor. This runs counter to evolving the science, and is akin to throwing out the baby with the bathwater.
Lesson for honest rational skeptics: Go where the data takes you, and especially look for data that seems to go counter to your pet theories and provisionally held “truths”. It is the only way the science will evolve.
Coming from you gatesy, that’s like a drunk preaching sobriety. You are not fooling anybody.
As I am not attempting to fool anybody, then I am being highly successful. Thank you for that vote of confidence!
Those who “hang around” the pseudoscience sites would do well to spend more time reading actual research papers rather than the pseudoscience pablum being dished out at the faux-skeptic sites.
What a surprise. He claims he is not trying to fool anybody. Yeah, we can rely on your assurances. Keep at it, gatesy.
Yes, but on the flip side, you have those advocating significant anthropogenic climate change who, when faced with the plateau in temperatures, look for any plausible explanation that could explain the plateau while maintaining the idea that significant climate change is still inevitable, and upon finding a plausible explanation, they treat it as a likely or even certain explanation, even if the evidence for it is provisional, tentative, or even non-existent. It’s not the job of the other side to prove your position wrong. It’s your job to prove your position is right.
“It’s not the job of the other side to prove your position wrong. It’s your job to prove your position is right.”
—-
Rational skepticism goes beyond trying to prove a position “right” as the honest skeptic knows that position is simply a provisional truth. The honest rational skeptic should spend more time trying to prove their position (their provisional truth) wrong, not right. In trying to prove your position wrong you’ll find the exception (like the hiatus) and that is how knowledge expands. If you only look for what proves your position right, you will fall to confirmation bias.
Contemporary climate science was built from the ground up on a framework of confirmation bias. A bunch of rational skeptics don’t get together and come up with a 97% consensus. You need to up your game. gatesy. You aren’t fooling anybody.
“I think both blogs like WUWT and blogs like RealClimate and SkepticalScience suffer from mirror versions of the same problem, which is that they both tend to latch on to any news item, study, or bit of data that they think supports their narrative”
The reality is somewhere between denier and warmer.
The climate isn’t warming the way the global warmers said it would. To contend it is, is simply lying.
There is some evidence it is warming for non-solar reasons.
Until accurate attribution can be made – global warming is just a food fight.
Estimates of ECS run from 0.6 to over 4.5. The IPCC, a warmist organization with Greenpeace and WWF representation says it is 2-4.5°C.
There are people who think that awful things are going to happen and we should throw trillions at the problem. There are people who think nothing is going to happen or it will be beneficial, who think any money spent on global warming is wasted.
Both sides can make a case. The warmists don’t seem motivated to accurately bound ECS.
At this point it doesn’t look like anything bad will happen short term and it seems that letting nature and economics take its course will eliminate the threat of a high end response with potentially negative consequences long term.
Doesn’t mean the warmists are wrong – but they aren’t close to proving they are right and have to make a number of dubious assumptions to create warming scenarios with significant negative consequences.
Most people in middle go “yeah it is going to warm a little” and argue about whether that is bad or good. To this point warming has been good for the planet.
+10
Mosherite!
I mean lukewarmer.
+
You have to take into account linking external root domains as well, when analysing a website’s authority. Not that it matters comparing this site to and then there’s physics:
judithcurry.com
342 Root Domains
52,713 Total Links
https://andthentheresphysics.wordpress.com
41 Root Domains
10,051 Total Links
They must be measuring domain authority as well. The right hand side of the diagram is a house of cards. Take away real climate and it all falls down.
All this work show, is how many blogs, that saw a survey, took a survey…
ie few dozen ‘very concerned blogs’ all linked to each other, and by the looks of it, only a handful, (if that?) of sceptic blogs participated.. (or are they just linked to, not respondents)
so it shows nothing… about who reads what..
if a few dozen ‘sceptic’ blogs, etc had seen the survey, and 2 or 3 ‘science’ blogs, would we be saying how pointless the ‘concerned blogs’ are – as for ‘science’ blogs – Sou, and others there are just activists, vs say Climate Audit and ‘science’
blogs I read, include Tamsin Edwards, IPCC report, my Garden pond (Ruth Dixon) Dr Doug Mcneall, Climate lab book. Dr Joe Smith
BUT some of those post infrequently, vs others that post every day..
I commented at the author’s blog (I had seen the survey invite, via a retweet)
http://www.scilogs.com/from_the_lab_bench/mysciblog-survey-of-science-bloggers-take-and-share/#comment-175754
very very poor methodology, all it shows is it’s own limitations.
looking at the full map (zoomable here)
file:///C:/Users/Home/Downloads/BlogsRead_ModularityClass3_InDegreeSize.pdf
I read multiple blogs, all over the map) like:
Retraction Watch – have been commenting there for years.
Making science Public (likewise, I have a guest article in progress!)
Dot Earth
Collide a Scape
Guardian Science
New scientist
George Monbiot
and many many others,
Desmog blog is in there, Readfern, Grist (a pure PR activist attack blogs ) how is that science!
and look – Skeptical science is linked to the Climate Consensus 97%
?John Cook reads Dana’s blog, Dana reads John’s blog ?-
what a revelation – really silly
Another vast complication is that while I do not read a lot of these blogs, I do read a lot of discussions of their articles on other blogs. So who reads what is not based on who reads where. This is what makes altmetrics interesting.
And Susie goes with Hymie …
bts
:)
JS :)
An actually interesting question in climate debate blogometrics is how many people read them, say at least one article a month? My guess is somewhere between hundreds of thousands and millions of people, but who knows? How big is the debate? (My impression is that this is one of the biggest public science debates in history.)This is a nice research question.
Hi David – I would say the climate change science niche – is very small (concerned and less concerned) – rough indicator – twitter followers of those that blog and tweet (are relatively tiny)
also, even the biggest websites like WUWT only have unique readers in the tens of thousands, SkS, Realclimate have a little less. ;-) – both sides have tiny numbers of the public, knowing that they even exist.
It would be interesting, how many views (and unque readers,) that Guardan Environment get (and say the 97% consensus blog, and monbiot get) less than we might think?
I don’t know many people (in normal life) that even know who Monbiot is (or Delingpole, for that matter) and they certainly have not heard of any of the blogs above in that diagram-
Thus we are all in the ‘climate bubble’ ?
The public I believe are largely oblivious.
ie say WUWT or Climate Audit or Guardian environment has 20 thousand unique readers one day – and a similar number the next day…
they will largely (if not virtually all?) be the same ‘small’ group people – and not new readers – same elsewhere.
If we are here, we are outliers.
One of the most frequently found types of unskeptical arguments made by “skeptics” in the blogosphere is when they try to generalize from this outlier group to the general public.
So, “Joshua”, forgot to consider the possibility that it’s actually a small fraction of the largely apathetic public that are skeptics?
agree with Joshua – in fact WUWT, Realclimate, Skeptical science, Stoat, Sou, etc, Climate Audit, Bishop Hill, all of it – are all outliers as far as the general public are concerned. The ‘climate concerned’, also try to extrapolate from the outlier climate bubble, to the general public…
Yes Barry, both camps do it. But it is quite evident the general public doesn’t care for climate that much. Climate cannot win elections or prop up presidents or prime ministers. In not caring for the climate issue, they are more akin to skeptics than climate activists.
Confirmation bias is a pretty strong bias ( that we all must be wary of ).
I like to frequent sites of all types to ensure that all data is included.
Sketpical Science banned me, not for being uncivil but some formality of content, so I’ve given up on them.
‘Real Climate’ and ‘Open Mind’ are amusing in selectivley accepting comments. They’ll file13 comments which raise questions but if I use an alias and post as a syncophant ( “Great post – we need to stop CO2 immediately!”) they’ll put the comment up in a hearbeat.
Rabbet Run doesn’t do anonymous anymore ( which is kinda ironic, since Halpern continues to use a psudonym ) so I’ve ceased there.
That leaves just ATTP for contributing sanity.
It’s unfortunate, because banning and running just leaves a bunch of echo chambers, which has happened ar WUWT.
In the climate blogosphere there is selection pressure for irony.
The funny thing is that skeptics and gullibles are jammed into the bubble together, where we can duke it out at close range and no else even gets dirty.
visited some of the warm side sites on the chart
of course ATTP quickly called Richard Tol a “nutter”
proving his point
the other warm sites are either behind pay walls are appear to me to have very low activity
Climate Lab Book looked good and I plan to give it a closer read
many of the warm sites comes across to me as defensive (a word I hate and use reluctantly)
most of the energy is on the skeptic side
CE is the most current at being in the place where the argument is right now
looks like skepticism is getting way more converts
funny that politics and MSM give the opposite impression
then again, I’m probably completely blinded by “denialism”
wonder if John Cook has therapy recommendations
thanks Judith
happy New Year
Renown global warming expert shares greatest fear: ‘Children Aren’t Going to Know What a Goose Bump Is.’
http://www.newscientist.com/blogs/shortsharpscience/2013/03/global-greening-plants.html
http://www.newscientist.com/article/mg21829204.400-carbon-emissions-helping-to-make-earth-greener.html
http://earthobservatory.nasa.gov/Features/GlobalGarden/
http://earthobservatory.nasa.gov/Features/GlobalGarden/Images/npp_change_bump_lrg.jpg
What’s not to like?
Everyone needs a metric to evaluate positive change. I’m a greenie from way back. The earth is observed (satellite coverage) getting greener and greener. There’s a growing consensus it’s CO2 enrichment from fossil fuels.
More green equal more better. My metric. Subjective, relative, but there you have it. The greener the better.
When fossil fuel runs out we need to figure out a way to keep CO2 rising. That’s just how beneficial it is.
And there is probably even more greening in the ocean, but it also probably mostly gets eaten by growing sea life populations.
Classic…
Skeptical Science reinvents the hockey stick patching disparate data sources together.
http://www.skepticalscience.com/images/co2_10000_years.gif
R. Gates uses it upthread without hesitation like it came from a legitimate journal instead being otherwise unpublished original work by an unnamed author here:
http://www.skepticalscience.com/print.php?r=101
http://www.illustrationsof.com/royalty-free-roflmao-clipart-illustration-1148650.jpg
David
An objective person unfamiliar with the arguments might observe that with higher temperatures than today in the past, including the Minoan, roman and medieval warm periods, that levels of of co2 over 300 ppm are not the determining factor that causes warmng.
Tonyb
Tonyb
I see nothing
whatever will we do with ourselves if you keep pointing out stuff
Tony said: “that levels of of co2 over 300 ppm are not the determining factor that causes warmng.”
—-
Different factors can lead to the same effect, or in climate terms, different forcings can have the same net effect on energy accumulation or loss from the climate system.
Tony,
natural warming + manmade warming > natural warming
natural warming + manmade warming > manmade warming
DOUBLE TROUBLE !
I blame the burning of mastodon dung by Clovis hunters for all this sea level rise. Of course, there was a natural component as well. Or, as a sciency person might put it: mastodon poo + natural warming = catastrophic SLR.
http://upload.wikimedia.org/wikipedia/commons/5/51/Bassian_plain_14000_BP.jpg
Look on the bright side moso, w/out those Clovis hunters
there’d be no annual Sydney ter Hobart Yacht Race.
Very posh pov for a serf! I’m thinking that, if our ancestors had taken more care, Ricky Ponting could have played for Victoria. (Well, Bill Lawry was hardly going to play for Tassie.) If only our forebears had a climatariat urging them to consider their grandchildren, and their grandchildren’s grandchildren.
Even now, most scientists are just drudging idly away in dentistry or engineering or food packaging. We lack real scientists, like Victor Venema and the lady with all the names, to explain the universe in clear spaghetti terms.
LOL !
max
So you seem to be agreeing that as the past has been warmer than today it must be natural variability and it is therefore the theoretical man made element that models say are coming that worry you, not what has happened to date?
Equally then we can take it that natural variability has to date caused those ‘extremes’ you seem to be worried about.
tonyb
Getting Tasmania back would be catastrophic.
Tasmania is an island unto itself and must remain so. )
Our ancestors, the last time CO2 was at 400 ppm:
http://researchmatters.asu.edu/sites/default/files/images/lucyF1.jpg
Hey, they did alright for themselves (else we would not be here today). So no worries…right?
Except for one little detail- we’ve got a few more mouths to feed then they did:
http://upload.wikimedia.org/wikipedia/commons/thumb/b/b7/Population_curve.svg/350px-Population_curve.svg.png
But warmer is always better for plants and animals, right?
http://www.globalpost.com/sites/default/files/imagecache/gp3_full_article/mexico_drought_2012_07_16.jpg
And we’ve had to completely disrupt not just the carbon cycle, but the nitrogen cycle as well to feed all those mouths:
http://www.epa.gov/climatechange/images/science/graph-increase-in-ghg.jpg
The disruption of the nitrogen cycle is definitely a little discussed topic in much of the blogosphere, though it deserves attention. Team Pseudoscience however has it’s hands full trying to suggest humans have not caused the CO2 increase. They have little ammo left for the nitrogen cycle disruption:
http://orion.chemi.muni.cz/kucera/New_Folder2/nitrogen_cycle.jpg
Gatesy, the Earth has never been without non-condensing greenhouse gases, nor has it ever been without water vapour, so your point is irrelevant.
Last time CO2 was 400ppm? Some 13,000 years ago?
https://watertechbyrie.files.wordpress.com/2014/06/steinthorsdottir-fig-9.png
‘The most significant aspects of the new CO2 record presented here, is i) the dynamic behaviour of CO2 throughout the interval,but particularly at climate change boundaries, and ii) the considerably higher concentrations, compared to CO2 records based on ice core data (see Fig. 8). It has been suggested that stomatal proxy records reflect atmospheric CO2 more accurately than ice core data, for instance by comparing modern air flask measurements of CO2 to both types of datasets (Kouwenberg et al. , 2003; Finsinger and Wagner-Cremer, 2009). It has furthermore been suggestedthat[CO2] values derived from air bubbles in ice cores underestimatethe true palaeo-CO2 (e.g.Berner and Kothavala, 2001; Kouwenberg et al., 2005; Van Hoof et al., 2005). The generalagreement of the several stomatal proxy studies that have previ-ously been published covering the interval studied here also sup-port the finding that CO2 was higher during the last termination that previously believed (seeFig. 9 and Section 5.2). The absolute ppm values for CO2 during the last Termination may be very difficult to determine with certainty, but increasingly evidence is pointing towards higher concentration and more dynamic behaviour of atmospheric CO2 during this important interval.’ https://www.academia.edu/2949675/Stomatal_proxy_record_of_CO2_concentrations_from_the_last_termination_suggests_an_important_role_for_CO2_at_climate_change_transitions
The ice cores are not necessarily reliable.
Oh, so many more:
http://ramblingsdc.net/Australia/Graphs/CSIRO1KCO2.jpg
http://environ.andrew.cmu.edu/m3/s2/graphics/embedded/fig14-2.jpg
http://forourgrandchildren.ca/wp-content/uploads/2012/09/CO2-Temperature-1000-years.jpg
Not a single published paper among them. Blog science one and all. Try again.
And all exactly the same as well.
One might be forgiven for assuming that they’re all from the same source.
SOLAR LONG TERM TREND
http://orssengo.com/GlobalWarming/SolarLongTermTrend.png
http://3.bp.blogspot.com/_RBGVNzE33VE/SgN2FbAUGNI/AAAAAAAAAN0/ICUJWZDvOVs/s400/us_post_causes_global_warming_lrg.jpg
CO2 does not coorelate with temperature and is still at historical low levels:
http://www.biocab.org/Geological_Timescale.jpg
Gatesy the phony skeptic warmista troll has gone into fullblown dramaqueenery mode, today. Nice performance, gatesy. We are entertained. More pictures, please.
Solar activity coorelates better with temperature than CO2:
http://sppiblog.org/news/rises-of-co2-and-temperature-do-not-coorelate
http://sppiblog.org/news/rises-of-co2-and-temperature-do-not-correlate
Man made contribution to CO2 insignificant:
http://www.geocraft.com/WVFossils/PageMill_Images/image270b.gif
That’s the power of compounding interest over many years, eh Ordvic?
http://www.tradingonlinemarkets.com/Articles/Learn_to_Invest/Compound%20interest%20example.gif
Water vapor rules the greenhouse system:
http://www.geocraft.com/WVFossils/greenhouse_data.html
With water vapor alone and without the non-condensing GH gases, very quickly, the Earth would look like this:
http://blogs.egu.eu/network/4degrees/files/2013/09/Fictional_Snowball_Earth_1_Neethis.jpg
Water vapor alone is not enough to sustain the GH effect. Basic physics.
ordvic, oops, you pointed to a pseudoscience page by mistake. Try again. In terms of W/m2 at the surface, taking away the CO2 amounts to about 20% of the effect. Perhaps your authors mean something else by greenhouse effect or don’t quite understand it yet. You need to ask them what they mean or if they even know what they are talking about.
Well I supplied you with my BS sites, show me yours. I already have sKs stuff so I don’t need more of that. I’m already convinced of the CO2 physics theroy so I don’t need more primers on that and the picture of the next ice age doesn’t help.
Martian atmosphere is 95% CO2. That’s why it is so hot there. I like your handling of facts, Gates Scientist.
“ordvic, oops, you pointed to a pseudoscience page by mistake.”
_____
No mistake. Team Pseudoscience serves up dinner 24 hours a day in the blogosphere:
https://muscleheaded.files.wordpress.com/2014/09/pablum.jpg
Gatesy, the Earth has never been without non-condensing greenhouse gases, nor has it ever been without water vapour, so your point is irrelevant. (previous post ended up in the wrong place)
“Martian atmosphere is 95% CO2.”
______
Wow, that is sure relevant to a discussion of a composite atmosphere of condensing and non condensing GH gases. Fortunately, actual scientists discuses and analyze the supporting role of non-condensing GH gases in an atmosphere with water vapor:
http://www.giss.nasa.gov/research/briefs/lacis_01/
Thank god there are islands of actual science in the sea of Pseudoscience.
“so your point is irrelevant…”
______
Yes, actual science is always irrelevant to followers of Pseudoscience. Wouldn’t want to interfere with a good meme by inserting relevant facts, which in this case is that water vapor needs non condensing GH gases to sustain the climate we all enjoy. Thus, discussions about the small role that non condensing GH gases play must be accompanied by the fact that their role is absolutely critical to keeping our planet from becoming Ice House Earth.
ordvic, try this one.
http://www.giss.nasa.gov/research/briefs/schmidt_05/
By the way your cite was entertaining especially when you get to the reference 5f which was a hoax news piece (Onion style) about the EPA planning on regulating water vapor, just the kind of thing the crazies want to believe. I think they give skeptics a bad name, and you need to complain to them about their web page.
JimD, thanks for the link, I’ll read it later. Other than the authors take on it, tell me what chart or table on the pseudo science site is in error. I’m simply pointing out it’s a matter of degree and that is what Gates started with with his hockey stick CO2 charts. I don’t think anyone knows, at this point, just how much the effect will be. If they did know Hansen and the IPPC computer models might have been a little more accurate with their predictions and projections.
ordvic, if anyone uses ecoenquirer.com as a reference, I wouldn’t trust any words from them and would just look elsewhere. ecoenquirer is the Onion of the “skeptics”, it appears. The CO2 graphs from Gates are correct, and I wouldn’t be surprised if Judith has used it too. Skeptics have no alternative to it. You can search.
Yes, NCGG’s are required to maintain the climate we enjoy, but so is water vapour. Take away the latter and you also end up with a frozen planet.
The big question is sensitivity, and you cannot imply anything about sensitivity by invoking scenarios (no NCGG’s) which have never occurred, and will never occur.
And do stop with the feeble ad-homs – it’s not conducive to good discussion.
Jim D, it’s hardly surprising, since all of Gatesey’s CO2 graphs are the same.
Why do you imagine he found it necessary to present them all, when just one would have sufficed?
phatboy, you have to ask Gates that. As far as I am concerned David presented it, along with references, but looked skeptical despite those, not giving any idea which reference he didn’t agree with and why. Do you know?
There are several new papers on how CO2 physics is more complicated than first known. I read one that was well advertised that had to do with how long wave avd short wave work with CO2 and if I am recalling correctly it showed that it is incoming radiation that produces an effect not outgoing. I’ll have to try and find it later. There is also this paper that is saying the same (it may be the one I’m thinking of):
http://m.pnas.org/content/111/47/16700.abstract
There is still no answer as to whether or not the graphs and tables on the pseudo science site are accurate other than cartoons and pontificating like super science observers (not very impressive or expressive). Also no mention of solar being in better correlation with temp than CO2 as the other site showed. I’ll have to take there is no real rebuttal here just huff and puff.
R. Gates
CO2 as the atmospheric thermostat, the Crickian “central dogma” of climate science. I checked out your link referring to 4 papers by the usual suspects – Schmidt and Hansen. Only Rothman was new to me.
Regarding all the Mars comparisons, Mars is a very different world – mass, magnetic field, atmospheric density, distance from the sun, etc.
As for the graph, a y-axis range of 0 – 7,000 ppm and an x-axis range of 500 – 0 MYA (million years ago), the Phanerozoic era, would give a less misleading picture. At the very least, go back to the early Cretacious as even just the Pliestocene is insufficient to show true variability, IMHO as a not-so-confident id gee ought.
Correction – “…late Cretaceous…”
ordvic, regarding paleo, check out Realclimate who researched the origins of the graph you showed as a hand-drawn idealization that gradually got more wiggles added but is now far out of date with current knowledge. The paleoscientists use better ones nowadays.
http://www.realclimate.org/index.php/archives/2014/03/can-we-make-better-graphs-of-global-temperature-history/comment-page-3/
Jim D, yes I’m aware of the different takes on paleo and prolly already read the real climate but I’ll check later. I think it’s pretty well established that temps plunged late ordovician with mass extinctions and there were two more after that. CO2 lagged by hundreds of thousands of years. CO2 was as high as 4000 to 7000 ppm in the early years with the weak sun yadda yadda. I grabbed that one but I’ve seen many other including Royer who did his best to smooth it out. Regardless, I’m more interested in this idea of CO2 working with incoming solar and water (clouds) that is why I pointed to the pseudo science site. You and Gates don’t believe water has something to do with the greenhouse effect?
If that paper is the one I was looking for it talks about CO2 working with clouds in feed back and that the natural forces of oceans cycles etc. That could explain the poor perdictive ability of Hansen and the IPPC. I’m just not accepting the simplistic reasoning of CO2 to Temp in direct correlation. The effect could be any best guess at this point.
ordvic, the NASA link I gave you also explains how water vapor is important, and clouds. It really is worth reading.
In paleo the main solar effect as pointed out by Royer is that the sun has been strengthening at about 1% per 100 million years, so given CO2 amounts in the distant past have much less effect than now.
RG likes to present badly drawn charts from a warmers perspective.
How RG sees it.
http://environ.andrew.cmu.edu/m3/s2/graphics/embedded/fig14-2.jpg
How it really is:
https://realityversiontwopointzero.files.wordpress.com/2014/12/fig14-2b.jpg
PA, if you distort it even more, you can make the problem go away completely.
You seem unaware that the minimum CO2 level is 0.
I added 0 to the chart.
380/280 = 1.35 so about 3/4ths of the chart was missing. On that chart the CO2 level is shown as 370 – a 32% increase over the existing level.
The proportions are correct – and 0 is indicated at the bottom.
Maybe this will please Team Pseudoscience:
http://blogs.scientificamerican.com/observations/files/2013/05/co2-800000-years.jpg
Probably not as their sensitive tummies can’t digest anything but pablum.
http://judithcurry.com/2014/12/28/climate-blogosphere-discussion-ii/#comment-659509
Sorry Robbie,
No sale on your little Pseudoscience project. Global CO2 was not at 400 ppm 13,000 years ago. It’s been about 3.2 million years since we’ve had these levels. Our ancestors looked something like this:
http://researchmatters.asu.edu/sites/default/files/images/lucyF1.jpg
Wouldn’t really do to cast doubt on ice cores with actual peer reviewed science. Randy the video guy might get sanctimonious and supercilious – and deny it.
‘The most significant aspects of the new CO2 record presented here, is i) the dynamic behaviour of CO2 throughout the interval,but particularly at climate change boundaries, and ii) the considerably higher concentrations, compared to CO2 records based on ice core data (see Fig. 8). It has been suggested that stomatal proxy records reflect atmospheric CO2 more accurately than ice core data, for instance by comparing modern air flask measurements of CO2 to both types of datasets (Kouwenberg et al. , 2003; Finsinger and Wagner-Cremer, 2009). It has furthermore been suggestedthat[CO2] values derived from air bubbles in ice cores underestimatethe true palaeo-CO2 (e.g.Berner and Kothavala, 2001; Kouwenberg et al., 2005; Van Hoof et al., 2005). The generalagreement of the several stomatal proxy studies that have previ-ously been published covering the interval studied here also sup-port the finding that CO2 was higher during the last termination that previously believed (seeFig. 9 and Section 5.2). The absolute ppm values for CO2 during the last Termination may be very difficult to determine with certainty, but increasingly evidence is pointing towards higher concentration and more dynamic behaviour of atmospheric CO2 during this important interval.’ https://www.academia.edu/2949675/Stomatal_proxy_record_of_CO2_concentrations_from_the_last_termination_suggests_an_important_role_for_CO2_at_climate_change_transitions
PA, yes, chartmanship is a major tool of the doubters whether it is minimizing man-made trends or lopping off the first part of temperature trends. It is quite clever. Many are fooled. In the case of CO2 mankind is responsible for the part above 280 ppm, so having the chart display that part is quite reasonable. You could also start all temperature plots at 0 Kelvin if you want to be consistent. For example the global surface temperature is 288 K, making a 1% rise almost disappear. This may make skeptics feel much better about themselves by hiding the problem.
Rob E, you keep showing the CO2 for one site which says more about the health of those particular forests than global climate. Until someone provides an independent time series from elsewhere this is just a local measurement with no global significance. I would be impressed if someone found a correlation with a forest in New Zealand to this one in Sweden, for example. There are good reasons people don’t take climate CO2 measurements in forests.
Jim D,
“There are good reasons people don’t take climate CO2 measurements in forests.”
I’ve totally missed your point here. First, aren’t all measurements local (temp, co2, IR, etc.? And second, with our planet being 31% covered by forest how can we not measure co2 levels within those areas? http://www.earth-policy.org/indicators/C56. Who decides what is included and what is not leading to “global significance”?
I think the really interesting thing here is the new NASA carbon satellite observatory, which is providing insight into spatial variability of CO2. This will provide a context for interpreting long time series at single sites (including ice cores!). I suspect there are surprises in store for our understanding of space/time variability of atmospheric CO2.
Dr. Curry,
First, Happy New Year, and thanks to you for all your work and most importantly sharing.
Do you have any “prediction/projection” (which you’re ready/willing to share) where this might lead? :” I suspect there are surprises in store for our understanding of space/time variability of atmospheric CO2.”
The “well mixed” CO2 vs. the modeling presented from NASA of the flow of CO2 (from the sattelite system which I believe you’re referencing) visually appears to be somewhat less than “well mixed”. Am I missing something here?
Not ready yet to say anything on this topic, i’m still in info collection mode.
‘The general agreement of the several stomatal proxy studies that have previ-ously been published covering the interval studied here also sup-port the finding that CO2 was higher during the last termination that previously believed ‘
You haven’t read the study have you Jimmy Dee – or even understood the nature of the vegetation.
‘Betula nana is a deciduous Shrub growing to 0.3 m (1ft) by 0.5 m (1ft 8in).
It is hardy to zone (UK) 2 and is not frost tender. It is in flower in May, and the seeds ripen in July. The flowers are monoecious (individual flowers are either male or female, but both sexes can be found on the same plant) and are pollinated by Wind.’
As usual – the superficial in service of the meme. Yes – beware pseudoscience from the true believers.
Rob E, they only showed a time series in one area (see map). Unless they or someone shows a correlation with some distant area, I would be skeptical. What is wrong with being skeptical when you only have one data point? You should be more skeptical of this, especially as they suggest major outgassing in the Southern Ocean that is so far away from Sweden as a CO2 driver for climate change. However, it is a step that you agree with them about CO2 concentrations possibly driving climate change. Maybe there were short-term rises in CO2 after the Ice Age ended, but the ice cores indicate that these were not significant at those locations, implying it was more likely a somewhat local effect.
You still haven’t read it – or any of the others studies referenced.
file:///C:/Users/Robert/Downloads/16555-47845-1-SM%20(2).pdf
`
It’s not a new idea.
http://www.geos.ed.ac.uk/research/globalchange/group5b/Quaternary/McElwain2002.pdf
We could actually discuss some science. You know what they say – either sh_t or get off the pot.
Rob E, yes, there were large temperature and CO2 fluctuations, consistent with each other in the Younger Dryas. This is not new. Was the rapid warming at the end of the period driven by some CO2 event or did CO2 outgas in response to warming from the restoration of the Gulf Stream? This is an open question apparently. I don’t have an answer. Do you?
You need to actually reference some science and actually construct an argument around data – not simply waffle on.
http://www.biomind.de/realCO2/literature/Kouwenberg_2005_Geology.pdf
‘To explain substantial centennial-scale CO2 shifts during the last millennium, a mechanism must be found to produce such rapid changes…’
https://watertechbyrie.files.wordpress.com/2014/06/co2_beck.png
Rob E, first you have to be sure you are not just looking at data noise cause by poor sampling. The ice core suggests that in the mean this noise just cancels itself out on larger scales and longer time scales, and only the recent rise shows there too.
Such variability couldn’t be right – like numerous other data series that don’t quite fit the narrative. Don’t even have read any science – just pull another rationalisation our of your arse.
The ice core fits and is a direct rather than proxy measurement. You can believe proxies over direct, but I don’t automatically believe them without lots more evidence. I’m skeptical.
That Robbie would try to suggest that the stomatal proxy CO2 estimates represent a better measuremt than global ice cores is quite laughable. What we are concerned about is CO2 in a well mixed atmosphere. Not only do stomatal proxies have a high margin of uncertainty, they have high variability because they do not represent a well mixed atmosphere. What we have learned from direct measurements of CO2 in a well mixed atmosphere is that, except for the annual cycle, and the steady anthropogenic rise, CO2 does not show the high variability shown in stomatal proxies. Furthermore, because they are ground based, (most plants are near the ground), stomatal proxies give a local ground snapshot of CO2 and always will be higher than a well mixed global atmosphere. Taking into consideration their inherent limitations, wide variability, and uncertainties, what stomatal proxies can be useful for is confirmation of general ice core measurements, and/or extending estimates beyond ice core reach. With the recent ability to estmate CO2 levels using the proxy data from Lake E. in Siberia, going back millions of years (look for more on this in 2015) we now have another source of CO2 estmates that confirms the greater accuracy of ice cores over stomatal proxies. Bottom line: with a high degree of confidence we can say that CO2 levels have ranged between 180 and 280 ppm over the past several million years with the recent anthropogenic excursion to 400 ppm and rising being quite remarkable in swiftness and intensity in the geologic record. Trying to suggest otherwise is pseudoscientific pablum.
They also present a record of pCO2 at the time of their growth. Ice core records (evidently) don’t. They “smooth out” the data over periods of decades to centuries that far back, due to diffusion.
Or so Salby and others have claimed, and “Global Warming” believers have responded to those claims with denial and (usually intellectual) hooliganism.
Danny Thomas, forests have a large diurnal cycle in CO2 and also vary over decades with local climate in ways unrelated to CO2 but affecting their CO2 production. I would not rely on individual forest measurements for long-term trends. At Mauna Loa they are very careful to exclude air that is influenced too much by the local surface.
Jim D,
Thank you.
I may have misunderstood/misinterpreted your meaning so please clarify if you can. No individual location should be used as proxy for conditions for a region (depending on how defined), but from this: ” forests have a large diurnal cycle in CO2 and also vary over decades with local climate in ways unrelated to CO2 but affecting their CO2 production.” do we not effectively take a number of individual locations to generate a broader geographical picture? And if we do, as long as the insturmentation remains unchanged (Re: Steve Mosher) why are trends from an individual not valid especially if over longer time frames? This comes across are indicating there are not regional climates and there are so I’m not clear on why you’d not be comfortable with that data. I’m sure there’s a big hole in my thinking so looking for your aid once again.
Danny Thomas, I think that a few well chosen sites can give the correct global picture. So Mauna Loa is representative enough, as verified by other stations like at the South Pole, for example, that large numbers are not needed, and especially those that have a lot of local natural or manmade sources that contribute noise.
Jim D,
Thanks. I’d not thought this through before but you’re making me wonder. Any idea on what would be considered a sound sampling (zero stats in my education)? Would we be better off by defining each “climate zone” on the planet (then there’s the question of that definition): tropical, temperate, polar?
Or sampling every say (arbitrary?) 100 square miles? I’d expect the more the merrier, but that is only an assumption on my part. But if we only sampled the “big three” and did so over longer time frames, I’d be okay with considering the trends.
Better question may be to just ask you what, if you were the designer, would you prefer and why? I’m still not clear on since 31% of the planet is considered “forested” why you’d lack comfort sampling in those areas especially with an extended time frame. I fear I’m still missing something, and I’ve had coffee.
Danny
Did you ever see my article on co2?
If not i will link to it but it needs some background info and caveats
Tonyb
Danny, this depends on the purpose of measuring CO2. The main purpose is to see the global trend which is taken to be uniform because it is well mixed given time. Given that, if you are sure about the trend in one location, you have the number you need. So, even though the mean may vary from place to place, the trend is not expected to because being well mixed means it evens out to the same number everywhere.
Jim D,
I’m trying to understand your offering, and going back to the statement about not being comfortable with an individual site and associated trends if placed within a forest being inappropriate so I must look to you for context when it comes to why the sampling was being done. So in other words, in the discussion about sampling not being appropriate in the forest (as I understood your perspective) what methodology would increase your comfort?
Here’s an excellent summary of some of the exciting data coming from Lake El’gygytgyn (called simply Lake E for short) in Siberia:
http://www.skepticalscience.com/pliocene-snapshot.html
This paleoclimate data has opened up a whole new exciting window into past climates of Earth with very high resolution. Most importantly, the data has given us a glimpse into what the planet was like the last time CO2 was at 400 ppm. A time when human ancestors might have looked something like this:
http://www.scientificlib.com/en/Biology/Anthropology/images/AustralopithecusAfarensis1.jpg
Expect more exciting paleoclimate data from Lake El’gygytgyn in 2015.
Looking for global long-term trends in CO2, a forest is not the best place to put a measurement. It is close to sources that may be variable regardless of global variations, which confuse the signal. Similarly you would not put a measurement in a city. Obviously people do measure CO2 in these places too, but that is to study local things that dominate the diurnal and seasonal cycles.
Jim D,
What I’m not getting is why would the location matter, assuming no change in insturmentation, and a substantial time frame (say 30 years)? How would this invalidate the trends? Since forests are 31% of our globe, and cities including their associated heat island effects, if the time frame is long enough I’m missing why the concern. Excluding 31% of the globe when measuring global co2 concentrations seems counter to me.
How are the forest associated process different than that say of the oceans. The CO2 short term cycles should moderate and “smooth” (if that’s a good choice of words) over the long term time should they not?
Danny, the local ups and downs are larger than the global signal you are trying to detect. Even within a forest it makes a difference whether you are on a crest or in a valley. The signal can be very complex and interesting in other ways, but not good for climate monitoring. Forests, for example inhale CO2 in the daytime, locally depleting it until more is brought in by the wind. Here’s a quick reference I just found.
http://www.jstor.org/discover/10.2307/1938896?sid=21105534838433&uid=3738032&uid=2&uid=70&uid=2129&uid=4
Jim D,
I promise I’ve had zero grog (so far) today, but this is not sinking in.
I understand your commentary but am only having a challenge with the “why” portion. Does it matter if the data ranges are more broad, given sufficient time (30 years?) than if more narrow when generating trends? I’m gathering that this is the concern you’re trying to get through to me (broad ranges), but I’m only unable to digest how it’s an issue with trends are negatively impacted.
I’m perceiving that if the range is 1 to 10 and the mean is (approx.) 5 is the trend different that if the range is 1 to 100 and the mean is (approx.) 50? Or is my assumption wrong that the range should not impact the trend? (Hoping this is clear?) If I am wrong, then are not the ranges for insturmentation located elsewhere equally arbitrary?
Danny, if you are planning to have a controlled measurement environment for 30 years, you have the best control when that environment is simple, like the Mauna Loa one, and even there they can’t use all the measurements because some are too locally influenced. Ideally you want to look at air that has not been through a source or sink recently. If they could have a station in the upper troposphere they would, but a mountain surrounded by ocean is the next best thing.
Jim D,
I’m sorry, but I’m not getting the reasoning. Thanks for your patience.
This seems to me to be an argument for more insturmentation in more sites inclusive of mountains, troposphere, cities and forests. Exclusion of 31% of our planet bothers me when attempting to gauge global anything. Excluding all except mountains bothers me more. I’m still lacking something. Picturing the NASA movie of CO2 flow from modeling, I’m missing how given sufficient time the effect on the trend would be affected. This further presumes I have the right comprehension of “well mixed”. And I’m sensing that 1000 locations over longer times is better than 1 location (mountaintop) over that same time.
Danny, for climate what matters is the CO2 value through higher levels in the atmosphere because the radiative impact depends on its profile. The surface is not a good place to get this because of extraneous noise. The best surface locations for getting at this would be mountains far from sources with correct filtering to remove surface effects in some measurements. They are trying to measure the cleanest representation of tropospheric CO2.
Jim D,
Again, I thank you for your patience. If you have reading material to suggest I’d appreciate it. I grasp what you’re saying, but I don’t quite get the “why”. The more the surface, intermediate, and upper locations seemingly the better to generate a “global” measure. As my reading so far leads me to a multi level co2 flow including sinks, sources, and no matter the altitude if one is trying to figure out the broader “atmospheric” saturation level. I think you’re telling me that due to the GH effect and radiation reflectivity being important at the tropospheric level, but does it not reflect at all levels? I guess part of it is defining a “clean” sample. Grrrr. I’m sure your explaination is clearer to others, but I just don’t have a grasp.
Danny, yes, it comes down to what is most representative of the global atmosphere, and most of the surface isn’t. It is a careful sampling exercise rather than trying to measure everywhere all the time and hoping the noise cancels.
Thanks Jim. Happy New Year!
Thanks, Danny, Happy New Year.
If we were talking about interest on savings, that would be an increase of about 1/1000ths of a cent per million dollars, right? That probably sounds like an unconscionable windfall to the Leftist and the cargo cult culture that vote themselves government transfer payments to be paid by the productive.
“Such is the power of the Internet. In the last 12 months the site has been visited by 600,567 unique users, who have looked at 3.4 million pages. Traffic is growing. Twenty seven percent of visitors were new.”
http://joannenova.com.au/2014/12/merry-christmas-and-thank-you-site-traffic-up-20-to-600000-people/
And it didn’t even register on the ‘map’.
Not even ‘in the ghetto’, where the stoat has been known to comment.
Go figure.
Mark M aka handjive
After seeing this unfold, it seems to me this survey is just the latest example of polarization of the climate issue. And there are many who seem to want to point to even very flawed studies that serves their prejudices or rhetorical needs. One is reminded of the defense of Mann or the defense of Lew’s retracted paper. There is far too much of this in the climate blogosphere and it seems few forums for informed civil discussion. Perhaps Lucia’s or SOD are the best places left. I think neither was included in the diagram. But this study seems to be like most “survey” based results, badly flawed in terms of characterizing the subject matter.
Maybe part of the problem is the comment threads where people sometimes are less than eloquent or restrained. Comment threads sometimes become echo chambers for those who find a blog and its commenters congenial. Often they are a lot less informed than the blog posts themselves.
It would be interesting to try to quantify participation say at Climate Etc over time. I believe it might show a loss of interest among many valuable commenters who participated in the past. It is hard I suspect to sustain interest in climate over time. It is a very complex and specialized subject.
David Young
I am new to this very interesting subject
my observation is that scientists themselves barely agree on basic facts
take the hiatus
just read today on Climate Lab Book
Ed Hawkins says no hiatus
Judith Curry says yes
I recall Judith saying the hiatus is the heart of the debate
being informed means tossing a coin
perhaps informed “valuable commenters” loose interest because discussion about the technical facts goes round in circles
politics and psychology take over
while we wait for nature show it’s hand
I doubt the genteel discussion you seek is possible
+
Words are lousy ways of talking about trends.
So are numbers based on “analysis” that throws away 99.9999%+ of the data. By (among other things) cramming it all into a few dimensions imposed by the “analyst’s” preconceptions.
A new Gallup poll shows Obama is the man most admired by Americans. Pope Francis was second. Hillary is the most admired woman, followed by Oprah.
http://www.gallup.com/poll/180365/barack-obama-hillary-clinton-extend-run-admired.aspx
Then again Obama doesn’t even appear on the number of top ten finishes and Richard Nixon gets 21 appearances.
Maxy seems to be constantly and selectively proving a point that people he likes are popular. Why? What does it have to do with science or policy? Maxy seems a very confused little camper.
As usual, Rob Ellison tries to turn back the clock when faced with the realty of today. I don’t blame him. If I were past my prime, I might do the same.
Only 3 deniers made the admired list, Sarah Palin, Bill O’Reilly,and Ben Carson, with a combined score of 4, compared to a combined score of 31 for Obama and Hillary. If the question had been “who do you admire least?” deniers would have scored higher.
Putin made the top ten in Max’s list.
…Really?
schitzree said on December 30, 2014 at 10:48 am
Putin made the top ten in Max’s list.
…Really
_________
It was not my list, it was a list from a Gallup poll. If I were to list the men I most admire, the results would be different, although Obama still would be #1 and the Pope still would be #2.
OMG
another ageist comment from Max
time for sensitivity training
I thought us old conservative reactionaries were responsible for all …ist comments
get off our turf whipper snapper
Maybe he feels validated.
Did a comment disappear? I know I said arbitrary but capricious?
The number of appearances in the top 10 doesn’t include Obama the second at all and Clinton comes in well under Margaret Thatcher.. Longevity counts. It gives a sense of of the vagaries of history – and the futility of partisan posturing like Maxy’s.
As for the future – you need some new blood and new ideas. Perhaps the poll leader for 2016 – Jeb Bush. A third Bush in the White House? He does seem to have a bit of private sector baggage however. But let’s hope that the GOP has a credible candidate — just because Maxy and Joshua would be so annoyed.
Max –
==> ” I don’t blame him. If I were past my prime, I might do the same.”
Don’t make the mistake of thinking that because of Chief’s current state, that means he’s necessarily past his prime.
For all we know, this might be an improvement. :-)
Sorry Josh – your prime has been and gone and no one noticed. Did they?
But what does it all mean, Max?
It suggests Hillary will be our next president.
I don’t doubt that. Unless they can get Mitt to run, I think the dems will be able to put anyone they want in office.
As is often the case in climate science, the methodology behind the network analysis is just silly. So, whatever it shows is really worse than meaningless; it is meaningless with a bias, yielding only unscientific misinformation. Reminds me of the infamous Lewandowski conspiracy ideation paper. What causes me a degree of concern is that some frequent commenters here who seem to think they are scientists or at least understand science actually defend this stuff in multiple redundant posts. I hope they are just trolls or agent provocateurs, but I suspect not. I suspect they are true believers.
The graph shows that people that agree with each other talk with each other and some of them talk with people they don’t agree with. Ground breaking. I’m in awe.
R. Gates,
Completely OT, but you (at least I think it was you) were discussing this the other day and I cannot recall on which thread so posting this link here:http://www.nbcnews.com/science/science-news/belizes-blue-hole-reveals-clues-mayas-climate-doom-n276296
Thanks for that link Danny. Very interesting. Seems the Mayans as A civilization suffered the effects of climate change in a terminal way- right in the heart of the very warm MWP. Seems a warmer climate is not always better for civilizations.
R. Gates,
“Seems a warmer climate is not always better for civilizations.”
Or at least as the article states, a drier one! 100 year drought!
Now the question (as ever) is why?
It seems to not correlate to CO2 (EPA):(Note the N20 spike?)(website added as I cannot tell if the image pasted….sorry)https://www.google.com/search?q=chart+of+co2+levels+in+atmosphere+for+2000+years&espv=2&biw=2133&bih=1004&tbm=isch&tbo=u&source=univ&sa=X&ei=qweiVIDcNomYgwTvw4PwCA&ved=0CB0QsAQ&dpr=0.75#facrc=_&imgdii=_&imgrc=_VcEkDsii0NIpM%253A%3BY_jMPlz2gelz2M%3Bhttp%253A%252F%252Fwww.epa.gov%252Fclimatechange%252Fimages%252Fscience%252FGHGConc2000-large.jpg%3Bhttp%253A%252F%252Fwww.epa.gov%252Fclimatechange%252Fscience%252Fcauses.html%3B800%3B570
Danny,
MWP not related to CO2 to any major degree. Greater net solar (SW) reaching the ground, via slightly higher solar output and lower volcanic aerosols for many centuries,, plus natural variability. This is a dissimilar combination of forcings to our current warm period.
Pls keep in mind that my learning curve is not in “hiatus/pause/plateau/peak (? I added that last one:)”. Thanks for the guidance, but resources would help most. Got a link or two to suggest?
How do we know the forcings were from different sources then to now? It would actually be interesting to see those forcings you listed in comparison with those of today, but I have no idea (yet) how to go about building something like that. I find temps. but not those which you suggest. And are you saying the volcanic aerosols are higher now than in 800-900?
The warming/drying was occurring. Monsoons were reduced in quantity and indeed missed the area discussed in the article for prolonged periods, but indeed were apparently occurring nearby.
Based on the article, the localized anthro was deforestation for crops?
From AR4.
http://www.ipcc.ch/publications_and_data/ar4/wg1/en/fig/figure-6-14-l.png
It’s wrong. CO2 varies a lot more than suggested by ice core analysis. It misses the most important change in forcing – albedo – which we know only in the satellite era. A 1% change in albedo is a 3.4 Watts/m^2 change is SW forcing.
http://earthobservatory.nasa.gov/IOTD/view.php?id=84499
The rainfall is to a large extent driven by ENSO. Note the red intensity over the period of interest in the following – regularly double the red intensity of that seen in the 1997/1998 El Nino. El Nino leads to lower rainfall over the Yucutan Peninsula.
https://watertechbyrie.files.wordpress.com/2014/06/moys-20022.png
Moy et al (2002) present a record of rainfall preserved in the sedimentation record which is strongly influenced by ENSO variability. It is based on the presence of greater and less red sediment in a lake core. More sedimentation is associated with El Niño. It has continuous high resolution coverage over 12,000 years. It shows periods of high and low ENSO activity alternating with a period of about 2,000 years. There was a shift from La Niña dominance to El Niño dominance some 5,000 years ago that was identified by Tsonis (2009) as a chaotic bifurcation – and is associated with the drying of the Sahel. There is a period around 3,500 years ago of high ENSO activity associated with the demise of the Minoan civilisation (Tsonis et al, 2010). It shows ENSO variability considerably in excess of that seen in the modern period.
Gates, I think you’re fishing for what you want to catch.
This article doesn’t cite warmth, or even precipitation.
Rather it tries to proxy hurricanes from flood evidence.
The study found fewer hurricanes from fossil evidence.
We should note, that doesn’t preclude having the same or even more weaker hurricanes ( that didn’t leave a residue ).
Ritual sacrifice ( an irrationality not unlike modern calamitology ) is as good or better a postulate than drought, at least from one basin strong hurricane record.
“Climatic modeling, tree ring data, and historical climate data show that cold weather in the Northern Hemisphere is associated with drought in Mesoamerica. Northern Europe suffered extremely low temperatures around the same time as the Maya droughts.”
““The Maya succeeded in creating a civilization in a seasonal desert by creating a system of water storage and management which was totally dependent on consistent rainfall.” The constant need for water kept the Maya on the edge of survival.” – Wiki I guess they did not anticipate change.
Ragnaar,
As always, thank you. Are you aware of associated anomalies in the climate/feedbacks/forcings? R.Gates mentioned the aerosols as candidate. I’ve not spent as much time researching the past and find Tonyb’s offerings to be unique and fascinating. I did discover this item today (http://books.nap.edu/openbook.php?record_id=11676&page=R1) and what I’ve read so far seems plausible.
Danny,
I’ve not studied the Mayan collapse, but you given me new area of interest. I found this interesting:
http://lightning.sbs.ohio-state.edu/geog8901/paper/politics_Haug2003.pdf
Danny Thomas:
4 possible explanations for the MWP:
http://www2.sunysuffolk.edu/mandias/lia/possible_causes.html
I’d guess the Large-Scale Ocean Current Conveyor Belt. We are told the oceans have the heat now as those processes switched on. So the MWP may have been where the oceans did not keep their heat so well. The conveyor belt upwells cool water not that far from the ENSO and PDO regions as well as sequesters warmth from the North Atlantic near the AMO region. All things being equal, I’d go with the oceans first. But the question is what drives these ocean switches? Perhaps the oceans thought they were warm enough and stopped absorbing so much heat during the MWP.
“Mann is also concerned that the dominance of medieval La Niña conditions now indicated by Trouet’s work might make it more likely that the current man-made warming could also put the El Niño system back into a La Niña mode, although most climate models so far had predicted the opposite.”
http://www.newscientist.com/article/dn16892-natural-mechanism-for-medieval-warming-discovered.html#.VKIwdP8JCA
One would think that the during the MWP, we were bombarded with El Ninos warming the atmosphere. The sign still confuses me. When the ocean gives up heat during an El Nino, it is cooling itself. On the other hand persistent La Ninas might speed up the Pacific gyres and move more near surface heat to the poles which is what we want during a warm period. Let’s go with that. The Pacific gyres will speed up as a reaction to higher temperatures, thus cooling both the Pacific and the atmosphere.
Danny
The collapse of the Khmer civilisation is also attributed to climate change.
In this case that of back to back droughts mingled with extremely heavy monsoons which destroyed the irrigation tanks of the city.
http://www.rebeccacosta.com/blog/the-collapse-of-the-khmer-empire-225.htm
In particular there were two periods where this was pronounced;
“Then, after six centuries of successful water management, two catastrophic events occurred — one man-made and the other orchestrated by nature.
According to Dr. Roland Fletcher, archeologist at the University of Sydney and co-director of the Greater Angkor Project, the cascade first began with a tragic engineering mistake.
Evidence indicates that engineers decided to change the course of the Siem Reap River by constructing a dam. The goal of the dam was to direct river water toward a newly built reservoir. But the engineers miscalculated and built the dam too low. So when the monsoons arrived the dam turned into a massive spillway. Water began flowing over the top of the dam into abandoned canals, causing catastrophic damage to other parts of the system. Once the dam was fully breached and the damage had spread, the amount of water directed to other reservoirs also decreased.
Records show that the Khmer spent generations attempting to repair the damaged water system “that grew ever more complex and unruly.” Yet year after year, the system on which the survival of the empire depended continued to deteriorate until the dam completely failed, igniting a cataclysmic chain reaction of other failures.
Then the second event struck: A series of back-to-back droughts and mega monsoons descended on the Khmer Empire between 1362 and 1392 and again between 1415 and 1440. According to Fletcher, these extreme conditions (caused by what scientists call the “Little Ice Age”) “would have ruined the water system.”
Similar to the fate of the Mayans, water problem bred food shortages and disease and contributed to a malnourished Khmer army who became unable to fend off attack.”
What is interesting in this is that we can trace similar episodes of extreme drought and extreme rainfall in the British records during these two periods, so at least two pulses of the intermittent Little Ice Age seems to have been global.
tonyb
Tonyb,
Thank you so much. The historic information you study and provide I find invaluable and I thank you so much. I’m playing a bit of catch up so please forgive if I missed this but the article about the Maya indicated a 100 year drought in approx. the 800-900 year age. Are you by chance aware of associated anomalies? I would be interested, and believe R.Gates and others would also.
Danny
My current studies of the climate are from around 1086 ( thevdomesfay book) to around 1539 ( the reformation of the mnasteries) with a focus on the period 1200 to 1400 so I can try and trace the (elusive) change from the MWP to the LIA.
As you go back in time it becomes difficult to sort out the many religious and supernatural references and legends with real weather events let alone trying to discern the ‘climate’ i.e. 30 year periods , with any certainty.
As regards the approximate dates you give we can say with reasonable certainty that the period between 910 to 930 was extremely dry with numerous very hot summers. In general the period from 790 to 1190 or so could be considered the peak period of the MWP with generally warm and settled weather, although there were plenty of exceptions to this.
Tonyb
ok
this whole thread is about various ancient cultures crashing as a result of environmental changes
many abrupt and unexplained, multifaceted
guess what
it’s gonna happen again
and we’ll be hard pressed to explain it even as it happens around us
one reason the “climate change” debate often strikes me as shallow
some divine the entrails of frogs
others run computer models
wake me when the future doesn’t surprise
What are they [AGW alarmists] really saying?
–e.g.,
“How do I feel about climate change? Afraid: for my grand children, for my family, for people. That keeps me awake at night [saving the world from what the greatest generation hath wrought].” ~Professor James Byrne
http://www.gallup.com/poll/167873/americans-cite-jobs-economy-gov-top-problems.aspx
We’re all outliers here. Climate change doesn’t get a mention in top 12 problems facing the US.
Your taxes are paying people to hate the American and all who work to pay all of the bills –e.g.,
“Mark my words, you plutocrats, denialists, fossil-fuel hacks and science charlatans – your time will come when you will be backed against the wall by the full wrath of billions who have suffered from your greed and stupidity, and I’ll be first in line to put you there.” ~Professor Corey Bradshaw
Thanks, Wagathon, for the quote by Professor Bradshaw.
It is more likely that science will prevail and the New Year bring us images of Obama, Putin and armies of consensus scientists teaching us how to pray to the Creator, Destroyer & Sustainer of every atom, life and world in the solar system.
http://stevengoddard.wordpress.com/2014/12/29/last-remaining-global-warming-scam-dies/#comment-474279
I linked Rabbet Run to my blog, and visit it quite often. I also like to use it to jump to “Capitalist imperialist pig” and sites like that. But I’m not a scientist, and I don’t know anything about these surveys. I do have some scientific paper parodies, and I’m definitely going to write about my survey which proves the isolation of watermelons from other fruits.
Perhaps a study to prove my supposition that there’s more dried fruit globally than at any time in the history of humanity might add some needed perspective on these issues.
Wagathon, if you check this graph you can see fruit production has been increasing:
http://www.unctad.info/upload/Infocomm/Images/Citrus%20fruit/Production%20_en.jpg
However, watermelons are disconnected from these statistics. My preliminary research seems to show most watermelons think extreme weather has shrunk the fruit crop.
But … but … watermelons ARE a fruit!
If there are watermelons – where are the other elemelons? Pyromelon pedamelon and anemelons.
cucumbers are a fruit too
some things just don’t make sense
Global sea ice slightly above 1979-2008 average.
http://arctic.atmos.uiuc.edu/cryosphere/IMAGES/global.daily.ice.area.withtrend.jpg
Rabbet Run no longer allows anonymous posts – rich because Josh still uses a psudonym.
The callout to Jean Meyer in the linked article is right on but Richard Smith’s understanding of the Atkins diet is not. It may not be a good diet but it is not a low fat diet. Smith does have a point though: whereas the global warming alarmists on the Left say we’re, “carrying out an unintended experiment on the climate system” (e.g., Professor Peter Cox), they’re oblivious to the fact that their uncontrolled government-approved experiments on society, the economy and the culture are driving America and Western civilization off a cliff.
Wagathon,
I heartily disagree that Adkins is “not a good diet”. When I did it for a short while, it allowed as much bacon as I cared to eat. That, in my opinion, is a good diet! :)
Danny, move up your diet game and try the banana split and chocolate sundae diet.
Fernando,
Reading my mind (like a haiku)! I’m on that one now since the bacon didn’t pan out long haul. Must have cherries (picked)(I understand fruit is doing well) and whipped cream, add a few nuts and what do we have (climate discussion?).
:)))))))
True, true, 80 calories in 2 slices of Hormel precooked bacon so, that’s about 40 slices a day in a low 1600 calorie diet.
I can understand why Wattsupwiththat is out there without links to other scientific blogs. If you oppose what Anthony Watts believes, you are quickly banned from posting there. AGW deniers flock there to confirm their biases, and don’t encounter anything that makes them uncomfortable in the comments section, which is mainly backslapping.
I personally have been banned from posting, because I called attention to a big mistake Watts made in the run up to the Berkeley Earth Surface Temperature Study publication.
I am puzzled that the diagram doesn’t show a connection between Hotwhopper and WUWT, since it is dedicated to debunking what appears on WUWT.
We share this, then.
Like your experience with WUWT,
I’ve been banned from SS and don’t see much point in returning.
‘RealClimate’ and ‘OpenMind’ don’t ban – just don’t post comments that don’t adhere to their beliefs.
The result is echo chambers.
Fortunately, here, we can discuss these things.
Eadler2 – “oppose” really?
I’d probably ban you too. You aren’t looking for a discussion – you are looking for a fight or to indoctrinate the enemy.
The lack of a connection between Hot Whopper and WUWT would tend to indicate they are linking to an archive of his posts instead of the site.
You have raised my curiosity. What was Mr. Watt’s “big mistake”?
Surely the “V” is redundant, unnecessary, should be deleted &c.
It is no coincidence that shifts in ocean and atmospheric indices occur at the same time as changes in the trajectory of global surface temperature. Our ‘interest is to understand – first the natural variability of climate – and then take it from there. So we were very excited when we realized a lot of changes in the past century from warmer to cooler and then back to warmer were all natural,’ Tsonis said.
In the 20th century – there were two multi-decadal warm periods and one cold. As well as presumably a warmer Sun – increasing in the first half of the century and staying high until at least 1985.
These multi-decadal periods involve chaotic shifts that are in principle deterministic but in practice incalculable. But it must be presumed that the change in temperature trajectory – at 1912, 1944, 1976 and 1998 – results from changes in cloud and water vapour or changes changes in energy partitioning between ocean and atmosphere. Or both.
Oceans are far too difficult and variable – and reliable observations far too short – to say much with any confidence. Clouds are only knowable in the satellite era. But what we do know is that – like the oceans – natural variability is huge.
‘Climate forcing results in an imbalance in the TOA radiation budget that has direct implications for global climate, but the large natural variability in the Earth’s radiation budget due to fluctuations in atmospheric and ocean dynamics complicates this picture.’ http://meteora.ucsd.edu/~jnorris/reprints/Loeb_et_al_ISSI_Surv_Geophys_2012.pdf
What do we know about cloud? Here’s a graph from Ben Laken and Enric Palle – which cross validates ISCCP-FD and MODIS using sea surface temperature in the tropical Pacific. The data says that the changes are very significant in recent warming – and in more recent non-warming.
https://watertechbyrie.files.wordpress.com/2014/06/cloud_palleandlaken2013_zps3c92a9fc.png
Here’s a graph from AR4 – I haven’t graduated to AR5 yet.
http://www.ipcc.ch/publications_and_data/ar4/wg1/en/fig/figure-6-14-l.png
I doubt very much that we understand carbon dioxide dynamics with any precision. Here’s a graph from Margret Steinthorsdottir et al 2013 – Stomatal proxy record of CO2 concentrations from the last termination suggestsan important role for CO2 at climate change transitions – showing a very different dynamic to the ice cores. And as I say – nothing is known about albedo – that dominant component in the Earth’s energy budget.
https://watertechbyrie.files.wordpress.com/2014/06/steinthorsdottir-fig-9.png
So what do we know? Ocean and atmospheric circulation changes abruptly, the global energy dynamic changes dramatically and it seems associated with sea surface temparature in the Pacific and cloud formation.
Burgman et al (2008) used a variety of data sources to examine decadal variability of surface winds, water vapour (WV), outgoing longwave radiation (OLR) and clouds. They conclude that the ‘most recent climate shift, which occurred in the 1990s during a period of continuous satellite coverage, is characterized by a ‘La Niña’ SST pattern with significant signals in the central equatorial Pacific and also in the north-eastern subtropics. There is a clear westward shift in convection on the equator, and an apparent strengthening of the Walker circulation. In the north-eastern subtropics, SST cooling coinciding with atmospheric drying appears to be induced by changes in atmospheric circulation. There is no indication in the wind speed that the changes in SST or WV are a result of changes in the surface heat flux. There is also an increase in OLR which is consistent with the drying. Finally, there is evidence for an increase in cloud fraction in the stratus regions for the 1990s transition as seen in earlier studies.’
In a study that was widely interpreted as a demonstration of a positive global warming cloud feedback, Amy Clement and colleagues (2009) presented observational evidence of decadal change in cloud cover in surface observation of clouds from the Comprehensive Ocean Atmosphere Data Set (COADS). ‘Both COADS and adjusted ISCCP data sets show a shift toward more total cloud cover in the late 1990s, and the shift is dominated by low- level cloud cover in the adjusted ISCCP data. The longer COADS total cloud time series indicates that a similar magnitude shift toward reduced cloud cover occurred in the mid-1970s, and this earlier shift was also dominated by marine stratiform clouds. . . Our observational analysis indicates that increased SST and weaker subtropical highs will act to reduce NE Pacific cloud cover.’ As was clearly stated in the paper, the evidence was for a decadal cloud feedback negatively correlated with sea surface temperature in the region of the Pacific Decadal Oscillation. The feedbacks correspond exactly to changes in the Pacific multi-decadal pattern.
Much variability comes from changes in Pacific Ocean states – and we know without much doubt that El Nino frequency and intensity peaked in the 20th century in a 1000 year high.
http://minnesotansforglobalwarming.com/m4gw/2010/07/16/greenhouse_gases_in_atmosphere.jpg
Give us the non-condensing GHG pie chart.
Michael,
What Team Pseudoscince won’t dare admit is the absolute dependency of our greenhouse climate on the trace quantities of noncondenscing GH gases. The essential role of these trace GH gases in maintaining the greehouse atmosphere makes them (specifically CO2) a regulator or control knob. Without this control knob, we return to Ice House Earth relatively fast. Pseudoscience can’t allow this key role for CO2 or their whole house of cards collapses.
a) 3,000 gigatons – CO2 in the atmosphere
b) 1,029,600 gigatons – mass of water vapor in atmosphere #
c) 51,480,000 gigatons – mass of the atmosphere
d) 13,880,000,000 gigatons – mass of the oceans
# Assumed to be 2% of c)
a) > b) > c) > d)
So 3X versus 13,880,000X. CO2 sits at the top of the pyramid, giving orders to everything below it. This is not a democracy. I hope I didn’t mess up too many decimals.
Michael, can you explain why water vapor should be excluded from other greenhouse gases?
R.Gates is blowing smoke as usual. CO2 is not a climate control knob. Its greenhouse effect is marginal at best. We live on a water world. H2O not CO2 is the big Kahuna.
Water vapor only responds to the temperature, while CO2 controls it. Even the trace CO2, at 400 ppm, which is one tenth of the H2O, itself a trace gas in air at 4000 ppm, causes 20% of the greenhouse effect. By the way, whoever provided that pie chart seems wrong, unless the H2O is only counting its surface concentration not its full atmosphere concentration. CO2 is 10% of H2O molecule for molecule or more than 20% kg for kg.
When exactly did this “Ice House Earth” occur, which we will return to if all CO2 magically vanishes from the atmosphere?
And how did it occur, given that the atmosphere was thick with NCGG’s right from the outset?
The narrative appears to be that without CO2 the earth would be a frozen snowball and we wouldn’t be here discussing this, ergo not only does CO2 control the temperature, but the sensitivity must be high.
Except it never happened, so no inferences as to sensitivity can be drawn from it.
What are the relative concentrations of H2O and CO2 at -40°C?
What is the average temperature at the bottom of the altitude range where emitted IR (in absorbed wavelengths) can actually make it to TOA? At the top?
Water may be the major GHG in the atmosphere by total amount, but its effect is mostly limited to lower altitudes, with the well-mixed GHG’s dominating altitudes involved in radiative coupling with the ~3°K of interstellar space.
Several times supposedly, most recently a few times 600-1000 MYA. Nobody knows the reasons, or for that matter whether they really happened, but GHG’s may well have been involved. Somehow. Assuming their strong involvement is the current fad, and quite plausible, but hardly proven.
Only a denier could say that. In fact, although it’s hardly proven that they happened, they do seem (at this time) to be the best explanation of the evidence.
At -40 C and colder there would be comparable or more CO2 molecules than H2O ones. It is therefore important for the total upper atmospheric emission to space.
That’s what I said. Since it’s your argument, why don’t you put out the effort to put some numbers behind it, with links to appropriate science?
AK, if it did happen then it happened despite the presence of non-condensing GHG’s.
And if it did happen that GHG’s went down to zero, then where did the GHG’s reappear from to restart the process?
It seems unlikely that GHGs from volcanic activity dropped to below sequestration levels for tens of millions of years before restarting again.
And the Earth certainly didn’t start out as a frozen ball with zero GHG’s – quite the opposite, in fact.
AK, yes, the fact that CO2 has the major effect at TOA is about the only uncontroversial bit of the whole warmist argument.
As I understand the currently popular scenarios, primarily decay of organic matter already in the ocean, perhaps anoxic.
Personally, I’m highly skeptical of the currently popular scenarios, assuming it happened at all. I’d guess something more like a sudden reduction in methane and other short-chain hydrocarbons (as the GHG contribution, if any, to the process). Increasing oxygen levels could have passed a tipping point, leading to increased ozone and scavenging of methane (etc.) levels previously similar to modern CO2 levels. That would be consistent with the appearance of green algae with lignins a little while later, which would have been able to protect them from what UV made it through the newfound ozone layer.
But that’s highly speculative, as are any explanations for the “Snowball/slushball Earth” events. If that’s actually the explanation of the evidence.
AK does any evidence actually exist?
AK, if you want a number, at -40 C and 250 mb pressure, water vapor saturates at 720 ppm. Since the humidity is usually well below saturation, CO2 at 400 ppm is comparable with this typical example of upper air conditions.
In the distant past, the sun was weaker and you did not need zero CO2 to get a snowball earth. It was even possible at 1000 ppm.
Yes, there’s plenty of evidence of shallow-water glacial activity in areas whose magnetic signatures suggest they were close to the equator. Of course, assuming they were close to the equator requires making a few unproven assumptions, such as that the Earth was always a 2-poled magnet, and that the poles of that magnet were always close to the geographic poles.
I’m not going to waste my time digging that evidence up; it doesn’t really prove anything at all about CO2, so I don’t really have a dog in that race.
Not particularly. You need it if you’re going to argue with the water vapor fanatics. Along with links to the actual science.
And don’t forget the primary reason there’s so little water vapor at that height: because most of it has precipitated out as clouds. Which are effectively “black bodies” at IR wavelengths, and mirrors at the short wavelengths that contain most of the sun’s radiant energy.
Not that much a billion years ago. Maybe 3-4 BYA, when the earliest events are supposed to have occurred.
Serial warmunist misinformers would like you to ignore water vapor’s utmost, overriding importance in establishing the surface climate where we live and breathe. In a grand demonstration of fallacious reasoning and outright error:
@JimD writes
“Water vapor only responds to the temperature, while CO2 controls it.”
BZZZZZZZZZZZZT! Wrong. Logical fallacy called “begging the question” a form of circular reasoning described as “assuming that which is to be proven”. A silly, baseless assertion that CO2 controls temperature. Temperature controls CO2, actually, which is clearly evident in ice cores where temperature rise precedes CO2 rise by centuries.
“H2O, itself a trace gas in air at 4000 ppm”
BZZZZZZZZZZZZZZZT! Wrong. Off by a factor of ten. Let’s help poor JimD find the right information here:
http://www.esrl.noaa.gov/gsd/outreach/education/climgraph/docs/cg_8.pd
Water Vapor … 4% … 40,000 ppm
https://www.eso.org/gen-fac/pubs/astclim/espas/pwv/mockler.html
Serial warmunist misinformers would like you to ignore water vapor’s utmost, overriding importance in establishing the surface climate where we live and breathe. In a grand demonstration of fallacious reasoning and outright error:
@JimD writes
“Water vapor only responds to the temperature, while CO2 controls it.”
BZZZZZZZZZZZZT! Wrong. Logical fallacy called “begging the question” a form of circular reasoning described as “assuming that which is to be proven”. A silly, baseless assertion that CO2 controls temperature. Temperature controls CO2, actually, which is clearly evident in ice cores where temperature rise precedes CO2 rise by centuries.
“H2O, itself a trace gas in air at 4000 ppm”
BZZZZZZZZZZZZZZZT! Wrong. Off by a factor of ten. Let’s help poor JimD find the right information here:
http://www.esrl.noaa.gov/gsd/outreach/education/climgraph/docs/cg_8.pdf
Water Vapor … 4% … 40,000 ppm
https://www.eso.org/gen-fac/pubs/astclim/espas/pwv/mockler.html
David, 40000 ppm is wrong unless you just look at the surface so you have misinterpreted what they said to mean the whole atmosphere as opposed to the air we normally breathe. For the whole atmosphere it is 4000 ppm of H2O, about ten times the CO2. Yes, CO2 responds to temperature too, about 10-15 ppm per C of warming. However doubling CO2 raises the temperature by several degrees which is much larger than the temperature response that adds a few tens of ppm. Turns out paleoclimate variations in CO2 explain the temperature while H2O can’t do much except equilibriate to the new temperature. The difference is that H2O has an infinite reservoir (the ocean), while CO2’s availability at the surface has varied driven largely by geological and vegetation effects.
Global sea ice above 1979-2008 average.
WTF????
http://arctic.atmos.uiuc.edu/cryosphere/IMAGES/global.daily.ice.area.withtrend.jpg
David in TX | December 30, 2014 Global sea ice above 1979-2008 average.
What you fail to understand is that the extra heat accumulating in the sea depths is coming straight out of the Arctic ocean and will eventually make it’s way to the Pacific and cause another El Nino. Just ask R Gates who will explain more eloquently the actual mechanisms involved.
Heat preferentially seeks to build up in deep water leaving the surface layers free to freeze is the theory.
EARTHS SEA ICE EXPANDS TO RECORD HIGH:
Sea Ice Extent -day 363 – Highest Global Sea Ice and Highest Antarctic Sea Ice for the day:
http://sunshinehours.wordpress.com/2014/12/30/sea-ice-extent-day-363-highest-global-sea-ice-and-highest-antarctic-sea-ice-for-the-day/
For those who like to pretend that the alleged climate science doesn’t get intelligently discussed on WUWT, this thread has plenty of intelligent analysis and open discussion of the climate model foolishness with both sides well represented. And very little off-topic jabbering, or flinging of mashed potatoes:
http://wattsupwiththat.com/2014/12/29/a-few-comments-on-the-new-paper-by-gavin-schmidt-and-steven-sherwood/
Sometimes I am sorry I got banned by Anthony for smacking his little buddy Willis over his heinous denigration of Vietnam vets in a low down attempt to excuse his own cowardice. Well, somebody had to do it.
Maybe the link would be helpful:
http://wattsupwiththat.com/2014/12/29/a-few-comments-on-the-new-paper-by-gavin-schmidt-and-steven-sherwood/
again
Don’t be sorry you got banned from WUWT. You are far more likely to get real science here at CE. And regardless of your ad homs against me, I salute all Vietnam Vets, and if you’re one, then thank you for your service.
http://jazzroc.files.wordpress.com/2008/11/global_warming_bull.gif
+1 :)
Interesting that those that claim to be closest to the ‘science’ are the ones that expend the most energy trying to convince their readers not to read dissenting views. This is the very antithesis of science.
And LOL at VV recommending reading HotWhopper to find out what’s going on at WUWT. This is akin to recommending 1940/50s editions of Pravda to find out what is happening in the free world.
Scientists ‘must be emotionally charged’ about climate change to highlight its dangers, claims expert
Climate scientists must inject more emotion and personal experience into their communications with the public to underline the dangers of global warming, according to a leading professor.
Chris Rapley, a professor of climate science at University College London, is urging colleagues to ditch “academic, fact-based approaches” to the subject in favour of “charged” narratives.
He recently performed 2071, a one-man show giving a personalised account of what climate change means for him, at the Royal Court theatre in London and the Deutsches Schauspielhaus in Hamburg.
Professor Rapley was prompted to do his show amid a growing realisation that scientists were not communicating the dangers of climate change and the importance of tackling it as well as they could.
http://www.independent.co.uk/environment/climate-change/scientists-must-be-emotionally-charged-about-climate-change-to-highlight-its-dangers-claims-expert-9950692.html
Goin’ from the funded narratives of gravy train it’s worse
than we thought ter the charged narratives of theatrical
performance.Not so different I guess.
Happy New Year Beth
May all your cows give lots of milk in 2015 :)
‘Chris Rapley, a professor of climate science at University College London, is urging colleagues to ditch “academic, fact-based approaches” to the subject in favour of “charged” narratives.’
They’re way ahead of you, Chris.
Happy New Year Mosomoso
And to you, Peter.
That’s not what Rapley actually meant, he was actually expressing his disdain for media sound bites.
Or something like that
WUWT
Alexa Traffic Rank: 19,220
Sites Linking In: 5,000
RealClimate
Alexa Traffic Rank: 219,833
Sites Linking In: 3,633
Variable Variability
Alexa Traffic Rank: no rank
Sites Linking In: 3
So if a blogger makes a post on the internet and no one read it, does it still matter?
No. The salient question is whether it matters even if someone does read it. I think the answer is still no.
That gives a sense of perspective, doesn’t it?
But, nonetheless, little bloggers can still have a big impact. You can crack a major story, set off the chain of events, write about new things first, be interesting etc.
The related question then is: Does Venema do that?
Another related question: does Victor have a Donate button, like this one:
http://nigguraths.wordpress.com
Intruguing network in the blogroll, too.
WUWT “This blog was viewed about 44,000,000 times in 2014.”
Exactly an order of magnitude greater than CE. An amazing stat.
Judith, thank you for running this site.
Alex.
I second that, and Happy New Year to all
Watch the warmunist gratuitous handwaving dismissal of this peer reviewed paper.
http://i566.photobucket.com/albums/ss102/infernojones/co22.jpg
From:
180 YEARS OF ATMOSPHERIC CO2 GAS ANALYSIS
BY CHEMICAL METHODS
by Ernst-Georg Beck
Reprinted from
ENERGY & ENVIRONMENT
VOLUME 18 No. 2 2007
http://www.biomind.de/nogreenhouse/daten/EE%2018-2_Beck.pdf
Been there many years ago. Major issues are that the late E. Beck did not consider the locations where the measurements were made or the lack of accuracy of the methods used.
Ferdinand Engelbeen has gone through this stuff in detail and Eli has had a word or two or three as well.
A quick test is to look at that sharp rise and fall near 1940. Now try and describe a physical process that could handle such a change in the entire atmosphere.
So I guess when you are relatively smart and you don’t have much in scientific literature going for you, you turn to blogging and your own opinion of the science. Which attracts those who are not getting actual science in the MSM that supports their beliefs.
I should also that add that the purpose of the most popular climate related blogs is usually to defend the science against misinformation.
Spot on, Joseph, “the purpose of the most popular climate related blogs is usually to defend the science against misinformation”.
That is why Climate Etc, WUWT and the Blackboard are so popular and supported by warmists and skeptics alike.
I am impressed by your perceptiveness, do not let me down.
I should also that add that the purpose of the most popular climate related blogs is usually to defend the science against misinformation.
Just as the purpose of the most popular theism related literature (such as the bible, books by Richard Dawkins, etc.) is to defend religion against misinformation.