
Several new analyses of relevance to interpreting the comparison of climate models with observations.
Ed Hawkins
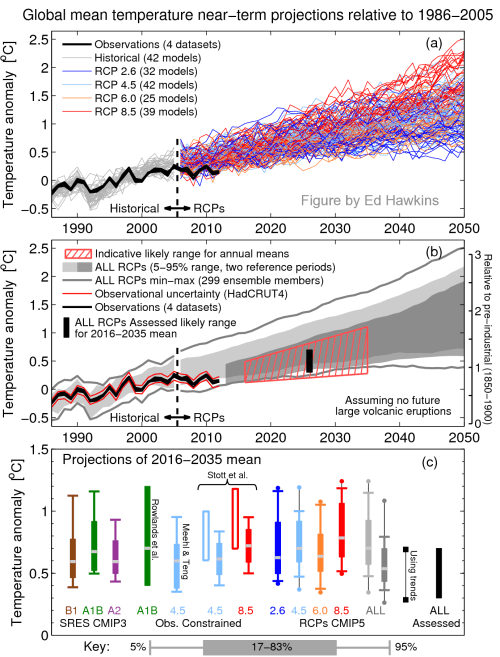
Ed Hawkins has a new post Near-term global surface temperature projections in IPCC AR5. He refers to Figure 11.25 in the AR5 Report (link to Ch 11; relevant text starts on p 51):
See Ed’s post for the complete Figure caption. Two things strike me:
1) The top panel seems a much more honest comparison than the Figure 1.4 discussed on the previous Spinning thread. Clearly the IPCC has not been consistent in its spin, with an apparently spin free Figure 11.25 making it into the document.
2) The red box in the middle panel, which implies a lowering of their projections relative to the climate models, seems a tacit admission that their model projections of actual climate variability and change are highly uncertain.
In trying to understand where the red box comes from, here is some text from Ch 11:
Overall, in the absence of major volcanic eruptions and, assuming no significant future long term changes in solar irradiance, it is likely (>66% probability) that the GMST anomaly for the period 2016–2035, relative to the reference period of 1986–2005 will be in the range 0.3°C–0.7°C (expert assessment, to one significant figure; medium confidence) This range is consistent, to one significant figure, with the range obtained by using CMIP5 5–95% model trends for 2012– 2035. It is also consistent with the CMIP5 5–95% range for all four RCP scenarios of 0.36°C–0.79°C, using the 2006–2012 reference period, after the upper and lower bounds are reduced by 10% to take into account the evidence noted under point (5) that some models may be too sensitive to anthropogenic forcing.
However, the implied rates of warming over the period from 1986–2005 to 2016–2035 are lower as a result of the hiatus: 0.10°C–0.23°C per decade, suggesting the AR4 assessment was near the upper end of current expectations for this specific time interval.
The assessment here provides only a likely range for GMST. Possible reasons why the real world might depart from this range include: radiative forcing departs significantly from the RCP scenarios, either due to natural (e.g., major volcanic eruptions, changes in solar irradiance) or anthropogenic (e.g., aerosol or greenhouse gas emissions) causes; processes that are poorly simulated in the CMIP5 models exert a significant influence on GMST. The latter class includes: a possible strong “recovery” from the recent hiatus in GMST; the possibility that models might underestimate decadal variability; the possibility that model sensitivity to anthropogenic forcing may differ from that of the real world; and the possibility of abrupt changes in climate.
This text in Chapter 11 is some of the most believable text in the report, presenting a realistic assessment of the uncertainties in the climate system and the inadequacies of the climate models. Too bad the folks writing Chapter 9 (95% confidence in attribution) didn’t read Chapter 11 first.
Chip Knappenberger
At Cato, Chip Knappenberger and Pat Michaels have a post Climate Models’ Tendency to Simulate Too Much Warming and the IPCC’s Attempt to Cover That Up. The main technical meat of their post is to compare observed and modeled 15- yr and 20-yr moving trends during the period 1951-2012.

Figure 3. The observed 15-yr moving trend during the period 1951-2012 from the Hadley Center temperature record (blue) compared to the multi-model mean trend (thick red line) and the 95 percent range of individual model simulations (thin red lines). (The model simulations consisted of 108 individual model runs downloaded from Climate Explorer that combined the RCP4.5 scenario with historical simulations).
The result isn’t very pretty for the IPCC.
Most of the time, the observed trend is either near or below the average trend from the models. At the recent end of the record, the observed trend has fallen below the model trend for 12 consecutive overlapping periods, and the discrepancy is growing larger. For the past two periods, 1997-2011 and 1998-2012, the observed trend falls below the 95 percent range of modeled trends, a statistical indication that the observed trend is not a member of the modeled set of predictions (i.e., the models do not statistically capture reality as represented by the observations).
Also notice that there are few excursions of the observed trend above the value of the modeled trend—a few periods ending in the late 1960s, mid-1980s, and again for the period ending in 1998 and 1999. The 1998 endpoint is the one that the IPCC decided to highlight—the fattest cherry they could find. It ends the largest positive discrepancy between observations and models during the past 40 years. Had they chosen to break their analysis in 1997, the observed trend during the period 1983-1997 would have been very close to the multi-model mean, while during the period 1997-2011, it still would have fallen below virtually every climate model simulation.
By carefully choosing the break point in their analysis to be 1998, the IPCC concocts a narrative that sometimes the observed warming trend is less than the model average and at other times it is greater than the model average and that it all works out. The reality of the situation is that the small (in time as well as magnitude) positive excursion during the late 1990s is dwarfed by the large (in time as well as in magnitude) negative excursion of the observed trend beneath the model average trend at the end of the record. Two wrongs do not make a right.
Steve McIntyre
Steve McIntyre has a new post Fixing the Facts 2 that raises additional concerns about changes in the various drafts and in particular the deletion of Fig 1.5 from the SOD. The punchline of his post:
Richard Betts did not dispute the accuracy of the comparison in SOD Figure 1.5, but argued that the new Figure 1.4 was “scientifically better”. But how can the comparison be “scientifically better” when uncertainty envelopes are shown for the three early assessment reports, but not for AR4. Nor can a comparison between observations and AR4 projections be made “scientifically better” – let alone valid in accounting terms – by replacing actual AR4 documents and graphics with a spaghetti graph that did not appear in AR4.
Nor is the new graphic based on any article in peer reviewed literature.
Nor did any external reviewers of the SOD suggest removal of Figure 1.5, though some (e.g. Ross McKitrick) pointed out the inconsistency between the soothing text and the discrepancy shown in the figures.
Nor, in the absence of error, is there any justification for such wholesale changes and deletions after the third and final iteration had been sent to external reviewers.
In the past, IPCC authors famously deleted data to “hide the decline” in Briffa’s temperature reconstruction in order to avoid “giving fodder to skeptics”. Without this past history, IPCC might be entitled to a little more latitude. However, neither IPCC nor its supporting institutions renounced such conduct or undertook avoid similar incidents in the future. Thus, IPCC is vulnerable to concerns that its deletion of SOD Figure 1.5 was primarily motivated to avoid “giving fodder to skeptics”.
Perhaps there’s a valid reason, but it hasn’t been presented yet.
JC summary: Sure makes the Mora et al ‘we are toast by 2047’ argument, based on climate model projections, look pretty far off the mark.

Now you see it, now you don’t,
Where it stops, know that you won’t.
===============
No major volcanic eruptions in the next 50 years.
Is that a forecast or a fervent wish?
If ifs and buts were candy and nuts every day at the IPCC would be Christmas.
I wonder where major volcanic eruptions begins: 5, 20, or 50 cubic km of ejecta. Mt. Pinatubo was about 5 cubic km.
And:
“June 15, 2011 marks the 20th anniversary of Mt. Pinatubo’s cataclysmic eruption, which sent huge amounts of ash high into the sky and circling around the globe, lowering global temperatures by 1 degree Fahrenheit (0.5 degree Celsius) over the following year.”
http://www.livescience.com/30507-volcanoes-biggest-history.html
And:
“There haven’t been any VEI-8 volcanoes in the last 10,000 years, but human history has seen some powerful and devastating eruptions.”
There very good chance we won’t see a VEI-8 in next 50 years.
VEI 6
“The eruption of Novarupta one of a chain of volcanoes on the Alaska Peninsula, part of the Pacific Ring of Fire was the largest volcanic blast of the 20th century. The powerful eruption sent 3 cubic miles (12.5 cubic km) of magma and ash into the air, which fell to cover an area of 3,000 square miles (7,800 square km) in ash more than a foot deep.”
And:
VEI 6:
“A stratovolcano located in a chain of volcanoes created along a subduction zone, the cataclysmic eruption of Pinatubo was a classic explosive eruption.
The eruption ejected more than 1 cubic mile (5 cubic kilometers) of material into the air and created a column of ash that rose up 22 miles (35 km) in the atmosphere”
But maybe by major, they mean VEI 7 or larger:
“The explosion of Mount Tambora [1815] is the largest ever recorded by humans, ranking a 7 (or “super-colossal”) on the Volcanic Explosivity Index, the second-highest rating in the index.”
[100 cubic km of ejecta].
gbaikie,
“…lowering global temperatures by 1 degree Fahrenheit (0.5 degree Celsius) over the following year.”
Yet, if you look at the global temp graph, there isn’t really anything to see:
http://www.woodfortrees.org/plot/hadcrut4gl
I’m looking in vain for a lurch in temperatures that is in any way distinguishable from all the other lurches in temperatures. Curious, no?
“James Evans | October 13, 2013 at 12:16 pm |
gbaikie,
“…lowering global temperatures by 1 degree Fahrenheit (0.5 degree Celsius) over the following year.”
Yet, if you look at the global temp graph, there isn’t really anything to see:
http://www.woodfortrees.org/plot/hadcrut4gl
I’m looking in vain for a lurch in temperatures that is in any way distinguishable from all the other lurches in temperatures. Curious, no?”
If look at global satellite measurement it’s more apparent:
http://www.drroyspencer.com/latest-global-temperatures/
Since 1979, it’s one of larger downward dips.
Of course it preceded one of the most highest warming spikes of this period [1998- El Nino] which was then followed most largest dips from the highest peak year in global temperature.
I think you could say there were no effects due to Pinatubo beyond a decade after it [in terms of air temperatures]. I think larger eruption and eruptions in different locations and other characteristics of eruptions plus when they occur, could affect the degree of it’s effect.
Also one should not forget the Antarctic is a large land mass and is volcanic. Not sure when the largest eruption in Antarctic [or Greenland] has occurred.
Plus the most volcanic location on Earth is under water- the Atlantic ocean. A large eruption in the deep ocean may or may not have much upon the atmosphere, but it could affect global climate.
gbaikie,
So, one of the larger dips since 1979. That’s not saying very much is it? (Which massive volcanic eruptions caused the other dips?)
“I think you could say there were no effects due to Pinatubo beyond a decade after it.”
I think you could say there were no overall effects at all. According to the UAH data that you pointed me at, the OLS trend from 1979 to 1991 is exactly the same as the trend from 1979 to 1997. So what exactly was the effect?
http://www.woodfortrees.org/plot/uah/plot/uah/to:1991/trend/plot/uah/to:1997/trend
James Evans
I think the current period of slight cooling and what might happen over the next decade or two is what is being discussed, not the entire long-term temperature record.
Since 2001, HadCRUT4 shows a slight cooling of about 0.023C per decade.
http://www.woodfortrees.org/plot/hadcrut4gl/from:2001/trend
A continuation of this trend would mean total cooling of about 0.06C until the period centered on 2027, which IPCC has chosen.
This would compare with the RCP model prediction of 0.3C to 0.7C warming by then (above 1986-2005 mean, which was 0.2C cooler than 2001) or 0.1C to 0.5C warming since 2001.
Since we have already observed around 0.03C cooling since 2001, this means we would now need 0.13C to 0.53C warming over the next 13 years to get back within the IPCC model range.
Just arithmetically this means we need an average decadal warming rate of 0.25C per decade, or 0.1C to 0.4C per decade to be within the IPCC model range.
This appears highly unlikely to me (IOW IPCC’s lowest end warming prediction will still be too high, not to mention the high-end projection).
But who knows?
Max
James Evans | October 13, 2013 at 3:58 pm |
gbaikie,
So, one of the larger dips since 1979. That’s not saying very much is it? (Which massive volcanic eruptions caused the other dips?)
Here’s list of eruption of VEI 4 or higher of 20th century:
http://en.wikipedia.org/wiki/List_of_large_volcanic_eruptions_of_the_20th_century
There about 3 which are about VEI 6 and generally I would say one needs about VEI 6 to have much effect upon global temperature.
Here’s list of 19 century eruptions which at least VEI 4:
http://en.wikipedia.org/wiki/List_of_large_volcanic_eruptions_of_the_19th_century
there is one VEI 7, Mount Tambora (1815 eruption), about 100 cubic
km of ejecta. And two other VEI 6, one being Krakatoa, “Heard 3,000 miles (4,800 km) away. Caused a 5 year volcanic winter.”
It ejected: “The 1883 eruption ejected approximately 21 km3 (5.0 cu mi) of rock, ash, and pumice”
In 21 century we have only have VEI 4, so far, though there was undersea eruption of unknown magnitude:
http://en.wikipedia.org/wiki/List_of_large_volcanic_eruptions_in_the_21st_century
Undersea:
“The 2009 Tonga undersea volcanic eruption refers to ongoing volcanic activity that began on March 16, 2009, near the island of Hunga Tonga, approximately 11 kilometres (6.8 mi) from the Tongan capital of Tongatapu. The volcano is in a highly active volcanic region that represents a portion of the Pacific Ring of Fire. It is estimated that there are up to 36 undersea volcanoes clustered together in the area.”
http://en.wikipedia.org/wiki/2009_Tonga_undersea_volcanic_eruption
I don’t think volcano are responsible for most dips or peaks of in global temperature, rather I think there oceanic phenomenon which are mostly responsible for these, such as El Nino, etc.
Cf: stadium wave:
http://judithcurry.com/2013/10/10/the-stadium-wave/
“I think you could say there were no effects due to Pinatubo beyond a decade after it.”
“I think you could say there were no overall effects at all. According to the UAH data that you pointed me at, the OLS trend from 1979 to 1991 is exactly the same as the trend from 1979 to 1997. So what exactly was the effect?”
I think 5 cubic km of ejecta is near the low end in terms of affecting global temperature. But many climate scientists have made the case that Pinatubo did affected global temperature.
Probably a more measurable fingerprint than CO2- not that is saying much.
“Stick ’em up Your money or your life.”
The most important part is missing; namely comments from our histesz.
“JC summary: Sure makes the Mora et al ‘we are toast by 2047′ argument, based on climate model projections, look pretty far off the mark.”
Jim, short but sweet. Mora’s paper is getting lots of play, including by the NYTs. The goal post moving continues at a frantic pace.
Thanks, Judy.
Sorry, “hostess” not “histesz”.
It does not matter how you curve fit recent data during the warming period since the cold part of the little ice age. When you curve fit increasing data your projections will go up with the average slope until it gets out of the bounds of past warm periods.
If you used data from the ice cores for the past ten thousand years, your projections would be bounded in the same range as the past ten thousand years. Use data for past warm periods to project for this warm period and the warm and cold periods after this.
It snows more when oceans are warm and wet and it snows less when oceans are cold and frozen and this keeps temperature in bounds. The temperature that polar ice freezes and thaws is what establishes the set point for earth’s thermostat. Just look at recent years. When there are record low sea ice extents, you next have record snowfalls and cooling.
So far, this current warm period is behaving much more like the past warm periods than it is behaving like the alarmist climate model projections.
The temperature that polar sea ice melts and freezes provides the set point.
Herman,
The temperatures of the phase changes of water are set by atmospheric pressure aren’t they ?
Does atmospheric pressure (determined by mass and gravity) determine the set point of the thermostat at any given level of solar input ?
Stephen Wilde | October 13, 2013 at 11:11 am | Reply
“The temperatures of the phase changes of water are set by atmospheric pressure aren’t they ?”
Let me answer that question with a two part question. At what temperature does water freeze at sea level and at what temperature at the top of Mt. Everest?
Hi David.
That example is at the forefront of my mind.
The problem lies in getting others to acknowledge the implications of that.
See here:
http://www.newclimatemodel.com/the-setting-and-maintaining-of-earths-equilibrium-temperature/
Whoops.
Should have pointed out to David that water is always frozen at the top of Everest because the lower pressure means that the temperature is way below freezing all the time.
My point is that the temperature at which water evaporates or boils is affected by pressure and if water is frozen then the process of sublimation occurs in place of evaporation.
So it is the phase change to a gas that matters not the phase change from liquid to a solid and back again. The reason being that the rules for the thermal behaviour of gases are very different to those for solids.
Pressure is relevant to freezing too, though, see here:
http://www.newton.dep.anl.gov/askasci/chem00/chem00298.htm
Water is peculiar stuff.
More interesting stuff on water and ice here:
http://www.newton.dep.anl.gov/askasci/eng99/eng99530.htm
Anyway, the gist is that I think Herman is wrong in identifying the melt / freeze process as a thermostat.
Instead it is the liquid to vapour process that really matters because it moves energy upward towards space and that is indeed pressure dependent.
Thanks for making me think about the distinction.
Water is kind of neat, there is very little change in the freezing temperature with pressure but a large change in the evaporation temperature with pressure. So the freezing point provides a stable reference temperature to a point but water can exist in all three phases down to -40C or so in the atmosphere, below that it would be just solid or vapor. Atmospheric water vapor in the -30 to -40 C range should give the models fits.
The correct answer is 32F.
FAIL
David.
The freezing point of water is not 32F at all times and at all locations.
Read the stuff I have linked to.
Herman is mostly right, by the way. The earth’s climate is bi-stable with both semi-stable states set by water’s phase change temperature. The mass of atmosphere doesn’t vary much so both the freezing and boiling points don’t change appreciably at sea level and so little of the earth’s surface is high enough to change the boiling point much that’s ignorable too. The key to the twin semi-stable states is phase change temperature and albedo.
The two semi-stable states are all-frozen and all-melted. The earth has been locked in a no-man’s land for the past 4 million years where neither state is dominant. In the earth’s history the all-melted state is roughly 10 times as prevalent and is the condition under which life spent the most time evolving.
The albedo changes are associated with phases of water are high-low-high for solid-liquid-vapor respectively. In the all-frozen state there is a positive feedback that got it there that can stated as ice begets ice. Since the albedo of ice is so high once a trend of falling temperature is established there can be a runaway ice house. There are episodes in the earth’s past where it was completely or almost completely frozen. What came along to melt it is controversial but most believe it is volcanic activity over the course of many millions of years belching CO2 into the atmosphere to increase the greenhouse effect and/or covering the ice with dark volcanic ash increasing its albedo. In the end both are the same thing because the greenhouse effect is just a roundabout way of lowering surface albedo.
Liquid water has an albedo that is close to zero especially where insolation is greatest which is to say high noon in the tropics. So once a melt starts it has a positive feedback which can be restated as liquid water begets more liquid water. Melting glaciers on land have a secondary effect of both lowering the albedo of the land by exposing rocks in place of ice and by increasing the surface area of the ocean covering rocks with albedo of ~0.15 with water.
If it weren’t for the vapor phase of water a melt would feed on itself to become a runaway greenhouse. As the global ocean warms up evaporation rate rises dramatically, water vapor convects upward, and adiabatically cools, condenses, and forms a cloud which has a very high albedo and the runaway greenhouse screeches to a halt with high albedo clouds and low albedo ocean surface in balance.
The cap on temperature by clouds is evident in ice cores where we see the end of a glacial epic marked by a rapid rise in temperature then it hits a ceiling temperature which is the same each and every time.
The last glacial melt producing the Holocene interglacial is unusual in that it was interrupted by an event called the Younger Dryas which is believed to have been the premature rupture of a north American ice dam near the Great Lakes that flooded the north Atlantic with a layer of cold fresh water which floated over the top of the warmer seawater because fresh water is less dense than saltwater. This interruption stalled the inertia of the melt and Greenland’s ice sheet (GIS) was spared. In the Eemian interglacial (the one before the Holocene) temperature spiked about 3C higher during the rapid melt phase and sea level rose about 9 meters higher.
Now we get to the crux of Pope’s climate theory. The sparing of GIS reduces the surface area of the global ocean to something under a critical tipping point where the ocean can warm enough and produce enough snowfall over the continents to let ice gain the upper hand and climate lapse back into a glacial epic.
For what it’s worth I think Pope is more or less correct.
Stephen Wilde | October 13, 2013 at 1:58 pm |
“The freezing point of water is not 32F at all times and at all locations.
Read the stuff I have linked to.”
For all practical purposes on the earth’s surface the freezing point of pure water is 32F.
If you want to turn your brain fart into an argument over how many angels can dance on the head of a pin you can do it with someone else.
David.
I’ll ignore your closing comment because it distracts from the effort you put into your previous post.
The issue is whether Herman’s view that the freezing point is the main climate thermostat is true or whether my view that the vaporisation point is the main climate thermostat is true.
The former is not much affected by atmospheric pressure whilst the latter is significantly affected by atmospheric pressure.
The thing is that water vapour is lighter than air and so rises, inducing vertical transfer of energy and horizontal winds, both inducing cloudiness and albedo changes.
I think that is what provides the global thermostat and not simply the water / ice transition.
Indeed, it is that vertical convection and the consequent horizontal winds that will control the extent of ice formation.
So I think you make good points but your interpretation of the effectiveness of the ice / water energy exchange is in fact subordinated to the effectiveness of the water / vapour exchange.
So, I remain of the view that Herman and yourself have got it wrong.
I would put it like this: stabilization of earth’s climate is associated with the existence of the triple point of water within the pressure (mass of the planetary atmosphere) and temperature ranges of the earth’s surface and atmosphere. Discussed in Chapter 14 of my text Thermodynamics of Atmospheres and Oceans
Hi Judith.
Noted, but what do you think sets the “temperature ranges of the earth’s surface and atmosphere.”
The ‘consensus’ seems to think that GHGs play a part whereas I think that GHGs only affect circulation and that the actual system energy content is set only by mass, gravity and insolation.
Would you accept that the stabilising effect of “the existence of the triple point of water within the pressure (mass of the planetary atmosphere) ” is capable of neutralising any thermal effect from more GHGs via changes in the global atmospheric circulation and albedo ?
In fact I would go further and suggest that even in the absence of water (such as on Mars or Venus) the system energy content would be similarly limited by changes of circulation in response to any forcing element that sought to cause a divergence from that set by mass, gravity and insolation.
Hence my request that AGW proponents indicate just how far the circulation pattern would shift from our emissions.
Saying “the triple point” is confusing. Water has many, but only one at that low a pressure.
“The freezing point of water is not 32F at all times and at all locations.
Yes, Sea Ice is frozen Salt Water and it is a little colder. So the Set Point that Polar Sea Ice melts and freezes is a little colder than the melting point for fresh water. It is what it is. The temperature of Earth is regulated a little colder than it would be if it was done with fresh water. Oceans are salt water and that is what earth works with.
The issue is whether Herman’s view that the freezing point is the main climate thermostat is true or whether my view that the vaporisation point is the main climate thermostat is true.
The temperature that polar sea ice melts and freezes has a really good set point. Vaporisation does not have a set point. That happens over a wide range of temperatures. That does not support a thermostat that is ON or OFF. Earth temperature clearly has a set point. only suggest things that really do this.
Look at the ice core data. Look at temperature data leading up to modern times. The temperature bounds tightened up as the Polar Ice Cycles developed and matured. IR Radiation takes care of most of the heat that is cooling the Earth, but it does not have a set point. The polar Ice cycles have a set point and does do the fine tuning of Earth’s Temperature.
The Polar Sea Ice melts and turns snowfall on when cooling is needed.
The Polar Sea Ice freezes and turns snowfall off when earth is cool enough.
curryja said:
I would put it like this: stabilization of earth’s climate is associated with the existence of the triple point of water within the pressure (mass of the planetary atmosphere) and temperature ranges of the earth’s surface and atmosphere.
Yes, water is abundant in all of its states and it does help make Earth a wonderful place to live.
CO2 helps make Earth a wonderful place to live because it makes green things grow and is not needed for temperature control, water, in all of its states, handles that just fine.
I like pilot light analogy someone made on previous thread re role of CO2
curryja
Do you have a link or can you tell me which thread the pilot light analogy was on? I do not recall that.
http://judithcurry.com/2013/09/20/co2-control-knob-fallacy/#comment-383163
This seems like a good time for an observation. Stephen Mosher is fond of pointing out that scientists don’t tear down someone else’s model or theory without presenting one of their own for similar criticism.
If this were merely an academic debate over right or wrong models or better or worse theories, all in some abstract, cost-free world, that would be right.
But this particular discussion has gone past that cozy little world. Now it is a matter of proposing massive investments and policy making based on those theories and models.
In that world of pitching investments, there is a big difference between the person requesting the investment and the person offering it. You can simply say “no.” That may be a very interesting map to the lost gold mine, but I am not responding by showing a better map to the lost mine. Rather, I am saying No thanks. I’m not investing anything until I see better evidence than that.
I think my old Physics profs would understand that.
“Stephen Mosher is fond of pointing out that scientists don’t tear down someone else’s model or theory without presenting one of their own for similar criticism.”
Really? Seems like that would make peer review a lot more difficult.
Not only that, it would be a world with no unbelievers. You wouldn’t be allowed in the door unless you professed your faith in something.
Not a very scientific way, is it?
The idea there is that reviewers can criticize someone’s article without necessarily attacking their theory.
They may have done sloppy work on a brilliant theory.
Judith
Thanks for Ghil’s excellent observation:
Don’t we first have to quantitatively model “natural climate variability” before we can distinguish “anthropogenic global warming”?
Since none of the current IPCC GCM’s have shown any skill in modeling the “haitus” of the last 17 years, how can they claim any skill in distinguishing “anthropogenic” from “natural”?
Contrast models incorporating natural multidecadal variability. E.g.,
NAO implicated as a predictor of Northern Hemisphere mean temperature multidecadal variability Jianping Li, Cheng Sun1, and Fei-Fei Jin, Geophysical Research Letters 11 Oct 2013
Nicola Scafetta Discussion on climate oscillations: CMIP5 general circulation models versus a semi-empirical harmonic model based on astronomical cycles Earth-Science Reviews 126 (2013) 321–357
These seem to better quantify “natural climate variability”.
Ghil observes:
Contrast climate persistence or “Hurst-Kolmogorov dynamics”
It appears the IPCC is ignoring evidence that past climate is not “stochastic red-noise process”, and consequently it fails on both counts.
“Jim D | October 13, 2013 at 6:50 pm |
manacker, no, CO2 levels were declining slowly and had to drop much further before the Ice Ages started. First Greenland had to freeze over, and Arctic sea ice had to become a regular occurrence, then you could get Ice Ages.”
One could say the Ice Age started tens of million of years ago.
Particularly If want to go back to time of Greenland first freezing over, and might about 30 to 40 million years ago. If looking for time Greenland had oh say 1/2 or less it’s current level glacier ice it may occurred within last million year. The last interglacial period still had significant amount glacial ice in Greenland.
But if mean Glacial periods, generally CO2 level lagged global temperatures by hundreds of years.
And would imagine glacial period start like the Little Ice Age, but they simply do not recover- and get colder and colder over centuries. And there is apparently evident of a rather quick start of Glacial periods- steep cooling within a century or so.
I don’t remember Mosher saying that; maybe he will correct me. Sounds more like David Appell to me. And he’s just wrong about it. Bad work should be criticized, whether or not I have something to replace it with.
Criticize all you want, if you have nothing better to offer than a mix of appeal to incredulity based on some as hoc criteria verging on an appeal to perfection, what you criticize stays on the table.
Not we should not be thankful for the concerns raised by such criticism, mind you.
http://nypost.com/2013/10/13/crew-members-deny-captain-phillips-heroism/
As with all things context is important.
Here is the context. There are some people who characterize science SOLEY as the skeptical step. That is, they argue that they dont EVER have to offer explanations, but rather all they have to do is criticize the work of others. Or in practice all they do is criticize and they think this amounts to scientific behavior. My point is that science contains both. Both the constructive step when an explanation is offered and a critical step when explanations are criticized. In short, you cannot make a career in science merely doing criticism. In fact its very hard to publish a paper that merely points out mistakes.
Its interesting to note how science does in practice handle the criticial phase today. Look at how peer review happens. Look at the WIllis Spenser fight.
Where folks asked.. “why didnt you write him privately?”
In the end takeing the job of scientists means you have to offer explanations. Yes, along the way you USE skepticism as a tool to improve your explanation, but in the end, the goal is explaining.
If all you do is criticize, then you are doing something that is more like philosophical skepticism.. and you cannot do that consistently. You cant live that philosophy
@Steven Mosher…
Perhaps so, when it comes to “Climate Science”. However, when some science is used across the science/policy interface to drive policy “prescriptions” there needs to be some sort of rigorous process that studies just how much reliance should be placed in that science. Perhaps it should be called “meta-science”?
Thus, the IPCC has the (tacit?) theory that their GCM-based projections are “ready for prime time”, in the sense that policies costing trillions of dollars can be recommended based on them. People like Freeman Dyson have proposed an alternate theory: the models are not ready for prime time. Evidence may now be offered relative to both theories.
Seems like McSteve does pretty well by criticizing without offering alternatives. As you saying that he’s not contributing?
This whole issue was dealt with in my null hypothesis paper http://judithcurry.com/2011/11/03/climate-null-hypothesis/ in the section on Decision making and the burden of proof; see also my description of Ghil’s version of the climate null hypothesis. The issue is whether IPCC et al. have come up with a sufficiently convincing argument to reject the climate null hypothesis. Ghil’s statement is appended below:
More precisely, we ask whether the impact of human activities on the climate is observable and identifiable in the instrumental records of the last century-and-a-half and in recent paleoclimate records? The answer to this question depends on the null hypothesis against which such an impact is tested. The current approach that is generally pursued assumes essentially that past climate variability is indistinguishable from a stochastic red-noise process, whose only regularities are those of periodic external forcing. Given such a null hypothesis, the official consensus of IPCC (1995) tilts towards a global warming effect of recent trace-gas emissions, which exceeds the cooling effect of anthropogenic aerosol emissions. . . The presence of internally arising regularities in the climate system with periods of years and decades suggests the need for a different null hypothesis. Essentially, one needs to show that the behaviour of the climatic signal is distinct from that generated by natural climate variability in the past, when human effects were negligible, at least on the global scale. . . Can we identify with measurable certainty deviations of the current record from predictions based on past natural variability? If so, such deviations have to be attributed to new causes. The “suspects” clearly include human effects, and attribution to them will become thereby both easier and more reliable.
The alternative theory is ‘natural variability’, what has governed climate variability entirely at least until the onset of the industrial revolution.
IMO there are two questions here, which need to be addressed separately:
What is the impact of all human activity on “climate” (whatever that is)?
and
What is the effect of atmospheric pCO2 on climate?
There are other human activities that can impact climate, and there are serious, unaddressed (AFAIK) questions regarding paleo. Especially the issue of just how “constant” the pCO2 was prior to the early 20th century, in light of Salby’s effort to deprecate all ice-core evidence.
Extension of a particular, moshe, to a general. Can live that way, in this instance, with such rich soil, and copacetic climate.
=================
Regarding “Steven Mosher | October 13, 2013 at 12:31 pm |
As with all things context is important….”
This blog (at least the comment section) is more political than scientific. I would go to Steven’s or Lucia’s blogs for more “scientific” comments. Point being that I am not sure that (given the context) Steven’s point is relevant for comments on this blog.
There is also a tendency in some camps to marginalize those they disagree with by claiming that since they are not trained climate scientists their comments should be disregarded. It doesn’t take another “climate scientist” to recognize when “climate scientists” are not following sound scientific principles.
And finally I shouldn’t have to wait until I know what is causing climate change before challenging someone who claims it is caused by pixie dust.
As Steven said “As with all things context is important.”
The null hypothesis comes down to whether a 400 ppm climate can be distinguished from a 280 ppm one. Paleo evidence suggests it can because the last time with 400 ppm was before the Ice Ages started. A subsequent follow-on is whether 700 ppm can be distinguished from 280 ppm. I think it can quite easily, again on paleo supporting evidence from the Eocene. Don’t be trapped into just considering models and the last century of data when answering these questions. There is a lot of additional science out there with a direct relevance to these questions.
Please specify how far a CO2 increase from 280ppm to 400ppm would shift the jets and climate zones latitudinally and provide details of your work.
Natural solar and oceanic variations achieve up to 1000 miles.
Stephen Wilde, if you can prove those for yourself, you will have disproved the null hypothesis too. That wouldn’t be the way I would do it because paleoclimate gives no additional information on those, unless you want to use models. Paleoclimate directly gives you things like Ice Age frequency and ocean temperatures, and biology characteristics regionally. These would be better evidence for most people than your models.
Jim D
Yes, you are right.
Demonstrating how far the climate zones shift from natural variability as opposed to from our emissions would be a game changer.
I ascertained that some time ago:
http://www.newclimatemodel.com/weather-is-the-key-after-all/
Isn’t the burden on the AGW proponents to show how far the climate zones and jets would shift as a result of our emissions ?
JimD said:
This is a no-brainer if you sit down and do the analysis.
Take all the natural variability and it fills in the majority of the fluctuations of the global temperature curve of the last 130 years, but essentially none of the overall trend. See this chart where I compared what Lean&Rind developed several years ago, with what I came up with recently:
http://imageshack.us/photo/my-images/62/8c1.gif/
The natural variability is toward a slight cooling if anything, so that the GHG’s are compensating that change as well.
The null hypothesis was revoked years ago.
WHT,
Only if:one ignores the rising trend of solar activity since the LIA and attributes the thermal recovery from the LIA.to anthropogenic effects alone.
I don’t think that is reasonable.
Steven Mosher | October 13, 2013 at 12:31 pm |
With all due respect to Dr. Curry, who has a response to your view that is stated in terms of the null hypothesis, I would like once again to point out not just the fallacy in your viewpoint but its historical inaccuracy.
You hold the position that to participate in the debates on climate science that it is not enough to offer criticisms; rather, one must offer an alternative explanation to gain permission to offer a criticism. You would hold that Copernicus’ criticisms of Ptolemy’s astronomy could not have been genuine criticisms because Copernicus had not yet undertaken, much less finished, his own system of astronomy which contradicts Ptolemy’s system. Had you been there, you would have told Copernicus that his decision to engage in research that fundamentally departs from Ptolemy’s assumptions was both unscientific and foolish in the extreme.
In her comment above, Dr. Curry quotes Ghil as follows:
“The presence of internally arising regularities in the climate system with periods of years and decades suggests the need for a different null hypothesis. Essentially, one needs to show that the behaviour of the climatic signal is distinct from that generated by natural climate variability in the past, when human effects were negligible, at least on the global scale. . .”
She goes on to say that natural variability is the alternative theory. On that she is mistaken. Natural variability is not a theory but our records of the facts. It is data and nothing but data. When our data reveal natural regularities, as Bob Tisdale has shown time and again for ENSO without ever resorting to a theory, then we have our natural regularities. Nothing more is needed. We do not yet have an explanation for them or a theory that comprehends them. It is our duty to get to work and find such theories and explanations. (Mosher, your particular problem is that you cannot “get your mind around” the idea that facts can be known independently of theory.)
However, the fault does not lie so much with Mosher as with a small group of scientists and activists who decided as early as 1980 that the combination of computer models of climate and radiation theory could make a case for CAGW. From that day on, they have howled that all the causes are known. What BS. Fortunately, we have now reached a point where prominent Warmists such as Trenberth find themselves searching for ocean mechanisms that predate any possibility of influence from manmade CO2.
AK
“People like Freeman Dyson have proposed an alternate theory: the “models are not ready for prime time. Evidence may now be offered relative to both theories.”
That’s not a theory. That’s a judgement about usefulness that Dyson has no business making since he is not a policy maker.
Lets suppose I am a policy maker
As a policy maker I want to know
What is your best prediction for sea level rise in the next 100 years?
Here are some possible avenues of response
A). we dont know, we cant know, the whole mess is chaotic
B) Here is an extrapolation based on past data ( statistical model )
C) Here are the boundaries we have seen in the whole history of the earth ( super wide )
D) Here is what 40 or so physics models say
E) The models in D are wrong
F) The models in D run hot.
As a policy maker I get to choose, I HAVE TO CHOOSE which of these to listen to or how to combine them into some approach that I think I can make a decision on. I dont get to quit being a policy maker in the face of uncertainty.
person A. I get to dismiss person A out of hand. The job is to provide an answer. person A failed. go away.
person C. well thanks, that’s not actionable intelligence. yes seas have been a lot higher and a lot lower. Thank you, now go away.
person E. Thanks for your input jackass, I know the models are wrong.
if you have a better model please put it on the table, otherwise go away.
person F: thank you for your input. I might be able to use that.
So you are left with B and D. projecting the future based on statistical models of the past and projecting based on physics, on the current state of physics with all its attendant warts. You also have some good input from F.
How do you decide ? And if there is time pressure how do you decide?And if there are high costs or potential high costs how do you decide? And if you cant test these approaches against each other how do you decide? and if the costs and impacts are uncertain how do you decide? I’d submit that this process of deciding is not rigrous, not perfectable, and cannot be reduced to a canonical set of rulz. But we can say that certain parties are not helping to answer the question.
So if you look at this list of A-F you will find every form of denizen.
some of you dont matter. Sorry. That’s ok, continue on, but understand that a good policy maker is going to ignore what you say.
shrugs.
@Steven Mosher…
It’s a theory, or perhaps I should say “theory” of a meta-science: “climate meta-science”. At a very primitive level, since a whole bunch of work needs to be done regarding the definition of “ready for prime time“. I would propose (as a first approximation) that when predictions are actually useful in terms of the proposed policy, the “science” providing them is (perhaps only somewhat) “ready for prime time“. “Actually useful” as opposed to “worse than useless” in the sense that they give decision-makers a false sense of confidence that they know the outcomes of their decisions.
To go with your example:
E.1) The models in D are
wrongworse than useless: they give you a false sense of confidence.[Policy maker to] person E.1: Thanks for your input jackass, I know the models are wrong. if you have a better model please put it on the table, otherwise go away.
Smart ruler (i.e. the public in a democracy) to policy maker: you’re fired!
“You hold the position that to participate in the debates on climate science that it is not enough to offer criticisms; rather, one must offer an alternative explanation to gain permission to offer a criticism. ”
Wrong. That’s not what I am saying.
Try again
Theo
“Mosher, your particular problem is that you cannot “get your mind around” the idea that facts can be known independently of theory.”
Your theory, the theory that there are facts independent of theory,
is of course the theory you need to assert that there are facts independent of theory. In short, you rely on a distinction between fact and theory that is a dogma and not a fact.
But go ahead and try to distinguish between fact and theory or show a fact that is independent of theory and I will show you the theory you accept prior to determining what are facts and what are theories.
G. Wait until we know more before committing billions of dollars.
“What is your best prediction for sea level rise in the next 100 years?”
Global sea level will rise about 1 foot.
Sea level in a particular region may rise more than this and sea levels could instead lower in particular regions.
The existence of coral islands, provides evidence that coral island can keep pace with meter of more rise in global sea level. So as long as this natural process is not hindered, coral island should never have a problem from rising sea levels.
But generally speaking because coral island are at low elevation, they don’t make a very safe place to build anything if want it to last a century.
More a much more important aspect is related to storm surges, and tsunami, and these are strongly affected by regional conditions.
Go away.
We have to have alternatives for fossil fuels in any case, as they are non-renewable resources. That will cost at least billions of dollars.
Go away, yup.
Steven Mosher | October 13, 2013 at 4:45 pm |
You have to be kidding. Do you believe that there are no prominent Warmists who accept the claim that there has been a “hiatus” in temperature increase? Surely, some do accept it. Trenberth, the most prominent Warmist in my opinion, accepts the claim. He is searching for the missing heat in the deep oceans. Where does he get the idea that there is missing heat? He gets it from the temperature record, which he recognizes to be factual. The temperature record has departed from theory. In the case of Warmists, that means that the temperature record is flat or declining while the model-produced record continues to climb steadily. Even warmists recognize that the “hiatus” requires explanation.
I do wish that you and all Warmists would embrace your reasoning and publish to the world that the “hiatus” and all such phenomena are meaningless in themselves and that only Warmist theory has meaning. That would bring about an end to the IPCC and all government support for Warmist theorists as soon as the word got out.
Finally, if you are going to hold the position that there are no facts that are independent of theory then you have surrendered science’s connection to the world. You have embraced some postmodern Marxist fantasy in which scientific conclusions are reached by committee using the “precautionary principle” and various other tools of “decision making under uncertainty,” tools that have no basis in science whatsoever.
But isn’t it true by definition that the “null hypothesis” to climate change on Earth (at least over the last 600 million years) is “natural forcing and variability”?
manacker, that would be the reductio ad absurdum argument against the null hypothesis, which is that it implies that CO2 never has had any effect on explaining climate change including the Triassic and Eocene warming periods. Paleoclimate people would have to go backwards in their understanding of the data to accommodate that idea.
Jim D
Yet the Ice Age started anyway.
Over the 500,000 year record (which Al Gore misused in his “AIT” flick) we see periods during which CO2 levels were lower than normal, but temperature started to increase and other periods during which CO2 levels were higher than normal, but temperature started to decrease.
And going even further back, the Ordovician “Ice-ball Earth” period occurred when CO2 was at 4,000 ppmv.
The “CO2 climate control knob” is a model-derived fantasy, Jim
Max
Jim D
Are you suggesting that the “CO2 climate control knob” should be the “null hypothesis”?
I certainly hope not, because that would be absurd.
Max
manacker, no, CO2 levels were declining slowly and had to drop much further before the Ice Ages started. First Greenland had to freeze over, and Arctic sea ice had to become a regular occurrence, then you could get Ice Ages.
manacker, I am only saying the null hypothesis already doesn’t fit the extended-period facts, so find one that does. It is no good having a null hypothesis that no one believes is true in the first place.
Steven Mosher | October 13, 2013 at 4:35 pm |
AK “People like Freeman Dyson have proposed an alternate theory: the “models are not ready for prime time. Evidence may now be offered relative to both theories.” That’s not a theory. That’s a judgement about usefulness that Dyson has no business making since he is not a policy maker.
Does this imply that since I am not a policy maker I have no business making a judgement as to how my tax money is spent? And since I am not a climate scientist I have no business making a judgement about how accurate climate models are? I wonder if I have any business deciding how to take care of my yard since I am also not a gardner.
I repeat my earlier comment:
“There is also a tendency in some camps to marginalize those they disagree with by claiming that since they are not trained climate scientists their comments should be disregarded. It doesn’t take another “climate scientist” to recognize when “climate scientists” are not following sound scientific principles.”
Mosh
Your example of the “policy makers dilemma” is amusing – but it has some holes
First of all, it ASS-U-Mes that the “policy maker” does not already have a hidden agenda. We know that this is not the case. Many pols are salivating at the chance to levy a direct or indirect carbon tax on their citizenry in order to increase revenues and are pushing IPCC for the “physical science basis” to support this agenda.
Then your example relates to expected future sea level rise “over the next 100 years”. As any Dutchman knows, the “solution” to this problem is NOT a carbon tax, but increasing the height of dikes/levees if and when it becomes apparent that this could be required (not simply because “40 climate models” somewhere have projected that this could occur over the next “100 years”).
Tide gauge records show that the decadal rate of SL rise has fluctuated from over 5 mm/year to under -1 mm/year over the 20th C, averaging 2.0 mm/year during the first half of the century and 1.4 mm/year over the second half, for an overall average of 1.7 mm/year. It is now being measured by a totally different methodology (satellite altimetry), which also measures a totally different scope (the entire ocean except polar and coastal regions, which cannot be captured by satellites versus selected coast lines, where people live). These new measurements show that it has been around 3 mm/year recently (so well within the 20th C range).
So let’s ASS-U-ME that the “policy maker” really has no hidden agenda and he hears that model simulations based on ASS-U-MEd future greenhouse warming tell him the average rate of SL rise will increase up to three-fold, so that SL could rise by somewhere between 20 and 84 cm by 2100. So what will he do?
If I were the policymaker, I would tell the model wizards to “go back to the drawing board” and give me a closer estimate along with key check points, where I can see whether or not the projected trend is really occurring, so I can see if and when I need to start thinking about raising the dikes.
I would ask these guys how well their model projections have done recently. Are they on track? How well did they predict the current pause in warming? Could they have over- (or under-) estimated the rate of temperature rise leading to the rise in SL? Are there any other factors I need to know about?
And, if I were an elected politician, I would be more concerned about decisions that are likely to be required during my time in office and not the far distant future.
Mosh, I believe this is a more realistic scenario than the one you have presented.
But yours was entertaining.
Max
WebHubTelescope (@WHUT) | October 13, 2013 at 5:27 pm |
“We have to have alternatives for fossil fuels in any case, as they are non-renewable resources.”
Yes, I know, I know. Can you tell me when? I’d like to set my alarm.
Steven, Don’t be so provincial. Many countries that have no fossil fuel reserves are far on the road to transitioning to alternatives. They pay through the nose for scarce resources and then expect to be competitive?
They don’t have much choice, and that is not even considering the GHG issues.
Steven Mosher: That’s a judgement about usefulness that Dyson has no business making since he is not a policy maker.
We all have a business making judgments about usefulness and writing them to the legislators and bureaucrats who are the nominal “policy makers”.
Perhaps you’d like to rewrite that to make sense?
“That’s not a theory. That’s a judgement about usefulness that Dyson has no business making since he is not a policy maker.”
I put this Mosherism in a class with “there is no categorical difference between measure and estimate,” models are tested against ground truth…from other models, etc.
Sometimes to win the argument at hand, he says things even he does not believe.
Mosher, you just don’t understand how policy making works, when you claim that Person A, whose position might be less pejoratively described as “there isn’t enough information to know the answer” is a “Fail.” In fact, the model of responses that was used in the top policy organisation in Australia, where I worked (the Prime Minister’s department), was that there are three options to be considered when faced with a policy problem.
1. Do nothing.
2. Implement a partial response.
3. Implement a totally committed response.
Very often (1) was the correct answer; less often, it was (2) and almost never was it (3). And, the fact that there was no compelling information to drive action did not mean that it was our duty to go and find it. It is up to the proponents to do that, if it can be done.
Johanna
+1
Theo
“Finally, if you are going to hold the position that there are no facts that are independent of theory then you have surrendered science’s connection to the world.
That’s your theory, sadly it’s wrong. The position is rather that statements about “connected to the world” are not very science-like. The statement that all facts are theory laden is merely a statement that you cannot simply ‘start with the facts”, that the decision to call some things facts and other things theories is a theory about what is.
Science doesnt need realism to function. In fact it functions quite well without making any assumption about its “connection” to the world. I have a theory. It works. It allows me to make successful predictions. Explaining this success by assuming that “science works because its connected to the world” is adding an assumption where none is needed. It violates parsimony. Science works because it works. One need not pollute science with un-neccessary philosophical statements about the connectedness with the world. Science works. That is all. If I showed you that science worked but was not connected to the world, what would do?
stop using it?
You can of course go read Popper or Kuhn or Quine on facts being theory laden. But just ponder this. How do you know what ‘facts’ to go look at? how do you know what data to collect? The notion that you just ‘start with the facts’ is an inaccurate account of how science actually works. Take a look at Climate science, the “facts” of natural variation are ignored and not looked at because the activity of science is theory laden. They are defined away as ‘noise’. The notion that one can look at all the facts, or decide in advance, free of theory, which facts are important, is misguided. facts just dont appear. They are always manifested through the lens of theory. I see an outlier, you see a counter example. the fact doesnt speak for itself, doesnt tell us what it means.
Steven Mosher | October 13, 2013 at 4:45 pm |
Theo
“But go ahead and try to distinguish between fact and theory or show a fact that is independent of theory and I will show you the theory you accept prior to determining what are facts and what are theories.”
To give reason for your point, it is not enough to show that a theory is associated with the data. You have to show that the data is unique to one theory; otherwise, the data would not be theory dependent.
My favorite example is the factual and observable truth that Venus has phases. That fact is recognized by Kepler’s theory, Newton’s theory, Einstein’s theory and any other theory that will ever encompass our solar system. Clearly, then, the fact is independent of theory.
Theo,
Some observations are meaningful in many different theories and have a very similar meaning in all of them. That does not make them fully theory independent. After all you wrote any other theory that will ever encompass our solar system. You didn’t write without any theory.
At what level theories enter in our perception in formation of concepts and in the use of language are questions to be considered to get deeper in this discussion.
Some theories are very simple and behind many more complex theories. Basic view of solar system is more general than Newtonian theory of the motion of planets, but there are even more basic theories behind the basic view of solar system.
Moving to the application of this hierarchy to climate science, I have noted that TCR is a quantity less dependent on the detailed theories than projections of future temperatures calculated from specific climate models. By that I mean that the selection of a model to use in interpreting the empirical data has over a wide range of cases only a modest influence on the resulting estimate, while the projected temperatures in 2100 calculated from the same set of models vary much more strongly.
Pekka Pirilä | October 15, 2013 at 4:15 am |
Theo,
“Some observations are meaningful in many different theories and have a very similar meaning in all of them. That does not make them fully theory independent. After all you wrote any other theory that will ever encompass our solar system. You didn’t write without any theory.”
I came very close to “no theory.” All I need is a Walmart telescope to see the phases of Venus. All Galileo needed was his handmade telescope. If pressed for an explanation, all I need is the simple optics of simple telescopes. Keep in mind that the facts that I claim to observe are the phases of Venus and not more complicated matters such as the orbit of Venus.
“At what level theories enter in our perception in formation of concepts and in the use of language are questions to be considered to get deeper in this discussion.”
Philosophers of science who are not of the Kuhnian/postmodern persuasion do not do “concepts.” As Quine argued so well for so long, terms are implicitly defined by the sentences in which they occur. The question then becomes how truth-values are to be distributed or redistributed over sets of sentences.
Your points are interesting and I do hope we have occasion for further discussion of these matters.
Steven Mosher | October 14, 2013 at 12:14 pm |
“Science doesnt need realism to function. In fact it functions quite well without making any assumption about its “connection” to the world. I have a theory. It works. It allows me to make successful predictions. Explaining this success by assuming that “science works because its connected to the world” is adding an assumption where none is needed. It violates parsimony. Science works because it works. One need not pollute science with un-neccessary philosophical statements about the connectedness with the world. Science works. That is all. If I showed you that science worked but was not connected to the world, what would do?
stop using it?”
So, Steven, do you really think that you can give a reasonable account of the meaning of the word ‘prediction’ in science without referring to factual claims that are known to be true or false independently of your theory?
Let’s start with your grand claim that there are no facts known to be true independently of theory. When you predict, what are you predicting? Other theoretical statements that belong to your theory? Why predict them? If they belong to your theory your can deduce them through logic alone.
If you predict other theoretical statements then what is the value of prediction? The predicted statements cannot serve as evidence for your theory because they are part of your theory. Anyone who does not accept your theory will not be impressed that you “predict” other of your theoretical statements.
The purpose of observational statements in science is to serve as a common ground among scientists who do not share the same theoretical beliefs. Or you can adopt the Marxist position that the truth is the last ideology standing; however, if you adopt that position then why be concerned with truth of scientific statements?
Steven Mosher | October 13, 2013 at 12:31 pm |
As with all things context is important.
“Here is the context. There are some people who characterize science SOLEY as the skeptical step. That is, they argue that they dont EVER have to offer explanations, but rather all they have to do is criticize the work of others.”
Excellent Strawman fallacy. May I add it to my examples for teaching?
No one claimed that criticism alone made one a scientist. (Though it did make Godel a legendary mathematician.)
The claim is that a scientist does not need an alternative theory before they criticize another’s theory. Given that a scientist is expected to be a dedicated critic of his own work, the claim is obviously false. Must a scientist create an alternative to his own theory before he can criticize his own theory?
Kurt became famous because he PROVED an incompleteness, not only because he offered his criticism of Hilbert’s program.
Kurt did not became famous because of his criticism of relativity theory.
Apologies. It’s Steven Mosher, not Stephen
Science is replete with examples where one scientist proved another wrong without a replacement theory. Start with the Michelson–Morley experiment.
re read the entire history of the series of experiments
Related: Science is also replete with moments when they almost had complete closure, but not quite. Newton had everything pretty much all figured out except for a few annoying details like light and lightning and magnets and stuff like that.
But then again, the Church had everything all figured out except for a few annoying details like planets.
The annoying little details are often the problem that turns the paradigm upside down later. But the annoying details are there whether or not there’s an alternative theory. The alternative theory can come centuries later. In the mean time things almost fit together, but not quite.
Not having an alternative theory doesn’t make wrong theories right. They may be the best game in town, but that’s not the same thing as right. Newton didn’t have a correct explanation for light just because Einstein hadn’t been born yet. Newtonian mechanics was wrong in the relativistic and quantum domains even when Newton was alive.
You re-read the entire series of experiment Mosher. Einstein made the next advance with a small contribution from Lorentz. It wasn’t Michelson and/or Morley. Stop with the obfuscation already.
jim2, the reason why so many people believe Morley-Michelson was important is that so many k12 school books say so. This is a good example of how k12 education is actually teaching wrong science and science history.
Yes, Lorentz almost got there, and Einstein did based entirely on Maxwell’s equations, and MM doesn’t figure in there anywhere. Relativity came directly out of electromagnetism.
But we’ve known for a long time that k12 science is an abomination. And that was before the activists got their fingers in and around it.
Michelson–Morley is a good choice for an example. One of my favorites is the discovery by Galileo that Venus has phases. There are a gazillion of them.
Before we get totally off track with regard to the Michelson-Morley experiment, let us focus on what it was intended to show, namely, that there is no ether drift. Vague comments to the effect that other theorists were important in the larger discussion simply distract from the focus on the experiment’s main result.
Harold, show me where I said MM had something to do with relativity. What they did show is that the postulated aether did not have the postulated properties. Their experiments indicated the speed of light is constant WRT to motion. The destruction of the aether theory is a form of creative destruction.
Different people frequently are involved in any one step forward. Some may disprove a hypothesis while others formulate new ones. Science is a group effort. Occasionally, someone may disprove a hypothesis and propose an alternative. There are no rules regarding these activities.
The idea that one can’t criticize theories, models, statistical treatments of data, or methodologies without first proposing a replacement has no historical precedent and is illogical.
The idea that one can’t criticize theories, models, statistical treatments of data, or methodologies without first proposing a replacement has no historical precedent and is illogical.
###########
That’s never been the argument.
The argument has been against those who claim that criticism is ALL that is required. That one can do all of science by merely criticizing.
Further within normal science it is the case that you don’t get to throw out a paradigm because of odd results.
This is an example of Mosher believing his perception of reality is actually reality when it isn’t.
Perhaps humanity’s most common experience.
==============
You mean like this: http://climateaudit.org/2013/07/26/guy-callendar-vs-the-gcms/
Guy Callendar > Multi-million$ GCMs. Dear Climate “Scientists” pretty doesn’t matter if you go backwards on your key metric (ie: predictive skill, of which you have none).
Wouldn’t it be relevant to have a curve fit on this graph?
http://onlinelibrary.wiley.com/store/10.1029/2011JC007255/asset/supinfo/jgrc12191-sup-0010-fs09.pdf?v=1&s=79e93e124ca1fd8a33753fc667ff17deaa20b3e6
It shows that the deep oceans ( below ~1000m) have lost ~17K the last ~82 million years, and no sign of a reversing trend sofar.
In case you’re wondering how the deep oceans got so warm, try the creation of the Ontong Java plateau, a mere 100 million km^3 of hot lava erupting into the deep oceans.
So, according to figure 11.25, if we had in 2035 a temperature less than 0,1ºC hotter than 1998, and so a 37 year “pause”, this will be consistent with the indicative prediction range for annual means. Literally, no global warming is consistent with a dangerous global warming. Are they serious? And, what would be the ECS for the non global warming part of the dangerous global warming indicative range?
None of this mega cool Academies have considered the convenience of a wait-and-see (and learn) strategy?
Assuming no future large volcanic disruptions…
Rather than speculate about a single natural event that could confound our best projections, it is more interesting to see that reality is so contrary to the preconceptions that underlie all of the official government GCMs–e.g., The observed 15-yr moving trend during the period 1951-2012 from the Hadley Center temperature record (blue) has fallen below the 2.5th percentile.
Judith Curry,
” the possibility that model sensitivity to anthropogenic forcing may differ from that of the real world;”
Do you have any links to who is working on this part of issue?
This is a huge concession by the Warmists. In part, because it required one of them to momentarily overcome his/her huge arrogance and admit that the Warmist figure for climate sensitivity is not the end-all and be-all of climate science. They have been much more subtle in admitting that radiation theory alone cannot explain all observed climate phenomena.
Let me remind everyone, not that you need reminding, that it has been only a year or so since skeptics succeeded in getting Warmists to admit that natural variability has a role to play in our best scientific account of Earth’s climate at this time.
natural variability has always been known to have a role. I distinctly recall many years ago informing climate skeptics that the peak of the 1998 temperatures was not part of the longterm trend!
The skeptics haven’t yet accepted that the pause is due to natural variability within a rising trend, so the shoe is on the other foot now.
Jim D
Most skeptics of the IPCC CAGW premise have “accepted that the pause is due to natural variability within a rising trend”. (I certainly have.)
The long-term “rising trend” has been around 0.05C per decade, starting long before there were any real human GHG emissions.
This long-term trend has been overlaid by an oscillation with ~30 year cycles of strong warming and ~30 year cycles of slight cooling, with an apparent amplitude of around 0.2C, which are very likely a result of some sort of natural variability. Syun-Ichi Akasofu has attributed these cycles primarily to the PDO, but there are other hypotheses.
The point of contention is whether or not human GHGs (principally CO2) have been a significant or only an insignificant contributor to the late 20th C warming.
Max
Jim D: The skeptics haven’t yet accepted that the pause is due to natural variability within a rising trend, so the shoe is on the other foot now.
At least the early part of the rising trend preceded the largest amount of CO2 increase, and so must be part of the “natural variability”. How much of the complete rising trend is equally part of the “natural variability” is indeterminate on the present evidence. Estimates are all over the place.
lolwot | October 13, 2013 at 6:09 pm |
You might have been on the ball but the mainstream was not.
the possibility that model sensitivity to anthropogenic forcing may differ from that of the real world;
Admitting this is a great news.
However, did not they tell us the science was settled?
Climate sensitivity estimate based on observation.
CO2 for zero GMST in the 1960s, C1= 320 ppm
CO2 for 0.4 deg C GMST 2012, C2 = 394 ppm
Climate Sensitivity, CS = T*Ln (2)/Ln(C2/C1)
CS = 0.4*Ln(2)/Ln(394/320)=0.4*0.693/0.208=1.33 deg C for doubling of CO2.
That’s wrong. The transient climate sensitivity is close to 2.1 C according to observational data.
Webby
Girma has just demonstrated to you that the actual observations since the 1960s show that the TCR was 1.33C – NOT 2.1C.
If you criticize his figure, show how his calculation is incorrect, but don’t just make flat statements.
Max
You really are serious aren’t you Max?
GIRMA said:
CO2 for zero GMST in the 1960s, C1= 320 ppm
CO2 for 0.4 deg C GMST 2012, C2 = 394 ppm
I assume he meant 1960, where C1 = 317 PPM, and where the T anomaly is 0.
Change the temperature increase to 0.6 deg C instead of 0.4, which you can just “look up” you know.
That scales Girma’s answer by 0.6/0.4 or 1.5*1.33 = 2 C
This TCR=2C is the number I have been quoting, which you can also determine by a multiple linear regression fit assuming lnCO2 and 4 fluctuation terms (SALT = SOI, Aerosols(volcanic), LOD, TSI):
http://img51.imageshack.us/img51/645/u8hp.gif
Girma is leader of Team Denier, and gullible fools like Max eat up whatever he says. Fascinating.
Web
GMST for 2012 is 0.45 deg C, not 0.6 deg C
http://www.woodfortrees.org/data/hadcrut4gl/compress:12
Watch how the little weasel Girma cherry-picks the data.
Pick HADCRUT or GISS, and you can see that change averages about 0.6
http://www.woodfortrees.org/plot/gistemp/from:1880/mean:60/plot/hadcrut4gl/from:1880/mean:60/offset:0.08
Median observational estimate for TCS is 1.3 K per Otto et al., 2013.
Climate sensitivity estimate based on observation.
CO2 for zero GMST in the 1982, C1= 341 ppm
CO2 for 0.45 deg C GMST 2012, C2 = 394 ppm
Climate Sensitivity, CS = T*Ln (2)/Ln(C2/C1)
CS = 0.45*Ln(2)/Ln(394/341)=0.45*0.693/0.144=2.17 deg C for doubling of CO2.
Standard 30 year climatology…./sarc
They use the ice ages Girma, that’s where you need to attack.
They also use the observational evidence of land sensitivity, ~50% higher than global.
This equates to ECS, no need for paleo evidence, X boy.
“…processes that are poorly simulated in the CMIP5 models exert a significant influence on GMST. The latter class includes:… the possibility that model sensitivity to anthropogenic forcing may differ from that of the real world.”
But we are more certain than ever of the model’s predictions.
Given the latest news that the “science” of WG I in the AR5 will be changed to conform to the SPM, I wonder if this admission will survive in the final document.
“…the observed trend is not a member of the modeled set of predictions (i.e., the models do not statistically capture reality as represented by the observations).” ~Knappenberger and Michaels, Climate Models’ Tendency to Simulate Too Much Warming and the IPCC’s Attempt to Cover That Up
We paid the bill for Western academia to create a story that humanity was responsible for global warming, and then pass it off as truth. Nature, however, had the last say. We should not ignore the fact that academia’s America-is-evil-and-is-killing-the polar-bear story has been very helpful to the Left. Academia took sides against America.
I-ndisputable
P-roof of
C-O-Two
C-limate Change*
* Used ter be ‘Globul Warming but when the facts change,
what do you do, Sir?
Possible choices :
:
*Play word games.
*Shift the goal posts.
*Hide the Decline.
*Resort ter the memory shredder.
* Somethin’ else.
The UN-IPCC certainly has proven itself to be more chaotic than climate.
If we do start real world cooling there is going to be quite a ruckus.
So far, a period of not warming is all that we have seen.
Interesting times lie ahead.
Agree, very interesting. The 60 year (quasi) cycle is going down now and even with any longer cycle or trend in oposite direction it can only stay flat for a few decades. I expect cooling, the sun slowed down a bit.
Stephen
I don’t need to tell you what CET is currently doing. We desperately need a ‘Plan B’ for cooling, as Plan A seems out of date.
.I prepared this for my MP.
http://climatereason.com/Graphs/Graph11.png
The Govt exhibited real genius in deliberately jacking up energy prices at exactly the time that temperatures started falling.
tonyb
Now they have a better excuse for energy subsidies to the poor, paid for by raised taxes (on carbon). And of course, more bureaucracy to administer them, and make sure nobody gets energy subsidies who doesn’t really need them.
“The Govt exhibited real genius in deliberately jacking up energy prices at exactly the time that temperatures started falling.”
This is entirely typical for government and the institutions that comprise it. For just one example, take a look at central banks and their uncanny ability to buy and sell gold at precisely the wrong times. These co-called experts are so bad that they’re considered a reliable contrary indicator..
Being mostly wrong about things is of course, true as well for the public at large.
Simply from this POV, one could predict that the current global warming mania, like all manias, is a bubble ready to pop, from Beanie Babies to Tulips to Real Estate to just about any investment vehicle…or cultural expression e.g. fashions) you can name.
Hi tonyb.
I fully agree.
It’s just that I’m making my posts conservative in tone until the evidence improves.
CET (and Alaska temperatures) appear to be a highly sensitive precurser.
In both cases I think it is because each location is downwind of a large ocean area and the oceans control the trends.
Dissecting how the pause observations diverge from model predictions, and how the IPCC has tried to ignore/minimize/obfuscate the fact, informs about the untrustworthy nature of the IPCC process. But it shifts attention from a more important consequence. NASA SoC 2008 said in 2009 that 15 years hiatus would falsify climate models. Santer’s 2011 paper said 17 years. Von Storch’s new 2013 paper at academia.edu says now 98% certain the climate models are falsified.
Falsification could be because they underestimate natural variability (e.g. stadium wave). In which case they must overstate AGW because some of the 1970-2000 warming used to tune them was natural, yet was attributed to CO2. It could be because they are too sensitive (constant UTrH producing the factually missing troposphere hotspot, wrong sign for cloud feedback) by perhaps half. It is probably some of both.
No matter the underlying causes, the point is the CMIP5 models are now (if not yet definitively by all tests, at least almost certainly already by most) falsified. No one including the IPCC or any policymakers should be relying on any of the newest model predictions about the future. And that stops the whole game dead in its tracks. Points to the absurdity of Mora’s new Nature paper on 2047 ToE. All based on models, which (worse) Mora knew or should have known don’t downscale regionally, let alone to city localities as his class did.
To paraphrase Stephen Hawking’s anecdote in A Brief History of Time about the world on the back of a turtle on the back of a turtle…turtles all the way down! For CAGW it was always models all the way down.
So attempts to move the falsification goalposts to 30 years from 17 have already begun. Shoild not be allowed to happen, since it is just a question of mathematical statistics. Therein lies a different comment.
Sorry , Rud, you have omitted the most important point. Even though the models have been falsified, the warmists, the Royal Society, the American Physical Society, etc. etc. have not ADMITTED and AGREED that this is so.
So I come back to my old question “Who is going to bell the cat?”.
Jim, you make a good observation and question.
I believe our hostess is trying, with her testimony to Congress. Watts, SMc, Pielke, Goddard, Lucia, JoNova, and many others are with their blogs. Bob Tisdale, Andrew Montford, and I are with our ebooks. Let’s all pitch in in whatever ways we can. My recent post here on oysters stimulated an off line exchange which resulted in a UW blog post last week that the Seattle Times article was wrong (and linking to Climate Etc. That’s a significant, albeit small, positive step, for a tenured professor at a CAGW university hotbed.
They will continue to use their climate models until the Summary for Policymakers says otherwise.
Excellent post. Once people realize that natural variability has a role to play and that the role was not understood in the past, doesn’t it make sense that they would endeavor to shine a bright light on natural variability?
The 2005 is roughly center of the plateau. The 2016-2035 mean will be lower, at most zero.
Feeding the wishful thinkers again:
“JC summary: Sure makes the Mora et al ‘we are toast by 2047′ argument, based on climate model projections, look pretty far off the mark.”
Yes, it looks pretty far off the mark – but do we know that it IS far off the mark? Knowledge actually is what Mora’s argument is based on. Let’s not bank on wishful thoughts, please.
Mora’s arguments are based on climate models, which are shown in this post to be running too hot relative observations. This comparison with observations contains far more ‘knowledge’ than the climate models themselves (on which Mora’s arguments are based)
Is a TCR of 2C and ECS of 3C too hot?
That is the mean of all the models, right?
And this really hasn’t changed since 1979.
If CO2 growth continues at 2 PPM/year, this is what the outlook is for a TCR of 2.1C:
http://img9.imageshack.us/img9/78/efqu.gif
We really have no idea how the emissions will grow, and so that no longer remains a climatology question but an economic one.
CO2 doubling in and of itself is ~1C over dry land (MODTRAN) .
The crux of the matter is the mythical water vapor amplification which ostensibly trebles that to ~3C. If clouds produce a negative feedback, and all the evidence indicates that’s true, then there is no water vapor amplification and catastrophic global warming then becomes beneficial global warming.
Write that down.
Springer is that kooky krackpot who thinks that the oceans form a “greenhouse liquid” which traps enough of the suns rays that it will raise the temperature of the earth by 33C.
He has to keep writing that to himself because it is such a bizarre theory that even he has trouble believing in it.
WebHubTelescope: Is a TCR of 2C and ECS of 3C too hot?
That is the mean of all the models, right?
The mean of the models is definitely too high, at least if the simulations qualify as an unbiased sample from the population defined by the models. The 95% confidence interval of the mean function definitely excludes the actual trajectory.
Look as close as you want to at the following figure.
http://img51.imageshack.us/img51/645/u8hp.gif
This is a model assuming a TCR=2C, which essentially takes the CO2 as the only trend, and applies the SOI, Aerosols (large volcanic eruptions), LOD, and TSI as fluctuation terms. I refer to this as the SALT model, because of the 4 fluctuation terms.
It’s a simple R multiple linear regression algorithm
y <- GISS, etc
lm( y ~ lnCO2 + S + A + L + T)
View it and weep.
Try it and weep.
Team Denier weeps.
WebHubTelescope: It’s a simple R multiple linear regression algorithm
y <- GISS, etc
lm( y ~ lnCO2 + S + A + L + T)
Is that equal to the mean of the GCM simulations?
WebHubTelescope: http://img51.imageshack.us/img51/645/u8hp.gif
That’s a good model, another “live” model to be tested against the data of the next few decades. Does it support or discredit your time^3 model? What are the coefficients?
Ro, Ro, Ro, who’s wishfully thoughtful?
===========
” Knowledge actually is what Mora’s argument is based on. ”
Ah the hand waving. It’s become a national pastime. Content no long matters. Just keep waving the hands and flapping the gums, and hope that by some miracle you’ve actually communicated something.
“Clearly the IPCC has not been consistent in its spin, with an apparently spin free Figure 11.25 making it into the document.”
Ah a piece of the puzzle that doesn’t fit! How about instead of just jamming that piece in to fit the conspiracy theory you instead question your premise that the IPCC is spinning?
You have McIntyre casting subjective opinion about graphs to come up with “concerns” which you swallow hook line and sinker as evidence of spinning.
I bet if the draft figures and the released figures had been swapped round we’d still have skeptics finding reasons why the published versions were inferior to the draft ones.
And little mention is made of the baseline error in the original draft figure 1.4! The IPCC making a mistake in a graph which skeptics leaked and promoted – that would seem to fly in the face of conspiracy!
lolwot, “You have McIntyre casting subjective opinion about graphs to come up with “concerns” which you swallow hook line and sinker as evidence of spinning.”
She swallowed it because McIntyre is right, Mora is a crank.
Why would some mining hack like McIntyre be questioning any of this? The RCP 8.5 scenario comes about due to continued acceleration of CO2 emissions such that we will produce twice as much per year by 2050 than we do today. Since McIntyre knows all about the tar sands, as he is a mining expert, he should be telling us what the emissions of carbon will be by 2050.
Will the EROEI be so low that significant amounts of CO2 will be emitted for each barrel actually used?
If that is the case, RCP 8.5 may be the actual scenario and we will have a huge increase in CO2 even though we are not actually using that much more fossil fuels for productive use than we are today.
Ad hominem alert!
McIntyre rocks!
“Why would some mining hack like McIntyre be questioning any of this? The RCP 8.5 scenario comes about due to continued acceleration of CO2 emissions such that we will produce twice as much per year by 2050 than we do today. Since McIntyre knows all about the tar sands, as he is a mining expert, he should be telling us what the emissions of carbon will be by 2050. ”
What does tar sands have to do with global CO2 emissions?
Tar sands are in Canada, they are currently a major element of Canada’s economy, and Canada emits less CO2 than Germany, and the entire country of Canada emits less than 1/10th of China.
The primary reason China emits more CO2 than any other country in the world is because China burns far more coal than any other country in the world.
If China was using natural gas instead of coal or if China were burning the same amount of coal as the US, they would have a lower emission than the US.
But not Canada.
“Why would some mining hack like McIntyre…”
Too funny.
For gbaikie’s response and so many others, read …
http://www.nizkor.org/features/fallacies/index.html#index
Specifically for the gbaikie response concerning McIntyre (from the fallacies web site) …
“A Circumstantial ad Hominem is a fallacy in which one attempts to attack a claim by asserting that the person making the claim is making it simply out of self interest. In some cases, this fallacy involves substituting an attack on a person’s circumstances (such as the person’s religion, political affiliation, ethnic background, etc.). “
Typical member of Team Denier. Clueless.
HackIntyre should stick to mining analysis.
Maybe he could tell us how much CO2 that the tar sands in Canada will emit, both in extraction costs and end use.
Once he gets practice at that, have him look at oil shale (not shale oil, different thing) and tell us how much CO2 that will emit should we figure out how to bootstrap the process.
See Raymond Pierrehumbert, “U.S. shale oil: Are we headed to a new era of oil abundance? – Slate Magazine.” [Online]. Available: http://www.slate.com/articles/health_and_science/science/2013/02/u_s_shale_oil_are_we_headed_to_a_new_era_of_oil_abundance.html.
” WebHubTelescope (@WHUT) | October 13, 2013 at 5:34 pm |
HackIntyre should stick to mining analysis.”
He is retired.
That means he doesn’t need to work anymore.
And analyzing mining proposals would be work- though he probably liked
his job.
Wiki:
“Prior to 2003 he was an officer or director of several small public mineral exploration companies. He retired from full-time work, but still sometimes engaged in mining consultancy. He is an active squash player and once won a gold medal in the World Masters Games in squash doubles.”
http://en.wikipedia.org/wiki/Stephen_McIntyre
Ooooh, a “mining hack” eh?
It’s a good thing you don’t publish any papers Web, because if you do, the sharp eyes of the auditor will be upon you, and then you’ll find out quickly that the intrepid Canadian is no hack. Hansen found out, so did Mann, and so did Lewandowsky, and many others. McIntyre has balls of steel, and a brain that is more than adequate for teaching you a lesson or two in humility.
If McIntyre was just a hack, then why was the Hockey Team so afraid of him? And don’t kid yourself, they were very afraid of him. It’s documented fact, so don’t bother arguing.
You just lost a lot of credibility with me because of that “hack” comment. pally. You showed what you’re really about, and it ain’t science.
IIRC, McIntyre got into this because of the Hockey Stick.
In a prospectus for a mining operation as in many other investments it is a flaming red flag for malfeasance. The real world doesn’t normally produce hockey sticks.
You wish you had the math ability to carry his water. His CV looks pretty solid. Better simply saying he has his opinion. Forget such a bereft insult.
Heh, think where we’d be if he’d stuck to mining analysis. And you think we’re bewildered now.
==========================================
WebHubTelescope: Why would some mining hack like McIntyre be questioning any of this?
Why? Because he is a good statistician. He has found significant shortcomings in some of the reported “evidence”. Perfect? I wouldn’t know, but his record is pretty good.
You never deal in substance. You always are talking about opinion’s on changes in a graph or some such. The spaghetti graph in itself is totally objectionable. If you disagree, give us a definitive statement of what it conveys to the public. It is wholly unintelligible.
But that’s all this is, opinions on graphs. That’s my argument.
If skeptics object to a graph then by definition it becomes “objectionable”.
Skeptics didn’t object to the draft figure 1.4. Even with the error pointed out, we don’t see skeptics objecting to it, rather they seem to be lamenting it’s passing.
The criterion seems to be:
Does it look like this graph supports my argument?
If not, then it’s an objectionable graph so lets find all the imperfections in it and raise them as “concerns”.
Insert Big Concerned Face In Public. Shake Head Sorrowfully. Wail About Science.
It’s a biased process because with scrutiny such “concerns” could be found with any graph. No graph containing a complex set of data will be perfect. There’s no control case because skeptics aren’t interested in expending the same effort on “non-objectionable” graphs.
Eg Judith just says “The top panel seems a much more honest comparison”. No skeptic is going to bother scrutinizing that.
Son, my question was what does the graph say? If you decline to attempt an answer, please say so.
Judith Curry, hinging your summary upon a cherry-picked “quotation” that is inaccurate and/or incomplete and/or out-of-context shows questionable judgment. What is the full Mora quotation to which you refer, and what is its context?
Couldn’t you at least show Prof. Mora sufficient respect to at least cite the *title* of the work in question, namely “The projected timing of climate departure from recent variability“?
This regrettable imprecision obscures the *main* element of spin in your summary, which is its implicit, never-justified, cut-off of the year year 2050. Is the world going to end in 2050? If not, should we consider longer-term consequences of AGW, as indicated by “the best available climate science“?“?
Don’t scientists and policy-makers and citizens and grandparents jointly share in a professional, social, moral, and familial responsibility to do consider longer time-frames? … and don’t energy-balance principles and paleo-science *both* tell us that our predictions become *more* reliable on longer time-frames?
The Key Question A key question in climate-change science is this: By appropriate adjustment of physical parameters, can mechanistic climate models exhibit stadium waves of sufficient amplitude and duration as to substantially modify long-term IPCC5 predictions?
If “yes”, then recent Wyatt/Curry work is seminal … otherwise not.
Conclusion Skeptical energies are far better applied to the crucial and concrete long-term scientific challenge of distilling stadium wave dynamics from computational climate models than to the irrelevant and short-term non-challenge of cherry-picking contentious climate-change “quotations.”
a fan of *MORE* discourse: Skeptical energies are far better applied to the crucial and concrete long-term scientific challenge of distilling stadium wave dynamics from computational climate models than to the irrelevant and short-term non-challenge of cherry-picking contentious climate-change “quotations.”
I think that you have posed a false choice. Surely there will be skeptical and other challenges to the Wyatt/Curry “stadium wave” results: not least, we shall be watching to see whether the extrapolation into the future is matched by future data, which would provide more support for the idea that the stadium wave is a real process. That idea has already been expressed. What exactly is your objection to Prof Curry’s comment about the Mora et al I missed: any more than that she didn’t quote the title?
Fan, “Couldn’t you at least show Prof. Mora sufficient respect to at least cite the *title* of the work in question, namely “The projected timing of climate departure from recent variability“?
Do you seriously expect Judith Curry to respect Mora after he says the world is going to end in a few decades. He’s a crank, of the Ehrlich,Hansen variety.
Denialist cognition and smears by Bob, links by FOMD.
Bob, thank you for providing Climate Etc readers with a concise, factually incorrect, unreasoned, ideology-driven, demagogic example of denialist cognition.
Your many examples are greatly appreciated, Bob!
Fanny, OK, 2047. Is that better. Fan, why don’t you take a few minutes and tell us how Ehrlich’s and Hanson’s predictions fared.
Erlich (and coauthors) predict what economies/politicians/people will do, whereas Hansen (and coauthors) predict what climate will do … the latter being far easier than the former!
Those 1981 thermodynamics-driven predictions still look pretty darn good, eh Bob?
As for the harder question regarding the implications of climate-change for sustainment, you’ll have to ask this guy!
Bob, your continuing thirst for foresighted scientific understanding is wholly commendable!
Well Fanny, any objective observer would note that Ehrlich and Hansen have failed on a grand scale. I would never expect you to notice, however.
Eh Fanny, did you happen to notice the slope of the Arctic sea ice recovery. Pretty impressive.. By the way what did Senor Gore predict?
http://www.ijis.iarc.uaf.edu/en/home/seaice_extent.htm
“anthropogenic carbon dioxide warming should emerge from the noise level of natural climate variability by the end of the century”
Check.
“and there is a high probability of warming in the 1980′s.”
Check.
“Potential effects on climate in the 21st century include the creation of drought-prone regions in North America and central Asia as part of a shifting of climatic zones”
Unsure
“, erosion of the West Antarctic ice sheet with a consequent worldwide rise in sea level,”
Check
“and opening of the fabled Northwest Passage.”
Check
4 (+?) out of 5 for Hansen!
lolwot,
“anthropogenic carbon dioxide warming should emerge from the noise level of natural climate variability by the end of the century”
Fail, no warming for 17 years. Previous warming natural, not man-made
“Potential effects on climate in the 21st century include the creation of drought-prone regions in North America and central Asia as part of a shifting of climatic zones”
Fail- all natural and expected.
“, erosion of the West Antarctic ice sheet with a consequent worldwide rise in sea level,”
Total fail. Steig refuted.
“and opening of the fabled Northwest Passage.”
Fail, all ships blocked by massive ice.
Bob – “…did you happen to notice the slope of the Arctic sea ice recovery.”
Yeah, even bigger than the 1996 recovery, and that was a whopper.
Bob
“Fail, no warming for 17 years. Previous warming natural, not man-made”
Wrong, the trend over the last 17 years is upwards. Most of the recent warming is due to greenhouse gas emissions (see Xie et al for one of many examples).
“Total fail. Steig refuted.”
Wrong again, the west Antarctic ice sheet is losing mass and contributing to sea level rise.
“Fail, all ships blocked by massive ice.”
Wrong, the Northwest passage has opened several times in recent years.
I noticed you also abstained from denying Hansen’s correct prediction of warming in the 80s.
Failure as far as the eye can see.
lolwot -fails to understand data
FOMD- fails to take meds
Joshua – failure to understand rudimentary science
Webby – fail to be objective
Gore – massive failure on every prediction
Mann- failure to understand stats 101
Marcott – failure to understand stats
Gergis – failed at everything
Karoly – failure at scientific mentor-ship
Mandia – failed at Superman impersonation
Schmidt – failed at debate with Spencer, and many others.
Jones – failed at excel
Pachuri – total failure
IPCC – failed at politics and science
Dessler and Lacis – failed at CO2 control knob
Biddle, did you look at the recent jaxa data?
Sure Bob, everyone else is wrong and you are right. What are the chances!
According to you Hansen’s prediction that the Northwest Passage would open failed!
Even though it did open in 2007 and 2008 according to scientific sources. But they must be wrong too huh Bob?
Bob –“Biddle, did you look at the recent jaxa data?”
Yeah, same data as on my link. And it’s getting colder here in the mountains, too.
“He’s a crank, of the Ehrlich,Hansen, FOMTrolling variety.”
Yes, FOMTrolling, YOU are a crank. And it’s not name calling, it’s from experience with your arguments, links, and your agenda. They have been weighed, they have been measured, and they have been found wanting. Sorely wanting.
Happy to have increased your self knowledge!
My list :
Bob — the knob
http://neverendingaudit.tumblr.com/post/27981918010
A fan of *MORE* discourse: Potential effects on climate in the 21st century include the creation of drought-prone regions in North America and central Asia as part of a shifting of climatic zones, erosion of the West Antarctic ice sheet with a consequent worldwide rise in sea level, and opening of the fabled Northwest Passage.”
To date, those actually are not faring well.
Climate models predict what climate modelists want them to predict. A linear equation and different RCP scenarios leave no discussion.
Other thing is wherther these predictions have any correlation with statistical climatic parameters or not. For a definitive knowledge on climatic parameter’s correlation we will have to wait some centuries. More info in my “Refuting IPCC’s claims on climate change”, placed in:
https://docs.google.com/file/d/0B4r_7eooq1u2VHpYemRBV3FQRjA
15 years is 1.5 solar cycles and is a particularly bad choice of averaging period unless you want to see the solar fluctuations which are not small, but it seems the decline at end could be solar.
There is a seminal paper out there, relating to the inability of computational climate models to conform to reality. Their general failure to capture a basic symmetry observed in the climate system strongly indicates missing physics, which is a much more serious issue, than measurements running a bit low relative to predictions or the somewhat controversial lack of a tropical hot spot.
Short wave albedo of Earth is clearly regulated in some, as yet unknown way. Until this process is uncovered and incorporated into computational models, they are good for nothing.
My first guess is, by the way, that the observed close match between albedoes of the Northern and Southern hemispheres is only a secondary effect, the root cause being regulation of entropy production rate in the climate system. For the overwhelming majority of entropy production occurs when incoming shortwave radiation is absorbed and gets thermalized, therefore a cross hemispheric balance of entropy production implies similar albedoes.
Journal of Climate, Volume 26, Issue 2 (January 2013)
doi: 10.1175/JCLI-D-12-00132.1
The Observed Hemispheric Symmetry in Reflected Shortwave Irradiance
Aiko Voigt, Bjorn Stevens, Jürgen Bader and Thorsten Mauritsen
Herewith an alternate model of climate change, for your comments.
“Man-made” climate change did occur during the mid 1970’s-1990’s, but the warming had nothing to with carbon or greenhouse gas accumulations. All of the warming that occurred was a “side-effect” of the Clean Air Act of 1970 (and its amendments), and other international efforts to reduce air pollution..
Just as the planetary cooling that occurs when a large volcano erupts ends after the pollution has settled out, warming will naturally occur as other atmospheric pollutants are removed. As the Clean Air Act was implemented, temperatures rose–as they had to –but the cause was wrongly attributed to CO2 and other greenhouse gasses, rather than simply to cleaner, more transparent air (fewer aerosols).
Today’s somewhat elevated temperatures mirror those of the 1930’s, which were also due to cleaner air (due to the large reduction in industrial activity, etc. during the Great Depression). Again, no CO2 effect.
The current 15 year “pause” in warming may represent a plateau in temperature increase due to various feedback effects, or it may be that continuing efforts to reduce air pollution are being offset by the massive pollution from China and India.
It is likely that future average global temperature increases will occur only as additional cleansing of the air happens.
For a supporting view of the above, Google “Shocker: Global Warming may simply be an artifact of clean air” AIP Conference Proceedings 1527, pp 579-82 August 2013
“(i.e., the models do not statistically capture reality as represented by the observations).”
The IPCC should stop trying to paint a more favorable view of their models and admit that they are largely useless. The first thing a modeller should do before writing a line of computer code, is produce a theoretical model that fits the facts. I have done that, underlined above, and I commend that approach to modelers. It is essential from the start to understand the many ways that the CO2 molecule can absorb so much heat and how that capability can be turned on and off. Classic thermodynamics is not enough and Quantum theory helps here.Perhaps it is not so much physics that matters, but the structure of the modelling groups,
climate plague affecting every living thing’ — AP: ‘Temps Go Off the Charts Around 2047′
Makin’ It Up: UN IPCC lead author John Broome slams IPCC’s trillion-ton carbon budget as number ‘plucked from nowhere’ & 2-degree temp limit as ‘pulled out of the air’
Those Stubborn Facts: Actual Climate Evidence Again Refutes IPCC’s Claim Modern Temperatures Are “Unprecedented”
Shock News: No Current School Child Has Ever Seen Any Global Warming
Washington Post warmist Michael Gerson: “Time scales that environmental advocates once touted as significant are now dismissed as irrelevant”
Cook’s 97% consensus claim: standing on its last legs
James Delingpole: ‘The Climate Alarmists Have Lost the Debate’
New paper finds natural ocean oscillations control Northern Hemisphere temperatures 15-20 years in advance — Published in Geophysical Research Letters
Tornadoes Numbers Remain At Near Record Lows Through September
52% Growth In Arctic Sea Ice Since This Date Last Year
Gore blames the media for not getting the publicity he was used to
WSJ Op-Ed: We have to kill eagles with wind turbines in order to save them
Preempting warmist claims of global warming: Prof. Roger Pielke Jr.: ‘In case you’re curious about N. Indian cyclones ‘no trend towards an increase in the number of categories 3–5 cyclones over the last 30 yrs’
New paper finds no evidence of AGW in West Antarctica — Published in Geophysical Research Letters
New paper finds SW Pacific Ocean surface temperatures were about the same as today, ~200,000 years ago — Published in Quaternary Research
Chylek et al 2013 shows a linkage between US Southwest climate and AMO/PDO cycles
The Author(s) 2013. This article is published with open access at Springerlink.com Paper: Chylek et all ClimDyn_US_SW (PDF)
All the ”climate models” on the catwalk suffer from obesity
“climate plague affecting every living thing’ — AP: ‘Temps Go Off the Charts Around 2047′
Hope I make it. I’d be 96. Presumably like the temperature. (not)
I’m hoping you make it pokerguy!
Alexander Biggs: “The first thing a modeller should do before writing a line of computer code, is produce a theoretical model that fits the facts.”
Dude, that’s exactly what climate modelers do …
Climate models are a representation of our understanding of physics.
And if climate models were really as useless as you claim, don’t you think that would have come to the attention of the climate modelers too??? You have to have some trust that these people do their jobs, just like you and I do our jobs (I presume …).
You can’t just arrogantly second guess them.
Well, I haven’t read enough of you to be sure, but I’ve just got to say, RO, that is marvelous parody.
==========
Retrograde Orbit: Remember? “the science was settled” or that was what the modellers were told to assume. They were not doing a scientific research project.
My advice cones from my own experience developing complex models of missile systems long before analogue and digital computers existed that could run them. One result of that work is that the total amount of CO2 in the atmosphere is unimportant to climate, What is important is the proportion of new, hot CO2 in the atmosphere.
I know how to analyze data and computer output and I can easily tell that when they don’t agree, it is the computer output that is wrong and not the actual real data. I would never trust someone who produces bad computer output and then does tricks with the real data to make the computer output look less bad.
You have to have some trust that these people do their jobs, just like you and I do our jobs (I presume …).
You can’t just arrogantly second guess them.
I did not have a job where one could say what was going to happen and it did not happen and everyone trusted them anyway.
We were supposed to and did second guess everyone and every thing and that is how you make sure the so called experts have not made yet another mistake.
You must be skeptical of these people. You can and should look at the actual data and figure out what it does show and not blindly follow others who claim to know everything, but still cannot make skillful forecasts.
Climate People tell us, over and over and over, that they are not Skeptical.
Over and over and over, I tell you that you must be skeptical to be a scientist.
You must be skeptical and you must second guess everyone on important issues.
You have to have some trust that these people do their jobs,
“Science is the belief in the ignorance of experts.” –Richard Feynman
Sometimes, a good quote is all you need.
It seems IPCC hasn’t improved since AR4. The three extracts show IPCC distortions, cheating, misrepresentations, making stuff up and changing approved text and figures after the third round of reviews was completed and closed. Conclusion: IPCC is pretty dodgy. Thank heavens for the skeptics who are doing what real scientists should be doing, eh?
The foundation was way too small and really wouldn’t have supported a small shack so the entire building project was scrapped. HOWEVER, I would like to have an in-depth and intelligent argument that the wood trim on the North-South hallway on the East side of the building’s 82nd floor should have been painted a lighter shade of ivory.
The original theory that all of this was based on, the model that CO2 produced a greenhouse effect, was wrong from the start. Why not address this first instead of wasting brain power on articles that assume it was correct?
I have attended a lot of lectures from people on different sides.
I am convinced that CO2 has a greenhouse effect.
CO2 is a trace gas and manmade CO2 is a fraction of that.
The Greenhouse effect of CO2 is so small that it cannot be measured or verified. The manmade part of that effect is in the noise in the noise.
The greenhouse effect is the property of glass to let through high energy short wave radiation and to trap longer wave radiation. It is mostly transparent in the visible spectrum and mostly opaque in the infrared. It’s why your car is hotter inside than outside on a sunny day. There is no extra energy, just more sensible heat.
Carbon compounds in the atmosphere can and do absorb and reemit long wave radiation, some of which is directed back toward the earth. This, however, is one simple aspect of an extremely complicated system. Carbon also absorbs short wave radiation directly and reemits it in the IR in all directions keeping the system in equilibrium as some of the radiation never makes it to earth. Carbon compounds also absorb heat during this process. Hot air rises and cools. Hotter air rises more rapidly.
If you know of experiments that fully take into account all of the relevant factors but still show a net increase of energy in the biosphere I would be grateful if you would share it with me. Observations of atmospheric temperature gradients have not changed with the increase of CO2 as the greenhouse models predicted.
The spaghetti graph ploy is intended to give the visual impression that their entire spread is equally plausible. But the lower edges are filled with a variety of wildly variable traces, like the rest of the mess. Averaging them is of course invalid, too, as it implies/requires averaging their assumptions and parameters.
If only the closest to reality/best models were kept and refined, they might eventually evidence some skill. None of the spaghetti strands currently qualifies.
Can someone please explain how it is even remotely scientific to do the following: “after the upper and lower bounds are reduced by 10% to take into account the evidence noted under point (5) that some models may be too sensitive to anthropogenic forcing. “? Doesn’t this translate to
our models suck so we are going to change their answers. Excuse me, if the models are to sensitive to the A-forcings then turn then down in the model, you just can’t reduce everyting 10% because we want it to match reality better, then it just become curving fitting with no attempt at theoretical understanding!
A GCM is a multi-million dollar generator of curves showing exponential growth with random variation.. The mere fact that each model produces different output means the science is uncertain. Run the models for thousands of year projections and you will see just what is under the hood – a morass of interdependent parameters that add up to exponential growth under any conditions.
But if your shooting looks like a shotgun spray, it is likely that something will hit the target.
Comparisons need to be done with the business as usual anthropogenic forcing as opposed to forcing reductions that didn’t happen. That would clear out the chaff. Then a separate subset of these models that were relied on for policy….since they are undoubtedly very wrong indeed and yet policy remains unchanged.
“The red box in the middle panel, which implies a lowering of their projections relative to the climate models, seems a tacit admission that their model projections of actual climate variability and change are highly uncertain.”
Actually that red box needs to be inverted in order to show the greater probability of ongoing slight cooling until the year 2028 at least. Did they forget that the natural 60 year cycle is now cooling, even though the long term one has about half a degree of warming over the next 100 years or so, before 500 years of cooling sets in?
Did they forget that water vapour and other radiating gases reduce the thermal gradient in the troposphere, meaning that the supported surface temperatures are lower, as real world empirical data confirms here?
.
(continued)
Did they forget that the thermal gradient developed in the huge force field in a Ranque-Hilsch vortex tube now confirms that Dr Hans Jelbring was right in his paper published in Energy & Environment · Vol. 14, Nos. 2 & 3, 2003 and so the gravito-thermal effect is a reality?
So as BigWaveDave said …
“Because the import of the consequence of the radial temperature gradient created by pressurizing a spherical body of gas by gravity, from the inside only, is that it obviates the need for concern over GHG’s. And, because this is based on long established fundamental principles that were apparently forgotten or never learned by many PhD’s, it is not something that can be left as an acceptable disagreement.“
We are now handing out 40 bitcoins to the fortunate winner of a internet site owner with the chosen prize code.
The final results would be out in 4-weeks time. Your own prize code is: BHCFW3