
by Javier Vinós and Andy May
“Probably no subfield of meteorology has had as much effort devoted to it as the effects of solar variability on weather and climate. And none has had as little to show for the research labor.” Helmut E. Landsberg (1982)
1.1 Introduction
The sun has been identified as the source of climate since the dawn of human intelligence, and consequently the sun was worshipped in many ancient cultures. Large sunspots are visible with the naked eye when the sun is low on the horizon and partially obscured by dust or smoke. Several myths and iconography suggest sunspots were known to ancient cultures from America, Africa, and Asia; however, the first written mention of a sunspot comes from Theophrastus’ De Signis Tespestatum c. 325 BC. This first written record of solar variability was already linked to a climatic effect, as Theophrastus mentions its association to rain. Theophrastus is considered the father of botany and was the student of Aristotle that succeeded him as the head of the Lyceum when Aristotle, teacher of Alexander the Great, had to flee Athens due to anti-Macedonian sentiment. Theophrastus mention in passing of sunspots must have referred to common knowledge from the past, since he lived through the Greek grand solar minimum of 390–310 BC (Usoskin 2017) and it is very unlikely that anybody at that time could have seen a sunspot with their naked eyes. Most naked-eye sunspot observations known to us come from China, where records have been found starting from 165 BC. The oldest known drawing of actual sunspots is from the Chronicon ex chronicis by John of Worcester, dated in the manuscript to December 1128, during the Medieval grand maximum in solar activity.
Aurorae are an atmospheric light phenomenon that results from the interaction of solar wind and the geomagnetic field, usually produced between 10-20° from the geomagnetic poles. Aurora is the Roman goddess of the dawn, sibling of Sol and Luna. Every morning she would open the gates of heaven for the sun to rise and then race across the early morning sky in her chariot to alert of a new day. The name aurora borealis was given to the atmospheric phenomenon by Galileo in 1619, indicating its northern (boreal) direction. Aurorae are occasionally seen in mid-latitudes and rarely in low latitudes, when a geomagnetic storm temporarily enlarges the auroral oval. Aurorae have been observed since antiquity. The first records of aurora appear to be three Assyrian clay tablets c. 660 BC (Hayakawa et al. 2019). The prophet Ezekiel also recorded an aurora c. 593 BC in the Bible, and Aristotle wrote about aurorae in his treatise Meteorologica in 340 BC. However, the association of aurorae to solar activity was impossible to make until the arrival of modern science. Anders Celsius was the first to propose that aurorae were linked to the Earth’s magnetic field in 1733, but the solar link had to wait until the Carrington event of 1859, when the solar flare detected by Richard Carrington and Richard Hodgson that caused a great geomagnetic perturbation was followed by the most intense and lowest latitude reaching aurora in recorded history. Aurorae historic records since antiquity are used, together with naked-eye historic sunspot records, to study past solar activity.
The invention of the telescope in 1608 was soon followed by multiple sunspot telescopic observations. The first records correspond to Thomas Harriot in 1610, and the first publication to Johannes Fabricius in 1611 (Vázquez & Vaquero 2009). Galileo Galilei and Christoph Scheiner carried out systematic sunspot observations in 1612, both realizing they were never far from the solar equator and rotated with the sun. Telescopic sunspot observations arrived just in time to register the Maunder grand solar minimum (GSM) from about 1645 to 1715. No other GSM has taken place since, as the Dalton Minimum was not a GSM (Usoskin 2017).
At least one variable star was known to the ancient Egyptians three millennia ago. There is now evidence that the Cairo Calendar, dated 1244–1163 BC, records, as lucky and unlucky days, the period of the eclipsing binary star Algol, associated with the Egyptian god Horus (Jetsu & Porceddu 2015). Algol was the second variable star described by modern astronomers in 1669. It was preceded by the discovery that Mira was pulsating with an 11-month period by Johannes Holwarda in 1638. The number of known variable stars grew slowly until c. 1850 when it accelerated, and particularly since the introduction of astrophotography in the 1880s. The 2017 General Catalog of Variable Stars (version GCVS 5.1) contains data for 52,011 variable stars. The sun is currently considered a variable star with a very slight variation of one milli-magnitude. Over 80% of sun-like stars display a variability like the sun (Connolly et al. 2021).
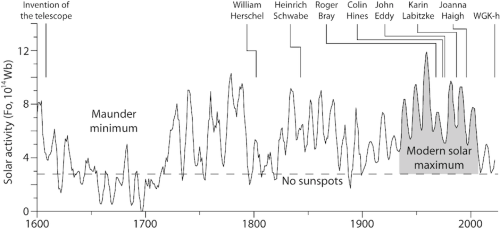
Fig. 1.1. Sun-climate historic landmarks.
Solar activity since 1600 after Usoskin et al. 2021 (Fig. 8), and Wu et al. 2018 for the 20th century, in open solar flux Weber units. Some landmarks in the study of the sun-climate effect are indicated. 1608, invention of telescope. 1801, Herschel sunspots-climate hypothesis. 1843, discovery of the solar cycle by Heinrich Schwabe. 1968, Roger Bray discovery of the 2500-year solar activity cycle associated with a 2500-year climate cycle. 1974, Colin Hines proposes a sun-climate mechanism mediated by planetary waves. 1976, John Eddy landmark article on the Maunder Minimum. 1986, Karin Labitzke discovery of the first solid sun-climate effect in the polar atmosphere during winters. 1996, Joanna Haigh proposal of the “top-down” sun-climate mechanism. 2022, proposal of the “Winter Gatekeeper” sun-climate mechanism hypothesis.
1.2 William Herschel, Heinrich Schwabe and the early sun-climate frenzy
With the advent of the telescope and the interest in sunspots there came speculation that changes in sunspot number and changes in weather were related, as Theophrastus suggested in 325 BC. Italian Jesuit astronomer Giambattista Riccioli and Mexican astronomer José Antonio Alzate made the same suggestion in 1651 and 1784 respectively.
Musician, composer, mathematician, astronomer, and the best telescope builder of his time, the discoverer of Uranus and infrared radiation, William Herschel was the first to propose that the sun was a variable star and sunspots reflected changes in solar activity that had an effect on climate. In an article presented in 1801 at the Royal Society he said:
“I am now much inclined to believe that … [abundant sunspots], may lead us to expect a copious emission of heat, and therefore mild seasons. And that on the contrary, … the absence of … [sunspots], will denote a spare emission of heat, may induce us to expect severe seasons” (Herschel 1801).
It is interesting that Herschel was also the first to correctly relate more sunspots to higher solar emissions, unlike all previous observers and nearly all that followed him until the 20th century. He then proceeded to relate the price of wheat since 1650, obtained from Adam Smith’s The Wealth of Nations, to early sunspot accounts, finding a correspondence. Herschel proposition of this correspondence is likely incorrect. He himself warned that the criterion was probably not real since the price of commodities is also regulated by their demand, but the lack of temperature records left him with no other method. Figure 1.2 shows that grain production is a better choice, as it would be expected. The great mortality from the 1317 famine and the Black Death from 1346 that killed one third of the European population resulted in decreased demand that kept grain prices low despite the fall in production during the Spörer Minimum c. 1400-1500.
Herschel’s sun-climate proposal was met with derision. Lord Brougham scoffed and called it “a grand absurdity” and went on to say that “since the publication of Gulliver’s voyage to Laputa, nothing so ridiculous has ever been offered to the world” (Edinburgh Review 1803).
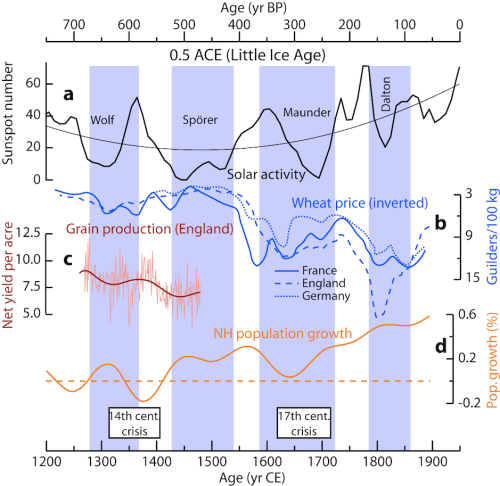
Fig. 1.2. The effect of Little Ice Age climate changes on human societies of Europe.
a) Solar activity reconstruction shows the Wolf, Spörer, Maunder, and Dalton solar minima. After Wu et al. (2018). The quadratic regression (thin line) follows the long-term change in solar activity. b) Wheat price in Dutch guilders per 100 kg (inverted), for France (continuous line), England (dashed line) and Germany (dotted line). After Lamb (1995). c) Three main crops of grain net yield per acre in England, with annual data (thin line), and long-term trend (thick line). After Campbell & Ó Gráda (2011). d) Northern Hemisphere population growth in %. After Zhang et al. (2011). Boxes at bottom identified the periods considered as the 14th and 17th century crisis by historians. Vertical bars (ACE, abrupt climate event) are periods of climate deterioration. After Vinós (2022).
Herschel’s detailed solar observations might have revealed the 11-yr solar cycle, except they took place during the Dalton Minimum. That discovery had to await Heinrich Schwabe who was looking for a hypothetical planet inside the orbit of Mercury, called Vulcan, proposed by many astronomers at the time. For 17 years (only one and half periods!) he made detailed solar observations trying to distinguish a transit of Vulcan among the sunspots. He was publishing his solar observations every year, and in 1843 he reported:
“From my earlier observations, which I have reported every year in this journal, it appears that there is a certain periodicity in the appearance of sunspots and this theory seems more and more probable from the results of this year. … If one compares the number of groups with the number of days when no spots are visible, one will find that sunspots have a period of about 10 years, and that for five years of this period they appear so frequently that during that time there are very few or no days when no spots at all are visible” (Schwabe 1843).
Schwabe’s idea attracted little attention until the inclusion of his sunspot data in Alexander von Humboldt’s 1851 monumental work Kosmos. Then four astronomers, including Rudolf Wolf, director of the Bern observatory, noticed that periodic changes in the small daily fluctuations in the geomagnetic field corresponded in period and epoch, with the sunspot cycle described by Schwabe. Rudolf Wolf then began a systematic study of solar variations giving rise to the sunspot record. Heinrich Schwabe, despite not finding Vulcan (it is in the 40 Eridani triple star system, according to Star Trek), was awarded the Gold Medal of the Royal Astronomical Society in 1857.
The discovery of the solar cycle triggered a frenzy to find 11-year periodicities in any weather record. In the 1860s only three articles were published about the sun-climate connection. The next decade they were more than a hundred (Hoyt & Schatten 1997), and in the following decades they continued to multiply. In 1958 the American Meteorological Society listed 1278 articles on solar-weather relationships in its bibliography. Most of the sun-climate studies between 1870 and 1920 agreed that there was a negative correlation between sunspots and temperatures in most locations where a good correlation could be found.
From this period the studies by Wladimir Köppen stand out. Köppen stablished a climate classification system still in use, and made substantial contributions to several branches of science. He was one of the foremost climate scientists of his time and, with his son-in-law Alfred Wegener, lent crucial support to the Milankovitch theory. Köppen sun-climate studies were rigorous. His 1873 article about the eleven-year period of temperature was the most comprehensive to that time and he published an update in 1914. He concluded that the sun does indeed cause a periodicity in the Earth’s surface temperature, not only in many locations but also on a hemispheric and global scale. At that time, the small changes in CO2 levels could not have been the cause of the climate changes detected by Köppen.
At the turn of the century the consensus was that there was no doubt that the 11 and 22-year solar cycles negatively correlated with surface temperature at most locations and even hemispherically and globally, showing a positive correlation with precipitation at low and high latitudes and a negative one at mid-latitudes. In 1903 Nordmann stated: “The mean terrestrial temperature exhibits a period sensibly equal to that of the solar spots; the effect of spots is to diminish the mean terrestrial temperature, that is to say, the curve which represents the variations of this is parallel to the inverse curve of the frequency of solar spots.” (Hoyt & Schatten 1997).
1.3 The solar constant and the subfield discredit
The amount of solar energy arriving to the Earth, or total solar irradiance (TSI), started to be measured with the invention of the pyrheliometer by Claude Poillet in 1837. The accuracy of the data during the 19th century was poor due to the unreliability of the early instruments and the lack of proper standardization in the early measurements. Despite these shortcomings, astrophysicists of the time noticed that variations in TSI ought to be very small, giving birth to the concept of the solar constant. In 1878 Samuel Langley invented the bolometer and in 1890 he became director of the Smithsonian Astrophysical Observatory. With the help of Charles Abbot, who succeeded him in 1906, they set up a program to determine solar constant variations with stations located at mountain peaks in the US and Chile. Data from 1923 to 1954 showed small variations associated to the solar cycle of 0.02–0.25% and a controversial increase of 0.2% during the 31-year period. Charles Abbot was convinced of the sun-climate connection, and after the end of the program he wrote in the first issue of the now called Solar Energy Journal that: “As solar radiation and the weather appear to be affected by identical periods of variation, it is therefore likely that weather changes are produced by solar variation.” He then proceeded to compare solar forecasts for precipitation and temperature at St. Louis and Peoria with actual weather data from 1854 to 1939, as evidence of his thesis (Abbot 1957). Nevertheless, he acknowledged the difficulty of attributing significant weather changes to such small variations in the solar constant, recognizing that the general opinion was against his hypothesis.
The consensus of the time had changed from supporting the sun-climate connection at the beginning of the 20th century to rejecting it by mid-century. The change did not happen because of a better determination of the solar constant, that at the time could still accommodate significant variability, but by something that happened around 1920. All those statistically significant correlations that the best scientists of the time, like Wladimir Köppen, had found in about seven decades of weather data (c. 1840–1910), started to fail around 1920, or even worse they inverted, something that nobody could explain. The situation became very confusing, some authors claiming positive correlation, others negative correlation, and others no correlation at all. Elaborate hypotheses were proposed, indicating a troubled paradigm, and the whole subfield fell into disrepute. By 1950 the study of sun-weather relationships was considered by many to be an undignified pursuit for a meteorologist (Hoyt & Schatten 1997), and this state was recognized by Abbot in his 1957 article.
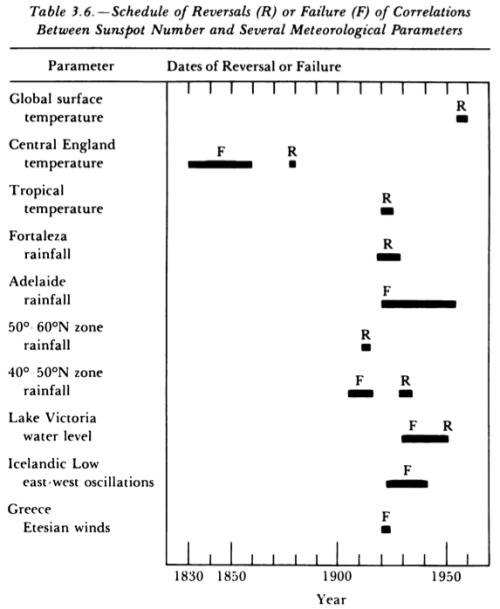
Fig. 1.3. Graph of some correlation reversals (R) and failures (F) for selected meteorological variables and sunspots. From Herman & Goldberg 1978.
The timing of the sign reversal in several sun-climate correlations tended to cluster between 1920–30 (Fig. 1.3). Temperature correlation inverted, as well as many other meteorological variables, like precipitation, winds, the preferential location of the Icelandic low, and the strength of the Indian monsoon. Even though the sign reversals could not be explained, they still suggested a sun-climate relationship, just not one based on TSI changes, since the relationship between solar emissions and sunspot activity does not invert. This important conclusion escaped most climate researchers at the time and it escapes many of them today. In the early 20th century, climate shifts were unknown, but it is known today that c. 1924 a regime change took place in the Pacific from a cool Pacific Decadal Oscillation to a warm one (Mantua & Hare 2002). This shift took place right after the 1923 solar minimum, and resulted in global warming (the early 20th century warming), despite solar activity being below average until 1934.
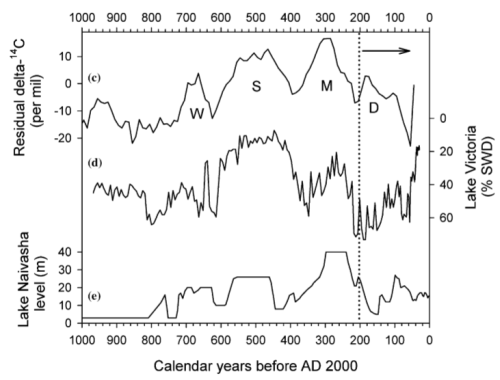
Fig. 1.4. A sun-precipitation correlation reversal c. 1800 reported in 2005.
c) Change in atmospheric 14C as inverse indicator of solar activity. W, S, M, D, correspond to the Wolf, Spörer, Maunder and Dalton minima. d) Lake Victoria levels inferred from shallow-water diatoms (SWD) in a core. e) Lake Naivasha (Kenya) levels in meters. Dotted vertical line and arrow mark a sun–climate reversal during the Dalton sunspot minimum. From Stager et al. 2005.
According to Hoyt and Schatten (1997) the sun-temperature correlations have changed sign several times during the past 400 years and have been negative between about 1600-1720 and 1800-1920, and positive between about 1720-1800 and 1920 and the present. The 1800 reversal is illustrated in figure 1.4.
1.4 Roger Bray, John Eddy and the 1970s revival
While the sun-climate subfield was falling into disrepute, the seeds for its renaissance were being planted. Andrew Douglass was an astronomer that had been fired by Percival Lowell in 1901 for his skepticism about the artificial nature of Martian canals. Through his entire career Douglass was convinced of the sun-climate effect, and in 1904 he noticed a correlation between tree-ring widths in Arizona, related to precipitation conditions, and sunspots. By pursuing this relationship, he developed the new subfield of dendrochronology over the following 40 years, the only precise method for dating ancient structures until the advent of radiocarbon dating. Douglass studied the annual rings of trees in relation to climate and solar activity and was the discoverer of the centennial solar cycle (named by him as the triple-triple solar cycle). He did not find it in sunspot records, but in its climatic effect on sequoia ring-growth (Douglass 2019). It is the only instance of a solar cycle first identified in the paleoclimate record.
Willard Libby developed radiocarbon dating in the late 1940s. For the method to be accurate it was essential to know how the atmospheric 14C/12C ratio had changed over time. Scientists had to build a calibration curve (IntCal) from precisely dated tree rings by Douglass’ dendrochronological method, to transform radiocarbon ratios into calendar ages. Hans Suess in California and Minze Stuiver in Arizona were among those leading the effort. In 1961, Stuiver was the first to suggest that atmospheric 14C variations lasting a few centuries or less were due to solar modulation of cosmic ray 14C production in the upper atmosphere (Stuiver & Quay 1980). Suddenly the sun appeared to be more variable over long periods of time than recent solar constant measurements indicated.
This finding opened the door to using the recently reconstructed 14C changes to study solar variability and its relationship to climatic changes in the distant past. Starting in 1963, and based on his glaciological and botanical studies, Roger Bray proposed that there was a close relation between solar activity and climate during the past centuries and millennia. In 1968 he identified the solar and climate 2500-year cycle that has been recently named after him (Vinós 2016). This long solar cycle is the most important, in terms of climatic effect, during the Holocene. The most recent low in Bray’s solar cycle, during 1388–1834 (Bray 1968), coincided with the Little Ice Age (LIA) discovered by François Matthes in 1939. Roger Bray first proposed that the LIA had a solar cause. During the 1960s and 1970s Roger Bray published 14 articles in Nature and Science linking solar variability and volcanic activity to climate change, but as he was a botanist researching climate independently from New Zealand and removed from other sun-climate scientists, he was not credited for his findings unjustly. His cycle was given the absurd “Hallstatt” name by Paul Damon and Charles Sonnet (Damon & Sonnet 1991), despite being aware of Bray’s work.
In 1974 Robert Currie published a study of 226 weather stations throughout the world, that in 1993 was updated using 1,200 U.S. stations. Using new statistical methods just developed, he found both a 10.5 solar and an 18.9 lunar signal in many of them but interpreted that local effects could mask the regional signal at some stations. Interestingly, he detected that stations East of the Rocky Mountains displayed a positive correlation between solar activity and temperature, whereas stations West of the Rocky Mountains displayed a negative one (Currie 1993), an effect not very unlike the signal-reversal in correlation observed in the 1920s. In 1980 Currie detected an 11-yr sunspot cycle signal in Earth rotation. He was not the first to do so after the invention of the atomic clock, but since solar effects on Earth are so controversial (probably due to the lack of accepted mechanism) the Sun-Earth rotation effect has been “discovered” independently multiple times, the last time in 2010, and it continues to be ignored.
However, the first viable mechanism for the sun-climate effect was suggested by Colin Hines in 1974. A year earlier Wilcox et al. (1973) discovered that the solar magnetic field sector structure affected the average area of low-pressure troughs during the winter in the Northern Hemisphere at an altitude of 300 mb (roughly 30,000 feet or 9,100 meters). Hines (1974) was skeptical of any sun-climate effect but suggested that planetary waves subjected to variable reflection in the upper atmosphere, may induce variable interference patterns in the lower atmosphere. These might constitute a possible candidate for the effect, if it was real.
A widely circulated article by Joe King (1975) did much to popularize the renewed interest in sun-climate relationships by presenting a great variety of evidence and concluded that:
“the accumulated evidence is so compelling that it is no longer possible to deny the existence of strong connections between the weather and radiation changes.”
It prepared the scene for John Eddy’s landmark article in Science a year later. Eddy brought to light the forgotten finding by Gustav Spörer and Edward Maunder that during the 1645-1715 period the sun behaved in a very unusual way and displayed very few sunspots. Eddy, very interested in the history of astronomy, supported their finding with naked-eye sunspot observations, auroral observations, eclipse observations, and 14C data (Eddy 1976). The Science article on the Maunder Minimum became hugely popular. Eddy followed up with several articles on the sun-climate relationship over the past 7500 years (Fig. 1.5).
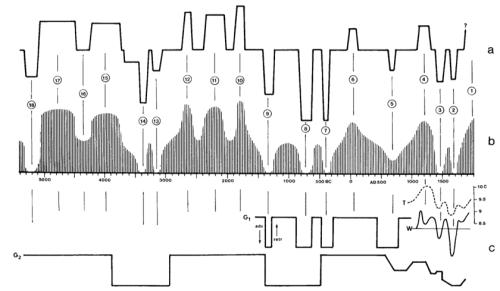
Fig. 1.5. Interpretation of the sun-climate relationship for the past 7500 years by John Eddy.
a) Schematic 14C variability showing 18 deviations from normal. Numbers 2 and 3 correspond to the Maunder and Spörer minima. b) Long-term envelop interpretation of the solar cycle based on 14C data. c) Climate estimates. G1, Alpine glaciers; G2, Worldwide glaciers; T, England temperature; W, Winter severity for Paris-London area. From Eddy 1977.
George Siscoe optimistically reviewed the 1970s golden decade of sun-climate research (Siscoe 1978), citing three major advances. Those of Wilcox and Eddy, and the studies linking drought in the North American Southwest to the 22-yr Hale solar magnetic cycle. But while the sun-climate subfield was again bursting with activity, advanced with well attended meetings, given its interdisciplinary and controversial nature, it was still criticized. Barrie Pittock published a critical look at 140 sun-climate articles (Pittock 1978) and concluded “that despite a massive literature on the subject, there is at present little or no convincing evidence of statistically significant or practically useful correlations between sunspot cycles and the weather or climate.”
1.5 1980s Global Warming and the second sun-climate demise
In the 1980s, the sun-climate renaissance of the 1960s-70s was drained of energy by improvements in solar constant measurements. Cavity radiometers were first equipped in the Earth Radiation Budget experiment onboard Nimbus 7 satellite in November 1978. The Active Cavity Radiometer Irradiance Monitor (ACRIM) experiment started with the Solar Maximum Mission in February 1980. For the first time solar constant values reached the precision of two decimal places of a percent. The decrease in the solar constant from the 1980 solar cycle maximum to the 1986 minimum was determined to be 0.15%, or 2 W/m2. But the yearly change had already been determined by 1982 to be of only 0.02%. The great majority of researchers believed that only changes in total energy could affect climate, to them a change of ± 0.07% could not produce significant effects. Those defending the idea that small solar changes could act on atmospheric instabilities that amplified their climatic effect were at odds to explain how they could do so in an inherently unstable atmosphere.
In 1980 Nastrom and Belmont appeared to have identified how the sun-climate effect was acting. Using radiosonde data for 174 stations in the Northern Hemisphere for the period 1949-1973 they found that tropospheric winds displayed a clear solar signal. They found that wind speed and temperature were responding to the solar cycle, and the effect was maximal near the tropopause during winter (Nastrom & Belmont 1980). In 1983 the same authors declared their result statistically insignificant after more tests (Venne et al. 1983). Also in 1980 Minze Stuiver, the authority in radiocarbon dating that had initiated past solar activity reconstructions in 1961, published an influential article in Nature comparing the new detailed 14C variability reconstruction and several long climate records (Stuiver 1980). He concluded that low solar activity periods like the Maunder Minimum had taken place several times during the past 6,000 years and that a relationship between climatic series and the 14C derived record of solar activity for the past millennium could not be established.
Minze’s article demolished John Eddy’s work. Two years later Eddy certified the death of sun-climate studies as mainstream science:
“Spacecraft measurements have established that the total radiative output of the Sun varies at the 0.1–0.3% level. … Such changes can be expected to perturb the terrestrial surface temperature by a fraction of a degree centigrade and probable evidence of this solar-induced signal has been found. The effect, though important in terms of understanding the climate system, is too small to be significant in practical weather or climate predictions” (Eddy et al. 1982).
As the old proverb says: “fool me once, shame on you, fool me twice, shame on me.” Sun-climate researchers had been burned twice, in the 1920s and 1980s; it should not happen again. The subfield fell into absolute disrepute. Nothing with the words “solar” and “climate” in the same phrase was to be taken seriously again. The timing was perfect for the CO2 hypothesis of climate change, as global warming started for the second time in the 20th century and this time it could be blamed solely on CO2 changes. It couldn’t be the sun and whoever suggested it faced ridicule and an insignificant career. It has reached a point where even clear solar effects on Earth’s rotation or on El Niño/Southern Oscillation are meticulously ignored.
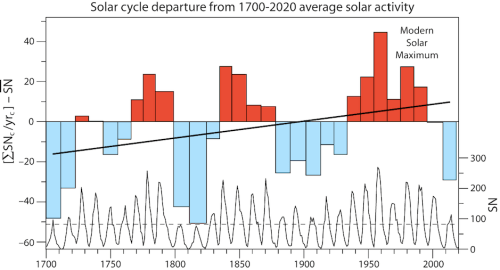
Fig. 1.6. Solar activity has been increasing since the depths of the Little Ice Age.
The length of each solar cycle has to be taken into consideration when comparing solar activity. Top, the sum of the sunspots for every year in the cycle is divided by the number of years in the cycle, and the 1700-2020 sunspot average is subtracted from the result. The result is displayed as a bar graph with bar width proportional to the duration of the cycle. Line is the linear regression trendline. Bottom, yearly sunspot international number from WDC-SILSO. The 1934–2008 period is the 75-year period with highest solar activity in at least 700 years, as we know solar activity was very low during the LIA since c. 1270. This period receives the name of modern solar maximum. The close correspondence in time between the highest solar activity 75-year period and the highest global warming 75-year period (1925-2000) in 700 years is unlikely to be a coincidence and deserves a thorough investigation that is not taking place. From Vinós 2022.
The turnaround was complete for those who wished to continue their careers. Wilcox, Svalgaard, and Scherrer had published in 1976 “On the reality of a sun-weather effect” (Wilcox et al. 1976). They were close to solving the problem. They were in the right part of the planet (the Northern Hemisphere extratropics), at the right location (the upper troposphere-lower stratosphere), at the right time of the year (during winter), looking at the right variable (pressure), and seeing a clear effect. That the sun-climate effect is stronger in Arctic latitudes during the winter is further confirmation of what could be deduced from the reversal of sun-weather correlations: The sun cannot affect Arctic winter climate through changes in TSI because there is no solar irradiation during the polar night, and it doesn’t matter there how small or large the TSI changes are for a sun that doesn’t shine. The existence of a different mechanism is required.
Colin Hines (1974) had already identified the sun-climate mechanism based on the Wilcox et al. results; it was the differential propagation and reflection of planetary waves due to changes in zonal wind speed. The same changes identified by Nastrom and Belmont and later discarded. But Wilcox et al. walked away. They forfeited their chance to find proof of a sun-climate effect in this 200-year-old climatological quest. That honor would go to a woman more interested in science than her career or reputation. Wilcox, et al. co-author Leif Svalgaard has dedicated his latest years to vigorously refuting any suggestion that solar variability may have contributed to modern global warming, and to tirelessly promoting a controversial change to the sunspot record that better supports his views.
1.6 Karin Labitzke and the unacclaimed first solid proof of a solar signal
In 1982 the National Research Council published a monograph on “Solar Variability, Weather, and Climate.” It reads like a death certificate of the subfield. It includes articles by James Holton and Barrie Pittock among others, under the chairmanship of John Eddy. James Holton, one of the foremost experts in the atmosphere, analyzed the possible physical mechanisms for a sun-climate effect through a dynamic coupling between the stratosphere and the troposphere in a negative light (Holton 1982). When considering Hines’ (1974) mechanism, Holton conceded that changes in stratospheric flow related to solar variability might alter the reflection/absorption of planetary waves and through wave interference produce effects in the troposphere. To him, this mechanism provided a possible link between solar variability and tropospheric weather and climate, which could be significant despite the huge energy difference between the solar input and the climate response. However, he concluded that the mechanism was speculative.
Two years earlier Holton and Tan (1980) had published a seminal article discovering that equatorial stratospheric winds, despite circling the Earth at high altitude above the equator, modulated global circulation. These winds are known as the Quasi-Biennial Oscillation (QBO) because they alternate between easterly and westerly direction with a quasi-periodicity slightly over two years. The effect of the QBO on Northern Hemispheric circulation discovered by Holton and Tan was to alter the mean geopotential (pressure) at the pole during the winter via planetary waves. This finding should have raised all kind of questions about possible solar activity involvement, since it was clearly related to the Wilcox et al. findings and involved Colin Hines’ planetary wave mechanism, but at the time a solar explanation was (still is) unacceptable to most academics. During winter, strong westerly winds circle the polar region trapping a cold-air low-pressure center, forming a strong polar vortex. The north polar vortex modulation by the QBO is so important that it received the “Holton-Tan effect” name. Interestingly, the north polar geopotential modulation by the QBO was only significant during the winter season when the mean zonal wind is westerly and vertically propagating planetary waves are present. Holton and Tan had to introduce the planetary waves condition because at certain times the correlation broke down.
Karin Labitzke (1987) noticed that the polar vortex–QBO correlation broke down sometimes during the westerly phase of the QBO, but only when solar activity was near its cyclical maximum. She decided to segregate the data on stratospheric polar temperatures according to QBO phase. The very low correlation between solar activity and polar temperatures, when all data are considered, becomes very high using the segregated data (Fig. 1.7). After 186 years Labitzke had solved the quest initiated by William Herschel in 1801. In a follow-up article with Harry van Loon (Labitzke & van Loon 1988) they extended the study on the solar effect on winter atmospheric pressure and temperature to the Northern Hemisphere troposphere. A main conclusion from this work is that the signal of the QBO in the extratropical stratosphere was strengthened in solar minima and weakened in solar maxima. That the QBO orientation flips the solar effect from one sign to its opposite is not unlike other correlation sign-reversals in the sun-climate effect, and a third indication that the effect cannot be mediated by changes in TSI.
In Peixoto and Oort’s (1992) indispensable Physics of Climate manual Labitzke and van Loon’s findings were properly appraised. After declaring it the most convincing statistical evidence of a solar-weather relationship found, they continue:
“Even at the earth’s surface, the correlations between solar activity and sea level pressure or surface temperature … are unusually high and appear to explain an important fraction of the total interannual variability in the winter circulation” (Peixoto & Oort 1992).
However, Labitzke’s ending of the 186-year quest for a sun-climate effect, initiated by William Herschel in 1801, could not have come at a more inconvenient time. Global warming was already blamed on CO2 and the scientific dogma was completely against her finding, as all sun-climate studies had been discredited. James Holton said:
“Superficially, I can’t find anything wrong with it, but there is absolutely no physical basis, and that bothers me. These people have the highest correlation I’ve seen, but if I were a betting man, I would bet against it.” (Kerr, 1987).
She had found a clear and indisputable effect of solar activity on climate. It could not be disputed, but it could be ignored. And it was going to be ignored as an oddity with little practical effect, and no place in modern climate understanding.
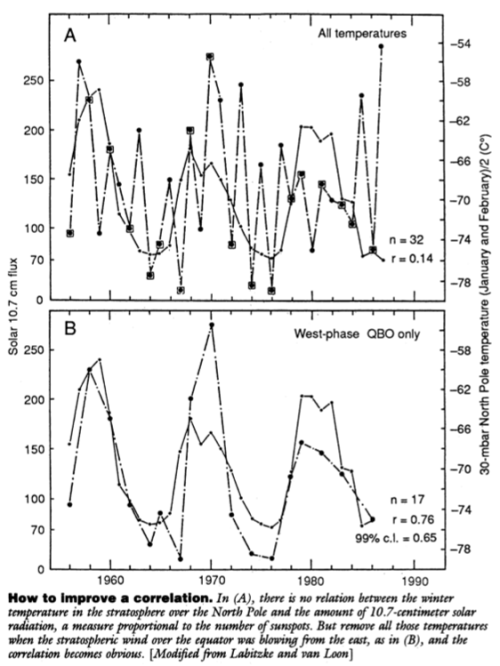
Fig. 1.7. Karin Labitzke’s 1987 finding of a sun-climate effect.
A) Lack of correlation between winter North Pole stratosphere temperature and solar activity (10.7 cm solar flux) when data for all years is considered. B) Clear positive correlation when only QBO west phase years are considered. Not shown is the clear negative correlation when only QBO east phase years are considered. From Kerr 1987.
1.7 Aftermath
The scientific consensus about an important sun-climate effect went from being against, prior to 1850, to being in favor between 1860s–1920s, negative from the 1920s–1960s, positive again in the 1960s–1970s, and then negative since the 1980s. It only demonstrates that scientific consensus has no place in science. Scientist’s opinions are not science. Only evidence constitutes science. Even though evidence can be dismissed or ignored, it remains, waiting for the time when it will be properly reappraised.
The fall of the sun-climate subfield during the early 1980s discouraged further research into how solar variability affects climate. The strengthening of the politically supported CO2 hypothesis of climate change turned the subfield into a scientific dead zone. Only a handful of researchers decided to pay the steep reputational and career price of pursuing this research interest. The difficult sun-climate relationship research subject experienced scant progress between 1870 and 1980, considering the amount of research labor invested. Turning it into a disreputable field after 1980 has resulted in slower progress despite the rapid advances in climatology in the decades since.
Despite these difficulties, as models attempt to reproduce real phenomena, and reanalysis is fed real climate data, the sun-climate effect keeps appearing, defying whack-a-mole attempts to keep it buried. In 1996 Joanna Haigh showed in a landmark article in Science that changes in atmospheric circulation, reproduced only weakly in models, had a clear solar origin (Haigh 1996). Tropical ozone changes appeared to be critical for the effect in the model. It soon became clear that the changes in TSI during the solar cycle did not involve enough energy to explain the observed climate effects. So, it was assumed that some sort of amplifying mechanism was responsible. Even though climate models did not include the stratosphere until recently, Haigh developed what is known as the “Top-down mechanism” for amplifying the solar effect on climate (Fig. 1.8).
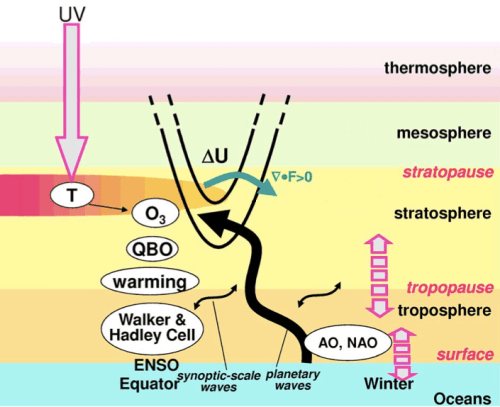
Fig. 1.8. Top-down mechanism for amplifying the solar effect on climate.
Solar UV radiation acts on the ozone layer in the stratosphere increasing its temperature (T) and the amount of ozone (O3). The change in temperature alters the latitudinal temperature gradient, and through thermal wind balance affects the zonal-mean zonal winds (ΔU). The change in zonal winds alters the properties of the atmosphere for propagating planetary waves. The effect creates an anomalous divergence (>0) of the Eliassen-Palm flux (F) proportional to the eddy potential vorticity, changing the deposition of momentum and kinetic energy. The strength of the polar vortex (not shown) depends on those changes, driving changes in the Arctic Oscillation (AO), North Atlantic Oscillation (NAO), and the Hadley and Walker circulations. Thick interrupted arrows indicate coupling. After Gray et al. 2010.
The orthodox view of the sun-climate effect at present can be summed up in Judith Lean’s 2017 review. The 0.1% increase in total irradiance between solar minimum and maximum is associated with an increase of 0.1 °C in Earth’s global surface temperature. There are dynamic processes that alter the regional response both at the surface and in the atmosphere. The effect of a grand solar minimum, like the Maunder Minimum, is considered to be less than a few tenths of a °C of global cooling (Lean 2017).
Over the following five parts in this series of articles we will explain the recently proposed Winter Gatekeeper hypothesis of sun-climate effect (Vinós 2022). It involves some very complex climate phenomena, which explains why it escaped discovery for 220 years. In the next part we will see that the orthodox IPCC sanctioned climate change view ignores the effects of solar variability on at least five very important climate-related phenomena that essentially refute it. It is hoped that the time has arrived for another reversal in the sun-climate consensus.
Note: This is the first of a six-part series on the effect of solar variability on climate change. Javier’s previous 13-part series on climate change was posted between 2016 and 2018 and can be read at judithcurry.com by introducing “Nature Unbound” in the search box. It generated over 4,000 comments and was the basis of his September 2022 book, Climate of the Past, Present and Future. A Scientific Debate, 2nd ed., where part of the material in this series is included.
Glossary [Vinos&May-AbbrevGlossary]
Bibliography [Vinos&May-Bibliography ]

Could really use an abstract and/or a one page (or less) executive summary, for this article and for the whole long series. Not going to wade through the whole thing to find out what it is about.
It means solar panels are going to work just fine for the foreseeable future.
My question would be framed as; On balance is the sun currently amplifying or suppressing the effects of the emissions and effluents that are being injected into the biosphere? I’m leaning towards a slight dampening but over such long time frames our decedents will have to deal with it.
The third option to your question is neither. But then “injected into the biosphere” is not a scientific concept.
David needs an elementary course in atmospheic science, far more than an executive summary of an unpublishable paper by someone else who needs one too.
Russ
Peter Kalmus, NASA climate scientist, is crying again. He was 9 years old when EPA in 1983 came out with a report that said oceans would rise by 12 feet by 2100. They have actually gone up by only a few inches.
Do you think this climate scientist ought to check the data? Or do you think he should just go see a good shrink?
Russ
Funny how this kid was always on target
https://pbs.twimg.com/media/FZTqnoLX0AEKLU2?format=jpg&name=360×360
“I’d rather have questions that can’t be answered than answers that can’t be questioned.”
Richard Feynman
Surely you’re joking Mr.CKid-
Inos & May’s screed well deserves Dick’s immortal words concerning the TTAPS report :
“You know, I really don’t think these guys know what they are talking about .”
Russ
Don’t be such a fuddy duddy. Mandelbrot had a tough time at the start too. Let the ideas play out.
Mandelbrot’s tiny theorem has been scientifically cited almost as ubiquitously as it outcrops in The Book of Nature.
You might as well get it over with and compare Vinos and May to Galileo, or if not Lord Rayleigh, at least Lord Monckton, whose magisterial M Theory of the Climate Pause bears a deep structural resemblance to V&M’s latest contribution to theoretical astrology.
You might get more readers with one 3 word sentence, but I really enjoyed this article! The collection and summation of sun related science of the centuries is breathtaking! Very well done!!
It is about climate, David,
Put that at the top of your decision tree.
Idk why you are telling it, this article is so interesting.
I would use the information from this article for preparing my coursework. I also often use this source http://essaypapers.reviews/ for such tasks
“Not going to wade through the whole thing to find out what it is about.”
I must warn you that this is the shortest article in the series, and none will have an abstract, so you might want to skip the whole series altogether.
Andy is a superb writer and summarizer, but I am a bad influence. I gloat on complex texts densely filled with information. For those willing to follow the series, the articles will take time and effort to digest. It is also a way to weed out those looking for easy answers to a complex question.
Pingback: The Sun-Climate Effect: The Winter Gatekeeper Hypothesis (I). The search for a solar signal - News7g
An incredibly interesting start of your series. I’m going to hold off commenting further until I can read some of the references.
With a great start like this, the rest is a must read.
I like history of all kinds including the history of the sun and the perceptions that ensue from it being observed. In history, I also like how the same or similar ideas are presented, then somehow diminished, and are re-awakened to be studied again. Our sun plays a really big part in making our planet habitable for us. Looking for and now claiming to find its connectivity with our daily lives, food sources and what brings us joy sets my mind on another adventure. Curious how history leads my mind to appreciate the present and look forward to the future.
Vinós missed that the TSI influence is cumulative through solar cycles, instead, like everyone else, he looked only at the immediate effect.
https://i.postimg.cc/fbrKC4dy/109y-SN-vs-30y-Had-SST3.jpg
The climate hinges on the solar threshold I established in 2014 of 95 SN.
Everyone looks to Immediate Climate Correlation to external forcing, “the sun”, “CO2”, “sunspots”; No One is looking at internal response of a massive system. A car driving down a bumpy road responds different when the spring rates and shock absorbers have different influence. Climate has always had alternating warmer and colder time periods that do cycle in phase with any forcing parameter. Some climate parameters do respond immediately with every change in forcing, but long term trends and major changes defy logic when trying to prove a single factor is most important.
Every bit of data indicates it always gets colder after a warm time and it always gets warmer after a cold time, for fifty million years. Every bit of data in ice core records indicates there is always more ice accumulation in warmer times when polar oceans are more thawed. Every bit of data in ice core records indicates there is always less ice accumulation in warmer times when polar oceans are more frozen. Every bit of data in ice core records indicates that ice extent increases as climate gets colder. Every bit of data in ice core records indicates that ice extent gets less as climate gets warmer.
This all indicates that more ice accumulation in warmer times causes the ice to get heavy and flow and increase ice extent. This all indicates that less ice accumulation in colder times allows the ice to thaw and thin and retreat and allow ice retreat.
Ice is never considered a factor in causing change, only a result, this is wrong, easily understood with study of ice core records.
These internal responses cause changes that occur hundreds and thousands of years later. Ice accumulation is more in every warm period and ice accumulation is less in every cold period.
Ice cannot grow on land after something made the climate cold and froze the source of evaporation, yet that is what consensus, peer-reviewed, climate theory proposes, and all the groups disagreeing with consensus, go along with their consensus on too many factors.
There is a major error in what I wrote, this sentence must have “NOT Always” between do and cycle.
Climate has always had alternating warmer and colder time periods that do NOT Always cycle in phase with any forcing parameter.
If solar variation drives climate, why do we not see an 11 year temperature cycle correlating with the 11 year solar cycle?
Patience you must have.
patience must you have
Sounds better in a star wars sort of way
We do, but it is small in recent observations.
https://judithcurry.com/2022/07/31/the-sun-climate-effect-the-winter-gatekeeper-hypothesis-i-the-search-for-a-solar-signal%ef%bf%bc/#comment-978097
The solar cycle influence is evident for those with eyes that see. Detrended SORCE TSI correlated well with HadSST3 during SC24.
See Fig.13 e-g, with correct climatic condition predictions.
https://i.postimg.cc/1zHrhxKZ/Rathore-etal-Fig-1-Asymmetrical-OHC-vs-SORCE-TSI-overlay.jpg
https://i.postimg.cc/7ZPt9G7G/AGU-Fig13.jpg
Thanks
the figure 1.6 – “solar cycle departure from 1700-2020 average solar activity” raises the question of how much of the warming is due to the Sun vs co2.
ancillary to the fig 1.6, there are numerous charts showing the total solar irradiance has increased starting circa late 1800’s with a peak circa 1930-1950 with a decline since circa 1950 though still much higher in the last decade compared to the late 100’s
I would think that the a good portion of the warming in the last 50 or so years is due to the increased solar activity and the delayed effect of the heating from the sun (changes in intensity of the sun should immediately translate into changes in temp (atmosphere , oceans storing and/or releasing heat)
Thoughts Judith
thoughts Javier & Andy
“the Greek grand solar minimum of 390–310 BC”
That’s a fairly good start date for that centennial minimum, I get 395 BC, but it only lasts until about 346 BC. It is the second centennial minimum in a grand solar minimum series starting from 500 BC.
I don’t see any basis for a 2500 year solar cycle, it does not exist in any multi-body synodic cycle, even if it may seem to be present in certain temperature proxy series.
“Wladimir Köppen, had found in about seven decades of weather data (c. 1840–1910), started to fail around 1920, or even worse they inverted, something that nobody could explain.”
That’s due to the major lows in the solar wind shifting from sunspot maximums to around a year after each minimum, and vice versa. In the space age there were major lows in in the solar wind in 1969 and 1979-80, which then shifted to a year past each cycle minimum from the mid 1990’s. The AMO has exactly the same phase shift relative to sunspot cycles, but the full inverse of UK temperatures, with faster solar wind states being associated with higher UK temperatures but a colder AMO. See figure 12 here:
http://virtualacademia.com/pdf/cli267_293.pdf
We can talk about sunspot cycles and climate in a general way but not meaningfully with weather, For that we need to look at solar variability at the scale of weather variability, which is back to the solar wind again, as that drives Northern Annular Mode anomalies driving the weather anomalies. Sunspots are largely a red herring when it comes to the weather. It’s the only way the ordering of these major heat and cold waves in history will be explained, they are not constrained by sunspot cycles or centennial/grand solar minima, they happen at any time:
https://docs.google.com/document/d/e/2PACX-1vQemMt_PNwwBKNOS7GSP7gbWDmcDBJ80UJzkqDIQ75_Sctjn89VoM5MIYHQWHkpn88cMQXkKjXznM-u/pub
Fig. 1.2. in the post is intriguing, population growth strongly increasing as the Sporer minimum kicks in from 1425, peaking through the unnamed centennial solar minimum from 1550, and increasing again through the latter half of the 1600’s when all the cold weather was. But falling through all the heat of the 1610’s to mid 1660’s.
Part quote “–Fig. 1.2. in the post is intriguing, population growth strongly increasing as the Sporer minimum kicks in from 1425,–“.
That may be due to the previous decline from the last Crusade 1396. But again, populations have always declined post Eddy cycle peaks, ie from the MWP, ~1300ce. Wars have always followed famines (the four horsemen)
[graves from ~600-900, and clothes 1700-1800 indicate diminutive person stature]. Population declines from peak numbers post Eddy cycle peaks are today historical landmarks for the previous five Eddy peaks.
From https://archaeologynewsnetwork.blogspot.com/2022/07/new-research-demonstrates-connections.html
“– Between 1441 and 1461 CE the strife reached an unfortunate crescendo — the complete institutional collapse and abandonment of the city. This all occurred during a protracted drought. Coincidence? –“
The Eddy Cycle is an artifact of sloppy wiggle matching, it’s not a real cycle.
1441 to 1461 was during the Sporer Minimum, which was the longest centennial solar minimum of the little ice series of grand solar minima.
“The Eddy Cycle is an artifact of sloppy wiggle matching, it’s not a real cycle.”
That is obviously incorrect. The Eddy cycle is very real in cosmogenic and climate proxy records. It just doesn’t fit your hypothesis.
Marchitto, T.M., Muscheler, R., Ortiz, J.D., Carriquiry, J.D. and van Geen, A., 2010. Dynamical response of the tropical Pacific Ocean to solar forcing during the early Holocene. Science, 330 (6009), pp.1378-1381.
https://citeseerx.ist.psu.edu/viewdoc/download?doi=10.1.1.370.2991&rep=rep1&type=pdf
Javier,
Quote from your link:
“The early Holocene SSTs were also characterized by millennial-scale fluctuations that correlate with cosmogenic nuclide proxies of solar variability, with inferred solar minima corresponding to El Niño like (warm) conditions, in apparent agreement with the theoretical “ocean dynamical thermostat” response of ENSO to exogenous radiative forcing”
And solar minima are in an 863 year cycle (+/- 20 yrs). I have empirical evidence of what orders that and all its variability, there is no hypothesis for the origin of a 1000 year cycle.
Can’t wait for the rest. Thank you, Javier and Andy.
If you had a friend with an above ground pool, you’d remember when everyone would walk in a circle, adding energy, it’d create a smooth, controlled whirlpool. It was when everyone got out or stopped that the water became choppy & chaotic with rogue waves.🧵
https://mobile.twitter.com/aaronshem/status/1542526291018137602
Current analysis looks for too Direct of a relationship and it does not consider the possibility of thresholds. The solar impact maybe greater when solar activity is generally low.
This is also 22 years ago, putting us roughly in the same phase and polarity of solar cycle. We also just had the weakest solar cycle in over a century.
Ryan Maue
Jul 11, 2000 shows up as an “analog” year or similar climate as 2022, especially with triple dip La Niña.
December 2000 was very cold across Eastern 2/3 of the United States. Can we put much confidence in such a prediction for this next winter?
https://mobile.twitter.com/aaronshem/status/1547238126938214400
Haig nearly got it right but not quite.
Solar activity variations involving changing wavelengths do cause O3 variations in the stratosphere but she didn’t go into the necessary detail.
A quiet sun creates more O3 over the poles which forces down the polar tropopause causing wavier jet stream tracks. An active sun reduces O3 over the poles so that the polar tropopause rises and allows the jets to become more zonal.
Then she didn’t follow through to the most significant effect which is that because those variations alter the degree of meridionality in jet strem tracks they then affect global cloudiness and the amount of solar energy able to enter the oceans which then determines warming or cooling.
https://joannenova.com.au/2015/01/is-the-sun-driving-ozone-and-changing-the-climate/
Excellent article, thanks Javier and Andy. Good to see the solar integration technique I posted in 2008 getting further developed too (Fig 1.6 top)
Excellent article – especially liked this paragraph:
“The scientific consensus about an important sun-climate effect went from being against, prior to 1850, to being in favor between 1860s–1920s, negative from the 1920s–1960s, positive again in the 1960s–1970s, and then negative since the 1980s. It only demonstrates that scientific consensus has no place in science. Scientist’s opinions are not science. Only evidence constitutes science. Even though evidence can be dismissed or ignored, it remains, waiting for the time when it will be properly reappraised.”
This sums up what anyone who has participated in a climate debate and had a supposed science writer (e.g. Steven Novella) argue that you are a “denier” for questioning the “scientific consensus”.
Where can one find „Vinós J (2022) Climate of the past, present and future. A scientific debate, 2nd ed. Critical Science Press, Madrid“?
Neither Amazon nor DuckDuckGo or Google yielded anything.
(Except for the first edition).
The same for „Critical Science Press“.
Javier is still finalizing the book. He hopes to publish it in mid-September.
First edition (2020) ISBN 978-3030189501 not available
https://www.amazon.com/Climate-Past-Present-Future-Scientific/dp/3030189503
Second edition coming soon.
Interesting stuff.
‘Bray cycle’ was up to 2,600 years in 1968?
Glaciation and Solar Activity since the Fifth Century BC and the Solar Cycle
J. R. BRAY
Nature volume 220, pages 672–674 (1968)
Abstract
A combination of geophysical, biological and glaciological information supports the idea of a 2,600 year solar cycle.
https://www.nature.com/articles/220672a0
– – –
That’s about 300 years more than the Hallstatt cycle you derided.
It is interesting how Roger Bray was capable of identifying the cycle with the data available in the late 1960s. New data available allows to identify the cycle all the way to the Last Glacial Maximum, 20,000 years ago. The climatological and cosmogenic evidence was essentially discussed in the Nature Unbound series published here, and it is updated in the book.
The incorrect Hallstatt cycle is the product of a mathematical analysis of 14C data from the last 9,600 years, because it breaks down prior to that. It is contradicted by climatic data and by the nature of 14C data, as the Bray cycle is established by all Sporer-type solar grand minima of the Holocene.
The analysis has allowed me to identify the time when the cosmic radiation from the Vela supernova arrived to the Earth, as it has left a huge mark in the 14C record, but not in the climate record.
https://en.wikipedia.org/wiki/Vela_Supernova_Remnant
So much for Svensmark hypothesis. Cosmic radiation has no discernible climate effect in proxies.
The Vela supernova cosmic event is used in the incorrect Hallsatt cycle, but not in the climate-related solar Bray cyle.
Javier wrote:
“the Bray cycle is established by all Sporer-type solar grand minima of the Holocene”
Grand solar minima series occur on average every 863 years (+/-20yrs). Every fourth series definitely shows stronger in GISP2 at 3453 years, but not every third series at 2589 years.
THE APPARENT PLANETARY ORDERING OF SUNSPOT CYCLES AND CENTENNIAL SOLAR MINIMA:
https://docs.google.com/document/d/1YOu7hHVEuaWWLuztj6ThEsJd7Z-765Uz-L68lQbRdbQ/edit
Do you have a citation for Bray saying there’s a 2500 year cycle? I only found 2600 years in web searches of his work. The reason for asking is that the precession of the Jupiter-Saturn conjunction cycle is close to 2500 years.
Javier wrote:
“the Bray cycle is established by all Sporer-type solar grand minima of the Holocene”
Grand solar minima series occur on average every 863 years (+/-20yrs). Every fourth series definitely shows stronger in GISP2 at 3453 years, but not every third series at 2589 years.
THE APPARENT ORDERING OF SUNSPOT CYCLES AND CENTENNIAL SOLAR MINIMA:
https://docs.google.com/document/d/1YOu7hHVEuaWWLuztj6ThEsJd7Z-765Uz-L68lQbRdbQ/edit
“Do you have a citation for Bray saying there’s a 2500 year cycle?”
No. From the data he had available at the time Bray inferred a 2600-yr cycle. I’ve been able to locate the cycle lows between 20,500-9,000-yr BP, so it can be determined that the cycle has an average period of c. 2550 years, but it presents as much variability as the 11.4-yr cycle.
OK thanks Javier. I found a pdf link to his 1968 paper which shows his thinking in more detail.
By the way, I suggest the Hallstatt cycle as the beat period of your Bray cycle and the de Vries cycle, thus:
Bray = 12 de Vries, 12 – 1(Bray) = 11 and Hallstatt = 11 de Vries.
In his 1968 paper, Bray mentions 400-year and 400-450 year periods, and 6 of them making his larger cycle. So each one would be 2 de Vries, and 6*2=12.
Javier, excuse my article being so brief, it just captures the essential ingredients. I will be expanding the text and adding a series of images of each sunspot cycle maximum correlation over a couple of hundred years, to visualise the Venus-Earth-Jupiter-Uranus progression which creates each centennial solar minimum.
But if you would like to view it on a heliocentric model, download the free demo here, set the date to a convenient Venus-Earth syzygy like 17.07.1617 or 06.06.2016, and animate in steps of 291.9609 days, which is half a Venus-Earth synodic period. Away from the centennial minima sunspot cycles, sunspot cycle maxima are when inferior conjunctions of Venus and Earth are towards Uranus, and with Jupiter doing a fourfold pattern with Uranus through four cycles. First say an inferior conjunction with Uranus at maximum, then a quadrature at the next maximum, then a superior conjunction with Uranus at the next maximum, followed by another quadrature at the next cycle maximum. That astronomically defines the shorter cycle lengths between the centennial solar minima, and suggests why both cycles 16 and 20 were smaller.
http://www.alcyone.de/alcyone_ephemeris.html
Just where are these so called cycles? It all seems so much astrological madness. All I see is aperiodic variability at many scales. Quadrature btw is an archaic mathematical term referring to determining the area of a circle by constructing a square of the same size. But they do like to use high-faluting jargon.
https://watertechbyrie.files.wordpress.com/2017/05/isotope-9400-e1659732607560.gif
A heliocentric quadrature, an astronomical term, two gas giants at 90° to each other relative to the Sun. The first fairly stable synodic period of the four primary bodies creates the centennial minimum cycle.
RIE:
“All I see is aperiodic variability at many scales.”
The Gleissberg cycle of centennial solar minima is well written about, the intervals do vary between around 80 and 130 years, though if the orbits were circular, there would be far less of that variability. Because the ordering is by quadrupole configurations within elliptical orbits there has to be a lot of latitude in the timing of quadrupole events.
Your cosmic rays series is missing two centennial solar minima, from around 1115, and from 1550 AD. They can be well confirmed with tree ring proxies and with weather chronicles.
Two celestial bodies at right angles to a reference point? We can see how it relates to squaring the circle. The synodic period is the time required for a body within the solar system to return to the same same position relative to the Sun as seen by an observer on the Earth. I presume that a fairly stable synodic period of the 4 largest planets in the solar system is a figment of your imagination. But by all means show your working. No cartoons please.
Whether it is written about or not is irrelevant. Science is self correcting – unless it is climate sceptic blogoscience.
Insulting and denigrating while asserting a false definition of a synodic period, and you have the wrong four bodies. Can you be self correcting?
By all means correct the definition and identify the planets.
https://www.google.com/search?q=synodic+period&rlz=1C1RXQR_en-GBAU936AU936&oq=synodic+period&aqs=chrome..69i57j0i512l9.7972j0j15&sourceid=chrome&ie=UTF-8
But please cite some actual science on this assertion or STFU. Narratives don’t do it.
The location of the solar system barycentre integrates solar system planetary orbits. It’s a Pointcare map and if you knew anything of the n-body problem you would know why.
https://www.brighthub.com/ezoimgfmt/img.bhs4.com/c1/c/c1ce801bf6423a3dbb86bf7289bc954d8c4be0b1_large.jpg?ezimgfmt=rs:600×600/rscb1/ng:webp/ngcb1
Ulric’s notions are cartoon science couched in impenetrable jargon. Saying so is neither insult or denigration.
It wasn’t actually false, but rather restrictive, a synodic period does not have to include Earth, it could be between say Jupiter and Uranus.
“Ulric’s notions are cartoon science couched in impenetrable jargon.”
The correlations show the ordering of the timing of every sunspot cycle maximum (from which the minimums can be extrapolated), accounting for the variations in cycle lengths, and exactly which cycles are weaker during each centennial solar minimum, accounting for the variability of the duration and of the intervals of centennial minima. It provides a logical explanation for the occurrence of centennial solar minima, the quadrupole configurations at each cycle maximum have to slip progressively out of line and fall back in again over a ~110 year cycle, at the first fairly stable synodic period of all four bodies.
The correlation between solar cycles with Venus-Earth-Jupiter cycles has been noted several times since the 1800’s, it only requires one more body to account for all the variability, including an explanation of why grand solar minima series, occur twice during a very stable 1726.62 year synodic cycle of all four bodies.
The cosmogenic isotope record does not have 110 year solar minimum over the past 1000 years. Ulric has an explanation of course for why not.
The cosmic ray intensity chart which you linked is missing three centennial solar minima of the last 1000 years. From around 1115, 1215, and 1550. There are abundant tree ring proxy series and weather chronologies which confirm them. I’m not bothered why the CR proxy is wrong, I wouldn’t dream of using such a crude and hugely smoothed proxy anyway.
Show me the record or stop mouthing off.
https://www.pnas.org/doi/full/10.1073/pnas.1118965109
I could have showed you the tree ring proxy series and the weather chronologies if you had asked nicely.
That’s twice today that I have had questions fobbed off on specious grounds that I should work it out and now that I didn’t say please. If you have nothing to hide – why hide it. I gave you peer reviewed evidence – you said it was wrong and refuse to provide alternative evidence.
Be polite and respectful and then we can converse.
You called me bonkers and other things just in this post. I am really not interested in discussing your Wily E. Coyote science. I just asked for the data you said contradicted the information I linked to. I’ll assume your data is MIA.
I called your reference bonkers, it is.
Pingback: The Sun-Climate Effect: The Winter Gatekeeper Hypothesis (I). The search for a solar signal – Andy May Petrophysicist
I wonder how the ancient observers identified and followed sun spots without telescopes. Did they look straight at the sun, may be through thin parchment? Or did they make a camera obscura? This could not give a fine enough resolution to find sun spots. Any thoughts?
Dietrich, As far as I know early observers either looked at the Sun only at sunset and sunrise, or they used a camera obscura. Kepler used a small hole in the roof of his house.
A smoke screen when the sun is low is enough.
https://www.gettyimages.com/detail/photo/orange-sunrise-and-sunspots-due-to-wildfire-smoke-royalty-free-image/841094912
Thin cloud or mist & fog works.
My favorite comment and a good summary: Every bit of data indicates it always gets colder after a warm time, and it always gets warmer after a cold time,
“Fig. 1.6. Solar activity has been increasing since the depths of the Little Ice Age.”
The main change since then is less lows, the highs are not so different. The actual depths of the little ice are mostly confined to centennial solar minima, there were very warm periods between the centennial minima, some which have not been exceeded since, like in 1540-41. Much of the 1610’s to mid 1660’s was very warm to hot in Europe, looking at sunspot numbers won’t tell you that. Solar cycle 20 was smaller than average, but the solar wind speed was the highest of the space, with record heatwaves 1974-1976.
I fear that the claim that Labitzke “end[ed] the 186-year quest for a sun-climate effect” is premature.
The problem is that like far too many alarmist scientists, Drs. May and Vinós have ignored the huge problem of autocorrelation.
The data shown in Fig 1.7 starts out with only 31 data points. But the autocorrelation is extremely high, with a Hurst Exponent of 0.91. And this in turn means that the “effective N”, the number of independent data points in the dataset is … well …
One. And it’s hard to draw conclusions from one data point.
Drs. May and Vinós also do not mention the necessary use of the Bonferroni Correction. The Bonferroni Correction adjust for the number of places you’ve looked, or equivalently, the number of trials.
For example, if you throw seven coins one time and they all come up heads, that might well indicate that the coins are loaded (or have two heads). It would be statistically significant.
But if you keep throwing the seven coins, assuming they are honest coins, eventually you’ll get seven heads … is that statistically significant?
Well, no … because you haven’t included the Bonferroni Correction.
And as a result of Labitske and the current authors ignoring autocorrelation and the Bonferroni Correction, you can’t draw any conclusions from the the Labitske data. Or more accurately, you can draw all the conclusions that you want, but they are NOT statistically significant.
Next, the fact that two cycles might match up for three cycles as in Figure 1.7 is too few cycles to establish anything. Basically, all climate signals have cycles, and they often intersect … for a short while. My rule of thumb is that you need 5 cycles to say the relationship is stable … and even then I’ve been fooled. For example, there’s a 5-cycle agreement between some selected sea levels and solar cycles … but it falls apart completely when you look at the times before and after the period when they coincide.
I also get very nervous when I see sentences like this:
“That the QBO orientation flips the solar effect from one sign to its opposite is not unlike other correlation sign-reversals in the sun-climate effect.”
In general, scientific phenomena don’t suddenly “reverse”. Sunshine doesn’t suddenly “reverse” its effect and make things colder instead of hotter. Rain doesn’t “reverse” its effect and make things dryer.
Far too often, claims of “reversals” are just an ad-hoc attempt to explain the fact that two signals under consideration are unrelated, and thus go into and out of phase …
As this article notes, folks have looked very hard for a sun-surface climate connection since William Herschel. I’ve looked very hard. Most of my investigations of the subject are here, and there are a couple more here.
In all, I’ve looked for sun-surface climate effect in 36 locations without success. Lake levels. River levels. Temperatures. Clouds. Sea levels. Tree rings. Rainfall.
No joy.
And as the authors admit, others have found the same lack of a connection.
If there were actually some significant solar-climate relationship, we wouldn’t have to wait 186 years for Labitske to dig out some obscure “connection” that only appears in a tiny part of the climate system, when the moon is in the seventh house, the QBO is just-so, and you hold your tongue a certain way …
w.
The time has come, to talk of many things: Of ENSO—and QBO—and Earth rotation— Of paleoclimatology—and energy— And why the sea is boiling hot— And whether pigs have wings.
Hi Willis, I do not have a PhD, so Dr. is inappropriate. Javier does so it is OK in his case. Most of your issues will be addressed in the remaining 5 posts, so I will only address the issue of autocorrelation.
Autocorrelation matters when you are trying to project a time series into the future or use linear regression statistics, like R^2. We are not doing either here. We are simply comparing plots of winter polar temperature for all points to a plot with west-phase QBO only.
The points compare very well (visually) when the west-phase only points are used. Visually, the correlation is apparent and not random. Calculating autocorrelation statistics on this data is pointless, as you say there are too few points. Later in the series you will see more modern data, this is a historical overview of past research into a solar/climate connection. The plot is the first of its kind, but not definitive in and of itself.
Thanks for the reply, Andy.
You say: “Autocorrelation matters when you are trying to project a time series into the future or use linear regression statistics, like R^2. We are not doing either here.
We are simply comparing plots of winter polar temperature for all points to a plot with west-phase QBO only.”
I fear that saying “visually the correlation is apparent and not random” is not convincing. Spurious correlations are rife in climate science, and particularly in the solar corner of climate science. There’s an interesting one here.
In any case, on Figure 1.7 itself it says
“n = 17
r = 0.76
99% c.i. = 0.65”
And that specific statistical claim was the one that I was referring to, that the R^2 of the two series is 0.58.
For an exposition and discussion of what I find unaccounted for in the Labitzke study, see my post here.
Next, I just noticed an oddity. The Karin Labitzke graph Figure 1.7 (b) is curious in that there are 32 datapoints in the solar dataset, and it’s being compared to a temperature dataset with only 17 datapoints …
They’ve done a strange thing. They’re comparing all years of the solar dataset to a reduced-years temperature dataset. Not even clear what that measures. Seems like apples and oranges.
In any case, my thanks, and I look forwards to your further clarifications.
w.
Willis,
As for the statistics in the plot, I’ll refer you to Labitske’s paper. We do not use these values for anything. The plot is interesting and important, but only a first step. As important as the plot is, the idea behind it sat dormant for over 30 years. Possibly your complaints about the statistical significance of the data plotted is one reason it sat dormant for so long. We have much more to say on this in the next few posts. This is just a review of the historical research into a solar/climate connection.
“Possibly your complaints about the statistical significance of the data plotted is one reason it sat dormant for so long.”
By no means. Labitzke’s 1987 work was followed by many works, some of them in collaboration with Harry van Loon. They are very solid works. Peixoto and Oort, two of the best atmospheric physicists of the 90s found no problem with them. Labitzke’s data on polar stratospheric temperature was updated until 2013, two years before her passing. They are accesible at the Freie Universitat of Berlin.
Karin Labitzke’s works have several thousands of citations in Google Scholar. She was by no means an obscure scientist. She was one of the foremost experts in the stratosphere. Together with van Loon she authored the 1999 book: The Stratosphere: Phenomena, History, and Relevance
https://www.amazon.com/Stratosphere-Phenomena-History-Relevance/dp/3642636373
The problem is that Labitzke’s findings don’t fit the assumption of people like Willis on how the sun should affect climate if it does. But that is the problem of people like Willis, that set themselves for failure, and not Labitzke’s problem. Then, after they fail, they think they know the sun does not affect climate significantly. So they fail again.
I assume that the Sun warms the Earth, Javier.
Are you suggesting it is incorrect?
Willis makes two good points about the statistics required in analyzing the associations claimed in this post. My first thought on reading this post was the Bonferroni concern given all the searching for an association. The autocorrelation issue is mainly one of reporting and adjusting the confidence intervals for the degree of autocorrelation. Making a Bonferroni correction is no simple matter since it requires an exact accounting of the number of trials of not only the author using it but those of others of which the author has knowledge.
A good and proven independent theory of the association beats correlation every time. I hope that the future posts on this topic cover Willis’ concerns and provide some solid supporting theories. The handling of the historical changes in views on the topic in this post was a highpoint for me.
Willis
“For example, if you throw seven coins one time and they all come up heads, that might well indicate that the coins are loaded (or have two heads). It would be statistically significant.
But if you keep throwing the seven coins, assuming they are honest coins, eventually you’ll get seven heads … is that statistically significant?”
–
Perhaps best if you steer away from probability comments unless you qualify them a bit better.
–
Your comment that if all seven coins come up with heads being statistically significant in the sense that it is unusual ( loaded or two heads) is incorrect.
It is an event that has a probability that is no more statistically significant than any other throwing of such coins.
(Feynman made this quite clear in a comment about a licence plate number as I recall).
–
No need to assume double headed coins or loaded coins as the question of probability applies to the pure state,
And even so the act of 6 tails and 1 head is just as surprising and improbable as seven heads or any other result on one throw.
–
The next fallacy is that eventually you will get 7 heads if you throw them long enough.
No.
That is not guaranteed.
As said probability theory does not deal with honesty and in one or more infinite universes seven coins may be thrown and never have 7 heads as an eventual result.
–
“In general, scientific phenomena don’t suddenly “reverse”.
Reflection of light waves?
Your chances increase for throwing a given combination of heads and tails with more throws. It goes back to putting adjusted confidence intervals on your results whether it be for Bonferroni or autocorrelation considerations.
Great effort Javier!
What? You want to discuss evidence? First, what’s your ESG score? That’s the critical part.
This just in – length of day sharply down in the last two years.
Polar ice buildup? Glaciers unmelting?
https://youtu.be/D2rUtp7g3ms
Other sources seem to imply the change was abrupt. It would be good to know what the timing was on the 28th and on the 30th.
Some idea on the above from here: https://c.tadst.com/gfx/600×337/earth-in-a-hurry-3.png?1
Available is date for the shortest days in the previous three years. For 2021 and 2020 that occurred on the night of the new moon. For 2019 it was the full moon.
It is not ice, or temperature. It is dynamics.
If it could be known for the days in between it may reveal more. Sampling rate may hide and obfuscate important information. From year to year the shape is different.
ENSO, volcanoes, solar activity and anthropogenic greenhouse gases – according to Lean and Rind 2008 – https://agupubs.onlinelibrary.wiley.com/doi/full/10.1029/2008GL034864
What’s interesting is the past 40 years. Frequent and intense El Nino all over the place, a couple of volcanoes in the 80’s and 90’s depressing atmospheric temps for a bit and emissions take off after 1980. So it should be a bit warmer.
https://images.remss.com/msu/msu_time_series.html
And by definition we are looking for small changes in background variables that trigger – triggers don’t correlate – hydrodynamic flow transitions in oceans and atmosphere and nonlinear feedbacks in ice, cloud, biology, dust… The sun-climate connection is not if but how it plays out in Earth’s physical system. Here’s something from a few young guns in 2015.
‘The purpose of this review is to describe the global scope of the multidecadal climate oscillations that go back at least, through several hundred years. Literature, historic data, satellite data and global circulation model output have been used to provide evidence for the zonal and meridional jet stream patterns. These patterns were predominantly zonal from the 1970s to 1990s and switched since the 1990s to a meridional wind phase, with weakening jet streams forming Rossby waves in the northern and southern hemispheres.’ https://www.mdpi.com/2225-1154/3/4/833
‘https://www.mdpi.com/climate/climate-03-00833/article_deploy/html/images/climate-03-00833-g001a-1024.png
The polar annular modes may have a solar signature. Both north and south Pacific gyres spin up with more meridional annular modes leading to upwelling in the eastern Pacific and Bjerknes feedback – cooling the planet with more cloud. At this time of year the La Nina will likely intensify with the ITCZ moving south to the Austral spring.
https://www.ospo.noaa.gov/Products/ocean/sst/anomaly/
Thank you Javier, Andy and host Judy.
Can’t wait for more.
Excellent and well written paper.
Pingback: 겨울 문지기 가설(I). 태양 신호 검색 – Watts Up With That? – Blog Ciencia
Pingback: The Winter Gatekeeper Hypothesis (I). The search for a solar signal – Watts Up With That? - News7g
Pingback: The Winter Gatekeeper Speculation (I). The seek for a photo voltaic sign – Watts Up With That? - news page
Javier Vinos and Andy May, excellent article. Thank you.
CO2 is beneficial for ecosystems, agriculture and forestry. It is having a negligible impact on global climate.
Global warming is net beneficial. We need to stop trying to reduce it.
However, we do need to do all we can to reduce fossil fuel consumption because the pollution they cause are having huge negative health impacts and causing high numbers of deaths.
To reduce the health impacts and substantially reduce the cost of energy the world needs to transition from fossil fuels to nuclear power (not renewables!!) as rapidly as possible.
If not for the disruption that began in the 1960’s to the declining cost of nuclear power, the OCC of nuclear power could now be around 5% to 11% of what it is [1] (Figures 1, 2, 3 and Table 3 – https://www.mdpi.com/1996-1073/10/12/2169/htm )
https://www.mdpi.com/energies/energies-10-02169/article_deploy/html/images/energies-10-02169-g001-550.jpg
“Figure 1. Overnight construction cost (in 2010 US $/kW) plotted against cumulative global capacity (GW), based on construction start dates, of nuclear power reactors for seven countries, including regression lines for US before and after 32 GW cumulative global capacity.” [1]
If the energy impact sector is corrected using empirical data, and the other impact sectors in total are unchanged or more beneficial, then Figure 15 [2] indicates global warming is beneficial, not harmful.
https://www.mdpi.com/energies/energies-12-03575/article_deploy/html/images/energies-12-03575-g015-550.jpg
“Figure 15. FUND3.9 projected global sectoral economic impact of climate change as a function of GMST change from 2000. Total* is of all impact sectors except energy.”
References:
[1] Lang, P.A. Nuclear Power Learning and Deployment Rates; Disruption and Global Benefits Forgone. Energies 2017, 10. http://dx.doi.org/10.3390/en10122169
[2] Lang, P.A.; Gregory, K.B. Economic impact of energy consumption change caused by global warming. Energies 2019, 12, https://doi.org/10.3390/en12183575
Peter
l
Peter Lang has not a clue about the impacts of greenhouse gas emissions on either climate or environment. We need simultaneously to both reduce emissions and not reduce emissions?
There are limits on what science can illuminate. Peter goes well beyond those limits in a long chain of qualitative assertions that are cut and pasted interminably.
Hi Judith.
A query. Surely the best way to measure any change in overall global warming/cooling is via studying the day/night temp variation?
Just look at the massive day/night temp variation on Mars, even with 96% carbon dioxide.
Maybe a daily? monthly? yearly? decade? satellite worldwide day/night survey would be interesting. Surface? Stratosphere? Both?
Been done already? I did look for this but found nothing.
Surly it is better to find out the earths overall day/night temp variation then dissect out the causes of any found hard data changes?
Just a thought.
John Presser in Hobart Tasmania
Hi John
You noticed that:
“Just look at the massive day/night temp variation on Mars, even with 96% carbon dioxide.”
“even with 96% carbon dioxide.”
Exactly, the “day/night temp variation on Mars” is not as massive as on Moon, because Mars rotates faster than Moon.
The obvious discrepancy can be explained only by the Mars’ much faster than Moon’s rotational spin.
The obvious discrepancy can be explained only by the Planet Surface Rotational Warming Phenomenon.
https://www.cristos-vournas.com
I find it a very Intresting article and subject.
But why is the Gleissberg cyclus and the Bary Center not mentioned ? Or the work of Dr. Landscheidt whose work on solar angular momentum rate of change of the sun’s rotation around the solar system’s barycenter has been correlated with major US droughts.
This is pretty easy. The sun warms the oceans, CO2 back radiation does not. Dr. Jim Greene just made a video on that. If the oceans are warming more solar radiation must be reaching the oceans. How would that happen? Jet Stream changes to reduce the clouds over the oceans. That is exactly what has happened. It is that easy. Okum’s Razor.
My point exactly, for at 15 years ow.
The sun warms oceans and a warmer atmosphere slows cooling. The big change in cloud cover in recent decades was over the eastern Pacific. The former is founded on the 2nd law of thermodynamics and the latter is known because there are satellite observations.
True, true, the idea of back radiation has been demolished. Gerhard Gerlich and Ralf D. Tscheuschner proceeded to falsify AGW theory by demolishing the Left’s atmospheric greenhouse conjecture: “an idea the authors trace back to the traditional works of Fourier 1824, Tyndall 1861 and Arrhenius 1896, but which is still supported in global climatology, essentially describes a fictitious mechanism by which a planetary atmosphere acts as a heat pump driven by an environment that is radiatively interacting with but radiatively equilibrated to the atmospheric system.” Given, “the second law of thermodynamics,” G&T show that, “such av planetary machine can never exist.”
I enjoy reading science history and this article is a good read. Reminds me of the history of astronomy, Aristarchus, Ptolemy, Copernicus, Galileo, Kepler, Herschel, Shapely, Hubble, Penzias and Wilson (CMB), Guth (inflation), 1a supernovae (1998), Sloan Digital Sky Survey, BAO signal and dark energy, …
Finding a connection between the sun and climate has been illusive. Longer solar cycle length seems linked with a weaker solar cycle considering the deep minimum of 2009 (cycle 24). Karin Labitzke (1987) Showed “that the signal of the QBO in the extratropical stratosphere is strengthened in solar minima and weakened in solar maxima.” Also, “clear positive correlation when only QBO west phase years” and “negative correlation when only QBO east phase years.” QBO is Quasi-Biennial Oscillation.
“In Fig. 1.8 solar UV radiation acts on the ozone layer in the stratosphere increasing its temperature (T) and the amount of ozone (O3).”
I just read an article (see American Institute of Physics, July 5, 2022) where an “all-season ozone hole in the lower stratosphere over the tropics” agrees well with a model of cosmic ray driven electron (CRE) reactions and, “strongly indicate the identical physical mechanism working for both Antarctic and tropical ozone holes.”
Cosmic rays increase in the atmosphere during solar minimum and there may be a solar signal in the tropical ozone data (UV: higher O3 during solar max, CR: lower O3 during solar minimum).
In addition, will Dr. Kharkova’s double dynamo solar model be included in subsequent updates? I found the methods and conclusions in her 2015 paper to be ground breaking. Two dynamos moving in and out of phase, 30 year cycles? Must wait on the edge of my seat and see.
There are no solar cycles. The sun evolves moment by moment chaotically – as shown by Pointcare’s orbital Hamiltonians. This then feeds into plasma dynamics. The most that can be hoped for is spectral peaks.
e.g. https://pubs.usgs.gov/fs/fs-0095-00/fs-0095-00.pdf – fig 4
But to imagine that this resolves into distinct cycles is an old idea with little explanatory power. Then the solar energy is transported and transformed within the Earth system – that is neglected entirely. Except when it’s cooling the planet – then it’s a chaotic climate shift. With not a notion of implied or any idea of the physical mechanisms – really just eyeballing pretty pictures and making asses of themselves.
It’s an idea that brings the crazies out to play. The earth is warming because we are emitting greenhouse gases, we don’t what the outcome of that will be and while there may be some natural cooling in future we don’t know when or how much cooling. In a hot world with cool NH summers transporting heat mostly in the atmosphere – to northern climes where it falls as snow. Cool summers allow more snow and ice to survive leading to self reinforcing feedback and runaway ice sheet growth.
Oh looky – https://www.skymarvels.com/gallery/Vid%20-%20Solar%20System%20Barycenter.htm
“There are no solar cycles.”
In science, hypotheses demonstrate their value when they are capable to anticipate events not in the observational dataset. For example Einstein’s hypothesis prediction that light passing near a massive body in space would bent, was observed during a solar eclipse afterwards.
The existence of secular solar cycles is not only in the observational dataset (cosmogenic record in tree-rings and ice cores), but it allowed Mark Clilverd et al. to succesfully predict in 2006 that solar cycles 24 and 25 would be very low activity cycles.
Clilverd, M.A., Clarke, E., Ulich, T., Rishbeth, H. and Jarvis, M.J., 2006. Predicting solar cycle 24 and beyond. Space weather, 4 (9).
https://agupubs.onlinelibrary.wiley.com/doi/pdfdirect/10.1029/2005SW000207
Your hypothesis that there are no solar cycles is inferior because is not supported by observations and does not predict anything.
Solar activity evolves moment by moment in response to chaotic orbits and turbulent plasma physics. Nonlinearities in the Earth system unpredictably amplifies the response.
There is literally nothing approaching strict periodicity in any solar record. The game seems to be picking maxima or minima and then averaging. And even with such simple math – they get it wrong. 863 years -/+ 20 is just nuts. And Javier’s proposed mechanisms for a solar indirect effect in the planetary system is so much flimflam.
e.g. https://watertechbyrie.files.wordpress.com/2017/05/isotope-9400-e1531338833901.png
There is the ENSO band – that changed from a 5 to 7 year beat around 1900 (Vance et al 2012), the multidecadal beat with a period of a decade or three may be linked to the Hale geomagnetic ‘cycle’, there may be a millennial beat with El Nino frequency and intensity peaking in the 20th, there was a bifurcation some 5,500 years ago during a long, slow increase in solar activity. Internally driven abrupt climate change – the Sahel dried – it was but is there a solar trigger for state transitions in the climate system. That’s uncertain and no amount of handwaving at ‘correspondences’ will change that. It’s a working hypothesis – the gyre hypothesis.
e.g. https://watertechbyrie.files.wordpress.com/2020/01/moy-2002.png
Multi-decadal variability in the Pacific is defined as the Interdecadal Pacific Oscillation (e.g. Folland et al,2002, Meinke et al, 2005, Parker et al, 2007, Power et al, 1999) – a proliferation of oscillations it seems. The latest Pacific Ocean climate shift in 1998/2001 is linked to increased flow in the north (Di Lorenzo et al, 2008) and the south (Roemmich et al, 2007, Qiu, Bo et al 2006)Pacific Ocean gyres. Roemmich et al (2007) suggest that mid-latitude gyres in all of the oceans are influenced by decadal variability in the Southern and Northern Annular Modes (SAM and NAM respectively) as wind driven currents in baroclinic oceans (Sverdrup, 1947).
Javier doesn’t have the systems theory needed or any depth in geophysics – that’s why his hypothesis is inferior. There was a decadal blip in planetary warming after 1998 – I picked it. Not the timing – that remains impossibly hard – but that it would happen. Mark my words – it will happen again. It makes it a phase transition and not a cycle as such.
Robert wrote:
“863 years -/+ 20 is just nuts.”
You are just nuts. That figure is perfect for GSM series from 2225 BC, 1365 BC, 500 BC, 350 AD, and 1215 AD. It also works with the high solar warm periods, and also with major solar storm events.
994 AD major solar storm + 863 = 1857, 2 years before the Carrington event.
1052 major solar storm + 863 = 1915, 6 years before an extreme solar storm.
There should be another around 863 years after the 774 super storm.
Other than your eyeballing nonsense – where the hell is the evidence.
Be nice Robert, I have references.
774 + 863 = 1637.
December 1638 and January 1648:
“Identification of possible intense historical geomagnetic storms using combined sunspot and auroral observations from East Asia:
https://citeseerx.ist.psu.edu/viewdoc/download?doi=10.1.1.398.4924&rep=rep1&type=pdf
That’s an off the wall paper such as I occasionally enjoy. I will read it. But it is not your 100 or 200 year solar astrology showing up in tree rings. .
Robert:
“In a hot world with cool NH summers transporting heat mostly in the atmosphere – to northern climes where it falls as snow. Cool summers allow more snow and ice to survive leading to self reinforcing feedback and runaway ice sheet growth.”
Then, please visit the Reversed Milankovitch Cycle.
Link:
https://www.cristos-vournas.com/443826320
Christos – in a word – not a chance. I have wasted enough time with you.
Robert:
“Christos – in a word – not a chance I have wasted enough time with you.”
https://www.cristos-vournas.com
And I’d appreciate it if you stopped being such an intransigent ass.
“Cool summers allow more snow and ice to survive leading to self reinforcing feedback and runaway ice sheet growth.”
How much cool? 0,04 % CO2 cool?
https://www.cristos-vournas.com
Absurdity on absurdity. No the future is not in the planets. And we have still not seen an internal mechanism that amplifiers solar variability.
‘Since irradiance variations are apparently minimal, changes in the Earth’s climate that seem to be associated with changes in the level of solar activity—the Maunder Minimum and the Little Ice age for example—would then seem to be due to terrestrial responses to more subtle changes in the Sun’s spectrum of radiative output. This leads naturally to a linkage with terrestrial reflectance, the second component of the net sunlight, as the carrier of the terrestrial amplification of the Sun’s varying output. Much progress has also been made in determining this difficult to measure, and not-so-well-known quantity. We review our understanding of these two closely linked, fundamental drivers of climate.’ http://bbso.njit.edu/Research/EarthShine/literature/Goode_Palle_2007_JASTP.pdf
There is not a hint of doubt – and that’s Javier’s greatest absurdity. Not having any systems theory – or much in the way of geophysics – we are left with dogmatic narratives that are wildly off track.
“The earth is warming because we are emitting greenhouse gases, we don’t [know] what the outcome of that will be and while there may be some natural cooling in future we don’t know when or how much cooling.”
GHGs are just one of the factors involved in the warming.
If the past is prelude to the future a new glaciation awaits the Earth in a few thousand years. It has happened over fifty times in the past 2 million years and the funny idea that this time is different is based on the ignorance of experts.
‘In a hot world with cool NH summers transporting heat – mostly in the atmosphere – to northern climes where it falls as snow. Cool summers allow more snow and ice to survive leading to self reinforcing feedback and runaway ice sheet growth.’
Yes Javier – we may trigger a glacial and there has been a lot of actual science around this very point.
“we may trigger a glacial”
Your idea of how much we can affect climate is hilarious and baseless. We can’t hurry a glaciation, nor can we stop one. Fiction is fun but not to be taken seriously.
Ellison and the “elites” have something in common: They believe if they imagine it, it is so, reality notwithstanding.
Javier is right to say “We can’t hurry a glaciation, nor can we stop one.” It is written in the stars (really in the planets).
REI however may have a point there; in that we may influence to what extent the detrimental effect is when triggered.
REI is also very right to protect and improve the source of human livelihood – the soil- ; and more, much more, if we wish to retain the advances gained during the last century.
How does a glacial start? One good proxy is Otzi the Ice-man, and he speaks volumes. Working back from what info was gained these last months his date is January 12th 3559BCE. Excellent planetary alignment. The ancient calendars tell of an obliquity change of about four degrees around that time.
(the calendar builders were widely knowledgeable. the priesthood followers as much ignorant, obsessed with killing their youngest and ablest. Lest we forget).
Re Otzi see here https://melitamegalithic.wordpress.com/2019/06/14/ask-otzi/
Arctic feedbacks start with changes in North Atlantic hydrodynamics. Not understanding is one thing being dicks about it is another. It is largely extremist ideology and Jimbo is a perfect example.
e.g. http://bbso.njit.edu/Research/EarthShine/literature/Goode_Palle_2007_JASTP.pdf
Out of the mouths of babes.
Robert I. Ellison | August 3, 2022
“There are no solar cycles. The sun evolves moment by moment chaotically “
Javier | August 4, 2022
“The existence of secular solar cycles is in the observational dataset (cosmogenic record in tree-rings and ice cores)”
The existence of observational solar cycles might suggest a cyclical variation in solar temperature but has little true correlation with measured solar intensity changes and a technical issue of how it can be more emissive with the sunspots are more active as a sunspot is technically a darker or lowe emission area.
Hence RIE is technically right.
The amount of energy emitted is chaotically variable though the source appears reasonably steady.
Consequently the energy emitted can vary by enough in itself to be a sole cause of global warming and cooling.
Space and matter are not settled stable unchanging concepts.
Interstellar dust is one both constant in presence and variable in amount possible fuel supply for the sun.
Complicating the issue however are the albedo characteristics of an atmospheric planet with a water charged atmosphere which, as Roy Spencer explains can cause long lasting temperature changes through the amount of cloud cover.
Also enough on its own, not to mention uneven topography, winds, oceans and vegetation changes to by itself be a sole cause of global warming and cooling
The search for a solar signal on the earth is an exercise in haruspicy.
The proper search is evident to all and ignored by all.
We have satellite readings of the amount of energy coming from the sun stretching back for decades.
Different satellites and different overlaps poorly put together.
Get a team out to gather and re sort them out and give everyone a clear picture of the last 30- 40 years.
Overlap it with the magnetic observable cycle shifts.
Two things are evident.
Poor, weak to no correlation of sunspots with solar temperature (fact).
True variability of solar temperatures with warming and cooling phases in as RIE puts it, true chaotic fashion.
“has little true correlation with measured solar intensity changes”
Not correct. The centennial Feynman cycle last oscillation is very prominently displayed by the Aa (antipodal amplitude) geomagnetic index, that is a reflection of solar magnetic activity (solar wind) effect on the Earth’s magnetic field.
<i<"how it can be more emissive with the sunspots are more active as a sunspot is technically a darker or lowe emission area."
It is widely known that the higher emissivity is the result of bright faculae that are associated to sunspots.
The correlation between sunspots and solar emissions is very well known as you can imagine. They both go up until about 200 sunspots when emissions start to flatten and might even decrease if sunspots go above 300.
Down Javier’s rabbit hole again. There is no correlation between climate and sunspots – because climate change emerges from physical changes in ice, cloud, biology, dust…
Andy and Javier have put a lot of work into this so I will have to read the darn thing.
It will probably turn out to be mostly harmless but very interesting since they are doing a Douglas Adams type trilogy.
“The sun has been identified as the source of climate since the dawn of human intelligence”
The sun is technically only a heating source for the earth.
One could talk about a climate on a planet like Jupiter without having to invoke a sun at all.
Climate is the sum of
a rotating earth.
A hot core.
In our case an earth sized planet.
At 1au from the sun.
A solid ore based surface.
A temperature and pressure at a rotation speed that allows water to exist as oceans ice and clouds.
At a pH that reflects the alkalinity of the earth.
A biosphere that has changed the atmosphere to include 20% of oxygen that was not originally there
CO2 levels that are strictly an equilibrium balance between the ores of the earth and the temperature and pressure of the atmosphere.
Clouds
Coriolus effect.
The elliptical orbit and variable distance of the sun from the earth
The axial variability, wobble and incline.
Volcanoes,
Asteroids
Dust storms
Ice caps.
Rainfall
To name a few
And in the midst of this jumble of signals we try to see an effect of sunshine on climate that can be measured?
Well, yes , we can but only if we link them to existing real reproducible data on measured solar output.
Despite dumping on solar cycles there might be links to be found if it is real.
The problem is picking out patterns, which always exist in mountains of data, and as Willis said, wanting to believe the patterns are significant.
Data is important.
Theory is important.
Correlation?
It helps.
But it does not mean causation
angech, your generous comment is appreciated. Why bother to read before commenting? woke, woke, woke
True CG.
The subject matter has been around for a number of years.
The premise is made in the first few paragraphs.
The authors have put a lot of work into their ideas, investigations and theories.
I have, like yourself, retaken an active interest in the ideas over the past 10 years as they are presented.
I have put up a list of just a few things that effect climate other than the sun and it’s magnetic related sunspot cycles.
I have put up the coloured jelly bean argument.
I look forward to finding their views and proofs of detectable changes.
Javier and RIE are 10 points each in their responses.
Your point was taken into consideration before I deliberately posted my comments and hence before you were to make your comment
(Did not know it would be you)
Being woke means never having to say sorry, as I constantly find out from my kids.
“ I constantly find out from my kids.”
Me too.
At a family vacation last week with all my kids and grandkids together watching woke network news, I expressed my opinion about there being 34 genders. My leftwing daughter sternly said “Put a cork in it, Dad.”
Judith is desperate for things to post.
Solar cycles are real.
Solar cycles could be relevant if heat changes mirrored sunspot changes.
This might yet lead to reproducible proxy changes which might be sortable out from the chaff if the heat changes were big enough.
If any evidence exists these guys are looking for it.
This subject touches on nearly every other aspect of Climate change.
Give it a go.
This is the crux. (Read it all CG)
“In the 1980s, the sun-climate renaissance of the 1960s-70s was drained of energy by improvements in solar constant measurements. Cavity radiometers were first equipped in the Earth Radiation Budget experiment onboard Nimbus 7 satellite in November 1978. The Active Cavity Radiometer Irradiance Monitor (ACRIM) experiment started with the Solar Maximum Mission in February 1980. For the first time solar constant values reached the precision of two decimal places of a percent. The decrease in the solar constant from the 1980 solar cycle maximum to the 1986 minimum was determined to be 0.15%, or 2 W/m2. But the yearly change had already been determined by 1982 to be of only 0.02%.”
First up is the fact that we should have a 44 year record of overlapping solar temperature that can be directly and uniquely linked to solar cycle sunspot changes.
Not looking at the earth first, get the sun right first.
Then we need to estimate how much variability in a month and a year exists.
“Spacecraft measurements have established that the total radiative output of the Sun varies at the 0.1–0.3% level.
The decrease in the solar constant from the 1980 solar cycle maximum to the 1986 minimum was determined to be 0.15%, or 2 W/m2. But the yearly change had already been determined by 1982 to be of only 0.02%.
The orthodox view of the sun-climate effect at present can be summed up in Judith Lean’s 2017 review. The 0.1% increase in total irradiance between solar minimum and maximum is associated with an increase of 0.1 °C in Earth’s global surface temperature.
Then how good the variability with the cycle is
Data from 1923 to 1954 showed small variations associated to the solar cycle of 0.02–0.25% and a controversial increase of 0.2% during the 31-year period.
Conclusion.
200 years of research continues to show that most correlations in time turn out to be spurious (RIE chaos)
The more one looks the more Yankee baseball World Series one can link to the Solar cycle, in an inverse way.
People keep looking.
There is no very good link between solar radiation and solar sunspots.
There is evidence of 0.2% yearly variation which could ( lovely word) lead to substantial temperature change 1 C over 10 years but has not happened.
Even such small variations with all the other earthly inputs might cause 1C changes.
angech
“There is evidence of 0.2% yearly variation which could ( lovely word) lead to substantial temperature change 1 C over 10 years but has not happened.
Even such small variations with all the other earthly inputs might cause 1C changes.”
That’s right, solar energy output variations may cause 1 C surface temperature change over a solar cycle period.
Those changes, nevertheless, cannot change the millennia’s long orbital forced Warming Trend.
Polar ice’s gradual shrinkage is not caused by solar energy output periodical fluctuations.
It is caused by the steady and the continuous the millennia’s long orbital forced Warming Trend.
https://www.cristos-vournas.com
There is quite literally no correlation between solar activity and surface temperature.
https://watertechbyrie.files.wordpress.com/2022/08/tsi-.png
https://watertechbyrie.files.wordpress.com/2022/08/toa-net-flux.png
Recent (40 year) climate variability is the result of volcanoes, greenhouse gases and a substantial warming from cloud cover changes in the eastern Pacific Ocean.
So how are climate shifts in the Pacific caused by indirect solar effects? I’m pretty sure it is not Christos’ madness.
“So how are climate shifts in the Pacific caused by indirect solar effects?”
Like with the sharp drop in the solar wind temperature/speed in late 1976 following the fastest solar wind states of the space age through the early and mid 1970’s. That’s the great 1976-77 climate shift, from multi-year La Nina to El Nino. It’s a negative feedback.
I ask how and Ulric responds with more Wile E. Coyote science.
“Conclusion.
200 years of research continues to show that most correlations in time turn out to be spurious”
A definition of insanity is doing the same thing over and over expecting a different result.
Another definition would be to expect someone to prove what it has already been disproven.
Colin O. Hines was a great Canadian atmospheric physicist who did groundbreaking work in atmospheric waves, and died in 2020.
https://www.physics.utoronto.ca/people/memoriam/colin-o-hines/
He didn’t believe in a solar-climate effect, but he correctly deduced in 1974 that if it was real it should take place in the stratosphere and be mediated by atmospheric waves. The energy is not a problem as it is contributed by the waves.
That people like Willis Eschenbach after 200 years continue to look for solar-surface correlations and fail, and then reject a solar effect, shows that they also fail to learn from the work of others. Those that demand a solar-surface correlation to accept that the sun has an effect on climate change are in the same league. Who has demonstrated that solar variations are unable to strongly affect the climate of the planet without displaying a correlation with surface conditions?
If someone aspires to increase his knowledge of something as complicated as climate change he should come to it without assumptions about how things should work.
Understanding something as complex as climate requires eschewing glib assertions. There is far too much physical reasoning and too little empirical science.
Dewapoker adalah Web Slot Online Terpercaya dengan Provider game Terlengkap di Indonesia. Tidak cuma itu saja, ( https://mercatiendas.co ) pula mempunyai game yang Fairplay serta menguntungkan di tiap Taruhan- nya. Kemauan menemukan jackpot besar telah ada dengan gampang di dalam ( https://162.0.236.6 ) terpercaya. Sehingga dari dini ada bonus member 100% sampai kesimpulannya dicapai dalam banyak peluang.
stevenreincarnated | August 5, 2022
“I’m not sure the oceans can’t be a heat engine.”
–
Steve perpetual energy is sort of discredited.
Hence in the sense of producing new energy, like the sun, no.
There are a lot of mechanisms Gravitation and pressure based, coriolus etc that seem to produce energy (an engine) de novo, but in reality merely transform existing energy from one state to another
Energy can’t be created or destroyed – only transformed.
Ocean currents warm by changing albedo and water vapor. It doesn’t create energy. A combustible engine doesn’t create energy either.
Or the sun for that matter.
Robert:
“Energy can’t be created or destroyed – only transformed.”
What do you mean by that? Do you imply energy was always there?
https://www.cristos-vournas.com
Christos, try https://www.feynmanlectures.caltech.edu/I_04.html
Persistent solar signatures in cloud cover: spatial and temporal analysis
Voiculescu and Usoskin
Probably changes in solar output change ocean currents but that would take a while. No surprise you wouldn’t find a clear temperature signal in solar cycles. That would require a much more direct effect.
“ Probably changes in solar output change ocean currents but that would take a while.”
Thank you. I’ve been thinking about that for awhile. Hopefully, Javier will comment. Oceans have very long memory, with some circulation taking hundreds of years.
Rui Xing Huang, at Woods Hole Oceanographic Institution, is one of the foremost experts in ocean circulation, that has developed and tested several concepts that are now incorporated to models.
He has this to say:
“There is a huge heat flux through the upper surface of the ocean, but the ocean is not a heat engine; instead, the ocean is driven by external mechanical energy, including wind stress and tides.”
https://e-nautia.com/clubargon/disk/Partage/ERMs_ETM/huang_2004_energy.pdf
This is not how most people think about the ocean and climate. The main way to affect ocean circulation is through wind and tides that by far are the main ocean sources of mechanical energy. The sun affects wind circulation, and the moon affects tides.
Here is a nice detailed write-up on ocean currents:
https://oceanservice.noaa.gov/education/tutorial_currents/welcome.html
While the NOAA article is correct as far as it goes – there is no connection between the factors described and the resulting globally coupled ocean and atmospheric flow field. For that you need maths and physics.
http://people.atmos.ucla.edu/jcm/turbulence_course_notes/turbulent_flows.pdf
In fact I would go one step further and state that it is a fact that ocean currents are every bit as much a heat engine as the sun in concept. In both cases we aren’t arguing about the creation of energy. We are talking about the location of that energy. If you stopped all ocean currents we would end up in snowball Earth. It’s all about location, location, location.
“ocean currents are every bit as much a heat engine as the sun in concept.”
It has to do with the concept of heat engine. The ocean moves a lot of heat, but as it enters and exists through the same surface, it results in minimal work done. When you watch the ocean you see mechanical work in action, not thermal work.
What is the fundamental difference between the sun pushing more energy to the Earth and the ocean currents causing the reflection of less energy through reduced albedo and the retention of more energy through increased water vapor? Both cause more energy to be added to the system, no?
https://en.wikipedia.org/wiki/Heat_engine
The atmosphere converts heat to mechanical energy. The ocean does not. The atmosphere is a heat engine, the ocean is not. It is a thermodynamical concept. It has nothing to do with the amount of energy moving through them.
So the sunlight that gets reflected by albedo is somehow different than the sunlight that isn’t. You need to think this through a little better.
Unless of course you are arguing that neither the sun nor ocean currents are heat engines. That could be true according to definition. It’s also when I lose interest.
There is one way the Sun drives ocean currents directly, and that is through the halothermal circulation. The Sun evaporates sea surface water, driving the circulation. It is a heat engine.
The term halothermal circulation refers to the part of the large-scale ocean circulation that is driven by global density gradients created by surface heat and evaporation.
https://en.wikipedia.org/wiki/Halothermal_circulation
If you warm water it expands and gravity causes it to flow towards the poles. There’s another.
The reflected shortwave radiation does not enter the climate system and is not available to do work. The absorbed shortwave radiation is converted to thermal energy, does work, is converted to longwave radiation and exits the climate system. The energy can exit the climate system from nanoseconds to thousands of years after entering it.
Whether the sun is a heat engine or not is irrelevant to the Earth as it is so far removed. Heat engines operate with thermal energy, and the Earth does not receive thermal energy from the sun. Heat engines have a heat source and a heat sink that are at different temperatures. The higher the difference the more work it can be done, but their efficiency is limited by the Carnot theorem.
That the atmosphere is a heat engine has huge repercussions to climate, and above all to weather. Weather phenomena are the work output of the atmospheric heat engine.
” through the halothermal circulation. The Sun evaporates sea surface water, driving the circulation. It is a heat engine.”
As I said, the fact that the thermohaline circulation moves heat from the tropics to higher latitudes does not make it a heat engine. A heat engine converts thermal energy into mechanical energy.
Rui Xing Huang and Carl Wunsch say the ocean is not a heat engine. Perhaps they are wrong, but I find their argumeents very convincing and I have not read a good defense of why the ocean should be considered a heat engine.
I believe if the ocean were not a heat engine, the halothermal circulation would cease. The ocean currents create turbulence due to dissipative elements as well as turbulence caused as a result of flowing around obstacles. The circulation due to this cause has not ceased, therefore there has to be an input of energy. Heat causes the evaporation which in turn drives the circulation. Perhaps Rui Xing Huang and Carl Wunsch are using some specific definition of a heat engine that excludes the halothermal circulation, but it is driven by the Sun and the resulting heat in any case.
For example:
Olbers, D. and Zhang, J., 2008. The global thermohaline circulation in box and spectral low-order models. Part 1: single basin models. Ocean Dynamics, 58(3), pp.311-334.
“The importance of mixing in such THC models and, on the whole, in the dynamics of the MOC, was pointed out by Wunsch (2002), who triggered a series of papers (Wunsch and Ferrari 2004; Wunsch 2005; Kuhlbrodt et al. 2007, among others), clarifying that thermohaline loops can only exist over substantial depths in the ocean if either diapycnal mixing or wind-driven upwelling is present. These agents have to supply potential energy by transporting heat down from the surface and mix it with the deep cold watermasses or by drawing upward fluid from those heavy layers by vertical pumping. In this sense, the ocean is ultimately a mechanically driven engine rather than a heat engine, and THC models should be regarded as driven by the parametrization of mixing embedded in their governing equations rather than by the thermal and haline or density differences in their compartments.”
https://www.researchgate.net/profile/Dirk-Olbers/publication/225674553_The_global_thermohaline_circulation_in_box_and_spectral_low-order_models_Part_1_Single_basin_models/links/5d29f264458515c11c2db2dd/The-global-thermohaline-circulation-in-box-and-spectral-low-order-models-Part-1-Single-basin-models.pdf
I am still trying to find your point, Javier. If the ocean currents aren’t a heat engine how does that affect my argument? The energy imbalance caused by increasing the energy retained would drive the winds as a fuel source just as the sun wouldn’t be an engine but merely a fuel source.
I was replying to this comment by you and CKid:
“ Probably changes in solar output change ocean currents but that would take a while.”
Changes in solar output should not affect ocean currents directly because that requires mechanical energy. Changes in solar output must necessarily affect the atmosphere first. This is a crucial point for any solar-climate theory, and derives from climate thermodynamics. The source for a solar effect on climate resides in the atmosphere, not the surface or the ocean. Knowing some thermodynamics, one would not look at the surface or the ocean for a sun-climate effect. Andy and I will discuss energy and thermodynamics of the climate more thoroughly over Parts 3 to 5.
I see now why you brought it up but my statement didn’t specify how the currents would be changed so you had me very confused.
Btw, in models when they change the depth of solar penetration it changes the currents.
Thanks for that, Javier. I see the long-held beliefs about the THC may be wrong.
Javier
Several years ago because of thuggish, Mafia like, street level attacks by alarmists on a guy with initials W.S. I decided to research how much literature there was on solar. As a recall, I found a couple hundred papers just in the 2 preceding years. I concluded that if big oil had paid off all those authors, they wouldn’t have had any profits. That was about the same time when the prevailing alarmist line was there was no warming in the 1930s, no talk about a coming Ice Age in the 1970s, and no MWP and LIA globally. Since I knew from simply paying attention as a child that the 1930s line was wrong and I lived through the 1970s talk so that those arguments were both bogus. From further extensive research I knew their MWP and LIA contention was off base.
I had worked with politicians daily for 2 decades so I also knew BS when I saw it. That was when I really became suspicious of the establishment narrative.
I only have questions and a desire to understand the mechanisms and processes involved. My gut feeling is that solar has some role and the oceanic circulation has some role in long term climate variability. Hardly any insight. CO2 probably has some impact as well. But I have no idea about the relative proportions.
I’m here to learn and think about all the possibilities. Climate is an unimaginably complex subject and one that is endlessly fascinating.
One of my overarching themes in my comments over the years is that our species innately wants simplification, order and hierarchies where there might not be any. And the unknowns probably outweigh the knowns.
I look forward to the rest of your series.
“I only have questions and a desire to understand the mechanisms and processes involved.”
An open mind is a pre-requisite for learning. Skepticism is the armor that defends us from being infected by wrong ideas.
The sun warms oceans and the atmosphere slows cooling. A negative SAM spins up the South Pacific Gyre resulting in Bjerkmes feedbacks. These feedbacks do involve a transformation of heat energy to kinetic energy in wind driven currents in baroclinic oceans.
https://upload.wikimedia.org/wikipedia/commons/thumb/6/68/LaNina.png/440px-LaNina.png
‘The Bjerknes Feedback (BF) intensity, which dominates the development of ENSO, has been proposed to determine ENSO predictability.’
https://agupubs.onlinelibrary.wiley.com/doi/full/10.1002/2016gl071636#:~:text=The%20Bjerknes%20positive%20feedback%20describes,winds%20along%20the%20tropical%20Pacific.feedbacks
I’m not sure the oceans can’t be a heat engine. At least some models show that once poleward ocean transport is increase the warmth generated can be self-perpetuating.
‘We use National Centers for Environmental Prediction/National Center for Atmospheric Research reanalysis data to estimate the altitude and time lag dependence of the correlation between the interplanetary magnetic field component, By, and the geopotential height anomaly above Antarctica. The correlation is most statistically significant within the troposphere. The peak in the correlation occurs at greater time lags at the tropopause (∼6–8 days) and in the midtroposphere (∼4 days) than in the lower troposphere (∼1 day). This supports a mechanism involving the action of the global atmospheric electric circuit, modified by variations in the solar wind, on lower tropospheric clouds. The increase in time lag with increasing altitude is consistent with the upward propagation by conventional atmospheric processes of the solar wind-induced variability in the lower troposphere. This is in contrast to the downward propagation of atmospheric effects to the lower troposphere from the stratosphere due to solar variability-driven mechanisms involving ultraviolet radiation or energetic particle precipitation.’ https://agupubs.onlinelibrary.wiley.com/doi/full/10.1002/2014GL061421
https://agupubs.onlinelibrary.wiley.com/cms/asset/f56fcd9f-89d8-451e-b611-e2e626d958b0/grl52088-fig-0001-m.png
I suggest that polar surface pressure is the locus of the sun-climate indirect effect. Multi-decadal variability in the Pacific is defined as the Interdecadal Pacific Oscillation (e.g. Folland et al,2002, Meinke et al, 2005, Parker et al, 2007, Power et al, 1999) – a proliferation of oscillations it seems. The latest Pacific Ocean climate shift in 1998/2001 is linked to increased flow in the north (Di Lorenzo et al, 2008) and the south (Roemmich et al, 2007, Qiu, Bo et al 2006) Pacific Ocean gyres. Roemmich et al (2007) suggest that mid-latitude gyres in all of the oceans are influenced by decadal variability in the Southern and Northern Annular Modes (SAM and NAM respectively) as wind driven currents in baroclinic oceans (Sverdrup, 1947).
While in another comment you assert:
“There is quite literally no correlation between solar activity and surface temperature.”
Here’s a ‘time integrated’ NAO/AMO chart. The NAO varies with ocean and atmosphere coupling but also perhaps with some aspects of solar variability. It is similar to the Smeed et al chart I showed you some time ago – that you arbitrarily dismissed because it is inconsistent with your assumptions. The time integration of the NAO suggests that solar variability may be a spatiotemporal trigger for climate shifts.
https://www.researchgate.net/figure/The-relationship-between-NAO-and-AMO-in-the-observations-a-Lead-lag-correlations-between_fig12_324452579
https://watertechbyrie.files.wordpress.com/2014/06/smeed-fig-72-e1659831493667.png
That is bonkers, the colder AMO anomalies in the mid 1970’s and mid 1980’s were during positive NAO regimes, and the AMO warming 1995-1999 and 2005-2013 during negative NAO regimes.
My point is that you arbitrarily dismissed any link between solar and surface temperature, while posting the best you have learned on the subject from other commenters.
Yes – there is absolutely no statistical correlation between the NAO and surface temperature. The time integrated NAO is a different thing.
I have read 1000’s of scientific papers. I keep an open mind and I do hope I have learned something. I tend to try not to pull it out of my ass.
Energy and matter.
Two faces of one entity?
Any attractive force works on mystery.
No one throws a lasso over another particle and drags it closer.
The energy from the sun is fuelled, as far as we know from an amalgamation of space dust from previous stars.
Masses of hydrogen thrown together over a billion years then aggregating through gravity.
Not formed directly by gravity alone acting on a dust mass because it should originally all have been moving apart.
We still move through dust which adds to fuel to the sun, helping prolong the nuclear life of the sun.
The sun is a cauldron of hot motile plasma roiling through space.
It cannot have a constant temperature due to this constant boiling effect but gravity holds most of it in the confines of a tight ball which helps create a relatively constant rate of fusion and energy production according to its mass, hence a relatively constant heat output and temperature.
Earth does not receive a constant energy input because of its elliptical orbit.
It has a yearly cycle of hotter and colder temperatures .
In this sense a solar signal is quite easily detectable, called summer and Winter.
Trying to establish a signal for the smaller variation in solar output with solar cycles would be easy if the variation in energy output that is presumed by the authors to exist was of a similar magnitude to the orbital energy variation.
Happy if Javier could put up the percentage change from summer to winter to compare to the 0.1 change mentioned for solar cycles.
Since it has not been easy over 200 years to prove cycles nor are we putting up the 40 years satellite data showing obvious 11 year cyclical fluctuations
In solar output consistent with the solar cycles it is a hard sell.
I do not see how theory aligns with a convoluted model of small high in the atmosphere changes running through a chain of exponential effects to produce a recurrent , persistent , common outcome.
I am much happier with a model of magnetic change linked to sunspot activity without the gravity based hydrogen fuelled mass having to cyclically
change temperature due to an unknown and possibly unobservable mechanism.
“The effect of a grand solar minimum, like the Maunder Minimum, is considered to be less than a few tenths of a °C of global cooling (Lean 2017).”
Yet the globe warmed during the late 1800’s centennial solar minimum, and warmed during the current centennial solar minimum. Obviously there was an increase in negative North Atlantic Oscillation conditions through the Maunder Minimum for the cold in Europe. But the negative NAO will be associated with a warmer AMO, and and slower trade winds, meaning increased El Nino conditions.
Centennial solar minima have a moderate effect and that if the multidecadal oscillation is not opposing it. We are seeing the same during the present extended minimum. There is no cooling, just reduced warming. If the AMO turns before it is over we should see slight cooling. Nothing that could not be adjusted out of the datasets.
“Centennial solar minima have a moderate effect and that if the multidecadal oscillation is not opposing it.”
The AMO is always warmer at least during each centennial solar minimum, because the warm AMO is negative NAO driven.
“There is no cooling, just reduced warming.”
Without the AMO acting as a negative feedback to weaker solar wind states since 1995, the globe should have cooled from 1995.
Greenhouse effect… is it real? Nope– the analogy that increasing atmospheric CO2 acts like a greenhouse has been shattered and scientific skeptics of AGW have known that for years.
You must know that no one believes that it is an actual greenhouse?
… much like everyone knows climate change is not caused by modernity?
A driver of climate change is greenhouse gas emissions. Assuming contrary to the physics that it isn’t drives ever more convoluted sceptic post hoc rationalisations.
If climate change alarmists really believed humanity’s CO2 was really heating the globe they would not oppose nuclear energy. The only similarity to a greenhouse is that CO2 ‘greens’ the globe.
ffs – even Joe Biden in favour of nuclear power
Has shellenberger asks in a recent Forbes article… But if Sanders, Thunberg, and Extinction Rebellion are so alarmed about carbon emissions, why are they fighting to halt the the huh use of fracking and nuclear?
https://evilincandescentbulb.files.wordpress.com/2022/06/img_20220616_180814.png
Academia vs the scientific skeptics of the man- caused Hot World fanaticism is the obverse of the vaccine scientists of Covid-19 vs the anti-vaxx disinformation industry. In both instances, fake news rewards the religious zeal of charlatans and quacks to take full advantage of the credulous, superstitious and ignorant among us.
I don’t thick there is such a thing as a scientific sceptic – except in the fundamental sense of ‘nullius in verba’. Sceptics assume there is no greenhouse effect – and are very creative in devising a plethora of mutually exclusive alternatives. Let’s call it cognitive dissonance. I think that there is ample evidence to accept greenhouse theory – in a spatiotemporal chaotic system. If you are going to be political – it’s more than time to move on to solutions because you have that argument.
The solution is capitalism and rational economic policy. Rational economic policy might additionally keep the US from in future leading the rest of us down the rabbit hole of asset inflation bubbles and recession. WTF did you expect from quantitative easing?
Gerhard Gerlich and Ralf D. Tscheuschner proceeded to falsify AGW theory by demolishing the Left’s atmospheric greenhouse conjecture: “an idea the authors trace back to the traditional works of Fourier 1824, Tyndall 1861 and Arrhenius 1896, but which is still supported in global climatology, essentially describes a fictitious mechanism by which a planetary atmosphere acts as a heat pump driven by an environment that is radiatively interacting with but radiatively equilibrated to the atmospheric system.” Given, “the second law of thermodynamics,” G&T show that, “such av planetary machine can never exist.”
Wagathon | August 6, 2022
“Greenhouse effect… is it real? Nope
–
the analogy that increasing atmospheric CO2 acts like a greenhouse has been shattered.”
An analogy is a comparison for effect.
It cannot therefore be shattered.
That CO2 is a GHG is a statement and by definition therefore correct.
Therefore it acts like a GHG.
The amount of CO2 in the atmosphere is totally dependent on its equilibrium with the CO2 substrates in the earth (and by extension the sea.
Minor perturbations by biomass change summer to winter, volcanoes and ocean outgassing with temperature changes are far greater than the combined yearly human actions of pumping a few GGT into the air which equilibrate almost instantly.
Proof?
The lack of ocean acidity increase in areas where this is occurring.
Scientists and most skeptical scientists accept that the level of CO2 equates to a change in surface temperature.
Wagathon and CO2 is life do themselves an injustice by trying to discredit the concept of back radiation.
The failure of the Climate change warming argument is not the scientific theory but the addition of unwarranted feedback mechanisms and a failure to underpstand the importance of energy fluctuation due to both sun and albedo (cloud) changes.
Acidification is an impossibility because the oceans are infinitely buffered…
Gerhard Gerlich and Ralf D. Tscheuschner proceeded to falsify AGW theory by demolishing the Left’s atmospheric greenhouse conjecture: “an idea the authors trace back to the traditional works of Fourier 1824, Tyndall 1861 and Arrhenius 1896, but which is still supported in global climatology, essentially describes a fictitious mechanism by which a planetary atmosphere acts as a heat pump driven by an environment that is radiatively interacting with but radiatively equilibrated to the atmospheric system.” Given, “the second law of thermodynamics,” G&T show that, “such av planetary machine can never exist.”
Back radiation…? Gerhard Gerlich and Ralf D. Tscheuschner proceeded to falsify AGW theory by demolishing the Left’s atmospheric greenhouse conjecture: “an idea the authors trace back to the traditional works of Fourier 1824, Tyndall 1861 and Arrhenius 1896, but which is still supported in global climatology, essentially describes a fictitious mechanism by which a planetary atmosphere acts as a heat pump driven by an environment that is radiatively interacting with but radiatively equilibrated to the atmospheric system.” Given, “the second law of thermodynamics,” G&T show that, “such av planetary machine can never exist.”
A few extremist ideologues – much like fringe extremists on the other side.
Winning the politics means winning the broad centre.
‘The world is going to end in 12 years if we don’t address climate change.’ ~Ocasio-Cortez
The mechanistic links between some aspect of solar variability and major modes of climate variability is an active area of research. It may offset a little AGW.
https://www.nature.com/articles/s41598-019-38626-3
https://www.ncbi.nlm.nih.gov/pmc/articles/PMC4758621
“The mechanistic links between some aspect of solar variability and major modes of climate variability is an active area of research. It may offset a little AGW.”
Correct, except for the “little” part as nobody is able to properly quantify AGW and solar effect.
From your second reference:
“The impact on global mean near‐surface temperature is small (∼−0.1 K), but larger changes in regional climate occur during the stratospheric dynamically active seasons. In Northern Hemisphere wintertime, there is a weakening of the stratospheric westerly jet by up to ∼3–4 m s−1, with the largest changes occurring in January–February. This is accompanied by a deepening of the Aleutian Low at the surface and an increase in blocking over Northern Europe and the North Pacific. There is also an equatorward shift in the Southern Hemisphere midlatitude eddy‐driven jet in austral spring. The occurrence of an amplified regional response during winter and spring suggests a contribution from a top‐down pathway for solar‐climate coupling”
‘They found that a descent into MM‐like conditions over the next ∼70 years would only decrease global mean surface temperatures by up to ∼0.2 K, with some uncertainty depending on the assumed reconstruction of past TSI. Feulner and Rahmstorf [2010].’
https://qph.cf2.quoracdn.net/main-qimg-1e7c61564dd850b4a2b075b45e26b195-pjlq
Nobody can find the future effect of something when the mechanism is unknow.
That conjecture based mainly on the change in TSI, and the effect of the 11-yr cycle is not supported by paleoclimatological evidence of what happened during many of the grand solar minima that have taken place during the Holocene.
Luckily that prediction will not be put to the test any time soon. I would hate to be proven right by a severe cooling of the world.
Incorrect j
Incorrect Javier. The model rationale was to explore how solar UV variability affects climate. It drives changes in the NAO. The Swallow Lake ENSO proxy shows La Nina dominance in the centuries before 1900.
Javier sets himself up as the arbiter of right and wrong. Contrary to the facts and really annoying. I linked to a paleoclimate temperature reconstruction – Javier hand waves but paleoclimatology.
“The model rationale was to explore how solar UV variability affects climate.”
The record is too short and does not include any solar grand minimum, so the prediction does not hold water. Only paleoclimatology remembers what happens during several SGM separated by c. 200 years. And the answer is severe cooling, frozen Thames fairs, and glaciers growing into farms and villages.
We may be able to model things that we don’t know well, but those models have no value.
They modelled a descent into a grand solar minimum. Cold NH winters are driven by changes in the NAO. Does this change the energy content of the planet?
e.g. https://iopscience.iop.org/article/10.1088/1748-9326/5/2/024001
The state of the Pacific does through cloud cover changes in the eastern Pacific. A cool state is triggered by increased flow in both the north and south
“Cold NH winters are driven by changes in the NAO. Does this change the energy content of the planet?”
Absolutely yes.
Absolutely yes? Without a doubt? Not a hint of a mechanism? Seems quintessentially Javier.
” Not a hint of a mechanism?”
You have sufficient knowledge to deduce it by yourself. If you are unable to do so you will have to wait until I post it.
Energy in changes very little. Energy out changes with ice, cloud, dust. vegetation, volcanoes and planetary temperature. I asked the question – but those changes cannot be quantified prior to the satellite era.
Javier | August 6, 2022 at 4:39 pm |
“Nobody can find the future effect of something when the mechanism is unknown.”
“We may be able to model things that we don’t know well, but those models have no value.”
Yet “ Yet Alfred Wegener changed the way we see the world without having the geophysical knowledge to develop the tectonics theory. When asked what was the mechanism for his continental drift theory he said the Coriolis force. He knew he was right about the continents because he was following the evidence, not the theory.
In science all it is required is to be right when everybody else is wrong, as Richard Feynman famously said”
Interesting dichotomy
Javier said I know enough to work it out. So why does he always rudely insist that anything I say is incorrect or inferior? There are far more odious and far less informed denizens of this would be echo chamber for dyed in the wool barbarians at the gates of science. I would prefer a sharing of data and ideas but that can’t be can it.
This is the winter Southern Annular mode (SAM) from the British Antarctic Survey. It’s the ‘winter gatekeeper’ because the polar annular modes are more active in their respective winters. But to bring it into the physical world of hydrodynamic, spatiotemporal chaotic flow one needs the grye hypothesis.
e.g. https://digitalcommons.uri.edu/gsofacpubs/140/
http://www.nerc-bas.ac.uk/public/icd/gjma/newsam.win.pdf
http://www.nerc-bas.ac.uk/icd/gjma/sam.html
‘Only paleoclimatology remembers what happens during several SGM separated by c. 200 years. And the answer is severe cooling, frozen Thames fairs, and glaciers growing into farms and villages.’
The Maunder Minimum was a bit cooler in Central England. There was a large Papua New Guinea volcanic eruption in there somewhere. How much was cold arctic air and how much was caused by an energy imbalance at TOA? The former is regional cooling and the latter is global climate variability.
https://www.metoffice.gov.uk/hadobs/hadcet/
… Pacific gyres. Javier has not the systems theory, math or geophysical knowledge needed to develop a conditional climate synthesis. Conditional on acknowledging uncertainty – something Javier cannot do it seems.
” Javier has not the systems theory, math or geophysical knowledge needed to develop a conditional climate synthesis.”
Yet Alfred Wegener changed the way we see the world without having the geophysical knowledge to develop the tectonics theory. When asked what was the mechanism for his continental drift theory he said the Coriolis force. He knew he was right about the continents because he was following the evidence, not the theory.
In science all it is required is to be right when everybody else is wrong, as Richard Feynman famously said. And most scientists strive to be wrong by joining consensuses.
Robert I. Ellison | August 6, 2022
Au contraire.
Javier definitely has the systems theory, math or geophysical knowledge needed to develop a conditional climate synthesis.
No need to insult people to disagree with them ( conditional perhaps on if they insult you first?)
Javier not only has the knowledge to put up a climate synthesis but the chops to do so and is way ahead of a lot of people in politeness.
You have both had op eds here and I have enjoyed reading both.
Your fixation ( blinkering ) is CO2 rise being totally human induced and dangerous.
It seems you cannot acknowledge other causations.
Javier wants to find a solar cycle temperature link but misses the first step.
Mine is arguing with other people whether they are right or wrong.
Or should that be whether I am right or wrong.
Fortunately I do not know that I lack insight.
‘Climate is ultimately complex. Complexity begs for reductionism. With reductionism, a puzzle is studied by way of its pieces. While this approach illuminates the climate system’s components, climate’s full picture remains elusive. Understanding the pieces does not ensure understanding the collection of pieces. This conundrum motivates our study.’ Marcia Wyatt
angech the complete contrarian. Systems thinking looks at things in a different way. We look for emergent behaviour in a climate system that does shift dramatically and abruptly with small changes in system components.
‘Systems Thinking has been defined as an approach to problem solving, by viewing “problems” as parts of an overall system, rather than reacting to specific part, outcomes or events and potentially contributing to further development of unintended consequences. Systems thinking is not one thing but a set of habits or practices [1] within a framework that is based on the belief that the component parts of a system can best be understood in the context of relationships with each other and with other systems, rather than in isolation. Systems thinking focuses on cyclical rather than linear cause and effect.’ http://environment-ecology.com/general-systems-theory/379-systems-thinking.html
As for insults they are ubiquitous. Mine are modest and are based mon truth. A lack of system theory is evident and cartoon science widespread. I suggest that snowflakes stay out of the kitchen if they are offended by that.
“Systems Thinking has been defined as an approach to problem solving, by viewing “problems” as parts of an overall system”
System theories as you describe them have been around a long time under various names.
The one I enjoyed the most was the Null A SF books with a Gilbert Goseyn (sic).
I’m Ok, your OK was another.
Mindfulness was a theme at various stages and reflective practices formed a large part of the Australian psychological self help scenes.
As my mate Kenny would say, snowflakes have to toughen up.
As the infamous RBG (and Cisco kid!) said speak softly and only after listening first. Modesty is not one of your failings.
All I ask is a little self introspection, an application of your methods to yourself and a new sparkling RIE on the side of contrarianship.
I am a blunt working class Australian. I don’t suffer contrarians who dogmatically repeat memes they insist is the one true science. It’s all talk and that’s not science at all. The oceans as I have said to you is a net carbon sink – it’s how the carbon cycle works. But by all means do a Fermi calculation using Henry’s law and see for yourself. Else it’s omnia in verba.
The system is spatiotemporally chaotic and if you understood what that means you wouldn’t be rabbiting on as you do.
Robert I. Ellison
“I don’t suffer contrarians who dogmatically repeat memes they insist is the one true science. The system is spatiotemporally chaotic”
Phew! Safe. I agree with you.
“ . The oceans as I have said to you is a net carbon sink – it’s how the carbon cycle works”
Two out of two
“by all means do a Fermi calculation using Henry’s law and see for yourself.”
Definitely not “a working class Australian” now, maybe when much younger. blunt yes.
How much does CO2 rise with a 1C rise in temperature in your opinion?
Is it really only 10 ppm , sounds far too low. Thanks.
I have been called – by a friend – a working class lad done good. I object to that too. I worked in construction while I studied engineering. It took 10 years of long days and late nights – but what else is a poor white boy to do.
Let’s do a Fermi calculation. There is some 5 degrees C change between glacials and interglacials and a change in CO2 of about 100 ppm,
ΔCO2/degree C = 100/5 = 20 ppm/degree C
Thanks Robert
“Let’s do a Fermi calculation. There is some 5 degrees C change between glacials and interglacials and a change in CO2 of about 100 ppm, ΔCO2/degree C = 100/5 = 20 ppm/degree C”
A lot of different leads.
I note Henry’s Law. Posted on October 28, 2013 by …and Then There’s Physics in his previous incarnation describing M Salby.
He gives 6 ppm/degree C at around 15C from the sort of calculations one would think the law would give but 120 ppm/C for Salby.
His choice of parameters leaves a lot to be desired ( my bias).
I was anticipating off my own bat a higher level based on my ideas of earth atmosphere CO2 equilibrium.
One of the mysteries which your approach overcomes is the delay or lag of CO2 rise and fall with temperature changes.
Up to 800 years is a bit ( to say the least ) long for a simple chemical heat pressure relationship.
This lag time is also evident in ATTPs and others long reaction to CO2 rise for temp rise.
The issue seems to be studiously ignored on my web searches for such a simple question.
My idea of a simple substrate, atmosphere, equilibrium reaction at current atmosphere and pressure being only able to give one simple answer.
In a short time frame.
Obviously does not have a simple solution.
I think if the answer lies between 6 and 120 ppm then blaming CO2 increases on humans would be on shaky grounds
Apparently the ocean is a sink at 15C global average but a source at over 25 C?
The first and obvious mistake ATTP made is in only considering CO2 exchange to take place in water in the ocean rather than as I point out over the whole surface interface with the earth.
And to only claim it down to 100 meters in the ocean..
However his explanation for the maths, which you would understand seems to be pretty good.
I will go off and do my own contrarian stuff on this as I am not sure whether I am contradicting or bolstering his claims
What is the ocean temp now – 15.2 degrees C?
My Fermi calculation is a sanity check. You should try it some day. 😉 It all comes from biokinetics of photosynthesis and respiration on land. A much more difficult proposition.
https://www.nature.com/articles/nature08930
I agree with what angech says above!
https://www.cristos-vournas.com
You’ll have to be a bit more specific than that Christos. And you forgot to cut and paste your usual cr@p.
Wow, this is really interesting! Love the coverage of historical data. I can’t wait for the next instalment, keep them coming please Judith.
Pingback: Der Sonne-Klima-Effekt: Die Winter-Pförtner-Hypothese (I). | EIKE - Europäisches Institut für Klima & Energie
Pingback: Der Sonne-Klima-Effekt: Die Winter-Pförtner-Hypothese (I). • Cottbuser Freiheit
Pingback: Der Sonne-Klima-Effekt: Die Winter-Pförtner-Hypothese (I). - FreeSpeech.international
This is such a wonderful read, involving and beautifully paced without ever resorting to lecture. Like any good detective story the authors reveal and present the evidence in such a way as we understand ‘what the crime supposedly is’, the characters involved, how the evidence has been collected, produced and received by those claiming to be able to solve the puzzle almost up to the present day. We are invited to determine, if we wish to do so, at each stage of the unravelling, what or whodunit. But such is the quality of the writing that only after we have heard the whole story as far as it can be told, can we be sure we will know what the crime is and, therefore, who is guilty.
I have read this Part One three times already both because it is so well written it invited me to do so and each time has offered a slightly different perspectives on what the likely red herrings are and what the real evidence tells us about the nature of the supposed crime itself. I know the forces out there are desperately trying to arrest CO2 but have they identified the real crime and found the right culprit? Thus far there seem to be considerable grounds for doubt.
I am really grateful to all concerned and for Dr Curry for publishing it here.
‘The academic reputation of the field of Sun-climate relations is poor because many studies do not address all, or even some of, the limitations listed above. It is also a field that in recent years has been corrupted by unwelcome political and financial influence as climate change sceptics have seized upon putative solar effects as an excuse for inaction on anthropogenic warming. In particular, figures and statistics with known errors, limitations and inaccuracies are repeatedly reproduced on the Internet and in the media (as discussed, for example, by Damon and Laut 2004), and publications are reported in a massively selective manner. None of this makes any difference to the scientific reality, or otherwise, of mechanisms connecting solar variability and Earth’s climate; however, it does make evaluation of the evidence much more difficult. Recent reviews have been presented by Reid (2000), Rind (2002), Haigh (2003, 2007), Beer (2006), Foukal et al. (2006), de Jager (2008), Gray et al. (2010) and Lockwood (2004, 2010, 2012)…
Feulner and Rahmstorf (2010) and Jones et al. (2012) have used GCMs and EBMs to predict that this will offset anthropogenically rising global temperatures by no more than about 0.2°C in the year 2100, relative to what would happen if the solar output remained constant. Similarly, Lean and Rind (2009) find that the solar decline would delay the arrival at a given temperature level by no more than about 5 years. Thus, these predictions show that continued solar decline will do little to alleviate anthropogenically driven global warming. However, the decline should do much to end the debate about the fraction of global warming that can be attributed to solar change. For the first time since about 1900, long-term solar and anthropogenic trends are now in opposite directions. Non-robust fits will fail sooner rather than later because of the change in solar behaviour. Thus, the next few years will give us much better estimates of the solar contribution to both global and regional climate change. For global temperature rise, there is every indication that these new estimates will, if anything, be smaller that previous estimates. ‘
While consensus is an oddly contrived notion – some paradigms are more popular than others among informed scientists. Here’s an alternate history provided in the interest of being able to walk and chew gum at the same time.
https://link.springer.com/article/10.1007/s10712-012-9181-3
Exactly as I said:
“The orthodox view of the sun-climate effect at present can be summed up in Judith Lean’s 2017 review. The 0.1% increase in total irradiance between solar minimum and maximum is associated with an increase of 0.1 °C in Earth’s global surface temperature. There are dynamic processes that alter the regional response both at the surface and in the atmosphere. The effect of a grand solar minimum, like the Maunder Minimum, is considered to be less than a few tenths of a °C of global cooling (Lean 2017).”
Thank you for adding another (older) reference to the orthodox view.
It’s a recent reference from Mike Lockwood. And he says that we will soon know – with a decline in solar activity and a still warming world – what the dominant cause of recent warming is.
The subtext is crystal clear – explicitly with Javier. Greenhouse gases has no effect on climate. It couldn’t possibly be so because science that says otherwise is inferior without a shadow of a doubt.
“It’s a recent reference”
It’s 5 years older than the one I gave. It is 10 years old.
“Greenhouse gases has no effect on climate.”
I’ve never said that. You are using straw man fallacy.
I have not a clue
This is getting silly. I have ordered a new keyboard.
Let me know what that reference is – unless you think I should work it out for myself. And I not in the habit of lying. So how much influence do you imagine AGG has on recent warming?
Lean, J.L., 2017. Sun-climate connections. In Oxford Research Encyclopedia of Climate Science.
https://oxfordre.com/climatescience/view/10.1093/acrefore/9780190228620.001.0001/acrefore-9780190228620-e-9
“So how much influence do you imagine AGG has on recent warming?”
I see no point in imagining things, but considering that the combination of the multidecadal oscillation and solar forcing was responsible for the early 20th century warming, and that the current period of rapid GHG increase since 2000 is seeing a reduced rate of warming (the pause and all that), I would say it is difficult to defend that anthropogenic emissions are responsible for more than half of the observed warming.
It is curious how having no clue of my views on climate change you have such a strong opinion on them. I would say it denotes that you reach conclusions without sufficient data even when obtaining the data is easy.
‘It is a challenge to communicate the simultaneous limitations and potential of the changing Sun to change Earth’s climate and atmosphere, and the complexity of the connections. Some consider the Sun to be a major cause of climate change; others insist its influence is negligible. This bifurcation underscores public debate about the extent of natural versus anthropogenic influences on Earth’s climate. That the Sun’s radiative output changes is now indisputable; that these changes initiate myriad complex responses throughout the Earth system, currently and in preindustrial times, is also increasingly well established. But the magnitude of solar-produced climate change is significantly smaller than that imposed by increasing greenhouse gases in the past century, and expected during the next century.’
I think you are motivated to construct a narrative in support of a predetermined conclusion – and are arrogant enough to insist on it’s absolute truth. I note that you still don’t provide any quantification of anthropogenic v. natural variability. Even one that is uncertain.
I pay little attention to surface temperatures. Thermometers don’t capture latent heat at the surface. Basic physics. But the world is warming still.
https://images.remss.com/msu/msu_time_series.html
The attribution btw is about 50/50 in the past 40 years. – https://www.nature.com/articles/s41612-018-0044-6 –
“I think you are motivated to construct a narrative in support of a predetermined conclusion”
And you are wrong as usual, because you reach your conclusions disregarding the evidence.
Robert:
“…the magnitude of solar-produced climate change is significantly smaller than that imposed by increasing greenhouse gases in the past century, and expected during the next century.”
Yes, it is very difficult to convert your old-fashioned opinions, Robert…
But I don’t give up hope though… I never give up hope one day you will be a converted scientist…
https://www.cristos-vournas.com
Don’t bother in my account.
It’s a working hypothesis based on observations.
Ahha, I get it now… talk about the concept of back radiation gets you incinerated alive by Greenhouse Dragons.I’m So be it although, experiments said to show that cool objects can keep warm objects warmer seem oblivious of evaporative and convective heat transfer to the point of being comfortable calling the 2nd law of thermodynamics a myth.
The sun warms oceans and the atmosphere slows cooling/ How can these global warming zealots be so stupid?
The unique properties of water are truly unique so you can’t blame Hot World fabulists for their inability to comprehend.