
by Guido van der Werf
The 200% increase in fossil fuel emissions Murry Salby claims is about 20% in reality, and the constant CO2 growth rate he found actually increased by roughly 20% as well over the same time period.
The broad scientific consensus is that the increase in atmospheric CO2 concentration from about 280 parts per million (ppm) before the industrial revolution to about 400 ppm today is due to the combustion of fossil fuel and deforestation. Many lines of evidence support that statement, from bookkeeping to sophisticated measurements of oxygen and carbon isotopes.
Murry Salby disagrees though and in a recent talk stated that “The premise of the IPCC that increased atmospheric CO2 results principally from fossil fuels emissions is impossible”. This received a lot of attention in especially the more skeptical community and at very first glance Salby seems to base his message on an interesting finding. When viewed more carefully, I think the conclusion is wrong though and below I try to show why. Let’s start with understanding his reasoning.

Figure 1, replicate of the figure Murry shows after 8 minutes and where he plots fossil fuel emissions. The key message is that the growth in fossil emissions after 2002 was three times as large as before that year, 3% per year after 2002 and 1% before. He mentions that fossil fuel emissions have increased by a factor 3 and that this should be seen in the atmosphere so let’s look at the atmospheric CO2 measurements.

Figure 2 replicating Murry’s figure about 9 minutes into his talk. This is monthly atmospheric CO2 data, and d1 and d2 seem virtually identical. In other words, there seems to be no increase in the CO2 growth rate which apparently led Salby to reject the general consensus that increased atmospheric CO2 concentrations result principally from fossil fuels emissions.
So what is wrong? Basically two things. Most importantly, fossil fuel emissions have fortunately not increased by a factor 3 over the past two decades. Let’s plot Figure 1 again but now a) add CO2 emissions from deforestation because that is another anthropogenic source of CO2, b) have the y-axis start at zero, and c) focus on actual emissions instead of the growth of emissions because that is what matters. The figure then looks like this:
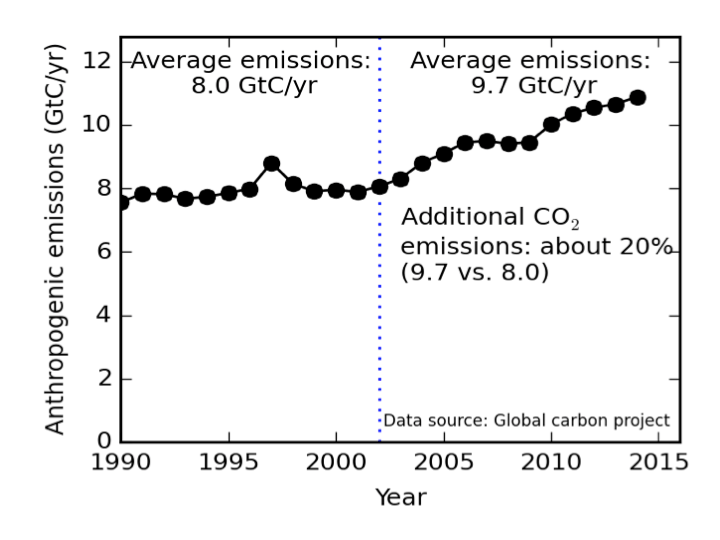 Figure 3, please keep in mind this is based on exactly the same data as Figure 1 except for the deforestation part. Deforestation emissions have decreased somewhat over time but are in general a minor contribution, roughly 10% of total anthropogenic emissions. The uptick in 1997 is due to peat fires in Indonesia during that year, these estimates are based on the work my lab carries out in collaboration with US colleagues at NASA and UCI.
The increase suddenly looks less impressive and is about 20% instead of Salby’s 200%. However, it is still strange that this is not seen in the atmosphere. Or is it? I actually think it is and d2 was 10% larger than d1 in Figure 2 but this depends on exactly which start or endpoint one uses. However, it is difficult to see these details when you plot it as in Figure 2 and that is the second thing that went wrong in his analysis.
You could see it though; if one looks carefully the linear trend line in Figure 2 (the green line) does not fully capture the signal. But let’s not do this visually but have a proper look at the data instead. By taking out the seasonal cycle and focusing on the actual annual growth rate the patterns become much more apparent (and interesting!):

Figure 4 which shows the same data as Figure 2 but now the focus is on where it should be: the annual growth rate. This varies much more from year to year than the anthropogenic emissions and since the 1970’s we know that the natural carbon cycle is slightly out of balance during El Nino and La Nina periods and after volcanic eruptions: low growth after the eruption of Mt. Pinatubo in 1991 and after La Nina’s, high growth rates after El Nino’s, see the peak in 1998 and also 2016 is on track to be record setting. The exact mechanisms are still not fully understood though.
On topic: the growth rate actually does increase, see Figure 4. Exactly how much is difficult to say over such a short time period, I only added the green and yellow line to compare them with Salby’s results but by slightly modifying the years over which one averages the increase can be roughly between 10 and 30%.
In summary, the 200% increase in fossil fuel emissions Murry claims is about 20% in reality, and the constant CO2 growth rate he found actually increased by roughly 20% as well over the same time period. In other words, nothing that challenges our current understanding of the global carbon cycle where most research is geared towards understanding whether it will keep up with growing fossil fuel emissions or become a positive feedback on climate change.
Biosketch: Prof. dr. Guido van der Werf is a faculty member of Earth and Life Sciences at Vrije Universities Amsterdam. His research focuses on the global carbon cycle and interactions with the climate system. Funded by several national and international grants including a prestigious European Research Council (ERC) grant he is specifically interested in forest fires and deforestation. Combining biogeochemical modeling, satellite data, and atmospheric modeling enables him and his group to quantify fire and deforestation carbon emissions, and these are the basis for exploring their response to climatic, demographic, and socio-economical changes. In addition, satellite data is used to test ecological hypotheses over large scales and drones are used to investigate fire plume chemical composition. He is a contributing author to the IPCC AR5 and member of the Global Carbon Project, GOFC-GOLD fire implementation team, and Carbon Community of Practice.
JC note: Guido sent this to me via email in response to my post on Murry Salby’s talk. This is exactly the sort of thing that I hoped my post would elicit (but didn’t expect). Pls make an extra effort to keep your comments civil and relevant.

Pingback: Broad consistency between patterns of fossil fuel emissions and atmospheric CO2 – Enjeux énergies et environnement
At 200 ppm we all starve to death. At 400 ppm we argue over wiggles in a graph. Which side do you want to be on?
Rokshox Aug 12 12:51am – The wiggles weren’t enough to make the case, so deforestation got pulled into the equation. Funny thing is, the world has been re-foresting quite significantly, not de-foresting. If SST had been pulled in instead, the opposite case could have been made. So this article is badly flawed.
Trouble is, Murray Salby’s case is badly flawed too. Fact is, recent decades’ CO2 increase is roughly half the man-made output and it is pretty difficult to make the case that it would have gone up that much without the man-made CO2 (I calculate it would have gone up by just a few percent of the observed increase). [Sorry, no supporting links, I’m travelling and out of time.]
I disagree Mike – leaving out deforestation does not impact the results, it just provides a less complete story. It is not about wiggles but about decadal changes. And reforestation is one factor why not all our emissions stay the atmosphere. Please back up your claims about SST with a graph or link before stating something is badly flawed, SST and CO2 growth co-vary because they are both driven by ENSO on annual timescales, but that is another story that Salby misused in one of his earlier lectures.
http://www.woodfortrees.org/graph/plot/esrl-co2/from:1958/mean:24/derivative/plot/hadsst3gl/from:1958/scale:0.23/offset:0.095
http://www.woodfortrees.org/grap/plot/esrl-co2/from:1958/mean:24/derivative/plot/hadsst3sh/from:1958/scale:0.24/offset:0.1
http://www.woodfortrees.org/graph/plot/esrl-co2/from:1958/mean:24/derivative/plot/hadsst3sh/from:1958/scale:0.24/offset:0.1
afonzarelli The correllation is already known about (since the mid 1970s), but it doesn’t tell you anything about the cause of the long term rise in atmospheric CO2. The reason why is explained in detail here:
http://www.skepticalscience.com/salby_correlation_conundrum.html
The middle graph is missing an “h” in the word graph (disregard). The lower graph uses southern hemisphere data which is a better fit with the satellite data. As you can see carbon growth tracks with temperature for the entire duration of the mauna loa data set. For all you engelbeen fan boys out there, the trend features of the graph cannot be curve fitted. While the slopes of the graphs of the two data sets can be fitted (as i have done…), the trend features cannot be fitted having done so. Engelbeen (probably) rightly has the short term inter-annual variability pegged as due to vegetation, but has no answer as to why the longer term trend features are a match. This bears watching as we head forward. If we see cooling on the horizon and those trend features go down with temps, then the relationship of temperature to carbon growth will be affirmed. As it is, with over half a century of data, we seem to have affirmation enough…
The correlation between the CO2 derivative and temperature is understood in terms of the natural sink being less effective in warmer years. For the ocean, this can be understood in terms of chemistry, but for the land it is less obvious why.
Dikran (or gavin…), i’m not making a claim regarding the nature of the rise here. Simply that there is a correlation between temperature and carbon growth for whatever the reason… As regards the mass balance argument, i regard it as junk. You and i had a heated exchange over at dr spencer’s blog on this very topic about two years ago. (you stormed off without having finished the debate) Just remember that the entire rise in co2 COULD still be there in the absence of human emissions in which case human emissions would be having no impact on carbon growth. There are other arguments against the mass balance argument as well. Not sure i have the time (nor the energy) to cover them with you today. (plus, i’m not sure whether or not i’m inclined to go back and forth with you on this because last time you were quite obtuse and rather rude)…
afonzarelli ” Simply that there is a correlation between temperature and carbon growth for whatever the reason…”
The reasons have been pretty well understood for a long time, and as I pointed out the corellation can no mathematical link to the cause of the long term rise in atmospheric CO2 because the long term rise depends on the average value of the growth rate and the corellation is entirely insensitive to that average value (indeed the offset is arbitrary and in this case just chosen to make the two plots line up).
As regards the mass balance argument, i regard it as junk.”
Fine, if you think that conservation of mass is junk (which is all that the mass balance analysis amounts to) then you disagree with Prof. Salby as well as with me and the worlds carbon cycle researchers. Of course, rather than just saying it is junk, you could point out the exact flaw.
Jim D, yes, i have heard that argument before. (if you have any info on that, it would be much appreciated…) I do think that ice cores are a huge hurdle for skeptics to overcome as to the claim for a natural rise. However, shallow cores seem to be telling something different than the deeper cores. There seems to be a lot more movement of co2 with temperature than the 16 ppm/1C in the shallow cores. (for instance, the mid 1700s to the early 1800s saw carbon growth that would be the equivalent of a temperature rise of about .5C) So, there is some question as to what the correct henry’s law figure might be. As well, there is some question as to the mechanism for your argument… If we’re dealing with an inefficiency in the sinks with warming there should also be some dependency (reflected in the data) on the amount of co2 we’re putting into the atmosphere.
afonzarell writes “You and i had a heated exchange over at dr spencer’s blog on this very topic about two years ago.”
I suspect that would be this thread
afonzarelli later continued “(plus, i’m not sure whether or not i’m inclined to go back and forth with you on this because last time you were quite obtuse and rather rude)…”
Care to give a link to the comment where I was rather rude? Rashomon. ;o)
JimD ENSO affects precipitation around the Pacific, which in turn has an affect on plant growth. See the paper by Jones et al given in the blog post at SkS that I mentioned earlier.
fonzie, the outgassing estimate from Henry’s Law (I am told it is not actually Henry’s Law, but we can call it that), is about 10-15 ppm per C. This explains the rise from the Ice Ages, and is within uncertainty of temperature and CO2 for the measurement record, until recent times when we got this large other source meaning CO2 has grown much faster than ocean temperature changes alone can predict by a factor of about ten.
Dikran, you’ll have to explain the first part of your comment a little better as i’m not quite following. I can say that the offset is just a convenience for comparing the two graphs. We don’t have the luxury of going back hundreds of years to when carbon growth was zero and temps were stable…
As for your mass balance, i gave you all that you really need to know. That the entire rise COULD be there in the absence of human emissions. I’ll also give you the “mike jonas argument” seeing how it’s his comment that we’re initially replying to: If there is a natural imbalance that would be adding the same yearly rise (that we are seeing) in the absence of human emissions, then the rise is entirely dependent on that natural imbalance. With the imbalance we have our rise, without it we don’t…
Jim D, right, from the ice ages we get 16 ppm/1C. I’m saying the high resolution (shallow) cores seem to contradict that. (plus, there may be more to the henry’s law values than the literature is letting on)…
Henry’s Law gives a temperature dependence that helps predict outgassing. It is based on equilibrium chemistry and its order is 10-15 ppm per degree. The change we are seeing in CO2 is not accounted for by chemistry which is an order of magnitude too small. It is emissions with perhaps 10% from outgassing due to the 1 C warming.
afonzarelli if you would give the URL to woodsfortrees instead of a png from the graph we could see exactly how the graphs were produced and even play with them a bit. Without that I don’t feel I have the full story. Something like this showing short term variation between hadCRUT and Mona Loa http://www.woodfortrees.org/plot/esrl-co2/mean:12/scale:0.2/isolate:60/plot/hadcrut4gl/isolate:60/mean:12/from:1961
a fonzarelli wrote “As for your mass balance, i gave you all that you really need to know.”
Sorry, using the bluff about the discussion at Roy SPencer’s blog being a “heated exchange”, when it was clearly nothing of the sort, and that I had been “rather rude” when I hadn’t suggests that you are not interested in a rational scientific discussion, and I suspect that what will happen if we discuss it again is that you will attempt to shift the goal posts in order to avoid conceding that mass balance shows that the natural environment is a net sink. Sorry, I have better things to do with my time.
Are you not being rude now? This is the same attitude you had back then. As well you went storming off just like your doing now…
As far as “moving the goal posts” goes, there are other arguments against the mass balance argument that do deal with that. I simply use this particular because it is a simple one. (and one that ferdinand made the same mistake with as you back in his 2010 piece AND got called out for it…) Can i at least hear you say that the entire rise COULD be there in the absence of human emissions in which case we would have added nothing to carbon growth? (is that really too much to ask of some one of your stature?)
http://www.woodfortrees.org/plot/esrl-co2/from:1958/mean:24/derivative/plot/hadsst3sh/from:1958/scale:0.24/offset:0.1/plot/esrl-co2/from:1958/mean:24/derivative/trend/plot/hadsst3sh/from:1958/scale:0.24/offset:0.1/trend
Mike Jonas: Funny thing is, the world has been re-foresting quite significantly, not de-foresting.
Deforestation continues at a greater rate than reforestation, does it not?
afonzarelli: Can i at least hear you say that the entire rise COULD be there in the absence of human emissions in which case we would have added nothing to carbon growth?
How could it have been, in the light of all evidence? Is that reasonable?
Mike, is the above what you’re looking for? I just plotted out temps and co2 derivative and then matched the slopes and offset as you can see there… I used the southern hemisphere data because it most closely matches the satellite data (which doesn’t go all the way back to 1958). Note the absence of pinatubo volcano cooling in the early nineties. That cooling shows up in the satellite record but not the southern hemisphere record as the phillipines are located at 15 N latitude…
afonzarelli: As regards the mass balance argument, i regard it as junk.
Why?
Matthew, first off, LUV your comments; i find you to be a breath of fresh air…
Ugh, let’s see, are your familiar with the mass balance argument? (in light of this i don’t really know where to start here) Key is the word in bold “COULD”. The mass balance argument makes no statement as to what the carbon growth would have been in the absence of human emissions. COULD be zero or small, COULD be half as much or the entire rise COULD be there anyway. This argument tells us nothing about that. You’re right, in light of all the evidence, it isn’t reasonable. I’m just saying here that the mass balance argument is NOT a part of the evidence…
(if you need a little explanation as to just what exactly the mass balance argument is, let me know… fonzie)
afonzarelli: Jim D, yes, i have heard that argument before. (if you have any info on that, it would be much appreciated…)
That water absorbs CO2 more slowly at higher temperatures is well-known. Getting from that to an exact calculation of the time derivative of CO2 versus global mean temperature requires assumptions about too many unknowns, such as the increased photosynthesis at the higher temps, rainfall and CO2 concentrations. The important point is that Salby’s argument is not the only possibility, so is not good evidence against the anthropogenic source of atmospheric CO2 increase.
Matthew, also, it’s my (scant) understanding that the world has more trees, BUT fewer acreage of trees…
Yes, Matthew, my limited understanding of it is the claim that if carbon growth is correlated with temperature then it must be a natural rise. Since the anthropogenic source keeps growing (and even if the temperature remains the same) then how would the earth “know” to keep taking out the extra CO2 that humans emit. That’s the argument that is made by agw proponents, thus they claim that the relation between temps and the carbon growth rate must be spurious. I personally see so many paradoxes with the carbon data that i don’t take sides on whether the rise is natural or anthropogenic. What i DO say is that since the carbon growth rate has been correlating with temperature for over half a century it may well be an exercise in futility to reduce human emissions in the hope of a reduction in the growth rate. On that alone, agw should fail politically if not scientifically…
How do you ever think CO2 will be 200 ppm? It was 280 ppm before the industrial era, and the biosphere was just fine.
afonzarelli is correct. The pseudo-mass balance argument is ridiculous. And, Henry’s Law is not directly applicable here because the oceans are not a static pool of water. The fact that the oceans are flowing converts the proportionality in ppmv/degC into a rate dependent factor in ppmv/degC/unit-of-time.
And, that is what the data show. It couldn’t be more obvious (see plots afonzarelli submits). The temperature relationship accounts for the entire atmospheric CO2 record since at least 1958. You give me the starting point, and the temperature record, and I can tell you what the atmospheric concentration is to high fidelity. Anthropogenic inputs are superfluous.
Moreover, anthropogenic inputs are continuing to accelerate, but aside from the recent El Nino temperature induced blip
http://woodfortrees.org/plot/esrl-co2/derivative/mean:12/from:1979/plot/rss/offset:0.6/scale:0.22
atmospheric concentration is not accelerating.
You deniers of temperature-driven CO2 are going to look pretty silly in the years ahead as temperatures continue to stall, as will be the case with atmospheric concentration, while emissions keep zooming upward. The divergence is already stark. In 5 years, it will be beyond denying.
? The origin and accuracy of the data ?
Has Murry Salby been given an opportunity to respond to this?
Emissions from http://www.globalcarbonproject.org, Figure 2 monthly NOAA Mauna Loa data (as used by Salby) and Figure 4 annual NOAA global growth rates, see http://www.esrl.noaa.gov/gmd/ccgg/trends/ for both which include accuracy assessments. Murry Salby has obviously the opportunity to respond to this. I he had tried to publish this then the mistakes would have -hopefully- been caught in the review process.
The web page of Professor van dear Werf suggests that his teaching career may be closely tied to the validity of his thesis here.
Thanks Guido
Guido van der Werf,
Thank you for your very informative post. I learnt a lot.
It seems telling that Murray Salby hasn’t responded to your post and to the good comments here. Perhaps he is preparing a response and will send it to Judith to publish as a post.
Rate Change of fossil fuel emissions vs “increase in anthropogenic CO2 emissions”
Prof. Guido van der Werf. Thanks for trying to evaluate Dr. Salby’s presentation. However, please compare “Apples to Apples” and distinguish Salby’ mis-statements from his otherwise clear mathematical development, graphed units and surrounding statements.
Fallacy: Changing comparisons:
You have switched from Salby’s “change in the growth rate”
to “change in total Anthroprogenic emissions”.
You stated:
You further graphed: “Additional CO2 emissions: about 20% (9.7 vs 8.0).”
Your Fig. 3 appears to be a logical error misreading Salby’s graph rather than from Salby’s actual statements and his mis-statement versus his intended statement on the rate of fossil fuel growth.
Salby actually graphs “Fossil fuel emissions (GtC/yr)”
This shows fossil fuel emission growth from ~ 6.1 to 7 GtC/y from 1990 to 2003.
Salby accurately labels this period as “Average growth 1%/year”. (~17%/13 years).
Then Fossil fuel emissions grow from 7 to 9.9 GtC/y from 2003 to 2015.
Salby accurately labels this period as “Average growth 3%/year.” (~40%/12 years).
However, Salby then sums this up by: “Additional CO2 > 200% (3% vs 1%)”
Salby’s compact notations refers to the CHANGE in GROWTH RATE of Anthropogenic carbon emissions – the 200% increase from 1%/year growth to 3%/year growth.
He did NOT state your interpretation that “fossil fuel emissions . . .increased by a factor of 3 over he past two decades.”
The confusion appears to come from two factors;
1) Salby’s compact notation “Additional CO2″.
It would have been much better for Salby to have stated:
“Fossil Fuel CO2 growth rate increased > 200% (3%/y vs 1%/y).”
2) Salby’s mis-statement on Fossil fuel growth rather than the increase in rate of fossil fuel use in the segment from 8:17- 8:50.
Check the actual statements by Prof. Salby in “Atmospheric Carbon, 18 July 2016.
7:57 – 8:04 Graph: “Fossil Fuel Emission (GtC/yr)”
Salby states: “During the decade before the change of the century fossil fuel emission increased almost linearly”.
Note the period 1990-2002 is labeled “0.08 GtC/yr2“.
8:05-8:16 Salby states: “During the subsequent decade it also increased linearly – But three times faster.” Note the graph for the period 2002 to 2015 is labeled “0.275 GtC/yr2“.
By “Faster” and the units GtC/yr2, Salby’s 300% clearly refers to the change in the RATE of growth, NOT to the ABSOLUTE growth in Fossil Fuel Emissions.
8:51-9:24 Compare Salby’s statement for the atmospheric CO2. “Its increase was virtually identical”.
8:17- 8:50 In this Salby’s coloration and statements are confusing versus what he states on the right graph.
The Red area under the curve on the right accurately states “Additional CO2 > + 200%.”
Salby actually states:
Salby should have stated,
Similarly, the graph is in error in that the blue goes down to the bottom rather than just down to 6 GtC/yr. Similarly the red in the right graph should only go down to ~6.8 at 2002 rather than to the bottom.
Fallacy 2 Shifting the goalposts
You then “shift the goalposts” by reinterpreting Salby’s explicit “Anthropogenic FOSSIL FUEL emissions” to an unstated all inclusive “Anthropogenic emissions“.
Note Salby did NOT use “anthropogenic emissions” as shown in your Fig. 3.
Regards, David
PS Long term Anthropogenic Fossil Fuel emission breaks & data
The conventional interpretation is “exponential growth” in anthropogenic fossil fuel emission.
Alternatively, in reviewing Fossil Fuel Emissions, there appear to be two major breaks in trends in Anthropogenic Fossil Fuel Emissions.
1) At ~ 1947 after the end of WWII (from 1860-1947 vs 1947-1982) to the rapid post war economic growth.
2) At ~ 2002 (From 1982-2002 vs 2002-2015.) This appears to primarily from the rapid growth in China’s coal use.
I find the data from the International Energy Agency (IEA) 2015 supports Salby’s graph of Anthroprogenic Fossil Fuel Emissions Fig 1.
See Figure 4. “Trend in CO2 emissions from fossil fuel combustion” on page 8 of CO2 Emissions from Fossil Fuel Combustion IEA 2015, 152 pp
Source: Carbon Dioxide Information Analysis Center, Oak Ridge National Laboratory, US Department of Energy, Oak Ridge, Tenn., United States. PDF at https://www.iea.org/publications/freepublications/publication/CO2EmissionsFromFuelCombustionHighlights2015.pdf
Links: CO2 Emissions From Fuel Combustion Highlights 2015 html
Data: CO2 Highlights 2015 Tables
Similarly see: Global CO2 Emissions – Historical Center for Climate and Energy Solutions.
Sources; Carbon Dioxide Information Analysis Center, Oak Ridge National Laboratory (2015), International Energy Agency, World Energy Outlook (2015)
See graph at:
http://www.c2es.org/docUploads/global-co2-emissions-historical.png
NOAA Carbon Dioxide from Fossil Fuel Combustion Trends from CDIAC links to:
Carbon Dioxide Information and Analysis Center ORNL
http://cdiac.ornl.gov/trends/emis/meth_reg.html
Latest Published Global Estimates (1751-2013)
Other graphs: “Fossil Fuel Emissions 2015” from Only Zero Carbon.org
could be a little too broad.
http://papers.ssrn.com/sol3/papers.cfm?abstract_id=2642639
Prof. Werf, have you done any study on water vapor and methane cycle and their interactions with the climate system? As you know, water vapor is the most abundant greenhouse gas and methane increased 3 times faster than CO2 since 1800
Thanks Dr. van der Werf!
Can you please clarify deforestation emissions? Is this a true emission caused by burning forested areas, or accounting for carbon which is not taken up due to the deforested areas? It strikes me that a certain amount of deforestation results in carbon being sequestered in semi-permanent forms such as lumber used in buildings, or stored paper, rather than emitted.
Both direct emissions from fires used in the deforestation process and delayed emissions because of decaying debris (10-year time scales) and products made from wood (longer time scales).
Thanks for the additional information.
Historical CO2 emissions from land use changes:
http://cdiac.ornl.gov/trends/landuse/houghton/houghton.html
Very clear and concise post. Thank you for taking the time and making the effort.
Guido
The discussion is interesting, a few points.
First I am concluding that the carbon cycle you follow is the IPCC model, a closed atmosphere, where any CO2 that is emitted to the atmosphere returns to earth or ocean minus the annual increment. This model is strictly an assumption and the allocations of where the CO2 comes from and returns to. There is absolutely no evidence to support this theory. Further the atmosphere is open, not closed as witnessed by the incremental increases of 5% at 90km, and 12% at 100km altitude / decade. It does not get there by magic.It is lost in an annual cycle from the troposphere. A significant portion of CO2 the troposphere annually.
Second, your reference to the atmosphere taking up all emissions both human and biosphere based on the annual residual increase since 2002 is mistaken. You finish with the sentence “The exact mechanisms are still not fully understood” My own findings confirm that the annual residual CO2 ppm increase is set by the troposphere temperature profile from winter thru summer in the northern Hemisphere. Increased Troposphere temperatures increases atmospheric capacity both by volume and adsorption. This allows more emissions to stay in the troposphere. The period of the green line has been a period of increased temperatures, and if you look at the individual years of high ppm increase this is evident. .
Further, the CO2 in the total vertical column density increases annually due to Troposphere losses out to and beyond 100km.
The CO2 chart that you provide is Mauna Loa and is not representative of the annual emissions and oxygenation cycle as put forward. Mauna Loa simply records the annual transport of NH atmosphere bearing CO2 into the southern hemisphere between May and November ending in the Antarctic vortex.
It is well worth looking at the thirty NASA OCO-2 satellite images released in April that cover the period of September 2014 to February 2016. They are an education in what is really occurring. .When looking at the rapid increase in the mid to high SH latitudes in June onwards, most assume that the increase is due to Southern Ocean out welling, it is not.
You will find the images and my interpretation at the link below.
Regards – Martin
http://www.blozonehole.com/blozone-hole-theory/blozone-hole-theory/carbon-cycle-using-nasa-oco-2-satellite-images
Thanks for the link to your research. I struggle with these CO2 cycle arguments because people have various assumptions, often unstated. First take on your POV is that CO2 is not a “well-mixed” gas in the atmosphere, and the implications of that overturn assumptions professed by many, both supporters and detractors of IPCC. I will need time to read more deeply.
Martin Cropp
Thank you for the link.
I am a visual learner so the progressive images help my understanding.
I more easily follow the atmospheric pressure/volume relationships as it has been these connections that I have worked with in another venue.
What was most gratifying was the announcement that the atmosphere is not a closed system. Particularly, the poles play some role as windows for both heat energy losses as well as atmospheric gases. The discussions regarding the Southern Hemisphere was helpful for me as it seems that the Arctic carries the most press.
You have provided to me a new framework with which I will consider further atmospheric movements.
Regards.
Guido, thank you for the interesting article. As I mentioned on the other thread, there are also “issues” with Prof. Salby’s presentation of the 14C data.
Prof Curry writes “This is exactly the sort of thing that I hoped my post would elicit (but didn’t expect).”
I don’t see why you should not expect this “sort of thing”, the mass balance argument that demonstrates Salby’s conclusion is incorrect has been explained repeatedly, most recently here. Note Prof. Salby describes conservation of carbon as
“[a] fundamental physical law that must be satisfied by CO2 in the atmopshere. If that is not satisfied, you may as well turn out the lights an go home”. [my transcription may not be word perfect, but you can check it on the video as I have given the timing].
The mass balance argument shows that his conclusion violates that fundamental physical law. Details of my peer reviewed comment paper that explains this in detail have also been provided more than once:
Cawley, G. C. (2011). On the Atmospheric Residence Time of Anthropogenically Sourced Carbon Dioxide. Energy & Fuels, 25(11), 5503-5513.
The source of Salby’s error (correlations are insensitive to constant offsets, but it is the offset that causes the long term rise) has also been pointed out, on multiple occasiona, you can find this by searching for the URL of my SkS blog article Murry Salby’s Correlation Conundrum.
Ferdinand Engelbeen has also very patiently explained how we know Salby is wrong on many occasions.
The source of Salby’s error (correlations are insensitive to constant offsets, but it is the offset that causes the long term rise) has also been pointed out, on multiple occasiona, you can find this by searching for the URL of my SkS blog article Murry Salby’s Correlation Conundrum.
This idea that Salby has made some mistake by using correlation is a puzzle.
The only way it would be a ‘mathematical flaw’ is if his proposed function f(T) had to satisfy f(0) = 0. But presumably he is free to have a constant term in what amounts to a linear regression. Marsupial and others are doubtless right that this constant is actually human emissions, but that will be exposed by the proposed model not fitting out-of-sample, specifically the first half of the 20th century. It seems a model validation issue rather than some sort of mistake?
“The only way it would be a ‘mathematical flaw’ is if his proposed function f(T) had to satisfy f(0) = 0. ”
It is a flaw because it is claimed that the correllation demonstrates that the rise in CO2 is due to “surface conditions”, however the rise in atmospheric CO2 only depends on the mean growth rate and the correllation is numerically completely insensitive to the mean growth rate, so there is no mathematical connection between the two.
“But presumably he is free to have a constant term in what amounts to a linear regression.”
Linear regression has the problem that temperature depends on atmospheric CO2 as well as there being a plausible positive feedback via Henry’s law. Regression being based on correlations, not physics can’t distinguish between the two.
“Marsupial and others are doubtless right that this constant is actually human emissions,”
approximately, yes.
“but that will be exposed by the proposed model not fitting out-of-sample, specifically the first half of the 20th century.”
The problem with that is that we don’t have monthly bulk atmosphere CO2 observations for the first half of the 20th century.
“It seems a model validation issue rather than some sort of mistake?”
No, there is no mathematical link between the correlation between growth rate and temperature and the long term trend in atmospheric CO2 as the long term trend depends on the mean growth rate and the correlation coefficient is mathematically completely insensitive to the mean growth rate.
“The source of Salby’s error (correlations are insensitive to constant offsets, but it is the offset that causes the long term rise) …”
No, not all of it. Only the linear term. But, there is a quadratic term beyond that which is explained by the temperature rise, and is not the product of an arbitrary parameter. And, if the quadratic term is explained by the temperature rise, then that leaves little room for the quadratic term that would arise if emissions were significanly driving things.
Ergo, the linear term is also due to the temperature relationship, and comes about because the equilibrium temperature is about 0.6 degC below the current level from the RSS baseline (and, remember, that baseline is arbitrary).
http://woodfortrees.org/plot/esrl-co2/derivative/mean:12/from:1979/plot/rss/offset:0.6/scale:0.22
The impact of emissions is simply not significant.
Of course as the rise in atmospheric CO2 has been reasonably close to being linear (i.e. the linear term is dominant, and the upward curve is small by comparison) there isn’t much left to be explained by the quadratic term and above.
Also if you take a zero mean signal (i.e. the variations in growth rate that temerature can explain via correllation) and integrate it (to get the effect on the increase in atmospheric CO2) then you find the overall increase explained is essentially zero (hint: what do you get f you add up lots of random numbers with a mean of zero? answerer: zero).
Bartemis would know this if he had actually read the article at SkS.
However as Bartemis has shown repeatedly that he can’t discuss science without becoming rude and abusive, I won’t bother to try and discuss it with him. life is too short.
dikranmarsupial | August 14, 2016 at 6:56 am |
“…there isn’t much left to be explained by the quadratic term and above.”
If you can’t match the quadratic term, then you don’t have the correct model.
“hint: what do you get f you add up lots of random numbers with a mean of zero? answerer: zero.”
Wrong again. You are confusing “mean” with “average”. If you integrate a noisy, zero mean signal, you get a Weiner process, the sampled version of which is commonly known as a random walk. It does not generally integrate to zero in finite time, but to a value which varies proportionately to the square root of time.
Aside from that (being totally wrong), this is just gibberish. Throwing up chaff in the air to obscure the fundamental weakness of your position. If you match the dips and rises of the rate of change, then you have a good fit. If you cannot match them, then you do not.
“Bartemis would know this if he had actually read the article at SkS.”
I’ve read it. It is garbage. Through and through. Embarrassingly so.
“However as Bartemis has shown repeatedly that he can’t discuss science without becoming rude and abusive…”
You have earned it. I’ve tried being civil with you, but it does no good, because you don’t have the mathematical chops to understand what I try to explain to you. You are absolutely clueless, spouting off drivel repetitively with no sophistication, with no in-depth understanding of how systems in the real world work, and no ability to correct yourself. It is beyond me to understand why you think your background qualifies you to do this.
I too have reservations about Dr Salby’s claims but wish to ensure that we are accurately representing his position. I was under the impression that his presentation compared fossil fuels emissions with total known emissions.
I am not suggesting that Dr Salby ought or ought not to compare total anthropogenic emissions with total emissions, but only whether not Dr Salby did or did not include non-fossil-fuel emissions.
Did Dr Salby include non-fossil-fuel emissions? And are deforestation emissions or other non-fossil-fuel emissions relevant to the claims he made?
In my opinion, the non-fossil-fuel component of AGW is interesting but is not the main focus of GHG mitigation policy and debate. Fossil-fuel emissions are the focus of public interest and debate.That seems to me the justification for separating emissions from fossil fuels for comparison with total emissions.
What were a hurdles for me in Dr Salby’s presentations were:
1. How was the “induced” CO2 component estimated? What was the source? And if the initial problem was that the fossil fuel increase is not matched by an increase in total emissions, why address this question by focusing on an induced component that would increase the mismatch rather than explain it? Or is Dr Salby’s claim that both have to be explained and both are explained by the sinks,
2. If the human component increased so dramatically but did not remain in the atmosphere, where did it go? (What sinks operated?)
Is Dr Salby’s main point that the GHG emissions from fossil fuels are so small compared with the total carbon flux that their impact cannot be detected? That seems to be the overall point of the introduction.
I approached this question from a different direction. We know that elevated CO2 is stimulating terrestrial “greening”. Is the world ocean similarly responding to elevated CO2? Can the increment in these sinks be quantified?
Biologists have claimed that terrestrial and oceanic micro-biota are responding to elevated CO2 and that the total mass of the micro-biosphere is a significant proportion of the total biosphere. Can the increment in these sinks be quantified?
Having studied Dr Salby’s textbook, I take his claims seriously. But I am skeptical. (Physics of the atmosphere and Climate 2012, CUP.)
Even if it is, it’s clearly a rather silly point. If I have a system that is in balance (all the fluxes cancel), then if I add a new source I would expect that quantity to increase within the system, given that the fluxes no longer balance. It doesn’t really matter how big the new flux is relative to the other fluxes. Of course, it may be that the change is too small to actually measure, but that is clearly not true in the case of changes in atmospheric CO2.
aTTP says ” If I have a system that is in balance …”. And if you don’t?
Anders Valland, the system was in approximate balance in pre-industrial times, but anthropogenic emissions have disturbed that balance, and as a result natural uptake exceeds natural emissions, as demonstrated by the mass balance analysis.
The key point is that (as Prof Salby states) it is the difference between total uptake and total emissions that governs the rise in atmospheric CO2. While natural emissions are much larger than anthropogenic emissions, they key question is whether anthropogenic emissions are large compared with the difference between natural emissions and natural uptake. They are indeed; anthropogenic emissions are roughly twice as large in magnitude and of the opposite sign.
dikranmarsupial,
200 is approximately equal to 199, 201,176 . . .
What’s your point?
Adding CO2 to air doesn’t heat it.
Removing CO2 from air doesn’t cool it.
Foolish Warmists substitute fantasy and toy computer games for reality.
Nature doesn’t care.
Cheers.
Anders: The system was in balance, with atmospheric CO2 levels changing very little (+/- about 5 ppm) for millennia before the industrial era.
“The system was in balance, with atmospheric CO2 levels changing very little (+/- about 5 ppm) for millennia before the industrial era.”
Maybe it was, and maybe it wasn’t. Salby has arguments there, too. But that would not, in any case, establish that it had to be so forever.
The effect on the ocean is to acidify it, which is regarded as a negative. This is the other problem with Salby’s budget because he claims that the ocean is the source of the extra CO2 when actually the ocean is observed to be gaining carbon too. Where is all this carbon coming from? He doesn’t know.
Acidification is not a direct proxy for total ocean inorganic carbon content.
It’s not a question of where the carbon is “coming from”, it’s a question of why the atmospheric pCO2 is doing what it’s doing.
Stipulating that the amount of anthropogenic emissions (averaged over several years) is somewhere around twice the amount of CO2 accumulating in the atmosphere (also averaged over several years), what are the factors responsible for the amount that remains in the atmosphere?
In general, “cause and effect” is a myth. Before you can properly claim to have demonstrated that, say, anthropogenic emissions are responsible for the increase in pCO2, you have to make a good case that, without those emissions, and all other things being equal, the pCO2 would have remained roughly flat.
Currently, efforts to make that case seem to be begging the question.
In the CO2 record from ice cores there is no instance of CO2 rising 100 ppm within a couple of centuries. Furthermore, the ocean acidification shows that it is also gaining CO2. I think the question of what is happening and how much has been answered a long time ago.
no evidence that ocean acidification is related to fossil fuel emissions
http://papers.ssrn.com/sol3/papers.cfm?abstract_id=2669930
This is dictated by chemistry. If the atmospheric CO2 increases, the ocean carbon also increases to maintain an equilibrium.
Perhaps because the ice core record smooths things out at shorter time scales.
Not by itself it doesn’t.
You lost me on the second word of that paragraph. Your mind is much too closed. You have the answer that fits your ideological agenda, further questions might just confuse things.
Oh? Are you a chemist?
What do you mean by “ocean carbon”?
What is the effect of precipitation of CaCO3 (or MgCO3) on “ocean carbon”? On “ocean acidification”?
Are you biologist enough to describe the difference between the effect of diatom blooms and coccolithophore blooms? (I could provide links, but you should be able to answer this off the top of your head, given that you keep posting on the subject.)
Do you agree that CO2 in the air has an equilibrium with carbonates in the water? That increasing the amount in the air, necessarily increases the amount in the water. Is this a surprise to you?
You clearly don’t understand enough about the subject to discuss it.
You’re just a troll wasting people’s time with your ign0rant arm-waving.
Why don’t you study the subject before showing off your ign0rance?
The answer is: if you increase the CO2 in the atmosphere, some dissolves in the water such that, yes, carbonates do increase in the water until equilibrium is re-established. Just trying some science out on you here, but facts and science seem to just make you angry. Anyway, food for thought. Carry on.
No, that’s not the answer.
Increased pCO2 does, in fact, maintain equilibrium with increased dissolved CO2 in sea-water. However, after that CO2 hydrolyses to carbonic acid, the relative concentrations of carbonic acid (H2CO3), bi-carbonate (HCO3-), and carbonate (CO3-2) vary in a more complex way depending on pH, which in turn depends on the relative proportions of cations, especially Ca+2 and Mg+2.
Precipitation of CaCO3 (or MgCO3) increases the alkalinity by a factor of about 10 relative to dissolution of new CO2. (Under current conditions.)
Thus, precipitation of these minerals can produce ocean acidification (lower the pH) in the absence of changes to pCO2. That acidification, in turn, will drive an increase in dissolved CO2 (gained from de-hydrolysis of carbonic acid), which in turn will produce out-gassing of CO2 until the atmospheric pCO2 is increased to be in equilibrium.
As the CO2 outgasses from the sea-water, more carbonic acid will de-hydrolyse to CO2, and its fraction will be made up by re-association converting bi-carbonate to carbonic acid. Thus, precipitation (without re-dissolution) can drive increases in atmospheric pCO2 in that absence of things like fossil emissions.
Now, do you have any idea where that precipitation might be coming from
You are referring to reactions to acidification. However, increasing CO2 in the atmosphere does increase carbonates in the water. That’s where a lot of the carbon goes. After that, who cares, the direction of the carbon flux is clear. Obfuscation doesn’t get around that.
AK: “Currently, efforts to make that case seem to be begging the question.”
They are absolutely groveling on the ground with their hands clasped and tears coming out of their eyes.
AK: “Increased pCO2 does, in fact, maintain equilibrium with increased dissolved CO2 in sea-water. “
I just love Jim D’s assertion that the solubility of CO2 in sea water is simple chemistry…
http://cdiac.ornl.gov/ftp/cdiac74/chapter2.pdf
Salby is done on this blog. Stick a fork in it, as they say. Even half the skeptics have turned.
> I too have reservations about Dr Salby’s claims but wish to ensure that we are accurately representing his position.
An outline of his “scientific reasoning” might help.
Figure 3 in the main post notes an uptick in 1997 of increased emissions due to peat fires in Indonesia, in the second half of the year. The emissions value increase over the previous year is about 1 GtC/yr or 13%. Looking at the surface CO2 stations due west within the plume (Mahe Island – Seychelles and Ascension Island in the Atlantic – plus others) the increase in CO2 output is totally absent from the records. In fact the 1997 CO2 year when reviewing the period 1995 to 1999 shows a slight dip on the smooth line curve in 1997 mostly to do with increased temperatures and CO2 residual during 1998..
A volume equal to 13% of global emissions, in a few weeks in one area without atmospheric trace at surface level..
The reason for raising this issue is to reinforce that in any one given year a significant increase in emissions would have little effect on the annual curves, or the annual residual CO2 increase. That is why the curves are monotonous.
” That is why the curves are monotonous.”
Did you mean monotonic?
Thanks for the post.
Though Salby was suggestive I had some reservations and wanted to have a look at the data myself but didn´t want to spare the time.
Any remarks about the atomic bomb test/isotope issue?
The bomb spike decay of 14C indicates the residence time of individual CO2 molecules. It says nothing about the net carbon sink rate (all emissions both n and a), or the effective half life of annual a emissions, the concentration rate. Salby confused the two and should not have.
You should not just assume so without inquiring into his reasoning. There are conditions under which the two can be considered essentially equal.
Ristvan, to me the importance of the residence time of C14 is that it shows that the atmosphere is a small transition reservoir connected to a very large geological reservoir. The CO2 trajectory will, therefore, be determined by the behavior of that geological reservoir in response to 1) Temperature; and 2) CO2 ppm. The increase in CO2 ppm is only half of what would be expected from human emission. This suggests that the sensitivity to CO2 of the large reservoir is about 0.17 Gt CO2/yr/ppm. This means that if we kept at today’s emissions we would stabilize at 500 ppm.
Frederick Colbourne
Your questions are vital to the total equation of the carbon cycle. There is no empirical evidence that the carbon cycle balances, they values are simply estimates to make a balanced model.
However if we look at the global picture including the high altitudes we can conclude with great certainty that the carbon cycle does not balance, and that the limited sinks identified by the IPCC are not adsorbing anywhere near the volumes they claim. It is important to view the NASA OCO-2 satellite images in the link in my post above. They are very revealing.
Ninety percent of all human emissions and the greater percentage of biological emissions are in the Northern hemisphere. We see an annual undulation in the CO2 curves most pronounced in the high NH latitudes and diminishing as we go southward. The downward trend in the NH CO2 curve is not direct oxidation, but the dilution of CO2 in the atmosphere with oxidated atmosphere.
How do we measure the effectiveness of the carbon cycle and the IPCC sinks large and small.
1. The is an annual residual baseline increase in the atmosphere, the volume is controlled by the atmospheric temperature. This retained.
2. The mid to high NH surface station CO2 curves go flat during winter with virtually no accumulated increase. This is at a time where annual CO2 emissions are greatest. Where does the CO2 go to. It transports vertically to higher altitudes via low pressure zones such as the documented up-welling at the equator and the Arctic vortex.
3. Looking at the OCO-2 images you will see a massive transport of CO2 beginning in May through to late November. The accumulation that you see occurring in the SH is what is not adsorbed, oxidated or returned to sinks.
4. Having done a study of the SH surface stations from the equator down, there is no reduction in the SH CO2 curves, barely 1ppm movement at best, and yet we see a 13ppm downtrend in the NH. For that volume of CO2 to be adsorbed by the Southern Ocean it must have physical contact, but most travels at higher altitudes. Some papers say adsorption is occurring, others say out welling.
5. There is empirical evidence of CO2 accumulation increasing up the entire vertical column, with increased density out to 110km and beyond. At 90km the annual increase is 5% in line with Mauna Loa, however at 100km and above the increase is 12% / decade. Given the vast area at this altitude this requires a significant volume of CO2.
To assess the carbon cycle with any degree of certainty, the entire atmospheric column must be considered, I see absolutely no evidence that the carbon cycle as depicted by the IPCC or Dr Salby should be considered valid. The vast majority of human and biosphere gross CO2 emissions leave the troposphere.
“There is no empirical evidence that the carbon cycle balances”
as Prof. Salby says the balance is “[a] fundamental physical law that must be satisfied by CO2 in the atmopshere. If that is not satisfied, you may as well turn out the lights an go home”. If you are arguing that the cycle does not balance then you are essentially arguing that significant amounts* of carbon are spontaneously created in, or spontaneously vanish from, the atmosphere. Can you propose a plausible physical mechanism that might cause that?
* actually minute amounts of 14C are created from nitrogen in the upper atmosphere by the action of cosmic rays and small amounts of 14C decay back, but the amounts are utterly insignificant.
dikranmarsupial
I am not proposing that significant amounts of CO2 are spontaneously created or vanish from the atmosphere. The losses are part of the normal carbon cycle. I would suggest you take the time to read my conclusions and view the OCO-2 satellite images at the following link.
http://www.blozonehole.com/blozone-hole-theory/blozone-hole-theory/carbon-cycle-using-nasa-oco-2-satellite-images
ozoneburst so where do these “losses” of carbon go if not into the oceans or terrestrial biota (thus balancing the carbon cycle)?
To be clear, “the carbon cycle balances” just means that whatever carbon that is emitted into the atmosphere that isn’t taken up by the oceans or terrestrial biosphere stays in the atmosphere. In other words
C’ = E – A
where C’ is the change in atmospheric carbon over some time period, E is the amount of carbon emitted into the atmosphere and A is the amount absorbed by the other reservoirs over that period.
Nobody is assuming that natural emissions and natural uptake are closely balanced in the post-industrial era, we know that this is not the case.
ozoneburst so where do these “losses” of carbon go if not into the oceans or terrestrial biota (thus balancing the carbon cycle)?
–
Interesting question
“Like where do we get the fossil fuels to burn from”.
–
Really Dikran,
There are lots of ways to lose carbon and unbalance the cycle if your mind is not fixated on proving Salby wrong.
Vegetation gets buried unde dirt on land and silt in the sea.
Give it a few 100 million years and it will come back as oil or coal or methane to burn and restore your lovely “natural” cycle.
angech wrote “Vegetation gets buried unde dirt on land and silt in the sea.”
In order for the carbon to be in the vegitation that is buried, the vegitation first needs to take it out of the atmosphere, so conservation of atmospheric CO2 is satisfied.
In order for silt in the sea to be buried, the CO2 first needs to be taken out of the atmosphere by the oceans, so conservation of atmospheric CO2 is conserved.
When we burn fossil fuels, we are reversing the “vegitation gets buried under dirt”, but that doesn’t affect conservation of atmospheric CO2 either as the fossil fuel -> atmosphere flux accounts for this.
Mass balance just means that any carbon emitted into the atmosphere that isn’t taken out of the atmosphere stays in the atmosphere.
This article seem very tendentious to me.
Looking at your figure 3, you are showing emissions, while Salby’s chart was clearly intended to demonstrate the growth of emissions. That is, the derivative with respect to time. Your average over a number of years is of emissions, not the derivative.
Looking at your figure 4, you are again averaging growth of CO2, although Salby’s version is summarizing growth in this case. However, if we just eyeball your chart, it’s obvious that there’s a change at around 2002: after then the growth rate appears roughly constant, while before it’s clear that the rate itself was increasing.
While I have a number of issues with Salby’s presentation, his charts clearly show a change that calls into question the assumed relationship between anthropogenic emissions and CO2 growth, while your use of averages seems intended to hide those questions.
Why does an increase in the derivative WRT time of anthropogenic emissions correspond to a decrease in the 2nd derivative WRT time of pCO2?
If you greatly simplify and assume a constant volume for the atmosphere and that the only thing changing the amount of CO2 in it is the fossil fuel emissions, then the increase in the concentration of CO2 in the atmosphere should be roughly proportional to the change in the concentration.
I must say that not taking the data back to 1959 hides a multitude of sins, but even if you do the correlation between the annual mean CO2 concentration at Maunu Loa NOAA ESRL DATA has a good correlation with Global Fossil-Fuel CO2 Emissions from Boden et al ORNL (no adjustment for forests). Each million tonnes of emissions increase the CO2 concentration in ppm by 0.00022.
All very crude, but on the face of it you can’t reject the hypothesis that CO2 concentration is going up in sync with CO2 emissions over the period since 1959.
I’m rejecting the conclusion. It’s certainly a valid hypothesis, but the evidence doesn’t really support it as more than that. The alternative hypothesis is that atmospheric pCO2 is driven by factors pretty much independent of fossil fuel emissions. The evidence is just as consistent with that.
I thought the same about data back to 1959, which is summarized here, including fossil/cement, land-use, and atmospheric increases. I did a very slapdash chart:
https://3.bp.blogspot.com/-ZlVQz_Sjgb8/V62iTDJ_uBI/AAAAAAAAArE/LBv-cXtEMektJpKeys4IqS33eAtb0mVtACLcB/s1600/CarbonBudget1.jpg
Just eyeballing it, I still must seriously question the proposed linear correlation between emissions and pCO2 growth. Although, without removing the effect of (presumably) ENSO, it’s hard to see closely enough to be sure.
AK,
What is happening to what we emit? The increase in atmospheric CO2 over that time interval is smaller than the amount of CO2 we’ve emitted. If you’re suggesting that the rise in atmospheric CO2 is not anthropogenic, then you’re suggesting that something non-anthropogenic has absorbed all of our emissions, and something non-anthropogenic has also emitted enough to produce a rise in atmospheric CO2. What can this be?
AK, as I have pointed out elsewhere, the variability in the increase of CO2 is because the natural sink is less effective in warmer years. So we have a smoothly increasing source and a sink of about half that with some variability around it leading to the observed behavior in CO2. Look for a larger than average increase in CO2 in 2016 because of the El Nino.
We know there’s a lot more changing than just fossil/cement emissions.
The global carbon system is made up of a number of source and sinks, many items that are both. Peat bogs, for example, which can be sources or sinks depending on a complex mix of recent rainfall, atmospherically sourced nitrogen (& phosphorus?), waterflow control by animals such as beaver and humans, temperature, and so on.
Each of these items participates in producing the actual global CO2 mixture. Many are influenced by current pCO2, in various ways, and with various lags, in addition to more external factors such as those noted above. Many entire classes are so poorly studied that we can only guess at their behavior.
Salby seems to be assuming a direct linear drive on absorption by partial pressure, an assumption I would reject as totally unwarranted.
Many who dispute him seem to be assuming little or no influence on absorption by partial pressure, an assumption I would also reject as totally unwarranted.
Unfortunately, the assumption I would consider best warranted, that of the vast number of sinks/sources, many or most are influenced in different ways, with different lags, concentrated in different regions of the earth with different non-linear interactions with local/regional climate, leaves us with far too many unknowns to make predictive models.
So, you can go with “science” that’s easy to do but probably wrong, or you can shoot for science that may be right but we can’t do yet, pending better methods and technology for data gathering.
If you admit that the science isn’t up to it yet, than all your economic and political conclusions become far more uncertain.
If you insist on denying that the science isn’t up to snuff, you may be able to assert economic and political statements, but you’ve left science behind.
@Jim D…
Clearly you’re just arm-waving and spouting straw-man arguments. They don’t convince me, and they won’t convince anyone who closely examines the discussion.
You might try actually looking at the picture I posted.
You’re looking at it from the wrong perspective. Human emissions are very small potatoes compared to emissions from a very large number of different natural sources. There’s also a very large number of different natural sinks. Many are both.
Every one of those different sources/sinks varies its behavior, based on a number of factors. The notion that they are somehow “in balance” is ludicrous, without proof. Very conclusive proof. Your entire argument is an exercise in question-begging until that proof is forthcoming.
AK, no, even Salby noted that the derivative of the CO2 increase is highly correlated with the global temperature. This explains your wiggles if you look. Furthermore it is not surprising for the ocean because its chemical balance with pCO2 depends on the temperature to a degree that explains the magnitude of the wiggles. Apparently land may be contributing to the temperature dependence of the sink in a similar way, which is less understood. So what we have is a smoothly increasing source and a temperature dependent sink, and between them they explain how the CO2 rises annually. The 2016 El Nino will prove the point with one of the fastest increases in CO2 in measured history.
@Jim D…
Look harder.
AK,
You still haven’t answered my question. Our emissions are larger than the increase in atmospheric CO2. If they aren’t the source, where has it gone?
AK, you were the one not understanding your wiggles. I tell you they are understood in terms of temperature, and you seem to still be confused by them. What question is there left to answer?
@…and Then There’s Physics…
That’s because the question you’re asking doesn’t make sense.
What do you mean by “source”?
AK, here.
https://s3-us-west-1.amazonaws.com/www.moyhu.org/misc/ghg/m.png
Any questions?
@Jim D…
Yes.
Where’s the data? I wouldn’t trust anything from that source till I’ve gone back and looked at it myself.
What’s been done to it?
Why are you using ice core data when it’s been shown to be questionable?
What’s been done to it?
Looks like it was hockey sticked.
Read the labels. They tell you about the data, and none of it is new. Is there some reason it surprises you?
Ice core data spliced with Mauna Loa. Where else did I see a hockey stick? Some things never change.
They don’t tell me where to get data I can load into a spreadsheet or whatever.
I’m not interested in your deliberately deceptive propaganda pictures.
You’re just a troll trying to change the subject from something interesting to your same old discredited refrain.
The most direct way to talk about the subject at hand is a plot that shows the total CO2 in the atmosphere over time along with the total emissions over the same centuries. If you have another version of this plot, let’s see it. I think it makes “skeptics” angry because it shows very simply that both the emissions and CO2 level are growing similarly and consistently with each other. The data at hand proves them wrong when they doubt that these two things could be connected, and it forces them into deny-the-data mode. It is a regular pattern.
That’s certainly the best way to deceive. If you present a “plot” that shows anything, without pointing the data behind it, that’s probably what you’re trying to do.
I did. Right here. Along with a link to the data behind it.
You came along and tried to change the subject.
AK try figure 5 in my paper that shows the very close relationship between cumulative anthropogenic emissions and atmospheric CO2. The data sources are all given in the text of the paper.
AK, I didn’t change the subject. My plot is just an integrated version of yours. It shows that in the end the wiggles cancel out and the accumulation is proportional to emissions. How is showing an integrated plot changing the subject? Yes, year by year emissions don’t exactly match CO2 increases, and we know why (temperature fluctuations), but overall they match, both having steadily increasing growth rates since the dawn of the industrial era, and it is no coincidence.
@dikranmarsupial…
Not that close. Especially pre-about-1950, which might correspond to partial firn closure for cores.
I’ll also point out that your figure 5 barely goes beyond 2000, while Salby’s claim of a divergence is post-about-2002. See the chart I created (directly from the data from the linked .XLSX file) for how the curve diverges after then. (It does appear a little more extreme than it would if I summed emissions with land-use, since we’ve been requested not to fill the comment streams with picture, I’ll just link to one that includes the sum.
I went ahead and read a few pages of your paper, and scanned most of the rest, and it strikes me as a classic example of the sort of tendentious, question-begging, sophistry I’m used to seeing from you.
You seem to be making the same mistake Salby makes with his swimming-pool analogy: that somehow you can predict natural uptake as a simple, effectively linear, response to pCO2.
AFAIK there is absolutely no justification to make that assumption. There is also no justification for assuming that, because the uptake is less than the total emissions, that atmospheric pCO2 wouldn’t have followed much the same curve even without anthropogenic emissions.
Of course, there’s also no reason to assume that it would.
Not really. Real scientists who study the subject admit there’s a lot that’s still unknown.
As I keep trying to show you, you don’t understand the science, all you know how to do is spout simplistic tendentious sophistry. You keep refusing to see. Sheer denial.
“Obfuscation”. Pfui!
If you think a match as close as Fig 5 in my paper is a coincidence (given that the the carbon cycle models also give the explanation), you will not be convinced of anything.
“that somehow you can predict natural uptake as a simple”
I am not making any such assumption. The mass balance argument doesn’t assume we know the values of natural uptake or natural emissions, but it does allow you to work out the difference between the two.
AK, have you not see that the derivative of the CO2 increase matches the temperature perturbations? This is a signature of a natural sink. Scientifically understood because a warmer surface can uptake less CO2. Also not a coincidence. Where does the carbon end up even in your chain of events? The bottom of the ocean. Not the atmosphere.
Which really has nothing to do with why pCO2 has behaved the way it has.
Looking at your figure 5, I see evidence of considerable difference pre-1950. When we consider the likelihood that ice cores smooth decadal-century-scale peaks, it seems quite plausible that variations similar to what we’re seeing today may have taken place during the last century.
And the Post-Mauna Loa evidence certainly doesn’t support assuming a simple relationship.
AK “Which really has nothing to do with why pCO2 has behaved the way it has.”
well knowing what natural uptake is has no relevance to figure 5 as it is just a plot of the observations, so what is your point?
Not a very good match.
Besides, AFAIK there’s close to a consensus that it’s ENSO related. (I’m working on that, but it’s taking a while because I have to use monthly data: annual gets into aliasing problems with ENSO.)
But if it is ENSO related, there’s no reason to assume that it’s via temperature. In fact, IIRC people have pointed out that the temperature-driven changes shouldn’t be able to achieve the observed amplitudes.
There are many other ways in which ENSO could be driving the 2-5 year variation.
Perhaps.
Not if it can’t produce the observed amplitude.
Pure assertion.
Again, you demonstrate your ign0rance of chemistry.
For purposes of attribution, you need more than to just follow the carbon. You need to understand the back-pressures, all the pressures, so you can make a good case that pCO2 would have behaved differently in the absence of anthropogenic emission.
The evidence isn’t there. Especially when there are other factors, also roughly correlated with the Industrial Revolution, that could have been responsible.
“And the Post-Mauna Loa evidence certainly doesn’t support assuming a simple relationship.”
post 1960 the two curves in figure 5 are practically on top of eachother, how much closer would they need to be to “support assuming a simple relationship”. It certainly supports the conclusion that the rise in atmopsheric CO2 is due to anthropogenic emissions – it would be a bit of a coincidence for the two curves to be practically on top of eachother if the rise in atmospheric CO2 were a natural phenomenon.
My point is you have no good reason to assume natural uptake wouldn’t have been just as much lower than total emissions even in the absence of the anthropogenic component.
This is why I keep saying you’re begging the question: you’re building in unwarranted assumptions about how various sinks, and source/sinks, respond to pCO2.
AK, so you say that the temperature to CO2 derivative as shown by Salby is not a good match, and that blows Salby’s whole outgassing argument out of the water. Moving on. You don’t like the ice core records showing a flat CO2 level because you believe it smooths out variations. If so, why would there be a fixed background value rather than one that varies up and down randomly but in a smooth way. What maintains that flat background if not a flat long-term reality. That whole hidden variation argument is highly flawed because of this non-varying flatness over centuries.
AK wrote “My point is you have no good reason to assume natural uptake wouldn’t have been just as much lower than total emissions even in the absence of the anthropogenic component.”
Yes we do, the reasons are physics and biology that have been well understood for some time. Of course you can always posit some new physics or biology that we don’t know about, but you can ignore any scientific finding you like by doing that.
The fact that atmospheric CO2 levels have been pretty stable over the last million years (even glacial cycles only affected levels by about 100ppm) shows that there are strong feedbacks maintaining the equilibrium. If natural uptake was capricious enough for the recent rise in CO2 to be natural (even thought it has been a constant fraction of cumulative anthropogenic emissions) then the pre-industrial equilibrium would be very hard to explain.
Not a “coincidence”, an artifact, of your choice of drawing schemes.
I’ll agree, it seems unlikely that there isn’t some sort of relationship. But the relationship could easily be to some other factor of the Industrial Revolution. Such as whaling. Or bog clearance. Or other land use changes.
Or some complex combination of factors.
I see no reason for assuming that the primary cause of increasing pCO2 is putting CO2 into the atmosphere. Changes to the natural systems of emission and uptake seem more plausible to me.
and chemistry of course, apologies to any chemist who may be reading!
“Not a “coincidence”, an artifact, of your choice of drawing schemes.”
I added a constant and multiplied by another, which is what a regression would have given. Are you really saying that the results of a one-variable regression would be an “artifact of a choice of drawing scheme”? I’m sorry, but that is absurd. The plot shows that the rise in CO2 is explained very well by a constant fraction of cumulative anthropogenic emissions, it is hard to think of a more basic relationship.
Assuming it existed in the first place. Assuming the “pre-industrial equilibrium” isn’t just an artifact of ignoring certain diffusion effects in ice cores.
AK if you want to disregard any inconvenient data (the issues with ice cores have also be rather well studied) to suit your position, then you can convince yourself of absolutely anything, and there are no prospects of making any progress.
it is amusing to note that AK wrote “My point is you have no good reason to assume natural uptake wouldn’t have been just as much lower than total emissions even in the absence of the anthropogenic component.”
and I responded “Yes we do, the reasons are physics and biology that have been well understood for some time” giving a link to a book from 1979 that explains a lot of the basics.
Did AK accept that there were good reasons? Did AK provide an counter-argument on this point? No, of course not, AK just moved onto questions about the ice-core data. LOL.
@dikranmarsupial…
They most definitely have not been “rather well studied”. In fact, they have all the earmarks of another exercise in question-begging, baked into older ice-core data.
I actually scanned over the links I offered in my other comment, as well as having read other recent papers on both sides of this issue. Most of the defense of the ice-core data strikes me as circular and full of appeals to authority.
Nope.
I’m not going to debate a “book from 1979”, I’ve studied enough biochemistry to know how much of what people thought they knew in 1979 has been shown to be obsolete.
Set up your arguments, and I’ll try to knock them down with recent work. “[… T]he reasons are physics and biology that have been well understood for some time” is just arm-waving.
Backing up:
I tend to be skeptical of charts like yours, so I did one myself:
https://3.bp.blogspot.com/-Pn_pFrHaKw4/V64VynxPLAI/AAAAAAAAAr8/ZnMFehHZat8xhyBK5gED68_PBN1IOPgGQCLcB/s1600/CarbonBudget3.jpg
I’m going to have to think about this for a while. It is more convincing when I’ve done it myself. But the other one I did is pretty convincing too.
These are better matches, because not only is there a match of the low order polynomial (and hence, low order information) behavior of total CO2, but the details of the rate of change are matched as well.
http://woodfortrees.org/graph/esrl-co2/mean:24/plot/hadcrut4sh/scale:0.22/offset:0.1/from:1958/integral/offset:314
http://woodfortrees.org/graph/esrl-co2/derivative/mean:24/plot/hadcrut4sh/scale:0.22/offset:0.1/from:1958
It is a well known fact that in the Northern Hemisphere, where the most fossil fuel emissions of CO2 come from, higher the latitude greater rise in the temperatures, with the Arctic region dominating the global warming tables.
Some years ago I looked into some aspects of the above (at the time I had the CO2 data only to the year 2000) and plotted relevant variables as displayed in this graph:
http://www.vukcevic.talktalk.net/CO2-Arc.gif
Association between variables or lack of thereof, in the above graph are clear but reasons for it not so. Currently science gives attributions to the correlation that is ‘supposedly understood’ even if not as good as the higher one, which may not be.
So we are left with an acceleration in atmospheric CO2 increase, but no acceleration in temperature increase, sea level rise, or sea ice melting.
That is a problem for a hypothesis that proposes that those things depend on atmospheric CO2 levels.
large uncertainties in natural flows make it impossible to detect the effect of fossil fuel emissions.
http://papers.ssrn.com/sol3/papers.cfm?abstract_id=2654191
Not true, the mass balance analysis allows us to estimate the difference between natural emissions and natural uptake with low uncertainty, which allows us to estimate the effect of fossil fuel emissions with high certainty. See the my comment here.
So dunb. You really should not be engaged in this discussion. It is well beyond your level.
The DAILY anthropogenic Carbon emissions compared to the total resident Carbon in the atmosphere AND hydrosphere are just 0.000062%, and this in a dynamic system, when CO2 is continuously being produced and taken up by natural cycles.
I cannot see how this insignificancy can effect the atmospheric levels of CO2 in anyway whatsoever, especially when one realises that a hypothetical instantaneous 2% release of the oceans’ CO2 will result in a 100% increase in atmospheric CO2.
Atmospheric CO2 increase is mainly a result of warming oceans with a secondary but lesser effect due to deforestation.
A recently launched satellite had revealed all this, but its results have been ignored by the media which has continued pushing its faulty old narrative of a catastrophic anthropogenic climate change.
Could you show your math? A “back of the envelope” scribble seems to indicate you are off by a large factor. 40 million tons of daily A CO2 when compared to 40 trillion tons natural CO2 is 1/1,000,000th. Isn’t that .0001%? or .000001 of the natural? With our daily global CO2 output probably closer to 100 million tons you are even further off. Thanks, if you can set me straight.
But what if my back-of-envelop calculations are correct? I picked up the data from Wikipedia. I have now reworked the calculations using different sources for the data which I am submitting here:
>Total mass of atmospheric CO2-3000Gt (http://www.ecoworld.com/atmosphere/effects/how-to-measure-atmospheric-co2-ingigatons-cubic-kilometers.html)
>Atomic mass Carbon-12
>Atomic mass 0xygen-16
>Molecular weight CO2-44
>Hence Total mass of atmospheric C – 818Gt
>CO2 in oceans=atmospheric x 52 times
>Hence total C in hydrosphere and atmosphere – 43,364Gt
>Annual Anthropogenic C emissions – 9Gt
>Daily Anthropogenic C emissions – 0.024657534Gt
>Hence %age proportion of daily Anthropogenic C emissions compared to total C in the oceans and atmosphere combined – 0.000057%
I am pretty sure that my calculations are correct. This one proves my yesterday’s value of 0.000062% pretty close to this one, and therefore correct.
I know that it is very difficult to deal with this truth, but I just can’t do anything about this irrelevant daily amount of anthropogenic contribution to the Earth’s surface’ viable carbon store. I think we are barking up the wrong CO2 tree.
The post and many of the comments are very insightful. To this interested but unsophisticated observer it seems as though no one has aced the exam. Perhaps because all of the needed facts at this time are as yet unknowable which prevents a complete understanding of the systems in toto. But that doesn’t detract from any of these well thought out analyses. It just should remind everyone of the challenges ahead.
Salby seems to destroy his credibility with his CO2 conjecture. He should have just stuck to CO2 not being a pollutant with no demonstrable harm to humans or the environment with a caveat that the cost associated with mitigation having little or no effect on CO2 levels. Too bad.
http://www.breitbart.com/big-government/2016/08/12/winter-is-coming-warns-the-solar-physicist-the-alarmists-tried-to-silence/
I’m very curious about the ENSO cycle and it’s affects as stated by Prof Guido. “we know that the natural carbon cycle is slightly out of balance during El Nino and La Nina periods and after volcanic eruptions”. It seems to me that implies the only time the natural carbon cycle (CO2 only?) is ‘in balance’ is during ENSO ‘neutral’ periods when there are no volcanic eruption effects? I don’t have empirical evidence, but, if this assertion is accurate, the periods in which the natural CO2 cycle is in balance are rather short compared to the periods in which they are out of balance.
You can also look at multi-year averages to average out the ENSO cycle, and then get a better budget of emissions against CO2 increase without the noise.
Doesn’t that assume that El-Nino, La-Nina, & volcanic effects will ‘balance’ over time, i.e., the two cycles are, on average, of equal strength? As I understand the ENSO cycle, El-Ninos do not necessarily follow La-Ninas in a ‘cycle’ and, at least for the period in question El-Ninos have outnumbered La-Ninas both in frequency and strength.
Yes, they do balance over time, especially since the CO2 rise is such a strong signal. Temperature effects diminish as you get to decadal scales, so by then all you see is emissions and the CO2 rise.
I don’t think Guido suggests that the natural carbon cycle (even without anthropogenic emissions) is ever really in exact balance, just that ENSO is one of the things that unbalances the carbon cycle. So if not for ENSO, the natural carbon cycle would balance more closely than it currently does.
In the post-industrial era the natural carbon cycle is never in balance anyway, as anthropogenic emissions have pushed atmospheric CO2 above its equilibrium value, which strengthens the natural sinks relative to the natural sources.
From 1992 until 2014, ONI clearly shows La Nina dominance. The Eastern Pacific trended cooler… a lot cooler.
http://www.climate4you.com/images/NOAA%20CPC%20OceanicNinoIndexMonthly1979%20With37monthRunningAverage.gif
Jim D | August 12, 2016 at 7:54 am |
“Temperature effects diminish as you get to decadal scales, so by then all you see is emissions and the CO2 rise.”
Utter nonsense. The temperature relationship holds for at least the past 58 years, i.e., for as long as we have reliable CO2 data.
http://woodfortrees.org/graph/esrl-co2/derivative/mean:24/plot/hadcrut4sh/scale:0.22/offset:0.1/from:1958
http://woodfortrees.org/graph/esrl-co2/mean:24/plot/hadcrut4sh/scale:0.22/offset:0.1/from:1958/integral/offset:314
Bartemis, I should have been clear that the temperature effects of ENSO on outgassing average out over time, because this was responding to discussion on ENSO effects on the CO2 signal. Of course, the radiative temperature effect of CO2 just gets larger with CO2, as your second graph shows very well. It is very important to realize that the surface temperature both affects and responds to CO2.
“Of course, the radiative temperature effect of CO2 just gets larger with CO2, as your second graph shows very well.”
No, it doesn’t. That is a graph of the rate of change of CO2 matching temperature. The rate of change of CO2 does not drive temperature. That would lead to an absurd situation in which CO2 could rise indefinitely but, once it stopped rising, temperatures would revert, regardless of concentration.
Thus, the direct relationship between the rate of change of CO2 and temperature establishes cause and effect firmly in the direction of temperature to CO2, and not the reverse.
OK, this is what I was thinking you plotted. A direct relation of 1 C per 100 ppm for the last 60 years. No messing.
http://woodfortrees.org/plot/esrl-co2/scale:0.01/offset:-3.25/plot/gistemp/from:1950/mean:12
Jim D: “A direct relation of 1 C per 100 ppm for the last 60 years.”
You can post that piece of rubbish as many times as you want, it still won’t come true, Dr. Goebbles.
Many a skeptic has scratched their head over that graph and wondered to themselves surely it can’t be what it looks like because that would mean AGW is right with effectively over 2 C per doubling. No models, just observations.
“that would mean AGW is right with effectively over 2 C per doubling.”
No, it would mean absolutely nothing of the kind.
Jimbo, write out 10,000 times:
>Correlation DOES NOT imply causation
Correlation is evidence of correctness.
Jim D: “Correlation is evidence of correctness.”
More arrant nonsense.
It is nothing of the kind.
Jim D | August 13, 2016 at 12:26 pm |
Pathetic. It’s not hard to get a vague likeness from two low order polynomial series, because there’s very little information to match. It’s when you get a match like this
http://woodfortrees.org/graph/esrl-co2/derivative/mean:24/plot/hadcrut4sh/scale:0.22/offset:0.1/from:1958
with every nook and cranny matching, that’s when you know you have something.
Yes, that is already explained too.
Then, you agree that the graph putatively relating temperature to CO2 is spurious, merely an indication that both variables went up at the same time, and the graph relating CO2 to temperature is the right one?
You cannot have both. That would represent an unstabilizable positive feedback system.
You can have both.
1. The emissions cause a rise in CO2 (surprisingly to you perhaps), which causes a rise in temperature (even more surprising to you).
2. There is a natural sink which is less effective for warmer years, so the CO2 rise is slightly but detectably faster in warmer years.
Sorry, no, you cannot have both. Either temperature is driving the rate of change of CO2, or CO2 is driving temperature. Having both would be unstable. Given that the former is as perfect a fit as one could ask for, while the latter is merely two signals that happen to be going in the same direction, it is the former.
CO2 directly affects the temperature, and temperature also has a role in the sink’s effect because warmer water absorbs CO2 less effectively. The effect of temperature on the sink is small compared to the emissions source, but measurable, and has little bearing on the warming rate.
Incorrect. As long as the gain is less than 1, the system is stable. It’s a convergent series (remember these from Calculus?).
Let me explain it this way:
Say that 1 degree of warming causes a release of 10 ppm CO2. (roughly accurate).
That 10 ppm CO2 causes another 0.2 C of warming. Which produces another (0.2*10) = 2 ppm of CO2. Which produces another (2 * 0.2/10) = 0.04 C of warming. Etc. Each part of the feedback loop produces ever-smaller total effects.
Run the numbers; that converges at 0.25C of warming and 12.5 ppm of extra CO2. Not unstable.
“As long as the gain is less than 1, the system is stable.”
The gain is not less than unity. The relationship is revealed here
http://woodfortrees.org/graph/esrl-co2/derivative/mean:24/plot/hadcrut4sh/scale:0.22/offset:0.1/from:1958
It is an integral relationship
dCO2/dt = k*T
for appropriately baselined temperature. It has infinite gain at zero frequency.
If you couple this with a perturbative equation for temperature, say
dT/dt = -a*T + b*CO2
you find it cannot be stabilized for b positive and k positive.
The first one should be
dCO2/dt = E + k*T
because there is a large emission source, E. The second one should be
T=a*CO2+b
because T grows in proportion to CO2.
It’s obvious that temperature caused the CO2 to go up.
Shoot, even the pause in temperature caused the CO2 to go up.
Bartemis,
In your equation
dCO2/dt = kT
is t time?
JCH | August 15, 2016 at 5:09 pm |
It’s an integral relationship. The “pause” caused the rate in CO2 to pause in lockstep. The relationship is really good with RSS:
http://woodfortrees.org/plot/esrl-co2/derivative/mean:12/from:1979/plot/rss/offset:0.6/scale:0.22
…and Then There’s Physics | August 15, 2016 at 5:18 pm |
Yes, little “t” is time. Big “T” is temperature anomaly (with respect to the appropriate baseline).
Jim D | August 15, 2016 at 5:23 pm |
“The first one should be
dCO2/dt = E + k*T”
E is superfluous. Not needed to get an excellent fit:
http://woodfortrees.org/plot/esrl-co2/derivative/mean:12/from:1979/plot/rss/offset:0.6/scale:0.22
“The second one should be
T=a*CO2+b”
Then
dCO2/dt = a*k*CO2 + …
which is unstable if both a and k are positive.
E turns out to be the dominant term. The first T is really a perturbation from a base T, and that term can be either positive or negative. In ENSO neutral conditions, or averaged over long periods
dCO2/dt = E
There is also a natural variation addition to T in the second equation which is like a time-dependent b term, but averaged over longer periods you get
T=a*CO2+c
where c is a constant. This just gives you a stable growth of T with E when you consider the terms after averaging out ENSO.
Bartemis,
Well, if t is time and T is temperature anomaly in your equation,
dCO2/dt = kT,
then the solution is
CO2 = kTt + C
which would seem to suggest that CO2 would rise with time even if T = constant. These seems so obviously silly, I’m genuinely worried that I’m missing something.
…and Then There’s Physics | August 15, 2016 at 5:30 pm |
“…which would seem to suggest that CO2 would rise with time even if T = constant.”
Lot’s of things seemed silly at the time, before data collection showed the truth of it. This is what the data tell us is happening:
http://woodfortrees.org/plot/esrl-co2/derivative/mean:12/from:1979/plot/rss/offset:0.6/scale:0.22
It assuredly cannot go on forever, but the relationship has been remarkably stable since at least 1958, when we started getting decent CO2 data
http://i1136.photobucket.com/albums/n488/Bartemis/temp-CO2-long.jpg_zpsszsfkb5h.png
An integral relationship is, in fact, what we should expect for a dynamic flow problem. Let A be atmospheric content, and O be oceanic content at the surface layer. Then, we can create a toy model of the form
dA/dt = a*(O – A) + E
dO/dt = b*(A – O) + U – D
where U is CO2 content of upwelling waters, and D is downwelling content. The ratio of a to b is related to Henry’s constant, and these dynamics are fast.
U is essentially exogenous over the timeline of interest, as it represents waters that began their trek from the surface to the depths and back again centuries ago. D will be proportional to -O, and will also be temperature dependent, so we can express this as
dA/dt = a*(O – A) + E
dO/dt = b*(A – O) + U – (k0 + k1*(T-T0))*O
If k0*O is approximately U, and equilibration time is long, then we can write this approximately as
dA/dt = a*(O – A) + E
dO/dt = b*(A – O) + – k1*(T-T0)*O_SS
where O_SS is nearly constant. The steady state solution is then approximately
dA/dt := (b*E + a*k1*O_SS*(T-T0))/(a+b)
If a is much greater than b, then
dA/dt := k*(T – T0)
where k = k1*O_SS.
And, this is what we see in the data. As long as the dynamics of equilibration are slow, then the output A will look like the integral of temperature anomaly over a timeline much shorter than it.
This is what I believe is happening. But, regardless of whether my particular hypothesis is correct or not, the data are telling us in no uncertain terms that atmospheric CO2 is primarily driven by temperature, and the relationship is an integral one.
Clarification:
dA/dt = a*(O – A) + E
dO/dt = b*(A – O) + U – (k0 – k1*(T-T0))*O
If k0*O is approximately U, and equilibration time is long, then we can write this approximately as
dA/dt = a*(O – A) + E
dO/dt = b*(A – O) + k1*(T-T0)*O_SS
Bartemis, yours is a tail wagging the dog view. The actual CO2 is given by
dCO2/dt = E – N
where N = N(T) is the temperature dependent natural sink. E is a fairly large fixed term independent of T being emissions. It only needs N to have a linear dependence on T to get a relationship where
dCO2/dt = a + b*T
which is what you are plotting.
Jim D | August 15, 2016 at 5:49 pm |
Sorry Jim. You can’t just throw away an unstable part like that. Even if you could claim the instability took a long time to build, eventually it would build, and lead to a runaway condition.
Furthermore, E is clearly not the dominant term. If you give me the starting point, and the temperature record, I can tell you what the current CO2 level is with fairly high accuracy. E is superfluous. It contributes, at most, a very minor amount to the overall level.
The integral CO2 in the atmosphere agrees with the integral emissions with the natural sink removing about half of them. Where, in your world, do the emissions go if not half into the atmosphere and half into the sink? Do your integrated budget which should include emissions somewhere, and see what happens to it, or are you denying emissions. Your puzzle has this rather large missing piece.
Jim D and others: The first one should be
dCO2/dt = E + k*T
because there is a large emission source, E. The second one should be
T=a*CO2+b
because T grows in proportion to CO2.
second point first. T is proportional to log(CO2), so
dT/dt = k*(1/[CO2])*d[CO2]/dt + other contributing factors like insolation; WebHubTelescope went into this in some detail a while ago, and he had a model for T with a good fit to extant data (I called it “live” meaning not disconfirmed by data, though also not tested against out of sample data.) Note that the derivatives of the other factors with respect to time might not be 0.
dCO2/dt is more complex. Assume for simplicity a source with a varying 0-order rate with time-varying rate coefficient (s(t)), and two first-order sinks with temperature-dependent rate coefficients (solution in ocean: o(T); and storage in carbohydrates by photosynthesis p(T).
Then
d[CO2]/dt = s(t)*[d s(t)/dt] – o(t)*[CO2] – p(t)[CO2].
where as usual [CO2] is concentration of CO2.
It goes to 4 terms if there are 2 0-order sources with different time-varying rate coefficients, say a human source (rising rate coefficient over time) and a natural source (with rate coefficient not known to be either rising or diminishing over time.
k might be considered “known” from WHT’s least-squares fitting. s(t) is approximated from fuel consumption statistics; o(t) and p(t) are not known. p(t) seems to be increasing with both T and CO2; o(t) decreases with increasing T.
Salby’s conclusions rest upon unjustifiably strong conclusions about the rates of sources and sinks. Note that the derivative of T with respect to t over the 20th century is a product of an increasing function and a decreasing function; hence it is nearly independent of CO2 on that interval..
Salby also has to ignore the role of emissions, which is what Bartemis is doing too.
Yes, I was linearizing the log function. For the past 60 years 1 C per 100 ppm is a surprisingly good linear fit.
http://woodfortrees.org/plot/esrl-co2/scale:0.01/offset:-3.25/plot/gistemp/from:1950/mean:12
Jim D | August 15, 2016 at 6:03 pm |
Sorry, Jim. You are positing an unstable system.
And, E is not large. Natural input dwarf anthopogenic inputs.
matthewrmarler | August 15, 2016 at 6:13 pm |
“Assume for simplicity a source with…”
There is no need to assume anything. The data very clearly show that the dominant process has the form
dCO2/dt = k*T
where T is the anomaly from an appropriate baseline.
http://woodfortrees.org/plot/esrl-co2/derivative/mean:12/from:1979/plot/rss/offset:0.6/scale:0.22
Take that as the starting point, and work out your hypotheses from it. Don’t form the hypothesis first, and then try to shoehorn the data into it.
“It is a capital mistake to theorize before one has data. Insensibly one begins to twist facts to suit theories, instead of theories to suit facts.”
― Arthur Conan Doyle, Sherlock Holmes
Jim D | August 15, 2016 at 6:19 pm |
“The integral CO2 in the atmosphere agrees with the integral emissions with the natural sink removing about half of them.”
Not very well, and the fit with the temperature data is much, much better.
“Where, in your world, do the emissions go if not half into the atmosphere and half into the sink?”
My equations above clearly show the E term, and I show how it can contribute only a very small amount to the overall atmospheric concentration. The emissions join the much larger flow of natural CO2, and are easily handled by the same sink activity that handles natural flows.
I must go and do some real work. Will check in later.
Jim D | August 15, 2016 at 6:23 pm |
“Salby also has to ignore the role of emissions, which is what Bartemis is doing too.”
Not ignoring, just considering them in proper proportion. The much larger natural flows, modulated by temperature, dominate the observations by a wide margin.
Here is what the integrals look like over time. One is emissions, one is CO2. The shapes being the same should tell you something. This is the big picture. the temperature dependence barely shows up on this scale. You can’t see the forest for the trees when you look at derivatives.
https://3.bp.blogspot.com/-Pn_pFrHaKw4/V64VynxPLAI/AAAAAAAAAr8/ZnMFehHZat8xhyBK5gED68_PBN1IOPgGQCLcB/s1600/CarbonBudget3.jpg
“The shapes being the same should tell you something.”
It does. It tells me you found something you liked, and stopped looking. It tells me you need to learn a bit about confirmation bias.
“You can’t see the forest for the trees when you look at derivatives.”
On the contrary, you see that it matches in the small, higher frequency, higher information, detail as well as the large, lower information, realm. But, if you want to compare the total, this integration of the derivative comparison is a better fit, as it matches the derivative, too.
http://i1136.photobucket.com/albums/n488/Bartemis/tempco2_zpsmgkycbdj.png
Look, CO2 started rising at the same time and accelerated at the same rate as emissions. The high-frequency temperature variation is in the natural sink part, and is also as expected.
Jim D and Bartemis: “The shapes being the same should tell you something.”
What your graphs show is that with present data, the most important alternative hypotheses can not be ruled out. Multiple processes acting concurrently are changed concurrently by changes in T and CO2 since 1880.
I’ll repeat here something that I said before: if the entire increase in atmospheric CO2 has been caused by a natural process independent of human emissions, then a mass of CO2 equal to the entire human emissions of CO2 since 1880 has been added to the atmosphere. Either that or some process managed to absorb it all even as the rest of nature was outgassing CO2. Given that, at least some of the increase in CO2 must be of human origin; given that, there isn’t enough information about all the rates of all the processes to estimate the relative proportions of human and natural contributions accurately.
Without emissions, there would have been no CO2 rise. Take a look at the long-term behavior and contemplate what it means.
https://s3-us-west-1.amazonaws.com/www.moyhu.org/misc/ghg/m.png
“Without emissions, there would have been no CO2 rise.”
This is an expression of faith.
Do you even see the graphs and think about what they tell you?
Jim D | August 16, 2016 at 3:54 am |
“Look, CO2 started rising at the same time and accelerated at the same rate as emissions.”
Post hoc ergo propter hoc. If the warmist side didn’t have logical fallacies, they’d have nothing at all.
Temperatures started rising at the same time, too. And, they make a much better fit with the data. MUCH better. And, due to the integral nature of the relationship, you can only have one or the other, or you get instability – temperatures drive CO2, or CO2 drives temperatures. It is very clearly the former.
I think we’ve exhausted all the avenues, and you fellows are just casting about for excuses and rationalizations to deny the obvious. Time will tell. Hasta la vista.
Visual evidence is not a fallacy. Would CO2 have risen without us injecting something almost equaling the total atmospheric content into it? It looks like you are just being deliberately obtuse.
“Visual evidence is not a fallacy.”
Drawing inferences from visual evidence based on consistency with a preferred paradigm is post hoc ergo propter hoc, a classic logical fallacy that has been catalogued since antiquity. It is the same fallacy that led people to believe that night gasses caused malaria, or that catastrophes were the result of a god or gods being displeased with them, or that wearing coconuts on their ears would bring the great silver birds of the sky to their island to dispense their bounty. It is positively primitive and, when you engage in it, you are behaving as a throwback to a less enlightened era.
“Would CO2 have risen without us injecting something almost equaling the total atmospheric content into it?”
Yes. CO2 concentration evolves primarily based on temperatures. That is what the data show.
Our activities have a negligible effect. It is like keeping a candle lit in your home for a week, summing up the total of heat it emitted, noting that the amount of heat generated would have increased inside temperature by 10 degrees and, as temperature was observed to rise 5 degrees, concluding it did so because of the candle, and not because little Johnny surreptitiously raised the thermostat on your air conditioning by 5 degrees. The impact of the thermostat on the air conditioning is many times more powerful than the heat from the candle, and the heat generated by the candle dissipated in any case well before the week was up.
“It looks like you are just being deliberately obtuse.”
And, it looked like those who said people were getting sick due to animicules in the body were being deliberately obtuse when anyone could see that keeping your window open at night was the cause of sickness. This is why we have the scientific method, because it has been observed over and over and over again that what appears obvious is often completely wrong. That is why we demand logical rigor, and thorough testing.
For millennia, humankind suffered under the arbitrary dictates of those who ‘saw the obvious’, and ordered up quack cures and useless rituals and sacrifices for the ‘common good’. You are like a shaman in a grass skirt, ordering the villagers to throw a virgin into the volcano to appease the gods.
Snap out of it. Join the 21st century. Follow the train of rigorous logic your Enlightenment forebears laid out for you. If you do, you can only come to one conclusion: we are not in control of atmospheric CO2 and, indeed, have little impact on it at the present time.
If someone poured water into a glass in front of you and then said look there is water in that glass because I poured it there. You would still doubt cause and effect and call it a logical fallacy. You are saying the poured water went somewhere else, and the water in the glass came from somewhere else. Great stuff. Good thinking. Keep it up, genius.
“If someone poured water into a glass…”
Wow Jimbo, if you set fire to a strawman as big as that, you could warm up the entire Solar System, not just the Earth!
It applies to CO2. If you pour CO2 into the atmosphere and the amount in the atmosphere rises, while the ocean also absorbs some and acidifies as a consequence, why would you conclude that it is coming out of the ocean (wrong sign), and where did the emissions go? Real headscratcher, right?
Jim D: “Real headscratcher, right?”
To you, perhaps…
My headscratcher is why anyone could still be supporting Salby’s idea that the majority (even skeptics here) have officially declared goofy. And it comes down to the question I posed above. Carbon into the air, and carbon into the ocean. Where is all this coming from, if not emissions?
Jim D: “why anyone could still be supporting Salby’s idea”
Please indicate the post in which I stated that I supported Salby’s idea.
OK, which part of Salby’s idea do you consider wrong?
Jim D: “OK, which part of Salby’s idea do you consider wrong?”
Answer the question.
You disagree that the CO2 rise came from emissions, right? Or was that Bartemis? Perhaps you jumped into the thread to disagree with Bartemis, but I don’t know. You tell me.
“If someone poured water into a glass in front of you and then said look there is water in that glass because I poured it there…”
This isn’t a water glass. This is claiming the water level in the lake rose because you’ve been piddling into it since you were a babe. Forget about precipitation or water management at the dam. It’s all you.
“…why would you conclude that it is coming out of the ocean …
Because that is what the evidence indicates.
“…(wrong sign)…”
Wrong logical inference.
“…and where did the emissions go?”
Same place the much larger natural inputs go. The sinks maintain a balance between inflow and outflow. Normally, the most you could change that balance would be in proportion to your inputs versus the natural inputs, i.e., at best a few percentage points. But, the balance point is temperature dependent, and when there is a surfeit of inflow compared to outflow induced by the temperature change, the amount retained increases steadily.
That is what the data tell us. That is the scientific analysis. All your instinctual protestations are just so much drum banging by a primitive shaman.
Follow the carbon.
Bartemis: dCO2/dt = k*T
where T is the anomaly from an appropriate baseline.
http://woodfortrees.org/plot/esrl-co2/derivative/mean:12/from:1979/plot/rss/offset:0.6/scale:0.22
Take that as the starting point, and work out your hypotheses from it. Don’t form the hypothesis first, and then try to shoehorn the data into it.
You do not acknowledge that in the presence of a known input, such as human input, that relationship does not have a unique interpretation. The sinks that I mentioned, ocean and photosynthesis, are not imaginary, but are known to exist and have estimated rates, though the rates are not estimated very accurately. You have to assume that nothing else is happening, which, like it or not, is an assumption, and counterfactual at that..
“It is a capital mistake to theorize before one has data. Insensibly one begins to twist facts to suit theories, instead of theories to suit facts.”
― Arthur Conan Doyle, Sherlock Holmes
That may be good enough for fictional detectives, but it is worthless in science. What we have in this instance is lots of data but only partial knowledge about each of several process.
Thanks for starting a new thread.
“You do not acknowledge that in the presence of a known input, such as human input, that relationship does not have a unique interpretation.”
I acknowledge it, but I consider it very unlikely to have much of an impact. We have a temperature relationship that, when it is scaled such that all the wiggles match, also matches the long term trend. Integrating that relationship, we get an excellent fit with observations.
In order to add some portion of accumulated emissions into that relationship requires backing off the scaling factor, so that the long term trend does not become too large. But then, the wiggles don’t match so well anymore.
It may seem to someone stuck in city traffic that we are belching an ungodly amount of CO2 into the atmosphere. Yet, it is actually a pittance compared to the natural flows. I think it is far-fetched, and excessively ego-centric, to actually believe that we have much of an impact. And, the data certainly appear to back that evaluation up.
In the next few years, we should see temperatures decline due to the impending downward phase of the ~65 year cycle. This is what I expect to see – a continuation of the long term trend and cyclic behavior which has been observed since well before CO2 could have been a factor:
http://i1136.photobucket.com/albums/n488/Bartemis/ex_zpsgxhcx6bz.jpg
If that happens, the divergence is going to be very dramatic. But, it’s already fairly dramatic with the on-going “pause”
http://i1136.photobucket.com/albums/n488/Bartemis/nopause_zpscjndrosf.png
It’s not going to be long before people who believe in anthropogenic attribution are going to have to confront the divergence between the declining, or at least non-increasing, rate of change in the atmosphere versus the continuing acceleration in emissions. The gap is growing rapidly.
bartemis: It may seem to someone stuck in city traffic that we are belching an ungodly amount of CO2 into the atmosphere. Yet, it is actually a pittance compared to the natural flows.
that is a foolish comment. being stuck in traffic is irrelevant. The natural flows are large, but the estimated anthropogenic CO2 is a large fraction of the increase in the atmospheric total CO2. This is analogous to your weight gain if you consume 1% more calories than you use up over a long period of time. The human effluent added a slight amount more than was removed from the atmosphere over a 100+ year period of time. Without accurate quantitation of all the rates of all the processes the fraction of the total due to humans can’t be quantified, but the claim that it is 0 leaves a great mass of CO2 unaccounted for.
The rest of that comment was irrelevant.
“This is analogous to your weight gain if you consume 1% more calories than you use up over a long period of time.”
If you are comsuming 2000 calories a day, and you bump it up to 2020 calories, you are not going to gain weight indefinitely. Your body will adjust, and you will reach some new equilibrium weight slightly greater than where you were. There are feedback systems involved, just as there are feedback systems on the Earth for the regulation of CO2.
“The rest of that comment was irrelevant.”
See no evil, hear no evil. You are in denial.
You are in denial.
Maybe now you are prepared to answer a question, a slight variation on a proposition I have written: if since 1880 or thereabouts, the net flow of CO2 between the natural sources and the sinks has shown a net balance producing an increase of atmospheric CO2, where has all of the anthropogenic CO2 gone?
I’ve answered this silly question several times. Here is a cut and paste from above:
Same place the much larger natural inputs go. The sinks maintain a balance between inflow and outflow. Normally, the most you could change that balance would be in proportion to your inputs versus the natural inputs, i.e., at best a few percentage points. But, the balance point is temperature dependent, and when there is a surfeit of inflow compared to outflow induced by the temperature change, the amount retained increases steadily.
That is what the data tell us. That is the scientific analysis.
bartemis: Same place the much larger natural inputs go. The sinks maintain a balance between inflow and outflow. Normally, the most you could change that balance would be in proportion to your inputs versus the natural inputs, i.e., at best a few percentage points. But, the balance point is temperature dependent, and when there is a surfeit of inflow compared to outflow induced by the temperature change, the amount retained increases steadily.
that is not possible if the entire increase is independent of human CO2. If over the course of time, the net rate into the atmosphere of natural processes is positive, then a mass of CO2 equal to the entire anthropogenic CO2 must accumulate in the atmosphere.
What you refer to as a “balance” is a balance of the rates of absorption into sinks and outflows from sinks, so you must model those rates along with the rate of human effluent in order to calculate how much of the increase is human-generated and how much is natural. Since the rate of outgassing from the ocean increases with temperature, you are requiring that the rate of flow into sinks increases with temperature sufficiently rapidly to absorb all CO2 outgassed from the ocean and all anthropogenic CO2. Far from making no assumption, you are making an incredible assumption about the relative rates of the sinks and sources of CO2. (cf, your Don’t form the hypothesis first, and then try to shoehorn the data into it.)
I went through the math for my hypothesized model above @ August 15, 2016 at 5:55 pm. There is no inconsistency. There are just too many people who do not understand the dynamics of feedback loops offering their unqualified opinions.
Bartemis: There are just too many people who do not understand the dynamics of feedback loops offering their unqualified opinions.
I think that you are in over your head.
If it is true that the total increase in CO2 is caused by the net positive balance of the source rates and sink rates over the past century or so, then the a mass of CO2 equal to the total mass of the anthropogenic CO2 has been added to the atmosphere.
Bartemis | August 15, 2016 at 2:55 pm |
has words but no math.
“…then the a mass of CO2 equal to the total mass of the anthropogenic CO2 has been added to the atmosphere.”
A little less than half. So? Are you one of the pseudo-mass balancers who imagine that the facile observation that the rise is less than the sum total of human inputs proves it was caused by human inputs? Those are very stupid people.
In a feedback loop, it is quite possible to remove the entire impact of a disturbing input, while the output is dominated by impacts of more powerful agents. It’s beyond elementary in the theory of control systems.
“…has words but no math.”
That can happen when you get the time off by 3 hours. Try cutting and pasting.
“A little less than half.”
And, declining, BTW – see ulriclyons post @ August 12, 2016 at 8:35 am just below this one.
Fools who believe in anthropogenic attribution are in the uncomfortable position of having to claim that the sinks are getting more powerful, which is very unfortunate because they had hoped to stoke alarm by having the sinks become less efficient.
But, it’s just adding epicycles to an incorrect hypothesis. When you use the integral relationship with temperature, there is no discrepancy. The sinks are not getting more powerful. The rate of change of atmospheric CO2 simply stabilized with the “pause” in temperatures, while human inputs kept accelerating upward.
It’s really a slam dunk. There is no doubt about it. Human inputs have negligible impact, and the rate of change is being driven by natural, temperature dependent, forcing.
Bartemis, you have invented a Rube Goldberg machine where a simple lever will do, plus you avoid explaining where the carbon for ocean acidification came from. The lever is: carbon is emitted, some ends up in the atmosphere, some goes into the surface including the ocean. Occam’s Razor. It doesn’t get simpler than that, and as an added bonus, the details fit with a slightly temperature-dependent sink.
bartemis: That can happen when you get the time off by 3 hours. Try cutting and pasting.
Sorry.
So you have some diffeqns with hypothetical mechanisms and unknown rates; I have a simpler set of diffeqns with hypothetical mechanisms and unknown rates. Either way, if the integral over time of the difference in rates between natural flows into the atmosphere and out of the atmosphere is positive, then a mass of CO2 equal to the mass of CO2 emitted by humans must have been added to the atmosphere; the only way out of that is to posit a special sink for the anthropogenic CO2. So the increase in CO2 can not be completely natural.
Are you one of the pseudo-mass balancers who imagine that the facile observation that the rise is less than the sum total of human inputs proves it was caused by human inputs?
You have mistaken what I wrote. I have written that the increase can not be purely natural. What the balance of natural source and human source is can not be estimated without knowing the rates of the natural processes with greater accuracy than is now at hand.
Control theory is fine, but we lack detailed knowledge of the mechanisms and rates.
Fools who believe in anthropogenic attribution are in the uncomfortable position of having to claim that the sinks are getting more powerful, which is very unfortunate because they had hoped to stoke alarm by having the sinks become less efficient.
Someone may have been stoking alarm, but not I.
Natural sources and sinks have not maintained the exact same rates since 1880, hence not the exact same approximate balance. Photosynthesis is evidently faster, but the balance of the temperature and CO2 atmospheric pressure effects at the ocean surface is not known (increased atmospheric CO2 concentration increases solution into the ocean, but increased ocean temperature increases the rate of dissolution into the atmosphere); the rate of sedimentation of the dissolved CO2 has increased..
If half of the atmospheric CO2 is anthropogenic, that is more than Salby has been willing to admit so far. I believe I read an estimate of 85%,, but as I said, none of the rates are accurately enough known to strongly support a conclusion.
Jim D | August 20, 2016 at 2:15 pm |
“…you have invented a Rube Goldberg machine where a simple lever will do…”
Actually, it is you guys who have to invent exotic processes to explain away the remarkable consistency between temperatures and the rate of change of atmospheric CO2. Or, would, if you were that sophisticated.
But, you don’t even understand why you would have to do that, do you?
“…the details fit with a slightly temperature-dependent sink.”
But, they don’t, for the reasons I have presented previously.
matthewrmarler | August 20, 2016 at 3:45 pm |
” I have a simpler set of diffeqns with hypothetical mechanisms and unknown rates.”
But, they don’t fit the data.
“…if the integral over time of the difference in rates between natural flows into the atmosphere and out of the atmosphere is positive, then a mass of CO2 equal to the mass of CO2 emitted by humans must have been added to the atmosphere.”
Sorry, no. I am not going to argue basic control systems theory with you guys anymore. It is as futile as trying to explain Relativity to my dog. And, I don’t even have a dog.
It is incredibly obvious that human inputs are having negligible effect. Keep watching the rate of change as temperatures continue to stall or even decrease. The rate of change of atmospheric CO2 is going to march in lockstep with the temperatures, as it has for at least the past 58 years.
In the meantime, human inputs are going to continue accelerating. The divergence is already stark, and it is going to become undeniable (it already is to any with the brains and lack of bias to see it). There is no need to go making up epicycles to maintain the illusion that humans have a significant impact. We don’t.
And, that is my last word on this thread.
Once again, Bartemis avoids talking about ocean acidification.
Jim D: “Once again, Bartemis avoids talking about ocean acidification.”
Probably because it would be about as relevant as talking about unicorns.
@Jim D says “…you avoid explaining where the carbon for ocean acidification came from. The lever is: carbon is emitted, some ends up in the atmosphere, some goes into the surface including the ocean. Occam’s Razor.”
Jim, there are close to 40,000 gigatons of carbon in the deep oceans that are subject to tidal mixing and changes to ocean circulation patterns. There is carbon in the lithosphere, over 200,000 gigatons of the stuff, that is part of the carbon cycle through the Earth’s tectonic activity, a portion of which is going to be released from time to time into the hydrosphere.
Contrast those quantities with the nominal 800 gigatons of carbon currently in the atmosphere, which includes the rather paltry (by comparison) increase of 250 or so gigatons of carbon attributed to humans since the beginning of the industrial revolution.
I don’t think Occam is necessarily on your side.
bartemis: And, that is my last word on this thread.
I’ll leave it alone as well. You have the last word.
Warm AMO.
“Uptake of atmospheric carbon dioxide in the subpolar North Atlantic Ocean declined rapidly between 1990 and 2006. ”
http://www.nature.com/ngeo/journal/v6/n2/abs/ngeo1680.html
http://ej.iop.org/images/1748-9326/8/1/011006/erl459410f3_online.jpg
“However, it is the dependence of the airborne fraction on fossil fuel emission rate that makes the post-2000 downturn of the airborne fraction particularly striking. The change of emission rate in 2000 from 1.5% yr-1 to 3.1% yr-1 (figure 1), other things being equal, would [should] have caused a sharp increase of the airborne fraction” —- Hansen et al, 2013
“other things being equal” is the issue though, one would be land use change, another would be ENSO. The paper sounds interesting, can you give a URL?
With the North Atlantic being such a large CO2 sink, the AMO is major factor. Associated regional rainfall changes may also play a part.
Dikran,
Yes, ENSO is a factor (as is average sea surface temperature). But I think the bigger reason the airborne fraction did not rise as expected is that the expectation for that rise is based on a flawed model of CO2 uptake (Bern model). Bern is basically a multi-exponential curve fit, and while that fit matched historical atmospheric response when it was done, like most curve fits, it lacks predictive power. My guess is that Bern just assigns too much uptake to a fast response which saturates quickly and too little uptake to slower responses which saturate much more slowly. The result is that Bern predicts an increase in airborne fraction with rising emissions that doesn’t happen; the opposite happens. This may be related to the high measured CO2 uptake rates in the North Atlantic which are due to quite deep (eg up to >700 meters) convective overturning in the North Atlantic, which we discussed briefly at Ken Rice’s blog some weeks ago. Deep convective overturning is an example of a much slower (and large capacity) CO2 sink which can saturate only very slowly.
The airborne fraction doesn’t involve the Berne model; expectations of what it should be may, but not the airborne fraction itself.
According to the paper, the missing factor was thought to be the rise in aerosols from increase coal burning in India and China affecting the carbon cycle in a similar manner to volcanic activity.
It would be interesting to see the error bars etc., it isn’t clear to me that there is a statistically significant change that needs explaining, but then again I have only had time to skim the paper and may have missed it.
Dikran,
“The airborne fraction doesn’t involve the Berne model; expectations of what it should be may, but not the airborne fraction itself.”
Of course, the airborne fraction is what it is. The model only provides an expected response (AKA prediction). I would never suggest otherwise. I am pretty sure a flawed model is the best explanation for the divergence between expected and actual airborne fraction; it is after all just a curve fit. But only time will tell.
Guido,
I appreciate that you took the time to write this post, and of course you show (again!) that Salby’s arguments are utterly wrong. No surprise there, others, including Ferdinand E, have been pointing this out for years. The first time I saw the “could just be outgassing from the ocean” claim several year ago I even wrote a guest post at WUWT showing how the rise in atmospheric CO2 can be duplicated by a very simple model that includes only CO2 emissions and changes in sea surface temperature. That guest post generated a blizzard of comments with exactly the same spurious ‘logic’ you saw in the Salby thread and on this thread, often by the same commenters. Nothing has changed over the intervening years. I concluded after my guest post at WUWT that there was absolutely no point in trying to convince some people that adding CO2 to the atmosphere will cause the atmospheric concentration to rise. I applaud your efforts, but fear you are wasting your time.
SFP, the ocean outgassing theory is observationally debunked by actual pCO2 (dissolved CO2) measured in the mixed layer at Station Aloha in the Pacific and BATS in the Atlantic. Both are in barren waters, so the confounding biological sink is minimized. In both locations the mixed layer pCO2 rises at the same rate (i.e in parallel) as atmospheric ppm. You can use google images to find multidecade charts for both locations. So Salby is simply wrong.
This is tautological, whatever the source. You forget that the ocean is a dynamic body of water, not a static pond. There is always an inflow to the surface, and an outflow to the depths.
Bartemis: You forget that the ocean is a dynamic body of water, not a static pond. There is always an inflow to the surface, and an outflow to the depths.
With that you have joined me in hypothesizing processes whose rates are not known. In order to conclude that the entire atmospheric CO2 increase is independent of human CO2 emissions, you would have to assume something about the ratios of those and other rates.
Salby is wrong in that the IPCC premise could be correct in a small number of cases.
Guido however is deliberately misleading in trying to beat him down.
–
This does not bode well for the truth of his assert actions if he has to mislead so much in the reply.
–
Salby states the rate of increase in growth in fossil emissions has increased 200% since 2002 compared to the rate of increase in growth since 1990.
A 1% change in trend to a 3% change in trend is a 200% increase, not a 20% change.
Guido changes this to a claim that Salby said fossil fuel emissions increased by 3 times which is not at all what Salby was showing in his graph
–
Shifting to a different measure, total output change and presenting it as the same thing when knowing it isn’t is sad and wrong.
–
Guido then puts up a graph of fossil fuel emissions from the Global carbon project with a different y axis showing the full fossil fuel emissions over this time.
The same one as Salby.
Sadly they are not the same graph.
Salby 6.1 Gct/year per year to 9.8
Guido. 7.8 Gct/year to 11.
Now you can shoot Salby down by saying he used the wrong graph, but you have to state this.
You can argue with him on the same graph but it has to be the same graph.
Or you can pretend it is the same graph, and put anything you like on it but the moment you pretend, or the moment you don’t notice you are using a different graph, you lose bulk credibility, no matter how “prestigious” you are
> Guido changes this to a claim that Salby said fossil fuel emissions increased by 3 times which is not at all what Salby was showing in his graph
A 3% rate is 200% more than a 1% rate; 3% is 3 times 1% (0.01 x 3 = 0.03).
What’s the problem with that, and is there a secret formulae from the Harvard Advanced Econometry Dept that I am missing again?
***
> This does not bode well for the truth of his assert actions if he has to mislead so much in the reply.
I’m not even sure Guido did, so that he has to is far from being established.
Cut to INTEGRITY ™.
Cut to INTEGRITY ™.
Or cue?
I agree with you.
So maybe it should be a queue.
Could be a jump to, angech, but how you jump on “cut” looks more like a jump, as it cuts nothing.
See my detailed post above on increase in RATES vs the total Fossil Fuel emissions etc.
Salby states humans have emitted twice as much CO2 over the last decade compared to the previous decade, strictly not true as a 3% compounding over a decade is a 71% (approx) increase not a doubling.
But Guido claimed, by changing back to Salby’s increase of trends that Salby had said there was a 200% increase in fossil fuel emmisions.
A blatant exaggeration, misdirection and confabulation.Salby said no such thing.
To claim otherwise is again sad and wrong and indicative of a bent in knocking the man, not the paper.
> Salby states humans have emitted twice as much CO2 over the last decade compared to the previous decade, strictly not true as a 3% compounding over a decade is a 71% (approx) increase not a doubling.
That would
***
> Salby had said there was a 200% increase in fossil fuel emmisions.
Of CO2, of course.
Here’s Murry’s transcript, starting at 7:30 and ending around 8:46:
Again, cue to INTEGRITY ™.
> That would
… be an interesting interpretation of “strictly speaking” since Murry does not mention doubling.
Finally we are in the dark on how much CO2 man actually produces.
Let alone nature as AK points out above.
Many lines of evidence is not all lines of evidence.
Bookkeeping by the way is not and never will be one of them.
Sophisticated measures of oxygen and carbon isotopes?
There is a laugh and a half.
Sophisticated guesses is a better description.
It should be easy,
“Bookkeep” the amount of oil , coal and gas mined each year and turn it into Gct of carbon.
Add in a little extra for wood burning in the poor countries.
Guido as a member of the Global Carbon Project has this at his fingertips.
But he does not show it.
Judith could you ask him to put up Gct estimates for 1990-2000 and 2000 – 2010 and see if they have approximately doubled as Salby said , or whether they are actually only a 20% increase?
I doubt we will see them!!!
Finally we are in the dark on how much CO2 man actually produces.
Not according to Prof. Salby
“In truth only one component of the CO2 budget is known with any certainty, human emissions, implicitly through records of extraction – how much coal and oil are dug up”
So put the figures up,Dikran. You have them.
You agree with him on the closed budget.
Show us your 20%.
If you don’t, Salby is presumably correct in his near doubling over the previous decade.
angech the data source are all listed in my paper, you can download them from the Carbon Dioxide Information Analysis Center.
No figures,Dikran? From the man who should know and should be able to supply them.
I repeat.
You have them, obviously.
You refuse to put them up.
But hand wave to data sites.
I repeat.
Show the figures for the 2 recent decades, preferably Salby’s but I’ll take 1990-1999 compared to 2000- 2009.
It’s that simple.
Simply show us the 20% increase Giorgio claims.
In figures.
I will eat humble pie if you do, promise.
But you won’t.
What excuse will you use?
Mosher’s Do your own research?
Your own cannot be bothered.
Or look ,there is another meaningless graph?
Guido will not do it or JCH.
The 20 % claim is bogus until you do.
angech,
Many allegedly missing lines of evidence lead to invisible farting unicorns.
If we were Gods, we’d not need to do science.
Good grief. Browse to CDIAC data and click on the “Latest Published Global Estimates (1751-2013)” link.
(million metric tonnes of carbon)
1990-1999: 6,324
2000-2009: 7,786
23% increase.
Next.
What a surprise!
Yet more references to foolish Warmist invisible farting unicorns. No useable data, no science, just infantile attempts to deny, divert, and confuse –
“. . . Published Global Estimates (1751-2013)” link.”
More demands to look up irrelevant estimates masquerading as fact – foolish Warmist Scientism!
And all all delivered with a large dose of patronising condescension!
CO2 added to the air still heats nothing. CO2 removed from the air still cools not at all. Fumbling, bumbling, buffoons, or bumbling, fumbling, buffoons? You be the judge!
Cheers.
What can I say, Mike, I have a low tolerance for demands to be spoon fed something which took me all of five minutes to look up for myself.
I know you’re immune to evidence in the form of estimates, but here’s a fun fact. I regressed cumulative emissions from that table against CO2 since 1750 and obtained an R^2 of 0.96. Standard deviation of the residual is 5.5 ppmv. CO2 has gone up 120 ppmv since 1750, or 22 standard deviations of my (very simple) model error.
22 sigma! You’re right, it’s got to be coincidence. Must be. It simply cannot be true that the most obvious source of additional CO2 in the atmosphere since the Industrial Revolution has anything whatsoever to do with … the Industrial Revolution. Nope. I cannot, will not, accept the bleedin’ obvious.
Sigh.
Brandonthank you for directing me to the right link.
23% is very close to 20%.
I have to eat a large dose of humble pie.
Yuk.
Thanks to Dikran and Willard for pointing out the obvious
angech,
Having had to eat crow a number of times myself [1], I don’t envy you. Your forthright recognition prompts me to apologize for having been so harsh in my rebuttal.
—————
[1] I once confidently declared that the oceans transport more heat poleward than the atmosphere. Boy was I embarrassed upon being corrected. What made me feel better is the guy kept rubbing my nose in it even though I immediately copped to my mistake.
Do we have to stop all CO2 emissions completely to stabilise levels in the atmosphere? No – we just have to stabilise the rate of emissions. To see this lets assume that once a year a pulse of N0 = 5.5 Gtons of CO2 is added to the atmosphere due to fossil fuel emissions. This then decays away with a lifetime Tau. Then the accumulation of fossil CO2 in the atmosphere in year n is simply given by.
CO2( n) = N0( 1 +sum(i=1,n-1) (exp(-n/Tau)))
If we assume that n is very large then we can treat this sum as an infinite series and the atmosphere will eventually saturate at a certain value of anthropogenic CO2 concentration.
Multiplying both sides by exp(1/Tau) we can derive that the sum in the limit as n-> infinity is
CO2(n) = N0/(1-1/exp(1/Tau))
I know that the BERN model is more complex with ~3 different values for tau. However we know that about half of emissions are absorbed each year and this has remained constant. So for this argument lets assume some net value of tau.
Taking a range of values for Tau we can calculate the fraction of 280ppm (750 Gtons) at the limit of n -> infinity
Tau Fossil Limit (Gtons) Fraction of 750 Gtons
———————————————————————————-
5 ——- 30.3 ————– 4.0%
7 —— 41.3 ————– 5.5%
10 —— 57.8 ————– 7.75%
14 —— 74.3 ————– 10%
50 —— 272.3 ————– 36%
100 —— 547.2 ————– 73%
200 —— 1103 ————– 147%
Of course tau may well change with partial CO2 pressure. It may even decrease.
” However we know that about half of emissions are absorbed each year and this has remained constant. ”
I think this is probably because we are forcing the carbon cycle rather hard, which means we only see the dominant first order response. If you drive a first order linear system with an approximately exponential signal, then the response will be approximately exponential with the approximately same rate. I suspect that if you drive the Bern model with anthropiogenic emmissions it will give an output similar to the one-box model with the average decay rate, but if you then switch off the forcing, then the outputs would diverge. That would show that you can’t draw strong conclusions about the return to equilibrium from observations during exponential forcing.
If we try to stabilise emissions, then the effects of the slower mechansims start to make themselves more apparent. Simple one-box models are useful for qualitative illustrations, but not good enough for quantative predictions.
Clive,
I think you’re correct that stablising atmospheric CO2 does not require stopping all emissions; if we stopped all emissions atmospheric CO2 would decrease. As a rough estimate, the long-term enhancement is about 20-25% of out total emissions.
However, I think your calculation is only correct under the assumption that the fast carbon sinks are effectively infinite (I haven’t quite followed your calc, co maybe I’m wrong). Although it’s true that we could continue to emit at some low level and atmospheric CO2 would barely rise, I don’t think it is strictly true that it would actually stablise if the emissions exceeded the rate at which CO2 is sequestered into the slow carbon sinks. For atmospheric CO2 levels in the few hundred ppm range, I think this is a few tenths of a GtC/yr and so any level of emission above this would lead to an increase in atmospheric CO2 – although, you could probably set the level such that this was slow enough to be not noticeable on human timescales.
Why would we want to stabilize levels? We don’t want to go back to horses and covered wagons – that would create a lot of other environmental problems.
There is such a thing as nuclear power and electric vehicles.
“I know that the BERN model is more complex with ~3 different values for tau. However we know that about half of emissions are absorbed each year and this has remained constant. So for this argument lets assume some net value of tau.”
Yes, it has at least six parameters, including three values of tau and three sink sizes. As they say, with 5 free parameters, you can draw an elephant. Which is why there is significant potential for divergence between reality and a curve fit model like Bern; I believe this will become apparent in the next decade or two. Simplifying the Bern model to a single sink and single tau doesn’t necessarily allow more accurate predictions than the Bern model gives. Only a model based on an accurate physical representation of the system will constrain the model parameters enough to give a predictive model. A curve fit rarely has predictive power; accurate understanding of the physical processes involved does have predictive power.
This is all a bit like the pause..
Guido proves Salby wrong argument A.
Nick proves Salby wrong, argument B
Dikran marsupial proves Salby wrong, argument C
If I go back to the previous thread we can fed arguments D-L.
–
ATTP asks
“You still haven’t answered my question. Our emissions are larger than the increase in atmospheric CO2. If they aren’t the source, where has it gone?”
–
Arguments A-C swallowed the CO2 up.
In fact your question should be
“Can we increase our CO2 emissions enough to save the world?”
Because if D-L are correct CO2 is in for a big fall.
or as AK said
“Human emissions are very small potatoes compared to emissions from a very large number of different natural sources. There’s also a very large number of different natural sinks. Many are both.”
There are actually multiple reasons why Salby is wrong. This doesn’t suddenly suggest that he might not be.
True.
I am not arguing that he is right. Just that people who should know better are trying to prove him wrong with multiple reasons and using tricks to do so.
Giorgio and Dikran should know better and present simple truthful figures rather than artful dodges.
When they fudge the figures (20% is plainly not right)
Fudge the boundaries of the argument suddenly you wonder if Salby might be right (he isn’t) .
My argument on multiple reasons still stands.
You cannot have all the different reasons right or you would actually be arguing that CO2 should be going down rapidly.
Interestingly the more arguments you put up the more chance you have of being right with one of them*, ie that Salby may be wrong, but the more foolish one looks from using all the wrong arguments along the way.
* three doors problem.
Where are D-L in the previous thread?
All I could find is the D-K effect.
As expected.
An increase in fossil Fuel emissions in reality being a 20% means claims that such emissions are about 200% are about 1,000% wrong, right?
* Henry’s Law is real but describes saturation, not uptake. Henry’s law doesn’t describe very much at all about actual spatial CO2 uptake:
http://d32ogoqmya1dw8.cloudfront.net/images/eslabs/carbon/ocean_co2_flux_credit_1400184673_744.jpg
* Expression of uptake as a function of emissions makes no sense to me, can anyone make a rational case for expressing it such terms?
CO2 is rapidly mixed within the atmosphere. Oceans, plants, or phytoplankton probably don’t take up a given molecule of CO2 based on whether it was emitted this year or has been bouncing around since the dinosaurs. It’s more reasonable that global uptake is a function of global atmospheric concentration of CO2:
http://climatewatcher.webs.com/Uptake.png
* It’s not part of the conversation, and the IEA doesn’t think it’s happening, but I believe we’ve already passed peak emissions rates:
http://cdn.static-economist.com/sites/default/files/imagecache/original-size/images/2015/12/blogs/graphic-detail/20151212_woc737_0.png
Given the variability, It will take another decade or so for the trends to resolve, but I expect accumulation rates will slow soon. If you’ve got another decade to live, stick around and check it out.
TE,
“* Expression of uptake as a function of emissions makes no sense to me, can anyone make a rational case for expressing it such terms?”
Yes, the rate of uptake depends on current atmospheric concentration, past atmospheric concentration, and the processes by which CO2 is removed from the atmosphere. It is the need to consider the past trend in atmospheric CO2 that makes people connect emissions to uptake. You can’t ‘validate’ your model of CO2 uptake if you can’t connect the historical trend in CO2 to emissions in the past.
BTW, the ocean uptake graphic (from Takahashi et al I think) is very interesting. The regions of net outgassing are were upwelling cold deep water is warming (releasing CO2 absorbed from the air the last time it was in contact with the atmosphere, on the order of 1000 yrs ago). While regions of net uptake are were there is cold surface water and relatively deep to very deep convective overturning. The regions of high uptake include not only some high latitude areas were cold bottom water is formed, but also mid latitudes with relatively deep wintertime convection, but where there is often a summertime surface stratification due to seasonal warming. These regions have strong net CO2 uptake in spite of temporary summertime stratification. Where there is a stable well mixed layer and little local upwelling (mostly in the subtropics and tropics) there is little net uptake or release of CO2.
Soil respiration to the atmosphere: annually 59 GTC isotopically fractionated to -21 PDB.
Human (including land use) to the atmosphere: annually 9 GTC fractionated to -24 PDB.
For context, the ocean mixed layer is 2 PDB, and the overall atmosphere -8.
It is currently impossible to distinguish human from soil atmospheric inputs.
When the soil and atmosphere both warm (for any reason), soil respiration will increase and atmospheric pCO2 will decrease, leading to increased transfer.
Seemingly, soil and atmospheric warming will have only a small net effect on human input (increased low latitude air conditioning offset by reduced high latitude heating).
We grossly exaggerate human status as a force of nature, and our understanding.
gymnosperm
Agreed that we overstate the role of the human. Researchers should spend more time in the wilderness to get a better grasp of human scale.
Agree generally your other comments. Much of the discussion here, so far, arises from attempts to apply static rules to dynamic systems, or a mix of both. Dynamic systems have features like growth and decay rates and time constants whose form of equation need not be assumed to be classic like in radioactive decay. Our lack of knowledge of the taus in the Bern models and generally, everyone’s lack of knowledge of dynamic constants like time constants, causes a great deal of confusion, special pleading, cherry picking of time intervals, tailoring of selected data to fit the argument and so on.
It would be nice if we had a model that all players agreed represented the dynamics of CO2 flow between atmosphere, and (land + sea + ice).
Three values of tau is incomplete unless we can verify the physical mechanisms that lead to each value.
Until we have a dynamic model we will have page after page of people arguing about interpretation uncertainties, as here, which is usually fruitless.
Yeah, usually fruitless, but what else is there? We are grinding against a machine of human frailty. A machine that generated witch crazes and the execution and excommunication of many of our greatest minds.
Ultimately, the best we can do is keep pointing out the uncertainty.
Much of the discussion here, so far, arises from attempts to apply static rules to dynamic systems, or a mix of both.
+1e100!
“A machine that generated witch crazes and the execution and excommunication of many of our greatest minds.”
Yes, Matthew Hopkins would feel right at home, finding deniers instead of witches.
Jim D said (above): The most direct way to talk about the subject at hand is a plot that shows the total CO2 in the atmosphere over time along with the total emissions over the same centuries. If you have another version of this plot, let’s see it. I think it makes “skeptics” angry because it shows very simply that both the emissions and CO2 level are growing similarly and consistently with each other. The data at hand proves them wrong when they doubt that these two things could be connected, and it forces them into deny-the-data mode. It is a regular pattern.”
I agree with Jim. When I saw the original post I updated my data on ML CO2 ppm from Scripps http://scrippsco2.ucsd.edu/data/atmospheric_co2
and found a data set (new to me) from Oak Ridge National Laboratory (ORNL) on Global / regional / country manmade carbon emissions: fossil fuel burning, cement, and flaring http://cdiac.ornl.gov/CO2_Emission/timeseries/global
1. ORNL carbon emissions are here https://imagizer.imageshack.us/v2/645x492q90/r/922/AmIzu4.jpg
2. Scripps ML CO2 concentration ppm here
https://imagizer.imageshack.us/v2/645x492q90/r/924/wWsot5.jpg
3. Overlay of the two shown here (the actual charts are overlayed and not plotted on the same chart since Scripps ML is monthly and ORNL emissions is annual.
https://imagizer.imageshack.us/v2/646x492q90/r/924/Zwsg1V.jpg
My comments:
First, I strongly question Salby’s conclusion that there has been no increase in atmospheric CO2 during the period 1990 to present. That is clearly not the case from looking at the data/charts.
Second, the rate of increase in ML CO2 is slowly increasing over time from 1958 to present shown here from plotting the differences and fitting a linear equation https://imagizer.imageshack.us/v2/583x471q90/r/923/lpNT6Q.jpg
Third, the size of the peaks – valleys has also been increasing over time … I do not know what to say about that… but seems consistent with the overall average increase noted. As shown here https://imagizer.imageshack.us/v2/583x449q90/r/924/lA8lKs.jpg
And finally I am unclear why Salby looked only at 1990 to present. Clearly we can see the same departure in the trends on emissions vs. CO2 ppm occurred during the 1960-70s as seen in the overlay plot.
DW, nice little analysis. Another way to show that Salby is just wrong.
ristvan,
It is so easy to change axes to pattern match two almost monotonic almost straight line plots and derive a high correlation. The more the noise is smoothed, the higher the correlation coefficient, commonly.
But maybe the argument is about the noise part?
Much climate work deals with variables that are close to the limit of detection of their concentration or effect or measurement. Small excursions within large numbers, particularly when two are subtracted, such as in derivation of TOA radiation imbalance, rest almost entirely on the real noise and bias in the measurements, which is dangerous ground when you are near the detection limits i.e. when the variable you regard as significant for the argument is about equal to the noise in its derivation.
I have never been comfortable working with S:N = 1 or less.
Geoff Sherrington | August 12, 2016 at 9:21 pm |
“It is so easy to change axes to pattern match two almost monotonic almost straight line plots and derive a high correlation.”
YES! Do a low order polynomial curve fit of the one against the other, and you’re sure to get something vaguely similar.
But, if you match the rate of change, and match it this well
http://woodfortrees.org/graph/esrl-co2/derivative/mean:24/plot/hadcrut4sh/scale:0.22/offset:0.1/from:1958
well, then you’ve got something.
“the size of the peaks – valleys has also been increasing over time … I do not know what to say about that… ”
The size of the seasonal cycle has increased mostly because
1) plant growth rate globally has increased as a result of higher atmospheric CO2. Since land area is dominated by the northern hemisphere, the rate of plant CO2 uptake is highest in the northern summer, which is when atmospheric CO2 level is falling.
2) There is cyclical pattern of fossil fuel use, with the greatest emissions in the northern winter. Greater total emissions, greater cyclical variation.
The convolution of these two effects likely makes it impossible to use the increase in cycle depth to estimate the increase in plant growth rate. Maybe the seasonal trend in atmospheric oxygen, combined with the seasonal CO2 trend would allow an estimate of the increase in global plant growth rate in the northern hemisphere.
Danley Wolfe | August 12, 2016 at 12:47 pm |
“I think it makes “skeptics” angry because it shows very simply that both the emissions and CO2 level are growing similarly and consistently with each other.”
Not very similarly or consistently really, definitely not at all at the incremental level. Integrated temperature is growing more similiarly and more consistently.
These are better matches, because not only is there a match of the low order polynomial (and hence, low order information) behavior of total CO2, but the details of the rate of change are matched as well.
http://woodfortrees.org/graph/esrl-co2/mean:24/plot/hadcrut4sh/scale:0.22/offset:0.1/from:1958/integral/offset:314
http://woodfortrees.org/graph/esrl-co2/derivative/mean:24/plot/hadcrut4sh/scale:0.22/offset:0.1/from:1958
This kind of dynamic arises naturally from the continuous transport of CO2 through the oceans. Anthropogenic contributions are negligible compared to the natural flows.
Is CO2 a pollutant. The more apt description should be ‘when does CO2 become a pollutant’? Here is a bell curve but it doesn’t show the numbers. I believe it would be 600ppm where CO2 does become a pollutant.
https://upload.wikimedia.org/wikipedia/commons/d/da/Bell_curve_of_intake_versus_health_effect.svg
How will the apsidal precession effect temperature:
https://www.cabrillo.edu/~rnolthenius/climate/Denialists/D-Ruddiman/milak&temp.jpg
Now there is something terribly wrong with this chart as far as the downward curve of the apsidal precession we are only up to about January 8 of a year of precession with June being the bottom. This is according to Kern who calculated it as 68 years for a day.
It started at December 21 and bottoms at June 21.
I guess I am wrong! The apsidal precession lasts 23 to 24 thousand years and we are at 21,000. So that this is how it looks. I’m going to have to reread Kern:
theconvenientskeptic.com/wp-content/uploads/2010/11/Li-Holocene.png
This is hard to follow, but I see the mention of forestation/vegetation (which is the only thing I know anything about).
Did anyone factor in the warming and drying of the northern hemisphere due to orbital control?
How about changes in vegetation due to invasive species?
How about changes in fire regimes?
How about the increase in woody biomass of North America?
Fire suppression, which started 200 years ago in NA?
When I look at the climate history for latitudes relevant to humans, not polar regions, I see that it appears that actual measured and quantified changes in climate is not closely or otherwise related to changes in atmospheric co2.
Can’t we just agree to throw virgins in volcanoes? It worked so well for the Mayans, who also believed they could control the climate….http://ambergriscaye.com/museum/digit14.html
Global warming alarmism correlates with a pause in global warming but not CO2 avoidance. The only link so far that can be directly linked to increases in the atmospheric CO2 levels is happier trees and more plant growth in general due to dramatic increases in their water use efficiency.
Guido van der Werf, thank you for your post.
Guido van der Werf (@GuidovanderWerf) | August 12, 2016 at 4:24 am |
Guido, thanks for the post, and especially for the link to the data. Professor Salby reminds me of Old Bill, an utterly charming conman I once knew. A friend explained Bill’s problem thusly:
In any case, what Prof. Salby is overlooking is that the evolution of the atmospheric CO2 level is the result of an exponential decay in the CO2 levels being constantly offset by human emissions from fossil and landuse changes. As a result of annual variations in the CO2 sinks, any simplistic annual comparison doesn’t look good … but when you do the math correctly, including the exponential decay, the relationship is obvious.
For example, there’s an Excel workbook available at your first reference which gives emissions from both fossil fuel and land-use changes as well as airborne CO2 changes, all in gigatonnes.
If we use just the fossil-fuel changes to emulate the airborne CO2 changes, we get a lousy R^2, 0.4645. And adding land-use changes doesn’t help, it only increases the R^2 to 0.4649.
But if we do the complete analysis where we include the exponential decay, we get a much better correlation. And of course, the method including exponential decay is the method used by the scientists studying the subject.
Now, there are several consequences of a situation where we are constantly adding new emissions to a pile of CO2 in the atmosphere that is exponentially decaying away.
1. IF the emissions rise at less than a certain rate per year, the additions to the atmospheric CO2 will become smaller and smaller over time. In this example we have increasing emission changes … and decreasing CO2 changes.
2.IF the emissions become constant, the CO2 levels will continue to rise initially. However, eventually the amount added annually will equal the amount sequestered annually, and the atmospheric CO2 level will no longer rise. Constant emissions … and CO2 changes slowly going to zero.
3. IF the emissions rise slowly but exponentially at a given rate, the change in atmospheric CO2 will level off and be constant over time. In this case we have increasing emissions changes … and constant CO2 changes.
In other words, the rate of emissions change and the rate of atmospheric CO2 change are not linearly related. And the form of the final curve over time depends on the variations in the ongoing balance between how much is being added annually and how much has already been added.
Finally, I would note that since 1959 the amount of excess CO2 absorbed by the earth has risen from around 2 Gtonnes/yr to about 6 Gt/yr. In other words, the land and ocean are annually currently absorbing the total amount emitted annually from human actions during the 1970s ,,,
So I would say that Salby is wrong, but for a curious reason—he is using the wrong underlying model for the relationship between changes in emission levels and changes in the resulting atmospheric levels. There is no reason to expect that they will be simply related as he seems to assume.
Finally, I must thank you for sitting through the video. I am unable to justify spending that much time waiting for something to happen. While I can scan a scientific report and read the abstract and get good info in five minutes, a one-hour lecture is nothing but uncited, unreferenced boredom for me. I don’t ask that a man publish his ideas in the refereed journals, but I do ask that he write his ideas down so that they can be examined critically by the public.
Regards, nice post,
w..
Willis, curious why you invoke an exponential scheme. Is it because this is often nature’s second choice after linear, or do you have some mechanistic insight?
Geoff Sherrington | August 12, 2016 at 9:28 pm
“Exponential decay” is a very common natural phenomenon. It occurs wherever sinks are proportional to the amplitude of a disturbance from some pre-existing steady-state. It is the mathematical expression of any decay where the rate of decay is proportional to the current value. Mathematically, this is dependence of decay rate on current value expressed as
dN/dt = – lambda N
where “N” is the quantity and “t” is time.
Taking the integral gives us the familiar form for exponential decay,
N(t) = N(0) e(-t/tau)
where “tau” is the time constant of the decay (similar to the “half-life”) and N(0) is the value of N at time 0.
The derivation is given here.
All the best,
w.
Willis Eschenbach,
Thank you. That is interesting and makes sense to me, not that I am overly concerned about CO2 emissions. My primary concern is the damage function and the lack of valid justification for high-cost, no-benefit, economically damaging mitigation policies.
Willis Eschenbach, about point 2: if the disappearance from the atmosphere is first-order with a constant rate parameter (implying exponential decay if there is no input), then a constant input will eventually result in a constant concentration (as you wrote), but not a gradual decline to 0 (as you added after.)
Other than that, good post. Thank you.
To me, Salby is a distraction, but as long as he keeps giving these talks, I suppose the rest of us have to chime in from time to time to show his weaknesses.
mosomoso,
I think it is good that Judith posted this. I learn a lot by reading the good posts – like Willis’s – that show up the flaws in the analysis,
matthewrmarler | August 12, 2016 at 10:45 pm
Thanks, Matt. What I said was that the CHANGES in CO2 concentration would decay to 0 (constant concentration), not that the concentration decays to 0.
Sorry for the confusion.
w.
This is not, as I understand it, correct.
If you looks at this Archer et al. (2009) paper and consider Figures 1 and 2, the current understanding is that it will decay exponentially towards a long-term equilibrium in which an amount equivalent to ~20-40% (depending on our total emissions) remain in the atmosphere. This enhancement will decay very slowly over thousands of years. In other words, even though the exponential decay constant is maybe a few hundred years, it doesn’t decay back to 0 enhancement, and we would expect atmospheric CO2 to remain enhanced for millenia.
Willis Eschenbach: and CO2 changes slowly going to zero.
Ah. I misread it as “CO2 changes slowly, going to zero”. Sorry for the misunderstanding.
“In any case, what Prof. Salby is overlooking is that the evolution of the atmospheric CO2 level is the result of an exponential decay in the CO2 levels being constantly offset by human emissions from fossil and landuse changes.”
No, that is not it. If it were, then we would be very lucky indeed to have prevented a decay to zero.
Or, would you claim that natural emissions keep it from going below a floor? Well, that doesn’t work, either, because in such a system, human emissions could not produce a proportional rise greater than its proportion of input, which is what, 3% maybe?
What is happening is that there is an entire train of CO2 leading from the oceans to the atmosphere, back into the oceans, down to the ocean depths, and back up again. Anthropogenic emissions join this train, to the tune of a squirrel hitching a ride on the Orange Blossom Special.
I agree its a nice post Guido. I do wonder at all the attention given to Salby every time he gives a presentation. It’s not like its a peer reviewed paper that might have some credibility. Perhaps everyone can all just reference this post the next time the temptation to spend time and effort on this arises again and move on to the really important and difficult problems in climate science. Given the large uncertainties, there is plenty of work to do.
David Young,
And that is why I wish Judith had not given visibility to Salby’s video. It is stupid to spend time refuting the same obvious errors and misunderstandings, over and over again. Salby has not a clue what he is talking about, and teeing up Salby’s rants to be so easily knocked down discredits, via the broad brush of the political left, the many legitimate technical arguments against catastrophic alarm which can be (and should be!) raised.
Nic Lewis contributes to human understanding. Salby just enables people who want only to say “see, the skeptics are crazy”. Note to Salby: Please stop helping so much, and please find something else to occupy your feeble and fevered mind.
stevefitzpatrick | August 12, 2016 at 9:56 pm
Thanks, Steve. While I agree about the quality of Salby’s work, it is precisely because Judith and other sites DO give visibility to Salby that we know about the problems with his claims. Sunlight is always the best disinfectant …
w.
“Thanks, Steve. While I agree about the quality of Salby’s work, it is precisely because Judith and other sites DO give visibility to Salby that we know about the problems with his claims. Sunlight is always the best disinfectant …”
I think the actual evidence is that sunlight can also allow weeds to grow and prosper..
Personally I think all the nut job posters and comments should be quarranteened over at tallblokes and goddards
Steven Mosher: “Personally I think all the nut job posters and comments should be quarranteened[sic] over at tallblokes and goddards”
Whereas you should be quarantined over at Miriam O’Brien’s.
She seems partial to the odd Hot Whopper.
Interesting to me how this one guy with what is considered by most to be a fringe POV, causes the alarmists to go to DEFCON 4.
I sense insecurity.
I am the opposite of an alarmist. Salby is utterly wrong, and I think more than a little crazy. I go DEFCON 4 over stupidity, whether that is Stefan Rahmstorf ranting about 2 meter sea level rises in 80 years or Salby ranting about ocean ‘outgassing’ to explain atmospheric increases in CO2. Utter crap is utter crap, independent of who suggests it.
Yes, I notice our friendly reader of astronomy spends a lot of time on this and also any other people who call themselves skeptics but are clearly wrong.
David,
Make that professor of astronomy. ;-)
But yes, easier to address the obviously wrong rubbish than the credible arguments. The credible arguments are basically ignored (note upthread the running marsupial’s, AKA Gavin C, refusal to engage on the clear technical weaknesses of the Bern CO2 model). Why not? Well, mostly because it is easier to beat up on insane rants from the likes of Salby than address the real issues.
Expert assessment of sea-level rise by AD 2100 and AD 2300
http://3.bp.blogspot.com/-attSJe9GdVw/VBZh6VTj_jI/AAAAAAAAGYY/lhTAxkzmXiY/s1600/Fig490experts.png
Yes Steve, I noticed the evasion on the Bern model by our furry friend. I am actually unable to determine exactly what the current title of our astronomer friend really is as there is contradictory information on his web pages. I would be exceptional to progress from reader to full professor in a single year, but I suppose not impossible.
You should stick to astronomy, Steve. You are utterly clueless, yet absolutely convinced of your righteousness.
JCH,
As someone said, science is the belief in the ignorance of experts. The paper
you cite is an opinion survey of people who don’t know how to project sea level rise, even when emissions are specified. An opinion survey, no justification needed for whatever crazy rise they want to specify. In fairness, when sensitivity is constained to no better than a range of three-fold, of course you cant project
future rates of rise with any confidence. First thing needed is a narrower range of climate sensitivity.
Bartemis,
I’m not an astronomer. Neither am I ‘righteous’. I am averse to rubbish being passed off as science.
As someone said, science is the belief in the ignorance of experts…
I’ve noticed that the man who said this was smart, but that the people who keep repeating it act like they’re arrogant experts.
Climate change already accelerating sea level rise, study finds
Greenhouse gases are already having an accelerating effect on sea level rise, but the impact has so far been masked by the cataclysmic 1991 eruption of Mount Pinatubo in the Philippines …
Drip:
http://www.aviso.altimetry.fr/fileadmin/images/data/Products/indic/msl/MSL_Serie_MERGED_Global_IB_RWT_GIA_Adjust.png
Drip:
http://www.aviso.altimetry.fr/fileadmin/images/data/Products/indic/msl/MSL_Serie_J2_Global_IB_RWT_GIA_Adjust.png
Drip:
http://www.aviso.altimetry.fr/fileadmin/images/data/Products/indic/msl/MSL_Serie_AL_Global_IB_RWT_GIA_Adjust.png
stevefitzpatrick wrote “The credible arguments are basically ignored (note upthread the running marsupial’s, AKA Gavin C, refusal to engage on the clear technical weaknesses of the Bern CO2 model). Why not? Well, mostly because it is easier to beat up on insane rants from the likes of Salby than address the real issues.”
This is dissapointing stuff. I don’t have any particular views on the Bern model, which is why I didn’t comment very much, except to point out that you can’t really tell whether a single box model is better than the Bern model by looking at conditions where they are being strongly driven. I also pointed out that someone (Hansen) may have ideas about what might happen after a sudden increase in anthropogenic emissions without reference to the Bern model.
It appears to be you that want to discuss the Bern model, but if you want me to discuss them as well, then don’t just expect me to pick up on your issues with it if they are tangential to the issue that I want to talk about. I think it is worthwhile trying to stop people being mislead by scientific arguments that are so bad that they do *both* sides of the argument harm. I think it is better to have interesting discussions of technical limitations of mainstream science issues separately.
Either way, we could do without this sort of sniping. I think I’ll give your comments a miss in the future.
I should also point out that I tend not to criticise things where I have acquired the relevant expertise, I have a reasonable grasp of the basic science, I am not an expert on the kind of carbon cycle models that are used by carbon cycle researchers. This is a good way of avoiding Dunning Kruger. *If* you explained the issues in detail *and* gave me the time required to research them *then* I might comment in a substantive manner. Expecting me to immediately share your views (or contest them) is unreasonable.
Is the airborne fraction of anthropogenic CO2 emissions increasing? – Knorr09
Several recent studies have highlighted the possibility that the oceans and terrestrial ecosystems have started loosing part of their ability to sequester a large proportion of the anthropogenic CO2 emissions. … It is shown that with those uncertainties, the trend in the airborne fraction since 1850 has been 0.7 ± 1.4% per decade, i.e. close to and not significantly different from zero. …
One of the papers Knorr references:
Contributions to accelerating atmospheric CO2
growth from economic activity, carbon intensity, and efficiency of natural sinks
…Recent growth of the world economy combined with an increase in its carbon intensity have led to rapid growth in fossil fuel CO2 emissions since 2000: comparing the 1990s with 2000 –2006, the emissions growth rate increased from 1.3% to 3.3% y-1. The third process is indicated by increasing evidence (P-0.89) for a long-term (50-year) increase in the
airborne fraction (AF) of CO2 emissions, implying a decline in the efficiency of CO2 sinks on land and oceans in absorbing anthropogenic emissions. …
stevefitzpatrick | August 13, 2016 at 7:59 am |
“I’m not an astronomer.”
Then, you are just clueless. You have nothing to offer of any scientific value. You just assert based on what you feel.
dikranmarsupial | August 13, 2016 at 10:34 am |
“I should also point out that I tend not to criticise things where I have acquired the relevant expertise…”
Ha! You have no comprehension of feedback dynamics whatsoever, yet you jump into that fray with nary a thought.
Gavin C., It is good to acquire relevant expertise before offering an opinion. Such as on GCM ensembles, falsification of models with high internal variability and sub grid models in fluid dynamics (and GCM’s) and the fact that they are simply not really based on the “laws of physics” in a meaningful way and are obviously tuned to match some subset of the data available.
It would also be helpful if people could retract all their defenses of models in light of the recent paper on tuning those models that appear to confirm that Judith Curry was right all along about the uncertainties. I have noted some swipes at Judith at ATTP’s thread on model tuning though. I hope you will correct that too since you are a paragon of fairness and rectitude.
JCH,
Remove the influence of ENSO, and the ‘acceleration’ in sea level just about disappears. In any case, plotting a couple of years of data and claiming it shows a change in long term trend is silly. Perhaps you would be interested in a bet on the rate of sea level rise over the next decade. I’ll bet US$1,000 that the next decade will have OLS best estimate under 4.6 mm/year. If it is under 4.6 mm/yr then you pay me US$1,000. If it’s over 4.6 mm/yr, I pay you. Since you seem to think it is already at 4.6 mm/yr…. and accelerating…. this bet should be easy for you to accept.
t would also be helpful if people could retract all their defenses of models in light of the recent paper on tuning those models that appear to confirm that Judith Curry was right all along about the uncertainties …
This is just complete nonsense.
Bartemis,
Sorry you think I have nothing of scientific merit to offer. For what it is worth, I share that opinion of you.
Fortunately for me, lots of other people do not share your view, and I have made a reasonable living doing science and engineering for 40+ years.
I don’t think the current rate is 4.5mm; Jason II thinks that. Bet him, or his brother, Jason III.
Dikran,
“I think I’ll give your comments a miss in the future.”
Suit yourself.
JCH,
Bet Jason?
Exactly the kind of reply to expect from someone who doesn’t really believe their own claims. Not surprised.
A Deus.
UCAR makes a claim. AVISO provides data, analysis, and graphs. You just provide the prick.
Steve Fitzpatrick, you mentioned a post you wrote over at wuwt. How might i find it? Thanx…
Willard, You are an irrelevancy and a true hypocrite. Russell has nothing to do with anything discussed here except your spurious claim that you admire Russell despite apparently not having read his later History of Western Philosophy. Have you actually read this work (aside from the index)?
I don’t need to denounce everything that is wrong here at Judith’s even though the comment you point to is indeed wrong. However, I would expect Cawley to at least address his past important errors and seeing as he is Rice’s right hand man, after you of course, have an equal standard here and there. But “and then there’s hypocrisy.”
But I forgot,
https://ipccreport.wordpress.com/2014/08/16/and-then-theres-hypocrisy/
http://www.populartechnology.net/2015/01/who-is-and-then-theres-physics.html
And then theres this bit too:
http://rankexploits.com/musings/2016/brexit-felicitations/#comment-149449
Regarding Willard’s dubious contributions to pseudo-science:
https://climateaudit.org/2016/08/03/gergis-and-law-dome/#comment-770299
https://climateaudit.org/2016/08/03/gergis-and-law-dome/#comment-770299
afonzarelli,
https://wattsupwiththat.com/2009/05/22/a-look-at-human-co2-emissions-vs-ocean-absorption/
Please note that I combined the ocean and plant uptakes into a single “ocean absorption” rate. My point was not to generate a very accurate model, it was to show that the evolution of atmospheric CO2 is perfectly consistent with emissions and partial uptake by natural sinks at a rate which increases with atmospheric CO2 concentration.
Willard, Aside from pettifogging, you offer nothing but pseudo-science and attempts to insinuate that my credibility is suspect. Have you no respect for science, logic, or truth?
You are really an ignorant coward, Willard, as anyone can see who checks the links above. I perhaps should take up the issue of your Canadian academic philosopher employment as it is apparently known to many at Climate Audit who have already reached the conclusion I have.
There are those who can talk about science and who have publications in the area. Then there is Willard who can only talk about non-scientific irrelevancies and try to discredit without having even a shred or evidence. “And Then There’s Hypocrisy.” And then there’s dishonesty.
Willard, you will find that life is much more interesting when you form your own opinions, place your bets. You might think about how much time you have spent auditing others about what they wrote or what they thought or think… life is not about remembering what others have written it is all about what you think & do. Trump, win or lose? What do you think?
Thank you, Steve, i’ve got it bookmarked; i look forward to reading it…
Possible Henry’s Law complication.
Confusion between static and dynamic reservoirs.
Henry was calculated using constraints of the vessel holding the source of CO2.
In ocean settings mixing can happen to make a large dynamic vessel possible in concept.
First case, cool the vessel, CO2 is lost, equilibrium comes quickly in the vessel. Derive a Henry Law constant.
Second case, cool the ocean (or the relevant layer) and gas is lost but can can be replenished from an adjacent layer. Depending on factors like mixing rates and T change rates, Henry need not apply in simple form.
BTW, many trained in analytical chemistry will not accept that ocean pH can be measured to the accuracy assumed by those attaching consequences to it. Besides, the chemistry of matters like buffering, stability diagrams, precipitation of carbonates, biological effects, use of Debye-Huckel equations is likewise more complicated than seems understood by advocates of interpretation.
But that lack of depth in climate science seems not to matter to those calling for policy change based on simple catch phrases like ‘ocean acidification.”
I do not know if the oceans are becoming less alkaline and I doubt if anyone else does.
Geoff (Chemist)
Geoff Sherrington,
/humour on
Climatological measurements supersede those of any other branch of science, both in accuracy and precision.
They can measure global mean sea level to an accuracy of 0.01 mm, or a small fraction of the thickness of a human hair. Any attempt to question this nonsense is met with the usual response that “all measurements are estimates, so go away.”
I would expect that climatologists would have no problem with establishing a global ph level to 0.0001 – using the usual toy computer games as a reference. Accompanied by a few climatological redefinitions of standard chemical and physical terms, evil dirty black coal would once again to be shown as the root of all evil, and the source of all human problems.
Cheers.
/humour off
Guido van der Werf (@GuidovanderWerf) | August 12, 2016 at 4:16 am | says:
“SST and CO2 growth co-vary because they are both driven by ENSO on annual timescales…”
No way can SST and CO2 co-vary on annual time-scales. Annual forcing applies only to SST. ENSO has a period of approximately five years that is traceable from present day observations to CET. The physical oscillation involved is that of ocean water from side to side in the Central Pacific. It started when the Panamanian Seaway closed and thereby established the present Pacific current system.
This article tries to reframe the question, so the answer given is meaningless
Marty Gwynne: Salby is correct when he says changes in atmospheric CO2 growth are not driven by human emissions.
No he is not. As has been shown by numerous writers, his argument has serious flaws. At best he provides a reason to look at much evidence all together, and when considered all together the most reasonable explanation for atmospheric CO2 growth is the increase in human emissions.
IEA Emissions per year vs IPCC projections. Emissions grew by 3gt 1990 – 2000 and 6gt 2000 to 2010. That’s a doubling in emissions growth, with no corresponding increase in atmospheric CO2 growth, and atmospheric CO2 growth is relative to net surface emissions, so, really, how much CO2 in the atmosphere is natural and how much man made? Human emissions are NOT actually measured, but guessed.
Salby is correct when he says changes in atmospheric CO2 growth are not driven by human emissions.
The warming since the LIA is alrgely responsible in three warming spurts of remarkably similar rates. 3 x 30 year positive phase warming events and the culmination of this warming in the oceans surely drives most CO2 growth.
https://upload.wikimedia.org/wikipedia/commons/thumb/2/2d/Global_Warming_Observed_CO2_Emissions_from_fossil_fuel_burning_vs_IPCC_scenarios.svg/2000px-Global_Warming_Observed_CO2_Emissions_from_fossil_fuel_burning_vs_IPCC_scenarios.svg.png
There’s a contradiction there. You assert what humans emissions did and then make a claim based on those emissions, and you also say that the emissions are just guessed. Which is it?
You can’t both claim that we don’t know something, and also that we do, and use try to use both to argue your point. Pick one.
In any case, the original post shows that atmospheric CO2 growth has indeed increased. (Figure 4)
so yes the author of this article has tried to reframe the debate to one of “tripled emissions since 1990. That’s not what is being discussed.
Climate Ect needs to “peer review” stuff like this to at least make sure it is on point :p
David Young,
If there is anyone worty of completely ignoring, it is Willard. Why try to discuss technical subjects with someone who knows nothing about those subjects? Lucia, with the patience of a saint, put it off for quite a while, but ultimately either banned him outright or put him on moderation (can’t remember which it was) due to his endless, meaningless rants. I’d suggest you don’t waste your time.
SteveF, Thanks for the advice. You are right!! The only reason I’ve bothered is that lately he has been using intimidation tactics to get me to censor what I say. I view it as a moral imperative to not buckle to these tactics.
I agree with Steve, its best to totally ignore Willard and the other disrupters, and don’t let them influence what you want to say in the slightest. Unfortunately, I also get sucked into defending something against some of the disrupters – e.g. David Appell, Jim D, opulso recently. I should know not to by now; it completely disrupts any chance of having a rational, constructive discussion.
I view it as a moral imperative to not discuss with ANYONE i find repugnant…
Consider an arbitrary time period from t0 to t. Mass conservation states that the mass of CO2 accumulated in the atmosphere over this period is equal to the mass input to the atmosphere minus the mass output from the atmosphere (from all sources and sinks):-
Ma(t) – Ma(t0) = (Mi(t) – Mi(t0)) – (Mo(t) – Mo(t0) Eq 1
This is completely uncontroversial outside lunatic asylums.
If we differentiate Eq 1, we obtain another completely valid equation:-
Ma'(t) = Mi'(t) – Mo'(t) Eq 2
If we differentiate Eq 2, we obtain another completely valid equation:-
Ma”(t) = Mi”(t) – Mo”(t) Eq 3
A model which satisfies Eq 1 offers a low (zero) order solution. A model which satisfies Eq 1 and Eq 2 matches the rate of change of mass addition and subtraction as well as the total mass accumulation over the period. In other words it matches time trends or gradients. A model which also satisfies Equation 3 matches not just time trends but the rate of change of those trends – the changes of slope over time. Any model for atmospheric CO2 which is valid to second order has to satisfy all three equations.
Salby’s argument is based on the fact that Eq 3 “doesn’t work” for a model founded on the assumption that the mass accumulation is explained by anthropogenic addition, but does work for a model founded on the assumption of temperature dependence. Guido’s response is to ignore Eq 3 and go to Eq 2 in order to argue that the model “does work” for Eq 2.
This does NOT constitute an effective rebuttal to Salby’s main point. This then raises the obvious question:- does an effective rebuttal exist? The answer is that it does – Salby’s argument contains a serious weakness – but this article does not in any way highlight where that weakness is.
The second derivative is dominated by the seasonal cycle and station values don’t represent global values, so it is not useful for global budgets. What is useful is the integral of the mass balance, not the derivatives. This has been shown on this set of comments. The way the integral increases over time shows that the anthropogenic source is the driver of the trend with natural sinks as a proportionate response.
The trouble is that Salby’s theory violates equation 1, which you yourself describe as “completely uncontroversial outside lunatic asylums.”
Just because equation 2 is derived from equation 1 (by differentiation) doesn’t mean that every solution to equation 2 automatically satisfies equation 1, which is why we need a constant of integration when going back from equation 2 to equation 1.
“Salby’s argument is based on the fact that Eq 3 “doesn’t work” for a model founded on the assumption that the mass accumulation is explained by anthropogenic addition,”
It does work though for a system where the reason for the long term rise is anthropogenic emissions, but where the growth rate is modulated by ENSO, which we have known since the work of Bacastow in the 1970s. Note that Prof. Salby seems completely unaware of this work.
“but does work for a model founded on the assumption of temperature dependence.””
The trouble is, that model violates Eq 1.
“The trouble is that Salby’s theory violates equation 1.”
The validity of your statement is heavily dependent on your definition of “Salby’s theory”. Can you please state your definition of his theory? If you take the narrowest view – that it consists of one (of several possible) specified functional form relating CO2 concentration to temperature dependence, then I probably agree with your statement. A best fit of his simplified temperature model to Eq 3 (second order data) probably leaves a shortfall in long-term CO2 growth. However, if you take a broader definition i.e. that the growth in CO2 is more driven by temperature dependence than anthropogenic addition, then your statement is not valid. I can certainly find a variety of functional forms for the temperatue dependence which will satisfy Eq 1 and Eq 3 observations simultaneously. The argument then comes down more generally to how physically realistic such model descriptions are and more specifically to how physically realistic are the time and temperature dependence of the natural sources and dissipation terms (sinks), I have yet to see a rigourous rebuttal of Salby’s assertion that CO2 growth is principally driven by temperature, but would be genuinely grateful for a reference if you believe that such a rebuttal exists.
The main point of my comment was not to suggest that Salby is correct in his view on this – I am reasonably convinced that he is not from the combination of evidence – but that Guido’s article misses the target completely. I also think that rather than the hand-waving arguments, it would be useful to show that there exists a combined temperature and mass addition model which does satisfy the observations to second order rather than trying to defend a simple growth model which clearly does not. This would go a long way to addressing why Salby’s use of the word “impossible” is itself an invalid conclusion.
Over some similar period didn’t the planet “green” by a similar amount, 14% or 17%?
Has anyone ever worked out the significance, if any, of the daily C emissions calculated at 0.025 GtC/day (9 GtC/Y) by comparing it to the net combined mass of carbon in the atmosphere and the oceans? According to my calculations it is less than insignificant at 0.000057%, but then I could be wrong.
Pingback: Weekly Climate and Energy News Roundup #236 | Watts Up With That?
If you have a bias towards your “something” being in the data, you will likely find it. A multi-variable teleconnected system will have tons of correlations, some meaningful, some just by chance but with no connections. So finding correlations is easy in climate. Finding cause and effect is not.
Since most scientists have bias they need to apply due diligence towards this: Leave no stone unturned looking for confounding factors. These are variables that are potentially the actual causes of whatever correlated cause and effect paradigm that is your bias as a scientist.
The plural form in my statement is there on purpose because of these three considerations. 1) In a complex system, there can be more than one real driver working together in any given moment to produce temperature trends, just as there are multiple teleconnections that work together to cause weather. 2) in a complex system, there can be more than one fake driver that looks real. Finally, 3) in a complex system there can be more than one driver that work at different times to produce the same effect.
In summary, good luck with that definitive finding.
This posts primart attack is a textbook definition of a straw man. Salby didn’t say there was a 200% increase in annual emissions! If you actually listen he said that 200% more CO2 was emitted by fossil fuels in the second decade as compared to the previous decades total CO2 emissions i.e. the integral under the curve. That is a completely different statement from talking about a percentage increase in annual emissions. For you to conflate them as you have done above is disingenuous. It’s hard to believe you didn’t know the difference. Not to mention the figure you show with the scale different so that the curve looks flatter. I see what you did there, and it doesn’t help the eye make an accurate comparison but that wasn’t the point was it?
This posts primary attack is a textbook definition of a straw man. Salby didn’t say there was a 200% increase in annual emissions! If you actually listen he said that 200% more CO2 was emitted by fossil fuels in the second decade as compared to the previous decade’s total CO2 emissions i.e. the integral under the curves. That is a completely different statement from talking about a percentage increase in annual emissions. For you to conflate them as you have done above is disingenuous. It’s hard to believe you didn’t know the difference. Not to mention the figure you show with the scale different so that the curve looks flatter; I see what you did there, and it doesn’t help the eye make an accurate comparison but that wasn’t the point was it?