
by Judith Curry
A new paper purports to have resolved the discrepancy between climate response estimates from global climate models versus energy budget models.
Reconciled climate response estimates from climate models and the energy budget of Earth
Mark Richardson, Kevin Cowtan, Ed Hawkins & Martin B. Stolpe
Abstract. Climate risks increase with mean global temperature1, so knowledge about the amount of future global warming should better inform risk assessments for policymakers. Expected near-term warming is encapsulated by the transient climate response (TCR), formally defined as the warming following 70 years of 1% per year increases in atmospheric CO2 concentration, by which point atmospheric CO2 has doubled. Studies based on Earth’s historical energy budget have typically estimated lower values of TCR than climate models, suggesting that some models could overestimate future warming2. However, energy-budget estimates rely on historical temperature records that are geographically incomplete and blend air temperatures over land and sea ice with water temperatures over open oceans. We show that there is no evidence that climate models overestimate TCR when their output is processed in the same way as the HadCRUT4 observation-based temperature record. Models suggest that air-temperature warming is 24% greater than observed by HadCRUT4 over 1861–2009 because slower-warming regions are preferentially sampled and water warms less than air5. Correcting for these biases and accounting for wider uncertainties in radiative forcing based on recent evidence, we infer an observation-based best estimate for TCR of 1.66 °C, with a 5–95% range of 1.0–3.3 °C, consistent with the climate models considered in the IPCC 5th Assessment Report.
Published in Nature Climate Change [link to abstract]
The paper is behind paywall, but Ed Hawkins has a blog post with more extended discussion Reconciling estimates of climate sensitivity, including discussion of the figures (with full captions). Excerpts:
Climate sensitivity characterises the response of the climate to changes in radiative forcing and can be measured in many different ways. However, estimates derived from observations of historical global temperatures have tended to be lower than those suggested by state-of-the-art climate simulators. Are the models too sensitive?
A new study largely explains the difference – it is because the comparison has not been done ‘like-with-like’.
An earlier study by Cowtan et al. demonstrated that these subtle differences in producing estimates of global temperature can make a significant difference to conclusions drawn from comparisons of observations and simulations. When using simulated air temperatures everywhere, the models tend to show more warming than the observations. However, when the comparison is performed fairly, this difference disappears. Roughly half of the difference is due to masking and half due to blending. The size of the effect is not trivial. According to the CMIP5 simulations, more than 0.2°C of global air temperature change has been ‘hidden’ due to our incomplete observations and use of historical sea surface temperatures.
But what effect does this have on estimates of climate sensitivity? A new study, led by Mark Richardson, repeated the analysis of Otto et al. but used updated observations, improved uncertainty estimates of aerosol radiative forcing and, critically, considered the blending and masking effects described above.
So, according to the CMIP5 simulations, the TCR estimated from our available observations will always be lower than if we had full spatial coverage of global near-surface air temperature. To summarise the effect of the differences in analysis methodology, Figure 3 shows various estimates of TCR. The top red bar shows the raw estimates of TCR from the CMIP5 simulations and the bottom blue bar is the original result from Otto et al. based on observations. The various bars inbetween reconcile the difference between Otto et al. and CMIP5.
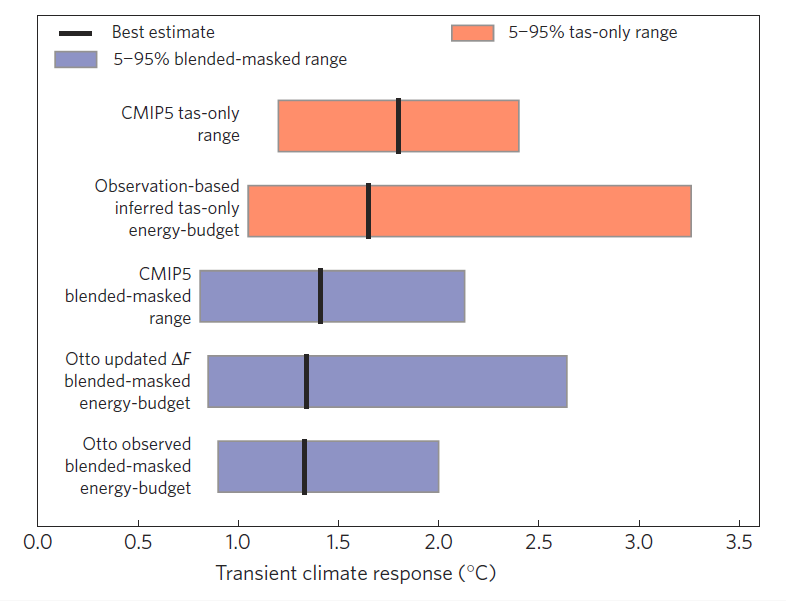
Figure 3: Comparison of modelled and observed TCR estimated from Earth’s historical energy budget. The blue bars show blended-masked results, reported upwards as Otto et al.’s results using HadCRUT4 observations, the same results using updated aerosol forcing (from Lewis & Curry), and the range when the same calculation is applied to blended-masked CMIP5 temperature series (one simulation per model). The red bars compare our bias-corrected estimates of tas-only TCR from HadCRUT4 using the Otto calculation with Lewis and Curry forcings, and the canonical CMIP5 model range. The updated observation-based estimate is higher due to the corrected blending-masking bias, and has a wider range due to the greater uncertainty in radiative forcing series used. Boxes represents 5–95% range and thick vertical lines are the best estimate.
For example, if the models are treated in the same way as the observations, then the estimated TCR is the top blue bar, in much better agreement with Otto et al. There is then no discrepancy between the observation and simulation estimates of TCR when they are treated the same way. (The second blue bar shows the impact of updating the uncertainty estimates of aerosol radiative forcing on the Otto et al result, which is a separate issue.)
However, we can also reverse the procedure above and estimate by how much we need to scale the TCR estimated from the observations to reproduce what would be derived if we had air temperatures everywhere. This is the second red bar in Figure 3, which overlaps the CMIP5 simulation range and has a best estimate of 1.7K (range, 1.0-3.3K)
JC NOTE: For reference, see Nic Lewis’ latest values [link]:
https://judithcurry.com/wp-content/uploads/2016/04/slide18.png
Richardson et al conclude that previous analyses which reported observation-based estimates of TCR toward the low end of the model range did so largely because of inconsistencies between the temperature reconstruction methods in models and observations.
Finally, if the reported air-ocean warming and masking differences are robust, then which global mean temperature is relevant for informing policy? As observed? Or what those observations imply for ‘true’ global near-surface air temperature change? If it is decided that climate targets refer to the latter, then the warming is actually 24% (9-40%) larger than reported by HadCRUT4. And that is a big difference, especially when considering lower global temperature targets.
JC reflections
The key issue that this paper raises is about the quality of the global surface temperature data sets, particularly related to sampling. The paper infers that the trend of surface temperature anomalies in HadCRUT4 are 9-40% lower than the true global averages. Is this believable? Well the uncertainty in surface temperature trends (9-40%) doesn’t seem implausible, but the inference that the uncertainty is only on the side of insufficient warming doesn’t seem plausible. There are many uncertainties in these global surface temperature data sets, although sampling is probably the largest uncertainty. Where does the (9-40%) numbers come from? Climate models.
If you want to sort out the sampling uncertainty of a dataset like HADCRUT4, the best way to approach this is compare with the global reanalysis datasets like ECMWF and the NCEP reanalysis (both of which disagree significantly with each other). By subsampling the ECMWF and NCEP reanalyses, and then comparing with the global reanalyses, you could get a handle on the biases in HadCRUT4 from under sampling (and the uncertainty in this bias). This is a much better approach than trying to infer the bias in a trend using global climate models that are biased warm.
Ed Hawkins asks the question: Finally, if the reported air-ocean warming and masking differences are robust, then which global mean temperature is relevant for informing policy? Here is my answer:
- As a stand alone dataset to document global warming, then a data set like HADCRUT4 is the best, which reflects the actual data that is available.
- For climate sensitivity analyses, you need a global data set. I am not a fan of any of the statistical infilling methods used in the data sets (although local infilling by Berkeley Earth is probably the best of the methods). I think the best path forward is the ‘dynamic’ infilling approach used in the data assimilation of numerical weather prediction models (the reanalyses). Coupled reanalyses (atmosphere-ocean) are the way to go, but these are in their infancy (I think I have a draft post on this topic buried in my files).
- In the absence of a truly global data set with ‘dynamic’ infilling, then the uncertainty analysis is of paramount importance. I realize that the HadCRU and NOAA groups are doing an increasingly thorough job of analyzing the uncertainty, but it does not yet comprehensively address all of the areas of uncertainty.
So the apples that I want to see is a truly global surface air temperature dataset derived from several different global coupled reanalyses.
In any event, I agree with Cowtan’s point that in comparing model and observation trends, you should subsample the model simulations to match the observations.
So, how should we approach estimates of climate sensitivity using the observations we have today? I think the best approach is to fully account for the uncertainties in the global surface temperature data sets in the analysis. This could be accomplished in several ways.
Lets get back to the Richardson analysis. What insights are provided by their sensitivity analysis?
The first major challenge is that the forcings (and forcing change over the period) used in the CMIP5 models don’t match the best observationally-based forcing estimates that emerged from the AR5. And if you are subsampling the CMIP5 models and using global forcing data, that introduces at least a different species of apple into this since several forcings are not homogeneous over the globe (aerosols, volcanic forcing, solar).
Here is why I think it might be better to use HADCRUT4 than a truly global data set for doing climate sensitivity analysis. The main thing missing in the HADCRUT4 analysis is the Arctic region. And the Arctic is hugely sensitive to the multi-decadal ocean oscillations, which was noted in the AR5:
“Arctic temperature anomalies in the 1930s were apparently as large as those in the 1990s and 2000s. There is still considerable discussion of the ultimate causes of the warm anomalies in the 1920s and 1930s.” (IPCC AR5)
“A recent multi-proxy 2000-year Arctic temperature reconstruction shows that temperatures during the first centuries were comparable or even higher than during the 20th century.”
Assuming that these high amplitude variations in the Arctic have a substantial component from natural internal variability, this variation should not be included when you are trying to infer the externally forced variability from CO2. How much of the current warming and sea ice loss in the Arctic is natural versus forced by CO2 remains highly uncertain, the AR5 makes a very conservative statement:
“Anthropogenic influences have very likely contributed to Arctic sea ice loss since 1979.”
‘Contributed’ – apparently the AR5 did not have sufficient confidence to say anything like ‘more than half’.
Lewis and Curry (2014) attempted to factor out some of the multi-decadal variability in calculations of ECS by choosing two periods with approximately the same AMO index (and an absence of major volcanic eruptions). Even so, the LC14 analyses implicitly assumed that the warming during 1910-1945 was ‘forced’, and based on climate model simulations, it appears that only a fraction of this warming was forced. So until we are able to separate out multi-decadal internal variability from forced variability, we will be overestimating climate sensitivity using the energy balance methods.
So, have Richardson et al. presented a convincing argument that the models and observational estimates of TCR are in agreement?
Well, the biggest outstanding issue is that of aerosol forcing; if you use Bjorn Stevens’ aerosol forcing values, Nic Lewis (from table above) finds the (0-95%) range to be 0.93 – 1.67 C, whose upper limit is below the mean of Richardson’s subsampled CMIP5 sensitivities. Yes the values do overlap, but this is a far cry from ‘agreement’.
Where does this leave us? Well we can infer from this that including the Arctic in climate sensitivity analyses makes a fairly large difference; however some (if not most) of the Arctic warming has been from natural internal variability, which shouldn’t be counted in the climate sensitivity estimates.
So the road forward on this requires efforts in (at least) two directions:
- Truly global surface air temperature datasets using ‘dynamic’ infilling in the context of coupled global reanalyses
- Separating out natural internal variability from forced variability in the observational estimates of climate sensitivity

The availability of ocean heat data means we can move away from using surface temperatures, with all of its uncertainties and biases, to diagnose climate system heat changes. Uncertainties in the ocean heat data are reasonably well recognized.
Indeed, the concept of “climate sensitivity” can be much better evaluated using the ocean heat content changes to estimate the global average radiative imbalance.
Roger Sr
Mere recognition of the uncertainties of ocean heat content data does not make them more tractable. The lack of spatio-temporal coverage alone militates against any firm conclusions from available data.
Roger, I’ve read the case that OHC is the best metric and it seems reasonable. However, I wonder:
How much of OHC is unsampled because of the formation in narrow zones around the Antarctic coast?
What portion of OHC increase might be adiabatic, not diabatic?
The CERES period of record indicates a net radiative imbalance close to zero. The variability and uncertainty of the satellite estimates are high, but how high in comparison to the OHC?
Turbulent Eddie -The ocean itself does the spatial and temporal averaging so small unsampled regions are not likely to make much difference in the estimate. The adiabatic changes are not likely to be important in the total global heat change estimate as areas of ascent would be countered by areas of descent, but it is an interesting question that you raise.
Since the CERES data measures fluxes, and it is the differential changes in the fluxes that result in the radiative imbalance, errors are magnified. With the ocean, this is an integral (mass-time) assessment which minimizes errors.
Roger, I’ve always found your methods and data well documented, your assumptions reasonable, your logic cogent, your conclusions both reasonable and suitably qualified and you appear to be open to non-conventional explanations that meet similar criteria. That continues to be the case, as usual. Deserved or not (I cannot say, except as above), this certainly creates the impression that you are a diligent and reliable source of information and opinion – you are trustworthy in other words.
I greatly miss your blog – comments on OR off.
Please continue as you have been – my only request is: MORE! (but I know it eats time like a monster, so I understand why you can’t always do it)
kneel63 – Thank you for your thoughtful comment. I do still use twitter. Judy is doing such a good job on Climate Etc that my blogging would be redundant :-)
Roger,
Climate sensitivity is defined in terms of surface temperature changes. How would you evaluate it much better using ocean heat content changes? I agree with you that OHC is a better metric for analysing overall AGW, but it’s not clear how it can better evaluate climate sensitivity.
Ken – My point is what do we gain with the so-called “climate sensitivity” that we do not find using OHC? There is no lag when we measure in Joules. If the OHC change would go to zero for its annual average, for example, the global TOA radiative imbalance must average out be near zero on this time scale.
Roger,
I’m certainly not arguing against using OHC (I think it is a very important indicator) but I don’t think OHC alone can tell us how much the surface will warm if we emit some amount of CO2, which is essentially what climate sensitivity can indicate. Clearly at some point in the future, the OHC change will – on average – go to zero and global radiative balance will have been – on average – restored. However, we would probably like to know how much the surface will have warmed when we do retain energy balance. I don’t think the OHC alone can tell us that (well, unless we make some assumption about the partition of energy between the different portions of the climate system).
In the fifth assessment report by IPCC we find the following statement:
“Ocean warming dominates the total energy change inventory, accounting for roughly 93% on average from 1971 to 2010 (high confidence). The upper ocean (0-700 m) accounts for about 64% of the total energy change inventory. Melting ice (including Arctic sea ice, ice sheets and glaciers) accounts for 3% of the total, and warming of the continents 3%. Warming of the atmosphere makes up the remaining 1%.”
(Ref: Contribution from Working group I; On the scientific basis; to the fifth assessment report by IPCC; Chapter 3; Observations Oceans; Executive summary; Page 257)
This indicates to me that there must be a tremendous exchange of energy between the atmosphere and the oceans, and that the atmospheric temperature will be highly sensitive to variation in this exchange.
However I agree that as far as the theory is about atmospheric warming – we will have to verify it by observing the atmosphere.
Science or Fiction,
Except it isn’t strictly about atmospheric warming, as the section of AR5 WGI you quoted alludes. Boiled down to its essence, the theory is that increasing the so-called GHGs in the atmosphere create a downward energy imbalance, and thus the system as a *whole* retains more absorbed solar energy than it would otherwise until the long-term TOA balance is restored. Senior’s point is that most of that energy goes into the oceans, thus like Anders agrees, it’s the better metric for detecting and diagnosing AGW.
Living as we do on the surface, it’s important to understand how that retained energy expresses itself in terms of atmospheric temps. That, combined with the fact that we have better long term surface records than subsurface explains the emphasis. But that’s quite different from saying that the theory is [all/only] about atmospheric warming.
To very rough first approximations, surface temps vary with vertically averaged ocean temps thus:
Using those scalings, the 700m and 2000m curves show far less visual variability than at the surface and down to 100m … well here, a picture says a thousand words:
https://2.bp.blogspot.com/-Bf0obrzw9X0/V3SQ2bZML5I/AAAAAAAAA-8/VLA5EKsNZ-ULr8Ct43d7lFqvtxCA-FmfACLcB/s1600/HADCRUT4%2Bvs%2BScaled%2BVertically%2BAveraged%2BOcean%2BTemperatures%2B2015-05.png
No Paws to speak of down to or below 700m either. At 100m and above, you can see that the surface temperature follows the variability there very closely, suggesting that most of the interannual/decadal variability is not due to atmosphere/ocean energy exchanges in the deep oceans, which show the long-term CO2 forcing signature quite clearly.
I should have stated explicitly that I think the oceans are the place to look to quantify energy accumulation. But as far as the theory is about surface warming that theory cannot be checked by observing the ocean heat content.
Science or Fiction,
Fair enough.
Why not? Given that sea water has roughly four times the specific heat capacity of air at sea level, we’d theoretically expect the upper layer of ocean and surface air temps to be tightly coupled, with SSTs being the driver. And that’s what we see in observation. As well, it stands to reason that accumulating energy at depth would be — not just matched, but exceeded by — warming near the surface because the oceans are heated from the top down. We also see that very thing in observation.
The tricky bit is not validating the theory of surface warming (been there, done that already) but reliably quantifying how much to expect for a given forcing. Thus the topic of this post and the paper about which it comments.
Excellent, where have you archived the reliable OHC data from 1900 (or 1880 or 1850) if you have it. Please provide URLs.
Eli
Glad to see you agreeing with a point I often make about OHC
Around what decade do you think it can start to be reliably used?
Tonyb
While you’re at it, see if you can find some reliable land surface data from then.
Here are OCONUS GHCN TMAX sites since 1895 that are missing fewer than 30 days:
https://turbulenteddies.files.wordpress.com/2016/06/stations1002.gif
To be fair, TMAX isn’t necessary for a TAVG, but it’s pretty clear that Sfc Obs, just like RAOBs, MSU, and SST are a big pile of poo.
Probably when Argo was fully deployed and debugged, a discussion Eli had with RPSr a number of years ago
Remember, ‘Global Warming’ is the greatest threat to Mankind and The Earth in the history of ever, and we’ve been hearing about it for decades now. It’s so bad we have spent Billions of dollars a year on conferences, science grants, Renewable Energy, and a plethora of others.
And who knows, someday we may even spend a few million bucks on creating an actual Global Temperature Monitoring Network, so we’ll know what the real Global Average Temperature is and not have to guess.
schitzree: “And who knows, someday we may even spend a few million bucks on creating an actual Global Temperature Monitoring Network”
Oh, come on schitzree!
Why would you want to use the data from a load of $10 dollar thermometers when you’ve got dozens $100,000,000
computer gamesclimate models generating hundreds of widely different datasets to choose from?Buck your ideas up mate, you’ll never make a real climate “scientist” if you can’t get with the program!
I’m glad The Eli joins with other skeptics in their skepticism about the ability to identify any level or rate of warming in OHC pre 1900. Rather difficult to assert the word “unprecedented” to recent data that was virtually unknown before 1900.
Eli
Again you agree with the points I have made about OHC. You are a smart bunny-in this instance :)
Presumably therefore that bearing in mind we know the OHC for a shorter period than Trump has had a bad haircut, that we should not start to draw any conclusions as to its meaning.
tonyb
Too funny. TE.
Now show all the data.
Too funny. TE.
I do wish it was.
Now show all the data.
The GHCN analysis of TMAX/TMIN sites outside of NA ( upper left ):
ftp://ftp.ncdc.noaa.gov/pub/data/ghcn/daily/figures/stn-yrs.png
is pretty close to what I find for Global stations OCONUS:
https://turbulenteddies.files.wordpress.com/2016/06/global_ghcn_stations.png
I used the criteria of 30 missing days, which is arbitrary, but 90 days didn’t seem to make much difference.
That’s why assessments of global extreme heat probably aren’t possible, certainly not for any significant duration.
By contrast, US data is more than enough, reliable enough, and of a long duration:
https://turbulenteddies.files.wordpress.com/2016/06/conus_ghcn_stations.png
If we’re really serious about this climate thing, it would seem some fairly simple and in this day and age, fairly inexpensive standards would be in order:
1. Uniform electronic instrumentation
2. Logging capability ( to improve reliability toward 100% )
3. Uniform standards ( TOBS of local midnight )
4. More strict tower heights ( 2m, no range, no exceptions )
5. Strict siting standards and annual metadata
6. Uniform RAOB instrumentation
7. Uniform 0Z and 12Z RAOB soundings
et. al.
Automated stations ( and I understand automated RAOBS ) would significantly reduce the cost.
For what it’s worth, it does make me more sympathetic for those of you working to create a global mean data set – fragmentary records, irregular reporting, missing data and numerous other headaches.
I’m more sympathetic but also see the warts more closely on all the data sets.
I’m not so sympathetic, they know how bad it is and they still do stupid stuff and fail to tell people how thin they are with the facts, and they want to turn the entire worlds economy over based on it.
Does the third person who speaks for Eli have the same name? Just curious. Please ask Eli for me.
I think it’s Ethan.
eli, “Excellent, where have you archived the reliable OHC data from 1900 (or 1880 or 1850) if you have it. Please provide URLs.”
Since this article promotes scaling of data to create a new index I am sure someone can scale sst to create a new OHC database.
http://1.bp.blogspot.com/-W98rTpHZANI/UpvafO7QqTI/AAAAAAAAKqg/GCgmbMVGOgw/s1600/common+period+with+gmsl+and+ohc+monthly+to+1669+27mo.png
http://redneckphysics.blogspot.com/2013/12/2000-years-of-climate.html
Silence. I take it then a girl has no name.
Since more than 90% of thermal energy stored by Earth’s climate system lies in the oceans, OHC offers advantages in principle over surface temperatures in monitoring climate change.
In practice, however, the fact remains that there’s pitifully little reliable basis for estimating OHC before the advent of ARGO floats during the prev8ious decade and even they offer essentially Lagrangian measurements that confound local and advective changes, seldom distinguished by non-oceanographers. Furthermore, to detect truly diabatic changes, the OHC record needs to be differentiated for direct comparison with ERBE radiation imbalances, thereby loosing all the putative advantages of integrated, smoother metrics.
For those of us living on Earth’s surface and unequipped to outlive the 21st century, well-chosen surface temperature records offer a far longer an more pertinent glimpse, albeit through a glass darkly, at the workings of the climate system clearly dominated during the Holocene by multi-decadal to quasi-millennial variations. .
“Ocean warming dominates the total energy change inventory, accounting for roughly 93% on average from 1971 to 2010 (high confidence). The upper ocean (0-700 m) accounts for about 64% of the total energy change inventory. Melting ice (including Arctic sea ice, ice sheets and glaciers) accounts for 3% of the total, and warming of the continents 3%. Warming of the atmosphere makes up the remaining 1%.”
We are here on behalf of the shareholders and the board of directors and my associates and I am here to audit your company. We will start with the above 1% that is the atmosphere and spend 90% of our time with that. Next since we here so much about ice we will spend 9% of our time with that 3%. Finally 1% of our time will be spent looking at that 93% that is in the oceans. We really are credentialed auditors and you can check with our board about that. You see, we are interested in highly volatile small things that don’t have hardly any sustain or mass. I mean, it’s not like all those billions of dollars in investments matters when you can watch 10s of millions of dollars do things like set records in the 10s of millions of dollars class for smaller amounts of money. We at Give Us A Clue CPAs, feel big is small and small is big.
The concept of climate sensitivity is a modeler’s concept, not a physicist’s concept. It is thoroughly artificial. Why don’t you go and measure it, instead of estimating it.
Curious George.
“The concept of climate sensitivity is a modeler’s concept…” No, it isn’t.
” Why don’t you go and measure it, instead of estimating it.” They do.
As a physicist, climate sensitivity *is* a model concept. It is not one the seven fundamental quantities nor a derived quantity, which would be one based on products and/or ratios of the seven fundamental quantities. Climate sensitivity cannot be directly measured. The fact that different models produce different climate sensitivity estimates should be sufficient to tell you this.
I don’t follow. Different kinds of atomic-level simulations produce different molecular properties, but that doesn’t mean that the latter can’t be measured. It just means there are differences in the models’ structures, inputs, etc.
Steve Brown.
“As a physicist, climate sensitivity *is* a model concept”
No, it is not.
Harry Twinotter,
You wrote –
“No, it is not.”
Clear, concise, and completely useless. Factless Warmist Waffle. An appeal to the immense authority of Harry Twinotter. You can’t even define “climate sensitivity” in any reasonable scientific manner. It’s a nonsense sciency word combination without meaning.
Climate is the average of weather. An average is a number – sensitive to nothing. This might explain why reputable physicists even try to discuss physics with fanatical Warmists. Warmists may redefine scientific terms to their hearts’ delight, but it doesn’t change a thing.
Cheers.
Mike Flynn, the blog troll. Go Brexit yourself.
Flat earth flynn
For the win
Harry just knows. Please share your knowledge. How do they measure the climate sensitivity? How precise are their results?
Strictly speaking we don’t even measure GMST trends, we estimate them.
Eh. All measurements are estimates. All measurements have some sources of error, and uncertainties.
Eggzachary.
Steven Mosher.
“Flat earth flynn. For the win”
Yes, it is a pity about trolls. They can spoil a blog.
I agree, GMST is an estimate. The “M” stands for “mean”, no one to my knowledge is saying it is an actual temperature. I think of it as a temperature index (although I am not sure index is an accurate term either maybe someone who knows can tell me).
As for climate sensitivity estimates, Dessler gives these examples of how it is estimated. TL;DR models AND measurements.
Climate models – models.
Paleoclimate record – observations.
Interannual variations – observations.
20th century record – observations.
For the General Circulation Models, as far as I am aware climate sensitivity is an emergent property of the models. The GCMs model known physics, and the climate sensitivity pops out as a result.
Dopey Benny writes: “All measurements are estimates.”
Philosophically correct. Practically useless unless the purpose was to give Mosher a woody.
Harry Twinotter,
… especially since it’s typically reported as mean temperature *anomaly*. Aren’t semantic nits just grand? :-)
I know lotsa folk who are saying the whole thing is simply made up. I’ve never been able to figure out why teh modulz don’t better match the falsified observational timeseries, but that’s polly ‘coz I’m a stoopid warmunist.
All this talk about estimates reminds me of all those dozens of times Smokey badgered me to produce a “measurement of AGW” knowing full well I’d answer him the same way every time: best I can do, DB, is point you to *estimates* derived from measurements. I even asked him once what kind of instrument could conceivably measure such a thing. Got nothing but [crickets] in return. Well no, that’s not entirely true; he once again declared Victolly! because “all” I had were “guesstimates” and then probably corked off another boilerplate rant about Lysenko or some such.
FWIW, you won’t get any guff from me — I’ve described it the same way. In fact, one of the best responses to “there’s no such thing as an average temperature” I’ve seen is that a mean global temperature anomaly is an “operational definition” which serves as an indicator of systemic warming, and so long as it’s consistently calculated over the time interval in question is entirely suited to purpose. IIRC, that was from someone who was more on the climate contrarian side of the fence … but I’d have to look to make sure. Doesn’t matter really; I thought it was a sound argument.
Or unless they “prove” sensitivity is low/teh modulz are hawt, hey Springer?
Curious George.
“Harry just knows. Please share your knowledge. How do they measure the climate sensitivity? How precise are their results?”
You first. You made a claim, so the burden of evidence is on you. Kinda rude asking me to provide evidence when you have not.
Dear Harry, you made the claim – and I am rude to ask you to support it. Get well soon.
Meh. Most physical laws are oversimplifications of reality. It’s this way all through science.
You know that the Ideal Gas Law is just an approximation, and only holds for gases with a fugacity close to 1? That is, gases whose collisions are nearly entirely elastic, that don’t bond with each other. Fugacity measures how much the atoms “stick” to each other, and helps us understand the rather narrow range where the Ideal Gas Law holds. Useful for simply physics, though.
The Theory of Evolution has gone through at least three major iterations. They keep adding stuff to it. Oh, hey, punctuated equilibrium hypothesis. Hey look, we can create new species with a single plant and a single generation, with polyploidy. Who needs to evolve a whole population?
Whoa, the tree of life can be more like a bush, when you can splice DNA packets in from other species, as many bacteria can. And, as it turns out, genetic drift is often more important than natural selection. Weird!
Newton’s Laws of motion were vast simplifications. Obviously they have trouble once you bring in friction or electric fields or magnets or variations in gravity.
Speaking of which, the gravity of most nearby bodies is lumpy enough that Newton’s Law of Gravity can be a problem for space flight. You really have to take gravitational gradients into account, too; the two-body approximation used in Newton’s Law is way too simple. Turns out that Newtons’ Law of gravity was a “modeler’s concept.. not a physicist’s one.”
And don’t get me started on simple materials science. Ptui. Simple is rarely simple there.
The real world is always messy. But scientists come up with simplifications that are close enough to reality that they’re useful. All of the major sciences do this; they congeal things down into their basic form(s), and new stuff is variations on those. And occasionally the new ideas become important enough to become their own new pillar of knowledge, or other times it branches off into its own subfield. And it just keeps growing.
Point is, there isn’t really a distinction between a “physicists’ concept” and a “modeler’s concept”. They’re all just fundamental concepts, with variations and combinations. When you look at the details, that’s always where things are interesting.
But, yeah, “climate sensitivity” is a good enough concept for it to be of use to climate modelers. “Sensitivity on a reasonable timeline for humans” is another way to put it. But if you want to play around with different timelines for forcings and responses, you can do that, too. That’s part of the fun of science.
The observations suggest however, scientists first thoroughly mix money in a solution to obtain the desired results.
As a nation we have been blessed as they say…
http://www.washingtonexaminer.com/national-debt-jumps-nearly-100-billion-in-one-day-to-record-high/article/2595507
to have enough experts in so many different fields, that now we are even able to count our current costs… Computers have made scientists much more efficient just like all their models projected.
Curious George is correct. Climate sensitivity is a model output not a data input. Warmists and sycophants have difficulty distinguishing between measured data and model outputs. It appears to be willful ignorance imposed by a dearth of facts upon which to base their case for catastrophic AGW in a far enough future so the current generation of alarmists will be retired or dead when found to be wrong. In other words it’s a bullsh*t inspired by a not very well hidden agenda to impose a favored social order on a global basis.
Orthogonal observation to RPsr. If the observational energy budget data are biased, then so are all the GAST datasets. A point long made by skeptics. So then we do not know how much Earth has warmed, let alone the attribution of that warming. In soccer, this is called a deperate own goal.
More evidence of wheels falling off the bandwagon. The more panicked one is, the more nonsensical stuff becomes.
One thing is clear: if after 150 years of thermometer records the instrumental datasets are still this uncertain, the paleo record must be completely worthless.
The paleo proxy record at least has one advantage. It is consistent in the way it registers. To me this makes it more reliable to detect changes.
Enh. This isn’t about uncertainty in instrumental datasets, it’s about different measurements. The sea surface vs the air temperatures, which portions of the globe you include, etc.
Foolish climatologists use sciencey terms like “energy balance” because they don’t actually know what they are talking about.
The Earth is a big ball of mostly molten rock, sitting a long way from the nearest decent external heat source – the Sun. Therefore it cools. The energy from the Sun, plus all the internal heat generated by nuclear mass conversion has not been able to stop the Earth cooling, over the last four and a half billion years.
No energy balance at all. Losing energy, continuously and remorselessly.
No amount of climatological double speak can deny simple observable fact. I’ve no doubt they’ll keep on trying. Their salaries depend on it.
Cheers.
Uh…. Mike? Have you bothered to compare the amount of energy from geothermal to the amount of energy we get from the Sun? To see how large of an effect geothermal is compared to solar radiation?
And… maybe this isn’t news to you, but when climate scientists talk about “energy balance”, they’re talking about the energy gains and losses of the Earth’s climate system. They’re not talking about the Earth as a whole, molten core and all. Just the climate. Obviously geothermal is one input into that energy gain/loss, but it’s not the only input, nor is it even anywhere close to being the most important.
You can find out such neat facts if you break open an introductory textbook on climate science.
Benjamin Winchester,
Have you compared the amount of energy we get from the Sun at night to the amount of energy radiated from the Earth at night? As I may have mentioned before, the Earth has cooled over the last four and a half billion years. The Sun notwithstanding!
As to climate scientists, I see you use the term loosely. Climate is the average of weather. Any reasonably competent child can calculate averages. Science?
There is no “energy balance”. Things warm up during the day, cool at night. Warmer in summer, cooler in winter. You are trying to bring fantasy to a fact fight. The Earth has cooled. The weather (and hence climate) does not remain static.
A book on climate science would be redundant. Averages are a product of mathematics, although climatologists keep averaging and re-averaging, hoping for different answers. This fits Einstein’s definition of insanity, from memory, but still doesn’t help to predict the future any better than reading tea leaves.
Cheers.
Hey, you are the guy from the Internet. You’re famous!
Benjamin Winchester,
Thank you for your encomium.
Unfortunately, even with all the fame in the world, I still need $5 to buy a decent cup of coffee.
If you’re really, really, impressed, I’d appreciate the $5 more than your fulsome praise.
I’m must admit you sound like a Woeful Wayward Warmist, trying your best to be gratuitously offensive. If you need a few tips on improving your game, let me know. I’m always glad to be able to assist the disabled.
Cheers.
Mike, you present tremendously bad strawmen about climate science. The reason I poke you with the Dilbert cartoon is because you’re doing what the character there does: look for the worst possible way to interpret what the other side is saying, and then you ridicule that strawman as hard as you can.
Note that there’s no publishing scientist – Lindzen, Curry, etc., – who thinks that geothermal is an issue for the concept of a climate energy balance. And the reasons why are pretty obvious: because it’s not an issue. Geothermal is quite small in comparison to solar and GHGs, and there’s no reason to think that geothermal varies as much or as often.
The actual, scientific concept of “energy balance” is something you can find in a science textbook. Making up a new version that includes the entire Earth, not just the Earth’s climate, and then criticizing that version instead of engaging with what the scientists are saying? It’s pretty absurd, and the amount of bias it demonstrates is just sad. You could try understanding what the scientific concepts are, and then engage with those instead.
You’re basically being this guy, but to climate scientists:
http://dilbert.com/strip/2015-06-07
Most effective argument you’ve made so far, Benny, comparing people to cartoon characters. Stick with it and stop the clownish attempt to make cogent fact-based arguments which you lack the chops to construct.
http://www.thefreedictionary.com/hubris
“No energy balance at all. Losing energy, continuously and remorselessly.”
yes, the Earth has cooled substantially since the last glaciation ;o)
dikranmarsupial,
I notice you cannot bring yourself to admit that I am correct. You are trying to employ the Warmist tactic of deny, divert, and confuse – albeit not very successfully.
With what part of my statement do you disagree!
None of it? As I thought, a Witless Warmist!
Cheers.
Nice post. I find if interesting that it took so long for the “consensus” to discover that the “surface” they were modeling doesn’t exist in observations. Now perhaps they will ponder just how significant warming from -30C to -26 C over sea ice is in the grand scheme of things.
“The key issue that this paper raises is about the quality of the global surface temperature data sets, particularly related to sampling. The paper infers that the trend of surface temperature anomalies in HadCRUT4 are 9-40% lower than the true global averages. Is this believable?”
I don’t think their issue is the quality of the datasets, in terms of what they measure. They speak of geographic incompleteness, but then say that this refers to the need to use SST over oceans. Well, we knew that. And as they say, comparing SST for EBM with air temp for GCMs is not comparing like with like. So they infer an air temp for ocean regions. That obviously adds uncertainty, as the figure shows. They aren’t saying a SST-based index is faulty, just that it isn’t the same.
The reason why the correction has a one way effect is that, as we know, SST is more stable than air temp.
Could you flesh out that reasoning a bit more? I’m not clear on how SST stability implies one direction or the other for corrections.
It has been warming. SST generally warms more slowly than air temp.
Not really. Surface air temp follows SST like a dog on a leash.
For Harry totter
Here is all of the data that you need, with an interpretation from colleague Chris Gilham.
http://www.geoffstuff.com/explanation_chris_gilham.pdf
Many of us worked on this matter for a couple of years.
Previous attempts by Nick Stokes and Mosh to discredit it are not valid.
It does NOT give the same outcome as BOM push.
Geoff.
Geoff Sherrington
“For Harry totter”
And so the ad hominems start. You climate change deniers are very predictable.
“While this might be numerically true for the homogenised ACORN-SAT dataset, the unadjusted temperature change for Australia is less than half that figure. We can measure change by taking start and end points of a period of time.”
Got it wrong by the second paragraph – the adjusted ACORN-SAT is almost identical to the raw data.
I will read the rest of it, but “appeal to authority” (especially to your own authority) usually don’t go anywhere I have discovered from experience.
Geoff Sherrington.
The analysis in the PDF is a pig’s breakfast. I will stick with the Australian BOM analysis thank you very much.
I am not a statistician, but I have issues with your “analysis”:
– it used absolute temp values, not anomalies calibrated against a standard baseline.
– ACORN-SAT has around 112 stations, and AWAP (the raw data) has around 700. You do not appear to use anywhere near that number in your analysis. In one analysis you use 19 AWAP and 19 ACORN-SAT stations across DIFFERENT periods of time – WtF ?
It has been warming …
You deduce this from a temperature set that is under discussion as being questionable. Circular?
I do not feel or see any particular signs of warming over the past 60 years. What are they, apart from adjusted temperature sets?
In the raw data.
The difference between raw and adjusted using the base periods of curry .16c
Using 10000 of the best stations. .quality scored ..unadjusted… we see about 1c of warming since 1880.
That’s raw data.
No adjustments.
Objectively scored as the highest quality in their respective regions.
Yes it has warmed.
There was a little ice age
Equal around the globe? Did MIn or Max change or did both change to produce that warming?
Warming by itself is pretty meaningless, great for funding sure, but not proof of warming from Co2.
In historic Australian data, we see about 0.4 deg of warming till now. That is probably within noise levels.
Granted, it is reasonable to think there has been some warming, but there is no rule to say global temperatures should be rock steady.
There is less merit in drawing inferences about trends when at least part of the trends commonly used are due to adjustment.
You have a different idea of adjustment to mine. I do not preclude adjustment to have been in place before the main data sets were formalised and sent off to other countries for incorporation in global averages.
Geoff.
Steven Mosher,
Yes, there has appeared to be warming. You appear to think it’s due in some way it is due to the presence of CO2 in the atmosphere.
Obviously you are mistaken. The Earth has cooled since it was molten. The surface cools at night. Filling a room with CO2 does not cause its temperature to rise.
CO2 has precisely no warming power.
Heat, on the other hand, does.
Maybe observed increases in temperature of various thermometers is due to them being exposed to increased levels of heat? What do you think?
Cheers.
“Yes it has warmed.”
In the continental US and Europe perhaps. The lack of comparable data temporally and spatially renders your claim anecdotal at best.
Geoff Sherrington.
“In historic Australian data, we see about 0.4 deg of warming till now. That is probably within noise levels.”
The Australian data shows the annual mean temperature has risen by around 1C since 1910. The raw and adjusted data sets are almost identical. The reference data set is ACORN-SAT.
Harry TO,
You are about 6 laps behind in this discussion. What you state to be correct is what I am questioning is correct. IMO, you are talking about junk data. Want some references to good data?
Geoff
Geoff Sherrington.
“Want some references to good data?”
Yes, go for it. I am pointing out errors in your claim, and I said what my source is. Us Ozzies pay good tax money for the BOM and I like their work. If you think you have better data, please post.
I’m curious to know what the average daily high and average daily low in any given place will be should temperature rise as predicted by models? To make it easier let’s say Nashville, TN.
go get the GCM of your choice. download the data and see.
next go get the skeptics best model and ask the same question.
Nashville. its a good test. may the best model win
The Bible tell anyone who cares to read it, that things like this are to be expected to happen when we break the rules.
https://ca.news.yahoo.com/survey-finds-excess-health-problems-lesbians-gays-bisexuals-224741845.html
Scientists and Insurance companies are still baffled don’t you want to know why first?
Believe On, Him
Manna.
Romans 4:24 But for us also, to whom it shall be imputed, if we believe on him that raised up Jesus our Lord from the dead;
Alive
Other factors too, along with so-called minority stress, may account for health differences between heterosexuals and lesbian, gay and bisexual people, Gonzales said.
For example, he said, survey respondents may not have had access to marriage, which wasn’t legalized at the federal level in the U.S. until 2015.
So for centuries the rules brutalized these people, but now they can get married and they will soon be healthier. Cause for celebration!
See what I mean?
Has it occured to you that it might be that the climate cannot yet be reliably modelled in a useful way?
AGW scientists are having a harder time with the model for Noah’s Flood, than most and from the looks of things we did not learn anything.
JCH:
Don’t argue with Mr. Bible or he will have one of Noah’s dinosaurs stomp you.
Steven Mosher,
You obviously never tire of issuing orders and demands, usually accompanied by restrictive parameters.
Have you ever considered actually doing some science?
Cheers.
Absent a doctor in the room (a validated model) Mosher asserts we should rely on the medical advice of a retard because that’s the only other person present.
I don’t know where Mosher gets this notion of we have to either construct a better climate model or accept the results of those existing that are demonstrably unreliable.
Here’s a clue Mosher – just because there’s only one game in town it doesn’t follow that you have to either play it or invent a better game. Duh. Were you born an inept boob or did events conspire to turn you into one over time?
Opluso, When the dinosaurs were still stomping around it was the Age of the Dinosaurs. Age of Grace, is where you are now, Kingdom Age, is the next step in our evolution you might say. Get yourself a crown to throw and you will be moving to the next level with the rest of us. See, it’s just that easy after all.
climate sensitivity relates atmospheric composition to temperature but if the policy implication is to reduce fossil fuel emissions, it must be shown that atmospheric composition is responsive to fossil fuel emissions.
http://papers.ssrn.com/sol3/papers.cfm?abstract_id=2642639
the other way to reach that policy implication is to bypass sensitivity altogether and show that warming is related to fossil fuel emissions
http://papers.ssrn.com/sol3/papers.cfm?abstract_id=2725743
as it stands, there is no empirical evidence to support the Lacis idea that we can attenuate warming by lowering fossil fuel emissions. there is no control knob in our hands.
that control knob is more likely to be in nature’s hand.
Big +
The real control knob can be observed as the fat-filled vessel with eyes and a mouth attached to the top of the climatastrophist neck.
OFF TOPIC
In a book on cosmology titled “The Singular Universe and the Reality of Time,” physicist Lee Smolin and philosopher Robert Unger wrote:
“Science is corrupted when it abandons the discipline of empirical validation or dis-confirmation. It is also weakened when it mistakes its assumptions for facts and its ready-made philosophy for the way things are.”
Seems like climatology is not the only area of science that is getting the cart before the horse.
But, the ~2 going on 3 or 4 or 5 or 6 decades long hiatus in global warming is not consistent with the climate models…
“In any event, I agree with Cowtan’s point that in comparing model and observation trends, you should subsample the model simulations to match the observations.”
I don’t think this is unreasonable. However, you would need to withhold data from both calculations so you can check out-of-sample data. Sorry, but many climate scientists seem to have the habit of using models to adjust data and while that is not unreasonable either, one needs to be very careful to double and triple check your assumptions. THAT, I don’t see happening except at the fringes (eg, uncertainty was previously buried until JC and the real world butted in).
Personally, I think there is too much “we are right – we must be!” and not enough “what did I/we miss?”, “is I change the assumptions, what happens?” etc. It’s all very well to publish science based on a spherical cow, but no farmer would take you seriously…
““In any event, I agree with Cowtan’s point that in comparing model and observation trends, you should subsample the model simulations to match the observations.”
‘I don’t think this is unreasonable. However, you would need to withhold data from both calculations so you can check out-of-sample data. ”
That is a separate issue.
Let me make it simple for you.
Lets suppose you have a model that calculate the temperature for the whole globe.
Lets suppose you have observations of only the highest mount peaks
Now you want to compare the model with the observations.
the typical skeptics approach ( see bob tisdale ) is they compare the observations of the mountain tops with the modelled temperature of the whole planet… and conclude that the models are warmer.
the right approach is to compare apples with apples.
The mountain tops as observed versus the mountain tops as modelled.
out of sample is an entirely different matter.
And yes.. when people like Cowtan and way did their work showing how hadcrut was wrong they did in fact use out of sample data. In fact its out of sample data that shows us hadcrut is wrong
“That is a separate issue.”
This is what is wrong with climate science – the whole subject is way too complicated for any one person to be expert in all areas. Yet all areas interact in complex ways that are barely if at all understood. So you end up saying things like:
“Let me make it simple for you.”
And then proceed to make a straw-man argument to prove I don’t understand as much as you. Even if it’s true that you do know more than me, you cannot possibly believe that anyone knows enough to make a “climate prediction” of any useful accuracy – to date, all such attempts have resulted in the prediction being defended as accurate by post facto cherry-picking data sets, ridiculously complicated and dubiously justified adjustments to those data sets, circular logic and marginalising and denigrating anyone brave or foolish enough to suggest there might be a mistake in any single piece of the “evidence”.
While I honestly believe you are attempting to do science and advance the field as best you can, making simplified statements and downplaying uncertainties in order to garner political support – even for honestly held expert opinions – is not the right or moral thing for a scientist to do – ever. And yet your work – whether you realise it or not, and whether you care or not – is being used to do just that.
In my not so humble opinion, if you really want to make a difference to climate science, then stop fiddling about with temperature datasets and start thinking more about systems instead – the stadium wave for example, is a greater contribution to the field than the statistical gymnastics of BEST could ever be. Even if stadium wave turns out to be wrong, it shows a grasp of treating the whole system as different to the sum of its parts, while BEST is just another in a long list of “data sets” that look more like an attempt to torture the data until it confesses than to allow any useful predictions to be made.
And before you ask, no I am not interested in doing so myself – at all. Quite frankly, given the treatment shown to several high profile climate people for daring to suggest there may be something wrong with the way the field does business, I simply don’t have the stomach for it.
Steven Mosher,
You’re wasting your time arguing about historical temperatures, according to the IPCC. The IPCC wrote –
“The climate system is a coupled non-linear chaotic system, and therefore the long-term prediction of future climate states is not possible.”
I realise that Warmists take no notice of the IPCC. Either that or they redefine “not possible” to “a certainty”. Fiddling about with history provides precisely no information about the future, in general. With chaotic systems, the future is totally unpredictable in any useful fashion.
Talk of probability distributions sounds sciency, but provides no more useful information than saying the bottom bound of temperature is absolute zero. True, but meaningless, like many patronising and condescending Warmist comments.
Maybe it’s time for you to practice the Warmist tactic of deny, divert, and confuse. Maybe you could demand that someone develops a useful climate model. That might divert people away from the realisation that all the money spent on climate models to date has been completely wasted.
Or you could deny that the climate is chaotic, as the IPCC stated. Or pretend that CO2 heats things up ie. increases their temperature.
The possibilities are endless, particularly if you inhabit the Warmist fantasy land where wishful thinking overcomes fact.
Cheers.
Al Vostok points out the 5 Tops that were in the Inconvenient Truth but did not explain the reason for all the CO2 peaking _After_ the Temperatures had hit the Top, not to mention that next the Dust, would exploded in the world we all love but still, no model that would be any good at AGW stuff. What is now left to do, Steven? How can Mann stop the pattern from repeating itself over and over and over… again?
“Lets suppose you have observations of only the highest mount peaks”
Well, lets suppose you have observations of only areas with land use change that have a 0.5°C average increase in temperature since 1880 due to land use change.
Alternatively, if your models show most or all of their warming in places you aren’t measuring, like the arctic or the bottom of the ocean, maybe you should put a few thermometers in those places and see if they actually are warming as much as the models claim.
Granted, you’d then have to wait a few years to get reliable data. obviously that isn’t going to set well with the ‘make changes now’ Alarmists but, sorry to say, you aren’t getting your way anymore anyway.
it’s just to bad nobody in the Climate Science community thought to place a few more thermometers around the globe a decade or two ago. To busy flying around to places like Cancun and Paris I guess.
C&W also did “out of reality” corrections by inventing numbers when none existed. But this is different from “out of sample” techniques. When a location is both out of reality and out of sample, is it a valid object for incorporation in any physical model? Does its use reduce the uncertainty of the final product? No, not in any good physics sense.
Flynn, kneel63
The sun is actually getting warmer and it is well known that in millions of years we may have to move the earth farther away from the sun.
My understanding is that that ipcc has discounted significant energy release from the mantle yet 3 new papers suggest that gravitational effects from milankovich cycles and changing pressure from glaciers melting can create significant changes in ocean fissures. This is most likely a significant factor in ice age temperature variation which means that co2 carries much less baggage and evidence of high sensitivity.
The ipcc has repeatedly made bad assumptions. The ocean was static over decadal scales: wrong. Just the recent 20 years shows massive amount of energy can be stored In the deeper ocean. The amo and pdo generate approx 0.23C up and down over a 60 year cycle. The evidence for this is amplified by recent data showing aerosol forcing has to be much less than used in the models. This means co2 forcing has to be much less.
They calculated aerosol forcing from looking at co2 and what it needed to be to match the curve of the historical data. This means in effect they assumed the co2 tcr. However they missed the amo/pdo and gave the wrong number for aerosols resulting in massive problems with co2 sensitivity.
I have not seen an explanation for the heat accumulation in deep ocean detected in OHC recently. If pdo/amo are the required explanation for the 1945-1975 anomaly because of aersosol screwup then where is the energy for the pdo/amo come from? Wouldn’t it need to be in the ocean and therefore isn’t it likely that none or very little of the OHC seen in the last 20 years is due to co2 but must be related to something else which periodically stores energy in the ocean and releases it. What cyclical effects could cause this shorter cycle as well as the longer 1000 year cycle that some have observed?
It seems likely that undersea leakage could be happening at least in principle and since much of this may be at depths far greater than Argo which covers less than 50% of ocean mass.
The remarkable unexpected results of Argo suggest improved Argo that can detect both deeper ocean to the mantle, shallower ocean and even fixed observation sites which can gain much more information about currents and changes in chemical and biological composition of the ocean is critical.
Later someone says pick up a intro book on climate science to discover geothermal effects are minimal. Is this the same climate science 101 that never knew about pdo/amo 60 year cycle, denied the Lia and mwp, doesn’t know about gravitational effects on mantle can affect fissure eruptions, thought aerosols were responsible for the cooling from 1945-1975 and had no idea that co2 energy could be diverted to the oceans somehow.
+1
“As a stand alone dataset to document global warming, then a data set like HADCRUT4 is the best, which reflects the actual data that is available.”
Huh?
Hadcrut throws away a ton of data merely because the data appears outside their selected window for calculating a base anomaly period.
Further, you keep saying that Berkeley infills. We dont infill.
All that said it is clear that the estimates of Delta T need to take account of all the uncertainty– the sampling uncertainty, measurement uncertainty and structural uncertainty. For example, if you use NCDC and calculate delta T for the lewis and curry base and final period you end up with much lower sensitivity than using hadcrut
Steven Mosher,
The arguments over models and data overlooks the fact that neither can provide any more useful predictions about the future than my examination of a frozen chicken.
In other words, I can predict the future just as well as the most highly self styled climatologist in the world. Actually, I’ll include economists and political pundits in the category of people who can’t predict the future any better than I can.
I assume that weather will continue happening in the future. If it looks like rain, I’ll consider taking an umbrella. I suspect you think the same.
There is no delta T. CO2 heats nothing. A very minor insulating effect, as part of total atmospheric insulation. Fiddling around with past temperatures shows precisely nothing. A thermometer records the temperature of itself. Surrounding a thermometer with CO2 does not cause its temperature to increase. End of story for any rational person.
Climatologists are different – keep the grant funds coming, but don’t expect any accountability. I suppose it keeps them off the streets, or from clogging up the semi-skilled labour market.
Cheers.
Flat earth flynn for the win.
FEFFTW
“There is no delta T. CO2 heats nothing. A very minor insulating effect, as part of total atmospheric insulation?” What is your calculation for CO2’s radiative forcing?
David Appell,
The term “radiative forcing” seems to be confined to climatologists who do not understand normal physics, so they create new terms which sound “sciency”.
However, using the radiative transfer equations, it can be seen that your beloved “radiative forcing” must be less than zero. You may do the calculation using your own assumptions as to spectral radiance, optical depth, and so on. If you come up with a positive figure, you will need to recheck your calculations, obviously.
Your question is a typical Warmist misdirection, and is about as silly as asking me “how long is a piece of string”?
Away with ye, laddy! Your horse is moribund. Flogging it will achieve nought. On the other hand, maybe you need the exercise!
Cheers.
Oh dear! It seems Steven Mosher has become annoyed because I pointed out that NASA graphics show all the continents – the whole Earth – being warmed by sunlight at one time. This is the only way they can avoid the inconvenient fact that night occurs. All their “energy balance” figures turn into a pile of stinking ordure in the absence of the Sun.
I haven’t checked, but they might also be silly enough to believe the Earth’s orbit is not elliptical, and that the axis is not inclined to the plane of the ecliptic.
These physical facts result in inconvenient things for Warmists such as day and night, and summer and winter.
What a pack of Warmist Wallys! Who needs facts, when fantasies keep the grant funds flowing?
Cheers,
Thermal radiation shields increase the temperature of systems, they function much as greenhouse gases do. You could look it up or you could continue to blather.
Mike Flynn | June 28, 2016 at 11:59 pm | Reply
I suspect that when God was passing out brains you two clowns thought He said “rain” and asked for an umbrella instead.
Eli Rabbett,
You might be silly enough to believe that what you refer to as “radiation shields” increase the temperature of what they are shielding. This is complete and utter nonsense, of course
The shiny radiation shielding suits worn by firemen are to keep the wearers from getting too hot. Conversely, shiny “space blankets” prevent people from losing heat too quickly (or vice versa, if the truth be known).
You’re talking rubbish, in the hope that nobody will realise you haven’t a clue.
Present a few new facts, and I’ll no doubt change my mind. Over to you.
Cheers.
Are you saying that HADCRUT4 is not fit for purpose? If so we need to examine our funding of the Met Office and see if we can get a rebate on the very expensive computer the public purse has just bought them.
tonyb
Are you saying that Im saying it is not fit for purpose?
are you saying that there request for computers to run weather prediction depended on hadcrut4?
what are you saying and what do you think you are saying about what i am saying?
just saying
Stop being an utter fool and trying to argue by asking questions. It doesnt work. will never work and is just ignorant.
“Stop being an utter fool”
You first.
Mosh
Sorry, I didn’t realise you were the new moderator. If I want to ask questions I will do so. Its a very good way of getting answers as the Brexit vote just showed.
You have the prerogative of not replying or going off at a tangent asking questions of your own.
tonyb
“Sorry, I didn’t realise you were the new moderator. If I want to ask questions I will do so. Its a very good way of getting answers as the Brexit vote just showed.”
wrong. Your question was a total joke. Asking stupid questions like yours is different than asking people to vote.
Stop asking stupid questions. It makes you look like springer
Mosh
Asking questions gets interesting replies, like this one from Eli
https://judithcurry.com/2016/06/28/towards-reconciling-climate-sensitivity-estimates-from-climate-models-and-observatiions/#comment-793001
perhaps you would like to give your opinion as to when OHC became a useful matrix.
tonyb
Berkeley Earth uses kriging, which effectively does some infilling
if you have two thermometers 1 foot apart you are infilling by your definition.
Doctors “infill” body temperature when they only measure under your tongue.
No, body temperature for normal usage has been normalized to the value measured under the tongue.
And how does measuring under the tongue tell you anything about what the temperature is at other places in the body?
Do we have to make up temperatures for the rest of the body?
Steven – Germans had two thermometers a foot apart – an old glass thermometer, and a new electronic thermometer. Over eight years, the new thermometer was on average 0.9 degrees C warmer. Does BEST include this effect?
http://notrickszone.com/2015/01/12/university-of-augsburg-44-year-veteran-meteorologist-calls-climate-protection-ridiculous-a-deception/
Long story short? Infilling station data has been around a very long time, at least 40 years.
Everett F SargentJuly 2, 2014 at 2:47 PM Moyhu
Long story short? Infilling station data has been around a very long time, at least 40 years.
“Along with “estimated” data for a bunch of closed/zombie weather stations that shouldn’t be reporting at all, and have no data in the raw data file.”
I have three degrees in civil engineering, the 1st one was a two year at Vermont Technical College in May 1975 (then UVM then Cornell).
That summer of 1975, I was lucky enough to work for the USACE CRREL in Hanover, NH as a GS-3.
My job, along with several others, was to update the CONUS snow load contour map, using all available historic raw monthly snow accumulation data.
This was all from stacks and stacks of computer printouts.
When a station was missing data, we INFILLED it using a simple three point average from the closest three adjacent stations (that formed a triangular enclosure for the missing data).
Perhaps not the best method, but that was almost 40 years ago.
I can’t remember if we did any massive multiyear infilling though (Is that a requirement for the v2.5 USHCN to work?).
But at some point, contour maps are constructed from the final homogenized climatology either as anomalies and/or absolutes. Correct?
We never used those estimates to calculate any other missing data, all interpolation was from original raw data only.
–
I guess BEST does not get any data from CONUS , then?
Or other infilled data sets?
Give it up Steven.
http://berkeleyearth.org/wp-content/uploads/2015/04/Figure9.png
http://berkeleyearth.org/understanding-adjustments-temperature-data/
funny anecdote about SNOW.
repeat after me. USHCN is 1/20th of the data for the US
Mosher writes: “repeat after me. USHCN is 1/20th of the data for the US”
Repeat after me. The US is 1/50th of the earth’s surface.
Sounds a bit like complimenting cooks on their bald eagle egg omelets.
“Even so, the LC14 analyses implicitly assumed that the warming during 1910-1945 was ‘forced’, and based on climate model simulations, it appears that only a fraction of this warming was forced.”
I dont think this follows.
Since you are concerned about forcings during the base period ( 1859-1882) and the forcings during the final period ( 1995-2015 ) and episodic natural forcings during 1910 -1945 are not a part of the equation… Literally .
Now, if we had evidence that the arctic was warming today because of natural forcing that would be a different matter.
Excluding the arctic, when theory tells us we should see more warming there, seems like avoiding the best evidence.
Finally we know that the hadcrut method performs worse than other methods on sparse data. So, why support an inferior method while we wait for the ‘perfect’ method
Now, if we had evidence that the arctic was warming today because of natural forcing that would be a different matter.
Yeah, that’s been around for a while.
Precisely how much of the winter time warming is natural versus anthropogenic is another matter, but it appears to have occurred in the past:
http://climatewatcher.webs.com/ArcticFingerprint.png
So some of the Arctic sea ice decline and subsequent winter warming is quite possibly natural.
Excluding the arctic, when theory tells us we should see more warming there, seems like avoiding the best evidence. I tend to agree ( though making up numbers for central Greenland, which is 2 kilometers above the surrounding sea level stations is ridiculous ).
However, excluding the complete troposphere, when theory tells us we should see more warming there, also seems like avoiding the best evidence.
Finally we know that the hadcrut method performs worse than other methods on sparse data.
You certainly don’t know this at all. You’re talking about knowing temperatures where no measurements exist. Here’s the visual again:
https://climatedataguide.ucar.edu/sites/default/files/styles/node_lightbox_display/public/key_figures/climate_data_set/global_temperature_difference_19912010smins19011920_0.png
All the analyses differ and probably all of them are wrong, though we don’t know what’s not measured.
Has Lewis & Curry 2014 passed peer review?
David.
Good point. Has BEST?
Whilst we are asking questions what has happened to the Watts paper and what news on the embryonic Atmospheric society?
tonyb
BEST peer reviewed? No. The only papers produced by the group were published in pay-for-play vanity journals.
Too funny. BEST’s vanity journal publisher is owned by an India-based firm and is just a few years old. Here’s one of their papers:
http://www.scitechnol.com/earth-atmospheric-land-surface-temperature-and-station-quality-in-the-contiguous-united-states-Cib9.php?article_id=750
And here’s a review of the publisher:
https://scholarlyoa.com/2012/05/05/omics-publishing-launches-new-brand-with-53-journal-titles/
There’s a third choice between publish or perish for clowns like Mosher.
Too funny!
Too funny. BEST’s vanity journal publisher is owned by an India-based firm and is just a few years old. Here’s one of their papers:
http://www.scitechnol.com/earth-atmospheric-land-surface-temperature-and-station-quality-in-the-contiguous-united-states-Cib9.php?article_id=750
And here’s a review of the publisher:
https://scholarlyoa.com/2012/05/05/omics-publishing-launches-new-brand-with-53-journal-titles/
How much has it cost you Steven? They must have some additional storage space for Berkley Earth scientists data output, for some sort of fee. What has been the total cost for your services?
David Appell,
I don’t know, and I don’t care.
Is it true? Can it be repeated? Is it any use? – might be more useful questions.
Are you really gullible enough to believe all peer reviewed papers are true?
Sorry to sound harsh, but you sound like a drowning Warmist, clutching at straws.
Cheers.
?
Climate Dynamics is a peer-reviewed journal and the paper itself says the authors thank two anonymous reviewers. In any case, it’s been nearly two years and the biggest complaints about the analysis are things that either have found little support (forcing efficacy) or have only started to be discussed very recently (difference between SAT and SST). Nobody has shown a mistake was made with the data available at the time.
Lewis and Curry ref:
http://link.springer.com/article/10.1007/s00382-014-2342-y#page-1
The official publication was 2015 (online version 2014)
“Has Lewis & Curry 2014 passed peer review?” How would it impact the conclusions?
Yes. Lewis and Curry (2014) was published in Climate Dynamics a 30-year journal published by a subsidiary of Springer-Verlag.
According to the Journal Citation Reports, the journal has a 2013 impact factor of 4.619, ranking it 5th out of 71 journals in the category “Meteorology & Atmospheric Sciences”.
Thanks for asking!
Curry’s name certainly spans the gamut of trash and treasure in published papers. This outstanding paper with Lewis published in an eminent climate journal is on the treasure side and her association with the BEST clowns published in an obscure Indian vanity journal marks the depth of the trash side.
Yep.
Poor David, what are you and the rest of the Climate Faithful going to use to deride all heretical thought now that you are no longer able to ban skeptical and lukewarmer papers from the journals? Why, you might actually have to start arguing you opinions based on facts.
Do you HAVE any facts, David? Anything to support your position that isn’t a model or conjecture filled greenpeace pamphlet?
My very limited climate comprehension is being severely tested. Are the authors saying that GCM’s have nothing to offer by way of nonlinear dynamics and the only issue with simple, linear, basically static, energy budget calculations is the data input? Nic Lewis seemed to imply something similar in remarks a couple of months ago. The implications for saving resources in these hard pressed times seem obvious!
This is hilarious. If I understood correctly, the main point of Richardson et al., 2016, is that the 25% more warming that models predict but we don’t find is actually hidden in the surface of places we don’t measure. This is even better than global warming hiding in the oceans. Apparently we are playing hide and seek with global warming. Hilarious and ridiculous.
Agree .
Well, not quite. They also show that if you determine the temperature change in the models in a manner consistent with how it is done in reality (air temperatures over land, sea surface temperatures over ocean) and also account for coverage bias, the results essentially agree.
Okay. So do the models need to be adjusted down? or the measurements up?
Ken,
Neither, really. We should just be aware that the temperature we get if we have full coverage and use air temperatures only, will probably be different to what we get if there is some coverage bias and the temperatures are from air temperatures over land, and sea surface temperatures over the oceans. The main point is that if we want to compare models and observations, we should do our best to do a like-for-like comparison.
ATTP,
Seeing as how the models are carefully “tuned” to reflect the Warmist version of history, that’s hardly surprising, is it?
They only start to diverge into the future. Do you really find that odd?
Even the IPCC states that future climate states are not predictable. Unfortunately, it seems that Warmists even have problems accurately predicting the past. That really is odd, wouldn’t you agree? Just ask Steven Mosher – he’ll predict any past you wish.
Cheers.
Well, given the physics, it was pretty ridiculous – most likely politically motivated – to conclude there was an actual hiatus in the build up of energy in the system: sunlight, increasing insulation, climate, weather, etc.
ATTP,
“The main point is that if we want to compare models and observations, we should do our best to do a like-for-like comparison.”
That’s fine to keep in mind, but if models and observations are apples and oranges, don’t you think somebody ought to fix this graph (and others like it)
http://blog.drwile.com/wp-content/uploads/2014/03/models1.jpg
It’s confusing a lot of people!
Ken,
Well, models and observations aren’t apples to oranges, it’s just that we haven’t always done a true apples to apples comparison when doing comparison. Yes, that graph does indeed confuse people. Gavin Schmidt has already done a more thorough version of that graph and we should probably update that to include what is highlighted in the recent Richardson et al. paper.
ATTP,
“Gavin Schmidt has already done a more thorough version of that graph and we should probably update that to include what is highlighted in the recent Richardson et al. paper.”
We’ll all be looking forward to that!
cheers, ken
Actually, …and Then There’s Physics, they don’t show that.
If we now go to all those places and measure the way models do, we can still find that models show too much warming. They haven`t demonstrated the opposite.
All they have demonstrated is that models have one more reason to be wrong. They believe that reason can make models and measurements agree, but that is only a belief, and science doesn’t rest on beliefs.
I am not a fan of any of the statistical infilling methods used in the data sets
==============
Instead of infilling, why are the temperatures not simply sampled?
For example, rather than trying to build continuous records for stations, treat all stations readings as though they are simply ships at sea, that move randomly. This removes the problem with false trends introduced by changes at each station.
Once that change is made, there is no need for infilling. Rather, simply sample all stations randomly in such a fashion to provide equal coverage over the surface of the earth. In this fashion there would be no need to adjust any station.
Due to the central limit theorem, this will result in a normal distribution of temperature, that can be used to calculate averages, standard deviation, and standard error. Mathematically this is much more satisfactory solution than the current practice of trying to correct individual stations and infill stations where none exist.
that is essentially the berkeley method.
No, it isn’t. Read harder.
Too funny springer has sunk to Flynn levels.
1. As ferd notes one should not try to build long records by adjusting.
that’s what we do.
2. For sampling, we build a regression of latitide and elevation versus
temperature. You can can do this several ways. You can stratify
lat and elevation and sample from that to build a model, you can randomly sample from all (43K) locations.. and hold out data
for cross validation.. you can use all the data to build the regression.
What you end up with is a continous function that predicts monthly temperature as a function of latitude and elevation. You can then test that with your held out data.. or you can go buy proprietary data to test it
or test it with data that is online but not in climate repositories.
For example. To test your prediction you can go to the state of michigan and get all the temperature data from their agriculture department.. you can go to the Korean government and get the hundreds of stations they dont publish online..
There are these choices
1. “No inflling” ( CRU) which SIMPLY fills in missing data with a global average.
2. : Bigger grids which simply says temperature is a function of latituude and longitude
3 Statistical prediction, which assigns temperature as a function of testable regressors
4. Physical modelling: reanalysis
Only skeptics demand that 1 is right. They think that is settled science
This with the smallest grid size possible that still get sampled is the only decent solution that gives you an average of what was measured.
micro
ask yourself this
1. What happens to CRU if they use a 10 degree bin
1. what happens if they use a 6 degree, 3 degree? 2 degree? 1 degree
.5 degree
Go test that.
I have.
Ask yourself how you choose the best bin size?
Frankly? None of them are any good. I’d use the data for something other than a temperature anomaly against an arbitrary baseline.
I chose treating them as individual measurements of a large system. Basically the Continental US is measured, Eurasia isn’t bad, the rest get worse from there.
And nothing is really well measured prior to 1950.
But there is other things you can do with the data we have, and they tell us far more than a made up GAT.
I love this one, because it really encapsulates everything
Average Daily Entropy of tropical air is ~74kJ/kg, and it cools off ~9kJ/kg at night.
Deserts in the US SW is 28kJ/kg and cools 14kJ/kg.
Water vapor controls surface temps, and the energies and rate of cooling are under its control, not co2.
“Ask yourself how you choose the best bin size?”
Flag! That will be 15 yards for ignorant use of questions :)
Steven Mosher,
FWIW, Mike’s not nearly as boorish.
Steven Mosher | June 29, 2016 at 12:20 pm |
“Too funny springer has sunk to Flynn levels.”
Sadly it would require a rise for you to get to that level.
So there.
Boorish is a compliment compliment coming from brandonrgates.
Ding!
Next!
ferd – the method you describe isn’t possible. There aren’t enough “ships at sea” (literally) during most of the time since 1880 to give random samples any statistical significance.
samples don’t have statistical significance, but statistics based on samples may.
Is there a point you’re trying to make?
yes, whether the data are useful depends on the purpose of the analysis, the assumptions etc. statistical significance is already sufficiently poorly understood by most people that it is better not to use the phrase inaccurately. It is perfectly fine to say that the ship at sea data is too sparse to add much certainty to the analyses without (mis)using jargon terms.
Alchemy, or how you may turn our rock into gold.
Too funny springer.
Quiz time Springer.
1. How many ship records are there starting in 1662?, 1700? 1800?
2. Given the correlation structure of SST how many records
do you need to get the errors due to spatial sampling down to .25C?
3 show your calculations and your sources
Mosh:
You dont need to make a pot of stew to note that the stew in front of you tastes crappy.
Oh my. The point appears to be that Dik is a pedant.
Mosher you can find the answers to your questions here:
https://judithcurry.com/2011/06/27/unknown-and-uncertain-sea-surface-temperatures/
Thanks for asking!
Quickly Dikky! Wikidpedia needs your pedantry. It reads, in the first paragraph no less:
“the data are said to be statistically significant at given confidence level”
https://en.wikipedia.org/wiki/Statistical_significance
According to you data have no statistical significance. Get busy boy.
So much wrong here difficult to start but point one would be recognising the intent of climate paper authors. Kevin Cowtan has produced a number of papers now with good maths and clear intent
Random sampling of temperature data also removes the problem of anomalies, time of day observations, station maintenance, etc., etc. For example, if you simply choose a sample at a random station, without regard for time of day or time of year, you will as you sample the readings end up with an average over all times of day, over all seasons.
Using equal sampling by surface area you end up with a true average, not an anomaly, that represents the true average of the globe, from which you can be sure is normally distributed and can be analyzed by standard statistical methods.
Something that is not possible with the current approach, because you cannot be sure that infilling and homogenization preserves the underlying distribution, and you cannot be sure that the underlying data itself is normally distributed.
However, by using random sampling instead, you can take a non-normal distribution are turn this into a normal distribution, which can be reliably analyzed by standard statistical methods.
ferd – that method won’t correct for systematic changes like TOB or MMTS it only works for random sources of bias. The data is simply insufficient for the task being asked of it namely global temperature trends in the hundredths of a degree C per decade. No amount of correction can fix that underlying problem. This is why the only records I find remotely trustworthy are satellite MSU and ARGO diving buoys. The latter is far too short in duration to draw any conclusions and the former is too short to ferret out long term natural trends such as those that drove the Roman and Medieval warm periods. The modern warm period may be mostly or entirely due to the same natural causes as the other warm periods in recorded history.
Eh, unfortunately due to the many layers of processing that the satellite data goes (each with its own associated uncertainties) and the fact that we usually only have one satellite up at a time with little time for cross-calibration, the satellite data is even more uncertain than the surface measurements. There’s substantial evidence behind that.
On top of that, adjustments to the satellite records over the last decade have been significantly larger than changes in the surface record. The satellite records are still very much a work in progress, and their recent history demonstrates this.
Hell, Spencer hasn’t even released the methodology for his latest version, and it’s been out, what, a year and a half?
Back up your claim, Benny. You made at least one mistake in what little you wrote: “the fact that we usually only have one satellite up at a time”.
In fact we almost always have two up at one time and in recent years four.
http://images.remss.com/figures/missions/amsu/satellites_used.png
The fact is that there are two independent teams turning raw MSU/AMSU data into time/temperature series. These two teams come up with results that are substantially similar and most certainly in close enough agreement for both to useful. The differences usually amount to splitting hairs. Moreover these satellite measurements and trends are cross-checked with balloon soundings and other data sources.
Try again, dopey. And this time see if you can come up with some kind of retarded argument why ARGO isn’t far superior to any other SST records too.
Benjamin Winchester,
Regardless of how many satellites are or are not recording this or that, the fact remains that surrounding an object with CO2 does not increase its temperature at all.
Or maybe you have some repeatable scientific experiments to the contrary?
I didn’t think so.
Enjoy the fantasy. It obviously provides you with more solace than reality.
Cheers.
No, there’d still be a problem with time-of-day bias, with hot days getting double-counted when you sample in the afternoon and cold days getting double-counted when you sample in the morning.
There’s been a shift from sampling at one time of day to the other, so this would still show up. It’s a systematic bias, not a random one, so it wouldn’t go away with random sampling.
Plus, I don’t really see the benefits to random sampling. It’s really not that hard to adjust for the spatial density of your measurements, and it doesn’t require that you throw out so much of your data.
Climate risks obviously decrease with kind global temperature?
–
If they are referring to climate risks with increasing global temperature , not specified, one must point out that climate risks also oncrease with decreasing global temperature .
–
Absolutely foolish comment as “risk” here equates to any change in climate from what Mr Richardson et al has deemed normal. And it cuts both ways.
Any change up or down from normal is a risk.
1% increases for 70 years is a 70% increase, not a 100%.
A small but important quibble.
Yes we all know they mean a compound 1% but they did not state this clearly. 1% increase usually used refers to 1% of the base CO2 load.
Using this pseudo maths means a 200% increase in 140 years and a 400% increase in CO levels in 210 years which shows how unscientific this sleight of hand assumption is.
angech,
If everyone knows this, why is this even an issue?
I did explain.
To be clear 1% and 1% compound are two different creatures.
You and I and most researchers us a 1% increase per year to mean a 100 years to achieve a doubling of CO2.
To slip in a compound increase shortens the time frame and makes the doubling scarier as it comes on more quickly.
The problem with doubling at a compound rate is that it generally becomes unrealistic, an exponential spike, which has great scare value but is impossible.
Double it a few more times and the world would have to be covered in cars all running all day to give the required CO2 output.
angech,
It makes very little difference. The 1% per year is simple a standard way of determining climate sensitivity; it’s not intended to illustrate how quickly we will actually double atmospheric CO2. If you did it more slowly, you would get a slightly higher TCR, but it would have no effect on the ECS.
“IPCC Fourth Assessment Report: Climate Change 2007
The Physical Science Basis
In AOGCMs and non-steady-state (or transient) simulations, the ‘transient climate response’ (TCR; Cubasch et al., 2001) is defined as the global annual mean surface air temperature change (with respect to a ‘control’ run) averaged over a 20-year period centred at the time of CO2 doubling in a 1% yr–1 compound CO2 increase scenario
—
oops, apologies ATTP and Ben and Mr Richardson
they do compound increase,
how bizarre.
angech,
Why? Since forcing increases as roughly the log of concentration, exponential growth in concentration should yield a constant increase in forcing … which I’d think is more desirable than an exponentially decaying forcing over time as concentration increased constantly.
By using the surface stations as a reference point. I select stations that sample for a complete year, and only include those, a full year of samples. I then calculate the solar forcing at that station based on Latitude and altitude. Then I compare that to how surface temps change at that station deltaT/deltaF
I then average these values by area, in this case like latitude bands since they will have like forcing.
No made up data, no infilling, no homogenization. I’m now looking at three different time scales, daily change, seasonal change, and then the last 50-60 years, as station coverage before 1940 is junk.
https://micro6500blog.wordpress.com/2016/05/18/measuring-surface-climate-sensitivity/
“Water warms less than air”
What a perfectly true and basically useless observation that is.
And actually put forward as a reason?
–
Water also cools less than air
–
Hence its energy uptake and release is immaterial to the air temperature which is regulated by the energy received by the sun when it is shining.
–
(Yes there are a lot of quibbles, folks, it’s a blanket general observation)
but anyone who puts up one sided equations like water warms less than air as a reason?
It’s actually quite significant,
Enthropy for US SW deserts at max temp averages ~28kJ/kg, and drops a little over 14kJ/kg over night, the entire tropics 23S to 23N average is~74kJ/kg and drops under 9kJ/kg.
It’s about the longest day of the year here, it’s the 2nd Sunny day in a row, and it’s still 69F out and the forcast is for 77, yesterday’s max was 80, 3 days ago, it was Sunny as well, it was 95, the differences was where the air came from, Today we’ve got Canadian cool dry air, Monday it was humid tropical air. Solar forcing is on max, and it was clear skies.
This is how the stadium wave or like actions alter surface temps, the ocean surface temperature patterns set the path of the tropical air as it moves poleward. This is what caused the step after the 97 El Nino, and it impacted 20 to 30N, those are the surface stations that caused the GAT increase. I still have to break that band into smaller pieces to see where in that band, so look for where that air comes from and see what changed there, that’s the cause of the step.
micro6500 |
“It’s actually quite significant” – Quibble*
–
The water is there. It heats up less than air and cools down less than air.
Its effects and actions are all known hence why I said it is immaterial.
–
It is a fiction to say that the effects of water on air were not known and can suddenly change to make a 24% difference in heat energy in the world that everyone else has missed.
“air-temperature warming is 24% greater than observed by HadCRUT4 over 1861–2009”
Using a micro back of an envelope calculation that 24% extra air warming missed over 148 years equates to an 0.0000000001 rise in the total sea temperature over that time.
Puts it in perspective somewhat?
“It’s actually quite nano insignificant”
Warm water vapor is created in the tropics, air currents carries it inland to cool, the energy it carries is enough that 1,000 miles from tropical waters, it can still raise my daily temperatures here 15-20F for weeks at a time.
As this water vapor moves inland, it is affected by the same forcing as the air around it , but it also has more thermal mass than the air around it.
That’s that I tried to put a number to. The fact that it’s not changing the OHC that is nothing but a made up guess is immaterial, we live on land. And this water makes a big difference to surface temperatures, it controls how much it cools at night, the energy of co2’s forcing is insignificant in comparison. In electronics, a parallel path once it is around 10 to 1 or more is insignificant, and at 100 to 1 it’s effect on the output is ignored. If my estimate is correct, the water vapor of one cubic meter of air is of the same order as 10 hours of 3.7W/m2 radiation, and there are a lot more cubic meters of air around me. Co2 when compared to the energy involved in the daily warming and nightly cooling of the water vapor in the atm is an insignificant parallel path, and this explains why when you look at the dynamic response to the daily input of kilo J’s of energy from the Sun, there’s no sign of it.
What we proclaimed originally as global warming is nothing more than a reordering of where the ocean warm spots are and their effect on the trade winds and where all of the water laden air goes.
“Wider uncertainties in radiative forcing recently”
Real science reduces uncertainties, generally.
The speed of light, estimated, got better and better.
Thermometers got so accurate they threw those glass based rubbish ones away.
Now we find wider uncertainties , very helpful if you need to stretch a shrinking TCR estimate into a failed IPCC estimate.
Enough for tonight other then to say when you are in a hole, keep digging Mr Richardson.
“Real science reduces uncertainties, generally.”
Generally perhaps, but often the source of substantial progress in science comes from finding out something you didn’t know you didn’t know. The actual uncertainty was just as high before you found out about it, it is just that it wasn’t included in your previous estimation of the uncertainty. In other words science isn’t increasing the uncertainty, it is just increasing your knowledge of the uncertainty that was there all along.
Thanks
the source of substantial progress in science comes from finding out something you didn’t know you didn’t know.
True
” The actual uncertainty was just as high before you found out about it, it is just that it wasn’t included in your previous estimation of the uncertainty”
–
Beside the point really.
Unknown Unknowns and all that sort of thing.
You are correct that progress is in finding new things.
This does not relate to actual uncertainty in something else unless there is a link.
If there is a link then your comment is one of three possible outcomes.
The new knowledge will either reduce the uncertainty [most likely],
increase the uncertainty [less likely] example being the uncertainty of glass thermometer temperature accuracy when MMTS came in
Or keep it the same as before [highly unlikely].
The problem here being that new relevant knowledge ie having a link is most likely to make a perturbation away from the status quo.
Hence “Real science reduces uncertainties, generally.”
and “”Generally perhaps”
angech wrote “Beside the point really.”
No, I was pointing out your misunderstanding. The inherent uncertainty in the actual physics is what it is and no amount of science ever increases it, only our knowledge of the uncertainty. However I have had enough dealings with you already elsewhere to know that you are incapable of admitting your errors, so I’ll leave it there thanks.
Dikran
“The inherent uncertainty in the actual physics is what it is and no amount of science ever increases it, only our knowledge of the uncertainty. ”
Lovely sentence.
Everyone here obviously agrees with you.
–
“I have had enough dealings with you already elsewhere to know that you are incapable of admitting your errors,”
See angech | June 29, 2016 at 9:57 pm | above.
“oops, apologies ATTP and Ben and Mr Richardson ”
where I admitted one error.
I admit I do not like admitting when I am wrong, it hurts but I do try and have done so elsewhere in the past.
It does hurt..
I have yet to see any admission of errors on your part elsewhere which must be due to the fact that you do not make any.
–
“New knowledge will either reduce the uncertainty, increase uncertainty
or keep it the same as before.”
Both the fact that you do not make any errors [only other people]
and the chance of new knowledge making no change in uncertainty suffer from the same flaw.
Uncertainty is the question. You can take this paper two ways.
Deficient observations agree with conjured models – at least within the range of a few of the better known unknowns. Fine. With good math and clear intent you can prove anything.
However, does this study show that any of this is particularly useful? Or does it primarily underscore the enormity of what we don’t know?
All of my work uses the data we have. If there isn’t a station there, we do not know what the temperature is. As part of my work I do create a station map that can be loaded into google maps.
A thermometer covers, eh, a square inch of the Earth’s surface? So even if you had a million billion of them, you’d still only cover one-trillionth of the Earth’s surface area: 0.0000001%.
Man, if only we had some way of figuring out what the temperature anomalies were *between* thermometers. I wonder how the Weather Channel does it? ;-)
Benjamin Winchester,
The point is that it is a completely pointless exercise. If you need to know the temperature at a particular place, you measure it there, as precisely as is necessary.
As an example, an aircraft pilot might need to know the air temperature to set takeoff thrust, and to calculate lift parameters. The aircraft will have suitable sensors fitted. The airfield thermometer will suffice for some purposes. Temperatures 20 m, or 20 km distant, may not be relevant, and therefore not needed.
A network of near surface air temperature thermometers is a waste of time and money. It alters nothing, but obviously is of passing interest to many, such as the climatological measurebators.
Oh look! A temperature! How exciting!
Cheers.
The airport 30 miles away is 0 to 5F different than the local temp depending.
And temperature is not a linear field, it’s a nonlinear field, how do you infill a nonlinear field? And then Devine the average has gone up?
Here is the method that gets the most useful data.
I start at t0 at the minimum measured temp at a baseline of 0, from this point I log how much temps goes up, now I calculate the number of kWhr at that spot. So that energy raises them temp some amount, calibration is with itself. It could be low, could be high, but there is no way to validate what it was. After max temp, input energy is turned off and it cools, measure to the min temp. On average, the temp goes up, and then falls about 18F. Measure the same for a year, it should return to 0F. This station should return to zero. Now, some end a little high, some a little low. As long as I only include stations that collected a full year, and you can average a bunch of these together. Then you can say these 100 stations went up, or didn’t. But not only can you look to see if min temp went up over a year, you can look at max separately. So for my yearly reports, only stations that have at least 360 days, which all have 365 or 366. Now stations drop in and out, but where there are large collections of stations, unique events average away, trends across many stations show up. Areas with few stations have larger effects from a single measurement. I do a bunch of different sized areas to manage this, but it only impacts undersampled areas, and at least you know.
Now I also look at the rate of change twice a year, warming and cooling as the length of day changes, from this I can calculate climate sensitivity, see if cooling rates have gone down over the years, whether it’s min, max or both, and global or not.
And what’s actually measured is that max temp walks around 0F change, and there are larger changes to min temps, but the happen at different places at different times. But even here the global average is near zero.
There is a slight change in the slope of the seasonal change, but it’s not clear if it’s a trend or cycle. I just added a sensitivity analysis and that located where the step after the 96 El nino came from 20N to 30N latitude, the sensitivity takes a jump there alone about 97 – 98.
Man, the satellite data must be useless, then. They “measure” the temperature from hundreds of miles away, and then that data are run through model after model in order to get some output.
Any continuous function can be approximated by a set of linear functions. I mean, hell, that’s the basis of calculus, if you really go into it.
Plus, you could just use non-linear interpolation. This is old math; developed in the 1700s and 1800s for the most part. You can do quite well with piecewise polynomials, though Fourier series converge much faster for mathematically smooth functions.
Anyways. With even half-decent data, the mathematics of interpolation isn’t very complicated. You get associated uncertainty bars back out. Berkeley Earth’s methodology paper is pretty good, and not too hard to follow if you understand the underlying mathematical concepts (which you can learn, if you want to).
I never got why climate skeptics were always in such a tizzy over this stuff. It’s just math.
Yes. Very clearly, yes, the average has gone up.
Really? You don’t have any measurements for the area that’s missing measurements, where do you get the piecewise polynomial to make the field up? That’s the point you don’t know what it is in the first place and it is always changing.
But I wonder where that came from, as the stations themselves did not record a positive trend.
https://micro6500blog.files.wordpress.com/2016/07/global-trend.png
Benjamin Winchester,
You wrote –
“Man, the satellite data must be useless, then.”
Is this just another Wayward Witless Warmist attempt to deny, divert, and confuse, or are you feebly attempting to be sarcastic?
I’m not sure why you think satellite data is useless, but what relevance has your weird statement to my comment?
If I failed to express myself sufficiently clearly for you to understand, please let me know. Maybe you didn’t actually read what I wrote?
CO2 heats nothing. No network of thermometers, nor toy computer models, nor furious and frenetic hand waving, will make it otherwise.
Cheers.
“A thermometer covers, eh, a square inch of the Earth’s surface?”
Benny finally reveals an area of expertise; reductio ad absurdum
Good for you, Benny! What other talents do you have?
micro6500:
We do have measurements in the area – e.g., the surface of the Earth. Finding how well you can use them as parts of an interpolating function is a fundamental part of the methodology.
How does the doctor know what your core temperature is, if he didn’t measure it, but stuck a thermometer under your tongue? Think it through. I mean, really, think it through.
How would *you* measure temperature? And how would you show that the resulting spatial average is robust?
When you can answer these questions for *yourself*, you’ll understand how scientists do it. Or, you can cheat and go read Berkeley Earth’s methodology. Or books on statistics and numerical methods.
This isn’t a trick. Even with a billion thermometers, we’d cover very little of the Earth’s surface. So you need to understand how we’d take those billion thermometers – which is actually waaaaaay more data than we’d need – and calculate the resulting temperature anomaly. The key point comes down to how well temperature anomalies are correlated over distance.
Mike Flynn:
Nope, not sarcasm. You said that if we wanted to measure a temperature somewhere, we should measure it there.
Satellites don’t do this. It’s not like they have a thermometer hanging off a rope down the side. Rather, they extrapolate the temperature based on the amount of light that hits some sensor, with the help of some very complicated models.
Benjamin, “How does the doctor know what your core temperature is, if he didn’t measure it, but stuck a thermometer under your tongue? Think it through. I mean, really, think it through.”
He could stick a thermometer under your tongue, under your arm pit, in our ear or up your rectum and get a reasonable estimate of your core, however, laying a thermometer on your head is likely to be a lot more variable. The method being discussed is a bit like interpolating body hair patches.
Ayep. And you’d want to quantify that variability, yah? Look at how well-correlated the different measurements are to core temperature, and to each other? Maybe these might be important?
Nope. The analysis doesn’t support that.
C’mon, guys, all of this is laid out in the methodology papers for the different temperature sets. You can go look up Berkeley Earth’s methodology, and go over it with a fine-toothed comb. You can read some textbooks on statistics and numerical methods, and understand this for yourself.
If you think that the uncertainty estimates produced in BEST’s work are incorrect, you need to give a mathematical justification, not just a handwavey “I don’t like interpolating”. I’m tired of what are basically appeals to emotion, people just distrusting the interpolation instead of actually doing the work of understanding the math, and then seeing if there’s a problem.
No, I’ve done the work with the data, and I’ve seen how sparse and poorly sampled it is. And no, I don’t trust you can tell me the temperature of a place that has never actually been measured, let alone anyplace within a few hundred miles of it, and the ocean surface is worse, and it’s depths are basically nonexistent. I’m more a quantum mechanics guy, there isn’t even proof it exists if you don’t measure it.
I believe it’s there, but not that you or anyone can guess it’s temperature.
Cowtan at the University of York has a post on the background. http://www-users.york.ac.uk/~kdc3/papers/reconciled2016/background.html
“The next largest effect is the use of sea surface temperatures rather than air temperatures in the observational record. If the climate models are analyzed using both sea and air temperatures rather than air temperatures alone (as required by the formal definition of TCR), the temperature change is reduced by a little under 5%.”
About 5% of the impact is the over sea ice air temperature versus water temperature at about -2 C degrees. Most of the “warming” here is from less than -30 C by about 4 to 6 C degree in winter months known as Arctic winter warming. One degree temperature change at -30 C has an effective energy change of about 3.2 Wm-2/C with little to no latent energy and extremely low specific heat capacity. Warming in the tropical oceans at 27 C has an effective energy change of 6.16 Wm-2/C plus considerable latent energy and much higher specific heat capacity, this is like a rectal thermometer and should carry a lot more weight than the temperature of your Arctic explorer cap.
Benjamin, “Nope. The analysis doesn’t support that. ”
That is exactly what the analysis is doing.
99.99999% of the US’ surface has not been measured. Do you think that we can’t tell you the temperature anomaly (with error bars) anywhere in the US, even a mile away from a dozen thermometers?
What’s the mathematical justification behind that? Because the data says I can interpolate. And the uncertainty in our knowledge will be rolled into the uncertainty in the final product. And you use out-of-sample testing to check whether your results are solid or not. They are.
Give me the actual mathematical reason for why we can’t do this. Tell me what you think is wrong about Berkeley Earth’s methodology.
This is what’s so weird for me about this discussion. Climate scientists use the same math as the rest of us in science and engineering fields, and yet skeptics have a big problem with the results of climate scientists and not the other fields. I’ve yet to meet someone who’s actually gone through the math and understood it, who also thinks the surface temperature series are unreliable.
And you’ll say “I understood it” – that’s great! So tell me what part of the methodology you think is incorrect, and why.
First, I don’t advise my customers to auto fill any of their missing item attributes, unless reviewed by someone who should know the proper value, otherwise people will come to distrust the data, and it will degrade more and more. In electronics design, we didn’t infill, nor do I make up intermediate results for places I’ve no measured.
I get you can take an unknown topology and create linear equation based on the values you have and define the topology, but you have to have an equation, and weather in a non-stationary, non-linear field with complex behavior.
Tell me does a cloudburst between stations get detected and it’s change in temperature recorded and placed in to the global average, or is it replaced with a linear field from someplace that it missed?
Let me expound a little. The US since 1950 isn’t too bad, and pretty good after about 1980. Eurasia isn’t horrible either, the polar areas are poorly sampled, you need 2x the frequency of any sine wave you wish to sample, the Nyquist limit. And the Southern Hemisphere is poorly sampled even now. And that even ignores sub-sampled events that appear and disappear and at best are treated as noise, instead of as part of the local macro climate.
And it’s only Climate Science that is asking to turn the entire world economy upside down at a cost of a lot of trillions of dollars, while at the same time keeping the energy poor energy poor, and climate scientist seem he|| bent on making everyone energy poor.
Benjamin Winchester: “Climate scientists use the same math as the rest of us in science and engineering fields”
Really?
You could have fooled me.
I just thank Heaven that you climate “scientist” lot are never entrusted with anything critical, such as designing airliners, or even shopping trolleys, come to that.
Tell me Benny, would you let your wife and kids ride on an airplane that had been designed by the likes of Mann, Hansen or Schmidt?
Over the timescales we’re talking about (months+), short-term temp anomaly variations like that wash out. Correlation between temperature anomaly data is a lot weaker over day-to-day timespans, and pretty robust over month-to-months.
It’s kinda like switching to a healthier diet, and then measuring your weight. If you look at the diet’s effects every half-hour for the first day, you’ll see a lot of fluctuations that don’t have anything to do with the long-term trend. But if you check twice a day over a couple months, then you can actually see what effect the diet is having. The timescale matters.
You “have to have an equation”? I don’t follow. T
Rather, you determine the relationship between stations from the data. The data tells you this, and it tells you how robust these relationships or correlations are.
If I follow Moshers posts, they create a climate field based on latitude, altitude, and minor adjustments based on thinks like how close to the ocean it is. What is measured different than this field, is weather. Then this field is used to fill in everywhere. First daily mean temp is calculated, as opposed to min and max which while they might not be the min or the max, they are the best measurement we have. So out of band testing, you can’t just take the daily mean temp, you have to make it compatible with the field.
Use to rain (most)every afternoon about 3pm where I lived in Florida, visiting years later a comment was made they went away, and then a decade after that someone else mentioned they just moved. Made sense.
Now say you have a line of thunderstorms that has a regular track, there isn’t many places where a move wouldn’t hit a different pattern of stations, and I can contrive cases where it makes a big difference, climate isn’t devoid of weather, it’s weather averaged over long periods of time, and there are places with regularly chaotic weather, I live in one, the jetstream moves the dividing line between Polar and Tropical over top of my house, this moved north of me for the last handful of decades, we got a higher percentage of tropical air as compared to my childhood, poorly spaced stations can’t discern movement between stations, and it isn’t linear, that’s the equation we don’t have, we don’t have an equation to calculate where that dividing line is, unless we measured it.
The best we can do is look at what we recorded and say this number of stations in this area changed by this much.
After spending many an evening setting up my astrophotography gear, and logging how fast temperatures dropped, I found it more and more preposterous that while the temp can drop 4 degrees in an hour, it couldn’t get rid of a measly degree K or so.
So I wanted to see what was measured. I don’t preclude it’s warmed some, just that the signature of which stations recorded what changes could not have been from a slow forcing.
But how can we know what the temperature is for most of the US, when we’re not measuring it there? ;-)
Yeah, but we’re not trying to measure the frequency of a sine wave. The Nyquist limit isn’t really relevant here.
But yeah, the polar areas and Africa are poorly sampled, which is why different data sets attack them different ways: leave them out, interpolate but include the resulting uncertainty, cross-check against satellites. You can see how big of a result these different methods make in the final results.
Still, you can’t just say “well, the data is too poorly sampled” based on subjective judgment, and then throw up your hands. The scientific thing to do is to actually go and check how bad the sampling is, look at the resulting uncertainties are, and see if it actually is too poorly sampled. Let the data tell you what to believe.
Yeah, but either these methods are sound or they’re not. And I mean, they’re pretty plainly sound, which is why they’re in so wide use in other fields.
I’m just pointing out the inconsistency of ‘skeptics’ here, most of whom don’t even understand the techniques. They just hear “the government is making up data”, and that plays to their biases, so they accept it, and they don’t bother to actually check.
This is not skepticism; this is not a scientific attitude. It’s confirmation bias. When you go and check the data and the methods, you’re forced to acknowledge that they’re perfectly fine. That changed my mind, and it’s changed a lot of others.
They are not valid except for short distances in the field of climate. That is why accept that for the US for some years it’s measured enough to be useful.
Where did I do that? I selected a methodology that complemented the data we have and have spent 8 years working on it, including a cheap weather station and an IR thermometer. Specifically looking at the difference between today’s warming and tonight’s cooling.
https://micro6500blog.wordpress.com/2015/11/18/evidence-against-warming-from-carbon-dioxide/
https://wordpress.com/post/micro6500blog.wordpress.com/91
No you’re not, you’re repeating nonsense that fits your world view, you have no idea about my scientific attitude.
“99.99999% of the US’ surface has not been measured.”
Winnie Winchester doubles down on teh dumb.
Hard to believe, isn’t it?
The last word of the headline has a typo, “observatiions”.
Recent observations of Earth’s energy budget indicate low climate sensitivity. Research now shows that these estimates should be revised upward, resolving an apparent mismatch with climate models and implying a warmer future. ….
It great when a person of average intelligence, like myself, has all these really smart people agreeing with me. Us C students can have hope. I’ve said many times here that CS is not low, and that we’re in the midst of a big heatwave. My crayons have demonstrated these things many times.
No, they’re also people of average inteligence.
Delude on.
JCH
“we’re in the midst of a big heatwave.”
Latest Sea Ice and Global Temperature contents:Moyhu
Check with Nick
Put up your latest monthly graphs
NCEP/NCAR reanalysis surface temp anomaly area weighted global average made 2016-06-30
Shows the global temp falling for the last 5 months
“we’re at the end of a big heatwave.”
and it is only going to get colder.
Of course it’s falling. We’re still in the midst of a major:
https://www.youtube.com/watch?v=XE2fnYpwrng
Next up, the hottest La Nina in the instrument record. So hot they may rename it La Lolita.
Looking at the nearest 6 rankings (+3/-3) in this season gives us three El Niño cases that kept going into the following boreal fall and winter (’87,’97, and ’15), and three that barely eased into a neutral state (’92,’93, and ’14). On the other hand, the higher-ranked 1998 case transitioned into La Niña before the end of that year. I still believe that one should not discount the possibility of an ENSO-neutral outcome, while the next couple of months should still see at least weak El Niño conditions. …
El Niño conditions were considered replaced by ENSO-neutral conditions as of the end of May, and a “La Niña” watch was hoisted for boreal fall and winter 2016-17 with 75% odds. While I do not believe that the odds are that high, La Niña is certainly anticipated in most forecast models. … – Wolter
Up the down-escalator we go!
Say it with me: “No cooling since 2016”.
JCH | June 29, 2016 |” So hot they may rename it La Lolita.”
How very appropriate, All this talk of the oceans.
Lolita – Sailor, Your Home Is The Sea (U.S. hit version 1960)
Don’t get me wrong.
You do put up graphs, you do argue well, I just want to have a little fun every time the temp goes down for the next 2 years same as you did when it went up.
We’re still in the midst of a major? big heat wave??
No the current heat wave is over.
“Next up, the hottest La Nina in the instrument record.”
every time the temp goes down for the next 2 years we will talk about the cooling of the planet.
It is getting coooooler. Enjoy.
JCH writes: “It great when a person of average intelligence, like myself”
Maybe the average in the Appalachian mountains. Don’t flatter yourself.
Could’n the writers skip such a sentence: “Climate risks increase with mean global temperature”. Especially when they do not explain how and why.
If it is a common believed fact then it is not needed. If it is not, then an explanation would help.
Thought about this paper some more in light of many interesting comments.
In effect, it is reconciling energy budget sensitivity to climate model sensitivity by arguing the surface temperature records understate past warming because of surface coverage problems (another version of the heat is hiding where we cannot/have not measured it. Another variation on Cowtan and Way.
But, since 1979 we have had essentially full coverage of the globes lower troposphere in three satellite records, the best known being RSS and UAH. No unmeasured ‘hiding’ heat. And both run slightly cooler than HadCrut4, GISS and NCEI (although with almost identical shapes over time. Figure 1 in essay When Data Isn’t plots the comparisons through mid 2013. So the missing coverage/missing heat idea fails observationally. The observational energy budget models based on surface temp records are OK.
The paper also argues that by sampling the climate models in a way that mirrors the missing surface coverage, the observational/model sensitivities can be reconciled (in effect, partial model coverage has lower sensitivity than full model sensitivity). But this overlooks the well established fact that CMIP5 models do not have much regional skill, that regional downscaling basically fails to reproduce regional ground truth no matter which way it is done. See, for example, Pilke Sr. EOS 93:52-53 (2012). Removing ‘missing’ modeled surface coverage is in essence ‘negative regional downscaling’. Known not to work well.
Finally, the reconciliation assumes the CMIP5 models have temperature skill. They do not. By either the BAMS 2009 test (15 years) or the Santer 2011 test (17 years) the pause shows the models to be invalidated (except for Russia’s INMCM4, which also has the lowest ECS in CMIP5, see Sherwood et. al. In Nature 505: 37-42 (2014). Separately, the modeled tropical troposphere hot spot is missing. This is most apparent in various versions of Dr. Christy’s famous balloon/sat versus CMIP5 charts for the tropics. To which Gavin Schmidt vociferously and incorrectly objected. See McIntrye’s two recent posts rebutting Gavin rather thoroughly. So the foundational assumption in this paper about model quality is also erroneous.
All three lines of thought argue this new paper is probably just wrong.
ristvan | ” Another variation on Cowtan and Way.”
–
Kevin Cowtan has produced a number of papers now with good maths and clear intent.
–
Ristvan, the good that comes out of this paper is that it adds to the pile of excuses made for models not matching reality.
Along with the other 40 plus reasons already advanced.
At some stage like a strawbale the increasing weight of false excuses will get so heavy that it will spontaneously combust.
We can only hope that many more papers come out like this so it happens quickly.
“No unmeasured ‘hiding’ heat. And both run slightly cooler than HadCrut4, GISS and NCEI (although with almost identical shapes over time.”
Wrong.
“No unmeasured ‘hiding’ heat. And both run slightly cooler than HadCrut4, GISS and NCEI (although with almost identical shapes over time.”
Right.
I would say that this is much about the measurand – and in particular about the definition of the measurand. As defined in Guide to the expression of uncertainty: Measurand – particular quantity subject to measurement.
And I believe we should be very interested in the definition of this measurand – simply because we depend on a proper definition to be able to compare apples with apples. Without a proper definition – we will not be able to compare a a record of measurements with other attempts to quantify the same feature – in a useful way. Also, we will not be able to compare model predictions with observations – in a useful way.
As stated in Guide to the expression of uncertainty:
1.2 This Guide is primarily concerned with the expression of uncertainty in the measurement of a well-defined physical quantity — the measurand — that can be characterized by an essentially unique value.
And why is the guide concerned with the expression of uncertainty in a well-defined physical quantity? It doesn´t say – and it doesn´t have to be said – simply because it would be absurd to expect a standard for expression of uncertainty in a poorly defined physical quantity.
I think the climate industry has only started at scratch this issue – simply because the climate theory industry has not adopted international guidelines and standards which are adopted by more mature industries.
One of these standards is: ISO/IEC Guide 98-3:2008 Uncertainty of measurement — Part 3: Guide to the expression of uncertainty in measurement (Freely available). Another of these standards is the accreditation standard, for official recognition of independent laboratories: ISO/IEC 17025:2005 General requirements for the competence of testing and calibration laboratories.
These are the kind of standards enforced upon industry which is emitting even tiny amount of CO2 under European Emission Trading Scheme. And – absurdly – these are the kind of standards the climate industry, the industry providing the basis for the regulation of CO2 emission fails to fulfill.
Personally I find it hard to believe that Guide to the expression of uncertainty in measurement should not be found suitable for the climate industry as that standard was developed in cooperation by:
Bureau International des Poids et Mesures; IEC International Electrotechnical Commission; IFCC International Federation of Clinical Chemistry ; ISO International Organization for Standardization; IUPAC International Union of Pure and Applied Chemistry; IUPAP International Union of Pure and Applied Physics International; OlML Organization of Legal Metrology.
I wish governments and the climate theory industry would adopt the standards developed by more mature scientific organizations and also imposed by Governments upon the industry through a wealth of regulations.
Science or Fiction
“I would say that this is much about the measurand”
and the measuree.
Kevin Cowtan has produced a number of papers now with good maths and clear intent.
Thank you, I have been preaching that for years, with little apparent effect.
Geoff
‘Finally, if the reported air-ocean warming and masking differences are robust, then which global mean temperature is relevant for informing policy?’
None of them is relevant for policy. Nobody cares about sea surface temperatures. Nobody cares about sea air temperatures. Nobody cares about Arctic temperatures.
(Yes, I know Greenland is in the Arctic. It’ll be safe for thousands of years no matter what we do).
(Also: nobody cares about polar bears. They are doing fine, I know – but if they were dying in droves nobody would care).
What this paper is saying is that the increase in global surface air temperature since ‘preindustrial’ times (circa 1870) is 20-30% higher than previously reported… but somehow nobody noticed. It’s hard to think of a better argument for the irrelevance of this metric.
The only thing we care about is the effect on mankind of said temperatures – and since most of us don’t live in the oceans or the Arctic, these effects are going to be negligible even if the trend (whether cooling or warming) is steep.
Let’s look at the effects of these temperatures:
Heat-related mortality is declining.
Weather disasters are getting more expensive, but they’re actually declining as a share of GDP. 2016 is looking like a record low, after a near-record (low too) in 2015.
Sea level is rising, and the rise is accelerating (or at least has accelerated), but this won’t be a problem for the remainder of the century and probably beyond.*
Crop yields are rising, thanks in part to technology and better agricultural practices, but also to warming and (especially) CO2.
The warming is concentrated in the high latitudes of the northern hemisphere, at night and in winter. Surely Siberians won’t mind a couple more degrees.
Infectious diseases such as malaria are getting less deadly and widespread, not more.
Clearly, looking at the effects of warming makes one wonder if we need to do anything. Even the goddamn decline in Arctic sea ice probably looks fine to most of us (more open sea routes, access to oil and gas fields).
The other argument in favor of a temperature target is that it gives policymakers something to aim at. But this is much better accomplished by looking at actual emissions, which are what we control. The best measure of emissions is CO2 (from fossil fuel combustion) intensity of GDP. Said intensity is declining. But, it hasn’t declined any faster in the years since climate policies were enacted. Obviously this metric is rather embarrassing for the emission budgeters.
*If you disagree, surely you won’t mind betting. I bet not a single island over 1,000 population or town over 10,000 will be abandoned due to sea level rise this century.
Sea level is rising, but the rise is NOT accelerating. What happened was the sat alt SLR reads higher than geostationary and/or geocorrected by differential GPS long record tide gauges. Splice the two, looks like acceleration. Equivalent to Mann’s Nature trick. Look at long record quality tide gauges alone, no acceleration. Look at short record sat alone, no acceleration. And the sat stuff must be too high for various reasons, since gives rise to the ‘closure’ problem. Sat SLR>>sum of ice sheet loss plus thermosteric rise–by about 1/3. There is no closure problem with geostationary or geocorrected tide gauges. Details and references in essay PseudoPrecision.
Hear, roaring hear! A trivial tempest in a teapot.
My cloud budget plays havoc with my energy budget.
I don’t know how other budgeters make ends meet…though I hear they do it by just not having a cloud budget. If anybody mentions the woolly things overhead the energy budgeters just change the subject to impacts of climate change on badminton or Mars Bars…or threaten with RICO.
– ATTC
IPCC does not highlight that a central estimate for the energy imbalance – the current net energy accumulation on the Globe – is 0.6 W/m².
(Wikipedia: Earth’s energy budget Earths energy imbalance
And IPCC does not highlight that the central estimate for current total feedback from clouds alone is also 0.6 W/m².
(WGI; AR5 – Figure 7.10 | Cloud feedback parameters)
That doesn´t leave much room for radiative forcing from CO2.
Nor do they mention that per Stephens et.al. Nature Geoscience 5: 691-696 (2012) the TOA imbalance is 0.6+/- 0.4 while the surface imbalance is 0.6 +/- 17!!! Uncertainty monster bites hard. Essays Missing Heat and Sensitive Uncertainty have more details, references, and links.
Wrong units. That should be W/m^2/C, the amount of feedback for a given amount of warming.
You’re comparing that to the current energy imbalance, but these are apples and oranges. One is the feedback response to a change in temperature, the other is the current rate of warming.
No – it is the correct unit. Check the linked on my site for explanation. W/(m^2*C) (Not W/m^2/C as you write) have to be multiplied with the surface warming since preindustrial times C to get W/m^2.
Right. Which tells you the amount of feedback that we’d have gotten from clouds since preindustrial times.
It’s still not the same as the current energy imbalance, which is how much warming is happening now, as a result of the difference between the forcings and their feedbacks and the resultant warming.
You can’t compare between the two, because it’s not like the cloud feedback only kicked in at the end; it’s been kicking in this whole time, and the Earth has already been responding to it. It’s not like it’s gonna kick in all at the end. A lot of that cloud feedback for 1C of warming is already “eaten up” by the past warming.
“That doesn’t leave much room for radiative forcing for CO2” is… enhh, you’re misunderstanding how this works. CO2 has already caused warming, the feedbacks have already been kicking in, and because of that, the temperature has already risen, which decreases the current energy imbalance.
Current energy imbalance reflects how much warming we have left to go… it doesn’t reflect all of the warming that’s already happened.
Sorry that this took a while – I´m on travel. Besides I like to let things sink in.
This has nothing to do about what has happened in the past or what will happen in the future.
As David Springer said: «Energy imbalance is an immediate measure»
The Unit Watt is equal to Joule per second W = J/s
The functional relationship for energy imbalance (In its simplest form) which relate to here, is about what happens right now:
energy accumulation (W/m^2) = anthropogenic forcing (W/m^2) + cloud feedback * (Temp 2011-1750) (W/m^2) – other feedbacks*(Temp 2011-1750) (W/m^2)
And yes -there might be a million other things going on as well. Let us keep the original figures for simplicity. If the global energy accumulation is currently approximately 0,6 (W/m^2) -and the central estimate for cloud feedback by IPCC is 0,6 (W/m^2) – then it follows that: Anthropogenic forcing (W/m^2) – Other feedbacks* (Temp 2011-1750) (W/m^2) must necessarily be zero.
However, I do not claim that to be true, I have no idea what is true. The only thing I say is that if the estimate for current global energy accumulation, which is based on observed energy accumulation in the oceans, is correct – then the central estimate for cloud feedback must be too high or the central estimate for anthropogenic forcing must be to high or both central estimates must be to high.
Anyhow the central estimates provided by IPCC seem to be too high. Cloud feedback or anthropogenic forcing or both seems to be exaggerated.
Well, I say 3 angels can dance on the head of a pin.
So there!
You can put it another way. Say we held atmospheric CO2 right where it is, and the Earth warmed up a little more, and reached (pseudo) equilibrium.
In other words, say that the current energy imbalance becomes 0 W/m2.
Well, the cloud feedback would still have been 0.6 W/m2/C. That didn’t change, just because we finished warming. Rather, the cloud feedback was part of what caused us to warm that much in the first place.
The feedback tells you how much you’ll warm in response to some forcing. The imbalance tells you how much you have left to warm. They’re not directly comparable.
I admit I struggle to understand this.
Let us say that the cloud feedback effect ( 0,6 W/(m^2*C) was the only thing there were, in a preindustrial period with virtually no CO2 variation, and let us say that we had an el Nino year with 0,2 C of warming, that should then trigger the positive cloud feedback effect. At which temperature increase would it then stop warming?
I guess that what makes it stable is that the effect radiated outwards increases with T^4 (T = temperature). Stefan–Boltzmann law.
Well, after the El Nino, the temps would cool back down by themselves. El Ninos aren’t forcings, so… let’s go with solar instead. Same example; say an increase in solar radiation caused 0.2C of warming.
Then the cloud feedback would cause an additional 0.12 W/m^2 ( = 0.2C * 0.6 W/m^2*C). We need to know how that converts into additional warming. Without any feedbacks, the temperature sensitivity is roughly 0.3 K/(W*m2). So the extra 0.12 W/m^2 from cloud feedback would result in another ~0.036 C of warming. And then the system would be back to “balanced”, at least over climatic timescales.And yeah, as the temperature increases, the outgoing radiation also increases, which is how it balances out.
Benny writes: “The feedback tells you how much you’ll warm in response to some forcing.”
Not even wrong just stupid rambling. Feedbacks can be positive or negative. Negative feedback from snow/ice accumulation (albedo change) is what brings interglacial epics to a close. Positive feedback from melting of same is what drives the change to an interglacial. There is little to no change in planetary forcing from the sun acting as the primary driver but merely a change in how solar energy is distributed across hemispheres and seasons.
Benny, with an as yet undetermined appendage, next writes: “Current energy imbalance reflects how much warming we have left to go”
No, it doesn’t. Energy imbalance is an immediate measure and is subject to change on an immediate basis for legion disparate reasons both known and unknown.
Hi David
Thanks for stepping in. I have now responded to Benjamin Winchester a bit further up in this conversation.
Science or Fiction | July 2, 2016 at 2:21 pm |
Place your long-term bets on 0.0. You’ll be closer than any estimate using CO2 levels as a variable.
Here is link to my little piece on that:
The cloud feedback – alone – is of comparable size to the current global warming!
The link doesn’t work, re-post it please.
https://dhf66.wordpress.com/2016/02/09/without-cloud-feedback-there-would-be-no-global-warming/
Thanks – hope this one works!
SoF,
You’re still making the same mistake. The feedbacks are the feedbacks for the temperature increase since pre-industrial time, while the current energy accumulation is the current imbalance. These aren’t comparable.
Think of it this way. Say that for every dollar you earn, I promise to match it, so the “feedback” on your earnings is 100%. And say you earned $10k last year, so I matched you $10k.
Now say that for the $20k you got last year, you spent $15k of it. So your current “earnings accumulation” is $5k/year. This is like the current energy imbalance.
You see how these are two different numbers, conceptually and in reality? The feedback is $10k/year, but the accumulation is only $5k/year.
We can do the same with the radiation budget. If the forcing increased 1 W/m2 since pre-industrial times, and the feedback increased that another 1 W/m2, then we’d be “earning” 2W/m2 relative to back then. But we also “spend” more, because the Earth has warmed since pre-industrial and warming increases the outgoing radiation. So while the downwelling radiation has increased 2W/m2, the outgoing has increased by 1.5 W/m2, which leaves only 0.5 W/m2 as the current imbalance.
TOA isn’t going to measurably be in balance, the northern and southern hemispheres are almost always out of balance. The first is from Earth’s inclination, the second from the temperature not being uniform.
Also the rate of daily warming is higher than the rate of daily cooling rate so there’s some hysteresis.
“The feedbacks are the feedbacks for the temperature increase since pre-industrial time, while the current energy accumulation is the current imbalance. These aren’t comparable.”
This doesn´t make sense. The values for energy rate provided by IPCC are the current values as compared to preindustrial times (1750).
“C. Drivers of Climate Change
Natural and anthropogenic substances and processes that alter the Earth’s energy budget are drivers of climate change. Radiative forcing14 (RF) quantifies the change in energy fluxes caused by changes in these drivers for 2011 relative to 1750, unless otherwise indicated. Positive RF leads to surface warming, negative RF leads to surface cooling.” (Ref AR5; WGI; SPM).
This is about the current energy rates in W (Joule/s). The functional relationship I relate to is this:
energy accumulation (W/m^2) = anthropogenic forcing (W/m^2) + water vapor, lapse rate and cloud feedback * Temp 2011-1750 (W/m^2) – Planck response * Temp 2011-1750 (W/m^2)
I should add explicitly that, implicitly in my argument, the estimation of current energy accumulation has been based on ARGO measurement of temperatures in the oceans down to 2000 m for the period 2005 to 2015. I will also emphasize that the oceans have been assumed by IPCC to take many centuries to reach equilibrium. In other words, the oceans have just started on their departure from the equilibrium hypothesized by IPCC to exist in preindustrial centuries, the warming of the oceans cannot have started to level off by the theory propounded by IPCC. Hence the current warming should be a good measure for the current global energy accumulation:
«TS.5.5.6 Projected Long-term Changes in the Ocean
… Due to the long time scales of this heat transfer from the surface to depth, ocean warming will continue for centuries, even if GHG emissions are decreased or concentrations kept constant» AR5;WGI; Page 93
And to repeat my argument: As the current energy accumulation is lower than IPCC´s estimate for water vapor, lapse rate and cloud feedback alone the estimates provided by IPCC must be wrong.
While It may take an immensely complex model, comprising both physics and empirical parameters to correctly simulate the climate, I have shown that it only takes pure and simple physics to see that the values provided by IPCC must be wrong.
To be more clear on the second point, the Earth’s surface temperature is not uniform.
Brandonrgates,
Think of it this way.
You put some money in a bank, but overnight it all rots away. The bank replaces your money the following day. The same thing happens.
Then you get a bill from the bank for storing your money. There’s a small charge each time the bank replaces it – an insignificant amount.
After four and a half billion years of this, you’re much, much poorer. Your initial deposit has become worthless, due to inflation.
I usually have no time for pointless and irrelevant analogies, but in your case I’ll make an exception.
You can’t store heat in a vault. It mysteriously vanishes. You can’t store it in the ocean, in the atmosphere, or in a bottle. It’s a manifestation, not an object. You can no more store heat than you can store friction. I know, I know, bad analogy!
It’s interesting to think about though.
Cheers.
Mike;
There’s another “counting” issue: a molecule is either vibrating (heat) or emitting IR. AGW wants both, simultaneously. Double-counting!
More nonsense from the peanut gallery.
SorF,
I think you’re somewhat confused. The planetary energy imbalance is essentially the current energy imbalance after taking all the forcings and feedbacks into account. The change in forcing is about +2.3W/m^2, the Planck response is about -3.2W/m^2/K, water vapour + lapse rate is about +1 W/m^2/K, and clouds (as you say) is about +0.6W/m^2/K. If we’ve warmed by around 1K, then the imbalance would be
2.3 – 3.2 x 1 + 1 x 1 + 0.6 x 1 = 0.7 W/m^2
Just as it is observed to be.
ATTP,
Complete specious nonsense. A point on the Earth’s surface warms during the day. It cools down at night. Winter is colder than summer. And so on.
Over the last four and a half billion years, the Earth has cooled. Talk of forcings is just sciency climatological gobbledegook.
No heating due to CO2. Keep up the sciency talk if it makes you happy. Nature doesn’t care.
Cheers.
As far as I understand the Assessment Report 5 from IPCC. Cloud feedback is an dependent variable correlated to increase in surface temperature since preindustrial time (independent variable).
As the surface have warmed 0,85 K since preindustrial times, in accordance with AR5, this effect must currently have a warming effect on the globe which is caused by the increase in surface temperature since preindustrial times. And this effect alone is of comparable size to the current energy accumulation as observed.
My point is that the central estimates presented in the Assessment Report seem to be wrong, if they are right however, the cloud feedback effect alone can explain the current rate of warming.
SoF,
Again, I think you’re missing the point. Clouds are indeed dependent and respond to changes in temperature. Your 0.6W/m^2/K is a reasonable estimate (I think the range is something like 0 – 1W/m^2/K). That means that warming of 1K will produce a change due to clouds of 0.6W/m^2. However, warming of 1K also produces a Planck response of -3.2W/m^2 and a water vapour response (including lapse rate) of around 1W/m^2. Together this means the overall change is around -3.2 + 0.6 + 1 = -1.6W/m^2. However, we’ve ignored the change in external forcing of 2.3W/m^2, which means the net change in energy balance will be -1.6 + 2.3 = 0.7 W/m^2. That it is numerically close to the cloud feedback is purely coincidental.
And what would the current energy imbalance be if a magic hand took away the cloud feedback effect for a moment?
SoF,
If the feedbacks are -3.2W/m^2/K (Planck), 0.6W/m^2/K (clouds), and 1W/m^2/K (water vapour + lapse rate), then the ECS would be 3.7/1.6 = 2.3K. This means that for a change in forcing of 2.3W/m^2 (what has occured to date), the equilibrium warming would be 2.3/3.7 x 2.3 = 1.4K. We’ve warmed by around 1K, so the TCR-to-ECS ratio is around 0.7.
If cloud feedbacks were 0W/m^2/K, instead of 0.6 W/m^2/K, then the ECS would be 3.7/2.2 = 1.7K. For a change in forcing of 2.3K, this would produce a equilibrium change of 1.1K and a transient response of 0.8K. In other words, we would not have warmed as much.
The planetary energy imbalance would then be
N = 2.3 – (3.2 – 1)*0.77 = 0.6 W/m^2
So, it probably wouldn’t be very different because we would have warmed less.
See response to Benjamin Winchester above:
Science or Fiction | July 2, 2016 at 2:21 pm |
This is what you said:
This is not true. If all other feedbacks bar clouds (and Planck) were 0, then the energy balance would be:
N = 2.3 – (3.2 – 0.6)x1,
where N is the planetary energy imbalance, 2.3W/m^2 is the change in anthropogenic forcing, -3.2W/m^2/K is the Planck response, 0.6W/m^2/K is the cloud feedback, and 1K is roughly the change in temperature.
If you solve the above, you get around -0.3W/m^2 (i.e., we should be losing energy). So, if all we had were the Planck response and clouds, our current planetary energy imbalance would be negative, rather than positive.
The thing I know for sure is that if there is only one term, equal to 0.6 W/m^2 on the left side of the equality sign – and one term on the right side of the equality sign is equal to 0,6 W/m^2 – then it follows that the sum of all other terms on the right side of the equality sign must be zero, no matter have many terms there might be.
I´m just pointing out an inconsistency in the theory provided by IPCC – I have no idea about what might be consistent.
In the fifth assessment report from IPCC we find the following:
“7.2.6 Feedback Synthesis
Together, the water vapour, lapse rate and cloud feedbacks are the prin- cipal determinants of equilibrium climate sensitivity. The water vapour and lapse rate feedbacks, as traditionally defined, should be thought of as a single phenomenon rather than in isolation (see Section 7.2.4.2). To estimate a 90% probability range for that feedback, we double the variance of GCM results about the mean to account for the possibility of errors common to all models, to arrive at +1.1 (+0.9 to +1.3) W m−2 °C−1. Values in this range are supported by a steadily growing body of observational evidence, model tests, and physical reasoning.”
These feedbacks are feedback to temperature increase since preindustrial times, which was stated to be approximately 0,85 °C in 2011.
Hence the central estimate for water vapor, lapse rate and cloud feedback alone should have been +1.1 W m−2 °C−1 * 0,85 °C = 0,94 W m−2. As mentioned above the current global energy accumulation has been estimated to approximately 0,6 (W/m^2). Hence the central estimate for current global energy accumulation is less than IPCC´s central estimate for water vapor, lapse rate and cloud feedback alone. The current global energy accumulation is even lower than the 95% confidence level provided by IPCC. I think it is safe to say that estimates provided by IPCC are wrong.
I saw some of those cloud feedbacks today, and it’s not the first time I’ve noticed this, all day there were a lot of cumulus clouds, on the way back from dinner they were gone. And since I pay attention to clear night skies, I have noticed this many times before.
The Cookie Monster ate the Sea Ice Data, and the Uncertainty Monster ate the Climate Change data. What is a Muppeteer to do? Agree with a few others that the science of Climate Science is not settled for one.
When I look at the above bar graphs, there are a number of ends hanging over the <1.0 climate sensitivity line. Is there any reason to dismiss these possibilities except the: "yes butt" response?
It is possible, and it is likely that the <1.0 climate sensitivity range is true with the data at hand.
Need more data? Yes. Need better quality data? Yes. Need new models? Yes. And, maybe, do we need less vocally enthusiastic Climateers? Yes.
Plus many.
RiHo08,
Climatologists: Keep the money flowing. Do not question. All your moolah belong to us!
Cheers.
Abstract. “Climate risks increase with mean global temperature, so knowledge about the amount of future global warming should better inform risk assessments for policymakers.”
So does this mean that “risks” would decrease with declining global temperatures?
If global temps flatten out, can “policymakers” go home and leave us all alone?
also …
I had two flawed but serviceable parents. Had teachers and coaches.
Had Presidents and Congress persons. Had Ministers and a few friends.
What the frack is a ‘policymaker’?
Don’t want any stinkin’ policymaker.
Stuff policy.
Go Brexit.
God bless the Queen and the US of A.
All assuming plausible temp increase is a risk and not a hope! More warm, please.
The paper takes away the argument that the models don’t fit the observations. They can do like with like and show that they do. Now the skeptics have to add a wrinkle to the argument that just because they fit where the observations are we don’t know if we can trust them where there are no observations. This is a very big wrinkle to add because if you don’t trust them, you also don’t know which way it would go in a supposedly more correct case.
Jim D,
According to the IPCC, future climate states are not predictable.
What’s the point of stupid models if the IPCC is correct?
Who you gonna believe – the IPCC or yourself?
Cheers.
Which is why they do projections, not predictions. Read the rest of that.
I did.
Psychological projection
Psychological projection is a theory in psychology in which humans defend themselves against their own unpleasant impulses by denying their existence while attributing them to others. For example, a person who is habitually rude may constantly accuse other people of being rude. It can take the form of blame shifting.
Very revealing.
Exactly! (not).
Jim D,
More Warmist Weaselwords.
I take your point, however. Instead of spending billions on developing impossible predictions, it can be spent on pointless and completely useless projections.
Oh, how wonderful it must be, to be a climatologist! No care, no responsibility! Just keep the money flowing – the taxpayers have got plenty.
By the way, I hope you won’t mind too much if I ignore your order to “read the rest”. I do as I wish – whether this pleases you, or not, is a matter of the greatest imbuggerance to me.
Cheers.
MF, thanks for trying to understand all this. You clearly have a ways to go, but good effort. Try harder. Read more, Comment less. Cheers.
JimD, I believe the conclusion was if there was some way to measure a “global” tas, then sensitivity would be higher than what we can actually measure. This is a bit like, if a frog had wings…
No, it says that the models are not wrong when compared to observations, which undermines a lot of skeptic arguments.
Nope, The average elevation of land surface temperature is in the ballpark of 600 meters, so their phantom global tas doesn’t exist. If they were going to scale to global, they would need a fairly large supplementary document ‘splain how they adjust for elevation and differences in the specific heat capacity of the land tas and the phantom ocean tas. Their assumption that it is directly scalable is friggin’ hilarious.
OK, it seems you didn’t read the article or post, because none of this was the issue.They can match the observations, and if you don’t like how they matched the observations you need to say why, because they got a consistent result.
Jim D,
Oh goody! A model that predicts – sorry, projects – the past. What an immense boon to science!
The problem might be that the left hand page of the graph may tell you nothing about the page not yet writ!
No problem to a Warmist of course – the past predicts (sorry – projects) the future.
Cheers.
MF, exactly! Good job. Keep it up.
Jim D | June 29, 2016 at 9:02 pm |
“No, it says that the models are not wrong when compared to observations”,
–
“We show there is evidence that climate models suggest that air-temperature warming is 24% greater than observed by HadCRUT4 over 1861–2009 ”
Sorry, they state they are wrong with respect to observations.
–
“none of this was the issue.They can match the observations”
–
No they don’t match the observations.
They do a Sandusky and make the observations match the models Jim D.
Models are 24% out.
Add 24% on for adjustment because “Water warms less than air”
Or “I like Bing Crosby”
whatever
[Forget that “Water also cools less than air”]
Bing[o]
the observations match the models.
JimD, “They can match the observations, and if you don’t like how they matched the observations you need to say why, because they got a consistent result.”
There are no reliable observations of tas over the oceans or tos. Over most of the oceans, there is a latent flux that limits the increase in sensible temperature rise and high humidity which limits the increase in latent flux until you reach some altitude where you would see a change in altitude of the dew point not a significant change in temperature of the dew point. So they are scaling “surface” temperature to some point above the surface.
Using Cowtan and Way’s Kriging with UAH, they can create any number of “surfaces” with a data set that is typically panned as unreliable, but sensitivity is defined as the change in temperature of a surface that isn’t measurable with “accepted means: due to an increase in CO2. If this paper had been published by “skeptics” the internet would be buzzing with dozens of debunkings no doubt using models. :)
JimD, “Finally, if the reported air-ocean warming and masking differences are robust, then which global mean temperature is relevant for informing policy? As observed? Or what those observations imply for ‘true’ global near-surface air temperature change? If it is decided that climate targets refer to the latter, then the warming is actually 24% (9-40%) larger than reported by HadCRUT4. ”
The last bit from Ed Hawkins, ifs, ‘true’ and question marks.
captd, surprisingly for you there really were ocean surface temperature observations, and they matched their trend in areas where they were observed long term. What more can you ask than that?
JimD, “captd, surprisingly for you there really were ocean surface temperature observations, and they matched their trend in areas where they were observed long term. What more can you ask than that?”
What you considered a match isn’t the same as what I consider a match. Since there is a lot of thermodynamics involved that requires a real temperature, I am a bit more anal that you.
https://lh3.googleusercontent.com/-Rs8V_a0d7XM/V3W7b6vhioI/AAAAAAAAOgY/UqhdMEoYOJs2KlVVR5q_7zCWYm7B3rEEQCCo/s603/models%2Bversus%2BSST%2B0-30N.png
For example, in the 0-30 north oceans the actual temperature if you believe ERSSTv4 was warmer than “projected” in the 1940s so all that warming in the cannot be measurable surface 2 meters above the oceans there has already happened. Since it happened prior to 1950, CO2 probably isn’t the cause. That 0-30N span of ocean is a pretty big chunk of the oceans that would influence land surface temperature readings.
The trends match, even in your picture. What is your complaint? For sensitivity calculations, which is what this paper is about, you only need the trends to match.
JimD, “For sensitivity calculations, which is what this paper is about, you only need the trends to match.”
Right, which is why “sensitivity” is becoming irrelevant right along with global mean surface temperature.
It seemed that the trend meant a lot to you people during the “pause”, but now, clearly, not so much.
JimD,”It seemed that the trend meant a lot to you people during the “pause”, but now, clearly, not so much.”
Right, the youse guys nonsense. Once again, the “pause” is related to ridiculous predictions, not “projections”, by the UK met office when they thought they had nailed the decadal prediction modeling game. David Rose pointed out their error and because the UK had already specified time frames, Rose was able to cherry pick his start date.
The “slowdown”, “travesty”, “standstill” and “hiatus” were all used by youse guys aka climate scientists and relate to the differences between “projections” and observations. Changing the goal posts to remove the “slowdown”, “travesty”, “standstill” or “hiatus” like youse guys are doing is pretty comical. Anyone claiming to be a “climate scientist” should know a bit about differences in specific heat capacity and how they would impact the rate of warming.
Usuns, the skeptics with a bit of thermodynamics in their education, have understood the issue for some time and have point out that what “surface” you are trying to “project” is pretty important. 30 years later youse guys are finally starting to realize what should have been obvious :)
It’s just another ‘the data isn’t right’ argument. It seems to be the only hot topic left in climate science, that and arguing weather.
For sure, the “skeptics” don’t like any of the surface data when it agrees with the models. They have decided to throw that out along with the models. It doesn’t leave much.
I’m not saying throw it out. I don’t even really care if they keep adjusting it. My comment would be if your data is so freaking bad you have to change it every 2 years then come back when you think it is right. I don’t think it matters anyway. It’s going to be difficult to turn cooling into warming and every adjustment they make now to turn some warming into more warming will also turn some cooling into more cooling. Stalling for time is all it is.
but wait. the surface data they dont trust falsifies the models..
an the surface data they dont trust… is warmer than the the LIA and cooler than the MWP… but.. they dont trust it…
and the surface data they dont trust of course can be used to show the effects of GCRs… and that surface data has all sorts of solar cycles in it… just ask them
and the surface data they dont trust was warmer on the 30s in the arctic
and the models cant explain the warming from 1910-1940 in the surface data they dont trust..
Now skeptic with integrity migh argue that the uncertainties were larger than we thought… but that would require him to do some calculations..
its much easier to trust it when you need it, and shit can it when it proves you wrong..
Here Mosher
http://www.nature.com/ncomms/journal/v3/n6/fig_tab/ncomms1901_F5.html
Evidence of a change in ocean heat transport. Look at it and use your photographic memory to remember there is evidence of a change in ocean heat transport regardless of if you think it is correct or not.
Say, battle of the models, Zoolander or Hansel?
Dr. Curry,
Speaking of one-sided Uncertainty Monsters, I’m missing the bit where we demonstrated conclusively that its teh modulz that are biased hot.
Well …. ?
brandonrgates,
The models are completely useless. Whether they are hot, cold, or 5 days old, is irrelevant. They achieve nothing, and have proven to be of precisely no utility whatsoever.
Apart from keeping so-called climatologists free from poverty, of course.
There are probably a few meteorologists or other real scientists, who could advance science, given the odd few billion dollars to play with. Maybe you disagree, but that’s life.
Cheers.
The problem is that EMCWF and NCEP and MERRA and The 55 year japense re analysis All disagree with each other more than CRU BEST and NOAA do.
There is a new special product made only for the arctic that I may take a look at..
I have some comparison of ECMWF to the gold standard USHCRN……
I’ll save that result until it’s betting time…
and ya.. when a reanalysis wants to assert how good it is.. what do they compare to?
yup.. you guessed it.
I used to use this
http://openweathermap.org/models
and compare the “now cast” to the actual data for about 200 locations every day… for about a year
oy vey…
Judith ” Truly global surface air temperature datasets using ‘dynamic’ infilling in the context of coupled global reanalyses.”
–
Still not good enough but a start.
The ocean currents are a component of the heat generated by the sun in it’s 12 hourly passage over a slightly different line on the map each day. The push of heated air and water outwards as the day warms leads to Coriolis effects, Hadley cells, Jet streams and weather..
The pattern is reproducible each day, the amount of moisture and cloud formation similarly so though feedback from the previous day,week month currents and cloud create a chaotic pattern with a drunkards walk around a known mean.
The interference of land masses with the sea currents and to a much lesser extent mountains on air currents direct longer circulatory patterns the most obvious of which is El Nino [ENSO].
Here what you call Natural Variability is just the long term pattern of these interactions.
They have a set daily heat input [orbital variation/albedo due to clouds and vegetation etc occurs*] but patterns of months, years, decades and perhaps centuries in how often the specific currents [and unspecified currents] come around.
Hence truly global surface air temperature datasets are very much an ideal, not a practicality, and large scale infilling will be required at times.
Steven Mosher | June 28, 2016 at 11:01 pm
Further, you keep saying that Berkeley infills. We don”t infill.
-and we don’t inhale either.
Judith gets it wrong.
“(although local infilling by Berkeley Earth is probably the best of the methods)”
Everett F Sargent July 2, 2014 gets it wrong
“My job, along with several others, was to update the CONUS snow load contour map, using all available historic raw monthly snow accumulation data. When a station was missing data, we INFILLED it using a simple three point average from the closest three adjacent stations (that formed a triangular enclosure for the missing data).
I can’t remember if we did any massive multiyear infilling though (Is that a requirement for the v2.5 USHCN to work?). YES*
Long story short? Infilling station data has been around a very long time, at least 40 years.”
–
So Berkeley never infills, justs chucks out data hence is of very poor reliability?
Or Berkeley just uses buckets and buckets of infilled data but does not do the infilling itself?
So you can stand on a soapbox with clean non infilled hands?
“So Berkeley never infills, justs chucks out data hence is of very poor reliability?
ya, when the thermometers read 15000C we throw that out
BUT if you want to NOT do QC… then the record is EVEN WARMER
Or Berkeley just uses buckets and buckets of infilled data but does not do the infilling itself?
Nope we use daily data.. not infilled. Try again.
if you download the data you can see see the number of days missing data. simple
Steven,
you write “BUT if you want to NOT do QC… then the record is EVEN WARMER”
This is precisely the assertion that I cannot reconcile with historic Australian data. Our calculations produce a possible warming of about 0.5 deg C over the century to 2010 or so. We infer that adjustment, at some time or another, has caused another 0.5 deg additional warming that takes the topic from one of mild noise to alarmist proportions with changes of national devices for electricity generation. It is important.
Some say glibly that the globe is warming as part of a recovery from the LIA. If you agree with this – and you might not – then the question is, what is the mechanism. Was there heat stored in places like the deep ocean that, on circulating, exposes for a time, more hot water to exchange with the atmosphere? If such an intuitively plausible change is dismissed, what is the reason for its dismissal in exchange for the CO2 control knob?
Much of what you write implies that you can separate the CO2 control knob from natural variation. I have never seen an acceptable proof of this.
Until I do, I have to take the usual scientific approach and say that the CO2 control knob hypothesis is wrong.
This might class me as a sceptic, but I am not a sceptic of the type invented by warmists who have their profiles of the sceptic built around lavish fossil fuel funding of nasty denialist propaganda types seeking monetary gain.
Geoff Sherrington.
“Until I do, I have to take the usual scientific approach and say that the CO2 control knob hypothesis is wrong.”
You can do that, but it is an argument from personal incredulity, not the scientific method.
There is plenty of evidence for the CO2 hypothesis, and very little evidence against it. Has it been falsified – no.
I used the scientific method, and the warming does not have the fingerprint of Co2. The links to my two pages are posted in one of my comments here.
micro6500.
“I used the scientific method..”
Well, you know the method then. Get your study published in a credible peer-reviewed scientific journal, then we can talk.
Until then I defer to the authority of the climate scientists who concluded global warming does show the fingerprint of CO2.
In my experience, the authors of any paper whose first reference is
without any chapter, page, or paragraph numbers have drunk the Koolaid and are not worth reading. That kind of useless non-specific handwaving at something somewhere in 700 pages of bumf is nothing more than a vague appeal to authority masquerading as an actual citation. However, it’s valuable because it is clear evidence that they are no longer doing science and can safely be ignored.
Check it out sometime. Real scientists provide real citations. Non-scientists, as in this case, just say “The IPCC 2014 report said it somewhere” and think that that is sufficient …
w.
Willis Eschenbach,
Here’s the link provided in the references. Goes to a document that is all of nine pages long, not 700. That citation is supporting the first sentence of the abstract:
Climate risks increase with mean global temperature1, so knowledge about the amount of future global warming should better inform risk assessments for policymakers.
… which really ought not be controversial in the first place, but the first paragraph of the reference should get us in the ballpark:
The volume addresses impacts that have already occurred and risks of future impacts, especially the way those risks change with the amount of climate change that occurs and with investments in adaptation to climate changes that cannot be avoided.
If we must resort to the ad hom: in my experience, “skeptics” who make such ticky-tack critiques can be safely ignored.
brandonrgates | June 30, 2016 at 2:36 am | Reply
Actually, the link provided in the references goes to just the Foreward, Preface and Dedication of the document, which in fact I’d underestimated. I’d said it was 700 pages.
In fact, it is over 1,100 pages long, and we have no clue what part of it they think supports their case.
You go on to say:
“Ticky-tack critiques”? Seriously? You think that proper citation is unimportant in scientific studies?
You truly believe that a link to the Foreward, Preface, and Dedication of an 1,100-page scientific document constitutes a proper scientific citation?? It’s not even the Summary for Policymakers, it’s the opening fluff. Do you truly call that a scientific citation?
You should be glad you didn’t have Mrs. Henniger as your high school science teacher. She had no tolerance for that kind of a vague handwaving attempt at avoiding a real citation. She’d red-pencil it with a note that said “Page?”, and rightly so.
Finally, the IPCC always says that what they are presenting is a synthesis and a reporting of the actual science, and it is NOT the actual science itself. The IPCC is NOT doing any peer-reviewed scientific studies, and the IPCC reports are NOT peer-reviewed.
As such, citing the entire IPCC report without specifics is a way of avoiding citing any of the putative underlying actual scientific studies. If the IPCC is citing John Jones and is not doing new science, then subsequent studies should just cite Jones directly.
However, failing that, they could cite the specific page in the IPCC report that backs up their claims. But just pointing at 1100 pages without page numbers and even paragraphs if necessary is more than meaningless.
It is a symptom of someone who has drunk the Koolaid. For me, it’s valuable because I can avoid a lot of pseudo-science. If your first citation is nothing but an unverifiable statement that somewhere in 1100 pages somebody wrote something that you think supports your claims … well, I’m not all that interested in your second citation.
w.
Pingback: La realtà non ci piace…passiamo al mondo virtuale | Climatemonitor
HadCRUT is crap. Too much “man-made warming” there from data manipulation. I would rely on UAH and RSS data. Using satellite data Lindzen and Spencer independently discovered strong negative feedback, meaning TCR must be less than 1.1 C per 2x CO2
OHC is good for physicists but so what if the ocean deep is warming? We live on the surface and we’re more interested in how much warming on the surface. If people want to be physicists, the TV weathermen will be all reporting joules of ocean heat instead of air temperature on summer
There’s a direct contradiction between these two statements. If OHC shows sufficient warming, then there can’t be high negative feedbacks.
We use OHC and AHC to determine how much warming is happening and how the Earth responds to a change in temperature. That doesn’t seem useful to you?
We use OHC and AHC to determine how much warming is happening and how the Earth responds to a change in temperature.
Pielke has argued it’s the best metric.
But the flip side he’s also argued: OHC doesn’t matter.
OHC is, because of the very large time constant, locked away from climate system on the century scale. OHC does return to the atmosphere, but very slowly.
TE is correct. A point I’ve made many times. If the current measured TOA energy imbalance is both accurate and persistent (very big “if”) it is sufficient to warm the entire ocean basin by 0.2C over the next century. Obviously 0.2C warming is not catastrophic but rather by any reasonable metrics beneficial especially if driven by CO2 enrichment which has many other benefits aside from warming a comparatively cold interglacial epic. One should always keep in mind that polar ice caps are NOT the norm for the earth and not indicative of a global environment best suited for living things. Not that improving the earth’s capacity to foster more life is of any real concern to climate alarmists.
The salient point here is that the mixing rate between the 10% of the ocean’s volume subject to rapid warming, called “the mixed layer” and the frigid abyss is unknown and is the difference between unwelcome rapid warming of the surface and virtually no surface warming at all. Physically indisputable is that once the energy in the mixed layer is distributed across the entire ocean volume the law of entropy prohibits it ever again becoming concentrated in the surface layer. In other words once gone it stays gone.
No contradicting statements. The satellites don’t measure OHC, it’s tropospheric temperature. Ask Trenberth about his missing heat
By the way, it’s useful to Trenberth not to me. My change in body temperature just sitting down in my room is greater than his missing heat converted to delta T
Yeah, I get that. But, again, if the OHC is showing sufficient warming (and it is), then there cannot be these strong negative feedbacks in the troposphere.
A theory about negative feedbacks is useless when the real-world data shows that the system is warming robustly.
It’s useful to all of us. It gives us much better numbers for the Earth’s radiation budget, for what is actually going on with one of the key parts of the Earth’s climate.
How can you know it’s going up when you don’t even know what it is?
Define “warming robustly”, Winnie. GAT rise is so small it’s arguably within the margin of error of the instrumentation employed to measure it. The only really global coverage that passes the laugh test offered by any instrumentation are satellites that measure the average temperature of thick layers of the atmosphere. And you (unsuccessfully IMO) tried to indict even those as inadequate for the task.
In 37 years of satellite data there has been 0.5C of warming. That’s 0.135C per decade.
http://www.woodfortrees.org/plot/rss/trend
Warmist pro Professor Phil Jones of UEA’s UCAR group famously opined that warming not more than 0.1C/decade is not statistically significant. It’s within the margin of error in other words.
It looks to me that rather than calling it “robust warming” it’s more apt to say slight warming bordering on statistical insignificance.
That’s not really the crux of the matter however. The $64,000 questions have to do with attribution and consequences.
For instance only about half of that warming is hypothetically attributed to CO2 rise and that CO2 rise in and of itself is not certainly due to human emission given human emission is a linear two times what remains in the atmosphere year over year despite human emission level itself rising in a non-linear exponential manner. Obviously since the human source is rising rapidly the natural (and perhaps anthropogenic too) CO2 sinks are responding with a rise in capacity just as rapid. Without an explanation for this behavior we can’t say what’s really going on. That said even if all the measured warming is both accurate and anthropogenic half of the warming is from land use changes, methane, nitrogen compounds, CFCs, and soot. There is nothing approaching certainty in attribution.
Consequences are also uncertain. The base benefits of energy from fossil fuels are legion. In every country one examines productivity, living standards, and lifespan rise in direct proportion to energy consumption. All advances over the past 300 years were driven by the industrial revolution which in turn was made possible by fossil fuels. Moreover atmospheric fertilization (CO2 enrichment) drives increased growth rates from the primary producers in the terrestrial food chain and lowers the amount of fresh water required per unit of growth. Any warming that comes from the greenhouse effect of CO2 enrichment lengthens is asymmetrically distributed in greater proportion over land, in the winter, at higher latitudes. That asymmetry works to lengthen growing seasons in areas subject to freezing winters which also drives primary production higher.
The problem as I see it is therefore not anthropogenic consumption of fossil fuels but rather the awful consequences of running out of fossil fuel to keep the gravy train rolling.
So there.
Trying (to force us) to prevent benefits at immense expense! A Perverted Project par excellence.
“If it is decided that climate targets refer to the latter, then the warming is actually 24% (9-40%) larger than reported by HadCRUT4.”
Climate science is settled – but the best measurement of observed warming now appear to be 24% low??? Climate science is settled – but re-analysis of SST data eliminated the Pause??? The IPCC’s expert judgment has reduced the range of negative forcing attributable to tropospheric aerosols, but many climate models haven’t changed. Shouldn’t the establishment be embarrassed by these developments?
I am just an Engineer, but I do have to comment concerning accuracy. Certainly, some quibble about results stating: “Good enough for Government Work”, implying that Government Work is not robust enough to be compared to, say, the work of Scientists. But, what if the Scientist is actually doing work for the Government? Then, what kind of accuracy is acceptable?
The second sentance of the abstract, noted above, is:”Expected near-term warming is encapsulated by the transient climate response (TCR), formally defined as the warming following 70 years of 1% per year increases in atmospheric CO2 concentration, by which point atmospheric CO2 has doubled”.
I am sorry, I have used the “Rule of 72” succesfully for over 50 years, not the “Rule of 70”. Such a small error, many have overlooked it. But, in percentage terms, that is almost 3%. I would think this should be accounted for in such an elaborate GCM approach to advising our Government on how to spend the $Trillions needed for a robust attack on future global warming?
Such professional sloppiness prevents me from taking the proposal seriously.
“Good enough for government work” generally refers to public-sector inefficiency and laziness. With climate science the government funded studies are, in addition to those other things, corrupt and venal. This is why projections and observations have varied so widely, consistently, and always in favor of the AGW conjecture.
You should check for yourself, but my check indicates that compounding at 1% per year produces a doubling in 70 years.
…and Then There’s Economics.
Hmmm…
Evidently the Rule of 72 depends of the frequency of compounding.
I’m not going to invest in CO2 at 1% though.
TE,
The table in your link appears to show that compounding at 1% per year produces a doubling in 70 years.
aTTP – wrong! It’s 69.66 years. For once in your life, try to be in the ballpark.
The table in your link appears to show that compounding at 1% per year produces a doubling in 70 years.
Yes, that’s why I posted it.
It does point out the stupidity of the number, though.
There’s no physical basis for assuming a compounded increase in CO2.
Past increase has been related to population increase.
Also, increase in the percentage of the world with a developed economy.
The future will be influenced by declining population and a diminishing portion of the remaining world to develop. Also increases in efficiency. And all that in addition to fuel choices.
And of course, that 1% is not just CO2 but total GHG which has decelerated since 1989:
http://climatewatcher.webs.com/AnnotatedRF10.png
TE,
As has already pointed out, a compounded 1% per year increase means a constant increase in forcing. It is simply a standard method for estimating the climate sensitivity of a model.
Perhaps, but it’s just a made up scenario, not a law of nature.
And given that emissions have been flat since 2013 ( diminishing rates ), it’s beginning to appear erroneous.
TE,
You do realise that climate sensitivity is formally a model metric? It’s an indicator of the sensitivity of that model to changes in external forcings.
Right.
Rates of forcing have fallen since 1989.
I believe they will be falling more.
There will be decreasing rates of forcing for the atmosphere to be sensitive to.
TE,
The point is that the TCR doesn’t depend strongly on the rate at which forcing increases. I think the difference between the TCR from 1% per year run and an estimate based on a historical run is around 10%.
Oh good gawd… starting at ~270 ppm and ending at ~545 ppm is approximately doubled. Ending at ~537 ppm would also be doubled. Good enough for guv; good enough for the pearly gates; good enough for the Bank of England.
So stick 1% into this calculator:____________!
”Expected near-term warming is encapsulated by the transient climate response (TCR), formally defined as the warming following 70 years of 1% per year increases in atmospheric CO2 concentration, by which point atmospheric CO2 has doubled”
Absurd assumptions are needed to come to absurd conclusions (assuming you don’t want to risk absurd reasoning).
1% is 4 PPM. We aren’t even doing 4% in an El Nino year.
From 1960 to 1998 about 57% of carbon emissions stayed in the atmosphere. If you subtract the effect of 57% 1998 emissions 6643 MT/Y since 1998, the excess (“new”) emissions are only 27.5% effective.
The 49+% increase (CDIAC is still stuck on 2013) since 1998 in emissions has increased the annual CO2 increase from 1.7 PPM to about 2.2 PPM. Emissions haven’t increased for 3 years running. The environmental absorption has continued to rise.
In 1998 an strong El Nino produced a 2.93 PPM CO2 increase. 49+% more CO2 emissions later 2015 scored 3.02 PPM. Since 2016 is the real El Nino year we would expect 4.37 PPM if “new” emissions were as good as “old” emissions, 3.62 PPM if “new” emissions run true to form. Somewhere around 3 PPM would be a tie with 1998… with 49+% higher emissions.
And if we do have a CO2 increase above 3.02 PPM it might be the permanent all time record.
It isn’t clear that with constant emissions we can even maintain the 2.2 PPM/Y average increase since absorption (which follows the CO2 level differential from 280 PPM) is constantly increasing.
70 years of 1% per year increases in atmospheric CO2 concentration
Is an absurd assumption. It will never happen. Even 0.60% for 40 years is pushing your luck.
PA, +2
And to dwell on the minutia, one sometimes overlooks the obvious…for instance, there has been no empirical study that has concluded that increased atmospheric CO2 concentration CAUSES a corresponding increase in “average” global temperature.
If I am wrong in that, please provide a link to the study.
BTW, I live in a forest and can comment that the trees are producing larger and more abundant foliage in the past two years than ever before. I use as my evidence: the lack of signal from the XM satellite (in the summer).
Well, they showed a 0.2 W for 22 PPM increase in downwelling IR over 11 years at the earths surface in two places in a 2015 UCB study.
The average temperature in Oklahoma is around 288 K. So presumably this represents an increase from 288 to 288.037K for 22 PPM.
So a 100 PPM increase in CO2 causes a roughly 0.16K.increase in temperature in Oklahoma.
It is what it is. Either they measured carefully and the change is real but trivial, or they measured wrong and it is useless as data..
Continuous compounding is the Rule of 69. The reason Rule of 72 is so popular for annual compounding is that 72 has many small convenient divisors: 1, 2, 3, 4, 6, 8, 9, and 12 whereas 69 and 70 have few divisors. It is also accurate enough for typical interest rates between 6% and 10%. For daily compounding and/or much higher or lower interest rates the Rule of 69 should be used.
Reblogged this on I Didn't Ask To Be a Blog.
Judith: Is warming that we may have missed important? From a pragmatic point of view, if it is warming more rapidly somewhere we haven’t measured very well, it should be obvious that warming in that location is relatively unimportant. Furthermore, most of those regions are extremely cold and would be more productive if they were warmer.
Has anyone tried to measure warming, TCR and ECS for the regions of the planet that are most important to humans and excluding those regions where warming almost certainly will be beneficial? The regions where most of our food is grown and most people live? Land, not ocean? This is where we have the best records and the most at stake. How bad will AGW be where it is clearly and quantifiably bad?
Yes, warming in Greenland and Antarctica is important to sea level rise (and a few photogenic species that will probably adapt), but we don’t have the capability to convert warming in those regions into SLR. From glacial to interglacial, sea level rose about 24 m/K, so it is possible that the 0.5 K anthropogenic warming in the second half of the 20th century has already doomed the part of Greenland that melted in the last interglacial. In the long run, SLR at equilibrium almost certainly will be painfully large – the only hope is that it will take millennia rather than a century or two. Changing SSTs will also impact coral reefs and ocean fisheries, but here again we don’t have a clear idea of how the system will adapt. The same is true for hurricanes.
While waiting on an open access version of the paper to read, I note that the abstract supports a best estimate observation-derived TCR of 1.66 C. Given that the majority of CMIP5 model-derived TCRs also cluster below 2 C it seems that we have a growing consensus that things are NOT “worse than we thought”.
Good news all around.
I have not accessed the paper under discussion here but I am familiar with the Cowtan (2015) paper that shows that the CMIP5 models on average show different trends between the air temperature above the ocean surface (tas) and the SST (tos). The tas trends are higher than the tos trends with an increasing global temperature. That same paper would or could not provide data and analysis that showed the same effects with the observed stating that that data was too noisy. As result the only reasonable comparison between models and observed temperature trends would be using surface air on land and SST on oceans – which is the conventional measurement used for observed temperature trends.
In my own analysis I have found that the observed temperature series trends between tas and tos with increasing global temperatures shows higher trends for tas than tos. The difference in trends between tas and tos is a function, like the difference in trends between land and ocean, of the warming (cooling) rate. I did not get a feel for how much of the “correction” in the paper under discussion here was due to the so-called apples to apples comparison.
As a stand alone issue for estimating the observed TCR (or ECS) I would think the critical issue would be how much does using tas in the place of tos change that estimate and further how much confidence is there in using tas in place of tos.
As for the models to observed comparisons I would want to see a one to one comparison of individual models to the observed and use several sources of the observed and include model to model comparisons. Using an ensemble of models for comparison to the observed simply does not make statistical sense.
Comparing models to observed climate sensitivity in the form of ECS or TCR provides simply a one variable for comparison. A more comprehensive analysis would require more variables for comparisons and again with the comparison using individual model output and including model to model comparisons. Wherever possible the comparison should use statistical significance or something comparable like using probability on a probability distribution. I have done such analyses and reported the results at Climate Audit in the link below:
https://climateaudit.org/2016/05/05/schmidts-histogram-diagram-doesnt-refute-christy/#comment-769715
kenfritsch:
“In my own analysis I have found that the observed temperature series trends between tas and tos with increasing global temperatures shows higher trends for tas than tos.”
I have not seen this elsewhere, and think it is most interesting. If the difference between tas ond tos is a driver of weather, it could mean that warmer climate could give less extreme weather. The comparision between models is important too. Could you give a presentation of tas and tos from models and observation, something like the model presentations of Bob Tisdale?
I think J C ought to give you a post for this.
Turbulent Eddy
Like your response to the ice age or little ice age II proposed “shedule”
Seems like your comments postulate a long delay till minor cooling and then erratic warming by natural oscillation till the 100,000 year big change.
“Frozen Earth, the once and future ice age” by Doug Macdougall
Seems to say the coming ice age is closer.
Ruddiman in “Earths climate, Past and Future” says we already prevented one with agriculture plus general emissions.
So lots of controversy now.
Why do you feel so strongly about ice age xx? off by 100,000 years?
natural variation LIA II off in the future by 1,000 XX?
Scott
Hi Scott.
Why do you feel so strongly about ice age xx? off by 100,000 years?
Well, the Eemian was the last warm period ( or at least low ice ) around 120,000 years ago. Note the peak insolation at that time.
There won’t be a similar trough to the one that started the last glacial for the next 100,000 years. I’m by no means versed in these things, but it seems to me that a new glaciation needs time and ice survivable summers, especially at first, when the ice level is low. Once ice accumulates, the height of the ice means a lower temperature and the albedo helps persistence. But if we’re having a betting pool, put me down for that dip about 180,000 years from now.
https://upload.wikimedia.org/wikipedia/commons/9/90/InsolationSummerSolstice65N.png
By the way, if there isn’t another glaciation til then, it makes worrying about global warming all the more silly because the intervening melting periods will continue to eliminate present day ice regardless.
Pingback: Weekly Climate and Energy News Roundup #231 | Watts Up With That?
There are no inductive inferences
Karl Popper
Pingback: Are energy budget climate sensitivity values biased low? | Climate Etc.