
by Nic Lewis
In a recent article here, which summarised a longer piece at ClimateAudit, I discussed the December 2015 Marvel et al.[1] paper, which contends that estimates of the transient climate response (TCR) and equilibrium climate sensitivity (ECS) derived from recent observations of changes in global mean surface temperature (GMST) are biased low.
Marvel et al. reached this conclusion from analysing the response of the GISS-E2-R climate model in simulations over the historical period (1850–2005) when driven by six individual forcings, and also by all forcings together, the latter referred to as the ‘Historical’ simulation. Using their ‘iRF’ measure of forcing, I can largely replicate Marvel et al.’s results. However, there are doubts over whether the calculated iRF values for the Historical simulation did in fact include land use change (LU) forcing. See my related longer article at ClimateAudit, here, for an examination of this issue.
I want to concentrate here on exploring further the response to LU forcing, which in these simulations primarily represents increased albedo. Areas cleared for cultivation and grazing are typically brighter than the forest or other natural vegetation they replace. Marvel et al. found LU iRF forcing to have an extremely high ‘transient efficacy’. The model’s GMST response to the (negative) LU iRF forcing over the historical period, relative to what it would have been if the same forcing had been caused by changing the CO2 concentration (its transient efficacy), was almost four. This very high LU efficacy appears to account for at least half the apparent low bias in TCR estimation from the Historical simulation when using iRF. As I wrote originally, Marvel et al. used an unphysical regression model to estimate iRF efficacies. That accounts for most, but not all, of the large excess over one of their efficacy estimate for LU iRF. Here I want to examine the explanation for the remaining excess.
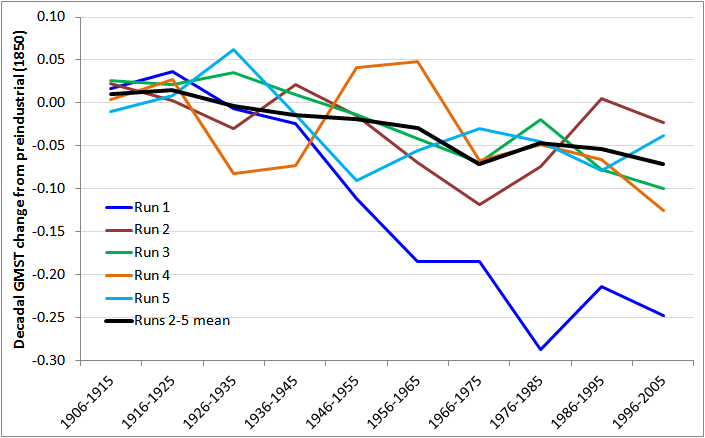
Ensembles of five simulation runs were carried out for LU and each other individual forcing. Marvel et al.’s estimates were based on averaging over the relevant simulation runs; undertaking multiple runs and taking the ensemble average reduces the impact of random variability. I commented in my original article that LU run 1 showed a much stronger negative GMST response than any of runs 2 to 5, from the middle of the 20th century on (see Figure 5 in the original article). The iRF transient efficacy calculated from this run is extraordinarily high: 9.5.
I conjectured that run 1 might be a rogue. Excluding it as well as using a physically-consistent estimation method for estimating iRF transient efficacy for iRF would reduce the estimate from 3.89 to, depending on the exact method used, 0.7 to 1.1. Excluding also the LU run with the lowest GMST response, to balance excluding the run with the highest GMST response, would cause little further change in the efficacy estimate.
Figure 1 shows the changes simulated by GISS-E2-R in response to LU forcing for each of simulation runs 2 to 5. They compare mean temperatures over 1976–2000 with those over 1850–75. Note that the temperature scale in Figure 1 is double that in subsequent figures.
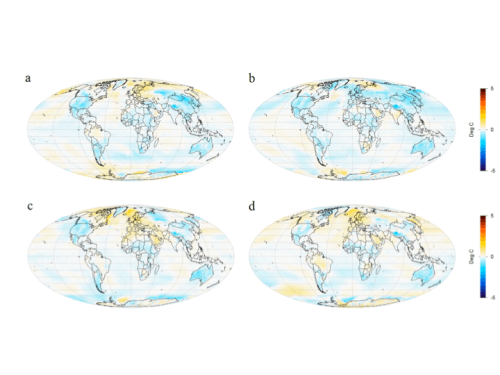
Figure 1. Simulated surface temperature change (1850–75 to 1976–2000 mean) driven by land use change forcing only: maps a to d show results from runs 2 to 5 respectively.
As the forcing and resulting temperature changes are small, internal variability has a significant effect on simulated changes even when comparing 25 year means, with changes varying in sign over some land areas and most of the ocean. Figure 2, which shows the average of all the plots in Figure 1, confirms that temperature changes for the runs 2 to 5 mean are small everywhere. Globally averaged, there is a cooling of 0.04°C. Although land use forcing in GISS-E2-R is very geographically concentrated (Figure 4c of Miller et al 2014 shows 2000 values), its effects on surface temperature are widely distributed, and generally not linked to where the forcing takes place. The generally greater cooling in land masses than over the ocean is mainly due to temperatures over land generally being more sensitive to global forcing, not to LU forcing being located in land masses.
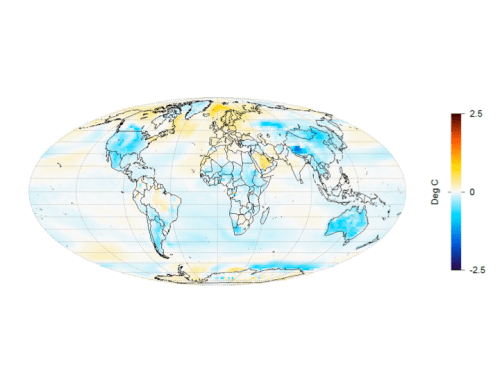 Figure 2. Average of temperature changes for runs 2 to 5, as plotted in Figure 1.
However, the temperature changes simulated in run 1, shown in Figure 3 are very different from the average of the other runs. The global average cooling is 0.35°C, nearly nine times as high as for the average of runs 2 to 5. And the next highest cooling, in run 3, is only 30% as large.
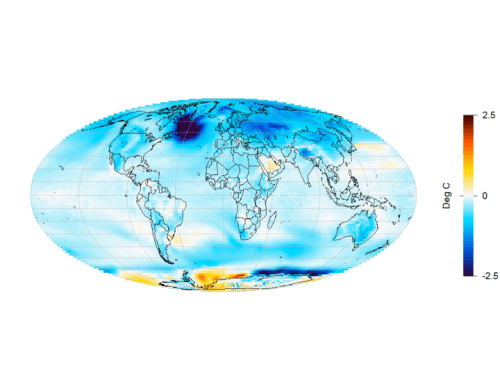
Figure 3. LU run 1 surface temperature change from 1850–75 to 1976–2000 mean.
In run 1, a very cold anomaly develops in the ocean south of Greenland. In most of the dark blue patch, the temperature has dropped by over 3°C, and by over 5°C in the centre of this area. Additional cooling to that shown in runs 2–5 has developed almost everywhere, apart from in the ocean around Antarctica, where some areas have warmed strongly and others cooled strongly. This all seems to point to some major change in the ocean overturning circulation having occurred in run 1, resulting in the cold ocean anomaly south of Greenland and substantial surface cooling in most areas.
Whatever the exact cause of the massive oceanic cold anomaly developing in the GISS model during run 1, I find it difficult to see that is has anything to do with land use change forcing. And, whether or not internal variability in the real climate system might be able to cause similar effects, it seems clear that no massive ocean temperature anomaly did in fact develop during the historical period. Therefore, any theoretical possibility of changes like those in LU run 1 occurring in the real world seems irrelevant when estimating the effects of land use change on deriving TCR and ECS values from recorded warming over the historical period. Hence I think there is a good case for excluding LU run 1 when estimating LU forcing efficacies.
Interestingly, I have very recently discovered (from Chandler et al 2013) that there was an error in the ocean model in the version of GISS-E2-R used to run the CMIP5 simulations, which may be relevant to the development of the ocean anomaly in LU run 1. Chandler et al. write, in a paper about simulating the Pliocene climate using GISS-E2-R:
“We discuss two versions of the Pliocene and Preindustrial simulations because one set of simulations includes a post-CMIP5 correction to the model’s Gent-McWilliams ocean mixing scheme that has a substantial impact on the results – and offers a substantial improvement, correcting some serious problems with the GISS ModelE2-R ocean.”
Chandler et al. say that a miscalculation in the isopycnal slopes in the mesoscale mixing parameterisation led to spurious heat fluxes across the neutral surfaces, resulting in an ocean interior generally too warm, but with southern high latitudes that were too cold.
Interestingly, they also write, comparing results from the corrected (GM CORR) and uncorrected model (GM UNCOR):
“One of the most significant differences of the Pliocene GM CORR simulations, compared with those of the uncorrected model, is the characteristic of the meridional overturning in the Atlantic Ocean. In GM UNCOR the Atlantic Meridional Overturning Circulation (AMOC) collapsed and did not recover, something that was expected to be related to problems with the ocean mixing scheme. Although we hesitate to state that this is a clear improvement (little direct evidence from observations), it seems likely that the collapsed AMOC in the previous simulation was erroneous.”
It occurs to me to wonder whether this error in the GISS-E2-R ocean mixing parameterisation, which gave rise to AMOC instability in the Pliocene simulation, might possibly account for the model’s behaviour in LU run 1. It looks to me as if something goes seriously wrong with the AMOC in the middle of the 20th century in that run, with no subsequent recovery evident.
Schmidt et al. wrote, in their paper about the GISS ModelE2 contributions to the CMIP5 archive:
“Since the simulations were completed, we discovered an error in the implementation of the skew flux Gent-McWilliams parameterization which had the effect of making the eddy-related diffusion more horizontal than intended. We are currently exploring the impact of this error, and the results will be reported elsewhere.”
Although the ocean error was identified at least three years ago, I have not found any publication presenting the results of the investigations into its impacts. It is of course possible that GISS has concluded that the impacts are negligible or perhaps small except where an instability arises. If this is the case it would be good to have a clear statement from GISS confirming such.
The single forcing simulations were part of the CMIP5 design. Although it is possible that some or all of them were run after the ocean correction was implemented, I can see no evidence of that being the case and I think it is unlikely. A commentator on the ClimateAudit thread has asked Gavin Schmidt, in a comment submitted to RealClimate, whether temperature and net flux data for GISS-E2-R available via the CMIP5 portals and KNMI Climate Explorer are based on a model corrected to fix the ocean heat transport problem. It would be helpful and refreshing to get a clear response to this question – and also to an earlier question asking what are the iRF and ERF forcing values in GISS-E2-R attributable to a doubling of CO2 concentration, upon which all the results in Marvel et al. depend.
[1] Kate Marvel, Gavin A. Schmidt, Ron L. Miller and Larissa S. Nazarenko, et al.: Implications for climate sensitivity from the response to individual forcings. Nature Climate Change DOI: 10.1038/NCLIMATE2888. The paper is pay-walled, but the Supplementary Information (SI) is not.

Pingback: Huge efficacy of land use forcing in one GISS-E2-R simulation: is an ocean model error involved? – Enjeux énergies et environnement
Marvel Comics LOL!
Marvel et al. found LU iRF forcing to have an extremely high ‘transient efficacy’. The model’s GMST response to the (negative) LU iRF forcing over the historical period, relative to what it would have been if the same forcing had been caused by changing the CO2 concentration (its transient efficacy), was almost four. This very high LU efficacy appears to account for at least half the apparent low bias in TCR estimation from the Historical simulation when using iRF. As I wrote originally, Marvel et al. used an unphysical regression model to estimate iRF efficacies. That accounts for most, but not all, of the large excess over one of their efficacy estimate for LU iRF. Here I want to examine the explanation for the remaining excess.
http://2.bp.blogspot.com/_gWQaU40PH24/SzkeTzzjHeI/AAAAAAAAE5k/EDNi9oia8Uc/s640/589.gif
http://judithcurry.com/2016/01/22/history-and-the-limits-of-of-the-climate-consensus/#comment-759518
Turkish study showed a peak difference of about 162 W/m2 (25°C) between asphalt and grass. Virginia Highway department says asphalt gets 60 °F (33°C) warmer than ambient temperature so the Turkish study is consistent.
I’m not sure how the “efficacy” plays into this but 162 W/m2 is 162 W/m2. The net radiative surface loss is only about 1/3 of that value.
So land use change is a pretty efficient way to warm the planet.
Hopefully, the mathematics of the modeling do not presume the Earth actually works like a greenhouse.
Well, Wag, at least climate modelling is a safe thing you can do indoors if you don’t like Twister or Monopoly. Plus, with Twister you can get minor strains, and Monopoly is full of sneaky references to reality.
Well, I would go for a different analogy. The models have more in common with the outhouse than the greenhouse.
Ah, but the outhouse requires exposure to weather. A bit too much verit-ay.
Lamentably, “the mathematics of the modeling” probably do “presume the Earth actually works like a greenhouse.” This passage from Hannah Arendt’s The Human Condition is germane:
Wonderfully expressed.
Glenn – interesting, but that sounds perilously close to the anthropological argument. Other than a generalised argument about the validity of any mathematical modelling at all, I struggle to see the relevance?
Jonathan Abbott,
The point is that mathematics is the quintessential Rationalist language, and is wielded like a weapon, so that empiricism gets lost in the fray.
Maybe this quote from Stephen Toulmin’s Cosmopolis will help:
Humans inherently want simplicity and command over facts. In much of their work there can be a false confidence in representation of reality. As long as individuals maintain some humility and keep a check on their self confidence it can function well. When they blur the line between reality and the models is when it comes crashing down.
Glenn,
The passage you quote, while beautifully written, appears to be some sort of apology for the application of mysticism to science, under the cloak of empiricism. I see no conflict between using mathematics as a language to describe the world, and empiricism as a way to test our knowledge. I also fail to see how it applies to GCMs, except in the most generalised way.
Indeed, Jonathan, mathematical explanation, tested by observation, is the soul of science.
Jonathan Abbott,
Au contraire!
Toulmin offers no “apology for the application of mysticism to science.”
What he does offer is recognition of the fact that, when man’s limits of knowledge and understanding are surpassed, he invariably reverts to mysticism to explain the unknown and the mysterious.
The belief that man has broken this habit — that man was able to start Modernity with “a clean slate” from some “scratch line” whereby he left all the superstitions of the Medieval world behind — is one of the three fundamental tenets of an “unreconstructed Modernity.”
As Toulmin goes on to explain:
Glenn,
Again, I’m sorry to disagree but I don’t think any scientists practicing today would argue that they have somehow cut themselves free of all bias and are capable of pure rationality. That may have been a claim of some 18th century philosophers but it is certainly not the intellectual driving force behind modern science.
I do think that a ‘scratch line’, if such a thing does exist, could perhaps be drawn by taking the basic logical and mathematical precepts of the ancient Greeks – but although these could be considered to be rationally consistent, any human application of them would of course be subject to the same bias. And that is well understood.
I’ve been trying to understand the German Ideology, started with Kant.
Kant describes the infant state, wherein all perception is a slave to the makings of our brain.
What he fails to realize is that such is only the beginning. We spend our entire lives now training this mechanism. We confer with other humans and compare our experience. We fire up a computer and plot the mandelbrot set.
Mathematics is a thing outside the human mind, not inside. Real logical structure exists in the universe.
The whole Marxist conception of reality is based on this nonsense that nothing is real, it is all a product of the human mind.
When people (climate also) go wretchedly wrong is that they fail to produce a sequence of rational steps where one conclusion follows from another. They jump across massive gaps.
Climate modellers think just because the write down equations and use some fortran finite difference techniques they have results that mean anything. They fail to account for model error, integration error and the rest.
The whole thing is very math’ish.
Admittedly I still have a lot to learn about the whole positivist debacle….
Jonathan Abbott,
The problem is that “scientists practicing today” have “cut themselves free” of very little bias. And strangely enough, it is science itself which has demonstrated just how biased scientists, and other human beings, are.
Both rationalism and empiricism, because they are performed by mere mortals, are highly imperfect ways of truth-finding and knowing. That is why dialectic — sharing research and theories and letting others have a rip at them, allowing one’s experiments and theories to be critically examined and debated by fellow scientists — is so important to the advancement of scientific knowledge.
And “taking the basic logical and mathematical precepts of the ancient Greeks” offers no guidance when it comes to the long-running battle between rationalism and empiricism. It was from the ancient Greeks, after all, that we inherited the problem. Here’s how the historian Carroll Quigley explains it in The Evolution of Civilizations:
If someone can explain how my brain created the Mandelbrot set and why, in what someone before I was born named the ”Valley of the Elephants’, I see Elephants, then I’ll question rationalism and accept that, yes, gender is a cultural construction….
Philosophers are too oft just incredibly sloppy mathematicians …to the point if absurdity.
“Hopefully, the mathematics of the modeling do not presume the Earth actually works like a greenhouse.”
Go read the code. It does not presume the world acts like a greenhouse.
Jeez you guys are a lazy bunch.
back in 2007 when I was bitching at Gavin he pointed me at ModelE code.
Big stack of code… you guys should go read it.
Then comment
“Computers are like bikinis. They save people a lot of guesswork.” ~Sam Ewing
Mosher
“Go read the code…”
Just to be nice…here you (plural) go:
http://www.giss.nasa.gov/tools/modelE/
This is kind of interesting and gets me to thinking, which is hard to do, about Jaron Lanier and Victoria L. and their ideas about code size, complexity, and bugs. Personally, I love bugs – they made a career for me.
Gavin’s words from the doc:
“Model development is an ongoing task. As new physics is introduced, old bugs found and new applications developed, the code is almost continually undergoing minor, and sometimes major, reworking. Thus any fixed description of the model is liable to be out of date the day it is printed. Understanding this, we will endeavour to maintain the web version of the document as closely as we can to the current release, however in is inevitable that some discussion here will on occasion fall behind development.
The GISS GCM model development process is over 25 years old (for a very readable description of the historical development see Hansen et al (2000)). Inevitably, decisions that were made and constraints that existed early on in the process have had influences that are still apparent. While much of the subsequent reworking of the model has led to a reduction in these historical influences, some parts of the model still hark back to the days of punch cards, FORTRAN 66 and line printer output. A charitable interpretation would be that while embracing the new (FORTRAN 90/95, multi-processing, netcdf, etc.), we endeavour to maintain some of the more harmless GISS traditions (which some might call eccentricities) in a spirit of continuity with those who have previously worked on the model. On the other hand, some of those early decisions (for instance regarding diagnostics, or conservation properties) turned out to be very far-sighted and are a principle reason why the GISS series of models continue to play a useful and important role in the world of GCM simulations. We hope that by continuing to make the GISS models a more accessible and better documented, we will be able to carry on in that vein for at least another 25 years.”
So, climate model output is useless.. We did know that.
Knowing it and showing it are two very different things. This is good work.
The fact is humans have been capable of impacting the global climate and environment for some time now. For example, DDT, we eliminated the use in the U.S. and fortunately saved our majestic symbol…the bald eagle. The chemical DDT was found to thin the egg shells for bald eagle hatchlings causing the eggs shells to be compromised and easily broken. We eliminated lead in gasoline which was found to make a substantial reduction of lead in our environment. Now, we have excess carbon dioxide from industrial sources and automobiles – millions of them. They are literally a converter pump that takes in oxygen and spews out CO2. And they are all over this planet. So if anybody does not understand the simple science behind the effects of greenhouse gases then just take a look at the planet Venus, which granted is an extreme example, but shows how a more dense atmosphere can trap heat in it’s biosphere, its surface temperature is around 900 degrees Fahrenheit. So Earth is taking on much more CO2 then it would naturally and the earth can not keep up its ability to dissipate the increased amount of CO2, and other greenhouse gases, without leaving a substantial impact on its environment. Now why is this? Well again the science is simple, electromagnetic radiation comes in different wavelengths (sycles) and in return different frequencies, which determines the intensity and penetrating ability…such as gamma rays being able to penetrate solid lead because it is at the high end of the frequency range. The sun’s solar rays are in the form of ultraviolet radiation which due to it’s intensity and frequency has the ability to penetrate the more dense greenhouse gases such as CO2 and methane. Then the ultraviolet radiation heats the earth, water and land, and that heat is then converted to infrared radiation (heat) which has a much longer wavelength giving it less penetratrating ability and more difficulty escaping the earth’s atmosphere, consequently trapping the heat within the earth’s biosphere. This is currently the leading cause of global climate change even though there is always natural factors as well such as volcanic processes and solar activity, but not at the rate of climate change we have seen the last century. Because us humans are producing and releasing billions of tons of CO2 every year. And what is actually even more alarming is the CO2 discharged into our oceans which changes the acidity (ph balance) of the water, and this is already having disastrous results in the seafood industry because oysters cannot form their shells naturally due to the acidic levels from the excessive CO2.
So if we truly care about our planet’s future, and our grandkids and their grandkids, then we will be good stewards of God’s green earth. Because our maker said we shall use our planet, but not abuse our planet. And moreover, if I’m wrong, along with all those who believe in the impact we our having on earth, we will still actually have a healthier planet. But if the deniers have their way and they are wrong then we will have irreversible disastrous global results…are not we better off to be safe than sorry and quit making our planet’s health a political issue? Thank you
Aaron
I live adjacent to an oyster producing estuary so could you cite the link that demonstrates your claim ?
) thanks
Tonyb
tsdr
Kepone was the culprit in the James River that fed the Chesterpeak (sic) Bay and caused the major shell fish / oyster problem for many decades after the mid 1970s.
From https://e360.yale.edu/digest/a_remarkable_recovery_for_the_oysters_of_chesapeake_bay/4437/
Louisiana once supplied most of the United States’ oysters, but Hurricane Katrina and the Deepwater Horizon oil spill have slashed the state’s oyster production. The Pacific Northwest was the U.S.’s second-largest oyster supplier, but ocean acidification is hurting those populations. In Florida, Apalachicola Bay oyster production has fallen by two-thirds because of freshwater diversions.
Wild oysters, such as these harvested by dredging, remain an important part of the industry in the Chesapeake Bay. are in serious trouble, with more than 90 percent of the world’s oyster reefs having been lost in the past century, according to a 2011 study.
Joel, you have fallen for the PMEL misrepresentations amplified by Seattle Times. See my guest post here, Shell Games, for the real story about the Pacific Northwest oysters.
Just showing that there are lots of causes. Some clearly so; others not so. Not trying to justify acidity, although acid conditions are not good for CO3=. Oysters are found many in shallower water than most of the ocean expanse. Pollution, pollution, pollution. Lots (all?) of it man-made for the oysters. Wonder how is the pearl business is doing? Lots of artificial ones now.
Joel, these are not acidic conditions. The ocean may be becoming slightly less basic, hence it is neutralizing. But that word does not sound dangerous so the greens use acidifying.
Joel,
You hit on one of the reasons I get irate at people using ocean acidification and impact to shell fish as a justification to reduce CO2 emissions.
There are plenty of human related activities which negatively impact oyster hatcheries, coral reefs, salmon spawning grounds, etc. With the possible exception of the latter, impacts from CO2 range from negligible to non-existent. The problem comes when one recognizes the limits of living in the real world. There is no cornucopia of resources pouring forth to address every problem. A rational response is to focus resources on the problems offering the greatest threat. Every dollar wasted on saving the planet from CO2 is a dollar that is not helping fix real problems.
There is nothing wrong with using DDT, the result of not using has caused the deaths of possibly hundreds of thousands of people (2,000 pa in Africa alone) and blighted the lives of millions.more
“If there’s nothing else and it’s going to save lives, we’re all for it. Nobody’s dogmatic about it.” – Greenpeace spokesperson Rick Hind, after Greenpeace stopped their effort to completely ban DDT.
“After having tested different chemical combinations, you…made one of the greatest discoveries within the recent history of prophylactic medicine. DDT… kills the mosquito, which spreads malaria; the louse, which spreads typhus; the flea, which spreads the plague; and the sandfly, which spreads tropical diseases.” – Gustaf Hellström, at the Nobel Prize ceremonies
http://dwb.unl.edu/Teacher/NSF/C06/C06Links/www.altgreen.com.au/Chemicals/ddt.html
Since the ‘sixties when malaria was almost eradicated, the ban on DDT has been responsible for the deaths of over a half million people annually – mostly children, mostly in Africa. Over the last five decades more people have died needlessly from malaria than were killed in all the wars world-wide during the same period.
Aaron,
That’s a very compelling and appealing narrative, but it sounds more like a catechism of High Modernity than science, at least as science has come to be practiced today.
Two times you posit your highly reductionist notion of science, once when you speak of the “simple science behind the effects of greenhouse gases,” and once again when, speaking of electromatnetic radiation, you proclaim, “Well again the science is simple.”
But here’s the rub: we are now discovering the world is a much more complicated and complex place than we once believed it was. This is as true of physics, economics and biology as it is of climate science.
In Cosmopolis, the philosopher of science Stephen Toulmin observes:
Toulmin goes on to conclude Cosmopolis with his recommendation of a retooled Modernity, modified so as to serve our current situation and needs better:
Banning DDT is estimated to have killed up to 80,000,000. DDT was and is the most effective treatment for Malaria. Malaria was nearly wiped out in a number of countries before the ban. But using DDT would upset the eco-enlightened’s delicate sensibilities.
The additional CO2 has caused a 60% increase in plant growth. Further, the increased CO2 increases plant heat and drought tolerance. This will help feed the future billions. The environmental community would prefer to starve them.
The environmental community doesn’t give a damn about people and relentlessly advances their selfish interests.
Yep.
Environmentalism shares many of the hallmarks of a fundamentalist theology:
Glenn,
I wouldn’t rely on some nameless medieval theologian as being representative of Church doctrine.
There is nothing inherently contradictory between being fruitful and multiplying and being good stewards of our environment.
“and this is already having disastrous results in the seafood industry because oysters cannot form their shells naturally due to the acidic levels from the excessive CO2. ”
I live on the lower Rappahannock in Virginia close to the bay and the oysters around here are doing fine. In fact oystering is now making a comeback after the devastating effects of over fishing for decades were reversed by Government regulation and provision of new beds and artificial structures. Doesn’t seem to be anything wrong with the shells……
http://depts.alverno.edu/nsmt/archive/CwiklaHasa.htm
PH average Lake Michigan water as sampled 5.25.
I have dug clams out of Lake Michigan. The PH gets as low as 5.25.
Shellfish can form shells at low PH.
http://www.ncbi.nlm.nih.gov/pmc/articles/PMC3904920/
Ocean Warming, More than Acidification, Reduces Shell Strength in a Commercial Shellfish Species during Food Limitation
Seawater acidification had no effect on shell strength but did affect shell flexibility suggesting that shell integrity was mostly maintained in M. edulis shells despite reductions in CaCO3 saturation.
The effect of warmth on shell strength just means the locations that are most productive will change. The species survived the MWP and the first part of the interglacial (which were warmer) so they will move or adapt.
Thank you for dropping in from Venus. I realize there may be language and communication problems, but please read posts and ask questions before commenting.
“but please read posts and ask questions before commenting.”
What would be the point of attempting a scientific discussion with someone whose entire world view is based on a mish-mish of theological assertions?
C + O2 —> CO2 + heat (a constant thermodynamic relationship).
If “heating the globe” is the problem (and CO2 is just correlated by this ratio when most of the energy is “C-based”), then switching to modes of energy generation that supply the same amount of heat, but less CO2, little is gained. Check out things with IR-gun and cities, like Las Vegas, where energy is hydro-based.
And what is actually even more alarming is the CO2 discharged into our oceans which changes the acidity (ph balance) of the water, and this is already having disastrous results in the seafood industry because oysters cannot form their shells naturally due to the acidic levels from the excessive CO2.
Really??? You need to put on a happy face and turn that frown upside down. CO2 doesn’t seem to be the problem.
http://www.epa.gov/salish-sea/shellfish-harvesting
Nearly 183,000 acres (739 square kilometres) of shellfish beds are currently closed to harvesting in the Georgia Basin, and about 36,000 acres (147 square kilometres) are closed in Puget Sound…
The primary sources of pollution that lead to closure of shellfish harvesting areas are polluted runoff from urban areas and farms, and uncontrolled sources of sewage and septic wastes.
We are doing so many other things to mess with shellfish CO2 doesn’t even seem to show up on the trouble map.
@Aaron
“So if we truly care about our planet’s future, and our grandkids and their grandkids, then we will be good stewards of God’s green earth.”
1. Prove that God exists.
2. Prove that I will have grandkids.
3. Prove that these grandkids will have grandkids.
Alternatively, admit that your position has no basis in science.
Thanks in advance.
Prolix scientifically and grammatically illiterate emotional theological twaddle.
Thank you for this. Your analysis is way over my head but two points come to mind:
1. it shows what a long way the models are from being reliable for projecting, let alone validated.
2. I am so grateful to people like you, Steve McIntyre and many other diligent and highly competent people who are doing what the government funded scientist should be doing – reproducing results and trying their best to find fault in every study that could have a significant role to play in supporting the pyramid of analyses and results that build up to supporting policy decisions.
On point 1 you could argue that model developers are identifying errors and fixing them, as highlighted by the example here.
One hopes they are doing something with all that money, but this in no way makes the models reliable, or even useful.
Off topic but what do people think of this Nature study?
http://www.nature.com/nature/journal/v527/n7577/full/nature15725.html
“Global non-linear effect of temperature on economic production”
Marshall Burke, Solomon M. Hsiang & Edward Miguel
AffiliationsContributionsCorresponding author
Nature 527, 235–239 (12 November 2015) doi:10.1038/nature15725
“Growing evidence demonstrates that climatic conditions can have a profound impact on the functioning of modern human societies1, 2, but effects on economic activity appear inconsistent. Fundamental productive elements of modern economies, such as workers and crops, exhibit highly non-linear responses to local temperature even in wealthy countries3, 4. In contrast, aggregate macroeconomic productivity of entire wealthy countries is reported not to respond to temperature5, while poor countries respond only linearly5, 6. Resolving this conflict between micro and macro observations is critical to understanding the role of wealth in coupled human–natural systems7, 8 and to anticipating the global impact of climate change9, 10. Here we unify these seemingly contradictory results by accounting for non-linearity at the macro scale. We show that overall economic productivity is non-linear in temperature for all countries, with productivity peaking at an annual average temperature of 13 °C and declining strongly at higher temperatures…….”
I think it is off topic. Are you trying to hijack the thread? Wait for one of the summary posts or an Econ post.
No not trying to hijack the thread. Thanks for your important feedback. I clearly said I know it is off-topic — just came across it and was wondering if anyone has substantive reactions.
If you want to play Hall Monitor, there are a few of them already, get in line.
Yeah, b’buttocks clearly said he knows it’s off topic. That clearly shows he had no intention of hijacking the thread. He was just wondering if he could hijack the thread.
http://soldiersystems.net/blog1/wp-content/uploads/2014/12/Holy-Thread-copy.png
ybutt,
If it wasn’t for climate science and psychology, economics would be the biggest producer of crap research.
Simplistic, mechanistic, speculative, assumption-ridden bunk, by the look of it?
I love the journal Nature, but it is sort of a knowledge bottleneck. Too bad our public library doesn’t have it anymore.
Sometimes this bog gets blogged down with dueling links – dinks with links.
@ybutt – The biggest issue is that the model assumes that adaptation to climate change is instantaneous. So if Kenya suddenly became 10 C colder, the loss in GDP would be the same as if people new decades in advance that it will get 10 C colder. This assumption is of course ridiculous, which means they likely overestimate the magnitude of the impact of climate on productivity (since they use year to year variation to estimate their damages function).
I won’t go into more detail since it is off topic.
Nic is one of just a few skeptics actually digging into the specifics of the models. That there are so few is probably the greatest weakness in the skeptical approach, given that pro-AGW climate science is completely dominated by various forms of modeling.
I’m going to repeat the point I made earlier. It was model developers that identified the error in the climate model and corrected it not skeptics.
This specific instance is irrelevant to my point. I think the basic problem is that there is virtually no public information about these models. For example, Nic’s post sounds like a parameterization is a specific algorithm, basically a simplification that makes a complex climate process computationally tractable.
If so then some simple questions arise. How many are there in a given model? What are they and how does each work, in basic terms? How do they vary from model to model? What uncertainties does each create? How do these uncertainties combine?
To my knowledge this basic information is nowhere available. Rather it is buried in highly technical journal articles, if that.
Humanity,
“…It was model developers that identified the error in the climate model and corrected it not skeptics.”
Maybe we should have a model debunking contest – toss them a piece of tenure meat and let the dogs go at it.
David Wojick,
“… I think the basic problem is that there is virtually no public information about these models.”
Maybe we can ask some grad students and post docs how they wrote that spaghetti code. Even assumming the code is good, there is that tricky part of the math/ physics model – GIGO and all that.
David I suspect to validate the models to your standards would require huge amounts of man power, cash and time. Who wants to fund that? Modellers are happy to say the models are fit for purpose while they stay in line with obs and the skeptics want congress to shut them down. So until the models and obs are in complete disagreement we muddle on with error finding being a high technical and subsidiary activity.
Its horrible that the world is imperfect.
Justin model debunking or model improving?
Debunk, then improve and repeat until the models are verified. ITMT, there is no need to trash the global economy.
Human, I said nothing about validation, which I think is impossible. I just want to know what the simplifications and assumptions are. To begin with, how many parameterization algorithms are there? Seems like a simple question.
How about a simple list with a plain language summary of what climate process each algorithm is parameterizing?
Where is the transparency?
Jonathan : “Actually I read an awful lot”
It doesn’t show
human1,
RE: ” …would require huge amounts of man power, cash and time. ”
They already get that. I’ve lost count of the number of different models. Is it 40? 70? Whatever the number it seems to be excessive for the few things they can actually do. Spend time and money improving the best of the lot sounds not only reasonable, but something one should expect to happen.
Mosher,
It’s a pity, because up to a couple of years ago you were one of the most informative commenters here. The point you keep coming back to, that more sceptics should do their own science, is both valid and important. But you don’t bother to argue your own corner any more – you’re all stick and no carrot.
Snark less. Comment more.
Nic identified errors in a couple of peer-reviewed studies. I wonder how well qualified the reviewers are in all climate papers to do this kind of granular analysis. Further, what is the extent of errors that have consequencial dimensions and are never found? It is hard to believe all the reviewers have the varied skills given the increasing complexity of the science.
kid and fellow wonderer,
” I wonder how well qualified the reviewers are in all climate papers to do this kind of granular analysis. Further, what is the extent of errors that have consequencial dimensions and are never found? ”
You have asked a fine and most crucial question. It is possible to prove their work wrong, but the time required to do so is unknown. Looks like we are stuck with this for our lifetime, perhaps our grandchildren’s lifetime also.
“It is hard to believe all the reviewers have the varied skills given the increasing complexity of the science.”
Yet another good point. How do we evaluate skills in climate science? Accuracy of predictions? Number of papers with their names on them? Citations? Climate pals on FB? Twitter followers? Castle invites? Grant totals?
I know how we evaluate building contractors – on time, under budget, as designed, safety, no lawsuits. They have to be licensed and insured – all to build a house of an ancient design to an old and well-established code using certified and tested materials and techniques. Yet the stability of the global economy is going to played with based on the work of who?
Nice is actually doing work unlike the rest of you who are merely repeating tired tropes.
Not all of us are able to make the necessary time available in our lives. Doesn’t mean we aren’t allowed to voice an opinion.
Pot calls kettle black. Video at 10pm. In other news……
Mosher
When you’ve got time you could maybe fix the Google map engine on the Best site.
Mosher,
True, but we are paying for it. We are the customer. Personally, I am dissatisfied with the product. Can I get my money back?
Clarification: I was writing about models in general and not Nic’s. My mistake.
Johnathan.
Read more. Comment less.
95% of the comments on this and other blogs are mere repetitions of common tropes.
Pot kettle. Name that fallacy!
Justin. Sorry, read the fine print. All sales are final. Gcm code is open source. Crowd fund your effort to improve it.
Mosher
Are “tired tropes” and “common tropes” different species?
Mosher’s invention! Pure genius!
http://static.planetminecraft.com/files/resource_media/screenshot/1434/tropes8022513.jpg
Mosher,
“Read more. Comment less.”
Actually I read an awful lot, and rarely comment. Maybe I’ll start commenting a bit more. By the way, your repetition of this phrase is now beyond tedious.
“95% of the comments on this and other blogs are mere repetitions of common tropes.”
Unfortunately yes, but the remaining 5% are very interesting, and you don’t need to be the next Nic Lewis to contribute.
I agree with you in part Steven. However not all of us are capable of doing what Nic does. I’m not really that capable of even understanding what he does, let alone trying to do it. For that matter I’m not capable of doing what you’ve done.
Yes there is a lot of repetition of argument here. But repetition is not unjustified when the same arguments get ignored over and over.
I also agree with Jonathan that at least some of the work – that funded by public funding – should be able to be called into question. Even if I were your love child and Nic’s most promising student, I don’t have access to the resources a Gavin or Tom Karl have.
Roy and John vastly depend on models
I am looking forward to a rapid (well, at least for climate researchers) response to NL’s questions. Regardless of the eventual response (or lack thereof) thank you for your valuable contributions to our understanding of these issues.
They need a post processor to identify and flag problems like that deep blue North Atlantic blob. One would have thought they can simply flag very steep gradients and other anomalous signs?
A correct model could be started with conditions, ten thousand years ago and run to current time and it would cycle warm and cool. I would have cycles like the Roman and Medieval and Modern warm period and it would have the cold periods like the little ice age. Current Models do not repeat the cycles in nature, Current Models do hockey sticks. They have left out that when earth gets warm, Polar oceans thaw and increase snowfall. They have left out that when earth gets cold, Polar oceans freeze and decrease snowfall. It is not the errors in the Models that make them always wrong, it is the most important snowfall that they left out.
Earth temperature is Regulated. The thermostats are set to the temperature that Polar Oceans Freeze and Thaw. This works in the NH and SH and the temperature set point is the same. It always snows enough to limit the upper bound and it always snows little enough to limit the lower bound. The overall process is complicated, but this most important fact is simple.
It works, look at actual data. http://popesclimatetheory.com/page85.html
Maybe the folks in DC will get the jest of the problem while digging out from under the huge snow dump this past weekend. It’s thermal transfer from ocean to land via chilling (freezing) in the atmosphere. Glaciation when the stuff stays on land and does not melt and flow back into the oceans via rivers. A cold land surface is created when the sun does not supply enough calories to convert ice to liquid by direct solar radiation or solar heated air.
Classical Physical chemistry transport of fluid from hot to cold with some earthly aberrations!
Did someone say Carnot? In effect the earth is a closed system, save solar influx and earthly outflux “shine” – visible and invisible. Molecular loss?
Much simpler computations are just as wrong.
The temptation to keep piling stuff into simulations to make them better is there to keep you from noticing that your work is nonsense from the outset.
Start from the physics, and don’t leave it.
It will help in noticing that you can’t solve something, and you can stop.
After reading Nic Lewis’s synopsis of the Marvel et al paper which he had discussed in more detail at ClimateAudit, I came away hearing in my mind:
“Climate model runs are not experiments. Such simulation runs can only give some credence to speculations.”
If I understand Lewis’s argument: Simulations made the oceans colder which required the land use change forcings portion of the simulation runs to be hotter and the subsequent deriving of TCR and ECR may be questionable.
Inquiring minds want to know.
You hear correctly. Given (1) the complexity of climate and (2) our lack of understanding, the most that one can do with these models is play with hypotheses. But the modelers insist that they can now do regional and short term prediction, given adequate funding, as well as forecasting out 300 years!. These unsupportable claims are all over their literature. It would be funny if it were not so serious. Cranks in control, as it were.
Pingback: Climate Models | Transterrestrial Musings
We know because NL asked and the paper’s author team replied, that they did not think this was a rogue run. It appears they did not know about the published error. And would not think their model could go rogue, no matter how nonsensical the result appears. About says it all. One wonders whether a correction will be forthcoming?
Both Gavin Schmidt and Ron Miller (the latter being the Marvel et al author whom I asked) are well aware of the published error, since it is discussed in publications of which each of them is the lead author.
Wow. That makes Miller’s reply to you truly ‘worse than we thought’.
One possible reason for at least part of the divergance between Marvel, et al. and observational study estimates of TCR/ECS is that the model-based estimates may, in fact, have the wrong sign for net impact on temperatures from land use changes.
Marvel, et al., assume land use changes slightly increase global albedo (negative forcing). However, if the non-radiative impacts from land use changes create warming that offsets the albedo-induced cooling, then observational studies would be more accurate than Marvel’s model, at least insofar as land use impacts are concerned.
From AR5’s WG-1 Technical Summary:
Fabulous quote! We do not know the sign but here is our deterministic model. Believe it. (Is this even science?)
Gavin’s Ringberg talk mentioned irrigation as a negative forcing, i.e. adding to the deforestation-induced cooling rather than offsetting it.
http://www.mpimet.mpg.de/fileadmin/atmosphaere/WCRP_Grand_Challenge_Workshop/Ringberg_2015/Talks/Schmidt_25032015.pdf
Me, I still haven’t got a clue how irrigation affects temperature. More heat released via evaporation? (Presumably the ‘LH’ in the presentation means latent heat?)
Irrigation is the single largest anthropogenic water use,
Bigger than bottled water…
I’ve heard irrigation argued both ways. Christy claims that California central valley records show a clear warming signal because at night higher humidity has a big effect.
Irrigation lowers daytime temps because energy is used in evaporation. This is the opposite of the urban heat island effect where precipitation runoff is gathered in storm sewers and not allowed to evaporate as it normally would have.
I just checked that. It seems Christy was mainly making the point not about irrigation itself but about crops, which of course go in hand with irrigation. It seems true that newly-irrigated areas will mostly have been areas which either weren’t grown on before, or had less lush crops (i.e. less sunlight absorption).
http://journals.ametsoc.org/doi/pdf/10.1175/JCLI3627.1
I was wondering if there is a consistent ‘green index’ to figure out how much of the Earth’s is covered by vegetation. That could in turn be used to know how much plant albedo we have. It would have the advantage of combining deforestation and agriculture.
Even in the absence of such an index, I believe it’s well established that tree/plant area has increased in the last 30 years or so, in which case land use forcing (or at least the albedo part) would have been getting less negative for the period, adding to the warming trend; and that’s without counting asphalt which obviously has greater sunlight absorption than the average land it replaces (and asphalt-covered surface has kept growing throughout this period).
This contrasts with the Marvel et al result, which has land use at more negative right to the end of the simulation:
https://climateaudit.files.wordpress.com/2016/01/fig5-lu_runs_gmst.png
It was unclear to me exactly how (or even if) the Marvel results incorporate any irrigation studies. As Nic Lewis pointed out at Climate Audit, GISS-E2-R has a stronger negative forcing for land use than does IPCC AR5. Perhaps that is because it includes the work by Cook, and others, on irrigation. However, that seems unlikely given the conclusion of Cook (2015):
http://pubs.giss.nasa.gov/abs/co04700w.html
I understand that the Land use (LU) forcing used in the Miller et al and Marvel et al studies did not include irrigation, so that cannot be the explanation for the high response to LU forcing shown in Marvel et al.
Irrigation does appear to have a cooling effect on local temperature, but a negligible one when globally averaged, and per Cook et al 2015 GISS-E2-R appears substantially overestimate its effects, when they are incorporated.
Another reason that the outlier LU run 1 should be omitted when estimating the effect of LU forcing is that the greatly enhanced cooling it displays is linked to an abrupt cooling of over 5 C in the Labrador Sea. Not only is incredibly unlikely to have been caused by LU forcing, but no such abnormal cooling event occurred in real climate system over the historical period. Thus we can rule out LU forcing having had during that period an enhanced cooling effect resulting from such an event.
What if there would have been a substantial cooling due to Land Use forcing, but is was not observed in the historical period because it was compensated for by a strong warming due to CO2 forcing. If that were the case, then the Land Use Run 1 should be accepted as physically possible.
Clever thought. But I have seen no evidence of strong warming in the Labrador sea/North Atlantic region in any CO2 forced simulations by this model.
The fundamental problem with climate models is the hubris of the scientists thinking they can actually model it. You are not that smart. Nobody is.
So you dumb down the model with all sorts of unjustified simplifying assumptions to get it to run, then assume it’s right (with the appropriate man is evil bias) and proclaim it’s settled.
Something engineers quickly learn when doing FEA is that you must verify the model with actual test results before using it for predicting anything. Many have learned the hard and bitter lesson of hardware humiliation despite what the model said was going to happen.
Unfortunately no such negative feedback for climate modelers exists, there is no punishment for being wrong (at least not yet).
A partial solution is to require that any model used by the government for any official purpose be certified by the engineer societies.
The engineering societies would evaluate the models from a software design review to a full performance evaluation. They would submit an punch list to the scientists to fix then reevaluate the corrected model.
When they were satisfied they would certify the model and it would become a “standard model” with a list of known errata and limitations. Corrections would go into version 2.0. When version 2.0 was ready they would bring the model to the engineering societies for review again etc.
The current modelers are running wild and need to be corralled. A controlled model release cycle is one way to do that. Also the review would investigate all the algorithms such as the Menne Algorithm that haven’t gotten a lot of scrutiny. Scientists content that temperature is like milk and it doesn’t hurt the data to homogenize and pasteurize it. These sorts of claims need to be independently evaluated and tested by the engineering societies.
What an interesting idea! (I may write about this.) Is there any precedent? I know a lot of engineering societies promulgate things like building and testing codes, but does anyone certify software?
Mind you given the power politics they might just certify the present junk.
My brother-in law was trained by Microsoft to debug software. He worked as a QA technician most of his career. He had to certify software in all departments.
“A partial solution is to require that any model used by the government for any official purpose be certified by the engineer societies.”
This would require a definition of the margin of error over time for each characteristic the program (GCM) is designed to model. It would also require reaching a consensus on how the effectiveness of the models would be measured.
How is it being determined whether the climate is getting better or worse? What are the metrics? It would seem that this would be something that “climate science” would have defined but apparently not.
Mr. Wojick, yeah, people certify software. While I am thinking this through though – here is an example.
http://ntrs.nasa.gov/archive/nasa/casi.ntrs.nasa.gov/20040014965.pdf
“Certification Processes for Safety-Critical and Mission-Critical Aerospace Software”
The second item in the checklist:
“Evidence of competence of personnel involved in development”
I don’t believe the software could get certified. Item #2 could be a killer.
To this point the modelers have gotten away with murder because no one declared the software “mission-critical”. If the software fails to give accurate forecasts and models global warming incorrectly, that could cause trillions of hard-earned dollars from the American public to die a horrible death – mostly at the hands of bureaucrats. That is about as mission critical as it gets.
The software should be declared mission-critical and the developers should be forced meet a “mission critical” certification standard.
PA
You are talking about a due diligence study, something that is generally required for large publicly (and often privately) funded projects.
David, yes there is precedence as pointed out above.
My father, a retired engineer used to these kinds of studies, pointed this out when Julia Gillard was offering rebates to pensioners who would be affected by the rising price of energy due to the carbon tax.
His point that the case for mitigating against FF emissions had not gone through a due diligence study would have to be by it’s nature vastly more detailed than anything yet undertaken. It’s made up of disinterested experts outside of climate research but also including members of them, and everything is examined, all assumptions, all code, evidence – everything. It would be exhaustive and probably quite expensive, but compared to the cost of what is proposed for mitigating FF, quite trivial.
hot air,
I liked what Andy West had to say:
Perhaps you can explain what a memeplex is.
David Wojick,
I thought Andy West did a very thorough job of doing just that.
Again, here is a link to his post:
http://judithcurry.com/2013/11/01/cagw-memeplex/
This deserves a post.
You deserve a brick today
http://photos1.blogger.com/blogger/5957/3306/1600/bark%20brick%2038%20McDonald%201.jpg
Hello Doug. Now go away and stop wasting everyone’s time.
Regarding land use run 1, Gavin at Real Climate says:
‘Dropping outliers just because they don’t agree with your preconceived ideas is a classical error in statistics – it’s much better to use the spread as a measure of the uncertainty’
But I don’t see that they discuss the uncertainty in land use forcing anywhere in the paper. In fact another problem is that they apply their adjustment to the most likely sensitivity value in other studies (i.e. the median), when pretty much the whole point of these studies was to arrive not at single value but at a probability distribution.
So they adjust Lewis&Curry 14 upwards by 50% or whatever, from 1.64 to 2.4 or so (off the top of my head). But what happens to the confidence interval? Either I’m blind or there is no discussion of this in the paper.
Marvel et al. does in fact give recalculated confidence intervals for the three studies in Table 3 of their Supplementary Information. But, given all the errors and other problems in Marvel et al., I don’t think they tell one anything much useful.
Gavin’s implication that I suggested dropping land use run 1 because it disagreed with my preconceived ideas is unwarranted. The problem with including LU run 1 is that it seems to be dominated by the effects of an instability in the GISS-E2-R ocean, probably resulting from the admitted serious error in its ocean mixing scheme, rather than by genuine effects of land use forcing.
Just to be clear, figure 2 in Marvel et al shows the adjustments, with Otto 13 for example going from 2 to 3 ECS and from 1.3 to 1.8 TCR (eyeballing, the circles the authors use are pretty big).
There are also probability distributions for both TCR and ECS, but it’s not clear to me what these represent. Marvel’s own PDF, one of the three papers she discusses?
Ok forget it. The PDF they talk about is Otto et al 2013, reference 4.
“I want to concentrate here on exploring further the response to LU forcing, which in these simulations primarily represents increased albedo. Areas cleared for cultivation and grazing are typically brighter than the forest or other natural vegetation they replace.”
Hmm. I’m not convinced it’s as simple as the simulations assume. I have the good fortune to live in a park, resembling a forest with grassy clearings, surrounded by a built up city with little greenery. Winter and summer, it’s always cooler in the park. There’s no signifcant altitude difference apart from the height of the buildings (mostly 5 storeys). So although removal of trees may increase albedo, in this case it also increases the ambient surface temperature.
There can be no “one size fits all” solution for modeling land use impacts. As you suggest, albedo is just one factor. Forests create shade, alter wind and runoff patterns, draw water from deep below the soil surface and release it well above the surface. The variables are slightly different in every location.
The assumption that a forest’s lower albedo = overall warmer temperatures ignores the fact that trees are living organisms that have evolved to alter their environment.
Running ensembles of five simulation runs and averaging them is completely equivalent to a five sample Monte Carlo, which would almost never yield any real variance reduction at all. To know if the summary statistics obtained from a Monte Carlo set are converged, you can simply divide the sample set in two and compare the summary statistics of the two halves. If they do not compare increase your sample size by an order of magnitude and repeat until convergence is observed.
The required number of Monte Carlo samples is a complex function of the number of dimensions of uncertainty and the underlying model complexity. I would guess than hundreds of runs might still be inadequate.
This seems to have the makings of a nice catch-22 for Marvel-style methodology. An ensemble of GCM simulations is necessary to account for sensitivity to perturbation of the parameters (Lorentz applies even after the mysterious ‘spin up’?). Difficult then to justify eliminating one of these simulations. But when these are being applied to historical data, a simulation with no resemblance to what actually happened makes it pretty useless for any historical calculations. What to do? One answer is (at least) 500 rather than 5 simulations so that such ‘outliers’ have less effect, but presumably prohibitive to do.
Gavin’s already addressed this here. All of the single forcing runs are counter-factual; they are not meant to represent what actually happened in reality, since – in reality – there wasn’t only a single forcing. Therefore single forcing runs are not intended to resemble what actually happened; single forcing runs are intended to represent what might have happened had there only been a single forcing.
Nic, you mentioned that about half of the change in TCR (and ECS?) in the paper comes from the high efficacy of land use forcing (in the simulations, that is). If land use run 1 had an efficacy of 9.5 and the average for the five runs is 3.89, then excluding it drives the average down to 2.49. In other words, nearly half of the ‘excess’ land use forcing efficacy (the amount over 1) comes from run 1.
So even excluding any other issues in the paper, about 25% of their TCR/ECS adjustment depends on this single simulation. Could you confirm this?
Alberto, What you say is correct. Note also that Marvel et al’s choice of both regression method and regression period pushed up the transient efficacy estimate. The simulations ran from 1850 to 2005, so they could (should?) have used 1856-1865 as the first decade rather than 1906-1915. Doing so would have reduced the LU 3.89 efficacy to 1.83, or to 0.91 excluding run 1. And to be physical, the regression best fit line must go through the origin; zero forcing implies zero GMST response. Imposing a zero intercept reduces the 1856-2005 decadal regression slope based efficacy to 1.03, or 0.64 excludign run 1.
I commented on this at CA also. The most striking thing to me about these seemingly divergent runs is that (in the absence of a code error) it blows a very large hole in the ideas used to justify using weather models for climate. Bear in mind the usual justification is that “initial conditions are forgotten in a climate run.” We then, why do these runs give such widely divergent answers. The most obvious reason is that the attractor (or rather the error laden GCM approximation to it) is very complex and has very divergent lobes or dimensions. If that’s the case, one would have to ask whether climate is predictable at all with such a model.
Pingback: Weekly Climate and Energy News Roundup #214 | Watts Up With That?