
by Judith Curry
So, exactly how long has it been warming?
The IPCC AR5 made a very strong statement regarding the attribution of recent climate change:
It is extremely likely that more than half of the observed increase in global average surface temperature from 1951 to 2010 was caused by the anthropogenic increase in greenhouse gas concentrations and other anthropogenic forcings together. The best estimate of the human induced contribution to warming is similar to the observed warming over this period.
I have been arguing that the IPCC’s attribution arguments are unconvincing unless they can also explain the early 20th century warming, and the longer period of overall warming prior to the 20th century.
Early 20th century warming
Consider Figure FAQ 10.1 from the AR5:
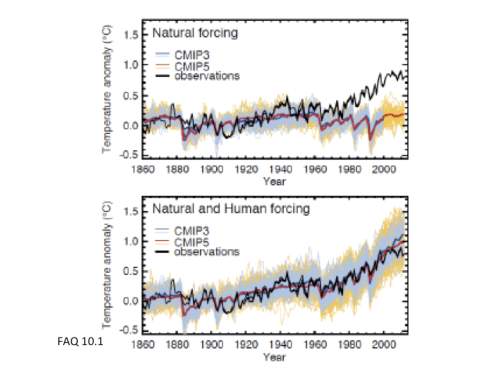
It is seen from the figure with both natural and human forcing that climate models simulations agree with observations very well during the period 1970-2000. There is significant disagreement during the following periods:
- 2000-present (the so-called hiatus)
- 1940-1970 (the so-called grand hiatus)
- 1910-1940
The IPCC AR5 doesn’t have much to say about the early 20th century warming or the grand hiatus (Section 10.7.1.1):
The AR4 concluded that ‘A substantial fraction of the reconstructed Northern Hemisphere inter-decadal temperature variability of the seven centuries prior to 1950 is very likely attributable to natural external forcing’. The literature since the AR4, and the availability of more simulations of the last millennium with more complete forcing, including solar, volcanic and greenhouse gas influences, and generally also land use change and orbital forcing) and more sophisticated models, to a much larger extent coupled climate or coupled earth system models, some of them with interactive carbon cycle, strengthens these conclusions.
Well the devil is in the details – further, if we are to be convinced by the AR5 attribution of what is essentially a strong warming period of 30 years, then unexplained periods temperature variability of 30 years are significant.
The AR4 Chapter 9 provides some illumination:
Modelling studies are also in moderately good agreement with observations during the first half of the 20th century when both anthropogenic and natural forcings are considered, although assessments of which forcings are important differ, with some studies finding that solar forcing is more important while other studies find that volcanic forcing or internal variability could be more important.
It is ‘reassuring’ that all the AR4 models do a reasonable job of reproducing these features, when they are allowed to select their external forcings to . . . reproduce these features. In the AR5, the selection of external forcing data was more objective, which accounts for slightly poorer agreement between the CMIP5 simulations and the observations.
Lets take a look at the early warming period, from 1910-1940. This period accounts for ~40% of the total observed warming since 1900. How much of that warming can be explained by CO2?
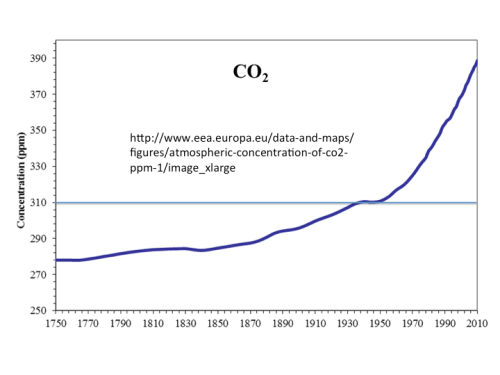
From NASA GISS, the CO2 concentration in 1910 is 300 ppm, and in 1940 is 311 ppm. So of the 100 ppm increase in CO2 since 1910, only 11% of this increase occurred during the period 1910-1940 which comprises 40% of the surface temperature increase since 1900. (aside: 25% of the anthropogenic CO2 has been emitted since 1998, which is a period of warming hiatus).
And while you are considering the above figure, check out the ‘hiatus’ in CO2 increase that occurred 1940-1960; its difficult to ignore that this could be driven by the grand hiatus in warming. (Note: Ralph Keeling was very interested in this feature).
Clearly something else other than CO2 has been the predominant cause of the warming 1910-1940, and climate models do not include this effect since they don’t reproduce the magnitude of the warming.
In terms of explaining this period of warming, the stadium wave argues: 1910-1940 (warming), 1940-1975 (cooling), 1975-2001 (warming), 2002- present (cooling) – against a background secular warming trend.
Earlier historical records
Insight into the length of the secular warming trend is provided by historical temperature records prior to the 20th century, I highlight two data sets here.
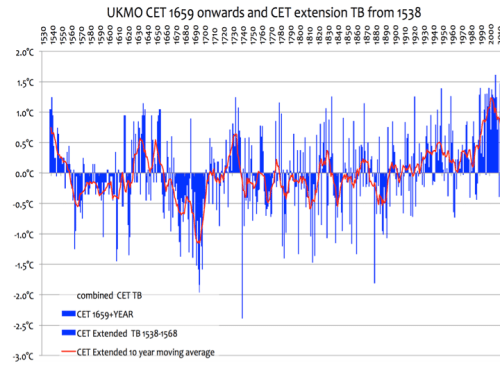
The first is the Central England Temperature record (Wikipedia) going back to 1659:
And Tony Brown’s CET reconstruction going back to 1538.
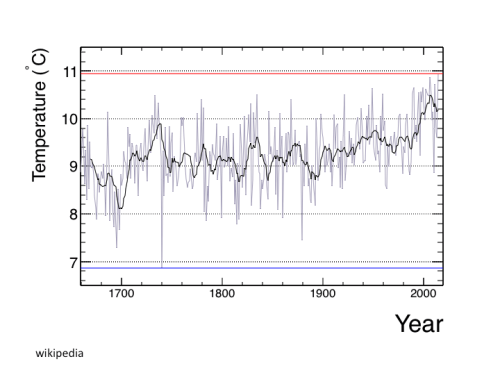
Berkeley Earth has attempted a historical reconstruction of global land temperatures back to 1760 (which is dominated by observations in Europe and eastern North America prior to 1900).
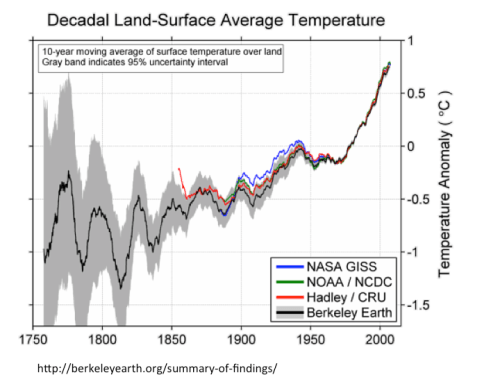
Substantial variability is seen on timescales of 30 years. As for a secular warming trend, the Berkeley Earth analysis shows a warming trend back to 1800, with considerable variability in the late 18th century. The CET analysis shows considerable variability particularly in the 17th century
Some of the variability can be attributed to large volcanoes that occurred around 1800 (AR5 fig 18.12)
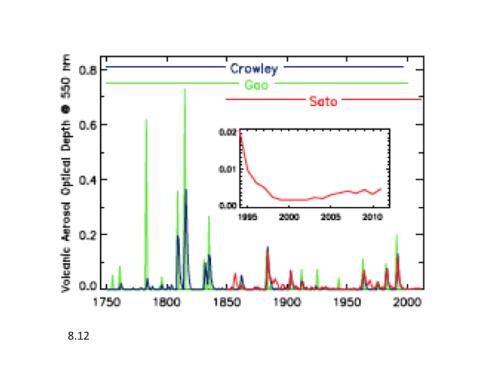 This was also a period of the grand solar minima: 1645 – 1711 (Maunder) 1791-1825 (Dalton).
400(?) hundred years of warming
Figure 5.7 from the AR5 compiles a range of paleoclimate reconstructions for the past two millennia:
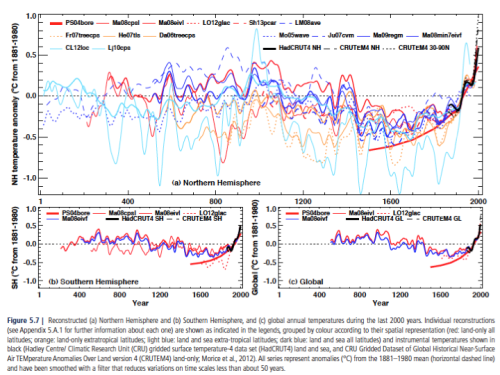
The borehole reconstruction (bold red) shows a striking secular increase since 1500. The other reconstructions show substantial variability, but all show an increase since 1700 and most of the NH reconstructions show an increase since 1600.
AR5 Section 10.7.1 provides some convoluted reasoning for arguing that all these variations are pretty well understood, and that internal variability and solar variability have small influences.
Consider AR5 figure 10.19, where the orange curves represent the climate model simulations and the other curves represent ‘selected’ reconstructions.

Now compare figure 10.19 with figure 5.9 above. What to conclude from the differences? Well the take away message seems that given the large range of paleoclimate reconstructions, you can cherry pick them to agree ok with your model simulations.
Implications for attribution arguments
So, what does all this mean for IPCC’s ‘extremely likely’ attribution statement for the warming since 1950?
- There have been large magnitude variations in global/hemispheric climate on timescales of 30 years, which is the same duration as the late 20th century warming. The IPCC does not have convincing explanations for previous 30 year periods in the 20th century, notably the warming 1910-1940 and the grand hiatus 1940-1975.
- There is a secular warming trend at least since 1800 (and possibly as long as 400 years), that cannot be explained by CO2, and is only partly explained by volcanic eruptions.
The combination of these two points substantially reduces the confidence that we should place in attribution statements of warming since 1950. Getting the ‘right’ answer (i.e. explaining the warming from 1970-2000) for the wrong reason (i.e. CO2) simply has not been eliminated as a serious consideration, and hence an ‘extremely likely’ conclusion is highly inappropriate.
So, what could be the cause of a 200 – 400 year period of secular warming? The obvious places to look are to the sun and the ocean. Sean Lovejoy dismisses the idea of a ‘grand oscillation’ on these time scales. Sun-climate connections are receiving renewed interest, as evidenced by the NAS Workshop Report The Effects of Solar Variability on Earth’s Climate. During my visit to Oxford last summer, I met with oceanographer David Marshall, who reminded me that the influence of the oceans on climate starts to get interesting at timescales around 1000 years.
In terms of trying to unravel forced from unforced, and natural versus human caused variability, it seems that sorting out what is going on during the grand hiatus (1940-1975) is particularly important, with a major clue provided by the CO2 hiatus (1940-1960).
We need to keep working the historical data record to build credible observational data sets back further in time. And we need more and better paleoclimate proxies, which means we need more robust (calibrated proxies) and more scientists in the field actually collecting samples.
The politically driven push to manufacture a premature consensus on human caused climate change and create an argument based on bootstrapped plausibility has misdirected climate science for the past two decades. The hockey stick attempted to wipeout secular variations prior to the 20th century, but even Mike’s Nature trick spliced the early 20th century warming as an integral part of the blade. At most, only a small fraction of the early 20th century warming was caused by CO2 (this issue was recently addressed in a post by Vaughan Pratt).
And finally, someone in the IPCC needs to read more than one chapter; there are a lot of inconsistencies in the different chapters.

A “known unknown” acknowledged by NOAA.
“The ocean covers 71 percent of the Earth’s surface and contains 97 percent of the planet’s water, yet more than 95 percent of the underwater world remains unexplored. The ocean and lakes play an integral role in many of the Earth’s systems including climate and weather.” http://www.noaa.gov/ocean.html
Shred,
It is cool (53F) today but the sun is warm. My car feels warm to the touch at 12 noon but quart of water right next to it is unbearably cold. They have both been in the sun for the same amount of time in almost the same location. What’s up with that?
I do not suppose that your car is transparent, as the water is. What color is it?
I can’t bear to touch ice, either.
David Wojick
Does the transparency of water influence it’s ability to absorb heat from the sun? I suppose it probably does. In this case the water is the color of water high in tannins.
I was making an obtuse comment, essentially agreeing that the deep oceans, covering most of the earth, have a profound buffering effect on the climate. I do understand that the winds are driven by the uneven heating of the earth and, in turn, the winds effect surface currents, but the oceans of water, with it’s peculiar properties, have an outsized effect.
Water isn’t transparent to IR – it is black. IR penetrates nm.
It is pretty transparent to short blue, violet, and UV – that penetrate up to 200 meters (200 billion nm).
Some fish can see in violet and UV wavelengths.
The albedo of water certainly impacts upon the ability and effectiveness of solar heating. There is a significant difference in temperature of swimming pools whose liners are dark blue (warmest), light blue (not so warm) , and white (coolest). A neighbour of mine has a darker blue tiling and his pool is 1 to 2 degC warmer than mine, and I think that he has a little less sun (but probably that is just a little less morning sun).
Of course, one sees this effect when one compares a white car to a black car. On a black car one can fry an egg, whereas the white car is simply warm to the touch.
But the issue here is not albedo but one of heat capacity, thermal capacity and thermal mass. A thin sheet of metal quickly absorbs the solar energy, and having good conductivity, quickly converting it into an increase in heat whereas the thermal lag of water by contrast is great and whilst energy is being absorbed due to its large heat capacity the response is slow.
Richard,
“… whereas the thermal lag of water by contrast is great and whilst energy is being absorbed due to its large heat capacity the response is slow…”
Thanks for your response. My point was the large heat capacity of the immense ocean. I suspect the ocean has a tremendous buffering effect on changes to climate. Then there are the effects of the triple point of water, ice, rain, the ozone, and plate tectonics. It is not easy to warm the planet.
Ref: Contribution from Working group I; On the scientific basis; to the fifth assessment report by IPCC; Page 257)
“Ocean warming dominates the total energy change inventory, accounting for roughly 93% on average from 1971 to 2010 (high confidence). The upper ocean (0-700 m) accounts for about 64% of the total energy change inventory. Melting ice (including Arctic sea ice, ice sheets and glaciers) accounts for 3% of the total, and warming of the continents 3%. Warming of the atmosphere makes up the remaining 1%.”
Because of the different heat capacity of the oceans and the atmosphere – the amount of energy which would heat the atmosphere by 1 K (Kelvin) will only heat the oceans by 0.001 K. Any lack of warming of the troposphere can be excused by a minuscule change in ocean temperature. Changes that are so minuscule that they cannot be measured with sufficient accuracy. And we don´t have a proper record of the oceans.
Is the theory testable? No. Falsifiable? No. Scientific? No.
Here are some more data, links and background information:
Mass of the atmosphere: 5.1 E+18 kg
Specific heat capacity of air: 1 kJ/kg*K
Heat capacity of the atmosphere: 5.4 E+18 kJ/K
Mass of the Oceans: 1.4 E+21 kg Mass of the Oceans
Specific heat capacity of sea water: 4 kJ/kg*K
Heat capacity of the oceans: 5.88 E+21 kJ/K
Heat capacity of the atmosphere / Heat capacity of the oceans = 0.001
In the following paper, Trenberth and collaborators argue that the ‘missing’ heat is sequestered in the ocean, below 700 m:
Ref: “Distinctive climate signals in reanalysis of global ocean heat content” (Geophysical research letters – first published 10 May 2013)
“The deep ocean has continued to warm, while the upper 300 m OHC appears to have stabilized. The differences in recent trends among the different ocean layers are profound. The small warming in the upper 300 m is belied by the continuing warming for the ocean as a whole, with considerable warming occurring below 700 m.”
«The deployment of the Argo floats from 2000–2004 is a revolution in the ocean observing capabilities and it is only after 2003 that regular and spatially homogenous temperature soundings of the upper 2000 m are available»
(Dr. Kevin Trenberth was a lead author of the IPCC’s 2nd, 3rd and 4th Assessment Reports.)
….
However the ocean temperatures below 700 m pre – ARGO must have an extremely large uncertainty – as illustrated by this animation by Bob Tisdale:
https://bobtisdale.files.wordpress.com/2013/03/nodc-temp-obs-at-1500m.gif
“There is so very little observational data at depths greater than 700 meters that the NODC elected not to present the data in 3-month blocks. They used 5-YEAR windows, in one year steps, what they refer to as pentads. That is, for example, a temperature measurement in 1959 will be used for the pentads of 1955-1959, 1956-1960, 1957-1961, 1957 [oops] 1958-1962 and 1959-1963.”
Ref: https://bobtisdale.wordpress.com/2013/03/11/is-ocean-heat-content-data-all-its-stacked-up-to-be/
To summarize – that’s what I call a dead parrot.
The thing I have never understood about the ‘hiding in the deep oceans’ thing is:
It seems like it always implies that someday the heat will rise up in an almighty zombie apocalypse and fry us all. But why shouldn’t it ‘hide’ in the deep oceans forever? And for that matter, why shouldn’t it go on down, into the ground below the ocean?
‘The combination of satellite and temperature data gives
us a glimpse of how much sea level rise is due to deep
warming.’ said William Lovel of NASA’s Jet Propulsion
Laboratory. (JPL.)’The answer is not much.’
http://iceagenow.info/2014/10/nasa-stumped-deep-oceans-warmed-2005/
Thanks for the info. I wish I knew more about thermodynamics and heat transport. I would love to see more postings about the effects of the oceans upon climate.
“I wish I knew more about thermodynamics and heat transport.”
I wish United Nations IPCC knew more about thermodynamics and heat transport. By United Nations theory – Energy is supposed to:
– Be trapped by increasing levels of CO2 in the atmosphere
– without warming it!
– Pass the upper 700 meters of the oceans
– without warming it!
– Hide in the deep oceans below 700 meter
– where it cannot be measured within reasonable uncertainty levels
I wish they knew enough to realize that: That is beyond reason – that is a falsifying experience – at the very least that is a reason to suspend judgement – a reason to stand against attempts to save the theory by another set of ad hoc excuses and inductive reasoning in favor of the theory – a reason to stand strong against justificationism.
Roy – the implication heat will rise up from the abyssal ocean is something skeptics created by torturing a quote from Kevin Trenberth. Added to that was the usual and unfortunate invocation of hearsay from anonymous insiders who allegedly claimed Trenberth was openly advocating the violation of the 2nd law, which is just about as absurd as absurd gets, but the absurd allegations those anonymous insiders project an outsized effect in the delusional blogoshpere which why they keep getting invoked.
He never implied any such thing. Years ago, Gavin at RC clearly stated the oceans do you think is being implied.
Deep is a term that covers a just about anything. Abyssal has meaning. Under 2000 meters has meaning. 0 to 300 meters has meaning. When somebody says the heat is hiding in the deep ocean, they have said nothing much at all, so why pay any attention to it unit they define what on earth they mean by “deep”?
For being a person that has all the answers you sure ask a lot of questions.
The answer is you are on the side of the people who tortured what Trenberth said.
I stopped believing in AGW when Phil Jones stated that he had ‘dumped the historical data to save space’. That’s all.
Well, now you know when you made your mistake.
Did Phil Jones, make a mistake?
You are on to something with heat capacity. I believe the most significant factor affecting global warming has to do with loss of water tables and loss of riparian plant cover in 30 degree latitude desert locations such as North Africa and North America. I believe the Roman Empire is the cause of the current global warming trend
@veeray2
I think it will be an near impossible challenge to deduce necessary consequences of that idea and to test the idea by comparing predictions from the idea with empirical observations.
Why would it be hard to include land heat capacity in climate models? in fact why isn’t it part of the model? why wouldn’t it be? Seems to me that if anything it would help the computer model get on track and be more realistic because land heat is a contributor to climate heat. I’m not sure why we would be considering models that don’t factor that in.
Plant cover is more than just a sequestering source for carbon, it also raises the heat capacity of land. That is critical cooling to the air especially at equatorial and sub tropical latitudes.
Basic biogeography points to landmasses as heat generators because of their low heat capacity. I believe the certification of North Africa dating back to the Roman Empire and desertification of the North American continent in recent times are significant contributors to global warming.
I am currently working on the detailed CET reconstruction from 1230 to 1290AD and to put it into context looking in broader terms at the decades that surround it.
The temperature rises to a peak similar to today at around 1520 to 1540 which includes several epic heatwaves, including a heatwave and drought that lasted eleven months in 1539/40 and another in 1525
The 13th century is an era of considerable volatility with some very warm decades at the end but what is most noticeable are the severe weather events of which the most notable is prodigious amounts of rain.
No sign of a significant deterioration in climate from 1258 despite the claims of the very long lasting effects claimed by Dr Mann and miller whose tree rings and moss respectively do not match the observations. Having said that, 1258 itself was a horrendous year but the volcanic effects were very short lived.
So a general warming for 350 to 400 years seems about right but not in a smooth linear fashion.
The title of the article is ‘tranquility, transition and turbulnce’ for what will Become obvious reasons.
Tonyb
We look forward to it!!!
Have you tried looking at the crop record in Galicia, or diaries kept by monks at Santiago de Compostela?
“… including a heatwave and drought that lasted eleven months in 1539/40…”
This was during Catherine Howard’s short reign, and was well noted in the contemporaneous texts. In fact, even in the Canadian TV series, The Tudors managed to pick up on that one.
I look forward to seeing your reconstruction in due course, and keep up the good work of putting the England’s climate in perspective so that one can get a better appreciation for the bounds of natural variation as it impacts upon the Climate of Central England.
Richard V seems to suggest that CET is not a good proxy for NH temperature trends. If so, I beg to differ.
Dr. Curry,
Why don’t more climate scientists think and ask questions like you do? Perhaps you were better suited to have a career in aerospace or mechanical engineering. Our retired NASA Apollo Program veteran scientists and engineers research team, The Right Climate Stuff research team, asked these same questions and laughed at the IPCC AR5 Figure FAQ10.1 (and the similar figure and discussion in AR4 when we started our independent assessment). It is downright silly, embarassing and totally incongruent with the Scientific Method to claim proof of an AGW theory using output of un-validated climate models such as attempted in AR5 Figure FAQ10.1. It didn’t take our research team very long to smell a rat.
Yes, there is good evidence that burning fossil fuels will cause some warming, but clearly natural climate variations are important also. Our key observation, ignoring climate models and focusing on climate data, is that CO2 climate sensitivity has been far overstated by the IPCC and its disciples, primarily because of their misguided allegiance to un-validated computer models that engineers dealing with public safety issues would completely ignore. TCR is not that uncertain and a growing body of research focused on observational estimates of TCR shows is isn’t likely larger than 1.2-1.4C, indicating transient climate feedbacks are small. Even more accurate is TCR(1+beta) = 1.8C where beta is the historical fraction of CO2 radiative forcing due to other GHG and aerosols.
68 years of cooling prior to the age of the automobile
Laugh at the IPCC all you want.
64 years of cooling.
Change the dates and you get z150 years of warmimg
http://www.woodfortrees.org/plot/hadcrut4gl/to:2014/trend/plot/hadcrut4gl/to:2015
Tonyb
JCH,
Is it still ok to call a black dog black if you find one white hair?
Just wonderin’ …
Any reason you can’t plot using the same data sources?
http://www.woodfortrees.org/plot/hadcrut4gl/from:1914/trend/plot/hadcrut4gl/from:1914/compress:12
Gee, 2015 looks about the same as 1879.
JCH | November 16, 2015 at 2:40 pm | Reply
68 years of cooling prior to the age of the automobile
Laugh at the IPCC all you want.
You make a good point – but we really don’t have very good data until the 90s.
If we don’t do anything about global warming until 2100 we will have enough instrumental data to compute the CO2 forcing accurately, and to determine if the 90s were a short term trend.
You guys apparently have never experienced a real hiatus. A year or so ago people were conjecturing that the modern hiatus might last until 2030.
Not me.
I was speculating it was about to go paws up – die.
See, with a real AMO falsifyin’ hiatus, the hiatus actually lasts a long time; as in, as long as 64 years instead of just 8 or so years.
18 years long my butt. RSS is for d___mies.
Anyway, with October, the pause has started coding. The DNR clipboard is hangin’ on the bed.
JCH
Well that all depends upon how the current strong El Nino pans out.
Will we see a long lasting step change in temperatures coincident with the 2015/16 El Nino, just as there was a step change in temperatures coincident with the 1997/8 Super El Nino?
Or will the current strong El Nino simply result in a short term blip in the satellite data record such that a following La Nina brings temperatures right back down and thereafter the temperatures continue to pan along the 2001 to 2003 anomaly level.
But if there is no long lasting step change coincident with the 2015/16 strong El Nino, by 2019/20 the ‘pause’ will then be well over 21 years in duration, possibly even 25 years in duration, and one can expect to see ever more papers putting Climate Sensitivity at ever lower levels. This follows since as the ‘pause’ lengthens Climate sensitivity (if any at all) must likewise decrease, unless of course, natural variation is getting more and more negative so as to counter-act the warming forcing of CO2 (if there be any such warming forcing at all at levels of CO2 exceeding say 380 ppm).
Let’s see how things pan out.
After a big EL Nino, the GMST just gets higher and higher.
And that was with a declining PDO. Persistently declining. Now we have a inclining PDO. It may not have peaked in 2014. It could easily go higher. PDO ramp ups can last for several years. Time will tell. They often have back-to-back EL Nino events.
In short, La Nina is not going to save your lousy take on science.
Read it and weep. PDO persistently declining. GMST still went way up; completely overpowering negative natural variation.
The PDO is a beast; ACO2 is a much bigger beast. That is why ACO2 won this cage match.
The toaster is now working on both sides, not just one side.
It’s a little unseemly prancing so delicately around the pale fire of airy equatorial warming; meanwhile, the sea beneath cools.
=================
The sea beneath cools exactly how? In major EL Nino events there can be a temporary drop in OHC. It comes right back. in most El Nino events OHC continues to go up.
As for the abyssal, Wunsch says he can’t prove he’s right, and he can’t prove they’re wrong. Call it a draw. Wunsch did find significant warming in the actual deep water of some basins.
Jch
I heard Thomas stocker say at an ipcc panel climate conference that we did not have the technology to measure the deep oceans. Other speakers confirmed this.
Tonyb
It does not mean we know nothing. We know a great deal.
The ipcc panel didn’t think we knew anything. You obviously have inside information. Not from Purkiss was it? Our knowledge of the abyssal ocean is almost zero. If you know better post the evidence.
Tonyb
Given the cumulative nature of CO, sustained emissions reductions are necessary if warming is to be kept below any agreed limit. – T. Stocker
I guess you’re fully on board with all of his opinions.
JCH | November 17, 2015 at 6:52 pm |
The sea beneath cools exactly how? In major EL Nino events there can be a temporary drop in OHC. It comes right back. in most El Nino events OHC continues to go up.
As for the abyssal, Wunsch says he can’t prove he’s right, and he can’t prove they’re wrong. Call it a draw. Wunsch did find significant warming in the actual deep water of some basins.
Anyway, with October, the pause has started coding. The DNR clipboard is hangin’ on the bed.
One would expect the dismal ocean to cool in an El Nino since the upwelling is less. Because the upwelling is less the ocean surface is warmer.
http://www.rlmartin.com/rspec/whatis/images/Study1-3.gif
Not an expert on El Ninos – but the ocean loses most of its heat to evaporation and that is dependent on wind speed as hurricanes often demonstrate.
El Nino with less upwelling and less trade wind warms the upper ocean, La Nina with more upwelling and stronger trade winds cools the upper ocean.
Unless you are measuring between ONI neutral points (the midpoint of the roller coaster) playing the whole warming/cooling game during a strong El Nino/La Nina is the factual equivalent of a drive by shooting.
Obviously the ocean lose heat all the time.
The sun drills light into the upper ocean. Greenhouse gases inhibit the loss of that energy. There is a persistent imbalance at the top of the atmosphere. ACO2 is increasing each year. This means there is more E in than out. In this circumstance, on net, the oceans are warming as a lot of the energy is going into them and being progressively slowed on its exit. In this circumstance, OHC rarely goes down. Some volcanos and a few very powerful El Nino events are the major exceptions, and the lost OHC is quickly restored.
Nonsense, the anomaly of -0.2 has happened throughout the period. Drawing some red line through the data means nothing.
Ignore the millennial at your perennial. Sure, the ocean cycles are long, sure the solar cycles are long, sure all their variations are long, and sure they’ve had a long time to mesh, unmesh, and other such mishigas.
===================
See-saw Marjorie Daw,
Seems climate was ever thus
And weather likely even worse.
http://climatereason.com/Articles/
The ocean cycles are long
But the Earth is patient
Gaia pauses at her loom,
Fingers busy, brain a boom.
===================
Good stuff, but it might be better if the figures were numbered, for easy reference. The Berkeley Earth reconstruction is interesting in that it indicates that it may have been as warm in the late 1700s as it is today.
However, one cannot (that is, should not) calculate confidence intervals from convenience samples, which these surely are. Confidence intervals require random samples from the entire population, which in this case is the whole earth.
I agree that the Berkeley’s confidence intervals aren’t very useful here
“Confidence intervals require random samples from the entire population, which in this case is the whole earth.”
read what you just wrote
New York harbor froze solid during one winter of the revolutionary war. That winter that was even worse than the one spent at Valley Forge. I kinda doubt those late 1700s were quite as warm as today.
Could the CO2 hiatus be caused by the Grand Hiatus (by increased CO2 uptake), rather than the other way around?
yes, that is exactly what it looks like
Dr. C., where does this co2 hiatus come from, ice cores? Here’s one of ferdinand’s graphs which shows a steady rise of about 3 ppm per decade up until MLO:
http://www.ferdinand-engelbeen.be/klimaat/klim_img/antarctic_cores_001kyr.jpg
Furthermore, if there is any relationship between temps and carbon, it is best reflected by a change in temperature (not a hiatus) affecting the change in the carbon growth rate as shown in bartemis’ graph:
http://www.woodfortrees.org/plot/esrl-co2/from:1959/mean:24/derivative/plot/hadcrut4sh/from:1959/scale:0.22/offset:0.10
Would you please elaborate on where they get this “co2 hiatus” from? Much appreciated…
Arthur
Dr. C., i’ll assume they got the co2 hiatus from ice cores here. Could it be that the “hiatus” is really just an artifact caused by smoothing perhaps? If you extend the temperature part of bart’s graph backward in time, we can guess that co2 stood at 300 ppm circa 1940. (before that there is a drop in the carbon growth rate with much lower temps) Before the hiatus, smoothing would produce higher numbers in the core as numbers were increasingly stable below, but increasingly growing from above. After the hiatus, smoothing would produce lower numbers in the core as lower concentrations would likely migrate higher due to pressure. The hiatus, then, would be a transition between the two periods (before and after) resulting in no apparent change in co2 levels…
[a little added clarity after having “slept on it”… If the REAL numbers from 1940 to 1960 go from 300 ppm to 315 ppm, then the numbers early on get skewed upward (but progressively less so as time goes on) by smoothing. The numbers later on, closer to 1960, are brought lower (this time progressively more so) by smoothing. The end result being an apparent hiatus…]
with respect to “It is seen from the figure with both natural and human forcing that climate models simulations agree with observations very well during the period 1970-2000.” isn’t this because the models were fitted and tuned to match this period?? that would be much like me saying my prediction for last weekends football games matched well since I just said the winning team is the team I picked to win.
Cheers,
Joe
“isn’t this because the models were fitted and tuned to match this period?”
It seems so – judging by the assessment report by IPCC:
«When initialized with states close to the observations, models ‘drift’ towards their imperfect climatology (an estimate of the mean climate), leading to biases in the simulations that depend on the forecast time. The time scale of the drift in the atmosphere and upper ocean is, in most cases, a few years. Biases can be largely removed using empirical techniques a posteriori. …»
(Ref: Contribution from Working Group I to the fifth assessment report by IPCC; 11.2.3 Prediction Quality; 11.2.3.1 Decadal Prediction Experiments )
Further -IPCC used circular reasoning to exclude natural variability. IPCC relied on climate models (CMIP5), the hypotheses under test if you will, to exclude natural variability:
“Observed Global Mean Surface Temperature anomalies relative to 1880–1919 in recent years lie well outside the range of Global Mean Surface Temperature anomalies in CMIP5 simulations with natural forcing only, but are consistent with the ensemble of CMIP5 simulations including both anthropogenic and natural forcing … Observed temperature trends over the period 1951–2010, … are, at most observed locations, consistent with the temperature trends in CMIP5 simulations including anthropogenic and natural forcings and inconsistent with the temperature trends in CMIP5 simulations including natural forcings only.”
(Ref.: Working Group I contribution to fifth assessment report by IPCC. TS.4.2.)
“Biases can be largely removed using empirical techniques a posteriori”
This sounds about right. There seems to be a lot of posterior in their technique.
“Biases can be largely removed using empirical techniques a posteriori”
That’s how I panel beat.
Seriously, really?
Oh yes – I´m dead serious – can you believe it? – page 967:
https://www.ipcc.ch/pdf/assessment-report/ar5/wg1/WG1AR5_Chapter11_FINAL.pdf
Remarkable bird, the Norwegian Blue, idn’it, ay? Beautiful plumage!
“Biases can be largely removed using empirical techniques a posteriori”
That’s how I panel beat.
– ghl
Thanks ghl – nice put :) :)
A comment on uncertainties. The Jevrejeva et. al. (2008) SLR reconstruction from tide gauges has a slow period from 1910-1940 (below trend), followed by a fast period to about 1975 (above trend). Counterintuitive pattern, probably at least partly measurement uncertainty all around. Plus, it is very unclear (despite CAGW theory) that either temperatures or precipitation on the three great SLR controlling ice sheets (Greenland, WAIS, EAIS) follows the global average. There are powerful but poorly understood regional factors evidenced by the past couple of decades.
1910 to 1940, the PDO is the master of ceremonies wrt the Global Mean Surface Temperature
Did the period experience a dominance of El Nino over La Nina?
The R value of the atmosphere is never listed in models, just temperature and CO2 predominately. yet the R value determines how many gigatons of water is lifted off the surface by heat. This heat is radiated to space with the physical form change from gas to liquid or solid and this super or sub cooled water returns to Earth for further cooling. It can scale virtually unlimited and will keep temperatures somewhere on Earth with the phase change range of water so life continues to exist on Earth. Proof is life still exists on Earth.
The Sun and the Earth’s core are the dominate energy inputs, the Earth’s surface Energy radiative rate is affect by the atmosphere’s R value. The Hydrothermodynamic Cooling system of Earth makes up the difference between inputs and outputs.
This affects geo-weather too. Heat melts Rock like ice and this thuderhead of magma rises high in the geo-sky to bring heat to sea level, thus balancing the core`s heat output when it’s radiative rate is slowed by the R-value of the gas atmosphere. It can scale and the move crust generally south to north as the magnetosphere flow. Flow tectonics is plates flow in a repeating conveyor belt like flow. With the Mid-Atlantic spread provide east west direction for Eurasia and the Americas the grind north with the pacific plate. (youtube flow tectonics for more info)
The point is our models are to narrow in scope of factors and large scale factors need to be included, including deforestation since man has been here, We broke the Sahara Forest with worldwide deforestation now we are breaking California…..
“We broke the Sahara Forest with worldwide deforestation now we are breaking California…”
What do you mean?
As man start to tech up with fire, cooking, warming, pottery, field clearing, charcoal making for metals, we started to deforest the Earth and the worldwide net effect was to change the weather flows as the standing columns of water know as trees where cut down and burned to change the heat absorption properties of the Hydrothermodynamic system of the Earth. and it also change the composition of the air along with it’s R value. Our population grew with this fire technology thus it got bigger until it became very noticeable with prehistoric forest burning in the age of fossil fuels.
As we learned to use,fire for cooking, warmth, pottery, metals, our populations grew and deforestation began, changing the flow of the weather and the water distribution on the planet.
Ok, thanks. But what about California, in particular?
Have you read the book “The Long Summer” by Brian Fagan? I think it’s fascinating and entertaining, as is his book “The Little Ice Age”.
The funny thing about the USA is that FFs allowed us to expand forests, as land used to feed work animals was returned to forest and woodland. Things get complicated, wicked even.
Have not read “The long Summer yet, will check it out. Funny thing about the Ice Ages is the terminal moraines, why are they they formed? to make mile high glaciers that cover pole caps on down requires maybe record amounts of ice and snow to fall from the sky. And heat is the only thing I know of to take it from sea level and put it in the sky in amounts to make the massive Ice sheets and glacier. (I digress)>
California seemed to be a desert when the Petrified Forests of AR. ,NV. and Utah was growing. This would suggest that when we see the sky start to have a prehistoric composition and R value, then The petrified forests will start to grow again and Cali won’t get the rain like it used to in lower R times. Course the Labaira Tar pits show vegetation still was in that water shed.
Every hot event in one hemisphere is balanced by a cold event in the other. Size and scale can be calculated or estimated in the energy budget of the Earth. Input rate and output rate over a time unit shows how large the water events will be to carry the heat up to space and bring the coldness of space down. And the R value of the atmosphere due to it’s composition is a lever Mankind stumbled upon.
2 more things, we cut down the forests of Europe, the Mid east cleared the,Eastern N. Americian hardwood forest for farmland, cut down the mid mountain forest to lay RR ties for the Transcontinental RR. and now Indonesia and South American forests are being burned to put in grasslands and 6 ft tall crops. Trading hundred of canopy height for the short crops we grow is probably a loss overall rather than a gain.
And Salt Lake is growing, it used to be called Lake Boniville and cover half the state of Utah, like Lake Pyramid did Nevada. The point is if the Cali drought continues and the rain is heat driven over the mountains, then water may be found by them over there, maybe in a short time frame.
Every hot event in one hemisphere is balanced by a cold event in the other.
No, ice core data shows Antarctic and Greenland coming out of the last major ice age at the same time. http://popesclimatetheory.com/page85.html
Shorter cycles are somewhat leading or lagging, but Longer cycles try to stay to stay closer together.
The thermostats in both hemispheres is the temperature that Polar Oceans thaw and freeze and the ocean mixing is enough that they never get out of sync. Temperature on earth is bounded because it snows more in warm times and it snows less in cold times.
to make mile high glaciers that cover pole caps on down requires maybe record amounts of ice and snow to fall from the sky. And heat is the only thing I know of to take it from sea level and put it in the sky in amounts to make the massive Ice sheets and glacier.
The ocean levels were higher and the oceans were warmer and that did provide the moisture for the snowfall that put the water from oceans on land as ice. There is not enough water in the oceans for that to happen now. You would need to melt most of Greenland and much of Antarctic, first, to get enough water in the oceans to create another major ice age.
Every hot event in one hemisphere is balanced by a cold event in the other refer to our regular summer winter cycles in the hemispheres.
In a ice age,it appears Ice does not melt in the summer in either hemisphere but just keeps growing until they advance and recede from the terminal moraines, so the hot events are in the middle area. Not much of a summer in either pole when the ice age is here compared to the summers when it is not. Since the whole world does not appear to freeze during a ice age, the must be massive ice making going at the pole driven by heat lifting oceans of water to the sky from the equator where it is pushed by the expanding air and vapor to the poles areas where it returns to the surface and follows cold land like a culvert between warmer expanding ocean air back down to the equatoral region.
So yes, I agree the poles ice should advance and recede at the same time like your website shows.
“No, ice core data shows Antarctic and Greenland coming out of the last major ice age at the same time.”
However, the energy source of the ice age has not shown up yet and looking around with our satellites nothing seems to out of the ordinary except the changing R value of the atmosphere….
And if, ” You would need to melt most of Greenland and much of Antarctic, first, to get enough water in the oceans to create another major ice age.” then it would make sense that we would see ocean levels drop alot instead of rise. Then all those underwater temples would be above the oceans again. Only in a ice age or maybe a changed R value age….
Well J J, fossil fuels use actually up less landscape
than them miles ‘n miles of wind turbines and solar
panels required to supply global energy needs. Why,
to meet present US energy needs, you’d require solar
panels covering an area the size of Spain, or wind
farms the area of Kazakhstan.
And we are actually reforesting land because we’re
also taking up less land for farming with more efficient
farming production even with a growing population.
Organic crops, wood and bio-fuels actually need
more land, land, lotsa’ land, than efficient modern
practices, but Green activists like to ignore the
inconvenient facts. .
Well if I had a farm or vineyard, I would plant rows of solar panels on poles spaced apart so I could drive my tractor there and plant crops. This would partially shade the crops of the hottest stressing sun and cut down on irrigation amounts. I would drop the electricity off at the local substation and with the money from the sales, I would be able to stay on my farm and pay the taxes. Or I could buy the waterless farms and vineyards of California for half pennies on the dollar.Who wants land with no water? Me. Then San Fran could buy my electricity and I could use the money to process their free sewage and water into water for my vineyards and farms while I process the sewage and biomass into bio-oil which I sell to the local refinery as a drop in oil. I use solar electricity for the energy to do that during the day so the bio-gasoline and oil can be used when needed. If the farms surrounding Chicago and chinese cities did the same thing, maybe just maybe, rain would fall out of the sky like it used to do in the recent past, At that point, I would sell the farms and vineyards at a profit.Then I would do this, google USPTO 8884457 , heck I might just start there and see if I can’t get a line of them anchored of a dam in the Columbia River before shipping Worldwide.
“Or I could buy the waterless farms and vineyards of California for half pennies on the dollar.Who wants land with no water? Me.
So Jonathon, are you doing this now? I suspect not because it doesn’t work. The cost of land, equipment, maintenance and taxes would in no way pay for the pitiful amount of intermittent power you would sell. Not even if taxpayers help you buy the equipment and pay most of what you would want for the electricity, which is largely worthless once society pays for the extra infrastructure required to utilize it when needed.
No, you are just throwing a pie in the sky and calling it proof that the world should do what you want. If you think it is a trivial process then do it yourself and make yourself rich and the world better. Your inaction disproves your claims.
will keep temperatures somewhere on Earth with the phase change range of water
The Polar Oceans freeze and thaw at the same temperature and keep the ice on land regulated to keep the polar ocean temperatures regulated. The rest of earth follows as best it can.
It is extremely likely that more than half of the observed increase in global average surface temperature from 1951 to 2010 was caused by the anthropogenic increase in greenhouse gas concentrations and other anthropogenic forcings together.
It always surprises me, though it oughtn’t any more, how they jump from a statement of combined effects to a campaign against fossil fuels. What are the best estimates of the magnitudes of the “other anthropogenic forcings” provided by the IPCC? Can they be derived independently of the estimated sensitivity to CO2?
Good point. I think there is a large and largely contradictory literature on this. For example, if land use changes account for 30% of the warming, as has been claimed I think, and CO2 is just one of the GHGs, among many, then one cannot estimate CO2 sensitivity from the historical warming (assuming this exists and is known with accuracy). Too many confounders.
Unfortunately, the complexity of reality is the enemy of public policy. Paris beckons.
wrong.
what you estimate is lambda.
The overwhelming uncertainty in determining TCR from historical data is the uncertainty about the historical net warming or cooling effects of aerosols as discussed in Lewis and Curry (2014). However, if one considers that the net historical effect of other GHG and aerosol forcing since 1850 is some uncertain fraction of CO2 radiative forcing defined as “beta” (beta is about 0.5), and that beta will not change significantly from its historical value as CO2 continues to rise in the atmosphere ( a reasonable assumption for the approximately 65 years to go until atm. CO2 doubles its 1850 value of 285 ppm), then the total AGW temperature rise due to a doubling of CO2 levels and cumulative effects of all other GHG and aerosols is TCR(1+beta).
This constant can be determined much more accurately than a unique value for TCR from historical data of GMST rise and atm. CO2 rise and has a value of 1.8C. If analysis of historical data on GHG rise and net effects of aerosols establishes beta = 0.5, then TCR = 1.2C. But, beta is uncertain and might be as low as 0.4, in which case TCR = 1.3C. But, TCR(1+beta) = 1.8C and only has uncertainty introduced by uncertainty in the historical GMST and CO2 level rise. The more accurate (than TCR) historical value of TCR(1+beta) = 1.8C can be used for forecasting AGW as a function of CO2 rise in the atm. much more confidently than with complex climate simulation models.
When one extracts the metric TCR(1+beta) from historical on CO2 net effects and GMST rise since 1850 we find that TCR(1+beta) = 1.8C more much more accurately determined from
Steven Mosher: what you estimate is lambda.
Who?
Sometimes brevity is the soul of witlessness.
Are you responding to this? Too many confounders.
There are too many confounders to get an estimate of the CO2 sensitivity. Each purported estimate depends on some as yet untestable assumption about the magnitudes of the confounded effects.
mathew
lambda is sensitivity
lambda = change in temp/ change in forcing
“For example, if land use changes account for 30% of the warming, as has been claimed I think, and CO2 is just one of the GHGs, among many, then one cannot estimate CO2 sensitivity from the historical warming (assuming this exists and is known with accuracy). Too many confounders.”
it’s not that there are too many confounders.
You have all your forcings.. c02, land use, aerosols, methane…
each of those is of course uncertain. you combine the forcings to get
total forcings… with uncertainty of course.
From that you estimate lambda. The climate sensitivity.
from there to sensitivity to c02 doubling is easy… multiply by 3.71
The issue isnt confounding. the issues are
A) collecting good estimates of all the forcings.
B) assuming they combine in a linear fashion.
C) assuming that internal forcing nets to zero over the period of interest.
Steven Mosher: The issue isnt confounding. the issues are
A) collecting good estimates of all the forcings.
B) assuming they combine in a linear fashion.
C) assuming that internal forcing nets to zero over the period of interest.
When the forcings have been changing during the period that has been measured, then confounding is in fact a serious issue. Why do you say otherwise? Confounding prevents the attainment of good estimates of all the forcings, and prevents appraisal of B and C.
wrong
what you calculate is bs
Thank you again!
Just proofreading:
“Now compare figure 10.19 with figure 5.9 above.”
Maybe it should be:
Now compare figure 10.19 with figure 5.7 above.
In your first figure, in about 1885 and 1962 the models drop down sharply, then resume their steady rise. This drop is due to volcanic activity in the models. But, as Willis Eschenbach has noted some time ago, the response is unphysical. If you delete these particular drops, the models are unable to match the temperature pattern and just go steadily up and would be way overshooting by 2000.
Uncertainty in the global temperatures data (prior to 1900) is far too great.
Some of the central/west European data including the CET are the only ones worth of the longer term serious consideration.
The CET clearly shows that the rate of the winter’s warming is more than 4 times greater than the rate of the summer’s warming.
http://www.vukcevic.talktalk.net/CET-s-w.gif
I have some ideas why that may be so, but formulating a working hypothesis is a different matter. Further more detailed spectral analysis of the summer’s temperatures data shows no distinct multidecadal periodicities, while the winter’s data does.
Vuk, in the early CET years, the ocean was colder from the low solar activity of the Maunder Minimum. The ocean is now warmer from the solar activity increase since then, which peaked at the end of the solar modern maximum in 2004. Warmer oceans in winter lead to higher winter temps moreso than higher summer temps at the CET latitude.
In case anyone wasn’t sure, the sun caused ‘global’ warming.
Sunspot activity was 65% more active for 70 years during the modern solar maximum from 1935.5-2004.5, when the annual average SSN was 108.5, than it was during the previous 70 years from 1865.5-1934.5, when it averaged 65.8, using http://www.sidc.be/silso/DATA/SN_y_tot_V2.0.txt.
I should point out that the v1 SIDC SSNs were 89% higher during the modern maximum, vs 65% for v2. AFAIK, the TSI reconstruction below is based on v1, http://www.sidc.be/silso/DATA/ARCHIVE/V1.0/yearssn.dat.
The versions differ but the modern maximum readily stands out in both.
https://i1.wp.com/spot.colorado.edu/%7Ekoppg/TSI/TIM_TSI_Reconstruction.png
there is no modern solar max
yes there is a modern solar maximum
https://en.wikipedia.org/wiki/Modern_Maximum
-douchebag
A more realistic TSI reconstruction is this:
http://www.leif.org/research/TSI-Based-on-New-Sunspot-Group-Number.png
“Uncertainty in the global temperatures data (prior to 1900) is far too great.
Some of the central/west European data including the CET are the only ones worth of the longer term serious consideration.”
This is funny.
There are no reliable past or present temperature data, it is just that some of them are much worse than others
///
This is spot on.
The satellite has the best coverage and suffers least from UHI and errors in TOB homogenisation, station drop outs etc, and is verified independently against radiosonde temperature measurements, but it is only of short duration.
The time series land based thermometer records are hopeless (not simply because of question adjustments and homogenisation, and instrument error bounds) but also because that throughout the time series the stations used with which the data is being compiled, at any one moment of time, is continually changing, so too their spatial coverage, such that at no time is like with like ever comparable. One simply cannot compare the temperature anomaly of say 1880 with the anomaly of 2010 because very different data is being used to compile the 1880 record than is being used to compile the 2010 record. Quite simply, no scientific comparison can be made given the way that the data is presented as one single time series. If you wanted to go back to 1850 to date, one would need 165 different series o that a comparison could be made over time..
ARGO is potential the best series, but spatial coverage is poor and the duration is short. Further when ARGO was first rolled out, it showed that the oceans were cooling. NASA thought this to be erroneous, so they simply removed from the data set those buoys that were showing the greatest amount of cooling, and hey presto ARGO suggested ocean warming.
Now it may have been that there was some instrument problem, fault or calibration error. NASA might have been right to have been concerned, But the scientific approach would have been to select a random sample of the buoys that were showing the greatest trend in cooling, and a random selection of buoys showing the greatest trend in warming and return these to the laboratory for testing.
However, there was no independent laboratory test performed to ascertain whether there was truly instrument error. And if there was instrument error, there was no independent testing to ascertain whether this error worked both ways, ie., produced not only erroneous cooling, but also erroneous warming.
The approach to this smacks of preconceived bias, and is unscientific, so ARGO always needs to be viewed with a measure of caution since it is possible that some legitimate data has simply been removed because it did not fit in preconceived bias groupthink
What happens when Argo data all by itself proves there was no pause.
Steven Mosher,
You wrote –
“What happens when Argo data all by itself proves there was no pause.”
Are you exceptionally dim, or just pretending to be so? Do other Warmists share your strange logic?
Cheers.
mike flynn.
just wait.. this will be too funny
Steven Mosher,
Your lot are always saying “Just wait, you’ll see.”
You can’t tell when, where, what, how much, or any specific consequences. Mainly because you are all clueless about the future – although if I saw facts to demonstrate otherwise, I’d change my mind.
I’ll let others do the laughing. I wonder what Warmists have against directing their efforts to reducing the death toll from preventable deaths in US hospitals, for example. Have you any got any good reasons for avoiding worthwhile pursuits?
Cheers.
Hi Steven
Hope all’s well. Funny, yep, nearly on the par with calling the concoction of numbers the ‘BEST’, which is more than just funny, it’s comic;
but then I ‘do climate’ strictly for my own personal amusement, so I’m pleased that you also find it entertaining.
http://www.vukcevic.talktalk.net/Bdata.gif
vuk read what you wrote.
ask your yourself… how did you judge the records as reliable?
think.
Hi again
Thinking is a time consuming process, I have no time or the patience for such frivolities.
There are no reliable past or present temperature data, it is just that some of them are much worse than others; hence there are no the ‘best’, perhaps only the Cautiously Estimated Temperature data.
Wood for trees is useless only going back to 1860. Vaughan Pratt showed SI as 40% culprit from ’10 to ’40. If you pull that rug out from under 1970 to 1998 what do you get? If you then pull the rug out from under period from bottom of Dalton to 1940 what do you get?
@ordvic: Vaughan Pratt showed SI as 40% culprit from ’10 to ’40.
Confirmable only as per the bottom line of this comment.
In the meantime I’ve done a somewhat better job of presenting this information in this graph.
http://clim.stanford.edu/H65N65.jpg
The following rises for 1910-1940 can be roughly confirmed by inspecting the graph (for more precision I cheated and looked at the plotted numbers themselves.
21-year HadCRUT4 (to remove the Hale cycle): 0.395 °C.
GHGs collectively (with CO2 contributing about 80% according to the IPCC): 0.082 °C.
Solar forcing (TSI): 0.055 °C.
This leaves 0.395 − 0.082 − 0.055 = 0.258 ° attributable to all other influences. This would be some combination of warmings and coolings due to natural and/or human influences such as aerosols, instabilities in ocean currents, Length-Of-Day (LOD) fluctuations, the stadium wave (Wyatt and Curry), the 3M effect (me, December 17, Global Environmental Change section, this AGU Fall Meeting), etc. etc.
In percentages the rise during 1910-1940 can therefore be apportioned as
GHGs: 21%
TSI : 14%
Rest: 65%
If considering only GHGs and TSI, the latter is exactly 40%.
@ordvic: Vaughan Pratt showed SI as 40% culprit from ’10 to ’40.
Confirmable only as per the bottom line of this comment.
In the meantime I’ve done a somewhat better job of presenting this information in this graph.
The following rises for 1910-1940 can be roughly confirmed by inspecting the graph (for more precision I cheated and looked at the plotted numbers themselves.
21-year HadCRUT4 (to remove the Hale cycle): 0.395 °C.
GHGs collectively (with CO2 contributing about 80% according to the IPCC): 0.082 °C.
Solar forcing (TSI): 0.055 °C.
This leaves 0.395 − 0.082 − 0.055 = 0.258 ° attributable to all other influences. This would be some combination of warmings and coolings due to natural and/or human influences such as aerosols, instabilities in ocean currents, Length-Of-Day (LOD) fluctuations, the stadium wave (Wyatt and Curry), the 3M effect (me, December 17, Global Environmental Change section, this AGU Fall Meeting), etc. etc.
In percentages the rise during 1910-1940 can therefore be apportioned as
GHGs: 21%
TSI : 14%
Rest: 65%
If considering only GHGs and TSI, the latter is exactly 40%.
Yeah I did realize the “Rest” was involved. Thanks for clarifying!
Excellent graph BTW.
Thanks, ordvic. It wouldn’t be worth commenting if no one was paying attention. :)
even then it’s a stretch
IPCC figure 5.7 above does in fact use my corrected reconstruction which uses few tree ring series (light blue). However, I concluded only that non-tree ring data give different results than tree ring data, not that mine was “right”, so don’t put too much stock in any of those curves.
This is probably a huge question, but I don´t very often have a tree ring expert at hand. So, if you dont´t mind – In hope of becoming a little bit enlightened on the subject – maybe by some good links.
As I would expect tree rings to be influenced by both temperature, water, CO2 and who knows what. I have always wondered how one could use tree rings to estimate global average temperature. How can the influence from temperature be separated from other influences. Which tests has the tree ring theory been exposed to and survived. Has the uncertainty been quantified in any reasonable manner.
Reblogged this on The Ratliff Notepad.
Pingback: Curry ehdottelee 400-vuotista lämpenemistä | Roskasaitti
We need to keep working the historical data record to build credible observational data sets back further in time.
I’d expect more variability will be found at any scale you get data for, always revealing a need for yet longer spans of data in order to sort it out, because you can’t sort a span out with data short compared to it.
This lines up mathematically with the theory of the representation of stationary gaussian random processes (which would be the simplest thing to have — the climate will be worse), where you can reproduce the process probability-wise over a time span T with sines and cosines with largest spacing 1/T.
This reverses in implication : you can’t tell cycles apart with data of length T with spacings of less than 1/T. All the probabilities come out right without knowing anything about 1/T frequencies.
The 1/T in question is here the frequencies from 0 to 1/T. How much is a longer cycle than you have data for, and how much is what actually shows up in your plot. You can’t tell, and you can never tell.
Question: What is the greatest adaptive technological invention of the twentieth century?
Answer: “Insulation.”
(See, Fred Singer, et al., Unstoppable Global Warming: Every 1,500 Years)
Personally I’d vote for indoor plumbing…;-)
For me it’s a toss up between electricity and toilet paper.
Good for you Tim, both were commercially available in the 19th century.
What would radical climatatologists say?
Tim “For me it’s a toss up between electricity and toilet paper.”
Of course its important to not mix up their uses.
The world will slam the lid on the man who builds a better crapper zapper.
=============
Well Bob, 19th, 20th or 21st century – it doesn’t matter. Still wouldn’t want to live without either item.
Variability is so dependent on the observer and the observer’s point of reference and time scale.
If we could stand back and look at a million years of daily data very quickly it would. in absolute temperature terms , be remarkably stable.
If we did it for only one day we would be accepting of vast temperature changes.
The issue however is one of CO2 response on one hand to natural warming and natural variability on the other hand.
Judith has already put up one excellent blog on CO2 response but the issue not addressed, the essential issue in my opinion, is how quickly should the surface temperature respond to a change in CO2.
I have tried to argue this with ATTP and would be interested in Mosher’s view on this.
I would like anyone who really knows to respond.
The point is that at a set CO2 level the air should be at a set temperature immediately.
It goes with saying that all the usual caveats apply as to cloud clover, ocean temps and pressure levels etc.
It is irrelevant whether the ocean has stored heat [it is therefore not released at the present time].
It is extremely important how quickly the temperature responds to a change in C02 level.
My understanding is that this should be more or less instantaneous for the atmosphere subjected to the heat from the sun during the day and lack of during the night.
In other words the CO2 increase should have a rigid, totally linked temperature response with any variation from this purely temporary linked to the above mentioned caveats.
If not either the CO2 /temp relationship is wrong [I do not think so]
or
the effect of the CO2 rise is being variably effected by negative feedbacks such as increased cloud formation and albedo thus offsetting the CO2 related temperature rise.
Since there is no correlation the second viewpoint must be right if these are the only two options.
Inertia is the greatest force in the universe. (With apologies to Rex Stout)
As I accept that CO2 is a greenhouse gas, a change of its concentration should change the energy balance, causing a long-term warming (with any missing heat hiding in the oceans, of course). It is the magnitude of the effect which is not researched enough. Let’s say a CO2 molecule in the atmosphere absorbs an IR photon. The energy can then be re-emitted, re-emitted at a different wavelength, or converted to heat in a double or triple collision. I have not seen a convincing description of the process.
As I accept that CO2 is a greenhouse gas, a change of its concentration should change the energy balance, causing a long-term increase in snowfall, ice volume and ice extent on earth.
The thermostats are the polar oceans that thaw and freeze to turn snowfall on and off as needed. This maintains the temperature bounds by adjusting ice volume and ice extent.
Further, these feedback may change as regimes vary on many timescales. The response in a few decades may be different than the previous decades or cyclical regime, and the response during multi-decade regimes may vary over multi-century regimes, and on and on…
https://www.researchgate.net/post/Is_there_convincing_evidence_of_AGW ?
Cherry-picking the present as the end point, again ;-)
Great job Dr Curry!
Meanwhile, it is proposed that a patient (the Earth to be obvious) with a highly uncertain condition be treated with costly therapies with extremely low effectiveness.
The doctors of Paris will plunge forward in any case. They will simply send us the bill for the treatment, and another in the future if more treatment is required to repair the damage they have caused.
Why are we still looking at a multitude of model outputs when observations clearly only match a small few of them? Why are the last 15 years of observations not germane for eliminating some of the more extreme scenarios?
If the science is settled in some minds, then why are some combinations and values of forcings not removed as a result of comparing experience to expectation?
There seems to be no decrease in uncertainty since 1988. “Something” will happen is not a scientific expectation.
I’d been asking that question for many years and gave up a while ago.
Picking only the models that happened to match the recent record is a recipe for locking into spurious correlation of model and data. There isn’t much reason to think that the model that fits the record better in the past will continue to do so in the future unless you have some specific causal theory about what makes that model better than the others.
In 1910, what was not mentioned is that the sun was at its weakest in the 20th century, while by mid-century it was at its strongest. That can account for 0.2 C of the warming with the other 0.1-0.2 coming from other forcing changes. Since 1950, we have added 75% of all GHGs, and the warming has been a further 0.7 C. Thirty-year averaged temperatures put into perspective that the later century through now is nothing like the earlier part, and was added on top of it, being understood quantifiably because of the dominant manmade forcing change during the same period.
http://woodfortrees.org/plot/gistemp/mean:120/mean:240/plot/gistemp/from:1985/trend
@Jim D: In 1910, what was not mentioned is that the sun was at its weakest in the 20th century, while by mid-century it was at its strongest. That can account for 0.2 C of the warming
0.2 °C? How? Seems very high. Do the math. You’d need a much larger solar climate sensitivity than anyone’s proposed in the literature.
Correct, when you look at the global temperature changes in 11-year solar cycles, the sensitivity to the forcing change is almost 1 C per W/m2, and those are just transient.
Solar plus PDO plus ENSO.
From the article:
”
From Speigel:
“Over the past three years it all totals to be a whopping 1.025 million households.”
“Spiegel writes that the price of electricity in Germany has doubled since 2002 in large part because of the renewable energy feed-in surcharge. Private households are the hardest hit; they have to pay some 45% more than the EU average (while German power producers get 30% less than the EU average)! The government-interfered market is grotesquely distorted.”
It is not only Germany’s power companies who are bleeding to death financially, but so are many private citizens, who are unable to pay for their power. A shocking situation in one of the world’s most technically advanced nations.
”
http://joannenova.com.au/2015/11/1-million-german-households-had-power-shut-off-in-last-three-years-due-to-green-energy-cost/
I guess Germany desires to return to the Dark Ages and they are importing people who are used to it already.
tsi isn’t the whole story
the power spectrum changes ie especially in the uv
even you might be vaguely aware that different frequencies have different transmission and absorption characteristics as they propagate through the ocean/atmosphere
http://www.nasa.gov/topics/solarsystem/features/solarcycle-sorce.html
Paughan Vratt,
Curiouser and curiouser
From your link –
“If these SIM measurements indicate real solar variations, then it would mean you could expect a warmer surface during periods of low solar activity, the opposite of what climate models currently assume,” said Gavin Schmidt, a climate modeling specialist at NASA’s Goddard Institute for Space Studies in New York City.”
The thrust was that the measurements must be incorrect, because they don’t fit with the model assumptions. Fantasy supplanting fact?
Cheers.
The SIM instrument isn’t broken. It corresponds with other instruments. The climate model that Gavin uses is broken. Facts trump models.
During periods of high solar activity ultraviolet increases far more than expected while visible and infrared decrease. One might expect from a simplistic view of the atmosphere that this would make the stratosphere warmer and troposphere cooler.
The confounding factor is that UV plays a large role in atmospheric chemistry and the models don’t look at changes in chemistry. Changes in chemistry effect the production of ozone and nitrogen compounds, the lifetime of CFCs, and probably cloud formation. Bacteria in the atmosphere, for instance, work as nucleation sites for water droplets. UV produces ozone by busting up O2 in atomic oxygen which is then free to combine into O3. Ozone kills bacteria thus it reduces nucleation sites and presumably cloud formation. The net effect of clouds is cooling as is demonstrated by largely cloudless deserts having higher mean annual temperatures than moist climates at the same latitude. So there you have an explanation why increased UV during high solar activity can increase surface temperature more than the corresponding decline in visible and infrared works to reduce it.
Not very complicated, really, but climate models don’t do chemistry.
Neither chemistry nor biology. But are there enough critters to kill?
Long searched for is a mechanism by which the change in UV can multiply its effect on climate without a runaway effect. The complex physical, chemical, and biological maelstrom of clouds, chemicals, and critters may ameliorate.
===============
Knowing that there is no escape from THE FOUR LAWS WITHOUT WHICH NOTHING WHATSOEVER IN THE UNIVERSE THAT HAPPENS, HAPPENS – there simply is no change in temperature of anything without input of energy = work = quantity of heat, requiring accountancy in joule, and not that ‘phlogiston’ of ‘feedback’ without any energy dimension. My results of following this necessity are at: http://tinyurl.com/qjxakew
The relatively recent theories of convective motion within the molten Earth might account for observed temperature variations and heat loss through the surface.
Observations confirm the movement of continental plates, and fluid movement within the mantle provides a reasonable explanation for this activity. The exact mechanism is still subject to debate as it is difficult to examine the molten mantle in detail.
However, observations confirm a wide variation in heat losses from the mantle through the crust, and crustal hot spots appear to wax and wane, and move around, presumably due to heat movement within the mantle and core.
Given that the majority of the Earth’s surface is covered by oceans, an increase in deep ocean temperatures would indicate increasing heat being emitted through the ocean basin. Hot spots appear to wander erratically, and appear as unpredictable as the mechanism causing them.
However, to a Warmist, it seems easier to believe that the depths of the oceans are prevented from freezing due to missing heat accumulated by CO2. I suppose geothermal vents, geysers, volcanoes, hot springs and similar things are also due to CO2.
A rise in surface temperatures here, a fall there, accompanied by overall cooling, seems the inevitable outcome of a fluid rock ball, wrapped in a thin floating semi solid crust.
Or you can believe it’s all due to something essential for our continued existence – CO2!
Cheers.
@MF: The relatively recent theories of convective motion within the molten Earth
Earth’s crust, mantle, and inner core are solid. Except for a very small volume of magma below the crust, most of the molten part is the outer core comprising roughly 15.5% of the total volume of the Earth, http://epsc.wustl.edu/courses/epsc210a/pdfs/JS_rocksandmins.pdf
The outer core starts at 54.6% of the distance from the surface to the center of the Earth, and ends at 64% of that distance.
Total ignorance from the ex-professor. Perhaps you believe the Sun is made of nickel too.
Appologies. I misread it on first read. The outer core is molten.
Cumulative percentage distances from surface to base of each structural element
Crust = 1%
Mantle = 45%
Outer Core = 80%
Centre of the Core = 100%
http://www.acmecompany.com/stock_thumbnails/12305.earth_cross-section.jpg
Vaughan Pratt,
It may have escaped your notice that the continents move. Tectonic plates and all that. Unfortunately, it’s difficult to the plates to move on the molten mantle, unless the mantle is fluid to some degree.
From Wikipedia (not always the most reliable, but close enough for Government work) –
“Although solid, the high temperatures within the mantle cause the silicate material to be sufficiently ductile that it can flow on very long timescales. Convection of the mantle is expressed at the surface through the motions of tectonic plates. As there is intense and increasing pressure as one travels deeper into the mantle, the lower part of the mantle flows less easily than does the upper mantle (chemical changes within the mantle may also be important). The viscosity of the mantle ranges between 1021 and 1024 Pa·s, depending on depth.[21]”
Note the words ductile, and convection.
Just so others are aware, the relatively solid crust is up to 65 km deep, although it averages much less. The geothermal gradient is such that the deepest hole ever drilled was less than 13 km. A rough average is about 25 C per km of depth.
So, given that the radius of the Earth is over 6000 kms, and granite melts at around 1250 C, the relatively viscous crust is at most 45 km thick on average, (below the melting point of igneous granite). Less than 1% of the distance from the surface to the centre of the Earth.
Warmists don’t like the concept of the molten Earth, slowly cooling.
I’m not sure what you were criticising, if anything. I was merely reporting theories put forward by real scientists (not ratbag pseudoscientific climatologists). If you don’t believe that the continents move erratically up and down, and side to side, good for you!
Cheers.
Mike Flynn,
What’s most relevant about plate tectonics is that the world will not get out of it’s current coldhouse phase until the plates move and open up a gap for ocean circulation around the planet near the tropics. Until North and South America separate again we’ll remain in a coldhouse phase (a relatively rare condition; we are in only the third coldhouse phase since multi-cell animal life began). Therefore CAGW is BS! No ca the plate locations prevent it. No catastrophe is plausible.
That was meant to say: “No catastrophe is plausible. The current plate locations prevent it.”
Apology accepted, Peter, thank you.
@MF: “The viscosity of the mantle ranges between 1021 and 1024 Pa·s, depending on depth.” Note the words ductile, and convection.
Also note the two numbers you gave there, Mike: 1 followed by between 21 and 24 zeros. (21st century cutting and pasting is no respecter of superscripts, hopefully the 24th century will get that right.)
Distance is a relative concept, like the distance to the nearest gadgetry vs. the distance to the nearest galaxy.
In that respect ductility is like distance.
As noted in that article, the viscosity of water is 0.001 Pa·s. The viscosity of the mantle is therefore somewhere between a million million million million times and a million million million billion times the viscosity of water. (You see the difference there of course…)
On that basis it would be fair to say that the mantle is more easily shaken than stirred.
It should also be noted that the continents do not exactly skate around the planet like Wayne Gretzky on a good day. Bacteria traveling on solid surfaces at a few cm per hour move several thousand times as fast as continents at a few cm per year.
If continents moved as fast as bacteria I would own two fewer homes in sunny-and-seismic California. (One of my dad’s patients back in Australia in the 1950s had given him a number of graphic photos, taken by a touring relative at the time, of the seismic destruction of Stanford in 1906. You can therefore imagine his horror when as a first year Stanford grad student in 1970 I told him that my wife and I had bought a home in Palo Alto. Boy was he angry at my utter stupidity. Two decades later, in a different house in the same neighbourhood, we rode out the 1989 Loma Prieta earthquake with nothing worse than some broken ceramics and a study knee-deep in books.)
Vaughan Pratt,
You wrote –
“Distance is a relative concept, like the distance to the nearest gadgetry vs. the distance to the nearest galaxy.
In that respect ductility is like distance.”
I assume you are trying to disagree with me about something, but neither you nor have any idea what it is, from the tenor of your reply.
Instead of indulging in Warmist folderol of the distractive, or lateral arabesque varieties, maybe you could read what I write, and quote the parts that you disagree with. If I’m wrong, I’m wrong.
I can’t tell whether you’re stupid or deranged, or whether you think I am.
Your comment –
“On that basis it would be fair to say that the mantle is more easily shaken than stirred.
It should also be noted that the continents do not exactly skate around the planet like Wayne Gretzky on a good day. Bacteria traveling on solid surfaces at a few cm per hour move several thousand times as fast as continents at a few cm per year.”
What is the relevance, if any? You seem to be making some obscure Warmist point, which is beyond my understanding. The mantle is more easily shaken than stirred? Is this yet another Warmist fantasy, or is it code for admitting you can’t actually find factual fault with anything I wrote?
If you are trying to imply that you disagree with geophysicists who propose theories to explain observations, take it up with them. I don’t believe you will, and I don’t blame you. Your grip on the facts relating to the physical composition of the Earth seems tenuous, to say the least.
Tectonic plate movement seems to be a fact. At a few centimetres a year, over a few hundred million years it might amount to a reasonable distance. You might have an alternative theory to those of the geophysicists, and I’m guessing it would include the magical heating properties of CO2. Pardon me while I snort with derision. I know it’s not good form, but I find myself unable to believe in Warmist magic these days.
What a pity, eh?
Cheers.
@MF: I assume you are trying to disagree with me about something, but neither you nor have any idea what it is, from the tenor of your reply.
You proposed to explain various phenomena, including climate fluctuations that others have attributed to greenhouse gases, in terms of a supposedly molten mantle forming a fluid. The problem with your explanation is that it starts from the false premise that the Earth’s mantle is a molten fluid, when in fact the mantle is rock solid.
What is true is that lava is molten, i.e. a fluid. Lava comes from magma in magma chambers. Lava is to magma as spit is to saliva: it’s what we call it when it’s been ejected.
What is not true is that there is any magma in the mantle. Here’s the relevant section of the Wikipedia article on magma (bold face mine):
Despite being found in such widespread locales, the bulk of the Earth’s crust and mantle is not molten. Except for the liquid outer core, most of the Earth takes the form of a rheid, a form of solid that can move or deform under pressure. Magma, as liquid, preferentially forms in high temperature, low pressure environments within several kilometers of the Earth’s surface.
Here’s your explanation of plate tectonics.
@MF: Observations confirm the movement of continental plates, and fluid movement within the mantle provides a reasonable explanation for this activity. The exact mechanism is still subject to debate as it is difficult to examine the molten mantle in detail.
According the Wikipedia article on plate tectonics, “The key principle of plate tectonics is that the lithosphere exists as separate and distinct tectonic plates, which ride on the fluid-like (visco-elastic solid) asthenosphere.”
The key phrase here is “fluid-like”. Not fluid, not molten the way lava is molten, but rather a visco-elastic solid. The Wikipedia article on rheology goes into this in more detail:
Also included in this disciplinary branch are solid Earth materials which only exhibit flow over extended time scales. Those that display viscous behaviour are known as rheids. E.G. granite can flow plastically with a negligible yield stress at room temperatures, (i.e. a viscous flow). Long term creep experiments (~ 10 years) indicate that the viscosity of granite and glass under ambient conditions are on the order of 10^20 poises.
(A poise is 0.1 Pa·s, not a big difference with that many zeros. Pa·s is the official SI unit, “poise” dates back to when “centi-” was a more popular prefix, the viscosity of water being roughly 1 centipoise. Basalt lava has a viscosity on the order of 1000 Pa·s, considerably more viscous than water or even treacle but still a fluid. Other lavas are even more viscous, but rheids are on the order of a million billion times more viscous than even very viscous lavas and as such are universally considered solids.)
You also proposed to account for “observed temperature variations’ in terms of a molten Earth:
@MF: The relatively recent theories of convective motion within the molten Earth might account for observed temperature variations and heat loss through the surface.
According to the Wikipedia article on mantle convection, its speed near the top of the mantle is around 20 mm/yr. That’s 2 m per century. Any temperature variation between 1900 and 2000 would therefore have to be explained by a mantle movement of 2 m. But according to the article on geothermal gradient, “the geothermal gradient within the bulk of Earth’s mantle is of the order of 0.5 kelvin per kilometer,”. Hence a mantle movement of 2 m, even if vertical, could not explain a temperature variation during a century of more than 1 millikelvin. And that’s assuming that mantle convection is sufficiently variable to account for any variation at all, as opposed to a steady geothermal release at the surface.
@MF: A rise in surface temperatures here, a fall there, accompanied by overall cooling, seems the inevitable outcome of a fluid rock ball, wrapped in a thin floating semi solid crust.
The mantle is not “fluid rock”, it’s as solid as glass at room temperature, which no one considers “molten”. An old explanation of why cathedral windows are thicker at the bottom was because over a millennium they can flow, but that’s since been discredited. Here’s what the Corning Museum of Glass has to say about this.
…and by the time they [glasses] have cooled to room temperature, they have, of course, become rigid. Estimates of the viscosity of glasses at room temperature run as high as 10 to the 20th power (10^20), that is to say, something like 100,000,000,000,000,000,000 poises. Scientists and engineers may argue about the exact value of that number, but it is doubtful that there is any real physical significance to a viscosity as great as that anyway. As for cathedral windows, it is hard to believe that anything that viscous is going to flow at all.
To summarize, the interior of the Earth is not molten, or liquid, or fluid, but rock solid. Your application of the supposedly molten interior of the Earth as an alternative to the greenhouse gas explanation of recent climate change therefore does not hold water, or lava, or any fluid other than hot air: it is based on a false premise.
@PL: Cumulative percentage distances from surface to base of each structural element
Geologist Peter Lang (I won’t call him an ex-geologist) gave the correct numbers here. My 54.6% was for the radius of the outer core relative to the Earth, I forgot to subtract it from 100 to give 45.4%. But my 64% for the bottom of the outer core was pure brain damage, no idea how I got it, which Peter correctly gave as 80%.
Doing this sort of calculation with MATLAB or octave or R, which work a bit like APL, can sometimes be less error prone than using a calculator. That way if you make a mistake it’s more obvious because every value is wrong, not just one.
The depths of the respective layers in km can found in say the Wikipedia article on Structure of the Earth entered into MATLAB or octave by setting
R = [0 35 2890 5150 6360]
Then typing
(R/6360)*100
gives essentially Peter’s percentages on one line:
0% 0.55% 45.44% 80.98% 100%
(I truncated to 2 places and put the % signs in by hand.)
The respective volumes of the crust, mantle, outer core, and inner core, as percentages of Earth’s volume, can then be given by typing the single line
-diff((1-R/6360).^3)*100
which yields
1.64% 82.12% 15.55% 0.69%
Here diff is the difference operator, a finite version of calculus’s derivative operator that is fundamental to George Boole’s Calculus of Finite Differences, an astonishing 336-page book published in 1860. diff can also be used to approximate derivative if the data is sufficiently densely packed.
Replacing 100 in the above formula by the volume of the Earth in your favorite units gives the volumes of those shells in those units all at once.
On a marginally related topic, in the category of mnemonics for things, one way to remember the radius of the Earth is as 20/π Mm (1 Mm = 1000 km), namely 6.3662. This exploits the fact that the French defined the meter so that the distance from the North Pole to the equator along a meridian through Paris would be 10 Mm (10,000 km). Which they almost got right except that the astronomers Delambre and Méchain assigned to determine that precise distance through Paris ended up in 1799 underestimating it by what satellites have now determined to be 2290 meters or 0.0229%. This meant that the platinum meter stick ended up being 0.229 mm shorter than what it had been specified to be, more details on that story at the Wikipedia article on Pierre Méchain.
However the Earth is not a sphere and there are various radii, among them the following listed on Dave Williams Earth Fact Sheet.
Equatorial radius (km) 6378.1 km
Polar radius (km) 6356.8 km
Volumetric mean radius (km) 6371.0 km
So the 2.29 km error hardly matters given that the equatorial radius is 12 km greater than 20/π Mm while the polar radius is 9 km less.
Which if you can remember +12 km and -9 km is a great way to remember both the equatorial and polar radii. Even approximating them by +10 and -10 km is already pretty good. And to remember which is which, remember that the Earth is an oblate spheroid due to the centrifugal force of its rotation, making its equator bulge out and pushing its North and South Poles together.
(Anyone would think I was still a professor. Come to think of it, I am still a professor. :) A professor emeritus is still operationally a professor with an office, voting rights on faculty appointments and promotions, the right to teach classes and advise graduate students, library privileges, list Stanford as one’s institution in publications, etc. etc. Plus free parking on campus! To be an ex-professor one needs to resign.)
“one of my dad’s patients Australia”
prison doctor?
i keep mixing up australia’s beginnings was it a penal colony, penile colony, or both
http://dictionary.reference.com/browse/dotage
Vaughan Pratt,
It seems that you are hanging your argument on a statement I made earlier –
“The relatively recent theories of convective motion within the molten Earth might account for observed temperature variations and heat loss through the surface.
Observations confirm the movement of continental plates, and fluid movement within the mantle provides a reasonable explanation for this activity. The exact mechanism is still subject to debate as it is difficult to examine the molten mantle in detail.”
There are observed temperature variations both on the surface, and sub surface, observed by real scientists called geophysicists, and peer reviewed papers relating to these observation have been published in reputable scientific journals.
Continental movement has been measured by real scientists, also.
The exact mechanism is still open to debate. This is part of the scientific process.
If the material of the mantle is at a temperature above its melting point, by physical definition its state is molten
Your denial that these facts can possibly be due to anything other than the magical gas CO2 shows a depth of delusory thinking which might indicate a psychotic condition.
Your attempts to deny these facts appear to me to be patronising, condescending, and wrong. If you are merely trying to be gratuitously offensive, (a particularly Warmist characteristic, generally employed in the absence of relevant fact), then you are being spectacularly inept.
I decline to take offence, as a general rule, and you provide me no particular reason why I should lower my standards to suit your purpose.
Get over it Vaughan. I merely commented on fact, and mentioned there are competing theories to explain these facts. CO2 is not involved, unless you believe that mass material movement within and on the surface of the Earth is yet another aspect of the many wondrous and miraculous powers of that essential to human life compound. Do you truly believe? I thought not. Just another erratic Warmist denialist charade!
Cheers.
I was just checking your consistency. You pass: you haven’t changed your spots one tiny bit.
shows a depth of delusory thinking
That would indeed be true of anyone so deluded as to think they could dissuade you from your remarkable beliefs.
In my case I’m more interested in understanding the variety of arguments for and against various propositions about climate. Some propositions are more clearcut than others. You have the remarkable ability to single out the most clearcut ones and insist on the opposite of what scientists believe. Example:
MF: If the material of the mantle is at a temperature above its melting point, by physical definition its state is molten
To be consistent you would also have to say that if water is above 100 °C, by physical definition its state is vapor.
But if you take a trip to the bottom of the TauTona mine in South Africa, 3.9 km below sea level, you will find that water at 110 °C, well above the supposed boiling point of water, does not boil but remains liquid. The boiling point of water down there is about 113 ° C.
How such a thing could be possible should become clear after contemplating the phase diagram of H2O.
Melting points and boiling points cannot be specified for temperature alone but must also take pressure into account.
This is as true for rock as for water.
Somehow my latest learned comment landed on the previous post. I think I got distracted by Jim D’s Miss Carolina, and the whole global thing, and the climate happening all over the place, and such as.
You know why nobody could locate modern Britain before the seventh millennium BC? Don’t miss my latest comment to find out why. Click now! (Hint, it wasn’t education or missing pages in the atlas, and such as.)
Britain became an island when Doggerland got flooded and the British Channel was formed, separating it from the rest of Europe.
‘Noah’s flood is not yet subsided; two-thirds of
the fair world it yet covers.’ H. Melville.
True dat! The globe is indeed a water world and water is not featured in the climate models, either in vapour form in clouds nor in liquid form through the movement of currents. Jeez!
Yep, it’s water world all right. And all these big climatic shifts have been quite recent, more recent than the earliest settlements and even towns like Jericho and Catal Hayuk. Of course, by the time of the 2200 BC Bond Event there was plenty to wreck. And it got wrecked.
Mosomoso have you seen these?
BBC’s Orbit: Earth’s Extraordinary Journey is a three-part documentary about natural climate cycles, especially because there was no AGW crap involved. It can still be viewed online at the following links, highly recommend everyone to give it a go, well worth the time:
Episode 1: http://bit.ly/PiAyBs
Episode 2: http://bit.ly/Nsw7kn
Episode 3: http://bit.ly/MCa5yx
Cheers Peter M
Sorry but the links are no longer working. The series now seems to be behind paywall.
Peterm
Yes, I am asked for authentication from Christcollege.com
Tonyb
Peyerm
I have tracked the series down
http://www.bbc.co.uk/programmes/b00xztbr/episodes/guide
As you can see it is available to buy as a DVD or online. It was a fairly recent series
Tonyb
Thanks for the links Tony.
@PMD: water is not featured in the climate models, either in vapour form in clouds nor in liquid form through the movement of currents
Peter, today there are more than thirty CMIP5 models. Which of them would you say suffer from this defect? All? Half? A handful? One or two? None of the above?
If you prefer essay to multiple choice, go for it. :)
My reply is located below VP. Apologies for using the wrong tree.
“If you prefer essay to multiple choice, go for it. :)”
a$$hole
Vaughan Pratt,
If thirty climate models give different answers, at least twenty nine are wrong. If you believe one is correct, which one?
You’ve got no more clue than the fools who believe that averaging a number of demonstrably wrong answers leads to truth. Fat headed nonsense, perpetrated to keep the mentally disturbed quiet and comatose.
Dimwitted climatologists wasting other people’s money on models they know to be wrong are positive geniuses compared with the providers of funding. These people are just living in a fantasy world.
I’m not being too critical, am I?
Cheers.
It was covered by Ice?
“You know why nobody could locate modern Britain before the seventh millennium BC?” Because Britain has been modern for only a few centuries. [e-mailed on three-day delay.]
Yes, and the place became truly developed only after the arrival of Australians in Earl’s Court in the 1960s.
Mosomoso,
When I was frst in London (about 1975-76) and English guy told me the English need an Australian passport to visit Earl’s Court.
Peter, that’s almost true, it had a very high Aussie identity. I had an Earls Court-based Australian girl-friend around 1970, all of my friends called her “Bruce.”
… intensity …
By the way, that was the year the Australian cricket team thrashed the English team lead by Tony Greg. Gee it was fun travelling on the tube those days. Aussies at each end of the carriage replaying the days play – batting strokes at one end and the bowlers at the other. With wonderful commentary for each – lots of “Oh! bad luck for the poms and fantastic delivery/stroke for the Aussies (Dennis Lillee, Jeff Thomson, Ian Chappel, Greg Chappel, Rodney Marsh, etc.). The poms sat in their seats with head down concentrating on reading about the history of the empire in the newspapers. :)
Unlike most Aussies I’ve spent all my travel time in France/Italy/Spain. I must be the only francophile redneck. (Think it’s why I hate the EU so much.) By the ’70s I’d copped enough Bruces and Barrys back home.
Still, despite the Irish-Catholic thing, I won’t budge from parliamentary democracy and constitutional monarchy. It’s so cool to live where your first constitution is a hundred years older than your actual country. Thanks Poms.
When I was frst in London (about 1975-76) and English guy told me the English need an Australian passport to visit Earl’s Court.
Wonder if we overlapped. July 1975 was the first time my wife and I encountered London. In Earl’s Court I bought a rusty Mini van for 200 quid from an Australian couple returning home, and drove it to Edinburgh and back during the next three months, plus much touring around Edinburgh. Cost me a pretty penny to bring that rust bucket up to Edinburgh MOT standards when its license expired. Got 60 quid back when I sold it in London to a dealer.
A hire car might have been cheaper. The ability to fix cars competently doesn’t always translate into the ability to price them competently.
Hi VP. I will let Mike Jonas do the writing for me.
http://wattsupwiththat.com/2015/09/17/how-reliable-are-the-climate-models/
I know that you rarely visit WUWT and that you may have missed this.
Cheers, Peter M
Thanks, Peter. I checked out Mike Jonas’s WUWT post. It was his usual “we don’t know f—–g nothing”. Was there something new there? If there was I couldn’t find it.
(MJ has an Oxford MA in maths from about half a century ago. While he may be a mathematics genius, what he’s written to date has convinced me that anything to do with physics, whether climate science, quantum computing, quasicrystals, orbital mechanics, or interpreting Excel spreadsheets, is above his pay grade.)
I know that water vapour figures in some of the models VP but IMO they have the wrong sign on their combined effect on climate viz the models considered them as contributing to warming when in reality the water cycle should be considered as having a cooling influence.
I’m pretty sure water figures in all the CMIP5 models, Peter. But I know nothing about what values they use, so if you feel their values are wrong then you’re better informed than I.
A more specific criticism of Mike Jonas’s WUWT article is that, just as statistician William M. Briggs disallows filtering, Jonas disallows fitting. Since all areas of science makes heavy use of both, these rejections of filtering and fitting have something of the flavour of Jack D. Ripper’s rejection of fluoridated water:
https://www.youtube.com/watch?v=J67wKhddWu4
It should come as no surprise that scientists who tie one or both hands behind their back by not allowing themselves to use all the scientific tools at their disposal would end up knowing less as a result. What is not legitimate however is to project their resulting ignorance on those of their colleagues who understand and use those tools to best advantage.
Thanks for your response VP. I have read around this topic a fair bit, especially the various IPCC papers on the models and their seems to be agreement that the models need more work in respect of accounting for the atmospheric water cycles. Intuitively, the models seem to be running hot because (a) their climate response rate to doubling of CO2 is too high and (b) they do not adequately allow for negative feedbacks from clouds, among other influences which must remain beyond the realm of prediction due to their chaotic nature.
Do tell …
Yep, the M twin got it right. Doggerland went under, though they reckon Dogger Bank held on as an island for a millennium or more. (Mega-tsunami from Norwegian landslip or gradual?) It was around that time that the Bass Strait central basin got its final flooding, and Tasmanians were finally free of Victoria. Hectic millennium if you were just trying to fish and and generally beachcomb. In amongst it all was some major chilling, with all sorts of drought around the globe. Maybe a meltwater pulse was up to no good?
All done before we had climate change!
Bright side and dark,
in the see – saw of
climate variabiliity,
Victoria finally
free of Tassie. )
Mosomoso
This is an interesting article on doggerland. I also wrote about it in my article on roman sea levels
http://stephenliddell.co.uk/2015/09/03/doggerland-britains-atlantis/comment-page-1/
Of particular interest is the map. It is now earmarked for a wind farm
There is also a submerged area in the English channel called the Goodwin sands which disappeared centuries ago.
To this day a cricket match is played on the sandbank that appears when there is a very low tide. There is a picture of the recent cricket match with a pitch even damper than the one you moaned about at Cardiff
Tonyb
Interesting site and post, tony b.
I suppose if England run out of Irish/Saffy/Taffy/West Indian/sub-continent mercenaries to boost its chances against Australia there is always the Goodwin Sands option.
Victoria finally
free of Tassie.
And vice versa.
Although the bulk of my family was all from Melbourne since about the mid 19th century, one of my ancestors on my mum’s side was the official Hobart beachcomber around 1808, or something like that.
I’m wondering if that position has opened up. I’d be ok with the cold.
The borehole proxy does interest me.
It doesn’t suffer from biological contamination.
It is relatively global ( land anyway )
It is relatively long duration.
It depicts:
the Last Glacial Maximum,
the Holocene Climatic Optimum,
the Little Ice Age, and
the Medieval Warm Period.
The only real difference from the commonly accepted history is instead of a ‘Roman Warm Period’ there appears a Roman Cold Period ( -2C ).
Is it accurate? It’s certainly consistent with a number of other proxies.
http://3.bp.blogspot.com/_nOY5jaKJXHM/THFaS4Eg28I/AAAAAAAABQ8/m5Vpi1cbS50/s1600/Fullscreen+capture+8222010+100429+AM.jpg
TE
The University of Michigan hold the international borehole data. It is here
http://www.ncdc.noaa.gov/paleo/borehole/core.html
The results from each continent can be examined.
Huang is one of the major authors of articles on the subject. I had an email exchange with the person last year. I think it would be an interesting topic for a post here as undoubtedly the majority (but not all) of the reconstructions show a 400 year long warming but obviously lack the resolution of something like CET
tonyb
go read climate audit on boreholes.
I am always stunned at the way skeptics latch on to the bits of data they like.
http://climateaudit.org/2010/04/05/ipcc-and-the-law-dome-graphic/
Apparently so do global warmers. Global warmers seem to hide the data they don’t like.
Mosh
I think you were around when I expressed my scepticism of boreholes here a year or so ago. They lack resolution and the results vary according to the continent and era. Which is why I conversed with Huang and posted the comments here.
They are as legitimate as tree rings which get a lot of attention here (take that whatever way you want)
As such they probably need an article to explore the current state of research.
tonyb
I am always stunned at the way skeptics latch on to the bits of data they like.
You may observe that I asked Is it accurate?
However, the largest feature is the generally accepted Ice Age.
Are you an Ice Age denier?
The second largest feature is the Holocene Climatic Optimum.
This event has a physical basis of increased insolation over land.
Are you in denial of the HCO?
Though not causally understood, the Medieval Warm Period and Lil’ Ice Age are borne out by numerous other proxies.
Are you in denial of these events?
We are cooling, folks; for how long even kim doesn’t know.
===============
Tony “as legitamate as tree rings”? praytell, show me YOUR MATH on that calculation.
Nice Try TE
1. You sang all its Praises.
2. So said NOTHING about the documented problems
3. You tossed in a rhetorical question “is it accurate”
And Now you want to run away from your analysis.
figures
Mosh
Did I really need to put ‘sarc’ after my comment about tree rings/
tonyb
I am always stunned at the way skeptics latch on to the bits of data they like.
Oh, yeah, I forgot how rich this was coming from the guy who wants to ignore the dozen or so different analyses of both RAOB and MSU data which dispel the Hot Spot and latch on to the one dubious analysis which shows a warm spot, just to hang on the preconceived models prediction.
Turbulent Eddie | November 17, 2015 at 12:06 pm |
I am always stunned at the way skeptics latch on to the bits of data they like.
Oh, yeah, I forgot how rich this was coming from the guy who wants to ignore the dozen or so different analyses of both RAOB and MSU data which dispel the Hot Spot and latch on to the one dubious analysis which shows a warm spot, just to hang on the preconceived models prediction.
Huh? You do know that they release radiosondes at the equator?
Either someone can dredge up radiosonde data that shows an equatorial hot spot or that is a dead issue.
http://climateaudit.org/2008/06/07/march-2008-radiosonde-data/
The radiosonde data seems to take a minigun to the hot spot idea. The hot spot theory isn’t just dead – the hot spot is hamburger.
Steven Mosher: I am always stunned at the way skeptics latch on to the bits of data they like.
The idea is to give serious consideration to all of the data, not just those data that a particular proponent of AGW catastrophes wants to consider. The data are more “likable” the more carefully and reliably they have been collected. But it’s a ranking, not an absolute: the ocean surface data before the Argo floats are less “likable” than the ocean surface data from the Argo floats, for example.
Do you have a scientific criticism of the radiosonde data, some reasons to discredit or ignore them at all times?
perhaps I ought to have written “borehole” or “radiosonde” data?
Steven Mosher: 3. You tossed in a rhetorical question “is it accurate”
You have disparaged questions lots of times. But that question, like most, is a simple request for more information, in case one of the readers happens to have some.
My friend Karl Stefan (NCAR weather balloon program) used to run the balloon program. If they had asked, Karl could have floated those balloons with the radios at two meters above the surface. He was a great balloon pilot.
Mosh:
when someone asks a question that you do not wish to answer, you unwillingness to answer it does not make the question “rhetorical”.
“Do you have a scientific criticism of the radiosonde data, some reasons to discredit or ignore them at all times?”
Sorry I have commented on the problems and limitations before.
first and foremost would be
1. changes in type, exposure, and sensors
2. changes in the lag corrections over time
3 changes in the length of the train, which lead to balloon wake
impacts on the observations
4. changes in balloon tracking which lead to different observation heights
5. changes in time of observation
6. changes in station locations
You can see other issues here
http://www.remss.com/measurements/upper-air-temperature/validation
Bottom line.. don’t hang your hat on any given dataset.
mathew
“You have disparaged questions lots of times. But that question, like most, is a simple request for more information, in case one of the readers happens to have some.”
No you misunderstand rhetoric.
A simple question would not have the PRELUDE he offered.
He offered a prelude that praised the data and then a question.
Imagine if no one had come along to anwer his question.
I would hazard people would say “Well nobody objected to his praise of the data, therefore, it cant be challenged”
A SIMPLE question would be just that. A question with no pretext or prelude
Steven Mosher: A SIMPLE question would be just that. A question with no pretext or prelude
I think that your inference of a “pretext” is mistaken. A question should have some “prelude”.
Don’t hang your hat on one data set.
We have all discussed multiple data sets for a long time. In this context, what does “hang your hat on one data set” even mean?
oops, “any given data set” for “one data set”. sorry
Steven Mosher: I would hazard people would say “Well nobody objected to his praise of the data, therefore, it cant be challenged”
There is too much guessing in this game. One of the reasons that people ask questions is to seek clarification instead of guessing.
I did read what Climate Audit had to say about borehole measurements. Main take-away from the articles was not to pace too much reliance on a single borehole measurements as there were many mechanisms that would distort the temperature profile from the pure thermal diffusion case. There are also several mechanisms that could interfere with getting accurate temperature measurements at the varying depths. The process of thermal diffusion puts many stages of low pass filtering on the temperature signal (i.e. time resolution gets worse with increasing time in the past).
I wouldn’t put much faith into a single borehole reconstruction, but would give credence to an average of many reconstructions (skill needed in averaging). It is after all a temperature measurement as opposed to measuring something that correlates with temperature.
I wouldn’t put much faith into a single borehole reconstruction, but would give credence to an average of many reconstructions (skill needed in averaging).
Yesss!
Same goes for other multimillion-sample databases like HadCRUT4, GISTEMP, BEST, and so on.
Vaughan, one difference between a borehole measurement and the likes of HadCRUT, BEST, etc is that the thermometer calibration should not be an issue if the measurements were done correctly. That still doesn’t rule out the confounding problem with a single borehole, but sampling widely separated boreholes should significantly reduce the “common mode” errors.
@eem: one difference between a borehole measurement and the likes of HadCRUT, BEST, etc is that the thermometer calibration should not be an issue if the measurements were done correctly.
It’s a nice question whether boreholes or HadCRUT4 offer a better picture of 1850-1900 climate. I don’t have any preconceptions there.
However it seems to me that for climate purposes a major application of boreholes is in exploring 18th century and earlier climates. For that purpose the biggest differences I see are that estimates of say 17th century climate based on boreholes can be (a) made globally (b) using constantly improving modern instruments (c) repeatedly at many places to further improve accuracy and (d) independently verifiable by other people drilling other boreholes. The biggest downside is that precision drops off the further back you look.
Estimates of 17th century climate based on say direct CET measurements can only use (a) temperatures measured in Central England (b) made with 17th century instruments (c) that cannot be repeated, and (d) cannot be verified independently beyond what if anything was done about verification in the 17th century..
I hope that you don’t feel that I am stalking you VP, its just that your contributions are usually very informative and well put. In the instance of the CET, however, I believe that contemporaneous dairies and other records have always been an important aspect of Tony Brown’s work that seems to be overlooked by many climate scientists and others such as yourself.
“I am always stunned
at the way skeptics latch on to the bits of data they like”fixed that for ya, no need to qualify it
Peter, when I pointed out what I considered to be the chief benefits of boreholes for understanding 17th century climate, those who find CET informative, which includes me, should be pleased rather than annoyed that it was my top choice for that comparison. Comparison with an inferior product is not much of a recommendation.
On the flip side CET has advantages over boreholes such as no risk of error in reconstructing exact years, great year-to-year resolution (the Hale cycle is clearly observable in CET, can the same be said of borehole reconstructions?), etc.
When Tony showed me his 100-year extension of CET I was impressed that the Hale cycle could be seen in it, even extending across the Maunder minimum which was quite remarkable. Getting back to Tony on this is on my list of projects.
Hi Judith,
Why look only at CO2? N2O, methane, tropospheric ozone, and (post 1940) halocarbon compounds contributed a significant fraction of total forcing… about 30% of the total in the last 20 years or more…. but each with potentially different temporal trajectory. I mean, if you want to consider temperature change versus forcing, why not all man-made GHG’s instead of just CO2?
Good point, I have wondered if some of our gases which are never found in nature might be wild carding the show.
and like with the cigarette debate in the 60’s and 70’s, it’s not Can you prove Cigarettes are harmful, it’s can you prove that they are NOT harmful.Those companies said it was too expensive to prove that. OK, take it as a given our pollution is doing this. What are we going to do? Our whole World currently runs on unimaginable amounts of fossil oil. Taxing it really won’t cut down on our use, it will only make it more expensive. And the Oil companies probably want to pay off the billion dollar rigs by drilling and selling existing stocks of know oil. Biomass and sewage currently is not being manufactured into bio oil so it looks like the answer is to look out the window or on the news to see just how big the weather, earthquakes and volcanos are being energized to be. Maybe when all the oil is sold off, things might be different. If it does not break our infrastructures on such a large scale that burning that much oil becomes impossible and sales plummet, breaking the backs of the giants, and then we may develop like the 3rd world going 1st world with no access to oil. Bio fuels and renewables are their path and it may more and more become ours wether we like it or not. But on the bright side, our troops can stay home and work at doing that.
And why not include natures own Green House Gas – H2O – in both liquid and gas form?
@sfp: Why look only at CO2?
A question best directed to climate skeptics. The IPCC reports released every six years or so take all greenhouse gases into account.
I mean, if you want to consider temperature change versus forcing, why not all man-made GHG’s instead of just CO2?
A question better directed to climate skeptics. The IPCC report does exactly what you ask of it.
I was looking for H2O, water vapor and clouds under natural forcing in Assessment Report 5 by IPCC, but could not find it. The only factors under natural forcing was solar irradiance, volcanic aerosols. And a conclusion; “There is very high confidence that industrial era natural forcing is a small fraction of the anthropogenic forcing except for brief periods following large volcanic eruptions.”
(The IPCC report is voluminous but it is searchable).
Roy Spencer has a take on clouds in his book The great warming blunder:
“The insistence of the IPCC and the scientific “consensus” that clouds cannot cause climate variations continues to astound me. All atmospheric scientists know that clouds are controlled by a multitude of factors; my position is that causation between clouds and temperature flows in bot directions. In contrast, the IPCC´s position is that clouds can only change in response to temperature change (temperature cause clouds). But neglecting causation in the opposite direction (clouds cause temperature) can lead to large errors in our understanding of how and why the climate system changes, as well as in our diagnosis of how sensitive the climate system is to human influences.”
Judging from the following paper there is no doubt that Roy Spencer is right about his claim about IPCC´s position.
The following demonstrate that the cloud feedback parameter is set by choice:
Climate forcings in Goddard Institute for Space Studies SI2000 simulations J. Hansen et all
I find the following section immensely telling about climate modeling:
“The bottom line is that, although there has been some narrowing of the range of climate sensitivities that emerge from realistic models [Del Genio and Wolf, 2000], models still can be made to yield a wide range of sensitivities by altering model parameterizations. We suggest that the best constraint on actual climate sensitivity is provided by paleoclimate data that imply a sensitivity 3 ± 1°C for 2 CO2 [Hansen et al., 1984, 1993, 1997b; Hoffert and Covey, 1992]. It is satisfying that the a priori sensitivity of the SI2000 model comes out near the middle of the empirical range of 2 – 4°C for 2 CO2. However, for the sake of interpreting observed climate change and predicting future change it is appropriate to consider climate sensitivity as an uncertain parameter that may, in fact, be anywhere within that range.
[78]
Therefore we include the possibility of altering the model’s climate sensitivity. We do this by adjusting an arbitrary cloud feedback as defined in the appendix of Hansen et al. [1997a]. Specifically, the cloud cover is multiplied by the factor 1 + cT , where T, computed every time step, is the deviation of the global mean surface air temperature from the long-term mean in the model control run at the same point in the seasonal cycle and c is an empirical constant. For the SI2000 second-order model we take c = 0.04 and 0.01 to obtain climate sensitivities of 2°C and 4°C for 2 CO2.”
This speaks for it self.
Test
I was looking for H2O, water vapor and clouds under natural forcing in Assessment Report 5, but could not find it. The only factors under natural forcing was solar irradiance, volcanic aerosols. And a conclusion; “There is very high confidence that industrial era natural forcing is a small fraction of the anthropogenic forcing except for brief periods following large volcanic eruptions.”
(The IPCC report is voluminous but it is searchable).
Roy Spencer has a take on clouds in his book The great warming blunder:
“The insistence of the IPCC and the scientific “consensus” that clouds cannot cause climate variations continues to astound me. All atmospheric scientists know that clouds are controlled by a multitude of factors; my position is that causation between clouds and temperature flows in bot directions. In contrast, the IPCC´s position is that clouds can only change in response to temperature change (temperature cause clouds). But neglecting causation in the opposite direction (clouds cause temperature) can lead to large errors in our understanding of how and why the climate system changes, as well as in our diagnosis of how sensitive the climate system is to human influences.”
Judging from the following paper there is no doubt that Roy Spencer is right about his claim about IPCC´s position.
The following demonstrate that the cloud feedback parameter is set by choice:
Climate forcings in Goddard Institute for Space Studies SI2000 simulations J. Hansen et all
I find the following section immensely telling:
Therefore we include the possibility of altering the model’s climate sensitivity. We do this by adjusting an arbitrary cloud feedback as defined in the appendix of Hansen et al. [1997a]. Specifically, the cloud cover is multiplied by the factor 1 + cT , where T, computed every time step, is the deviation of the global mean surface air temperature from the long-term mean in the model control run at the same point in the seasonal cycle and c is an empirical constant. For the SI2000 second-order model we take c = 0.04 and 0.01 to obtain climate sensitivities of 2°C and 4°C for 2 CO2.”
This speaks for it self.
They’re not “forcings”, they’re “feedbacks”. Granted, both “forcings” and “feedbacks” are myths, but you need to understand the theory behind the modelling philosophy if you want to be able to make any sense of the “science”.
The pause is dying. Family members who need to say their piece are encourage to go to its bedside while there is still time. The pause can only get deader; it can never get well.
October anomaly is 1.04C
Here’s a close up
peace out; paws up
Hmmm..
I’m going to guess that with each successive month that you’ve posted the statistical progression of temps this year relative to the mean, you’ve had fewer and fewer responses.
Just a coincidence ‘prolly.
Most likely due to everyone recognizing derangement when they see it.
Just like they recognize a putz when he comes along.
+1.
Succinct
He is only intermittently insufferable, lately. I guess he’s still in Judith’s hoosegow. The others in the “J” series of evangelical alarmist drones have tried mightily to fill in, but they ain’t half as annoying.
It is only temporary, as it’s peak El Nino. What goes up must come down.
Don’t sweat it, La Nina and low solar activity are on deck.
Nope.
BW,
agreed the interesting thing is where temps settle after the El Nino lagged affects have worked through the system. Temps back at the ~2002-2014 mean would look like a continuation of the pause. Although whether this or something different will happen in the short term looks difficult to predict.
That’s 0.4C
http://www.drroyspencer.com/2015/11/uah-v6-0-global-temperature-update-for-october-2015-0-43-deg-c/
And 95% of the models agree – the empirical data are wrong
http://www.drroyspencer.com/2015/11/models-vs-observations-plotting-a-conspiracy/
the response will be “wait for the next la Nina”
There is no killing the pause until we can explain the cause.
even then folks can and will object to the explanation.
https://i.imgur.com/3dE3jff.png
Fixed it for you.
I’m actually fine with this. The CO2 effect is logarithmic. Since 1980 the temperature has followed a log curve. With the rate of CO2 increase being nearly constant the correspondence between time and concentration is good – so you would expect a log curve.
Might increase 0.5°C to as much as 0.7°C before it goes asymptotic.
Global warming predicts the slope to be increasing not decreasing (they are confused about the difference between logs and exponentials as they are confused about everything else).
Have your fun. In 2016-2017 the deniers will get in their licks. I expect an ever slowing increase in the temperature trend and look at ONI induced variation as noise.
If the sun worshipers are right and the temperature does actually decline – we should provide a 100% subsidy to the fossil fuel industries. More CO2 is the only convenient way to stave off an ice age, and it solves food and water problems. Warming with benefits is the way to go.
I think we should look into ways to release methane from clathrates that are not expect to ever be exctractable for use.
Not hard to harvest the methane if you aren’t trying to collect it. Large pumps that dredge the bottom up to the surface or tactical nukes should do it. Global warming is setting off 278 nukes per minute. Using a few minutes worth to harvest methane won’t even be noticed.
Data hurts and he gets mean. 1st option: be nasty. 2nd option: be nasty.
It’s funny.
And it’s going to last until around April. What fun.
And then they think it’s automatic that there will be a La Nina.
Well,possible, but there could also be another El Nino. And then another one. Stuff like that can happen when the PDO is ramping up. Natural variation was supposed to be their friend.
It’s the opposite. Natural variation is ACO2’s best buddy.
The pause has already killed the cause. But the alarmist powers that be will keep pretending to fight the fight, at the big partee in Paree This is for huffpo yimmy:
http://www.huffingtonpost.com/eric-mann/prelude-to-paris-four-tra_b_8579840.html
So said the Redcoats. Then they met my ancestors.
Don
That was a remarkably stupid article even by huffpo’s standards
It’s about time they presented the positive side of the balance sheet. The west has brought health wealth longer life and the ability to live better and more comfortably and others in the world are benefiting from our creation of the industrial age.
Tonyb
Tony, that is the perspective of an author who describes himself as:
“Revolutionary, Civil Rights, Anti-war, Labor, and Environmental Organizer”
Those things that our little yimmy aspires to be, but can’t afford to take a pay cut. He lives the life of a Mother Earth hero here, vicariously. A little Caped Crusader of the keyboard.
I know how these guys feel. I used to believe with the same religious fervor that Western (so-called) Civilization was the cause of all evil on our otherwise idyllic planet. My wife sent me to a psychiatrist who put me on an elaborate combination of strong psychotopic medications and I was cured.
JCH: The pause is dying.
Maybe.
The 30-year trend today is .17C. The 30-year trend in 1999 was .17C. Close enough to start filling out the death decree.
JCH: The 30-year trend today is .17C.
What is a “trend today”? Is that “over the past 30 years”, and is it 0.17C per decade?
The 30-year trend today is .17C. The 30-year trend in 1999 was .17C. Close enough to start filling out the death decree.
About right.
But also right,
the 30yr trend in 2004 was almost 2.0C/century
the 30yr trend in 2015 was almost 1.7C/century
30yr trends are falling:
http://climatewatcher.webs.com/Trends30.png
Start filling out the birth certificate.
TE – so the earth warmed during the 18 years of no warming. Good to see you’re catching up.
say what?
http://www.drroyspencer.com/wp-content/uploads/UAH_LT_1979_thru_October_2015_v6.png
October anomaly 0.43C
Question from a lay person: I note that solar events are mentioned as possible explanations for various climate changes. What I do not see is any discussion or data regarding changes in the earth’s relationship to the sun in distance or axial shifts.
Which brings me to polar wondering. It’s noted that, at the axis, these shifts seem minimal and measured in centimeters, but wouldn’t that change in polar distance to the sun increase (or decrease depending on the pole) exponentially along longitudinal lines? Would that not account for one pole’s ice melting while the other is stable or grows in any period? What would that effect be on climate or increased temperatures changes over different areas of earth as it wonders back and forth?
Thank you for your time in responding.
Right now we are on the downward slope of the apsidal precession. See duncansteel.com for an explanation. You might also visit cdejager.com. wikipedia has a nice diagram animated. De Jager has more to do with solar cycles but Duncan Steel is all about Milankovich cycles.
Correction: Milankovitch
BTW the distance in orbits is millions of miles
The axial tilt, as explained by Steel could explain why the south pole is so cold right now and the north pole is warm. Due to yhe present position in this apsidal cycle.
Averaged over a year, Total Solar Irradiance (TSI) at Top Of Atmosphere (TOA) is the same for both hemispheres. The reason is that the greater total heat in joules applied to the hemisphere more oriented towards the Sun during perihelion (near Sun) turns out to be cancelled by the greater heat applied to the other hemisphere during aphelion (distant from Sun).
This is a consequence of Kepler’s Law for elliptical orbits whereby Earth travels more slowly during aphelion and hence has longer to accumulate the heat that has been reduced by the greater distance.
Once you see where Kepler’s Law enters into this cancellation you shouldn’t be too surprised if the two effects roughly cancel. What I found interesting was that they cancel exactly, independently of the Keplerian orbital elements of eccentricity, inclination (axial tilt), and argument of periapsis (phase).
AFAIK this is a new result involving the computation of a delicate integral which yielded to a neat trick. Which if novel one would expect to be eminently publishable as a short communication in a suitable physics or geophysics venue. For starters say, physics arXiv.
So I wrote it up carefully, completely, and (so I thought) neatly, in a format I’m accustomed to using for short communications (in this case a mere two Latex pages printable on a single sheet of paper), and submitted it to the physics arXiv.
Well, what do you know? It was rejected, not on the ground that it was wrong (which it certainly wasn’t), or uninteresting (that many people believe the opposite should surely make it interesting), or a known result (which it may well be but who knows?), but that it was not formatted for journal publication.
What? Nothing about whether it was correct, interesting, novel, etc. And moreover no way to appeal the decision – the judges decision is final.
I concluded that the people who review arXiv submissions are incompetent. Having no shortage of other good problems to work on I saw no point trying to fight these physics people. And it’s not the first time I’ve experienced this with short communications on the physics arXiv. I don’t have this problem with mathematics venues, which is probably where I’ll get around to submitting it next.
The irony is that the arXiv’s have been drowning in volume of submissions for quarter of a century. One would therefore imagine they would welcome a submission making its point clearly and succinctly (one sheet of paper!) instead of rejecting it by taking succinctness as a criterion for unsuitability for journal publication.
Well it’s a good thing someone understands it. It may be a good thing I’m not a reviewer, I probably would have approved your publication :-)
Ah yes I found the Antarctic debate:
http://www.skepticalscience.com/argument.php?p=7&&a=21
ordvic,
Apsidal precession, combined with all the other odd and not so odd peregrinations of the orbit, axial tilt, magnetic poles, core and mantle fluid dynamics, continents bobbing around all over the place and so on, make my head hurt!
Can no one rid me of this pestilential chaos?
Cheers.
ditto, but it is explained thoroughly nonetheless. Just be glad we don’t have to understand it for it to work … in the next 1000 years.
VP, BTW it was Duncan Steel who made the claim of the apsidal precession could account for pole temperature differences. I’m looking for a blog with comments on sKs (actually allowed the debate), where Steel defends his assertions. It is an excellent debate so I hope I can find it again :-)
Looking forward to seeing it if you find it, ordvic.
As a caveat I only derived the equal-hemisphere-warming result for Top Of Atmosphere irradiance. Any asymmetry between the hemispheres can still result in unequal warming. In the case of albedo this is a positive feedback because the warmer a hemisphere gets the lower its albedo as its ice and snow disappear. In particular one would expect the Northern Hemisphere to be warmer on that account. But only for the reason of asymmetric albedo, not for the reason that at perihelion the North Pole is the one experiencing the midnight sun.
Notwithstanding my Google Scholar i10-index of 84 (84 papers cited at least 10 times, a number I only learned about a couple of months ago when I signed up for GS), I’m terrible at submitting papers I write for publication. Over the past 45 years I’ve accumulated quite a stack, and my (very short) equal-hemisphere-warming paper may well end up joining them and no one will ever see it.
With that in mind I’ve put it on my website as http://clim.stanford.edu/NHsurplus.pdf . The original version was dated December 21, 2013, this later version has only a couple of minor touchups, greatly constrained by my wanting it to fit onto a single sheet of paper, sort of like Twitter but for academic papers. Enjoy (if that sort of thing is your cup of tea).
“With that in mind I’ve put it on my website as http://clim.stanford.edu/NHsurplus.pdf ”
It’s really a neat result and a pity that it hasn’t yet been accepted for publication.
Thanks, Pierre-Normand. Some day I’ll figure out how to make it look more like a journal publication, if that’s what it takes to get short communications accepted.
Kathleen H.: Would that not account for one pole’s ice melting while the other is stable or grows in any period? What would that effect be on climate or increased temperatures changes over different areas of earth as it wonders back and forth?
Are you asking about such effects on a time scale of 100 years or 100,000 years?
The answers are quite different. Only the former has any bearing on climate during this century. The slower pace of the latter makes such fluctuations less problematic for biodiversity etc. But perhaps you’re more interested in the latter, which is certainly interesting in its own right.
Vaughan Pratt,
How about a time scale of less than 10 years? It appears probable that the temperature of Greenland increased about 7 C in less than 10 years. The IPCC acknowledges “less than a few decades”.
In any case, dramatic rises and falls of temperature unlike anything in our experience, seem to have occurred.
I fervently hope I don’t have to experience such an event. It might well disturb my quiet enjoyment of life, eh?
Cheers.
https://images.duckduckgo.com/iu/?u=http%3A%2F%2Fwww.ferdinand-engelbeen.be%2Fklimaat%2Fklim_img%2Fgreenland_jja_temp.gif
Huh? Where does 7°C come from? It might be as warm as the 1960s, maybe.
PA,
From Wiki (you can read the references if you like. They seem to fit with other sources.)
“Measurements of oxygen isotopes from the GISP2 ice core suggest the ending of the Younger Dryas took place over just 40–50 years in three discrete steps, each lasting five years. Other proxy data, such as dust concentration, and snow accumulation, suggest an even more rapid transition, requiring about a 7 °C (13 °F) warming in just a few years.”
As far as I know, some researchers say as little as 5 years. Cooling in various parts of the world including Greenland, has been similarly precipitous. Some flavour of the annoyance of changing weather patterns can be derived from –
“Goehring hopes to use the cosmogenic dating techniques elsewhere, including Norway. There are numerous records, he said, of farms and farmhouses there being overrun by ice during the unusually cold period known as the “Little Ice Age,” which continued into the mid-19th century.”
Whole villages have been overrun in Europe in the 19th century – after hundreds of years of ice freedom, grazing in the summer, sitting in the village square enjoying the sunlight.
I hope it doesn’t happen to me. Who knows?
Cheers.
Mike Flynn | November 19, 2015 at 9:33 pm |
“Measurements of oxygen isotopes from the GISP2 ice core suggest the ending of the Younger Dryas took place over just 40–50 years in three discrete steps, each lasting five years. Other proxy data, such as dust concentration, and snow accumulation, suggest an even more rapid transition, requiring about a 7 °C (13 °F) warming in just a few years.”
I understand…
You are probably right.
However, comparing the young dryas to the current time is apples and grapefruit.
The younger dryas may have been caused by an asteroid impact. At any rate it isn’t clear what caused the younger dryas. If we have a near extinction asteroid impact then the younger dryas may comparable.
However from previous ice ages, at our point in the interglacial the only way temperature has failed is failed downward. We could get a 7°C drop.
http://www.cabrillo.edu/~rnolthenius/climate/Denialists/D-Ruddiman/milak&temp.jpg
The average temperature at our level of insolation is 4.5°C cooler. The claims we are going to “fail upward” are just laughable.
Correct me if I’m wrong.
People promoting boreholeometers believe that surface heat from say, 500 years ago crept below the surface during the day, and did not move back toward the surface at night when the surface cooled.
Instead, by the same mechanism used by CO2 to move heat into the cold depths of the oceans, the surface heat moved from the colder surface to the hotter interior, where it remained, until supposedly measured by the Warmists at depths greater than 20 meters.
During 500 years, the temperature at a particular depth remained sufficiently different from the layers above and below, to be measured later. In other words, adjacent bodies at different temperatures stopped obeying the laws of physics until called on to do so by the climatologists.
If you are particularly gullible, you have to suspend disbelief, and accept, as NOAA do, that –
“Departures from the expected increase in temperature with depth (the geothermal gradient) can be interpreted in terms of changes in temperature at the surface in the past, which have slowly diffused downward, warming or cooling layers meters below the surface.” – NOAA.
So cooling slowly diffuses downward, while the surface above remains warmer than the “coolness” below it. The “coolness” keeps descending, and then stops, waiting to be measured. Or warming, if that suits your purpose better. At least according to NOAA!
What nonsense! More modelling, supposedly showing that other silliness such as treemometers is scientific, and accurate. It should be noted that the first 20 meters or so of borehole data is discarded, as the seasonal influence of the Sun can be detected at this depth. We are supposed to believe that temperature changes caused by the Sun can be detected at depths beyond which the influence of the Sun can be detected – by definition!
Oh what fun it must be, to be a climatologist. No accountability, no responsibility, no need to learn physics or thermodynamics – just watch Star Trek, and “make it so”!
Cheers.
I think you are wrong…. :-)
I make no judgement as to the veracity of boreholes or the reliability of the technique but the idea with boreholes is that the temperature gradients are trapped by layers of snow. They don’t “diffuse” down or anything like that. The fresh snow serves as insulation and is it builds up over time the temp gradient is preserved layer by layer.
I have to say, I have often struggled with this intuitively. How can temp gradients in even the best insulators be preserved for such a long time? I know that there is a logarithmic effect for heat between objects of different temps to equilibriate, but I really struggle to imagine how that could extend meaningfully over such a long period of time.
Yet, they use very sensitive thermometers, they can reliably reproduce results in the same area so they must be seeing something. The resolution must be very course of curse and I don’t know how they would allow for variability in precipitation.
Actually, the prehistoric CO2 levels are measured in much the same way, since the snow traps atmospheric properties layer by layer, year by year. But just like the heat, it appears they do diffuse especially in the early years, so they can be a little unreliable for that sort of detection.
agnostic2015,
Thanks for your response. I’m not talking about ice cores. I believe boreholes in the ground are supposed to reflect past surface temperatures, by some miracle.
The very fact that results from boreholes in various parts of the world, drilled through rock of different thermal properties, in areas of demonstrably different thermal gradients, show remarkably similar results, might indicate more wishful thinking than science.
Even inferring past temperatures from ice cores is probably an exercise in futility. Isotope ratios are based on present day composition of sea water. There is no particular reason to believe that the oceans’ composition in the past were the same as today. Many other assumptions are also made, without any apparent caveats relating to other factors which are totally disregarded, if they do not support the desired result.
Lots of time, effort, and money expended to achieve precisely nothing which could remotely be considered accurate or useful.
It’s all about as silly as handing Michael Mann a slice of tree, and expecting him to accurately tell you the temperature where the tree grew, year by year. And yet, many still believe. There’s more than one born every minute, obviously!
Cheers.
Ach – apologies. I confused boreholes and ice cores in my mind. I have absolutely no idea how the borehole proxies are supposed to work.
So many ice cores, so little cataloguing, even less analyzing. And where is the data?
=============
Of course, I think you meant to write “coarse of course.”
I see wind, precipitation, evaporation, and cloud cover as complicating factors.
Matthew
I think Mosh has inadvertently posted the wrong link on boreholes . When I corresponded with huang last year he suggested that the 2008 version was better
http://www.earth.lsa.umich.edu/~shaopeng/2008GL034187.pdf
He also advised that anything older than a 300/400 year reconstruction ran into difficulties
Tonyb
tonyb, thank you for the link to Huang’s later work.
climate reason,
Thanks, also, for the link.
It looks suspiciously like somebody pointed out their early paper was more enthusiastic than scientific.
From your link –
“The database contains more than 24,000 entries, of which a little more than half come from measurements in boreholes on the continents. While it is true that these data were derived from temperature measurements in boreholes, the database does not include the actual temperature vs. depth measurements. For some entries (more than 6,000), there was additional information about the depth range over which the heat flux determination was made.”
It now seems that temperature readings from boreholes at specific depths don’t actually exist, so clams of “cooling” signals moving downwards is just specious nonsense.
The authors state –
“We then extend this temperature-depth profile downward from 300 m to 2000 m, making use of the heat flux vs. depth data of HPS97. The steps to convert heat flux over a depth interval to temperature change over that interval involves integration of Fourier’s equation of heat conduction.”
This is somewhat miraculous, given that they state the data doesn’t actually exist. They try to paper over this minor difficulty by implying they calculated the temperature profile from measured heat flux. Of course, this won’t wash either, because calculating heat flux requires temperature measurement(s), which don’t exist, apparently. Maybe Phil Jones lost them.
The authors will no doubt defend their paper as vigorously as Mann, Schmidt or Hansen defended some of their more ludicrous efforts.
No wonder real scientists avoid “climate science” like the plague. I do feel sorry for the poorly advised who believed that involvement with “climate science” would be a good career move in the long term.
It’s all good fun, isn’t it?
Cheers.
you are wrong
Steven Mosher: you are wrong
maybe. it would be helpful if you fleshed out your argument a bit.
He asked a question.
I answered it.
But for reference, here
http://www-personal.umich.edu/~shaopeng/annurev00.pdf
Steven Mosher: He asked a question.
I answered it.
Wrong again. What Mike Flynn said in the post that you responded to (according to the indentation) was “Correct me if I’m wrong”. You provided no correction. His post has no question. If you were responding to a question, do please quote it so that readers like me know what the heck you are writing about.
http://www-personal.umich.edu/~shaopeng/annurev00.pdf
Thank you for the link. I downloaded the pdf.
sorry matt.. you are correct.
he asked to be corrected if he was wrong.
he is wrong.. explaining to him why he wrong is not my responsibility, nor is it yours or anyone’s elses. If I told you 2+2 = 5, it’s enough to point out it is wrong. At some point skeptics have to understand that learning the science is their responsibility. Nobody owes Flynn a free education.
You? you get a link. While the reconstruction of temps from boreholes has difficuties and challenges they are not the “problems” that Flynn imagines.
Matthew
My reply to you landed in the wrong place. Huang suggested to me that the 2008 version of his borehole work should be used, mosh seems to have inadvertently posted an old version
http://judithcurry.com/2015/11/16/400-years-of-warming/#comment-744128
Tonyb
Steven Moshe,
From your reference –
“The fundamental concept behind subsurface temperatures as a climate proxy can be succinctly stated: If Earth’s atmosphere experiences a warming or cooling, the soil and rock in contact with the atmosphere will feel this change. Such temperature changes at the Earth’s solid surface then propagate into the subsurface by heat conduction through the soil and rock.”
This is “succinctly stated” nonsense. Cooling one end of heated object does not “propagate” any cooling through the object. There are no “cool rays”, nor is there negative heat. Anybody who believes so is merely deluded.
Another piece of blinding ignorance is the implication that the atmosphere warms or cools the surface, by itself. This is just physically incorrect. As Tyndall pointed out, the surface temperature can be over 30 C, where the “air temperature” is below zero.
Have you actually read the paper? Do you really believe in the accuracy
of treemometers?
You might just as well link to some of the more ludicrous Warmist papers as “proof” that you have found your lost clue. It seems obvious that you still don’t have one.
Cheers.
Nope. Makes perfect sense to anybody who understands the differential equations that describe the flow of heat through a physial object.
Of course it does.
Nobody’s talking about “cool rays” except you.
Of course there is.
Anybody who believes they can understand science without understanding the descriptive math is merely deluded.
https://img0.etsystatic.com/100/2/6191330/il_570xN.829820300_pxc8.jpg
Steven Mosher: explaining to him why he wrong is not my responsibility, nor is it yours or anyone’s elses.
gee. You passed up an opportunity to share information. You also did not have a responsibility to tell him he was wrong.
mathew read his latest. its hilarious
AK,
Of course there is negative heat – inverted caloric – just as phlogiston has negative weight. /sarc off
I’m curious as to how you determined my knowledge of mathematics? Mind reading, perhaps? What branches of mathematics do you consider you understand better than myself? Why?
You obviously haven’t found Steven Mosher’s missing clue, either!
Cheers.
AK
“Nope. Makes perfect sense to anybody who understands the differential equations that describe the flow of heat through a physial object.”
dont expect flynn to get it
http://www.clim-past.net/2/1/2006/cp-2-1-2006.pdf
Steven Mosher,
Thanks for the link. I particularly liked the conclusions –
“Discussion and conclusions
Modelling and observations presented above show that differences higher than the error of measurement are observed between the model based on surface forcing (observed SAT plus assumed POM) and observation. It is mainly due to our poor knowledge of the climatic history before the ob- servational period and poor knowledge of other factors like groundwater flow, snow cover trends etc. These factors are difficult to distinguish from each other without additional independent information about the climate preceding the ob- servational SAT record.”
They still don’t manage to explain how surface cooling manages to propagate downwards through warme substrates, presumably resulting in a layer of unchanging colder rock sandwiched between layers of warmer rock. Measuring this amazing occurence by taking the temperature of water in a borehole seems a bit far fetched. What do you think?
Not to worry. It’s all models, assumptions, and estimates anyway! Complete rubbish.
Keep laughing.
Cheers.
Steven Mosher: mathew read his latest.
The irony is that I read most of your posts and skip most of his. I stepped into this bog by reading up from the bottom instead of down from the top.
you skipped the validation part of the paper mike.
and you skipped the math.
read what AK wrote again…
Steven Mosher,
Unfortunately, measuring the temperature of the water inside a borehole ( presumably cased, but not specified) tells you the temperature of the water at that depth. Nothing more, nothing less.
You might decide that the air temperature was measured. Just as pointless. Maybe you think the material comprising the bore walls was measured. Not so useful, if the material has been exposed to either air or water for any length of time.
In any case, unless the boreholes were made with a magic drilling rig, where the drilling head generated no heat, and no fluid or drilling mud was used to flush the drill waste from the hole, the temperatures of the exposed bore walls are useless for anything except rough indications of the local geothermal gradient.
Even worse, if the boreholes are cased, which is usual. Metallic casings conduct heat, making precision temperature reading of the borehole surfaces impossible. Plastic cases are even worse, for the opposite reason.
USGS –
“Temperature Tools
The temperature log can be used to give a useful profile of the thermal conductivity of rocks adjacent to the borehole and a measurement of the local geothermal gradient when the borehole is allowed to stabilize for a period of time (at least several days) after drilling ceases, assuming there is no convection in the borehole. The temperature log can be used to indicate where water is entering or exiting a borehole, where there is flow in the borehole, and to trace a dynamic fluid-temperature front between
wells. Temperature logs need to be run in fluid-filled boreholes, either cased or uncased. Most temperature tools range from 1.0 to 1.5 in. in diameter.”
You will note “assuming there is no convection in the borehole.” No problem, if Warmist physics is employed. The colder denser water at the top of the hole will not displace the warmer less dense water at the bottom of the hole. More magic?
Stupid, stupid, stupid. Sorry, still no cooling propagated from the surface to the warmer depths. Tosh and balderdash!
Cheers.
Forget Flynn who flails about with Strawmen arguments.
Good arguments about the LIMITATIONS of borehole work can be found IN THE SCIENCE.
That is something Skeptics refuse to learn. THE BEST arguments against tree rings or bore holes or temperature adjustments or c02 are already IN THE SCIENCE.. The trick is to pick one of these areas and see if you can improve on the best argument.
Instead you guys waste time with stupid arguments ( c02 is a trace gas… waaaa ) and lose the debate thereby
Here is a nice paper
http://esrc.stfx.ca/pdf/Lesperance_et_al_2010JD014377.pdf
some really good arguments.. not hand wavy flynnisms
Steven Mosher,
From your latest wildly speculative modelling link –
“A one‐ dimensional model of heat conduction is used to show that surface trends are attenuated as a function of depth within conductive media on time scales of decades to centuries, therefore invalidating the above assumption given practical observational constraints. The model is forced with synthetic linear temperature trends as the time‐varying upper boundary condition; synthetic trends are either noise free or include additions of Gaussian noise at the annual time scale.”
Models, models, models.
The authors accept that even at depths of less than 20 meters, the actual recorded temperatures and the model temperatures are different to the point of uselessness.
However, the authors proceed to ignore facts, and provide modelled outputs to great depths, using a model which they agree doesn’t provide results that agree with reality, even at depths shallower than those within the influence of the Sun.
Have you got any facts, Steven, or do model “experiments” replace observed data in your Warmist denialist world?
Maybe if you wave your hands hard enough, you can reverse four and a half billion years of recorded cooling. Or maybe not. What do you think?
Cheers.
Boreholeometry like tree proxitization is said to be better at divination than tea leaves and chicken entrails.
Since we don’t have instrumental data from 1000 or 500 years ago the claims of better accuracy have to be taken on faith to some extent. The tree proxies went south in 1960, and there is no proof they didn’t go north in the distant past. The calibration period is back when temperature measurement was less reliable. Tree proxies don’t show warming since 1960 so they are claimed not to match current temperatures and not validated against modern measurements.
The claim that tree proxies kinda look like the actual temperature for 40 or 60 years in the early 20th century if you are far away and near sighted doesn’t mean they are a “calibrated proxy”.
Since there hasn’t been a study proving that boreholeometry and tree proxies are better than tea leaves and chicken entrails, the claim they have more value is without merit.
“Since there hasn’t been a study proving that boreholeometry and tree proxies are better than tea leaves and chicken entrails, the claim they have more value is without merit.”
Your task is to do the tea leave reconstruction. Then we can test your claim.
With tree rings you can in fact do verification statistics.
They are better than tea leaves.. because.. there is no tea leave recon
Bat wings from the belfry in a prestigious ivory tower is the currently preferred method of calibrating proxy data.
Steven Mosher,
I have consulted the entrails.
They tell me that the surface once molten. The seas were once boiling. Parts of the Himalayas were once 6000 meters lower than now.
So far so good. The past has been corrected predicted 100%.
As to the future: –
Weather will continue. No two days will be exactly the same. The Sun will continue to rise and set. Climate will continue to change. The Earth will continue to slowly cool.
The tea leaves agree with the entrails. 100% correlation, therefore both are completely accurate.
You have nothing even remotely as accurate or useful.
Cheers.
“With tree rings you can in fact do verification statistics.”
Well, if they did their validation against the entire instrumental record that would be fine. “I don’t wanna” is an insufficient justification for not using the post-1960 period for calibration. Picking a calibration period just because it looks good to you is cherry picking.
Perhaps it really isn’t getting warmer and the trees are correct.
Further if the proxies were REALLY calibrated against the instrumental record, the dead wood studies should show 60% more variance, a much warmer MWP and much colder LIA. The historic instrumental record has been “adjusted” with 60% more variance since 2008 and perhaps 80% or more since 2000. The dead wood studies need to be adjusted to have 60-80% more variance just like the instrumental record.
I am looking at the tea leave thing there are a few tea bags in the pantry.
PA
“Well, if they did their validation against the entire instrumental record that would be fine. “I don’t wanna” is an insufficient justification for not using the post-1960 period for calibration. ”
Do you even know what you are talking about.
http://www.ltrr.arizona.edu/~dmeko/notes_12.pdf
go research the difference between calibration periods and validation periods.
there are good arguments about the limitations of tree rings. go learn them.
400 years of tit-for-tat.
@MF: Correct me if I’m wrong. People promoting boreholeometers believe that surface heat from say, 500 years ago crept below the surface during the day, and did not move back toward the surface at night when the surface cooled.
Thus far I’ve never called anyone a troll on CE. But after following Mike Flynn’s arguments about boreholes, which bear a distressing similarity to all his other arguments, there can be no question that Mike Flynn is not here in any capacity other than to play the troll.
While I’d be perfectly happy to explain the quantitative physics of boreholes to Mike, what would be the point? Mike Flynn is here for no other reason than to suck up people’s time with inane remarks, arguments, and contradictions, none of which show the slightest interest in actually learning anything worthwhile.
DFTT: Don’t Feed The Troll.
Vaughan Pratt,
Still no correction based on fact? Maybe you are one of those people who blindly believe any sort of rubbish published in a “peer reviewed” journal.
Guess what, Vaughan. Not all is as it seems.
I suppose you would be far too clever to believe any of the computer generated gibberish papers accepted for publication by Springer or IEEE.
Or – (2014) –
“Finally, in the last few weeks of the year, Elsevier retracted 16 papers by one researcher after it became clear that fake peer reviews were behind the acceptances of Khalid Zaman’s papers.” Just one of many, unfortunately.
Facts are facts. Nonsense is nonsense. CO2 is plant food. It warms nothing. Never has, never will. Cold waves do not propagate down from the surface seeking the warmer depths.
So fire away. Unleash your “quantitative physics”. Ordinary physics, based on theory confirmed by experiment, suits me.
Cheers.
If this definition is accurate:
In Internet slang, a troll (/ˈtroʊl/, /ˈtrɒl/) is a person who sows discord on the Internet by starting arguments or upsetting people, by posting inflammatory,[1] extraneous, or off-topic messages in an online community (such as a newsgroup, forum, chat room, or blog) with the deliberate intent of provoking readers into an emotional response[2] or of otherwise disrupting normal on-topic discussion,[3] often for their own amusement.
Then:
1.) Boreholes are off topic?
2.) Provoking readers into an emotional response?
3.) Often for their own amusement?
1.) Pretty much!
2.) Debatable!
3.) She is not amused!*
*Queen Victoria once remarked, with British understatement, “We are not amused.” What was she not amused by?
Victoria’s comment is said to have been inspired by the Hon. Alexander Grantham (Alick) Yorke, one of her grooms-in-waiting. (A relative described him as an “elderly pansy.” Flower lover, I guess.) The job of a groom-in-waiting, or anyway Alick’s job, was to hang around the castle and be funny. As all wits know, however, you’re funnier some days than others. On one of Alick’s not-so-funny days, some say, he told a risque story to a German guest (“Gab es ein junger Mann von Nantucket …”), who laughed loudly, moving the queen to ask that the story be repeated. It was, and she wasn’t. Amused, I mean. She was not using the royal “we,” though, but rather was speaking for the affronted ladies of the court.
Try try again:
1a.) Boreholes are off topic?
1b.) Provoking readers into an emotional response?
2.) Disrupted normal on topic debate?
3.) Often for their own amusement?
1a.) Pretty much!
1b.) Debatable!
2.) Debatable!
3.) She is not amused!*
with the deliberate intent of provoking readers into an emotional response
He certainly succeeds in provoking Jim D into arguing with him, over and over, in the apparent expectation of a different result at some point.
Any luck so far, Jim?
or of otherwise disrupting normal on-topic discussion
If I had to pick just one adjective for Mike Flynn on CE it would be “disruptive”.
Is there anybody from Australia who is not disruptive!!
Mike, suppose it was cool at the surface for 100 years and then warm for ten years. Do you expect cooler temperatures to be found below the warmer temperatures, or don’t you know how thermal diffusion works in solids and so that would be a complete surprise to you?
Jim D,
In typical Warmist fashion, you pose a question almost completely devoid of meaning. You don’t specify temperatures, the physical properties of the body involved, or whether the heating and subsequent loss of heat is continuous or intermittent. However, my answer would be no, if you mean that In some fashion, “cold” diffuses into “warm”.
However, I draw attention to the following (from Wikipedia, but good enough) –
“Heating is a natural process of moving energy to or from a system other than by work or the transfer of matter. The heat passes only from a hotter to a colder system.”
You might ask “Ah, but what about cooling?”. When heat passes to a cooler system, it results in “cooling”. Now your surface cooling is nothing more than the warmer layers below the surface losing heat at a rate more rapidly than it can be replaced by the energy from, in this case, the asthenosphere through the crust.
The temperature gradient steepens depending on the surface temperature being reduced, or may temporarily form an inversion – say if highly absorbent rock is heated by the Sun during the day. In any case, “cold” does not “diffuse” through anything. As an example, you might wish to affix a metal rod (for convenience only), to a temperature controlled soldering iron at say 300 C. The far end of the rod will not reach 300 C, but will reach a steady temperature. Now dip the end in ice water. Hold it there as long as you like – if your rod is long enough, it will get very close to 0 C. Now replace the ice water with warm water, and allow the rod to heat to the temperature of the water.
Finally, using your most sensitive thermometer, find the “cold” which has “diffused” into the rod. Unfortunately, physics prevails, and the temperature gradient proceeds from 300 C to something less, depending on the environment. The heat is passing from a hotter to a colder system. It cannot do otherwise.
Even if you freeze the middle, all you have is two gradients from hotter to cooler. Once you remove the temporary energy sink – the lower temperature portion – the temperature gradient along the rod will once again proceed from hotter to colder, without any “cold” spots along the way.
In the case of the Earth, you cannot affect more than the surface, and a short (maybe 20 meters) distance below it, by the application of the Suns heat, or, alternatively, removing the Sun’s heat, and allowing the interior heat of the Earth to escape as rapidly as possible.
Just as another example, take a block of ice at say -4 C. Put it in a hole as deep as you like over 20 meters depth. Leave it for 24 hours. Has its volume changed? Has its “coldness” diffused into the rock, or has the temperature of the surrounding rock dropped due to energy being absorbed by the ice, and the ice melting. The temperature of the resulting water will eventually rise to equilibrium with the surrounding rock.
And no, I’m not surprised that you have no idea about how heat moves from hot to cold, and not the other way. Steven Mosher’s clue is still missing. You certainly don’t appear to have it.
If you wish to, you might care to read up on the heat equation. You probably don’t need to understand parabolic partial differential equations, but if you do, it will reinforce what I have said.
If you think I am in error, please quote exactly the words with which you disagree, and provide some facts to support yourself.
Cheers.
A long answer to explain how you don’t believe in thermal diffusion. You don’t need much knowledge of diffusion. Try it this way. It is cold for 100 years, the cooler than average temperatures diffuse deep into the earth at a rate governed by thermal diffusion, just the way cold temperatures diffuse down a rod with one end in ice water (which maybe you don’t believe). It is then warm for ten years, the relative warmth diffuses less distance in that time. Now do you see why as you go deeper into the layer the warmth has not reached yet, it could be colder there? Try putting the end of an insulated rod in ice water for a day, then in boiling water for a few minutes, and see what the temperature looks like along the rod. That is how boreholes work.
JimD,
What part of quoting the parts you disagree with, did you not understand?
Warmist wishful thinking. The Earth has been exposed to outer space for four and a half billion years. This has resulted in “cooling”.
The crust is really, really, thin. The rest is from very hot to really, really, hot.
Heat flows from hot to cold – unless you are a foolish Warmist in denial,
Cheers.
I gave you your own example with a long rod and you didn’t comprehend it. Reverse your experiment and first put the end in cold water for a few days. Then heat the same end for an hour. It will still be cold further down the rod because heat diffuses with a limited speed. You agree with that part, right?
JimD,
What part of quoting what I said do you fail to comprehend? You obviously did not properly read what I said. You keep trying to shift the goalposts. I won’t play your stupid Warmist game.
Quote exactly what I said, and provide facts to support your disagreement. Of course you can’t, so you will fly off at a tangent, change the subject, try to introduce irrelevant and incomplete analogies, anything to avoid admitting that you can’t actually show where I am in error.
Just a small quote, if complete, will do. A teensy weensy little one? Of course, Warmist prefer denialist fantasies to facts.
Nonsense such as CO2 warms things, CO2 is poisonous, CO2 is a polluting health hazard, reducing CO2 will stop the climate changing, bring World Peace and cure baldness. Magical stuff, that CO2.
Cheers.
OK, I was trying to give you a simpler experiment with just two temperatures, but you have to have this one in order to understand anything, so let’s go with it.
“As an example, you might wish to affix a metal rod (for convenience only), to a temperature controlled soldering iron at say 300 C. The far end of the rod will not reach 300 C, but will reach a steady temperature.”
OK, so far, but it won’t be steady because eventually the whole rod would reach as close as you want to 300 C if it is insulated.
Now dip the end in ice water. Hold it there as long as you like – if your rod is long enough, it will get very close to 0 C.”
Yes it will get close to 0 C at that end and a temperature slightly warmer than that spreading along the rod, until at some point it is still nearer 300 C.
Now replace the ice water with warm water, and allow the rod to heat to the temperature of the water. ”
Yes, now you have the warmth starting to spread up, but it will still be colder than that further down and warmer than that even further down. The cold part doesn’t immediately disappear when you put an end in warm water, which seems to be your assumption. This is how boreholes can tell us that it was colder in the past, and your example illustrated that too. Satisfied now?
JimD, “Mike, suppose it was cool at the surface for 100 years and then warm for ten years. Do you expect cooler temperatures to be found below the warmer temperatures, or don’t you know how thermal diffusion works in solids and so that would be a complete surprise to you?”
There is a kind of interesting heat exchange directional effect with the oceans that deserves a little better consideration. The ocean can release heat much more quickly than they can regain heat. The rate varies greatly with surface wind velocity, salinity/density gradient stability and CO2 concentration has a small impact on the rate which can be significant on multi-century and millennial scales. Of course that is meaningless with climate being a multi-decadal thing.
This is a large part of the reason that volcanic and solar variations are darn near impossible to model.
This is boreholes, however, captd? Solids are about as simple as it gets. Maybe you can explain it to MF.
With the TOA at current configuration: more energy in than out, the oceans cannot release energy quickly. And it is because of ACO2.
Now, if you could wave a wand and drop atmospheric CO2 to 280 ppm, the oceans would vomit energy like crazy.
JimD,
I wrote –
” The far end of the rod will not reach 300 C, but will reach a steady temperature.”
You wrote in response –
“OK, so far, but it won’t be steady because eventually the whole rod would reach as close as you want to 300 C if it is insulated.”
JimD, you might be so good as to where I said anything about it being insulated. I didn’t. You haven’t shown that I said anything wrong. You added another condition – “if it is insulated” – and then complained about it.
You then go on to say –
“The cold part doesn’t immediately disappear when you put an end in warm water, which seems to be your assumption.”
I didn’t say it did. Once again you are criticising an argument which you made yourself, based on an unwarranted assumption. This is standard Warmist fare, refusing to acknowledge what has been written, and rather substituting what you would like to have appeared.
You still haven’t even managed to show a single error of fact. Boreholes do not retain any information relating to surface temperature at any depth beyond the seasonal influence of the Sun. Cold does not flow. Heat does, and it moves from hotter to colder.
You are merely confused. Measure the temperature of water in a borehole at some depth over 20 meters and I can assure you cannot deduce what the surface temperature was from the present water temperature in the borehole.
Casting runes or reading the Tarot will be just as accurate.
Cheers.
MF, why should it stop at “seasonal influence”? As you get deeper the influence comes from longer periods. You seem not to understand how diffusion works. Perhaps you think boreholes don’t show that things were colder a century ago, in which case it is just your own observation denial. Why are you putting water in your borehole? That is not how it is done. They simply look at its temperature as a function of depth. Glad to help.
@cd: The ocean can release heat much more quickly than they can regain heat. The rate varies greatly with surface wind velocity, salinity/density gradient stability and CO2 concentration has a small impact on the rate which can be significant on multi-century and millennial scales.
The chill factor, for oceans instead of people. :)
This is a large part of the reason that volcanic and solar variations are darn near impossible to model.
Would that reason be any less applicable to clouds?
Berkeley does an excellent job of improving our understanding of how to model clouds and other hydrological issues, some of which bear on your chill factor for oceans. Lots of new insights there.
vp, “@cd: The ocean can release heat much more quickly than they can regain heat. The rate varies greatly with surface wind velocity, salinity/density gradient stability and CO2 concentration has a small impact on the rate which can be significant on multi-century and millennial scales.
The chill factor, for oceans instead of people. :)
Kind of. a direct water to air heat exchanger is more efficient in the WATER -> AIR direction partially due to evaporation but mainly due to the air being more mobile. The air itself is mainly just limiting the rate of heat loss, more turbulent mixing and a higher flow rate just enhances the rate of loss. I don’t like to call it evaporative cooling because it is hard to keep track of where that latent ends up and there isn’t a good indication of what “normal” evaporation should be.
vp, “Berkeley does an excellent job of improving our understanding of how to model clouds and other hydrological issues, some of which bear on your chill factor for oceans. Lots of new insights there.”
I have skimmed a few of those, but I have mainly looked at GFDL papers. Since I tend to enjoy the ocean paleo more than most I have focused more on convective trigger temperatures and issues with different SST proxies. Tropical Mg/Ca and corals reconstructions definitely indicate ~400 years of warming and high latitude tree ring reconstructions definitely indicate red herrings. Boreholes agree with the tropical oceans which should be pretty convincing.
Natural variability is indeed the one question the whole attribution question comes down to. What you get out depends on what you put in as assumption.
Toying around with fitting data to time series models using stationary models like AR-processes and simulating the probability of observations of R^2 of fits of temp. series to log co2 you get a zero chance of HadCrut4 e.g. being from natural variability (as far as I understood Lovejoy did something like that).
Using an ARIMA-fit (which from the physics side should make more sense) and running a monte carlo sim. gives about a 25% probability to get the observed R^2 for fitting the temperature record to Log c02.
But both fits from visual inspection don’t look right, one has to few trends, the other too much.
Actually supposing the climate is somehow chaotic one perhaps shouldn’t expect a good fit from time-series models driven by gaussian noise.
Is there any model yet that gets the statistics of natural var. right? Might be somehow informative.
It’s always useful to remember that the more we attribute recent warming to man the colder we would now be without man’s efforts. If sensitivity is high, then we’re only warm from the release of AnthroCO2, and frankly, we can’t keep it up forever, or even for very long.
================
How is this useful? Lol.
You’d better hope the recovery from the Little Ice Age was predominantly natural for if man is responsible for the warming recovery from the coldest depths of the Holocene, then we can’t keep it up much longer.
================
kim:
Not to worry. If INDCs and international carbon controls throw the planet into another ice age, I’m sure we will get a refund.
All they will have to do is roll strikes at the ice sheets:
Congratulations Dr. Curry. This is a great brief presentation on how climate science is in its infancy. A relatively small group of people was able both to claim that CO2 is the main driver of temperature/climate, and to become dominant in this field. There is a temptation to replace one exaggerated theory, based on little evidence, with another. You are resisting that temptation.
Years ago Steve McIntyre was surprised that while proxies were clearly important evidence on “global climate,” little effort was being made to study them rigorously, or to gather new ones.
Dr. Curry: “ During my visit to Oxford last summer, I met with oceanographer David Marshall, who reminded me that the influence of the oceans on climate starts to get interesting at timescales around 1000 years. “
What we know with some certainty about oceans (if data is to be believed) is that the intra-annual change in the insolation effects (suspiciously) high symmetricity in the N. Atlantic’s sea surface temperature, cantered on 1st of March and 31st of August. Since all the months show multi-decadal variability within + or – 0.5 degree C, well within margin of the measurements error for the SST, I could only conclude that the N. Atlantic Ocean’s SST has been remarkably steady.
http://www.vukcevic.talktalk.net/NA-SSTmonth.gif
I have no idea what the case might be on the timescales around 1000 years.
Thank God, we have the tools and minds at this moment in history to be able to catch this falling knife just it time. What are the odds?
Dr. Curry,
A cursory analysis of the past 10,000 years global reconstructions quickly shows that there has not been a single significant abrupt warming event. Holocene millennial to centennial climate variability is characterized by four major and a few more minor abrupt cooling events followed by recovery.
A more detailed analysis of the past four major abrupt cooling events shows that all of them coincide with periods of one or a cluster of grand solar minima suggesting that they are mainly due to low solar activity.
After the low in the cooling event, the recovery takes between 200 to 400 years, so we are talking about a 200 – 400 year period of temperature recovery, not secular warming. Why it takes so long for temperatures to recover after the sun goes back to normal activity probably has to do with ocean’s inertia.
Any warming caused by GHGs is over imposed on this natural recovery.
By the way, despite almost everybody assuming that global warming should continue sometime in the near future, once the recovery ends the most probable outcome would be a return to Holocene general cooling and I don’t think we can put enough GHGs in the atmosphere to prevent that from happening.
The image didn’t work. Let’s try again
[IMG]http://i1039.photobucket.com/albums/a475/Knownuthing/Abrupt2_zpsqul2fobb.png[/IMG]
Without tags, perhaps.
http://i1039.photobucket.com/albums/a475/Knownuthing/Abrupt2_zpsqul2fobb.png
Don’t worry about cooling. There are much more potent ghg than co2
So you are of the school that thinks that glacial periods have been abolished by humankind and Milankovitch has become irrelevant. Well, that is just a belief, not even a hypothesis. If 25% of all the CO2 that humankind has put in the atmosphere has failed to significantly raise temperatures over the last 19 years I don’t see your belief holding much water.
http://berkeleyearth.org/3-packs-a-day-killer-air-in-shenyang/
Mosh
Very worrying. Let’s hope they do reduce their coal consumption as promised but with such an insatiable need for energy I doubt if these scenes will disappear for a decade or two
Tonyb
climatereason: Let’s hope they do reduce their coal consumption as promised but with such an insatiable need for energy I doubt if these scenes will disappear for a decade or two
Indeed. I would expect that, if they devote some of their productive capacity to cleaning the effluents, their net fossil fuel consumption will increase.
Are we no longer discussing CO2?
Curious George: Are we no longer discussing CO2?
Increased fuel consumption to clean power plant effluent will increase CO2 production if net output is maintained.
Mathew the Pm25 spike is due to district heating.
As for power generation the goal is to move people away from coal. For health and climate reasons.
Steven Mosher,
You wrote –
“As for power generation the goal is to move people away from coal. For health and climate reasons.”
It seems you have boarded Hansen’s Death Train. I’m sure the grateful Chinese (and maybe the Indians too), will shower you with garlands, and prostrate themselves before. Or they might politely chuckle behind their hands, at the ignorant foreigner and his hubris.
Move away from coal. A laudable goal, but maybe you can come up with a cure for cancer while you work out how to keep civilisation going in the absence of coal. Maybe you could utilise the well-known heat storing abilities of CO2. Store the heat during the day, and release it at night, boiling water to drive steam turbines.
There’s quite a lot of sunshine in India and China. How hard could it be?
Cheers.
Steven
Woooh! Scary, scary headline!
“3 Packs a day: Killer Air in Shenyang”
On the other hand, from a real expert –
“Compared with cigarette smoking, said Prof Webster, the total amount of PM2.5 breathed in over 24 hours’ exposure to a concentration of 471 micrograms per cubic m would still be less than half the PM2.5 found in one cigarette. He said the true health effects of PM2.5 from environmental samples are not yet accurately known.”
So smoking one cigarette is equivalent to roughly 900 micrograms per cubic m. per 24 hours.
3 packs a day? Are you dreaming, or just making stuff up to justify seeking more donations? Do you really think the Chinese government doesn’t realise particulate pollution is not desirable?
Or maybe you think that the Chinese nation is so dim it needs to be told what to do by the likes of BEST!
Can’t BEST find something useful to do?
Cheers.
Sorry, but you need to keep up on the conversation between Pope and Muller. It’s easy to follow Mike. I am sure you wont get it.
basically, PM2.5 merely refers to the size of the particle.
read… there is more.. but start here
http://www.myhealthbeijing.com/2015/08/
Steven Mosher,
You love a good estimate of potential harm, backed up by assertion but not much else. At least PM 2.5 particulates can be measured, unlike the supposed dangers from CO2.
Puff pieces from Berkely Earth don’t actually qualify as science. I have to admit I’m more likely to believe the authors who wrote : –
“Lung Cancer and Cardiovascular Disease Mortality Associated with Ambient Air Pollution and Cigarette Smoke: Shape of the Exposure–Response Relationships” than Steven Mosher, or even Professor Muller.
I repeat, can’t you and your lot find something more productive to do than tellIng the Chinese what they already know? There are more than a billion Chinese, and they appear to be no more stupid than the average American. It’s even possible that they might score higher than white Americans on intelligence devised by those same white Americans!
Who’d be laughing then?
Cheers.
sorry Mike you are wrong again
http://www.pnas.org/content/110/32/12936.full.pdf
Steven Mosher,
You wrote –
“sorry Mike you are wrong again”
About what, precisely?
Now it may be that you are just stupid, as well as gullible and deluded.
Even if I was wrong, I might be able to correct the deficit. Stupidity, gullibility and delusional behaviour, on the other hand, might persist until you die.
In any case, I wish you well.
Cheers.
Huai river Mike.
Read it.
Then your mistakes should be clear to you.
Steven Mosher,
You Warmist diversionary tactics don’t seem to be working too well. You apparently claim that I am wrong about something. I ask you to be specific, and you respond “Huai river”.
I didn’t mention the Huai River, so I can only presume you are becoming tired and emotional.
I would rather be mistaken than stupid. Luckily, I am neither,
Provide some facts if you wish – pointless and irrelevant links do you no credit. A tactic of true believers such as AFOMD, but stupid.
No facts? I thought not?
Cheers.
@Mosher: sorry Mike you are wrong again
This brings to mind the scene in Stephen Sondheim’s Into The Woods where Little Red Riding Hood quizzically asks Cinderella, “You talk to birds?”
One of my favorite lines in the whole musical, along with “I was raised to be charming, not sincere.”
Steven, you talk to trolls?
http://www.scmp.com/news/china/article/1394729/cars-or-coal-scientists-split-over-main-culprit-beijings-air-pollution
And let’s not forget the background level, barbecues, industrial coal and port vehicle traffic.
Uh oh. Why do I get this uncomfortable feeling that the Marxist are going to blame the 400 year warming on the rise of Christianity and the West.
Something about Bourgeois society, no doubt.
When it comes to predicting the future of “natural” versus “man-made” effects, it is at least wise to know with a high degree of certainty just what “natural” will be. To that issue, I have visited the Vostok Ice Cores data. The data tells us that there are “lots” of “natural” events every 120K years. Many would override any “man-made” ones now being considered. The question arises as to whether we have a firm grasp of the “natural” before embarking on how influential mankind is in altering cosmic forces
From the Vostok Ice Core, it is clear that the Earth is subjected to many levels of NATURAL “warmings”: JUST one “category “10” warming of 9+ with an ~12000y duration every 120,000y; several category “6” warmings of 5-6C peaking ~ every 7500y after each category “10” event; many category “3” warmings of 2-3C peaking ~ every 5000y; and a multitude of category “2” warmings of 1-2C peaking on decade and century scales. So, there are lots of “natural” warming events caused by cosmic forces. See graphs below.
http://pages.swcp.com/~jmw-mcw/Curry_3_time_ranges.jpg
Modern man has been fortunate that there have been no category “6” or “3” “natural” warmings DURING the category “10” one that has provided the current living conditions for the last 10K years! Aren’t we so fortunate that one does come along every 120K years! One is left to wonder when some “natural” warmings will add to our current level. Could a “natural” warming like that indicated in the following graph occur? How certain could we be that a “natural” warming is not occurring, unless we have “predicted” (modeled by cause) such warmings, at least the past 120000y? How certain are we that the current conditions (plus any warming) will hold before the current category “10” warming ceases? Unless ALL “natural” warmings (and, by inference, coolings) can be properly modeled (accounted for, time, duration and magnitude) then how can we know if any changes are man-caused?
http://pages.swcp.com/~jmw-mcw/Curry_future_natural_heating_event.jpg
“So, what could be the cause of a 200 – 400 year period of secular warming? The obvious places to look are to the sun and the ocean”
But, we have looked and the answers are not obviously there.
The other area may be the variable albedo of the earth.
This can be due to changing patterns of cloud cover, short term.
These may well be influenced by the sun and the ocean.
In that the amount of water vapor produced will vary with both.
Other factors would include dust cloud patterns from the deserts,
Smoke from burning vegetation, volcanoes always, Pollen and pollutants, and vegetation growth and cover.
Ice extent at the poles and snow cover can also be extremely variable and widespread.
This also provides the only possible reasonable negative feedback to CO2 increase and would be the “safety valve that has kept the earth so stable for life to exist.
With all due respect, this is a religious warming.
The man made warming religion can’t hold a candle to the plan of God.
2Pe 3:10 But the day of the Lord will come as a thief in the night; in the which the heavens shall pass away with a great noise, and the elements shall melt with fervent heat, the earth also and the works that are therein shall be burned up.
It won’t cost you a dollar either.
With all due respect, this is a religious warming.
Here’s a little present for the “but wait for the next La Nina” crowd.
I say wait for the next back-to-back La Nina events. That should really snot knocker warming.
Except, when the PDO was ramping up, it warmed aggressively during back-to-back La Nina events between 1933 and 1040. Got hotter. A lot hotter. Natural variation is not the friend of skeptics.
People who come out with El Nino will disappear with La Nina. It is called natural selection and is only a matter of time.
I came out long before EL Nino. I believed we could have a warmest year with no EL Nino, and we did.
La Nina is not going to help your foolish scientific position. The PDO can continue warming the earth during a La Nina. It has happened many many times.
La Nina is not the opposite of EL Nino. It cannot erase what takes place in an EL Nino.
With increasing concentration of ACO2, La Nina adds more energy to the oceans layers that are involved in ENSO, so we get the the warmest La Nina followed by the warmest ENSO neutral followed by the warmest EL Nino followed by, in human terms, endless and so on and so on. If you need some help look at the record for the warmest La Nina episodes. Then look at the records for the Warmest EL Nino episodes. Then look for the warmest ENSO neutral records. Then look for the warmest month.
I will help you. You will want to hide from reality, so then look at UAH and RSS.
JCH | November 18, 2015 at 7:58 am
“La Nina is not the opposite of El Nino. It cannot erase what takes place in an El Nino.”
When you can say with a straight face white is black or up is down there is no reasoning with you.
This is an intelligent site.
Most people here would disagree with your statement.
Some explanation please as to why it is not an opposite in definition and accepted meaning?
Or was the typo EL Nino deliberate to have a semantic exit trapdoor?
JCH before this decade is out the false theory you support AGW, will be obsolete, not that it isn’t already.
I will have to say I told you so.
Right back at you.
My “theory”, which was agues based upon the peak-to-peak recurrence of the PDO at around 43 years was that in 2012 we were on the verge of a positive phase of the PDO.
Everybody laughed.
Then they called it the blob because they could not admit the PDO had gone positive around 20 years before they were predicting it would – I was told negative phases of the PDO last for 20 years. I showed them graphs that clearly showed the negative phase of a PDO cycle could last mere years, which is perfectly congruent with chaos theory.
So in my graph warming continues until 2006, which how the pause and the no warming in 18 years completely fooled a lot of very smart people.
At about that time the PDO cascades into NEGATIVE index numbers and the GMST also cools sharply. There are back to back La Nina events.
They started predicting 20 more years of that nonsense.
And then the PDO goes sharply positive and the GMST shoots off like a rocket.
Sorry, I’m looking pretty good.
Jch
It’s your excessive modesty that is probably your best trait
Tonyb
“400(?) hundred years of warming” – JC
So there was no ‘pause’?
Weather is always dynamic don’t forget.
There was a theory killing, 64-year pause.
Ok, if you say so. In your heart you know different, circles.
All I heard was a puffed pause killed the theory of AGW, so I figure a 64-year pause has just gotta be a bigger theory killer.
Job, learned he did not know everything about the weather and now we really know why.
What is the reference for the 2d graph you highlighted and used for your claims (the “Tony Brown’s CET reconstruction”) ?
Ort
The chart Judith cited came from my article carried here in 2011
http://judithcurry.com/2011/12/01/the-long-slow-thaw/
The supplementary information was carried here. There is also an extensive list of references
https://curryja.files.wordpress.com/2011/12/long-slow-thaw-supplementary-information.pdf
I wrote this next item earlier this year to explore my observation that the LIA was much more intermittent than many of us think.
https://curryja.files.wordpress.com/2011/12/long-slow-thaw-supplementary-information.pdf
Incidentally, I personally discussed the material I had gathered with David Parker at a meeting at the Met Office. David created the 1772 CET data based on Manley’s earlier work.
tonyb
Since the Holocene Optimum 8000 years ago the earth has been in a gradual overall cooling trend which has continued up to today punctuated by spikes of warmth such as the Roman ,Medieval and Modern warm periods.
The main drives of this are Milankovitch Cycles which were more favorable for warmer conditions 8000 years ago in contrast to today , with prolonged periods of active and minimum solar activity superimposed upon this slow gradual cooling trend giving the spikes of warmth I referred to in the above and also periods of cold such as the Little Ice Age.
Further refinement to the climate coming from ENSO, volcanic activity , the phase of the PDO/AMO but these are temporary earth intrinsic climatic factors superimposed upon the general broader climatic trend.
All the warming the article refers to which has happened since the end of the Little Ice Age, is just a spike of relative warmth within the still overall cooling trend due to the big pick up in solar activity from the period 1840-2005 versus the period 1275-1840.
Post 2005 solar activity has returned to minimum conditions and I suspect the overall cooling global temperature trend which as been in progress for the past 8000 years ago will exert itself once again.
We will be finding this out in the near future due to the prolonged minimum solar activity that is now in progress post 2005.
Four hundred years does not tell us anything try 8000 years.
PA | November 16, 2015 at 7:44 pm | If we don’t do anything about global warming until 2100 we will have enough instrumental data to compute the CO2 forcing accurately, and to determine if the 90s were a short term trend.
I posit you can do this now. We have 75 years since 1945 which contains 100ppm of the 300ppm which would constitute a doubling of CO2. If you cannot estimate from 1/3 the data what the result will be after 100% of the data is in we are pretty poor scientists. Of course there is always the possibility of “tipping points.” However, given no scientific basis to believe any tipping point is actually real we could have tipping points for anything or we could have an asteroid strike, a massive volcano or massive events on the sun etc which we know nothing about either.
The fact is given 30+% of the data the total change in 75 years and 1/3 of a doubling is about 0.3-0.5C probably < 0.4C. Given that CO2 reacts logarithmically we must continue to pour in exponentially increasing quantities of CO2 to keep a linear movement of temperature. While some may easily believe we will continue to pour exponentially increasing amounts of CO2 into the atmosphere this is not a likely scenario just from the sheer economic and practical matters. So, realistically we have to assume that an exponential rate of CO2 growth cannot continue indefinitely and the last 100ppm of CO2 large as it is will have practically no effect on temperature.
In fact the remaining 2/3 of the way to a doubling will be roughly equivalent to the temperature rise from the first 1/3. We can postulate that there are "latent heats" to be released but frankly there is no proof of any such phenomenon. We have to assume that in 75 years we've seen about the kind of feedbacks and latent heat effects that we are going to see. So, once again the conclusion is obvious and fairly indisputable.
Unless presented with absolutely rock solid data which shows how some latent longer term effect of CO2 is in the works in the next 50 years or so we are pretty certain the total likely additional temperaure gain by 2100 or a doubling of CO2 is 0.4C. This would mean since 1945 – 2100 with a doubling of CO2 we should have a total of TCR = 0.8C +- 0.3C.
I have seen no evidence that TCR could possibly be higher than this.
Everyone is screaming about 2C change will be hugely bad. We are never going to get 2C! It is unrealistic to make such a prediction. It's practically impossible to get there. At the current rate we would have to be at probably 2000ppm of CO2 which is 5 TIMES the current density of CO2 in the atmosphere. This is simply stupid.
I just don't get it. We have nearly 100 years of fairly solid data, the best data. As Judith points out previous data is so uncertain you can pick any values you want but the last 100 years is much better.
Well, there are number of rationales
If you assume a TCR of 1K which is in line with 22 PPM = 0.2 W/m2 and take the 1880 to 1940 trend – subtract the CO2 forcing and project it forward then add the 1940 to 2015 CO2 forcing (again at 1K) you have accounted for the temperature change, actually overaccounted since the computed change from 1940 is more than 1.03°C
So I am fine with a TCR of 1K.and it is in the error bounds of the field measurement.
But then there is this plot of cumulative emissions in GT vs CO2 in PPM using the CDIAC emissions data and the ESRL CO2 data.:
https://i.imgur.com/kmbVysf.png
The CO2 level is clearly hitting some sort of limit. Before 1959 the plot (as posted by someone else) follows the red line.
The CO2 level has been going asymptotic for a while (see chart above) and that basically dooms global warming as a serious concern.
500 PPM which looks like the practical limit gives a 2015 to 2100 warming of .0.32 °C and a total 1880-2100 warming due to CO2 of 0.75 °C.
I’m solidly within your err bounds so we basically agree on the outcome.
@logiclogiclogic: While some may easily believe we will continue to pour exponentially increasing amounts of CO2 into the atmosphere this is not a likely scenario just from the sheer economic and practical matters.
Surely you’re joking, logic^3.
You seriously believe that the shareholders of Exxon Mobil and OPEC companies would allow their companies to slow the current rate of growth of fossil fuel emissions?
Those shareholders would replace the boards of those companies at the drop of a share price if the companies did that.
Wherever did you get your “sheer economic and practical matters” from? The Onion?
Unless presented with absolutely rock solid data which shows how some latent longer term effect of CO2 is in the works in the next 50 years or so we are pretty certain the total likely additional temperaure gain by 2100 or a doubling of CO2 is 0.4C.
A completely unsupported fabrication based on nothing better than the confusion created by climate projections based on too narrow a sampling period combined with a total absence of numerical data.
A more meaningful projection can be based on the following. Any projection for 2100 climate should be satisfied with a projection of climate averaged over the 65 years 2065-2130, since the much shorter 10-year average over say 2095-2105 isn’t going to tell you much more and is probably going to be less plausible, albeit more plausible than a projection for the global average over the month of August 2100.
But if you look at 65-year climate since 1868 plotted against rising CO2 forcing, making the appropriate allowance for variations in heat from the Sun during that period, you get a perfectly straight line heading upwards at a rate of 1.73 °C per doubling of CO2, as can be seen from this graph.
http://clim.stanford.edu/H65N65.jpg
If CO2 emissions continue to follow the same trajectory they’ve been following for more than a century, atmospheric CO2 will have reached 936 ppmv according to the RCP8.5 concentration pathway formerly known as “business as usual”.
But log2(936/280)*1.73 = 3.012. That is, barring any hitherto unexpected deviations from the climate path to date, global climate will have risen 3 °C over its preindustrial level.
Any other forecasts are based on either optimistic or pessimistic bendings down or up respectively of what since 1900 have so far been perfectly straight lines.
To date no arguments have been made for either up or down that have been accepted by both sides of the climate debate. Hence ruling out the possibility of a 3 °C rise by 2100 is simply putting one’s head in the sand.
Every prediction that has failed from Malthus to club of Rome and now climate catastrophe was based on unlimited exponential growth as an assumption. Such assumptions are unsustainable and have always failed. Besides the impossibility of infinite exponential increase in co2 output there is a countervailing trend which has undone all these predictions. The exponentially increasing knowledge and technical ability. The rate of progress of technology is so great now that any attempt to predict what we can do in 20 years is just stupid. There is no way anyone can know what we will be able to do so any prediction beyond 10 years is basically 0% probability of being right.
If I extrapolate the cost of solar power using a similar formula you are using solar power will cost essentially 0 cents per kWh and oil will cost 1million dollars per kWh. That’s how stupid your exponential predictions are and have always been. They’ve always been wrong. Every time. They’re stupid and if you still believe them you are either 15 years old and have no knowledge or you are truly naive and unread.
“But if you look at 65-year climate since 1868 plotted against rising CO2 forcing, making the appropriate allowance for variations in heat from the Sun during that period”
Which quantity at which standard uncertainty do you use for heating from the sun in 1868?
CO2 emissions continue to follow the same trajectory they’ve been following for more than a century, atmospheric CO2 will have reached 936 ppmv according to the RCP8.5 concentration pathway formerly known as “business as usual”.
http://climatewatcher.webs.com/ChinaCO2.png.
https://i.imgur.com/5J5CcKC.png
There isn’t a chance that the CO2 levels will break 500.
China is 30% of global emissions and they are going down.
The rise in CO2 is going asymptotic anyway.
But keep dreaming the magic CO2 will come from somewhere.
YP I don’t know why you keep doing this.
http://climatewatcher.webs.com/ChinaCO2.png
“Sigh”, rasn frasn chart…
logic, We have had 1/3 of a doubling since the 1950’s and a 0.7 C rise. You can do the math to find 2.1 C per doubling. I am not sure where you went wrong, but those are the numbers. Or you can use that at 400 ppm we have had 1 C of rise already, again giving about 2 C per doubling and that is only the effective transient rate. The CO2 and temperature numbers alone give you rates around 2 C per doubling however you want to dice it.
I will point out that as much as some will try to argue there are tipping points and feedbacks and other things that “could” raise temperatures more there are also many things realistically which could do exactly the opposite.
I correct my previous article which mentioned 1945-today as 75 years. It’s 75 to 1940. It’s roughly also about halfway to 2100. We SHOULD be able to estimate after being halfway there.
Things that could increase to higher:
1) Sun effects
2) Ocean effects
3) Feedbacks related to changing ice mass
4) Continue whatever reason for the warming over the last 400 years.
Things that could lead lower:
1) Sun effects
2) Ocean effects
3) Eruptions
4) Asteroid Strike
5) The reversal of whatever caused the 400 year rise since 1650 or so
The IPCC assumes 0 volcanoes for next 85 years to 2100 which is of course an absurd assumption. The sun or ocean could be indirectly related to the 1000 year cycle observed could have caused the 400 year rise. If so then we are probably near the inflection point for whatever that is.
The IPCC said short term periodic effects can be ignored because we are talking about “climate.” They also assumed (or based on the clearly false hockey stick) that there are NO long term periodicities. This is clearly a specious assumptions since all reconstructions show periodicity up the wing wang. We have so many periodicities we have no idea how to attribute them but clearly there ARE longer term periodicities. Since these are largely unexplained and we are looking at periods of 100 years or so any periodicity which is less than a million years or so could have been a contributing factor to the latest warming.
All of this says that attribution of CO2 to all or most of the late 20th century warming is absolutely premature. The only way to come to that conclusion is to say that short term periodicity is ignored, long term periodicity is denied and then you are only left with the only thing that is changing in the time frame in question which is CO2. Conclusion CO2 caused all of the rise in latter half of 20th century.
That’s simply bogus reasoning any sane person should see around. It’s a setup. We’ve all been setup. That’s the feeling I have because no logical person can possibly believe the statements coming from these people. They construct their arguments so no other conclusion is possible but based on assumptions which are blatantly false or clearly unknown. Sometimes that’s referred to as a “strawman.” I feel lied to because this is simple. It is not complex. We have enough data 75 or more years to make reasonable estimates. The answers are known they just don’t want to face what they say. It’s impossible TCR > 1 let alone the 3 4 5 6 7 8 9 10 they have said was so much more likely. We can see that clearly now and I personally see no possible way to ignore that.
Logiclogiclogic
Whilst your approach is somewhat simplistic, it is based upon sound common sense. I have been saying much the same thing for some considerable time, that whilst there are uncertainties surrounding our data, particularly time series temperature data sets (which have much wider error bounds than their compilers will acknowledge), the ‘pause’ (or slow down) of the last 20 years has removed any doubt that Climate Sensitivity is much lower than the IPCC would wish to acknowledge. I do not see how any independently and objectively minded observer could place it at a figure of more than 1.3. it looks to me from the temperature data that is now in that Climate sensitivity cannot be higher than the no feedback scenario, and it could well be less than that.
To add to your point about cycles, naturally occurring cycles, the interview by the BBC of Phil Jones (from CRU at UAE, and one of the IPCC lead authors, and overseer of the CRUTEM and HADCRUT temperature series) is interesting. In this interview, Phil Jones was specifically asked about the warming between 1860s to 1880s, and the warming between the 1920s to 1940s, and the warming between late 1970s to late 1990s.
The IPCC acknowledges that CO2 was not the driver of either of the two earlier warming episodes, ie., it did not cause the 1860s to 1880s warming, nor did it cause the 1920s to 1940s warming.
The IPCC consider that CO2 caused and drove the late 1970s to late 1990s warming simply because they could not think of any other explanation that could explain that warming. This is in itself a logical fail, and is little more than an admission of lack of knowledge but let us leave that failure of logic to one side.
The point is this. In the late1800s there was almost no rise in CO2, and indeed there was little rise in CO2 levels before the 1950s and this is why the IPCC accepts and acknowledges that CO2 did not cause and drive the 1860/80 warming nor the 1920/40 warming.
Now then if CO2 is a significant driver of temperature one would expect to see a significantly different rate in the rate of warming as soon as CO2 becomes a driver. Therefore one would expect to see the rate of warming between the late 197s and the late 1990s to be greater than the rate of warming that occurred during the earlier two warming episodes. This must be the case unless natural variation during this period was a negative thereby throttling back the full force of the CO2 driving.
But there is no acceleration in the rate of warming between that observed in the late 1970s to late 1990s, and that observed in the two earlier warming episodes of 1860/80 and 1920/40. The lack of an increase in the rate of warming is therefore a major obstacle for a high sensitivity to CO2, and strongly supports the view that Climate Sensitivity to CO2 (if any at all) must be rather low.
Phil Jones materially admitted to the following:
Quote
[BBC Interviewer] Question:
— Do you agree that according to the global temperature record used by the IPCC, the rates of global warming from 1860-1880, 1910-1940 and 1975-1998 were identical?
[Phil Jones Answer]:
“…I have also included [this in a table summary that he produced] the trend over the period 1975 to 2009, which has a very similar trend to the period 1975-1998.
So, in answer to the question, the warming rates for all 4 periods are similar and not statistically significantly different from each other
….”
See: http://news.bbc.co.uk/2/hi/science/nature/8511670.stm
In my opinion, this comment by Phil Jones strongly backs up the thrust of your common sense approach.
Climate Scientists, and the IPCC knew by the time that AR5 was published that Climate Sensitivity had to be below 2 and that the probability was that it was less than 1.5.
As you say, we have all been sold a pup because the IPCC cannot admit to what the data collected these past 40 years is clearly telling us, namely that there cannot be strong positive feedbacks, the assumptions underpinning that assumption must be wrong, and that Climate Sensitivity can at the very most exceed the no feedback scenario by just a smidgen.
But whilst AGW would still survive, cAGW would be over if Climate Scientist and the IPCC were to admit what they know must be the case, namely that there is no scary Climate Sensitivity, and this is probably under 1.5.
the ‘pause’ (or slow down) of the last 20 years has removed any doubt that Climate Sensitivity is much lower than the IPCC would wish to acknowledge.
What are you talking about? Are you saying that a rise of 4 °C per century is some sort of “slow down”?
This rapid rise has been the case for the past five years, with no sign of any relief to date. It is furthermore what naive climate models based on the past century of climate date would predict.
the ‘pause’ (or slow down) of the last 20 years
Since HadCRUT4 over the “last 20 years” has been rising at 1.14 °C per century, what exactly do you mean by a “pause”?
You seem somewhat confused since you talk about 4 degC per century and 1.14 degC per century. These are substantial differences, and this just goes to show how unreliable temperature data is when you have such a stark difference.
According to the Skeptical Science trend calculator, using RSS data, the trend for the last 20 years is:
QUOTE:
Data: (For definitions and equations see the methods section of Foster and Rahmstorf, 2011)
Trend: 0.028 ±0.153 °C/decade (2σ)
β=0.0028079 σw=0.0018535 ν=17.142 σc=σw√ν=0.0076741
UNQUOTE
Given that the positive ‘trend’ is less than the uncertainty, we cannot say whether it is flat, trending positive, or trending negative.
This rate (0.28degC per century) is very different to the rates referred to by Phil Jones for the warming periods detailed in my above comment, so the slow down is very apparent when the last 20 years is compared to the rate of the 1860 to 1880 warming episode which was slightly greater than the 1920 to 1940 warming episode, and also slightly greater than the late 20th century warming episode
I also link a series of plots showing recent trending. All suggesting no statistically significant trend since the ‘trend’ is less than the applicable error bounds of the relevant measuring devices
.http://www.woodfortrees.org/plot/hadcrut3gl/from:1997.3/trend/plot/gistemp/from:2001.66/trend/plot/wti/from:2000.9/trend/plot/hadsst3gl/from:2000.8/trend/plot/hadcrut4gl/from:2000.9/trend/plot/hadcrut3gl/from:1997.3/plot/gistemp/from:2001.66/plot/wti/from:2000.9/plot/hadsst3gl/from:2000.8/plot/hadcrut4gl/from:2000.9/plot/rss/from:1996.8/plot/rss/from:1996.8/trend/plot/uah/from:2005/plot/uah/from:2005/trend
I have spent some 30 years studying ship log data, and I can tell you that we have no idea as to ocean temperatures prior to ARGO.
The Hadcrut4 adjustment in any event seems to have made an error in their adjustments whilst taking account of the engine room warming bias, they have wholly ignored the fact that ships do mot draw SST but draw sea water from depth often in the region of 7 to 10m, and this means that the source of the water being sampled is cooler than SST. No doubt you are aware of ocean temperature profiles and will therefore be well aware that water say at 8m is considerably cooler than that at the surface.
For some unknown reason the adjustment failed to take account of that, and that difference more than cancels out any warming due to engine room environs.
Logiclogiclogic
What an interesting site you have.
I like space so there is much to read; I only briefly scanned the Mars mission and Is alien life out there.
I intend to revisit when I have a little more time.
In my post above, I omitted to point out the IPCC cannot explain either of the two earlier warming episodes, ie., the 1860/80 and/or the 1920/40 warming episodes. Given that it cannot explain those warming episodes and given that it accepts that CO2 did not cause those warming episodes, it makes its logical failure with respect to the late 1970s/late 1990s warming even more pronounced.
I also did not point out that the rate of warming between 1860 to 1880 was slightly more than the rate of warming for the late 1970s to late 1990s warming because the difference is so slight and not statistically significant. The material point being that there is no statistical difference to the rate of warming for any of the three warming episodes. And since there is no difference, this strongly suggests that Climate Sensitivity cannot be high.
Thanks, triple-l and RV for very sensible posts.
I omitted to point out the IPCC cannot explain either of the two earlier warming episodes, ie., the 1860/80 and/or the 1920/40 warming episodes. Given that it cannot explain those warming episodes and given that it accepts that CO2 did not cause those warming episodes, it makes its logical failure with respect to the late 1970s/late 1990s warming even more pronounced.
It’s unfair to complain that someone can’t explain something when you simply claim they can’t without offering them the opportunity to explain. Did you?
Pingback: Two contributions to our understanding of climate change — and two books « DON AITKIN
“I have been arguing that the IPCC’s attribution arguments are unconvincing unless they can also explain the early 20th century warming, and the longer period of overall warming prior to the 20th century.”
They have ignored the ongoing natural variability. A lot of the post 1995 surface warming is AMO driven, which includes continental interior regions drying out, and probably the upper troposphere and lower stratosphere declines in water vapour since 1995. The AMO warming is dependent on negative NAO/AO, while increased CO2 forcing of the climate is expected to increase positive NAO/AO. It appears that natural variability is overwhelming the opposing positive effects on the NAO/AO due to increased CO2.
http://www.ipcc.ch/publications_and_data/ar4/wg1/en/ch10s10-3-5-6.html
Pingback: Ma quanto caldo ha fatto? | Climatemonitor
Judith: It is perfectly reasonable to assert that unforced variability and naturally forced variability interfere attribution of warming to anthropogenic forcing. However, both factors also influence the confidence intervals for TCR and ECS in Lewis and Curry (2014). Is there a consistent assumption about unforced variability and naturally forced variability that works for both?
Agreed, this is my main criticism of the existing methods of estimating ECS/TCR. LC14 attempted to partially address this by picking two periods with approx the same AMO index
Thank you for the reply, but my question remains unanswered: Is there a consistent assumption about unforced variability and naturally forced variability that works for both [the attribution statement and for estimating ECS and TCR]?
Some skeptics say the pause invalidates theories that produce a GHE. When I say the pause can be explained by unforced variability (possibly with a contribution from volcanos, naturally forced variability), the question arises: “How much warming or cooling is too much to be attributed to unforced variability?” The coldest periods of the LIA (about 1 degC of cooling) appear to associated with reduced solar activity, but published estimates of the change in TSI (1 W/m2) appear to be far too small to have produced the observed cooling. Pinatubo shows that volcanic aerosols and cooling likely last for less than 5 years. Can unforced variability be 1 degC? If so, 20th century warming requires no explanation and LC14 is over confident speculation. (I don’t like this conclusion.)
If we assume that the LIA was caused mostly by naturally forced variability, then we have several periods in the 20th century of cooling and warming associated with modest unforced variability: The AMO’s effect on GMST (0.25 degC peak to trough) isn’t big enough to invalidate the IPCC’s attribution statement. Thus you don’t mention it above, except indirectly since its signal has been found in CET. ENSO is too short. If I understand correctly, the PDO’s impact on GMST can not be fit with a period and amplitude.
I suspect this question is best answered by a post: “Natural Variability Limits Confidence about Attribution and Climate Sensitivity.” It would cure help if you clearly distinguished between naturally forced variability and unforced variability.
If I understand correctly, the PDO’s impact on GMST can not be fit with a period and amplitude. …
And out the open gate go the cows. The PDO is the big boss of the GMST. The AMO is a laughing stock.
Despite its lack of “amplitude”, PDO goes south, GMST goes south:
http://www.ospo.noaa.gov/data/sst/anomaly/2011/anomnight.1.3.2011.gif
Despite its lack of “amplitude”, PDO goes north, GMST goes north:
http://www.ospo.noaa.gov/data/sst/anomaly/2014/anomnight.9.29.2014.gif
franktoo, i truncated your question:
Is there a consistent assumption about unforced variability and naturally forced variability that works?
No.
Here are variabilities from numerous control runs of GCMs:
http://www.met.reading.ac.uk/~ed/bloguploads/tas_ipcc_control1.png
No two have similar statistics.
Now, perhaps the range is constrained – anything +/- 0.5C could be natural, anything more is not.
But that assumes the models are correct, and given just the range, there’s not guarantee of that.
Judith: Attribution of at least 50% of observed warming to humans has little importance. If you use Otto (2013) or Lewis and Curry (2014) to translate 50% of observed warming into TCR and ECS (and say the rest could be natural variability), all this means is that TCR must be greater than 0.7 degC and ECS must be greater than 1 degC. In essence, the IPCC has said there will be future warming, but they can’t say with high confidence that warming will be anywhere near catastrophic.
Pingback: Ma quanto caldo ha fatto? : Attività Solare ( Solar Activity )
Pingback: Curry: 400(?) years of warming | JunkScience.com
From 1910 to 1940, and from 1970 et 2000 (2 periods of 30 years that are significant in terms of climate evolution), we have observed roughly the same warming of about de 0.5°C (respectively 0.47 et 0.48°C), whereas :
From 1910 to 1940 :
• Cumulated CO2 emissions have been about 110 Giga Tons
• emissions have increased from about 3 to 4.8 Giga Tons per year i.e. +60%
• CO2 concentration has increased from 300 à 311 ppmv i.e +3.5%
From 1970 to 2000 :
• Cumulated CO2 emissions have been about 615 Giga Tons i.e 5.6 times more than over 1910 – 1940 period
• Emissions have increased from about 15 to 25 Giga Tons per year i.e. +67%
• CO2 concentration has increased from 325 à 370 ppmv i.e +14%
And for comparison we have observe a 0.1°C cooling from 1940 to 19700 whereas:
• Cumulated CO2 emissions have been about 250 Giga Tons i.e 2.3 times more than over 1910 – 1940 period
• Emissions have increased from about 4.8 to 15 Giga Tons per year i.e. multiplied by more than 3.
• CO2 concentration has increased from 311 à 325 ppmv i.e +4.5%
Conclusion:
Natural variability is the thermal knob.
Not CO2.
Climate science is a highly technical subject developed by superior intellects based on higher mathematics, advanced technology, truly staggering quantities of data, and a vast literature of peer-reviewed articles.
The IPCC report collects this immense body of knowledge in one report updated every six years for the benefit of policy makers. The latest update runs to 4852 pages, more than a score of detective mysteries albeit less of a cliff-hanger.
It should clear to all that the authors of the report have combined an obsessive attention to detail with admirable restraint in respectfully addressing the policy makers. What they may have overlooked however is that policy makers might not be best served in this way. Too long, didn’t read. And so polite. Is that any way to address world leaders, particularly those leading the greatest country in the world?
It seems to me that the IPCC Report could profitably be repackaged for greater impact by stripping it of all redundant text and boiling it down to the dimensions of a political cartoon that everyone can understand and agree or disagree with as they prefer. And in the grand tradition of political cartoons it should pull no punches. Donald Trump would approve such a message.
Climate scientists working on outreach could do worse than to focus their efforts on distilling their subject into an understandable form along these lines. If a competition were held for the best cartoon making past and future climate understandable, I’m sure my contribution would be dismissed out of hand as far too technical. But that’s just me, I can’t help it.
That said, here’s what I would offer.
http://clim.stanford.edu/cmfd.jpg
This models climate in decidegrees (tenths of a degree C) as a function of time t in decades since 2000, with negative numbers belonging to the previous millennium, e.g. −9 is 1910, −6 is 1940, and so on.
Climate is modeled as the sum of the respective contributions of nature and you dummies that just don’t get it, do you? Nature’s contribution is cosine(t), to which you dummies out there breeding like rabbits, from the mattresses of Mumbai to the four-posters of presidential palaces, are adding a further exponential(t). Stop that (the adding, not the breeding—multiplying is more fun than adding).
You see right away the difficulties. Although everyone should know by now that “exponential” means “anything faster than a snail”, isn’t “cosine” what you do to loan papers? And so illiterate, can’t even spell.
There are lots of other objections that could be raised. However in the interest of reaching a larger audience than would know what to make of 1.73*log2(280+1.02215^(y – 1790)) (which actually is quite well approximated by an exponential over the time period displayed here) I’m going to press on with this model while agreeing cheerfully that it oversimplifies climate from the standpoint of climate mavens.
So Eric (since this was written with your argument in mind), is any premise of your argument significantly at odds with this model of climate?
Because if not then somehow your conclusion seems not to follow from your premises.
Well, part of the problem with the internet is there is too much TLDR and not enough TLDW.
“Climate science is a highly technical subject developed by superior intellects based on higher mathematics, advanced technology, truly staggering quantities of data, and a vast literature of peer-reviewed articles.”
There is so many logical fallacies in that section alone, that it will take me more time to point them out than it took you to write that section.
One example: IPCC used circular reasoning to exclude natural variability. IPCC relied on climate models (CMIP5), the hypotheses under test if you will, to exclude natural variability:
“Observed Global Mean Surface Temperature anomalies … lie well outside the range of Global Mean Surface Temperature anomalies in CMIP5 simulations with natural forcing only, but are consistent with the ensemble of CMIP5 simulations including both anthropogenic and natural forcing …”
(Ref.: Working Group I contribution to fifth assessment report by IPCC. TS.4.2.)
Circular reasoning passed all reviews of: Papers, IPCC assessment report and governments review of the report.
Your idea that there is superior intellect behind that seems dubious.
TLDW: Usually that’s Watch, PA, but perhaps you meant Write? Not sure which makes more sense.
@SoF: There is so many logical fallacies in that section alone, that it will take me more time to point them out than it took you to write that section.
Hmm, clearly not a dentist. Dentists can tell when the patient’s tongue is in his cheek.
Vaughan Pratt,
Your graph left out the four and a half billion years of cooling, and doesn’t show why the world should magically decided to warm since 1900 or so.
Can you post a long term graph, and a supporting explanation?
Cheers.
Vaughan Pratt | November 21, 2015 at 8:43 pm |
TLDW: Usually that’s Watch, PA, but perhaps you meant Write? Not sure which makes more sense.
Not used to dealing with ambiguous people. In the future for your edification I will use:
TL;DWrt
Although given the following, which received a lot of press coverage back in early2011, I may be guilty of making too light a matter of this.
https://www.ucsf.edu/news/2011/04/9719/inability-detect-sarcasm-lies-may-be-early-sign-dementia-ucsf-study-shows
MF: Your graph left out the four and a half billion years of cooling,
I can’t tell whether you’re confused about the Commonwealth nations or the melting point of ice, Mike.
It’s the Canadians that make hockey stick graphs, not the Australians.
This is because ice only forms on neighbourhood ponds in Canada, not Australia. We stick to field hockey, the only Australian sport that men dare not play against women. (Well, half a century ago anyway, I can’t speak for the present.)
Vaughan Pratt,
I’m told that about four and a half billion years ago, the surface was molten rock. Not a lot of ice about then.
So a graph showing the predictable decline of temperature to now, in accordance with known physical laws might help. I understand many Warmists are in denial about the molten Earth. Maybe the Earth really was created at absolute zero, and has warmed since. I certainly can’t prove otherwise, but it seems a bit far fetched. Don’t you agree, or do you believe in Creationism?
If you believe that the Earth was never warmer than now, good luck to you. I hope you don’t mind if I choose not to validate your fantasy.
Cheers.
Thanks Vaughan for your very constructive sarcasm.
Sorry to insist, but the hackneyed “authority argument” is totally irrelevant and inefficient.
I am not a climate a climate scientist but a “rocket engineer” in the first meaning of the term.
I mean I’ve been working for years as Technical Officer for the Ariane 5 launcher program, for both French and European Space Agencies.
With that scientific and technical background I have a good knowledge of :
1/ The difference between the engineering and the scientific methods :
A/ The engineering way :
Note : applicable to R&D programs as well as to applied science programs.
● Programmatic framework
● Responsible for the whole development and qualification / certification of a product or complex system.
● Under strict and formal Management, Quality and Technical Requirements, Rules and Standards
● Responsible for the project / program compliance with regard to the allocated budget.
● Responsible for the compliance of the system / product with technical, planning and cost requirements
● Responsible for the product / system Reliability and Safety
● Responsible for selling the product / system and all program’s outputs to the customer.
● Responsible for any consequence if something goes wrong, including critical consequences such as people deaths (even if Ariane 5 launcher is not a manned launcher, any anomaly occurring during ascent phase, before reaching the orbit, may have critical effect in case the launcher falls down over inhabited areas) or critical impacts.
B/ The scientific way :
Note : applicable to basic science and especially climate science.
● Basic purpose is the issuing and validation of new theories.
● No programmatic framework.
● No customer.
● No strict / formal procedures regarding the way of conducting scientific research (indeed there is no formalization of the “scientific method”)
● No strict / formal Management, Quality or Technical Requirements, Rules or Standards.
It is worth noticing that NASA has been the leader in the establishment of many Management, Quality and Design / Technical Specifications, Rules or Standards, including for models validation, which have been derived in many other countries or other scientific domains. But curiously, NASA-GISS has never deemed necessary to apply those Specifications, Rules and Standards to climate research…
● Sometimes perform Safety analyses but without any responsibility regarding their outputs…
● No responsibility regarding costs impacts of proposed solutions.
● No responsibility regarding consequences if something goes wrong.
2/ Data Analysis :
I especially know how to recognize data manipulation / falsification when I see it, which is exactly what NASA-GISS or CRU are doing with respectively LOTI and HADCRUT4 series, when “correcting” the surface stations’ data.
3/ Models ‘ development and validation processes:
I had the opportunity to attend a conference by some NASA veterans, about key lessons learned from the Agency’s failures. The N°1 key lesson, and one of NASA’s most famous leitmotivs is : “Test as you fly and fly as you test”.
The key implication of this rule in terms of modelling is that no model can be trusted and used before formal validation and rescaling on the basis of test experiences.
Most standards in that field have been established by NASA within the frame of Apollo and Shuttle development programs, but curiously, NASA-GISS has never applied those standard for validating its climate models.
And the inconvenient truth is that whatever smart climate modellers are, they have not the slightest skill and experience in model’s validation, that none of their nice climate models has ever been validated, and that none of them could ever pass any formal Verification and Validation process .
Indeed it looks like Climate scientists are not as clever as they think they are. They have many things to learn from the engineering method, but I ‘m afraid that too many of them are too narrow minded to be willing learning from engineers.
@eo: Sorry to insist, but the hackneyed “authority argument” is totally irrelevant and inefficient.
Science or Fiction also mistakenly thought I was appealing to authority.
Perhaps I should have clearer that I was complaining about authority, not appealing to it.
My main point was in the last two sentences, namely that your premises were entirely consistent with a model of climate, cos(t)+exp(t), that was obviously about to go sky high.
Therefore your reasoning had to be totally fallacious.
But instead of addressing my point, you appealed to the authority of the engineer over the scientist.
I wasn’t appealing to anything and I wasn’t making any argument other than to point out that you didn’t have an argument.
Vaughan Pratt,
You wrote –
“Climate science is a highly technical subject developed by superior intellects based on higher mathematics, advanced technology, truly staggering quantities of data, and a vast literature of peer-reviewed articles.”
I know you’re attempting humour, but some people may not appreciate your particular variety of comedy. You might need to employ a script writer, as your attempts to write your own comedic material is falling a bit flat.
Just a thought.
Cheers.
Eric
‘2/ Data Analysis :
I especially know how to recognize data manipulation / falsification when I see it, which is exactly what NASA-GISS or CRU are doing with respectively LOTI and HADCRUT4 series, when “correcting” the surface stations’ data.”
This is too funny. I know BS when I see it and you dont know squat about GISS or CRU
Both codes have been available since me and other people fought to have them released.
You havent looked at this code
You couldnt find it on line if you had to
If you found it you couldnt read it or understand it
And you could never get it to run because you have no skills
And you could not find a single thing wrong with that code
As for the data.. same thing. you could not find the data,
you couldnt understand it
you could not figure how to down load it or make sense of it.
Go ahead.. do all this..
You cant . you wont.
Steven Mosher,
So, as well as being a “scientist”, you are also an authority on “code” and “data”.
All this pales into insignificance beside your awe-inspiring mastery of “mind reading”! You can establish what people do, and don’t, know, without any knowledge whatsoever, and from great distance! You are indeed an example of the superior intellect based on higher mathematics, mentioned by Vaughan Pratt – fashioned by the Creator to stand as a shining beacon lighting the way for lesser intellects.
Or maybe you are just another pathetic wannabe, seeking attention in the same fashion as “Nobel Laureate” Michael Mann, or mathematician turned “climatologist” Gavin Schmidt. At least Gavin Schmidt didn’t claim to have won a Nobel Prize, being content to be recognised by the award of a “Climate Communications” prize. Anything’s better than nothing.
I know. You think I’m being a little harsh. Maybe so, but I can’t really think of anybody more deserving just now. Do let me know if you think I’m wrong.
Cheers.
If natural variability is the control knob, then when you crank it all the way to the left, why does the temp keep going up? Is it backwards?
Demonstrate the last time natural variation actually cooled the surface air temperature of the earth in any significant way. The clearcut example is the 64 years leading in to the 1905 trough. Then there is 1942 to 1952, which was unceremoniously interrupted by, of all things, ACO2. And then there is… ____________.
And whatever you write in there, you’ve got to be kidding me.
When looking carefully at the comparison between models and observations in AR5 FAQ10.1 one can notice that :
1/ As Dr Curry told, the agreement between models and observations is correct only between 1970 and 2000. Models reproduce the warming at a rate of about 0.16°C per decade.
2/ Models totally fail reproducing the [1880 – 1910] and [1940 – 1970/75] cooling periods, as well as they fail reproducing the pause observed since the late 90’s.
3/ Models also totally fail reproducing the sharp [1910 – 1940] warming, at a rate of almost 0.16°C per decade, that is equivalent to the one observed from 1970 to 2000. Instead, models produce a warming of only 0.06°C per decade, i.e. 2.5 time lower than observed.
4/ Indeed, models produce a quite constant warming at this rate of about 0.06°C per decade, from 1880 to 1960, that is totally contradicted by observations.
5/ This warming is only interrupted by few abrupt cooling events resulting from volcanic eruptions
● Krakatoa : 1883
● Santa Maria, Soufrière & Montagne Pelée : 1902
● Quizapu : 1932
● Agung : 1963-1964
As can be seen on observational data, the effect of volcanic eruptions on climate is obvious and can last few years, but this effect is significantly overestimated by models, both in amplitude and duration.
6/ [1970 – 2000] warming period is also interrupted by such abrupt cooling events resulting from volcanic eruptions, confirming the volcanic forcing effect, but also the fact that climate models are too sensitive to this effect:
● El Chichon : 1982
● Nevado del Ruiz : 1985
● Pinatubo : 1991.
Conclusion:
● Climate models are much too sensitive to CO2.
● Climate models are also much too sensitive to volcanic forcing.
● Climate models are unable to produce cooling, as observed from 1880 to 1910, or from 1940 to 1970, except by using an exaggerated volcanic forcing.
● Climate models are formally invalidated by comparison to observational data.
● Climate models are unable to provide any useful prediction on the basis of which any policy could be established.
● AGW theory, that is largely (entirely) based on climate models outputs, and not supported by any observational data, is hereby formally rebutted.
Eric, your premises this morning are considerably more detailed and relevant than those of last night, and therefore do not deserve to be made fun of the way I did above. You’ve obviously been paying attention to AR5.
With regard to your premises 1, 5, and 6, while these are valid concerns for modeling short-term climate, not everyone needs this. For one thing long-term predictions of the average climate over much less than ten-year periods are less plausible than over longer periods. So for example a forecast of average climate over 2029-2031 would be less believable than one over 2020-2040, because 20-year averaging would remove many of the kinds of unpredictable phenomena such as volcanoes that could have a much bigger influence on the 2029-2031 average than on 2020-2040.
Looked at from that standpoint, models that accurately account for short-term phenomena, defined as those that 20-year averaging erases, have no obvious advantage for forecasting 2020-2040 or 2090-2110 when compared with models that apparently don’t such as those in your complaint
Your premises 2, 3, and 4 address longer-term phenomena. I agree wholeheartedly that this shows their inability to forecast repeats of what are surely natural climate fluctuations.
What I don’t agree with however is your conclusion that they invalidate the science of CO2-driven global warming. It would appear that all but one of these longer-term natural fluctuations can be erased with a 65-year filter, as shown by the blue curve in the following plot of 65-year climate against CO2 forcing defined as log2(CO2/280. After 1950 this tracks forcing very linearly, see the green trend line sloping up at 1.73 degrees per doubling of CO2.
http://clim.stanford.edu/H65N65.jpg
When I first plotted this I was puzzled about pre-1950 until I remembered that TSI (as reconstructed from sunspots because there were no satellites in that era) had risen between 1900 and 1950. I hadn’t previously bothered with TSI since I didn’t see its relevance to recent climate.
Simply subtracting the expected solar forcing (over the whole period, not just pre-1950) from HadCRUT4 before smoothing dramatically straightened the blue curve to create the red curve. This shows pretty clearly that for all practical purposes TSI and the 65-year-and-faster fluctuations account for all significant fluctuations in HadCRUT4 save this damnably straight red line.
But what is the significance of its straightness? In 1896, noting that moonlight had to pass through more atmosphere when the Moon was lower in the sky (a nice paradox to entertain grade schoolers with), Swedish Nobelist Svante Arrhenius used the recently invented Langley bolometer to plot IR from the Moon as a function of its altitude. After compensating for the expected influence of water vapor he found an excellent relation between reduction in IR and the log of the amount of atmosphere between him and the Moon, which he attributed to decreasing CO2 along the path as the Moon rose. This is how he obtained his logarithmic law for CO2 as the dominant non-vapor greenhouse gas, which has since been independently confirmed with the help of the absorption lines of CO2 listed in the HITRAN tables, which Arrhenius lacked at the time.
The significance of straightness is that this is what Arrhenius calculated as the expected behavior of global mean surface temperature with rising CO2.
This straightness is only a correlation and does not rule out some other explanation besides rising greenhouse gases. Perhaps rising economic production, rising population, the log thereof, or some other rising index during this period might track CO2 forcing equally linearly.
I’ve tried all three of these, namely Yale economics professor Robert Shiller’s reconstruction of S&P since 1871, the US population since 1790, and its log. As can be seen from the following plots, none of them tracked forcing linearly: their value of 1-R2 (the relative variance of the residual after subtracting the trend line) was between 20 and 90 times greater than HadCRUT4’s, making them a far worse explanation. (The slight difference from the above graph is due to a slightly different period and a more complicated way of plotting the graph below, an older one, that I will simplify in due course for agreement with the above graph.)
http://clim.stanford.edu/ClimVsNonclim.jpg
So even if you theorize that rising population or the economy could be the cause, it is a much worse match to observed climate than rising greenhouse gases.
Incidentally the plots for USpop and LOGpop look perfectly straight in the above, but that’s because they’re sitting in very thin windows, especially LOGpop. When each is plotted at a suitable scale their nonlinearity becomes more obvious:
http://clim.stanford.edu/USpopCurv.jpg
(The value of R2 for LOGpop does not change in the slightest when taking log(USpop) at different bases of the logarithm, nor if you divide the US population by a thousand or a million. R2 is a very robust measure in that regard, it is invariant under any linear change of scale.)
But maybe some other cause of global warming exists that does track forcing as linearly as HadCRUT4. I can’t disprove that simply by saying so, but you can’t prove it that way either, unless you can find one.
I believe that puts the ball in your court.
VP:
Having eliminated natural fluctuation and TSI, doesn’t your curve imply that (all feedbacks) + (all non-CO2 GHG forcing) = 0?
Vaughan Pratt,
You wrote. –
“In 1896, noting that moonlight had to pass through more atmosphere when the Moon was lower in the sky (a nice paradox to entertain grade schoolers with), Swedish Nobelist Svante Arrhenius used the recently invented Langley bolometer to plot IR from the Moon as a function of its altitude. After compensating for the expected influence of water vapor he found an excellent relation between reduction in IR and the log of the amount of atmosphere between him and the Moon, which he attributed to decreasing CO2 along the path as the Moon rose. This is how he obtained his logarithmic law for CO2 as the dominant non-vapor greenhouse gas, which has since been independently confirmed with the help of the absorption lines of CO2 listed in the HITRAN tables, which Arrhenius lacked at the time.”
True, but it doesn’t mean what you think it does. A reduction in energy reaching the Earth does not result in warming. Actually, you explain very nicely the reason why the surface of the Moon achieves higher temperatures than the Earth after the same length of time exposed to the unconcentrated rays of the Sun. No atmosphere to speak of. Sad for you, but true nevertheless.
You need more magical CO2 pixie dust, or a reality readjustment to counter your ongoing denial condition. Welcome to the twenty first century!
Cheers.
Having eliminated natural fluctuation and TSI, doesn’t your curve imply that (all feedbacks) + (all non-CO2 GHG forcing) = 0?
Certainly not! No-feedback CO2 forcing is estimated at around 1 °C/doubling of CO2. 1.7 °C/doubling shows that considerably more than no-feedback CO2 is having an impact.
How to divide that excess between feedbacks and other GHGs?
The IPCC estimates that CO2 is about 80% of all (non-water-vapor) GHG forcing. That accounts for an additional 0.25 °C/doubling.
Absent any other explanation the remaining 1.7 − 1.25 = 0.45 °C/doubling must be from feedbacks.
But a lot of that warming is going into the ocean, which acts like a CPU heatsink with no fan. The feedbacks are therefore likely to be considerably stronger when the cooling effect of the ocean is taken into account. But note that the Oceanic Mixed Layer, which does most of the cooling, is only a small fraction of the whole ocean.
Were there no ocean, we would be seeing a much faster rise in temperature.
You need more magical CO2 pixie dust, or a reality readjustment to counter your ongoing denial condition. Welcome to the twenty first century!
One of your better arguments, Mike. Unlike your others it contains nothing contradicting common sense physics.
VP:
Thank you for the reply. However, I was not disputing the scientific understanding of the GHE, with which I agree. I was seeking clarification of your graph for “CO2” against temperature which (as far as I could find) did not mention feedbacks or non-GHGs in the description of terms.
My confusion wasn’t helped by your reference to Arrhenius, who removed the effect of water vapor to estimate CO2 forcing. You did this to show straight-line CO2 effects and then moved to comparisons with other potential correlations with temperature. This implied to me that you might be using CO2 forcing without other forcings/feedbacks.
S Lovejoy was explicit in his graphing that his “CO2” curve was a proxy for all forcings and feedbacks with natural variation accounted for. I wasn’t clear whether you followed the same method.
The reason this is of interest to me is that if (all forcings) + (all feedbacks) = (observed temperature for 100+ years) it suggests the possibility that no unobserved forcing or feedback exists and that TCR is approximately equal to ECS.
Kent
(1) My key message is not dealing with short term variations but with the fact that models are unable to reproduce the natural long term variability with a 60 years’ period, and more especially the 30 years (also to be considered as long term) cooling periods from 1880 to 1910 and from 1940 to 1970.
Indeed this inability is THE key issue that formally invalidates climate models. It means that the physics coded into the models is either incomplete or biased or even totally wrong.
(2) The driver for the 60 years’ natural variability is mainly PDO.
(3) Humlum et al 2012 have shown that temperature is driving CO2 and not the contrary…
(4) Averaging errors over long periods does not provide guaranty that models outputs are valid and reliable.
(5) A 65 years filtering removes long term natural fluctuations such as AMO and PDO but does not provide any demonstration that remaining warming is driven by CO2 and / or human emissions.
(6) Ice core data provide evidence of a quasi millennial oscillation with alternating warm and cool periods :
● Minoan Warm Period about 3 k-years ago
● Roman Warm Period about 2 k-years ago
● Dark (cool) Age about 1.5 k-year ago
● Medieval Warm Period from about early 10th to late 14th century
● Little Ice Age from about late 14th to mid 19th century.
The background warming trend of about +0.6°C per century as observed since the mid-19th century can be explained as the result of this natural millennial oscillation.
(7) Arrhenius equation is proven as wrong / incomplete as it does not account for :
● Carbon cycle by which Earth system is actually regulating CO2.
● Saturation of CO2 greenhouse effect by water vapor that is actually the main greenhouse gas, responsible for 90% of the total greenhouse effect.
@opluso: S Lovejoy was explicit in his graphing that his “CO2” curve was a proxy for all forcings and feedbacks with natural variation accounted for. I wasn’t clear whether you followed the same method.
Since I’m not sure whether we’re talking about the same thing, let me say what method I followed. In common with Lovejoy I plotted climate against CO2 forcing. In addition I removed all fluctuations with a period of 65 years or faster, and TSI. Neither of these are expected to arise as CO2 feedbacks and therefore what was left must include all CO2 feedbacks.
The reason this is of interest to me is that if (all forcings) + (all feedbacks) = (observed temperature for 100+ years) it suggests the possibility that no unobserved forcing or feedback exists and that TCR is approximately equal to ECS.
That would follow if the ocean-atmosphere-land system could drift rapidly into equilibrium, say in less than a year after holding all control knobs fixed. That it may take centuries implies that ECS will likely be considerably larger than TCS.
As a simple counterexample to your reasoning, consider a resistor R and a capacitor C in series. Let V be the applied voltage across the two, and let v be the voltage across the capacitor. If V and v are both zero then the current I through R is zero and the system is in equilibrium.
Now if you ramp up V steadily, the voltage v across the capacitor will ramp up too, albeit somewhat behind V. But if you suddenly stop raising V it is not true that v will immediately stop rising. Instead it will converge to V eventually, namely the equilibrium state (I = 0), with a time constant of RC.
I don’t claim to be measuring either TCR or ECS, but rather empirical or observed climate sensitivity. I discuss these distinction in more detail here. However to really do justice to these distinctions requires more detail about why ECS takes so long to equilibrate, along with climate models that are sufficiently detailed to capture the essential mechanisms differentiating these three notions yet sufficiently simple as to be both understandable and implementable without too much code. I’ll be working on this over the next couple of weeks.
Vaughn actually attempted some common sense experimental physics at one time.
http://boole.stanford.edu/WoodExpt/
Utterly failing at that he returned to the purity of thought experiments wherein all of climate “science” continues to reside with its roommate creation “science”.
Climate science is to atheists what the new testament is to Christians.
1) My key message is not dealing with short term variations but with the fact that models are unable to reproduce the natural long term variability with a 60 years’ period, and more especially the 30 years (also to be considered as long term) cooling periods from 1880 to 1910 and from 1940 to 1970.
Indeed this inability is THE key issue that formally invalidates climate models. It means that the physics coded into the models is either incomplete or biased or even totally wrong.
Yes, I already agreed with you on that point. It’s a good point. If it’s your key message then we have no key disagreement.
(2) The driver for the 60 years’ natural variability is mainly PDO.
Uh oh. Je pense que tu ferais mieux d’arrêter les frais ici. Il est inutile de t’enfoncer davantage. Why didn’t you quit while you’re ahead?
Attributing natural variability to the PDO is like saying the motion of a car is caused by the rotation of its wheels. What makes the wheels rotate? Perhaps the motion of the car is the cause. What causes the PDO? Perhaps climate fluctuations are the cause.
Sounds more like an engineer’s explanation than a scientist’s. Where’s the physics? And where’s the logic: where’s your proof of which is driving which?
(3) Humlum et al 2012 have shown that temperature is driving CO2 and not the contrary.
Yes to the former, no to the latter. What Humlum et al have overlooked is that each is driving the other, which is at the heart of this fundamental positive feedback between CO2 and temperature.
(4) Averaging errors over long periods does not provide guaranty that models outputs are valid and reliable.
I don’t understand. What argument or claim is that in reference to?
(5) A 65 years filtering removes long term natural fluctuations such as AMO and PDO but does not provide any demonstration that remaining warming is driven by CO2 and / or human emissions.
Yes, I’ve made that point myself about its not being a proof, two or three times by now. But at this stage we’re only talking about the best candidate for the causal relation, not a knock-down proof that one of those candidates is the cause. What you haven’t done is shown any warming mechanism that is remotely as well correlated with rising temperature as CO2 forcing is. I’ll be extremely surprised if you can come up with any warming mechanism that is not at least one or two orders of magnitude more badly correlated with climate than CO2 forcing is.
Furthermore the relationship between CO2 and climate is independent of the relationship between CO2 and humans. If rising CO2 can heat the planet, what does that have to do with what causes the CO2 to rise? This is obvious to scientists, I don’t understand why it wouldn’t be equally obvious to engineers.
(6) Ice core data provide evidence of a quasi millennial oscillation with alternating warm and cool periods :
● Minoan Warm Period about 3 k-years ago
● Roman Warm Period about 2 k-years ago
● Dark (cool) Age about 1.5 k-year ago
● Medieval Warm Period from about early 10th to late 14th century
● Little Ice Age from about late 14th to mid 19th century.
The background warming trend of about +0.6°C per century as observed since the mid-19th century can be explained as the result of this natural millennial oscillation.
Your alleged +0.6°C per century (which FYI is a really ancient skeptic fallacy) is based on a period when CO2 wasn’t rising seriously. The past half century has seen a dramatic increase in CO2. During that period temperature rose at +1.5 °C per century, 150% faster than your out-of-date figure. Furthermore the current decade starting in 2011 has been warming at +6 °C per century, ten times your figure!
(7) Arrhenius equation is proven as wrong / incomplete as it does not account for :
● Carbon cycle by which Earth system is actually regulating CO2.
● Saturation of CO2 greenhouse effect by water vapor that is actually the main greenhouse gas, responsible for 90% of the total greenhouse effect.
The Arrhenius logarithmic law expresses a relation between atmospheric CO2 and surface temperature. None of the respective contributions to the CO2 level by the carbon cycle, humans, space monkeys, or feedbacks have the remotest thing to do with the Arrhenius law.
Your saturation argument was Angstrom’s objection to Arrhenius, since shown to be fallacious. Further analysis of this argument here.
Vaughan Pratt,
You wrote –
“The Arrhenius logarithmic law expresses a relation between atmospheric CO2 and surface temperature. None of the respective contributions to the CO2 level by the carbon cycle, humans, space monkeys, or feedbacks have the remotest thing to do with the Arrhenius law.”
I believe you may be confusing the Arrhenius speculation, (CO2 concentration having anything to do with air temperature), with Arrhenius’ serious scientific work, resulting in the Arrhenius equation, sometimes referred to as Arrhenius’ Law.
Obviously, a speculation or idea is not a law. Warmists might wish it were so, but it’s not.
You are perfectly free to create fiction at will. I am equally free to point out your fabrications. Obviously, facts determine which is which. Others are free to decide for themselves.
Cheers.
VP:
Thanks for the link to your earlier discussion of definitions (TCR, ECS). I was getting sloppy with my language and it is always good to be brought back to a common vocabulary.
I could stop there but I am now fully caffeinated and will use that excuse to better organize my thoughts in writing.
My reaction to graphic info such as yours is that TCR is confined to the lower range of estimates (Lewis & Curry, for example). If my reaction is appropriate, your graph places you firmly in the lukewarmer camp. Condolences to the family.
The failure of GCM models to reproduce the course of observed warming is typically attributed to “natural variation” and other fudge factors. But your graph removed natural variation with 65-year filtering and also removed TSI. This resulted in a linear curve that matches the observed warming for over 100 years. It appeared to me that no lag in response and no “hidden heat” is needed to explain observed warming as a function of forcing/feedback.
The official definition for TCR relies on a scientifically arbitrary but mathematically convenient 1% per annum increase (and takes into account compound annual growth rate effects). Thus, 70 years at 1% annual growth = ~100% increase from starting-point GHG forcing. Current measurements indicate that for all GHGs combined, we are approaching an effective doubling of pre-industrial GHG forcing. Despite the stubborn refusal of reality to precisely conform to 1% per annum, it seems that conclusions may be drawn from what we have observed thus far. As you have shown, 100+ years of temperature increases can be explained simply by resort to physics-based calculations of GHG forcing.
It would seem that the remaining debate is reduced to how long it takes to physically experience any lagged TCR effect due to a particular increase in forcing. My perspective is that we should measure this TCR lag in months and years rather than decades and centuries. Obviously, there is a lot of consensus money betting that my perspective is wrong.
In contrast, estimates of ECS that further magnify GHG-induced warming expressly rely upon centuries of equilibration. That bears repeating: Centuries. Some projected ECS effects would even require millennia. Other than Dr. Carson’s grain storage structures in Egypt, there aren’t a lot of examples of human edifices lasting that long. Thus I find it silly to support proposals to protect today’s infrastructure against far-future climate changes.
However, even if one agrees with the dire, higher-end ECS projections, I find today’s political demands to be more an expression of current self-interest than a plea for future insurance. Given the ECS-imposed long lead time and the miracle of compound interest (there’s that CAGR again), the money being spent on the Paris COP21 could have been invested and used to move all of Bangladesh to higher ground when the apparently inevitable sea level rise occurs, generations hence.
Another missed opportunity, I suppose.
Kent
@DS: Utterly failing at that
DS is occasionally correct but much more often confused. However I have to say this is the first time I’ve ever seen him both in the same breath.
He correctly refers to my website titled “Failure to duplicate Wood’s experiment”. Quite right, I utterly failed to duplicate Wood’s experiment.
I have also utterly failed to give DS an A, or even a C, for his inability to understand the significance of failing to duplicate a bogus experiment.
I’m sure DS would consider that my failure, just as I would consider it his. Not all students are that way, but those that are may not make it.
I must thank him however for periodically advertising my website on Wood’s unduplicatable experiment. I’ve been too lazy to do it myself.
@MF: I believe you may be confusing the Arrhenius speculation, (CO2 concentration having anything to do with air temperature), with Arrhenius’ serious scientific work, resulting in the Arrhenius equation, sometimes referred to as Arrhenius’ Law.
On the contrary, I referred to it as the “Arrhenius logarithmic law” precisely in order to avoid the ambiguity you speak of. There is nothing logarithmic about the Arrhenius equation. The confusion is therefore entirely yours.
@opluso: If my reaction is appropriate, your graph places you firmly in the lukewarmer camp. Condolences to the family.
Your reaction is entirely appropriate, opluso. However I have no idea what a “lukewarmer” is, nor will I or anyone in “the family” (is this “family” from Sicily?) ever find out until someone eventually gets around to defining the concept.
All I know is that if CO2 continues along the “business as usual” RPC8.5 pathway until 2100, at which point CO2 will be somewhere within cooee of 940 ppm, then 1.73 °C per CO2 doubling implies that the climate will be 3 °C above where it was in 1910.
Does that make me a lukewarmer? You tell me.
I rather suspect that 97% of the planet is confused as to the meaning of “climate sensitivity”. Come to think of it, probably more like 99.9%. No, make that 99.99%. No, 99.999%. (I’m just calculating the proportion of the planet that takes climate science seriously, hard to pin that down in real time.)
@ VP
(1) You did start with the authority (and consensus) argument when claiming that :
“Climate science is a highly technical subject developed by superior intellects based on higher mathematics, advanced technology, truly staggering quantities of data, and a vast literature of peer-reviewed articles.
And blablabla…
(2) Climate system is a little bit more complex than a car.
And if your go that way :
● There is one single “engine” – i.e. heat source – which is the sun.
● And one main heat storage capacity which is the Ocean.
But there are also many internal or external mechanisms ruling / regulating the evolutions of climate variables. Some of them are probably still unknown, some are known but not yet characterized (no physics behind), and some are still badly understood (physics behind but still incomplete or erroneous).
Pacific Decadal Oscillation is obviously one of the key internal mechanisms because it drives the way Pacific Ocean (widest Ocean on Earth and therefore main heat storage) is exchanging heat with the atmosphere, in the mid to long term (50 to 70 years period), hereby significantly influencing the evolution of air temperatures over tens of years’ timescale.
(3) Humlum etal has shown that CO2 follows temperature variations with an average la of 10 months.
(4) I was referring to your quote :
“For one thing long-term predictions of the average climate over much less than ten-year periods are less plausible than over longer periods.”
It is based on the erroneous assumption that averaging random (+/-) errors over long periods leads to a small error at the (the + compensate the -).
(5) Refer to (6).
Even if the mechanism behind is not yet understood, ice core date reveal the existence of a quasi-millenarian (natural) oscillation, with cool and warm periods. The currently warming period is a “recovery” after Little Ice Age that occurred from late 14th to mid 19th century.
(6) Once again you missed the key point.
What matters is not the warming rate since the mid-19th century but the fact that ice core data reveal the existence of a quasi-millenarian (natural) oscillation, that well correlates with observed (mean) warming observed since the mid-19th century.
This warming rate varies maybe from 0.5 to 0.7°C per century depending on the point you start the linear fit, but your 1.5°C/century rate is surely a pure fallacy, derived from observations over the specific [1970 – 2000] warming period, that is too short to be extrapolated to a full century.
Moreover, the same rate as been observed from 1910 to 1940 whereas CO2 concentration was 25% lower than today, increasing from 300 to 311ppmv (+3.7%).
(7) Arrhenius had assessed a warming of +5°C for doubling CO2, which is now proven totally overestimated since actual value is at least 3 times lower.
Analogies between “engine[s]” and “heat source[s]” are totally inappropriate.
Irrelevant.
The most important point is that the global climate is a heat engine. By analogy to a car, the Sun would correspond to the combustion inside the cylinders. Outer space (at an effective temperature of around 3°Kelvin) would correspond to the tail-pipe. Everything else in the climate system corresponds to parts of the car’s drive train, and associated systems.
To the extent it matters, “Ocean heat storage capacity” might best correspond to warming of the air intakes due to diffusion of heat from a warm engine. Other than that, changes to it might correspond to changes in general engine temperature as the cooling system changes due to action of the thermostat.
Pingback: Weekly Climate and Energy News Roundup | Watts Up With That?
400 years does not matter; this is what matters.
When the PDO went down just before WW2, the GMST was drug down with it. It is the last time the GMST went down in a way that matters.
In the mid 1980s the PDO went negative – declining ramp. For the first time, the GMST failed to go down. ACO2 had completely taken over. It i stye control knob. Hate it all you want; it’s still the control knob.
We are in a ramp up of the PDO. These are usually prolonged and enhanced warming. People need to start paying attention.
When the AMO lays on its downward haymaker, starting just before 1969, the GMST doesn’t even react. It’s a pansy ocean cycle.
Reblogged this on Canadian Climate Guy.
Reblogged this on I Didn't Ask To Be a Blog.
Reblogged this on 4timesayear's Blog.
Vaughan Pratt,
Wrong again, but good try.
“The Arrhenius equation can also be written as,
ln k = ln A – (Ea/R)(1/T)”
ln k is of course, the natural logarithm of k. Interesting for you to say that there is nothing logarithmic about the Arrhenius equation.
Plotting activation energy is often done on log paper, to obtain straight lines. But enough of this. Arrhenius speculated about CO2 in the atmosphere. As yet, not confirmed by experiment, and doesn’t seem to actually exist. No law to be found.
Cheers.
Mike Flynn, you are joking right?
You can rewrite any equation whatsoever through taking the logarithm on both sides. This hardly justifies calling the original equation a “logarithmic equation”. You might as well call Newton’s third law a logarithmic law just because since F = ma, it must also be the case that ln(F) = ln(ma).
Mike Flynn, you are joking right?
That would depend on whether you count trolling as joking. I’d be ok with that.
it must also be the case that ln(F) = ln(ma).
In those situations where mass is conserved, this further simplifies to yet another logarithmic law, ln(F) = ln(a) + K where K is the constant ln(m).
Not being in a big rush myself, I lean towards the latter relation.
Pierre-Normand,
If you believe there is a “Arrhenius logarithmic law” relating to CO2 and atmospheric temperature, you are as silly as Vaughan. There is no such law. If you don’t believe me, look it up on Google.
As to your second silly comment, if you would like to point out the exponents (other than 1) in Newton’s third law, please do so. I can’t actually see any. Nor can you.
Once again, what part of my comment do you disagree with? Or are you just resorting to casting Warmist denier aspersions in the absence of fact?
Warmists! Bah! Humbug!
Cheers.
Vaughan Pratt,
I’d have to say that you are a silly as Pierre-Normand who is obviously as silly as you.
I see you have introduced the Warmist inconstant constant, to accompany the Warmist Arrhenius logarithmic CO2 law which doesn’t actually exist.
In the Warmist physics K is the constant ln(m). In this fashion, the constant K is of course anything you want it to be. Somewhat like Climate Sensitivity, or Climate Change, or any other term in the secret Warmist vocabulary. In the real world, constants are, well, constant. That’s why they are called constants, rather than variables.
But this is all irrelevant. The world has cooled for four and a half billion years. CO2 is a boon to humanity, being the essential plant food.
Complain and deny all you like, the facts won’t change!
Cheers.
MF:
I think you should win a prize for the longest moving average, using the fewest data points, in climate science.
Much better point, IMO. Also relevant to the debate.
Ariane 5 “rocket engineer” Eric Ollivet: (i) Climate scientists are not as clever as they think they are. (ii) They have many things to learn from the engineering method, but I ‘m afraid that (iii) too many of them are too narrow minded to be willing learning from engineers. (Numbering mine)
While I can’t speak to (i) or (iii), I’m fine with (ii) in general. But after trying to follow EO’s numerous claims about climate, in the particular case of (ii) at hand I have serious doubts as to whether climate scientists have anything at all to learn from rocket engineers other than that the latter should stick to rocket engineering.
Earlier he and I had some exchanges where I believe I understood all his points, and agreed with some of them, but where serious communication in the other direction seemed noisy to nonexistent. He complained about my supposedly appealing to the authority of a discipline while himself appealing to the authority of a single cherry-picked paper based on scientific fallacies. He paid no attention to my points, made strawman arguments based on putting words in my mouth that I had not said, made blatantly false claims about my climate analyses, failed to distinguish the different notions of climate sensitivity, and misrepresented Arrhenius,
Let me illustrate with the following dozen (!) examples taken from a single comment, that of November 26, 2015 at 5:53 pm.
Example 1 (not paying attention): (1) You did start with the authority (and consensus) argument when claiming that : I already told you it wasn’t intended as an argument, it should have been obvious that it was tongue-in-cheek hyperbole. If English isn’t your first language you’ll just have to take my word for it.
(Personally I try to avoid appealing to the authority even of a discipline let alone that of an isolated paper, and much prefer arguments based not on any authority other than that of first principles and the best available data.)
Example 2a (appealing to undefined concepts): (2) Climate system is a little bit more complex than a car. I’m not sure what that means. How are you defining “complexity”? My upcoming AGU presentation next month depends critically on the importance of defining “complexity”, for which I take computational complexity as a role model.
Example 2b (a fallacy resulting from failure to define terms): And if your go that way :
● There is one single “engine” – i.e. heat source – which is the sun.
● And one main heat storage capacity which is the Ocean. That is far from a complete list of simple climate matters. If you want to choose the latitude best suited to your climate druthers all you need is the dependence of annual mean surface temperature on latitude, a very simple object. If you want to know when best to holiday in the Bahamas the only climate-relevant information you need is dependence of climate on season. There are a great many simple climate matters besides the two you list. Your basic problem here is that you have not yet defined “complexity” of climate. It depends on what you want to know. Obviously you can’t know everything.
Example 2c (a point where I fully agree with him): But there are also many internal or external mechanisms ruling / regulating the evolutions of climate variables. Some of them are probably still unknown, some are known but not yet characterized (no physics behind), and some are still badly understood (physics behind but still incomplete or erroneous). Very true. I fully agree. It is entirely consistent with everything else I’ve been telling you, none of which seems to have registered with you.
Example 2d (failure to grasp a point): Pacific Decadal Oscillation is obviously one of the key internal mechanisms because it drives the way Pacific Ocean (widest Ocean on Earth and therefore main heat storage) is exchanging heat with the atmosphere, in the mid to long term (50 to 70 years period), hereby significantly influencing the evolution of air temperatures over tens of years’ timescale. Certainly. But what is its relevance to the question “What will be the average temperature over 2065-2130?” The 65-year running mean of a 65-year-period sine wave is exactly zero. You have not been paying attention.
Example 3 (appeal to the authority of a single paper): (3) Humlum etal has shown that CO2 follows temperature variations with an average la of 10 months. The dependence of climate on CO2 has been well known and understood for well over a century. Only the most extreme climate denialists reject that dependence. Humlum’s supposed “proof” of no such dependence requires him to commit glaring fallacies in reasoning, for example the fallacy that only the Sun and not rising global temperatures can warm the ocean. Not only are you cherry-picking isolated “authorities” in order to dismiss an entire discipline, you’re picking those with the most fallacies per page.
Example 4 (strawman argument): (4) I was referring to your quote :
“For one thing long-term predictions of the average climate over much less than ten-year periods are less plausible than over longer periods.”
It is based on the erroneous assumption that averaging random (+/-) errors over long periods leads to a small error at the (the + compensate the -). (i) No wonder I didn’t understand what you were referring to: it’s not something I said. The utility of climate averaged over long periods is that it removes short term fluctuations from consideration, the same point as in Example 2d. Aerosol cooling from volcanoes becomes irrelevant, etc. (ii) But even if I had based it on the point that averaging n times as many samples reduces the expected error by sqrt(n), what is “erroneous” about that? Are you saying engineers don’t accept elementary theorems of statistics?
Example 5 (appeal to a common fallacy): (5) Refer to (6).
Even if the mechanism behind is not yet understood, ice core date reveal the existence of a quasi-millenarian (natural) oscillation, with cool and warm periods. The currently warming period is a “recovery” after Little Ice Age that occurred from late 14th to mid 19th century. Gamblers commonly use that “recovery” argument to prove that if they’ve been on a losing streak lately they’re now due for a winning streak. It’s what keeps them going (though somehow the flip side rarely convinces them to quit while they’re ahead, perhaps because winning makes them more rational). Unless you have something based on actual physics your argument is no better than the gambler’s.
Example 6a (unsourced claim): (6) Once again you missed the key point.
What matters is not the warming rate since the mid-19th century but the fact that ice core data reveal the existence of a quasi-millenarian (natural) oscillation, that well correlates with observed (mean) warming observed since the mid-19th century. Citation needed. Documentation of any such correlation would be extremely interesting.
Example 6b (another strawman argument; failure to pay attention): This warming rate varies maybe from 0.5 to 0.7°C per century depending on the point you start the linear fit, but your 1.5°C/century rate is surely a pure fallacy, derived from observations over the specific [1970 – 2000] warming period, that is too short to be extrapolated to a full century. I did not claim or do any such thing. Where in my analysis did the period 1970-2000 enter into anything? My analysis equally weights the entire 165 years of HadCRUT4. You haven’t paid attention.
Example 6c (same as Example 2d): Moreover, the same rate as been observed from 1910 to 1940 whereas CO2 concentration was 25% lower than today, increasing from 300 to 311ppmv (+3.7%). While this is quite true, it is only relevant to medium term climate, for the reason I gave in Example 2d and many times before. You didn’t understand a central point that I’ve been making for some time now.
Example 7 (misrepresentation of Arrhenius; treating concepts as the same): (7) Arrhenius had assessed a warming of +5°C for doubling CO2, which is now proven totally overestimated since actual value is at least 3 times lower. Two problems here. (i) You seem unaware of the fact that this was only Arrhenius’s first estimate, and that he himself subsequently estimated climate sensitivity to be more than 3 times lower. (ii) You make the common mistake of thinking there is a single definition of climate sensitivity. The different definitions can have widely different values.
Eric Ollivet was Technical Officer for Ariane 5. If his ability to reason reliably about climate science is any indication of the standards set by the ESA for the engineering of Ariane 5, it is perhaps not so surprising that it exploded on its maiden flight:
https://www.youtube.com/watch?v=gp_D8r-2hwk
Logic is a characteristically Greek, German, and Anglo-Saxon enterprise, with very little contributed by either the Romans or the Gauls. What we have here is a compelling example of the principle that “Gallic logic is often neither logical or rational, at least to the Anglo-Saxon mind.” But I do get it that conversely my Anglo-Saxon logic may appear neither logical nor rational to the Gallic mind.
@vp: My analysis equally weights the entire 165 years of HadCRUT4.
Actually the weights of the first and last 64 years increase linearly in my analysis producing the blue curve in
http://clim.stanford.edu/ClimVsNonclim.jpg
Because of the way moving averages work the weights are 1/65, 2/65, 3/65, …, 64/65, up to full weight between 1914 and 1950 inclusive. So in fact I’ve done the opposite of what EO claims! Instead of weighting the period 1970-2000 more than other years I’ve weighted the whole it considerably less than 1914-1950, especially the hot end which has weights as low as 15/65, less than a quarter of the full weights in 1914-1950.
VP:
I’ve assumed that a fit based upon absolute GMST (rather than anomalies) would produce an identical graph but perhaps that isn’t quite right.
Given that annual anomalies are calculated by reference to a 30-year average that might produce additional effects. But I’m not clear what impact removing that would have (if any) on your curve.
Have you done the calculations using absolute global average annual temps?
http://clim.stanford.edu/ClimVsNonclim.jpg
I really think climate scientists need to start looking at biogeography. I believe that global warming as a result of desertification caused by the Roman Empire in North Africa roughly two thousand years ago. And the current trend of desertification now in North America is increasing the rate of heating in our atmosphere.
veeray2:
You left out the Aral Sea region.
You are correct. I think anywhere you have water table depletion and loss of high heat capacity you have a piece of land that is contributing to the problem. I still think that 30degress lattitude is where the focal point of the problem is. Global warming needs to be a fight on two fronts. heat capacity and emissions. I have a theory that in the recent ice age history aquifers have never been dry. there has always been a high heat capacity on land. I believe aquifer depletion is a completely human invention.
Pingback: Model biases can be largely removed using empirical techniques a posteriori! | Science or fiction?
Pingback: 2015 → 2016 | Climate Etc.
Pingback: 2015 → 2016 | Enjeux énergies et environnement
Pingback: 2015 → 2016 – Web-Log9