
by Judith Curry
A discussion of Section 8.3 of Alan Longhurst’s book Doubt and Certainty in Climate Science.
For context on the topic of the variability of Arctic climate, see these previous blog posts:
- New presentations on sea ice
- Early 20th century Arctic warming
- Uncertainty in Arctic temperatures
- Unprecedented(?) Arctic warming
- Unprecedented(?) Arctic warming II
- Historic variations in Arctic sea ice
- Likely causes in the recent changes in Arctic sea ice
For background to this section in Longhurst’s book, it is useful to also read sections 8.1 and 8.2. Some excerpts from Section 8.3:
8.3 Why is the Arctic climate and ice cover so strongly variable?
Observations suggest that variability in oceanographic conditions in the Arctic is very largely driven by the consequences of the flows through open passages to both Atlantic and Pacific Oceans, which themselves respond to the different and characteristic variability of the circulation patterns of each ocean: each inflow is not only variable in volume of water transported but also in the temperature of the water imported.
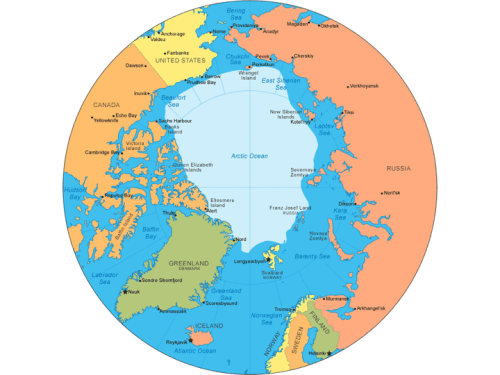
JC note: here is a map for geographic reference
Of the 8.5 Sv of warm, salty Atlantic water that passes north across the Greenland‐Scotland Ridge annually, about 4.0 ±2.5 Sv passes into the Barents Sea either directly to the north of Norway as a barotropic flow, or along the western coast of Spitzbergen as a baroclinic flow. These fluxes of warm water (6-‐8C) carry almost 100 TW of Atlantic heat into the eastern Arctic Ocean annually, while another 10‐20 TW passes into the western Arctic basin through the Bering Strait in a flow of about 0.8 ±0.2 Sv of Pacific Ocean water. The high‐salinity water Atlantic water fills the Arctic basin between the low‐salinity surface water and the Arctic bottom water while the small flow of Pacific shelf water passes to the east along the Alaskan‐Canadian shelf.
Although the Arctic Ocean comprises only 3.7% of the surface of the global ocean, it receives an input of freshwater from Asia and North America that is equivalent to 11% of the flow of all rivers, whose flow across the northern continents and into the arctic seas is at least as variable as it is in other regions. This fresh water, together with melt‐water from the melting ice‐pack in summer forms a permanent superficial layer (usually about 200m deep) of low salinity over the entire Arctic Ocean, without which much less seasonal ice would form. The flow of freshwater from the northern continents represents an export to the world ocean that goes almost entirely into the Atlantic, about 5.1 Sv passing as relatively low salinity water through the passages between Greenland and Ellesmere Island into the Labrador Sea, a flow of low salinity water that can subsequently be traced around the subpolar gyre. Balance is also maintained by flow from the Arctic Ocean through the western part of Fram Strait to enter the East Greenland Current. The strength of both of these annual fluxes during summer will have consequences for the salinity of the surface water mass of the Arctic Ocean and hence on the strength of the freezing cycle during the following winter.
JC note: The freezing temperature of water depends on the salinity of the water — more salt means a lower freezing temperature (the same effect of salting your driveway in winter). The freezing/melting point of pure water is 0C; the freezing point of seawater with salinity 35 psu (~ parts per thousand) is -1.92C. Because the the Arctic Ocean is fresher than average seawater, the average salinity is closer to 28 psu.
Because the incoming and the outgoing flows, warm and cold respectively, lie side‐by‐side between Greenland and Scandinavia, an asymmetry is induced in the distribution of ice-‐cover on the Arctic Ocean; this is generally dense to the west of Fram Strait while, to the east of Spitzbergen, much of the Barents Sea – at similar latitudes – remains ice‐free even in winter due the eastward flow of warm Atlantic water.
The outgoing flow through Fram Strait carries with it large volumes of fresh water as fragmented pack ice, a flow that is strongly episodic at decadal scale and is associated with the series of so‐called Great Salinity Anomalies observed within the circulation of the subarctic gyre and in the Nordic seas that were discussed in the previous chapter.
The significance of these events continues to be revealed: a new synthesis of circulation in the Arctic basin has been made from almost 3000 oceanographic profiles obtained in the central Arctic Ocean since the 1890s, which were not previously accessible. This makes it clear to what extent the variability in the inflow of ‘warm and salty’ North Atlantic water at times of positive values of the NAO (North Atlantic Oscillation) dominates the temperature of the Atlantic water mass by importing ‘vast quantities of heat’ into the Arctic Ocean to induce core temperatures in the intermediate layer in Nansen Basin that are much warmer than in the Canadian Basin, far downstream. This warm intermediate layer has the potential for significant control of the annual cycle of formation and melting of arctic ice.
On the other hand, during the negative phase of the AO (Arctic Oscillation), water motion in the Arctic Ocean is anticyclonic and the Beaufort gyre is strengthened, so that ice is retained and thickened both in the Canada Basin and along the Siberian coastline, where it may survive summer melting. Similarly, records of fast ice thickness and extent in four Arctic marginal seas (Kara, Laptev, East Siberian, and Chukchi) indicate that long‐term trends are small and generally statistically insignificant, although correlation degrades eastwards and is absent in the Chukchi Sea. That a simple warming trend throughout the 20th century does not characterise arctic conditions is also confirmed by records of ice‐cover in the four seas that lie north of Siberia (Kara, Laptev, East Siberian and Chukchi); these show clearly that ice variability in these seas is dominated by a low‐frequency oscillation of frequency 60‐80 years that “places a strong limitation on our ability to resolve long‐term trends”. This low frequency signal is strongest in the Kara Sea (where very strong ice minima occurred in 1940 and at 2000 the end of the data series studied) and decays eastward so that in the Chukchi Sea ice cover is dominated by decadal fluctuations. Only in the Kara Sea is ice cover dominated by thermodynamic factors, while ice cover in the other basins is dominated by the effects of wind and currents.
Transport of warm water on this scale may be expected to be directly related to the pattern of low and high pressure cells in the atmosphere. A stubborn, positive state of the NAO characterised the final decades of the 20th century, and was associated with transport of Atlantic water into the Arctic Basin that significantly reduced ice coverage.
Since 2002, this process has accelerated due to very thin spring ice and to the “memory of the system to the positive winter AO state that characterised the mid-‐1980s and 1990s” as Stroeve et al. put it. As well, these authors note that the character of sea ice has also progressively changed after so long a period of positive NAO values, particularly in the progressive loss of multi‐year ice. The single, strongly-‐negative NAO index during the winter of 2009/2010 was not sufficient to reverse the process.
The first evidence that a warm pulse had entered the Arctic Ocean in 1990 was the occurrence of anomalies of order 1C in the Atlantic water mass of the Nansen Basin. These were transported in the anticyclonic gyral circulation along the Asian continental slope through the Makarov Basin to reach the Canadian Basin 7 or 8 years later as a warm anomaly of about 0.5C. A second set of warm pulses was detected at Fram Strait in 2004 were a little warmer, but followed the same trajectory as in 1990 so that peak warming in the Eurasian Basin occurred in about 2007.
Warm anomalies such as these, transported within the Atlantic sub‐surface water mass, are not in direct contact with the pack ice that is insulated across a steep pycnocline from the warmer water by a <50m layer of cold surface layer of low salinity. The heat lost by each warm anomaly as it passes eastwards must in part be lost into the bulk of the Atlantic water mass below, but there is good evidence also of significant upward heat flux during transit along the slope: despite microstructure observations that suggest that mixing is very weak across the Arctic halocline, heat budget estimates nevertheless yield significant vertical fluxes. These in turn suggest that decreases in ice thickness of <30 cm may be attributable to this flux, rather than to the supposed consequence of a warming atmosphere over the Arctic Ocean.
The pulses of warm Pacific water that pass north through the Bering Straits are rather variable. Sea surface temperatures at the source of these fluxes in the Bering Sea closely matches the evolution of the value of the PDO (Pacific Decadal Oscillation). The significance of this observation is that it confirms that the inflow of Pacific summer water (PSW) in the late 1990s through wind forcing of near-‐surface transport was both unusually warm and unusually strong. The area of this interflow in the southern Canadian basin and the Chukchi Sea corresponds with the area of summer ice reduction during the late 1990s. However, increasing Bering Sea temperatures at the end of the 20th century cannot be formally correlated with relative ice loss in the Arctic Ocean, and an alternative mechanism has been proposed: that the warm pulse of PSW retards winter ice formation and so ensures a more efficient transfer of momentum from wind to the coastal water mass which “in turn causes an imbalance between ice growth and ice melt”.
Variability in summer ice‐cover in the Chukchi Sea, as in the Barents Sea, has been correlated with the values of the AO and the NAO, and hence with the frequency of cyclonic depressions over the Arctic Ocean. During the years 1979-‐2009 there was an increasing frequency and strength of extreme wind events on the north coast of Alaska during late summer and autumn. Such conditions will not only hasten melting of ice formed the previous winter but, independently of that process, will also increase the apparent area of open water by rafting and compacting small, isolated ice floes.
To summarise the arguments presented so far concerning ice-‐loss in the arctic basin, at least four mechanisms must be recognised: (i) a momentum-‐induced slowing of winter‐ice formation, (ii) upward heat-‐flux from anomalously warm Atlantic water through the surface low‐salinity layer below the ice, (iii) wind patterns that cause the export of anomalous amounts of drift ice through the Fram Straits and disperse pack-‐ice in the western basin and (iv) the anomalous flux of warm Bering Sea water into the eastern Arctic of the mid‐1990s.
These and other observations can be integrated into a model with feedbacks and having two unstable end‐points that is consistent both with classical studies of past climate states, and also with recent analysis of ice dynamics in the Arctic basin by Zhakarov, whose oscillatory model identifies feedback mechanisms in atmosphere and ocean, both positive and negative, that interact in such a manner as to prevent long‐term trends in either ice‐loss or ice‐gain on the Arctic Ocean to proceed to an ultimate state.
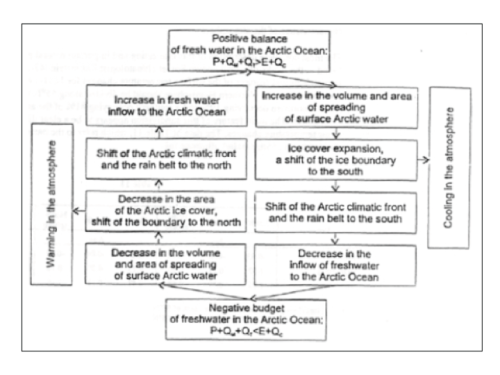
The key to this model lies in the distribution of precipitation on Earth, with maxima in the tropics and in high latitudes, so that the Arctic receives an excess of precipitation over evaporation of about one third, which is associated with the permanent presence of the low salinity surface water mass of the Arctic Ocean, separated by a halocline from the saltier Atlantic water below. The presence of this low salinity surface water mass would enable ice cover to fully recover in winter, even in the extreme case in which it was totally absent by the end of summer.
The model also provides a key to understanding the causes of the natural oscillation of the Arctic climate between two states of relative ice cover, depending on the balance of the relative volume of freshwater in the Arctic basin. Zhakarov’s model is conceptually simple: during periods of high precipitation when winter ice forms readily, summer ice cover increases, the atmosphere cools, the arctic front together with its associated rain belt shifts south so that freshwater input to the Arctic Ocean decreases, and winter ice cover is thicker, has a deeper draft, and so survives better in summer.
All this has been available to arctic science since the 1990s, but has been widely neglected perhaps because it suggests that when we are predicting change in arctic conditions we should look to the ocean for the major forcing, rather than to local atmospheric temperature. It emphasises that there is a strong internal relationship between the formation, stability and extent of sea‐ice and the structure of the upper layer of the Arctic ocean: it is the relative area and depth of low-‐salinity arctic water above the halocline that are paramount to ice formation and its summer survival.
JC reflections
I find this section to be an excellent summary of what is going on in the upper Arctic Ocean and sea ice — and Arctic climate dynamics is one of my areas of expertise. Longhurst’s argument is consistent with the stadium wave hypothesis [link], and clarifies the role of salinity and freshening from river runoff (from land precipitation) into the Arctic Ocean. In particular, Longhurst highlights Russian research (which was also integrated into the stadium wave), notably this paper by Zakharov Sea Ice in the Climate System – A Russian View, which is a must-read for anyone interested in this topic. Further, Longhurst interprets recent sea ice variability in context of the ideas put forth by Zakharov
The complete text of the chapter further clarifies how this view of Arctic sea ice differs from the prevailing view that atmospheric warming and ice-albedo feedback are conspiring to amplify the Arctic warming and melt the sea ice.
Section 8.2 is on Arctic temperatures, in which Longhurst concludes:
There is, therefore, very little support for the implications of the widely-‐ disseminated and quoted NOAA analysis and graphic used to introduce this section; the 1.5‐3.5C warm anomaly for Arctic regions that it suggests is most probably a result of gridding, and of adjustment and homogenisation of station data.
I agree with Longhurst that the extrapolations/kriging exercises of GISS and Cowtan and Way are misleading; see my previous post [link]. I think the only way to approach the Arctic-wide temperature changes is through reanalyses (data assimilation by numerical weather prediction models) [link]; see this figure from the ECMWF reanalyses [link]:
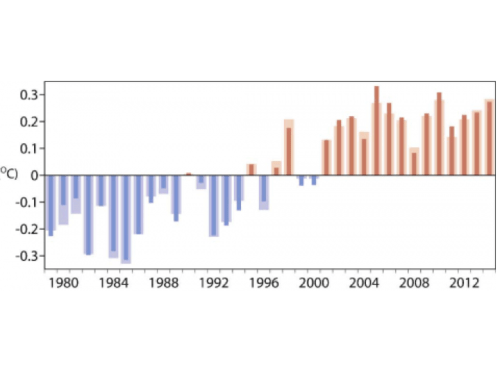 The narrower, darker bars denote complete global averages, while the lighter, broader bars denote averages taken only over grid boxes which exclude most of the Arctic and Antarctic. Evidently the ranking of average temperatures depends on the data coverage, although the differences are within the bounds of uncertainty associated with the dataset. For the purpose of this illustration we used HadCRUT4 geographical coverage for each month to sample ERA-Interim estimates. The November 2014 HadCRUT4 coverage was used for December 2014 as HadCRUT4 data were not yet available for the latest month.
The narrower, darker bars (including both polar regions) don’t show any evidence of a ‘polar amplification’ of the warming, although the signals from a warming arctic are combined here with a mostly cooling antarctic. Interesting that when you include the polar regions, that 2005 and 2010 were substantially warmer than ‘warmest year’ 2014.
The processes summarized by Longhurst are occurring in the Arctic Ocean (and are consistent with the stadium wave hypothesis). The key question is to what extent atmospheric warming/ice albedo feedback is influencing the recent sea ice decline relative to the natural variability. In my 2013 Climate Dialogue essay on The Decline of the Arctic Sea Ice, I stated that I figured that the human contribution was 50%, +/- 30%. After reading Longhurst’s chapter, I am inclining more towards a natural dominance for the recent sea ice decline. I have argued (consistent with the stadium wave hypothesis) that a recovery of the sea ice is occurring already in the Atlantic sector of the Arctic. It seems that the warm blob in the northern Pacific is dissipating and Alaska is having a very cold and snowy autumn so far, so perhaps we will soon see a recovery start in the Siberian sector. The 2015 Arctic sea ice melt season was a little lower than 2013 and 2014, but sea ice volume continues to increase. The next 10 years of sea ice observations should clarify all this.
Moderation note: This is a technical thread, keep your comments on topic and civil. Moderation will be heavier than usual.

Pingback: Why is the Arctic climate and ice cover so variable? | Enjeux énergies et environnement
A corollary to the question: Are variations in Earth’s heat source responsible for any of the observed variations in Earth’s climate?
There is a great reluctance to consider the influence of other astronomical objects on planet Earth, perhaps a fear of some rational basis for astrology?
https://weatheraction.wordpress.com/2015/10/05/a-disturbance-in-the-force-saxbys-equinoxal-gales/
The question is whether or not Earth’s climate is influenced by the force in the Sun? Watch the NASA video (ref 10) on stellar flares:
https://dl.dropboxusercontent.com/u/10640850/The_FORCE.pdf
Noble Prizes are being announced today for those who rescued the Standard Solar Model by reporting that solar neutrinos oscillate away before reaching our detectors.
http://nypost.com/2015/10/06/2-share-nobel-prize-in-physics-for-work-on-neutrinos/
Reblogged this on Climate Collections and commented:
Technical treatment of Arctic ice
I am sure the global rise in ocean heat content must have something to do with the latest ice loss, but this seems to have been completely omitted for some reason.
well, what would be the mechanism? The mechanism in play is regional increase of fresh water at the ocean surface, analogous to additional runoff into the Arctic Ocean. A back of the envelope estimate of the addition of freshwater from land ice melting? The seasonal melt/freeze cycle of sea ice has little net effect on upper ocean salinity.
probably due to the fact,that most of the so called increase in OHC is in the other hemisphere.
http://www.nature.com/nclimate/journal/v5/n3/full/nclimate2513.html
Jim D | October 4, 2015 at 10:03 pm | Reply
Perhaps, but you would have to quantify that “global rise in ocean heat content”. The very small change in ocean water temperatures since sea ice measurements began in 1979 does not match with gains (or losses) in any season, not from Sept (Arctic sea ice minimum) over through winter to March-April sea ice maximums.
The Arctic sea ice anomaly has varied strongly (gaining and losing more 2.5 Mkm^2 in only a few months) several times, and not once of those extreme changes has the result been predictable by “conventional” theory of “warmer ocean melts sea ice, melted sea exposed darker ocean water to the sun, ocean water warms up even more, and more sea ice is lost.”
At best, you can “almost” make an inverse association: low sea ice in the fall often – but not always! – results in unusually high spring sea ice the next year, and low sea ice in the spring is followed by high fall sea ice at maximum. Several times, but again – not always! – high spring sea ice is followed by low sea ice in the next fall.
2015 Arctic sea ice maximum was unusually early, but had a very long, broad peak that remained at 97% of its maximum for many, many weeks. By mid-April, 2015 arctic extents were higher than all recent years, and they remained higher than most recent years all through the summer. Then, they dropped in August-September to below -2 std deviations .
Now, they have crawled back into their former +/- 2 std deviations range.
Remember, for seven months of the year, low Arctic sea ice extents mean increased heat losses from the Arctic ocean. It is ONLY in those five summer months of April-May-June-July-August that the exposed Arctic ocean gains energy from the sun. The rest of the year? Less sea ice = Increased energy losses due to
(1) increased evaporation from the exposed ocean,
(2) increased convection losses
(3) no conduction losses through the sea ice to the colder air,
(4) increased long-wave radiation into the same Tsky from a 2 degree C ocean surface than from a -25 degree C ice surface.
On the other hand, over the course of the entire year, the last 4 years of ever-larger “excess” sea ice anomalies around Antarctic are reflecting 1.7 times as much energy from the planet as is absorbed up north.
Not much energy is exchanged between the southern hemisphere and the northern hemisphere. The temperatures in both hemispheres are regulated by the Polar Oceans that thaw and increase snowfall and freeze and decrease snowfall.
It is ONLY in those five summer months of April-May-June-July-August that the exposed Arctic ocean gains energy from the sun.
The Arctic ocean is warm enough to melt ice or cold enough to freeze over because of the temperature of the ocean currents that come from the tropics. There is never enough sunlight in the Arctic to melt the ice. The sunlight never even reaches the water unless the warm currents melt the sea ice first.
Replying to Popesclimatetheory comment below
False. The antarctic sea ice is melted from below from the circulation of warmer waters under the sea ice. The Arctic sea ice is melted from above, with shallow meltwater ponds NOT “connected” to the Arctic waters below the sea ice covering as much as 40% of the ice surface. This was measured several different ways during Dr Curry’s own 1997-1998 SHEBA expeditions. Yes, “some” arctic sea ice is melted from below. But most is melted from the sun above.
And, once the summer season is passed, the ever-colder Arctic air masses remove even more heat from the under-ice water up through the sea ice by conduction into the -25 deg arctic air. Thus, the heat flow most of the year is opposite the quote above.
There is some current through the Bering Strait into the Arctic. But not much. And that current south of the Bering Strait is the very cold Japanese Current and the eddies around the Aleutian Islands – neither of which is not “tropical” by any regard.
RACook wrote: The Arctic sea ice is melted from above.
Those surface puddles don’t count for much.
Run water on one ice cube and blow hot air on another. Warm summers do allow sea ice to melt, but without the warm water, the Arctic would be more like Antarctica and never thaw, other than a few puddles.
The Arctic never freezes where the Gulf Stream comes in and it melts first where the Gulf Stream flows. The part of the Arctic that melts last gets just as much sun but not as much warm water.
In years past, the Arctic did not melt as much, the sun was just as warm but the water was colder.
Not to mention surface albedo effects resulting from variable industrial dust blown in from variable winds.
The text quoted says “each inflow is not only variable in volume of water transported but also in the temperature of the water imported.” In the case of the upper water in most oceans including the North Atlantic inflow, that temperature is increasing on the same decadal time scales as this ice loss. That is an obvious and important factor that was not mentioned at all. The positive albedo feedback and resulting polar amplification should also be considered in any discussion of the Arctic region, as well as the fact that the land around the Arctic Ocean is warming even faster than it. Once you add these factors, you get a more coherent picture of what is going on.
“The positive albedo feedback and resulting polar amplification should also be considered in any discussion of the Arctic region,”
With reduced September ice extent, the rebound to March maximum is strong, but with greater September sea ice extent the rebound to the next maximum is far less. That is a negative feedback.
Jim D:
What do you believe is the primary driver of the increase in OHC — CO2 forcing or sunlight’s non-infrared spectrum?
And to what degree do you believe that warming of the land surrounding the Arctic is attributable to CO2 forcing as opposed to, say, the release of latent heat, soot-induced albedo changes or stadium wave propagation?
P.S. Thank you for continually raising such interesting questions. They are greatly appreciated, at least by me.
The warming of both the ocean heat content and land are directly from the imbalance caused by the increasing forcing, and the factor accounting for nearly all of that is rising GHGs. These things don’t warm spontaneously or by internal processes.
Peter Minnett’s explanation nails it. DLR changes the gradient; the escape of energy driven into the upper ocean by the sun is delayed; OHC continuously goes up – exception is extremely strong El Nino events, rare, and volcanoes, rare.
JCH:
I’m afraid you lost me there. Are you referring to his work on aerosols from Asia increasing downwelling IR? And I’m not clear on how DLR “changes the gradient”.
The oceans get warm. There was a Roman Warm Period and a Medieval Warm Period and now there is a Modern Warm Period. There is a several hundred year period when warm oceans keep the Arctic Ocean more open so that more snowfall will rebuild the ice on land for the next Little Ice Age! Look at the actual data. Warm periods always follow cold periods and cold periods always follow warm periods. More snow falls in warm periods and then it always gets cold. Less snow falls in cold periods and then it always gets warm. Look at the actual data.
The earth has huge ice machines in the North Polar Region and in the South Polar Region. When oceans get a little warmer, much sea ice thaws and ramps the snowfall rate up, without bound, until the oceans get a little colder and the oceans freeze and that ramps the snowfall rate down.
Snowfall rates are higher when the temperatures are higher and snowfall rates are lower when the temperatures are lower. Ocean Temperatures in the North and South Polar Region are regulated near to the temperature that the Polar Oceans Freeze and thaw.
The evidence for this is in the ice core data.
http://popesclimatetheory.com/page85.html
We have temperature data since 1890, we have watched from space a fraction of that time. Our thermometer data and our satellite data is of time periods that are far too short to use just that to understand the thousand year cycles.
We have ice core data for thousands of years. You must use data that goes back many repeating cycles to understand climate.
Little known fact. Earth also has a snow cone machine at the South pole, but don’t tell anyone. More snow cones for us.
Over the past fifty million years, earth cooled because land moved, ocean currents changed, more and more warm water was circulated in higher Latitudes and Polar Oceans to melt more and more sea ice to support more and more snowfall to promote more and more ice on land. You can see the change in the slope of the temperature change when the space between North and South America closed. The cooling had stopped for more than twenty million years and then it resumed. Temperature has been regulated by the advancing and retreating sea ice. A little warming increases snowfall and a little cooling decreases snowfall. This adjusts Albedo and it adjusts the amount of ice and ice water that is dumped into the oceans to directly cool the water. When more ice and ice water is shed from Greenland and Antarctica, it is because warm thawed oceans promoted more snowfall to increase the ice depth and flow rates. These are well bounded stable cycles, in the North and in the South. When it is warmer it will always snow more and then get colder. When it is colder it will always snow less and then get warmer. The ice core data does show this for eight hundred thousand years. Other proxy data does show this for fifty million years.
http://popesclimatetheory.com/page81.html
This is good stuff. I’ve thought for awhile that sea ice volume is a leading indicator of recovery, but every time I think about it I come up with a different reason. This makes better sense than anything I’ve come up with.
==================
The 2015 Arctic sea ice melt season was a little lower than 2013 and 2014, but sea ice volume continues to increase.
Do you have a reference for this?
judith it struck me that you spoke in error here, volume has gone down this year compared to the previous two years.
Not according to PIOMAS
http://psc.apl.washington.edu/wordpress/wp-content/uploads/schweiger/ice_volume/BPIOMASIceVolumeAnomalyCurrentV2.1.png
NevenA:
The answer is (or at least may be) blowin’ in the wind…
http://nsidc.org/arcticseaicenews/
Arctic buoys go where the Arctic sea ice goes.
And as long as the Arctic sea ice is going like this:
http://psc.apl.washington.edu/northpole/pngs/Allyears_buoy_drifts.png
Arctic sea ice will decline.
opluso, I guess if you accept what you have written here then you might think that the sort of year to year variation are a product of weather/atmospheric variations. What Longhurst is talking about are factors that influence ice on a multi-decadal time frame (ocean oscillations(?) versus external forcing), a trend that started in the 1980s/1990s.
In that case it does make Judiths comment still a little premature, given that she’s intimating that a deflection point may have occured based on 3 years data.
BTW I take Judiths point with the graph but I also think Neven isnt wrong here, and that contradiction arises simply because the argument is over relatively small changes for a year-or-three.
The problem I have with Longhurst is that he seems to be the anti-IPCC, i.e. anything but external forcing. Or at least a very minor role for it. Most people seem to accept a role for both external forcing and internal variations. The argument seems to be over just how much each dominate and anybody who wants to say they have the answer needs to ignore a subset of the evidence or at least put forward a single explanation when multiple explanations seem plausible. Its sorta why Longhurst looks as wonky as the consensus.
Attempting to respond to human1ty1st:
I think we agree.
One could argue that global CO2 forcing drives changes in the weather (short term) and climate (longer term) and thereby causes the changes in wind patterns that drive currents, floating ice, etc. That’s where the various models, based on competing assumptions, come into play.
Yet I would assume that all agree that the proximate cause of annual arctic ice fluctuation is local/regional “weather” even if the longer term trends (that is, changes in the weather from year to decade to century) are being driven by something more global in nature.
Even if everyone agrees on that last point, you can still debate natural variation vs CO2, etc. My impression is that Dr. Longhurst favors natural climate variation explanations over the dominant CO2 “control knob” explanation for observed changes in recent decades.
Since natural climate variability and CO2 forcing are at work simultaneously it becomes difficult to assign specific percentages of any observed change in conditions to any single cause. So it isn’t surprising to me that great minds, at least on this issue, do not necessarily think alike.
Turbulent Eddie: Thank you for a nice picture of a drifting ice. It did not change since Nansen’s times. What makes you think that it has anything to do with an ice loss?
The claim: “It did not change since Nansen’s times.”
may be unfounded.
“For both 2015 and 2007, the summer pressure patterns led to winds directed down the Fram Strait, helping to transport ice out of the Arctic Ocean into the East Greenland Sea.”
Also, Rigor and Wallace.
Evidently transport does change. During times when the Beaufort gyre dominates, ice spins in place and accumulates. During times when the trans-polar drift dominates, ice is lost and totals decline.
The latent heat fingerprint on Arctic temperature does indicate that:
Arctic sea ice loss occurred from 1910-1945,
Arctic sea ice gain occurred from 1945-1975,
Arctic sea ice loss occurred from 1975-2005 or so,
Arctic sea ice gain occurring since roughly 2005?
These things are all models, but here’s an interesting pic from seaicenews.
Some expansion of area over 2012:
http://nsidc.org/arcticseaicenews/files/2015/09/compare_extents_20150911_20120917-350×516.png
http://ocean.dmi.dk/arctic/plots/icecover/icecover_current_new.png
http://psc.apl.washington.edu/wordpress/wp-content/uploads/schweiger/ice_volume/BPIOMASIceVolumeAnomalyCurrentV2.1.png
You can download the data here and see for yourself that according to PIOMAS as of end of September 2015 sea ice volume is 1087 km3 lower than 2014, and just 289 km3 higher than 2013, after having been 1223 km3 higher at the end of June.
Furthermore, when subtracting the minimum from the maximum 2015 saw the third highest volume loss during one melting season, after 2010 and 2012 (see this bar graph) .
2015 has ended below rebound years 2013 and 2014 on practically every graph.
Well, according to the Navy model,
there was some thick ice lost in the Beaufort Sea
from last year:
http://www7320.nrlssc.navy.mil/hycomARC/navo/arcticictn/nowcast/ictn2014100118_2014100200_039_arcticictn.001.gif
to this year:
http://www7320.nrlssc.navy.mil/hycomARC/navo/arcticictn/nowcast/ictn2015100418_2015100200_041_arcticictn.001.gif
Much of this occurred in the last few months.
At the same time, there is more 1 and 2 meter thick ice in the Eastern Arctic. Further, the ice loss in the Beaufort and Chukchi appears to have left an outlying ring which seems to be acting as a nucleus of ice formation.
The sea ice recovery is just some natural variation on the overall trend of decreasing sea ice volume, extent and area.
It’s like the temperature pause, only the pause has more going for it as the sea ice recovery only lasted 2 years and it’s all over.
Do we really need to wait 10 years to see what is going on up north?
In 10 years the Piomas trend line will be where the 2012 minimum was, so a bad melt year like 2010 or 2012 and it will be curtains for the ice.
Do we really need to wait 10 years to see what is going on up north?
The percentage of multi-year ice has continued to increase since reaching a minima in 2008:
http://nsidc.org/arcticseaicenews/files/2014/04/Figure5.png
This means the existing ice becomes more persistent, fresher ( with a higher melting/freezing temperature), with a higher albedo.
Many processes are significant, but it may have been a matter of confirmation bias to wilfully attribute all or even the majority of Arctic sea ice decline to global warming.
Many processes are significant, but it may have been a matter of confirmation bias to wilfully attribute all or even the majority of Arctic sea ice decline to global warming.
When the globe does warm, the oceans warm. Polar Sea Ice always thaws when oceans are warm. Polar Oceans always freeze when oceans are cold. Polar Sea Ice Decline is always due to global warming. Polar Sea Ice Increase is always due to global cooling. That is simple Physics.
When warm oceans thaw Polar Sea Ice, that is when the open oceans provide moisture to rebuild the ice on Greenland, Antarctic, and the Mountain Glaciers. It rebuilds the ice until there is enough ice on land such that ice advances and increases Albedo and increases the amount of ice that is dumped into to oceans and on land. Earth always cools after a warm period with more snowfall. Earth always warms after a cold period with less snowfall. Ice core data does always correlate with this.
The temperature that Polar Oceans Freeze and Thaw does provide the Thermostat setting for both Hemispheres.
http://popesclimatetheory.com/page85.html
> I agree with Longhurst that the extrapolations/kriging exercises of GISS and Cowtan and Way are misleading […] I think the only way to approach the Arctic-wide temperature changes is through reanalyses […]
Yet:
http://judithcurry.com/2013/11/18/uncertainty-in-arctic-temperatures/#comment-415427
Also, there’s only one hit for “misleading” in the C&W thread:
http://judithcurry.com/2013/11/18/uncertainty-in-arctic-temperatures/#comment-415324
Clarification might be required.
Willard,
Lindsay R, Wensnahan M, Schweiger A, Zhang J. 2014. Evaluation of seven
different atmospheric reanalysis products in the arctic. Journal of Climate
From the abstract:
http://journals.ametsoc.org/doi/full/10.1175/JCLI-D-13-00014.1
Agreed. However the model structure, assumptions, and data assimilation methods, whatever their uncertainties and differences, are better than extrapolation or kriging over long distances or across land/sea/ice boundaries. And some model systems are better than others – for surface Arctic surface climate, i pay most attention to ECMWF, NOAA/NCEP/CFSR and MERRA. I wrote a paper on this over a decade ago that is relevant also:
http://curry.eas.gatech.edu/currydoc/Curry_JGR107.pdf
“Agreed. However the model structure, assumptions, and data assimilation methods, whatever their uncertainties and differences, are better than extrapolation or kriging over long distances or across land/sea/ice boundaries. And some model systems are better than others – for surface Arctic surface climate, i pay most attention to ECMWF, NOAA/NCEP/CFSR and MERRA. I wrote a paper on this over a decade ago that is relevant also:”
Lets take that as a given, because it is merely asserted. physical models are better than statistical models.
1. Given: physical model(s) are better than kriging.
2. Judith recommends 3 models
A comparison of the models with each other and the models with CRU, GISS, C&W, and BE might tell us something.
Frankly looking at Merra in the past I found some of its output to look unphysical.
Question; if reanalysis shows no haitus… what does one conclude?
“Question; if reanalysis shows no haitus… what does one conclude?”
That you’ve done your reanalysis wrong.
That you’ve done your reanalysis wrong.
1. Judith prefers reanalysis products to krigging.
2. if reanalysis products show no hiatus, and if they are preferred,
THEN what do you conclude?
Think harder mate
Steven Mosher: 1. Judith prefers reanalysis products to krigging.
In data sparse regions and across geographic boundaries. And some models are better than others.
if reanalysis shows no haitus… what does one conclude?
What does that refer to? No drama please, information (reasonably reliable information!) will do.
1. Judith prefers reanalysis products to krigging.
Reanalysis and kriging both model data where there are no observations.
Reanalysis attempts to model a parameter in a physically consistent manner with other parameters which may be observed.
Kriging dispenses with physical consistency.
Both may be in error.
Kriging assumes “spatial variation in the data being modeled is homogeneous across the surface.” It would appear that kriging is being applied even though many atmospheric phenomena and trends of phenomena are inhomogeneous. Certainly that’s the case over the Arctic varying from land, to open ocean, to thin ice, to thick ice, to kilometers high ice sheets over Greenland.
I thought the hiatus was global, not arctic and that the arctic was still warming a bit. Or are you referring to a hiatus in sea ice melting trends?
Having read and reread the links to past posts and their links, in particular some of tonyb’s work, it seems one has to make a herculean effort to ignore the natural variability argument especially after looking at all the literature published many decades ago. Recovery of the Arctic, with the obvious observational implications, should give some who are on the fence a little nudge.
Yes. And it appears a recovery is underway since the (IMO) nadir in 2007. 2012 was weather driven. If TonyB’s information is right, then something like a 30 year recovery is underway. And only coincidentally sat observation coincided roughly with a cyclic ice zenith. Essay Northwest Passage touches on many aspects of this, using transit information as a proxy.
You are ignoring the record of natural variability.
“Similarly, records of fast ice thickness and extent in four Arctic marginal seas (Kara, Laptev, East Siberian, and Chukchi) indicate that long‐term trends are small and generally statistically insignificant, although correlation degrades eastwards and is absent in the Chukchi Sea. That a simple warming trend throughout the 20th century does not characterise arctic conditions is also confirmed by records of ice‐cover in the four seas that lie north of Siberia (Kara, Laptev, East Siberian and Chukchi); these show clearly that ice variability in these seas is dominated by a low‐frequency oscillation of frequency 60‐80 years that “places a strong limitation on our ability to resolve long‐term trends”. This low frequency signal is strongest in the Kara Sea (where very strong ice minima occurred in 1940 and at 2000 the end of the data series studied)”
I have no clue what he is looking at here.
Every sea he mentions…. Kra, Laptev, East Siberian, Cukchi
basically go to ZERO
https://14adebb0-a-62cb3a1a-s-sites.googlegroups.com/site/arctischepinguin/home/amsr2/grf/amsr2-area-regional.png?attachauth=ANoY7coH7MzYVfZucpcQmoL4GYA7vHn00ppAAQHOaYxHHRT_Ecp4C9qn8BclTniHZcMfFlM4Ha8whZ_X7vxi2pPvP0v74DHgLiRSDl-SGmVhckYCQwedSBphnRySlgmM7GVWu3GnM842o7JpazAAGjnVl7v3wXF1qBvTYHWMQvGVNNqMzqZvIO4VJZZy5A2CaOHmV8wt-BDGKOlcPywXmg-PAZ2QmFMWA3BGcNEJYC7efum-JzSo_Ndi-fVJC9TsFmfeSXAdUsUg&attredirects=0
That’s goinh to complicate any trend analysis.. the same way the ice cover is limited in maximum size by land.
Since virtually every sea is going to zero… you want to watch those that dont. Central basin and CA
“I have no clue what he is looking at here.”
fast ice thickness and extent
Which part of that don’t you understand?
“these show clearly that ice variability in these seas is dominated by a low‐frequency oscillation of frequency 60‐80 years that “places a strong limitation on our ability to resolve long‐term trends”. This low frequency signal is strongest in the Kara Sea (where very strong ice minima occurred in 1940 and at 2000 the end of the data series studied)”
Look at the actual data for those seas.
1. They all have a MAXIMUM that can never be exceeded by definition
2. they all a minimim (extent) of ZERO which is reached every year
now.
consequently looking at trends in those regions is going to be meaningless since the total extent of the whole artic is determined
by those seas that DO NOT REACH ZERO.
Finally, he just makes bald assertions with no data no sources no methods.
Passes your smell test, cause you like odd smells
Ah. So you don’t understand thickness of fast ice.
I’m not sure why. Is it your contention that the thickness of fast ice on these sea shores is the same from year to year?
https://upload.wikimedia.org/wikipedia/commons/thumb/d/d8/Sea_ice_Drawing_General_features.svg/2000px-Sea_ice_Drawing_General_features.svg.png
I think someone is confused and unless someone can show me that measurements of fast ice area or extent are measured and published, Steve Mosher has a point.
But anyway, fast ice has been breaking off and becoming sea ice at irregular intervals, see Ayles ice sheet and the Petermann glacier for a couple of examples.
Nope springer. That is not my contention.
The author gives these as sources:
Polyakov, I.V. et al. (2003) Journ. Climate 16, 2078-2085
Polyakov, I.V. et al. (2010) Journ. Climate 16, 2078-2085
Mosher’s hypercritical unqualified opinion is just that. The author is an accomplished oceanographer who has studied these regions of the world in depth over a very long career. Mosher is a piker with no science degree holding delusions of being a peer to people like Longhurst. It’s pathetic.
fast ice != drift ice
yes it still remains unclear and beside the point,
He’s saying the fast ice hasn’t declined, even though the drift ice has.
Warming would tend decrease drift ice and to decrease fast ice.
Other factors ( such as salinity based changes ) might decrease drift ice but not change fast ice which is what is observed.
the “usual” definition of “fast ice” is sea ice that is grounded or held “fast” to the shore, not moving with the currents and winds occurring offshore.
Te. He is not saying that or showing that at all.
The way I read it, he is saying the trend in fast ice in the four seas mentioned are small and statistically insignificant.
Siberia seems to be too dry to support marine terminating glaciers, which would be a prerequisite for the existence of ice shelves in the area.
Observations suggest that variability in oceanographic conditions in the Arctic is very largely driven by the consequences of the flows through open passages to both Atlantic and Pacific Oceans, which themselves respond to the different and characteristic variability of the circulation patterns of each ocean: each inflow is not only variable in volume of water transported but also in the temperature of the water imported.
Why would anyone ever need to add to this?
After reading Longhurst’s chapter, I am inclining more towards a natural dominance for the recent sea ice decline.
Whatever caused the Roman and Medieval warm periods is causing this modern warm period. This is a natural cycle and we did not cause it.
Judith kindly referenced part 2 of my arctic ice articles. Early on in it is a link to an earlier article of mine covering the arctic warming in the first half of the 19th century.
A much more detailed version of part 2 was carried here
http://wattsupwiththat.com/2014/08/22/historic-variations-in-arctic-sea-ice-part-two/
arctic ice melt can be traced back through the centuries, for example via the bronze age ipiatuk race in Alaska who had an extraordinary civilization which I have been trying to trace via the university in Fairbanks
Whilst at the Scott polar institute in Cambridge A couple of years ago there was much Russian research into the extraordinary warming that took place along what is now the northern sea route during the first half of the 16th century. In Europe the warmest years in the last thousand are possibly those centred around 1540.
I hope to return to the polar institute this winter to see if these reports are corroborated by any other reports
Tonyb
Moore et al (2001) note the fastest Arctic cooling in 1240 years at 1375 AD, the same year that England had unusually hot weather. Does that ring a bell?
Ulrich
I am abroad at present but if you have a link to that study could you email it to me as I am currently working on that period. Thanks
Tonyb
Toni, you have yet to acknowledge what I have repeatedly said about the extreme temperature difference between Europe and Greenland in the 8th century. I am not your secretary or research assistant, google for the Moore paper yourself.
Ulric
as I have said to you before I have no knowledge of the 8th century conditions in either Europe or Greenland and it is some 3 centuries outside of my research era so I can not comment on it
I am currently on a tiny tablet with spotty connection so am not in a position to Google anything
tonyb
You don’t need to refer to Baffin Bay temperatures for your work on that period anyway, especially if you are not following that the temp’s move in opposition to the UK.
“I have no knowledge of the 8th century conditions in either Europe or Greenland..”
You have seen both the GISP2 series and the Europe proxy data for then but choose to ignore it.
“Whilst at the Scott polar institute in Cambridge A couple of years ago there was much Russian research into the extraordinary warming that took place along what is now the northern sea route during the first half of the 16th century. In Europe the warmest years in the last thousand are possibly those centred around 1540.”
The first half of the 16th century was rather cool at Baffin Island, but do note how warm it was there from around 1200 to just before 1375, probably from around 1362 in fact, as that is a close heliocentric analogue to around 1540, and was also very warm in NW Europe.
http://snag.gy/MW326.jpg
As you know there was a significant downturn in European temperatures in the ~1200-1360 period.
Look at GISP around 1540:
http://snag.gy/ZLRCy.jpg
This is not the first time that I have alerted you to the temperature differential between CET/Europe and this GISP series. Maybe you could respond this time.
The late 1500’s, cold CET (Sporer Min), warm GISP.
Around 1610, warm CET, cold GISP.
1660’s, warm CET, cold GISP.
Warm CET years around 1686 in the middle of Maunder, cold GISP.
Coldest part of CET in Maunder, 1690’s, warmer on GISP.
Largest rise in CET 1690’s to 1730, cooling all the way on GISP.
1740 very cold CET, warm on GISP.
Coldest part of Dalton Min on CET 1807-1817, warm on GISP.
Warm ~1825-1835 CET, cold on GISP.
Very cold 1836-1845 on CET, v warm on GISP.
Ulric
My quibble is when people claim GISP 2 to be a good global temperature proxy.
Yes, the relationships between cold/warm looks good from your link. Is it one of Easterbrooks graphics?
tonyb
My quibble was even though I had already showed you all this and other examples of the Arctic versus CET/Europe temperature differential, you carried on regardless with assertions that the Arctic was warm at the same time as the MWP in Europe. This time it’s an anecdote about “extraordinary warming that took place along what is now the northern sea route during the first half of the 16th century”, that is flat useless without information showing in which years let alone decades the warming occurred. You are only referring to 2 or 3 warm years in UK/Europe around 1540, that’s not half a century.
You said
“Yes, the relationships between cold/warm looks good from your link. Is it one of Easterbrooks graphics?”
What relationship looks good? I cannot tell from that reply whether you are actually agreeing with me, or have decided for yourself that this GISP series follows CET.
I wonder if mineral component of melt water isn’t a factor in the cycle, as happens when El Nino sends iron-rich Aussie silt into the Pacific on parching spring westerlies, setting things up for sister Nina. It wouldn’t surprise me if this was so…and it wouldn’t surprise me if this was not something one mentions over the aperitifs at COP 21. The narrative, doncha know.
Hey, I’ll drink ter that.
The melt water or the COP 21 aperitifs? I suppose a serf will guzzle anything.
Drink while you can. After COP 21 your water, fuel and power rations will have to be reduced or made more expensive. As a trade-off, your guilt ration will be greatly increased.
We all have to tighten our belts for the planet – and by “we” I mean “you”.
Pingback: Hielo ártico de septiembre con datos de 2015 | PlazaMoyua.com
Top down awethaurity, so rigid. (
“…times of positive values of the NAO (North Atlantic Oscillation) dominates the temperature of the Atlantic water mass by importing ‘vast quantities of heat’ into the Arctic Ocean..”
The reverse, negative NAO warms the Arctic.
” A stubborn, positive state of the NAO characterised the final decades of the 20th century, and was associated with transport of Atlantic water into the Arctic Basin that significantly reduced ice coverage.”
Nonsense, the ice loss accelerated from around 1993 onward because of increasingly negative NAO.
Ulric the article has it opposite of what you convey.
The significance of these events continues to be revealed: a new synthesis of circulation in the Arctic basin has been made from almost 3000 oceanographic profiles obtained in the central Arctic Ocean since the 1890s, which were not previously accessible. This makes it clear to what extent the variability in the inflow of ‘warm and salty’ North Atlantic water at times of positive values of the NAO (North Atlantic Oscillation) dominates the temperature of the Atlantic water mass by importing ‘vast quantities of heat’ into the Arctic Ocean to induce core temperatures in the intermediate layer in Nansen Basin that are much warmer than in the Canadian Basin, far downstream. This warm intermediate layer has the potential for significant control of the annual cycle of formation and melting of arctic ice.
On the other hand, during the negative phase of the AO (Arctic Oscillation), water motion in the Arctic Ocean is anticyclonic and the Beaufort gyre is strengthened, so that ice is retained and thickened both in the Canada Basin and along the Siberian coastline, where it may survive summer melting. Similarly, records of fast ice thickness and extent in four Arctic marginal seas (Kara, Laptev, East Siberian, and Chukchi) indicate that long‐term trends are small and generally statistically insignificant, although correlation degrades eastwards and is absent in the Chukchi Sea. That a simple
“Ulric the article has it opposite of what you convey.”
That’s because it is also apposite what the data says.
^opposite
“Why is the Arctic climate and ice cover so variable?”
Because of something called “natural variation”.
I think a more important question is:
Why did anyone expect the Arctic climate and ice cover to be more stable?
“The 2015 Arctic sea ice melt season was a little lower than 2013 and 2014, but sea ice volume continues to increase. The next 10 years of sea ice observations should clarify all this.”
I forecast increased sea ice extent for summers 2013&14 as I knew the NAO would be more positive.
The next ten years should see the most negative NAO/AO conditions of this solar minimum, and much loss of summer sea ice like 2007 and 2012 and worse.
I really admire all the work and thought that you, Dr, Curry, Dr. Longhurst, and your well-versed commenters put into searching for real answers to climate issues. As a layperson it is refreshing to read everything above from people who are unwilling to just sit back and let the CAGW crowd control the debate. It is clear that the science is not settled. I wish the mainstream media had half the intellectual integrity and openmindness that you all exhibit.
“I wish the mainstream media had half the intellectual integrity and openmindness that you all exhibit.”
+1000
All the papers in the world on the subject don’t mean a thing if integrity is dismissed in the media in order to create a convenient CAGW argument. I wish JC’s work got half the exposure as skinny polar bears; but the Paris summit obviously would just not have the urgency.
The variability depends a lot on how you look at the ice. A summary of ways Arctic ice is reported.
https://rclutz.wordpress.com/2015/10/04/ice-house-of-mirrors/
Thank you for the interesting and informative link. It gives a better perspective than what is usually portrayed. Digging a little more into the facts can never hurt.
I am sitting here watching an interview with Ben Bernanke, the former Fed Chairman. His book will be in the headlines in the next few days with supposedly his call for more CEOs of financial firms to be in the can. But listening to his explanation of what he meant is different from what is in the headlines. The reality is always more complicated than a simple narrative.
Your link shows that to be true.
I’m just a layman struggling to understand. But it seems to me using the amount of sea ice at any one time in the Arctic as some sort of gauge for existence of warming or cooling or to determine a trend in temperatures in anything but long time scales is folly. It seems to me the variables effecting the amount or coverage of sea ice, be it old vr. new, extent, area, or volume are so numerous. And many of those variables have nothing directly to do air temperature, water temperature, or insolation and yet they can have a marked effect on how much sea ice there is at any given time or during a particular year.
Agreed. Good summary. For those committed to the future being warmer, declining Arctic Ice is proof, and so it is hyped. Most of the variability is like beauty: it’s in the eye of the beholder. If you are not paying attention in September, it will be over before you noticed.
Humans are very good at seeing patterns where there are none.
And at least equally good at failing to see what is right in front of their noses.
ACO2 is the control knob of our climate. The PDO is positive, so there will be a very slight, very meaningless recovery of arctic ice, which will go away. The current rate of warming is likely at least double the IPCC’s .2C per decade. The AMO is a toothless tiger, and any CS estimate based upon the notion that it raised global temperatures in the last half of the 20th century is likely very wrong on the low side.
Perhaps. So what?
You’re sunk.
Prove it.
Lol:
http://cci-reanalyzer.org/DailySummary/
Yawn, today’s weather…
At first, thought you were kidding. Then realized you might be serious. Evidence for CO2 control knob fails with the pause, which also now falsifies the CMIP5 suite of climate models. The past decade’s rate of warming is statistically zero, not double 0.2C. See MxKitrick’s paper for a proper treatment of the autocorrelation. Please provide counter evidence if you meant to be taken seriously. Or fess up to kidding.
http://www.ospo.noaa.gov/data/sst/anomaly/2015/anomnight.10.5.2015.gif
Who gives a flip what UAH does? Seriously, it sucks.
Agreed. As a layman reading through posts like this, it lends more credibility to the statement that the climate system is a massively complex, chaotic, non-linear coupled system, made up of 5 separate subsystems, of which we have, at best, limited understanding of what drives each. Add to that the externalities such as solar, cosmic rays, gravity, polarity, etc. plus who knows how many unknown unknowns. Yet we continue to have those who espouse that there is but a single control knob that overrides everything and if we can adjust that control knob just so, we can control and stabilize our climate system and never experience another extreme weather event.
We are currently warming at more than twice the IPCC’s .2C per decade rate because of added CO2 in the atmosphere by humans.
JCH, I repeat my previous request to your astounding assertion about PRESENTLY warming at 2x the IPCC rate. Evidence, please. I don’t think there is any. Skeptic pause, warmunist missing heat, all that stuff that refutes your evident belief. Saying its so don’t make it so. Where I come from, just called your cards.
I’m so sorry. I made this claim before I learned Alaska is having a having cold weather and the blob is dissipating.
We are currently warming at more than twice the IPCC’s .2C per decade rate because of added CO2 in the atmosphere by humans.
Hee-hee.
That learn’d tha IPCC real good.
Don’t make rate based predictions any more
– they expose the claim to falsifying observations:
http://climatewatcher.webs.com/TrendsSince.png
Yeah, there’s some real truth telling in that pile of chit.
Sorry seems to be the hardest word
JCH – the blob is dissipating and the last 2 or 3 UAH monthly data points have been down.
Like Glory all blobs are fleeting
Dissipating:
http://polar.ncep.noaa.gov/sst/ophi/color_newdisp_anomaly_160W_95W_15N_65N_ophi0.png
Yeah, there’s some real truth telling in that pile of chit.
You could do it for yourself, if you were really interested.
I have; it’s my definition of the end of the pause… that point at which the almost completely dead thing can no longer fog a mirror.
If you had really analyzed any data, you wouldn’t write the erroneous statement:
We are currently warming at more than twice the IPCC’s .2C per decade rate because of added CO2 in the atmosphere by humans.
You are talking about a linear system; I’m talking about a dynamic, nonlinear system.
Regarding the blob, here are the anomalies for July:
http://www.ospo.noaa.gov/data/sst/anomaly/2015/anomnight.7.6.2015.gif
and for October:
http://www.ospo.noaa.gov/data/sst/anomaly/2015/anomnight.10.5.2015.gif
It does appear to be diminishing ( as blobs are wont to do ).
The PDO index has trended downward in 2015 (GMST follow it like a slave because the PDO is a badass cycle); it’s still high; it appears poised to go back up.
“Why is the Arctic climate and ice cover so variable?”
It’s the Ice Unicorns come out to play. Laughing and neighing down a rainbow slide.
Andrew
Readers might enjoy my earlier humorous (I hope…) essay on Cowtan and Way over at WUWT “Cowtan and Way – The Magician’s ‘Red Scarf Trick’ with Linear Trend Lines” http://wattsupwiththat.com/2013/11/20/cowtan-and-way-the-magicians-red-scarf-trick-with-linear-trend-lines/
Arctic and N. Atlantic are dominated by natural ‘oscillations’, however the Arctic ice data is far too short to make any meaningful conclusion.
of no interest to the conformist ( link)
If you dont look too hard for ‘oscillations’ having a tidy frequency, but instead for evidence of the occurrence in the past of periods when ice cover was low – somewhat like today – you find them easily, and I note a few in my text; they are enough to convince me that trying to figure out exactly what has happened recently by analysis of the evolution of conditions in the last 10-15 years doesnt really get you anywhere. Better to look first at the big picture of evidence for Atlantic warmth up north and – roughly – whether there is a typical return period. That Russian model seems to me to characterise that approach.
Alan
The ‘oscillation’ (blue line in the link) derived from the CET (the best data we have for any climatic event in the N. Atlantic) surprisingly show better correlation with the tectonic events than with the CET itself, which is the purpose of showing the graph.
On the other hand the CET and the Greenland’s ice core 10Be deposition rate (which is supposed to track past solar activity) are also closely correlated (second graph in link).
WUWT blog has come up with yet another surprise for the area: the globe’s highest annual CO2 concentration (if correct)
https://wattsupwiththat.files.wordpress.com/2015/10/oco2-1year-co2-globalmap.png?w=720&h=415
The N. Atlantic – Arctic natural temperature variability is far to complex to make a definite attribution.
Dr. Longhurst, hi again
I’ve just finished reading chapter 8.3, in which you mention 55 and 60-80 years periodicities as critical in the N. Atlantic – Arctic oscillations. That broadly confirms the case as shown in top graph. During summer months ~55 and ~68 years appear to be the dominant periodicities, while in the winter they are ~68 and ~89 years. The AMO’s 60ish yr is the resultant of the summer components when the N. Atlantic is building its heat content, but its SST 150 year long data is not sufficiently long for the FFT to resolve difference due to the periodicities close proximity, hence somewhat misleading ’60 year cycle’ narrative.
See also this figure on daily average sea ice thickness from PIOMAS
http://psc.apl.uw.edu/wordpress/wp-content/uploads/schweiger/ice_volume/Bpiomas_plot_daily_heff.2sst.png
Do you have any response to this comment from Neven?
http://judithcurry.com/2015/10/04/why-is-the-arctic-climate-and-ice-cover-so-variable/#comment-735012
Joshua:
Comment nesting didn’t work for me but while waiting for Dr Curry’s response you can refer to my mention of wind/weather driven ice in reply to NevenA here:
http://judithcurry.com/2015/10/04/why-is-the-arctic-climate-and-ice-cover-so-variable/#comment-735059
Whether or not Arctic ice extent/thickness declined in recent years is not really the issue. Nevertheless, what caused it to decline has both scientific and policy relevance. And if CO2 forcing is not the primary driver of ice decline, a rebound may occur despite continued growth in CO2 emissions.
Opluso –
Yes. I read your comment and it does seem to me that year-on-year comparisons, or comparisons for less that decadal periods, are not particularly meaningful. As near as I can tell, what is particularly meaningful is comparing the trend over the decades when we have increased ACO2 emissions significantly to previous decades. But then again, I don’t consider myself able to really judge what is or isn’t particularly meaningful.
But it does seem that if you’re going to point to short term trends, then you should account for the type of evidence that Neven referenced.
What I take away from Longhurst’s Chapter 8 when I first read it and now is: there are a lot of moving parts.
Two items: the first, the layered Ocean currents, fresh water on top, then the warmer but saltier layer and finally the deep bottom layer. Not as much vertical mixing. The Atlantic waters have to swirl over and past relatively fixed topographical features. Its like watching water swirl around a partially submerged rock on a beach shore.
The second item: Polar Amplification has been difficult for me to “see” with the concept: as the warmer global surface temperature becomes, the more evaporation and Polar snow will accumulate, more albedo, etc. In a warming environment, snow is wet and heavy. Wet heavy snow on warmer water surfaces sinks quickly or rapidly dissolves. (observations come from heating various snow types on a stove to make water for drinking and cooking). The other issue I didn’t “see” with Polar Amplification was that it seemed the two poles were behaving very differently, or so I have been told. In both cases, ocean currents seemed to govern what was happening in these regions and not the ambient surface temperatures.
At this point in my own edification, I will have to come back to Longhurst’s book again and re-read at least chapter 8.
I see no reference to the impact of cyclonic activity on Arctic sea ice export?
That did play a role in the recent record lows.
2012, not 2007. And weather did play a brief role in 2015. Very brief, given the early decline termination and very rapid recovery since.
Judith
If you want an answer to the question posed in your headline I suggest the northern sea route authority in Russia is a good place to start
It was set up in the early 1930s in response to the rapidly warming arctic and collected a great deal of data in order to be able to charge for transit permits
http://www.arctic-lio.com/nsr_ice
It assumed new importance during the war in order to provide weather and ice data for the vital atlantic convoys
.my next door neighbour served on several convoys and I understand that ice records and wind directions were regularly compiled by the Russians.
Tonyb
Interesting!
The Northern Sea Route website is still looking for a good format to publish statistics, making a detailed year-to-year comparison difficult. Here is the number of ships that took at least a part of the Route:
2011 – 41
2012 – 46
2013 – 71
2014 – 53
Tony, For reasons having to do with winds and currents, a better proxy for Arctic summer ice is Canada’s Northwest Passage, in my view. The transits are permitted and recorded by Canada since the time of Larsens 86 day transit in 1944. Something you may want to research in more detail than my casual observations in the NWP essay.
Hasn’t the latest Arctic research (e.g., Kobashi, et al., 2010; Rørvik, et al., 2009) shown that significant variability of high latitude temperatures on >100+ year timescales have been the natural course of events over the last 1,000 to 1,500 years, all without benefit of increasing or decreasing levels of atmospheric CO2? Given the geophysical record, a few decades of Arctic warming are not unusual.
Hasn’t the latest Arctic research (e.g., Kobashi, et al., 2010; Rørvik, et al., 2009)
It’ll be 2016 three months from now.
Since we are being trivial, it’s actually less than three months.
Variable
this seems the operative word to me
what are the boundaries large and small that would be considered good?
as tonyb has asked many times
which previous, presumably perfect, historical spot should we endeavor to return to
I think the alarmist position is weak without an answer to this question
… and they should be careful what they wish for
A good place to start in comprehending the high variability of temperatures and sea ice in the Arctic is the recognition that, at those latitudes, the available heat comes primarily from oceanic and atmospheric advection, rather than local thermalization of insolation. And the colder the environment, the less heat transfer it takes to change the temperature. That is the fundamental basis of “polar amplification.”
Of note:
NASA Sees Arctic Ocean Circulation Do an About-Face
http://www.jpl.nasa.gov/news/news.php?release=2007-131
“– A team of NASA and university scientists has detected an ongoing reversal in Arctic Ocean circulation triggered by atmospheric circulation changes that vary on decade-long time scales. The results suggest not all the large changes seen in Arctic climate in recent years are a result of long-term trends associated with global warming.
The team, led by James Morison of the University of Washington’s Polar Science Center Applied Physics Laboratory, Seattle, used data from an Earth-observing satellite and from deep-sea pressure gauges to monitor Arctic Ocean circulation from 2002 to 2006. They measured changes in the weight of columns of Arctic Ocean water, from the surface to the ocean bottom. That weight is influenced by factors such as the height of the ocean’s surface, and its salinity. A saltier ocean is heavier and circulates differently than one with less salt.”
[..]
” The freezing/melting point of pure water is 0C” Sorry if someone else has already raised this point, but when I lived in Alberta it was repeatedly inculcated that without a nucleating agent, pure water did not freeze until about -39C. Maybe this is only of biological importance (0C melting point is ok), but I think you need to be more precise.
The remnant ice off the Alaskan coast does seem to have provided a nucleus for refreezing and allowed a rapid recovery this year, at least as far as area is concerned:
http://www7320.nrlssc.navy.mil/hycomARC/navo/arcticictn_nowcast_anim30d.gif
Reblogged this on I Didn't Ask To Be a Blog.
I should perhaps have mentioned earlier that my arguments in the section under discussion rest heavily on observations made in the North Sea and the Nordic Seas that were discussed in Section 7.1 “Consequences of wind patterns over the North Atlantic”; It is surely relevant to ice conditions in the arctic that these shifts of characteristic ecosystems correspond rather well with periods of low ice cover in the arctic. It is fortunate that the shift of pelagic organisms is quantified during much of the 20th century in the continuous plankton recorder data maintained at Plymouth, and also in national fishery statistics maintained and analysed by ICES. Correlation can be carried back to the 19th century low ice periods in historical documentation.
Alan Longhurst
Dr Longhurst
Thank you for the book. Your biography is very impressive; the study of zooplankton is amazing. Never knew before that single cell animals that large exist, and have shells. And so important to the marine ecosystem. If it were 1959 again I would be tempted to join the study of marine biology.
Regards,
Richard
Pingback: Weekly Climate and Energy News Roundup #200 | Watts Up With That?
We are developing a new dataset of september arctic sea ice extent from 1935 to present day. We are incorporating AARI data into adjusted HadISST from 1953 onwards. From 1935 until 1952, we are using AARI data and filling the gaps with a climatology. This is the result:
http://images.meteociel.fr/im/5857/Imagen2_vlj2.png
And this is the map showing the lowest minimun of the pre-satellite era according to our results (1952, 6.49 mill. sq. km):
http://images.meteociel.fr/im/3296/Septiembre_1952_jqb3.tif.png
More news will come soon.
In addition, Walsh et al. are making progress, see their last presentation: http://www.star.nesdis.noaa.gov/star/documents/meetings/Ice2015/dayThree/1_Walsh_J_dayThree.pdf (preliminary result can be found at pages 17 and 18)
Why is the Arctic climate and ice cover so variable? I love that question!
Small temperature changes in ocean temperature can freeze or thaw the Arctic and the ice cover and climate changes a huge amount when the Arctic freezes and thaws.
The ice cover changes a huge amount with small changes in temperature. This is the thermostat for the Northern Hemisphere.
This thermostat turns powerful cooling, snowfall, on and off. This does keep temperature and sea level bounded.
“Why is the Arctic climate and ice cover so variable? I love that question!”
Dr. Curry answered that at one point.
The sea ice is a function of:
1. Temperature
2. The amount of ice flowing through the Fram Strait.
I suppose in theory that with the correct weather there could be virtually zero sea ice during the late summer of any given year. There would be some old ice on the Canadian coast and that is about it.
But God (and weather conditions) don’t clear out the Arctic very often.