
by Judith Curry
Seeking once again to clarify the problems in communicating the IPCC climate change attribution statements.
Context
The immediate motivation for this post is a tweet from Gavin Schmidt that he is #stillwaiting for a response to his critique of my 50-50 essay [link]. Well this post is a response to only one point that he raises (some of the rest of his points seem pretty incoherent to me), but it is an issue that has been used by Schmidt to discredit my arguments about attribution.
The main conclusion of the IPCC AR4 was:
“Most of the observed increase in global average temperatures since the mid-20th century is very likely due to the observed increase in anthropogenic greenhouse gas concentrations.”
In my Uncertainty Monster paper, I criticized the IPCC statement for the ambiguity of the word ‘most‘. Nowhere in the AR4 report is this clarified, but Hegerl et al., in their response to the uncertainty monster paper, state
The likelihood describes the assessed probability that ‘most’, i.e. more than 50%, of the warming is due to the increase in greenhouse gases. This statement has a clear meaning and an associated uncertainty, although explicitly listing ‘>50%’ in the text to ensure that no misunderstandings are possible could be helpful in future work.
Well, here is how the AR5 states it:
It is extremely likely that more than half of the observed increase in global average surface temperature from 1951 to 2010 was caused by the anthropogenic increase in greenhouse gas concentrations and other anthropogenic forcings together. The best estimate of the human induced contribution to warming is similar to the observed warming over this period.
Hmm . . . the AR5 didn’t use ‘>50%‘, but rather elected to use ‘more than half‘.
One problem with the IPCC’s attribution statement illustrated by this statement from a document Lost in Translation: Closing the Gap Between Climate Science and National Security Policy, published by the Center for a New American Security (which I also cited in the Uncertainty Monster paper):
“For the past 20 years, scientists have been content to ask simply whether most of the observed warming was caused by human activities. But is the percentage closer to 51 percent or to 99 percent? This question has not generated a great deal of discussion within the scientific community, perhaps because it is not critical to further progress in understanding the climate system. In the policy arena, however, this question is asked often and largely goes unanswered.”
This statement was written in response to the AR4 statement; the AR5 statement has arguably added some precision with its words The best estimate of the human induced contribution to warming is similar to the observed warming over this period.
Help from the dictionary
For reference:
Most: greatest in amount or degree; the majority of
Half: one of two equal or approximately parts of a divisible whole, as an object, or unit of measure or time; a part of a whole equal to the remainder.
Legal definition of more than half: majority
Majority: A majority is a subset of a set consisting of more than half of the set’s elements. This can be compared to a plurality, which is a subset larger than any other subset considered; i.e. a plurality is not necessarily a majority as the largest subset considered may consist of less than half the set’s elements.
I did not find a specific definition for ‘greater than 50%‘, so lets look at these definitions:
Percent: out of each hundred; per hundred; one part in a hundred.
Percentage: In mathematics, a percentage is a number or ratio expressed as a fraction of 100. Percentages are used to express how large or small one quantity is relative to another quantity. While percentage values are often between 0 and 100 there is no restriction and one may, for example, refer to 111% or −35%.
And while we’re at it, we need one more definition:
Predominant: present as the strongest or main element. Synonyms: main, most important, foremost, key, paramount
Gavin’s critique
I started my 50-50 essay with this:
Pick one:
a) Warming since 1950 is predominantly (more than 50%) caused by humans.
b) Warming since 1950 is predominantly caused by natural processes.
Gavin states in his critique:
Here Judith makes the same mistake that I commented on in my 2012 post – assuming that a statement about where the bulk of the pdf lies is a statement about where it’s mean is and that it must be cut off at some value (whether it is 99% or 100%). Neither of those things follow. I will gloss over the completely unnecessary confusion of the meaning of the word ‘most’ (again thoroughly discussed in 2012). I will also not get into policy implications since the question itself is purely a scientific one.
To understand the critique in Gavin’s 2nd paragraph above, it is instructive to look at John Nielsen-Gammon’s essay Your Logic Escapes Me, which is discussed further in my post The logic(?) of the IPCC’s attribution statement:
It can be a bit misleading to express this in terms of percentages. When most people see percentages, they imagine small positive numbers that collectively add up to 100%. However, different agents of climate change can have positive (example, increasing greenhouse gases) and negative (increasing aerosols) contributions. Pick a random time interval, and natural variability is just as likely to make a negative contribution as a positive one.
Curry’s assumption that the IPCC means ‘most’ in this context to cover a range of 51-95% is flat-out wrong. Here’s the full quote from the Summary for Policymakers: “It is extremely likely that more than half of the observed increase in global average surface temperature from 1951 to 2010 was caused by the anthropogenic increase in greenhouse gas concentrations and other anthropogenic forcings together. The best estimate of the human-induced contribution to warming is similar to the observed warming over this period.” They explicitly state that their best estimate for the human-induced contribution is about 100%, which is outside the range that Curry assumes they mean!
If you’re going to impute a range for them, at least have their most likely value somewhere near the midpoint of the range. For the sake of argument, a reasonable range would be 51-135%.
The figure that Gavin and JN-G refer to is:
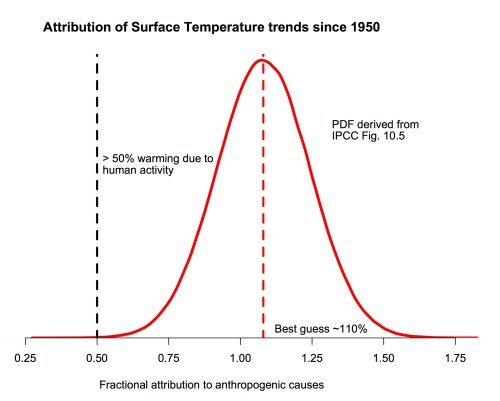
The probability density function for the fraction of warming attributable to human activity (derived from Fig. 10.5 in IPCC AR5). The bulk of the probability is far to the right of the “50%” line, and the peak is around 110%.
Semantics
Until this exchange, it never occurred to me that the IPCC’s attribution statement was attempting to convey AGW attribution that was possibly outside the range of 0 to 100% (and apparently it didn’t occur to the Center for a New Security, either). ‘Most’ used in the AR4 wouldn’t necessarily preclude an interpretation of AGW attribution that was greater than 100%, but it in the common understanding of the word ‘most’, most people would interpret this to be some number that did not exceed 100%.
However, the use of ‘more than half’ in the AR5 attribution statement, to infer the the possibility of AGW attribution that exceeded 100%, violates any conceivable understanding of the word ‘half’. If you are interpreting ‘percent’ as something between 0 and 100%, then ‘more than half’ is equivalent to ‘greater than 50%’. However, if you interpret ‘>50%’ to allow for numbers >100%, then ‘>50%’ is not equivalent to more than half.
So what did the IPCC intend by its statement ‘more than half’? If we take Gavin’s word for it, then the IPCC has attempted to communicate this with very poor semantics.
If the IPCC does really mean ‘more than half’, but limited not to exceed 100%, then it is appropriate to view anthropogenically forced climate change and natural climate change as two parts of a divisible whole. Therefore there is absolutely nothing wrong or illogical about my statement:
Pick one:
a) Warming since 1950 is predominantly (more than 50%) caused by humans.
b) Warming since 1950 is predominantly caused by natural processes.
Using ‘>50%’, as suggested by Hegerl et avoids the specific problems of using ‘more than half’, but again the common understanding of percentage is to expect the values to relate to a divisible whole of 100%.
The AR5 further states:
The best estimate of the human induced contribution to warming is similar to the observed warming over this period.
I would infer that the IPCC’s best estimate is that human induced contribution is close to 100% for the period since 1950, which effectively implies that low values of sensitivity and the ‘pause’ are irrelevant.
This issue of semantics, while it may seem arcane, is an important one, and illustrates the main source of my disagreement with J N-G on this issue (there are of course additional disagreements with Gavin).
Attribution
It seems that I need to take on the logic of ‘fingerprinting’ as a method for attribution. I note here that Science of Doom is beginning to address this very messy issue:
- Natural Variability and Chaos — Three — Attribution and Fingerprints
- Natural Variability and Chaos — Seven — Attribution and Fingerprints or Shadows?
The ‘magic’ of fingerprinting is described by Gavin:
Judith’s argument misstates how forcing fingerprints from GCMs are used in attribution studies.
No, I didn’t misstate this, I simply don’t buy the IPCC’s fingerprinting (I actually think the AR4 approach makes more sense than the AR5).
Notably, they are scaled to get the best fit to the observations (along with the other terms). If the models all had sensitivities of either 1ºC or 6ºC, the attribution to anthropogenic changes would be the same as long as the pattern of change was robust. What would change would be the scaling – less than one would imply a better fit with a lower sensitivity (or smaller forcing), and vice versa (see figure 10.4).
So . . . even a minuscule sensitivity to CO2 – say TCR = 0.1C, would not change the attribution argument. Hard to imagine such a small sensitivity would not change the size of the green and the orange bars in the figure below:
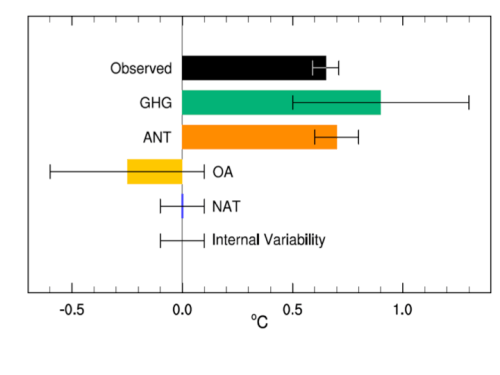 (From AR5, Fig 10.5)
Necessary (but not sufficient) for a credible fingerprinting attribution is to understand the fingerprints associated with natural internal variability on multidecadal and longer timescales, which is essentially ignored. In addition to sensitivity being irrelevant, the ‘pause’ since 1998 and the cooling period 1940-1975 seem irrelevant to the fingerprinting. A substantial contribution for multi-decadal and longer internal variability has been essentially defined out of existence (it appears the AR5 ‘forgot’ to do the detection step.)
Stay tuned for a future post ‘Muddy fingerprints.’ Not exactly sure when I will get to this tho.
Bottom line: the climate attribution problem needs to be reframed. Attempting to discredit my arguments over semantics reflects tilting at windmills, with the root cause being very unclear statements made by the IPCC in their main conclusion statement on attribution.

They get >100% because they argue that the anthropogenic warming effects have to overcome the aerosol cooling (and therefore give the same net warming as the total warming since 1950), though most people count aerosols as part of the anthropogenic effect, which causes the confusion.
When they define sensitivity or human contribution only with respect to their estimated forcings, it is implied that these are correct, but we know that the uncertainty with respect to clouds, aerosols, etc is large. This also dismisses any role for internal variability (PDO, AMO, etc) that might account for part of the warming of the 1980s-1990s, though they do trot these out to explain away the pause (ie, natural variability can only explain unknown cooling, not warming in this approach).
see: Loehle, C. 2014. A Minimal Model for Estimating Climate Sensitivity. Ecological Modelling 276:80-84
I can send a copy to anyone: craigloehl at aol dot com
Craig, used your paper in essay Sensitive Uncertainty. Fn 14. I recommend it to all CE denizens. More accessible than Lewis and Curry (which is more PDF and less point (mode) oriented), yet coming to similar conclusions. The essay takes on how GHG work (disspelling Sky dragon and saturation silliness), sensitvity above ‘grey earth’ SB as a function of feedbacks ( reducing them to the two most important, and treated elsewhere separately), and even the various notions of how cumulative sensitivity might be defined. Context.
“…they do trot these out to explain away the pause (ie, natural variability can only explain unknown cooling, not warming in this approach.”
—-
This is an oversimplification of what “they” actually do, with the presumption first of all that “they” are some monolithic bunch that adhere to a narrow range of techniques. There are mulltple approaches that try and filter out ENSO effects, PDO, IPO, volcanic, and even solar – taking both postive AND negative additions to forcings, to see what residual underlying long-term forcing from anthropogenic sources might remain. What we get is a net GH warming of the GST of somewhere around .15 C per decade over the 20th century, and therefore the high probability that (after the filtering) the majority of this is indeed anthropogenic. But given the continued rate of increase in GH gases, there remains the distinct possibility that this simplistic linear rise will acually curve uoward to a higher rate during the decades of the 21st century.
Ahh Mr Gates, the man who has no logical thoughts of his own. The man who thinks climate sensitivity to increased forcing is on the high side.
So just thinking logically. The IPCC said for a long time that the median increase in global temperatures would likeley be 3.25c for a doubling of CO2. Let’s use that, you can use a ‘higher’ figure if you like. So CO2 has increased from 280 to 400. That means, due to the logarithmic effect of increasing CO2 that we should be about half way towards the 3.25c increase. Let’s call it 1.5c.
The warmists reckon that a natural cooling effect is preventing the full increase from showing. So you reckon that without mans ‘interference’ ‘natural’ temperatures would currently be about 1.5c cooler than now.
Now that would put us cooler than the little ice age. Not only that, this ‘pause’ is actually an ongoing natural cooling trend in your warmist brain. Not only that, this ‘natural’ cooling trend seems to be increasing as the measured warming trend decreases.
So brainbox is that what you truly believe? Should the Earth currently be cooler than the little ice age and is it currently locked into an increasing cooling trend? Would that be a good thing? Has man actually rescued himself and other species from a cold disaster because make no mistake, life does worse in cold rather than warm?
The more the measured warming trend drifts away from the alarmists view the larger the apparent natural cooling trend must be.
Its just the logical extension of your beliefs, so presumably you will be happy to confirm.
Alan
Alan M.,
Your reckoning is a bit off, by about 100%. Let me do the math for you. We are probably about .8C warmer then we’d be without anthropogenic forcing. We’ll just round your 1.5C to an even 1.6C and call it good. So your figure is 200% of the actual, thus, you are 100% off. But we’ve, not seen the full troposheric effect of even 400 ppm yet, so your attempts to project linearly, or even logarithmically are way off. 3C or slighly higher is a solid number for ECS with CO2 going to 560ppm.
RGates,
“your attempts to project linearly, or even logarithmically are way off”
Has anyone attempted to determine where in the CO2 logarithm we actually are? It seems to me that climate sensitivity, whatever it is, would not just depend on starting conditions, feedings and forcings. It would also seem to make a great deal of difference where on the logarithmic graph we find ourselves. At the beginning, ECS would be substantially more…substantial than at the end. N’est-ce pas?
What the hell are you talking about? You don’t make an ounce of sense.
It is perfectly simple. Simple enough even for your brain to take in surely.
The IPCC and you, have stated that the expected median increase from doubling CO2 would be 3.25c .We are about half way there, so according to you we ALREADY have increased temperatures by about 1.6c. ACTUAL temperatures are influenced by the underlying ‘natural trend overlaying that apparent inescapable increase.
Therefore according to you and your IPCC chums, current temperatures would be 1.6c cooler that today’s measured temperatures if Man had not emitted any CO2 at all. Don’t have to be Einstein to figure that out now do we?
That would be cooler than the Little Ice Age and as the measured warming trend decreases you must believe that this long term cooling trend is getting worse. i.e.when CO2 reaches 560ppm you must believe that, whatever the actual temperature is at that time, it is 3.25c higher than it otherwise would be naturally.
So answer the question do you believe the Earth should naturally be currently colder than the LIA and cooling further as we speak?
Alan.
He has a dilemma here which he might just as well stride through. We are doing small good with temperature and a large good with greening from Anthropogenic CO2.
====================
I answered your question Mr. Millar. We’d be roughly 0.8C cooler right now without the extra anthro GH kick. We’ve not even yet seen the full effect of 400 ppm CO2, not to mention the other rapidly increasing GH gases. Your pseudoscintific attempt to project linearly seems to be at least one source of your confusion.
Humans might indeed unwittingly forstall the next glacial advance, but whether civilization will be around to enjoy the new Miocene-like warmth remains a very open question.
Here you go again Gates” you must be suffering from cognitive dissonance.
Do you believe that when we reach 560ppm CO2 the Earth’s temperature will be 3.25c (or whatever climate sensitivity figure you want to use) higher than it would otherwise be?
If not how long will it take to see that figure, a year, ten years, a hundred years, a thousand years? What literature are you relying on that has established such a delay in Earth’s response to increased radiative forcings?
Are you relying on the complete bollocks put around that it is the oceans taking up all this increased energy and that they are just storing it away justready to release it at just the right moment in the future to suddenly validate the IPCC and the GCMs projections?
The IPCC and the models did not say we were not going to see immediate and strong warning.
They said we would see immediate and ongoing sharp rises in temperatures and produced projections to show that, based on the output of the Global Climate Models. These projections are way out.
They didn’t show some sort of moderate warming followed by huge pulses of energy emerging from the oceans in 50 or 100 or a 1000 years to rapidly warm the planet to reach their alleged warming figures.
They didn’t do that because they would have been laughed out of town as that would breach the Laws of Thermodynamics.
If it was true that a big proportion of the energy is going into the oceans to be distributed amongst its huge volume rather than being reflected or radiated or convected immediately then there is no problem. The distributed energy can only reemerge in a diffuse pattern and would take hundreds or thousands of years to fully reemerge. Just the laws of physics that’s all!
Perhaps you need to do some thinking of your own.
Alan
“Do you believe that when we reach 560ppm CO2 the Earth’s temperature will be 3.25c (or whatever climate sensitivity figure you want to use) higher than it would otherwise be?”
______
Around 3C is a good estimate for what the ECS is– meaning that if CO2 reached 560 ppm AND stopped, that within a period of time (maybe decades) the average global surface temperature would be about 3C higher than CO2 at 280 ppm (the Holocene average). We also have to account for the very slow response of the ice sheets and the biosphere to higher temperatures, and this Earth System Sensitivity (ESS) can take quite a bit longer than getting to ECS– maybe up to centuries or longer. Thus, even if somehow CO2 stopped right around 560 ppm, and ECS stabilized over a few decades at around 3C higher than pre-industrial, temperatures could slowly (over centuries) drift a bit higher until ESS temperature was reached, which could be even 4C or higher. Our best guide here is probably the paleoclimate data, which tends to indicate we’re headed for mid-Pliocene to Miocene-like conditions as we go toward 560 ppm, which again, are about 3C or higher than pre-industrial temperatures.
Here you go again!
Have you some difficulty in reading and comprehension?
Where are you getting this huge delay in the Earth’s response to increased radiative forcing from?
It is not from the IPCC and the GCMs, the very bodies that you have said you trust with their projections.
They don’t say this, full stop!
Have you erased their graphs and curves from your memory as some sort of psychological protection? Or are you now agreeing that they are indeed wrong with their projections?
Perhaps again you would like to point to the literature that has established the timeline of Earth’s response to increased forcing.
Or alternatively publish your own theory,backed up by some sort of observational and proven evidence of course.
Where is this huge reservoir that is holding all this excess energy back from the troposphere but can still deliver it subsequently in just a matter of a few years.
Is there a tiny, unimaginably hot, part of the planet just waiting to explode in a big bang?
Or is it something huge like the oceans where distributed energy would take millenia to fully reemerge due to the Laws of Thermodynamics, you know entropy and all that!
Alan
“Where are you getting this huge delay in the Earth’s response to increased radiative forcing from?”
_____
There is huge thermal inertia in both the oceans and cryosphere. The ice sheets can take centuries to fully respond to changes in CO2.
“Where is this huge reservoir that is holding all this excess energy back from the troposphere but can still deliver it subsequently in just a matter of a few years.”
_____
You’d do well to understand what these charts are telling you:
http://www.nature.com/nclimate/journal/v4/n3/images_article/nclimate2106-f1.jpg
These natural variations in heat flux in and out of the ocean can be multi-decadal in scope. What we are seeing is up and down fluctuations in how much energy the oceans are releasing back to the atmosphere based on the IPO, but the long-term trend is higher tropospheric temperatures.
There is also a chance that the rate of increase over multi-decade periods will decrease i.e., “slow down” reflecting logarithmic characteristics rather than accelerate or continue monotonically. There are scientific reasons for the greenhouse effect to have this pattern.
Oh God it is the Oceans after all!
Don’t you know that the only reaction with the troposphere is at the oceans surface, The oceans are stratified. Very little interaction with the thermocline from deeper layers and even that would be undetectable.
There are huge changes in the thermocline dependent on season. It gains and loses energy very quickly.
E.g. at Kings Point NY sea surface temperatures are 60F in October, 37F in January and back up to 49F by April.
Do you think a fraction of a degree change in the temperature of the deeper oceans (if that is what has happened and it is far from proven) is going to have any effect on the thermocline’s affect on the troposphere?
Why don’t you do some logical thinking of your own instead of being a know nothing useful idiot for others who are mainly in it for their own self interest, which is the usual human condition if you haven’t noticed.
Maggie
It seems Gates is arguing natural variability is 50% at the start of this thread.
http://blogs.scientificamerican.com/observations/files/2014/01/3-radiative-forcings-ipcc.jpg
The only way to arrive at their number is to treat solar as a constant.
They (as I read AR5) do mean the GHG forcing was 110% and that there was a 10% negative forcing from the sum of all other feedbacks.
“If CO2 causes 1 unit of warming and feed back from CO2 is -1 unit of warming for a net of zero units of warming, can it still be claimed that CO2 causes warming?”
—–
If that dynamic existed, then CO2 would cause zero warming. Fortunately, that dynamic is physically impossible, else the planet would look like this:
http://images.spaceref.com/news/oosnowball.earth.2.jpg
RGates,
The planet has NEVER looked like that because H2O is in the air. And on the surface. It simply doesn’t need that runt tagalong dioxide.
“RGates,
The planet has NEVER looked like that because H2O is in the air. And on the surface. It simply doesn’t need that runt tagalong dioxide.”
—–
Your ignorance is your undoing. You will need to study quite a bit more if you want to carry on an intelligent and knowledgable dialog on this topic. Without noncondensing GH gases, especially CO2, the Earth would look like this is fairly short order.
R. Gates:
You write
“If that dynamic existed, then CO2 would cause zero warming. Fortunately, that dynamic is physically impossible, else the planet would look like this: [picture of iceball]”
Earth with no greenhouse gasses would have a equivalent emitting temperature commonly given as -18 C, well below the freezing temperature of water. However, at the equator the geometry is such that a square meter of surface exposed to sunlight would radiate from two square meters when the area on the night side of the equatorial hoop that contains the illuminated meter is considered. This is instead of the disk-to sphere ratio of 4 which is used in the -18 C calculation. In the no-greenhouse atmosphere there would be no convection or advection (isothermal atmosphere). When this difference in equator-to-whole sphere geometry is taken in to account, the surface temperature at the equator becomes 30 C, the same equatorial temperature we see today. This condition would generate plenty of water vapor to provide a local greenhouse effect which would quickly spread to encompass the entire earth and produce a climate similar to today. It simply impossible to have the entire surface of the earth covered with ice with solar radiation at today’s levels, even starting with an iceball with no CO2. Time to get rid of this unfounded claim.
“It simply impossible to have the entire surface of the earth covered with ice with solar radiation at today’s levels, even starting with an iceball with no CO2. Time to get rid of this unfounded claim.”
—–
Even during the deep freeze the Earth went through around 700 million years ago there were likely open pockets of water near the equator– so no one is suggesting a complete solid freeze. But you seem to fail to understand the basic dynamics of condensing and noncondensing GH gases, and how once ice begins to advance and the atmosphere begins to dry, it becomes quite a difficult thing to turn around. The last time it lasted well over a hundred million years. The colder it gets the more moisture is condensed and then the less moisture the atmosphere can hold. Albedo increases steadily, more solar is reflected, glaciers at all latitudes advance rapidly and you’re off to the races toward ice planet Earth. Noncondensing GH gases like CO2 are critical to holding the temperatures high enough to prevent this.
If CO2 causes 1 unit of warming and feed back from CO2 is -1 unit of warming for a net of zero units of warming, can it still be claimed that CO2 causes warming?
The answer, of course, is yes it is which means it can be claimed that CO2 causes warming even though there is no warming.
Let me go out on a limb here and take a grave risk of makin’ a complete fool of myself.
So, like, after much head-scratching, I think I’ve finally gotten Dr. Schmidt’s point (kinda, sorta, maybe). And I more or less see it in these terms:
-So say Dr. Schmidt is drivin’ through some known, local-yokel hick-town with a known, 25-mph speed trap which is “strictly enforced” (unless you’re a local). And further say, then, that Dr. Schmidt is very carefully keepin’ his speed well under 25 mph, when, suddenly the red-lights and siren go off and a beefy-but-carryin’-a-few-extra-pounds, local gendarme pulls Dr. Schmidt over.
-So then say that Dr. Schmidt objects to the pull-over, when told he was doing 65-mph in a 25-mph zone, “I was carefully watching my speedometer and I never once exceeded–nay! even came close to– 25-mph.” At which point, the somewhat pot-bellied, friendly-to-a-point, not-so-dumb-as-he-looks, Barney-Fife-gone-to-seed representative of local law-enforcement gets a sly grin on his face as he prepares to collect the scalp of another city-slicker.
-“Sorry, ol’ buddy, but you were doin’ 65 mph, I clocked you earlier up the road there at that speed”, says Deputy Dawg. “But that was a 65 mph zone!!!”, replies an astounded Dr. Schmidt. “Ah yes!”, confirms our speed-trap master-trapper, “but you see, umm…Mr. Schmidt–oh wait!, I mean DOCTOR!!! Schmidt (you probably think you’re a whole lot smarter than us country folk, don’t you Dr….uh…what’s your name again? Oh yeah! Schmidt?)–that when you took your foot off the accelerator at 65-mph, Newton’s First Law of Motion tells us your basic speed thereafter continues at 65-mph for all eternity. And that you may have applied brakes and other good stuff, like that, to actually slow your car is neither here or there, since your fundamental speed–referring, again, to that Newton-guy business–remains 65-mph–and this is a 25-mph zone. Sorry, guy, 65 in a 25!”
-A shaken Dr. Schmidt, “By golly, you’re right!!! I’ll pay the ticket.”
So have I understood Dr. Schmidt’s attribution logic or not in the homespun terms I’ve used to explain it to myself? Anybody? I hope I got it right.
“So, like, after much head-scratching, I think I’ve finally gotten Dr. Schmidt’s point (kinda, sorta, maybe). And I more or less see it in these terms:”
Yes, that seems like a correct understanding. I’m considering a blog post on this if I can find the time, and I might quote you.
@ Dagfinn,
Thank you for the response–and please do use my comment as you see fit.
The inescapable conclusion is that the IPCC purposely used words instead of numbers because they are not sure of the actual numbers. If they are later shown to be wrong they can argue that their words were incorrectly interpreted. As has been demonstrated by Gavin.
As such, the IPCC conclusion is without scientific merit, because it is not precise. It is open to interpretation, to mean whatever the reader chooses it to mean.
“When I use a word,’ Humpty Dumpty said in rather a scornful tone, ‘it means just what I choose it to mean — neither more nor less.’
Hi Ferd
They have a bad record when they use numbers to sound sciency, they are not very good at it. Some rotten statistician pops up and points out their errors. They are reduced to ” more than …….high confidence ……lots and lots..”
So like the hard-working athlete, they’re putting in 110% effort. Now I get it. Numbers only mean what you want them to mean, not what they say.
Is Gavin Schmidt as smug and arrogant in person as he appears to be in all of his written and spoken communications that I have seen or read? He seems more like a salesman than a scientist.
“He seems more like a salesman than a scientist.”
Or – more likely – a politician.
If he is “Gavin” occasionally commenting on this blog, he has earned my respect.
“If he is “Gavin” occasionally commenting on this blog, he has earned my respect.”
He lost mine long ago for several reasons:
1) he “moderated” a comment I left at RC to make me look foolish
2) he lied about the “mystery man” thing to all and sundry
3) “it depends on the meaning of “if” ” seems to be how he operates
Sorry, I have no time for people who resort to such underhanded tactics to try and create a “win” for their “side” – most especially someone who claims to be a scientist.
> Is Gavin Schmidt as smug and arrogant in person as he appears to be in all of his written and spoken communications that I have seen or read?
Besides, is Gavin honest?
No in person he seemed very nice, charming and polite.
I would say I spent over 3 years berating him on blogs.. so if he were like most people he would not have walked up to say hi and actually offer some advice. And it was good advice about a technical issue.
Hmm.
most folks are better in person. my experience
Mosher, “most folks are better in person. my experience”
Were you looking in a mirror when you said that?
Bob.
no. hence the word “most”
I suspect you are brighter in person. nobody could be as dumb as your comment
Love that Gavin’s so anxious to hear from you Judith. Anything to take the focus off the triumphant 2014 warmest year in recorded history claim. When asked if he regretted they left out of the press release that there was only a 38 percent chance this was actually correct, he decided not to answer. Smart fellow.
“Smart fellow.”
?
No child incriminates themself.
If the error margin is +/-5%, Then 51% could be both more than or lees than half, or 50% or whatever.
So Judith was wrong to ask “pick one”. She should have asked “pick none, one or both”.
However, the use of ‘more than half’ in the AR5 attribution statement, to infer the the possibility of AGW attribution that exceeded 100%, violates any conceivable understanding of the word ‘half’.
No. If I pour 1.5 gallons of water into a bucket I have poured more than half a gallon of water into the bucket. There is no semantic problem here. If anything, the substitution of “more than half” for “most” removes the ambiguity.
the ambiguity comes from using words with imprecise definitions in place of numbers. politicians use words to obscure. science uses numbers to reveal.
your meaning is precise because you used actual numbers. (1.5 gallons, half a gallon = 0.5 gallon).
Josiah
and if it is a 1 gallon bucket?
ghl,
If you pour 1.5 gallons into a 1 gallon bucket, then you’ve still poured more than half a gallon into the bucket. Is that not obvious?
I simply don’t see the point of this semantic quibble. Seems like the IPCC is being pretty clear. Disagree with them if you like, but don’t spend time on arguing what “more than half” means.
The semantic quibble has been used to attempt to discredit my arguments regarding problems with IPCC’s attribution arguments. I will make that clear in the main post
There is the dancing on the head of a pin aspect of the semantics. The real questions are what possible basis is there for the contention that human CO2 is responsible for 110%? The “Halt” (pause no mas) shows that “natural” cooling coupled with random aerosol etc. negative feedback at least equals human PLUS warming derived (increased respiration, ocean outgassing) CO2. That would be another 110%. How many per cents are we allowed in this game?
if AGW is 110% of observed warming, and natural variability is -10% of observed warming, for a total of 100% of observed warming, what happens when observed warming falls to a statistical zero as it is now?
does AGW become 0% of observed warming, or does it become an infinite % of observed warming? does natural variability become -0% of observed warming, or does it become negative infinity %?
If AGW is 0% of recently observed warming, there is obviously no problem. If natural variability is infinite, there is nothing we can do about it. It would make efforts to control climate futile.
what percentage of the statistically zero observed warming is due to AGW?
0%? 100%? 1000%? 10000000%?
All answers are right, so they must all be wrong. Otherwise 0=100=1000=1000000.
The semantic problem I think lies in the difference between 1) AGW is half of the observed warming and 2) The number representing AGW half the the number representing the observed warming. Or: 1) half of and 2) half as large as. Being half of a physical phenomenon versus being half as large as a physical phenomenon.
And the two sentences in the AR5 statement are different in this respect.
They speak like the oracle of Delphi – their formulations are intentionally vague. If you don’t know something you try not to be too definite in your statements. What they convey is not science but feelings.
The correct statement would be: “we have not the faintest idea about how much warming is natural vs anthropogenic”.
Spot on, Jacob!
And astrology has just become a climate science discipline.
NASA climate scientists say 2014 was warmest year
on record by approximately 2 hundredths of a degree.
Gavin Schmidt admits there’s a 38% margin of error.
Mathematically, does this mean there’s a 62%
probability that it ain’t? A serf wonders.
http://www.dailymail.co.uk/news/article-2915061/Nasa-climate-scientists-said-2014-warmest-year-record-38-sure-right.html?ito=social-twitter_mailonline
Dear Beth, I think it means there’s a 99 percent chance that NASA scientists aren’t really scientists at all. Or not the kind we Amercans can be proud of anyway.
“Mathematically, does this mean there’s a 62%
probability that it ain’t?”
Who can say? If they are using IPCC terms, then they could say “more unlikely than likely” instead.
It seems that “62% probability that it ain’t?”
pretty much sums up all this global warming ideology.
In addition it’s reflected in poll numbers:
“Twenty-eight U.S. senators held an all-night “talkathon” Monday to call attention to climate change, an issue that only 24% of Americans say they worry about a great deal. ”
http://www.gallup.com/poll/167843/climate-change-not-top-worry.aspx
It is no longer a climate change; it is warming again. Get ready for the next paradigm shift.
I find the interpretation of Muller as a converted skeptic is hardly creditable, even though he likes to play it up. His skepticism seem more generic than denialist, centering more around the problems of temperature measurements. From a “Wired” interview in 2008, in which he discussed the three biggest problems facing a president from a Physicists point of view
http://www.wired.com/2008/11/physics-the-nex/
“Global warming. There is a consensus that global warming is real. There has not been much so far, but it’s going to get much, much worse. ”
Moreover, he and his daughter founded a consulting firm in 2010, well before his published work on temperature measurement at Berkley. His consulting firm promoted its “Green Gov” service specifically mentioning Climate Change. https://web.archive.org/web/20100627144243/http://www.mullerandassociates.com/greengov.php
So, not so much a disinterested observer.
I read Muller’s paper on trying to fit the Milankovitch cycles and even a new one he figured out of procession of eccentricity of Earth’s orbit. Nothing matched in phase. Eccentricity matches in interval size to the glacial cycles of the last 400 ka but not in correct timing. Also the warming increase is so minuscule from eccentricity change that it would not have been even a hypothesis if the 100 ka interval was not such a good match. Most warming scientists still believe, as they were taught, that the Milankovitch cycles are responsible for the ice ages. This way they do not have to explain a big unknown. Muller seems to have forgotten all about the problem he spent years trying to solve. Well, I guess he is trying to not rock the boat by being willing to play down the fossil record of 20 degree plus F swings in global temp, going against the CO2, level, warming while CO2 levels were low and cooling while CO2 levels were high, are still caused by unknown forces.
Judith, doesn’t Richard Muller’s plain statement (earlier this month) I Was wrong on Climate Change confront pretty much the same issues as your essay …
https://www.youtube.com/watch?v=Sme8WQ4Wb5w
… and reach conclusions far more directly and plainly?
Good on `yah for plain-speaking citizen-science, Richard Muller!
I like his very last comment to the so-called “skeptics”…
“Are you serious?”
Nice interview!
Sounds to me like he’d say the same thing about volcanoes causing the LIA.
CO2 had a better match than US population? Maybe, but it isn’t obvious. Too bad he didn’t show his work.
http://www.census-charts.com/Population/images/pop-us-1790-2000-stacked.png
Of course the growth of CO2 and the other GH gases of methane and N2O are ultimately and intimately connected to US population growth. They have very similar growth paths for good reason, though now China and India are taking the role. Most of those reading this blog owe their existence to, and indeed, even the existence of this blog is thanks in large part to the Age of Fossil Fuels.
Don’t tell me, Gates. I assumed as much which is why I immediately went after that comment from the interview.
Yep, serious. Richard compiled a mass of data for land only that pretty much confirmed what everyone already knew. And then has some weird epiphany like this mass of unsurprising data somehow changed something.
A massive number of thermometer measurements near the land surface record an increase in temperature.
Warm air rises, yet four satellite groups measuring TLT average to no warming at all for a human generation.
Mmmm…
I believe the satellite data over the surface temperature measurements. It has much better coverage than the land/ocean measurements. As altitude increases, the trends become less and less until at a certain height the trend is flat. Above that the trend reverses.
But below that level, the direction of the trend is the same as on the surface, just a bit attenuated.
So, the satellite appears to faithfully reproduce the direction of the trend. It’s difficult to reconcile the sat data with any of the surface data sets.
Can’t wait to see what Spencer et al are going to come out with. Spencer mentioned the new methods are much better than the last ones.
Question – what sensitivity does Muller find in his CO2 perfect match?
Oops sorry for misplacement.
I find the interpretation of Muller as a converted skeptic is hardly creditable, even though he likes to play it up. His skepticism seem more generic than denialist, centering more around the problems of temperature measurements. From a “Wired” interview in 2008, in which he discussed the three biggest problems facing a president from a Physicists point of view
http://www.wired.com/2008/11/physics-the-nex/
“Global warming. There is a consensus that global warming is real. There has not been much so far, but it’s going to get much, much worse. ”
Moreover, he and his daughter founded a consulting firm in 2010, well before his published work on temperature measurement at Berkley. His consulting firm promoted its “Green Gov” service specifically mentioning Climate Change. https://web.archive.org/web/20100627144243/http://www.mullerandassociates.com/greengov.php
So, not so much a disinterested observer.
My first meeting with him. total skeptic on the temperature record.
Some issues he raised ( sampling bias) were things I had already shown were not a problem. I pushed him really hard, but he wasnt having it.
UHI. I pushed him really hard on that. he wouldnt budge.
when the charts started to come out he was somewhat shocked.
On our attribution argument. he was likewise stunned at the result.
on Mann. he thinks the HS is bogus.
on GCMs. he dont like them at all.
he is more complicated than your simple boxes
I have no boxes and his work stands or falls by itself. Just find the meme that, so many want to push, that he was some kind of total skeptic who was drug kicking and screaming by observatory evidence into the light. He does present as an independent thinker whose unwillingness to swallow the whole ideological package has seemingly moved him to the periphery of the lime light.
It’s good to know climate grandees at least appreciate good radio entertainment. http://www.cartalk.com/content/benefits-having-three-halves
Extremely likely more than half has a very simple meaning that 95% of the area of the bell curve is right of the 50% line in that figure. There would be a part of the tail to the left.
That’s what I would say, but it is not what the IPCC meant. Or Gavin, for that matter.
So, the temperature could go down for a couple of decades and man could still be responsible for the majority of warming. Interesting.
Seems to be the case. Like I said, ‘magical’
The exiting part would be to find a time period when the forces in the denominator cancel to zero and then man can be responsible for an infinite percentage of warming.
Nobody else that I can think of talks like this. If I exercise so I should lose ten pounds, but eat more so I only lose a net of 2 pounds then my great exercise program accounted for 2000% of my weight loss.
Isn’t that 500%? But I get your point – and the error can be attributed to no one does this and when they do it makes no sense and therefore make errors.
Thanks, 500% is correct. I need to eat more for my exercise To account 2000%. Off for a burger, fries and thick shake.
Ahaa, jim2!
That is it….as each man woman and child emits heat, the warming can only be attributed to us, whereas all cooling is attributed to nature.
Let me see, there could be a grant in here.
Much like linking extreme weather to AGW. They know there always has been extreme weather and there always be. But it gives them proof every year of AGW. “See the extreme weather? Just like we predicted.”
Not a bad PR strategy, actually.
“So, the temperature could go down for a couple of decades and man could still be responsible for the majority of warming. Interesting.”
—-
You really need to try and be less simplistic in your understanding of a net-forcings approach to climate. Suppose a combination of natural variabillty and natural external forcings over a period would have led to a 0.6C drop in GST without an increase in GH forcing, but imagine that the actual GST over that period only dropped 0.1C. You could say that GH additions caused 0.5C of warming, even if GST dropped.
I think I nailed it actually.
” You could say that GH additions caused 0.5C of warming, even if GST dropped.”
You could, but it would be pure speculation.
You could equally say that human CO2, at most 3% of the atmospheric IR resonating gasses, is simply insignificant. This latter statement would actually be based on measurement.
You have an air conditioner on one side of the room and a heater on the other. If both are set on 1, then the temperature stabilizes at 70F. If you crank up the aircon to 2, the temp goes down to 60. Did the heater stop heating?
You crank up the heater to 2.5 and the temp goes to 80. Is the heater responsible for 10, or 20 degrees of warming? Or what?
Don – no question such processes can happen. Isn’t the issue how to describe such? The heater is pumping out BTU’s. It makes sense to speak of that (in this example the heaters BTU output is constant until you crank it to 2.5. It probably has a constant BTU delta between setting 2 and 2.5). You can study and plot a range of temperatures that result from various combinations of heater and AC settings. Someone can correct me if I’m wrong, but I suspect that the delta between 2 and 2.5 for the heater is not constant as the settings vary on the AC. So it’s kind of flaky to speak of the settings as providing a specific temperature delta. It gets even sketchier when you switch the language to include percentage changes as their are interactions between multiple factors. They key point is that this is not meaningful, precise or appropriate language for science.
The delta is not constant for temperature change as the AC setting varies. It is constant for BTU output.
What I am suggesting leads to this:
Some clever climate scientist’s theory says: If you crank up the heat from 1 to 2, it should get warmer, all other things being equal. SWAG based on theory says it should get 20F warmer. If the clever climate scientist turns the heater up from 1 to 2 and it only gets 10F warmer, then he just has to suspect and consequently is compelled to assume that somebody has cranked up the air conditioner, or opened a window. So, cranking up the heater from 1 to 2 caused 20F of warming that was offset by 10F of cooling. In his mind heater caused 20F of warming, and when things go back to normal the missing 10F will show up. I say he could be right, but I wouldn’t bet my own money on it.
Don, I get it. Just like we can never say the heater stopped working (or never worked) based on temperature measures alone – we can’t say that human induced GH warming has stopped because of temperature signatures alone either. There will always be a potential source of cooling or a heat sink to support whatever heat output your theory suggests.
The question I guess is how plausible are they and in the absence of strong evidence either way “do you believe in a combination heater and heat sink, or dismiss them both?”
PE, I would say that their story is plausible, because we are not talking about very much warming. There is no strong evidence, either way. That’s the argument against them. They could be right, but they have to show us. We are not gonna to take their word for it. Remember Climategate!
And remember this:
http://www.npr.org/2007/03/22/9082151/global-warming-is-not-a-crisis
Gavin got his clock cleaned. No debating with skeptics, since then.
The actual evidence is during the timespan the room set a record for record warmth, and then it cooled. The room again set a record for record warmth, and then it cooled to a record warmest cold ever. Then the room set yet another record for warmth.
There was a climate scientist who said the last record was about to happen.
If you have ever had kids, you probably know what happened. Kid variability. Sometimes they remember to close the door; sometimes they don’t.
You missed this part, whatever your name is:
“we are not talking about very much warming”
And what we are looking for is strong evidence. Not confirmation bias evidence.
Since Jim Cripwell and Manaker can’t comment I’ll hoist their banner:
Since NO ONE claims to be able to predict the variations in climate over ANY period, absent any anthropogenic contribution, attributing ANY subset of the observed variations in the ‘Temperature of the Earth (never rigorously and consistently defined)’ to anthropogenic influence amounts to nothing more than ex cathedra pronouncements by Climate Experts.
That said, postulating that greater than 100% of the observed warming (if any, given the multiple adjustments to the ‘official temperature records’) was driven anthropogenically makes perfectly good sense. After all, absent anthropogenic contributions we may well have been experiencing dramatic natural cooling. As Kim has often reminded us, the higher the sensitivity to CO2, the colder the climate we would now be experiencing without the fortuitous warming provided by ACO2.
Suummer time, and the livin’ is easy – peasy,
Fish are jumpin’ and the GM crops are high.
Your daddy’s rich, and your mom is good lookin’, hush climate skeptics, don’t ya cry.
RiHoO8, skeptics cry? We’re too tuff.)
Beththeserf
And kind hearted too.
Answer # 3: all of the above.
one of my favorite kims…
“adapting to warmer world piece of cake
colder world brings the four horsemen” **
so true
without “unnatural” human activity the world be growing colder
which poor creatures and ecosystems would be threatened then?
it is a curious thing to imagine the world without us
anybody watch “It’s a Wonderful Life” lately?
**(kim, forgive if I didn’t quote exactly right)
wow…
I went into mod for that?
—Since Jim Cripwell and Manaker can’t comment I’ll hoist their banner:
Since NO ONE claims to be able to predict the variations in climate over ANY period, absent any anthropogenic contribution, attributing ANY subset of the observed variations in the ‘Temperature of the Earth (never rigorously and consistently defined)’ to anthropogenic influence amounts to nothing more than ex cathedra pronouncements by Climate Experts. —
It seems number have claimed it will cool a bit in next decade or two:
http://www.globalresearch.ca/global-cooling-is-here/10783
“Figure 5.Global temperature projection for the coming century, based on warming/cooling cycles of the past several centuries. ‘A’ projection based on assuming next cool phase will be similar to the 1945-1977 cool phase. ‘B’ projection based on assuming next cool phase will be similar to the 1880-1915 cool phase. The predicted warm cycle from 2030 to 2060 is based on projection of the 1977 to 1998 warm phase and the cooling phase from 2060 to 2090 is based on projection of the 1945 to 1977 cool cycle.”
That’s 2 November 2008
And it looks like “B” is wrong though “A” could be close to being right. Or it seems to predict we already be seeing some cooling trend already and we aren’t seeing it now, but it seems possible to me that within couple years see something which be the start slight cooling. Or probably take 10 years before it’s long enough time to call it a cooling trend.
So it will be the ’70’s all over again.
Or by time it’s sunk in that it’s cooling and everyone’s talking the doom of coming Ice age, it will turn around and start warming again. With the usual idiots citing AL Gore as some kind of expert/prophet.
Wrong
Bob, you wrote:
Since NO ONE claims to be able to predict the variations in climate over ANY period
The consensus people do claim to be able to predict. They have not been successful.
I do claim to be able to predict. Just take the climate cycle of the past ten thousand years and project that forward. We are well inside the bounds of that prediction.
I’ll see your ten and raise you twenty. That’ll freeze betting.
=================
@ popesclimatetheory
Well, your ‘Climate Theory’ does have two notable features:
A. It is consistently ‘blown off’ (ignored) by the Climate Scientists.
B. It, unlike the outputs of the various official ‘Climate Models’ (which just do VERY rapidly what they are told to do–show that the planet will be doomed by ACO2 absent political control over all energy production and consumption), appears to hindcast historical data AND makes predictions which so far match observations reasonably well.
I must say I found this difficult to follow (as well as the Real Climate post). But if I am interpreting the debate correctly we seem to have a quantity (“the degree C temp rise attributed to humans”) being compared to another quantity (‘the degree C increase over the period”).
It is unusual in the English language to compare unrelated quantities using proportions or percentages. So it is natural for us to read “Most of the observed increase in global average temperatures since the mid-20th century is very likely due to the observed increase in anthropogenic greenhouse gas concentrations” as being a statement about the proportion of observed degree C temp increase caused by humans. We would be most surprised to find that 110% of the increase was our fault, particularly since the phrase tells us that the two items are related – one the total observed rise, the other the human bit.
The reason for this is because in English we have perfectly good ways of describing the relationship between two unrelated quantities (which is apparently what IPCC were doing). We say things like “the size of the total temp rise was less than twice the size of the temp rise due to humans taken in isolation”. We introduce language that makes it clear we are talking about unrelated quantities.
The foolishness of the IPCC/Schmidt misuse of the English language becomes clear when we have periods of nil temp increase (eg last couple of decades) or even declining temps . How do you use this idiom to make the comparison then? However the chance to use phrases such as “infinitely greater” shouldn’t be put aside lightly in this kind of debate.
That is assuming I’ve correctly understood the problem at hand.
… How do you use this idiom to make the comparison then? …
Easy – you say that “more than all of the temp rise that didn’t happen during the last 15 years is due to anthropogenic causes.
+1
‘Relationship between two unrelated quantities?’Not ter
worry, a dash of dissimulation does it. Don’t fergit we’re
masters of the splice.
http://climateaudit.org/2011/03/29/keiths-science-trick-mikes-nature-trick-and-phils-combo/
Judith, that you felt this post was needed at all shows the sorry state of formerly ‘settled’ climate science. As for Gavin’s nattering about GCM fingerprints, that just illustrates the core fallacy in his CAGW religion. The GCM models (CMIP5, latest and greatest) do not (and inherently cannot because of computational limitations) get the most important ‘fingerprints’ right. Gavin knows there is a missing tropical troposphere hot spot fingerprint. See Christy’s APS brief you posted previously. How about the wrong cloud and precipitation fingerprints? How about the actual temperature fingerprint crucial to many climate realities (not anomalies)? And for non-model fingerprints, where is that accelerating sea level rise? Gavin should know there are two bogus excuses for the recent apparent deceleration in three peer reviewed junky papers. All covered by several Blowing Smoke essays.
GCM’s cannot be used to argue attribution. They are too shakey. The pause/hiatus already falsified them according to high priest Santer’s own 17 year criterion. Which Gavin attempted last week to obfuscate in his NASA GISS ‘hottest ever’ PR that did not also note GISS’ own analysis had concluded there was a (1-0.38)~2/3 chance the PR was wrong. That trick suckered in the NYT, but lasted less than one 24 hour MSM spin cycle. Gavin is apparently feeling heat. But not from AGW. From all the folks whom Judith has been patiently educating here.
Its worse than that; the GCM’s are not ‘anything’, they are not experiments with falsifiable outputs, when one of their outputs matches a particular real measurement they are acclaimed, where they fail, they are excused with Mosher-like sophistry.
The whole field is defined by very pretty rubbish.
We can also use some numbers. The warming since 1950 is about 0.7 C. At 2 C per doubling, the CO2 change in this period alone would account for 0.7 C. If you want it to be less than 50%, you need an effective sensitivity less than 1 C per doubling, almost no feedback. This probably explains why they say extremely likely more than half.
The warming since 1944 was 0.4K.
Ya really have to wonder how much of this was centennial warming.
That doesn’t help you because now 2 C per doubling accounts for nearly 200% of the warming, so you can argue even less against the IPCC likely most statement.
I have no idea what you are on about and I rather suspect you don’t either.
0.2k for a 40% increase in CO2 gives you nowhere near 2K per doubling.
Yes that gives you 0.4 C per doubling. Are you suggesting that as a likely number? The increase since 1950 was about 25%, so I am not sure what you are saying.
Anastasios Tsonis, of the Atmospheric Sciences Group at University of Wisconsin, Milwaukee, and colleagues used a mathematical network approach to analyse abrupt climate change on decadal timescales. Ocean and atmospheric indices – in this case the El Niño Southern Oscillation, the Pacific Decadal Oscillation, the North Atlantic Oscillation and the North Pacific Oscillation – can be thought of as chaotic oscillators that capture the major modes of climate variability. Tsonis and colleagues calculated the ‘distance’ between the indices. It was found that they would synchronise at certain times and then shift into a new state.
It is no coincidence that shifts in ocean and atmospheric indices occur at the same time as changes in the trajectory of global surface temperature. Our ‘interest is to understand – first the natural variability of climate – and then take it from there. So we were very excited when we realized a lot of changes in the past century from warmer to cooler and then back to warmer were all natural,’ Tsonis said.
Four multi-decadal climate shifts were identified in the last century coinciding with changes in the surface temperature trajectory. Warming from 1909 to the mid 1940’s, cooling to the late 1970’s, warming to 1998 and declining since. The shifts are punctuated by extreme El Niño Southern Oscillation events. Fluctuations between La Niña and El Niño peak at these times and climate then settles into a damped oscillation. Until the next critical climate threshold – due perhaps in a decade or two if the recent past is any indication.
What’s an appropriate rationale? Remove the multi-decadal variability?
https://watertechbyrie.files.wordpress.com/2014/06/swanson-et-al-2009.png
Discount ‘dragon-kings’ and take the 1979/1997 residual? Satellite data says that most of this was clouds associated with low frequency climate variability.
https://watertechbyrie.files.wordpress.com/2014/06/swanson-realclimate1.png
Simply average the 1944/1976 cool period plus the 1977/1998 warm regime?
It all works out at about 0.07K/decade – with contributions from the Sun to 1985 and a 1000 year high in El Nino frequency and intensity.
This is before you get to the unpredictability of the next climate shift.
I just don’t believe that we can use a mathematical network approach to extract knowledge from sparse data. Why should it be better that statistics?
What you don’t believe is not all that interesting.
Here’s the original paper – http://onlinelibrary.wiley.com/doi/10.1029/2007GL030288/full – knock yourself out.
Rob – the first sentence in the Introduction in your reference is “One of the most important and mysterious events in recent climate history is the climate shift in the mid-1970s [Graham, 1994].” When did YOU notice this mysterious event which can not even be dated to better than 5 years?
Wrong place.
You mean the “Great Pacific Climate Shift’ of 1976/1977?
I started thinking about it in 1990.
http://www.researchgate.net/publication/233871224_Geomorphic_Effects_of_Alternating_Flood-_and_Drought-Dominated_Regimes_on_NSW_Coastal_Rivers
Let me Google that for you – http://lmgtfy.com/?q=great+pacific+climate+shift
Rob – you give me a funny reference and then you ask me what I mean. Not really fair, but I don’t complain. My point is that an “abrupt climate shift” can easily go unnoticed. It took you 15 years to notice it. I never did. Tipping points – how scary.
Recent scientific evidence shows that major and widespread climate changes have occurred with startling speed. For example, roughly half the north Atlantic warming since the last ice age was achieved in only a decade, and it was accompanied by significant climatic changes across most of the globe. Similar events, including local warmings as large as 16°C, occurred repeatedly during the slide into and climb out of the last ice age. Human civilizations arose after those extreme, global ice-age climate jumps. Severe droughts and other regional climate events during the current warm period have shown similar tendencies of abrupt onset and great persistence, often with adverse effects on societies…
Modern climate records include abrupt changes that are smaller and briefer than in paleoclimate records but show that abrupt climate change is not restricted to the distant past.’ NAS 2002
What you have noticed seems about as interesting as what you believe.
I was just pointing out that the ‘Great Pacific Climate Shift’ of 1976/1977 was something that had been discussed for decades – and was not just a throw away line in an otherwise seminal paper – all of which including the paper of course goes right over your head.
I subtly suggested you Google it instead of wasting everyone’s time with snarky nonsense.
I think it depends on which data set you use, Jim D. Going from memory, I thought BEST said 0.8 C over a much longer time period? And here is a link to NASA saying 0.8 C since 1880.
http://earthobservatory.nasa.gov/Features/WorldOfChange/decadaltemp.php
The “Great Pacific Climate Shift’ of 1976/1977?
I started thinking about it in 1990.
http://www.researchgate.net/publication/233871224_Geomorphic_Effects_of_Alternating_Flood-_and_Drought-Dominated_Regimes_on_NSW_Coastal_Rivers
Let me Google that for you – http://lmgtfy.com/?q=great+pacific+climate+shift
it seems to me that sloppy language is being used as a means to conceal sloppy science and even sloppier reasoning that is behind the CO2 hypothesis of the AGW camp.
> … sloppy language is being used as a means to conceal sloppy science
Perhaps, but the true purpose of this “more than half” ambiguity is to scare the horses – and given the MSM coverage, this ploy works again and again …
What’s interesting about more or less than “half” is that there’s been no change in the increase or decrease in 100 years. Moreover, Zhou and Tung found that no more than half of global warming could have been human-induced. Looking for any evidence that humanity is cooking the globe, Jiansong Zhou and Ka-Kit Tung (Deducing Multi-decadal Anthropogenic Global Warming Trends Using Multiple Regression Analysis) began by excluding climate change due to natural factors and more specifically, by adding the effects of AMO (Atlantic Multi-decadal Oscillation) trends that alarmists neglected to consider. Zhou and Tung found what they were looking for –i.e., humanity’s contribution; but, it was small: so small it had to be less than half of, previously deduced anthropogenic warming rates, that government scientists have been using to base their fears of an impending climate doomsday. Moreover, Zhou and Tung found no statistically-relevant evidence of either an acceleration or pause in global warming over the last 100 years.
Warmists have nearly a total dependence on Inductive Reasoning, i.e, if it is getting warmer it must be human induced. They will not be nominated for Logician of the Year awards any time soon.
FL that is kind of the nub. You recognize as obvious a point that many simply refuse to acknowledge.
Why does the IPCC project futures that are impossible?
Why is the IPCC publishing an ECS for doubling of CO2 if we aren’t going to get doubling of CO2?
We should be getting ECSs for 40% more CO2.
Using the local favorite ECS, 1.64 * .4 = 0.656°C is a repeat of the 20th century.
The creation of high end unachievable scenarios just to create alarming but impossible warming projections seems inherently deceptive and dishonest.
Whoops that was suppose to be a reply to FL in the next thread.
It is a madness. We must understand the etiology, else suffer on.
==========
http://www.carbonbrief.org/media/134707/lequere_rcps.jpg
http://www.carbonbrief.org/media/137442/knutti_and_sedlacek_sres__vesus_rcps.jpg
Well, we are emitting above the RCP8.5 scenario.
We are performing well below RCP8.5 scenario.
They have to come up with a good excuse for the warming to be delayed.
Chaotic something or other, its hiding somewhere, etc.
If the energy isn’t being stored – but is being emitted – which appears to largely be the case, one would expect the out-year projections (2050 and onward) must be lowered.to comply with reality.
It would be foolish to reduce carbon emissions below RCP8.5 until they admit the models are wrong. If we reduce emissions they will claim the pause is due to reduced emissions and not that the models are wrong, and we really need to establish who is right.
Oh that turkey reasoning, right up ter Thanksgiving Eve.
— If we reduce emissions they will claim the pause is due to reduced emissions and not that the models are wrong, and we really need to establish who is right.–
We are going not reduce emissions just like we aren’t going stop Russia from taking over Ukraine.
The US has reduces it’s CO2 emissions but not because of governmental
action even if you include the great recession as part of a govt plan to reduce CO2, that still didn’t do much to reduce CO2.
Instead it’s due to the unforeseen changes in technology which has reduce the US emission- and largely fracking is responsible.
And all the countries that spent the most [trillions of dollars] doing measures to reduce CO2, have instead increase their CO2 emissions and have destroyed their environments.
But this is irrelevant to the issue because China has increase it’s emission to level higher that what the wacko greens have desired to lower CO2 emission- or had the idiotic ideas had “somehow” worked to perfection- it would not have mattered, because China is now emitting twice as much CO2 as US, and China will continue it’s mad growth in CO2 emissions in the next decade and beyond.
So without China [and india and others] reducing CO2 emission, even were Europe to go completely broke doing what pols says they going to it’s CO2 emission reduction plus they somehow got to zero emissions [not imagined possible- so miracle happens] – China’s increases will wipe out the insignificant amount CO2 emission reductions possible by Europe.
So rather than brilliant and daring government leadership, what going to stop China from polluting it’s cities will be China will consume all it’s coal,
and what going to stop imperial Russia is reality.
gbaikie – I’m still looking for all this fossil fuel that they are going to burn.
60% of emissions are going into the ground or water not the air.
If we are going to achieve doubled CO2 we are going to have to find 2.5 times the current reserves (1.5 times more reserves) quickly and even that won’t be enough if the rate of loss to the ground and water keeps increasing. If the greens keep interfering we will never achieve doubled atmospheric CO2 ever and will be lucky to even get a 40% increase.
PA, RCP8.5 breaks down in the future, because it assumes we burn fossil fuels we simply don’t have the means to produce. I realize there are cornucopians who gloss over realities, but if we look at the fine print we can discern a future in which fossil fuels will be incredibly expensive. I expect we will have a pretty serious crunch before mid century.
FL I replied to this, here:
http://judithcurry.com/2015/01/19/most-versus-more-than-half-versus-50/#comment-666444
Layman science question here. Do Dr. Schmidt and Dr. Curry view Oscillations (e.g., El Nino) differently in defining what is or isn’t natural climate variability? If so, how?
I emphasize the importance of multidecadal oscillations (e.g. AMO, PDO) and allow for the possibility of longer scale oscillations. I also question the ‘confidence’ in using a single solar reconstruction in their simulations of 20th century climate (and attribution arguments). The ‘establishment’ focuses on high frequency natural variability (e.g. El Nino).
by ‘establishment’ you mean the ‘consensus’
guess you lost your ‘establishment’ cred when you disagreed
I am learning so much about science
:)
Even 250 years of temperature records, and quite sparse records in early periods, is only as long as a gnat’s eyelash on a climatic scale.
Arguments about percent contribution can be very strange. If temperatures rise by .00001C, would we say humans are responsible for 50000000% of it? If a company grossing $10,000 makes $2 net profit, and I made $1 for it, am I responsible for 50% of the company’s profit?
The former is probably less misleading, but I’m not convinced either is particularly informative.
If a company grossing $10,000 makes $2 net profit, and I made $3 for it, am I responsible for 150% of the company’s profit?
Steve Ta, according to the logic of Judith Curry’s critics, yes!
This all reminds me of the trick question used during a previous recession: “What percentage of jobs are created by small businesses in America?” The answer, it was claimed, was 130%. The point was that large firms were shedding jobs and that public policy should (somehow) be driven by this fact. Of course, this resulted in a debate over the definition of “big” and “small” and even “job.” Appropriate policies (design, scale, implementation schedule) were not universally apparent but that did not stop advocates (on all sides) from claiming clairvoyance and demanding action in line with their own interpretation.
Most (Oops! There’s that word again…) who drilled down into the economic and employment data came away more confused than enlightened as to cause and effect. Was it foreign competition? Tax policy? The education system? All (none) of the above?
When seeking a specific public policy outcome, whatever it may be, advocates should expect their premises and conclusions to be scrutinized by those with whom they disagree. Unfortunately, in the climate debate, most advocates are simply being disagreeable.
I give a patient chemotherapy an the tumor volume shrinks by 10%, but I know the doubling time is 4 weeks, so after 3 and a half months I can claim I have killed 100% of the tumor.
I would reverse the tumor analogy. When the patient complains that the chemo isn’t working because the tumor is 5% larger, you can claim that since it would otherwise have been 150% larger, then you’ve reduced it by 45%!
The conflict of attribution and apportioning specific attributes of CO2 or land use changes or even the urban heat effect seems to muddy the climate change waters. If CO2 changes represent 5% of the observed changes, this may be more than the 4% of land use changes, which maybe more than the 1% influences of Urban Heat Effect. The rest of the observed changes could be natural variability, as yet not assessed and hence determined regarding such effects.
The issue is to determine the CO2 effect, which, to my understanding, has not been quantified. Of course, the CO2 effect may be related to its production other than smoke stack/tail pipe emissions; i.e., the plants that dominate areas now observed in the OCO2 satellite.
Gavin Schmidt’s expositions are just that, reflecting his belief system, modeled to be sure, just not integrated into any observational system.
Gavin? People don’t take him seriously. He’s a full-time propagandist. The tactics of a mafia defense lawyer without the legal ethics.
‘Climate forcing results in an imbalance in the TOA radiation budget that has direct implications for global climate, but the large natural variability in the Earth’s radiation budget due to fluctuations
in atmospheric and ocean dynamics complicates this picture.’ http://meteora.ucsd.edu/~jnorris/reprints/Loeb_et_al_ISSI_Surv_Geophys_2012.pdf
https://watertechbyrie.files.wordpress.com/2014/06/loeb2012-fig1.png
https://watertechbyrie.files.wordpress.com/2014/06/loeb2012-fig1.png
All of the warming happened between 1976 and 1998. The late century warming – between ENSO events – seems fueled by a large decrease in reflected SW between the 80’s and 90’s.
If we exclude climate transitions in 1976/1977 and 1998/2001 – we get the following residual warming – including the expectation that the plateau will persist for a while yet.
https://watertechbyrie.files.wordpress.com/2014/06/swanson-realclimate1.png
If you look at the last climate shift you get this.
https://watertechbyrie.files.wordpress.com/2014/06/earthshine.jpg
‘Earthshine changes in albedo shown in blue, ISCCP-FD shown in black and CERES in red. A climatologically significant change before CERES followed by a long period of insignificant change’
If they had any handle at all on all this – they might be taken a little more seriously.
SW changes.
https://watertechbyrie.files.wordpress.com/2014/06/cloud_palleandlaken2013_zps3c92a9fc.png
Watch for the next Earthshine report.
it will show a correlation between temperature and albedo that is already apparent with the plot that ends in 07
Judy must have crashed their server. Not prepared for that much traffic I guess. ;-)///sarc
The RealClimate link to his original response only has 5 of the 9 pages. I was particularly interested in one paragraph he wrote. Judy is it possible to get to the whole article again?
This is a really fun discussion, not only are we arguing about how many angels can dance on the head of a pin, but we’re debating if more than half, most, a preponderance, a majority, the largest part, a greater part, nearly all, etc. etc. of the angels are dancing to a “man made warming” beat or “something else” (hip-hop maybe?).
It’s too funny really, most of nothing is still nothing and more than half of nothing is still nothing.
Something we cannot observe beyond the appropriate error bars is not worth dissecting into “where” it came from.
Some folks really have no conception of measurement noise, honestly the surface temperature datasets are useless at this point, they have been massacred with adjustments, and they should all be tossed.
Carry On, eventually someone will figure it all out and I’m sure it’s “very likely” my fault in the end.
Cheers, KevinK
+1
Dr Curry, could your semantic confusions come from you excluding the possibility that nature variations may have not warmed the planet since 1950?
It is a mistake to try to determine the IPCC’s scientific meaning of the term ‘most’ in the sentence “[m]ost of the observed increase in global average temperatures since the mid-20th century is very likely due to the observed increase in anthropogenic greenhouse gas concentrations.” It was a political statement, not a scientific one.
The point is not measurement, but blame.
“Man is responsible” for the warming so man must give us control of his energy economy. Percentages are irrelevant. Laying blame is all that matters. All the rest is smoke and mirrors .
Song of the climate consensus:
Oh I’ve got plenty of nuthin’,
and soon you’ll have nuthin’ too.
Nothin’ from nothin’ leaves nothin’
You gotta have somethin’ if you want to be with me
I’m not tryin’ to be your hero
‘Cause that zero is too cold for me, Brrr
I’m not tryin’ to be your highness
‘Cause that minus is too low to see, yeah
Billy Preston
Indeed. There’s no science here whatsoever …
The AGW argument is completely circular to begin with.
They start out with the premise (their hypothesized ‘warming mechanism’) that more CO2 in the atmosphere necessarily MUST make the surface warmer. Has this causal relationship (+CO2 > +T) ever been empirically verified in the real Earth system? Of course not. Not even remotely so.
And yet they ASSUME their premise to be true before they go on attributing. This way of arguing is called “Begging the Question” or ” petitio principii”, which means ‘the conclusion that one is attempting to prove is included in the initial premise of an argument’. It is of the type: “Opium induces sleep because it has a soporific quality.” Which is EXACTLY equivalent to the AGW argument: “More CO2 in the air causes ‘global warming’ because it is a ‘greenhouse gas’.”
But what is a ‘greenhouse gas’? Is it a gas that absorbs and emit IR within certain bands of the EM spectrum? Or is it a gas whose presence in the atmosphere makes the surface below warmer?
The first definition is true and observed. The second one isn’t. It is a mere assertion, an assumption, a conjecture extrapolated from the first definition, a jump in the argument that in fact goes from fact to hypothesis and which therefore needs to be verified empirically before it can be said to be valid. Well, it’s NOT verified empirically. Not at all. So you are NOT allowed to assume that your hypothesized effect is working out there in the real Earth system. But, that’s what they do …
Good point, Gary.
Did you see that the climate concerned are making a bold, self-sacrificing statement about anthropogenic CO2? They’re only taking 1,700 private jets to the next global discussion of the issue:
http://www.breitbart.com/national-security/2015/01/20/1700-private-jets-fly-to-davos-to-discuss-global-warming/
A Lear Jet 85 – $21,000,000.00
1,000 gallons of jet fuel – $4,850.00
The hypocrisy of spoiled CAGW autocrats – priceless.
You know, folks like Rob, it would be interesting to see something new. Not the same old, same old fancy cheats signifying nothing.
Why don’t you believe in chanting mantras? It’s been settled for millenia.
It is the same old circle jerk – involving the same old jerks it seems.
Which bit of the data or the quotes from actual science is a cheat? What is it that you don’t understand?
others replys above and below suffuce for refutation.
You’re being a bit obscure Rud. Which bit is refuted? That blowing smoke constantly is something new? Or the fingerprints the models don’t get? Or whatever other pedestrian nonsense you fondly imagine throws a spanner in the works?
If you have an actual point – other than simply being disagreeable – by all means go for it. If you have a new I for one will be astounded.
Arrrrgh. New to this game, but what about amount of time as it relates to attribution. Seems a moving target.
Let’s just stop all known anthro CO2 (ya’ll hold yer breath please), fill the skies with aerosols, and find out what happens (once we’ve settled on the time frame that will “settle” the argument).
What are the expected typical confidence ranges for an study to be considered scientific? Likely = 66%-90% (24% range)? Seems like a pretty low standard and “likely” to cause uncertainty.
Dr. Curry, if I get it correctly, is indicating the confidence ranges put forth are approximately 50% +/- 30%. That’s a 60 pct. range! Seems a big dart board. Dr. Schmidt if I get it correctly, sees it falling in 33% ranges (but 62% is okay when it suits I.E. HYE [hottest year ever}), a bit more focused but still seemingly quite broad. Those seemingly can’t lead to anything but “uncertainty”.
To this non scientist it’s hard to imagine another area with so much riding on the outcome, having this considered an acceptable standard especially since this is one step removed from the academic studies that seem to have wiggle room already. What am I missing here? Semantics? What the heck. If one can’t state in 10% ranges (9 outta ten times at 90%??????), 15%, heck 20% how is that considered a scientific study? Likely? How about “best guess, but maybe not”? (What the term for semantics when referring to number?)
What (and I’d really like to know) am I missing?
Fewer words. We’re uncertain how uncertain we are? Uncertain, uncertanties (TM)?
If we’re not certain, how uncertain we are how can decisions be made?
The scientific evidence is that (a) above is correct. So what? we lived through it without disaster. The problem was created when politicians, lawyers and some scientists implied it was a projection for the future, as if future climate could be predicted by such a simple calculation..As if future climate would be just ‘more so’.
This is a past misunderstanding that has little relevance to the future, except to warn us of the danger of including non-scientists in a scientific debate. However there is not much confidence that the powerful UN has learnt this lesson.
Apply Einstein’s Razor: Make things as simple as possible but not simpler.
Gavin & IPCC never read Einstein’s directive, and missed a major simplifying option: Negative feedback and low climate sensitivity!
AR5’s
is quickly nullified by Monckton et al’s “Simple Model”.
Statistician William Briggs summarizes: NEW PAPER: Why Models Run Hot: Results From An Irreducibly Simple Climate Model
“Why models run hot: results from an irreducibly simple climate model“, by Christopher Monckton of Brenchley, Willie Soon, David Legates and Matt Briggs
Seeing how well the simple model works, the burden is on Gavin et al. to show why their models have any significance – other than coercing politicians to fund the climate gravy train.
FWIW – as an admitted statistically-challenged observer of this “debate” for more than five years – my impression of Gavin Schmidt (and his various and sundry pronouncements, pontifications and prognostications) is that his words have – more often than not – resembled those of a self-declared “angel” dancing on the head of a pin.
It seems to me that Schmidt and his fellow (UNEP blessed) “angels” – notwithstanding their, no doubt, very “best” efforts – have been glaringly unable to advance (with even a modicum of progress) beyond the halcyon days of their pre-Climategate world.
Those were, no doubt, the good old days; when their word was (for all intents and purposes) unquestioningly taken as gospel truth. Albeit by far too many – not the least of whom were those in their ever-growing army of unthinking MSM “partners” who should have known better than to glom onto the holy writ of press releases. Not to mention the UNEP and/or NGO-partner generated word salads (and/or carefully crafted, albeit relatively infrequently viewed, videos) galore.
Much as Schmidt and his fellow IPCC-niks might prefer (others) to believe otherwise, the on-line world has changed considerably since those halcyon days of Gore-acular yore!
Alas, for Schmidt and his fellow “angels”, IMHO, the effect of their obscurantist pin-dancing fog (and pettifoggery) is declining by the day. If not by their respective tweets and FB pronouncements and/or sermons from their mount of crumbling credibility!
Hilary, my reply to your topic follows yet is still preceded by essays in Blowing Smoke. Alas, not syndical enough. Let us go further.
Visit http://www.improbable.com/airchives/paperiar/volume7/v713/angels
Or just google around the topic. Name of the ‘paper’ is, “Quantum Gravity treatment of the Angel Density Problem”. Quite more serious than Gavin’s new pronouncement YE 2014 about hottest year ever missing the error estimates per my new book, which contains much more info insight, or not.
Either way, regards.
I am not sure what the argument is about here. When you look at the pdf curve, you’ve got percentage attribution on the horizontal axis. At any percentage attribution, you go up to the curve to read the likelihood that this attribution level is the actual level. As they’ve create this curve, values lower than 0.5 (50% or warming attributed to GHGs), are extremely unlikely.
The phrase “It is extremely likely that more than half of the observed increase in global average surface temperature from 1951 to 2010 was caused by the anthropogenic increase in greenhouse gas concentrations and other anthropogenic forcings together.” is perfectly consistent with the pdf, and describes it accurate. All that’s saying is that the vast majority of the area under the curve is to the right of 0.5.
Now I haven’t a clue where this PDF function comes from (model run distributions?) But there’s no way to interpret it, or the IPCC statements as “it’s just as likely than 50%+ of the warming was caused by natural process” – according to the pdf, there’s probably a less than 1% chance that that level of attribution is correct.
Incomplete understanding of three key properties of the climate system—equilibrium climate sensitivity, rate of ocean heat uptake and historical aerosol forcing—and their underlying physical processes lead to uncertainties in our assessment of the global-mean temperature evolution in the twenty-first century 1,2 6 . Explorations of these uncertainties have so far relied on scaling approaches 3,4 7 , large ensembles of simplified climate models1,2 8 , or small ensembles of complex coupled atmosphere–ocean general circulation models 5,6 9 , which under-represent uncertainties in key climate system properties derived from independent sources 7–9 11 . Here we present results from a multi-thousand-member perturbed-physics ensemble of transient coupled atmosphere–ocean general circulation model simulations. We find that model versions that reproduce observed surface temperature changes over the past 50 years show global-mean temperature increases of 1.4–3 K by 2050, relative to 1961–1990, under a mid-range forcing scenario. This range of warming is broadly consistent with the expert assessment provided by the Intergovernmental Panel on Climate Change Fourth Assessment Report 10 20 , but extends towards larger warming than observed in ensemblesof-opportunity 5 typically used for climate impact assessments. From our simulations, we conclude that warming by the middle of the twenty-first century that is stronger than earlier estimates is consistent with recent observed temperature changes and a mid-range ‘no mitigation’ scenario for greenhouse-gas emissions.’ https://ore.exeter.ac.uk/repository/bitstream/handle/10871/9287/Broad%20range%20of%202050%20warming%20from%20an%20observationally%20constrained%20large%20climate%20model%20ensemble.pdf?sequence=2
https://watertechbyrie.files.wordpress.com/2014/06/rowlands-fig-1.png
This is a single model using small changes in initial values and on ‘the assumption that models that simulate past warming realistically are our best candidates for making estimates of the future…’
Models are chaotic and all of these – and many other solutions – are plausible. Although it would be interesting to see the results that are not constrained by simulating best the last few years weather. That is – take a starting point of today and let the model evolve where it may with small changes in inputs and couplings.
Climate is complex in the terms of complexity science. Complexity emerges from the interactions of simple components. Sun, wind, currents, cloud, ice and ecology. There is no chance at all that the physics of complexity are captured by ideas of forcing. The Earth system behaves in certain ways – increases in autocorrelation as it approaches a tipping point and dragon-kings at the transition to a new state. There is not a chance in hell that models capture these dynamics of the interactions of simple components.
The only way to approach understand is with space sourced data – and this data tells another story entirely than the simple forcing narratives. Unless chaos and complexity are understood – it is simply dog whistling in the dark.
> There is no chance at all that the physics of complexity are captured by ideas of forcing
Yes
I once asked Lakis on this website a few years ago for an answer to that concept … his reply was unresponsive to the question
Chaotic, coupled, non-linear elements continually evolving in never-ending Navier-Stokes iterations. The only real prediction possible is that negative feedbacks will eventually undermine any single evolutionary direction
Rob Ellison, how much crude oil and condensate are assumed to be consumed and emitted to estimate the CO2 concentration used in this ensemble? Do you have a segregated curve by fossil fuel type?
“Most of the observed increase in global average temperatures…drone, drone, drone…”
Well if GISS et al is anything to go by, they may not have finished observing the 20th century yet. It would be helpful to know when they plan to finish making significant adjustments.
I discussed much of this, including the semantics and the “magical” properties of what I call the net warming model, in my Big Question essay. http://judithcurry.com/2014/01/29/the-big-question/
“[The net warming model] leaves the impression that our questions have been answered when they haven’t. It does not answer the question we want to ask and believe we’re asking: the intuitive question about how much of climate change we are causing. The answer we’re looking for is percentage between 0 and 100. If the answer we’re getting is something else, even potentially, it must be the answer to a different question.
More semantics; the concept of causation:
“Since it is not possible to cause events that never actually happen, there is no way greenhouse gases could have caused more warming than actually occurred. This means that in this instance “more than half” must be read as referring to a percentage between 50 and 100.
This is analogous to attempted murder. If I point a gun at you and fire it, but something stops the bullet in its path, I did not cause you to die. It’s a trivial and conclusive inference: you are still alive, therefore I did not kill you, nor did anyone else. Similarly, if a given amount of warming was prevented from happening by a cooling influence, the warming did not happen and was not caused by CO2 or anything else.”
It’s not even semantics!
The IPCC statement reads “It is extremely likely that more than half of the observed increase in global average surface temperature from 1951 to 2010”, not to what percentage of the rise is anthropogenic warming as opposed to anthropogenic cooling.
The statement is clear; it means what Judith (and probably everyone else in the normal world) thinks it means. Of the warming that occurred in the given time frame, what portion of that was caused by (the sum of) anthropogenic factors? They say it is extremely likely it was more than half.
Trying to discredit someone’s argument by redefining the terms is absurd.
And In terms of informing policy makers and the public, the statement has to mean what is commonly understood by those terms. You can’t redefine them post-hoc. I could make a statement regarding what a “girl” said, and when challenged about the gender, because it was a “boy” that said it, I could claim that the original meaning of the word “girl” was “small boy”. I wouldn’t be wrong, but the meaning of the word “girl” is generally accepted to mean a “small female human”.
How can Gavin’s critique be defended? He may not even be ŵrong.
Judith,
if you plug in the numbers from your paper with Nic Lewis into the change in GHGs over the period covered by the IPCC attribution statement, what proportion of temperature change is attributed to anthropogenic and what to natural?
Does your analysis support or contradict the IPPC?
I don’t care about the semantics. I just want a clear answer and a clear explanation of what the weight of credible evidence says. Does the weight of credible evidence support the hypothesis that >50% of the global surface temperature increase since 1950 was caused by human’s GHG emissions?
Answer Yes or no?
Then provide a very succinct, clear, simple summary of the evidence in a way could be explained to a policy analyst, politician, and intelligent, interested, unbiased member of the public.
Is anyone who blogs on CE capable of meeting my request (while refraining from the usual abuse and snide remarks)?
+1 PL.
You lost me at the start of your last comment.
“it is certain that essentially all the CO2 rise post industrialisation is anthropogenic.
I’m not at all interested in debating that point, it’s simply proven.”
PL is right here.
We destroyed 40 Gt/year of carbon sinks and added 170 Gt of carbon from burning forest and are currently adding 2 Gt per year by the same process.
So depending on how you look at it none, some, or most of the CO2 is due to fossil fuels. This doesn’t include the effect of warming the ocean.
The warming of the ocean contributed some to the CO2 increase.
http://zipcodezoo.com/trends/Trends%20in%20Atmospheric%20Carbon%20Dioxide_2.gif
CO2 followed temperature and went from 270 to 300 by 1900. Any number above 30 PPM for CO2 increase driven by warming alone can be justified. A good case can be made for 50 PPM.
No, we haven’t enough knowledge of nature to make that determination yet.
==================
Peter,
good question, answer “Yes”.
In summary, even low estimates of sensitivity give >50% attribution to CO2 on the 1950-2010 timescale, plus there are patterns in the warming only explicable by greenhouse gases.
Details:
We can look at the CO2 rise 1950 – 2010 and estimate the temperature rise we would expect.
There are essentially three ways of estimating sensitivity to CO2 (TCR in this case):
1. GCMs
2. Paeloclimate (normally using last glacial maximum as a reference)
3. Observational Energy balance
The third of these gives the lowest estimates, so we’ll use that, with data from the Lewis and Curry paper.
Lewis and Curry give TCR 1.05 – 1.8 as the 17-83% range; TCR 1.33 is the midpoint
Plug the numbers in and you get:
TCR % of warming attributed to Co2
1.05 49%
1.33 62%
1.80 84%
(I’ve asked Judith in the post above what her analysis on this basis would show – she should be much better at this than I am)
So, quantitatively, even using low ball methodology, we get an attribution which confidently puts anthro at >50%
Qualitatively, we need to look at the fingerprints of warming.
With CO2, we’d expect tropospheric warming and stratospheric cooling. That’s exactly what we see. There are other fingerprints, but to my mind they are less conclusive individually, but convincing in aggregrate. See for instance http://www.skepticalscience.com/its-not-us-advanced.htm
BTW I had an interaction with Gavin at Realclimate which might help you understand his position. Personally I find it rather confusing. But then I’m not a climate scientist.
http://www.realclimate.org/index.php/archives/2014/08/ipcc-attribution-statements-redux-a-response-to-judith-curry/comment-page-2/#comment-589707
Three times in the last century and a half the rate of temperature rise has been about the same and only in the last of these was CO2 significantly rising. The slopes after the rises resemble each other, too, either flat or slight cooling. These varying slopes cycle around a trend that has remained the same since the end of the Little Ice Age.
So where’s the anthropogenic CO2 fingerprint? I presume millennial scale changes are responsible for the temperature rise since the LIA. They are simply discounted in consensus alarmism, and that is the source of error: ignorance of nature.
If man is mostly, or largely responsible for the recent rise, then we’d be just that much colder without our input.
===================
VeryTallGuy,
Thank you for your response.
Do we know what caused the similar previous warmings, such as the Roman and Medieval warm periods?
Peter,
the argument stands regardless of MWP attribution. I’d just note that a large and global MWP if proven implies a high TCR and therefore higher confidence in anthro attribution from 1950-2010.
verytallguy,
Second question, the calculations you quote are based on the change in CO2 concentration in the atmosphere between 2050 and now, right? Are we confident we know what proportion of the change in CO2 concentration is due to human activity?
What was the change in human caused concentration between 1950 and now?
Nope, you don’t know the forcings for the MWP, or any of the Holocenic Optima and Minima.
======================
verytallguy,
Isn’t that a circular argument? it seems you are assuming the cause of the MWP was CO2? Why couldn’t it have been caused by interactions of one or more the very large number of factors that cause the abrupt climate changes that happen periodically and also irregularly?
Peter,
it is certain that essentially all the CO2 rise post industrialisation is anthropogenic.
I’m not at all interested in debating that point, it’s simply proven.
On MWP and sensitivity no it’s not a circular argument. I’ll try and illustrate with an example.
Let’s say there was a global and large MWP, and it was caused by solar changes (neither is likely true, but let’s just take it as an example)
We can then estimate sensitivity to the forcing from the change in temperature during the MWP.
The larger the MWP temperature rise in this scenario, the larger the TCR, and the same feedbacks both positive and negative will operate for solar and CO2 forcing.
If there is a strong negative feedback in the climate system, be it clouds, lapse rate, etc it would preclude large temperature variations in global temperature caused by a perturbation in climate, regardless of the cause of the perturbation
VTG,
You lost me at the start of your last comment.
That sort of answer won’t get anywhere. Remember you are trying to explain in simple terms to a policy analyst, politician or intelligent, interested, unbiased non specialist member of the public.
You say it is a fact. If that’s so what’s the evidence?
And how do you explain the increases in CO2 concentration that occurred during periods of warming before the industrial era?
You need to be able to provide simple clear answers to all these sorts of questions.
Peter,
I don’t *need* to do anything Peter, I very politely gave you a rationale for attribution of temperature rise, which is the topic.
The recent CO2 rise being anthropogenic is as certain as the earth orbiting the sun and the evolution of species.
I have no more intention of debating that than debating the laws of thermodynamics.
I’m happy to debate attribution, sensitivity and other things which are difficult or uncertain.
Feel free to explore or question what I’ve suggested on those, and feel free to research or debate elsewhere the anthropogenic nature of the Co2 rise.
VTG, you don’t know the cause of the apparent millennial scale cycles and you don’t know the cause of the rises and falls of CO2. You may think you do, but you are not convincing.
==================
VTG,
OK. So clearly you are simply a Climate Cultist. You have beliefs and if challenged to explain why you believe, you fly into an uppity defence of your cult’s beliefs.
Your response is another example of how the Climate Cultists carry on. You would have done better for your cause to have not answered, because what you’ve done is reinforce for me that those of your persuasion are just cultists. Referencing SkepticalScience and RC damaged your credibility from the time you told me to go read the answers to my questions on those sites. Do you have any idea of who set up and paid for RC and do you know about what Skeptical Science has been up to. If you don’t know, go find out.
Peter,
compare and contrast
you originally:
you now:
You asked for clear and simple attribution without abuse and snide, which I provided, using data directly from the host’s papers.
You choose to challenge realted but separate unequivocal and well understood science, and tell me I *need* to go down that rabbit hole.
Now you come back with snide and abuse.
I am not your encyclopaedia. There is a level of accepted science below which there is no point in debate. Co2’s anthropogenic origin, for me is one of these. I have no problem if you want to challenge that, but equally I have no intention of wasting my time on it.
yes. I’m aware of that. Perhaps you should first analyse your own responses. As far as I am concerned, you are not someone with credibility.
VTG,
You didn’t answer the question. You weren’t capable of answering the question. You should have shut up and let others answer.
VeryTallGuy,
On one point agree with you,
You say:
“If there is a strong negative feedback in the climate system, be it clouds, lapse rate, etc it would preclude large temperature variations in global temperature caused by a perturbation in climate, regardless of the cause of the perturbation”
This is absolutely correct, and taken together with the fact that there have been many perturbations in the past, it indicates that the climate does not tend to spin out of control every time it gets perturbed. If it did have this tendency, then it would have spun out of control long ago. But it hasn’t, and we’re still here.
Peter Lang,
a most instructive interaction. You have clarified some things for me.
KenW
Absolutely. The expected response to a step increase in CO2 is to move from the relatively stable Holocene climate through a period of rapid (in geological terms) change to a new, relatively stable climate with a higher overall temperature and somewhat different circulation and rainfall patterns.
VTG, “In summary, even low estimates of sensitivity give >50% attribution to CO2 on the 1950-2010 timescale, plus there are patterns in the warming only explicable by greenhouse gases.”
Patterns of warming are nowhere near 50% of where they are expected to be. This suggests that convective processes circumvent and overwhelm significant portionss GH warming.
Absurd. We don’t know what forcing changes were during the MWP. Chaotic changes in weather/climate regimes, water distribution and albedo are likely the cause.
Absurd. 27% of the rise in Law Dome CO2 concentrations happened before emissions were big enough to contribute.
aaron
take it to Judith. I used her TCR numbers, which are observationally based. They are low compared to other methodologies
I made no claim as to the cause or magnitude of the MWP, merely noted that the larger you think it is, the larger the TCR must be, qualitatively.
As to your implications vs anthro CO2, I stand by what I said to Peter and have no intention of following you down that rabbit hole
verytallguy,
If the system is dominated by positive feedbacks, instead of negative ones, then it would have to spin out of control because feedbacks would beget even more feedbacks. Since it hasn’t already done this, it looks likely to me that the negative feedbacks must dominate.
Without major positive feedbacks, and more likely slightly negative ones, we will see an increase in temperature (ECS – x), which is a small fraction of natural fluctuations.
This increase will therefore never be positively identifiable, much less found with our fingerprints all over it.
verytallguy’s comment at 5:21 “it is certain that essentially all the CO2 rise post industrialisation is anthropogenic.”
Based on the above comment, the United States wasted a lot of money in 2014 with NASA’s Orbiting Carbon Observatory-2 Mission “designed to measure atmosphere carbon dioxide with the “accuracy, resolution and coverage needed to identify its sources and sinks.”
KenW
Yes, that’s correct. The conventions of climate science are that the Stefan-Bolzmann feedback is NOT usually included, so positive feedback does not mean a NET positive feedback in the control systems sense. This is a difference in nomenclature, not principle.
Whilst other feedbacks (notably water vapour) are almost certain to be aggregate positive, the total NET feedback including Stefan-Bolzmann is negative. That keeps the climate relatively stable.
There are periods (PETM, during deglaciation) where the net feedback even including Stefan Bolzmann, may actually be net positive, so that the climate does run away, but only for a transient period (eg until ice sheets have retreated). Feedbacks vary according to the overall state of the climate system, they are not necessarily constant.
Note again, that the numbers from Judith’s observational sensitivity study with Nic Lewis imply strongly positive feedbacks (again, not including Stefan-Bolzmann), albeit less strong than the centre of the IPPC range implies.
verytallguy,
Then we’ll settle in a stable climate, I gotta call it a day.
Do we know what caused the similar previous warmings, such as the Roman and Medieval warm periods?
Some of us do. The warm periods are times of low ice extent and the cold periods are times with higher ice extent. Albedo difference is the cause of the warm and cold periods.
Consensus people see the ice extent difference as a result.
It is the cause and not the result.
The answer is NO. There is no evidence. There is only climate model output and that is not data and that is not evidence. That is unskilled forecasting.
With no warming from manmade CO2, the historical record shows that after the roman and medieval warm periods, another warm period should have happened now. Nothing stopped that would have prevented this warm period from happening.
I was writing my comment at the same time without seeing your comment
The surface temperature record shows a decadal peak in 1944, a decadal low in 1976 and again a high point in 1998. The cooling from 1944 to 1950 is all ENSO – and this is a substantial part of the warming cited.
The difference between 1950 and 1998 is 0.71K – the difference between 1944 and 1998 is 0.39K.
If it assumed that natural decadal cooling between 1944 and 1976 was exactly balanced by natural decadal warming between 1976 and 1998 – the residual due to anthropogenic effects was 0.39K.
Was the residual all anthropogenic? Models give us no clue at all – there are literally thousands of plausible solutions to any model and tuning gives no reassurance that the complex physics of climate are captured. Paleodata is simply playing games – we barely have enough data in recent decades to constrain estimates. Energy budgets are a joke unless you know what is actually happening with TOA energy flux and why.
‘In summary, although there is independent evidence for decadal changes in TOA radiative fluxes over the last two decades, the evidence is equivocal. Changes in the planetary and tropical TOA radiative fluxes are consistent with independent global ocean heat-storage data, and are expected to be dominated by changes in cloud radiative forcing. To the extent that they are real, they may simply reflect natural low-frequency variability of the climate system.’ AR4 3.4.4.1
Independent evidence from multiple sources suggest – if ‘real’ – that recent warming was all cloud changes associated with decadal changes in ocean and atmospheric circulation.
What seems incontrovertible is a prospective downturn in solar activity from the late 20th peak – and a decrease in El Nino frequency and intensity from a 1000 year high.
Interesting. Thanks.
+1
Peter Lang: Does the weight of credible evidence support the hypothesis that >50% of the global surface temperature increase since 1950 was caused by human’s GHG emissions?
We have discussed elements of the evidence from time to time. Consider the claim by Dr Norman Page (who writes here) and Dr Nicola Scafetta (who has published in peer-reviewed journals), and others, that there is a natural process affecting global climate, having periodicities near 1000 and 60 years, that is accurately represented by the weighted sum of sine curves. If that proposition is true, then the weight of the rest of the credible evidence does not support the hypothesis that >50% of the global surface temperature increase since 1950 was caused by human’s GHG emissions.
If there is no such process, then > 50% of the warming since 1950 may be due to human interventions, but the assignment of portions to deforestation and other land use changes and to GHG. How much is due to GHG emission then depends on the estimates of the quantitative effects of all other human interventions: about those, the credible evidence is incomplete, but depending on how strong you conclude it to have been, you can get estimates of 50% for the effects of GHGs.
Every quantitative estimate of the magnitude of the GHG effect depends on the quantitative estimates of the effects of the other processes. The confidence of the IPCC writers in the >50% attribution follows from their confidence that no other process coincident with CO2 increase has a large effect.
Now, is the Page/Scafetta/etc hypothesis “credible”? I think so. Is it true and is there an accurate representation of the process? Maybe.
Matthew R Marler,
Thank you for that very clear explanation. Much appreciated.
O/T but thought I’d mention anyway:
The agenda behind my interest and my questions is what policy is justified on a rational basis. The more I read posts and discussions as on this thread, the more I am convinced that we should not risk damaging world economies by implementing policies that will do just that for a very unlikely beneficial result in decades or centuries time. I am also persuaded that the world can and will cut global GHG emissions sufficiently and do so in a way that benefits rather than damages the economies of the world. However, IMO, that will not happen by imposing centrally controlled, legally binding agreements with penalties for not meeting commitments, nor by implementing carbon pricing nor by distorting markets with regulations to mandate high cost renewable energy.
Your comments boost my confidence in what I think is the way policy analysis should progress.
Peter Lang: Do we know what caused the similar previous warmings, such as the Roman and Medieval warm periods?
As far as I have been able to learn so far, we do not. I have read a bunch of conjectures, but no adequate model that has been tested against out of sample data. Douglas Cotton, who writes here under various names, has published a book explaining the fluctuations as due to the changing gravitational fields imposed upon the Earth and sun by the revolutions of all the planets. I have read several such explanations. As far as I can tell, no such hypothesis has been able to rally much support or survive critical reviews.
I view this as one of the most important of the known unknowns of the discussion.
I didn’t ask this question very well. What I meant to ask was:
Do we know by how much CO2 concentrations increased during the similar previous warmings, such as the Roman and Medieval warm periods? If so, have attribution studies for the past 50 years taken into account the amount by which CO2 concentration increased during equivalent previous warming periods?
Peter Lang, which of 2014’s succinct, clear, simple,
97 summary statements of consensus was the *MOST* nearly satisfactory to you?
Ultra-simple?
http://www.skepticalscience.com/graphics/07_AK2_Jason_Box_med.jpg
Most-honored?
http://www.skepticalscience.com/graphics/49_E5Q_James_Hansen_med.jpg
Good News The same Catholic Church that (eventually) accepted Galileo’s worldview and (eventually) accepted Darwin’s worldview is now (finally) accepting Hansen’s worldview.
Perhaps Pope Francis will provide the summary clarity that you seek, Peter Lang?
More Good News Hundreds more BRAND NEW summary statements are a-coming in 2015!
Fan again consulting noted atmospheric physicist Pope Francis.
Have you convinced the CMIP to include the ‘Divination’ model yet?
curryja, sometimes it helps to use illustrations in discussions…and actual warming rates. I just happened to have this in my files.
https://bobtisdale.files.wordpress.com/2015/01/ipcc-attribution.png
Cheers
Oops. Typo in Title Block. 1950 should read 1951.
How does global CO2 have to rise by 2050 to continue this trend?
Bob,
Can you please explain what you interpret from this chart?
Nothing to interpret, Peter. I’ve simply shown the warming rate presented by the data and half of that warming rate.
FYI, the long-term warming rate (1880-2010) is about one-half the rate of 1951-2010.
Or another way,
50% of less than expected:
http://climatewatcher.webs.com/SatelliteEraTemperatures.png
Can we say they were half right and call the whole thing off?
=================
Better yet, cut this climate baby in half and each side gets its fair share.
=========================
Kim, I bags the Right half
I want the half that gets warmer.
They have two problems:
1. The trend is less than predicted. The emissions are running ahead of RCP8.5 so the trend should have been more than predicted.
2. The atmospheric CO2 level increase from today will be less than the RCP8.5 CO2 level of 935.87437 PPM by at least 335.87437 PPM. It is likely it will be more than 385.87437 PPM less.
http://data.giss.nasa.gov/modelforce/ghgases/Fig1A.ext.txt
http://www.esrl.noaa.gov/gmd/ccgg/trends/
December 2014: 398.78 ppm
December 2013: 396.81 ppm
A wildly pessimistic estimate of the 2100 CO2 level would be a 50% increase from today’s 400 PPM:.
a. Only about 40% of yearly emissions are staying in the atmosphere (and the percentage is declining – it used to be 60%)..
b. It took a full century (1901-2000) for the level to go up level to go up 74 PPM.
c. The five year average annual rate of increase 30 years ago was around 1.55 PPM/year when emissions were 1/2 the current levels.
d. The current five year average annual rate of increase is about 2.26 PPM…
The IPCC projects a 133.96859% (535.87437 PPM) increase in 85 years or an average increase of 6.304404 PPM per year starting this year. That sort of estimate doesn’t even qualify as deluded.
It can be conservatively stated that the forcing will be less than half and will likely be approximately 1/3 the RCP8.5 forcing level.
Simply multiply the RCP8.5 temperature increase for 2100 (the central value is 3.5°C) by 1/2 for the observed response, and 1/2 for the over prediction of CO2 level.
3.5°C * 1/2 * 1/2 = 0.875°C
A 0.875°C temperature increase by 2100 is the actual worst case CO2 driven warming, that realistic and rational people would expect, with plenty of margin for error.
http://en.wikipedia.org/wiki/Sydney_Harbour_Bridge#mediaviewer/File:Sydney_Harbour_Bridge_from_Circular_Quay.jpg
Hmm … Joining them spans must have taken some precise calculations, no place fer obfuscations. Jest sayin’ …
What is the IPCC meaning of “other anthropogenic forcings”? And if that forcing is greater than 50%, then the “greenhouse gas” contribution could be less than 25% according to the IPCC.
Thank You for explaining this to me Judith.
I see it now! It’s brilliant. The circle is closed. All bases are covered.
Warming is what they say it is – no matter what happens.
Can’t wait to see the fingerprints on the models!
Two and two are five! Sometimes they are three. Sometimes they are all of them at once. I must try harder. It is not easy to become sane!
(apologies to Orwell)
I think I may have written about this in the past, but here it goes:
In the oil industry we run computer models which use hundreds of thousands and sometimes above one million cells. The models are used to match the data, and to run forecasts, which are expected to run for as much as say 50 years (although a 20 year forecast is much more common).
When we run these models we do attribution analysis, but I find such attributions to be somewhat inaccurate. And some of them are absolute non sense, because the different “forcings” are interrelated. This means that in each time step a “forcing” can impact how other “forcings” behave. Imagine the frustration we suffer when management insists we try to separate the individual effects so they can decide if they were worth the effort.
In our case a “forcing” can be the injection of CO2 slugs. These are injected using wells, and are alternated with water injection. Imagine the mess when we are asked to figure out whether an individual well in a 20 well pattern is worth drilling and used to inject. However, that’s the type of question I have faced in the past.
I think this underlines the sophistry employed by the IPCC and others when attempting to convince policy makers of how ‘significant’ the contribution from anthropogenic greenhouse gases has been with regard to the very moderate warming we have seen since 1951. Their measure of ‘significance’ is phrased in an obscure and impenetrable manner that is far removed from what most people would understand to be logical and consistent with reality. Fraction of Attributable Risk (FAR) models are increasingly used nowadays to ‘fingerprint’ regional and global climate variability and even extreme weather events. As Judith says, those ‘fingerprints’ look very ‘muddy’
I think a comment I made recently on another blog is apt to repost here:
“If I understand TCR (to doubling of CO2) correctly, it involves only the positive radiative forcing theoretically calculated from the increase in atmospheric CO2 plus an array of positive and negative feedbacks which are a direct consequence of the increase in CO2 radiative forcing. I am guessing that this would include increases in other associated GHGs (+ve feedback) and increases in aerosols from fuel burning (-ve feedback). Though natural variability (external and internally generated – including the cooling effect of naturally produced aerosols) would affect the final temperature achieved, this would not affect the calculation of TCR as long as natural variability is accounted for. So solar, volcanic activity, ENSO/AMO etc. are independent of TCR and any measurement of TCR would presumably have accounted for their (presumed estimated) effect upon global temperatures.
The situation we have here is that the cooling effect of man-made aerosols has declined appreciably [since 1951] as CO2 emissions and other GHGs have increased, so we would expect even greater warming, which hasn’t happened. Hence TCR must be lower than previously thought. Of course, it could be argued that natural variability since 1951 has been appreciably greater than that which is estimated by the IPCC, and that this may explain part or all of the observed reluctance of temperatures to rise as quickly as they have been predicted to rise using AGW forced models. In which case a higher estimate of TCR could be argued. But this requires natural variability to have contributed a net negative influence on global temperatures over that period. If it has been net positive – which looks more likely – and greater in magnitude than assumed by the IPCC in their calculations, this will put even more pressure on the downward revision of TCR.”
The IPCC refuse to consider the real possibility that the majority of the positive climate forcing (I deliberately do not use ‘warming’ to avoid confusion) we have seen post 1951 may be due to internal and even external variability. As there is very little room to include any negative contribution from man-made aerosols, this necessarily implies that the positive climate forcing contribution from anthro GHGs has been minimal, which brings into question the ‘urgency’ of climate mitigation measures.
“Well, here is how the AR5 states it:
It is extremely likely that more than half of the observed increase in global average surface temperature from 1951 to 2010 was caused by the anthropogenic increase in greenhouse gas concentrations and other anthropogenic forcings together. The best estimate of the human induced contribution to warming is similar to the observed warming over this period.”
I feel the most interesting part of this statement is not the first, but the second. They seem rather eager to suggest that in fact ALL OF the warming since 1951 was entirely our ‘fault’. After all, they go on:
“The observed warming since 1951 can be attributed to the different natural and anthropogenic drivers and their contributions can now be quantified. Greenhouse gases contributed a global mean surface warming likely to be in the range of 0.5°C to 1.3 °C over the period 1951−2010, with the contributions from other anthropogenic forcings, including the cooling effect of aerosols, likely to be in the range of −0.6°C to 0.1°C.”
That should be – according to the IPCC – a net range of anthropogenic ‘contributions’ to the general global temperature rise between 1951 and 2010 of 0.6 to 0.7°C.
So what about ‘natural factors’?
“The contribution from natural forcings is likely to be in the range of −0.1°C to 0.1°C, and from internal variability is likely to be in the range of −0.1°C to 0.1°C.”
That should make up – according to the IPCC – a total natural contribution to the general global temperature rise between 1951 and 2010 of exactly 0°C.
Well then, how much warmer on average – again according to the IPCC (HadCRUt4) – are we today than we were 60+ years ago?
A tad more than 0.6 degrees.
Gee. Doesn’t that fit rather neatly with the attribution assessment above?
So there’s been NO ocean cycle influence whatsoever over this period, the Great Pacific Climate Shift of 1976/77 had no impact at all on global temperatures. According to the IPCC.
Well, they seem pretty confident this is the case. So I’m sure they’ve done all they can to find it. And of course, there’s nothing in the actual, real-world data suggesting that the oceans had a say:
https://okulaer.wordpress.com/2014/07/30/modern-global-warming-in-three-steps-the-fairly-short-version/
Hence, it must be true.
The IPCC gets the award for turgid prose. Just putting in the word “net” where appropriate and listing what “other” is composed of, would have made their explanations actually useful. In other areas of the AR5, they have some of the most unintelligible and unreadable paragraphs I have ever been tortured with.
Seen wobbles? Corrugations? That’s all the Holocene temperature has been: irregular corrugations, ups and downs, fluctuations. Hence all that sea level rise and fall over just a few thousand years. The wobble we are on now is part of yet another corrugation, completely undistinguished. It would be odd if we were not in a dip or rise, since there are no levels.
Not long ago just about everybody believed this…till there was a need to unbelieve it.
The IPCC’s attribution statement is clear, and *refer to the amount of warming that can be attributed to anthropogenic GHG in the 2nd half of 20th century*. This amount is fixed, it is baked in – it has already happened. The statement refers to no other ‘forcings’ or how they are adjusted w.r.t anthropogenic factors. All that can be inferred from the statement is ‘how much of warming is due to human-caused GHG’.
As several have noted above, Schmidt’s writing is usually in the vein of Realclimate. There will usually be a leader paragraph or two attempting to build up as much derision and mockery as possible of the latest person or claim they’ve seized upon, building up as though the utter wrongness involved was so terribly obvious to real scientists. This will be followed by a brief, flash-in-the-pan type of exposition of the rebuttal – usually only a few words long and at best no greater than two-and-a-half sentences. As added bonus, this crucial portion will incorporate odd sentence construction and grammatical errors, and be worded ambiguously enough to allow at least two valid interpretations.This will quickly be followed further long paragraphs of how other research supports the rebuttal and how real scientists would not even consider such a line of inquiry. Both introduction and conclusion will contain numerous links which lead to various dead-ends and red herrings.
Model of clarity of thought and writing, they are not. Schmidt is obviously intelligent but not in the way of promoting open and frank discussion. He cannot go without insulting the opponent in as many ways as possible and resists from providing straight answers, preferring instead to mock-and-run tactics. It is rarely, or never that one learns from him and certainly it is not worth wasting time discussing the IPCC anthropogenic attribution argument with him. Getting into attribution arguments with Schmidt is a mistake.
> There will usually be a leader paragraph or two attempting to build up as much derision and mockery as possible of the latest person or claim they’ve seized upon, building up as though the utter wrongness involved was so terribly obvious to real scientists.
Otters call this blogging, e.g.
https://nigguraths.wordpress.com/2015/01/07/the-edf-vs-brazil/
When blogging has a back story, some otters call it investigative journalism.
All that’s worth it only if the main substance of the argument, especially when you’re building up as though there is such a main rebuttal, is not so poor. Realclimate’s build-ups mainly serve to mislead and draw astray.
So all the derision and mockery are “worth it” if the “main substance” is “not so poor,” Shub?
You’d better start with the “not so poor” part first, Shub, instead of begging it.
Judith –
VTG has an interesting comment above, where he states that:
Now I recall you stating publically that someone would be “fooling themselves” if they thought that ACO2 “dominates” (corrected from your original assertion of “influences”) on decadal or centennial scales…
But VTG’s numbers indicate that you made that statement even when the paper you was in the process of getting published indicates that ACO2 in fact dominated climate on a decadal scale over the past 6 decades or so.”
Would you mind clarifying? Are VTG’s calculations incorrect? Is there a contradiction between your public statements and your published analysis?
You assume TCR is a meaningful term. She did an exercise that basically puts a limit on TCR over the past ~135 years.
It assumes that natural warming can not coincidentally correlate with CO2 and that TCR is a constant.
She made the calculation assuming that all warming was forced.
Lewis and Curry give TCR 1.05 – 1.8 as the 17-83% range; TCR 1.33 is the midpoint
Plug the numbers in and you get:
TCR % of warming attributed to Co2
1.05 49%
1.33 62%
1.80 84%
Joshua, did you ‘plug the numbers in’ and reproduce the % attributions? Or do you just agree with VTG? Where did he plug them into?
I don’t remember what numbers I got, but they were similar.
aaron, please show your work, Joshua wants to know.
In fact it is worse than that. This TCR is just due to CO2, not the total anthropogenic effect which is taken to be 20-30% higher, so Lewis and Curry have confidently put anthropogenic effects above 50%, and the CO2 alone would have an 80% chance of being more than 50%. This is not surprising because Lewis and Curry made no assumption about the sign of natural variation in the periods that they chose, so their range centers on 100%.
JD,you misunderstand. As TCR was calculated, it would be reduced by other forcings.
did them on another computer and didn’t save. I’ll redo if I can, but I have a job and severe chronic pain.
aaron, but then with a TCR of 1.33 and their forcing change of 1.38 W/m2 you get 100% of their 0.49 degrees since the 1930-1950 base period. I would count this as a 100% attribution to the anthropogenic forcing change, which was then actually their assumption in coming up with 1.33, so it is circular. Their low end also ends up being well above 50% because it is more than half of 1.33. If they chose a 1950 base like the IPCC, the temperature change for less forcing would be nearer 0.7 C, which is how the IPCC gets a much larger sensitivity. 1950 is arguably a better base temperature because 1940 was clearly near a local peak.
Let’s look at that TCR. 1.33° for a doubling I believe is the correct term. I also believe the TCR is the immediate response.
According to the NCDC from 1985 to 2003 things warmed about 0.45°C.
Jan 1983 342.87 PPM December 2003 375.93 PPM.
We’ll assume that forcing is a log function, the CO2 portion is assumed to be.
1.33 = x ln (2), X = 1.92
1.92 ln (375.93/342.87) = 0.177°C. 0.177/0.45 = roughly 40%.
Roughly 40% of the 1983-2003 warming is due to CO2 if TCS is 1.33.
Then they have chosen 100% attribution for the period since 1940 with no natural variability to get their number of 1.33. Seems the attribution percentage is very dependent on what start and end dates you choose for your no-natural-variability period. If I choose the period you used, and get the sensitivity from there, it becomes over 3 C per doubling, but this was a fast-warming period that is probably too short for a meaningful ratio.
Well JD, I just grabbed dates that captured the start and end of the 20th century late warming. It was an attempt to see how the numbers play out.
You might be right about the 100%. But if CO2 only caused 40% of the late warming we could actually see some cooling later this decade.
Well, we’ll see what happens by 2020. A couple of cooling fans predict cooling by 2020.
Joshua, I’m not sure Judy can reproduce VTG numbers any better than you can. He left very little direction as to how he arrived at them. That part just seems to have been glossed over. Doesn’t that seem odd for a ‘realist’?
“But VTG’s numbers indicate that you made that statement even when the paper you was in the process of getting published indicates that ACO2 in fact dominated climate on a decadal scale over the past 6 decades or so.”
I guess we are taking VTG calculations as fact… Apparently without checking ourselves. Seems like a selective use of skepticism to me.
John Carpenter –
==> “I guess we are taking VTG calculations as fact…”
????????
Two explanations for crickets.
1. Nobody knows the answer to your brilliantly conceived and artfully constructed question. The audience is cowering in fear of your revealing teh awful truth.
2. The audience was bored with the show and your question made no sense. They left you alone with the crickets.
Hi Tom –
Since you cared enough and were interested enough to read through the comments and write a response…..I’ll ask you.
Are VTG’s numbers wrong – or was Judith making public statements that were in direct contradiction to her published analysis?
Are you a man or a cricket, Tom?
” or was Judith making public statements that were in direct contradiction to her published analysis?” – Joshua
This is the entire Curry MO.
Judith engages in rhetoric in the media and on her blog (and others’) that is in contrast to her scientiffic output.
She’s rather taken by the idea that she might be considered a ‘heretic’, and seems to think she is a bit of a mavrrick, while her scientific publications are nothing but mainstream.
There’s this latest paper with Lewis, with Judith talking it up in terms of a challenge to the IPCC summaries, yet it sits within the IPCC range of results.
Michael, so how did VTG calculate the attribution percentages? If you know, let out with it. Joshua wants to know. Any denizen will do, I would expect the realist denizens to easily produce this information for Joshua than any of the skeptic ones. I would think the realist denizens to help out Joshua instead of leaving him flapping in the wind at the mercy of the skeptical denizens. Help your friend out for goodness sake!
John,
What are you babbling about?
It shows that it could be close to 100%. It’s an upper bound. It doesn’t account for the multi-decade quasi-cyclical warming (eg, frequent el ninos during 80s and 90s).
Nor multi-century warming trend which may be continuing.
I don’t know if this is correct, the internet came up with a bunch of non-sence when searching for a good formula.
=1.05*LN(400/311)/0.74=0.357101644
=1.33*LN(400/311)/0.74=0.452328749
=1.8*LN(400/311)/0.740=.612174247
Base 2
=1.05*Log(400/311,2)/0.74 0.515188771
=1.33*Log(400/311,2)/0.74 0.652572443
=1.8*Log(400/311,2)/0.74 0.88318075
“What are you babbling about?”
Michael, Never mind, you have to be paying attention.
Joshua, VTG didn’t show his work but according to VTG all you have to do is plug in the numbers. You say his numbers, in fact, show that ACO2 dominated climate on a decadal scale over the past 6 years. Based on what calculation? Why are you asking Judy for that info? She didn’t make the calculation, VTG did. Why not ask VTG how he arrived at them. Somehow you put the onus on Judy to show VTG s numbers are correct instead of VTG. Strikes me as an odd way to go about it.
John Carpenter –
==> “Why are you asking Judy for that info? ”
I asked Judith. when she first said we’d be fooling ourselves to think that ACO2
influenceddominated climate change on a decadal scale, whether her public statement would contradict the conclusions of the study she co-authored. Asked other “skeptics” too. Asked “reallists” too.Crickets.
Then I saw that VTG seemed to have an answer – so I’m asking Judith, you, whoever, whether his answer is right.
You see,John – I think it would be a problem if her public rhetoric is in contradiction to her science. I don’t have a problem with advocacy per se. Advocacy is a good thing, IMO – a foundational freedom and perhaps the backbone of our democratic system. But I think that there is a difference between good advocacy and bad advocacy.
Anyway, John – Judith and you or whoever is perfectly within their rights to not give me an answer.
You you a man or a cricket, John?
John –
http://judithcurry.com/2014/09/19/week-in-review-27/#comment-632905
John –
http://judithcurry.com/2014/09/19/week-in-review-27/#comment-630888
John –
http://judithcurry.com/2014/09/19/week-in-review-27/#comment-630856
And John –
I even kindly suggested that she walk back her original statement:
And then she walked it back:
“I think it would be a problem if her public rhetoric is in contradiction to her science”
Oh good, I’m glad to see you are concerned with her public rhetoric potentially being in contradiction with her science. That’s considerate of you on Judy’s behalf. What I don’t understand is why you don’t just figure it out yourself instead of demanding answers from her and everyone else. Ah, but then you wouldn’t be able to make the ‘crickets’ statement and score points. That’s a classic example of a (flawed) skeptical argumentative strategy. i.e. find a potentially conflicting set of statements, demand an explanation/data/proof/calculation etc (but not offer any type of counter explanation/data/proof/calculation OF YOUR OWN, then get no response and finally apply “crickets” to the situation with the inference that Judy (climate scientist) doesn’t know how to answer the question and is now ignoring me…. a gotcha tactic.
“You you a man or a cricket, John?”
Well, like you Joshua, I’ll stay crickets on the calculation accuracy wrt % attribution of ACO2 (opposed to my deep inclination to stand up to your challenge to my manhood because naturally pandering to machoism is definitely the next best step in promoting good dialogue). Really Joshua, I’m just concerned about your recent employment of (flawed) skeptical argumentative strategy being in contradiction with what I typically observe as your stance on the use of (flawed) skeptical argumentative strategies. Gotta love the denizens here at CE.
John –
Reply got caught in the moderation filter. I’ll try once to find the terribly offensive term, and if that doesn’t work, wait for the comment to be freed from comment prison.
John Carpenter –
==> “Oh good, I’m glad to see you are concerned with her public rhetoric potentially being in contradiction with her science.”
Well, you may have a point there. I was suggesting a “problem” more in her logic than that I’m “concerned’ about contradictions between her rhetoric and her science. That type of contradiction is pretty ubiquitous, so I may have left a drama-queening impression of concern. No, with perhaps walking back the rhetoric, it doesn’t concern me – it is what it is, part and parcel of identity politics in the context of polarized debates that serve as proxy for ideological battles. Not much point in being “concerned” about something being what it is…You know, Buddhist stuff about the illusion of control and all that.
==> “That’s considerate of you on Judy’s behalf.”
Not on her behalf, John.
==> What I don’t understand is why you don’t just figure it out yourself ”
Don’t have the chops
==> “instead of demanding answers from her and everyone else.”
????
“demanding”
That’s funny, John. That’s in the top 10 of my list of the most laughable blog arguments I come across – that asking questions equals “demanding.” As if I have some delusion that I’m in a position to “demand” something of Judith. As if asking questions is “demanding.” I put that right up there with the arguments that if someone strongly disagrees with you about something, or ad homs you, it must mean that your points are valid and hitting home. Ridley and Tol hoisted that argument up the flagpole, willfully oblivious to the ironic (unintentional, of course) implications to their own advocacy. When you ask me questions, John, in blog comments, should I whine that you are “demanding” that I answer? (sorry for the diversion).
==> “Ah, but then you wouldn’t be able to make the ‘crickets’ statement and score points.”
OK I will concede to you the crickets argument. Obviously, if I don’t get an answer to a question there might be any variety of reasons. It could be that my question doesn’t make sense. It could be that my interlocutor doesn’t think the question is important enough to answer. It could be that they just missed it. Or, it could be because they feel that answering the question would force them to concede a point. I actually didn’t think that was the case here….because I actually didn’t know the answer to the questions. If I don’t know the answer, then I can’t have a gotcha. But maybe I was gotcha-f*shing.
If you read my comments on the previous threads, I was surprised to hear that Judith said that ACO2 doesn’t “dominate” (let alone “influence”) the climate on decadal or even centenial scale. My unscientific understanding of the science is that Lewis’ range of sensitivity might contradict such a claim. I asked clarifying questions, along with asking whether she meant CO2 or ACO2 (a question that went unanswered) and asking whether she really meant to say “influenced” (which she then corrected).
I just meant that I asked the question multiple times and didn’t get an answer. I asked it at “realist” sites also. No answer there, until VTG’s partial answer (I’m now not sure it was an answer because of the reference to the paper Judith co-authored, and as has been pointed out, that paper may just be an argument based on certain assumptions that would make my question inapplicable, although the question as to whether Judith’s assertion about CO2/ACO2 “dominance” is in contradiction to Lewis’ range of sensitivity may still be a valid question, I think).
Anyway, my experience with Judith and her fellow “skeptics” is that they will never feel that they have to concede a point – no matter if the answer to a particular question exposes a logical inconsistency – they will just spin and go about their merry way. Sameolsameol. So there never is a “gotcha” in these discussions because no one ever thinks they’re wrong.
==> “That’s a classic example of a (flawed) skeptical argumentative strategy. i.e. find a potentially conflicting set of statements, demand an explanation/data/proof/calculation etc (but not offer any type of counter explanation/data/proof/calculation OF YOUR OWN, then get no response and finally apply “crickets” to the situation with the inference that Judy (climate scientist) doesn’t know how to answer the question and is now ignoring me…. a gotcha tactic.”
Yeah. I’m saying that it isn’t really what I was doing in the way that you’ve portrayed it …but I see where it would have come off that way, and there’s an element of accuracy in your portrayal (in that it was probably gotcha-f*shing).
==> “Well, like you Joshua, I’ll stay crickets on the calculation accuracy wrt % attribution of ACO2 (opposed to my deep inclination to stand up to your challenge to my manhood because naturally pandering to machoism is definitely the next best step in promoting good dialogue).”
Geez. No, John, it wasn’t a slight to your “manhood.” That isn’t how I intended the comment. It was just some playfulness with language. I might have easily said to a female interlocutor, “Are you a woman or a cricket..”
==> “Really Joshua, I’m just concerned about your recent employment of (flawed) skeptical argumentative strategy being in contradiction with what I typically observe as your stance on the use of (flawed) skeptical argumentative strategies. Gotta love the denizens here at CE.”
OK. I concede a couple of points (kinda). I would certainly never argue that I don’t (at least sometimes) employ the same identify-motivated fallacious reasoning as I observe so often in my much beloved “Denizens.”
But I would still like to know the answer to my question. You seem to have the chops.
Is Judith’s statement about it being “foolish” to think that ACO2 dominates the climate on centennial (or decadal) scale in contradiction to Lewis’ 90% CI that goes up to 3.0°C per doubling (considering the magnitude of warming over the last 60 years or so projected out another 40 years)?
So, John, do you share characteristics with a non-demanding question-answerer, or do you share characteristics with a very cheerful winged insect?
John –
Reply got caught in the moderation filter. My attempt to find the offending term didn’t work, so I’ll wait for the comment to be freed from comment prison. I’ll check back later to see if Judith granted a pardon. If not, I’ll try to find the offending word through piecemeal re-posting.
I know you’re waiting anxiously for my response, and don’t want to let you down.
Joshua, thanks for your thorough reply, its one reason why I enjoy dialoguing with you.
###############
==> “That’s considerate of you on Judy’s behalf.”
“Not on her behalf, John.”
I gathered that, it was just a little needle in your side.
###############
==> What I don’t understand is why you don’t just figure it out yourself ”
“Don’t have the chops”
Again, i knew that… another needle… sorry about that.
################
==> “instead of demanding answers from her and everyone else.”
????
“demanding”
That’s funny, John. That’s in the top 10 of my list of the most laughable blog arguments I come across – that asking questions equals “demanding.”
Well, asking one time… no, I agree that is not demanding, not even two times, but three and four times? That starts to look like a demand rather than simply asking a question.
################
“When you ask me questions, John, in blog comments, should I whine that you are “demanding” that I answer? (sorry for the diversion).”
Only if I ask you the same question four times with no answer, yes, you then have my permission to whine about it as I would concede that I have become demanding at that point.
#################
“…because I actually didn’t know the answer to the questions. If I don’t know the answer, then I can’t have a gotcha. But maybe I was gotcha-f*shing.”
Maybe?
#################
“Anyway, my experience with Judith and her fellow “skeptics” is that they will never feel that they have to concede a point – no matter if the answer to a particular question exposes a logical inconsistency – they will just spin and go about their merry way. Sameolsameol. So there never is a “gotcha” in these discussions because no one ever thinks they’re wrong.”
Ah, well that is a human trait that is not exclusive to Judy and her fellow “skeptics”. I have to readily admit to falling victim to that trait myself, though I do try to correct for it when I see I simply had the wrong information or saw the situation incorrectly. No one likes to admit they got something wrong, but OTOH I think too many people take themselves overly seriously thinking their opinions or ideas matter that much. I do respect those that admit when they got something wrong and can change. Sadly it seems rare on these pages.
###################
“Yeah. I’m saying that it isn’t really what I was doing in the way that you’ve portrayed it …but I see where it would have come off that way, and there’s an element of accuracy in your portrayal (in that it was probably gotcha-f*shing).”
Honestly Joshua, I know that to be (mostly) true, I like to flip your argumentative style back around sometimes to see how you respond. Thanks for being candid and again another example of why I enjoy our discussions. I hope you see it the same way and I mean it all in a good natured way.
####################
“…(opposed to my deep inclination to stand up to your challenge to my manhood because naturally pandering to machoism is definitely the next best step in promoting good dialogue).”
Geez. No, John, it wasn’t a slight to your “manhood.” That isn’t how I intended the comment. It was just some playfulness with language. I might have easily said to a female interlocutor, “Are you a woman or a cricket..”
I know you didn’t really mean it that way, but I just couldn’t resist bringing that into the comment. Just too tasty of a morsel to let that one slide…. no offense was taken.
#####################
“OK. I concede a couple of points (kinda). I would certainly never argue that I don’t (at least sometimes) employ the same identify-motivated fallacious reasoning as I observe so often in my much beloved “Denizens.”
Don’t we all?
#####################
“But I would still like to know the answer to my question. You seem to have the chops.”
Thanks, but I hardly have the chops myself. However, the back of the envelope calculation provided by VTG has piqued my interest. I will reserve making comments until I know more.
####################
“Is Judith’s statement about it being “foolish” to think that ACO2 dominates the climate on centennial (or decadal) scale in contradiction to Lewis’ 90% CI that goes up to 3.0°C per doubling (considering the magnitude of warming over the last 60 years or so projected out another 40 years)?
Not sure myself. I am inclined to think that ACO2 would be influential on the centennial time scale, much more than on the decadal time scale. To say it is foolish to think ACO2 dominates the climate on decadal scales is more correct IMO than to think foolish on the centennial. Not sure foolish is the best description and surely a key word you picked up on.
####################
“So, John, do you share characteristics with a non-demanding question-answerer, or do you share characteristics with a very cheerful winged insect?”
Prolly a little of both Joshua…. hows that for staying in the middle?
+1, John.
And John –
Notice that with the criticism pointed my way for asking the question, still no answer….
The crickets abide.
My understanding of statements by the UN’s IPCC are given in this one-page summary of “The Great Social Experiment of 1945-2015″
https://dl.dropboxusercontent.com/u/10640850/Social_Experiment.pdf
The Problem: Totalitarian rule by world leaders and puppet scientists for the past seventy years (1945-2015):
1. Created a false conflict between physical sciences and spirituality.
2. Obscured the Sun’s control over every atom, life and world in the solar system.
3. Destroyed the integrity of science and constitutional limits on government.
4. Left society unprepared to survive 1 AU (astronomical unit) from a stormy pulsar.
The Solution: ? ? ? Must extend far beyond the limits of solar, nuclear and climate science, like problems identified in “The Great Social Experiment of 1945-2015″
This whole debate is hidden behind a curtain of vagueness, and deliberately so. You cannot get to the numbers because of the spinning and Gavin himself is one of the worst culprits in this regard. His announcement that 2014 was the warmest year in the historical record but his failure to explain the likelihood do that was only 38% cannot be seen as anything but a deliberate attempt to mislead the public.
Gavin is a scientist and not only should he know better, he does not better, which makes this transgression all the more serious.
She was turning away to look for the segment with Schmidt and Spencer.
================
Gavin is not to blame for our mental laziness and willingness to believe any nonsense that is supported by 97% of the scientists taking federal funds to write such nonsense. OM
It also follows using the same semantics that:
“It is more likely than not that more than the entire observed increase in global average surface temperature from 1951 to 2010 was caused by the anthropogenic increase in greenhouse gas concentrations and other anthropogenic forcings together.”
Most can probably understand what is meant, but is it a good way to phrase it?
According to the article about Gavin Schmidt and the pause, talking about possible “causes” from the Trenberthian ‘hide and seek’ idea to aerosols, volcanic ash and a weaker sun, the author gives it really gives it away, saying, as follows: “the impact of solar activity and volcanoes does not appear sufficient to explain the problem and the accumulation of deep ocean heat appears to be somewhat elusive – the measured increase in ocean heat content being less than that required to explain the pause.”
See what I mean? The ‘pause’ is a problem. Somehow, government scientists must figure out a way to kick this puppy down the road for another 10 years; otherwise, the global warming gravy train goes off the tracks. Gavin’s solution? He simply pulls prognostications out of his government-paid arse and fabricates a prediction out of out of whole cloth –i.e., global warming due to humanity’s release of CO2 into the atmosphere in 10 years.
Their real problem is, I don’t know of anyone who has the temerity to predict global warming will not resume, given enough time. No one is skeptical of the fact that the Earth has been warming since the last ice age.
Judith, your post is very important. People with dishonest objectives quite commonly manipulate language to achieve deception. For instance, where I live 90% of the water bill is sewer charges.. The actual charge for the volume of water that anyone uses is comparatively very small. However, the water company very deceptively trumpets the relatively small increase in the cost of the water and glasses over the huge increases in the sewer charges that have been mandated by the EPA. Gavin has a habit of being legalistic in a very negative way.
Unfortunately, I am not surprised by Gavin misleading interpretation of the word “most.” There is a legal term “preponderance” that means more than 50 percent but not more than 100 percent. Maybe v very common legal term, preponderance, should be used in this discussion and in other formal IPCC documents.
JD
Agreed preponderance is a much better word here
Quick, write to the IPCC and inform them of this paradigm shift in statisitical understanding!
Brilliant blog-science!!
ATTP and Tobis and Sou are ‘confused’, they think of course 110% is more than half. They think it is even funnier and stupider of me to respond but what if the other piece is 220%? If % are unconstrained between 0-100, you don’t know.
I am thankful to Denizens who are able to see the problems with this. Twitter can be painful, but I would expect better from those with Ph.D.’s in science.
It is important to understand what the standard was in using % and what the intent of the usage was at the time it was written. If the intent was to use an unconstrained standard of %, then the use of phrases like ‘greater than half’ in other attribution descriptions is not consistent with the original intent. Non scientists will have a harder time understanding the concept of % greater than 100 or less than 0. Though its a perfectly valid usages of %, it’s not what the average person will understand if other phrasing used to describe the same attribution use ‘greater than half’ which then constrains % from 0 to 100. It’s a mixed message and It leads to exactly this type of confusion.
> It is important to understand what the standard was in using % and what the intent of the usage was at the time it was written.
Wait. It’s been what, three years now since the Italian flag and nobody took care to go RTFR?
Well Judith, if you think that there could be an “other piece [that] is 220%”, then lay out the evidence for that.
Otherwise it’s just “what if” arm-waving.
Jebus.
Michael – I hate to break this to you in a public forum, but when English speakers use the term “what if,” it means they are positing a hypothetical. Hypotheticals are by nature not proven.
Michael, you need to ask VTG how she arrived at that.
Yes jim, what if the noon is made of green cheese?
I’m not fond of green cheese, but I’m sure Dimowits would want to make a bio-fuel of it.
The 220% comment is very odd. How can ‘the other piece’, presumably the observed warming, really be twice what the IPCC thinks it is? Granted if it really was twice, then anthropogenic effects would be less than half. However, the error bars on the actual warming since 1950 are within about 10%. This is why ATTP was confused by the 220% comment, and so am I.
natural warming 120%
anthropogenic warming 110%
all cooling factors combined 130%
100% of warming accounted for
steven, so if we take away the anthropogenic warming there would not have been any warming at all. Surely this is the definition of mostly anthropogenic.
steven:
“natural warming 120%
anthropogenic warming 110%
all cooling factors combined 130%”
Let’s crank up the sensitivity:
natural warming 120%
anthropogenic warming 330%
all cooling factors combined 450%
If we unleash anthropogenic warming, looks like we have to unleash cooling factors as well. Super power warming meets super power cooling. Kyle Swanson said words to the effect of high sensitivity is the flip side of natural variability. If you let the high sensitivity dogs out (anthropogenic warming 330%), you also let out the super power cooling wolves. I’d have been just fine if we had stayed with a limit of 100%.
Jim, I understand what you think. Now bring something to the table besides your opinion. Don’t bring AR5. I’m looking at their chart that states internal variability is +/- 0.1C. I’m aware of papers that credit more global variability to the AMO than that. They have proven that the AMO isn’t internal variability? They have proven the papers wrong? They have proven the AMO is the only source of internal variability and the papers are slightly too high? What have they proven besides they can make a chart with an unreasonably low range for internal variability?
Jim, that is silly. By the same token if we take away the natural warming there wouldn’t have been any warming at all. You just assume the cooling was natural. Here I was thinking it was all anthropogenic.
Sorry about blasting you for the AR5 graph. That has been irritating me for a while and you were lucky enough to be the one I was responding to when it came out.
Ah, Ragnaar, those lovely curves, death to the alarm. The higher the sensitivity, the colder we would now be without man’s efforts.
====================
> Twitter can be painful, but I would expect better from those with Ph.D.’s in science.
Of course we do:
https://twitter.com/mtobis/status/557934052892610560
We also expect Ph.D’s to reciprocate.
You can’t win an argument like this with that mob on twitter. All they have to say is:
Everybody knows that 110% is more than 50%.
You say something about two halves each being 50% adding up to 100% and they say:
Yeah, and everybody knows that 110% is more than 50%, cause 110 is bigger than 50.
You say, you can only have 100% and they say:
Nun uh. Everybody knows price of football tickets went up over 110%.
You say something about 220% and they say:
Gotcha, you said 220%. Proves we can have more than 100%. Game over.
Dr. Curry ==> At the risk of stating the obvious — aren’t the authors of the original AR4 and AR5 statements alive and well and able to communicate? Couldn’t one just email them and ask them outright to settle this issue of “what they meant?”
It seems a little silly to me to have a long ongoing scientific battle over what “Dr. Lead Author” meant — doing everything *except* asking him [them].
It is not like we are looking at some ancient papyri written in a long forgotten tongue — or arguing over the exact meaning of some apocryphal “saying of the prophet Buddha” [which I spent lots of time doing in university in the 1960s].
The issue is that this statement was crafted in the summary for policy makers, no idea who to ask on this one. One of my points has been the lack of transparency; not only should it be very clear what they mean, but there should be a traceable account of how they reached their conclusion (this was recommended by the IAC).
1. And, from my ethics point-of-view, clear accountability for the wording of the statement itself — exactly who (one to x persons) crafted and agreed to the wording — so that there *would* be someone to ask if we did not find it clear.
2. If this is in fact merely a “policy” statement and NOT a “scientific” statement — and this fact is acknowledged by all involved (is it?) — then why discuss this statement and not the scientific statement from the appropriate science chapter summary?
The issue of concern here is how this gets communicated to the public and policy makers – lots of misleading spin
The scientific concern is the opacity and circular reasoning of the fingerprinting
Judith –
==> “The issue of concern here is how this gets communicated to the public and policy makers – lots of misleading spin”
Misleading spin?:
Hmmm.
Even with your later change from “influence” to “dominate,” we still have the following curiosity:
Misleading spin?
Consider, perhaps, if you advocacy might be misleading – to the extent that perhaps someone like the Chairman of the House Subcommittee on Energy might hear your Congressional testimony and still think that your advocacy is consistent with his views:
Isn’t the real issue that Science has been coopted by UN bureaucrats and politicians to advance anti growth immoral social agendas? Searching for transparency in this snake pit is hopeless. Debating with the obfuscators only leads to more obfuscation.
The question I ask is why are scientists willing to be complicit in this diminution of Science? For some it’s the security of federal funding of incremental BS research. For others it’s irresistible to bask in the public spotlight after years of being ignored.
There is an interesting essay in “Climate Change: The Facts” by Bernie Lewin entitled “The scientists and the apocalypse”. Bert Bolin was one scientist who tried to prevent the cooptation of Science, but unfortunately he was out maneuvered. Today’s IPCC has been perverted by a political process that marginalizes Science and marginalizes scientists who question the orthodoxy.
At one point i was planning a post on Bert Bolin. Maybe I should resurrect this idea
Judith,
I think a post on Bert Bolin would be well worthwhile.
In auditing terms all they needed to do was leave a paper trail. And then hire someone with writing skills to produce a document worthy for the general public consumption.
Dr. Curry ==> I am still hung up on the fact that this is a “policy statement” intended for policy makers, a Summary of the scientific findings, I assume from the Science chapter on Attribution.
Didn’t the Lead Authors of the Science chapter on Attribution give a Chapter Summary, or a conclusion of some kind on Attribution? Doesn’t it follow then that the SPM Summary “must” be based on the Science chapter summary? Can we query the Lead Authors of the Science Chapter re Attribution on what their summary of the actual scientific findings were?
It it really this nutty?
Yup and no you can’t. Is it any wonder they’ve gone so far off track?
===============
The IAC reccomendation was pretty clear.
the IPCC needs to be transparent and traceable.
Some observations. The vast Majority of AR5 consists of SUMMARIZING the science. Recall how many times we have heard that the IPCC doesnt DO SCIENCE.
How does one create a transparent and traceable account of a summary of the science? It pretty simple.
1. You provide the drafts
2. you provide the reviewer comments
3. you provide the author/editorial responses.
You show people how the sausage is made. Over the years the IPCC has improved on its transparency and traceability. The review process has been opened up. Comments are on line. Errata get published. Are they perfect?
Nope. But it’s an improvement over some of the crap in Ar4 that lead to climategate. So credit where credit is do. Certainly it can be improved, but as far as a summary of the state of the science it does pretty good.
However, there are some areas of Ar5 where the IPCC is DOING SCIENCE, despite their protests that they do not do science.
Attribution is just one area. Combining sensitivity estimates is another area.
In both of these areas they fail miserably to establish a record or document a process that is
A) as clear as possible.
B) transparent
C) traceable
D) reproducable.
There are sections of the report that read more like science than a summary of science, sections where the authors have done some work, done some math, compared some results from science, in order to synthesize a viewpoint. Call it analysis, call it science, call it math, call it whatever. It should be easy for anyone ( with the skills) to take the same information the authors took and derive the same conclusion.
Don’t they give best estimates or a range of value based on the results of other studies? I don’t see why you think that it is inappropriate for a review body to do that. Just pointing them to individual papers is not the best way to communicate information o non-experts.
Did I say it was inappropriate?
nope.
“Don’t they give best estimates or a range of value based on the results of other studies?”
you tell me what you think they did.
For example. Show the calculations they used.
Point to the methodology and the data.
My best guess is that I think Steven is indicating “show your work” as my impression is he’s comfortable when things are boiled down to numbers so the trail can be followed clearly.
Oops. Apologies. I didn’t see Steven’s response. But it looks like I got close.
Hey Danny –
FYI, in case you’re interested:
http://judithcurry.com/2015/01/17/week-in-review-37/#comment-666110
Joshua,
Interested and appreciated. Response over there!
Yes Danny
Also don’t trust Joshua to give you a straight answer especially about the science which he admits is over his head
Steven,
Most (+/- 50% :)))) is over mine as well. But you guys are so kind to be so patient with me and I cannot possibly express (in this format) how much it’s appreciated. But just so ya know, Joshua’s response was “uncertain” (as you’ll see if you’re following that thread). Climate humor, who’da thunk it!
Mosher
From my reading of SoD, regarding natural variability and the footprint, the IPCC reports often accept the conclusions of references without explanation, and often does not show its assumptions. When following the reference trail it appears, to me, that the magic of disappearing natural variability is accomplished by an “estimate of natural variability” found in Hegerl et al 1996. That estimate appears to rely, I’m not sure, on a paleoclimate study, Santer et al 1995b, on SST. What are chances of those estimated SSTs being flawed?
Tony, your input would also be appreciated.
Regards,
Richard
Rls
I don’t want to run down attribution stuff.
After 7 years of working on temperature I’m somewhat confident to speak about that.
Other stuff not so much
And dontcha love them curves? The higher the sensitivity, the colder we would now be without man’s efforts.
==================
Mosher
Appreciate that. My comment also describes how the IPCC fails to show critical information and asumptions that is instead buried in its references. Also, do you have an opinion in using proxy SSTs in establishing natural variability?
Richard
rls.
SST proxies.
First lets understand the conceptual problem in attribution.
We would like to do a controlled test.
A: temperature since 1850 with all forcing
B: temperature since 1850 with only natural forcing
C) temperature since 1850 with natural + postive human forcing
But we cant do a controlled test. tere is one earth.
That leaves these options:
A: decomposition. We statistically decompose the records
to try to account for or propose what things were not held constant
and how they contributed.
B. Simulation: run a GCM
C: PUNT.
SST proxy play into A. devil is in the details. not my bag.
Thank you Steven
Richard
With the pause there also has been a hiatus in sloppy scientific thinking. The pause neutered the alarm; and, with the calm society’s cooler minds can more easily be heard above the din of clanging tools of the global warming propaganda-machine.
We see now that the primary accomplishment of AGW theorists was to bring weather reporting from the pages of the newspapers to the halls of liberal academia and Left-leaning government. All that was need was to simply define the weather as the climate.
The government-education bureaucracy for a long time been able to dress up the charade in the trappings of science. Western schoolteachers got by merely repeating the general allegations — often supported by scientifically-groundless representations — of a small group of self-anointed experts of climate.
The Global Scale of the AGW Conspiracy
(according to climate-change denialists)
• Physicists are stupid and/or corrupt
• Planetary scientists are stupid and/or corrupt
• Atmospheric scientists are stupid and/or corrupt
• Oceanographers are stupid and/or corrupt
• Paleo-scientists are stupid and/or corrupt
• Naturalists are stupid and/or corrupt
• Ecologists are stupid and/or corrupt
• Citizen-scientists are stupid and/or corrupt
• Historians of science are stupid and/or corrupt
• Journalists are stupid and/or corrupt
• Military leaders are stupid and/or corrupt
• Business leaders are stupid and/or corrupt
• Religious leaders are stupid and/or corrupt
http://myplace.frontier.com/~monty.fowler/wvpostcard.jpg
Conclusion somewhere there’s stupidity and/or corruption on a intolerable and unsustainable scale
http://coalgeology.com/wp-content/uploads/2011/04/Boone-County-Surface-Mining.png
The waste in treasure and nature and hero’s blood is evident to *EVERYONE*, eh Climate Etc readers?
http://www.faqs.org/espionage/images/eeis_02_img0625.jpg
Is Hansen a climate change denialist?
Denying that his models were wrong?
http://climatewatcher.webs.com/SatelliteEraTemperatures.png
GALLUP:
http://img.thesun.co.uk/aidemitlum/archive/01728/SNN1604P–620_1728824a.jpg
A person whose actuarial life-expectancy
is less than one decade
Question Is wagathon justified — either scientifically or morally — to assert that Pope Francis should focus on THIS world … and THIS generation — and therefore cease to speak of climate change?
The world wonders!
After all, there won’t be any observable climate-change in Francis lifetime!
The world has cooled since the days of the Romans. Should we worry now?
http://icecap.us/images/uploads/Yanetal2014b.jpg?w=400
I have had a chance to read Gavin’s post at realclimate. He is saying that “most” can be more than 100% because without C02, the world temperatures would have cooled. If that is the case (curious how he would really know that), then we need to have a discussion about the potential beneficial elements of CO2 and how it, to the advantage of humanity, prevented cooling. We also need to have a discussion about the negative impacts of cooling and how to prevent it.
JD
Judith
Are humans responsible for all or part of the warming?
For what its worth I will make some observations that relate to my work on reconstructing CET ( currently back to 1538)
In order to minimise annual error bars in my work and also to look at a period greater than a decade, I decided to see what the average annual temperature would be experienced by someone living a three score year and ten life span. That is to say, if someone was born the first year of a decade and died the last year of the decade 70 years later. I started at 1540 and continued calculating each decade until 1960 slicing them into 70 year periods.
The time scale included the worst periods of what we know of as the Little Ice age (LIA) a term that has little scientific meaning but should perhaps be better known as the LIIA- Little intermittent ice age- as there was no monolithic cooling for 500 years .
Curiously, at no time did our 70 year old drop below a 9 degree average for his life span. the reason being that although he experienced some extremely cold decades he also experienced some very warm decades, The coldest 70 year span was that beginning with the man born in 1680 which included the coldest decade in the record.
The 70 year span oscillates around 0.3c degrees from coldest to warmest. In my records I had a note for 1880 which reads ‘official end of the Little Ice Age.’
From 1880 onwards the previous warmest 70 year span in the record back to 1540 were exceeded, and each decade since then has been warmer than the previous decade. Consequently the man born at the start of each successive decade since then, and living 70 years, has known an increasingly slightly warmer lifespan.
I can only go by estimates for the man born in 1950 and 1960 for obvious reasons, which are based on completed decades plus the few years since the 2010 decade started.
This includes a short period of sharp cooling in the UK around that time. Remember me complaining here that my tomatoes wouldn’t ripen?
As a consequence, to date, the person born in 1950 or 1960 has a very similar estimate at around 9.77C This is some 0.5 degrees c above the figure for the man born in 1590.
Two observations-the increase over that 420 years is surprisingly small and remains within the 9 degree range for each 70 year period.
Every one of those seventy year long lifespans since 1540 had at least one little ice age type decade and some of them had several, bringing down the overall average considerably.
Since 1880 there has been no little ice age type decades, that is to say whatever caused the cold perturbations had ceased by 1880. Although we have had a number of random extremely cold years of LIA proportions, there has been nothing that has extended into a decade or more.
So IF humans are responsible for warming
a) it has been of very small proportions to date
b) The warming effect can be observed from 1880. Can AGW be backdated to that time?
As a caveat- and my research and resultant calculations are by no means finished- From 1540 the temperatures generally rises again to some very warm decades in the middle of the 14th century and again during the period we know of as the MWP-approximately 850 to 1190 AD with few catastrophically cold decades to counter them
Whether the man of 70 will be experiencing warmer temperatures than now during either of those periods I can not yet say in this just for fun, not intended to be a scientific theory, post
tonyb
Tonyb, one big stunt of alarmists is to state that we are not living in our grandparents’ climate. It’s true, of course. What they omit is that our grandparents were not living in their grandparents’ climate. Rather a large omission.
Since the present geological epoch has consisted of nothing but some twelve thousand years of temp and sea level fluctuations, some bigger, some smaller, it’s hard to imagine a 70 year old not going through a few climate shifts in his lifetime. (And by shift I mean one inconsistent, just definable trend giving way to another inconsistent, just definable trend.)
But mentioning the true (and screamingly obvious) nature of the Holocene is a real conference-pooper. Who wants to be the Grinch who stole Climate Summit? And the next biggie is in bistro-land by the Seine!
Pingback: “More than half” is the same as “> 50%”! | …and Then There's Physics
And another thing,
Was SO2 responsible for 105% of the non-warming?
Test your knowledge:
True / False — Global warming is more about politics than science.
| ANSWER |
Try thinking of it this way.
By overeating you have gained weight.
It is most likely that most or all of your weight gain is because of your overeating.
If it was not for the exercise you did, the food you ate might have made you even fatter.
It is unlikely that 50% of your weight gain is Natural variation or a Stadium wave.
The man/lady with no name says:
“It is most likely that most or all of your weight gain is because of your overeating.”
It couldn’t be hormones, or variations in cloud cover.
You established at the get-go that by overeating you have gained weight so that’s a given but putting the connotation of ‘overeating’ aside for the moment, how does that necessarily eliminate the likelihood that the weight gain may be due to Natural variation or a Stadium wave if, for example, you were 20 pounds underweight before you began ‘overeating’ or if you habitually ‘overeat’ every winter?
What might usefully be included is a definition of attribution. Perhaps naively, I should take attribution as an explanation of what has actually been observed. Not an account of what might have been observed (more warming), if something else had not occurred (aerosols?), AR5 Fig10.5.
The ‘problem’ of the unchanging climate for government scientists in the Climate Change Establishment — champion prognosticators like Gavin Schmidt of NASA — isn’t that they’re now admitting the pause in global warming by predicting 10 more years of it but that by then it will have been 27 years of no global warming… or, the pause will have lasted for 27, 30 or 37 years — depending on whether you choose the surface temperature record or one of two satellite records of the lower atmosphere (Refering to the 2014 Ross McKitrick study in Open Journal of Statistics: …Duration of a Trendless Subsample in a Global Climate Time Series).
What percentage of the missing hot spot is attributable?
The problem with reductionist logic is –e.g., WWI (1914-18), the war to end all wars, was followed by WWII (1939-45). So, obviously… the Third World War is overdue.
Hopefully, no one has put this up yet, from the article:
…
Much is being made of the “global” surface thermometer data, which three-quarters the way through 2014 is now suggesting the global average this year will be the warmest in the modern instrumental record.
I claim 2014 won’t be the warmest global-average year on record.
..if for no other reason than this: thermometers cannot measure global averages — only satellites can. The satellite instruments measure nearly every cubic kilometer – hell, every cubic inch — of the lower atmosphere on a daily basis. You can travel hundreds if not thousands of kilometers without finding a thermometer nearby.
(And even if 2014 or 2015 turns out to be the warmest, this is not a cause for concern…more about that later).
…
http://www.drroyspencer.com/2014/10/why-2014-wont-be-the-warmest-year-on-record/
And …
…
No One Has Ever Felt “Global Warming”
If you turn up your thermostat by 1 deg. F, you might feel slightly warmer in the few minutes it takes for the warming to occur. But no one has felt the 1 deg. F rise in global average temperature in the last 50 to 100 years. It is too small to notice, when we are routinely experiencing day-night, day-to-day, and seasonal swings of tens of degrees.
The Urban Heat Island Effect Has Hopelessly Corrupted the Land Thermometer Data
Most thermometers measure temperature where people live, and people tend to build stuff that warms the local environment around the thermometer.
Called the urban heat island (UHI) effect, most of the warming occurs long before the thermometer site actually becomes “urban”. For instance, if you compare neighboring thermometers around the world, and also compare their population densities (as a rough indication of UHI influence), it can be easily demonstrated that substantial average UHI warming occurs even at low population densities, about ~1 deg. F at only 10 persons per sq. km!
…
http://www.drroyspencer.com/2014/12/2014-a-record-warm-year-probably-not/
I guess a little off topic, but the POTUS talked about climate change in the state of the union. No surprise he used 2014 as the hottest year on record, and the last 14 of the 15 in this decade as the hottest as his platform to take aggressive action against CC. Smattering of applause.
I’m watching the Republican response. Simplify the tax system! Yes!
Oh, BTW the US is pumping more O & G out of our ground than ever and reducing our dependence on foreign sources. That was a good thing at the beginning of the speech, making lots of jobs and such. Kinda at odds with the CC bit about the need for aggressive action needed that came much later at the end of the speech. Though I have to admit he didn’t actually say the aggressive action was to reduce O & G (which by the way supplied lots of new jobs and reduced foreign source dependence that he happily took credit for at the beginning) but it’s kinda implied as the best way to reduce carbon emissions.
Capital spending by O&G WAS about 20% of the S&P. That’s why stocks haven’t celebrated the drop in crude to the extent you might expect.
https://d262ilb51hltx0.cloudfront.net/max/1200/1*zP5xtVRfM_OvslibuDOQ4w.jpeg
Obama said he not a scientist either, but he listens to the ones at NASA and NOAA and universities.
Not all of them
Probably 97% of them are at these places.
He’s not an economist, but he listens to Krugman. Go figure.
He’s not a leader, but he’s President. Sadly.
He put forth some policies like middle-class benefits, paid sick leave and childcare support that are apparently highly unpopular among today’s Republicans. They were also stoney faced when told about the recovery in the American economy and employment as though they disapproved of the success.
“NOAA said there was a 48% chance that 2014 was the warmest year…” I don’t think he’s listening to the NOAA as he said what he said without qualifying it. One commentator mentioned that while Clinton triangulated with an opposed Congress, President Obama is doubling down. Clinton more moved to the middle.
The middle class needs high paying jobs, not another government boondoggle that takes from one group and gives to another. You and the other Dimowits are totally clueless when it comes to unintended consequences. The rich have the wherewithal to leave the country. Why don’t you understand that? The same for companies. You are amazing.
Obamacare taught the middle class to read the fine print on all promises of free lunches. Last night’s fine print for the middle class was that he says he’s giving goodies to the middle class (that they don’t want – government day care and community college?) but he’s taxing their savings to make it happen:
http://www.forbes.com/sites/ryanellis/2015/01/19/obamas-new-state-of-the-union-tax-hike-on-middle-class-529-college-savers/
Likewise, the middle class knows his new taxes on investment will impact both their 401k and the willingness of the companies they work for to invest in growth.
Finally, for those who’ve been paying attention, the SOTU just confirmed the death of Keynesism- Obama boasted that the deficit fell and the economy grew. The deficit fell after the sequester, which he opposed by saying the economy wouldn’t grow when government cut spending. Ooops.
Yep, every time Obumbles fines Bank of America 10 billion, he is also nuking the return on teacher pensions, state pensions, 401Ks, IRAs, and other people’s retirement. He is an idjiot.
And of course his zero interest rate policy is nuking the same people.
That’s how it starts, Judy.
haha.. willard has caught Joshua’s disease
Don’t worry, the Moshpit. I won’t warn twice.
The truth hurts, eh?
https://d262ilb51hltx0.cloudfront.net/max/800/1*h4Q1qriWeFtAmhmTGOZgXA.png
can’t address Joni Ernst as a professional with an argument that needs to be discussed, eh Willard? Must be the war on women I keep hearing about.
The truth hurts, eh?
Nice ad hom, Willard.
For anyone silly enough to think Willard might by saying something real, here’s a transcript of Joni Ernst’s response to the SOTU:
http://www.politico.com/story/2015/01/gop-response-transcript-joni-ernst-gop-response-114423.html#ixzz3PTRSOVHT
Number of times the word “pig” (or any related word) appears? Zero, of course. The auditor says “look! invisible squirrels!”
Elitists like Willard look down their nose at people like Joni, a farm girl. He also despises people who go to rodeos, church, NASCAR races, you know, common people – pretty much anyone who Williard sees as not part of the intelligentsia.
That’s really tacky, willy. What would your feminista pals in academe think of you? Well, they won’t find out that you are a little anonymous blog character with no scruples or class.
https://d262ilb51hltx0.cloudfront.net/max/1200/1*WD3wrTyR_BgILAQ-eMAw_w.jpeg
haha. it’s so funny to watch the king of climateball lose it.
utterly lose it.
maybe he will bully brandon again.
dude needs to get an injection of honor.
https://d262ilb51hltx0.cloudfront.net/max/1200/1*PcZIOr67OdZxUx_wWzT4ng.jpeg
That’s a good one, willy. The C in C doesn’t want to be held responsible for leaving chaos behind in Afghanistan, like he did in Iraq, until he is out of office making the big bucks. He’s leaving behind an ever decreasing small force that won’t have enough boots on the ground to protect the perimeters of their logistics bases. Obama is only slightly more popular with the troops than Osama was.
That one is good, Don Don? Fascinating.
How about that one:
https://dekerivers.files.wordpress.com/2009/09/c1.jpg
?
That’s not even a cartoon, willy. Parent’s don’t need the gubmint to instruct kids to mind their parents. Everybody agrees with that, except those who think gubmint knows more than parents and cares about kids more. The same group of clownish thinkers, who don’t want gubmint in their bedrooms.
Hit me that in the middle of the night why the more than 100% percent thing really bothers me. It presents numbers in a way would sow confusion where we might otherwise have had understanding.
Imagine two heaters in a room. The first left to itself would increase the room temperature by 4 degrees. The other left to itself would increase the temperature by 8 degrees. If there were other factors present such that the temperature in the room only rose by 2 degrees, does it make sense to sys one accounted for 200% of the observed rise and the other 400%? If the othe factors offset so the rise was 8 degrees, is it edifying to say one accounted for 50% and the other 100% of the temperature rise? If you are not only talking about one of the heaters the numbers are very misleading.
Now imagine that there are various unknown sources of cooling and heat and that you are apportioning percentages to sources based on only the know subset of factors- the numbers transition to meaningless pretty quickly.
It seems obvious that one should list the factors and degree of cooling for each and do the same for those that warm. Then we can say 50% of the warming factors are anthropogenic. They will total 100% as expected.
But the cooling factors could still be twice as potent as the warming ones.
Here is the big implication if I am thinking straight. If in general natural trends were, all else equal, causing the overwhelming majority of heating and GHG a minority, but some temporary identified factor caused cooling, this strange inummerate way of speaking would allow you to say more than 50% of the observed warming is caused by GHG. It would be equally true (actually more true) to say natural forces caused more than 50% as well (or maybe more than 100%). But if we only say one and not the other our words have served to misinform.
Heh, ‘Served to Misinform’. There’s an epitaph.
==============
Good summary, P.E.
That’s fine, PE. But the effective argument against the 110% warming BS is to demand the proof. Give them an analogy. It has often been said by a kindly coach that his team has put out a 110% effort, while losing the big game. Where is the evidence that they put out 110%? They freaking lost. They looked like they were on pause.
Hey, let it be. For that argument to stand, most likely the Earth has cooled naturally. I think they’ve got it!
===========================
Am I just naive to expect that the finest brains in climate should be able to explain their ideas simply enough so that an educated outsider could understand on first hearing?
And that they should be able to do so unambiguously?
Especially as they have five years or more between IPCC reports and endless review meetings to think about them?
Because this seems to be yet another example of climos speaking with forked tongue.
I would advise that if they don’t want to be thought of as a bunch of spivs and shysters, their best defence is to stop behaving as if they were.
+1
One important development since the TAR is the apparent unexpectedly large changes in tropical mean radiation flux reported by ERBS (Wielicki et al., 2002a,b). It appears to be related in part to changes in the nature of tropical clouds (Wielicki et al., 2002a), based on the smaller changes in the clear-sky component of the radiative fluxes (Wong et al., 2000; Allan and Slingo, 2002), and appears to be statistically distinct from the spatial signals associated with ENSO (Allan and Slingo, 2002; Chen et al., 2002). A recent reanalysis of the ERBS active-cavity broadband data corrects for a 20 km change in satellite altitude between 1985 and 1999 and changes in the SW filter dome (Wong et al., 2006). Based upon the revised (Edition 3_Rev1) ERBS record (Figure 3.23), outgoing LW radiation over the tropics appears to have increased by about 0.7 W/m2 while the reflected SW radiation decreased by roughly 2.1 W/m2 from the 1980s to 1990s’ AR4 3.4.4.1
The warming from 1944 was 0.4K – at 0.07K/decade. Even from 1950 – a cherry if there ever was one – the rate was 0.1K/decade. In the extremely unlikely event that it was all anthropogenic – who gives a rat’s arse.
Climate change is certainly dominated by natural variability on decadal scales – and most likely centennial as well. The plateau will persist – and the next shift seems set to be to yet cooler global influences as a solar downturn is amplified through terrestrial systems.
A number of people asking for a derivation of the calculation and question posed to Judith above.
I make no claim for origniality or accuracy and would happily be corrected.
But for due diligence and audit:
dT(anthro) = (TCR/ln2)*ln(Ci/Cf)
This neglects other anthro influences.
dT = change in temperature for a change in CO2
TCR = TCR
Ci=initial CO2
Cf = final CO2
1950 CO2 = 309ppm*
2010 CO2 = 390ppm
*2010 CO2 is from Mauna Loa data – the Keeling curve. 1950 is extrapolated back from the Keeling curve which only starts in 1958, so that number will be slightly wrong.
Lewis and Curry give TCR 1.05 – 1.8 as the 17-83% range; TCR 1.33 is the midpoint
Plug the numbers in and you get:
TCR % of warming attributed to Co2
1.05 49%
1.33 62%
1.80 84%
I’m aware there is an element of circularity in the argument in that the 1950-2010 period is a subset of the data used by Lewis and Curry.
But it makes the point that if you wish to ascribe <50% anthro to 1950-2010, you have to have an unrealistically low TCR, lower even than the low side of the lowest methodology.
VTG,
You didn’t address the issue I asked you about that you are assuming all the increase in CO2 concentration is due to human activities. As I and others pointed out, CO2 concentration increased during previous warming too. This needs to be taken into account. You have not explained how it is taken into account.
Peter,
as I said to you, before, the anthropogenic attriibution of the CO2 rise is unequivocal, and a simple fact. If you doubt it, I’d suggest some simple research first. AR4 had a section specifically on this, I don’t recall AR5.
If you wish to debate that the CO2 rise is anything other than due to human activity, you need to find someone other than me, I’m not interested.
Similarly as with temperature, you must understand previous rises and falls of CO2 before declaiming on this one.
============
VTG,
Sorry, if you can’t answer the question in simple language, and simply resort to “trust me, I’m from the Climate Cult, and I know best, peasant” that’s just appeal to belief. Of course you have no idea what happened in the Roman and Medieval Warm Periods.
If you dodge simple questions like this, why should anyone trust anything you say? (especially since your source is RC and un-SkepticalScience).
Peter,
– I have not called you a “peasant”, or indeed any other name
– the only references I have suggested for the anthropogenic nature of CO2 are AR4 and AR5
– the only reason I pointed you to RC was to a specific interaction with Gavin Schmidt. If you truly want to understand the issue, listening to Gavin would be well advised, whether or not you agree with him.
To call me a “cultist” because I accept proven science is an interesting approach to learning.
I accept the laws of motion and thermodynamics. Does that make me a cultist?
Neither me, nor anyone else here is under any obligation to you Peter.
if you want to understand the anthropogenic nature of CO2, go do some research, and good luck.
VTG,
You demonstrated you are a climafte cultists because you hold beliefs and when asked questiosn about them, that you should have thought through yourself and be able to answer you used the usual method used by the cultists to avoid answering: you said it’s fact, proven, and go find out, trust me, or things like that.
I do not trust anyone who can’t answer a simple question in simple language without resorting to the sort of nonsense you resorted to.
It’s presumptuous of me, VTG, but your time might be better served wondering why a smaller percentage of CO2 emissions is staying in the atmosphere each year, and pondering the implications of that declining curve.
====================
Having handled lots of CO2, I can vouch for the very obvious fact that freezing or injecting into cold water are the only ready ways to contain it for long outside a sealed space. Only ways that I can think of, at least. Water warms and bye-bye CO2. That’s why your deluxe onion soup done with champers won’t fizz. Even a lot of alcohol stays the course of cooking, but that gas has gone in a trice. (I know this is terribly obvious, but so should Holocene climate fluctuations be obvious. So should the utter boring normalcy of the present warming be obvious.)
So you have some general warming (yet again) on a watery planet and consequently a bit more CO2 to add to whatever we belch? Makes sense. (Apologies for the humans belching, the ppm and all that. If it causes any real probs, we’ll use more nukes in future.)
Of course, there’s also the small matter of the actual Earth, and what it spits out. But that actual hot, porous ball called Earth must be a small matter because it is so studiously ignored by so many studious people. (Can’t really blame them, when you consider the access problems.)
I really hope there has been some global warming lately. Just so I know it’s the same planet it’s always been. Sort of a security thing with me. Also, those last coolings were a bit brisk, even the pea-shooter cooling of the ’70s had ’em squawking. Probably better off out of that, though I prefer the cool m’self. Particularly bad for Africa, and we don’t want to stir up those celebs.
That’s some good stuff, there, Moso. Historically, vulcanism has failed to keep up with the solar/biomic sequestration of carbon, long term. Short term? Oh, yeah, sure they know that. If you don’t, go do some research and good luck.
Let me show you, and listen carefully, to the symphony of models which demonstrate it. Er, uh, will demonstrate it.
=========================
Disappear the MWP, disappear past CO2 variability. Short of doing that it is difficult to make the correlation between CO2 rise and temp rise in the last quarter of the last century appear necessarily causal to anyone but morons.
Whoa, I’d better unpack that paragraph a little. No, go ahead, figure it out; it’ll do you good.
==================
verytallguy, your formula is messed up. This is an example of what your formula would give:
That’s obviously wrong. I assume the formula you wanted was:
Which would give dT(anthro) values of .35, .44 and .60, fitting the values you give if we take dT(anthro) to be ~.7.
Which isn’t to say I agree with using the formula. I think that calculation is beyond naive, but I also think we ought to be clear on what the formula is.
Brandon,
you’re right, the Ci and Cf are the wrong way around. Thank you.
It was deliberately intended to be a naive calculation, just to illustrate a way of thinking of attribution.
Interested if you think there is anything fundamentally wrong with it as an approach.
verytallguy, you didn’t just mix up the placement of Ci and Cf. You also misplaced the ln(2) part of the equation.
As for what’s fundamentally wrong with the calculation, there are about a hundred different ways the thing is wrong. The three broadest issues which come to mind are it ignores every forcing save that caused by CO2, completely ignores the time domain and is highly dependent upon endpoint selection. I’d normally ignore all that as it’s a crude approach, but you said:
Which is only true if one ignores how crude your approach is. Your approach cannot possibly demonstrate what you believe is actually true.
Faith fears Nothing!
===============
Brandon,
we both have ln2 on the denominator, so I think you’re mistaken on that.
“it ignores every forcing save that caused by CO2”
– yes, which I specifically pointed out
“completely ignores the time domain ”
– it implicitly assumes that forcings are rising during the period in line with the definiton of TCR. Which is approximately correct
“is highly dependent upon endpoint selection”
– in what way is this different to any other methodology looking at attribution over a period of 60 years?
Brandon, this CO2 monomania is a common theme in general and in specific. It is one of the biggest flaws in the models, it permeates the faith, er belief, of many of the individual commenters here.
How can so many misconstrue the petri dish for the world? These are bright people. Why the apparently willful ignorance? Fear? Guilt? Urges for money, fame or power? We owe it to ourselves to figure it out.
Our grandchildren will thank us.
====================
verytallguy, you’re write about the ln(2) part. You placed it in a different spot than I normally see it (as it isn’t tied to the TCR component), but the math still works out the same.
Pointing out your approach uses an assumption does nothing to establish that assumption is justified. I don’t see a need to establish the fact you stated an assumption in order to say your methodology relies upon an assumption, but if you want to, okay.
I’m not sure just what assumption you think you’re using, but simply saying something is “approximately correct” doesn’t automatically mean it is fine. Unless one has a decent estimate of how much an assumption affects the results, the assumption can’t be relied upon.
Saying you don’t know how to do something right doesn’t justify doing it wrong. It also doesn’t require other people figure out how to do it right before pointing out you’re doing it wrong. At a minimum, you ought to try multiple endpoints and see how it affects your results.
VTG
“It was deliberately intended to be a naive calculation, just to illustrate a way of thinking of attribution.”
You might want to inform Joshua who has been hounding judith.
Further, as was mentioned in the discussion of Judiths paper the
calculation assumes zero natural forcing over the time period n question.
basically Judith is accepting the IPCC attribution as fact and merely calculating a sensitivity GIVEN that.
So accpting something for the sake of argument differs from believing it.
The naive had to be told that Curry and Lewis was also based off of AR5. Some of them still didn’t get it, but those were not the naive.
=======================
Steve Mosher,
Joshua’s comments are his responsibility, not mine – feel free to take that to him if they are an issue for you.
I agree with
“Further, as was mentioned in the discussion of Judiths paper the
calculation assumes zero natural forcing over the time period n question.” and noted something similar myself upthread, although the time period for Lews/Curry is considerably longer than that relating to the IPCC attribution statement.
I would be very interested to hear if Judith thinks the Lewis/Curry reported TCR PDF overestimates the “real” TCR – and why!
Other methodologies all seem to report significantly *higher* sensitivities – there’s a nice figure somewhere in AR5 showing this, but I can’t immediately locate it.
So to disagree with the IPCC attribution, TCR needs to be lower than the lower bound of all methodolgies.
“Extremely unlikely” seems about right for that eventuality
Vtg
Wrong again.
Read more
Comment less and go help Joshua.
“Other methodologies all seem to report significantly *higher* sensitivities – there’s a nice figure somewhere in AR5 showing this, but I can’t immediately locate it.”
There is a good reason for your faialure.
Some help.
1. Nic picked an approach that has been previously vetted by the IPCC.
He used a method that they liked before when that method gave
“the right answer”.
2. ALL the methods assume a natural variation response that sums to
zero over the period of interest. Judith actually challenges this
assumption in her other work, but accepts it for the sake of argument
in the Lewis paper.
3. The Lewis Curry result is itself subject to a dataset selection bias.
The answer their method gives will likely go up when the following
is considered.
A) a better temperature record ( C&W or berkeley ) both of which will
increase the numerator ( that thing on the top)
B) a better OHC record ( see the recent paper on sea level which
will effect their estimates of OHC ( the denominator thing )
C) revised forcing due to aerosols from small volcanos.
All those will force the lewis/curry estimate up.
There is an interesting exercise to perform to reconcile sensitivity debates
with attribution debates.
You havent done anything to illuminate that issue or contribute to that debate.
Rather you dumped a math turd on the conversation.
and joshua ran around with your turd in his mouth.
I expect willard to come along and say it doesnt stink.
You guys need to get off our team or comment less. You are the kind of guys who claim a record year when its a tie. Then reponsible folks have to come along and clean up your doggy doo
Steve,
why, you seem to agree with me. Excellent. And what wit and erudition to go with it. Super.
But please, I thought you were big and ugly enough to cope with Willard and Joshie without asking for my help. I’m disappointed. But I’ll cope.
Per Mosher
basically Judith is accepting the IPCC attribution as fact and merely calculating a sensitivity GIVEN that.
So accpting something for the sake of argument differs from believing it.
I tried in vain to convince Lucia of this. As you might know, she wrote an entire post stating that Curry’s paper implies that she has less uncertainty than before. But it appears that Curry’s uncertainty fog is as thick as ever, of course biased towards the lower side of sensitivity.
Heh, I’d like to hear Jim Cripwell laugh about your ‘unrealistically low TCR’. So far, indistinguishable from zero as I expect he’s observing.
==============
Kim you realize that indistinguishable from zero would give you a climate that never changed
Ahem, we’re talking about climate sensitivity to AnthroCO2.
================================
Neither Jim believed, nor do I believe, that climate temperature sensitivity to CO2 is zero. His point, among others, was that that sensitivity hasn’t been determined as measurably significant than zero.
============
kim
Ahem, we’re talking about climate sensitivity to AnthroCO2.
that;s NOT how it works.
earth sensitivity is to WATTS.
this is called lambda.
so what happens when you increase the watts by 3.7?
the source of that doesnt matter.
the response aint zero or indistinguishable from zero.
forget whether the excess watts came from AnthroC02 or the sun increasing or from natural c02. The earth cares about watts.
I give up on teaching Mosher that all WATTS of electromagnetic energy are not equal. He somehow believes that if I shine a 300 Watt sun lamp in his face it would be no different than shining a 300 Watt ultraviolet lamp in his face. Hold – that would only be skin deep. It’s his brain that is impenetrable by normal means. Let’s replace the 300 Watts ultraviolet with 300 Watts of microwave.
http://borderlessnewsandviews.com/wp-content/uploads/2012/05/duh.jpg
VTG, thanks for showing your work.
Why, you’re most welcome :-)
Again, not the first one to note this on this thread, but as an example, visit ATTP’s parallel parasitic thread where many of the marooned and barnacled subjects are bouncing the attribution question around in a sack of rocks manner: there is no unanimity or clarity. Each of the commenters themselves have their own interpretation of the AR4/AR5 statements and they surprise each other. Some are learning new ways of looking at the attribution statement *now* – which implies they bought the Susan Joy Hassol version (Climate change is now and we’re causing it) hook, line and sinker and believed it blindly.
The IPCC attribution arguments (as opposed a rigorous scientific treatment of the question) operate under several constraints: the need to fit concerns for positive feedbacks, the need to not accidentally produce a very low value for sensitivity, the obligation to accommodate, and at times, exploit such unknowns as aerosols (very useful but also a pain), and so forth. My impression: it’s simply better to forget about the whole thing. Only religious people take up a statement written in a book, freeze it (as though it were something immutable), and study it and pore over it (instead of the concept/question behind it).
> visit ATTP’s parallel parasitic thread
Does it mean this is a parasistic comment, Shub?
Shub –
==> “Only religious people take up a statement written in a book, freeze it (as though it were something immutable), and study it and pore over it (instead of the concept/question behind it).”
Well, don’t tell that to Thomas, Scalia, the rest of the “strict constructionists” on the SCOTUS,, and tens of millions of “conservative” Americans.*
* Except when it’s inconvenient politically. When it’s inconvenient politically, they agree with you – well,except for the “religious people” part.
You left out, the best part is our relationship with Christ.
Nice to see you back, Tom.
People just know.
HI Tom! Where ya’ been, brother?
Still fishin…
In the simplest terms possible:
dT(1951-2010) = [dT(CO2) + dT(other GHGs) – dT(anthro aerosols) – dT(other -ve feedbacks) + dT(+ve feedbacks)]
– [dT(natural aerosols) +/- dT(internal variability) +/-dT(external – solar] variability)
To arrive at an attribution statement for the degree of temp rise due to human GHG emissions with such startling confidence, you MUST know with equal confidence the contributions from all other climate forcings operating over that period.
The crux of the matter here, putting aside all the complex, opaque, circular reasoning employed to justify the scientific credibility of assigning such a confident statement of attribution, is that the IPCC, Gavin Schmidt and others assume they have accurate estimates of the forcing due to natural variability AND that they have accurate estimates of the system feedbacks due to anthro GHG forcing. They don’t. They are working in the dark, but point a torch (flashlight) somewhere and expect us to believe that the small area thus illumined is representative of reality. It isn’t (very high confidence).
The way you laid it out is what should have been done in the IPCC documents. Had they done that, it would have cut down on the confusion factor. I remember reading in The Delinquent Teenager that some inexperienced (grad students?) were involved in preparation of previous ARs, perhaps the writers didn’t fully understand what they intended to write.
Thanks, just managed somehow to get the last square bracket where the curved bracket should have been and vice versa!
Jaime, that’s exactly correct. To know how much CO2 does, you need to know what, and how much each of the other factors do, and importantly, you need to know why and how much the climate system wobbles on its own.
This is what is so amusing about sensitivity estimates from paleontology.
=================
Thanks Shub. The complexity obviously arises in consideration of causes and mechanisms for calculating and attributing natural and anthropogenic forcings and explaining how that forcing characteristically manifests over the land masses and the oceans. We’ve heard much from climate scientists with regard to the latter in trying to explain why the Earth’s surface hasn’t warmed as fast as it was predicted to over the last decade or two, but not so much in the way of explaining why they are so certain that the man-made global warming signal since the mid 20th century has not been effectively swamped by natural variability.
All we get are meaningless statements of ‘hottest month’, ‘hottest year’, ‘hottest decade’, ‘climate change is happening’, ‘weather patterns are getting more extreme’, etc. backed up with opaque and counter-intuitive pronouncements on attribution. They would much rather talk about probabilities and weighted risk assessments than explain how climate science has solved a very simple equation (with very complicated science) over a critical period in our history when CO2 emissions from fossil fuels have risen rapidly.
A random usage of above 100% percentages:
http://en.m.wikipedia.org/wiki/Baytex_Energy
Gavin’s pdf graph says it is most probable that AGW contributed 110% to the ‘observed warming’ 1951-2010. I presume this is CO2 + other GHGs +/-feedbacks. If it was 0.5C, then that’s a generous contribution of 0.55C from AGW. That leaves a measly -0.05C attributable to all other climate forcings over that period. If, as seems probable, natural variability accounts for at least half of the actual observed warming (i.e. +0.25C), then how does Gavin explain the mysterious -0.3C contribution from unknown sources? It’s either that or he has to show that net natural climate forcings over that period have been slightly less than zero, effectively canceling each other.
random fop in Korean Drama
名正才能言順
孔子说:“主张不同,就不能共同谋划。
true that.
I’ve got an old vase with a bunch of that crap on the bottom. My Grandfather bought it at an art museum in Boston during the depression. What does it mean?
200% of Willard’s relatives are illiterate.
Willard: “A random usage of above 100% percentages” That was helpful. A 200% return on investment (ROI). Not impossible with a 15 year time frame. The actual return comes in at only 125% in spite of our projections. So the ROI is 200% but those pesky competitors caused something like a negative 75% ROI over the same period. Therefore the ROI was 200%. We are considering another investment almost identical to the original one. We assess as before a 200% ROI. Unknown is this time is, will our competitors or other unknowns add or subtract 75% to or from the return this time?
This piece is in today’s WSJ.
http://www.wsj.com/articles/holman-jenkins-climate-reportings-hot-mess-1421802468
Calamity Jam.
==========
Can’t read the article, unfortunately.
Google the title and click that link.
This article requires payment. I refuse to support Rupert Murdoch.
eadler
You are showing the hallmark of a true scientist- an open mind. My trust in science is restored.
I don’t want to pay to read any of Rupert Murdoch’s rags.
He who doesn’t learn from experience is a fool. Any opinion pieces in publications that I have read are trash based on what I know. I don’t see why I should support it with cash.
In fact I have found a way to read it for free, and comment below. I was not impressed.
I think I understand (semantics aside) what Gavin’s saying, but I’m having a hard time squaring IPCC AR5 figure 10.5 with his probability distribution function; it doesn’t seem to balance. The IPCC’s natural forcing (NAT) estimate in Figure 10.5 centers around 0 with error bars from -.01 to +.01, implying a symmetric distribution. How does this equate with a “best estimate” of 110% for anthropogenic effects over the same period? Wouldn’t natural forcing’s “best estimate” need to show a net cooling (of about .06C) for that to be the case?
Sorry if I’m missing something obvious; any help would be appreciated.
They’re hoping you won’t notice. The higher the sensitivity, the colder we would now be without man’s efforts.
==================
Maybe Gavin’s read: ‘We are cooling, folks; for how long even kim doesn’t know.’ one time too many.
Remind me to tell you a funny story sometime about Arthur Smith spending time trying to track down the first time I wrote that.
===================
Is this the article you are talking about, reposted by Ruth King?
http://www.ruthfullyyours.com/2015/01/21/climate-reportings-hot-mess-holman-jenkins-jr/
Jenkins strongly objects to a quoting of statistician John Grego’s calculation by an NYTimes editor which points out that if the annual global average temperature was a random function the odds of having so many of warmest years on record (134 years) in the past decade would be 650 million to
one. Why does he object to this – because looking at the record one can see that warm years are followed by warm years and that there has been a trend. So it is some kind of horrible journalistic sin to point this out in a different way, for people who don’t look at the charts.
The balance of the article is the usual spiel from people who don’t see a problem with AGW. We haven’t seen it get awfully hot. yet. There is no proof it will get very hot. We don’t have to worry because technology will be there like magic ( super efficient and cheap batteries together with solar) to solve the problem, so we don’t need any political bureaucracy to do anything about it.
This is simply a statement of Jenkin’s opinion. the problem is that the science says that there is a delay of many decades between the buildup of GHG’s and the ultimate effects, so that if there will be a problem the sooner we take action to stave it off the better.
Read carefully your last sentence with special attention to ‘delay’ and ‘sooner’.
====================
So if you found a similar situation with cold years you could make the same claim. Perhaps a cluster around 1910 would do the trick although I didn’t really check. Thank goodness that very unusual spell ended! I wonder what caused it.
Indeed you are entitled to ask that question and look for an answer that explains a cooling spell that ended in 1910. There are many possibilities- La Nina, volcanic aerosals, low solar activity etc. You need evidence to explain it.
http://earthobservatory.nasa.gov/Features/GlobalWarming/page4.php
In the case of the global warming trend since the mid 1970’s, we know it is not solar and an there has been a balance between El Nino’s and La Nina’s over that time period, with La Nina’s at the end. We actually know it is the GHG’s that are responsible.
Since 1975 we know it isn’t solar? That is true if you believe in a short time to equilibrium with a large transient/ equilibrium ratio. That doesn’t seem to be a common argument from those wanting to mitigate carbon. I missed the part where you mentioned the balance in the AMO and an equal balance in any long term poleward ocean heat transport.
Only 1 chance out of 650 million that the time around 1910 could be so cold! Of course it had to warm up!
eadler 2
“In the case of the global warming trend since the mid 1970’s, we know it is not solar and an there has been a balance between El Nino’s and La Nina’s over that time period, with La Nina’s at the end.”
Over the period 1979-2010 there has been a clear dominance of El Nino events over La Nina. The area above the neutral line (ONI=0) enclosed by the 7 year running average is clearly greater than the corresponding area below the neutral line.
http://www.climate4you.com/images/NOAA%20CPC%20OceanicNinoIndexMonthly1979%20With37monthRunningAverage.gif
If that doesn’t convince you fully, from about 1980 until 2010, the running 7 year average of PDO has been strongly positive.
http://www.climate4you.com/images/PDO%20AnnualIndexSince1900%20With7yearRunningAverage.gif
As most of the warming 1951 to 2010 occurred after 1979, PDO/ENSO variability must be seriously considered as a candidate for significantly contributing to that warming.
@Jaime,
“As most of the warming 1951 to 2010 occurred after 1979, PDO/ENSO variability must be seriously considered as a candidate for significantly contributing to that warming.”
It looks pretty much neutral to me based on your graph, especially if you look at the entire period 1950 to now. The influence of El Nino and volcanoes has been explored by regression. When the influences of these are removed we have a clear warming trend since 1975.
https://tamino.wordpress.com/2011/12/06/the-real-global-warming-signal/
https://i0.wp.com/www.pbase.com/azleader/image/144794218.jpg
http://1.bp.blogspot.com/-BQ5RRIoUE9U/T2-mRJdyNiI/AAAAAAAAATc/cVqrHywaBb0/s320/Its_The_Sun_Stupid.png
Eadler2
Indeed, you are correct in that PDO looks largely neutral since 1950 and we can only reasonably assign a contributory warming trend from about 1980. It also seems fairly obvious that PDO/ENSO has not been the only contributor to the steep warming trend from 1979 to 1998, though we do have that period culminating in the very powerful super El Nino of 1997/98.
AMO is also a very likely contributor to the warming we have seen since 1950. Here in its detrended form:
http://www.climate4you.com/images/AMO%20GlobalAnnualIndexSince1856%20With11yearRunningAverage.gif
We must remember that PDO is basically a measure of a cyclical spatial pattern of temp anomalies in the tropical Pacific, which contributes clearly to global warming but, of itself, does not represent warming. The AMO is different in this respect in that it represents actual SSTs. Given the long term trend in AMO since 1880 it seems highly unlikely that increases in N Atlantic SSTs have been driven by CO2, certainly not before 1950. The most obvious forcing to consider is solar. Looking at Lean’s solar irradiance construction combined with PMOD satellite data, this does not appear to be an unreasonable conclusion.
http://www.climate4you.com/images/SolarIrradianceReconstructedSince1610%20LeanUntil2000%20From2001dataFromPMOD.gif
Bob Tisdale has produced a very interesting graph which purports to show N Pacific actual SSTs which also vary cyclically. Effectively, the claim is that one can isolate a mutlidecadal SST cyclical trend in the N Pacific which shows, like the non-detrended AMO, a rising trend in ocean temps since 1880, which we cannot reasonably ascribe to CO2 forcing. I cannot comment with any authority on the credibility of his methodology but, if correct, then we have two major oceanic cycles forcing SSTs in the Northern Hemisphere at least which themselves appear to be forced by increased solar activity over most of that period.
http://bobtisdale.files.wordpress.com/2013/05/figure-33.png?w=720
We are left with the possibility that CO2 emissions have indeed contributed to the post 1950 warming trend but the magnitude of that contribution, assumed by the IPCC to be 100% or greater, is in doubt because the arguments put forward for largely ignoring natural variability are not that convincing.
Pingback: Ihmisen syyllisyys ylitti 100%? | Roskasaitti
Judith,
You’re repeating the same mistakes as you did before regarding the GHG contribution being capped at 100% (it isn’t).
E.g. see my response in the previous thread on this topic:
http://judithcurry.com/2014/08/24/the-50-50-argument/#comment-620816
The anthropogenic contribution is not necessarily bounded at 100%, since natural factors could in theory have contributed a cooling effect.
We discussed this in detail in our survey paper http://pubs.acs.org/doi/abs/10.1021/es501998e, because the responses suggested that the AR4 statement on attribution has been widely misinterpreted. We cite your uncertainty monster paper as an example of this misinterpretation.
Tiptoe, round the tulips, how cool.
==================
Furthermore, if sensitivity is low, we’ve bounced naturally off of the lows of the Holocene. If high, then we’re struggling against a natural cooling trend, coming after the lows of the Holocene.
We can’t keep up such heavy lifting for long.
=======================
Bart is correct, in theory. Now provide some convincing evidence for your theory, Bart. Start with the all important strongly positive feedback from water vapor assumption. How much of the alleged anthropogenic warming resulted from water vapor feedback? Was it 110%? Show your work and your evidence.
I don’t think you are up to the task. You would prefer to play pin the tail on the heretic, with Judith. What’s the name of that dude with the lamp, who is still looking for an honest mainstream climate scientist? Are you going to step up, Bart? Or is this just a drive-by potshot at the heretic?
@Bart Verheggen
‘the responses suggested that the AR4 statement on attribution has been widely misinterpreted’
They should have written a better statement, then. One that could not have been ‘misinterpreted’.
Is it really beyond some of the ‘finest minds in climatology’ to come up with a few sentences every five or so years that are clear and unambiguous?
Why?
You see that, judith? Verheggen et al cited your uncertainty monster paper. Are you flattered? Just kidding, Judith.
I have deleted the following text from the main post: ‘the timing of the NOAA/NASA press release on warmest year was motivated by the timing of the President’s SOTU address’, with a note to this effect in the text
Are you going to explain why you deleted it, Judith? You may have meant to put this message on the raw politics post.
Don,
Maybe because playing such politics in a post apparently criticising playing politics, was just a little too much to swallow, even for Judith
Yes it was supposed to be on raw politics comment thread. On twitter, that statement was distracting from the rest of my post. I couldn’t really defend the ‘timing’ statement, so I pulled it. The important point is really the ‘warmest year’ spin.
Thank you, Judy, and well played!
Are you being sarcastic, willy? Or are you missing an opportunity?
“Naive scientist that I am, it didn’t occur to me until last night that a narrative the NASA/NOAA press releaseof ‘warmest year’ was needed to provide the President with a sound bite to motivate his climate agenda. A scientifically sound press release like that issued by Berkeley Earth just wouldn’t fit the bill.”
Well, doesn’t that imply exactly what was stated in the deleted part?
Well-played would have been to delete the whole thing and make up some plausible, even if highly unlikely, excuse. I misspoke. Lot of co-incidental typos. I didn’t really say that. Some sort of Obama prevarication would do nicely. Judith needs to think about what she is saying before publishing. Twitter is watching her.
I was being sarcastic. The right thing to do is to admit that you shouldn’t have said it and you are withdrawing the accusation, period.
Don the accusation is actually not made.
It’s implied.
Note the passive voice
> Or are you missing an opportunity?
I would were I to play like you, Don. It’s a good move. It deserves to be applauded.
You seem to be asking for some kind of apology. There’s no need to express that. If you ever need one, here’s an How To:
http://www.kellyhills.com/blog/a-primer-on-apologies/
Sometimes, your dudgeon is too damn high.
I didn’t say anything about an apology, didn’t imply that an apology was in order. I said what I said. You make of it what you will. Deleting the offending remark and shining it on, is not what people who wear big boy pants would do. I gave her the minimum right thing to do. Apologizing would be a nice touch and would redound to her credit. Are you following any of this, willy?
> I didn’t say anything about an apology,
Sure, Don:
I thought you apologized for things you should not have said.
I don’t know who raised you willy, but my when my moms told me to apologize, I had to say I am so sorry for doing whatever it was I did, directly to whomever I did it to. Saying I shouldn’t have done it would have been trivial and would have gotten me a smack in the mouth.
I am trying to help, Judith, who keeps putting her foot in her mouth. That’s OK for anonymous blog characters who are just out to have fun, but I am sure she wants to be taken seriously.
I’m not apologizing to anyone or for anything. I removed an ancillary statement that I didn’t want to defend. My main point remains.
Well, it’s clear now. She is just doing some post-publication editing. No further comment from me.
I am not liberal arts type and I don’t spend a lot of time in the deep philosophical weeds. This looks to me like a well constructed accusation. Doesn’t name names, but it’s clear it’s the folks at NOAA/NASA what allegedly done it.
“the timing of the NASA/NOAA press release on warmest year was motivated by the timing of the President’s SOTU address’)”
I said the accusation was implied in the part that was not deleted.
I love watching people misuse our statement. somebody needed something
people
somebody
something
I think I know exactly what you mean, Steven.
Climate science mystery is much like the Lindbergh Kidnapping in that the magnitude of political forces made it impossible for the normal impartial justice system to function properly. Once the headlines ran “Lindbergh Kidnapper Caught” upon the suspect’s arrest the authorities and professionals united in their declared certainty through the trial and execution. The declassified records now reveal uncertainties leading to panics leading to fabricated evidence, coerced witnesses, rigged lineups and jury tampering. The New Jersey State Police still tout the case as their proudest moment. After the execution, the ABA completely reformed court rules, including requiring the sharing of evidence with defense counsels and elimination of cameras in court (until recently) and labeling suspects guilty to the press before trial. In 2000 the NJSP quietly destroyed all the DNA evidence on the case a few years after the suspect’s 92-year-old widow died after 10 years of failed appeals to reopen the case.
Both the Lindbergh case and climate science has their wood experts matching the wood grains (with some professional license). And they both had accountants crunching the numbers to connect dots to the already known conclusion.
UC Berkeley’s Prof. Richard Muller, an eminent climate scientist who came into the subject in the mid 1990s with no pre-declared position except “healthy scientific skepticism.”
He first attacked the climate gorilla, the cause of huge global temp swings through the epochs ages, for which we stand in a momentary pause in a millions of years long glacial period. He naturally studied the already scientifically convicted suspect, Earth’s orbital variations, the Milankovitch cycles. After years of study against ice core and oxygen isotope historical temperature proxies he found, just like many cold case investigators, the suspect was wrongly tagged. From first glance the 100-thousand-year orbital eccentricity cycle had seemed to be a perfect fit for that approximately same interval for inter-glacial periods appearing. But upon close scrutiny the phase did not overlap in any consistent pattern. Also the theoretical effect was way too weak, the least among the three identified cycles. The other two, obliquity and precession did not match up, even in every combination of reinforcement. Muller then had a Eureka moment when he discovered a fourth cycle, that of precession in and out of the ecliptic plain. And it’s period was the magic 100 ka. But years later he came to admit his own paper was wrong, it too did not fit the phase. Oh well.
Muller then went to work re-analyzing the contemporary temperature records and was alarmed at the data selectivity and bias in both the UK and USA. But after applying his skills to match the known solar intensity variations to the global mean temperature record — no dice. “Okay,” he declared in 2012, “that proves it’s CO2.” (Search his youtube. Its in this blog string too.)
Does anyone else see a problem here?
He forgot that he was the one who let a climate gorilla loose. Skeptical science.com still has the ice ages nicely (in their cages,) classified as Milankovitch caused. And we know from ice cores that CO2 was high (lagging BTW) the high temp inter-glacial periods, then falling after temperatures plummeted. Why was CO2 not a negative feedback against cooling? What caused the 20-degree rise into the modern epoch 10 ka with nil CO2 ?
Does Muller have an answer?– Does anyone?
No, we don’t have an answer, so we’ll just make one up. Morons are grading the examination and can’t check the maths.
More seriously, thanks; that’s trenchant criticism.
===================
Regretfully, Muller drug the good name of the institution my good friend, Glenn Seaborg, once served as Chancellor – the institution where I had studied as a graduate student and postgraduate student in 1962-64.
Regretfully, I doubt Muller’s sincerity.
I think most people are missing an important point here.
Judith wrote: “the ‘pause’ since 1998 [] seems irrelevant to the fingerprinting”. I think this is just the opposite, at least if we speak in %: BECAUSE there is a pause, the CO2 fingerprint INCREASED in terms of %! This is the rationale of the IPCC: the amount of antropogenic warming is a given (models), so the less warming, the more the human contribution, in %. That is why the level of certainty went from 90% to 95% in the last IPCC report, regarding the fact antropogenic contribution was >50% since 1950. And yes, according to this logic, it can be way greater than 100% (especially if the “hiatus” keeps going on)
I wrote an article in WUWT about that: http://wattsupwiththat.com/2013/11/21/from-90-to-95-confidence-level-how-ipcc-claims-can-be-at-the-same-time-consistent-and-absurd/
This way greater than 100% allows for the possibility that both anthropogenic sources and non-anthropogenic forces can at the same time both contribute more than 50% to the observed warming. But in this crazy world of percentages you have to divorce yourself from the common understanding that over 50% contribution to observed warming means that something is the dominant driver. With a small enough denominator you can have multiple minor impacts measured as causing over 50% of the observed warming.
Exactly the point that every salesman can take credit for the lion’s share of profit when earnings are slim.
Like I said, its ‘magic’
There are no quantifiable standards against which to falsify the hypothesis. If it is warmer they win. If it is colder they win. Brilliant strategy.
Yes: it is the opposite of science…
The rainmakers still get the chicken, just like they have for centuries.
Warming between 1950 and 2000 coincides perfectly with a 50-year long peak in solar activity.
http://en.wikipedia.org/wiki/Modern_Maximum#mediaviewer/File:Sunspot_Numbers.png
Not only that but the reduction in solar activity in the past 15 years coincides perfectly with the so-called hiatus.
100% of warming since 1950 is natural and caused by the sun is just as reasonable as 100% caused by human activity.
Pingback: Nonsensus about the Senate’s non consensus on climate change | Climate Etc.
A 4th order polynomial representation of potential future temperature evolution:
http://gergs.net/wp-content/uploads/2015/01/Global_monthly_temps_instrumental_records_extrapolated.png
Nice to get away from the linear projections, with real predictions as to how often (on average) we’ll see new temperature records being set.
Also, based on this very reasonable 4th order polynomial projection, we could see that 3C ECS hit as early as 2060 (unlikely, but in the range) with even odds by 2075 and very likely by 2100.
So a large factor in global average temperature is average tropical ocean temperature of around 30 C.
Or one could divide the world between tropics of about 30 C and the other half of the world being about 0 C giving the average of around 15 C.
So the half of world [Both Temperate and Arctic zones] which has average
temperature of about 0 is a bit less than 70% ocean area.
So for the world to warm by a significant amount [more than 1 C] one has to have the top surface of the ocean to warm. And to have top surface of ocean remain warm for any amount of time, one also need ocean below the surface to become warmer.
So basic question is which ocean will warm to most, the tropical or the other half of the world’s ocean?
And how will this happen.
Another stunning leap of the imagination from that same site:
http://gergs.net/wp-content/uploads/2014/11/Global_monthly_temps_all_extrapolated.png
Except of course is far less of a leap than any linear extrapolation, such as Monckton’s really simple (and really pseudoscientific) linear projections. It is far more likely for warming to follow a 4th order polynomial curve than the simple linear extrapolations.
Gate–How about we make a real money wager on where temps will be in 2020 per berkeley? Will you bet that they will be at or above this curve?
The Holocene temp record is a whole series of 4th order polynomials, full of ups and downs. In order to predict whether the curve at any point will continue upwards or start heading down again, you need to know the exact equation in order to solve it for the unknown x(temp) at time t. We don’t know enough about natural climate variability and CO2 feedbacks to be able to do that confidently.
https://upload.wikimedia.org/wikipedia/commons/c/ca/Holocene_Temperature_Variations.png
==> “Nice to get away from the linear projections,”
Indeed. That graph, in contrast to those I usually see, adds another important dimension.
Excuse me if this has been suggested already.
I suggest that an clarification inquiry be sent, by some big shot or institution, to IGPOCC, asking it if Gavin’s interpretation is correct.
Pingback: The Gift That Keeps on Giving | Izuru
“When I use a word,” Humpty Dumpty said in rather a scornful tone, “it means just what I choose it to mean — neither more nor less.”
“The question is,” said Alice, “whether you can make words mean so many different things.”
“The question is,” said Humpty Dumpty, “which is to be master – – that’s all.”
(Through the Looking Glass, Chapter 6)