
by Matt Skaggs
For years, climate scientists have followed reasoning that goes from climate model simulations to expert opinion, declaring that to be sufficient. But that is not how attribution works.
The concept of attribution is important in descriptive science, and is a key part of engineering. Engineers typically use the term “root cause analysis” rather than attribution. There is nothing particularly clever about root cause methodology, and once someone is introduced to the basics, it all seems fairly obvious. It is really just a system for keeping track of what you know and what you still need to figure out.
I have been performing root cause analysis throughout my entire, long career, generally in an engineering setting. The effort consists of applying well established tools to new problems. This means that in many cases, I am not providing subject matter expertise on the problem itself, although it is always useful to understand the basics. Earlier in my career I also performed laboratory forensic work, but these days I am usually merely a facilitator. I will refer to those that are most knowledgeable about a particular problem as the “subject matter experts” (SMEs).
This essay consists of three basic sections. First I will briefly touch on root cause methodology. Next I will step through how a fault tree would be conducted for a topic such as the recent warming, including showing what the top tiers of the tree might look like. I will conclude with some remarks about the current status of the attribution effort in global warming. As is typical for a technical blog post, I will be covering a lot of ground while barely touching on most topics, but I promise that I will do my best to explain the concepts as clearly and concisely as I can.
Part 1: Established Root Cause Methodology
Definitions and Scope
Formal root cause analysis requires very clear definitions and scope to avoid chaos. It is a tool specifically for situations in which we have detected an effect with no obvious cause, but discerning the cause is valuable in some way. This means that we can only apply our methodology to events that have already occurred, since predicting the future exploits different tools. We will define an effect subject to attribution as a significant excursion from stable output in an otherwise stable system. One reason this is important is that a significant excursion from stable behavior in an otherwise stable system can be assumed to have a single root cause. Full justification of this is beyond the scope of this essay, but consider that if your car suddenly stops progressing forward while you are driving, the failure has a single root cause. After having no trouble for a year, the wheel does not fall off at the exact same instant that the fuel pump seizes. I will define a “stable” system as one in which significant excursions are so rare in time that they can safely be assumed to have a single root cause.
Climate science is currently engaged in an attribution effort pertaining to a recent temperature excursion, which I will refer to as the “modern warming.” For purposes of defining the scope of our attribution effort, we will consider the term “modern warming” to represent the rise in global temperature since 1980. This is sufficiently precise to prevent confusion, we can always go back and tweak this date if the evidence warrants.
Choosing a Tool from the Toolbox
There are two basic methods to conclusively attribute an effect to a cause. The short route to attribution is to recognize a unique signature in the evidence that can only be explained by a single root cause. This is familiar from daily life; the transformer in front of your house shorted and there is a dead black squirrel hanging up there. The need for a systematic approach such as a fault tree only arises when there is no black squirrel. We will return to the question of a unique signature later, after discussing what an exhaustive effort would look like.
Once we have determined that we cannot simply look at the outcome of an event and see the obvious cause, and we find no unique signature in the data, we must take a more systematic approach. The primary tools in engineering root cause analysis are the fault tree and the cause map. The fault tree is the tool of choice for when things fail (or more generally, execute an excursion), while the cause map is a better tool for when a process breaks down. The fault tree asks “how?,” while the cause map asks “why?” Both tools are forms of logic trees with all logical bifurcations mapped out. Fault trees can be quite complex with various types of logic gates. The key attributes of a fault tree are accuracy, clarity, and comprehensiveness. What does it mean to be comprehensive? The tree must address all plausible root causes, even ones considered highly unlikely, but there is a limit. The limit concept here is euphemistically referred to as “comet strike” by engineers. If you are trying to figure out why a boiler blew up, you are not obligated to put “comet strike” on your fault tree unless there is some evidence of an actual comet.
Since we are looking at an excursion in a data set, we choose the fault tree as our basic tool. The fault tree approach looks like this:
- Verify that a significant excursion has occurred.
- Collect sufficient data to characterize the excursion.
- Assemble the SMEs and brainstorm possible root causes for the excursion.
- Build a formal fault tree showing all the plausible causes. If there is any dispute about plausibility, put the prospective cause on the tree anyway.
- Apply documented evidence to each cause. This generally consists of direct observations and experimental results. Parse the data as either supporting or refuting a root cause, and modify the fault tree accordingly.
- Determine where evidence is lacking, develop a plan to generate the missing evidence. Consider synthetically modeling the behavior when no better evidence is available.
- Execute plan to fill all evidence blocks. Continue until all plausible root causes are refuted except one, and verify that the surviving root cause is supported by robust evidence.
- Produce report showing all of the above, and concluding that the root cause of the excursion was the surviving cause on the fault tree.
I will be discussing these steps in more detail below.
The Epistemology of Attribution Evidence
As we work through a fault tree, we inevitably must weigh the value of various forms of evidence. Remaining objective here can be a challenge, but we do have some basic guidelines to help us.
The types of evidence used to support or refute a root cause are not all equal. The differences can be expressed in terms of “fidelity.” When we examine a failed part or an excursion in a data set, our direct observations are based upon evidence that has perfect fidelity. The physical evidence corresponds exactly to the effect of the true root cause upon the system of interest. We may misinterpret the evidence, but the evidence is nevertheless a direct result of the true root cause that we seek. That is not true when we devise experiments to simulate the excursion, nor is it true when we create synthetic models.
When we cannot obtain conclusive root cause evidence by direct observation of the characteristics of the excursion, or direct analysis of performance data, the next best approach is to simulate the excursion by performing input/output (I/O) experimentation on the same or an equivalent system. This requires that we make assumptions about the input parameters, and we cannot assume that our assumptions have perfect fidelity to the excursion we are trying to simulate. Once we can analyze the results of the experiment, we find that it either reproduced our excursion of interest, or it did not. Either way, the outcome of the experiment has high fidelity with respect to the input as long as the system used in test has high fidelity to the system of interest. If the experiment based upon our best guess of the pertinent input parameters does not reproduce the directly-observed characteristics of the excursion, we do not discard the direct observations in favor of the experiment results. We may need to go back and double check our interpretation, but if the experiment does not create the same outcome as the actual event, it means we chose the wrong input parameters. The experiment serves to refute our best guess. The outcomes from experimentation obviously sit lower on an evidence hierarchy than direct observations.
The fidelity of synthetic models is limited in exactly the same way with respect to the input parameters that we plug into the model. But models have other fidelity issues as well. When we perform our experiments on the same system that had the excursion (which is ideal if it is available), or on an equivalent system, we take great care to assure that our test system responds the same way to input as the original system that had the excursion of interest. We can sometimes verify this directly. In a synthetic model, however, an algorithm is substituted for the actual system, and there will always be assumptions that go into the algorithm. This adds up to a situation in which we are unsure of the fidelity of our input parameters, and unsure of the fidelity of our algorithm. The compounded effect of this uncertainty is that we do not apply the same level of confidence to model results that we do to observations or experiment results. So in summary, and with everything else being equal, direct observation will always trump experimental results, and experimental results will always trump model output. Of course, there is no way to conduct meaningful experiments on analogous climates, so one of the best tools is not of any use to us.
Similar objective value judgments can be made about the comparison of two data sets. When we look at two curves and they both seem to show an excursion that matches in onset, duration and amplitude, we consider that to be evidence of correlation. If the wiggles also closely match, that is stronger evidence. Two curves that obviously exhibit the same onset, magnitude, and duration prior to statistical analysis will always be considered better evidence than two curves that can be shown to be similar after sophisticated statistical analysis. The less explanation needed to correlate two curves, the stronger the evidence of correlation.
Sometimes we need to resolve plausible root causes but lack direct evidence and cannot simulate the excursion of interest by I/O testing. Under these circumstances, model output might be considered if it meets certain objective criteria. When attribution of a past event is the goal, engineers shun innovation. In order for model output to be considered in a fault tree effort, the model requires extensive validation, which means the algorithm must be well established. There must be a historical record of input parameters and how changes in those parameters affected the output. Ideally, the model will have already been used successfully to make predictions about system behavior under specific circumstances. Models can be both sophisticated and quite trustworthy, as we see with the model of planetary motion in the solar system. Also, some very clever methods have been developed to substitute for prior knowledge. An example is the Monte Carlo method, which can sometimes tightly constrain an estimation of output without robust data on input. Similarly, if you have good input and output data, we can sometimes develop a useful empirical relationship of the system behavior without really knowing much about how the system works. A simple way to think of this is to consider three types of information, input data, system behavior, and output data. If you know two of the three, you have some options for approximating the third. But if you only have adequate information on one or less of the types of information, your model approach is underspecified. Underspecified model simulations are on the frontier of knowledge and we shun their use on fault trees. To be more precise, simulations from underspecified models are insufficiently trustworthy to adequately refute root causes that are otherwise plausible.
Part 2: Established Attribution Methodology Applied to the Modern Warming
Now that we have briefly covered the basics of objective attribution and how we look at evidence, let’s apply the tools to the modern warming. Recall that attribution can only be applied to events in the past or present, so we are looking at only the modern warming, not the physics of AGW. A hockey stick shape in a data set provides a perfect opportunity, since the blade of the stick represents a significant excursion from the shaft of the stick, while the shaft represents the stable system that we need to start with.
I mentioned at the beginning that it is useful for an attribution facilitator to be familiar with the basics of the science. While I am not a climate scientist, I have put plenty of hours into keeping up with climate science, and I am capable of reading the primary literature as long as it is not theoretical physics or advanced statistics. I am familiar with the IPCC Annual Report (AR) sections on attribution, and I have read all the posts at RealClimate.org for a number of years. I also keep up with some of the skeptical blogs including Climate Etc. although I rarely enter the comment fray. I did a little extra reading for this essay, with some help from Dr. Curry. This is plenty of familiarity to act as a facilitator for attribution on a climate topic. Onward to the root cause analysis.
Step 1: Verify that a significant excursion has occurred.
Here we want to evaluate the evidence that the excursion of interest is truly beyond the bounds of the stability region for the system. When we look at mechanical failures, Step 1 is almost never a problem, there is typically indisputable visual evidence that something broke. In electronics, a part will sometimes seem to fail in a circuit but meet all of the manufacturer’s specifications after it is removed. When that happens we shift our analysis to the circuit and the component originally suspected of causing the failure becomes a refuted root cause.
In looking at the modern warming, we first ask whether there are similar multi-decadal excursions in the past millennium of unknown cause. We also need to consider the entire Holocene. While most of the available literature states that the modern excursion is indeed unprecedented, this part of the attribution analysis is not a democratic process. We find that there is at least one entirely plausible temperature reconstruction for the last millennium that shows comparable excursions. Holocene reconstructions suggest that the modern warming is not particularly significant. We find no consensus as to the cause of the Younger Dryas, the Minoan, Roman, and Medieval warmings, or the Little Ice Age, all of which may constitute excursions of at least similar magnitude. I am not comfortable with this because we need to understand the mechanisms that made the system stable in the first place before we can meaningfully attribute a single excursion.
When I am confronted with a situation like this in my role as facilitator, I would have a discussion with my customer as to whether they want to expend the funds to continue the root cause effort given the magnitude of uncertainly regarding the question of whether we even have a legitimate attribution target. I have grave doubts that we have survived Step 1 in this process, but let’s assume that the customer wants us to continue.
Step 2. Collect sufficient data to characterize the excursion.
The methodology can get a little messy here. Before we can meaningfully construct a fault tree, we need to carefully define the excursion of interest, which usually means studying both the input and output data. However, we are not really sure of what input data we need since some may be pertinent to the excursion while other data might not. We tend to rely upon common sense and prior knowledge as to what we should gather at this stage, but any omissions will be caught during the brainstorming so we need not get too worried.
The excursion of interest is in temperature data. We find that there is a general consensus that a warming excursion has occurred. The broad general agreement about trends in surface temperature indices is sufficient for our purposes.
The modern warming temperature excursion exists in the output side of the complex process known as “climate.” A fully characterized excursion would also include robust empirical input data, which for climate change would be tracking data for the climate drivers. When we look for input data at this stage, we are looking for empirical records of the climate both prior to and during the modern warming. We do not have a full list yet, but we know that greenhouse gases, aerosols, volcanoes, water vapor, and clouds are all important. Rather than continue on this topic here, I will discuss it in more detail after we construct the fault tree below. That way we can be specific about what input data we need.
Looking for a Unique Signature
Now that we have chosen to consider the excursion as anomalous and sufficiently characterized, this is a good time to look for a unique signature. Has the modern warming created a signature that is so unique that it can only be associated with a single root cause? If so, we want to know now so that we can save our customer the expense of the full fault tree that we would build in Steps 3 and 4.
Do any SMEs interpret some aspect of the temperature data as a unique signature that could not possibly be associated with more than one root cause? It turns out that some interpret the specific spatio-temporal heterogeneity pattern as being evidence that the warming was driven by the radiation absorbed by increased greenhouse gas (GHG) content in the atmosphere. Based upon what I have read, I don’t think there is anyone arguing for a different root cause creating a unique signature in the modern warming. The skeptic arguments seem to all reside under a claim that the signature is not unique, not that it is unique to something other than GHG warming. So let’s see whether we can take our shortcut to a conclusion that an increase in GHG concentration is the sole plausible root cause due to a unique data signature.
Spatial heterogeneity would be occurring up to the present day, and so can be directly measured. I have seen two spatial pattern claims about GHG warming, 1) the troposphere should warm more quickly, and 2) the poles should warm more quickly. Because this is important, I have attempted to track these claims back through time. The references mostly go back to climate modeling papers from the 1970s and 1980s. In the papers, I was unable to find a single instance where any of the feedbacks thought to enhance warming in specific locations were associated solely with CO2. Instead, some are associated with any GHG, while others such as arctic sea ice decrease occur due to any persistent warming. Nevertheless, the attribution chapter in IPCC AR 5 contains a paragraph that seems to imply that enhanced tropospheric warming supports attribution of the modern warming to anthropogenic CO2. I cannot make the dots connect. But here is one point that cannot be overemphasized: the search for a unique signature in the modern warming is the best hope we have for resolving the attribution question.
Step 3. Assemble the SMEs and brainstorm plausible root causes for the excursion.
Without an overwhelmingly strong argument that we have a unique signature situation, we must do the heavy lifting involved with the exhaustive approach. Of course, I am not going to be offered the luxury of a room full of climate SMEs, so I will have to attempt this myself for the purposes of this essay.
Step 4. Build a Formal Fault Tree
An attribution analysis is a form of communication, and the effort is purpose-driven in that we plan to execute a corrective action if that is feasible. As a communication tool, we want our fault tree to be in a form that makes sense to those that will be the most difficult to convince, the SMEs themselves. And when we are done, we want the results to clearly point to actions we may take. With these thoughts in mind, I try to find a format that is consistent with what the SMEs already do. Also, we need to emphasize anthropogenic aspects of causality because those are the only ones we can change. So we will base our fault tree on an energy budget approach similar to a General Circulation Model (GCM), and we will take care to ensure that we separate anthropogenic effects from other effects.
GCMs universally, at least as far as I know, use what engineers call a “control volume” approach to track an energy budget. In a control volume, you can imagine an infinitely thin and weightless membrane surrounding the globe at the top of the atmosphere. Climate scientists even have an acronym for the location “top of the atmosphere,” TOA. Energy that migrates inside the membrane must equal energy that migrates outside the membrane over very long time intervals, otherwise the temperature would ramp until all the rocks melted or everything froze. In the rather unusual situation of a planet in space, the control volume is equivalent to a “control mass” equation in which we would track the energy budget based upon a fixed mass. Our imaginary membrane defines a volume but it also contains all of the earth/atmosphere mass. For simplicity, I will continue with the term “control volume.”
The control volume equation in GCMs is roughly equivalent to:
[heat gained] – [heat lost] = [temperature change]
This is just a conceptual equation because the terms on the left are in units of energy, while the units on the right are in degrees of temperature. The complex function between the two makes temperature an emergent property of the climate system, but we needn’t get too wrapped up in this. Regardless of the complexity hidden behind this simple equation, it is useful to keep in mind that each equation term (and later, each fault tree box) represents a single number that we would like to know.
There is a bit of housekeeping we need to do at this point. Recall that we are only considering the modern warming, but we can only be confident about the fidelity of our control volume equation when we consider very long time intervals. To account for the disparity in duration, we need to consider the concept of “capacitance.” A capacitor is a device that will store energy under certain conditions, but then discharge that energy under a different set of conditions. As an instructive example, the argument that the current hiatus in surface temperature rise is being caused by energy storage in the ocean is an invocation of capacitance. So to fit our approach to a discrete time interval, we need the following modification:
[heat gained] + [capacitance discharge] – [heat lost] – [capacitance recharge] = [modern warming]
Note that now we are no longer considering the entire history of the earth, we are only considering the changes in magnitude during the modern warming interval. Our excursion direction is up, so we discard the terms for a downward excursion. Based upon the remaining terms in our control volume equation, the top tier of the tree is this:
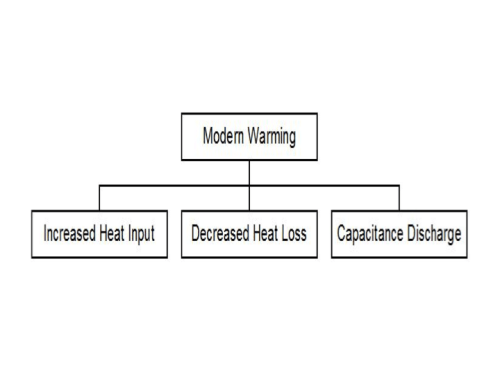 From the control volume standpoint, we have covered heat that enters our imaginary membrane, heat that exits the membrane, and heat that may have been stashed inside the membrane and is only being released now. I should emphasize that this capacitance in the top tier refers to heat stored inside the membrane prior to the modern warming that is subsequently released to create the modern warming.
This top tier contains our first logical bifurcation. The two terms on the left, heat input and heat loss, are based upon a supposition that annual changes in forcing will manifest soon enough that that the change in temperature can be considered a direct response. This can involve a lag as long as the lag does not approach the duration of the excursion. The third term, capacitance, accounts for the possibility that the modern warming was not a direct response to a forcing with an onset near the onset of our excursion. An alternative fault tree can be envisioned here with something else in the top tier, but the question of lags must be dealt with near the top of the tree because it constitutes a basic division of what type of data we need.
The next tier could be based upon basic mechanisms rooted in physics, increasing the granularity:
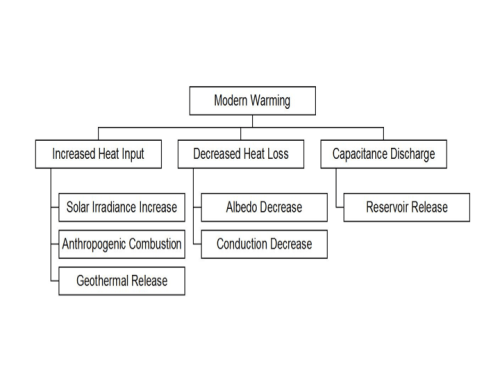 The heat input leg represents heat entering the control volume, plus the heat generated inside. We have a few oddball prospective causes here that rarely see the light of day. The heat generated by anthropogenic combustion and geothermal heat are a couple of them. In this case, it is my understanding that there is no dispute that any increases above prior natural background combustion (forest fires, etc.) and geothermal releases are trivial. We put these on the tree to show that we have considered them, but we need not waste time here. Under heat loss, we cover all the possibilities with the two basic mechanisms of heat transfer, radiation and conduction. Conduction is another oddball. The conduction of heat to the vacuum of space is relatively low and would be expected to change only slightly in rough accordance to the temperature at TOA. With conduction changes crossed off, a decrease in outward radiation would be due to a decreased albedo, where albedo represents reflection across the entire electromagnetic spectrum. A control volume approach allows us to lump convection in with conduction. The last branch in our third tier is the physical mechanism by which a temperature excursion occurs due to heat being released from a reservoir, which is a form of capacitance discharge.
I normally do not start crossing off boxes until the full tree is built. However, if we cross off the oddballs here, we see that the second tier of the tree decomposes to just three mechanisms, solar irradiance increase, albedo decrease, and heat reservoir release. This comes as no revelation to climate scientists.
This is as far as I am going in terms of building the full tree, because the next tier gets big and I probably would not get it right on my own. Finishing it is an exercise left to the reader! But I will continue down the “albedo decrease” leg until we reach anthropogenic CO2-induced warming, the topic du jour. A disclaimer: I suspect that this tier could be improved by the scrutiny of actual SMEs.
 The only leg shown fully expanded is the one related to CO2, the reader is left to envision the entire tree if each leg were to be expanded in a similar manner. The bottom left corner of this tree fragment shows anthropogenic CO2-induced warming in proper context. Note that we could have separated anthropogenic effects at the first tier of the tree, but then we would have two almost identical trees.
Once every leg is completed in this manner, the next phase of adding evidence begins.
Step 5. Apply documented evidence to each cause.
Here we assess the available evidence and decide whether it supports or refutes a root cause. The actual method used is often dictated by how much evidence we are dealing with. One simple way is to make a numbered list of evidence findings. Then when a finding supports a root cause, we can add that number to the fault tree block in green. When the same finding refutes a different root cause, we can add the number to the block in red. All findings must be mapped across the entire tree.
The established approach to attribution looks at the evidence based upon the evidence hierarchy and exploits any reasonable manner of simplification. The entire purpose of a control volume approach is to avoid having to understand the complex relationship that exists between variables within the control volume. For example, if you treat an engine as a control volume, you can put flow meters on the fuel and air intakes, a pressure gauge on the exhaust, and an rpm measurement on the output shaft. With those parameters monitored, and a bit of historical data on them, you can make very good predictions about the trend in rpm of the engine based upon changes in inputs without knowing very much about how the engine translates fuel into motion. This approach does not involve any form of modeling and is, as I mentioned, the rationale for using control volume in the first place.
The first question the fault tree asks of us is captured in the first tier. Was the modern warming caused by a direct response to higher energy input, a direct response to lower energy loss, or as a result of heat stored during an earlier interval being released? If we consider this question in light of our control volume approach (we don’t really care how energy gets converted to surface temperature), we see that we can answer the question with simple data in units of energy, watts or joules. Envision data from, say, 1950 to 1980, in terms of energy. We might find that for the 30-year interval, heat input was x joules, heat loss was y joules, and capacitance release was z joules. Now we compare that to the same data for the modern warming interval. If any one of the latter numbers is substantially more than the corresponding earlier numbers x, y, or z, we have come a long way already in simplifying our fault tree. A big difference would mean that we can lop off the other legs. If we see big changes in more than one of our energy quantities, we might have to reconsider our assumption that the system is stable.
In order to resolve the lower tiers, we need to take our basic energy change data and break it down by year, so joules/year. If we had reasonably accurate delta joules/year data relating to the various forcings, we could wiggle match between the data and the global temperature curve. If we found a close match, we would have strong evidence that forcings have an important near-term effect, and that (presumably) only one root cause matches the trend. If no forcing has an energy curve that matches the modern warming, we must assume capacitance complicates the picture.
Let’s consider how this would work. Each group of SMEs would produce a simple empirical chart for their fault tree block estimating how much energy was added or lost during a specific year within the modern warming, ideally based upon direct measurement and historical observation. These graphs would then be the primary evidence blocks for the tree. Some curves would presumable vary around zero with no real trend, others might decline, while others might increase. The sums roll up the tree. If the difference between the “heat gained” and “heat lost” legs shows a net positive upward trend in energy gained, we consider that as direct evidence that the modern warming was driven be heat gained rather than capacitance discharge. If those two legs sum to near zero, we can assume that the warming was caused by capacitance discharge. If the capacitance SMEs (those that study El Nino, etc.) estimate that a large discharge likely occurred during the modern warming, we have robust evidence that the warming was a natural cycle.
- Determine where evidence is lacking…
Once all the known evidence has been mapped, we look for empty blocks. We then develop a plan to fill those blocks as our top priority.
I cannot find the numbers to fill in the blocks in the AR documents. I suspect that the data does not exist for the earlier interval, and perhaps cannot even be well estimated for the modern warming interval.
- Execute plan to fill all evidence blocks.
Here we collect evidence specifically intended to address the fault tree logic. That consists of energy quantities from both before and during the modern warming. Has every effort been made to collect empirical data about planetary albedo prior to the modern warming? I suspect that this is a hopeless situation, but clever SMEs continually surprise me.
In a typical root cause analysis, we continue until we hopefully have just one unrefuted cause left. The final step is to exhaustively document the entire process. In the case of the modern warming, the final report would carefully lay out the necessary data, the missing data, and the conclusion that until and unless we can obtain the missing data, the root cause analysis will remain unresolved.
Part 3: The AGW Fault Tree, Climate Scientists, and the IPCC: A Sober Assessment of Progress to Date
I will begin this section by stating that I am unable to assess how much progress has been made towards resolving the basic fault tree shown above. That is not for lack of trying, I have read all the pertinent material in the IPCC Annual Reports (ARs) on a few occasions. When I read these reports, I am bombarded with information concerning the CO2 box buried deep in the middle of the fault tree. But even for that box, I am not seeing a number that I could plug into the equations above. For other legs of the tree, the ARs are even more bewildering. If climate scientists are making steady progress towards being able to estimate the numbers to go in the control volume equations, I cannot see it in the AR documents.
How much evidence is required to produce a robust conclusion about attribution when the answer is not obvious? For years, climate scientists have followed reasoning that goes from climate model simulations to expert opinion, declaring that to be sufficient. But that is not how attribution works. Decomposition of a fault tree requires either a unique signature, or sufficient data to support or refute every leg of the tree (not every box on the tree, but every leg). At one end of the spectrum, we would not claim resolution if we had zero information, while at the other end, we would be very comfortable with a conclusion if we knew everything about the variables. The fault tree provides guidance on the sufficiency of the evidence when we are somewhere in between. My customers pay me to reach a conclusion, not muck about with a logic tree. But when we lack the basic data to decompose the fault tree, maintaining my credibility (and that of the SMEs as well) demands that we tell the customer that the fault tree cannot be resolved because we lack sufficient information.
The curve showing CO2 rise and the curve showing the modern global temperature rise do not look the same, and signal processing won’t help with the correlation. Instead, there is hypothesized to be a complex function involving capacitance that explains the primary discrepancy, the recent hiatus. But we still have essentially no idea how much capacitance has contributed to historical excursions. We do not know whether there is a single mode of capacitance that swamps all others, or whether there are multiple capacitance modes that go in and out of phase. Ocean capacitance has recently been invoked as perhaps the most widely endorsed explanation for the recent hiatus in global warming, and there is empirical evidence of warming in the ocean. But invoking capacitance to explain a data wiggle down on the fifth tier of a fault tree, when the general topic of capacitance remains unresolved in the first tier, suggests that climate scientists have simply lost the thread of what they were trying to prove. The sword swung in favor of invoking capacitance to explain the hiatus turns out to have two edges. If the system is capable of exhibiting sufficient capacitance to produce the recent hiatus, there is no valid argument against why it could not also have produced the entire modern warming, unless that can be disproven with empirical data or I/O test results.
Closing Comments
Most of the time when corporations experience a catastrophe such as a chemical plant explosion resulting in fatalities, they look to outside entities to conduct the attribution analysis. This may come as a surprise given the large sums of money at stake and the desire to influence the outcome, but consider the value of a report produced internally by the corporation. If the report exonerates the corporation of all culpability, it will have zero credibility. Sure, they can blame themselves to preserve their credibility, but their only hope of a credible exoneration is if it comes from an independent entity. In the real world, the objectivity of an independent study may still leave something to be desired, given the fact that the contracted investigators get their paycheck from the corporation, but the principle still holds. I can only assume when I read the AR documents that this never occurred to climate scientists.
The science of AGW will not be settled until the fault tree is resolved to the point that we can at least estimate a number for each leg in our fault tree based upon objective evidence. The tools available have thus far not been up to the task. With so much effort put into modelling CO2 warming while other fault tree boxes are nearly devoid of evidence, it is not even clear that the available tools are being applied efficiently.
The terms of reference for the IPCC are murky, but it is clear that it was never set up to address attribution in any established manner. There was no valid reason to not use an established method, facilitated by an entity with expertise in the process, if attribution was the true goal. The AR documents are position papers, not attribution studies, as exemplified by the fact that supporting and refuting arguments cannot be followed in any logical manner and the arguments do not roll up into any logical framework. If AGW is really the most important issue that we face, and the science is so robust, why would climate scientists not seek the added credibility that could be gained from an independent and established attribution effort?
JC comments
I don’t normally provide comments within a guest post, but I need to make an exception here. Some big light bulbs in this essay. I have been dancing around the issues raised by Matt Skaggs in these previous posts, including tree logic:
- Reasoning about climate uncertainty
- Reasoning about floods and climate change
- Waving the Italian flag. Part I: uncertainty and pedigree
- The logic(?) of the IPCC’s attribution statement
- The 50-50 argument
But Matt’s essay really clarifies some things (I will do a follow up post on this general topic) This post also clarifies the disagreement between myself and Gavin Schmidt. The main point of relevance here is that there are different ways to frame and approach the climate change attribution problem, and the one used by the IPCC and mainstream climate scientists isn’t a very good one.
Moderation note: This is a guest post (invited by me). Please keep your comments civil and relevant.

I’m not even a scientist and Matt Skagg’s logic is obvious. As civily as I can put it, the CAGW believers are now working on faith, not science, and they resemble a cult more than they do scientists.
True, true, nature is not the slave of the Left. Answers don’t come so easily: nature still has her secrets; but, they won’t be found by those who are blinded by their own certainty. Answers to tough questions will not be handed over to scientists who have traded in their curiosity to become politicians and lawyers for the Left.
The real answer is that probably for ~50 years, since Carl Sagan made two bad mistakes, some, perhaps all US Universities have taught incorrect Radiative Physics. The evidence is here: http://web.mit.edu/16.unified/www/FALL/thermodynamics/notes/node134.html
The S-B equation does not predict an energy flux. Instead, it gives Radiant Emittance (aka Exitance), the Potential Energy Flux in a vacuum to a radiation sink at absolute zero. Only the vector sum of Emittances predicts real net IR flux, from Maxwell’s Equations. The next module of the MIT course, from the World’s pre-eminent Technical University, claims Emittance (W/m^2) is Emissivity (dimensionless).
This is an appalling failure of basic teaching because it leads directly to the ‘back radiation’ myth, confusing Emittance with a real energy flux. The heat generation and transfer assumptions the IPCC climate models were broken from the very start. Blog sites such as ScienceofDoom push this incorrect physics. !0s of 1000s of atmospheric science, and perhaps many other students, have been taught incorrectly.
It’s time this farrago was ended. Real atmospheric physics is very different; there is near zero CO2-AGW in its present configuration, as is being proved empirically. The heat generation in the IPCC models is based on a Perpetual Motion Machine of the 2nd kind
AlecM,
At least there are two of us.
It really makes no difference – reality, that is. It’s all about perception, spin, and money, by the look of things.
Back to the days of the natural philosopher, and the self funded enthusiastic amateur, I say!
I guess that when people have to choose between spending on clothing or climatology, they might decide that climatology isn’t all that important. I could be wrong, I suppose.
Live well and prosper,
Mike Flynn.
CO2 is a trace gas. Man-made CO2 is a fraction of the trace.
There is no way one molecule in ten thousand regulates Earth Temperature. That is way outside of reasonable.
http://popesclimatetheory.com/page16.html
Hold it right there!
“For years, climate scientists have followed reasoning that goes from climate model simulations to expert opinion, declaring that to be sufficient….” Matt
Not a good start.
Seemed like a great start to me: it points up one of the key defects in the whole “global warming” meme.
AK and others, my first reply should have been more specifically addressed to Michael. Sorry for the confusion.
John,
My point was only that Matt’s opening statement, suggesting that all we have are models, is not correct.
Michael, I am not sure where you get him saying “all we have” from his comment.
Cognis,
As in – that’s all we have been using, which is what Matt seems to be suggesting.
“Root Cause” assumes, in and of itself, that the temperatures have risen. What he is trying to nut out is “why?” So he is taking the temperature record for granted. Aside from temperature records, which he grants in his premise, what do we have besides models?
I know it is a very hard problem. I know that it might not be solvable and that the fact that it might not be solvable does not mean it is not happening, I am just wondering what we have besides models.
Tend to gloss over the fact of a century of temp obs.
Given the claimed importance of collecting data, it seems an odd thing to start with.
But what’s unusual about what’s in that “century of temp obs”? You need models, or a properly scientific hockey stick, to demonstrate that it’s actually “a significant excursion”.
Not at all. Observed temperature increase does not validate model output of the same. That is looking at the root cause problem backwards. If that is what you meant.
We observe temperature change. Model output offers one explanation. One mechanism. But data from models is man made. It is not observational data or experimental data. Observational data trumps experimental data. Experimental data trumps model data. Model data trumps no data. Obtaining more observational data or interpreting existing observational data wrt the other legs would help focus efforts. Are we looking at the right mechanism is the question.
But we don’t know that similar hasn’t happened dozens of times before.
That depends!
Specifically, it depends on whether the models were put together with the prior assumption that the current warming is an “excursion”.
Till you can demonstrate the absence of circularity there, the models are worse than useless!
AK, sure, we can argue over the shaft and it is worth arguing over. But the exercise assumes that the observed temperature change (the blade) is an excursion from the shaft…. for sake of argument and example.
Observational data trumps experimental data trumps model data is a generalization rightly pointed out by Matt, in the sense of root cause analysis. I did not intend to be specific about GCM model data as simpler models can be used on simpler systems quite effectively for RCA.
AK, my initial reply was intended for Michael, sorry for the confusion.
John –
How does someone analyze and observe data w/o utilizing a (man made) model?.
Joshua,
you can’t.
But if you want to disparage models, ala Matt, we can look at Isaac Held’s take on attribution which doesn’t rely on GCMs.
Joshua, that question appears to be going into differences in semantics. Maybe ‘simulation’ would be a better word. I am referring specifically to mathematical models and not conceptual models.
Observations/measurements can be made/collected without a mathematical model. I could count the number of cars traveling on a section of road over the course of several hours/days and plot that data against time. My analysis might reveal traffic is heavy at certain times of the day while at other times traffic is sparse. I might hypothesize that the times when traffic is heavy is when people drive to work or drive home from work and that when traffic is sparse people are sleeping. None of this requires a mathematical model, but does require several conceptual models.
That’s his nature.
Michael,
Matt Skaggs treats this as a temperature excursion within a control volume, but the temperature excursion depends on the net energy balance. If you limit the analysis to the energy balance (or temperature) at the surface then you miss the ocean´s heat capacity, which happens to be the largest system component.
This means solving the problem requires we understand the net energy balance in the ocean. The “capacitance” he mentions is the ocean´s ability to absorb and discharge heat. However, we lack one century´s worth of temperature observations WITHIN THE OCEAN. This means we are missing a really important piece of information: the ocean´s energy content.
We can´t go back in a time machine to measure the temperature of the ocean at depth, and this is the minimum required to get decent information.
So how do the subject matter experts suggest we get around this problem? (I suppose there are ways to get around it). However, offering a simple surface temperature record doesn´t provide the answers we need.
They need to come up with a sound quantitative method to describe the way the energy flows in and out of the ocean, then explain why the surface temperature isn´t responding partially to such energy flows.
Model data trumps no data.
NO!
incorrect model output is much worse than no data.
> Model output offers one explanation.
I thought the explanation was in the model, John
What are you modeling, if you don’t have an explanation to start with?
Oh, and nice post, MattS. The best post so far on Judy’s.
Agreed. the intro assumes that popular and/or politically connected climate scientists (ie realclimate) who have in the past enabled the CAGW meme (they have moderated significantly over the past couple years). There is a rich and rigorous literature conducted by work-a-day scientists that don’t deserve such derision.
That said, Michael, your comment on the century of temperature observations and the attribution are different kettles of fish and is not supportive of your complaint. This comment from you indicates that, like John Carter, your lack the basic sophomoric skills in the engineering and scientific art of problem solving.
In effect, you are making yourself the strawman Matt slew. By discrediting yourself, you actually made your first point. Matt’s opening should have not been directed at climate scientists, rather at the poetically useful idiots such as yourself.
I’m quite sure all this is rather quite over your head.
I get the feeling Matt argues for a model checker, Howard.
Considering the complexity of the task, I doubt he will ever obtain satisfaction. There are lots of states to check in a climate model.
But I’m willing to be surprised. I once thought chess engines would never beat world champions. I was 15, but still.
howard,
Keep tilting at your windmill.
I made no suggestion that attribution and observation are the same – not even a hint of such. Just that Matt’s suggestion that attribution has been entirely model based is mistaken.
But you were too keen to show how terribly clever you are, to notice.
agree not a good start
Steven Mosher: agree, not a good start.
“For years, climate scientists have followed reasoning that goes from climate model simulations to expert opinion, declaring that to be sufficient….” Matt
If you replace the “climate model simulations” with “radiative energy theory of Arrhenius” [that’s an abbreviation], then the statement is true of many commenters, such as James Hansen cited by FOMD, and Steven Mosher below. The idea of looking at all possible causes and evaluating all of them with respect to all of the evidence is frequently derided.
As written, without the substitution that I suggested, the statement is true of Michael Mann, Gavin Schmidt and Kevin Trenberth. Trenberth rather famously believes in missing heat that must be sought and found, rather than looking at any other natural processes.
Matthew Its not a good start when you paint an long historical endeavor with one sentence, no matter how you may try to shoe horn in a term that makes the over simplifcation less objectionable, the sentence remains exactly what it is: a freshman like, throat clearing, generalization to get the ball rolling.
Try this.
Try what I would tell any freshman.
Get RID of your throat clearing at the beginning of the paper.
Try it. Strike out any throat clearing.
put a big blue pencil through the first paragraph and start with the second.
Guess what? it improves the paper because you
A) dont over simplify history
B )dont create a strawman
C) dont force defenders to explain “what the general meant to say”
D) dont start off with the arrogant claim that your opponents have done
something wrong.
Steven Mosher: B )dont create a strawman
As I wrote, I do not think that it was a strawman. A goodly number of scientists have gone from simple or complex models to alarm and policy recommendations with very little evaluation of the science of climate change. Pierrehumbert’s book never mentions background variation or non-radiative transport of energy from the surface to the upper troposphere, yet asserts that the equilibrium climate sensitivity to a doubling of CO2 is 2C. It’s a bit much for me to call that “little evaluation of the science”, but it has little about the natural history of climate variation on Earth, and the use of that natural variation in assessing climate sensitivity to CO2.
“but it has little about the natural history of climate variation on Earth, and the use of that natural variation in assessing climate sensitivity to CO2.”
What is this “natural variation” that you are referring to? I think “skeptics” will have something to bring to the science table when you can answer that question. Science needs coherent theories to advance and all you have is this undefined “natural variation” that you say has been warming the earth since 1950.
Joseph
“What is this “natural variation” that you are referring to? I think “skeptics” will have something to bring to the science table when you can answer that question. Science needs coherent theories to advance and all you have is this undefined “natural variation” that you say has been warming the earth since 1950.”
1. The natural variation “they” refer to is the same natural variation that
the IPCC refers to. you can think of it as unforced variability, or
internal variability. There are two ways to look at this
A) you start with X, you subtract Y, you are left with Z.
X is the temperature we observe. “Y” is the temperature we think
we can attribute to known EXTERNAL forcing. Whats left
is Z. This residual is the “stuff” warming and cooling that is
not explained by the physics that gave you Y
B) you start with X, you subtract Y, you are left with Z.
X is the temperature we observe. Y is the temperature contribution
from known patterns in the temperature ( say an ocean cycle)
you are left with Z. This residual stuff is the warming that is due to
human warming.
2. ‘Science needs coherent theories
well they have coherent theories, say Judiths stadium wave.
I think it might be wrong. But its clearly published and clearly
coherent.
The fundamental problem is this. Climate models dont, by design, capture natural modes of variation very well. So its hard to use them to rule out natural internal unforced variation as a cause.
The fundamental problem is this. Climate models dont, by design, capture natural modes of variation very well
The fundamental problem is that the underlying hydrodynamic equations are not fundamental,they are phenomenological equations,with all their underlying constraints.
Mathew Marler,
You clearly “won” that bout with Mosher, yet he diverted to responding to Joseph without acknowledging you had a valid point and he accepted he was out of line on that. That’s one of the sighs of intellectual dishonesty.
Mosher’s first comment that appears on this thread shows sighs of bias and motivated motivated reasoning.
The “root cause” is natural climate cycles, one of about 1,000 years and another of 60 years superimposed on the first. The current slight cooling since 1998 will continue for another 14 or 15 years, and about 500 years of long-term cooling is due to start within the next 100 years or so.
These natural climate cycles are compellingly correlated with the inverted plot of the scalar sum of the angular momentum of the Sun and all the planets, possibly because of planetary magnetic fields which reach to the Sun and may affect its radiation and cosmic ray flux.
Because the temperature gradient in a planet’s troposphere is the state of thermodynamic equilibrium which the Second Law of Thermodynamics says will evolve, the planet’s supported surface temperature is autonomously warmer than its mean radiating temperature, so warm in fact on Earth that we need radiating gases (mostly water vapour) to reduce the gradient and thus cool the surface from a mean of about 300K to about 288K, this being confirmed by empirical evidence (as in the study in my book) which confirms with statistical significance that water vapour cools rather than warms, all these facts thus debunking the greenhouse conjecture.
“The current slight cooling since 1998 will continue for another 14 or 15 years, and about 500 years of long-term cooling is due to start within the next 100 years or so.”
_____
As with any such specific prediction, a large skeptical grain of salt must be applied. The assumption that some regular cycle exists in the climate where the past can be easily extrapolated into the future is not supported by the data. The climate is chaotic, nudged over the long-term by specific unique combinations for forcing, with a lot of wiggly natural variability “noise” over the shorter time frames. Simple cycle extrapolation, even if clever combinations of curve-fitting must be treated with the maximum amount of skepticism.
“””The current slight cooling since 1998 will continue for another 14 or 15 years, and about 500 years of long-term cooling is due to start within the next 100 years or so.”””
Take a step back and really examine why skeptics persist in the idea that there has been cooling. If we are only looking year to year or decade to decade, climate wise, it is irrelevant. There is no dispute among scientists who actually study this issue that the trend is on an upward slope.
So WHY the insistence that the earth is cooling?
Think about that. Not too hard or too objectively or it might cause you to be skeptical about skepticism. (And, if objectively it does not, you might not have the same brilliant tendency for complex understanding on this issue that many of the climate scientists who study it do – or at least the knowledge, so maybe your opinion, being less informed and less naturally fluent in such analysis and understanding, could take a back seat, or at least be mitigated by what the professional scientists who actually study this issue say?)
Taking issue with something you don’t want to accept or to believe is true is not independence, nor independent thinking. It is called close minded thinking, and it is very different, and it usually finds ways to substantiate itself – to convince itself it is using reason and perpetuate the pattern and persistence in a false belief or idea; only further enabled when so many others want to do the same, the issue produces a lot of passion, and there is massive information (often put out by ideological think tanks who are fighting possible ways of redress by instead sowing doubt over the issue itself.)
Taking issue because you have a more thorough knowledge base and understanding of the issue than the experts who study it (usually a pretty big step) is something else entirely.
Now, second, also think about the original above statement again, and notwithstanding the ongoing “belief reinforcing” substitution of the short term for the long (much like skeptics focus only on antarctic sea ice extent, when there are specific reasons for it, the arctic ice extent decline has been at a ten fold faster pace than any antarctic ice increase and is more relevant for a number of reasons, and BOTH the north and south polar region glaciers are again BOTH losing ice, and at an accelerating rate – see the middle of this piece here for more details and multiple links to the world’s leading science institutions)
…..think about why the insistence on the idea that the earth is cooling.
Why might skeptics continue to do this – to believe it – when even this, secondary (tertiary even) as it is, is false?
The warmest years on record according to NASA have been 2005 and 2010, http://www.giss.nasa.gov/research/news/20140121/ both higher than 1998. 1998 was near the tail end of a decade that jumped well above the mean average longer term rate of increase (there is a thing called climate variability, it didn’t disappear with climate change, and if anything probably only intensified;, and ocean warming and glacial melt both accelerated during this period, taking more energy out of the air – see below). And it had previously been the warmest year on record, well above the mean, so a bit of an outlier (at the time, anyway). And is now among the 14 very warmest years the earth has experience since record keeping began in the mid to late 1800s (depending on various stations.)
The other thirteen? ALL THIS MILLENNIUM. And there has only been fourteen years so far (through the end of 2013) in this entire millennium to begin with. Not only that, this past September was the warmest on record according to NASA. The climatic summer in the northern hemisphere, June – August was the 4th warmest on record according to NASA, and the warmest according to NOAA, and the three months prior to that, Mar-May, were the second warmest ever. And, if current trends continue, according to the World Meteorological Organization, 2014 will become the warmest year the planet has ever experienced in modern history.
Not to mention,why do skeptics continue to ignore, dismiss, or simply “argue with” by any means possible, the far more important fact that most of the increased absorbed heat energy is going into warming the oceans, not the atmosphere (thus keeping the ambient air temp rise from registering as high as it otherwise would, and impacting FUTURE climate far more). The World Meteorological Organization: “93% of the increase in heat energy the past few decades HAS GONE INTO heating the oceans
https://docs.google.com/file/d/0BwdvoC9AeWjUeEV1cnZ6QURVaEE/edit
And the rate of increase, which is even more important in some sense, is likely several hundred percent, and possibly 1500% faster, than at any point in the last 10,000 years.
http://www.voanews.com/content/oceans-are-buffers-for-climate-change/1781090.html Odd coincidence, right? “But of course.”
In fact it was likely the relatively cool ocean that kept (and has kept, but it is changing) temperatures fairly moderate.
Considering not just the fact that the oceans, which are far more imp than the atmosphere, are warming, and warming at an extremely rapid geological rate, both polar glacial areas are LOSING ice en net, and it is accelerating at both ends
AND that the actual ambient air temperatures, according to a composite of the three main global air temperature data sets (HadCRU< NOAA< NASA), and the WMO (which uses a composite of the three) are continuing to increase…
….The claim that the earth is slightly cooling, is, at best, a farce. WHY do skeptics continue to insist however, that it is the case.
Repeat question from above: Take a step back and really examine why skeptics persist in the idea that there has been cooling.
The assumption that some regular cycle exists in the climate where the past can be easily extrapolated into the future is not supported by the data.
It certainly is supported by the data. The data has gone from warm to cold to warm to cold in the same bounds for ten thousand years. That is as good as it gets.
“The “root cause” is natural climate cycles, one of about 1,000 years and another of 60 years superimposed on the first”
Yep.
This (comment above, and re-quoted in relevant part just below) is a classic example of where “climate change “skepticism” comes from. But Judith Curry is apparently oblivious to it. Hence, “this site,” which, being largely self reinforcing and somewhat insular has only perpetuated and greatly exacerbated that tendency.
This person WROTE A BOOK on this issue. (Stunning science by pointing out the essential irrelevance of that main molecule that “traps” energy and increases the lower atmosphere/earth energy balance – though science was too blind to this level of genius apparently to take note of this remarkable discovery that is somewhat akin to Galileo remarking to a then similarly dense world how the earth revolves around the sun). And, remarkably, writes:
“””Earth that we need radiating gases (mostly water vapour) to reduce the gradient and thus cool the surface from a mean of about 300K to about 288K, this being confirmed by empirical evidence (as in the study in my book) which confirms with statistical significance that water vapor cools rather than warms, all these facts thus debunking the greenhouse conjecture.””
Water vapor cools rather than warms.
Water vapor, which is a greenhouse gas, albeit short lived, and a component of and response to weather conditions – but not, being so ephemeral, a driver of much longer term weather patterns (or climate) – and due to it’s heavy prevalence the greenhouse gas that is on average responsible for more re ra-radiated heat than any other, in fact is not warming, but cooling. By capturing thermal radiation (heat energy emitted from the earth’s surface components and re radiating it in all directions – part of the same process that is accepted (somewhat like the “earth revolves around the sun accepted”) to keep the planet much warmer than it would otherwise be in the absence of any of these molecules – it actually “cools.” the earth.
Someone alert the scientific journals to start rewriting scientific history.
Lots of scientist are throwing their hands up in the air both at the level of future change we have already set in affect, and at our rather misinformed head in the sand response to it, and would love for this to not be as big of an issue as they “think” it to be. So there would not only be sufficient support from somewhere or another, it would be large. And science journals love contrary opinions, it is how science understanding is shaped.
______
But then this same comment calls the greenhouse concept, “conjecture,” which this commenter’s book “debunks.”
“This post also clarifies the disagreement between myself and Gavin Schmidt. ” – JC
Ah, the missing response.
Still on its way perhaps.
I think that the disagreement is going to boil down to null hypotheses. Gavin insists that AGW is true until proven false, while skeptics claim that it should be considered false until proven true. There are certainly arguments both ways, but IMO Gavin comes out on the short end of this one.
Getting the null hypothesis wrong is one of the most common ways for science to go wrong.
You may have said it but I could see it. So I will restate it again. Before you can assess whether something is abnormal, you must first characterise what is normal.
Instead, like every other damned academic you go straight to “let’s have a look at the bit that shows abnormality”.
But how do you know it is abnormal or anything unusual until you know what is usual?
To put that more formally, you suspect a signal and you know there is noise. But what is the ratio of signal to noise? And if the ratio is too high, then it doesn’t matter if you find correlation or causation or bananas hanging from trees, if the original signal contains no information, then no information can be obtained from it. If the signal is too small or too short relative to the noise to produce meaningful information, then no amount of processing or tools and techniques will provide anything useful.
Or as they say in computing: garbage in is garbage out.
Scottish – assuming you meant “couldn’t” rather than “could”, he did say it:
“I have grave doubts that we have survived Step 1 in this process, but let’s assume that the customer wants us to continue.”
Step 1 is listed as:
“Verify that a significant excursion has occurred.”
How do you know what is significant change until you know what is normality?
Instead, the way this is always approached by academia is “we know what is normal” – so let’s check to see if there has been a significant change from what we know is normal.
The problem is that everything we have seen in the last 150 is clearly very normal behaviour of the climate. I can say this because I’m used to studying systems like this and I know that I could not come up with any other conclusion other than the system appears to be behaving normally.
The assumption that multi-proxies (which agree very well on general trends) are somehow all corrupted by confirmation bias, or something worse, is a naive viewpoint at best. Yes, a degree of uncertainty always exists, but the general shape of Holocene temperature trends very likely looks close to this:
http://www.newscientist.com/data/images/ns/cms/dn23247/dn23247-1_1200.jpg
Pull out some random threads from that spaghetti graph, and let’s see how well they “agree very well on general trends”!
That’s exactly why a multi-proxy approach is best. Any individual proxy will have multiple sources of potential bias, but multi proxies eliminate that. A “fuzzy” multi-proxy graph is a beautiful thing…
IOW you agree that your statement:
… Wasn’t true. They don’t really agree. Only the ‘“fuzzy” multi-proxy graph’ shows the trend you want; none of its components show it.
When you consistently apply multiple proxies over several thousand years and get this shape:
http://i59.tinypic.com/2cz4ta0.jpg
You can plainly see the excursion “hockey blade” is significant. The causes of this excursion becomes the key point. How much is natural variability or non-anthropogenic external forcing and how much anthropogenically forced?
R. Gates says:
While showing a graph from Marcott et al. This is silly as the only reason you get the predominant aspect of that shape (the large excursion upward) is due to a methodologic problem which is both obvious and severe. In fact, Marcott et al acknowledge it is not a meaningful result. Despite this, he then says:
Which is BS even according to the authors of the work he cites. He is right to say this though:
The cause of that excursion is the methodology Marcott et al used. Their methodology suffers from the same problem Steven Goddard’s criticism of the USHCN temperature record suffers – series drop outs. The only reason there is a blade in that image is the proxies in the Marcott et al reconstruction cover different time periods.
To R. Gates, that means we “can plainly see the excursion ‘hockey blade’ is significant.” To Steven Goddard, it means we “can plainly see the” USHCN temperature record is fraudulently manipulated. To anyone who actually cares about evidence, data or reality, it means these guys use a flawed methodology which biases the results and do nothing to correct for that.
By the way, it’s amusing R. Gates says:
The only reason anyone would believe what I quoted him as saying in my last comment is confirmation bias. There’s no other way someone would fail to know Marcott et al acknowledge the “blade” of their reconstruction is unsupported by their methodology.
Maybe a person not suffering from confirmation bias would be unaware of the artifact caused by series coverage as that requires some small amount of technical examination, but to not be aware of what the authors of a graph say about the graph you share? Even if you didn’t see the authors say it, the point has been brought up in practically every discussion of the Marcott et al paper, often by the people defending the paper.
There is no excuse for being unaware of basic point everyone discussing the paper has acknowledged then calling people “naive” for their beliefs. The reality is you have to be incredibly naive to think any paleoclimatic temperature reconstruction, ever, has confirmed the “blade” of a hockey stick. There isn’t a single one which has.
(Before anyone starts posting paleoclimatic reconstructions, realize, showing a blade doesn’t mean confirming a blade. Reconstructions use the modern temperature record as a target, meaning a “blade” is inherently built into them.)
Brandon,
Was it Marcott who said of their data that the 20th century portion of their reconstruction was not “robust”? Or I am I thinking of the Cowtan and Way paper?
Yes, and no, Bill. It’s the 21st Century part of the C&W ‘reconstruction’ that amuses me.
============
IIRC it was one of the other authors, but speaking for the whole group. Don’t have time to chase down links, but you can start with Pielke Jr.
Marcott et al. responded at realclimate
http://www.realclimate.org/index.php/archives/2013/03/response-by-marcott-et-al/
Using 73 reconstructions with an average resolution of ~120 years with additional smoothing provides around a 200 year smoothed “shaft”. So if you want to compare instrumental to Marcott use one data point for the instrumental period and you get FIIK.
@R Gates your data is not real data that is more hockey stick
http://judithcurry.com/2014/10/23/root-cause-analysis-of-the-modern-warming/#comment-640713
Real data for the last ten thousand years goes from warm to cold to warm to cold and does not have the hockey stick on the end.
R. Gates, the Marcott Science hockey stick is a result of what is in my opinion clear academic misconduct. Unlike in Marcott’s thesis, which had no such hockey stick, the Science paper produced one by redating coretops. Provable in the SI and in comparison of thesis to paper figures. See the proof guest posted here in March 2013, now republished as ‘A High Stick Foul’ in the new book. Relying on discredited misinformation does you no credit.
R. Gates said: You can plainly see the excursion “hockey blade” is significant. The causes of this excursion becomes the key point.
Actually, the spaghetti graph is indeed very revealing. Just not of what you want. The older the measurement, the lower the temporal resolution; the graph practically screams that.
Now, let’s see if you actually understand basic math: what does the fact of changing resolution do to the significance of the “blade?”
R. Gates | October 24, 2014 at 5:41 am |
“When you consistently apply multiple proxies over several thousand years and get this shape: “
Yawn…
That isn’t a graph of “multiple proxies over several thousand years”, it’s just another representation of the Marcott rubbish that even its own creator has disowned.
Stop making stuff up.
@ Scottish Sceptic
“”Or as they say in computing: garbage in is garbage out.”
Or as they say in Climate Science: garbage in is gold out.
Modern alchemists turning lede into gold.
==============
“The cause of that excursion is the methodology Marcott et al used.”
______
Flat out wrong. The fact of the excursion itself is not the issue– only the cause or causes. Multiple proxies give us a high degree confidence the excursion of the current warming is a real and significant event against the backdrop of the Holocene. How much is natural variability vs. natural external forcings vs. anthropogenic forcing is the first central issue, followed closely by the second central issue – what, if anything, we need to, or can do about it.
R. Gates,
Flat out wrong?
You are in pretty rare form today. The Marcott reconstruction is smooth so much that “excursions” less than 120 years don’t exist. The temperature record would need to be smoothed the same for an apples to apples comparison. Here is an example
https://lh3.googleusercontent.com/-Z_Bt6YEkLjA/VEqqqJ81jBI/AAAAAAAALo4/lCQvF-e8tRM/w577-h344-no/oppo%2Bsmooth.png
That is one of the higher resolution ocean reconstructions. The smoothing of the samples averages 50 years and the authors “binned” the reconstruction into decades. Since the reconstruction is in degrees C, I “spliced” the instrumental data in degrees C with the same 50 year smooth and annual. There isn’t much of a hockey stick with matching smoothing.
”
Q: How do you compare the Holocene temperatures to the modern instrumental data?
A: One of our primary conclusions is based on Figure 3 of the paper, which compares the magnitude of global warming seen in the instrumental temperature record of the past century to the full range of temperature variability over the entire Holocene based on our reconstruction. We conclude that the average temperature for 1900-1909 CE in the instrumental record was cooler than ~95% of the Holocene range of global temperatures, while the average temperature for 2000-2009 CE in the instrumental record was warmer than ~75% of the Holocene distribution. As described in the paper and its supplementary material, Figure 3 provides a reasonable assessment of the full range of Holocene global average temperatures, including an accounting for high-frequency changes that might have been damped out by the averaging procedure.
– See more at: http://www.realclimate.org/index.php/archives/2013/03/response-by-marcott-et-al/#sthash.JfrxP6j0.dpuf
So even though the smoothing is over 120 years for the reconstruction Marcott and gang compare two decade averages. If they compared apples to apples, they would say the the period 1890 to 2009 is about average compared to the Holocene. That is not very $exy though is it?
“Q: What do paleotemperature reconstructions show about the temperature of the last 100 years?
A: Here we elaborate on our short answer to this question above. We concluded in the published paper that “Without filling data gaps, our Standard5×5 reconstruction (Figure 1A) exhibits 0.6°C greater warming over the past ~60 yr B.P. (1890 to 1950 CE) than our equivalent infilled 5° × 5° area-weighted mean stack (Figure 1, C and D). However, considering the temporal resolution of our data set and the small number of records that cover this interval (Figure 1G), this difference is probably not robust.” This statement follows from multiple lines of evidence that are presented in the paper and the supplementary information: (1) the different methods that we tested for generating a reconstruction produce different results in this youngest interval, whereas before this interval, the different methods of calculating the stacks are nearly identical (Figure 1D), (2) the median resolution of the datasets (120 years) is too low to statistically resolve such an event, (3) the smoothing presented in the online supplement results in variations shorter than 300 yrs not being interpretable, and (4) the small number of datasets that extend into the 20th century (Figure 1G) is insufficient to reconstruct a statistically robust global signal, showing that there is a considerable reduction in the correlation of Monte Carlo reconstructions with a known (synthetic) input global signal when the number of data series in the reconstruction is this small (Figure S13).
– See more at: http://www.realclimate.org/index.php/archives/2013/03/response-by-marcott-et-al/#sthash.JfrxP6j0.dpuf
So since their smoothing results in a period of less than 300 yrs not being “interpretable”, why would they tack on a couple of decade averages? To $ex things up. Since you are into TV, you know all about that right?
Since there are, “and (4) the small number of datasets that extend into the 20th century (Figure 1G) is insufficient to reconstruct a statistically robust global signal.” they pretty much spell out the issues, but that does stop Noaa from using this.
http://www.climate.gov/sites/default/files/styles/inline_all/public/Comic_RollerCoaster_610.jpg
Nice sales job, but not very scientific.
I love that excellent chart of IPWP temps Captn. D. It shows so well the tailspin that ocean heat went into as a result of the volcanoes that preceeded the LIA. Two of the largest eruptions of the past 2000 years occurred in 1257 and 1453. These did a real number on OHC, with the final cap to the LIA being Tambora and the famous ” year without a summer”. How wonderful that ice core data has so recently and excellently revealed these clear cut climate relationships.
Gates would have us believe the majority of the warming in the 20th century was a recovery from volcanoes that took place centuries prior to that. I’m skeptical.
R. Gates, “I love that excellent chart of IPWP temps Captn. D. It shows so well the tailspin that ocean heat went into as a result of the volcanoes that preceeded(sic) the LIA.”
Then you might enjoy some of the southern oceans reconstructions. There are indications of warming there starting around 5000 years ago that coincides with a shift in CO2. That would likely be orbital forcing. I am waiting to get some of the newer Antarctic data that shows some of the D-O response in the SH.
But back to Marcott, the verbiage doesn’t match the sales pitch. Originally, I thought it was confirmation bias or “noble cause” corruption, but I am beginning to believe it is lack of rational reasoning skills. There is a new paper out on OHC that tends to prove my point. “Slicing” data, especially the “high quality” data with the makeshift data that has various smoothings applied, natural and after the fact, is not something “Climate Scientists” appear to be very good at.
R. Gates, if you want to make comments like:
Go ahead. I won’t even try to show you wrong. There’s no point when you’re denying basic technical points even people like Tamino acknowledge. If you want to defend a methodology on par with what Steven Goddard does, have fun. It just shows you’re every bit as close-minded as you accuse others of being.
You might as well just jump up and down shouting, “I’m right!” It’d be as constructive, and silly, as your denial.
Thanks, Matt, for your effort to use “root cause analysis” to identify the problem.
George Orwell identified the problem as political, rather than analytical, before he started writing “Nineteen Eighty-Four” in 1946.
Wow! That was brilliant! That pulls together an organizational picture and allows one to have a handle on what seemed to always be shifting around depending on what article one was most recently reading. Impressive.
Root cause: the systemic bias in the land temperature record due the UHI effect, erroneous adjustments to the data and simply making up data were non exists to come up with an imaginary average global temperature.
This is a very interesting post on several levels and I’ll need to review it a few times. There are a few early key points I could pick apart, but one in particular that stands out and is fundamental. It was stated:
“Holocene reconstructions suggest that the modern warming is not particularly significant.”
_____
Of course the operative phrase and word of interest here are “not particularly” and “significant”. It is a credit that at least the modern warming is acknowledged (versus being an illusion created by data manipulation or other such nonsensical ideas). “Not particularly” is a fudge phrase indicating that there is nothing special or of note in the modern warming. Based on the very analysis described here, that conclusion cannot be drawn. The modern warming (since 1980 if you like, but the oceans have been warming on a decadal basis for longer). does stand out against the background of the holocene as a significant excursion if by significant we use the metric of unusual or rare. But the notion that we don’t have any idea what caused previous significant excursions in surface temperature (I prefer ocean heat content as a more stable metric) is simply wrong. Because there is not complete consensus about the combination of forcing and related feedbacks, does not take away from the fundamental physics involved in understanding the net forcing. The exact combinations and percentages of forcings that produced the MWP and the LIA, for example, might not be known, nor the exact role of natural variability, but the general forcings that existed on the climate during these relatively recent periods are understood and do match up with the general warming or cooling of the periods. Multi-proxy records are aligning on painting a clearer picture of these relatively recent Holocene periods. So too, with our modern warm excursion, the Holocene record would indicate that it IS particularly significant, on a hemispheric as well as global basis. Furthermore, owing to a constantly expanding fleet of instruments gathering global data from the depth of the oceans to orbiting satellites, we have a nearly daily accounting for the energy imbalance the climate system is experiencing. Nearly every day we can see both how significant the modern warming is, both by data and by direct experience, and year by year we are measuring the exact combinations of forcings that go into causing that excursion.
How can you call it “unusual or rare” when we have no evidence at all whether similar “excursions” have occurred before?
Nothing prior to mid-20th century for ocean heating: sea-level doesn’t cut it if you don’t know what Antarctic ice has done.
Nothing prior to mid 18th century about global temperature except a bunch of highly unreliable “proxies”, some of which were denied by their own researchers.
“How can you call it “unusual or rare” when we have no evidence at all whether similar “excursions” have occurred before?”
______
The climate of the past 8,000 years (the bulk of the Holocene), comes more and more into focus with each new study. We know the general trends and major excursions. Multi-proxy records from around the globe continue to be analyzed in great detail and each one brings the Holocene into more and more focus. The modern warming is seen more and more for what it is — quite a significant excursion:
http://www.realclimate.org/images//Marcott.png
“Proxies” that are accepted because they prove that the modern warming is a “significant excursion”?
That’s begging the question.
There are several proxies, used in almost every reconstruction, that have been demonstrated to be highly suspect, but can’t be removed without making the handle of the hokey stick look too much like the blade.
Oh come on, R. Gates.
Have you no shame?
Even Marcott has disowned that graph.
AK –
==> “How can you call it “unusual or rare” when we have no evidence at all whether similar “excursions” have occurred before?”
Out of curiosity – would any magnitude of warming over the next 10, or 20, or 50 years meet your standard for evaluating whether it is rare or unusual? If so, what magnitude of warming would that be, and on what basis would you make that determination?
I would have to be convinced that a similar warming in the past would have left unmistakeable evidence. Evidence that can be shown not to exist.
Especially since what I see is a warming that’s within a few points of the previous warming, compared to the differences with cool points.
Remember the “warming” you’re talking about isn’t any greater in any one place than prior apparent local excursions. The assumption that past local events are not part of general global “excursions” is unwarranted.
Here’s a nice counter-balance to this discussion:
http://www.realclimate.org/index.php/archives/2013/09/paleoclimate-the-end-of-the-holocene/
With specific section discussing: “Is the modern warming unique?”
IIRC Marcott et al. was pretty badly savaged at CA. Not going to waste time digging up links. IMO it’s a prima facie case of question begging. Given the proxies it uses.
==> “I would have to be convinced that a similar warming in the past would have left unmistakeable evidence. Evidence that can be shown not to exist.”
How do you determine what is “unmistakable evidence?” Seems to me that you have to have some clearer sort of criteria than something as vague as “unmistakable evidence,”
Also, please explain the phrase “evidence that can be shown not to exist.” I don’t quite understand how you can show that evidence does not exist?
==> “Remember the “warming” you’re talking about isn’t any greater in any one place than prior apparent local excursions. The assumption that past local events are not part of general global “excursions” is unwarranted.”
???
I thought we were talking about global warming.
I don’t see why…
You asked me what would meet MY “standard for evaluating whether it is rare or unusual?”
Well, I do. And you asked me about my “standard”.
“Global excursions”, that is excursions in “global average temperature” tend to be small compared to local events.
Maybe we ought to be happy, without the extra CO2 those of us who survived the coming of the new Ice Age could be eating Kentucky Fried Penguin.
AK:
There are issues about the Marcott et al proxies, especially in how many were re-calibrated by Marcott et al, but that’s not the most important issue. The most important issue is the “blade” R. Gates promotes is purely an artifact of a bad methodology.
You may Steven Goddard sometimes accuses USHCN of fraud by showing a simple average of temperature records. The large difference in results stems from the fact the various temperature stations have different baselines,* so when stations drop out, the change in average baseline introduces a bias into the results.
The same thing is true for Marcott et al. They don’t do anything quite as simple as Goddard though. Instead, they use a methodology which exacberates the problem. In their methodology, they “jigger” the time values of their proxies. The idea is the dating process has uncertainty in it, so they move the time values around to see what effect it has on the results.
The problem is they already have a series drop out problem. By shifting the time values around, they force series which would already drop out to drop out sooner. Series which cover the entire period (and even extend beyond it) will tend not to drop out. That means the results will be biased because of the change in baseline of the proxies, a bias dominated by the series which extend the furthest into modern times.
Repeat the jigger process a thousand, or ten thousand times, and when average the results together, you can easily get huge artifacts like that shown in the Marcott et al graph. It’s purely an artifact though. It has no more validity than Steven Goddard’s cries of “fraud” in regard to the USHCN temperature record. In fact, it has less validity because Marcott et al’s methodology is more biased than Goddard’s – an incredible feat.
*Marcott et al do use a shared baseline for their proxies, but it is long before the most recent period. The baselines of the proxies in the more recent times are what are different.
Gates, I hope all is well. You seem to have suffered a brain injury recently.
“and year by year we are measuring the exact combinations of forcings that go into causing that excursion.”
The excursion that those measurements appear indicate that that excursion ceased – and in all probability reversed – around 18 years ago, you mean?
“…that excursion ceased – and in all probability reversed – around 18 years ago, you mean?”
____
Let’s see, out of that 18 year period, the past 10 have been the warmest, and out that warmest 10, the past 6 months have been the warmest. Odd way for warming to “reverse”, or “cease”.
“Let’s see, out of that 18 year period, the past 10 have been the warmest, and out that warmest 10, the past 6 months have been the warmest.”
Yeah, yeah, yeah… Of course they have!
You just keep on telling yourself that if it makes you feel better!
Even if the warming by 2100 only turns out to be 1.5 C (which would be on the low side), the modern warm excursion will be seen a exceptionally unique against the backdrop of the Holocene:
http://www.realclimate.org/images//shakun_marcott_hadcrut4_a1b_eng.png
Or perhaps this cartoonish version of Holocene temperatures should be used:
http://hot-topic.co.nz/wp-content/uploads/2010/05/Easterbrookholocene.0091.jpg
“the modern warm excursion will be seen a exceptionally unique against the backdrop of the Holocene:”
There isn’t any “warm excursion”, and that ridiculous graph is entirely fraudulent, just another entirely bogus hokey schtick.
As I suspect you are in fact well aware.
Here’s one of my favor Holocene temperature charts:
http://www.newscientist.com/data/images/ns/cms/dn23247/dn23247-1_1200.jpg
Shows both the range of the proxies, and the context of the current warming. Yep, definitely looks to be remarkable.
Smooth as a sow’s ear.
=========
I like this one. It is from Pielke Jr’s blog and shows the study with the part that isn’t statistically significant chopped off
http://rogerpielkejr.blogspot.com/2013/03/fixing-marcott-mess-in-climate-science.html
Looks like Gates got punked on this graph just like others as suggested by Pielke Jr. in the link by steven. Gates. how could you? You let me down.
Gates, you can’t say that data from recently-introduced and superior measuring instruments shows on a daily basis “how significant the modern warming is,” because you have no comparable prior data with which to compare it.
Multiproxy paleoclimate data is prior data. We do have an increasingly robust paleoclimate data set for the Holocene, and even an increasingly robust data set extending back to the mid-Pliocene. Most importantly, we are able to begin to align certain specific forcings with general longer term trends over past periods in Earth’s history, with that alignment having an increasing level of confidence through robust multi-proxy approaches.
Marcott.
http://www.newscientist.com/data/images/ns/cms/dn23247/dn23247-1_1200.jpg
GISP2 Greenland
http://upload.wikimedia.org/wikipedia/commons/5/57/Greenland_Gisp2_Temperature.svg
What Marcott loses in smoothing is revealed with a higher resolution proxy – the dynamical mechanism at the heart of climate.
From CA I believe:
1. Marcutt’s original thesis showed no 20th century uptick, but his published article did.
2. The uptick arose from re-dating core tops, without presenting any evidence that this was justified, and from deleting data.
3. The uptick would not exist if the article had used the same data and methods for the last century-odd as for earlier periods. Inter alia, earlier periods are century-plus scale averages; later periods are short-term. This means trends and rates cannot be compared between periods.
4. The article nevertheless implied that the large sharp 20th century uptick was itself robust in the context of the article, since when a different procedure produced a different result, the difference was written off as not robust.
5. Accordingly, Marcott himself used the uptick at time of publication to claim that we had “never seen something this rapid” as recent warming.
6. Now that 1-4 have been pointed out, Marcott claims, contra 5, that the uptick is “not statistically robust” and “cannot be considered representative of global temperature changes”.
7. Marcott also claims that 4 did not mean what it said, but the opposite, i.e. 6.
8. Despite 5, Marcott further claims that the uptick “is not the basis of any of our conclusions”.
Without making judgments re motivation or honesty, one might well ask:
A. If the 20th century uptick was not robust, why was it included in the study?
B. Why were conclusions drawn on the basis of the uptick, including by Marcutt and Shakun, and including in the FAQ?
C. If the paper did not claim exceptional warming, why did Marcutt claim it in public?
D. Imagine the paper had left out the uptick: would the rest of the reconstruction have been published, given its lousy temporal resolution?
E. The now renounced claims of exceptional warming rest on data mishandling and exploiting the inevitably sharper trends inherent in short-term data. If this was not a deliberate attempt to mislead, then why now deny earlier statements (cf. 7 and 8 above)?
Also, RGB at Duke would scold R.Gates for making the “schtick”
“First, the climate now is not warmer than it was in the Holocene Optimum (do not make the mistake of conflating the high frequency, high resolution “2004″ data point with the smoothed low frequency, low resolution data in the curve — even the figure’s caption warns against doing that — for the very good reason that in every 300 year smoothed upswing it is statistically certain that the upswing involved multidecadal intervals of temperatures much higher than the running mean. It is left as an exercise to the studio audience to figure out how to use contemporary high frequency climate data to make a numerically reasonable estimate of how much warmer than the smoothed average peak multidecadal intervals almost certainly were during the warming intervals seen throughout this graph. Goodness, I think it is easily 1+C, isn’t it!”
Like I have said in the past, warmers are pathological.
“elevators and alligators” if I remember correctly
What a quip!
@R Gates
Re ‘significant’.
I am really, really, really not going to soil my underwear at the idea that the Global Average Temperature (if such a thing exists) has changed in my lifetime from 287.14K to 287.78K.
I’m content for you to play your little games calculating the number of angels that may or may not dance on the head of a pin. But the changes you are so concerned about are trivial and have very limited practical effects.
They are INsignificant. Get a life.
It’s the Holocene and, like every other named period, it does this up-and-down thing with temperature all the time. That’s ALL the time. I wouldn’t burst a boiler trying to attribute. Silly to analyse what you don’t have in hand. Best to get it in hand first, wouldn’t you think? And if it’s all too stupendously complex to be reduced to describable mechanism or system we’ll understand. You get that with vast things which are in constant flux.
When we have climate science we’ll know more, but right now academia is busy doing…ah, you wouldn’t believe it if I told you.
“I wouldn’t burst a boiler trying to attribute.”
_____
The “bursting a boiler” is called science and at the core is a philosophy that the universe, including the climate of planets like Earth, is not a random walk, but rather, with enough hard work, the causes behind things can be understood by the human mind. A novel idea that brought us out of the dark ages where gods and demons were the cause of things. Please let’s not go back.
You’re actually right!
Two-tailed elephant, Moso.
==============
“you wouldn’t believe if I told you.”
Mos,
Just a shout out to let you know I enjoy your writing. As a writer myself, I notice and appreciate a finely tuned comment and a nicely shaped line. It’s a matter of some interest to me that the good writers are virtually always of the skeptical persuasion. Also the most supple minds. I can’t think of a single alarmist possessing so much as a comic flair. There’s not a wit… much less a poet …among them. But on the skeptic side, such types are almost common. Why is this? I can’t help wondering.
Well, thank you, pokerguy.
‘After having no trouble for a year, the wheel does not fall off at the exact same instant that the fuel pump seizes. I will define a “stable” system as one in which significant excursions are so rare in time that they can safely be assumed to have a single root cause.’
Great start there Judy.
Like – to quote a recent example – the printer cable decides to go belly-up at precisely the same instant you install the updated printer drivers, perhaps?
Sod’s law will get you every time!
Neither a wheel falling off nor a breaking fuel pump point directly to a root cause: the car had been assembled in Detroit on Monday.
What about an accident caused by driving 110 miles an hour, while drunk, on bald tires, with your mother in law screaming at you from the backseat, in a driving rainstorm?
It was snowing the way I modeled the temperature at the computer. My vehicle clunked across the tracks in the sleet.
H/t ambiguity in ‘C&W’.
==================
With climate there is no root cause – there are control variables and emergent behaviour. I would be pretty sure Judy knows this – or are we hedging our bets on the fundamental mode of operation?
Earth does not have A Stable Temperature.
Earth does have A Stable Temperature Cycle that is about 1000 years long.
Earth does have A Stable Temperature Cycle that is about 60 years long.
These are easy to pick out. There are others.
Temperature excursions inside the bounds of these cycles can be chaotic. There have been no excursions outside of the bounds of the past ten thousand years.
Would you prefer to drive across a bridge designed and built by: a) a scientist, b) an environmentalist, c) an economist, d) a bureaucrat, e) a politician or e) an engineer.
Engineers are tasked with the unenviable duty of building things that actually work and are safe. They cannot make political or policy based decisions. They need to actually understand what is happening and understand what needs to be done.
I’ve long called engineers ‘Invisible Magicians’.
===================
My first day in engineering school we were told that anyone can build a bridge – only an engineer can build it cost effectively. My first job costing – I was told to work out a number and double it. Hey presto – it works. Or have I given away too many magicians secrets?
never fogetting that the first 90% of the job takes the first 90% of the time and money, while the remaining 10% of the job takes the next 90% of the time and money.
Thanks, Matt Skaggs, for the well-put-together overview. And thanks, Judith, for posting it.
Well, it took me 47 comments to read it. It’s lucid, and very elegantly states what the skeptics have been howling about all along. Thank you, Matt.
=============================
This comment:
“If the system is capable of exhibiting sufficient capacitance to produce the recent hiatus, there is no valid argument against why it could not also have produced the entire modern warming, unless that can be disproven with empirical data..”
______
From a net-energy standpoint, it can be logically proven that capacitance, or more specifically, the release of energy from the ocean to atmosphere, did not produce the “entire” modern warming period, given that over the entire warming period (beginning at your own starting point of 1980) the oceans (down to 2000m) have accumulated approximately 0.5 x 10^22 joules of energy per year during this period. With the oceans being the only likely source of “capacitance”, we can see that for them to be both warming the atmosphere through an energy discharge and at the same time, gaining energy is not physically consistent. Rather, some external forcing on the system (very likely the increasing GH gases) caused both the oceans and atmosphere to warm, with short-term natural fluctuations in ocean to atmosphere heat flux (mainly ENSO related) to be a noisy signal riding on top of the longer-term external forced rise in overall climate system energy.
Exactly, Roy Spencer also wouldn’t disagree that there is a TOA imbalance from measurements. I guess the light-bulb strategy to rebut Gavin’s arguments is to throw anything and everything available at ‘attribution’.
I have been a participant in several “root cause analysis” having been told such an exercise comes from the aircraft industry; i.e., when an aircraft crashes and burns, that is an excursion. The exercise is meant to identify systems problems and not to attribute blame; believing that it is a series of issues that leads to the excursion. Some of the issues involve communication or lack there of.
When I observe the above root cause analysis regarding attribution of global warming, the first thing that jumps out at me is the CAGW, there has been no catastrophic global warming. It is proposed, but there is no excursion.
The second part of root cause analysis is gathering the appropriate experts. In aircraft disasters, not only the aircraft manufacturer, there are meteorologists, NTSB, etc. My experience has been to assemble not only the group directly involved but also outside resources, who may not even be impartial. Then we talk. Then we listen. Then we decide what we don’t know and should know. Then we decide what may not be known. Then we decide to implement some system changes and see if it impacts problems of similar root causes; i.e., follow-up observations.
Since the global surface temperature hiatus was not predicted but is now observed, making a plan, nay implementing a plan based upon guesses, is, well…likely to end up in crash and burn.
What seems missing from the climate change root cause analysis, the climate change scientists don’t have outside help to see their own blind spots.
Fundamentally, no one knows if we have had a planetary temperature excursion as we don’t know what internal variability is. This comes down to not knowing something we need to know.
Fundamentally, no one knows if we have had a planetary temperature excursion as we don’t know what internal variability is. This comes down to not knowing something we need to know.
We have data for the past ten thousand years that has cycled in the same bounds. That is a record of the natural internal variability. We now to have more people working to understand what caused it. That is what I do.
http://popesclimatetheory.com/index.html
correction
We have data for the past ten thousand years that has cycled in the same bounds. That is a record of the natural internal variability. We need to have more people working to understand what caused it.
That is what I do.
the search for a unique signature in the modern warming is the best hope we have for resolving the attribution question.
Surely the signature is CO2 rise tied to surface temperature rises with minor explainable caveats re volcanoes and ENSO events.
There is now a complete disconnect.
Hence there is no unique signature for the small spurt of warming that was experienced independent of the monotonous CO2 rise.
>Surely the signature is CO2 rise tied to surface temperature rises with minor explainable caveats re volcanoes and ENSO events.
There is now a complete disconnect
Yes, but my caveat here is the length of time involved. The “accelerated warming” commonly ascribed to 1970-2000 is not much longer than the current plateau – and both are very tiny periods indeed
Drawing large-impact and economically damaging policies from this short time is irresponsible in my view
Ian, I agree, extremely irresponsible, but it is unlikely that anyone will carry the can for it.
+1 Ianl888. Short term data is absolutely no basis for AGW hypothesis. Fail Fail Fail!
Thanks for the valuable post Matt Skaggs.
“But when we lack the basic data to decompose the fault tree, maintaining my credibility (and that of the SMEs as well) demands that we tell the customer that the fault tree cannot be resolved because we lack sufficient information.”
This resonated with me. As a CPA, I cannot sacrifice my credibility in any situation. If I don’t know what the answer is, I cannot say that I do.
“In the real world, the objectivity of an independent study may still leave something to be desired, given the fact that the contracted investigators get their paycheck from the corporation, but the principle still holds.”
CPAs get paid by who they audit in many cases. I feel our mandated code of ethics is one thing that allows us to maintain objectivity. The reputation of our profession as a whole also helps.
Epistemology
[the theory of knowledge] I hate this use of this word. Why can we not just substitute understanding for epistemology and help my epistemology of the word.
Warning rant
HRT and breast cancer.
10,000 women, 5 years, 303 develop breast cancer.
Control group 300.
Cause of cancer according to patient, 303 HRT in the first group.
Cause in the second group, inevitably trauma at some stage in the 6-12 months preceding diagnosis.
HRT has the blame although it is only likely to have been the vehicle in 1% of cases. People need something to blame.
CO2 has the same problem.
If you are looking for causation you will find it . The true sensitivity is buried under the huge attribution desire and need.
[note above figures are off top of my head to give an example of attribution bias]
Judith,
I really like the direction CE is going. These last couple of posts are definitely thinking outside the box. You started from a position in concert with the orthodox view of CAGW a few years ago, moved to explore social science and the science policy interface and now you’ve introduced two excellent posts from engineering perspectives. This is fantastic, IMO. Your breadth of knowledge and your influence on global climate change policy may make you one of the most respected global authorities on climate science-policy interface in the not too distant future.
Thanks Bob Tisdale!
This was posted as I left work; when I got home my wife informed me that the power was out. A few minutes later a power company cherrypicker drove by, the power came on, and then the cherrypicker went the other way. I apologize to any squirrels I may have offended!
Matt, thanks for a very thought provoking post. Seeing something and understanding that same thing can be two very different experiences and having some guidance in organizing the thought process is invaluable.
You have included a capcitve ellement to your analysis. Have you considered an inductive ellement as well. Just about every ossilator contains an iductive or kenitic componte.
Formal root cause analysis requires very clear definitions and scope to avoid chaos.
Good start.
We will define an effect subject to attribution as a significant excursion from stable output in an otherwise stable system.
Implication that this is only appropriate for stable systems? cf ‘stable’.
One reason this is important is that a significant excursion from stable behavior in an otherwise stable system can be assumed to have a single root cause.
Assumed? That reminds me of the joke about engineers.
Full justification of this is beyond the scope of this essay,
That would have been interesting.
I will define a “stable” system as one in which significant excursions are so rare in time that they can safely be assumed to have a single root cause.
Assume the definition, might as well assume the solution.
If we don’t assume that the climate is broken, perhaps process control theory would be better suited. This method is too simplistic for a complex and not totally understood system. What would this method be like if it did not assume a single root cause? There are many examples of events in complex systems which had multiple root causes.
Diag, the joke is usually (and of course, totally inappropriately) about economists.
Diag– “This method is too simplistic for a complex and not fully understood system.” But that’s exactly the point being demonstrated by this remarkable post.
To try to reframe the question. Is the excursion the hiatus?
Good one!
All the rabbit holes in your chart have been thoroughly searched.
But you left off cosmic rays.
Matt,
I’m very sympathetic to Diag’s objection above to assuming that an infrequent excursion in an otherwise stable system must be due to a single cause. I find that quite an assumption. Since this assumption seems unnatural, it must have been debated within the discipline and there must be some support for it. Maybe you could share some insight into the argument.
But that support cannot be because it allows the analysis to produce an answer.
I would offer that in construction forensics, “why did the thing fall down?’ falling down being an infrequent excursion, at least in the failures with which I have more than passing familiarity, there is hardly ever a single cause but more a combination of contributing factors. Often the one likely to be identified as the root cause is more the exact mechanism of the failure which is seldom in itself interesting because any fool could see it. What is interesting is the combination of acts and non-acts, and loading conditions foreseen and unforeseen which led to it.
It’s true that I’ve strayed from natural “systems” here, but I’m wondering why assuming that there is a single cause would work in a natural system where it cannot always work in our human systems.
I don’t mean to be facetious, but I’m having real trouble with an infrequent excursion in stable system being more than casually due to single cause. I imagine that when the dust settles if you think it did, then you didn’t know enough about the thing. No disrespect of you at all intended in this.
And thanks Matt, for the post.
It’s true that I’ve strayed from natural “systems” here, but I’m wondering why assuming that there is a single cause would work in a natural system where it cannot always work in our human systems.
That is easy!
In human systems, there are often a series of events that compound on each other to cause a disaster because we are not paying attention and thinking about what we are doing.
Nature always pays attention. The first cause did cause the excursion.
I am really curious as to how my comment could possibly warrant moderation.
Likely a bad word hidden in the middle of an innocent one.
I did use “f*o*o*l” but not with reference to anyone here or in the industry. Maybe that’s it.
You might refer to a “backward loof” next time.
Now that I have seen your comment I can tell you. The word famili*ar has gotten me a couple of times.
Interesting analysis. A couple of points come to mind
1) Matt notes:
“… heat input and heat loss, are based upon a supposition that annual changes in forcing will manifest soon enough that that the change in temperature can be considered a direct response. This can involve a lag as long as the lag does not approach the duration of the excursion.”
Some of the “capacitance” terms may have time scales longer than the duration of the excursion, namely some of those involved in the transport of heat in the interior of the ocean.
2) “The sword swung in favor of invoking capacitance to explain the hiatus turns out to have two edges. If the system is capable of exhibiting sufficient capacitance to produce the recent hiatus, there is no valid argument against why it could not also have produced the entire modern warming, unless that can be disproven with empirical data or I/O test results.”
I think this is a challenge for current climate change science. There are candidate processes with sufficient “capacitance” to produce the “hiatus” (see for example Matt England’s work; Meehl et al. 2011 Nature Climate changepaper). I don’t know if we are in a position to carry out rigorous I/O analysis on them, because of lack of data, lack of understanding of forcing or internal variability on these time scales, or both.
Models give us some insight, and provide plausible, if not definitive answers.
based upon a supposition that annual changes in forcing will manifest soon enough that that the change in temperature can be considered a direct response.
The response of temperature to summer and winter and to day and night and to cloudy and sunny does indicate that changes in temperature are an almost direct response.
Models show the temperature response may be decades or centuries later. Throw those models away. Their output cannot be expected to be correct someday, especially when that someday gets pushed more and more into the uncertain future. Five years, seven years, twelve years, 15, 17, now 18, next, maybe 30 or 50.
I have issues with the second tier where albedo decrease is lumped in with CO2 effects. I would label CO2 effects as an insulation increase that also reduces heat loss. It has nothing to do with reflection, but does impact the heat budget. There are some fundamental reasons that the surface is the temperature it is, and they include GHGs. A proper understanding starts with knowing why the atmosphere is the temperature it is. You can’t even get the atmospheric budget remotely correct without including GHGs, and in the correct amount. This is radiative transfer and convection. The heat budget of the mean atmosphere is known well with the Kiehl-Trenberth and other such diagrams. These don’t work without the right amount of GHGs to support the surface temperature being 33 C warmer than the radiative temperature. An analysis should start with the budget as it is known and explained by radiative transfer, and perturb the gases to see what they do. This is essentially what Arrhenius did a century ago. It turns out perturbations cause enough warming to add more H2O as a feedback. This is as obvious as warm tropical oceans observably having more moisture above them than cooler oceans, and the earth is dominated by how water surfaces equilibriate with the temperature. Given that we are adding insulation, and even skeptics agree that this is a forcing change of nearly 4 W/m2 per doubling of CO2, it would be odd to say that the warming is not a response to the forcing, but some coincidental burst of warm water from the depths that the article is implying. Measurements show that the ocean is not doing that (the depths are cooler and always have been), and the land has been warming faster anyway since 1980 which is a fingerprint of an external forcing increase. The article puts weight on fingerprints for attribution, and this is one that distinguishes external forcing from something internal like an ocean burp.
http://www.woodfortrees.org/plot/crutem4vgl/from:1900/mean:240/mean:120/plot/hadsst3gl/from:1900/mean:240/mean:120
Also undue attention to the hiatus. The hiatus is an illusion you get by ignoring that 1998 was well above the previous trend line. In 2014 we have returned to the trend line, and an El Nino will push us as much above it as previous El Ninos have.
http://www.woodfortrees.org/plot/hadcrut4gl/from:1970/mean:12/plot/hadcrut4gl/from:1970/mean:12/trend/plot/hadcrut4gl/from:2014/mean:3
DC, emitted IR from the atmosphere to the surface is a reality, much to your disappointment.
Anyone who has ever used a Pyrgeometer knows this. Here’s a great source for quality instruments:
http://www.eppleylab.com/instrumentation/precision_infrared_radiometer.htm
JimD, like many representatives of the consensus, you’re switching arguments from A to B. I don’t recall anyone ‘denying’ emitted IR. What we’re actually discussing is the impact.
Temperatures rose during a period where we emitted massive quantities of greenhouse gases. As we are set to increase those massive emissions, it is logical to investigate this correlation.
It is also logical to investigate potential impacts of the greenhouse gases prove to be a potent (rather than minor) contributor to the temperature rise.
It is not logical (nor is it fair argument) to say those investigations are anywhere near complete. They clearly are not.
Is it just me or does climate debate involve a lot of roots? A couple of years ago all we were talking about was unit roots. Now it’s root cause analysis. The Consensus debaters are like root canals. And all I can do is drink root beer and watch the show…
“An analysis should start with the budget as it is known and explained by radiative transfer, and perturb the gases to see what they do.”
I am going to try to compare this to an accounting situation. Here’s our best guess as to what the income statement for this period is. A net income is warming, a net loss is cooling. While the quantity of CO2 is known its effect is somewhat uncertain, but we can convert the quantity into an income statement value of so many watts of heat retention. We will tune the heat value of total CO2 whereby more of it reduces an expense, reduces any loss and leads to more net income. When we find the right heat value of CO2, we then get the right income statement. The right income statement ties the prior temperature to the current one. We would strengthen our analysis by nailing down every other thing that is happening. If we could account for all these other things with a high accuracy, we would assume CO2 does the rest. We would call this CO2 value a plug. http://en.wikipedia.org/wiki/Plug_%28accounting%29
Plugs can be thought of a last resort when records are lost, or a way to not waste time on immaterial amounts which is not the case with CO2. A plug value for a banner effect like CO2 would be questionable. A justification for it would be that we looked at everything and we couldn’t find the reason for the discrepancy. We will plug the value that balances the books. Losing 5% of total expenses puts us outside of the 95 certainty range, and I don’t think you get clean opinion for the income statement with that. CO2 is accepted to account for more than 5% of the change. I think I’ve heard arguments that the CO2 value has been plugged. It’s what makes things balance, which to some extent I admit it does. But when you’re plugging, you are only as accurate as everything else you know about the income statement. Now we can assume an effect of CO2 which is high, say 100% of the temperature change and we can say that is what we are certain of. With the remaining items on the income statement become subject to being plugged as we have to balance the books. So in this second case we are sure about something and anything missing is plugged. Taking the two cases together, first we plug for the value of CO2. Then we use that value to plug for what we can’t explain about the rest of the effects. What is looks like is you find an unknown using information set A. Once doing that, information set A in future income statements has to be modified by what was just a minute ago an unknown. So, plugs are a last resort, a Hail Mary of accounting. If they are used when you have a 99.9 accuracy for every other piece of the puzzle, you could derive a value for the effect of CO2 for a specific past time period.
On one side of the ledger you have that the surface has warmed and the ocean volume has a warming rate, while on the other side you have that the forcing has increased. These balance to within observational error, yet some still want to find a different reason for the two warmings going together that is unrelated to the fact that the forcing has increased, even though they have generally agreed that the three components exist: surface warming, ocean heat content increase and forcing increase. It’s an odd disconnect.
John Coleman, who co-founded the Weather Channel, is to be congratulated for exposing the AGW lie yesterday and getting favourable media coverage. There’s more on WUWT here, and I believe this will be the real start of the demise of the most atrocious travesty of physics in the history of the world.
With no greenhouse gases, the earth’s 255 K radiative level would be at the surface, and it would be cold. Deny that.
to give up greenhouse gases, we would need to give up water and the greenhouse gas loss would be the least of our troubles.
It’s a bit rough when my responses get deleted here, as I apparently have no right of reply. I hope you did read it first, or in email perhaps. If not, the same topic was discussed by Jeff Conlon and myself on the Air Vent this week, so read my explanation there if you are genuinely asking a question to which you don’t know the answer, which you don’t.
Uranus has a surface temperature of -197 C; that is a bit warmer than Earth’s surface temperature. As for atmospheric temperature profiles, let’s compare
http://en.wikipedia.org/wiki/Atmosphere_of_Uranus#mediaviewer/File:Tropospheric_profile_Uranus_new.svg
http://www.geog.ucsb.edu/~joel/g110_w08/lecture_notes/atmosphere/agburt01_09.jpg
Please note that the Uranus graph is in Kelvin and Earth’s is in Celsius. What is the pressure at the base of the troposphere? Maybe you have heard of PV=nRT? If you compress a mole of standard atmosphere to, say, 100 times the pressure, what would the temperature be?
It does not appear you have even a freshmen level understanding of physics, your name notwithstanding; else, why would you think gas under 100 times the pressure should be somehow be relevant for a direct comparison across temperature?
While you are at it, maybe you can explain how convection transports heat to space, or why you think there was no convection before CO2 increased. Or, why do you think relative humidity should change when 70% of the air at the surface is exposed to water, and more when you consider the water content of soil? If you don’t think it will change, then why are you talking about it?
~Harrison H. Schmitt and William Happer, In Defense of Carbon Dioxide, WSJ, May 8, 2013
Dubiously denialist error by Schmitt/Happer/Waggy, correction by FOMD!
Question Why would *ANY* Climate Etc reader — or any climate-science student read — read the Wall Street Journal’s cherry-picked delusions … when the engineers at the IEEE Spectrum offer real intellectual meat?
The world wonders! Climate-science students especially wonder!
~Schmitt & Happer (Ibid.)
Yeah Wagathon!
And there’s too much oxygen in the air nowadays …
Relative to the original design, that is!
http://www.qwantz.com/comics/comic2-2725.png
And yeah, *WAY* too much of Florida is above water …
http://teachingboxes.org/seaLevel/lessons/lesson4_reefs/florida_shore_5m.jpg
Relative to the original design, that is!
You might as well post a pic reflecting 5 kilometer sea level rise
– each is about as likely.
Actuall, 5m within the next few centuries is. It just possible, but even likely according to some models. The ice sheets are only now beginning their response to CO2 near 400ppm. This party is just getting started.
R, Gates and FOMD
of all the outlandish fear mongering regurgitated endlessly by CAGW proselytizers, sea level rise is the dumbest of all
hope you are both around to see if 300 year projections pan out
note to Judith
these last two post were outstanding
Please supply a date.
25,000 years in the future
Scott
Sorry, wrong spot, Florida coast line flooding date.
Scott
It is much better to think in terms of change in the total non-equilibrium system. This is given in a conceptually precise form by the 1st differential global storage equation.
d(W&H) = energy in (J/s) – energy out (J/s)
The big changes in the right hand side of this equation are in energy out. It includes step changes at climate shifts that show that cloud changes are involved in the dynamical mechanism at the heart of climate. This shows albedo in the 1998/2001 climate shift.
https://watertechbyrie.files.wordpress.com/2014/06/earthshine.jpg
‘Earthshine changes in albedo shown in blue, ISCCP-FD shown in black and CERES in red. A climatologically significant change before CERES followed by a long period of insignificant change.’
The dynamical mechanism – control variables that push the system past a threshold triggering a cascade of changes – is the key to understanding the changing trajectory of 20th century, the current hiatus, abrupt variability over the Holocene and longer and the uncertainties in anticipating 21st century climate evolution and longer. The dynamical mechanism is an inevitable conclusion drawn for the history of climate.
http://www.gisp2.sr.unh.edu/GISP2/DATA/fancy.html
W&H is work and heat – it includes energy changes in the atmosphere, hydrosphere and cyrosphere. The most significant factor is ocean heat content. The following is from Eric Leuliette (2013) – The Budget of Recent Global Sea Level Rise – 2005–2012. The important graph here is the middle one showing steric sea level rise – that is from changes in temperature. The bottom graph uses Jason altimetry to assess questionable mass changes – questionable because inconsistent with Argo salinity. The Argo temperature based on the Scripps Institute ‘climatology’ shows a steric sea level ‘rise’ of 0.2+/-0.8mm/yr.
https://watertechbyrie.files.wordpress.com/2014/06/steric-sea.png
It suggests that d(W&H)/dt – using the Scripps Argo ‘climatology’ – is zero give or take a relatively large error. Energy in equals energy out and the globe as a whole has not warmed in the 21st century.
Changes in energy in and energy out are measured at top of atmosphere. The absolute calibration uncertainty for net energy imbalance is +/- 5W/m2 – much larger than the nominal imbalance being looked for. The relative stability of anomalies is 0.3W/m2/decade for infrared and 0.25W/m2/decade for shortwave. So is potentially useful data. Note that there are annual changes in energy out due to albedo differences between the northern and southern hemispheres. There are large changes with the El Nino-Southern Oscillation and volcanoes as well step changes and decadal variability to do with changes in cloud associated with changes in ocean and atmospheric circulation.
Energy in is the solar component.
http://lasp.colorado.edu/data/sorce/total_solar_irradiance_plots/images/tim_level3_tsi_24hour_640x480.png
The Sun cooled to around 2008 and is currently about at the peak of the cycle. The planet has warmed by some 0.25W/m2 in the last few years.
Energy out is the reflected shortwave and emitted infrared. The SW and IR graphs shows upward positive. The net shows warming positive by convention. Net = -IR – SW
https://watertechbyrie.files.wordpress.com/2014/06/ceres-all.png
The net shows little movement over the period of CERES – showing that the change in TOA flux is at least consistent with the lack of warming.
http://www.drroyspencer.com/wp-content/uploads/UAH_LT_1979_thru_September_2014_v5.png
Multi-decadal regime shift – chaotic – unpredictable – involving abrupt shifts in ocean and atmospheric circulation – show the dynamical mechanism at the core of climate on a global scale.
https://watertechbyrie.files.wordpress.com/2014/06/ipo.png
http://www.esrl.noaa.gov/psd/enso/mei/ts.gif
https://watertechbyrie.files.wordpress.com/2014/06/smeed-fig-7.png
It all suggests cooling for decades at least.
I see the news showing the people running from the sea level rise in Florida, everyday. Even here, I live at about 25 feet above sea level in south-east Houston.
Oops, i must have seen that on an Alarmist Blog. It is not even in the most Alarmists news. We are not leaving yet. People are still staying on the island in Galveston, 30 miles from here.
We have one of those disaster towns near me on the midcoast of NSW, a little settlement to which I may retire one day. Everything bad is predicted for low-lying Lake Cathie, nothing ever happens. It’s pretty low, though, so worth watching out for. Not being much of a libertarian or anti-regulation guy, I’m happy to see prudent restrictions on development near dunes, vehicles on beaches, ferals, high noise, big boat wakes and other artificial turbulence in estuaries – the usual conservation stuff. By all means develop, build and have your fun, but don’t trash.
Especially around a pretty stable Australian coast, uninfluenced by post-glacial rebound etc, sea level rise remains what it always has been, a sluggish dribble starting – in this phase – in the 1700s and likely going quickest before the 1860s. None of this was obscure or even controversial till recently, any more than the fact that a very brief ten thousand years ago you could have walked across Bass Strait.
It’s mystifying that the sea level beat-up gets any airing at all. But these are strange times, when a hurricane in a hurricane belt and a drought in a drought belt are supposed to be evidence of human greed and excess. The budding Enlightenment spoke out and said that the Lisbon earthquake was not due to sin. When the young and supremely dynamic US had its Great Dayton Flood in 1913 (now THAT was a flood!) some may have seen it as God’s punishment, but most saw it as a reason to engineer better. So what’s happened to our heads lately?
Here’s your Roland Emmerich disaster-movie scenario by the way, as observed from geologically stable Sydney harbour:
http://tidesandcurrents.noaa.gov/sltrends/sltrends_global_station.shtml?stnid=680-140
Don’t all go ho-hum at once.
moso, buy that low-lying land before people realise it won’t be six metres under and start pushing up prices.
Beach erosion is a real problem, and some of it is due to poor development and lazy conservation over decades. When a local council is broke – pretty common around here – it’s easier to bang on about climate change than implement the expensive fixes. I guess if I was in charge of a local budget I’d have to do the same thing. When there’s no dough left even to slash the verges on busy secondary roads, no mayor wants to hear about expensive engineering projects the State and Fed governments won’t fund (excusing themselves because it’s the CO2, doncha know).
Conservation costs money, and all the billions these days go to “being green”. Whatever that is.
mosomoso,
Of course people forget that even in living memory, some roads that ran along the land abutting a beach, are now inland. In some cases up to a few kilometers. Parts of the Queensland coast demonstrate this quite vividly.
Accretion, erosion, uplift, subsidence – all part of Nature’s effort to keep us in a state of total confusion.
But back to the topic at hand, what do you suppose would be the root cause of no warming at all for either 20 years (or four and a half billion years, if I want to avoid being accused of cherry-picking)? There seems to be an assumption that there has been warming unrelated to the fact that 7 billion people warm the air far more than 1 billion. And yes, I realise that Sun pours a great deal of energy into the system, but self appointed climate scientists do carry on about anomalies, the extra bits that occur even at night, where the Sun don’t shine.
Root cause? The fools or frauds who misuse, abuse, and confuse admittedly sparse and imprecise air temperature observations to bolster a nonsensical speculation unverifiable by experiment. But what would I know? I don’t even have a share in a Nobel Peace Prize, let alone one for some branch of science!
Live well and prosper,
Mike Flynn.
Apparently the coasts were perfectly stable till our fossil fuels caused them to crumble. They were as regular and solid as a hockey stick. (Apart from maybe 50 metres of sea level rise a few thousand years back during the early Holocene, but that was all natural or internal or whatever you call stuff that just happens.)
Some folks take “paines” for the future
http://www.worldwidehippies.com/wp-content/uploads/2012/11/thomas_paine-common_sense.jpeg
with friendly hopes for a favorable multi-century outcome
http://www.historicalsocietyofsomersethills.org/Images/betsyross.jpg
The sages teach:
Of course, plenty of Carbon Cabal folks think on much shorter time-scales …
How is it that denialists praise the Carbon Cabal so vociferously?
http://radio.foxnews.com/wp-content/uploads/2014/03/natgasputin.jpg
Hasn’t the global carbon energy economy been a complete and total train-wreck for every truly conservative virtue and objective?
The world wonders, eh Climate Etc readers?
Oops! Posted this on the wrong thread. Belongs here:
@ FOMD
“How is it that denialists praise the Carbon Cabal so vociferously?”
Speaking individually and not collectively,the reason that this ‘denialist’ praises the Carbon Cabal EXTREMELY vociferously is because it is the single most important factor in making my life livable.
Thank you Carbon Cabal!
PS: I forgive you for providing the same service to FOMD.
Mosomoso,
That chart definitely needs “adjustments”. :)
Plants like CO2 and happy plants make oxygen, right?
AFOMD,
Are you really suggesting that all oxygen breathing life forms be exterminated, so that the anaerobic organisms can return to their previous place? You play in your sandpit, I’ll keep company with adults, if you have no objection.
If intelligent design is your thing, we are where we should be – surely. Or do you think the Designer is not as intelligent as you thought, and all is not going to plan?
Sit back, relax, have a refreshing cup of camomile tea. I believe it’s recommended for anxiety, depression and Warmist obsession. It can’t do any harm to try it.
Live well and prosper,
Mike Flynn.
a fan of *MORE* discourse: [there] exists abundant strong evidence that more carbon dioxide has caused more extreme weather”
Hansen et al provide abundant evidence that in the appx 2 decades before the recent pause the distribution of the temperatures shifted upwards as the global mean shifted upward. What Hansen et al do no provide is an evaluation of some of the causes (much less any “brainstorming” of causes) or evaluation of the full evidence with respect to any of them. Hansen et al provide no evidence that the changes were due to CO2. Hansen, as I wrote, jumped on the first warming following the then most recent cooling as fulfilling at last the prophecy of the 19th century. He did so without any realistic quantitative evaluation of the naturally occurring climate change.
[there] exists abundant strong evidence that more carbon dioxide has caused more extreme weather
More green things growing better does what? Please send links to the abundant strong evidence. if it is really abundant, you should be able to do this. Please send only links that reasonable people could believe.
+++++++++++++++++++++++
AFOMD,
You apparently keep forgetting that climate is merely the average of weather events which have already occurred, and this requires no more than the mathematics possessed by an average 12 year old student from any advanced society.
If you are overawed by the mental ability of twelve year old children, you are probably a Warmist, and would believe anything if someone used a computer to generate a pretty picture. It’s actually known as CGI, (Computer Generated Imagery), and does not necessarily represent reality.
Keep chanting he sacred Manntras and waving that hockey stick. I’m not sure whether dancing naked around the Tree of Yamal might help, but you never know, do you?
Live well and prosper,
Mike Flynn.
That graphic shows that since my childhood the average summer temperature over Europe, and my native England has risen 3 degrees.
This is why anomalies are used, as if they stated real temperatures we would be able to quickly nail down such outright lies.
While you are at it, maybe you can explain how convection transports heat to space, or why you think there was no convection before CO2 increased.
Not sure to whom this is addressed, but and interesting point.
Convection doesn’t transfer heat to space, of course, but it does enhance raidation to space by moving heat from lower levels where radiative emission to space is less effective to upper levels where it is more effective.
And of course, convection did occur before CO2 increased, but one could also ask why convective transfer, and more importantly convective enhancement of radiance to space should remain constant with increasing CO2, heat, and aboslute humidity.
Lucifer, that is true in the troposphere, where it matters most. And, it does not remain constant, althoughndoes act probably as a thermoregulator. One of the key insights in Lindzens 2001 adaptive iris hypothesis, the others being the latent heat left at altitude upon water vapor condensation thanks to convection and the temperature lapse rate, and the lowering of humidity (so water vapor feedback) from the resulting precipitation. Think tropical Tstorms.
I think MS post was painting in appropriately broad strokes. From his membrane around a volume/mass below TOA, quite appropriate to observe that neither convection nor conduction can ultimately cool planet Earth surrounded by space. Only outbound LWR (IR) does that. So those two other branches of the possible explanations tree can be pruned off at the outset.
Rather than a climate pollutant, CO2 is a root cause of all life on Earth as we know it.
Chris G, don’t pedal lies here; we have it on good authority, John Sidles, that the atmosphere is isothermal and is in thermal equilibrium with the surface and space.
even skeptics agree that this is a forcing change of nearly 4 W/m2 per doubling of CO2, it would be odd to say that the warming is not a response to the forcing
Many of us skeptics do not agree! This warming, due to CO2 doubling is supposed to cause warming in the troposphere and measurements do not find the warming. A lot of skeptics see that model output does not agree with real data and the lack of warming is normal and the model output is very flawed.
Jim D wrote;
“The heat budget of the mean atmosphere is known well with the Kiehl-Trenberth and other such diagrams.”
Sorry to inform you but the K-T “heat budget” would not pass any rigorous engineering analysis. It is so simplistic as to be useless, closer to a cartoon than reality. There is far more information that needs to be considered (such as the velocity at which thermal energy (and light) travels through the system, and the thermal capacities of the system components) before a proper “heat budget” can be prepared.
Jim also wrote;
“This is essentially what Arrhenius did a century ago.”
Yes, and Arrhenius also told us it would be several degrees warmer NOW than is observed (something about growing bananas in New Orleans rings a bell). So, if he was wrong one hundred years ago why do you insist that the climate science community is able to predict the temperature in the next hundred years ? And exactly how many centuries does the climate science community require before you can predict the temperature in a hundred years ? You have had 1 century and now demand a second century, I think the results are in and nobody (no matter how many peer reviewed papers they have published) can tell us the temperature in a decade, let alone a century,
Arrhenius had a hypothesis, it does not match reality, it is disproved. Move on to other possible hypotheses.
Matt Skaggs, thank you for a very well composed explanation of a very useful engineering tool (Root Cause Analysis). In very high reliability systems similar tools are used to predict “mean time to failure” (MTTF), it’s similar to root cause but done before a system is constructed. It allows sufficient redundancy to be included in the design to lengthen the MTTF.
For example, in satellites there are cables that connect different electronic boxes. Cables on a satellite are subject to being “sliced” by a micrometeorite occasionally (once every five years, as a “ballpark” figure). The MTTF calculation tells you how many parallel cables (the second redundant cable takes over the function of the “sliced” cable) to include for the desired MTTF requirement.
These are the well defined and structured tools used in engineering to prevent accidents in the first place and to learn (after the fact) what caused those accidents which do occasionally occur.
The climate science community has been predicting an “accident” (World Wide Thermal Armageddon) for so long now that few serious engineers believe them anymore. And the “Man/Woman on the street” has wised up as well.
Thanks again Matt, Kevin.
What’s this with an engineering analysis? If we didn’t understand why the atmosphere is its current temperature, we would be in the 19th century with the science, and I think you prove that many blogospheric skeptics are. The components of the K-T diagram are not in as much doubt as you seem to think. The fact that the surface is 288 K and the earth radiates at 255 K is also known and represented by that diagram. You will find that even the skeptical climate scientists don’t have big issues with the surface and TOA energy flows. Not knowing these things would be like some random person not knowing how a bridge supports itself before criticizing the engineers. Thankfully we do know how the surface temperature is supported by the presence of GHGs, and therefore what small changes to the atmospheric composition would do.
“If we didn’t understand why the atmosphere is its current temperature”
Jim, with respect, the climate science community DOES NOT KNOW why the atmosphere is at it’s current temperature. They have a hypothesis (among other hypotheses), but the climate science community hypothesis (the “GHE”) does not match the observations. NO CORRELATION between increasing GHG’s and temperature. NO CORRELATION = NO CAUSATION, hypothesis dis-proven.
The K-T analysis is worthless, sorry, I know a whole bunch of folks believe it, but it’s still worthless. It’s like a person who knows nothing about AC electricity trying to explain a modern electrical system with only a DC voltage meter.
And as a USA taxpayer I am totally entitled to criticize the builder of any bridge (or climate model) that I paid for. The bridges (most of them) stay up as the hypothesis of the designing engineer stated. The climate models have collapsed.
Cheers, Kevin.
KevinK, you make an assertion that the science does not understand why the earth’s average surface temperature is as it is, which is 288 K. Judith might be able to tell you, or can at least point you to the right textbook, but I think that you are one of those who won’t listen to anyone calling themselves a scientist, let alone touch a science textbook.
“Arrhenius had a hypothesis, it does not match reality, it is disproved. ”
Oh? Is the earth not warmer than it was 100 years ago? Do you have a physics model which better matches observations that does not involve warming caused by CO2?
Maybe you can point to the research article which disproves Arrhenius.
http://scholar.google.com/scholar?cites=3100721683053900352&as_sdt=2005&sciodt=0,5&hl=en
Popesclimatetheory,
You have it backwards as usual, temperature is going up but CO2 is still being sequestered in the oceans.
Never say never in science, there are still times when CO2 lead temperature increases, you need to do more homework.
Ontong Java
Kevin,
It is really hard to measure 2 variables, in this instance being Co2 levels in the atmosphere and some metric of global temperature and get Zero correlation.
Give it your best shot, plot a couple graphs, see if you can get anywhere close to zero.
Bob, any measurement by it’s very nature includes NOISE. I can measure the length of the average “Q-tip” I purchase at my local supermarket and also measure the “standing water” in my driveway after a rain storm, I assure you I can (after many statistical gyrations) find a correlation, no doubt about that. But then, as an engineer I have to step back a bit and ask myself; “What the heck does the standing water in my driveway have to do with the length of the “Q-tips” i just bought ????
Sadly, the climate science community has been on a multi-decadal quest for proof of the “GHE” hypothesis, last I checked they are pointing towards the “deep oceans” as the location of their prey. Yet they cannot quite figure out how to get down there to check for it, No matter, they can just assure us that; “the missing heat is there, trust us”, sure, if you say so…….
No you are wrong, some measurements do not include noise. As an engineer have you ever used a go-nogo gage?
But we are not talking about q-tips and the water in your driveway, we are talking about your assertion that there is no correlation between CO2 levels and global temperature.
Put your money where your mouth is, prove there is no correlation between global temperature and CO2 levels. Give me an r value
You claim to be an engineer, hopefully you can use excel or some other program to measure the correlation between the two variables and show that there is no correlation.
Should be simple enough for an engineer.
It’s a pretty good idea to do, because the result of the exercise gives an estimate of the climate sensitivity.
Cheers
Of course there is some correlation between temperature and CO2
http://popesclimatetheory.com/page44.html
The oceans are huge carbonated drinks. The vapor pressure of CO2 goes up when temperature goes up and down when temperature goes down.
CO2 follows temperature when it can. Temperature never follows CO2. Temperature and CO2 have been disconnected for thousands of years.
http://popesclimatetheory.com/page38.html
Attribution is not like root cause analysis. Root cause analysis would be a subset of attribution study. That is all root cause studies are attribution studies, but not all attribution studies are root cause studies
Root cause as you note is predicated on a known system, a designed system, operating outside it’s design space, whether that be a failure or just an anomalous behavior.
Root cause reasoning is grounded in the process of abduction. But abduction
depends upon a notion of “normal” or what you call stable.
There is another broader form of reasoning: induction. Let me put it this way.
You’ve been seduced by the argument of “unprecedented”. However, I would say the notion of “normal” in climate science has been abused, and the arguments about unprecedented are really misplaced. We dont care if the warming since 1980 is unprecedented. We dont care if its abnormal. We just want to explain it. the notion of the system being out of some range of its design space doesnt even matter. What we want to know is how much warming can be ASSIGNED to natural variability and how much can be assigned to external forcing and then we want to know how much of the external forcing is natural and how much is human caused.
In this conception there is no need to prove that the system is outside some arbitrary notion of “normal”. There is just a need to apportion the effect to several causes, not one root cause. Root cause doesnt even come up.
Now what does that look like in engineering?
Let’s take an example from my experience. Attributing the SUCCESS of a system to various causes.
We go to nellis air force base and we conduct a series of tests. We fly plane
A against plane B on the range. We do this 100 times. 30 times plane A
kills plane B. 10 times plane B kills plane A and 60 times they draw.
There is no normal for this system. There is just the behavior and we want to understand it. Why does plane A do better? What can we attribute it to?
So, we go through the data and we propose that 30% of the increased effectiveness is due to Plane A’s superior RCS, and 40% is due to its improved IR signature and 30% is due to its improved weapons. We are doing attribution but far outside the narrow walls of failure analysis.
There is no notion of “failure” in this approach. No need to show that something is “unprecedented” no need to attribute things to one cause.
We just want to understand why the system operates as it does. Why does the plane fly the way it flies rather than why did it crash.
Now IF all science were abduction, and if you were working with a system that had a well defined performance space, then the root cause approach might have some merit.
Finally, it goes without saying that some folks have tried to make the case for global warming on the basis of “unprecedented” features of todays climate. They were misguided, so don’t make me defend their wrong headed approach.
The question is: how much warming since 1850 can be allocated to external forcing and how much can be allocated to internal variability. Root cause gets you nowhere on this question. Primarily because root cause depends upon out of band behavior. The next question is this: Of the allotment that external forcing is assigned, how much is natural and how much is human.
Again, there isnt any question about whether or not the system is out of specs here.
So, what the “proposal” says is that without its superior RCS, Plane A would out-perform Plane B 30% less of the time, without its improved IR signature Plane A would out-perform Plane B 40% less of the time, and without its improved weapons Plane A would out-perform Plane B 30% less of the time? With appropriate combinations, ending in even performance without all three?
That’s a testable hypothesis. But AFAIK there’s a lot of synergy in such “superiority”. It could be that without any one of those “superiorities” Plane A would barely out-perform Plane B at all. Or there could be redundancy: without any one of those “superiorities” Plane A would only take a 3-4% loss, and it would require lacking two of them to get to the 30-40% range. And so on.
Whatever, the hypothesis can be tested in “real” flight (simulated combat), or even with “models” that have been verified repeatedly against “real” flight. (Or, during Viet Nam, perhaps even real combat.)
The equivalent doesn’t exist for climate. The models may be complex non-linear systems, but they aren’t nearly as complex as the actual climate, and they can’t be repeatedly tested against the real climate, because there’s only one run of the climate.
But the potential for synergy remains.
And this is where we end up digging into the roots of cause and effect. To identify a cause, as I suggested above, we need to compare behavior with the proposed (partial) “cause” against behavior without the proposed “cause” but with everything else equal.
The models cannot be relied on to replicate the behavior of the real climate, Specifically, the climate is an enormously complex non-linear system, with a vast number of synergies, redundancies, and feedback loops internal to its operation. The models, acting on a scale with 8-10 orders of magnitude less resolution, can’t possibly replicate more than a tiny fraction of these relationships.
And there’s no reason to assume that the fraction they can replicate is representative.
AK
“Whatever, the hypothesis can be tested in “real” flight (simulated combat), or even with “models” that have been verified repeatedly against “real” flight. (Or, during Viet Nam, perhaps even real combat.)”
actually you cannot test it in any controlled fashion, the actually requirements in terms of design space are too large. the models arent verified and there isnt enough good data from real engagements.
The point is its an illusion to think that root cause analysis is the proper approach for this KIND of problem.
The mistake Matt makes is mis specifying the problem.
Perhaps. Or perhaps he’s taking the mis-specification based on supposed “‘unprecedented’ features of todays climate” made by “some folks [who] have tried to make the case for global warming” that you mentioned above, and turning it into a reductio ad absurdam:
+ 1 Mosher
Stephen Mosher,
I think Matt Skaggs’ post is excellent and refreshing to have another approach. I think your comment here is excellent too. Very interesting, and persuasive. I am persuaded. Thank you.
This was the key sentence that persuaded me:
The whole comment is excellent (as is Matt Skaggs’ post.
Mosher,
you are of course right to point out that the climate system does not satisfy the usual assumptions of root cause analysis, i.e. a system in an assumed stable state and a single cause of it going out of spec. But it seems to me the crux of Skaggs’ analysis is the fault tree. This is a kind of logic tree and can be used for a wider range of problems than root cause analysis. I once wrote some software for fault tree analysis. In general the leaf nodes can be assigned probabilities and these can be propagated up the tree. A situation in which there are multiple contributing causes is not excluded, and there is no logical reason it should not be applied to the late 20th century warming.
The vital point is to list all the ways the effect under consideration could have happened, and not to exclude anything (except ‘comet strikes’). And doing this has led Skaggs to the main flaw in the IPCC attribution case:
“invoking capacitance to explain a data wiggle down on the fifth tier of a fault tree, when the general topic of capacitance remains unresolved in the first tier, suggests that climate scientists have simply lost the thread of what they were trying to prove. The sword swung in favor of invoking capacitance to explain the hiatus turns out to have two edges. If the system is capable of exhibiting sufficient capacitance to produce the recent hiatus, there is no valid argument against why it could not also have produced the entire modern warming, unless that can be disproven with empirical data or I/O test results.”
Of course this is not a new point. It is what Dr Curry has been saying for a while, and is closely related to the 50/50 argument. What this says to me is that any competent analyst, who uses a valid method of reasoning, will come to the same conclusion: The IPPC attribution argument is unsupportable.
Steven Mosher: Root cause as you note is predicated on a known system, a designed system, operating outside it’s design space, whether that be a failure or just an anomalous behavior.
If the behavior since 1850 is not unusual, then there is no problem at all. The author did allow the reader to choose other dates. His essay is addressed to the people who think that the behavior since [starting date] is unusual. As you and the author noted, it is difficult to establish that an event or excursion is unusual unless the system is known. Derivations all make assumptions about the system, which is “known” if the assumptions are demonstrably accurate. Whether those assumptions arise from abduction or induction is irrelevant to the task of evaluating their accuracy and deriving their consequences.
One of the facts about CAGW is that the alarmists made implicit assumptions about the system without investigating the system very thoroughly. Now they are in the position of trying to force the science of the system into limited propositions that yield their worries as derived results. Consider, for example, the writers (I have cited some) who never stretch outside the strait jacket of the equilibrium calculations. Or those who asserted with no evidence that warming would necessarily be bad, or that warming would necessarily produce less rainfall.
Steven, natural variability is just our way of saying we do not know why it got colder or warmer or paused.or in other words it is a measurement of uncertainty.
How can we measure uncertainty in the case of postulated climate change?
Easy as you know , you just measure what you predict/expect and the difference with reality, known as unaltered observation is the natural variability or uncertainty.
You mention internal variability casually but this is different to natural variability and might have the effect of confusing people.
Internal variability is a measurable function, surely, like Gate’s volcanoes, when they occur.
Natural variability is when the plot is not explained by the known internal variability either.
Your question,hence is wrongly framed, but answerable in this way.
The warming since 1850 has always been due to known external forcing (the sun) modified by known internal forcing (some big volcanoes, a Siberian meteorite and a minor CO2 rise) and to unknown internal forcing (mainly cloud formation and albedo changes, perhaps some particulates in the air) otherwise known as natural variation.
To pretend or believe that one feature, rising CO2, must produce a temperature rise without taking into account all the possible negative cloud feedbacks this could entail in a chaotic system can only make sense when uncertainty is extremely low.
Ie when you have enough knowledge of the other feedbacks and parameters.
30 years with no smoking gun for the Lindzen’s, Pielke’s, Spencer’s and Curries of this world to believe in, says that there are no convincing arguments yet ,arguments yes convincing no.
“”””For years, climate scientists have followed reasoning that goes from climate model simulations to expert opinion, declaring that to be sufficient. But that is not how attribution works.
The concept of attribution is important in descriptive science, and is a key part of engineering. Engineers typically use the term “root cause analysis” rather than attribution. There is nothing particularly clever about root cause methodology, and once someone is introduced to the basics, it all seems fairly obvious. It is really just a system for keeping track of what you know and what you still need to figure out.”””””
Absolutely remarkable how Matt Skaggs, fairly obvious and all, figured all of this out; but climate scientists essentially the world over, weren’t able to.
That is what vetted science journals, rigorous examination, re-examination and questioning, publication, and ongoing scrutiny, questioning, and adjustment are all about.
But since the above is intellectual skulldoggery that misses the main issue here, well, a vetted scientific journal won’t do; so there’s always the ever popular climate change “skepticism” Climate Etc. Site.
The rest of the piece above is even worse, going on for pages in manufactured ways to incorrectly define, to coin a phrase, what the “root” problem is. And in the process, with fancy language and concepts that have little to do with the issue, completely mischaracterize the issue, and ultimately engage in irrational analysis: To wit: The issue is about an observed change that we happen to observe, so we seek to figure out what might be causing it, look to the atmospheric change and see if maybe, ah ha, that might be it…
That is about as close to what this issue is, as baseball is play station. Bad analogy, but the point remains.
Nor can we be sure of what the exact differential between what is and what would have been, upon a dynamic global ongoing ecology for which there is no control variable. Nor does the extent of popularly measured changes – in so far as we could even do it – come anywhere close to reflecting actual net changes to the system that will reflect in future climatic changes, since most of it is not reflective in the current “climate” however that is defined, and however “different” it might be from what would have been in the absence of any changed atmospheric input to begin with.
The things that drive climate, which is far more important than air temperature, are changing. And this process is not linear, as the processes resultant from a net ongoing energy change due a massive increase in external input (a multi million year change – increase – in lower atmospheric thermal radiation absorption and re radiation, in the sense of our geologically recent evolved “temperate” earth climate and global energy balance is massive) is not linear.
This site will publish any pablum, so long as it sounds intelligent and helps promote “healthy” skepticism, even if that skepticism arises from a complete butchery of the entire issue, and very clearly, comes from a pre-determined view attempting to manufacture self believing support for that view.
Can anybody translate this? I don’t speak OG Kush.
Did anyone actually read the OP? Way too long and involved based on a minute skim. If you can’t cover the subject in a couple paragraphs a few figures a table or two and some bullets, then you obviously don’t understand the guts of it. This self-important diatribe reminds me of all the three-inch thick engineering reports (with foot thick appendicitis) gathering dust on shelves that explain everything about nothing. I’m surprised John Carter hasn’t chimed in with ten thousand words of his own to counter point the minutiae.
In any event, precise attribution is premature (climate science is an infant) and proving it is not that important because we will have to deal with rising sea level, extreme weather and various natural disasters no matter the causes. Also, we know that for the overblown simulated GHG effects, the proposed fixes for CO2 produce essentially zero results anyway. That said, the coincidence of temp rise and CO2 rise is enough attribution for now to pursue a no regrets policy in the near term.
I buried Paul. (you gotta remember strawberry fields)
Before reading any comments, I find this very interesting, a new approach to me, which suggests “back to the drawing-board” is required. I’ve copied it to my engineer daughter, whose thesis was on global warming using paleogeological data.
I thought that it was a good overview of a process of attribution analysis. The only “flaws” I found could be easily fixed by expanding some of the points, but it was long enough already. For example, if there was a definition of “SME”, I missed it (I took it to mean “subject matter expert”.) The idea of a bunch of climatologists getting together and brainstorming a lot of possible causal mechanisms and then addressing the evidence with respect to each of them I found quite droll. Climatologists who consider more than one cause of the warming since 1980 are deprecated.
In looking at the modern warming, we first ask whether there are similar multi-decadal excursions in the past millennium of unknown cause. We also need to consider the entire Holocene. While most of the available literature states that the modern excursion is indeed unprecedented, this part of the attribution analysis is not a democratic process. We find that there is at least one entirely plausible temperature reconstruction for the last millennium that shows comparable excursions. Holocene reconstructions suggest that the modern warming is not particularly significant. We find no consensus as to the cause of the Younger Dryas, the Minoan, Roman, and Medieval warmings, or the Little Ice Age, all of which may constitute excursions of at least similar magnitude. I am not comfortable with this because we need to understand the mechanisms that made the system stable in the first place before we can meaningfully attribute a single excursion.
That is a fairly “skeptical” (in this context) starting position.
I heartily endorse steps 3, 4, 5, 6, 7. They have, unfortunately, been identified as aspects of “spreading disinformation”. To write that there might be a persistent cause of the cyclicities of the last 11,500 years has been called “looking for unicorns” and such.
Another approach which focuses on systems that can be observed but not controlled or experimented upon is the “causal analysis” from AI, machine learning and statistics, well presented in the book “Causality” by Judea Pearl.
SME definition in third para.
Faustino: SME definition in third para.
thank you.
Matthew R Marler,
You said “I heartily endorse steps 3, 4, 5, 6, 7. “. Just out of interest what are your concerns about steps 1 and 2?
I wholeheartedly agree with the author that we don’t have sufficient grounds to proceed with the analysis past step 1.
Peter Lang: Just out of interest what are your concerns about steps 1 and 2?
We discuss 1 and 2 all the time, and I think that they are in practice indistinguishable. What caught my attention about the later points was the degree to which they have not been attempted — which is to say not at all, except by people derided as “faux skeptics” and worse.
I have addressed 1 and 2 with different sayings: If we knew the size of the background variation, we could estimate the size of the CO2 effect; if we knew the size of the CO2 effect, we could estimate the size of the background effect. The case that warming since 1896 (pick your starting point — that one came from Steven Mosher) is due to CO2 is full of “holes”, “liabilities”, “cavities”, “known unknowns”.
Mathew R Marler,
Thank you for the clear explanation. Now I understand why you didn’t include steps 1 and 2.
When I can once again sit under a beech tree in Antarctica, eating locally caught lobster, I will be able to give thought to the possibility of global warming.
Until then, I have to accept that it’s not nearly as warm as it used to be.
Bring back the Warm!
Live well and prosper,
Mike Flynn.
Matt Skaggs writes: “I have seen two spatial pattern claims about GHG warming, 1) the troposphere should warm more quickly, and 2) the poles should warm more quickly… I was unable to find a single instance where any of the feedbacks thought to enhance warming in specific locations were associated solely with CO2… I cannot make the dots connect.”
Matt, forgive me if I am misreading your post, but 10 seconds with Google: “GHG warming spatial patterns” and a click on the first IPCC reference: http://www.ipcc.ch/publications_and_data/ar4/wg1/en/ch9s9-2-2.html yields (paragraph 2):
“Greenhouse gas forcing is expected to produce warming in the troposphere, cooling in the stratosphere…”
Stratospheric cooling is a characteristic of GHG warming that is both observed and inconsistent with other possible warming sources. So either more than one source of warming is present (in contradiction to the premise of your article) or your reasoning forward of this point is based on an incorrect assumption.
BREAKING NEWS
“Moon makes tides” meme disproved
Matt Skaggs’ skeptical methods not followed!
Seriously, there are folks posting on HotWhopper whose sea-level skepticism is Skagg-like.
For appreciation of how Skaggsian skepticism can be just plain wrong, see this week’s IEEE Spectrum interview Machine-Learning Maestro Michael Jordan: the Delusions of Big Data and Other Huge Engineering Efforts
This is why articles advocating “stadium wave”-type hypothesis typically never mention “uncertainty” … it’s because the set of hypotheses investigated has near-infinite cardinality, such that individual pure-statistics models have near-zero predictive value. The long sad history of weather-prediction from sunspot cycles illustrates this inherent weakness of purely statistical science!
Conclusion The strongest climate-science is not now — and never will be — founded solely upon Skaggsian statistical analysis. Instead it’s founded on well-validated physical principles (Hansen-style notions of energy balance and CO2 heat-trapping), that are affirmed by observational science (Mann-style observations of lengthening “hockey stick blades”), whose consequences are appreciated ecologically, historically, economically, and morally (per Oreskes/Francis-style sustainability studies).
Nowadays these common-sense scientific realities are *OBVIOUS* to *EVERYONE*, eh Climate Etc readers?
“Conclusion The strongest climate-science is not now”
Had me going there for just a split second.
AFOMD,
I presume you have spent a few days studying up on the properties of chlorine and fluorine, and now accept they are different, in spite of sounding a bit the same. Good for you!
What differences do you detect between James “Death Trains” Hansen and Mike “I really deserve a Nobel Prize, even though I didn’t get one” Mann, and a person suffering from delusional psychosis?
I’ll give you a hint. The answer is – no difference at all!
You’ve previously proven your inability to relate to reality with your arrogant insistence that a number of insecticides contain fluorine, when in fact they don’t. Now you continue to insist that Death Trains Hansen and the Treemometer Mann are any more than second rate deluded wannabees. Talk about denial – you set new standards for denying reality!
May I diplomatically remind you that the world is steadfastly refusing to warm. Don’t blame me, blame the Warmists. Their doomsaying is wearing thin, it appears. Maybe ever more shrill predictions of excessive heat, excessive cold, famine, pestilence, flood, fire, earthquake and Ebola, might reinforce the faith of the ever dwindling band of irrelevant Warmists, by causing global temperatures to rise.
Keep praying and hoping – if you need any help understanding reality, I will be glad to help.
Live well and prosper,
Mike Flynn.
There’s plenty of “inability to relate to reality“ going around, eh Climate Etc readers?
Especially among pesticide enthusiasts!
How does “inability to relate to reality” arise, Mike Flynn?
And how is it sustained in the face of reality?
Thank you Judith for another fascinating post. What a great place this blog has become.
That’s two complete professionals in a row, neither of whom claim to have perfect knowledge but each, as proper scientists, provide a sensible and dispassionate route map for proper evaluation.
It would seem that those involved with models don’t like the thought of being relegated to a lower level of the “tree”, but you can’t please everyone.
Would that it would come to pass!
I am going down here and post this even before I read the post.
Ice Extent has been decreasing most of the time, ever since the coldest part of the Little Ice Age. Albedo has been increasing and warming has naturally happened. Clouds and Snowfall have increased as this warming took place. Snowfall and clouds are now sufficient to stop the Ice Extent from decreasing and sufficient to stop the Albedo from decreasing. That is why we have had a pause in the warming. Now I will read from the top.
Love it as always, but can it be so simple? I’d count up on my attributive toes, but Ockham the Onychologist has trimmed the nails, and the lollies are painted.
========
Ocam’s Razor says the right answer will be simple.
It will be easily understandable with average intelligence.
It will match up real well with common sense.
it will not come out of “black box models” that no one understands with feedbacks that no one can understand.
if anyone understood the models, they would have a model that would match real data. No one does.
Pingback: And then there was Michael | Cogniscentum
A lot of people don’t seem to realise that there were several proposed fingerprints to look for:
a. significant heat gained by the top layers of the sea outside of natural variation
b. stratospheric cooling.
c. troposheric warming.
d. dominant manmade CO2 precludes any significant pause in near surface temperature rise beyond the enso fluctuation.
e. The poles should both warm.
f. outgoing radiation reduces.
The Argo floats went in search of a and found only a heating plateau (after adjusting the initial cooling upwards), b stopped in 1995, c never happened at all, d also went the opposite to predictions, with e only one of the poles warmed and the other cooled and f, according to Lindzen, is demonstrably untrue.
By all objective metrics the hypothesis has been heavily disproven for some time. The reason the issue doesn’t go away is because most reseearchers are still being paid to find this dog that didn’t bark and if they report there is no problem to solve they are rapidly defunded.
I was just thinking, Arrhenius studied IR absorption by CO2. But did he study CO2 concentrations in the vicinity of 0.04$? I doubt it. I could be wrong.
Michael Mann’s “Nature trick” of using tree-ring proxies to “establish” past temperatures, and then using modern thermometer-bsed temperatures to “demonstrate” that modern temperatures are unprecedented, was an act of sensationalist showmanship of the P.T.Barnum variety, designed to prove the sucker–is-born-every-minute phenomenon.
Suppos that the mid-latitudes warm by 5 degrees C. Suppose that coral reefs begin growing off the oast of Georgia by the end of the century. Suppose pythons and anacondas, and alligators move into the Carolinas. So what? Corals used to grow at the latitude of England, crocodilians lived-in Canada. Real scientists don’t promote fear, they study things that they find interesting.
The notion that we must stop the climate from changing, in order to preclude people from migrating northward or to higher elevations as climates in these places become more comfortable to inhabit, is fringe lunacy, at best.
Most CE readers don’t want our lives dictated by authoritarian control freaks. The UN and IPCC, Al Gore, Michael Mann, and the like epitomize control freaks: people who derive pleasure from dictating, and disrupting other peoples lives.
I saved a copy of key statements and my comments as I read the post
Of course, there is no way to conduct meaningful experiments on analogous climates, so one of the best tools is not of any use to us.
We can compare the temperature and Albedo in a Medieval Warm period to the temperature and Albedo in a Little Ice Age and we will have a valid experiment that we can compare to modern time.
When we look at two curves and they both seem to show an excursion that matches in onset, duration and amplitude, we consider that to be evidence of correlation.
We can compare the Roman and Medieval Warm periods to the Modern Warm period. The modern Warm Period is progressing much the same. We need little to explain why they are the same. The only thing different is CO2 and it has not changed the progress of the Warm Cycle to be different from what happened before.
A hockey stick shape in a data set provides a perfect opportunity, since the blade of the stick represents a significant excursion from the shaft of the stick, while the shaft represents the stable system that we need to start with.
The hockey stick was tossed out by the IPCC because it was fraudulent.
Here we want to evaluate the evidence that the excursion of interest is truly beyond the bounds of the stability region for the system.
Temperature is well inside the bounds of the past ten thousand years. I read a little more and realized the author came to the same conclusion. Nothing is really different and CO2 caused the difference so CO2 has no measurable influence on temperature.
That way we can be specific about what input data we need.
They tell us the ice in the Glaciers and Ice Sheets is melting and the ice is retreating. Why don’t we use that.
Has the modern warming created a signature that is so unique that it can only be associated with a single root cause?
It can be associated with Albedo.
The skeptic arguments seem to all reside under a claim that the signature is not unique, not that it is unique to something other than GHG warming.
The skeptic arguments are not all in agreement with this. We do not have consensus. Some of us believe that the signature is albedo and the lost energy was reflected. Other skeptics have other theory. I will let them speak for themselves. Don’t lump skeptics under any one claim.
decrease in outward radiation would be due to a decreased albedo, where albedo represents reflection across the entire electromagnetic spectrum
You are on to something useful here.
Instead, there is hypothesized to be a complex function involving capacitance that explains the primary discrepancy, the recent hiatus.
Recent Albedo has been flat. Wait for the Earthshine report. It will show good correlation between Albedo and Temperature. That explains the hiatus.
With so much effort put into modelling CO2 warming while other fault tree boxes are nearly devoid of evidence, it is not even clear that the available tools are being applied efficiently.
It is very clear that too much effort has been put into understanding what influence CO2 has and no effort has been put into looking for other reasons for Natural Variability. This is true on the consensus side and on the skeptic side. Our own Climate Study Group has put most of our effort into sensitivity of temperature to CO2 and no coordinated effort into anything else. This was over my objections.
why would climate scientists not seek the added credibility that could be gained from an independent and established attribution effort?
because it would find no credibility. if your models always provide output that does not agree with real data, you have no credibility.
I have now read it all. This was an excellent post, in my opinion.
1. A fault tree might be a useful way to display the complexity of the alternative hypotheses that are in play.
2. An issue tree would be better because it would also display the debate that building the fault tree would create. It is in that debate that the uncertainties emerge. Fault trees do not display uncertainties. Note how much of his discussion is devoted to uncertainties.
3. He seems to say in part 2, step 1, that a fault tree approach cannot resolve this particular attribution issue. I agree. The uncertainties are far too great. In fact what he refers to as the modern warming is actually a modeling result, not an observation. What he says about the weakness of using modeling applies from the very beginning.
Root cause: advocates of more government control over every aspect of our lives by any means –e.g.,
@ Wagathon
“The incredible list of supposed horrors that increasing carbon dioxide will bring the world is pure belief disguised as science. ~Will Happer”
The advocates of more government control over every aspect of our lives by any means will say or do anything–at all–to achieve it. This does NOT imply that they actually believe what they are saying.
@ Matt Skaggs
First: thank you. Nice post.
” I have grave doubts that we have survived Step 1 in this process, ……..”
Exactly!
What we are faced with, using your automobile analogy, is that while driving peacefully down the street, car purring like a kitten, you are flagged down by a group of self-identified ‘Automotive Experts’, and told: “We have determined that there are serious problems with your car. Please get out. We will take your car to our shop to be repaired. We anticipate that this will take quite some time, so you will be billed periodically as repairs progress. Please ensure that your payments are submitted promptly so that the unpleasantness of having you arrested and your assets confiscated can be avoided. Have a nice day!”
+++++++++++++++++++++++++
Judith it is such a pleasure to read a truly objective thought process on this topic. I really thank you for bringing Matt’s article to us to read. It is clarifying and allows us to see where the flaws in the current process have been better. The logic of the IPCC is a mathematical logic executed in a vacuum. What I mean by that is that significant amounts of information remain highly uncertain that could have a tremendous effect. If the true purpose of the IPCC and climate scientists were to characterize the amount of heat that is attributable to CO2 the first thing would be (assuming a model could not be constructed that was shown to be trivially robust and powerful) would be to put bounds on all the other possibilities. The IPCC itself admits that clouds, oceans and a few other things are very unknown and have considerable possible input. However, I don’t see the focus in the documents of the IPCC or climate scientists in estimating these variables. Possibly this is because the data about these phenomenon are not available prior to 2000 in some cases and 1980 in others or not available at all even now.
The IPCC then attempts to assert their models are robust and that therefore proves the CO2 hypothesis however, an objective look at the models would say that it seems unbelievable the models are robust on the face of them considering the computational complexity and errors in the numerical processes as well as the number of assumptions in the underlying formulas. Each of the assumptions in the models represents a testable experiment that has not been carried out to my knowledge. It is not possible to believe the models are robust by looking at the assumptions and approach. THerefore one can take the position that the models are robust by looking at their results and seeing if it matches reality. This is a much weaker position as then we must look for close matching of new data to model data to be sure that the model is tracking the new data (not the data assumed to be incorporated into the models parameters.) I have not seen an objective study of model facility given some input data used as parameters and data not included that then is predicted to see if the models are able to deal with “new” data but even under this approach the very existence of the other data clouds the surety of the conclusions as the researchers clearly are aware of that data when they constructed the models. The best test is with new data. Unfortunately the “new” data post the creation of most of the models basic outlines and parameter fitting is primarily since 2000 and this data does not show the models in good light. In fact it lends credence to the idea the models are seriously lacking fundamental missing behaviors or have miscalculated the parameters to underlying processes or may be wrong entirely as to the equations underlying the atmospheric response.
Watt has clearly shown that an objective analysis cannot robustly conclude that CO2 is a root cause. There is way too much unknown to conclude we really have any idea why this excursion has happened. The models are not robust to provide any corroboration. Any objective analysis of them would have to be that they are deeply flawed and do not contribute to a solution at this time. Saying we just don’t know may be politically unacceptable but it is the only objective possible answer. If people want to know the answer then they must invest more time and money in studying and collecting data and it may take decades to get sufficient amount of data to accurately state the relative contribution or even the majority cause.
Gavin has said in posts to you that he is 110% sure of the attribution of CO2 to the temperature variance. That is a bizarre statement to me. He seems to base this on the models predictions which clearly is a false way to calculate those probabilities. It has become clear the models were missing ocean capacitance and flows that if true which seems indisputable then the attribution of prior causes in the models starts to come apart. For instance, if ocean flows do represent some of the heat during the modern warming then it implies some of the cooling in the period prior was related to this and then some of the warming prior to that is because of this effect. This means the attirbutions of CO2, aerosols, methane, other things used to explain those variations was wrong. Therefore as you have pointed out that means that even using Gavins “model based” approach to certainty the probability CO2 is the 110% cause of the modern warming is drastically reduced.
The modelers have assumed the “hockey stick” and therefore they then conclude the model is robust except for possibly the recent 15 years. However, as Matt points out it is now clear that the LIA and MWP seem to be real events. The hockey stick has been disproven and the PDO and AMO disturbances clearly show that significant effects exist in cycles in the system in hidden un-modeled variables. This is a serious blow to the models as they must be shown to explain these prior variations before they can assume to robustly model what is happening today. This alone is enough to discount the models entirely. It is impossible to know how much each of these capacitance type or other type inputs have contributed to the results and we are left at the point of saying again it is impossible to ascribe with certainty any number.
I believe this is the only possible objective analysis. Matt has proven this to my satisfaction. It is possibly regretable and politically inconvenient that the result is unsatisfactory. It seems to me the only legitimate argument is that CO2 has some contribution and if we wish to avoid any human contribution then we should take measures to limit human impact. This is a reasonable argument and backed by facts that at least some effect is coming from co2.
logiclogic, fine until “the only legitimate argument is that CO2 has some contribution and if we wish to avoid any human contribution then we should take measures to limit human impact.” This is only legitimate if (a) it is clearly demonstrated (it can’t be proved) that any human-caused warming will be net negative, and (b) GHG emissions reductions are the best approach to dealing with this. Neither is the case.
There are no facts that prove any effect is coming from co2.
There is Theory and Model Output and Opinion.
There is nothing else.
Theory in the sense of we know that CO2 absorbs certain wavelengths and re-emits it as radiation. Your point I understand is that it is not provable with the data we have now that this radiation is actually contributing to the temperature rise we have seen but I believe that radiation must exist. I may not believe in the models or believe some of the assumptions in the models but I do believe in basic proven physics.
My point is simply a common sense approach which is that if we are causing a large change in some element in the environment prudence would say that until we can prove it is benign or even positive we try to limit the excursion. However, this is a mild opinion in that I would not do anything extraordinary like limit people’s energy supply or drastically change the price of energy in response to that. Given that the excursion cannot be shown yet to have caused any change I wouldn’t spend a lot of money to limit our co2 output but would do what we could at very low cost to limit our output until we understand better the consequences.
I believe that I am more opposed to “liquid dinosaur” because it is a dirty way to produce energy and use energy. That is, it kills people in the production of it, the transport of it and the usage of it. Long term we must move away from limited resources to long term viable resources. I am not saying we should do this overnight but should be working to find alternatives and when they become economically viable put them in place so we can get off what I still think is a primitive way to produce energy.
Like the above argument that co2 doubling in the atmosphere may be benign but until we know if it is or not we should do what we can to limit our output this is a soft goal not a “crisis” must do goal.
There is no proof that CO2 causes any harm.
There is huge proofs that CO2 makes green things grow better while using less water.
It would be a huge mistake to limit the increase of CO2.
It has increased world food production and doubling of CO2 would bring much more improvements.
Note that now we are no longer considering the entire history of the earth, we are only considering the changes in magnitude during the modern warming interval. Our excursion direction is up, so we discard the terms for a downward excursion.

Doesn’t the thread get lost here? It is still possible that, even though warming is increasing, it could have increased more had the ocean not acted as a sink for heat. The quoted text is an unsupported logical leap made to simplify the problem, but it may have made it too simple.
Cog, “Doesn’t the thread get lost here? It is still possible that, even though warming is increasing, it could have increased more had the ocean not acted as a sink for heat.”
The oceans are reservoirs not just sinks.
https://lh3.googleusercontent.com/-yAK4GBn_s7g/VEp16YCr3RI/AAAAAAAALok/Hmgsg0xkdjU/w575-h345-no/approx%2Benergy%2B4545.png
So more of the warming could be due to the oceans recovering from some past event. This is where “normal” comes in handy. If you knew what “normal” really should be, then you can credit/blame the oceans. Since the LIA was about a degree cooler than late 20th century and it can take the oceans 300 years or more to recover by 1 degree, some portion of the warming is “likely” due to a return to “normal”. That would be a reservoir response.
On the other hand you could say that the LIA was “normal” and ignore that warming of the oceans has considerable impact on the global temperature average and credit CO2 with 100% (even 110%) of the warming from any period you like. That would be a heat sink response.
I guess how you look at it depends on what you are selling.
\
My point is that he makes an assumption not supported by the logic he provides. Maybe we could rule out the oceans as a net absorber of heat later on. But not at this stage of the analysis, by his own rules. For all I know, there may be heat coming out of the ocean that was stored there during the Roman Warm Period and has been sloshing around ever since, but we can’t even think about that now, according to his own rules of RCA.
I don’t see that, with the oceans as a reservoir there should be some increase it temperature or OHC which is right inline with capacitance. The LIA was a discharge cycle, how long does it take to recharge?
The length of “recharge” of ocean heat will depend on the intensity of the heat source that supplies the heat, generally, the higher the temperature of the source, the faster heat will flow into the sink. The second dependency is the resistance. That is, how easily does the heat flow from the source to the sink.
Obviously, there isn’t just one answer. It will vary with temperature and resistance.
(And, one form of the resistance is clouds)
The time period considered is not important to the message. It is not important to the thread.
He could have used a longer or different time period and that would have required more explaining to get to the same conclusions.
Any time period during a time that the correlation between CO2 and temperature fails, it would have worked as well. There are a huge number of times that the correlation between CO2 and temperature failed.
Heres another way to understand why Matt’s approach is off base.
The climate over the past 100 years is acting exactly how we would expect it to. That is, the Normal operating of the system would be this: When you increase the opacity of the system to IR, you expect ( and it was predicted) that the system would run hotter.
Its not a system acting abnormally. The warming we see is entirely normal, predictable and expected. Add C02 the temp goes up.
How much? THATS the tricky question because you have to separate or allocate or attribute some portion of the warming to GHGs and some portion to other causes.
The climate we see is entirely normal. The warming DUE TO HUMANS is entirely normal and expected.
Mosher,
It’s easy to say “whatever happened/happens is what we expected.”
The problem is, that’s not science.
Andrew
Science would start with…
Here’s what happened when we did x
Here’s what happened when we did y
In climate science, no one has ever done y to compare x to.
No science here.
Andrew
Perxactly.
andrew the prediction was made in 1896.
deal with it.
“andrew the prediction was made in 1896.
deal with it”
Not sure what you mean.
Andrew
read it and weep
http://www.globalwarmingart.com/images/1/18/Arrhenius.pdf
section 4 hmm pgs 263 and following.
you see it started with a prediction. If you increase c02 the temperature will increase
Guess what?
c02 increased, temperature increased.
That is evidence FOR the theory, not evidence AGAINST the theory.
And since that day, since 1896 the question has been..
How can we improve the accuracy of that prediction.. How accurate can we make it over smaller and smalller spatial scales and various temporal scales.
Early on man first observed that light travelled faster than sound.
How much faster? well lots faster.. but of course it too time to narrow and refine that answer.
Same with c02 and warming.
“c02 increased, temperature increased”
It also decreased, according to dips in the squiggly line.
This is supposed to be science?
Andrew
It’s not science. It’s guess work.
The hypothesis that CO2 is responsible for modern warming has a seat at the table.
Internal variability has a seat at the table.
One or more aspects of the Sun have a seat at the table.
And on top of that, we don’t understand how the climate system works.
Might as well read tea leaves as listen to some people.
jim2.
At the core all science is guesswork.
The question is how many guesses and how good are they
When classical physics predicted a certain spectrum from a black body, there was no guess work, the spectrum didn’t match predictions. They knew classical physics had failed. New physics accounted for black body radiation and a whole host of other phenomena. At that point, they knew they had found new theories that worked for the micro-world.
There was some guess work, but it was followed by quantifiable experiments and observations.
Climate science, thus far, has been too much guess work and not enough verification by observations.
In fact, if you believe the observations, the models have failed. But you can always throw on another turtle and carry on, I suppose.
Dr. Curry & Co. have put forth the stadium wave and it does have quantifiable predictions attached. We’ll see how the SW fares.
IMO, we just don’t have enough data yet to draw actionable conclusions.
“How much? THATS the tricky question because you have to separate or allocate or attribute some portion of the warming to GHGs and some portion to other causes.
“Imo, determining “how much warming is occurring” is the 1st and simplest of the tricky questions. The more difficult question(s) is what areas of the globe will have changes in their local conditions and when as a result of any temperature change. It is wrong to assume that there is a known relationship temperature increase and net change in conditions overall.
Right, that’s not science. At the most, it’s cargo cult science.
“They’re doing everything right. The form is perfect. It looks exactly the way it looked before. But it doesn’t work. No airplanes land. So I call these things cargo cult science, because they follow all the apparent precepts and forms of scientific investigation, but they’re missing something essential, because the planes don’t land.”
SM,
You are playing with semantics. I think we can all assume that by “normal” he means normal for the Holocene. You are arguing that CO2 is the “blackened squirrel” and we don’t need to look any further.
I am thinking that is a little simplistic, but the whole exercise is doomed anyway because we simply do not have data going far enough back to know whether the current warming is exceptional.
No, he is playing with semantics.
To be sure, as I argue, he and others got seduced into Mann’s argument about unprecedented.
The climate is doing WHAT WAS EXPECTED. In 1896 we predicted that adding c02 would raise the temperature.
we added c02.
the temperature went up.
this behavior is NOMINAL.
Now, our job is to explain how much warming.
The system is not out of its normal operation. Root cause doesnt apply.
period.
stephen mosher: The climate is doing WHAT WAS EXPECTED. In 1896 we predicted that adding c02 would raise the temperature.
we added c02.
the temperature went up.
this behavior is NOMINAL.
Now, our job is to explain how much warming.
In order to explain how much warming is due to that identified mechanism, all of the other mechanisms affecting warming and cooling must be identified and quantified. Clearly, anthropogenic CO2 does not explain the previous warmings or their approximate periodicity. What does? Is the mechanism persistent? Is it having an effect now?
Also of interest: is warming good or bad? What else happens, such as increased/decreased rainfall?
If you like statistical inference, what is the p-value associated with correctly predicting this outcome? Is it 0.5 (which it would be with stationary uncorrelated background variation)? Is it 1.0 (which it would be if the prediction was made early in a natural warming [which seems on the whole to have been the case])? Or think of confidence intervals and Bayesian credible intervals: is there sufficient evidence that the true effect of the CO2 to date is outside the interval (-0.1, 0.1)? the answer depends heavily on the assumptions made about the effects of all other causes.
Then there is the issue of predicting the future. Given everything we know now that was not known in 1896, including lots of knowledge about what still remains to be learned, can we confidently predict that future increases of CO2 will produce future warming?
To believe in a complex theory after 1 correct prediction (modified a bit in light of the pauses in warming that were not predicted) would be what the Skinnerians called “superstition”, and what Feynman called “Cargo Cult” science.
Your writing is an example of why I wrote that it was “droll” to think of a lot of climate scientists brainstorming to produce a lot of causal explanations and then to address all the evidence concerning them in systematic fashion. What they did instead was identify one mechanism, live through some oscillations between warming and cooling, and then proclaim that the first warming after ’40s-’70s cooling had to be completely caused by the pre-identified mechanism.
we simply do not have data going far enough back to know whether the current warming is exceptional.
We have a huge amount of excellent data and modern temperatures are well inside the outside bounds of the past ten thousand years.
The current warming is not exceptional.
Matthew
“In order to explain how much warming is due to that identified mechanism, all of the other mechanisms affecting warming and cooling must be identified and quantified. ”
A. ideally yes
B. pragmatically no. It is enough to explain a substantial portion.
ALL other mechanisms can never be identified. It might be unicorns
“Clearly, anthropogenic CO2 does not explain the previous warmings or their approximate periodicity. ”
1. Who ever said C02 was the only forcing agent? not me. please
2. C02 doesnt have to explain PREVIOUS warmings. Of course,
you cant explain previous warmings without it. Go ahead,
assign ZERO forcing to c02 and see how well you can explain
the paleo record.
“What does? Is the mechanism persistent? Is it having an effect now?”
Good questions. Note. these questions have nothing to do with
justifying root cause approach. rather, that you have these questions
shows you I am right.
“Also of interest: is warming good or bad? What else happens, such as increased/decreased rainfall?”
Good or bad are moral terms. Talk to your priest. I’m pretty much
of a nihilist so take your talk of good and bad to someone who cares.
“If you like statistical inference, what is the p-value associated with correctly predicting this outcome? Is it 0.5 (which it would be with stationary uncorrelated background variation)? Is it 1.0 (which it would be if the prediction was made early in a natural warming [which seems on the whole to have been the case])? Or think of confidence intervals and Bayesian credible intervals: is there sufficient evidence that the true effect of the CO2 to date is outside the interval (-0.1, 0.1)? the answer depends heavily on the assumptions made about the effects of all other causes.”
1. all good questions
2. questions dont address my argument.
“Then there is the issue of predicting the future. Given everything we know now that was not known in 1896, including lots of knowledge about what still remains to be learned, can we confidently predict that future increases of CO2 will produce future warming?”
1. yes we can predict this. we can always predict.
“To believe in a complex theory after 1 correct prediction (modified a bit in light of the pauses in warming that were not predicted) would be what the Skinnerians called “superstition”, and what Feynman called “Cargo Cult” science.”
1. there is more than 1 correct prediction. There is the whole
science of radiative physics.
2. The theory that follows from that is used inside todays weather models. Guess what? you cant predict the weather right without that theory
3. Given a choice between believing in a theory that has one right
prediction and claiming its wrong based on no data, where do you
think feynman would come down. One the side of you and Doug cotten?
“Your writing is an example of why I wrote that it was “droll” to think of a lot of climate scientists brainstorming to produce a lot of causal explanations and then to address all the evidence concerning them in systematic fashion. What they did instead was identify one mechanism, live through some oscillations between warming and cooling, and then proclaim that the first warming after ’40s-’70s cooling had to be completely caused by the pre-identified mechanism.”
They have never identified one mechanism.
That is cargo cult history
Steven Mosher: . pragmatically no. It is enough to explain a substantial portion.
Agreed, sort of. We have to be able to explain enough of the variation, and we have to have substantial evidence that we can explain enough of the variation. For CO2 attribution, we do not have evidence that we have enough of the natural variation explained.
Note. these questions have nothing to do with
justifying root cause approach. rather, that you have these questions
shows you I am right.
You’ll have to explain that some more. Whether the root cause of the last temperature peaks is persistent is intrinsic to evaluation of how much the recent warming is caused by CO2.
Good or bad are moral terms. Talk to your priest. I’m pretty much
of a nihilist so take your talk of good and bad to someone who cares.
In that case, lay off the policy recommendations. But non-nihilists have gone to great lengths to assert that the changes will be bad: consider James Hansen and Al Gore. I am sure that our readers will remember in future that you are a nihilist.
They have never identified one mechanism.
Sure they did. They settled on the radiative physics to the exclusion of everything else. It’s a mechanism with parts, but they excluded non-radiative heat transport, and they didn’t even bother to examine the causes of previous excursions.
1. all good questions
2. questions dont address my argument.
I am glad that you liked them. I added them in for people who like to consider the statistical question of whether a seeming confirmation of an hypothesis (or rejection of a different hypothesis) happened as a result of a causal sequence independent of the hypothetical mechanism. And for people who like to weigh the evidence relative to multiple possible explanations. There is a nice radiative balance theory that made one correct prediction about subsequent climate change (ignoring for now the epochs when there was no warming); should it be believed? Perhaps you prefer to ignore probabilistic calculations that are conditional on competing hypotheses.
oops. ” root cause of the last ”
should be “root cause of the earlier”
In a very real sense, the current warming period is a net biological feedback to the warmth of an interglacial. A certain species (i.e. humans) were at a critical stage of development such that during this particular interglacial we had the brain capacity, social, and technological tools to ignite the human carbon volcano. We see biological feedbacks to climate all the time, and the HCV is just one more example– albeit perhaps one of the strongest single biological climate feedbacks thus far in Earth’s history. Also, of interest is this feedback is both positive and negative – through our black carbon and aerosols we may be adding a negative forcing on climate, and of course through our GHG’s or HCV we are seeing a positive feedback to the natural warmth of the Holocene. We see that even the lowest of life forms are also joining the positive feeback bandwagon, adding even more warming to this period of Earth’s history:
http://www.natureworldnews.com/articles/9812/20141023/new-methane-releasing-microbe-key-player-in-climate-change.htm
Tens of thousands of techno-fans of Dinosaur Comics agree!
http://www.qwantz.com/comics/comic2-2725.png
Denialists, not so much … `cuz mostly, denialists have never even *HEARD* of Dinosaur Comics!
What are the haps, denialists?
a fan of *MORE* discourse: Tens of thousands of techno-fans of Dinosaur Comics agree!
The merry go-round broke down, eh fan?
One day, it turned out that Climate Change Is Real
http://www.qwantz.com/comics/comic2-2566.png
There certainly is a lot of Climate That’s Changing
http://www.qwantz.com/comics/comic2-1161.png
Dinosaur Comics it’s not just for nerds any more!
a fan of *MORE* discourse: One day, it turned out that Climate Change Is Real
There certainly is a lot of Climate That’s Changing
That’s what makes attribution of change to CO2 such a problem, isn’t it?
Mosher’s clearly trying to defend the indefensible here. He’s clearly lost another point, but won’t admit it.
Doesn’t that mean that during the ~17 year “pause” the system was acting abnormally?
Mosher,
In that case, you should recognise why it is entirely justifiable for all citizens to challenge and question every result, every prediction when it is being used to advocate for extremely damaging policies, right?
Your statement suggests science has lost its credibility and, perhaps it is time to subsume it as a subset of engineering? Discuss.
Judith, the other side of this equation is “what to do?” Lomborg has attempted very rationally to ascribe some of the expected impacts and using various economic measures to calculate the rationality of making investments. My basic problem from the beginning in this debate has been that even assuming all the worst case climate predictions the predicted impacts were not believable. If climate models are hard to get right for 80 years in the future predicting food production in 80 years is similarly hard. We have had numerous predictions of food supply in the past that have proven to be wildly off. The ability of man to create solutions that have not been imagined before seriously puts an upper bound on predictions of this type. In the face of our exponential knowledge about genetics and chemistry, our growing wealth and ability to affect lifespan, disease, mitigate natural disasters it is unbelievable the consequences predicted. I am reminded how 16 years ago a heat wave in france killed 15,000 but a similar heat wave the next year killed 10. Simple measures like having a fan, drinking more water produced a 99% reduction in fatalities. A study i made of disasters in the 20th century showed that nearly 70% of deaths due to natural disasters occurred in the first 50 years of the century and only 30% in the last half. In fact, the death rate from natural disasters has fallen an astonishing 98% in the last century. If a similar fall in death rates happens in the 21st century then it won’t matter if storms do increase or whatever. Our ability to withstand mother nature is improving dramatically. Some will point out that rising sea levels will be not as easily mitigated but the fact is few buildings last 100 years. Over the course of the century numerous buildings will be replaced naturally irrespective of rising tides. The ability to see this gradual movement and plan accordingly is contrary to the idea these things will be “submerged” suddenly. Some places may be abandoned and some places may be changed but it is hard to argue we should pay today for the inconvenience of future coastal landowners.
I could get into a hundred topics here from extinction rates and storms and so many of the supposed impacts and show you there is tremendous uncertainties in these studies. Some are pathetic in their robustness. The bigger issue is that it is robustly unprovable or logical that so many negative effects will happen because of a change in temperature of even 2,3,4 degrees because as temperature has risen human life and other life seems to benefit from warmer climate. A case in point is that during the climactic maximum 5,000 years ago temperatures were more than 2C warmer than today. During this time as you know humans finally felt in places around the globe that life was good enough to become agricultural. Numerous available data point to the fact that life was indeed better then. Life was more prevalent and more robust. The nile was twice as big. Life existed where deserts exist today. While this is NOT proof that similar rises would produce good results it does put some doubt if the studies showing catastrophic effects from 2C change in doubt. Similar to climate studies for me there would have to be proof through the use of much more robust data and models that the environment would be affected in such negative ways. On the face of it, researchers are clearly motivated to make their articles inflammatory. I would guess that surveys would show a bias to people in academia that any change in the environment is negative. However, simple mathematics, probability, science would say this is unlikely. It is unlikely we are at the perfect temperature today. Maybe it is so, but I personally would need to see proof that any change is necessarily negative consequence. Yes, any change will be inconvenient to some but change is unstoppable even if we factor out all human change. Things happen. The more you learn about history it is sobering to realize that sh** happens, has happened and will undoubtedly continue to happen. Get prepared is the only rebuke. We are. We have reduced the death rate from natural disasters by 98% in one century. I believe we will have large improvements this century as well and natural disasters will be a minor concern by 2100.
Such thoughts were evident to me from the beginning of this debate when I believed the temperatures would climb 2 or 3 degrees or more. It was never clear to me why such change should automatically be negative given that much of the world is covered under ice and snow there is clearly room for some warming to make more of the earth livable. Historical analysis shows that for large parts of evolution the earth was dramatically warmer and that it is relatively recent that we have had persistent long term ice ages that have covered the earth in snow and ice and left 50% or so of the surface of the earth harsh and deadly to life. Some will say that heating will naturally increase desert areas and lack of water however, all that melting ice and snow will raise sea levels over centuries causing disruption but it is much more likely that the environment would get wetter in general everywhere. This is common sense and backed by what we know about life at these warmer times looking at sediments and where life existed. It is just not robustly believable without significant additional proof that all these negatives are so obvious or given. All the focus has been on the models and the climate but for me just as equally suspect and poorly attributed is all the negatives.
I realize it is risky to just assume that change will be good too. The most prudent thing would be to minimize our impact and study. I suggest this for the time being cognizant that as we refine our knowledge of the environment and the consequences we may in fact learn that there is a net positive benefit to warming. The one thing that scares me is the ice age. It seems inevitable we will sink into one again. I doubt anyone can doubt this would be a terrible event for humans and life but we have sustained it before. The question would be would we take the experiment of modifying our climate to stop an ice age? It is a science fiction like scenario to be faced presumably by generations ahead but hopefully we will invest enough in knowledge by then to have a really good factual and scientific basis to understand how change will affect everything. Life is uncertain yet it has persisted on the earth.
LL, good post. Re “If climate models are hard to get right for 80 years in the future predicting food production in 80 years is similarly hard.” I have repeatedly argued that the only thing we know of the future is that it will surprise. Never in history have projections 90-100 years ahead been remotely accurate, and even in the last decade we have been surprised by the GFC, Russia annexing Crimea, Islamic State, ebola epidemic … My prescription remains, adopt those policies which give us most chance of dealing well with whatever befalls. This means pro-growth rather than anti-emissions policies.
“The most prudent thing would be to minimize our impact and study.” Study, yes, I’ve advocated for many years getting a better understanding of climate, unfortunately the research has continued to be too narrowly focussed. Minimize, no, I can’t see any benefit in that. Let’s deal with real, current problems, which will increase our capacity to deal with any future problems, which we can not at present foresee.
+++++++++++++++++++++++++++
LogicLogicLogic,
This seems reasonable and makes sense to me. I have difficulty accepting the impacts the alarmists want us to believe.
Do you have a link to what you believe are the best estimates of the net impacts per degree of warming and of cooling.
I am looking for authoritative studies equivalent to this one by Richard Tol:
http://www.copenhagenconsensus.com/sites/default/files/climate_change.pdf , See Figure 3
I have seen studies that show 7 times as many people die from a 1C change down vs up. I.e. if temps rose 2 degrees far fewer people would die of pneumonia, heart disease and other ailments that are affected by the cold. I believe the IPCC admits in its reports that until 2080 food production will rise as a result of global warming. This is believable as higher temps would mean more arable land, more evaporation would mean more rainfall and we have seen over the last 50 years as CO2 has climbed that total biotic life on the planet has increased some 30-50% according to NASA satellites measurements. It is rare to see these points made which are clearly significant positives. The IPCC claims that in 80 years when temps hit 2 degrees that due to numerous reasons food production will actually decrease. This i find unbelievable. One paper I saw said the reason for this would be the slow migration of crops from hotter areas to the new arable land opened up by the warmer climate or just migration of farm land. At most such an effect would be temporary and if the demand was there for food it is hard to believe that such a “migration” would be lengthy. In fact I find it hard to believe there would be any time to migration and I doubt that existing growing regions would experience any significant decline as well. We have been good at growing in the desert and one of the most productive areas is for instance the california midsection which is hot. I don’t find believable that food production would decline at all in 2080 even if technology remained completely unchanged. However, we know that amazing exponential knowledge of genetics and chemistry is likely to produce drastic improvements in all measures of food production over the years. Therefore any predicted decrease is ludicrous in my opinion and immediately puts in doubt the veracity of the whole argument that there are catastrophic consequences.
I don’t know of other good factual studies on many of these topics because partly I believe there would be little incentive to pay for a study that showed life will be great in the future. The way you get study money is to show there is a disaster potentially on the horizon. If you then conclude in your paper that oh sorry I was wrong, things will be fine my guess is you won’t get any more money. Therefore, academia has a bias, must have a bias to predicting negative outcomes.
I have a very powerful memory of the “Club of Rome” predictions back in the 80s. These were a whole bunch of academia from MIT and elsewhere who constructed computer models of the world economic and environment systems. They predicted that by 2000 the world would either be in ultra polluted deadly state or people would be starving for lack of food or some combination and their conclusion was that unless we chose a communist approach effectively of controlling many aspects of our society along a very precise curve we were doomed to catastrophe. Of course it was China that converted to capitalism not the rest of the world and not only that but 2000 was an incredible improvement over 1980s. 25 years of very high growth and we didn’t face the consequences they predicted at all. This really made me realize how computer models can be so much stupidity. It also made me realize how human ingenuity can be incredibly impactful.
A few years ago we didn’t know about fracking and the natural gas resevoirs we have figured out how to leverage. This has enabled us to drastically change the US energy and economic picture. Trillions of dollars in new cleaner energy does produce CO2 but less and the impact on the world is massively positive. I am driving an electric car now. I charge it at night when energy production is cheap and cleaner. I believe we will see a lot more electric cars faster than people believed a few years ago. I believe we will see battery technology improve and that the gas vehicle will be phased out over 50 years. I also believe that alternative energies will get better and that by the mid-century we will see a significant transition away from “liquid dinasour” type products. I say this conservatively in my opinion. It could happen a lot sooner but even if this more pessimistic prediction is true then whatever runup in CO2 we have will be limited to closer to a single doubling of CO2 which I believe now will result in another 0.5C increase in temperature from here which even the IPCC admits would likely be positive for humanity. I therefore find it unbelievable that we will have the 2C or 3C or more scenario and the debate about whether there are catastrophic consequences is therefore moot whether you believe their predictions of gloom or not. Therefore the need to limit use of fossil fuels is moot in my opinion. I think for many reasons including the dirtiness of fossil fuels and deadly nature of them in other ways, the need to move away from limited resources anyway that it is prudent to do so when it is economically at all reasonable to do so. Electric cars are very economic now in my opinion. I save $400-500/month in energy costs from mine. That’s 200 dollars from the gas cost and $200 reduction in my electric bill from moving to a time based billing scheme allowed in california for owners of electric vehicles. Combined with rebates from state and federal my electric car is essentially free for the first year or two and its maintenance costs will be lower over the long term. It is incredibly safe and I believe an eminently good choice. There was no compromise in choosing it. I believe that it is entirely likely that electric cars will make a bigger impact to reducing and changing our energy scenario over the next 50 years. This is just evidence that whatever the IPCC plans for our future is hardly solid predictions. So, I am profoundly distrustful of such predictions.
+10,000
Matt Skaggs, many thanks for this post. I have a few quibbles from my in a ‘six sigma’ company where root cause analysis was pervasive– but quibbles.
Steve Mosher, thanks for the counter perspective. Unlike yoirnimplicit assertion, I do not find them mutually exclusive. Deductive Root cause analysis is a subset of the broader causality question covered by inductive approaches.
The big takeaway for me is ‘capacitance’. An elegant way of capturing natural variation in ocean heat storage. And since we know the pre Argo OHC data is poor to nonexistant (xbt calibration being but one example), it means the attribution problem is likely insoluble using observational means until many more ARGO decades have passed, at least one more full stadium wave.
Which is, in a quite useful way, a proof that the science is not settled.
Judith, the best of Climate Etc here with this post and some of the thoughtful comments.
I think your assesment is fair
Does this mean you no longer think that “Matt’s approach is off base”?
When I first took notice of global warming I noticed that almost every scientific assertion contained the word “unprecedented”. This word apparently justified the alarmism.
When I investigated the various claims I discovered that events and values are almost never unprecedented in nature. I also discovered that our climate today is unremarkable and amazingly stable.
All of this should be known to the experts which means that the alarmism is not based on science.
This is SO true, scat. (Like the name BTW) I hear frequently all these people warning about storms. I keep going back to the fact that apparently people are blithely unaware of the types of disasters prevalent throughout history (even the last 100 years). A small examination of the facts shows natural disasters killing millions and millions of people just in the last century many of them much worse than anything we’ve seen recently. I feel like people are only aware of their current experiences and believe that life prior to their life was a blissful uneventful calm stability if they haven’t heard of it then it never happened. It is so naive. I was unaware of most paleolithic climate information 20 years ago. I knew that it was warmer in the past and we went through ice ages but only in a broad outline. Now I understand that even with the “hockey stick” that went back 1000 or 2000 years that is simply ridiculously short time frame to be looking at this data. Now we know the hockey stick was wrong and there were variations possibly even warmer than today 1000 years ago, 2000 years ago, 3000 years ago, certainly 5,000 years ago it was 2C warmer. They knew this. They didn’t point this out and that was damning when I discovered it because it demanded an explanation They had no explanation so they left such information out I believe hoping that people would not ask the difficult question they had no answer for which was why those variations in the recent past happened? Their models do not explain these variations because they apparently aren’t caused by co2 therefore they just denied their existence. I even had the head of lawrence livermore climate modeling tell me face to face that the MWP and LIA were not global just a few years ago. I was astonished because these “hot periods and cold periods” lasted for hundreds of years and left what he said were regions of the world apparently much hotter than other regions. He was willing to accept that on the face of it without the obvious problem that “How could that happen?” How could one part of the earth experience such a massive increase in temperature for hundreds of years but the rest of the earth was unchanged? He had no explanation or apparent interest in discovering the reason for that but he was willing to accept out of the box that co2 was the 90% reason for any variation in temps longer term. I found that shocking. How could he be interested in the climate of the earth and found it so uninteresting that parts of the earth were warmer for hundreds of years (or colder) than others? It’s obvious he just didn’t want to give up his belief that CO2 was the only relevant factor.
References to “unprecedented” in the last 1000 years or 600 years sounds impressive but if you look at the record you realize it is just completely meaningless statistic. The idea there could be longer term wavelike phenomenon in the system either from the sun or oceans or earth that we don’t know about is obvious and should have been considered. The idea we don’t understand the chemistry or how these factors could work is also obvious. They admit that we had virtually no ocean data that has 1000 times the heat capacity of the atmosphere and is in direct contact with the atmosphere yet they are willing to make predictions without really any robust data from that variable data at all (pre-2000) and they admitted they didn’t understand clouds yet that variable could easily swamp all other effects yet they said with 95% surety the heating from 1975-1998 was caused by CO2 (110% according to Gavin).
If Gavin is right that CO2 should have caused 110% of the heating we saw between 1975-2000 then it means that since we know around 50% of the heating was due to PDO/AMO that some process is suppressing 60% of the effect of CO2. That is damning right there because it forces him to admit he doesn’t understand where the CO2 heat went. Either that or he is still denying the existence of PDO/AMO. The climate modeler head from Lawrence livermore told me that PDO/AMO would stop that it wouldn’t continue anymore. That the effect was erased by CO2. He didn’t have an explanation for this bold claim. Apparently from what I could see since his models didn’t show it it didn’t exist. I am profoundly amazed that they are so hypnotized by their models that they are willing to deny existence of obvious phenomenon and come up with ludicrous explanations to explain them.
There is no way around it. They knew much of the landscape of uncertainty and they went ahead and said 95% surety when any scientist or even layman with a modicum of interest in the subject could see that was completely ridiculous assertion. I find it hard to find a plausible way to “excuse” this misdirection other than to say it was in their interests to maintain their careers to say this. I get that. Academics frequently will chase the “hot” topic for research. If climate change is the hot topic or cancer for medical science for instance, then you as an acedemic find a way to say your study will find a potential cure for cancer or better study this catastrophic inevitability. It is not in your interest to minimize the panic if you want to keep the money flowing. I can understand that and if you use the cancer basis and you are investigating something which has minimal likelihood of ever impacting cancer knowledge it may seem benign that researchers abuse this. The problem is largely not the academics but the system does not have a robust way of saying we need to study a broad array of topics even if it won’t affect cancer or if global warming won’t be deadly it is still worth spending a lot of money studying it. I can’t entirely blame academics for just finding a way to work within the system although if it is outright fraudulent research then that is different. I am not sure if some of the research in climate is of that magnitude but there is considerable evidence that some of these statements were not plausible science.
I myself am very happy we spent some of the money on climate study. I particularly like the ARGO project and the satellite projects giving us really useful data. I think we should focus down the efforts on modeling and reduce funding considerably until we have more data. We need more experimental funding to actually test hypothesis. I don’t know how to do this but there must be some enterprising academics out there who can find ways to substantiate some of the model assumptions with real data rather than continuing to tweak computer models to “find” the right formulas I would rather we did real science and found the parameters by experiment. We should also find ways to put bounds on and measure large impact variables and understand any cyclic processes in these larger variables. This means studying the sun to understand its cycles and atmosphere and even deeper ocean temp measurements. I would like to understand better how interaction of the mantle and ocean could affect the system. We know that volcanoes can affect the atmosphere. How do we know that release of large amounts of heat in the deep ocean couldn’t cause long term changes in climate later. I am very opposed to a lot of the impact studies which I believe are useless and extremely poor work. Most of those things I’ve seen are completely unbelievable stupid science. Some of it has been okay.
I realize this means waiting for more data but I think it is sufficiently proven to me that the change in temps will be minor from our CO2 production planned and that even if the co2 is produced and we get temp change that the effects on humanity are negligible. Therefore can we please move to longer term studying and more “basic” science that will uncover the true science in climate science which I don’t believe we have at this point and forget all this prediction stuff and all the “long term effects” studies. These are hopeless.
I like Matt’s essay, but:
(1) the concept of ocean capacitance is a nonsense because CO2 infrared radiation has micrometer penetration depth in oceans. But well, if IPCC’s lads want to manipulate climate change at their will, they require more and more invented tunning mechanisms.
(2) that “sufficient data collection” for the temperature excursion, excludes something basic in science: the appropriate timescale. If you want to understand climate change, you cannot focus in a timescale of 35 years, but on another of hundred/thousands of years. More info in my “Refuting …” at: docs.google.com/file/d/0B4r_7eooq1u2TWRnRVhwSnNLc0k/
From the article:
…
European leaders have struck a broad climate change pact obliging the EU as a whole to cut greenhouse gases by at least 40% by 2030.
But key aspects of the deal that will form a bargaining position for global climate talks in Paris next year were left vague or voluntary, raising questions as to how the aims would be realised.
As well as the greenhouse gas, two 27% targets were agreed – for renewable energy market share and increase in energy efficiency improvement. The former would be binding only on the EU as a whole. The latter would be optional, although it could be raised to 30% by a review in 2020.
…
“This package is very good news for our fight against climate change,” the European Commission president, Jose Manuel Barroso, added. “No player in the world is as ambitious as the EU.”
…
http://www.theguardian.com/world/2014/oct/24/eu-leaders-agree-to-cut-greenhouse-gas-emissions-by-40-by-2030
Here we can read for umpteenth time on attribution study that looks at the recent warming as an unexpected event and asks what we can conclude strongly from such an unexpected observation.
That has nothing to do with AGW which is not unexpected but strongly expected. The reasonable question to ask is not, whether the warming is due to AGW, as it’s virtually certain that AGW has contributed to it. The reasonable question to ask is, what can we learn about the strength of AGW. Root cause analysis is not the right tool for that.
Pekka Pirilä The reasonable question to ask is, what can we learn about the strength of AGW. Root cause analysis is not the right tool for that.
Identifying and quantifying all of the root causes is required for learning about the strength of AGW.
Matthew,
I do not think that root cause analysis is at all the right method for that. The problems of climate science are not in finding root causes, they are about determining quantitatively the role a large number of diverse factors have.
what Pekka said
Pekka Pirilä:
Matthew,
I do not think that root cause analysis is at all the right method for that. The problems of climate science are not in finding root causes, they are about determining quantitatively the role a large number of diverse factors have.
I could live with that. Had climate scientists “brainstormed” decades ago about the large number of diverse causes, their relative contributions, the evidence in hand and the evidence needed, before starting the alarmist crusade, this essay would likely not have been written.
It is not too late to brainstorm about all of the large number of diverse factors and to determine quantitatively their roles. If someone comes along post facto and calls the factors “root causes”, that won’t hurt anyone. There are at least 4 hypotheses about the quantitative effects of the suite of factors collectively called “natural variation”: (a) that it has reduced warming below what CO2 would have caused in the absence of background variability; (b) that natural variability has caused 0% of the warming since 1850; (c) that natural variability has caused 50% of the warming since 1850; (d) that natural variability has caused 100% of the warming since 1850. For each of those, you can estimate the warming due to CO2. Quantitative model fitting of temp data estimates of the last 11,500 years, assuming the suite of factors persists, comes closest to supporting (d). For (a) or (b) to be true, the factors that produced the past oscillations must be impersistent.
as it’s virtually certain that AGW has contributed to it.
No actual data supports this.
Actually, RCA is applicable. If you assume an observed “sensitivity” of 2 or higher is required to prevent failure of the models, RCA has potential. The baseline value per doubling is 1.0 C and anything greater would need a cause. So for the umpteenth time, it is not the effect, but the magnitude of the effect that is in question.
Though instead of a cause tree, an excuse tree would be better for climate science.
Pekka,
That;s just plain silly. So what if it’s contributed but the contribution is negligible. Your comment demonstrates your personal beliefs are preventing objectivity.
Peter Lang says, October 24, 2014 at 7:33 pm:
“Your [Pekka’s] comment demonstrates your [his] personal beliefs are preventing objectivity.”
Well, it’s ‘strongly expected.’ Pekka is one of the more blinkered and pigheaded adherents to the AGW cult around. Anything but this kind of silliness coming from him would be highly unexpected and downright shocking.
Pekka Pirilä says, October 24, 2014 at 2:40 pm:
“Here we can read for umpteenth time on attribution study that looks at the recent warming as an unexpected event and asks what we can conclude strongly from such an unexpected observation.”
You’re right, Pekka. It’s silly. Recent warming is not an ‘unexpected’ event at all. It lies entirely within the range of what you would expect from purely natural variability: Sun + ocean.
“The reasonable question to ask is not, whether the warming is due to AGW, as it’s virtually certain that AGW has contributed to it. The reasonable question to ask is, what can we learn about the strength of AGW.”
However, this is even sillier. This is just a poor alarmist’s way – for the umpteenth time – of saying that “I don’t need to go through no stinkin’ testing step of the scientific method; I’ll rather go straight for the conclusion that I’m right, much easier that way.”
There is absolutely no observational support from the real Earth system anywhere for the notion that there is something called AGW (or ‘climate sensitivity to CO2’) at all. +CO2 >> +T. It is just assumed to be the case. A priori. And from that assumption, things are simply interpreted as verification. Warming? Ah, yes – AGW. Completely biased and utterly circular, of course. And totally unscientific.
It’s pseudoscience.
Kristian: Surely the fact that CO2 is a GHG implies that in the abstract increasing CO2 will increase T. There is no pseudoscience to that much.
David Wojick says, October 25, 2014 at 7:48 am:
“Kristian: Surely the fact that CO2 is a GHG implies that in the abstract increasing CO2 will increase T. There is no pseudoscience to that much.”
This is precisely the kind of backward thinking that defines a PSEUDOscientific approach to reality. Thanks for confirming my observation.
David, you seemingly being blind to the obvious circularity of your own statement here speaks volumes about the jammed mindset of the regular AGW-believer. You simply do not see it yourself.
Here’s a reasonable question:
If the climate had done exactly what it has, but there was no extra CO2 in the atmosphere, would it appear unusual?
“I will define a “stable” system as one in which significant excursions are so rare in time that they can safely be assumed to have a single root cause.”
But they’re not independent.
And the assumption of a stable system is also unlikely and not proven.
Valiant, but vain.
Hope that doesn’t sound too rude.
Dr. Curry,
Off topic — in case you’re not aware of this UofI news analytics site.
THE CARBON CAPTURE REPORT
10/23/2014 Climate Change
Daily Report [News]
http://climatechange.carboncapturereport.org/cgi-bin//dailyreport?DATE=2014-10-23
Google map view:
https://maps.google.com/maps?q=http://climatechange.carboncapturereport.org/cgi-bin//dailyreport_kml%3F%26DATE%3D2014-10-23%26r%3D814526208.975814%26type%3D2&z=2&output=classic&dg=feature
Judithcurry.Com: Domain DB Profile
http://climatechange.carboncapturereport.org/cgi-bin//profiler?key=judithcurry_com&pt=4
The domain information doesn’t appear to be very accurate but you’re a better judge.
testing threading
It’s broken.
OT, but given the immediacy of the US elections and close races, …
…
In a forthcoming article in the journal Electoral Studies, we bring real data from big social science survey datasets to bear on the question of whether, to what extent, and for whom non-citizens vote in U.S. elections. Most non-citizens do not register, let alone vote. But enough do that their participation can change the outcome of close races.
Our data comes from the Cooperative Congressional Election Study (CCES). Its large number of observations (32,800 in 2008 and 55,400 in 2010) provide sufficient samples of the non-immigrant sub-population, with 339 non-citizen respondents in 2008 and 489 in 2010. For the 2008 CCES, we also attempted to match respondents to voter files so that we could verify whether they actually voted.
…
http://www.washingtonpost.com/blogs/monkey-cage/wp/2014/10/24/could-non-citizens-decide-the-november-election/
Judith,
This post and the one by Planning Engineer were excellent, well written and definitely worth spending some time on.
Root-cause analysis is feasible only if there is adequate theoretical comprehension of the effects of various possible mechanisms and sufficient empirical data to discriminate among them. With surface temperature variations over multi-decadal and longer time scales, neither of these prerequisites is fully satisfied. We have only the murkiest of theoretical conceptions and proxy data to guide us. It’s far easier to discredit certain claims than to establish root causes.
The GISP2 del18O record shows that, at least in the vicinity of Greenland, there have been not only multi-decadal oscillations throughout the Holocene, but even stronger quasi-millenial ones as well. Much as some would like to claim an ongoing unprecedented temperature excursion and attribute it to AGW, the evidence simply is not there. Nothing unprecedented has been been recorded and nothing resembling any “unique signature” of greenhouse warming has been established. In fact, cross-spectrum analysis shows, that the Keeling curve is either incoherent with GAT variations or LAGS them. Lacking solid evidence, AGW explanations rely upon bald belief.
The problem is that the CAGW alarmists don’t accept that point. They believe CO2 is the control knob and it’s dangerous. The want ‘action’, i.e. policy to control CO2 emissions. But if you statement is correct, there is no justification for policies that will damage the world economy and probably deliver no benefit.
On that matter I’d argue that even the economist’s models, such as Nordhaus’s DICE model with his default (arguably, high end IPCC assumptions), demonstrate that the cost of the porposed actions to the world’s economy would be huge and would greatly exceed benefits for all this century and beyond: https://www.masterresource.org/carbon-tax/world-not-agree-pricing-carbon-ii/#disqus_thread
@JohnS
1. ” Nothing unprecedented has been been recorded…”
2. “…nothing resembling any “unique signature” of greenhouse warming has been established.”
3. “…cross-spectrum analysis shows, that the Keeling curve is either incoherent with GAT variations or LAGS them.”
Would Michael Mann or Gavin Schmidt agree with you? Not, would they be right, but would they agree? Would they point to one or many papers that purport to show that there has been an unprecedented warming trend? [People right here on this list point to the hottest month or the hottest decade. Wouldn’t that be unprecedented and if they are wrong how can they be put right? What evidence exists to deny the claim of hottest this or that?] Or does ‘unprecedented’ have some other, agreed upon meaning?
Would they point to papers that purport to show a ‘unique signature?’ Many people tell me that there exists research that can measure the isotopes in CO2 and tell the difference between what we put into the air and what is ‘nature’ puts in, and hence, can tell how much temperature is due to man. This sounds pretty fantastic to me, but…they seem to have published papers while I have skepticism about their claims. I’ve read that CO2 lags temperature which means it can’t be a cause of temperature increasing but here we all are, CAGW proponents and skeptics alike totally ignoring that assertion which means to me that it must be irrelevant. I don’t understand.
Would Mann and Schmidt agree that a cross-spectrum analysis would yield the results you claim or would they, could they point to papers refuting such claims?
It seems to me that Climate Science went down a rabbit hole many years ago and has yet to emerge. It blunders around in the dark making fantastic claims and wanting to exercise enormous power over people’s lives based on a lot of wishful thinking and circular reasoning. But that’s a gut feeling, an intuition based on how most climate scientists behave. Attempting to actually understand what is going on is to step into the middle of a blizzard with no guide posts and hope for the best. Even the certainty which some people have about how CO2 behaves in a lab cannot be transported, ‘in whole’ to the global atmosphere, so it’s not enough to have some physics: one needs a lot of physics. And what about the saturation of CO2? I hear it asserted but when I read the warmists it’s a ‘fact’ that doesn’t exist for them. This is a truly bizarre world.
After a year of trying to get a handle on things I’m more educated in what is going but find I still have my initial bias that the CAGW crowd is nuts, ie, nihilistic, misanthropic and pursuing an agenda that has little to do with science.
I’d give up my bias to get off this exhausting merry go round of claim and counterclaim and having to sort through a mountain of statistical reasoning that I can barely follow and don’t trust at all.
To that end, would it not be helpful to have a library that could pull together all the refutations of the claims that are made by proponents of CAGW? Is there already such a thing?
Suyts Space has a video of the old Russian song, “Those were the days!”
http://suyts.wordpress.com/2014/10/24/those-were-the-days-open-thread/
Now after listening to five years of official excuses for the Climategate emails that surfaced in late Nov 2009, we are better able to understand the music of those who lived under Stalin.
The real root cause of globalclimatewarmingchange:
Progressive government policy driving government funded “science;”
+
Government funded science paid to achieve a predetermined result;
+
A predetermined result achieved by the substitution of statistics for
science;
+
Statistical manipulation of sparse data delivered to a progressive media to support the original government policy.
Rinse and repeat.
It’s not a decision tree – it’s post modern, government funded, agenda driven “science.”
GaryM, do you have a peer reviewed paper in an authoritative climate science journal approved by an approved climate scientist as evidence for your assertions? :)
Peter Lang,
No, I am proud to say that nothing I have ever written has had to run the gauntlet of review by the government sponsored PR campaigners that pass for climate scientists these days.
I just realised I’d accidentally deleted a word. I was trying to ask if you have a reference for the “real root cause of globalclimatewarmingchange” where the reference is peer reviewed in an authoritative climate science journal approved by an approved climate scientist? :)
No to that question too. I found it in “Mein Warmth.” A borderline psychotic screed, penned by an Austrian climate scientist while sitting in jail for organizing a putsch against the EPA under George Bush.
Very good. Your legally trained brain is far too quick for this Serf. :)
‘Engineers typically use the term “root cause analysis” rather than attribution. ‘ Yes, an industrial engineer would say that. But terms like ‘fault trees’ are only introducing additional complication to what is basically a natural dynamic problem. What are we trying to do? It is not a man made system that has broken down and we are trying to fix, but a thermodynamic system of heat flows, temperature changes, sources and sinks, random and chaos effects, non-lineaarities, non-stationarity, etc. Judith has described it as a ‘wicked’ problem. It sure is, but trying to make it fit an industrial scene may not help.
Dynamic problems are traditionally solved by by casting them as systems of linear and non linear differential equations, plus powerful computers and that is the way to proceed. Coping with a problem so complex is beyond the human brain. The only way is to divide it into a series of simpler problems, connected by such as the Laplace transform. Of course, Laplace is a linear concept, but works perfectly well as a connector between non-linear equations. It has the additional value that one can switch instantly between the time domain and the frequency domain and believe me you need both in this wicked problem. In that respect decades oe years are no different from microseconds.
Unfortunately the IPCC was politically and legally driven by the UN’s FCCC and 19th century science, rather than proper science. The injunction that the science was ‘settled’ illustrates all to well the potential catastrophe of mixing politics and science, so the parentage of the IPCC was doubtful.
Transparency has not been a strong point in the IPCC’s mostly unsatisfactory attempts at modelling, The word validation rarely escapes their lips. So we have some 50 unvalidated models where one good one would do.
You would expect the IPCC to carefully look for singularities in the data – that is totally unexpected events, yet they appeared to ignore the 1940 singularity. Surely it was important to understanding climate that after global average temperature had been climbing at the rate of 0.15C/decade since 1910, it switched to falling just as rapidly in 1940 despite increase in carbon dioxide concentration. This is clear from figure 1 obtained from the Australian BOM in my theoretical model underlined above.
I am a fan of root cause analysis and it was something I just applied naturally before I was even aware of the phrase. I see how lacking it is in may media portrayals of science. The WAIS is collapsing -> must be SUV’s can coal powered plants. Polar bears in decline -> must be SUV’s and coal powered plants. Ummm, there could be a multitude of reasons. (I choose polar bears because that reason was poor data quality and analysis)
Alarmists will read about an issue and think GW is the cause, it is like a get out of jail free card. No need to think. The way I see GW is that it will have a very small effect on everything, but never a big effect on anything.
En excellent essay. It sums up neatly everything that is wrong with “climate science”.
@ FOMD
“How is it that denialists praise the Carbon Cabal so vociferously?”
Speaking individually and not collectively,the reason that this ‘denialist’ praises the Carbon Cabal EXTREMELY vociferously is because it is the single most important factor in making my life livable.
Thank you Carbon Cabal!
PS: I forgive you for providing the same service to FOMD.
Pekka wrote:
“Here we can read for umpteenth time on attribution study that looks at the recent warming as an unexpected event and asks what we can conclude strongly from such an unexpected observation.
That has nothing to do with AGW which is not unexpected but strongly expected. The reasonable question to ask is not, whether the warming is due to AGW, as it’s virtually certain that AGW has contributed to it. The reasonable question to ask is, what can we learn about the strength of AGW. Root cause analysis is not the right tool for that.”
“Unexpected” was not my word, and if you follow it back up this page, it shows a good example of how threads get lost in comment streams. I posed the problem a certain way and then addressed it the way I posed it, based upon first principles and using clear logic and structure. The assumption that you and Mosher both begin with, that the modern warming is a mix of causes, has zero basis in established fact. It comes entirely from expert opinion, which you might notice did not make the evidence hierarchy at all. Steven Jay Gould borrowed the term “just so stories” from Rudyard Kipling to describe the presentation of entirely unfounded assertions as scientific fact. If you want to meaningfully challenge my approach, and there are indeed ways to do so, you need to first wean yourself from unfounded assertions so that you can at least establish some sort of foundation to build upon. You have essentially sliced your sword through the Gordian Knot, and now lying at your feet you have two knots you cannot untie. Your post, and those from Mosher as well, basically consist of “See? There are two knots!” Why don’t you step back and see if you can contribute to untying the knot?
Compared to this boring and tedious procedure, I find the IPCC approach refreshingly streamlined and efficient:
Start with point 3 – assemble a body of carefully vetted experts. The declare that an excursion has occurred (satisfying point 1) and select carefully vetted data to support that position (point 2).
Replace points 4 to 8 with declarations and a democratic vote of experts. Not only does it confirm a root cause, but it yields an additional benefit of a confidence level: when 29 out of 30 experts vote that the “global warming” is “catastrophic anthropogenic”, they have reached that conclusion on a 97% confidence level.
Yes, basic rigor would seem pesky to those trying to rush through an ideologically-motivated initiative.
Works nicely if the SME’s paymaster doesn’t have a vested interest in which particular conclusion they arrive at.
Which clearly is not the case here. Climate science SMEs are state-funded, and the state stands to greatly expand its empire on the back of a CAGW conclusion.
Strong and blatantly obvious evidence that this funding and impetus from politics is indeed a factor corrupting mainstream climate science, is provided by the deafening silence of almost all SMEs in response to Climategate, and the official self-exoneration coverups of it run by their minders.
Reblogged this on I Didn't Ask To Be a Blog.
Claim 1: The climate system is stable, in a dynamic way.
Claim 2: There is nothing humans can do to change this. There is no tipping-point.
Claim 3: The climate system is self-regulating, it remains in a certain range, although the regulation is not perfect and the set point may vary.
Claim 4: There are multiple negative feedback systems, so even if one forcing is changed, the effect may not be as expected because other feedbacks partially compensate.
In short, the climate is wicked, it takes more than a rain-dance to change it. It takes more than a root cause analysis to figure it out.
Matt Skaggs
Excellent Article.
Thank you
Matt,
The sectin headed ‘Looking for a Unique Signature’ should say “Possible Unique Signature”
some sceptics would respond “Not Necessarily” because insufficient is understood about clouds and water vapour.
Pingback: Whether or not Global warming will be large or small I have a big problem anyway | TryingToUnderstandItAll
Pingback: IPCC claimed “certainty” but it is clearly provable that 10 years later certainty is still not the case | TryingToUnderstandItAll
Pingback: Is climate science a “science?” | TryingToUnderstandItAll
Getting into the weeds like this just makes it clearer how many prerequisites to adequate attribution have been glossed over or disregarded. Not just misdirected effort, but incompetent effort.
Pingback: You Ought to Have a Look: National Landmarks, Copious Food, Fingerprints, and Satellites | Healthy Lifestyle 101
Reblogged this on Truth, Lies and In Between and commented:
Good look at root cause analysis and applying it to modern warming…