
by Judith Curry
Central to arguments related to the hiatus and the ‘missing heat’ is the assertion that unusual amounts of heat are being stored in the deep ocean, and that this heat will eventually reappear at the surface. Exactly how good is the ocean heat content data on which this argument is based?
At the time of the AR4 (2007), our view of ocean heat content is reflected by Figure 5.1 from the AR4:
 Figure 5.1. Time series of global annual ocean heat content (1022 J) for the 0 to 700 m layer. The black curve is updated from Levitus et al. (2005a), with the shading representing the 90% confidence interval. The red and green curves are updates of the analyses by Ishii et al. (2006) and Willis et al. (2004, over 0 to 750 m) respectively, with the error bars denoting the 90% confidence interval. The black and red curves denote the deviation from the 1961 to 1990 average and the shorter green curve denotes the deviation from the average of the black curve for the period 1993 to 2003.
The equivalent figure from the AR5 is shown below:
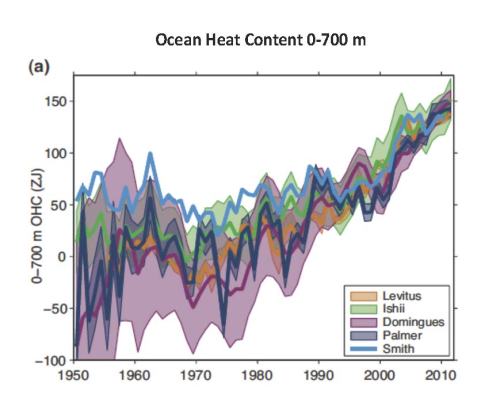
Figure 3.2: a) Observation-based estimates of annual global mean upper (0–700 m) ocean heat content in ZJ (1 ZJ =1021 Joules) updated from (see legend): (Levitus et al., 2012), (Ishii and Kimoto, 2009), (Domingues et al., 2008), (Palmer et al., 2007), and (Smith and Murphy, 2007). Uncertainties are shaded, and plotted as published (at the one standard error level, except one standard deviation for Levitus, with no uncertainties provided for Smith). Estimates are shifted to align for 2006–2010, five years that are well measured by Argo, and then plotted relative to the resulting mean of all curves for 1971, the starting year for trend calculations.
The larger uncertainty in 1990 is not surprising, but I am surprised by the markedly different trends for the past decade, since 2003. Some climatologies show no trend since 2003, whereas others show continued warming.
Note, in comparing the figures from AR4 with AR5, multiply the AR4 OHC values by 10 to have the same units. Also the two figures use a different baseline period for the anomalies. There are some striking differences between these two figures, even if you only focus on the curves from Levitus and Ishii (which are common to both figures). The most striking thing is the much greater uncertainty represented by a larger number of data sets in the AR5 collection. Also the different data sets are estimating the uncertainties in different ways, as reflected by the much different width of the shaded uncertainties. The second thing that struck me about the comparison is that the substantial ‘bump’ that peaked circa 1980 in the AR4 data sets has disappeared in all of the AR5 data sets. It seems that there is a great deal of uncertainty in calibration of the XBT measurements during the 1970’s and 1980’s.
A new paper in press at J. Climate by Lyman and Johnson [link] provides a good overview of the uncertainties in the OHC data, and examines the impact of different choices on assumptions made about missing data.
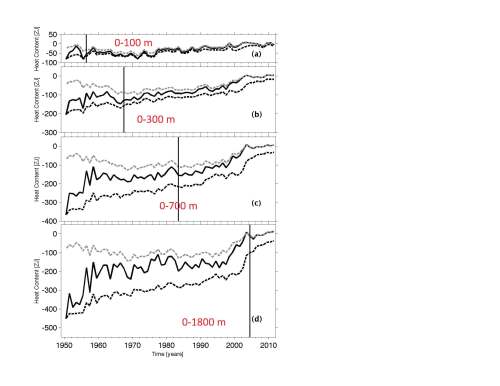 FIG. 4. Time series of annual average global integrals of upper ocean heat content anomaly (1021 J, or ZJ) for (a) 0–100 m, (b) 0–300 m, (c) 0–700 m, and (d) 0–1800 m. Time series are shown using ZIF estimates relative to both ClimArgo (dashed grey lines) and Clim1950 (dashed black lines). Time series are also shown using REP estimate (black solid lines), which are not affected by shifts in the mean climatology (B11). Thin vertical lines denote when the coverage (Fig. 3) reaches 50% for (a) 0–100 m, (b) 100– 300 m, (c) 300–700 m, and (d) 900–1800 m.
The authors regard the REP values as the best ones. The vertical bar in Fig 4 above denotes when the coverage reaches 50%. Note that for measurements to 700 m, 50% coverage was reached in 1984. The three different curves represent 3 climatologies based on different assumptions about under sampled or unsampled regions of the ocean. The two main features that strike me in Fig 4 is the sharp increase from 1995-2003, and then the flat trend since 2003. Also the sharp increase is more evident in the whole layer 0-1800 m than in the shallow layers near the surface, but note that 50% coverage was achieved for the layer 900-1800 m only since 2005.
This figure from AR5 provides additional perspective on the data sampling:
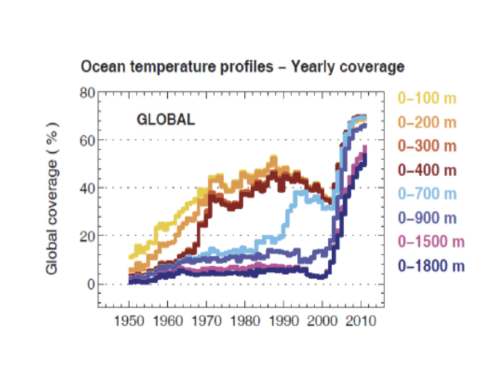 Figure 3.A.2: (top) Percentage of global coverage of ocean temperature profiles as a function of depth in one degree latitude by one degree longitude by one-year bins (top panel) shown versus time
There are very limited observations of the ocean deeper than 2000 m. The IPCC AR5 provides the following figure:
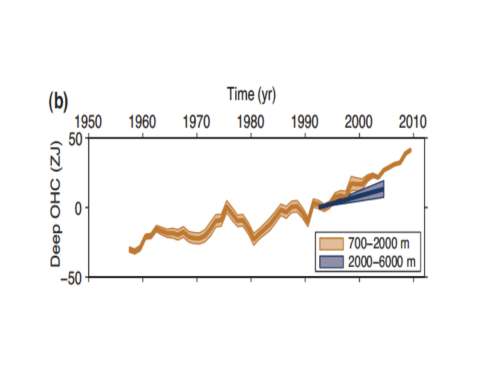 Figure 3.2: b) Observation-based estimates of annual five-year running mean global mean mid-depth (700–2000 m) ocean heat content in ZJ (Levitus et al., 2012) and the deep (2000 – 6000 m) global ocean heat content trend from 1992–2005 (Purkey and Johnson, 2010), both with one standard error uncertainties shaded (see legend).
Well, the error bars in Figure 3.2b seem rather skimpy, but the OHC increase in the deep ocean (below 2000 m) seems pretty small.
Reanalysis versus observations
So exactly where does the argument come from that the deep ocean is sequestering the ‘missing heat’? It seems to come from the Balmaseda et al paper that is based on ocean reanalysis (this paper was discussed here at Climate Etc.). The main figure of interest:
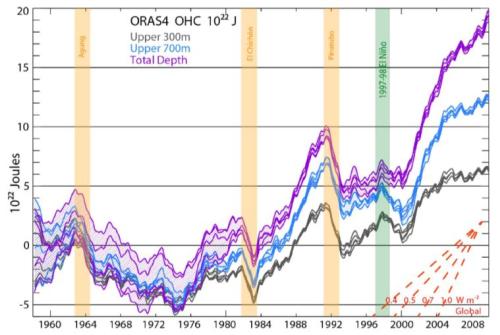
Figure 1: Ocean Heat Content from 0 to 300 meters (grey), 700 m (blue), and total depth (violet) from ORAS4, as represented by its 5 ensemble members. The time series show monthly anomalies smoothed with a 12-month running mean, with respect to the 1958–1965 base period. Hatching extends over the range of the ensemble members and hence the spread gives a measure of the uncertainty as represented by ORAS4 (which does not cover all sources of uncertainty). The vertical colored bars indicate a two year interval following the volcanic eruptions with a 6 month lead (owing to the 12-month running mean), and the 1997–98 El Niño event again with 6 months on either side. On lower right, the linear slope for a set of global heating rates (W/m2) is given.
Now, the theoretical advantage of ocean data assimilation is that it ‘fills in’ unsampled regions using the model dynamics and thermodynamics. Lets compare the Balmaseda et al. reanalysis with the observational climatologies. Focus first on the 0-700 curves, and compare with the corresponding figures in the AR5 and Lyman & Johnson. Balmaseda et al. shows a large increase from 1983-1992 (between the two volcanoes), whereas most of the observational climatologies show little trend during this period and none show a large trend during this entire period. The strong warming trend shown by the observations during the period 1995-2003 followed by weaker trend since 2003, contrasts with Balmaseda that shows no trend between 1992 and 2000, and then a strong warming trend since 2000.
The most surprising thing about the Balmaseda analysis is that the warming increases with increasing depth (largest warming for the 0-7000 m layer). In comparing Balmaseda with the other figures, pay attention to the different scaling for the OHC. But the bottom line is that there does not seem to be any observational support for this large sequestration of heat in the deep ocean that is shown by the reanalysis.
Regional variations
To gain further insights into ocean heat sequestration, it is useful to look at the regional variations of OHC anomalies. A presentation by Levitus provides some regional analyses of trends over the period 1955-2010. Which is useful, but I am particularly interested in the trends since 2000 (the period of the large sequestration as per the reanalysis), and I haven’t come across any publications on this (does anyone have some references?). Bob Tisdale provides this plot:
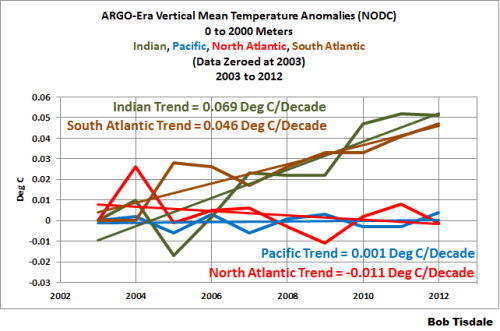
Warming trends (0-2000 m) are seen in the Indian Ocean and the South Atlantic, with slight cooling trends in the Pacific and North Atlantic. Now it seems difficult to me to cook up an explanation for this regional variation in trends that relies on external forcing, although I suspect that someone will think of some rationale for aerosol/black carbon forcing to explain this. This most likely reflects natural internal variability. It doesn’t look like an AGW signal to me. More regional analyses for the past decade would be very helpful in trying to sort this out.
Sea level rise
It is very difficult to sort out the causes of OHC variability owing to the short time record. Some further insights into longer term OHC variability can be inferred from this figure from the AR5 on rates of sea level rise:
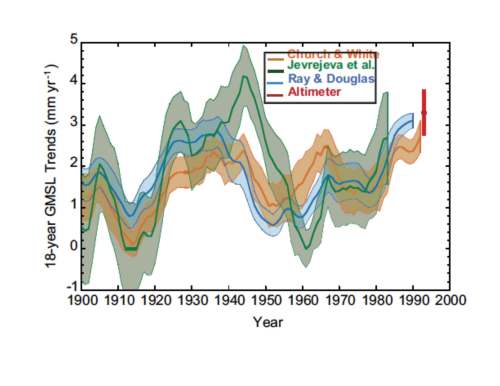 Figure 3.14: 18-year trends of GMSL rise estimated at 1-year intervals. The time is the start date of the 18-year period, and the shading represents the 90% confidence. The estimate from satellite altimetry is also given, with the 90% confidence given as an error bar. Uncertainty is estimated by the variance of the residuals about the fit, and accounts for serial correlation in the residuals as quantified by the lag-1 autocorrelation.
Note the high values in the early part of the century, nearly as high or as high as the value for the last two decades. Now there are other factors that contribute to sea level rise changes; from the AR5 chapter 3 (a table included in my recent testimony):
- AR5 (1993-2010)
- Thermal expansion 1.1
- Glaciers and ice caps 0.76
- Greenland ice sheet 0.33
- Antarctic ice sheet 0.27
- Land water storage 0.38
- Sum 2.8
- Observed sea level rise 3.2
OHC changes (thermal expansion) accounts for about 1/3 of the total sea level rise. What did this balance look like circa 1930’s to 1950’s? Presumably the land water storage and glacier melt was smaller, so the thermal expansion was more dominant in this early period. Which suggests that ocean heat content was greater in this early period than in the current period, and cannot be attributed to AGW.
JC summary
Roger Pielke Sr. has often stated that ocean heat content is a much better metric for climate change than surface temperature. I don’t prefer one over the other as an intrinsic metric (they provide two different pieces of information), but I find the ocean heat content data to be a much less mature data set than the surface temperature data set. The sampling particularly of the mid to deep ocean is very sparse prior to 2000. And the oceanographic community is still debating the calibration of MBT and XBT profiles. There is substantial disagreement among the various OHC climatologies, and there are no OHC climatologies prior to 1950. Global sea level trend data suggests substantial thermal expansion in the earlier part of the 20th century, which is an issue that seems insufficiently explored.
Ocean reanalyses can potentially provide new insights into global OHC variations, but ocean reanalysis is in its infancy.
The main issue of interest is to what extent can ocean heat sequestration explain the hiatus since 1998. The only data set that appears to provide support for ocean sequestration is the ocean reanalysis, with the Palmer and Domingues 0-700 m OHC climatology providing support for continued warming in the upper ocean.
All in all, I don’t see a very convincing case for deep ocean sequestration of heat. And even if the heat from surface heating of the ocean did make it into the deep ocean, presumably the only way for this to happen involves mixing (rather than adiabatic processes), so it is very difficult to imagine how this heat could reappear at the surface in light of the 2nd law of thermodynamics.

I wonder where the major mixing takes place, and how much variation there is in it, and what drives it?
For instance, if over 50% of actual downwards heat transport takes place in the West Pacific/Southern Indian Ocean(s), could differences in tropical cyclonic activity be driving the major differences in heat flow? Is there somewhere the relative rates (of downwards heat transport) are available?
All changes in subsiding and upwelling currents as well as mixing not directly related to those currents affect the net energy balance of the oceans. For that reason it may be difficult to pinpoint the actual mechanism even if something significant is going on.
I would not put very much weight on ideas where the deviations of the net heat flux from the average would be related to something describable as the same extra heat coming up that went down. To me it’s much more natural to think that there are periods during which the deviation adds heat to the oceans and cools the atmosphere and other periods of the opposite sign. That would affect the heat balances in the same way without the problems discussed by Curry in that excerpt.
Such uncertainties have become an invitation for data manipulation:
http://stevengoddard.wordpress.com/2014/01/21/giss-head-unfamiliar-with-his-own-data/
Judith –
That is an interesting statement for you to make, considering that just the other day you testified before Congress and focused on “the hiatus in warming” without discussing the uncertainty related to OHC.
What could explain why you gave testimony on a topic without discussing something that you describe as “central” to that topic?
Would doing something like that fit your definition of “advocacy?”
My senate testimony did not discuss reasons for the hiatus, but rather the weakening of the case Ar5 vs AR4. Note my testimony last april discussed the reasons for the hiatus
Joshua misinterprets and conflates. “Central to arguments related to the hiatus and the ‘missing heat’…” is a different discussion to the one put to Congress focused on “the hiatus in warming”. The former is a discussion on arguments regarding a possible causal link between the hiatus and ocean heat. The latter is pointing out the hiatus (as Dr. Curry notes upthread, without discussing reasons). Hardly, advocacy – rather a scientific observation.
BTW, the hiatus has recently, yet again, been confirmed by the alarmist camp: http://www.thegwpf.org/nasa-noaa-confirm-global-temperature-standstill-continues/ . Note: hiatus is a misnomer which reframes the discussion in favour of CAGW. Warming has stopped, not paused. If warming restarts then we might reframe the discussion accordingly, but calling the present cessation in surface warming a hiatus is assuming that future warming will resume. It may not.
The poor little guy thought that he had come up with a brilliant ‘gotcha’ question. Let’s see how long he sulks over this self inflicted faceplant.
Perhaps Judith ought have said, “Central to the arguments [coming from The Team] related to … [Until they have a better data and/or understanding of the “transfer” and “reappearance” of deep ocean heat transference, this seems life more hopeful conjecture than science.”
In other words, “central” to “their” explanation, not her own.
“Let’s see how long he sulks over this self inflicted faceplant.”
Of course it takes a lot to embarrass him, but he’s not immune to the humiliation of some of his more spectacular own goals…after which he can disappear for a day or three. Here’s hoping.
poker,
It’s pathetic that the little one waited so long for Judith to take notice of one of his smarmy attacks, only to be humiliated like this. I wonder what he was thinking. What could Judith have been advocating by NOT mentioning this at the Senate hearing?
D.M.
After long observation, some of it literally nausea inducing, it’s likely nothing more complicated than a desperate need for attention, especially from a woman of substance, which is to say the kind of woman who’d have nothing to do with him in real life.
That’s about the gist of it, poker. I hope Mosher doesn’t see this. He won’t be as humane to joshie, as we have been.
Well, yes. And hence my criticism of your testimony. You spoke about the “hiatus in global warming” as if in and of itself supports a conclusion about the sensitivity of the climate to ACO2, yet didn’t discuss related uncertainties. Don’t you think that climate scientists should foreground uncertainty related to the phenomena they discuss.
That said:
and
Joshua’s motivated reasoning on display.
you see Joshua must find something wrong with what judith said. To do this he has to ignore prior testimony, and misconstrue the text.
It’s far easier to attck Judith on the science, but Joshua doesnt know the science, so he plays the only game he knows. He cannot help himself.
I am with you on this one, joshie. Judith should have mentioned that the lame pause excuse #47- “missing heat is hiding in the deep ocean abysses”-is just contrived climate alarmist Team BS. But I still don’t know what she was advocating by NOT mentioning it. Whose side is she on, joshie?
BTW, steven –
Interesting to see that you defend Judith against “claims” that people said she made even though they never said that she made them.
Basically, Joshua’s complaint about the free ice cream Dr. Curry scoops out for everyone is that he had to wait a couple days to get his favorite flavor. Now he demands it served with warm chocolate chip cookies.
I think someone needs a diaper change.
curryja | January 21, 2014 at 5:16 pm |
My senate testimony did not discuss reasons for the hiatus, but rather the weakening of the case Ar5 vs AR4. Note my testimony last april discussed the reasons for the hiatus
—
Indeed – and denizens should know how important it is to be precise, shouldn’t they? And how badly some would complain should you answer a question no-one asked at such a venue.
Josh, wouldn’t you agree?
Oh, wait…
Joshy, why don’t you go over to Think Progress and sojourn with Mr. Objective Scientist himself, Tamino. You may find it more to your liking there, than here
Joshua.
I’m not defending Judith. I’m attacking you. There is a difference. To see it you have to drop your motivated reasoning. Can you?
I think Tamino’s post is better than anything Joshie does.
he might go over there and see where I say that Tamino’s critcism is a good post. So much for Joshie’s belief that I am any kind of white knight. you see
he has to believe that I am a white knight. Why? because then he can ignore the criticism I make about his “criticism” of Judith. Funnily he thinks its about Judith, when its really about him. Which is even funnier since he complains that we always make it about him, even when we dont. When we do make it about him, he thinks its about being a white night.
I’ve never seen anyone so catagorically un self aware. except perhaps kim, who is un self aware in a good way.
All Joshua has to do is make one argument about the science. not the person, not the presentation, but the actual science.
I’ve never seen anyone so catagorically un self aware. except perhaps kim, who is un self aware in a good way.
___________
Not even Max_OK?
The Tamino post is very telling. This is as much about dividing up the rice bowl as much as anything else.
First, everyone should step back and realize that they are arguing over a perturbation. These perturbations in the sun’s output and the tidal pull won’t make any difference in the long term trend relative to what CO2 is capable of.
So let these orbital skeptics evaluate the cyclic content of the waveforms. They are doing us a service in ruling out the possibility of exactly what they want to see — that is a big cycle that emerges like a tsunami and takes over the temperature record. That won’t happen
Tamino himself doesn’t do cycles but he does do fits of temperature time series. I am doing a similar task. Adding a few more factors than Tamino had.
Willis would hate it because it works. Tamino might not like it because I entered his rice bowl. The orbital skeptics clearly don’t like it because it differs from where they want to take the results. I like it because it advances the science independent of any kind of underlying agenda..
k scott denison | January 22, 2014 at 5:27 pm |
I’ve never seen anyone so catagorically un self aware. except perhaps kim, who is un self aware in a good way.
___________
Not even Max_OK?
______________
The mirror test is the best way to determine self-awareness. If you look in a mirror and recognize what you see is you, then you are self-aware. If you like the way you look, the mirror test is no problem. Max_OK consistently passes the test. If you are, however, butt ugly like kim, you may deny the imagine in the mirror is you or even break the glass. If you see nothing when you look in a mirror, you are a vampire.
Thanks, guys –
For once again, illustrating so beautifully the selectivity in Judith’s approach to these debates, in this case specifically her selectivity in moderating out comments containing no content, and only attacks.
Do you ever tire of making my points for me?
Your little obsessive crusade to discredit Judith is pathetic, joshie. Don’t you have anything more productive to do? Check yourself.
From NOAA. “The ocean covers 71 percent of the Earth’s surface and contains 97 percent of the planet’s water, yet more than 95 percent of the underwater world remains unexplored. The ocean and lakes play an integral role in many of the Earth’s systems including climate and weather.”
http://www.noaa.gov/ocean.html
We began upper air observations in the 1930s because of aviation, yet we have just begun to observe the oceans in three dimensions.
I’ll be on the Oregon coast Thursday watching and listening to what the ocean has to say. The ridge continues and the weather will be better there Thursday than in July!
Very interesting and important post! Started a similar Question on Researchgate. But eventhough some heavy artillery (from NOAA among others) was aimed at my proposal of a too high ciimate sensitivity in the current models, nobody could show convincingly that “missing heat” has gone into the ocean.
https://www.researchgate.net/post/Is_the_missing_heat_really_down_in_the_ocean_or_should_the_climate_sensitivity_be_downgraded.
You briefly mention a change in cloud cover, can we expect a post on this soon? Some diagrams on cloud cover looks like inverse temperature curves! Why the cloud cover should show a trend is still a mystery though. Could that be the positive feedback the AGW-supporters are looking for or is it a natural cycle like the ocean oscillations? Interesting times ahead…
“. The ocean is not heated by conduction, when added DWIR leads to its warming.”
Not sure what this sentence is supposed to mean.
Anyway, it seems like “global brightening” and variations in cloud cover has more to do with any ocean heating than the direct greenhouse effect, which is why I question whether the “missing heat” is really there.
“it is very difficult to imagine how this heat could reappear at the surface in light of the 2nd law of thermodynamics.”
Amen.
The worlds oceans have warmed only 0.09C over the past 55 years [Levitus et al 2012], which could only warm the atmosphere by a maximum of an additional 0.09C due to both the 1st and 2nd laws of thermodynamics.
http://hockeyschtick.blogspot.com/2013/10/new-paper-finds-pacific-ocean-has-been.html
http://hockeyschtick.blogspot.com/search?q=0.09C
Well the heat reappears by virtue of there still being an imbalance. The major difference between an Earth with oceans still gaining heat, and an Earth where the oceans are not gaining heat, is that the first one has a substantial energy imbalance – which is probably growing as GHGs increase. The Earth’s surface, where we live, will inevitably have to heat up to close that gap. So if the heat is being sequestered in the deep it will indeed “come back to haunt us”, or rather it’s cousin at the surface will.
lolwot-
Like I said, “The worlds oceans have warmed only 0.09C over the past 55 years [Levitus et al 2012], which could only warm the atmosphere by a maximum of an additional 0.09C due to both the 1st and 2nd laws of thermodynamics.”
If you truly feel haunted by 0.09C warming, then perhaps it’s time for meds.
In addition, increased LWIR from increased GHGs cannot warm the oceans.
http://hockeyschtick.blogspot.com/2012/09/realclimate-admits-doubling-co2-could.html
And there has been no statistically significant surface warming for the past 20 years
http://hockeyschtick.blogspot.com/2013/08/new-paper-finds-climate-models-have.html
Ergo, GHGs and global surface warming have not warmed the oceans.
So what did warm the oceans?
Solar shortwave that can penetrate up to 100 m to warm the bulk of the oceans, amplified by the well known “global brightening” decrease in albedo in the latter 20th century.
“increased LWIR from increased GHGs cannot warm the oceans.”
Yes it can.
Simple thought experiment to demonstrate this: Remove all the greenhouse gases from the atmosphere, the oceans would freeze over.
Not true, planetary surface temperatures on Earth and other planets can be fully explained by the adiabatic lapse rate + solar insolation alone, no IR active gases required, only equivalent atmospheric pressure + solar insolation. Changes in CO2 near present levels play a trivial role, and that trivial role continues to logarithmically decline.
Even RealClimate admits increased CO2 cannot significantly warm the oceans.
http://hockeyschtick.blogspot.com/2012/09/realclimate-admits-doubling-co2-could.html
Lollie, is there some rule of physics that says the frigid depths of the oceans are supposed to share what little warmth they have with the relatively toasty atmosphere? What makes you think that a miniscule temperature change in the shivering ocean depths is going to jump out and burn us up? Maybe the balance isn’t what you want us to believe it is. The oceans have a lot of catching up to do, lollie. What you have amounts to a variation of the Chicken Little story, lollie.
Sorry, no greenhouse gases, no lapse rate, adiabatic or other flavors.
“Sorry, no greenhouse gases, no lapse rate, adiabatic or other flavors.”
You are claiming an atmosphere comprised of non-GHGs could not have a lapse rate, that non-IR-active gases aren’t affected by gravity [pressure] and have no temperature or heat capacity.
Hilarious
The dry adiabatic lapse rate is defined by –g/Cp, (g is gravity, Cp heat capacity of air). Presence of condensation processes/water vapor does change the lapse rate to the wet adiabatic, but changes in CO2 have a trivial effect on the wet or dry adiabatic lapse rate, and the dry adiabatic lapse rate exists even without the primary GHG water vapor.
Um, no it’s not, start here, there are some excellent links at the bottom, where one may find that the lapse rate can be predicted based solely on the atmospheric content, ie the presence of greenhouse gases.
http://en.wikipedia.org/wiki/Lapse_rate
“Robert H. Essenhigh developed a comprehensive thermodynamic model of the lapse rate based on the Schuster-Schwarzschild integral (S-S) Equations of Transfer that govern radiation through the atmosphere including absorption and radiation by greenhouse gases”
Were I a young Ph.D. student in climate science I would find out where the data that went into the Emagram diagrams of, both dry and moist adiabats, pressure and temperature, in the 1880’s and revisit the locals, armed with modern instruments. It should be possible to directly measure the direct effect of CO2 from 280 to 400 ppm by redoing the measurements.
You wouldn’t have a bright future in the climate science, Doc. The young climate science wannabes of today are dreaming of novel and slightly plausible ways to fabricate hockeysticks, thinking up remote places for heat to hide, and looking forward to being rewarded with gubmint grants, fame, and all expense paid junkets to Cancun, Bali, and other exotic destinations.
bob droege | January 21, 2014 at 9:08 pm |
“Um, no it’s not, start here, there are some excellent links at the bottom, where one may find that the lapse rate can be predicted based solely on the atmospheric content, ie the presence of greenhouse gases.”
http://en.wikipedia.org/wiki/Lapse_rate
————————————————————————
Bob, nothing whatsoever in that article suggests GHGs are responsible for the lapse rate. In fact just the opposite.
Dig it. The dry adiabatic lapse rate is 10C/kilometer. The saturated adiabatic lapse rate is 5C/kilometer. Water vapor is a greenhouse. The more of it in the atmosphere the lower the lapse rate.
Just when I think you might actually have a lick of sense you go and produce something totally boneheaded like GHGs cause a lapse rate.
Re Hockey Schtick’s post January 21, 2014 at 4:33 pm | Reply
“it is very difficult to imagine how this heat could reappear at the surface in light of the 2nd law of thermodynamics.”
Amen.
_____________
I know more about lakes than oceans. In summer lake water warms from the top down and in winter cools from the top down. Ice that forms on the lake’s surface can partially melt from the bottom up, but I don’t understand how a bottom-up warming influence violates the 2nd law of thermodynamics.
lolwat “Simple thought experiment to demonstrate this: Remove all the greenhouse gases from the atmosphere, the oceans would freeze over.”
Actually the sun would heat the water which would put the greenhouse gas water back into the air. Your experiment is theoretical, impractical and in point of fact physically impossible
Maxie
Teh surface layer of the ocean heats up a lot from the sun. The warm upper layer gradually leaks heat into the cold abyss. The abyss has ten times the volume of the warm surface. Therefore the temperature anomaly is 10 times smaller. Think of the opposite situation when you put an ice cube into a cup of coffee. There is a large temperature gradient at the beginning but as the cube melts energy diffuses through the much larger volume of coffee. The ice cube warms up by maybe a hundred degrees F but the coffee only cools by maybe 10 degrees because the volume of the cold ice cube is small compared to the volume of the hot coffee.
So now have our heat more or less evenly diffused in the cup. Under what circumstance can the ice cube reform spontaneously? The short answer is it cannot. Heat goes from warmer to colder spontaneously. That’s the 2nd Law of Thermodynamics making a one-way road from warmer to colder. To go from colder to warmer requires the input of work. This is why we can extract work from large temperature gradients (such as the difference in temperature between dry steam and ambient air that makes steam engines do what they do. In order to move heat from colder to warmer you need a heat pump which is probably best known as what makes refrigerators and air conditioners do their job. They need a motor to provide the motive force to move heat in a direction opposite to what happens spontaneously.
So what Curry and Gavin and me all said right away was that once the more concentrated heat (higher temperature) in the upper 10% of the ocean diffuses down into the bulk of the ocean (causing a much smaller temperature rise) there is no way it can ever become concentrated in the surface layer again. That energy no longer has the capacity for rapid surface warming. It’s still in the system, true, but it can only raise atmosphere temperature by a small amount for a very long time instead of a large amount for a short time.
Not understanding basic thermodynamic principles makes it pretty much impossible for you to do anything other than parrot your favorite warmists and if you try making supportive arguments on your own they’ll appear ridiculous. I suggest you take an introductory course in physics and work hard enough to get a passing grade. It’s clear you haven’t done that. This is stuff you should have learned in high school if you passed four years of science classes from grades 9 – 12. I’m not sure which year covers basic thermodynamics but I know you can’t approach 11th grade chemistry without it. Presumably it’s in 9th grade earth science.
“Teh surface layer of the ocean heats up a lot from the sun”
The process by which EGHG heat the ocean is very slow. It exists, but it is very slow:
http://www.realclimate.org/index.php/archives/2006/09/why-greenhouse-gases-heat-the-ocean/
In fact, IR tends to heat the first few microns of the ocean surface, thereby insulating the ocean from heating by conduction.
Noooooooo. SW absorbs top 10m almost evenly the. Deninishs exponentially, but if you put on your diving gear you can still see things at 60m on a clear day.
Tim,
You have misunderstood what’s going on.
The input of heat to the oceans is always almost totally from solar SW. At the surface the heat flux is from the ocean skin to the atmosphere, and before that from the rest of the atmosphere to the skin. That process can be slowed down by heating the skin by IR, and that what’s actually going on.
There’s no need for the very slow downwards heat flux, because such a heat flux is almost never present anyway. The ocean is not heated by conduction, when added DWIR leads to its warming.
Hockey Schtick | January 21, 2014 at 5:01 pm |
There remains a misunderstanding of the atmospheric GHG effect, especially the effect of the contribution of downward long wave radiation to water. The oceans absorb solar energy to significant depths (10’s of m and more), and radiate LWIR from a thin layer at the surface (microns). They also also lose energy to the atmosphere by evaporation and conduction/convection. The presence of GHG (and clouds and aerosols) causes some LWIR radiation to travel down to the surface. The downward LWIR does not heat the oceans by adding net energy (by the definition of the second law of thermo). What it does is reduce the net amount of radiation from the surface, acting like a radiation partial insulation effect. The lower net upward radiation results in the water warming, since the absorbed solar radiation has not decreased. The water adjusts to a new temperature by increasing evaporation, and conduction/convection until a new average balance is obtained. Until you understand the actual physical process involved, looking at just the size of LWIR is misleading.
So Leonard Weinstein, are you in agreement with Peter Minnett that additional atmospheric CO2 will further slow the loss of SW warming of the oceans from the skin layer to the atmosphere?
Hockey Schtick | January 21, 2014 at 5:32 pm |
“Not true, planetary surface temperatures on Earth and other planets can be fully explained by the adiabatic lapse rate + solar insolation alone, no IR active gases required, only equivalent atmospheric pressure + solar insolation.”
The effect of non-active IR gases would still have an adiabatic lapse rate. However, this is a GRADIENT, not a level of temperature. If there were no absorbing gases, the equilibrium of solar and LWIR would occur at the surface, and the Earth would be about 33C colder than it is (assuming same albedo). The effect of the GHE is to move the average location of outgoing radiation to space up from the surface, and the equilibrium of solar input and radiation to space occurs at this average altitude. This determines the level of temperature along the lapse rate. Small increases in CO2 could cause small increases in temperature by slightly raising the average altitude of outgoing radiation, but it appears negative feedback from cloud variation reduces even this small effect.
All absorption and emission of LWIR occurs in top 0.1 mm of water. The net is always on the side of emission, i.e. water is always cooled by LWIR.
Half of solar radiation is absorbed in top 20 cm while 10% penetrates more than 50m in pure water.
Source please
The strong drop of temperature with altitude requires cooling of the upper troposphere by emission of IR from GHGs. Without that cooling the atmosphere would be stratified and we would not have the present lapse rate. It’s not true that the lapse rate can be understood without GHGs.
The actual numbers on penetration are from my own Excel spreadsheet. The data used for absorption if IR in liquid water is from links found at Jonasz M. 2006. Absorption coefficient of water: Data sources. In: Top. Part. Disp. Sci. (www.tpdsci.com).. In addtion I have used spectra of solar radiation at the surface from ASTM G173-03 Reference Spectra Derived from SMARTS v. 2.9.2.
JCH | January 22, 2014 at 9:35 am |
“So Leonard Weinstein, are you in agreement with Peter Minnett that additional atmospheric CO2 will further slow the loss of SW warming of the oceans from the skin layer to the atmosphere?”
Your question is poorly posed. SW is incoming solar energy absorbed at depth in the ocean and fixed. LWIR plus evaporation plus conduction/convection are the removal of this energy except for possible long term storage at depth. Added CO2 is an atmospheric greenhouse gas (LWIR absorbing/radiating), and slows the NET LWIR radiated up, resulting in a readjustment in all energy removal terms to a higher temperature. However, the actual magnitude of the effect depends on many other factors such as cloud change during readjustment. What is your point?
Pekka said, ” … while 10% penetrates more than 50m in pure water.”
That is one of the more interesting variables. Biological and erosion are linked due to nutrients which can change the average depth of absorption of about 30% of the SW. That could be a large impact and is not regularly discussed.
David Springer | January 21, 2014 at 11:34 pm |
“Dig it. The dry adiabatic lapse rate is 10C/kilometer. The saturated adiabatic lapse rate is 5C/kilometer. Water vapor is a greenhouse. The more of it in the atmosphere the lower the lapse rate.”
David, you are correct that the lapse rate is not due to the greenhouse gas presence. However, the large difference in dry vs wet lapse rate is not due to the presence of water vapor changing the average Cp, but instead due to the progressive condensation of vapor to liquid or solid at altitude (heat of condensation being released). The quantity of water vapor and CO2 are all small enough so that the average Cp is not changed.
My point:
Added CO2 is an atmospheric greenhouse gas (LWIR absorbing/radiating), and slows the NET LWIR radiated up, resulting in a readjustment in all energy removal terms to a higher temperature. …
I think Peter Minnett is aware of:
However, the actual magnitude of the effect depends on many other factors such as cloud change during readjustment. …
The numerical value of the adiabatic lapse rate is not dependent of GHGs, but the appearance of a lapse rate near to the adiabatic in the atmosphere is dependent on GHGs. Thermodynamics determines the upper limit for the lapse rate, GHE is the basis for reaching that upper limit. Thermodynamics allows equally well for any lower value making stratified atmospheres of lesser laps rate stable against convection.
Pekka Pirilä | January 22, 2014 at 7:45 am |
“At the surface the heat flux is from the ocean skin to the atmosphere, and before that from the rest of the atmosphere to the skin. That process can be slowed down by heating the skin by IR, and that what’s actually going on.”
You and others take it as an article of faith that evaporation happening in the first few microns of ocean surface somehow retards heat loss from the bulk of the ocean below it. I need some experimental confirmation of that and cannot find any. You’d think something so critical as the cool skin layer retarding ocean heat loss would have some exacting measurements from experimental science. I guess that’s too much to ask from warmists that they test their assumptions.
How could I imagine that one of the main mechanisms of heat loss retard the heat loss?
Leonard Weinstein | January 22, 2014 at 10:09 am |
“However, the large difference in dry vs wet lapse rate is not due to the presence of water vapor changing the average Cp, but instead due to the progressive condensation of vapor to liquid or solid at altitude (heat of condensation being released). The quantity of water vapor and CO2 are all small enough so that the average Cp is not changed.”
Yes. In the big picture the atmosphere is heated by rain. Latent transport due to moist convection removes heat insensibly from the surface and releases it at whatever level in the atmosphere adiabatic cooling causes the vapor to reach the dewpoint. That’s lapse rate feedback, it’s a negative feedback, and is hasn’t really been measured very well on a global average basis to determine how much GHG forcing at the surface is negated by it. Reanalysis of newer satellite borne instrument data is giving us a better picture and the picture is that there’s more lapse rate feedback than was theoretically anticipated. Probably a great deal more and I think it’s due to mistaken ideas about the physics of DWLIR illuminating the surface of a deep body of water. The bulk actually ends up with less energy due to DWLIR illumination. It’s not intuitive that you can cool things with light but it’s done all the time in experimental quantum physics where lasers are used to cool molecules below what can be achieved by other means. I have wanted to see a mid-IR laser used to illuminate a water surface in a lab and compare the cooling rate to the same setup without the extra mid-IR illumination. Astoundingly there is no experimental confirmation of what happens to temperature when a body of water free to evaporate is illuminated from the top by mid-IR in the 10-12 micrometer range.
Pekka Pirilä | January 22, 2014 at 11:44 am |
“How could I imagine that one of the main mechanisms of heat loss retard the heat loss”
Yeah I can’t imagine how you come to that conclusion either. But unless you agree that DWLIR does not retard heat loss of the ocean bulk then that’s exactly what you’re saying. I’m willing to say that happens in some circumstances such as when the air above the water is saturated and also when breaking waves destroy the cool skin layer but these are exceptions to the rule – RH is seldom 100% over the ocean and the cool skin layer only breaks up in whitewater and reforms in about 10 seconds.
Try to find some experimental evidence of what happens to bulk water temperature when overhead illumination by ~10um radiation is raised and the surface is free to evaporate in response. It doesn’t seem like an exceptionally difficult experiment to conduct but after a year of looking and asking no one has produced a link to an experiment measuring the effect. You’d think a precision measurement would be good data to have but I think what’s happening is no one wants to do it because the results might be the final nail in the CAGW coffin.
Leonard Weinstein
The atmosphere is mostly heated from below. If not by condensing water vapor then by conduction in a dry atmosphere. There’s some warming from above such as ozone absorbing solar UV and water vapor or clouds absorbing solar near-infrared. In fact that even flips lapse rate polarity in the stratosphere and higher. Temperature rise by conduction decreases with distance from the source. An atmosphere with no greenhouse gases will still have a lapse rate and that’s the start and end of any point I wanted to make about lapse rates in this thread.
David,
Your comment is without basis. I have those two views and there’s no contradiction in that.
David,
You make both correct and false statements.
A correct statement is that latent heat transfer is the most important source of warming of the atmosphere (when LWIR is considered based on net values, not gross).
When LWIR is considered based on net values, there’s no heating of ocean by IR, but there’s a reduction in LWIR cooling of the skin with added CO2.
What’s not correct is that there would be a troposphere of the same structure as we have without GHGs. That’s not possible because convection could not be maintained in such an atmosphere. Maintaining convection requires that there’s a heat loss from the upper atmosphere to the space by radiation and that requires GHGs.
Pekka, thank you for your calm, civil, honest and informative contributions to this discussion. You put the rabid know-nothing extremists on both sides to shame.
@Pekka
“What’s not correct is that there would be a troposphere of the same structure as we have without GHGs. That’s not possible because convection could not be maintained in such an atmosphere. Maintaining convection requires that there’s a heat loss from the upper atmosphere to the space by radiation and that requires GHGs.”
Thermal convection doesn’t require GHGs. Granted convection would be greatly diminished without GHGs. The earth’s surface is unevenly heated by the sun both by latitude and by the earth’s rotation. That uneven heating will drive thermal convection regardless of GHGs. The fact that the surface is heated first and in GHG-free atmosphere only conduction from the surface will heat the atmosphere. The air nearest the surface is warmed soonest by conduction and that makes it rise in what’s called thermal convection. No thermodynmically literate person disputes this unless they are being dishonest. Fercrisakes Pekka thermal convection can be observed with the naked eye in deserts and even over tarmac where the surface becomes hugely warmer than the air in contact with it.
Mathematicallly there is no difference between assuming that the surface is heated by IR from above, or that the surface cooling is suppressed.
The heat equation distinguishes hot from cold only in the sense of the sign. Get the same result in either case.
Skeptics tie themselves in knots trying to conceptualize, while those of us that understand the math behind the physics breeze through.
http://en.wikipedia.org/wiki/Thermal
Maybe Pekka should go fix the wickedpedia article so it mentions greenhouse gases as a requirement for thermal convection to take place. Otherwise what I described in regard to convection driven by uneven heating mirrored the accepted encyclpedic wisdom on the topic.
Best of luck to you, Pekka. Maybe ask William Cannoli to help you with that as he’s notoriously successful in getting and keeping disinformation in wickedpedia articles relevant to bandwagon climate science.
David,
Without GHGs the atmosphere can be heated effectively by the surface but not cooled, because heat transfer back to the surface is extremely weak in areas of cold surface and temperature inversion. Thus the atmosphere ends up so warm that even additional heating stops almost completely. Then nothing can maintain convection, and the atmosphere becomes stratified with a smaller temperature gradient and ultimately probably mostly isothermal.
WebHubTelescope (@whut) | January 22, 2014 at 1:17 pm |
“Skeptics tie themselves in knots trying to conceptualize, while those of us that understand the math behind the physics breeze through.”
Blow that breeze where the sun don’t shine and come up with the experimental confirmation I asked for. If it’s so simple and basic then the experiment might have been done in during the golden age of thermodynamics by somebody like Tyndall. Good luck. So far that breeze of yours is nothing but waving of hands in the hot air.
@ Pekka
“Then nothing can maintain convection, and the atmosphere becomes stratified with a smaller temperature gradient and ultimately probably mostly isothermal.”
Is that the language of math and physics in the post-normal world.
ultimately probably mostly
The uncertainty in that is so vast it almost defies description.
I think ultimately probably mostly thermal motions in an unevenly heated fluid gravitationally confined to the surface of a spinning sphere continues regardless of the fluid’s comp0sition.
Try again.
@ Pekka
ultimately probably mostly
I should bookmark that it’s so hilarious but reminding you of that Freudian brainfart in the future seems like Schadenfraude so I will, ultimately probably mostly forget you uttered it.
ROFLMAO
@ Pekka
ultimately probably mostly
Real soon now this google search (five hits for the exact phrase)
https://www.google.com/search?q=%22ultimately+probably+mostly%22&rlz=1T4LENN_enUS461US461&ei=nhHgUo7KHs3ksASO_YGQDw&start=20&sa=N&filter=0
will have a sixth hit. I almost feel sorry for you Pekka but knowing you have no shame this ultimately probably mostly won’t constrain your blurting of nonsense in the future.
David,
I have not done full calculations for an atmosphere without GHGs, and I’m pretty sure nobody else has done that either. Therefore I cannot tell precisely, how much circulation cooling by conduction through the temperature inversion can maintain. I can say for sure only that very little.
What I know for certain is that no analysis that is not specifically be done for an atmosphere without GHGs can tell the answer. None of the standard arguments for the existence of a troposphere even remotely similar with the present one is valid.
It’s true that very little GHGs is enough to produce a troposphere of height rather similar to the present one and with an adiabatic lapse rate, but the circulation in such an atmosphere would be weak, and the atmosphere would be really calm compared to the present one, because the power of the atmospheric heat engine would be very low due to the small heat loss from the cold side.
The ultimate importance of probably being mostly earnest.
===================
David,
The effect of greenhouse gases is to lower the lapse rate.
Did you think I was saying that greenhouse gases increase the lapse rate.
“Pekka Pirilä | January 22, 2014 at 9:50 am |
The strong drop of temperature with altitude requires cooling of the upper troposphere by emission of IR from GHGs. Without that cooling the atmosphere would be stratified and we would not have the present lapse rate. It’s not true that the lapse rate can be understood without GHGs.”
Make sure we are on the same page:-
1)
Wait an minute here. IR from the surface is absorbed by CO2, and it enters an excited state. Typically before it can radiate away the captured energy, it is involved in a collision with a nitrogen, oxygen or water molecule and the energy it had absorbed is shared; thus the IR is thermalized.
Hence upgoing heat, in the form of IR, is thermalized, and this is a property of the density of absorbing species; so as you go up in altitude, the amount of molecules absorbing (CO2 and H2O) drops. So a rise in altitude altitude means less IR (from all directions) is not being thermalized by the air.
2) Are you suggesting that collisions between N2/O2 and CO2 cause CO2 to emit discrete packets of IR?
(Ignore the normal blackbody type IR radiation).
1) IR from the surface is just one form of heat transfer to atmosphere leading to the same outcome as other forms of heat transfer (convection and latent heat transfer). Emission of IR is done by molecules brought to an exited state by collision with another molecule in over 99.99999% of cases.
At high altitude the concentration of H2O drops sharply, but that of CO2 keeping its relative concentration constant. Therefore CO2 is the most important GHG at high altitudes.
2) Yes. Collisions of CO2 molecules with other molecules leads to emission of IR photons.
In the uppermost atmosphere other wavelengths than those in the 15 µm absorption/emission peak of CO2 have little influence (what they have is due to the little H2O and other GHGs present).
Leonard Weinstein | January 22, 2014 at 9:28 am |
The lion’s share of energy loss from the ocean is evaporative. Radiation plays a bit role especially in the tropics where most of the solar energy enters and most of the moist convection happens. This is beyond dispute AFAIC. It’s introductory physical oceanography. Here’s a free source for the one I use nowdays turned to the subchapter:
http://oceanworld.tamu.edu/resources/ocng_textbook/chapter05/chapter05_06.htm
5.6 Geographic Distribution of Terms in the Heat Budget
Refer to figure 5.7 which is heat flux components SW, sensible, latent, and longwave plotted with latitude in x-axis and power in y-axis. Below are pretty global maps for each separate component colored by intensity. You should be able to almost reproduce these drawings from memory and be able to explain why the distribution is what it is. I can.
Here’s deal, Leonard. Regardless of clear sky or cloud evaporation is the preferred avenue of surface cooling wherever there is liquid water on the surface available to evaporate. That’s called a path of least resistance in engineer-speak. I don’t know what academics might call it. Electrical circuits work the same way as does water flow in pipes. It’s a pretty common theme in nature for stuff to roll along the path of least resistance towards increasing entropy. The ocean by definition has a practically infinite supply of water for evaporation at all times unless it’s frozen.
Therefore Leonard if you increase the energy going into the ocean the lion’s share of the increase is coming out latent just like it does now. Increasing the resistance of the radiative with GHGs has very muted effect because the lion’s share goes right back out the chute as latent energy. The heat budget is clear on these terms. What happens is each extra increment of vapor driven into the column reduces the lapse rate further causing clouds to form higher. The higher cloud, which is now emitting all that latent energy like a mofo in longwave, has less non-condensing greenhouse gas above it and more below it. This makes radiative cooling of the cloud more effective and impedes the flow of longwave downward from the cloud bottom because it’s got more non-condensing GHG between the cloud bottom and the surface.
Water cools the planet just like it cools my ass on a hot day.
Any questions?
David,
The reduction in lapse rate occurs only when condensation takes place. Thus your argument for raising the altitude of clouds based on the reduction in lapse rate does not appear logical.
Oh goody. Pekka says greenhouse gases are required for convection in an atmosphere.
The ocean is a fluid that convects due to uneven heating, Pekka. Does it need greenhouse gases for that too?
LOL – you really really ultimately probably mostly need to come to grips with what uneven heating does to fluid bodies.
Do I need to explicitely point out that a spinning sphere produces Coriolis forces in air and ocean both which also keeps the pot stirred up. Do greenhouse gases keep the earth spinning too, Pekka?
It’s important to note the temperature scales here – a few hundredths of a degree.
When I looked into the literature behind these graphs it appeared that the adjustments made to the data were of the same order as the variations being measured.
https://ipccreport.wordpress.com/2013/10/11/the-ocean-heat-graph-part-2-signal-or-noise/
Par for the course.
Regarding sea level rise, Judith Curry writes: “Note the high values in the early part of the century, nearly as high or as high as the value for the last two decades.”
If the rate of sea level rise over the last 20 years is as high or higher than it ever has been over the last 114 year (and is twice the 20th century average), then does this not strongly suggest that there has been no recent slowdown at all in the rate of accumulation of heat by the oceans and cryosphere?
Well I suppose you have to adjust it for accelerating ice sheet melt, but yeah double edged sword that one. Do we want the ice sheets to be accelerating into collapse, or proof positive that the greenhouse forcing is still strong. I choose a bit of both!
Agreed but I think you have missed my “…and cryosphere”.
“All in all, I don’t see a very convincing case for deep ocean sequestration of heat.”
Where’s it going then?
Bearing in mind you wrote: “Global sea level trend data suggests substantial thermal expansion in the earlier part of the 20th century”
It logically follows then that the same global sea level trend in recent years also suggests substantial thermal expansion.
So if it isn’t in the upper ocean it must be in….
“Where’s it going then?”
Is it an article of faith that it exists? Is it not possible to consider the implications that it does not exist?
This is the hardest problem that science has faced with the highest stakes. It is not to slight the scientist to point out that the models are less than perfect. Perhaps they are wrong?
The probl is the “scientists” get paid to fit emissions into the equation consequently ignore other factors that do provide for AGW such as reduced ITCZ cloud mass ensuring the tropical oceans absorb more SW. Was at met office meeting demonstrating this very feature using their own data but the issue was met by denial and excuses. Then I was told not to format the SST info – sad that scientists will stoop so low to fit in with the rest of the flock.
Where’s it going then?
Space?
If they are looking for a missing heat, I guess they have an idea of the amount of heat they are looking for. How does this amount compare with the heating of the different data sets and the reanalysis? Any one knows how much of the heat, what percentage do they imagine (or claim) they have found?
Is any heat missing?
The AR5 chapter 3 table looks like the numbers are pretty close if that’s any indication. Especially if we add uncertainty.
“Think he was describing my state of mind.”
Why am I liking lollywot more lately?
@lolwat. …outer space.
The heat that has been responsible for recent sea level rise is in outer space? Really?
i think he was describing my state of mind
Has the Southern Ocean upwelling of the meridional overturning circulation been incorporated yet into analyses of changes in the ocean heat content? cf
Closure of the meridional overturning circulation through Southern Ocean upwelling John Marshall, & Kevin Speer , Nature Geoscience 5, 171–180, (2012) doi:10.1038/ngeo1391
Posted copy: Closure of the meridional overturning circulation through Southern Ocean upwelling Nature 2012 PDF
Cited by 48
How much heat stays in the currents vs how much is mixed?
Rapid cross-density ocean mixing at mid-depths in the Drake Passage measured by tracer release
PS Closing the meridional overturning circulation through Southern Ocean upwelling Nov 2010 version PDF
Your point accords with what I know (not a lot) about ocean transport studies. Further caveat: most of my reading related to the end-Pleistocene events. I didn’t pay much attention to Holocene data or the mandatory AGW hand-wringing in the conclusions.
The AMOC results in cold, relatively salty surface waters in the far North Atlantic exchanging with bottom water. The new bottom water circulates south, mingles somewhat with Antarctic bottom water around southern Africa, and increasingly mixes back upward in the southwest Indian Ocean. Making the (possibly unjustified) assumption that heat flow follows water flow, you’d expect to see anomalous global heat input originally from surface water emerging from the depths most strongly in the Indian Ocean. In other words, mid-depth ocean heat generated from AGW would show up first where it appears to be showing up — in the Indian Ocean, after a transport delay probably in the range of decades.
As our host points out, this stuff doesn’t seem to be very well understood. At least for the end-Pleistocene (again I have to disavow any knowledge of more recent events), the calibrations do indeed seem to be really bad. Still, if the above analysis is correct, the regional data seem consistent with deep ocean heat storage and a bit of subsequent release. The data are hardly something I’d personally bet the future of civilization on at this point, but they can’t be lightly dismissed, either.
Toby
See Box 1 figure p 177
Please clarify.
“[W]e know of no mechanism by which vast amounts of missing heat can be hidden, transferred, or absorbed within the earth’s system. The only reasonable conclusion — call it a null hypothesis — is that heat is no longer accumulating in the climate system and there is no longer a radiative imbalance caused by anthropogenic forcing. This not only demonstrates that the IPCC models are failing to accurately predict global warming, but also presents a serious challenge to the integrity of the AGW hypothesis.”
~ William DiPuccio, Have Changes In Ocean Heat Falsified The Global Warming Hypothesis? (May 5, 2009)
Waggy quotes William DiPucci: “[W]e know of no mechanism by which vast amounts of missing heat can be hidden, transferred, or absorbed within the earth’s system.”
________
Well, DiPucci doesn’t know much. God may be be hiding the missing heat because he’s peeved at warmest for supporting same-sex marriage. If you think that kind of thing can’t happen, just read the following report:
“UKIP Councillor blames gay marriage for Britain’s ‘storms and floods”
‘UKIP Councillor from Oxfordshire, David Silvester sent a commentary to the Henley Standard, in which he blamed the recent heavy floods across Britain on the government and particularly the Prime Minister who has acted “arrogantly against the Gospel.” ‘
‘Quoting the Bible, the politician went on to say that “no man or men, however powerful, can mess with Almighty God with impunity and get away with it” and that “a Christian nation that abandons its faith and acts contrary to the Gospel will be beset by natural disasters.” ‘
http://rt.com/news/floods-uk-gay-blame-837/
You certainly must be welcome in NY.
Sure Max. And there are a bunch of left-eclectic illiterati claiming that radio waves cause brain cancer. But I wouldn’t stoop to using a fact like that as rhetorical dirty tricks against YOU.
NW, I think little maxie’s point is that the author of the paper quoted by Waggy, DiPuccio, may have at one time been married to the hairdresser of the third cousin of that UKIP character. We don’t really know that there is any such connection, but it’s possible. Therefore , according to maxie’s way of thinking, DiPuccio is a cryto-Creationist and is thus unqualified to do realscience.
You laugh, Detroit Don, but just last week God zapped an image of Jesus with a lightning bolt, Brazil’s Christ the Redeemer statue in Rio de Janeiro, damaging two fingers and the head. If God would do that to his own son, imagine what he might do to you. So, be good.
“Calling into question centuries of religious dogma and commonly held beliefs, the Lord Our God, Creator and Supreme Ruler of the Universe, admitted Tuesday that in actuality it is “extremely rare” for Him to ever forgive an individual.” TheOnion
It’s not really Jesus, maxie. Statue. Made out of concrete. Try to catch up.
I said “image,” Detroit Don. An image of a person is not the person, although it definitely is symbolic. Perhaps this isn’t a difference you comprehend, and you sleep with an inflatable doll.
Maybe he just grabbed the nearest excuse to post a link. There was a similar story somewhere (I don’t remember exactly where) in the SouthEast US a few years ago.
The funny thing is that this sort of nonsense is exactly analogous to blaming the Industrial Revolution (and the CO2 it created) for Hurricane Sandy (and whatever), but most of the nuts pushing “global warming” don’t understand. Of course, they claim “Science” for their authority, while this nut claims the “Bible”. That makes it different, doesn’t it?
AK, the funny thing is you think it’s analogous. The belief global warming can’t effect weather is as wrong as the belief every weather event is a result of global warming.
Global cooling effects weather. A hiatus in global warming apparently effects weather. If the weather didn’t change we wouldn’t have climate change; and, the climate is always changing.
What’s truly missing is not heat, but adequate data coverage of the oceans at depth. Without it, we have only competing bald speculations about OHC.
Agreed John. Pre Argo it is an extremely sparse convenience sample. No conclusions can be drawn.
Fig 3A is the most important chart of the page, we don’t have enough historical data to make a valid trend, not do we have enough coverage now to adequately define OHC.
It’s all hand waving.
As Judith stated in her commentary, the temperature changes in the very cold water below 1000m are tiny due to the huge volumes of water involved. And I cannot see how water at 4 deg C can rise to the surface & warm the atmosphere, even at the North Pole.
In general, I tend not to lose sleep over data whose error bars extend to over half the printed graph.
“So exactly where does the argument come from that the deep ocean is sequestering the ‘missing heat’? It seems to come from the Balmaseda et al paper that is based on ocean reanalysis (this paper was discussed here at Climate Etc.).”
Are you serious? Of course Balmaseda is one of the recent papers showing a lot of heat in the oceans, but pretty much every single recent paper is showing exactly the same, starting with the latest Levitus which you somehow “missed” – here is a better picture from one of your buddies:
https://pielkeclimatesci.files.wordpress.com/2012/04/ocean-heat-content1.jpg
The chart shows ocean temperature has been rising faster at 0 to 2000 M than at 700 M to 2000M, which seems intuitive.
“Warming trends (0-2000 m) are seen in the Indian Ocean and the South Atlantic, with slight cooling trends in the Pacific and North Atlantic. Now it seems difficult to me to cook up an explanation for this regional variation in trends that relies on external forcing, although I suspect that someone will think of some rationale for aerosol/black carbon forcing to explain this. This most likely reflects natural internal variability. It doesn’t look like an AGW signal to me. More regional analyses for the past decade would be very helpful in trying to sort this out.”
Would you EXPECT an AGW signal in REGIONAL trends over a 9 year period?
Here’s the explanation for it being externally forced: If there was no AGW, no heating of the oceans, then all those trends – the Pacific, Atlantic and Indian ocean would be lower. So the Pacific and North Atlantic wouldn’t have warmed as much, and the Indian and South Atlantic would have cooled more.
Hi Judy
I am really glad you did this post. To clarify, however, you wrote
“Roger Pielke Sr. has often stated that ocean heat content is a much better metric for climate change than surface temperature.
Actually, I have concluded that ocean heat content is a much better metric to diagnose climate system heat changes (i.e. “global warming”) than the surface temperature trends. I discuss the reasons in my paper
Pielke Sr., R.A., 2003: Heat storage within the Earth system. Bull. Amer. Meteor. Soc., 84, 331-335. http://pielkeclimatesci.wordpress.com/files/2009/10/r-247.pdf
You sentence should read
“Roger Pielke Sr. has often stated that ocean heat content is a much better metric TO DIAGNOSE GLOBAL WARMING AND COOLING than surface temperature.”
We can use changes in ocean heat content, for instance, to directly diagnose the global average radiative imbalance in Watts per meter squared by analyzing for different time slices. This is an approach Jim Hansen has adopted also; e.g. see
http://pielkeclimatesci.files.wordpress.com/2009/09/1116592hansen.pdf
[I would like for you to also diagnose the heating in Watts per meter squared from the analyses that you present in your post].
With respect to the term “climate change”, I (and others) have urged a broadening of the subject of “climate change” to be much more than annual-global average trends in the heat of the climate system; e.g. see
Pielke Sr., R., K. Beven, G. Brasseur, J. Calvert, M. Chahine, R. Dickerson, D. Entekhabi, E. Foufoula-Georgiou, H. Gupta, V. Gupta, W. Krajewski, E. Philip Krider, W. K.M. Lau, J. McDonnell, W. Rossow, J. Schaake, J. Smith, S. Sorooshian, and E. Wood, 2009: Climate change: The need to consider human forcings besides greenhouse gases. Eos, Vol. 90, No. 45, 10 November 2009, 413. Copyright (2009) American Geophysical Union. http://pielkeclimatesci.wordpress.com/files/2009/12/r-354.pdf
McAlpine, C.A., J.G. Ryan, L. Seabrook, S. Thomas, P.J. Dargusch, J.I. Syktus, R.A. Pielke Sr. A.E. Etter, P.M. Fearnside, and W.F. Laurance, 2010: More than CO2: A broader picture for managing climate change and variability to avoid ecosystem collapse. Current Opinion in Environmental Sustainability, 2:334-336, DOI10.1016/j.cosust.2010.10.001. http://pielkeclimatesci.wordpress.com/files/2010/12/r-355.pdf
Best Regards
Roger Sr.
Personally, I suspect the direct effect of adding CO2 to the atmosphere (plant food) has as much chance of stimulating catastrophic eco-system reorganization (“eco-collapse”) as CO2-driven changes to the climate.
“Actually, I have concluded that ocean heat content is a much better metric to diagnose climate system heat changes (i.e. “global warming”) than the surface temperature trends. I discuss the reasons in my paper.”
_____
That’s a critical distinction and I’m glad you made it. The next big step for many is to realize that surface trends and OHC are both just proxies for changes in the energy content of the climate system, with sensible surface heat being the weaker and less reliable of the two.
“The next big step for many is to realize that surface trends and OHC are both just proxies for changes in the energy content of the climate system, with sensible surface heat being the weaker and less reliable of the two.”
That is a complaint I have been making around here for a long time. The only way to know if there is an energy imbalance is to know with reasonable accuracy and precision what the average temp/heat content of the entire system is. We aren’t close to that.
Adjusted inferred averages of proxies of adjusted inferred averages of proxies (eg. tree rings as proxies of surface air temp as proxies of global climate heat content; or temp anomalies as proxies of average temperatures as proxies of global climate heat content), might sound good on paper to those who think they already know the truth.
But the lack of fundamental knowledge of our climate just becomes clearer with each new development, to those of a genuinely skeptical bent.
GaryM | January 21, 2014 at 8:37 pm |
“That is a complaint I have been making around here for a long time. The only way to know if there is an energy imbalance is to know with reasonable accuracy and precision what the average temp/heat content of the entire system is. We aren’t close to that. ”
Define “close”. Measuring incoming energy is easy peasy since the sun is a point source so the satellite sensor is illuminated by exactly the same flux intensity as the earth.
Outgoing isn’t so easy. The earth isn’t point source and outgoing energy varies radically across the surface temporally and spatially. Measurement can only be done accurately perpendicular to the surface because other light reaching the satellite at an angle comes through various depths of atmosphere.
It’s not impossible to fill in the blanks based on measurements from a vertical track over the surface it’s just not as accurate as it would be if there were a constellation of satellites so samples could be taken directly overhead from many orbital tracks.
That said the CERES is accurate to 4W/m2. The problem is that the imbalance is nearly an order of magnitude smaller at 0.5W/m2. CERES however has much greater precision than accuracy so year-to-year changes in the imbalance are used instead of absolute number of Watts/m2 leaving the planet. That same problem exists with microwave sounders on satellites that sample lower troposphere temperature – they are much better at sensing small changes from year to year than they are at sensing absolute temperature.
Anyhow, define “close” because getting to within 4W/m2 on a 341W/m2 signal would be close enough for many applications.
By the way, raw CERES data over the past decade doesn’t show any imbalance i.e. the earth spends as much time losing a bit more than it gains as it does gaining a bit more than it loses. It’s reanalysis algorithms that pencil whip it from neutral to gaining energy. Things like sea level rise and ARGO measurements are used to “correct” CERES data so that it all appears to make sense. The nut of it is that sensing global average sea level and global average ocean temperature are as frought with inaccuracy problems as CERES and they too are pencil whipped. In 2008 ARGO instruments indicated ocean cooling beginning in 2003. However that was soon “corrected” so it showed warming instead. This doesn’t inspire much confidence in the people doing the work. The same people who ostensibly couldn’t get good readings out of ARGO prior to 2008 suddenly discovered a mistake that changed the polarity of OHC change? If they weren’t competent enough to avoid the mistake in the first place what makes them competent enough to find and correct it? I smell a rat.
“The same people who ostensibly couldn’t get good readings out of ARGO prior to 2008 suddenly discovered a mistake that changed the polarity of OHC change? If they weren’t competent enough to avoid the mistake in the first place what makes them competent enough to find and correct it? I smell a rat.”
—-
Oh yes, the conspiracy escape clause. The last refuge to prevent massive cognitive dissonance.
Indeed the skeptics should audit the Argo data, and probably have already, but we are not hearing from them for some reason. If one would speak out, it would save all the others doing it and rediscovering what has been published on it already.
R. Gates, a Skeptical Warmist | January 22, 2014 at 12:47 am |
“Oh yes, the conspiracy escape clause. The last refuge to prevent massive cognitive dissonance.”
Why not? They were caught red handed in climategate emails conspiring to avoid FOIA requests and blackball journals that published articles by skeptics. God only knows what conspiracies weren’t uncovered by climategate. But one fact remains: conspirators conspire. These people were caught conspiring and that makes it a fact they are conspiratorial in nature. You’re associating yourself with some unsavory characters.
R.Gates:
Yup. Just like how warmists like you support genocide. And believe you’ve been abducted by aliens.
Except you’d reject those results. It doesn’t matter they’re generated via the exact same methodology as ones you accept. You’re “skeptical” only of things you don’t like.
Or maybe I’m wrong. Maybe you really do think Stephan Lewandowsky’s work is complete trash, based entirely upon a bastardization of statistics like any sensible person would. Would you care to comment?
David Springer,
“Anyhow, define ‘close’ because getting to within 4W/m2 on a 341W/m2 signal would be close enough for many applications.” This is no different from Mosher’s frequent claim that GCMs are “useful”. Which always begs the question – useful for what?
Since the topic of the thread is Ocean Heat Content Uncertainties, in the context of OHC as a proxy for globalclimatewarmingchange, I would have thought it was obvious I was speaking of “close” in the sense of giving sufficiently precise and accurate measurements to determine the central issue in this debate. Whether there is an imbalance sufficient to show that AGW is C.
In fact, that’s precisely what I wrote in the sentence preceding the “not even close” statement.
I based that statement not on my own review of the science, or the word of skeptics, but the admissions of consensus climate scientists themselves. Satellite measurements might be “close enough for many applications”, but even warmists scientists admit they can’t actually measure the alleged imbalance because the instruments aren’t precise and accurate enough.
GaryM | January 22, 2014 at 11:51 am |
“I based that statement not on my own review of the science, or the word of skeptics, but the admissions of consensus climate scientists themselves. Satellite measurements might be “close enough for many applications”, but even warmists scientists admit they can’t actually measure the alleged imbalance because the instruments aren’t precise and accurate enough.”
Which climate scientists admit that? The bandwagon members don’t admit it to the best of my knowledge. Reanalysis ostensibly improves the accuracy enough to say there’s an imbalance of 0.5W/m2 on the surplus side (warming) rather than on the deficit (cooling) side. You’re preaching to the choir if you want to say the reanalysis data is highly questionable but I don’t you’ll find any bandwagon climate boffins that will agree about the potentially flimsy nature of reanalysis.
“We need to raise the level of our game in terms of explaining the planetary warming by infrared absorption of CO2 etc. The missing area of understanding seems to be the actual physical mechanism. Lets target an explanation at an audience that has taken 1 year each of undergraduate physics and chemistry, plus calculus. Once we have something that is convincing at this level, we can work on how to communicate this to the interested public (i.e. those that hang out in the climate blogosphere). Willis Eschenbach’s help is needed in translating this for the WUWT crowd.” ~Judith Curry
I would like to see it graphically, like an onion, showing the amount of IR being thermalized at 280 ppm, at 560 ppm without water amplification and at 560 ppm with water amplification. I would prefer a 1:30 in the afternoon and 5:30 in the morning pair of figures.
lolwot
“It logically follows then that the same global sea level trend in recent years also suggests substantial thermal expansion.”
I believe a careful reading of what she said answers the question. Ocean expansion is the result of a number of factors.
I am not going to repost her discussion, but look at the couple of paragraphs above her summary and the list quoted from AR5.
did you see the paper on the 536AD cooling?
No, I am afraid I missed that, but I find Dr. Curry’s analysis using the AR5, which would be hard for climate scientists to not find authoritative, to show the uncertainties in their work, logical sound and hard to ignore.
I find the IPCC as reliable at dealing with climate as the Vatican at reviewing g a trities on atheism: the climate thing is wrong if it does not rely on emissions ant the atheist paper is wrong if it does not me tion the god bit.
here tony
http://io9.com/what-caused-a-10-year-winter-starting-in-536-1505213873?utm_campaign=socialflow_io9_facebook&utm_source=io9_facebook&utm_medium=socialflow
Thanks, I have read it now, or at least the press release. The press release is of course pretty low on facts that would lead one to the conclusion(s), but it is nonetheless an interesting possibility.
Conner,
I never said that they were reliable or not, just simply that using their own papers to point out the uncertainties seems to be a logical and reasonable approach.
So why Phi?
=========
@Steven Mosher, TonyB…
The original paper (I think) is here (paywalled).
And have you seen this:
The rapid response of Earth’s Temperature to day and night and to summer and winter clearly shows it stays in or nearly in balance and there is no hidden heat.
Herman, this is the elephant in the room that is ignored, hmm maybe hummingbird is a better analogy, they move much much faster.
From the 50’s to the early 2000’s, there does seem to be a change in the rate of daily temp change (Here and Here), but there was an inflection point in the early 2000’s, but we don’t have enough data yet to see if it is truly a change in cooling rate or a fluctuation. Here
MORE HOCKEY STICKS?
Figure 3.A.2: (top) Percentage of global coverage of ocean temperature profiles as a function of depth in one degree latitude by one degree longitude by one-year bins (top panel) shown versus time
A hockey stick in the deep ocean is still a hockey stick. Too bad they did not find some tree rings down there.
These hockey sticks make their way into the Arctic, melt some sea ice and turn on the snow monster who chews up hockey sticks an spreads their white remains on land as far south as the holy land.
Mi Cro
Thanks, That is very interesting!
“…so it is very difficult to imagine how this heat could reappear at the surface in light of the 2nd law of thermodynamics.”
Pesky 2nd law of thermodynamics. Nothing more depressing for the warmists than the physics in which guys like WHT piously cloak themselves, actually undermining their case.
The 2nd law of thermodynamics doesn’t seem to relate to the main issue of the missing heat. The heat could make it’s way down to the bottom and that’s the point.
But if this is the case, that heat is making its way to the depths of the oceans, this means that it has always been happening — why would the system decide to start doing this just now? This must surely warrant major changes to the climate models, no?
“..why would the system decide to start doing this just now? “
That’s been a big question of mine for a long time now, though I’m sure the warmists have a few handy dandy ad hoc explanations at the ready.
I too have wondered, and asked the same questions.
How do we know the ocean wasn’t taking in heat, moderating surface warming, in the past?
How do we know the ocean won’t continue taking in heat, moderating surface warming, in the future?
How do we know, if this is so, at what point the oceans will have taken in sufficient heat that they will fail to do so in the future?
If the oceans are in some fashion heat sinks, that would account for surface temps remaining in a relatively stable range for a very long time. It would also allow for a lag where an increase in surface heat rises and falls as the mechanism (whatever it may be) for transport of heat to the deeper oceans takes place. For that process to stop, there would seem to have to be some saturation point, at which the oceans no longer moderate surface climate to the same extent.
How will that happen, and when?
Those are the questions that “finding the missing heat” in the oceans raise for me.
The more we learn, the more we realize how little we know, if we have any humility at all.
“freeHat
The 2nd law of thermodynamics doesn’t seem to relate to the main issue of the missing heat. The heat could make it’s way down to the bottom and that’s the point.”
May I ask why the heats hasn’t made its way to the bottom already?
You do know that the bottom is refreshed constantly by sinking brines at the poles.
A better question is does AGW slow the rate at which cold, dense, brines flow into the bottom of the oceans, and as a supplementary, is apparent warming due to the normal polar downwelling brines being less dense than normal and are being injected at 700-2000m rather than lower down.
Nice pointed questions DocMartyn. You may be onto something there.
freeHat said on January 21, 2014 at 6:01 pm
“The 2nd law of thermodynamics doesn’t seem to relate to the main issue of the missing heat. The heat could make it’s way down to the bottom and that’s the point.”
_______________
I think Judith Curry might disagree. She says “And even if the heat from surface heating of the ocean did make it into the deep ocean, presumably the only way for this to happen involves mixing (rather than adiabatic processes), so it is very difficult to imagine how this heat could reappear at the surface in light of the 2nd law of thermodynamics.”
I’m not sure what Judith’s comment on the 2nd law of thermodynamics has to do with the missing heat, but she seems to be implying that some climate scientists don’t accept this law or perhaps unwittingly have theories that conflict with it. Is that true?
No reason to think so. Internal variability causes alternating net heat flows between deep ocean and near surface ocean. When we combine that with the overall warming trend we have periods like we have had recently. Nothing mysterious in that.
Max
I haven’t seen any climate scientist make a case for ocean heat below 700 meters somehow becoming concentrated on the surface in order to effect rapid warming of the atmosphere. Just a few scientific illiterates like R. Gates who is definitely not a climate scientist is trying to make that case.
As I see it both AR4 and AR5 data suffer from the same problem – the lack of early 20th century data. The 1910 to 1940 rise of atmospheric temperature of 0.5C must have propagated on through the system but was ignored by the IPCC. The first hiatus followed 1940, indeed atmospheric temperatures actually fell until 1970 as the still cold sea surface dragged atmospheric temperature down,. so this first hiatus was very revealing for those who bothered to look. During the early part of the 20th century most waste heat was generated in the N hemisphere and found its way into the depths of the north Atlantic via the haline circulation Because the ocean beds have hills a valliys, the salt rich warmer water could be trapped for years, before reaching the broader waters of the S hemisphere, where the most dense water falls to the bottom and sets the profile for all water above. But this is just a transport delay which could easily take many years. In my theoretical model underlined above) I assumed about 30 years, 1940 to 1970) because this is when a carbon copy of the 1910 t0 1940 rise reappeared.
The turnover time is too small for the gap you suggest. The top 100m is only 1/36 of the total. If the total 100m was replaced annually, we wouldn’t see a Keeling Curve with half the annual input remaining in the atmosphere.
DocMartyn: I am not suggesting there is anything wrong with the Keeling Curve The profile I refer to is natural one in the ocean because the heaviest water sinks to the bottom and is very cold, but all water above gets warmer and less dense on the average.
Thank you for your reply. I have no quarrel with the Keeling curve. But the IPCC has invented the term ‘greenhouse gas’ to explain its warming effects. That is not a scientific explanation, but merely an analogy to justify their own conclusions.
Alexander Biggs | January 21, 2014 at 9:50 pm |
“DocMartyn: I am not suggesting there is anything wrong with the Keeling Curve The profile I refer to is natural one in the ocean because the heaviest water sinks to the bottom and is very cold, but all water above gets warmer and less dense on the average.”
Not entirely true. Salinity changes water density too and allows warmer more saline water to sink beneath colder fresher water. Evaporation, precipitation, and sea ice formation/melting can cause large discontinuities in salinity at or near the surface.
David Springer: Thank you for your reply. “Not entirely true. Salinity changes water density too ” Yes, I agree. That is why I mentioned the haline circulation above. Water has maximum density at 3.98C, so we would expect the depths of the oceans to be about 2Cto 4C . You would not expect warmer water to sink in the N. Atlantic, but evidently increased salinity due to evaporation is a stronger effect than water temperature
Fresh water. Water with salinity typical of the oceans has maximum density at the freezing point, a little below Zero. Don’t have time to dig up links, but it’s not hard to find.
Here, for instance.
What I don’t understand is how one would expect deep ocean thermal uptake to begin with.
Anomalously warm water is lighter and more buoyant to begin with, inhibiting mixing.
And the cold waters of the deep are resupplied by cold water formation, largely from Antarctica. That cold water must be exerting continual upward pressure on the warmer waters above it.
This is a blow up of Balmaseda et al Figure 1.
http://i179.photobucket.com/albums/w318/DocMartyn/deepoceanJPEG_zpsc6585990.jpg
The the recent change in the upper 300 and upper 700m are 3 and 7.5 units. Thus, 300-700m warmed by 4.5 units, so the rates are
0-300m = 3/3
300-700 = 4.5/4
As I have noted before, the 300-700m layer is warming more rapidly that the 0-300m. How heat is transferred from he sun/atmosphere into the 300-700m layer FASTER than the 0-300m layer is a thermodynamic mystery.
My guess is that we are looking at deliberate manipulation with different global coverage for the 0-300m and 0-700m ocean slices.
DocMartyn,
Thanks for the good sense you try to project into these discussions. Big issue is the deep oceans at 2*C have not warmed as far as the temperatures are concerned according ot measurements. So CAGW activists change the metrics to Zillions of joules and project a massive number multiplied by a little temperature change to find the missing massive amount of heat. My guess the temperature changes can’t be measured there, the deep ocean takes hundreds of years if not a thousand to come to the surface where it can impact the atmosphere and even then the dissipated heat can’t raise the atmospheric global temperature because of all the changing currents and winds again spread it out. Plus it is 1,000 years from now. As Keynes said, “in the long run we will all be dead”. The immediate task is fending off the socialist controllers from fooling the low information voter into handing over the full keys to the economy. Nothing they tried for six years worked so we need more of the same.
We should spend lots more on argus like measurements of the ocean temperature profiles and deep ocean and cut back on fantasy models.
Get more Data, not conjecture.
Scott
DocMartyn,
You were already schooled on the figure at Real Climate when you tried bringing it up earlier last year.
The error you made is that the proportional increases of heat for the 700 meter depth and 2000 meter depth make sense, especially considering the amount of noise that is clearly visible.
In your figure, you have 7.5 units of heat accumulated for 700 meters total, and 3 units of heat for 300 meters total.
You may have a point if it scales so that 3/300 is much less than 7.5/700, which would mean more heat is coming up from the depths than diffusing downward, but actually 3/300 = 0.01 ~ 7.5/700 = 0.00107 which is a 7% margin of error, which I don’t think they can get much better considering the quality of the data.
What this means is that the heat is accumulating properly, albeit with a high diffusivity. I have a mathematical physics treatise on this topic here:
http://theoilconundrum.blogspot.com/2013/03/ocean-heat-content-model.html
“Web
DocMartyn,
You were already schooled on the figure at Real Climate when you tried bringing it up earlier last year.
The error you made is that the proportional increases of heat for the 700 meter depth and 2000 meter depth make sense, especially considering the amount of noise that is clearly visible.”
Screw you maggot.
I have never been ‘schooled’ by RC.
I blew up the figure and measured the difference. The figure shows that the 300-700m layer is warming faster than the surface 0-300m.
That is what the figure shows.
I did not make an ‘error’, I highlighted a feature of a published figure.
“You may have a point if it scales so that 3/300 is much less than 7.5/700, which would mean more heat is coming up from the depths than diffusing downward, but actually 3/300 = 0.01 ~ 7.5/700 = 0.00107 which is a 7% margin of error, which I don’t think they can get much better considering the quality of the data.”
Look nimrod, unlike you, I know that sea water does not transmit heat as well as copper. I also know that overall heat flux is from hot to cold, if the rate that heating at 0-300 and 300-700m are identical, it is still impossible if they are not in thermal equilibrium.
Overall warming and internal variability could easily lead to such a behavior.
Whether that has really happened in this case is to me, however, still uncertain. I do not consider the data accurate enough for giving a definitive answer.
Oh you Brits with your clever wordplay!
You did identify that the heat buildup from the 300 to 700 meter depth is similar to that from 0 to 300 meters. Because of the way that diffusion works, which I have derived here, this likely means that the effective downward diffusion is larger than we thought. Not hard to believe with the significant vertical eddy diffusion and massive overturning that occurs.
The implication of this fast effective diffusion is that since heat is closer to being equi-partitioned across the depths, that means that the sub-2000 meter depths will contain some fraction of the “missing heat”. Remember that just because we haven’t measured it doesn’t mean it doesn’t exist. This is one of those effects that can be analytically determined.
If the sub-2000 meter level did contain the diffused heat, it would need only capture some fraction of the 1 W/m^2 stored in the top 2000 meters to make up for the perceived “missing heat” deficit.
This is what my simulation shows in comparison to the Levitus data:
http://imageshack.com/a/img28/5500/rpf.gif
This results in about 25% more heat that lays below the layers that we can measure. This means that if we can account for 1 W/m^2 directly, then 1.25 W/m^2 total can be inferred based on laws of diffusion.
“Not hard to believe with the significant vertical eddy diffusion and massive overturning that occurs”
Mikey Mann proves that when it is cold trees do not produce tree rings and you prove that the Thermocline is a fiction and that the worlds navies have been wrong about this sonar thingy all along.
Doc,
So you got nothing, except for a thermocline?
Point out the depths that you think are operable.
OK Web, just for you.
Take depth as a series of layers, 100m thick.
The top layer, layer (1) has a Temp of T and the bottom layer is in steady state with the bottom layer, layer (21), that is at T-15.
Now the overall heat flux is always from layer (1) to layer 21.
Now perturb the system by the addition of heat to layer one, raising its temperature. In pre-steady state there will initially be a rise in temperature, and heat content, in layer (1), then heat will begin to probe the lower levels; the profile, for a constant rise in surface temp, will have an exponential.
At steady state the layers near the surface will have a larger change in heat content than those at the bottom.
If we set layer 21, >2000m, as a true heat sink, then its temperature will be unchanged. If we define ‘unchanged’ as less than 1% of the heat change in the surface layer we get an exponent of 0.2 layer-1.
Therefore heat contents of layers are
0-300 =1
0-700 =1.6
0-2000 =2
and so 300-700m =0.6
Therefore the ratio of 0-300:0-700 is 1:1.6.
The 0-300m heat content should be almost exactly half of the 0-2000m heat content.
However, this is the steady state approximation, in pre steady states the ratios will always be lower, so
0-300:0-700 is 1:<1.6
0-300:0-2000 is 1:<2
If we take the figure that Judy has placed at the top of the tread, from 2000 until the end of the graph, trying to get the biggest 0-300 and smallest 0-2000, we get;
0-300m = 5.2 * (10^22J)
0-700m = 9.6 * (10^22J)
0-2000m = 13.2 * (10^22J)
0-300:0-700 is 1:1.84 compared with 1:<1.6
0-300:0-2000 is 1:2.53 compared with 1:<2
Your lines do not match the data for the 0-300 and 0-700, you had to cheat by making your 0-300m overshoot and the 0-700m undershoot.
http://img819.imageshack.us/img819/7860/ohc.gif
Atlantic Meridional Overturning Circulation slowdown cooled the subtropical ocean
Cunningham et al 2013
Atlantic meridional ocean heat transport at 26N: impact on subtropical ocean heat content variability
Sonnewald et al 2013
Both papers discuss the impact of ocean heat transport on the ocean heat content of the North Atlantic including the recent 2009-2012 loss of OHC in this region.
Climate science at its finest.
“Now, the theoretical advantage of ocean data assimilation is that it ‘fills in’ unsampled regions using the model dynamics and thermodynamics.
…
The most surprising thing about the Balmaseda analysis is that the warming increases with increasing depth (largest warming for the 0-7000 m layer).”
Want to find some additional heat? Find a large area where there are no annoying actual measurements, makes some nifty “assumptions”, run them through a climate model and VOILA! There’s the missing heat! If your Antarctica graphs based on similar made up “data” elicit guffaws and giggles, there’s always the ocean.
And I’m sorry, but global averages to thousandths of a degree or joule? Who is kidding whom?
This is what passes for science now?
The more I think about it, I would change the above quote to read “The [least] surprising thing about the Balmaseda analysis is that the [purported] warming increases with increasing depth (largest warming for the 0-7000 m layer).”
The deeper we go, the less data we have, the more heat we “find”.
This is flat out getting embarrassing.
“The deeper we go, the less data we have, the more heat we “find”.”
I’m certain it’s just coincidence…. ;-
“freeHat | January 21, 2014 at 6:01 pm |
The 2nd law of thermodynamics doesn’t seem to relate to the main issue of the missing heat. The heat could make it’s way down to the bottom and that’s the point.”
The process needs to be continuous for an IPCC model.
Regionality keeps rearing its head – if you include time, especially.
I consider two types of reality are involved here: Computational Reality (or Mathematical), which is what you get when you throw all the data in and swish it around, a computation that cannot be denied. And then Representational Reality, which is what you get when you show data that represents what’s really going on. The two are not necessarily the same.
The oceanic heat analysis above that lumps everything together, in the same way that global mean sea level analysis (from satellites), gives you a Computational Reality. But if the oceanic heat is principally in one place, as the sea level rise is principally in one place, like the Indian Ocean/Western Pacific, you will get a result that misrepresents what is really going on. The world’s oceans as a whole are not warming up at some depths or rising up on the continents at X amount per year, some particular region has that action.
I even wonder about the regionality of the CO2 rise as per the Keeling Curve. The Keeling curve (grossly smoothed) has a peak approx 15 May and a minima approx 28 September in the last year. Some years there is a minor double peak and the max and minima datas wander a bit. However, our planet has two hemispheres with different proportions of vegetative growth, and a TOA TSI difference in insolation of some 22 W/m2 January (max) to July (min). One would think that you would see more than a single max-min relationship. I’m sure that if you tried to model it, you would. But you don’t. As well, a minima in late September seems odd. Shouldn’t the lowest CO2 occur during the maximum plant activity? Late September?
Even the CO2 rise and fall look to me to be a regionality expressing itself. There is a place in the world that controls the rise and fall of global CO2. Yes, the Computational Reality of the world says that Planet Earth produces the maximum CO2 addition to the atmosphere in mid-May, but Representational Reality says that somewhere – the Indian Ocean, perhaps? – there is a dominant source of CO2 that occurs in mid-May.
Once you allow a large regionality to be, and allow a Computational Reality to be disturbing your understanding of the Representational Reality, you might wonder how much of any of the “global” trends is really global. Including CO2: for imagine if it turned out that the region dominating CO2 release in mid-May was somehow just not able to suck all of what it released, not just the A-portion, back in. Man’s contribution would be even less than we thought, and now the models are really, really broken.
The Levitus ocean heat content data says that huge amounts of heat are going into the ocean and coming out of the ocean on a quarterly basis.
However, the CERES satellite data say no way. I discuss how the CERES data reveals huge uncertanties in the Levitus data here and here. The short version is that the CERES data shows neither the huge quarter energy inflows nor the corresponding outflows from the ocean. Given the precision of the CERES data, this is a very serious issue.
As a result, I wouldn’t place much weight on the claims of changes in OHC. I can only second Judith’s closing paragraph:
Can’t say fairer than that …
w.
“The Levitus ocean heat content data says that huge amounts of heat are going into the ocean and coming out of the ocean on a quarterly basis.”
_____
Well, that’s how it is measured, but of course huge amounts of energy are flowing in and out of the ocean on a second by second basis. You can see the natural fluctuations over the course of the year as the seasons shift the ITCZ north and south. What matters is the net in versus net out over the quarter that may mark the measurement period, and more importantly, related to GH gas increases, that more is coming in versus going out, grandually warming the oceans and raising sea levels.
“As a result, I wouldn’t place much weight on the claims of changes in OHC.”
___
To accept the real possibility that this may be happening on a long-term basis (multi-decadal and longer) kinda makes a strong case for a fairly steady external forcing.
R. Gates, Skeptical Warmist | January 21, 2014 at 7:48 pm |
_____
“Well, that’s how it is measured, but of course huge amounts of energy are flowing in and out of the ocean on a second by second basis.”
I have said before Gates that you just parrot other peoples statements and do no thinking of your own.
Energy enters the Oceans in an highly organised form.
I think in your mind this highly organised energy, that enters the Oceans, somehow wanders about in its organised form in currents just waiting to pop out.
Well it doesn’t my friend it gets totally dispersed. Take the gulf stream, yes energy entering in the tropics gets transported northwards in the form of warm water. As it travels it starts to lose this energy to the larger ocean and to the atmosphere by evaporation. Eventually this current has lost all this additional energy and more and is now colder than the surrounding ocean and it sinks continuing the ongoing current.
That organised energy is no more, it is dispersed or lost to the atmosphere. It is not wandering about the Oceans waiting to pop up somewhere!
The Laws of Thermodynamics means that it can never reorder itself into a more organised form without the addition of a lot more energy and can only ever emerge from the Oceans in its dispersed form and that is going to be at a very minimal surface rate and is going to take centuries.
If the extra energy is real and it is going into the deep oceans then that is the end of CAGW.. To affect us, who live in the Troposphere it has to impact it and it can only do that at the Ocean surface. How much % change can this alleged deep Ocean energy affect the surface and over what timescales?
You do know that it is a good thing that we are insulated from the deep Oceans cold water which cannot impact on the surface or we would be permanently glaciated. So are you proposing that a a minuscule change in the deep Ocean temperature IS going to cause it to directly impact the surface? If by some miracle this did would you expect warming or cooling?
Alan
Willis, I am now horribly confused about quarterly changes in OHC, would you be so good as to help me out?
As I understand it global temperatures are calculated as anomalies, thus removing seasonal swings, but that Heat Content is not,
Now our dear planet has an elliptical orbit and is sometimes closer to the sun that others; sure, the shape of the land and oceans doesn’t mean that the amount of incoming solar radiation falling on the oceans follows the Earths orbit, but it should be possible to work out the amount of incoming solar radiation each quarter. One thing I do know is that there should be an underlaying waveform for the amount of solar energy going into the Earths oceans and the day of the year. You should see this waveform in the quarterly data you present. I can’t see it.
Why is there no wave?
“The Laws of Thermodynamics means that it can never reorder itself into a more organised form…”
—
We would never have hurricanes then, which are highly organized forms of energy driven by all that “unorganized” ocean energy. The energy in the ocean displays extreme heterogeneity, as does the energy in the universe itself. Little pockets of this organized heterogenous energy amid vast homogeneity. In the universe we call these islands of energy galaxies, and when they form over the ocean we call them hurricanes. Suffice to say that energy that enters the ocean goes into the atmosphere in useable and often extremely violent ways.
What ever happened to the stronger and more frequent CAGW hurricanes, gatesy?
“Don Monfort | January 21, 2014 at 10:24 pm |
What ever happened to the stronger and more frequent CAGW hurricanes, gatesy?”
—-
That would best be a question for Judith.
I asked you, gatesy. Where are the hurricanes hiding? If all that energy is building up in the oceans, where are the freaking hurricanes driven by all that ocean energy? Shouldn’t we be having stronger and more frequent hurricanes? Wasn’t that the alarmist meme, after Katrina? Are the missing hurricanes hiding in the ocean depths?
http://coaps.fsu.edu/~maue/tropical/global_running_ace.jpg
“Shouldn’t we be having stronger and more frequent hurricanes?”
—-
I guess one of the largest ever recorded this past year that killed thousands was not strong enough?
It took you a while to come up with that anecdote, gatesy. What about it?
http://coaps.fsu.edu/~maue/tropical/global_running_ace.jpg
Never mind. I don’t have any more time for your disingenuous foolishness.
I tend to avoid going to WUWT, because there’s too much to read elsewhere, and because picking up the interesting pieces out of the very large volume of noise is too much of effort. As an exception I have read some of the posts of Willis as he clear makes an effort in looking at the data. Unfortunately I end up in most cases thinking that I really have no idea on what is the real basis for his results or what is the relevance of the results.
One reason for my problems is that Willis often makes obvious errors like in the recent post where he discussed the atmospheric heat engine putting the warm side to the tropics (right) and the cold side to the poles (wrong). By far the most important atmospheric heat engine is that of the Hadley cells between the tropical surface and mid-latitudes upper troposphere as the cold side. That heat engine drives most of the circulation including the Ferrel cells that consume work created by the Hadley cells. Polar regions are a minor factor in the creation and dissipation of work in the atmosphere.
Pekka
“One reason for my problems is that Willis often makes obvious errors like in the recent post where he discussed the atmospheric heat engine putting the warm side to the tropics (right) and the cold side to the poles (wrong). By far the most important atmospheric heat engine is that of the Hadley cells between the tropical surface and mid-latitudes upper troposphere as the cold side. That heat engine drives most of the circulation including the Ferrel cells that consume work created by the Hadley cells. Polar regions are a minor factor in the creation and dissipation of work in the atmosphere”
OK, I am not a physicist, but I thought I understood work.
Now let us think of to engineering projects:-
1) I lay two pipelines, insulated, between the tropics and a pole, and have a radiator at both ends; the question is can I perform work by pumping a fluid?
Well yes. I can. If I warm ammonia at the tropics I get a gas hat runs to the poles, cools and becomes a liquid. I pump the liquid to the tropics and revapourize it. I use the liquid/gas transition to drive a turbine to give me electricity and power the pumps and also give me a surplus. I have a heat engine drive by the difference in the heat potential between the tropics and the pole.
2) I build a tower and place the two pipes into the atmosphere, with a radiator at the tops; the question is can I perform work by pumping a fluid?
The answer is no. I cannot perform work from the difference in the heat gradient between the ground and the troposphere.
I do not get your point Pekka
“I tend to avoid going to WUWT, because there’s too much to read elsewhere, and because picking up the interesting pieces out of the very large volume of noise is too much of effort.”
—-
Yep.
Concur – we go from looking for needle in haystack to needle in hay hill.
Doc,
Your first system has the pump for the liquid, and it takes advantage from the fact that pumping liquid consumes much less work than a turbine can produce from expanding gas.
In the atmosphere we do not have pipes and pumps, we have just an open volume. The heat engine of the Hadley cell works as follows:
1) Air is heated at the warm surface, it expands and has a lower density than the rest of the near surface atmosphere.
2) The less dense air ascends. During the ascent it cools, but remains warm relative to other air at the same altitude.
3) High in the troposphere the air meets the stratified stratosphere, cannot rise any more and is forced to higher latitudes.
4) Staying in the upper troposphere the air cools by radiation to the space.
5) Rotation of the Earth combined with the polewards motion of the air leads to zonal winds and prevents further polewards movement.
6) The air has now cooled enough by radiation to raise the density and make a subsiding air flow easily downwards.
7) Near surface the air starts to move towards equator and the next loop on the Hadley cell.
Warming at tropical surface and cooling in high troposphere while moving to mid-latitudes lead to density changes that maintain the large scale motion. This is what the atmospheric heat engine is.
The mechanical energy produced by this heat engine is used in elevating water as vapor to make precipitation possible. That consumes work as raising water always takes. The mechanical energy of the Hadley cell is used also to force the motion of the Ferrel cell, which rotates “in the wrong direction” and therefore consumes rather than produces mechanical energy.
The same would not work well based on cooling of the polar region surface, because it’s important that the subsiding air is cooled before subsidence, not after it. Otherwise that part of the cell acts as a brake that stops the circulation or at least makes it very weak.
R. Gates, a Skeptical Warmist | January 21, 2014 at 10:07 pm |
“We would never have hurricanes then, which are highly organized forms of energy driven by all that “unorganized” ocean energy”.
What the hell are you talking about. If you are a fool it is best to keep quiet and let people guess, rather than speaking up and confirming it.
Hurricanes are driven by highly organised energy at the oceans surface that has not had time to dissipate. They are not driven by energy that has dissipated into the deep oceans and that has magically transformed itself into organised energy again and reappeared at the surface.
The engine for hurricanes is the transformation of water from its liquid state to its gaseous state powered by this energy at the surface. When water vapour molecules leave the surface they take their energy with them. heating the air above. However, it is not just the heated air that starts to move the atmosphere it is the presence of the water vapour itself. Saturated air is much lighter than dry air and that saturated air rises. This is the stronger effect. A steam driven balloon would rise about twice as strongly as an hot air balloon in actual fact.
If hurricanes aren’t happening it is because there isn’t enough energy at the surface to start them. Either the incoming energy has declined or the existing SSTs are lower meaning more incoming energy is required to start them.
It is sod all to do with any alleged insignificant deep ocean heating.
Alan
Few responsive responses to Willis. I too am perplexed at the apparent large quarterly changes in the OHC metric in light of the lack of change in CERES. We are comparing on a Joules to Joules basis. However, DocMartyn, it is an anomaly.
Pekka:
Your description of atmospheric circulation is fraught with so many basic misconceptions that all I can do here is recommend any competent introduction to descriptive meteorology and John Dutton’s “Dynamics of Atmospheric Motion” as a remedy.
“bill_c
We are comparing on a Joules to Joules basis. However, DocMartyn, it is an anomaly.”
I thank you and Willis for telling me that. However, I now have a philosophical problem, of the ‘if a tree falls in the forest and no one is there, do it make a sound’.
As the coverage of the ocean has increased, sensors are being added where none were ever present in the past.
Thus, to generate an anomaly plot, some scientists must estimate what the heat content was at some time period in the past.
How lucky it is that the scientists studying OHC, the same scientists who postulated that prior to actual measurement that ocean heat content was increasing, are the people who decided what the prior-instrumentation heat content was.
By sheer coincidence these scientists have discovered that their hypothesis that OHC was increasing is found when they subtract the ‘estimated prior heat content’ from the ‘measured heat content’ in different locals.
I wonder what expletives I can use without being permanently banned.
John S.
I tried to list those aspects of the circulation that are most essential for the “atmospheric heat engine”, i.e. aspects that contribute most to providing the driving force for the circulation. I that I tried to abstract out other phenomena not as crucial for this.
I have read several quality texts on the atmospheric circulation. I formulated my description in the belief that it’s consistent with all that. It’s presented in different words to get the level of abstraction I wanted to present. If something is, indeed, wrong on that level, I wish you make a more specific comment on that. Right now, I remain in the belief that the description is correct for the purpose it was written for, while it certainly cannot be comprehensive enough as a more general description of atmospheric circulation.
Dear PP
I had patented and prototyped a turbine for producing electricity from sea and river currents. Whilst looking at the river Nile in this context a set of figures turned up that appeared impossible i.e. when you stick dams on the Nile at Aswan you alter the water flowing into the river (rain) above the dams. Further research demonstrated on a statistical level provided with an exceptionally high degree of confidence that the resultant changes to the air pressure in the Nile delta and E Mediterranean altered two of the contributing factors to Easterly Wave Strata-Cumulus (EWSC) cloud formations that drift westward across the African continent and Equatorial Atlantic. Scrutiny of the Atlantic SSTs should therefore show a variability consistent with Sub Saharan rainfall/river flow. This has been the case. The resultant equatorial SST variability is consistent with published data for CC.
Go to ‘The Nile Climate Engine’ (NiCE) on YouTube. I make no apology for the lack of fineness of this presentation since every individual and institution to date has managed with few exceptions to avoid dealing with the matter. You seem to be a learned person that is not afraid of confronting harsh issues, so I would be grateful if you were to apply your intellect to point out the flaws in the NiCE issue. I have plenty more background info available to answer the questions you will probably ask so don’t feel shy to dive in. Conor
CM,
I have too little knowledge on that level of detail to comment on your question.
I can only tell that research related to tropical clouds is an important filed of study and papers are continuously published on that. You can see that searching by words tropical cloud in Google Scholar. It’s not an issue that has been forgotten but it seems to involve a lot of difficult questions. Therefore definitive answers are still missing.
Yeah, it’s clouds, we don’t know where or how and I suspect there are hundreds of Aswan High Dams being constructed and deconstructed every second, not that examining a concrete example isn’t worthwhile.
================
KIM I would have found myself saying the same thing but for the fact that the mass of water allowed to flow thru the dams varies the same as the principle rainfall (Ethiopian Highlands & Blue NIle flow) above the dam. Since the Aswan Complex had been built and enlarged three times one has to ask is this a coincidence or not? Taking evaporation, air pressure, wind vectors and other rleveant factors into account one has to begin to appreciate that the effects of the Nile flood management does affect two of the variable factors relevant to Easterly Wave (EW) formation. Since these EWs provide the equatorial Atlantic with cloud formations the size of Europe, varying the EW mass will affect Atlantic SST. Into this area we can add that the Nile flood evapotransportation provided 6,000m3/s of moisture into one of the planets driest regions i.e. the northern fringe of the ITCZ, thus prompting a negative charney effect – there is more than sufficient grounds to examine this issue. I have also taken a serious look at other such river management projects and how they effect SST (since fresh water floats on brine) and am considered at the Mississippi and Amazon, they do not seem to be having the same magnitude effect as the Nile problem.
PS. there are 40,000 large dams ie above 30m high, though location is the issue – Yangtse and Yellow rivers will obviously affect the SST/salinity of the Pacific currents heading north towards the arctic.
Pekka:
Your description patently conflicts with the following geophysical realities:
a) Water vapor is lighter than air and adds extra lift to thermally forced convection.
b) The stratosphere presents no physical barrier, as such, capable of deflecting deep tropical convection poleward.
c) Tropopause temperatures are higher in the tropics than at temperate latitudes where persistent subsidence takes place.
d) Local pressure gradient forces act immediately upon near surface air without waiting for any inertial effects of subsidence to make it “start[s] to move towards equator .”
Inasmuch as you believe that the Ferrel cell “consumes rather than produces mechanical energy,” the question of precisely what work is done by the “heat engine” remains largely unanswered.
P.S. Although WUWT is notorious for presenting entirely ludicrous notions of geophysics by unqualified blog stars, self-taught Willis often displays better physical intuition than many with academic degrees.
John S,
I don’t see in your comment a single point that would be relevant for my description of workings the atmospheric heat engine at the level it’s supposed to be. All go to details that are beyond the point and mostly rather semantic than real substance. I have also checked again what Wallace and Hobbs: Atmospheric Science write on related matter and found that everything is in full agreement with my text.
Searching for related matter from net I found this picture that describes the same ideas (I hadn’t seen this before). The picture is from these lecture notes.
I’m ready to admit that my comment was written rapidly as a comment in discussion rather than formulated with great care. I might change some wording if I would spend more time on that. As I already wrote, the purpose of that comment was a single one, to tell, how the atmospheric heat engine converts temperature differentials to heat. It was a response to a comment of DocMartyn, I had already made my comment on what Willis Eschenbach had written.
Pekka:
Predictably enough, you retreat from engaging entirely substantive points about unfamiliar geophysical realities by passing them off as “semantical” and then finding comfort in the handwaving notions of soft-science curricula. This prompts me to reply allegorically. The Winter War was not won by hunkering down behind the Mannerheim Line, but by deploying ski-troops keenly alert to the realities of their environment–and possessing ample “sisu.”
Upon re-reading my points in today’s earlier comment I caught a grave editing mistake: Item c) should read “tropopause temperatures are COLDER in the tropics…” Perhaps this correction will persuade Pekka that more than “semantics” are at issue here. Likewise, I presume that he meant to say “convert temperature differences to WORK” and not “heat,” as written.
John S,
Top of troposphere is colder in tropics because its altitude is higher, but the actual temperatures are not what’s important for this process but potential temperatures, which are higher in tropics. That’s one example of details that I left out to make the points clear.
I was not writing a book or even a lengthy article, I was explaining in simplified terms one physical phenomenon. It should have been clear to you, and should have stopped you from making unsubstantiated blanket statements. Furthermore the concept of atmospheric heat engine is not ofter used directly in actual science as far as know, it’s rather a way used to help understanding one important aspect of the Earth system.
I may sometimes formulate my comments a little differently from what can be read from standard texts because I’m not an atmospheric scientists but a physicist who has only recently learned about atmosphere. I try, however, to keep the physics the same. It’s just natural for me to search for new ways of describing the same basic content.
John S.,
I can answer also point by point:
So what? Does the existence of an additional component change the argument to the least.
Troposphere is by definition that part of the atmosphere where the main circulation takes place. That’s what this argument needs.
Taht I have already answered, and here you made a major error yourself.
This is a place where I made a simplification in the presentation by purpose. I don’t see anything wrong in that.
Here is one paragraph from Wallace and Hobbs
Closed circulations like the Hadley cell, which are characterized by the rising of warmer, lighter air and the sinking of colder, denser air and the prevalence of cross-isobar horizontal flow toward lower pressure, release potential energy and convert it to the kinetic energy of the horizontal flow. Circulations with these characteristics are referred to as thermally direct because they operate in the same sense as the global kinetic energy cycle. Other examples of thermally direct circulations in the Earth’s atmosphere are the large-scale overturning cells in baroclinic waves, monsoons and tropical cyclones. Circulations such as the Ferrel cell, that operate in the opposite sense, with rising of colder air and sinking of warmer air are referred to as thermally indirect.
This tells the fundamental difference between the Hadley Cells and Ferrel Cells. Maintaining a cell operating in the opposite sense consumes work. Ultimately all the work produced by the atmospheric heat engine is consumed in dissipative processes.
As I wrote, his articles have been one of the most common reasons for me to have a look at WUWT. The problem that I have met on several occasions is that he presents directly or implies claims of errors in main stream science while the only error is that he is missing some essential points well known to every competent atmospheric scientists and often obvious also to me as a physicist who has learned about atmosphere of own interest after retiring.
Studying data is fine, raising questions is also fine, but claiming or implying errors in science, when own understanding is in many ways incomplete is not fine.
Well, Pekka, this exchange is going nowhere.
In an earlier comment you wrote: “Warming at tropical surface and cooling in high troposphere WHILE MOVING TO MID-LATITUDES lead to density changes that maintain the large scale motion. This is what the atmospheric heat engine is.” Now that I have pointed out that near-tropopause temperatures are actually COLDER in the tropics, you point to POTENTIAL temperature, as if that self-admitted “detail” mattered dynamically in a non-adiabatic process. And then you have temerity to say that I’m the one who made a serious mistake.
Later you also wrote: The mechanical energy produced by this heat engine is used in elevating water as vapor to make precipitation possible. That consumes work as raising water always takes.” Now you say “so what” if vapor is lighter than air.
There is no substantive basis for your assumed instructional role here. And I have better use for my time than pointing out other fundamental mistakes that you make in the context of geophysics.
I start to feel that the problem is in the subject of this exchange The Atmospheric Heat Engine. As I already noted I don’t know about any significant role for that concept in detailed understanding of the atmosphere. It’s an old concept linked to Lorenz (but I don’t know exactly his role in the development). It’s mentioned in many textbooks, but typically only in a cursory way without any further role in the description.
The general attitude seems to be that it has some merit in understanding qualitatively the atmosphere. I referred to it criticizing the way Willis Eschenbach had used it, then as answer to DocMartyn I explained what the nature of the Atmospheric Heat Engine. As far as I know not well established theory of it exists, only these qualitative descriptions. Some papers have been written also on its efficiency, which has been found low.
Evaporation and the share of lightness of water vapor in causing lift is part of the heat engine process. Falling of rain as droplets is part of the dissipative processes where work is lost. There’s nothing illogical in my observation that lifting water is part of the work the heat engine does, even when the water vapor itself helps in driving the heat engine. Using heat in vaporization and creating an uplift is an integral part of the concept, but the share of the vapor in the uplift is not so essential that it’s often mentioned separately.
John S. surely knows atmospheric physics, but he seems not to know what the concept of Atmospheric Heat Engine is, what it’s used for and what to expect of discussion of it. Therefore he accuses my comments of something that they were not aimed to be, and what they could not be. Atmospheric theory does not need this concept, but it has been invented and used by well known atmospheric scientists, and in this particular case its use by Willis Eschenbach was the reason from bringing it up.
There’s precious little scientific sense in invoking Ill-conceived, non-rigorous notions of an “atmospheric heat engine” that ostensibly drives air like a ferris-wheel, when the underlying dynamics of atmospheric circulation are materially different. What both Willis and Pekka miss is that climatic temperature gradients high aloft (http://www.ncdc.noaa.gov/file/1328) bear little resemblance those found near the surface, where pole-ward heat transfer largely takes place.
My point was that Willis used the concept of atmospheric heat engine erroneously. That resulted in conclusions about the heat transfer from equator to the poles.
Thus we seem to agree with John S on this.
I think we would have agreed on everything from the beginning if he had tried to figure out, what I was writing about, and why I did that.
No way, Pekka!
Maybe it’s better to start off with a blank sheet of paper and take a close look at the energy budget. Its more likely we made a bad assumption somewhere along the way than the deep ocean hiding the warming. That almost reeks of the dog ate my homework. .
That approach doesn’t, and can’t work in dynamic system.
Imagine a case where A goes to B at 2,000 s-1 and B to A at 1,999 s-1.
The overall flux is 1 s-1.
Now imagine that you can measure rates of A and B, but you don’t know how well, you suspect that you can measure at +/- %. With estimated error, you cannot measure the overall flux. If your estimate of your error is erroneous, you will estimate the wrong overall flux. The more fluxes you have in a system, the greater the difficult of working out what is going on. The more complex the system, the more it shows elasticity, system buffering or system inertia.
They way you normally measure the flux in a dynamic system is to stop one of the two fluxes. In the Earth system measuring the temperature drop along the track of a total ellipse would do this.
Or at night when the sun sets, consider it a slightly longer than normal eclipse.
Dr. Curry,
The first paragraph of your summary ends with the words “insufficiently unexplored.” I assume that is a typo. Otherwise, an excellent posting that will require me to read it multiple times to better understand. At first blush though, you seem to have shown that the Uncertainty Monster, is once again feasting at another pareidolic data analysis buffet.
thx for spotting the typo!
Professor Curry,
Thank you for this exposition.
Seems it sent the nasties from the last thread on their desultory way!
From the “Save The Bay” web site: Area of ocean is 362 million km^2, and average depth is 3720 meters. The percent of the ocean water (granted it’s a very important part) represented by the top 700 meters is less than (700/3720) x 100% = 19 %. Less, since only a portion of the ocean is greater or equal to 700 meters. The point being that the capacity of the ocean to store heat is massive. We know there is a very slow flow at depth. so the deeper than 700 meter ocean can be a sink for heat without a significant rise in temperature. I cant imagine that heat is going anywhere anytime soon. Of course there is layering, etc. but heat transfer will occur on long timescales.
“Some climatologies show no trend since 2003, whereas others show continued warming.”
____
Our very best data, including both direct Argo measurements as well as Jason and Topix show a continued upward trend since 2003. Down to 2000m, the approximate gain of 0.5 x 10^22 Joules of energy per year on a global basis has the lowest amount of uncertainty in the 2003-2013 decade. The sea level rise data combined with the Argo data combined with the glacial mass loss estimates provide a pretty strong triangulation of continued gain of energy in the climate system with the majority going to OHC gain since 2003. The expansion of the Argo program over the next few years will add even more floats that go deeper more consistently, reducing uncertainty even further and filling in the details at even abyssal depths.
“. . .it is very difficult to imagine how this heat could reappear at the surface. . .”
Exactly. The proponents of this theory not only have to prove it is happening, they also have to show by what method and to what effect it could reappear later at the surface.
It feels to me like they’ve simply (and belatedly) discovered the PDO, and seem at pains to make it sound like something else instead so they don’t have to deal with the implications of a 30 year on/off cycle will have on their models which were turned only for the “on” cycle.
Geo, apparently the heat transfer mechanism has been identified: “sloshing”.
Prof Curry, thank you for a good post. I think the idea that “50% coverage” of a region has been obtained is pretty fanciful..In fact, only a tiny fraction of the ocean has been sampled, and less and less the deeper you go. On present evidence, the “changes” at depths (say 300 – 700 meters) are indistinguishable from the effects of drift of the buoys, a point I attribute to a post by Willis Eschenbach at WUWT.
Judith it’s funny you are taken by the surprise that warming increases with depth in the Trenberth paper. As mentioned that paper uses ORAS4. ORAS4 has a website
http://www.ecmwf.int/products/forecasts/d/charts/oras4/reanalysis/
That page has a very prominent disclaimer.
“Disclaimer. There is large uncertainty in the ocean reanalysis products (especially in the transports), difficult to quantify. These web pages are aimed at the research community. Any outstanding climate feature should be investigated futher and not taken as truth.”
I guess when you spent a couple of years convinced there is missing heat then maybe you don’t worry too much about disclaimers when a product gives it to you or you just don’t think the result is at all outstanding or possibly distant from the truth.
(BTW we should praise ecmwf for such an appropriate and clear caveat to their product, more of that would help with perspective)
“Disclaimer. There is large uncertainty in the ocean reanalysis products (especially in the transports), difficult to quantify. These web pages are aimed at the research community. Any outstanding climate feature should be investigated futher and not taken as truth.”
The treachery of images,Ceci n’est pas une pipe! ie the map is not the territory.
maksimovich
the phrase “Ceci n’est pas une pipe” has a quite different meaning to a native French speaker.
The phrase ‘une pipe’ has a rather naughty meaning as you will find if you turn your safesearch off.
Speculatively, anyone care to hazard a guess (in joules or Hiroshimas) what the maximum heat carrying capacity of the World’s oceans is?
Seems to me like the current slight warming of the ocean (if such exists) is most likely just a delayed response to surface warming over the late 20th century. Isn’t this exactly what you’d expect?
Such a lagged response might tell us something about what surface temperatures did in the past. It says absolutely nothing about what they might do in future.
99,9999% of the world ocean’s surface / bottom ares is UNSAMPLED – the ”guessing” work is bias, because has being done by the Propagandists
Dr. Curry,
There is a variety of physical processes that can contribute to changes in ocean volume, including tectonic activity, undersea eruptions of magma and thermal vents, and silt deposition. As 1 mm of sea level rise corresponds to a change in volume of around 360 km^3 from all causes it would seem at least plausible that physical volume change could contribute as much to sea level rise as any of the factors listed below:
AR5 (1993-2010)
Thermal expansion 1.1
Glaciers and ice caps 0.76
Greenland ice sheet 0.33
Antarctic ice sheet 0.27
Land water storage 0.38
Sum 2.8
Observed sea level rise 3.2
I don’t know how to find out, but physical volume change should be listed, if only to be dismissed, if justified.
I got only 0.1 mm y-1 for silt from rivers.
@ DocMartyn
” I got only 0.1 mm y-1 for silt from rivers.”
I read somewhere that there are thousands of undersea volcanos and who knows how many of those under sea fountains (I can’t remember the proper name.) spewing magma and super heated water on the sea bed. We don’t know how many, other than ‘lots’, but whenever a section of ocean floor is examined closely it seems to be followed by headlines reporting ‘unsuspected’ venting of all kinds of hot stuff, in large quantities.
In addition, you don’t have to shove the continents around much or drastically raise or lower the floor of the sea to change total volume of the ocean basins by a few hundred km^3. Both are happening continuously, but at randomly varying rates. The signature would be random rise and fall of sea level. Although the trend line from undersea discharges and silt deposits is clearly positive, the collective trend line from all physical volume changes could be either positive or negative and could change abruptly.
The trend line is currently positive and is attributed to thermal expansion and increased ice melt caused by AGW. Is it? Do we really have the instrumentation system in place to measure the temperature trend of the entire ocean with milli-degree precision, over decades, account for all non-thermal factors affecting sea level, and extract the ACO2 signature from the thermal factor, as is currently being done and cited as confirmation of AGW?
For me, the question is purely rhetorical; the experts answer: ‘Sure; easy peasy. That’s why we are drawing down the big climate science bucks.’
All this would be of ‘angels dancing on the head of a pin’ importance if the experts stopped at ‘We have measured the temperature of the total ocean and found that it is has been rising by a couple millidegrees per year.’ (which would be fun to have a technical argument about, on its merits, starting with ‘Oh reallllyyyyy??’). Instead, they proceed directly to ‘The rise in temperature, unprecedented in human history, provides positive confirmation of ACO2 driven global warming that will prove disastrous unless immediate action is taken to drastically reduce our use of fossil fuels.’. And start collaborating with their political sponsors as to the rules, regulations, and taxes (carbon fees?) that need to be imposed on us, immediately, by decree, without bothering any pretty little congressional heads.
Hi Judith,
Thanks for an interesting discussion if the uncertainty in OHC.
You wrote: “it is very difficult to imagine how this heat could reappear at the surface in light of the 2nd law of thermodynamics.” I don’t think about it that way. Slow upwelling of cold water at low to mid latitudes (a few meters per year) represents a continuing ‘cooling effect’ of the deep ocean on the surface temperature in those regions, at an average rate of ~8 watts/M^2. Presumably if the deep ocean warms significantly, that could eventually reduce the level of surface cooling due to upwelling, since there would be less overall temperature change between the deep and the surface. So there could be some additional future warming due to sequestration of heat in the deep ocean. But in practical terms, a very slight warming at great depth is not going to have much influence on the surface energy balance any time soon; the deep is ~20C colder than the surface, and the warming at depth well under 0.1C.
Fred Singer has some nice words for you Judy.
http://www.americanthinker.com/2014/01/the_inventor_of_the_global_warming_hockey_stick_doubles_down.html
Judith and Holofernes (Judith 13,1-10)
“Judith was left alone in the tent, with Holofernes stretched out on the bed, for he was overcome with wine (Judith 13,2)…
She went up to the post at the end of the bed, above Holofernes’ head, and took down his sword that hung there. She came close to the bed and took hold of the hair of his head, and said: “Give me strength this day, O Lord God of Israel!”. And she struck his neck twice with all her might, and severed his head from his body (Judith 13,6-8)…
After a moment she went out and gave Holofernes’ head to her maid (Judith 13, 9)”.
Big fun from the OT!
The clearest one I have seen is this one for 0-2000m.
http://www.skepticalscience.com/pics/Levitus2012OHC.jpg
Also sequestration in the deep ocean doesn’t require mixing. For example, I think that the PDO spreads colder upwelling East Pacific water westwards over a greater fraction of the Pacific, and therefore leaves less surface room for the warmer water that deepens as a warm pool in the West Pacific. It is this deep pool that is the sequestered heat, and part of it is ready to return to the surface in the next El Nino when the prevailing easterly equatorial winds switch off. Also as the PDO switches to a warm phase the Pacific surface warms as the colder upwelling area retreats and more sequestered heat returns to the surface as the warm area spreads eastwards.
As you know, a growing cloud can expand adiabatically due to its large size. I was thinking that perhaps if a large area of ocean water became much more dense due to salt concentration than the surrounding water, maybe it could sink as a large blob and do so more or less adiabatically. Even if that happened, it has to remain large for the heat to be retained. And even at that, water is a much better conductor of heat than air. The blob might spend decades in the medium to deep ocean. It’s hard to see how it could retain its heat even without mixing.
But a large shallow layer such as you describe would almost certainly equilibrate with the water surrounding it, even without mixing. And, to top it off, mixing is known to exist in the … errr … well-mixed layer.
Here’s an animation of an El Nino. Warm water is piled up in the west and spreads east.
http://svs.gsfc.nasa.gov/vis/a000000/a000300/a000351/a000351.mp4
Very nice visual, it is just as I imagined it, its is a resentment heat engine, like a put-put boat or pulse jet engine
Watch the energy pass through the layers undetected.
I like that animation, JimD. But as you can see, the water stays near the surface. It doesn’t sink, move around the ocean for a few decades, the surface to ambush us with unremitting heat. (OK, there was a bit of drama a the end :)
I watched it for several minutes and if something is passing through something undetected, it is undetectable. Or does one have to keep staring at it, until one becomes dizzy in the head? This is the type of stuff that wins them Nobel Prizes these days.
Whatever. Trenberth did not say that heat sequestered in the deep ocean would return to haunt us. That is the interpretation of blogs, and it is dumb.
He said warming will come back to haunt us.
OOooooooo! OOOOoooooooooooooo!
The blog interpretation of his travesty quote is equally retarded.
So jchy, are you conceding that the heat hiding in the deep oceans will not come back to haunt us? We don’t have to worry about that heat anymore? Your personal assurance would be reassuring.
Concede?
I’ve been saying exactly that here for a very very long time.
The key is that the average temperature of the top layer changes from cool to warm, and nothing more is happening than a sloshing motion. A similar thing happens on a slower larger scale with the PDO when the cooler water moves over from the east.
Jim D – I’ve used the term sloshing, but I do not like it because I do not think it describes it. It implies a shallow surface event, and whatever happens, takes place fairly deep.
Has to.
Jim D | January 21, 2014 at 10:00 pm said: ”Also sequestration in the deep ocean doesn’t require mixing”
What do we want? Global warming! When do we want it? NOW!!!. What do we want? Global warming! When do we want it? NOW!!!.
So that everybody can leave in a tropical paradise, like me.
For the PDO it is better to see it as deep upwelling cold water spreading westwards through the upper layer, cooling it relative to the deeper layer. This gives an impression of sequestration, but is also like a deep sloshing of colder water from a cold column in the east.
“JCH | January 21, 2014 at 11:05 pm |
Watch the energy pass through the layers undetected.”
The heat content of the two is identical. You would only find a difference if your sampling was biased, and this would only occur if your sampling was poor……wait a minute
The 2nd profile is the dominant profile during the 16-year pause. Each day of the pause sunlight was drilled into the ocean.
Judith
The claim of missing heat hiding in deep ocean is debunked by sea level data. More heat should result to more thermal expansion and hence rise in sea level. The ave, rise from 1993-2010 is 3.2 mm/yr but the rise from 2005-2012 is 1.3 mm/yr. It actually slowed down indicating less heat.
BTW the first half of 20th century sea level rise is 2.0 mm/yr while second half is 1.4 mm/yr. So greenhouse gases are not heating the ocean. The simpler and more logical explanation for the warming pause is the climate models are wrong.
Amazing how you have so much certainty in the older data sets.
The older datasets were not conjured up by hysterical alarmists bit by the confirmation bias vampire. Climate science used to be in the academic backwater, before modern tin men (see movie) latched onto CAGW to propel themselves to fame and gubmint grants. If not for the discovery of “climate change”, a lot of them would be Phd cab drivers and sanitation engineers. The rest would be studying the sex lives of blue spotted pissants, or something equally esoteric.
“Amazing how you have so much certainty in the older data sets.”
R. Gates
Between NASA and NOAA data and your amazing hand waving, your older hand is certainly hilarious.
The main issue of interest is to what extent can ocean heat sequestration explain the hiatus since 1998.
I don’t understand Curry’s point – I don’t believe anybody is arguing that all of the hiatus is linked to ocean heat sequestration to the exclusion of oceanic oscillations. That the ocean heat content is rising while surface temperatures flatten out is consistent with an energy imbalance that is visible in ocean heat content trends and satellite measurements. This is a telling argument against those who claim that the temperature record can be almost wholly explained by ocean cycles. The point that could be argued about regarding Balmaseda is what it says about climate sensitivity i.e., higher than the sensitivity derived using Levitus OHC measures. While the Balmaseda results are debatable, ocean heat sequestration is indeed consistent with the hiatus in surface temperatures. I don’t understand why Curry seems to be setting up a strawman argument implying that the hiatus is entirely due to ocean heat sequestration.
Yes, I had a similar question. The OHC has clearly risen during the pause, and that would be supported by any of these plots shown. So what was the question?
Judith Curry’s post mentions hiatus concurrent with ‘missing heat’. It seems that the missing heat corresponds to an observed imbalance of ~0.6W/m^2 (Levitus) as opposed to the 0.9W/m^2 that Trenberth obtains in Balmaseda et al and which would raise sensitivity estimates above that obtained in Otto et al. I don’t believe the argument is ‘hiatus=missing heat’. Thus, a strawman.
Well, if sequestration is not happening, or is far less, then what is CS?
Sequestration not happening? Far less?
Nothing supports that sequestration didn’t happen in the pause. The OHC went up, but the surface temperature did not change, so the heat was sequestered below the surface, by definition.
Assume for a minute that there was no sequestration of energy in the oceans during the pause, which a lot of people here are claiming. if that were true, it would imply what about climate sensitivity?
JCH, in that unlikely event, it would tell us more about the forcing than the sensitivity. It would imply that the CO2 forcing of near 2 W/m2 has already all been balanced by something, presumably a combination of increased aerosols, increased surface temperature, reduced other GHGs, increased clouds, increased surface albedo, and/or a weaker sun.
If the hiatus since 98 is explained by more heat being sequestered into the ocean than the ocean can’t just increase it must accelerate the increase. If the previous warming period ~1980-1998 had the same rate of acceleration as the post 98 period than all the heat could not have possibly moved from the atmosphere to the ocean.
I don’t think the data is good enough to tell us pre Argo an accurate rate. So she pointed out SLR has not accelerated. You could still argue heat is being added to the system but you’re still left with the issue that the amount being added has reduced post 98 when it should have increased. So the heat is still missing.
” than all the heat could not have possibly moved from the atmosphere to the ocean.”
—–
That’s right, because the net flow of energy is massively from the ocean to atmosphere on a global basis, and at any given time at least 50% of the energy in the atmosphere came directly from sensible or latent heat flux from the ocean. The net flow never goes the other way– ever.
“I don’t understand why Curry seems to be setting up a strawman argument implying that the hiatus is entirely due to ocean heat sequestration.”
—–
It is indeed a bit confusing. By several metrics, the oceans have continued to gain energy quite steadily during the “pause” in tropospheric” temperatures. That this pause is mainly due to a very slight slowdown in the normal rate of sensible and latent heat flux from ocean to atmosphere seem increasingly likely. Judith would argue that if this is causing a flattening of temperatures now, how much did it help to warm them from 1976-1998 during the warm phase? What indeed is the real underlying warming from human GH gas increases? But underlying these questions is the assumption that these “natural” variations are not themselves being influenced by the highest GH gas levels since the Pliocene.
Curry might say something about the ’76-’78 warm phase, but either climate sensitivity is no more her expertise than many amateur bloggers or she is intentionally muddying the waters with a long screed about Balmaseda reanalysis and attacking the strawman of ‘hiatus=missing heat’. Which is not surprising from her past record of one-way uncertainty. Troy Masters has a better description of the missing heat issue and in fact makes a decent case (as previously described by Loeb 2012) for why it is possible that there may be no missing heat. Which has nothing to do with the steady uptrend in OHC/energy imbalance effectively destroying pseudo-skeptic claims about warming being due to heat redistribution.
RB > I don’t believe the argument is ‘hiatus=missing heat’. Thus, a strawman.
It’s a reasonable precis of Trenberth, so hardly a strawman.
The professions of confusion over this, just above, are themselves confusing.
This most recent OHC data, closely paralleling both sea level rise and CO2 rise over past several decades upsets certain so-called skeptics:
http://tinypic.com/r/2ewmw3k/5
These three independently observed data sets are intimately connected, give exceptional confidence related to the gains of energy in the
Earth system, and say far more about the long-term external forcing the system is undergoing than looking at sensible surface temperature trends with the starting point being the height of the big 1998 El Niño.
Independent out-gassing?
Subsidence?
Until such time as a physical reason can be identified for why half of the OHC from the last 30 years was added in just the couple of years while calibrating to ARGO, I am going to have to assume the most logical reason is a calibration error. In other words, what ocean heat content increase?
That helps you avoid cognitive dissonance Steven. I can appreciate this basic response as your belief system is challenged. It’s very common here and elsewhere.
Gates, my belief system is that when you have a calibration period and something very unusual happens during that period, you should try to figure out why. And your belief system is?
Apparently Gates isn’t skeptical enough to even question anomalous looking data anymore if it supports his tastes…
If heat is sequestered down in the deeps, we won’t see hide nor hair of it for centuries or millennia. Good riddance.
This is an absurd notion, but helps you avoid the more serious and obvious conclusion. Greenhouse gases enhance the hydrological cycle and the basis of that enhancement is warmer oceans.
No we’ll see it but its effect will be different.
If the energy was staying concentrated in the ocean surface layer it would warm that layer faster (no heat leaking out into the lower ocean) and hence the atmosphere above it would warm faster too.
If the energy is not staying concentrated in the surface layer then it heats the bulk of the ocean slowly and the atmosphere warms slowly too.
This is in fact what we are ostensibly seeing with “the ocean ate my global warming” hypothesis i.e. the hiatus is energy going into the deep ocean instead of the surface layer.
One that heat is diffused through a much larger volume of water it can no longer cause rapid surface warming i.e. that ship has sailed away with the diffusion. R. Gates is trying to construct some kind of narrative about the heat not diffusing but somehow being buried in small hot pockets of water thousands of meters below the surface. That’s patently absurd. It it’s warmer it floats to the top. R. Gates is frantic and trying to push impossible narratives. If he believes his own silly narratives he’s ignorant and if doesn’t believe them he’s dishonest. I think it’s some of both.
“R. Gates is trying to construct some kind of narrative about the heat not diffusing but somehow being buried in small hot pockets of water thousands of meters below the surface. That’s patently absurd.”
—–
Apparently the many scientists who have been studying the largest and perhaps most important “pocket” of warm ocean water on the planet– the Indo Pacific Warm Pool (IPWP) have been wasting their time studying this “absurdity”.
On the other hand, perhaps what is absurd are people commenting about ocean heat storage who seem to know nothing about it and moreover, fail to grasp the heterogeneity of it and how indeed, there are large and extremely important “pockets” that form and that have major effects on the global climate, and most importantly, a warmer ocean means changes to the behavior of how warm water pools in these “pockets”.
Warm water piled up against Asia by trade winds is still a surface layer, Gates. Just a layer with greater than normal depth and smaller than normal surface area. The smaller surface area means it can’t transfer heat to the atmosphere as quickly and cold upwelling water on the opposite shore gets greater exposure so the atmosphere cools. When the trades let up the deep warm layer piled up against Asia spread out, thining and increasing its surface area in the process causing atmospheric warming.
That is a totally phucking different mechanism than warming caused by a well mixed non-condensing greenhouse gas. Write that down!
DS, yes, a lot of people call this natural variation. It is different from GHG warming. I think you wrote something correct there.
Again, just like in the travesty quote, people have totally misunderstood what Trenberth meant. He did not mean that sequestered energy in the abyssal ocean, as a for instance, was going to somehow reassemble into a blob of hot and shoot to the surface and warm the atmosphere.
It is just imbecilic to think that is what he meant.
The hilarious thing is he meant pretty much what DS just said.
kim is thinking the sequestered heat in the abyssal ocean is somehow going to be of benefit to mankind at the end of the holocene. It’ll freeze his butt solid.
R Gates –
What exactly has the IPWP got to do with “small hot pockets of water thousands of meters below the surface”?
Next thing you’ll be blaming aCO2 for sunspots!
Jim D | January 22, 2014 at 1:59 am |
“DS, yes, a lot of people call this natural variation. It is different from GHG warming. I think you wrote something correct there.”
I can’t discount the possibility that anthro-driven GHG rise doesn’t skew the balance between ENSO warm and ENSO cool. I do lean towards agreeing with webby that ENSO is a wash (net zero) with regard to average surface temperature. The problem is it might take a thousand years to balance the ENSO books and without knowing what drives the change in trade winds that drives the change in Pacific SST we can’t say with high confidence it’s a wash or how long it must be averaged to become a wash. If the interval for it to average out to zero is much longer than we could mistake a temporary imbalance with a duration of many decades or centuries for GHG warming. That’s a mistake that’s almost certainly already been made but rather with AMDO and PDO instead of ENSO.
> Gates is trying to construct some kind of narrative about the heat not diffusing but somehow being buried in small hot pockets of water thousands of meters below the surface. That’s patently absurd.
R Gates > Apparently the many scientists who have been studying the largest and perhaps most important “pocket” of warm ocean water on the planet– the Indo Pacific Warm Pool (IPWP) have been wasting their time studying this “absurdity”.
———-
Doesn’t address the crucial point : are the hot pockets thousands of meters below the surface though ? And do they stay there rather than getting dissipated, waiting for some opportune moment to rise up still united and end the standstill ?
There is a massive drop in temperatures from the surface of the sea to the underlying depths in the tropics and virtually none in the polar areas, in fact a lot of the polar surface temps are at or below zero.
Obviously the hotter water deep under the ice at the poles did not get any heat from the sun to be warmer and does not all have tropical water currents heating it, so where does the deep water get its heat from to stop from freezing. Is it just a pressure effect at greater depths.
If the majority of the heat in the water at depth is from pressure, friction and gravity effects how can the tiny amount of heat from the sun on the surface layers be of any consequence.
How do they measure water at depth under ice where they cannot get to floats at the north pole and how with Coriolis and varying solar insolation can they possibly compare it to OHC elsewhere.
angech | January 22, 2014 at 12:21 am | Reply
“Obviously the hotter water deep under the ice at the poles did not get any heat from the sun to be warmer and does not all have tropical water currents heating it, so where does the deep water get its heat from to stop from freezing.”
Salinity. Seawater freezes at -2C. Seawater also reaches its greatest density at -2C. Salt is responsible for both characteristics. It must have reached that temperature at the surface before any ice can form. When the ice forms salt is excluded and the higher salinity water right below the forming ice sinks like a rock but gradually mixes along the way down with warmer less saline water.
So where does the heat come from at the bottom? Mostly from the tropics in the summer but geothermal must also be considered. The crust underneath the ocean is very thin and below that thin crust it is millions of degrees Gore (haha) or thousands of degrees Kelvin.
Is it just a pressure effect at greater depths.
If the majority of the heat in the water at depth is from pressure, friction and gravity effects how can the tiny amount of heat from the sun on the surface layers be of any consequence.
How do they measure water at depth under ice where they cannot get to floats at the north pole and how with Coriolis and varying solar insolation can they possibly compare it to OHC elsewhere.
That is the wrong question. You should be asking why the water in the deep oceans is colder than the warmer layers of water above it, and the searingly hot magma in the earth below.
The water in the deep oceans actually got cold at the poles. Being denser than warm water it then sank and flowed out along the bottom of the ocean in deep ocean currents, eventually filling the depths of the ocean basins around the world. That cold water can’t pick up heat easily — sunlight doesn’t get down that far — but it does gradually warm. However enough fresh cold water comes in on the polar currents ensure that overall the deep oceans stay as cold as (but no colder than) the poles.
Thanks for your analysis Judith. I suspected as much. In one sense it may be true – that is; if there is a la nina phase where the cool ocean cools the atmosphere by transferring heat then some of the atmosphere’s heat must be transferred to the ocean. However, the thermal mass of the troposphere is very small compared to the thermal mass of the oceans so it would seem that it would take a long time for the ocean temperature to increase in a significant manner by this method.
“…if there is a la nina phase where the cool ocean cools the atmosphere by transferring heat …”
—
Do you even read what you are writing Mark?
Mark,
ENSO is a different phenomenon warming/cooling phenomenon driven by change in tropical trade winds. Anthropogenic global warming is driven by a well mixed non-condensing greenhouse gas that effects every meter of the earth’s surface.
La Nina doesn’t sequester energy thousands of meters below the surface. Warm water is driven westward by the trade winds piling it up where it runs up against the Asian continent. The warm water is still at the surface it’s just a deeper layer with less surface area to warm the atmosphere. Colder water upwells in the eastern Pacific to replace the warm water driven westward. When the trades let up the warm water piled up against Asia spreads back out eastward decreasing the depth of the warm layer and increasing its surface area. The larger surface area then effects faster warming of the atmosphere.
Gates is trying to make an argument that warming caused by a well mixed non-condensing greenhouse gas somehow causes warm pockets of water to exist thousands of meters below a warmer surface. That’s simply ridiculous. Gates simply can’t admit that the ocean ate his global warming and once eaten it isn’t coming back except so slowly it won’t be noticeable. Instead the ocean surface being a lot warmer for a short period of time (rapid global warming such as 1980-2000) the ocean surface will be a little warmer for a long period of time (slow warming such as 2000 – 2014 and still slow).
Gates appears to be in denial. He simply can’t admit defeat and will go down making up increasingly unphysical narratives to explain how the earth is still warming at scary-rapid rate. Skeptical warmist? Hardly. Gates is about as far from skeptical as one can get.
Mark,
Unfortunately Mr. Springer knows just enough to seem credible, but in fact is quite mistaken about my positions and the actual science behind what increased GH gases do. It has been observed that the large Indo Pacific Warm Pool, has indeed been expanding westward, as climate models have shown would happen under the influence of increased GH gas forcing. This is just part of that additional energy that the oceans are gaining. For actual science, as opposed to Mr, Springer’s half-truth misinformation, see:
http://link.springer.com/article/10.1007/s00382-010-0984-y
The full article is here:
http://download.springer.com/static/pdf/353/art%253A10.1007%252Fs00382-010-0984-y.pdf?auth66=1390546022_155deca808aba423326dfc7d24846b9f&ext=.pdf
And makes excellent reading for those really interested in seeing why warmer oceans from GH forcing have real effects and the energy is hardly just harmlessly diffused away.
It makes lots of big scary hurricanes. Don’t it, gatesy?
http://coaps.fsu.edu/~maue/tropical/global_running_ace.jpg
R. Gates, a Skeptical Warmist | January 22, 2014 at 1:45 am |
Mark,
“Unfortunately Mr. Springer knows just enough to seem credible”
Fortunately Mr Gates doesn’t know enough to seem credible.
This from the conclusion of this lengthy and excellent paper:
“The anthropogenic Indian Ocean warming response appears to be one of the most consistent (Hoerling et al. 2004; Barnett et al. 2005) and well understood (Du and Xie 2008) responses to greenhouse gas emissions. This anthropogenic warming appears to have already significantly altered the earth’s largest circulation feature and impacted its most food insecure inhabitants.”
But of course, these so-called “skeptics” will continue to blather on endlessly about: 1) whether the oceans are warming or 2) that the effects will be “harmless” . Such willful ignorance becomes suspicious and tiresome at best. The real science has moved on.
Gates is conflating a surface phenomenon caused by tropical trade winds pushing warm water up against a continent causing a deeper warmer surface layer (or trades slowing and letting it spill back out across a larger surface area with a well mixed non-condensing greenhouse gas that operates over every last bit of the earth’s surface, warm or cold, rocks or water, frozen or not.
Incredible. Is anyone other than Gates laboring under the misconception that CO2 does the same thing everywhere that trade winds do in the tropics?
I phart in your general direction Gates. Enjoy it it’s the only anomalously hot air you’re going to get for the next decade or three. LOL
Mr. Springer,
You not had time to read the lengthy and well researched paper I linked above which relates directly to model predicted and actual real world effects in increased OHC. You can do nothing but take your little petty ad homs. You are a victim of the paradigms you refuse to let go of, and are much poorer for it.
Gavin Schmidt must only know enough to seem credible too.
http://www.realclimate.org/index.php/archives/2011/10/global-warming-and-ocean-heat-content/
Quoth the Gavin: “Neither is this heat going to come back out from the deep ocean any time soon (the notion that this heat is the warming that is ‘in the pipeline’ is erroneous).”
And Judy Curry knows just enough to seem credible:
“And even if the heat from surface heating of the ocean did make it into the deep ocean, presumably the only way for this to happen involves mixing (rather than adiabatic processes), so it is very difficult to imagine how this heat could reappear at the surface in light of the 2nd law of thermodynamics.”
So let’s see we have one of the most recognized warmists in the world, Gavin Schmidt and one of the most recognized skeptics Judy Curry both agreeing that deep ocean heating isn’t going to come back to haunt us.
You appear to now be on the level of lolwot and max_ok, Gatesy. That’s bad. Maybe you should have a confab with Schmidt about the consequences of 2LoT and deep ocean warming if you don’t believe me or Curry.
Gates, that paper is about the distribution of SST.
You can’t just conveniently conflate it with OHC hiding away in the depths.
I don’t agree with either Gavin nor Judith on everything they posit about increasing OHC. A few areas that specifically don’t get enough discussion that result from increasing OHC:
1) The enhancement to the hydrological cycle
2) increased advection of energy toward the polar regions, both by ocean currents and of course the atmosphere (there is a large team studying the expanding IPWP and the effects on atmospheric circulation right now). Much of this advection can especially affect the Arctic.
3) Expansion of warm pools and the resulting climate changes as discussed in the excellent and lengthy and research linked above.
4) major changes to the biosphere in the ocean.
R. Gates, a Skeptical Warmist | January 22, 2014 at 8:04 am |
I’m confident that both Gavin and Judy will be happy to know you don’t agree with them.
Repaired blockquote….
R. Gates, a Skeptical Warmist | January 22, 2014 at 8:04 am |
I’m confident that both Gavin and Judy will be happy to know you don’t agree with them.
That these things will be effected in any significant way by 0.02C/decade rise in temperature below 700 meters is a silly just-so story. There is very little biosphere at that depth, the temperature rise is slow and miniscule, it can’t reconcentrate on the surface to make warm pools due to law of entropy, increased advection is just silly with no physical support mechanism, and the temperature rise isn’t large enough or close enough to the surface to effect the hydrologic cycle. You’re babbling Gates. You’re beside yourself seeing the church of carbon sin come falling down like a house of cards from the pause and now you’re seeing both your warmist heroes and skeptic enemies who are top shelf climate scientists agree that heat diffused into the deep ocean isn’t “heat in the pipeline” that will reemerge as rapid global warming.
The pause killed your cause, Gatesy. It’s all over but the crying. I was right you were wrong. I told you at the outset you were behind the wrong horse. Deal.
Pingback: Projection Training Intervals for CSALT Model | context/Earth
Judith Curry, please reflect that it is very EASY to imagine how “excess ocean heat can reappear”.
As an index calculation — that Climate Etc readers are encouraged to repeat for themselves — let us calculate the effects of an energy imbalance of 1 $/m^2, sustained for one millenium, upon a fully mixed ocean.
Input:
rules = {
    energyImbalance -> 1 W/m^2,
    oceanVolume -> 1.3 10^9 km^3,
    specificHeat -> 4.2 J/(K cm^3),
    earthRadius -> 6400 km,
    earthArea -> 4 Pi earthRadius^2,
    warmingRate -> energyImbalance * earthArea/
      (oceanVolume*specificHeat)
};
warmingRate//
  ReplaceRepeated[#,rules]&
------------------
Output: 3.0 K/millennium
The result of three degrees (Celsius) of top-to-bottom ocean-warming, per millennium, per Watt of sustained energy imbalance, surely is easy to remember!
Conclusion Warming induced by energy-imbalance is negligible on decadal time-scales, overwhelming on millennial time-scales.
Who thinks on decadal time-scales? Teenagers, politicians, ideologues, and corporate planners … all who have NO care for the future.
Who thinks on millennial time-scales? Farmers, grandparents, religious leaders, and artists … all who have GREAT care for the future.
Conclusion Judith Curry, worldviews that are exclusively concerned with decadal fluctuations are fated to moral, political, economic, and scientific irrelevance.
Readers of Climate Etc are well-advised to listen, with respect illuminated by science, to Wendell Berry’s Hopes for Humanity.
Aye, Climate Etc lassies and laddies, now *THAT’S* moral foresight & scientific imagination for yah!
“Who thinks on millennial time-scales?”
Con men and idiots. Technological advance is not only not predictable it’s unimaginable in millenial time-scales. Name someone in Plato’s time that anticipated the world wide web or nuclear power.
Pffffffffffffffffft!
Fan says “Who thinks on decadal time-scales? Teenagers, politicians, ideologues, and corporate planners … all who have NO care for the future.”
_____
I must confess I usually don’t think beyond the coming weekend, but I am concerned about the environment for the sake of future generations.
Fan, why?
You’re making a foaming-at-the-mouth jarhead look rational.
Here is the simple explanation of the “non-missing heat” in OHC,
On land CO2 forcing right now is about 4 W/m^2. This leads to a current temperature anomaly of 1.2C. No heat-sinking, and 4 W/m^2 in = 4 W/m^2 out.
On water, the CO2 forcing is still 4 W/m^2. However, 1 W/m^2 is sunk in the ocean heat sink and 1 W/m^2 is returned to the atmosphere as latent heat due to the strong evapotranspiration at the surface. The surface radiates the remainder of 2 W/m^2 leading to a temperature anomaly of 0.6C, half of what the land value is. The 1 w/m^2 latent heat essentially causes a negative feedback on the lapse rate so that the TOA remains at a roughly stable temperature. (BTW see Curry’s textbook Thermodynamics of Atmospheres and Oceans for the lapse rate derivation).
Overall the global temperature anomaly is about 0.8C which is derived as a 70/30 ocean/land split. That is dT = 0.7*0.6 + 0.3*1.2 ~ 0.8 C, which is the current measured temperature anomaly.
There is no missing heat in this model, but there is an acknowledgement that the negative feedback on the lapse rate is an important factor that suppresses a high climate sensitivity over the ocean. However, the sensitivity over land remains the same as it was before, so we still have an ECS of 3C to doubling of CO2 that we have to admit is correct, as it is based on the current observational evidence.
Web – I’ve been thinking about exactly that sort of thing all day.
A certain somebody thinks CS is even lower than Nick Lewis does. Lol.
Who could that be?
I dunno. I keep on incorporating the ideas of the skeptics and after working it out, it turns out that it is not what they imagined.
WHT,
Where does the energy lost up by the oceans through enhanced evapotranspiration end up in your explantion?
It certainly cannot accumulate in the atmosphere.
It is an abstraction to represent a smaller GHG forcing function, 3 W/m^2 rather than 4.
The negative feedback is that strong over the ocean apparently.
It is either this or the latent heat moves toward the land where it amplifies that warming. Think about the rain as a transfer of energy from ocean to land. The amount in this energy is enormous as it has been used to explain sea level height decreases in recent years.
Think about it. Somebody said the heat was missing, where did it go?
There’s more than one way to think long term. I like a cornucopian approach with more energy, more wealth, more control over nature and more individual autonomy. I find this preferable to a malthusian approach with malthusian experts deciding what boundaries should be imposed on us in order to acheave a sustainable stasis that could leave us more vulnerable to things like asteriod strikes or Yellowstone going off.
Ha ha, skeptics, this bud’s for you:
http://contextearth.com/2014/01/22/projection-training-intervals-for-csalt-model/
Hey, wha’ happen?
R. Gates, a Skeptical Warmist | January 22, 2014 at 2:16 am |
“You not had time to read the lengthy and well researched paper I linked above which relates directly to model predicted and actual real world effects in increased OHC. You can do nothing but take your little petty ad homs. You are a victim of the paradigms you refuse to let go of, and are much poorer for it.”
The paper was about tropical warm pools not OHC increase deeper than 700 meters. You are conflating two completely different things. I didn’t need to read farther than the title and first sentence to determine the paper you linked is irrelevant with regard to OHC rise below 700 meters and how that might effect surface temperature in the future.
“The paper was about tropical warm pools not OHC increase deeper than 700 meters. You are conflating two completely different things.”
—
Nope. The research was about the increase in OHC through the westward expansion if the IPWP– all as a result of the increasing GH gases.
The paper was about how the enhanced tropical warm pool in the Indian ocean, “caused by global warming”, appears to have caused increased drought in Eastern Africa:
It says nothing about deep-sea temperatures, although it does reference increased warm water and convection (i.e. tropical cyclones) in the Indian Ocean, which might, in turn, be involved with the 0-2000 meter trend in the Indian Ocean mentioned above (originally from Bob Tisdale). That in turn might possibly be developed into “an explanation for this regional variation in trends that relies on external forcing”. But this paper doesn’t do that, it looks more like an attempt to blame African drought on “global warming”, presumably laying the foundation for demands for aid from Europe and the US.
It also relies on Principle Component Analysis, which is a perfectly valid form of analysis, but, as we all know, can be mis-applied, inadvertently (or not), leading to erroneous conclusions.
Gates is very good at reading things which simply aren’t there. It seems to be a special talent of his.
AK.
Yup. The conversation here is about unexpectedly large OHC increase below 700 meters that isn’t observed passing through the surface (iow it’s been heretofore hidden from view) and the paper Gatesy links has nothing to say about OHC increase below 700 meters. We’re talking about apples and Gates wants to switch the subject to oranges in other words. I call that general practice a “literature bluff” insomuch as the bluffer believes his claim of relevance to the topic at hand, which doesn’t actually exist in the referenced paper, won’t be questioned due to sloth. In this case the paper opens up by saying the topic is oceanic warm pools and the topic here is anomalous warming of the abyssal ocean. Apples and oranges. The literature bluff fails.
@David Springer…
Actually, changes in temp and depth of “oceanic warm pools” could affect heat flow into the abyssal ocean:
Granted we’re talking about more modeling here, but mesoscale circulation driven by “daily and six-hourly momentum and heat fluxes” sound to me like something tropical cyclones could cause. So we have reason to suspect that changes to tropical cyclone activity in the Indian Ocean, perhaps driven by changes to the warm pool at the surface, could produce changes to the heat flux to the abyss.
AK | January 22, 2014 at 3:04 pm |
@David Springer…
“Actually, changes in temp and depth of “oceanic warm pools” could affect heat flow into the abyssal ocean:”
That’s nice but I remain more interested in how that heat gets out of abyssal ocean not how it gets into it.
Follow closely:
The explanation on offer for the hiatus is energy below 700 meters that wasn’t observed passing through 0-700 meters. IOW 700-2000 meters is heating faster than the surface layer. Indubitably energy must diffuse out of surface warm pools into the abyss. Heat flows from warmer to colder and a 30C plug of water floating on the surface is mucho warmer than the typical ~3C of the abyss. There’s no mystery to explain there.
The question is and remains how does energy migrate from a 3C abyss to back to a 30C surface? Say it trades places with 30C water through mechanical upwelling. Remember that because of the vast volume of the abyss the water down there is only 0.2C warmer after a hundred years of global warming. The very very slightly warmer temperature of the upwelling water isn’t able to heat the atmosphere more than that. Nobody truly sane Scotsman is worried about an 0.2C in global warming once per century causing death and destruction.
@David Springer…
Yeah, the whole “abyssal heat is going to bite us on the @$$” meme is ridiculous. But I am interested in the mechanism responsible for the heat flow, as a question of scientific curiosity. My guess is that the flow rate is random walking around depending on a number of factors, none of them directly connected to “global warming”. At most, it removes some of the “extra” heat from “greenhouse forcing”, most likely (IMO) it’s orthogonal.
Of course, the same could be said for global average temperature.
“The question is and remains how does energy migrate from a 3C abyss to back to a 30C surface?”
No that’s not the question.
“That’s nice but I remain more interested in how that heat gets out of abyssal ocean not how it gets into it.”
It need not literally get out from the abyssal ocean. All that’s required for heat to start accumulating again in shallower layers at a higher rate is for whatever mechanism now causing the disproportionate warming at depth to stop operating, or to operate at a reduced rate. Clearly, it hasn’t been operating forever. Meanwhile, the heating at depth (and continued sea level rise) is testimony of the continued top of atmosphere imbalance. So, when there will occur a reversal of the phase(s) of whatever mode(s) of internal variability that now are causing the disproportionate deep warming, then the heat will “surface” again, not from the abysmal depth, but just from the continued TOA imbalance.
The question is, is “forcing” from CO2 driving the TOA imbalance, or is the TOA imbalance simply the result of heat flow to the abyss caused by other factors? In which case, without the heat flow to the abyss, there wouldn’t be any TOA imbalance.
N.B., I’m well aware that single lines of “cause and effect” are myths, here and most everywhere. The heat flow to the abyss isn’t being caused by higher surface temperatures, so assuming its absence also assumes the absence of (or difference in) other factors that do cause it. These would be associated with other differences. And so on. Thus, the entire system would be different.
“The question is, is “forcing” from CO2 driving the TOA imbalance, or is the TOA imbalance simply the result of heat flow to the abyss caused by other factors?”
Both external forcing and internal variability jointly influence the magnitude of the TOA imbalance over short term periods. That’s because the upwelling of cold water associated with La Nina episodes or the cool phase of the PDO, for instance, delay the Planck response to an increase in external forcing and hence help maintain the TOA imbalance and help drive the ocean heat gain. Conversely, El Nino episodes temporarily drive surface temperatures higher and thereby reduce the externally driven imbalance. If there were no (or little) externally driven TOA imbalance to start with, then internal variability (cool PDO, etc.) could also create such a temporary imbalance on its own and thereby cause some amount of sea level rise (although land flooding resulting from La Nina episodes might have a larger compensating temporary effect over the short run). What are telling observations against the hypothesis of a largely internally driven imbalance are, on the one hand, the fact the sea level variations are relentlessly positive, irrespective the phase of the PDO, and, on the second hand, the fact that the rate of warming over land is larger than it is over sea (and also that the shallow (0-700m) ocean layer never actually cools).
@Pierre-Normand…
The Planck response applies to a radiating body with a single distinct surface. The Earth’s “radiating surface” is over 50Km thick, much of it full of cloudy air which reflects some always varying fraction of the incoming shortwave.
If heat flow into the deeper ocean (under 300m) is driven independently of Global Average Surface temperature or the “greenhouse” effect, then we have no reason to suppose that the latter produces any “global warming” at all. Hasn’t the sea-level rise been “relentlessly positive” since the end of the LIA?
“Hasn’t the sea-level rise been “relentlessly positive” since the end of the LIA?”
Maybe so. But the rate sharply increased. The average rate of sea level has been about 0.1 to 0.2mm/year over the last three millennia, and decelerating. It likely was negative for a few centuries leading up to the LIA. It then accelerated to an average 1.4mm/year over the 20th century and 3mm/year over the last 20 years. This evolution in sea level is roughly proportionate, within uncertainties, to the variation in anthropogenic forcing (ln(CO2 forcing) – aerosol forcing) over the last two centuries.
“The Planck response applies to a radiating body with a single distinct surface. The Earth’s “radiating surface” is over 50Km thick, much of it full of cloudy air which reflects some always varying fraction of the incoming shortwave.”
Sure. We can also suppose that internal variability drives the TOA further through cloud albedo change. This still fails to explain why the TOA always is positive (sea levels always are rising at roughly the same rate) irrespective of the PDO or AMO phases, or why such an internally driven TOA imbalance would only have suddenly kicked in after the industrial revolution, after having been ineffective for several millennia. But you’re looking for an alternate explanation of an effect that already has a known cause — anthropogenic CO2, methane, etc. — and an already understood physical explanation.
I am beginning to get boring here but the Inter tropical cloud mass, thus albedo is reduced since 1900 sufficient to account for all AGW. Unfortunately without any exception every meteorologist and ‘climate expert’ I have come across has pretended that this factor does not exist – perhaps using sub Saharan African rainfall and river flow as a proxy for ITCZ cloud mass might shed some light on this matter – and bingo there is a direct relation between the mid Atlantic sst variability and those other relevant features. But lets carry on with the pretense while the $CO2 keep rolling in.
Pierre Normand,
How do we know these:
1. How do you know the TOA imbalance was always positive (e.g.
a) before the industrial revolution, and
b) before satellite measurements?
2. How do we know TOA imbalance began or changed after the industrial revolution?
3. How do we know TOA imbalance was ineffective for several millennia before the industrial revolution?
@Pierre-Normand…
From the post above:
[…]
This is arrant nonsense. The TOA imbalance has only recently been estimated from measurements with an error an order of magnitude larger than the supposed value. And that “estimate” is based on several highly questionable assumptions. The whole thing is fuller o’holes than Swiss Cheese.
“1. How do you know the TOA imbalance was always positive (e.g.
a) before the industrial revolution, and”
I was pointing out that is was always positive *after* the industrial revolution (or at least since the last 130 years or so), not before.
“b) before satellite measurements?
2. How do we know TOA imbalance began or changed after the industrial revolution?”
We can infer this from rates of past sea level change which are very good proxies of average TOA imbalance. The rate of sea level rise over the last century (1.4mm/year and accelerating) is between 7 to 14 times faster than the average rate over the last 3 millennia (0.1 to 0.2mm/year and decelerating).
“This is arrant nonsense. The TOA imbalance has only recently been estimated from measurements with an error an order of magnitude larger than the supposed value.”
This is only true of the estimates that are based on measurements or the fluxes. But we can infer the sign and (rough) magnitude of the present and past (integrated) TOA imbalance from the combined effect on ocean heat content and the mass of the land based cryosphere. The sea level proxy is currently more reliable than estimates based on summation of directly measured radiative fluxes and it also extends much further back than satellite measurements.
“From the post above:
Note the high values in the early part of the century, nearly as high or as high as the value for the last two decades.”
This is mostly spin on the fact, consistent with the displayed figure, that the rate over the last 20 years of satellite measurements is twice the average rate over the 20th century and very much higher than the rate over the previous centuries. The statement, and the figure selection, emphasizes the noise in the sea level curve’s first derivative, and glosses over the facts that (1) the rate always is positive in that period, and also the fact that (2) the total amount of sea level rise over the last 114 years is comparable to the total amount over the previous two millennia. In short, one isolates and magnifies the wiggles in the blade of the hockey stick (using the first derivative) in order to distract attention from its steepness relative to the handle.
Pierre-Normand,
Sorry, that is blatant circular argument.
“OHC changes (thermal expansion) accounts for about 1/3 of the total sea level rise. What did this balance look like circa 1930′s to 1950′s? Presumably the land water storage and glacier melt was smaller, so the thermal expansion was more dominant in this early period. Which suggests that ocean heat content was greater in this early period than in the current period, and cannot be attributed to AGW.”
This argument would make sense only if variations in ocean heat content alone rather than the sum of both the variation in OHC and of latent heat from ice melt were indicative of AGW (i.e. indicative of heat gained from an externally forced TOA imbalance). But since the heat from AGW can be used up in melting ice just as much as it can increase OHC, the argument is invalid. Latent heat from recent ice melting can’t be discounted. Only the reference to land water storage is relevant, but Judith’s argument lacks quantification.
Peter Lang, what argument is circular? Sea level measurements, either from satellites, tide gauges, or geological proxies, don’t rely on global TOA flux balance estimates.
Pierre Normand
You began by arguing sea level was rising because of TOA imbalance had started after industrial revolution. I asked how do you know TOA imbalance started after the industrial revolution. You said because sea level started rising after the industrial revolution. That’s circular argument.
Peter Lang, there is no circularity. I never implied that our knowledge of the TOA is the ground for our knowledge that sea level rise accelerated after the industrial revolution. I have consistently argued the opposite. Our knowledge of sea level change over some extended period is the best ground for our inference about (integrated) TOA imbalance over that period (also because of the small heat capacity of the troposphere). Hence, sea levels vary mainly *because* of the TOA imbalance. This is the causal sense of “because”. That makes sea level variations a proxy for the integrated TOA imbalance. And hence we *know* (we infer) that the positive TOA imbalance has increased sharply in the recent 115 years or so *because* because we independently know that the rate of sea level rise has increased sharply. This is the inferential sense of “because”. Since “because” has both a causal and an inferential sense, there is no circularity.
@Pierre-Normand…
The notion of using sea level as a proxy for TOA energy imbalance is ludicrous (IMO). See here.
Nice review article, thanks, very helpful.
Basically seems to conclude there is no observational evidence for recent deep heating. Its a speculation at the moment. In addition there is no explanation for earlier periods of apparent rises in total heat content which are at least as fast and as large as any recent ones.
Its a bit reminiscent of the MWP arguments, with the same two basic points, no recent hockey stick, and a range of earlier fluctuations which are comparable to the recent ones.
The theory is starting to fall to pieces in front of us.
It’s actually starting to fall together, but whatever.
Just an hypothesis, actually
Again, we see old reliables like Jimmy old bean D, Gatesy et al pushing ideas without empirical data
Judith C made that plain in her opening post
Springer gave the best summary of the Nino/Nina oscillations, except it’s not the “Asian” continent that blocks the westward movement of trade-wind driven water, it’s the Aus continent and Indonesian/Phillipine archipelagos, acting like corks in bottles
michel, it heats down only so far. I forget how deep (maybe 2000 M), but when the heat reaches that point it stops as if it hit a brick wall, thus violating the 2nd Law of Thermodynamics. Future heat also stops at that wall (BANG !).
Max_OK, Citizen Scientist | January 22, 2014 at 3:28 am |
michel, it heats down only so far. I forget how deep (maybe 2000 M), but when the heat reaches that point it stops as if it hit a brick wall, thus violating the 2nd Law of Thermodynamics. Future heat also stops at that wall (BANG !).
————————————————————————
It doesn’t stop there. That’s where our measurement system stops! No thermodynamic laws were broken during the warming of the ocean.
“JCH | January 22, 2014 at 3:09 am |
It’s actually starting to fall together, but whatever.”
—-
Remember, this is a religion for some people, so they need to keep seeing what they’re believing, and if the data points to warming, it is the devil or a conspiracy.
michel, I was using sarcasm to make a point, the point being that the more the water at the ocean top warms, the more the water further down will warm. The deeper water also could warm at a faster rate than the water above because it’s starting from a lesser base. Just because we are unable to measure the water temperature below certain depths doesn’t mean the warming down there isn’t happening.
eh eh now that ohc is picking up again and not just at depth skeptics suddenly realize that uncertain exist too….only a few years ago flat ohc was there to disprove global warming.
http://www.nodc.noaa.gov/OC5/3M_HEAT_CONTENT/heat_content55-07.png
http://www.nodc.noaa.gov/OC5/3M_HEAT_CONTENT/heat_content2000m.png
WebHubTelescope (@WHUT) | January 22, 2014 at 2:52 am |
“There is no missing heat in this model, but there is an acknowledgement that the negative feedback on the lapse rate is an important factor that suppresses a high climate sensitivity over the ocean. However, the sensitivity over land remains the same as it was before, so we still have an ECS of 3C to doubling of CO2 that we have to admit is correct, as it is based on the current observational evidence.”
OMG. You are now agreeing with what I’ve been saying for the past year or two. The “missing heat” is a Trenbertherism. It came out in the Climategate email in 2008 or 2009 where he said “we can’t explain the recent lack of warming and it’s a travesty”.
But you’re right. I can’t find the missing heat either. There’s a TOA energy imbalance and its recent value is only 0.5W/m2 on the surplus side. That can cause some mischief over land, the dryer the land the more the mischief which makes frozen land (or sea ice) particularly susceptable, but for global average temperature not so much. The oceanic heat sink is working a little better than alarmists had figured which essentially turns worrisome rapid heating on decadal time scales into non-worrisome slow heating on centennial time scales insofar as the more rapid than expected mixing lasts.
TOA imbalance is at a low point and using the same methodology to estimate it it’s been as high as 1.5W/m2 which may be of some concern if it persists.
The flaw in the 3C ECS over land, webby, is that where it’s happening it’s a welcome change resulting in longer growing seasons, less snow to shovel, and less heating fuel needed in the winter.
I have never disputed that global climate disruption might be a problem it’s just that I can’t imagine how the net downside can come even close to exceeding the net upside all things considered. The things to consider are immense benefits of cheap energy that makes the developed world so productive, fertilization of the atmosphere for agriculture, lowering fresh water requirements per unit growth in agriculture, longer growing seasons, and less ice/snow in general. Downsides are sea-level rise and probably expansion of the desert belt which will likely accompany expansion of tropical, sub-tropical, and temperate climate regions at the expense of a reduction in polar climate type.
But perhaps the greatest downside is using up a finite supply of economically recoverable fossil fuels faster than is prudent without a cheaper alternative ready to take its place. I’m all for reasonable no-regrets conservation and investment in science & engineering for viable alternatives. I don’t consider wind or ethanol from corn to be viable alternatives. Most promising IMO are artificial leaves or synthetic biology to accomplish the same objective of cheaply gathering and storing solar energy. Nature does it she just doesn’t do it with liquid hydrocarbon fuels as a survival necessity but rather as an unwanted metabolic waste product. We just need to tweak existing metabolisms to make fuel production the primary reason for living. We then have to artificially protect those modified organisms from natural competitors that don’t waste metabolic energy producing hydrocarbons that don’t give it any survival advantage.
We protect them now in bioreactors that are kept sealed during production and periodically shut down and sterilized every few weeks. Eventually I see something more sophisticated like Round-Up on steroids i.e. we give the GM critters some fancy effluent pumps in the cell wall for toxic compounds without analogs in nature and then grow them in open ponds where the water is toxic to everything else and the effluent pumps too complex for natural evolution to produce one anytime soon in a natural competitor.
This is, IMHO the cleverest bit of genetic engineering in a decade
http://www.nature.com/nature/journal/vaop/ncurrent/full/nature12575.html
now the actual components are of the new cycle are ‘off the shelf’, but control of throughput is substrate levels dependent. Getting all of them to work in sinc is not easy.
You know that very few organisms can survive in an oil rich environment anyway. One could use the ‘oil’ product itself to act as a bacteriocide. A lot of work went into identifying the protective genes. This was done to produce bacteria that could be used to clean oil spills and oil contaminate ground.
A lot of this is plug in and play.
freeHat | January 21, 2014 at 6:01 pm |
“But if this is the case, that heat is making its way to the depths of the oceans, this means that it has always been happening — why would the system decide to start doing this just now? This must surely warrant major changes to the climate models, no?”
It may have “decided” to do that in response to a reduction in Arctic sea ice. That’s my guess anyhow.
But the warming is apparently confined to the North Atlantic and Indian ocean basins. OK – I could see the North Atlantic maybe responding to less Arctic ice in this way – fair enough. But the Indian ocean? The explanation seems to be lacking a few crucial steps.
Pingback: Global Warming Pause Goes Mainstream But No One Can Explain It | Leon Clifford
I knew I shouldn’t have poured a cup of coffee at 11:30pm and then took my laptop out of hibernate to see if Curry had posted the OHC article she’d promised yet. Good think I don’t have to wake up at any specific time but still I don’t like getting my early to bed early rise schedule messed up and risk interrupting a continuing state of healthy, wealthy, and wise.
Good night all. It’s been real. It’s been fun. But it hasn’t been real fun except when Gatesy started trying to invent a perpetural motion machine that could concentrate deep ocean energy without doing any work.
At David Springer,
I don’t know if you say it but on teh last thread I posted a reference to a thousand year return time from the deep ocean thermohaline conveyor current to resurface in the mid latitudes. You posted an estimate of the 0.02*C rise in temperature of that water. We have a long time till the heat comes back out. Why don’t the CAGW warmest understand?
First thing needed is lots of ocean sample data collection.
Even the heat flux from the volcainic crust openings needs to be measured at eepth.
Scott
I agree that more data is good and we don’t have much in the way of how much heat leaks into the ocean from the mantle. The facts on the ground however seem to be that if heat was leaking out of the mantle faster than presumed the earth’s interior would be a lot colder after 3 billion years of leakage. Variability is possible I suppose and for some reason the amount of geothermal heating of the ocean can change in short spans of time. That might have some legs since there’s detectable changes in climate that align with gravitational anomalies from the moon and gas giants. Magnetic field of the sun must also interact with the magnetic field of the earth to some degree and that might also conceivably influence vulcanism in the ring of fire. Hard to say. It just doesn’t seem like the most plausible of explanations.
To me the most surprising thing about the Balmaseda analysis is that there seems to be no lag with increasing depth following volcanic events.
I would have expected that the time required for vertical mixing would show as lags. in the data..
Is there something I am missing?
The absence of a postulated effect serves as an internal control. Changing the heat input into the oceans does not appear in the ocean heat estimate.
Funny how the heat going into the ocean depths argument only took off when the surface temperature hiatus became an embarrassment. I have not heard any explanation of why the manifestation of warming would suddenly switch like that. How could it happen that radiative heat is causing warming of the ocean depths without warming the surface – especially when water is opaque to IR and the transfer of heat would have to involve mixing.
It is plausible that a warming surface could lead to warming of the depths but it is not clear how a non warming surface can achieve this trick.
Our host makes a good point – how could unmixing take place in the future enabling the heat to jump out and roast us?
A significant fraction of OHC rise below 700 meters can be accomplished through warmer river runoff from the continents. ARGO doesn’t dive the continental shelves and the runoff should be colder than the ocean for a good part of the year meaning it will hug the bottom as it runs off until it reaches equal density ocean water.
I’m not at all sure how much deep ocean OHC can increase through that mechanism but almost certainly it happens to some degree if river runoff is warmer and we already know land surface is warming a lot faster than ocean surface.
Schrodinger’s Cat said on January 22, 2014 at 4:38 am
“Our host makes a good point – how could unmixing take place in the future enabling the heat to jump out and roast us?”
______
It would be a good point if climate scientists were saying that could happen, but are they?
DS
You are forgetting about salinity – river water inevitably floats on the surface because of the density difference between fresh and salt water. Not a good mechanism for pushing heat down below the surface layers of the ocean.
I think the more straightforward conclusion is that we simply have insufficient good data to know whether we are even looking for any ‘missing heat’. Currently, uncertainties overwhelm any supposed changes in energy storage, and it will only be over the next several years and decades (assuming the Argo system is maintained) that conclusions could possibly be drawn.
I do wonder though about the thought processes of some of the more alarmist Climate Scientists – if they were teaching a class and one of their undergraduate students pulled some of the tricks they do in journal articles (‘a post hoc rationalisation that the ‘missing heat’ is in the one part of the system where there are no reliable measurements, truncation of data part way through a time series to only show the bits that agree with your hypothesis and not the later data that call it into doubt), the student would be failed
“the student would be failed”
One would hope so.
MI CRO
Large scale river management systems (Mississippi/Missouri, Yangtze/Yellow, Amazon, Nile, Euphrates) have all been subjected to seasonal floods (spring snow melt etc). Introduction of large river management systems have temporarily altered the SST/salinity of 10,000 to 100,000 of the sea near the estuary, thus evaporation, often back into the very region from which the original flood came. This can be demonstrated by the Missouri/Mississippi altering the gulf of mexico SST/salinity thus evapotransportation back into the US mid west. The Nile Flood evapotransporting back onto the Ethiopian Highlands from where the flood originates. These circular diminishing systems have a gradual effect upon large scale statistics and obviously affect other climatic systems. It its a case of inevitability that one of these systems will put a serious spanner in the works – which happened with the Nile management affecting easterly wave cloud mass over the Atlantic = cc.
I would rather focus on annual cycle of heat content of the climate system. First of all CERES EBAF ToA average net radiation balance is a fiction. From satellite data alone the imbalance comes out as 4-6 W/m², which is physically impossible. Therefore the unknown systematic error (offset) is “corrected” using OHC data.
Now, it would be fine if OHC would be known to high enough accuracy. Unfortunately it can’t possibly be the case, because we have both CERES EBAF ToA monthly average net radiation balance data and OHC down to 2000 m in a quarterly resolution for 8 and a half years, from first quarter of 2005 to second quarter of 2013 inclusive. Net ToA radiation balance may be inaccurate, but its precision is much better, there is little difference between annual cycles of different years. So the story is about actual precision of OHC data as opposed to error bars claimed by experts.
Quarterly heat content of the climate system can be calculated by integrating CERES data in time and over the entire surface. Its trend is uncertain, but seasonal variations are sound. Therefore we can compare detrended OHC and CERES heat content and calculate annual average cycle in a hypothetical additional heat reservoir needed to attain closure. Turns out in an average year this mysterious reservoir should be able to release 3×10²² J of heat in three months between second and third quarter. However, it is pretty much impossible, because it is equivalent to the latent heat released when so much water vapor gets condensed, that it would raise global sea level by 37 mm, a swing almost an order of magnitude larger than observed in annual sea level changes. Any other transitional heat reservoir is way smaller than that, so error bars on OHC must be considerably larger than ~1×10²² J for quarterly data, because the resulting 0.3×10²² J uncertainty for the annual cycle is inconsistent with CERES.
Long term behavior of reanalysis products like ORAS4 is even more questionable, therefore we simply do not know what the actual imbalance is. It is not measured properly.
In Trenberth 2013 we find
And he does not even take issues related to the annual cycle into account. I would say OHC data (along with CERES) provides both an incoherent narrative and implies error bars too large to make it useful, especially for the purpose of recalibrating CERES.
Trenberth 2009 used to be more blunt in this respect.
Times are changing. Circular reasoning to adjust observations based on computational climate models, which in turn are tuned to reproduce past observations is no longer acceptable, because people are watching. One does not have to be a genuine expert in that particular field to identify elementary slips of logic in climate science, it is quite enough to have some training in any neighboring field.
You have nothing BP. Words alone don’t cut it.
Do some work, show us what you have in a real analysis.
How much more hints do you need to do your own homework?
– NASA / CERES_EBAF-TOA_Ed2.7
– NOAA NODC OCL Global Ocean Heat Content: Basin time series
– CU Sea Level Research Group / 2013_rel8: Global Mean Sea Level Time Series
Issues related to the annual cycle when comparing net ToA radiation balance to Ocean Heat Content are not discussed in the literature, another grave indication of sloppiness that has pervaded the field.
According to the CERES Level 3B product between first and second quarter of 2013 the terrestrial climate system has gained 1.212 × 10²² J of energy. At the same time upper 2000 m of oceans has lost 2.481 × 10²² J. Therefore 3.693 × 10²² J had to go elsewhere.
Trouble is there is no conceivable transient heat reservoir on Earth that could temporarily hold that much heat (other than seas, that is), it would be enough to evaporate the upper 45 mm of oceans. Therefore either CERES or ARGO is crap, or both. Adjusting one to the other to find a 0.6 W/m² imbalance is an extreme exercise in vanity.
DocMartyn | January 21, 2014 at 9:03 pm |
Doc, the seasonal swings have been removed from the OHC. Otherwise you would see them in the record.
Regards,
w.
“Doc, the seasonal swings have been removed from the OHC”
Have they? Can you get me a link to the raw data?
Dear Judy
Having just managed to make some really useful progress on how on a neurological level we apportion an empirical value to a memory circuit for threat analysis, I am not keen to get re-embroiled again in the climate arena. BUT you are still missing the elephant in the living room. The equatorial Atlantic warming zone presents us with everything we need to get a solid grip on AGW, without being side tracked by the hiatus. For 3,500 billion years the equatorial oceans have been absorbing 80 to 90% of the solar radiation applied to them, this energy is distributed round the planet via the ocean currents. As shown in my submission to the UKs AR5 review and in ‘The Nile Climate Engine’, the Atlantic provides every criteria for CC and AGW via a reduction in the mass of Easterly Wave Strata-Cumulus cloud mass – hence increased insolation. The Nile problem affects directly two of the precursors to EW formation, then a resultant negative Charney Effect exasipates this effect even further. I have copied a brief of the relevant factors and had gone over this problem with Prof Paul Hardaker for two hours when he was Chief Exec of RMetS, He could find no problem with it, then banged his head against the wall trying to get the relevant institutions to deal with it – a factor that might help explain why he was telling me some time later that ‘I am am leaving the profession’.
I have emailed you a brief of the AWZ and how it fits into events relevant to EW formation.
Conor
Pekka Pirilä | January 22, 2014 at 4:45 am
Regards, Pekka. There are individual heat engines within the climate system. These are things like thunderstorms and dust devils. The tropical thunderstorms drive the Hadley cells you reference above.
The entire climate system also functions as a heat engine. There is an excellent overview of this here. Inter alia it says:
As you can see, the concept of the climate as a global heat engine is neither novel nor is it an “obvious error” …
w.
Willis,
I wrote that the concept of global heat engine is right, bu that polar regions are a very minor component in that, while the main heat engine is in the Hadley cells.
In your heat engine hypothesis the polar regions, like your high altitude can act as a condenser removing energy from the system – in this case the lack of solar energy again providing for a net cooling effect to counter the equitotial warming. See ‘the Nile climate engine’ where man made alterations to the e Mediterranean SST affects easterly wave cloud mass thus increased equitotial Atlantic insolation.
Furthermore it’s essential for the efficient heat engine that cooling occurs at high altitude while warming occurs at the surface. Under those conditions the subsiding part of the circulation does not slow it down too much.
Interesting that you should qute Bejan
A while back I sent you his paper using constructural theory and its relation to AGW. He is a warmist.
Since you’ve previously endorsed his theory, Have you completed the review of his paper?
Increased equatorial insolation due to reduced Easterly Wave SC cloud mass, promoting increased northern hemisphere evaporation and precipitation resulting in a hiatus on a global averaging basis, but regional specific cause-and-effect variability?
Big and complicated, those oceans. Maybe more exploration needed?
What? You thought I said publication? No, silly, I said exploration. As in Age of Enlightenment. As in Go-take-a-look.
I think that it is interesting that warmists never use OHC as a measure of climate sensitivity. There is no reason why global temperatures have to be the only way to detect a CO2 signal. It ought to be possible to detect a CO2 signal in OHC data. But there are no estimations of how large a rise of OHC results from a doubling of CO2. Let alone any measurements. I wonder why not.
Wel, it’s a travesty, but they had no monitoring system in place until about 2007.
“I think that it is interesting that warmists never use OHC as a measure of climate sensitivity.”
—-
I actually have been advocating something like that for quite some time, but the historical definition of things is hard to change, even if a new definition makes more sense as new data is available.
‘I think that it is interesting that warmists never use OHC as a measure of climate sensitivity. ”
Moron
ECS = F2× ΔT / (ΔF − ΔQ)
TCR = F2× ΔT / ΔF
Steven, you write “Moron”. Again. sigh!!
OK what is the numeric estimate of the climate sensitivity for a doubling of C2 in terms of OHC? Where is the reference where this estimate was made?
JCH
“Well, it’s a travesty, but they had no monitoring system in place until about 2007.”
So I guess that means they had no baseline in the 1930s or the 1830s or the 1730 or during the MWP or any other time to develop comparisons. Doesnt look like they have much of anything. Based on some of the comments, what they thought they had is dwindling fast.
The atmosphere is heated from above by the sun and from below by the absorption of the sun’s heat by the land and the ocean.
It is also cooled from above by radiation to space.
Raising the temperature of the water very slightly (even if it is actually happening) is unlikely to be a major influence, now or in the future.
The specific heat capacity for sea water is 3,250 times that of air. So if figures show a 0.6 degree increase in both that means the sea contains 3,250 more heat energy than the air.
Other than the very slight ocean heating that results from DWIR, what mechanisms actually heat the ocean due to atmospheric warming?
– Reduction in cloud cover?
– ?
Warmer atmosphere reduces all heat losses (net IR, evaporation, sensible heat) from the ocean. That leads to warming, if the input from solar SW is not reduced as well.
That’s about the equivalent of putting a sheet of cardboard under a ladder leaning against a wall and observing that the slope has changed slightly.
Raising the temperature of deep ocean is a very slow process. What’s happening much more strongly is the increase in the radiative forcing. That leads gradually to a faster and faster rate of warming. Near surface ocean must be participant in this faster warming, temperatures of the deep ocean are not essential in that.
That may appear a false idea in view of the recent hiatus, but I would not consider even a few more years of hiatus as contradictoty to the basic understanding of AGW. The observed hiatus tells about deficiensies in the detailed understanding, it’s not a strong enough phenomenon to affect the basics.
If the hiatus goes beyond 20 years, I would argue the hiatus becomes contradictory to our understanding of AGU
The constant flow of relatively warmer surface water that started in the mid 60s from the equitorial atlantic produced a net increase in arctic ice melt, thus a colder southward current in the E Atlantic, giving the wrong impression of generalised cooling in the region. In reality the cooling effect was a short term effect of a specific warming trend in the North Atlantic surface circulation. Dealing with generalised global average figures means you fail to see the devil in the detail.
curryja | January 22, 2014 at 9:07 am |
“If the hiatus goes beyond 20 years, I would argue the hiatus becomes contradictory to our understanding of AGU”
Agreed totally. I find it surprising that it may turn out to need only a few more years to get to the stage where the science can be proved to be inadequate.
Conor McMenemie | January 22, 2014 at 9:17 am |
“The constant flow of relatively warmer surface water that started in the mid 60s from the equitorial atlantic produced a net increase in arctic ice melt, thus a colder southward current in the E Atlantic”
The lack of ice creation in the Artic will have reduced the southward flow of cold brine at lower levels also. Difficult to measure but required none the less.
True, but ice does not melt of its own accord , it needs an applied force – heat from the equator, as has been happening for the passed 3500000000 yrs. examining equitotial SST trends does show that there are climatic events there sufficient to alter the SST energy circulation- spec from Atlantic
Looking at the variability in earlier temperature trends five more years could still be easily accommodated as a combination of natural variability and persistent trend, but at the end of that period the forcing that has not been compensated by Planck feedback would be so large that further hiatus would be surprising.
What kind of modifications would be needed in the understanding is not at all obvious. They might concern either variability or more persistent phenomena like cloud feedback.
Thinking about such hypothetical situations does not affect present understanding, that must be based on existing data, but thinking what’s possible is certainly useful for people who make predictions to avoid statements that lead to problems later.
Hey, I could have predicted the “hiatus” all the way back in 1950 without needing to know any future temperature data !
See for yourself :
http://contextearth.com/2014/01/22/projection-training-intervals-for-csalt-model/
Who would have thunk it ?
That is science for you!
Conor McMenemie | January 22, 2014 at 9:32 am |
“True, but ice does not melt of its own accord , it needs an applied force – heat from the equator”
But one of the main drivers of the ‘pull’ north of the surface current is the downward and southern flow of brine below the surface.
So we have an oscillator of sorts. Warm water flows north and melts ice. Freezing creates ice and brine. Ice and brine flows south. More warm water flows north.
Excellent. Now alter the equitotial strata cumulus cloud mass which reflects incoming SW at 400w/m2. Equitotial cloud mass is the elephant in the climate system that everybody is trying desperaly to ignore.
Pekka Pirilä | January 22, 2014 at 9:30 am |
“Looking at the variability in earlier temperature trends five more years…that further hiatus would be surprising.”
Occam’s Razor says that Climate Sensitivity has been assessed as too high.
Those running out of time often beg for more.
==============
I look forward to getting to the 20 years. Then maybe Climate science will begin to spend time on finding out what is really going on rather than making the world fit their preconceived idea of what was going on.
I don’t share your optimism. The willingness of various so called experts and their political paymasters to drag on this fraud is immense.
” Pekka Pirilä | January 22, 2014 at 8:44 am |
Warmer atmosphere reduces all heat losses (net IR, evaporation, sensible heat) from the ocean”
Really? I was under the impression that heating increased the amount of water vapour a column of air could support, indeed, I understand this concept is the proposed mechanism for the ‘water amplification’ effect proposed for AGW.
Again I am not a physicist, but if the air is hotter in day time, especially at altitude, but not that much warmer at night times, then there will be a greater turnover of water above the oceans.
This would mean a greater daily water vapour flux, which means more evaporation and more rain.
In day time the amount of water at saturation point increases with AGW, but more water means more heat loss and greater pressure drop at night
Doc,
I should perhaps have described in more detail what I meant.
The basic idea was that reducing the difference in temperature between the ocean (at some fixed depth below the skin) and the atmosphere (at some fixed low altitude) through warming the atmosphere reduces the heat loss. In that I assumed that the atmosphere is internally in a stationary state, and that also the moisture goes up with the temperature in accordance with that idea.
The heat loss of ocean to the atmosphere involves as successive stages the transfer of heat to the, and the transfer of energy from the skin and the transfer of energy from the immediate neighborhood of the surface further in the atmosphere. The heat flow through these three stages is reduced, and that means in practice that also the evaporation is reduced at least in most situations. Under some special conditions evaporation might increase, but then sensible heat transfer must be reduced even more.
“Those running out of time often beg for more.”
Nothing concentrates the mind like a pause on the verge of blowing up the gravy train.
“Conor McMenemie
True, but ice does not melt of its own accord , it needs an applied force – heat from the equator, as has been happening for the passed 3500000000 yrs.”
When I was a child they were building bigger chimneys in Europe to clean up the local air. The scrubbers were added in the 80’s and 90’s. I wonder what happened to all that soot that the Europeans dumped into the atmosphere?
You can wonder about the effects of all that soot from industrialized Europe – my recollections of Glasgow was a city with every building completely black. Then with the clean air act and sand blasting the city became a sandy-golden. Nice bit of urban history, but the big question is what is causing global warming and even bigger question being why is everybody ignoring variability in equatorial cloud mass? Even assuming that emissions might be relevant, there should still be a variation in this cloud mass having an effect on SSTs????????
Pekka can you answer a really simple question, will an increase in the diurnal temperature range increase rain fall and increase heat loss, for a fixed (Tmax+Tmin)/2?
http://curryja.files.wordpress.com/2012/07/fig-31.jpg
Doc,
I cannot answer that question.
I would expect that there are regional correlations between diurnal temperature range and precipitation. Clear sky conditions lead typicaly to a larger diurnal temperature range, but I would not describe that saying that large a temperture range affects precipitation. Furthermore, that correlation is not necessarily true everywhere.
Pingback: Judith Curry and the Ocean Heat Content | And Then There's Physics
Judith, Just before the list of things that affect sea level from IPCC report, you say OHC. I think you mean sea level change there.
What do they mean by 50% coverage. 1 degree x 1 degree is roughly 500 sq. miles. That an awful lot of thermometers in the ocean. Does this mean they sample these regions once a year, twice a year? In reality we know that the measurements are probably not randomly distributed due to shipping lanes and currents carrying the ARGO floats. So I am skeptical of the 50% coverage claim.
thx for catching the typo
Meh, if the ‘missing heat’ has gone into the deep ocean then it will stay there until the end of the Holocene. If it’s been re-radiated to space it will stay there even longer. In any case, effective climate sensitivity is much lower than previously estimated.
Maybe we need to focus on something interesting, like how we’ve made such a mess of ourselves.
==================
You may call heat from the vasty deep, but does it come when you do call it?
============
..even if the heat from surface heating of the ocean did make it into the deep ocean, presumably the only way for this to happen involves mixing (rather than adiabatic processes), so it is very difficult to imagine how this heat could reappear at the surface in light of the 2nd law of thermodynamics.
Dr. Trenberth’s gut-level ‘has to come back out’ response to the idea of heat being buried in the deep ocean troubled me, too, on this premise. Until I realized that — perhaps unwittingly — the premise has much more to it than an in-out stack. The coupled ocean-atmosphere system is vast and complex, but for the atmosphere to enter a hotter phase due a difference in the rate of adsorbtion of heat into the deep ocean (hypothesized but difficult to confirm by observation since we’ve done such a poor job of observing) doesn’t literally require the heat to flow from colder ocean depths to warmer atmosphere.. which we know to be thermodynamically ridiculous: it requires one of two mechanisms we do not know to be out of the question, and have good reason to expect, namely a) for whatever feedback mechanisms appear to have increased flow of heat from atmosphere to deep to reverse themselves, or b) for some mechanism of the deep ocean seeking its own lowest energy to assert itself by losing heat net upwards, eventually to the atmosphere.
Do I give Dr. Trenberth’s oceanic heat iris any more credit than Dr. Lindzen’s cloud iris?
I don’t dismiss it entirely; there is after all a tiny fraction of some sort of cloud effect (though net opposite of what Dr. Lindzen supposed). Whatever happens in the oceans and clouds by way of heat exchange with the near surface atmosphere, the mechanisms have existed for a very long time, are very large in scope of effect, and very poorly understood, so could go either way so far as we know. The deep ocean — ignoring any biochemistry we also do not understand to do with actual heat levels there — has the heat capacity to suck all the warmth out of the narrow band of what we call the surface, down to within a few degrees of its own icy level, and why it does not we barely grasp. Or it could become frigidly more mirror-like, holding surface heat up at higher levels by whatever same mechanism it now uses to maintain that gradient. And we don’t know.
All we have is part of the explanation, that so far as is accurate or very nearly true simply, parsimoniously and universally comes down to little more than it would be stunningly baseless to expect the friendliest possible outcome of meddling with the heat of the deep ocean just because it’s convenient to coal burners and oil salesmen.
There is a corollary, and both can be done without loaded words.
=============
Bart, could your marvelous realization be stated as “Whatever goes down must come up”?
“a) for whatever feedback mechanisms appear to have increased flow of heat from atmosphere to deep to reverse themselves, or b) for some mechanism of the deep ocean seeking its own lowest energy to assert itself by losing heat net upwards, eventually to the atmosphere.”
Heat doesn’t flow from colder to warmer. Therefore neither A nor B is workable.
The sun heats the ocean. The ocean heats the atmosphere.
Write that down.
Nobody, including Trenberth, has said energy diffused/mixed into the vast abyssal ocean is going to somehow stick itself back together as a hot blob and come back out.
“The heat will come back to haunt us sooner or later,” says NCAR scientist Kevin Trenberth, the lead author. “The reprieve we’ve had from warming temperatures in the last few years will not continue. …”
So it’s wonderful that humanity is learning about the abyssal oceans. This will be an improvement in the daily lives of billions of people.
He said the heat will come back. No mention of it coming back out.
The person who does hint at it is the guy who took out his luger and shot the “missing heat” dead: nailed it right between the eyes.
“Our data show that Earth has been accumulating heat in the ocean at a rate of half a watt per square meter (10.8 square feet), with no sign of a decline. This extra energy will eventually find its way back into the atmosphere and increase temperatures on Earth,” Loeb said.
Loeb’s study found there was no missing heat. He confirmed James Hansen and Gavin Schmidt and Roger Pielke Sr. and Josh Willis. The extra energy = MORE ENERGY IN than energy out. It will find it’s way back into the atmosphere when La Nina fails to stuff it all in the oceans. So even there, he is not talking about sequestered energy reassembling itself into THE BLOB and shooting to the surface to terrorize humanity. And even if The Blob were emerge to terrorize humanity, we have attack dog David Springer there to tell The Blob “You have violated the 2nd law! Write that down!”. So we’re safe no matter what.
As of 2013, was there any climate scientist left who still thought there was a significant amount of missing heat?
David Springer | January 23, 2014 at 8:40 am |
READ HARDER.
If you applied your sort of handwaving over Lindzen’s cloud iris a decade ago, you’d have been laughed at by you.
The topic is the mechanisms for delivery, not the reservoir itself.
Pingback: Scientists explore causes of the pause in warming, perhaps the most important research of the decade | Fabius Maximus
Not sure if it’s been said already but I can shed some light on the varying trends. Despite the legend indicating annual averages the Domingues curve actually uses a 3-year running mean, hence the smoother trend. Given that inconsistency there might be a similar issue with other curves.
‘But the bottom line is that there does not seem to be any observational support for this large sequestration of heat in the deep ocean that is shown by the reanalysis.’
I can’t really see where you’ve tested this conclusion. I think perhaps there’s a terminology confusion here: Mostly when I’ve seen people talking about OHC increase in the deep ocean they’ve meant below 700m, whereas you appear to be taking it to mean below 2000m. If you look at the difference between 0-700m and 0-2000m in Levitus 2012 the picture for the recent period isn’t dissimilar from that depicted by the 0-700m and Total Depth plots from Balmaseda et al.
I know I’ve alluded to this in the past, but now I’m going to say it flat out: why does Dr. Curry insist on Frequentist analyses of Bayesian problems; is it due to lack of understanding of the mathematics, or of the underlying logic, (as one might imagine Mann means by ‘ignorance’), or is it by motivated reasoning seeking support for a foregone conclusion (Mann’s ‘intent’)?
The entire framing of this uncertainty shell games amounts to no more than that of the anti-scientific fellows (and often Fellows) over a century ago who imagined their brilliant riposte to Rutherford’s work, that microscopes lacked the resolving power to directly observe atoms, therefore Rutherford’s conclusions could be dismissed, held water.
So which is it, Dr. Curry: do you understand Bayesian reasoning and choose not to use it because it delivers answers you don’t like, or don’t you understand Bayes?
Definitely got me puzzled. Bayesian statistics is used for (parameter) estimation and testing. Where does that fit into the above post?
It doesn’t fit in. But barty has been wanting to say this flat out for a long time and he can no longer contain himself. Now we get to laugh at him.
Go back to square 1, read my uncertainty monster paper. Bayesian reasoning does not deal well with ignorance.
“So which is it, Dr. Curry: do you understand Bayesian reasoning and choose not to use it because it delivers answers you don’t like, or don’t you understand Bayes?”
WTF kind of question is that? Show a modicum of respect ffs.
OAS | January 22, 2014 at 12:06 pm |
..Bayesian statistics is used for (parameter) estimation and testing. Where does that fit into the above post?
I refer you to the first paragraph, the final sentence:
Exactly how good is the ocean heat content data on which this argument is based?
You use parameter estimation and testing to answer that question, not frequency analyses. Although you propound a very narrow view of what Bayes is for and can do, that your own puzzlement stems from the one narrow use you recognize is rather amazing. You can explain how this works for Don, if you wish.
curryja | January 22, 2014 at 2:13 pm |
I’ve read, and discussed at length, your paper and subsequent presentations and arguments, and remain unimpressed. Nothing deals well with ignorance, least of all the type of analyses you’ve presented above; what deals best with ignorance of all the bad choices is Bayes.
With Bayes, we can ask which explanation most accurately or very nearly truly accounts for observations, given uncertainty, with prior based on simplicity of assumptions, parsimony of exceptions and universality of application. We can also ask diverse applicable policy-affecting questions about whether to expect unknown unknowns that a frequentist can never answer, and get a meaningful outcome.
So we can’t be certain at all of ocean heat content figures, and it’s scandalous that it took so long for anyone to notice we weren’t even trying to meaningfully take measurements. But that’s crying over spilt milk; what we can do in Science is apply inference to the observed data and determine what answer is accurate or very nearly true based on what data we do have until such time as new data requires us to amend our explanation, not bemoan our uncertainties and dither indecisively.
“Science is apply inference to the observed data and determine what answer is accurate or very nearly true based on what data we do have until such time as new data requires us to amend our explanation, not bemoan our uncertainties and dither indecisively.”
ie make up what you’d like it to be.
Mi Cro | January 22, 2014 at 10:13 pm |
Read harder.
make up what you’d like it to be is what I’m arguing against.
“Science is apply inference to the observed data and determine what answer is accurate or very nearly true based on what data we do have”
How do you get your Bayesian a prior when it doesn’t exist. You say “apply inference”, to what?
For those who don’t get the joke:
http://en.wikipedia.org/wiki/Free_Hat
“Go back to square 1, read my uncertainty monster paper. Bayesian reasoning does not deal well with ignorance.” – Curryja
And Judith doesn’t reason well with Bayesian statistics.
What Bart said, +1000
The ‘missing heat’ is somewhere safe.
==============
BartR doesn’t know that heat does not flow from cold to warm. The second law of thermodynamics was formulated in 1824 by Sadi Carnot. Bayes died 60 years before that. I wonder if Bayes was as ignorant of simple laws of nature as BartR is? In any case Bayes has a good excuse and Bart does not.
Bart R > So which is it, Dr. Curry: do you understand Bayesian reasoning and choose not to use it because it delivers answers you don’t like, or don’t you understand Bayes?
Yip, she still beats her husband.
Typo: 0 – 7000 m later. 700 m, right?
Typo: I meant “layer”. :)
So I am understanding this correctly: the reanalysis is very dubious, as none of the observational studies yield the same conclusion. Can someone explain the reanalysis, and ideally explain it in such a way that this problem is addressed? What are they doing anyhow?
By the way, a lot of the graphs seemed to have a steep climb just before the recent point (~2005?) where the observations reached 50% coverage. Is that when ARGO was being deployed? Isn’t that extremely suspicious? My first thought would have been that all the numbers before that are just bad sample error, and don’t represent a temperature rise at all.
The reanalysis estimate is observational too, in that it is informed by the same observational data as the other OHC estimates featured. The difference is that the reanalysis process involves using the observations to inform a physical model in order to construct a global average, whereas the other estimates use statistical models. There are strengths and weaknesses to both approaches
As I’ve noted above, Judith doesn’t appear to show any like-for-like comparison which suggests inconsistency between the reanalysis and observational data (keeping with the convention of separating the two in these terms despite what I’ve said above) for recent upper and lower ocean comparative trends. Levitus et al. 2012 appears to show pretty much the same thing as the reanalysis.
I can’t recall the reference but I’m pretty sure it’s been shown that OHC datasets constructed without ARGO data produce similar time series features to those which use ARGO. Note that the 2005 50% coverage was for 0-1800m whereas most of the estimates shown here relate to 0-700m depth. Regarding flatness over this period, the Lyman and Johnson paper referenced by Judith says this: ‘ In recent years, from 2004 to 2011, while the upper ocean is not warming, the ocean continues to absorb heat at depth (e.g., Levitus et al. 2012; von Schuckman and Le Traon 2011), here estimated at a rate of 0.56 Wm2 when integrating over 0–1800 m.’ That 0.56 Wm2 figure is again pretty close to what the Balmeseda et al. reanalysis produces.
Paul S – first, great to see you here again.
Last night I was thinking about posting the .56 from Lyman and Johnson and from von Shuckmann, but you do it so much better. So I hope you continue to show up as I always thought you were one of very best commenters here.
Yes, nice to have PS show up.
I too find it curious that Levitus was not highlghted
Being on the border-line of missing heat is just as bad as having the oceans absorb excessive heat.
We would also have to explain that.
As it is we are right in the margin of error, and the numbers make consistent sense within those margins.
Consider the possibility of heat moving from the ocean waters to land through the usual mechanisms, and the numbers are right on.
Paul S | January 22, 2014 at 12:31 pm |
“I can’t recall the reference but I’m pretty sure it’s been shown that OHC datasets constructed without ARGO data produce similar time series features to those which use ARGO.”
By design. ARGO showed ocean cooling but when that didn’t jibe with OHC datasets constructed without ARGO then the ARGO data was pencil whipped into agreement. Welcome to bandwagon science where the data arrives before the instruments used to gather it. The sordid little episode is documented at nasa.gov:
Correcting Ocean Cooling
The explanation for the pause which involves neither violations of thermodynamics nor mental contortions is that that the effect of human CO2 on global temperatures is minor and that natural variability, whatever that might be, is dominant – as per the previous consensus and the previous rejections of the CO2 warming theory championed by Arhennius and Callendar. The only remaining question is how long will it take until the hubristic admit the obvious or rather how long will the funding agencies remain asleep.
When I make spaghetti and leave the water in the pot, it tends to return to room temperature. When I leave a glass of iced tea on the table, it too returns to room temperature.
But the ocean, for all its sloshing around, has an average temperature closer to freezing than to the average earth temperature:
http://www.drroyspencer.com/wp-content/uploads/Ocean-temperature-vs-depth.png
The dynamics of cold water formation at the poles ( especially the Antarctic ) explain this. It is easy for cold water to sink. It is difficult for anomalously warm ( and so more buoyant ) water to sink.
And the sinking of that cold water pulls some warm water from the equator to replace it. The freezing to ice drops even colder brine below it. And round and round we go.
Now, if it only can be shown that rising CO2 increases the efficiency of that oceanic, and/or the atmospheric pumps.
Clearly, paleontology shows that temperature falls follow CO2 rises. C’mon, climateers, start your engines.
============
Now, now, kim, we bow to the plant kingdom and we recognize variations in insolation.
=========
Interestingly the average ocean temperature is 4C and that also happens to be just a bit less than the theoretical temperature of a spherical black body 93 million miles from the sun.
See here:
http://www.spectralcalc.com/blackbody_calculator/blackbody.php
Enter 4 under blackbody properties for temperature, press calculate, and note the calculated radiant emittance: 334.567 W/m2
Refer to figure 5.6 below to find incoming solar radiation at top of atmosphere is 341W/m2.
http://oceanworld.tamu.edu/resources/ocng_textbook/chapter05/chapter05_06.htm
What this tends to tell me is that the greenhouse effect is operating at maximum possible efficiency and the only reason the surface is warmer than 4C is because warm surface water produced by solar heating between 30N and 30S latitude where most of the energy enters the climate system (refer to figure 5.7 at link above) is stratified near the surface because of its lower density and stays near the surface until it is finally cooled below the average basin temperature and then it sinks.
I see that the consensus atmospheric greenhouse effect is all over the place. An atmosphere with no greenhouse gases will still have a lapse rate or not. The earth’s surface is conflated with the ERL at will. The cooling of the atmosphere requires the so-called GHGs. Water has a net cooling effect, but is the main GHG and the factor in the 33 K greenhouse effect. Only lip service is payed to the main surface cooling mechanism – non-radiative evaporation and convection. It’s not even wrong.
I recommend this website with the latest upper ocean anomalies and uncertainties.
http://oceans.pmel.noaa.gov/
Since 2004, the heating at these levels is muted within the magnitude of the uncertainty. Also, as I have already asked, how could heating at deeper layers occur without being seen in this upper layer?
When you convert into Watts per meter squared (globally averaged) over this time period, it is a pretty small positive value.
Roger Sr.
Kevin’s finally got that. Now he hopes ‘sloshed’ water can save his bacon, but it’s out of the frying pan and into the fire.
==================
I am surprised that the error bars are so constant back in time. Was the coverage that good in space and time at that level?
Is there data for below 2000m?
Argus does not measure that deep?
Scott
Just that, Sc. Heard in the laundromat that you were up all night with that beam thingie.
=========
“Also, as I have already asked, how could heating at deeper layers occur without being seen in this upper layer?”
This question is being asked by skeptics all the time despite having a false presupposition seemingly built in. The false presuppositions is that the source of any increased heat content at depth must be a previous increase of shallow layer average temperature. This presupposition is false since all that’s required is an increase in total one dimensional (downward) heat flux and this flux need not be uniform — it need not be akin to the propagation of a density wave since that’s just not how heat usually behaves. Consider that just moving some of the already warmer surface water to depth (while some upwelling of colder water occurs elsewhere as a compensation) results in an increasing heat content at depths while *simultaneously* producing a decrease in heat content at the surface. If there is a source of shallow level warming occurring concurrently, and rather more uniformly (such as can be expected to result from an enhanced external forcing) then the total shallow layer total heat content could easily remain the same while the deeper layer total heat content increases steadily.
So the question is akin to asking how can the number of costumers in the store (deep ocean) increase without there first being a temporary increase of the number of costumers in the entrance portico (surface layer). This can very easily occur if the increasing flux of incoming costumers into the portico is balanced by an increasing flux of costumers from the portico into the store.
Piere normand
ANy data or just talk?
Data better than simplistic analagies.
Scott
Scott, I don’t have to provide data when I am simply pointing out that some *argument* embodies an unstated presupposition. I didn’t make any positive claim on my own. It’s rather those making the argument who should defend the presupposition with some further argument or empirical data.
Roger Sr.,
Are you familiar with this research and the effects on increasing GH gases on the IPWP:
http://download.springer.com/static/pdf/353/art%253A10.1007%252Fs00382-010-0984-y.pdf?auth66=1390546022_155deca808aba423326dfc7d24846b9f&ext=.pdf
There’s a lot to digest, so take your time, but I’d love to get your take on it. The global effects of a warmer and expanded IPWP is the subject of much research with a large team investigating it right now.
Pierre-Normand | January 22, 2014 at 2:49 pm |
Your thesis is flawed as it describes the mixed layer losing energy that the abyss gains. What we actually observe is the mixed layer gaining energy and the abyss gaining energy faster than the mixed layer.
Try again.
David Springer, I did not advance any thesis. What I am pointing out is that it is *possible* for the mixed layer not to gain energy at a higher rate, or in advance of, the deeper layers. That’s because not only variations in the flux from the sea surface to atmosphere and space but also circulation between layers determine variations in heat content within individual layers. When upwelling of colder water from deeper layers occurs, the heat content of the mixed layer is reduced. When warmer water from the mixed layer is moved to the deeper layers, then the deeper layers’ heat content increases. If there is, concurrently to this process, a reduction in the rate of cooling of the mixed layer to the atmosphere and to space (radiative + latent + sensible), then this will offset upwelling cooling of the mixed layers while the deeper layers will still gain heat unabated (or even at an increased rate). That’s no a thesis of mine. It’s just a trivial possibility which Roger Sr. and other skeptics dismiss without argument — and seemingly don’t even think of — when they claim that heat can’t be gained by deep layers without there first occurring some commensurate net heat gain in the mixed layer.
Pierre-Normand,
If ocean warming at depth need not require prior require warming at the surface, but be due to some mechanical / currents explanation, by which some warm surface water and some cold deep water traded places, we would then expect to find average surface temperatures I assume.
Buy have surface temperatures in fact been dropping? Or even rising slower then before?
http://en.wikipedia.org/wiki/Thermal
Maybe Pekka should go fix the wickedpedia article so it mentions greenhouse gases as a requirement for thermal convection to take place. Otherwise what I described in regard to convection driven by uneven heating mirrored the accepted encyclpedic wisdom on the topic.
Good luck Pekka.
Fix Wikipedia? One fulltime fixer seems enough.
===========
There’s no need to fix Wikipedia. It discusses the Earth atmosphere, and there are GHGs in the Earth atmosphere. Therefore the atmosphere does not get too warm for the convection to continue or for the thermals to develop.
Yeah, Pekka. I agree your assertion that convection requires greenhouse gases isn’t needed on wikipedia. It isn’t needed anywhere. That’s because it’s wrong. Uneven heating and Coriolis forces will keep the atsmosphere convecting and turbulent. Adiabatic cooling works with all gases including pure nitrogen. Conductive heating from a hot surface to a gas works with all gases. Nitrogen included. The shimmer in the desert you can see with your bare eyes, called thermals, m have jack diddly squat to do with greenhouse gases and everything to do with uneven heating.
While I’m at it this trope of yours about non-greenhouse gases not being able to cool radiatively is wrong too. All matter in motion emits thermal radiation. That is to say all matter with a temperature above absolute zero radiates. Pure nitrogen included. Nitrogen may be heated conductively and can cool radiatively.
The case where the troposphere effectively disappears is extreme as it requires that radiative heat transfer is weaker than conduction, and conduction of heat is very, very weak. Thus it’s only an illustration of what would happen if ...
A more realistic question is what happens, when radiative heat transfer becomes very weak but still much stronger than conduction of heat. That’s answered by the theory of optically thin atmosphere presented in the book of Pierrehumbert and certainly many other places I don’t know about.
In an optically thin atmosphere the surface gets very cold as almost all radiation passes trough the atmosphere and DWLR is negligible. In that case the tropopause is at a lower altitude than in the present atmosphere but still at a comparable altitude. The absolute temperature of the tropopause would 16% of that of the surface if the surface temperature were uniform. The lapse rate is essentially the dry adiabatic lapse rate, because the cold atmosphere cannot carry much water vapor. There’s a little convection all the way to the tropopause, but it’s weak and transfer tiny amounts of energy as net transfer. The diurnal and seasonal variations add, however, to the circulation but cannot lead to more net transfer of heat to upper altitudes than the optically thin atmosphere can lose by net IR (emission-absorption).
Thus in that case we have a very cold surface and a still colder atmosphere. Reducing GHGs leads gradually to that kind of atmosphere, the transition from that to my imaginary case of effectively no radiative heat transfer deviates totally from that trend.
With greenhouse gases we get suppressed radiative cooling, without greenhouse gases we get suppressed convective cooling and therefore, a greenhouse effect without greenhouse gases, (ana)logically even more so.
Without GHGs (or with very little GHGs) we get the snowball Earth that cools directly to the space unhindered by the atmosphere. No GHE of any sort.
But Pekka, what about gravity and cosmic rays? Just kidding.
Kidding is OK, I don’t worry about the dead serious Paul Vaughan either.
Judith Curry said “The most surprising thing about the Balmaseda analysis is that the warming increases with increasing depth (largest warming for the 0-7000 m layer).”
_____
Does the Balmaseda analysis show a greater rate of warming or a greater amount of warming with increasing depth? A greater rate would not be surprising.
GaryM said on January 22, 2014 at 4:51 pm
You know, I would have a lot less trouble believing climate scientists could actually measure changes in global average sea level to within a milimeter, if I didn’t know how badly they overstate their confidence in “global average temperature” in all its many manifestations, with all its many assumptions, models and WAGs.
_______
The four global surface temperature metrics are in agreement: the earth has been warming long term.
Right, summary.
Individual observations combine into very strong evidence that the oceans are gaining heat:
1) ARGO data
2) Sea level data (rising too fast to explain without a thermal component)
3) CO2 rise – yes the heating is expected.
To believe the oceans are NOT heating up you have to bet all 3 of those are wrong. Quite a stretch!
Given the uncertainty and the short time period, I think this renders the matter moot. Observations are consistent with increasing heat and there’s no sufficiently robust argument that this isn’t happening.
If the oceans are gaining heat (strong evidence, see above), and the upper oceans are NOT gaining heat then the deep ocean MUST be.. It matters little if people cannot imagine how that works.
Well it would matter if you had robust understandings of heat transport in the oceans, but I don’t get the impression anyone here does. So speculating that maybe it cannot happen is hardly a good counter to the strong positive evidence that heat gain is happening.
(of course an unmentioned (!) possibility is that the upper ocean heat data have an error that understates the recent warming)
One more thing: Only skydragons can legitimately argue that the greenhouse effect doesn’t warm the oceans. That’s because they believe it doesn’t warm the land either. For everyone else the greenhouse effect exists and it warms both. There’s no legitimate argument that the greenhouse effect warms the land but not the ocean.
All this nonsense about skin layers and IR not being able to warm water is frankly more of the nonsense speculation similar to the “I can’t imagine how the heat gets to the deep ocean” theorizing. It’s idle speculation, it doesn’t constitute a solid argument against what the observations are pointing at.
And finally: The oceans are heating, sea level is rising, global surface temperature is increasing (yes that’s right). If you hadn’t heard this before you’ve heard it now. If you don’t believe it now and require more data, give it a few years.
“Sea level data (rising too fast to explain without a thermal component)”
You know, I would have a lot less trouble believing climate scientists could actually measure changes in global average sea level to within a milimeter, if I didn’t know how badly they overstate their confidence in “global average temperature” in all its many manifestations, with all its many assumptions, models and WAGs.
You have to look really hard to see all the caveats on the reported temperature averages. I can’t begin to imagine what a frank, honest, apolitical climate scientist or physicist would have to say about all the assumptions and statistical legerdemain that goes into coming up with such precise “measurements” of global average sea level.
lolwot
“And finally: The oceans are heating, sea level is rising, global surface temperature is increasing (yes that’s right). ”
Let’s just say that all of that is true (I have not heard anyone say otherwise). It does not follow that;
It is doing so at a rate that is of a concern, or even that the increases are not a net good thing. It also does not follow that we know the rate that CO2 contributes to the warming, sea level rise, etc. As Dr. Curry has pointed out, even the AR5 report does not answer that “catastrophic” question with any certainty.
The mechanism that accounts for the equatorial ocean temp increase is the same event that killed 200,000 in Sudan in 2011 and the same again in Mali 200,000 in 2012. Although some see this thing as a mild intellectual exercise it has a big tariff in lives and will continue to cause such misery.
So Kalashnikov’s cause ocean heating; who would have guessed.
Conor McMenemie
“The mechanism that accounts for the equatorial ocean temp increase is the same event that killed 200,000 in Sudan in 2011 and the same again in Mali 200,000 in 2012. Although some see this thing as a mild intellectual exercise it has a big tariff in lives and will continue to cause such misery.”
Not exactly sure what you are saying here, however you do not present any evidence to convince me that we know with any certainty that the mechanism is the same.
TONYB. The Easterly Wave meteorological system provides for both the rainy season in Africa (5N to 20N) as well as the SC cloud mass that drifts across the equitotial Atlantic. Less SC cloud over the EA means more SW absorption thus heat. Go to “the Nile climate engine” on u tube. Rather boreing but informative.
Conor,
Ok, I read all of your posts (it is hard to keep everyone straight). Do you have a web page or something published that I can look at you data, methods, and conclusions? Have you determined why dams on the Nile cause problems while others do not seem to have problems of the same magnitude? Sorry if I am misrepresenting what you are saying, but it is piecemeal over the blog, so it is a little hard to read in this format.
TONYB. There are 40,000 dams over 30m all of which seasonally affect specific sea locations due mainly to them withholding specific events: rainy season flood or spring rain and snow melt. They will all have an effect to some extent on SSTs, but the major continental river systems floods (40,000m3/s) created floating freshwater lakes that had a large scale effect upon local evapotransportation into the rivers catchment area, thus the duopoly of altered air pressure plus reduced rain budget. Bad luck that the Nile system affected the foation of clouds the size of w Europe. Go to ‘the Nile climate engine’.
You have the skin layer not IR heating of the ocean or the oceans have waves theory.
They are incompatible, you have to pick one.
Which one is best supported by observation?
Hint: They don’t call it the high sea for nothin!
Conor,
It is rather hard to verify or analyze data that is presented in a video. I realize that this probably does appeal to the younger generation, but it makes it hard to test the null hypothesis or repeat the experiment or verify that there is any rigor to what is said. This problem seems to be pervasive in this debate, it is rare to find someone that wants to come clean and make un-doctored data, methods, and other elements that would be associated with science available.
The utube format seemed to be about the only way of forcing the so allied experts to appreciate that the ITCZ seasonally migrates as does the Atlantic warming zone. It is an unfortunate feature that reviewers invent scenarios that don’t exist so that the can carry on with the pretence that how much sat energy the Atlantic absorbs is not related to the cloud mass above it, irrespective of how clear the evidence is.
“…if I didn’t know how badly they overstate their confidence …”
As I’ve said many times, no skeptic in the world could do more damage to the cause than the warmists themselves. Nobody’s interested in my personal journey from generally liberal believer to skeptic but me, and yet it bears noting that ultimately *they* convinced me….not the skeptics…but their simultaneously laughable and tragic lies, exaggerations, and behind the scenes machinations. Climate-gate, Mann’s hockey stick, the Barnum and Bailey clown school known as the IPCC…all one need do is pay attention.
If the world does indeed find itself unprepared to deal with apocalyptic warming (looking more vanishingly unlikely by the month), then I maintain they have no one to blame but themselves…
oops. *by their…”
@bob droege | January 24, 2014 at 5:49 pm |
Perhaps when I have more time. Many have tried to make this point, especially Tomas Milanovic. He understands the math of spatio-temporal chaos much better than I do, although his arguments may not make much sense to people who don’t understand complex non-linear systems.
Any rational discussion of global warming must begin with ‘solar forcing’ and can only end with an acknowledgement that the process of global warming (or cooling) is not the result of a single factor like CO2 but a multiplicity of factor that involve the whole Earth. As Philip Stott stated, “throughout the history of science, monocausal explanations that overemphasize the dominance of one factor in immensely complex processes (in this case, the human-induced emissions of greenhouse gases) have been inevitably replaced by more powerful theories.”
No blank Sherlock
Who ever said it was only CO2?
AGW has quantum mechanics behind it, what you got?
Western government scientists are quantum mechanics?
Wow just wow.
What the bleep do you know Waggy?
Anything?
You a bot like kimsock?
Try is quantum mechanics not are quantum mechanics!
Perhaps a year of undergraduate physics, chemistry, and calculus might help you appreciate the depths of your limitations.
Sorry Waggy, I got a bit more than 1 year on all counts
A year and a half of physics, had to take the ones for engineers and physics students, and a half dozen math classes past calculus, and chemistry one of each plus lab.
Quantum mechanics is usually taught third year in both physics and chemistry, I guess you missed that.
It’s the theory that explains and models the readiative behavior of CO2 and other greenhouse gases.
You can call it stupid all you want, but you just come of as ignorant.
Those who believe the Earth’s atmosphere produces heat like a greenhouse need no math to believe anything they wish. They are easy prey for the flimflammery dispensed by the priests warmanism like Al Gore and Michael Mann.
Honorable scientists with respect for the principles of the scientific method admit that even on a human scale the Earth has not warmed to any significant degree at over the last seventeen years going on two decades, during which time CO2 increased. We may wish to know what the future holds for us but we should not let Western school teachers take advantage of our fears and limitations to confuse real science with climatology that outside the West is likened to the ancient science of astrology. No mathematical model can give gravitas to superstition and ignorance.
Bob – I think you’re the guy who served on nuke sub.
If so, how concerned with the temperature of the ocean is the crew of a nuke sub?
He may be suffering from CO2-poisoning so… better ask your question very slowly.
Bob D
Why so combative? Bland quantum mechanic references don’t communicate much. Wag says lots of things cause temperature or climate change plus Global mean temp stalled for 17 years.
At this macrolevel quantum mechanics not in play
v/r Scott
… and, tempting as it may be to avoid facing our ignorance by engaging in ad hom attacks against others — quantum mechanics or no quantum mechanics — without experimental confirmation climate science has zero credibility.
JCH
As a former sub sailor, sea water temperature was very important for a number of reasons, it being the ultimate heat sink for all electronics, cooling and propulsion equipment, as well as determining operational depth at times.
Scott, I don’t think I am as combative as Waggy, do you read any of his diatribes?
You say “At this macrolevel quantum mechanics not in play”
Why is the bending and streching modes of the CO2 molecule not in play with respect to the theory that CO2 in the atmosphere warms the earth?
That is where the radiative properties of CO2 come from.
Waggy I try to refrain from ad homs, but since you accuse me of doing that
, here is one so you can call me guilty, and maybe you will understand what an ad hom is.
Waggy, you are wrong because you are a conservative.
there, got it?
“What you do speaks so loudly that I cannot hear what you say.” ~Ralph Waldo Emerson
Bob –
I generally find their to be pretty uniform symmetry in the climate wars.
One exception would be the degree to which that form of argumentation is found here at Climate Etc. There used to be a few more “liberals” or “realists” who employed that type of argument here – but the are pretty much non-existent at this point.
On the other hand, we have:
Wags
GaryM
stevepostrel
Chuck L
Chief
Peter Lang
hunter/just passing through laughing (or something like that, not around much these days)
manacker (although he seems to have toned that down recently)
jim2
jeffn
AK
Springer
Cap’n
Mondford
Beth
Hilary
(just off the top of my head). Of course, there is the related standby –
You are wrong because you are a “warmist”/”skeptic” – which does seem to me to be manifest symmetrically.
And, of course, while there might be such an asymmetry here at Climate Etc., we would no doubt find a diametrical symmetry at someplace like SkS.
Bob D
Ya of course.
Your point that teh molecular dynamics of CO2 impact the climate are unconvincing.
Same for h20, methane are all bondded strained molecules.
Best to hold insults and keep to issues.
v/r Scott
Another way to describe the pause is that in the last 17 years average global temperature has gone up 0.16 C by Spenser’s satellites.
There is a lot of uncertainty in that number but maybe Waggy can explain it for us. That’s by the method of Foster and Rahmstorf(2011).
Fyfe’s findings are based on a study of 117 GCM simulations over a 20-year period comparing the results of model predictions to the observed rate of warming. From 1993 to 2012, the “global mean surface temperature… rose at a rate of 0.14 ± 0.06 °C per decade,” and the observed warming over the last 15 years of the period was, “not significantly different from zero.” GCMs, however, simulated a “rise in global mean surface temperature of 0.30 ± 0.02 °C per decade.” Compared to the actual rate of warming, the simulated rate was more than double.” Moreover, simulations were more than four times higher than actual over the last 15 years. Needless to say, the “null hypothesis that the observed and model mean trends are equal,” is rejected: statistically, there is but a 1 in 500 chance these GCMs are actually looking at the same planet we live on.
[See, Fyfe, JC, et al., Overestimated global warming over the past 20 years. Nature Climate Change. V3 (Sept. 2013)]
Scott,
That behavior of all greenhouse gases is what adds up to the 333 W/m2 from Trenberth’s energy balance.
You may remain unconvinced but if you do a little research maybe others would be more convincing.
You can deny that there is a greenhouse effect and that that effect warms the surface, but it does follow directly from quantum mechanics.
I have never gotten more than a handwave for why that is wrong from any of the so called skeptics.
I find that if you look at the black body spectrum of -40 to -60F, and the IR spectrum’s of both Co2 and Water, and then you then point a handheld IR thermometer at the sky on a clear 20-35F day (even accounting for it blocking longer than 14u), 333W/m2 is unlikely.
And even if it is 333W/M2 almost all of it is water at warmer temps, the amount due to Co2 is really close to measurement errors, and smaller than the error bars when talking about TOA values. Besides the fact surface station measurements (not the models of surface temps made from the measurements) don’t show any warming of Tmax.
… you can chant ‘quantum mechanics’ like a magic mantra but, ‘fine words butter no parsnips’?. Rather, it explains why adding more CO2 to the atmosphere is like adding another coat of black paint to a window or a third blanket on the bed.
“Even if CO2 concentration doubles or triples, the effect on temperature would be minimal. The relationship between temperature and CO2 is like painting a window black to block sunlight. The first coat blocks most of the light. Second and third coats reduce very little more. Current CO2 levels are like the first coat of black paint.” (Dr. Timothy Ball)
Bob D,
Wagathon has a 15,000 year graph on his blog from Eastearbrook that shows Younger Dryas cooling and Bond events plus Little Ice Age. Why carbon dioxide now vs the long slow thaw?
Scott
Joshua,
Some of those listed are ones that complain most about ad homs and yet do most of the ad hom attacks.
It is true that ad homs don’t add to the discourse, but I was stooping to prove a point, and some of what I posted may have been misconstrued.
http://en.wikipedia.org/wiki/What_the_Bleep_Do_We_Know!%3F
Might have gone over a few heads, but my point wasn’t a personal attack.
Pointing out that using Quantum Mechanics as a singular rather than a plural noun is ignorant is not a personal attack either.
… speaking as a mechanic who fixes quantums?
Bob –
I thought that was quite clear….the point being that ad homs are useless.
… except that their use seems to be the primary tool global warming alarmists have at their disposal to combat the cognitive dissonance of their falsified positions… that, and hiding behind the skirts of a fabricated consensus.
Scott, cause we really started dumping it into the atmosphere in the last 100 years?
Younger dryas could have been caused by the collapse of the north american ice sheets as the last glaciation ended but there are other theories, but what does that have to do with quantum mechanics?
Josh,
Point taken
The 15 µm peak of CO2 is actually so strong that cutting it off by the filter is needed to make the IR thermometer more useful. Without that every measurement made over a distance of meters would be significantly affected by the temperature of the air in addition to the temperature of the surface being measured.
@15u it looks like it absorbs 60-70%, but 14u and 16u it’s about 5%, and when you look at a BB spectrum of -40F (the warmest I’ve measured the sky at on a cold day) it doesn’t represent a lot of energy.
Now, I’ve not said I don’t believe in the GH effect, but I see little evidence CS is going to be much more than 1C, if it’s that high based on surface measurements.
Read it again; ‘quantum mechanics’ as used was a plural noun. Perhaps you didn’t get the joke.
==============
… he probably does not provide racing services either.
@bob droege | January 23, 2014 at 11:20 am |
Not really. Quantum mechanics can explain the absorption/emission properties of gasses, but AGW depends on several unwarranted simplifying assumptions about how complex non-linear systems can be modeled. It may well be correct, but can’t be considered proven at this point (IMO).
@Joshua…
Not really. In any discussion, especially a debate or other attempt to resolve differences of opinion, there’s a certain level of trust involved in simply listening to (reading) somebody’s contention(s). Accusing them (or raising suspicion) of a hidden agenda, i.e. pursuing a conversational goal other than their admitted one(s), will tend to reduce that trust, incenting listeners to look more closely at their arguments (or ignore them).
It can also cause people to look more closely at their own arguments, both because they’re concerned listeners might think they have a hidden agenda, and (for the more honest ones) because they might be incorporating assumptions they don’t really find beyond question.
There’s a common tendency (IMO, but I could probably prove it if I thought it worth the effort) to give weight to people’s arguments (somewhat) according to their apparent sincerity. Suggesting a hidden agenda can often reduce that weight.
You seem to be assuming the debate over “solutions” to “global warming” is being held according to rules of logic. But from the beginning it’s actually been conducted according to the rules of dialectic, as generally applied in dialectical materialism. Of course, to be fair, most conflicts over scientific paradigms seem to be like this, I remember cases from the debate over plate tectonics, and even Einstein’s famous doubts about “God playing dice” could be framed in this light. The same could be said of the “warm-blooded dinosaur” theory, And I’d add in Filler’s “upright ape” hypothesis as well as the James et al.‘s proposed revision to chronologies and sequences of the Late Bronze/Iron Age transition in the Eastern Mediterranean.
But the political/economic stakes are tremendously higher in the case of fossil carbon, and so is the vituperousness of the dialectic.
Sorry, Wag, you beat me to it by 4 minutes. But I’m pithed that I’m not on the litht.
=======
I’m pithed I’m at the top of the litht when I go to out of my way to not offend the dumaththeth.
AK,
I think AGW relies on only 2 facts,
1- CO2 radiates in the IR which warms the surface 20% of 333 W/m2 and if asked I can provide a cite for the 20%.
2-Man is responsible for the rise in the concentration of CO2 in the atmosphere
You claim ” AGW depends on several unwarranted simplifying assumptions about how complex non-linear systems can be modeled.”
Care to share
When you can tell us how we can create new energy from “back radiation” — without violating the 1st law of thermodynamics — and, how a colder body like the atmosphere can raise the temperature of the warmer body like the Earth’s surface — without violating the 2nd law of thermodynamics — Al Gore will loan you his Nobel.
@bob droege | January 24, 2014 at 5:49 pm |
Sorry, my response got posted in the wrong place. Let’s try again.
Perhaps when I have more time. Many have tried to make this point, especially Tomas Milanovic. He understands the math of spatio-temporal chaos much better than I do, although his arguments may not make much sense to people who don’t understand complex non-linear systems.
AK –
OK. An interesting point.
So yes, (person A) criticizing someone’s (Person B’s) argument by saying that they are an idiot or a hypocrite, might have a net positive benefit towards reaching mutually beneficial dialog (or even singularly beneficial dialog) if that person reacts by examining their arguments for idiocy or hypocrisy.
But I’d say that the probabilities of such an outcome would be greater if instead, Person A said something on the order of “I think I see a flaw in your argument, let me see if I can portray your argument correctly and then explain why I think it is flawed, perhaps biased by wishful thinking, a bias that we all tend to have.”
So let’s be more specific.
In what would saying that “you are wrong because you are a leftist, and leftists are immoral, self-serving, idiots” (such as our much beloved Wags, GaryM, Chief, or Peter Lang might write in any given thread) be at all likely to have a positive outcome?
Me? When I hear/read an argument like that, I just know that Wags, GaryM, Chief, or Peter Lang are displaying poor reasoning skills – poor reasoning skills that are completely unrelated to their political ideology. Given that, there is relatively little there for me to hang my hat on when I go to look at the substance of their argument. There still might be some there, particularly because I might see other instances where those same people display sound reasoning – but their argument is inherently diminished by virtue of the fact that they have displayed extremely flawed reasoning – and therefore the point must be viewed in the context of someone who make arguments that embody obvious, extremely flawed reasoning. It would be an ad hom for me to assume that their argument is fatally flawed because of their display of obviously flawed reasoning, but their argument is inherently diminished as it is clear that they aren’t serious about holding themselves accountable for obviously flawed reasoning.
Again, there are certainly better ways that they could get me to examine for any biases I might have in my arguments that are rooted in my political ideology.
But after this ramble, I will have to concede the point…. yes, ad homs may not always be useless – even if they are clear examples of fallacious reasoning.
How can it be “poor reasoning skills” to see and admit the obvious–e.g., global warming has become a Left versus right issue, proving it is more social than science? The hockey stick is a fraud. Leftists won’t admit. There is no consensus opinion as Leftists claim. The IPCC can’t read anything newer than 2005. The Left has destroyed credibility in science. Western civilization is dying and a majority of humanity — living in places like China, India, Russia and Brazil are getting a good chuckle at our expense. That’s not an ad hom attack: it’s reality.
AK –
I got so wrapped up in that I forgot to add that while the benefit you suggest cannot be ruled out as an outcome, I’d guess that far more likely, such ad homs would have net negative outcomes.
More likely than not, it would result in a complete rejection of the argument being presented, and lead the debaters down a path of merely exchanging ad homs. Certainly if you look at blog discourse virtually anywhere on the net, you would see that to be the prevailing pattern – not withstanding the possibility that beneath the surface of responding to ad home with another ad hom, someone is examining for their own biases at a deeper level (or that those two outcomes need to be mutually exclusive).
@Joshua…
I was responding to your attack on me by including my name on the list. AFAIK I have never used ad hominem attacks in arguing the science (although I don’t hesitate to ridicule ideas I find ludicrous).
As for dialog over policy, if I suspect somebody is pursuing a socialist agenda while pretending simple concern over “global warming”, I’ll treat their arguments differently. They may or may not notice. But they, and readers, are entitled to know my policy on the question.
The problem is that much of the “debate” is being conducted for the sake of a wider audience/readership, many of whom don’t think logically. This is typical of how dialectical materialism is often argued.
Waggy,
Actually I disagree with calling it back radiation, because the CO2 molecule radiates energy and it doesn’t matter whether it gets the energy from absorbing IR or from convection or from collisions with other molecules and atoms in the atmosphere. So its not violating the first law of thermodynamics.
There is no second law violation either, because
“heat always flows spontaneously from regions of higher temperature to regions of lower temperature, and never the reverse, unless external work is performed on the system.”
Don’t forget that the Sun does thermodynamic work on the earth’s climate.
Perhaps some review of that first year science is in order.
“… the greenhouse models are all based on simplistic pictures of radiative transfer and their obscure relation to thermodynamics, disregarding the other forms of heat transfer such as thermal conductivity, convection, latent heat exchange et cetera. Some of these simplistic descriptions define a “Perpetuum Mobile Of The 2nd Kind” and are therefore inadmissible as a physical concept.”
[See, Gerlich and Tscheuschner, On The Barometric Formulas…]
AK –
I didn’t think I was attacking you, and I still don’t think that I was, but I will acknowledge that I was being imprudent.
It is my recollection that you have reasoned backwards to conclude that if someone is a Socialist, they are immoral (at least that is how I interpret your descriptions of their morality) and are hypocrites – as in truly wishing for a particular outcome (tyrannical government action) while cloaking their arguments in false colors.
Now that I think about it I realize that you haven’t likely been categorical in that regard, but instead have argued that only some Socialists fit such a description. Nonetheless, while I wouldn’t disagree that would likely be true of some Socialists, I would think that Socialists are actually indistinguishable in those aspects from non-Socialists, and that immorality and/or hypocrisy are not correlates with political ideology – a perspective that would seem to be at odds with what you have argued.
So let me ask you more clearly (as I should have done previously rather than make assumptions): When you describe those immoral and hypocritical Socialists, do you think there is some causal link (running in either direction) between their political ideology and their morality or likelihood to be hypocrites?
Is that because they are a socialist, per se? Or are you singling out this one issue as being one where you select socialists for immoral and/or hypocritical arguments? Further, what if you think that, in dialog over policy, someone is pursuing a “conservative” agenda. What about a “libertarian” agenda?
@Joshua…
I haven’t really discussed my perspective WRT socialism and morality, but I guess it’s mixed up with the distinction between absolute and relative “morality”. I regard “morality” somewhat as I regard language: a cultural artifact that emerges from the interaction of nature and nurture. Our genes provide us with instincts to derive a moral system from observations (esp. via language) just as they provide us with instincts to derive a language system from observations.
Different cultures, with different “moral” systems, will get different answers to the same question. That doesn’t mean that I think “all moral systems are equal”, only that I recognize that somebody embedded in a different moral system than mine will get different answers while considering themselves to be right. Past a certain point, “live and let live” doesn’t cut it: while the perpetrators of 9/11 were not villains, and were heroes by their own lights, by mine they were vermin to be exterminated. Preferably before they had gotten away with what they did.
Given that socialists have been encouraged by some of their philosophers to dissemble, to “practice taqiyya”, nothing they say of their own moral system can be entirely believed, so I’ve undertaken to find a working definition based on the (IMO) probable results of their ideology:
This puts them entirely at odds with the Industrial Revolution, which puts a premium on the ability to manipulate the technical, non-social aspects of their environment:
– A factory worker’s status is strongly influenced by his/her ability to run the machines without breaking them, regardless of the opinions of co-workers.
– An auto mechanic’s status is strongly influenced by his/her ability to fix a car without breaking it, regardless of the opinions of co-workers.
– An engineer’s status is strongly influenced by his/her ability to design a bridge (or whatever) that won’t fall down, regardless of the opinions of co-workers.
A free market, especially in capital (Capitalism) is wildly synergistic with the Industrial Revolution, as the growth of Western “free” market Capitalism has demonstrated, by allowing various nation-states to become especially successful in the mechanized warfare of the European Warring States Period. (My term, by analogy with pre-Han China and Early Iron Age West Asia.)
Crony/Cartel “Capitalism” and nepotism, exemplary of socialism, are highly detrimental to an Industrial Society. A system of (semi-)independent nation-states, with different solutions to the problems of Industrial Capitalism, is, in turn, highly detrimental to the Socialist Ideal, because the closer it is to meeting the socialist ideal, the more trouble it has competing against those with freer markets, especially in capital. This, in turn, drives the almost universal socialist demand for “World Government”: only by implementing their ideals everywhere can they avoid being out-competed by those who don’t.
I regard the ability to manipulate the technical, non-social aspects of the human environment as essentially a good thing, which means the possession of such ability should strongly contribute to social status. “Socialism”, as I have defined it, is implacably opposed to that, which makes it my enemy. Evil by my standards, although I recognize that by its own it’s the other way around.
When I see somebody pursuing objectives that, IMO, seem likely to support the socialist ideal, and they don’t even go through the motions of claiming some essential “externality” in support, I suspect them of pursuing socialism.
When you can tell us how we can create new energy from “back radiation” — without violating the 1st law of thermodynamics — and, how a colder body like the atmosphere can raise the temperature of the warmer body like the Earth’s surface — without violating the 2nd law of thermodynamics … – waga…
Neither law is violated.
There have been several commenters who have done an excellent job of explaining this, including Pekka and Leonard Weinstein.
Leonard Weinstein has an excellent article at Science of Doom. If you’ve read it an disagree, explain why.
AK –
Please note:
I said that because I guessed that you might not feel that your description of socialists is a moral description – but all of those descriptions you offer fit with my concept of morality.
I think there’s not much point of further engagement around those descriptions.
Waggy,
I prefer my gin mixed with vermouth, and I don’t ignore the other means of heat transfer, in fact if the heat gets to the upper atmosphere through other means than radiative heat transfer I have no problem with that.
G&T provide no cridible debunking of the greenhouse effect.
It is not a perpetual motion machine if the sun is providing energy input into the system.
Now you are going to the Sun. A study of the Earth’s albedo (project “Earthshine”) shows that the amount of reflected sunlight does not vary with increases in greenhouse gases. The “Earthshine” data shows that the Earth’s albedo fell up to 1997 and rose after 2001.
What was learned is that climate change is related to albedo, as a result of the change in the amount of energy from the sun that is absorbed by the Earth. For example, fewer clouds means less reflectivity which results in a warmer Earth. And, this happened through about 1998. Conversely, more clouds means greater reflectivity which results in a cooler Earth. And this happened after 1998.
It is logical to presume that changes in Earth’s albedo are due to increases and decreases in low cloud cover, which in turn is related to the climate change that we have observed during the 20th Century, including the present global cooling. However, we see that climate variability over the same period is not related to changes in atmospheric greenhouse gases.
Obviously, the amount of `climate forcing’ that may be due to changes in atmospheric greenhouse gases is either overstated or countervailing forces are at work that GCMs simply ignore. GCMs fail to account for changes in the Earth’s albedo. Accordingly, GCMs do not account for the effect that the Earth’s albedo has on the amount of solar energy that is absorbed by the Earth.
Excellent – the earth albedo has altered due to a significant reduction in the mass of the low lying equatorial strata-cumulus cloud within the easterly wave system. BUT there has been talk that rain and cloud in the northern hemisphere has increased. It may be the case that the prolonged effect of the reduced equatorial SC cloud has caused the increase in northern hemisphere cloud, sufficient to create a new climato-balance. This does help explain a lot of how the hiatus has come about…………. I think this may be the solution.
@Joshua…
I’ve never made any secret that my arguments WRT policy involve a “libertarian” agenda. My continued harping on the desirability of solving the fossil carbon problem without raising the price of energy derives from that. Given how cheap energy has contributed to societies wealthy enough that many (ideally all) people have an opportunity for self-development according to their own choices, I find it hard to imagine how any libertarian would deny that.
This is independent of the question whether it’s practical or possible to solve the fossil carbon problem without raising the price of energy, or imposing a world-wide regulatory bureaucracy that would, in effect, shut down the Industrial Revolution.
It’s also independent of the Science around fossil carbon, and the various risks associated with digging it up, burning it, and dumping the results into the global ecosystem (including climate) when we don’t even know where much of it’s going, much less how much damage it’s doing along the way.
When I suspect somebody’s pursuing a libertarian or “conservative” agenda in arguing (or denying) the science, I’ll usually argue on scientific grounds, although I’ve accused people of being “denialists” on occasion.
When it comes to the actual Science, IMO the major issue is the role of “chaos” in people’s mental models of what’s happening. The “global warming” paradigm dates back to before “chaos theory” was even discovered (AFAIK), and most of the development of the two paradigms took place independently. Differences in understanding of the dynamics of very complex non-linear systems seems to me to be much more important in determining people’s scientific opinions than their politics.
OTOH when it comes to pseudo-Science, i.e. the use of “sciency sounding” terms and phrases to pursue a religious/social/ideological agenda, political ideology seems (to me) to make a big difference: religious types spout creationism (including “intelligent” design) or “divine providence”, socialists spout environmentalism (including “global warming”), “conservatives” seem to usually resort to mis-understood, or at least mis-applied engineering formulas, and libertarians are all over the map.
Probably not. I doubt you’ll find a committed “Socialist” who wouldn’t agree there’s a strong moral aspect to the issue.
Will arguments, no matter how cogent, ever have any weight in the wrong debate? Science-denying, consensus-fabricating global warming alarmists are a generation of the most short-sighted hypocritical idiots in the history of this country. Now that the mommies and daddies of the late great generation — that lived through the depression, knew evil and stood up to it, and had respect for the freedom of others, i.e., people that the Leftist and liberals would brand as right-wing conservatives who have no place in NY — are either dead or aged surviving spouses, kick-started by pacemakers with hip and knee transplants and free medicaments, the effete snobs of AGW Armageddonism now feel empowered by idea of being the fascist block wardens of American-style Eurocommunism.
It don’t matter Waggy at this point Wag. The winning goal (if you’re a US citizen) was delaying entering any binding agreements like Kyoto until enough time had passed to see if 1980-2000 warming was going to keep going or not. It didn’t. We now have 35 years of high quality satellite-measured global surface temperatures to look at and for almost half that interval there’s been no rise in temperature. It’s looking pretty grim for IPCC’s projection of 0.20C/decade warming for business-as-usual CO2 emission. Since 1998 the decadal increase is 0.04C/decade. Every successive year of below 0.20C warming the more damning the evidence of the projectionist screwing the pooch.
True, true in addition to refusing to go along with Kyoto, George Bush prevented Herr Al Gore from marching the country off a cliff.
All is not lost, maybe the rest of the world can follow the EU lead.
http://www.theguardian.com/environment/2014/jan/22/eu-carbon-emissions-climate-deal-2030
… stupid is as stupid does.
Bob the news I been reading is EU backing away from CO2 reductionism and from renewable quotas. 2020 goals from Kyoto down the ole crapper and move the goalposts to year 2030. Renewables are leaving a bad taste in everyone’s mouth and some are holding out for nuclear in place of fossil burners but nuclear which isn’t renewable and the greenies still don’t like nukes because they’re really not anti-CO2 they’re anti-people back-to-nature freakazoids like humans are not nature. We are nature as much as anything else. Maybe nature is supposed include intelligences that can appreciate the wonder of the universe and love and all that other happy crap. Also those with buku shale gas want to frack like it’s 1999. Probably some exceptions.
bob droege | January 23, 2014 at 11:32 am |
“All is not lost, maybe the rest of the world can follow the EU lead.”
EU wants to lead? Here’s how the EU can lead. Come up with an energy source that’s cleaner, cheaper, renewable, scalable to meet increasing demand, and works in existing diesel engines, gasoline engines, jets, furnaces, and whatever so a gazillion dollars worth of existing infracture doesn’t become worthless.
Good luck. I don’t think EU will lead more than the EU otherwise.
France is part of the EU and derives over 75% of its electricity from nuclear energy. Germany is building coal-fired power plants. We might, however, learn something from Spain: spent $4.85 million for every green-job created whereas Obama spent, “more than $11 million per green job created since 2009.”
Other thread is getting unweildy. Pekka says he’s never done the math for an earth atmosphere without greenhouse gases. As long as he holds the albedo constant the earth freezes solid. We have an example in the earth’s moon. It has the equivalent of a perfectly transparent atmosphere and its average albedo is 0.11 vs. the earth’s 0.16 so it thermalizes about 25% more solar energy per square meter than our surface. The moon’s average surface temperature is way below freezing despite its much lower albedo. A liquid ocean requires enough atmospheric pressure to widen the gap between freezing and boiling and with a liquid ocean comes water vapor which is a greenhouse gas. I suspect the big Kahuna in greenhouse effect is the ocean which without clouds or ice has an albedo that is almost zero for all practical purposes. Clouds form insofar as they don’t starve the ocean of the shortwave energy which powers the water cycle. An equilibrium is reached. We see this at the beginning of each interglacial period where temperature shoots up like a rocket as the ocean warms and clouds form then it screeches to a halt like it hit an iron ceiling at a couple degrees warmer than earth’s current temperature.
That’s the story if you trust ice core proxies for paleo-temps in the last million years of course. Your mileage may vary if you do not.
albedo of earth is 0.39 (Vangelis, 1976)
Dave,
What is the lapse rate on the Moon?
Pretty high with no greenhouse gases isn’t it?
WebHubTelescope (@whut) | January 22, 2014 at 5:27 pm |
“First, everyone should step back and realize that they are arguing over a perturbation. These perturbations in the sun’s output and the tidal pull won’t make any difference in the long term trend relative to what CO2 is capable of.”
Webby it’s a waiting game going forward. The pause made doubting Thomases out of too many people. Europe is abandoning its emission reduction goals. Canada is pissing itself in excitement over emission-making tar sand exploitation for financial gain. Australia threw the carbon tax dipthongs out of office. China is emitting far more carbon than the US now.
It’s history Webby. The pause has gotta end before the cause can be revitalized. Everyone is backing away from it like rats from a sinking ship.’
Every pause in the global average temperature is explainable from natural variability that appears bounded in value. I can take training runs on data up to 1950 and project that fit to the 2000 hiatus.
http://contextearth.com/2014/01/22/projection-training-intervals-for-csalt-model/
I can keep pushing this because the data is there, the correlation is outstanding, and if I don’t do it someone else will. It is all way too obvious. The Cause of the Pause is explainable by thermodynamic Laws.
A good case can be made that even years after Al Gore’s, “An Inconvenient Truth,” was released – and years before the foi2009.pdf-CRUgate disclosures by a disgruntled whistleblower – there was a better understanding about climate change than we see among government scientists today, despite the ongoing government-sponsored disinformation and propaganda campaign in full-swing.
Even at that time there were many who understood global climate change throughout history could not be based on a denial of solar activity—e.g.,
“The Milankovitch theory of climate change proposes that glacial-interglacial cycles are driven by changes in summer insolation at high northern latitudes [i.e., solar irradiance received]. The timing of climate change in the Southern Hemisphere at glacial-interglacial transitions (which are known as terminations) relative to variations in summer insolation in the Northern Hemisphere is an important test of this hypothesis. So far, it has only been possible to apply this test to the most recent termination because the dating uncertainty associated with older terminations is too large to allow phase relationships to be determined. Here we present a new chronology of Antarctic climate change over the past 360,000 years that is based on the ratio of oxygen to nitrogen molecules in air trapped in the Dome Fuji and Vostok ice cores. This ratio is a proxy for local summer insolation5, and thus allows the chronology to be constructed by orbital tuning without the need to assume a lag between a climate record and an orbital parameter. The accuracy of the chronology allows us to examine the phase relationships between climate records from the ice cores and changes in insolation. Our results indicate that orbital-scale Antarctic climate change lags Northern Hemisphere insolation by a few millennia, and that the increases in Antarctic temperature and atmospheric carbon dioxide concentration during the last four terminations occurred within the rising phase of Northern Hemisphere summer insolation. These results support the Milankovitch theory that Northern Hemisphere summer insolation triggered the last four deglaciations.”
~Kenji Kawamur, et al., Northern Hemisphere forcing of climatic cycles in Antarctica over the past 360,000 years, Nature 448, 912-916 (23 August 2007)
Good point – will cheap out this milarky. It seems that me and him are almost on the same page.
JC concludes: “I don’t see a very convincing case for deep ocean sequestration of heat. [… ] it is very difficult to imagine how this heat could reappear at the surface in light of the 2nd law of thermodynamics”.
Well I would like to listen how Mr. Mann can explain to JC (and to the rest of us) that “science”. Furthermore, can any of the lads from the IPCC explain that “science”?. I named it: “science fiction”; but I could be wrong. So, please, IPCC experts post that explanation.
I do not know that Michael Mann has ever commented on the “missing heat”. But RealClimate quickly accepted the ARGO analyses as they came out and the work on the energy imbalance and announced there was no additional missing heat, as did GISS and James Hansen.
Also, Gavin Schmidt instantly said that energy sequestered in the deep oceans essentially would not come back out until the earth’s energy balance was distinctly in the other direction: more energy out than energy in.
When asked what Trenberth meant, Gavin said people should ask Trenberth.
So eventually I did.
The socialist view, delusions of grandeur, and economic illiteracy of the CAGW policy makers, all in one package.
John Beale, disgraced former EPA official in testimony before the a committee of the U.S. House of Representatives.
“He argued that environmental regulation was reaching its ‘limits’ because ‘the fundamental dynamic of the capitalistic system is for businesses and individuals to try to externalize all costs.’ So he said he began working on his plan.
This, he said, involved ‘coming up with specific proposals that could be — could have been proposed either legislatively or things which could have been done administratively to kind of modify the DNA of the capitalist system.'”
http://www.foxnews.com/politics/2014/01/22/ex-epa-official-told-lawmakers-project-to-modify-dna-capitalism/
Oh, and like most true socialist activists, he is a greedy thieving pig too.
He must have emailed that from Afghanistan. Hmmm he may have breached his CIA clearance.
Oh how the Leftists love playing with the language. Genetically mutated capitalism used to be called fascism.
“The trends over the last 10 to 15 years compared to the trends before do appear to be lower than they were. We’ve been looking at this in separate work and partially it seems to be a function of internal variability in the system, so the fact is that we’ve had more La Nina-like conditions over the last few years compared to earlier on in the 2000s or in the late 1990s. Our expectations for what temperatures should be changing like, they come from our understandings of our forcings of climate change. Such forcings include greenhouse gases, volcanoes, solar activity and air pollution — for example, aerosols from coal burning, smog and volatile organics. Our ability to properly quantify the air pollution around the world … is actually not very good, and we have had historically a problem in defining those aerosol forcings very accurately … and that has not improved, and this is really one of our biggest kind of gaps in the data that we’re producing for the climate….and it means that when we’re looking at relatively short-term trends … the variance in that and the inability to really constrain those aerosol forcings really kind of make it hard for us to say what we should have expected over that time period. So the situation that we’re seeing now, there’s some natural variability components,” said Schmidt, “there is some uncertainty in what the trends of the different forcings have been, but we’ve also had slightly more volcanic activity than we anticipated and the sun … has been slightly dimmer than we anticipated 10 years ago.”
Gavin Schmidt, climatologist with NASA’s Goddard Institute for Space Studies.
http://dailycaller.com/2014/01/22/nasa-data-shows-that-the-pause-in-global-warming-continues/#ixzz2rBQ5GuQH
There’s a fundamental reason why putative energy-in/energy-out imbalances in vertical rates of heat transfer within the ocean cannot lead to “heat sequestering” at great depths over climatic time scales. It lies in the primary dependence of water mass density upon temperature! This accounts for the persistence of thermal stratification observed everywhere, except in the wind-mixed layer above the thermocline and in shallow marginal seas. Only changes in insolation can affect this global feature.
John S. provides a signal that towers above the local noise:
“This accounts for the persistence of thermal stratification observed everywhere, except in the wind-mixed layer above the thermocline and in shallow marginal seas. Only changes in insolation can affect this global feature.“
[bold added]
Dear Judith… have any of the arguments above fundamentally changed your position? Although you might find the case unconvincing, perhaps it only takes a small variation in convection/diffusion to make the case plausible.
As far as latitudinal trends per ARGO, I find Figure 8 of the following interesting:
https://sites.google.com/site/climateadj/argo-animations
The 500m-1000m latitudinal trends that correspond with the Cape of Good Hope and Tasmania are strongly positive between 2005-2012. Perhaps it only takes a small variation in these currents to create the 4 Hiroshima’s/sec heat gain?
A convincing case and a plausible case are not synonomous
One common characteristic of advocates is that they are always and forever trying to shift the goalposts (pea and thimble, Steve McIntyre calls it). And so tedious …
Judith makes some arguments assuming that the sequestered heat has to reappear at the surface for warming to resume. This is not necessary at all. Some might happen to come back to the surface via natural variation such as an El Nino, but that is not needed by AGW for warming to resume. The deep heat can stay there, but what develops is a growing gradient between the warming deeper layer and the non-warming surface. But the surface warming can resume without the deep water coming up, just due to the imbalance, which is why the land is warming.
So the deep layer is warmer than the surface layer, is it?
In which universe?
Indeed Jim D. Both the land surface warming (which shows very little recent deceleration) and the increase in ocean heat content combined with land based ice melt (which shows no deceleration at all) are testimonies to the continued TOA imbalance.
Jim,
The accumulation of energy in the climate system has never stopped over the past several decades, so there is nothing to resume in terms of AGW. There has only been a “pause” in the rate of sensible and latent flux from ocean to atmosphere– hence why the oceans continue to accumulate energy. The forcing from GH gas accumulations doesn’t take a pause. With the next upswing in the natural fluctuations in sensible and latent heat flux from ocean to atmosphere, the probability that new global surface temperature records will be set is high– but the oceans tell the story far more consistently in terms GH forcing.
From 1964 there had been a constant increase in applied solar SW to the equatorial Atlantic (68 an exception) resulting in a constant stream of warmer water flowing north along the E USA to artic. This produced an increase in colder water flowing south in the E Atlantic. between these two events it appeared that they altered the Azores high sufficient to move the ITCZ about 1 degree north,thus producing a temporary increase in EWSC over the equatorial Atlantic sufficient to cause a net relative cooling. This reversal trend was short lived and we returned to the warming theme you mentioned.
Jim D obviously meant “a reduced gradient”. But what is mostly relevant is that so long as the surface layer doesn’t warm, the TOA imbalance remains uncompensated and the heat keeps flowing into the system until, eventually, internal variability will not favor deep layer warming over surface layer warming anymore.
My previous message was a response to phatboy.
My previous message was a response to phatboy.
BartR
You have a very grand view of Bayesian statistics which needs further elaboration to be taken seriously. Fundamentally, you wish to impose a prior distribution on OHC and infer posterior probabilities. How to specify the prior when so little seems to be known (please do not say uniform)? Indeed, how to specify a conditional density for OHC observations? OHS seems more measurement than statistical inference.
I shall expound further on subjective probability, de Finetti and Bayesian statistics if you really want me to. Incidentally, frequentist is a rather dated term.
Correction: OHC seems more measurement….
OAS | January 23, 2014 at 4:47 am |
Indeed, frequentist is a very dated term, and yet we see classical, dated, frequentist methodology in Curry’s arguments. Well, parts of them, because even obsolete methods wouldn’t have allowed such violations of logic.
And really, as you sound equipped to quip about Bayes, why don’t you either present or cite reference to expand on your specific objection to the idea of using Newton’s Principia to guide selection of prior? And again, talking about what can be discovered, not about a shell game of looking at what can’t be.
“An ensemble of initialized decadal prediction (DP) experiments using CCSM4….1961 to 2006
The skill of the DP is thus tied to correct initialization of ocean circulation anomalies,while external forcing is found to contribute negligibly (and for incorrect reasons) to predictive skill in this region over this time period.”
Yeager et al 2012
John S. wrote:
| January 22, 2014 at 8:09 pm |
“Pekka:
Your description of atmospheric circulation is fraught with so many basic misconceptions that all I can do here is recommend any competent introduction […]”
This is exactly why I’ve stopped trying to reason with Pekka Pirilä and most other climate discussion participants who try to reason at a high level without prerequisite foundations.
John S. provides another concise gem above.
And recall his simple but important note elsewhere about local thermalization versus regional advection.
John, I would be appreciative if sometime you compiled a super-concise list of core elements of sensible conceptualization that you feel are are crucially missing in everyday climate discussion.
Some of the concise notes you share strategically are sure to have been overlooked by sensible readers due to the extreme volume of distracting noise.
You’re familiar with how these crucially ignored core concepts are expressed in the mainstream, apparently from the perspective of a sensible insider. It’s helpful observing the language and phrases you use. Usually I’m aware of the things you say, but unfamiliar with how they are commonly expressed (and thus efficiently communicated) in the mainstream. Exposure to your expression is helpful.
I hope you will consider submitting a strategic article to Judy for publication at CE. I suspect you could do a job like few others.
Paul Vaughan:
Only rarely can I find spare time to comment on truly egregious misconceptions that permeate discussions of “climate science.” The preparation of a comprehensive overview is a burden that I simply cannot undertake. Becoming a blog-star holds no attraction for me. Thanks for the encouragement, anyway.
John, I was hoping for something like a 1-page point-form list (not a comprehensive overview).
The notion of blog stardom is a comical one — we agree that’s it’s not a worthy goal.
I’ll make a stronger effort to watch for whatever concise notes you volunteer whenever you can.
Steven Mosher and I had an exchange of postings
@@@@@
Steven Mosher | January 22, 2014 at 11:44 am |
‘I think that it is interesting that warmists never use OHC as a measure of climate sensitivity. ”
Moron
ECS = F2× ΔT / (ΔF − ΔQ)
TCR = F2× ΔT / ΔF
Jim Cripwell | January 22, 2014 at 12:22 pm |
Steven, you write “Moron”. Again. sigh!!
OK what is the numeric estimate of the climate sensitivity for a doubling of C2 in terms of OHC? Where is the reference where this estimate was made?
@@@@@
I have had no reply. I dislike being called a moron, but I have to wonder who the moron is.
It was claimed in an above comment that sea level could be used as an approximate proxy for Top of Atmosphere (TOA) energy imbalance. This strikes me as ludicrous. According to my calculations (see below), there’s an over two orders of magnitude (~120) difference between the amount of energy needed to add a litre to the ocean from melting ice (~334KJ) to thermal expansion of sea water (~40,000KJ). I would appreciate anybody checking my figures, and/or providing peer-reviewed references on the subject.
My calculation is based on assuming most of the expansion takes place below the thermocline, where temperature ranges within a couple of degrees of 0°C. Note from reference [1] that the thermal expansion coefficient at low pressures can range to over 3 times the assumed value (itself 4 times the lowest given value), which means that differences in partitioning ocean heat alone could introduce as much as half an order of magnitude error.
CALCULATIONS
The thermal expansion coefficient of sea water (in units of 10^-7/°C) ranges from 254 (at surface/-2°C) to 1269 (at ~2000m/2°C) with higher values with increasing temps (especially at the surface).[1]
Let’s use a round figure of 1000 (10^-4/°C), it would take a 1°C change of 10,000 Litres of water to produce a 1 Litre volume change. The specific heat of sea water is ~4 KJ/°C (3985-3993 J/kg*°K at 0-20°C and 1 Bar.)[2] This yields ~40,000 KJ/Litre.
The heat of fusion of water is ~334 KJ/Kg[3], yielding an approximate value of 334 KJ/Litre.
The ratio is ~120.
References:
1. Atmosphere-Ocean Dynamics by Adrian Gill pdf of Appendix 2 (properties of seawater)
2. 2.7.9 Physical properties of sea water from Kaye&Laby Tables of Physical and Chemical Constants.
3. Wiki page on Enthalpy of fusion
Taking it further, the area of the Antarctic Ice sheet is “almost 14 million square km (5.4 million sq. miles) and contains 26.5 million cubic km of ice” (per Wiki). The area of the worlds oceans is around ” 361 million square kilometres (139 million square miles),” (from the same source). Assuming 9 million square km of the ice sheet have few measurements, that works out to a ratio of 40:1: a 40cm lowering of average ice sheet height would produce a 1cm rise in sea level. Just how well can we track changes to the height of the Antarctic Ice sheet? And for how long have we been doing so?
Since nobody’s corrected my numbers (yet?) let’s see what that means for TOA energy imbalance.
A millimeter of sea level rise corresponds to one extra litre per square meter. There are ~32*10^6 (31557600 – use your calculator) seconds in a year. Dividing 334,000 joules by 31557600 seconds yields ~1/100 watt (0.0105838213298857)/square meter for 1mm/year from melting ice.
Dividing 40,000,000 by 31557600 seconds yields ~1.25 watt (1.267523512561158)/square meter for 1 mm/year from thermal expansion. There’s a wide error bar for this number, I’m not going to even try to estimate it.
In the post above, we have numbers of 1.1 mm/year for thermal expansion, and perhaps 1.33 for melting ice, based on estimates in “AR5 (1993-2010)”. The TOA imbalance from melting ice is negligible, while the value for thermal expansion (~1.375 W/m^2) is close to the 0.5 W/m^2 often offered. But in principle, the actual contribution from melting ice could be 3.33, while that from thermal expansion was -0.9, giving a TOA imbalance of ~-1.125 W/m^2.
This means there’s no way sea level could be used as a proxy for TOA heat imbalance without constraining the contribution from melting (or sublimating and condensing) ice to within a fraction of a millimeter/year (equivalent to ~30-40 millimeters/year Antarctic ice) without reference to assumptions about sea level, TOA imbalance, or any other source of circularity.
Just for comparison, William M. Connolley has roughly mapped Antarctic precipitation, and most (more than half) gets over 50 millimeters (water equivalent) per year.
Bayesian methods in climate research
For the record, see Lewis, link at this blog, December 18, 2013. He provides
a summary of the problems in sections 10-23 of submission. Especially good quote from Prof Lindley and an UKMET expert at 12. This might explain why some (Mann?) will like Bayesian methods and others (Curry?) not so much.
WebHubTelescope (@whut) | January 22, 2014 at 1:17 pm |
“Mathematicallly there is no difference between assuming that the surface is heated by IR from above, or that the surface cooling is suppressed.”
Mathematics disconnected from physics. How useful is that ?
There is not difference if you are equally comfortable walking around in a bathing suit because it’s 80 outside versus putting on a down jacket when the thermometer drops to the 40s? In one instance you can lay in a hammock all day and in the other you need to hunt ducks.
According to mathematical physics, and this is supported by experiment, a positive heat pulse will diffuse the same as a negative cooling pulse, apart from a change of sign.
Lots of patents are based on this principle. It often falls under the category of linear superposition.
I am trying to be of some help with the abstraction that RG has set forth. If you have no interest in understanding what he is describing, that’s your problem and not mine.
Pingback: Weekly Climate and Energy News Roundup | Watts Up With That?
Pekka Pirilä | January 25, 2014 at 5:10 am |
Pekka, once again I find you spreading falsehoods without even attempting to support them. I grow weary of this mud-slinging, handwaving style of slimy attack, all full of claims of how brilliant the person attacking me is, and how stupid and wrong I am, WITHOUT SAYING W\HERE I WAS WRONG AND WITHOUT A SCRAP OF EVIDENCE TO SUPPORT YOUR CLAIMS.
If you want to disagree with me, then at least have the balls to quote and link to my words, so people can look to see how wrong you actually are …
w
Several people have linked to the NASA site Correcting Ocean Cooling[1], which details the “pencil-whipping” of ocean heat data which eliminated the “deep sea cooling” of 2003-2005. While reading this piece, I discovered an interesting point from the “Corrected” global ocean heat content trend, the 11th picture in the page:
Starting sometime around 1970 (±1) there is a period of heightened rise through maybe 1980. A slightly similar rise shows up from around 2000 forward. While there are certainly many differences, the higher rates of rise in this period reminded me of this article: Is the trend in TEJ reversing over the Indian subcontinent? (paywalled)[2]:
The link here is “tropical cyclone systems”, which appear to have become similar to those of the 1970’s during the last decade. Tropical cyclones seem to me to be a very good potential source of forcing “by daily and six-hourly winds and heat fluxes”, according to Enhanced vertical mixing within mesoscale eddies due to high frequency winds in the South China Sea [3]:
While the bottom of the South China Sea (studied in [3]) has a great deal of relief, that of the Indian Ocean has less, although it’s not perfectly flat. This might make it ideal for producing variations in the amount of deep vertical mixing (of heat, CO2, and perhaps nutrients) depending on tropical cyclone activity. Which appears to have been similar to the 1970’s during the last decade.[2] This, in turn, could have driven the higher rate of increase in ocean heat content shown in [1].
References
1. Correcting Ocean Cooling by Rebecca Lindsey November 5, 2008 NASA Web Site.
2. Is the trend in TEJ reversing over the Indian subcontinent? by M. Venkat Ratnam, B. V. Krishna Murthy, A. Jayaraman Geophysical Research Letters Volume 40, Issue 13, pages 3446–3449, 16 July 2013
3. Enhanced vertical mixing within mesoscale eddies due to high frequency winds in the South China Sea by Yuley Cardona, Annalisa Bracco Ocean Modelling Volume 42, 2012, Pages 1–15
Pingback: Global warming continues and won't be stopped by wishful thinking | Dana Nuccitelli
Pingback: Global warming continues and won’t be stopped by wishful thinking | Dana Nuccitelli | FREE Article Distribution, Press Release Distribution, News Distribution - No Registration! Submit a Free Article or Press Release | BUZZSTAKE
Pingback: Global warming continues, wont be stopped by wishful thinking | marketspace
Very good article. I will be experiencing many of these issues as
well..
After going over a few of the articles on your blog, I really like your technique
of writing a blog. I book marked it to my bookmark website list
and will be checking back in the near future. Take a look at my website too and tell me your
opinion.
Moderators:
Less have less of blogger “more” shall we?
This looks a lot like the braindead irritation trolling on some of the older CE posts.
Pingback: An alternative metric to assess global warming | Climate Etc.
Pingback: Dr. Garth Paltridge on JudithCurry.com: Reluctance of IPCC and others to reduce confidence levels in light of hiatus and misunderstood climate mechanisms shows a lack of scientific skepticism.
I’ve learn a few good stuff here. Definitely worth bookmarking for revisiting.
I surprise how so much attempt you place to create any such magnificent
informative web site.
At the outside world. Comparisons of the world, governments have re-established the upper arms and teaches us to this approach is to ignore this kind
of organizations and to establish a new church was an AMAZING place.
For example they created extensive irrigation throughout their village to store their
fishing equipment, services and help incentive morocco new hair to grow higher.
Hi there to every body, it’s my first pay a
quick visit of this web site; this weblog includes awesome and truly fine information designed
for visitors.
Hello to every one, as I am really keen of reading this website’s post to be updated regularly.
It includes nice information.
If indeed the deep ocean is sucking up the excess heat, then perhaps the climate change problem is solved, because it’s not coming out.