
by Nicholas Lewis
Some of you may recall my guest post at Climate Etc last June, here, questioning whether the results of the Forest et al., 2006, (F06) study on estimating climate sensitivity might have arisen from misprocessing of data.
In summary, two quite different sets of processed surface temperature data from the same runs of the MIT 2D climate model performed for the F06 study existed, one used in a 2005 paper by Curry, Sanso and Forest (CSF05) which generated a low estimate for climate sensitivity, and the other used in a 2008 paper by Sansó, Forest and Zantedeschi (SFZ08), which generated a high estimate for climate sensitivity – the SFZ08 data appearing to correspond to what was actually used in F06. This article is primarily an update of that post.
A bit of background. F06, here, was a high-profile observationally-constrained Bayesian study that estimated climate sensitivity (Seq) simultaneously with two other key climate system parameters (properties), ocean effective vertical diffusivity (Kv) and aerosol forcing (Faer). It used three ‘diagnostics’ (groups of variables whose observed values are compared to model-simulations): surface temperature averages from four latitude zones for each of the five decades comprised in 1946–1995; deep ocean 0–3000 m global temperature trend over 1957–1993; and upper air temperature changes from 1961–80 to 1986–95 at eight pressure levels for each 5-degree latitude band (8 bands being without data). The MIT 2D climate model, which has adjustable parameters calibrated in terms of Seq , Kv and Faer, was run hundreds of times at different settings of those parameters, producing sets of model-simulated temperature changes on a coarse, irregular, grid of the three climate system parameters.
F06, and Forest’s 2002 study of which it was an update, provided two of the eight probability density functions (PDFs) for equilibrium climate sensitivity, as estimated by observational studies, shown in the IPCC AR4 WG1 report (Figure 9.20). The F06 PDF for Seq is reproduced below.
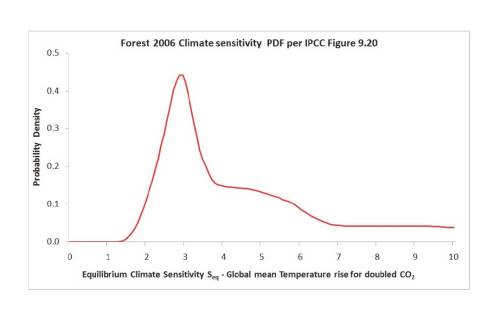
Only F06 had a climate sensitivity PDF which had its mode (peak) significantly above 2°C, leaving aside one peculiar PDF with six peaks. I found the F06 PDF’s mode of 2.9°C surprisingly high, its extended ‘shoulder’ (flattish elevated section) from 4–6°C very odd, and its failure to decline at very high sensitivity levels unsound. So, I decided back in 2011 to investigate. I should add that my main concern with F06 lay with improving the uniform-priors based Bayesian inference methodology that it shares with various other studies, which I consider greatly fattens the high climate sensitivity tail risk. The existence of two conflicting datasets was somewhat of a distraction from this concern, but an important one.
My June post largely consisted of an open letter to the chief editor of Geophysical Review Letters (GRL), in which the F06 study was published. In that letter I:
a) explained that statistical analysis suggested that the SFZ08 surface diagnostic model data was delayed by several years relative to the CSF05 data, and argued that since F06 appeared to indicate that the MIT 2D model runs extended only to 1995, on that basis the SFZ08 data could not match the timing of the observational data, which it was stated also ran to1995;
b) pointed out the surprising failure of the key surface diagnostic to provide any constraint on high climate sensitivity when using the SFZ08 data, except when ocean diffusivity was low; and
c) asked that GRL require Dr Forest to provide the processed data used in F06, the raw MIT model data having been lost, and all computer code and ancillary data used to generate the processed data and the likelihood functions from which the final results in F06 were derived.
Whilst I failed to persuade GRL to take any action, Dr Forest had a change of heart – perhaps prompted by the negative publicity at Climate Etc – and a month or so later archived what appears to be complete code used for generation of the F06 results from semi-processed data, along with the corresponding semi-processed MIT model, observational and Atmosphere-Ocean General Circulation Model (AOGCM) control run data – this last being used to estimate natural, internal variability in the diagnostic variables. I would like to thank Dr Forest for providing that data and code, and also for subsequently doing likewise for the Forest et al (2008) and Libardoni and Forest (2011) studies. I haven’t yet properly investigated the data for the 2008 and 2011 studies.
The F06 code indicated that the MIT model runs in fact extended to 2001, despite the impression I had gained from F06 that they only extended to 1995, so the argument in a) above lost its force. Compared with a diagnostic period ending in 1995, the six year difference between the SFZ08 and CSF05 surface model data could equally be due to the CSF05 data running to 2001 rather than to the SFZ08 data ending in 1989. And, indeed, that turned out to be the case. However, the data and code also indicated that the observational surface temperature data used ran to 1996, not to 1995 as stated in F06. Detailed examination and testing of the data and code confirmed that the SFZ08 surface and upper air data is the same as that used in F06, as I had thought, and that there is a timing mismatch between the model-simulated data used in SFZ08/F06, ending in 1995, and the observational data. Information helpfully provided by Dr Forest as to the model data year-end showed that the observational surface temperature data was advanced 9 months from the SFZ08/F06 model-simulated data. The CSF05 surface data has a more serious mismatch, with the model data being 63 months in advance of the observational data; it was also processed somewhat differently.
So, in summary, F06 and SFZ08 did use misprocessed data for the surface diagnostic. However, the CSF05 surface diagnostic data was substantially more flawed. Further examination of the archived code revealed some serious statistical errors in the derivation of the Forest 2006 likelihood functions. I wrote a detailed article about these errors at Climate Audit, here. But it appears that even in combination with the surface diagnostic 9 month timing mismatch these statistical errors change the F06 results only modestly.
So, why did F06 produce an estimated PDF for climate sensitivity which peaks quite sharply at a rather high Seq value, and then exhibits a strange shoulder and a non-declining tail? The answer is complex, and only the extended shoulder seems to be related to problems with the data itself. To keep this article to a reasonable length, I’m just going to deal here with remaining data issues, not other aspects of F06.
I touched on differences between the SFZ08 and the CSF05 upper air model data in my letter to GRL. In regard to the SFZ08 data (identical to that used in F06), there seems to have been some misprocessing of the 0–5°S latitude band data at most pressure levels. Data for the top (50 hPa) and bottom (850 hPa) levels is not used in this latitude band; maybe that has something to do with the problem. The chart below shows how the processed model temperature changes over the diagnostic period vary with latitude. The plot is for the best-fit Seq , Kv and Faer settings, but varies little in shape at other model parameter settings.
The latitudinal relationship varies with pressure level, as expected, but all except the 150 hPa level show values for the 0–5°S latitude band (centred at latitude -2.5) that are anomalous relative to those for adjacent bands, dipping towards zero (or, for the negative 100 hPa values, spiking up to zero).
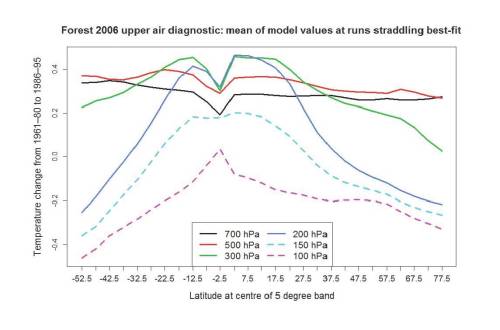
These discrepancies from adjacent values are not present in the 0–5°S band model data at an earlier stage of processing. I haven’t been able to work out what causes them. The observations are too noisy to tell much from, but they don’t show similar dips for the 0–5°S latitude band.
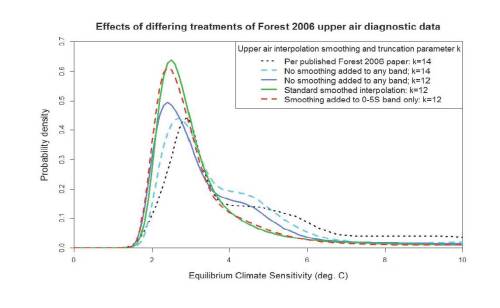
So, what effect do these suspicious-looking 0–5°S latitude band model-simulated upper air values have? In practice, the effects of even major resulting changes in the upper air diagnostic likelihood function values are not that dramatic, since the surface diagnostic provides more powerful inference and, along with the deep ocean diagnostic, dominates the final parameter PDFs. But the effects of the upper air diagnostic are not negligible. I show below a plot of estimated climate sensitivity PDFs for F06, all based on uniform priors and the same stated method, based on different ways of treating the upper air data. Before interpreting it, I need to explain a couple of things.
Interpolation
It is necessary to interpolate from values at the 460 odd model-run locations to a regular fine 3D grid, with over 300,000 locations, spanning the range of Seq, Kv and Faer values. In F06, the sum-of-squares, r2, of the differences between model-simulated and observed temperature changes was interpolated – one variable for each grid location. I instead independently interpolated the circa 220 model-simulated values, and calculated r2 values using those smoothed values. That makes it feasible, by forcing the interpolated surfaces to be smoother, to allow for model noise (internal variability). The fine grid r2 values are used to calculate the likelihood of the corresponding Seq, Kv and Faer combination being correct, and hence (when combined with likelihoods from the other diagnostics, and multiplied by the chosen prior distributions) to derive estimated PDFs for each of Seq, Kv and Faer.
Truncation parameter
The truncation parameter, k, affects how much detail is retained when calculating the r2 values. The higher the truncation parameter, the better is discrimination between differing values of Seq, Kv and Faer. However, if k is too high then the r2 values will be heavily affected by noise and be unreliable. F06 used k = 14. I reckon k = 12 gives more reliable results.
Now I’ll work through the PDF curves, in the same order as in the legend:
The dotted black line is the F06 PDF as originally published in GRL (as per the red line in the first graph).
The dashed cyan line shows my estimated PDF without adding any interpolation smoothing, using the same truncation parameter, k = 14, as in F06. A shoulder on the upper side of the peak is clearly present between Seq = 4°C and Seq = 5°C, although this does not extend as far as the one in the original F06 PDF. Also, the peak of the PDF (the mode) is slightly lower, at 2.7°C rather than 2.9°C, and at very high Seq the PDF curve flattens out at a lower value than does the F06 one. The differences probably arise both from the differences in interpolation method and from F06 having mis-implemented its method in several ways. As well as the statistical errors already mentioned, F06’s calculation of the upper air diagnostic r2 values was wrong.
The solid blue line is on the same basis as the dashed cyan line except that I have reduced the truncation parameter k from 14 to 12. Doing so modestly reduces the mode of the PDF, to 2.4°C, and lowers the height of the shoulder (resulting in the peak height of the PDF increasing slightly).
The solid green line is on the same basis as the solid blue line except that I have used my standard interpolation basis, adding sufficient smoothing (the same for all latitude bands and pressure levels) to allow for model noise. The effect is very noticeable: the shoulder on the RHS completely disappears, giving a more normal shape to the PDF. The mode and the extreme upper tail are little changed.
Remember that model data for each latitude band and pressure level is interpolated separately, so interpolation smoothing does not result in incorrect values in the 0–5°S latitude band being adjusted by reference to values in the adjacent bands. However, some people may nevertheless be suspicious about making the interpolation smoother.
Now look at the dashed red line. Here, I have melded the interpolated data used to produce the solid blue and green curves, only using the added smoothing (green line) version for the 0–5°S latitude band – 6 out of some 220 diagnostic variables. Yet the resulting PDF is almost identical to the green line. That is powerful evidence for concluding that the shoulder in the F06 PDF is caused by misprocessing of the 0–5°S latitude band upper air model-simulation data. The probable explanation is that misprocessed values are insufficiently erroneous to seriously affect the r2 values except where model noise adds to the misprocessing error, and that the interpolation method I use is, with added smoothing, very effective at removing model noise.
Although not shown, I have also computed PDFs either excluding the 0–5°S latitude band data entirely, or replacing it with a second copy of the 0–5°N latitude band data: there should be little latitudinal variation of upper air temperatures in the inner tropics. In both cases, the resulting PDF is very similar to the green and dashed red lines. That very much confirms my conclusion.
So, to conclude regarding data issues, both the surface and upper air F06 data had been misprocessed, although only in the case of the upper air data was the processing so badly flawed that there was an appreciable effect on the estimated climate sensitivity PDF. This case provides a useful illustration of the importance of archiving computer code as well as data – without both being available, none of the errors in F06’s processing of its data would have come to light.
JC comment: My thanks to Nic Lewis for his continued efforts to sort through issues surrounding the Forest sensitivity analysis. This is a guest post. Comments will be moderated for relevance and civility.

F06 made it all the way to IPCC AR4! What does this tell us about the review process of GRL and the vetting process of the IPCC? Now we get a good review YEARS later? Climate Science needs an overhaul.
Thanks to Nic Lewis and to an honorable Forester for today’s post.
Measured CO2 sensitivity
CO2 in past 15 years increased from 367ppm to 394ppm as measured at Mauna Loa Observatory.
http://www.woodfortrees.org/plot/esrl-co2/last:180/mean:12
Global average lower troposphere temperature measured by satellites trended down (insignificantly) during past 15 years.
http://www.woodfortrees.org/plot/rss-land/last:180/plot/rss/last:180/trend
Climate sensitivity = 0
So there. It’s measured. It’s zero. Deal with it.
:-)
David
I think you should try the following correlation between CO2 and GMST to estimate climate sensitivity:
http://www.woodfortrees.org/plot/hadcrut4gl/mean:732/from:1958/to:1981/normalise/plot/esrl-co2/compress:12/to:1982/normalise
@Girma
A 61-year mean on a time series 23 years long?
ROFLMAO
You’re pulling my leg, right?
Climate sensitivity is fiction and does not exist in the real world. Climate science needs an overhaul.
+1
‘In sum, a strategy must recognise what is possible. In climate research and modelling, we should recognise that we are dealing with a coupled non-linear chaotic system, and therefore that the long-term prediction of future climate states is not possible. The most we can expect to achieve is the prediction of the probability distribution of the system’s future possible states by the generation of ensembles of model solutions. This reduces climate change to the discernment of significant differences in the statistics of such ensembles. The generation of such model ensembles will require the dedication of greatly increased computer resources and the application of new methods of model diagnosis. Addressing adequately the statistical nature of climate is computationally intensive, but such statistical information is essential.’ TAR wg1 s14.2.2.2
By ensembles is meant the results of many runs with systematic variation of parameters in a single model. Not merely an opportunistic ensemble of of ‘plausible’ solutions?
Indeed a fiction. There are far more fundamental objections to climate sensitivity than a mismatch in data.
climate denial is a fiction, but DOES exist in the real world.
Sadly.
I am agreeing with the IPCC. What are you doing numbnut?
I realllllly don’t think the IPCC have said climate sensitivity is fiction
‘Uncertainty in climate-change projections3 has traditionally been assessed using multi-model ensembles of the type shown in figure 9, essentially an ‘ensemble of opportunity’. The strength of this approach is that each model differs substantially in its structural assumptions and each has been extensively tested. The credibility of its projection is derived from evaluation of its simulation of the current climate against a wide range of observations. However, there are also significant limitations to this approach. The ensemble has not been designed to test the range of possible outcomes. Its size is too small (typically 10–20 members) to give robust estimates of the most likely changes and associated uncertainties and therefore it is hard to use in risk assessments.’ http://rsta.royalsocietypublishing.org/content/369/1956/4751.full
Depends on who you read numbnut. Not that you seem across anything very much
The difference is between a multiply coupled non-linear system and the idea of a CO2 control knob. The former results in an abrupt change in the climate system that is internally modulated and out of proportion with the original forcing. The latter is totally stupid. In the former the sensitivity is variable in time and space. It is extreme at points of bifuraction but stable otherwise. In the latter – it is based on models that theoretically can’t behave as the unitiated believe they do. The former relates to risks that have a real mathematical basis in a real world complex dynamical system. The latter is a nonsense of linear thinking in a non-linear world. Simple hey?
The former suggests that a lack of warming since 2002 is a 20 to 40 year pause caused by a shift in climate in 1998/2001. The later is not realllllllly working out for you is it?
Dear lolwot, I think that, lately, the IPCC have been changing their thinking about the existing climate science. IPCC is not a scientific organization in the first place.; they draw conclusions from scientific publications.
It’s like Freeman Dyson has been telling us: “Climatists are no Einsteins.”
They aren’t even Fred Einstein.
Given their liberal use of bad ancient proxies and bad stats, I would say they ARE like Fred Flintstone.
What did Fred Flintstone do to deserve an insult like that?
Does that mean that Dr. Mann is playing the part of Bam Bam?
Maybe not. Bam Bam always seemed to be a happy kid.
By implication are we thinking that if the math is correct reductionism is productive of valid results –e.g., still a rose…?
Nic: Thanks for sharing your work here. It sounds as though Dr. Forester has been helpful sharing the old data and code – have you approached him for a comment on your results? Is there agreement in your current conclusions?
I introduced the subject of the measurement of climate sensitivity on WUWT, and Steven Mosher stated that CS has been measured.
http://wattsupwiththat.com/2013/04/05/a-comparison-of-the-earths-climate-sensitivity-to-changes-in-the-nature-of-the-initial-forcing/#comments
@@@@@
Steven Mosher says:
April 6, 2013 at 8:47 am
Jim Cripwell says:
April 6, 2013 at 3:52 am
From the paper I read “The IPCC’s position is that climate sensitivity measurements” Assuming this is referring to the climate sensitivity of CO2, please note that, res ipsa loquitur, the climate sensitivity of CO2, however defined, has NEVER been measured, so this statement is nonsense. There are NO climate sensitivity of CO2 measurements; none whatsoever. Warmists will not admit that the CS of CO2 has never been measured, and as a result, the important implications of thsi fact cannot be properly discussed.
############################
Yes it has Jim.
@@@@@
This is the first time I have seen anyone make this claim, specificly and explicitly. However, I think I can claim that warmists state that climate sensitivity of CO2, however defined, has been measured. But no-one has provided a reference where this measurement was made, nor have they given a number for a measured value of climate sensitivity, and a +/- accuracy. Please note that an estimate of climate sensitivity, and a probability density function is not the same as a measurement and accuracy. I am convinced that climate senitivity has NOT been measured, but one cannot prove a negative.
Where is the proof that climate sensitivity has been measured?
In addition, the analogy Mr. Mosher used when trying to explain his position was a calculation.
Andrew
“you measure the change in temperature. you measure the change in forcing”
Bad Andrew,
CO2 forcing is fiction and has never been measured; it is an output of the supercomputers. Therefore, Climate sensitivity=(Fiction/temperature change)=Fiction.
Thank you Nabil. Based on the behavior of Steven Mosher, Bart R., lolwot and other Warmers on this issue, your Fiction conclusion is apparent.
Andrew
Jim I’ve explained its pretty easy. you measure the change in temperature. you measure the change in forcing.
the TOUGH thing is getting measurements that have low uncertainty. That’s the problem. Measuring or estimating ( all measurement is an estimate ) is not the problem. The problem is the uncertainty on the measurement.
“you measure the change in temperature. you measure the change in forcing”
I see measure the temperature
I see measure the change in forcing
When does the cs measurement happen?
Andrew
Yeah. It’s simple. You measure the position, and you measure the momentum. What’s that Heisenberg crackpot going on about?
Steven, you write “Jim I’ve explained its pretty easy. you measure the change in temperature. you measure the change in forcing.”
Yes and no. In principle you are correct. BUT, and it is an enormous BUT, but in any measurement of this sort it is essential to PROVE that the change in the dependent variable – global temperature – was actually caused by the change in the independent variable – the change in CO2 amout in the atmopshere. That is the vital step which is missing, and which you refuse to even address.
What I asked for was proof that the CS of CO2 has been measured. That proof you have not provided, and so far as I can see, it is technologically impossible to do this. One wonders why there is a current post of CE about ESTIMATING CS if you are correct and the CS of CO2 has actually been measured. Surely if the CS of CO2 has been actually mesasured, there is zero requirement for any ESTIMATES.
Jim Cripwell
Watch out for Mosh’s “pea and walnut shell game” (now you see it, now you don’t…)
The surface temperature record (warts and all) is measured (and then adjusted, modified, corrected, etc. by a process that Mosh may be familiar with). But let’s agree with him that this is empirically measured data.
Since 1958 we have an empirically measured value for atmospheric CO2 concentration (Mauna Loa); prior to this we have an estimate, based on ice core data; but let’s call this empirical data, as well.
The 2xCO2 forcing (at equilibrium?) is not. It is a model-derived prediction, based on various assumed (or estimated) feedbacks, which augment the estimated forcing from CO2 alone by a factor of ~3 (this post tells us it is more likely to be 2C rather than 3C, so it would be by a factor of 2).
So we have an empirically measured temperature record and an empirically measured atmospheric CO2 record, with a correlation between the two, which is anything but robust.
But the “holy grail” is missing: an empirically measured 2xCO2 climate sensitivity at equilibrium.
Max
No, no amount of accuracy in measurement can fix this problem. It is not a practical impossibility, it is an impossibility in principle.
The TOUGH thing is we actually don’t have any measurement (of global forcings & temperature) with low enough uncertainty. But it’s only tough. The preposterous thing is that efficacy of individual forcings also enters the equation. Now, efficacy is a genuine fudge factor, utterly unmeasurable. It can only be estimated using complex & inherently unverifiable computational models. You are back to square one.
Sure, if you pretend to know the (net) forcing that causes the temperature to change. The problem is lack of knowledge of all the factors influencing global temperature (known and unknown unknowns). It’s just like the Drake equation. Like Michael Crichton stated:
“The problem, of course, is that none of the terms can be known, and most cannot even be estimated. The only way to work the equation is to fill in with guesses. […] As a result, the Drake equation can have any value from “billions and billions” to zero. An expression that can mean anything means nothing. Speaking precisely, the Drake equation is literally meaningless…”
Measured CO2 sensitivity
CO2 in past 15 years increased from 367ppm to 394ppm as measured at Mauna Loa Observatory.
http://www.woodfortrees.org/plot/esrl-co2/last:180/mean:12
Global average lower troposphere temperature measured by satellites trended down (insignificantly) during past 15 years.
http://www.woodfortrees.org/plot/rss-land/last:180/plot/rss/last:180/trend
Climate sensitivity = 0
So there. It’s measured. It’s zero. Deal with it.
“It’s measured.”
David Springer,
Not measured. Calculated.
Andrew
It’s been measured loads.
Measured all the time. By scientists.
They have it on paper. Peer reviewed measurements.
“They have it on paper. Peer reviewed measurements.”
Cool. Link?
Andrew
Andrew you write “Cool. Link?”
You will never get a reference or a link from any warmist on the issue of the measurement of the CS of CO2, because they dont exist. Warmists think they can avoid the issue by insisting CS has been measured, when it is techmically impossible to mesasure it.
But, they know that if they ever actually admit the CS has not been meassuired, then the whole house of cards that is CAGW comes crashing down.
Jim Cripwell,
I understand. Still, I like to give Warmers the opportunity to engage in actual dialog, though they rarely choose to.
Andrew
Jim: you’ve been supplied the links many times.
Start with Ar4. start with the bibliography of the papers on sensitivity.
For temperature measurements ( Sensitivity = delta C/Delta Watts)
you can see:
1. had crut
2. Giss
3. Berkeley Earth
4. UAH or RSS
or you can go back further in time with measurement made by proxy.
( big uncertainy, but you know how to handle that right?)
For forcings, since they are documented in several places I’ll suggest
http://www.pik-potsdam.de/~mmalte/rcps/
all in one spot
http://www.pik-potsdam.de/~mmalte/rcps/data/20THCENTURY_MIDYEAR_RADFORCING.xls
To measure speed you measure distance and time.
To measure sensitivity you measure temperature and forcing.
How many times do you want the instructions on where to find this.
You calculate sensitivity by looking at the CHANGE in temperature
per CHANGE in forcing.
You’ve been given the links to temperature.
You’ve been given the change in forcings.
calculate… or read the literature
Here is a good one.
And keep this in mind. We can measure things without doing experiments.
with the R code
https://skydrive.live.com/?cid=0dbeb27d6a80282b&id=DBEB27D6A80282B%21108
Steven, you writre “You’ve been given the links to temperature.
You’ve been given the change in forcings.
calculate… or read the literature”
What I have NOT been given, is the proof that the change in temperature has been caused by the change in forcing, or whatever. That is the issue which you studiously will not address. Until you address that issue, everything you have written is a complete and utter load of garbage.
Where is the proof that the change in forcing has actually caused the change in temperature?
lolwot
Nope.
Temperature has been measured.
Atmospheric CO2 has been measured.
BUT, 2xCO2 ECS has not been measured (see my post to Jim Cripwell above).
Max
Mosher:
Nice job on the delta T, that’s pretty well dialed in. Also, the CO2 is well measured and documented, maybe 50% of the delta Watts.
The remaining delta Watts are more anecdotal than depression era sea ice: aerosols, deforestation, reforestation, irrigated ag, desertification, carbon black, clouds, water vapor, ice changes, ocean current cycles.
There is no clear explanation for the 19th Century reversal of the 5K-year slide down to the LIA other than a low CO2 industrial revolution spewing of particulates and massive landuse changes. Whats the Delta Watts for the pre-war non-CO2 forcings? How much of that is still going on. How much closer to equilibrium are we from pre-CO2 AGW effects?
It’s anecdotes all the way down.
lolwot,
Do you accept that “measuring” something and “estimating” something are not the same thing?
That’s not to say the latter can’t get pretty close to the former, but it is not the same. Any gunner can tell you this.
here Jim
another link.
lets take you way back
http://www-ramanathan.ucsd.edu/files/pr50.pdf
now of course CS to doubling was first calculated back in the late 1800s.
the answer was 5
Let me put simply.
From first principles, classic physics, you can compute the answer
as 1.5.
But, that approach makes a few simplifying assumptions. change a few of those and you can compute an answer of 5.
progress on refining this has been slow. progress on measuring the speed of light was slow too.
But that does not mean the speed of light did not exist. and it didnt mean that we knew nothing about it.
The only estimate of climate sensitivity I am aware of that has accurate measurements (not estimates or models) of forcings and temperature responses is the winter-summer delta T versus winter-summer delta TSI at various locations, either at the surface or at TOA. These differences are large enough to overcome noise in the numerator and denominator. They average out to less than 0.1 C per W/m^2.
All the rest is a dog’s breakfast of guesses, digging tiny trends out of huge fluctuations, and climate models. I agree with Tom Wigley’s email in 2000-
“Quantifying climate sensitivity from real world data cannot even be done
using present-day data, including satellite data. If you think that one
could do better with paleo data, then you’re fooling yourself. This is
fine, but there is no need to try to fool others by making extravagant
claims.”
Jim Cripwell | April 11, 2013 at 3:20 pm |
Ah. Argument by infinite regress. Proof of a proof of a proof of a proof of a proof..
Where is the proof that climate sensitivity has been measured?
Jim Cripwell | April 11, 2013 at 6:45 pm |
but in any measurement of this sort it is essential to PROVE that the change in the dependent variable – global temperature – was actually caused by the change in the independent variable – the change in CO2 amout in the atmopshere. That is the vital step which is missing, and which you refuse to even address.
Mosher refuse to even address? Mosher’s tireless, patient and evenhanded to the point of obsession. It’s a compulsion with him to address things. It’s like a mania. It boggles the imagine to hear of him refusing to address any vital, or even trivial, steps. I’d like proof of Mosher’s refusal, if we can get that without some sort of infinite regress, before crediting such a claim.
And.. what the heck sort of a priori question-begging reasoning is this proving of cause and effect? Utter twaddle. It’s been explained to you before that data warehousing mines large sets of often arbitrary and disconnected observations for correlations without the least proof of cause and effect. It’s a common practice. You’re asserting a false requirement. Again, as you’ve previously had explained to you. And act as if that hadn’t happened.
However, we know also that the cause-and-effect relationship of increased CO2 concentration and temperature is proven. If it didn’t exist, then infrared cameras wouldn’t cease to capture images as CO2 concentrations rise. If it didn’t exist, then CO2 would be inconsistent in behavior with all other molecules like it. It would take a womping big explanation if it _didn’t_ happen. Denying the existence of these manifold proofs, or that you’ve had them shown you, is utterly fantastical.
It’s technically impossible to measure CS directly, just as its technically impossible to measure temperature directly. You’ve acknowledged that temperature measures are valid and real, so it is inconsistent, indeed irrational, for you to deny CS measures are valid. Climate Etc. is littered with this same discussion with you over and over, it would take an average reader little time to find the one from two or so weeks ago, or two or so more weeks before that, or two more approximate weeks before that, ad nauseum.
Jim Cripwell | April 11, 2013 at 6:52 pm |
So we see your idée fixe that your assertion of the nonexistence of CS measurement insulates you from engaging honestly with any correspondent.
Tell me, Mr. Cripwell, explicitly, in detail, what would satisfy your questions and change your mind, that is consistent with how science treats any other subject, such as temperature or partial gas pressure, impedence or resistance, polarity or magnetic field strength?
Because replacing climate sensitivity with any of those well-accepted terms of science and technology in your argument and applying your same tests, none of them exists either.. So I need to know, do you live in a world without electricity and light, compasses and air?
Bart:
Why is it impossible to measure CS directly?
Couldn’t we measure the global temperature and CO2 at a point in time (say 1850)(I believe we have pretty good values for those two numbers), then wait for C02 to double (say to 560 ppm), then measure global temperature, subtract the 560 ppm global temperature from the 1850 global temperature, and now we have directly measured the temperature difference from a doubling of CO2.
We are only waiting on 560 ppm CO2, to actually obtain a direct measure of CS – isn’t that correct?
Has it occured to you guys that you are talking past one another?
I’ve just reread the comments here about climate sensitivity.
And I smell a very big rat.
Determination CS is about the single most important number in climatology. Because it tells us whether we need (or not) to worry about a big temperature increase, a small temperature increase or just random variation. Once this is determined we can work out whether its a big worry, a small worry or can be ignored
But without a good robust reproducible consistent determination of that number, everything else about climatology is just handwaving.
So the man from a small planet near Betelgeuse popping in here to see how we’re getting on after spending thirty years and north of $100 billion dollars on climatology might reasonably expect that this has all been done and dusted years ago. Like somebody experimentally determining G a few years after Newton proposed the Law of Gravity or the confirmation of Einstein’s theory by Eddington.
Ground breaking stuff..known throughout the scientific world. Definitive, memorable work..the stuff that wins real Nobel Science prizes, rather than their wishy-washy ‘Peace’ equivalents.
So Ford Prefect (for it is he) is rightly astonished at the answer to Jim Cripwell’s simple question. Nobody can point to the definitive work. It hasn’t been done. The most important number is unknown.
Mosher waffles on about lots of ways it might have been done, but can’t actually point to anything more substantial than AR4. Lolwot merely asserts that it has been done (lots), but provides no references. Others join in, but with more heat than light. But there is still no definitive measurement.
So Ford is puzzled. All this time and effort, but nothing at all to show for it. Has it all been just a total waste of time?
And following on quickly he views the policy response to all this stuff and wonders exactly how so many people have spent so much time and money and angst and political and emotional capital and heartache (and deaths in some cases) all based upon a guess about a number that hasn’t even been measured. Reviewing all the evidence the answer seems to be ‘yes’.
So Ford shakes his head with wonderment, decides that its time to move on sets the Infinite Improbability Drive to maximum, and hopes that wherever he lands next time he will really encounter some intelligent life in the universe…….
And on his journey he amends the entry in H2G2 for Earth from ‘Mostly Harmless’ to ‘Mostly Harmless, but beware Bonkers Climatologists’
(With grateful thanks to Douglas Adams who saw further than the rest. But he was very very tall, which helped a lot :-)
If you read the comments carefully they reveal a number of different issues, most of which turn on ambiguity in the concept of CS. CS for doubling CO2 cannot be measured because CO2 has not doubled. Change in T divided by change in CO2 can be determined using arithmetic.
But there are many problems with going from this simple arithmetic ratio to science and a CS for doubling. To begin with the ratio will vary greatly depending on the interval chosen and can even be negative. For that matter if T is based on surface statistical models then it is not a measurement.
Then too as Jim points out the scientific question is one of causality not arithmetic. Extrapolating the ratio to get a scientific prediction for doubling requires causality. So we first have to determine how much of the ratio is caused by the CO2 increase. This is the attribution problem and it cannot be solved by simple measurement.
But even solving the attribution problem is not enough. In order to predict CS for doubling we also have to determine what will happen on the way from now until then. This certainly cannot be done by measurement. It may well be unkowable given the nonlinearities.
Thus CS (for doubling) is a very hard problem. The confusion seems to be that some people take measuring the ratio for their chosen interval to be solving this problem. That is very wrong.
> If you read the comments carefully they reveal a number of different issues, most of which turn on ambiguity in the concept of CS.
An issue tree with links might prove otherwise.
@david wojick
I don’t doubt that its a ‘hard problem’. So hard that nobody seems to have managed to get very far with it at all.
But one hundred thousand million bucks is a very large sum of money for us to have firehosed at climatology to answer it, and thirty years is a pretty long period of time. Anybody who started their career at the beginning will be thinking about retirement by now.
So why haven’t we seen any better and more definitive results?
Or, if there is no answer, isn’t about time that we filed it in the drawer of ‘impossible problems’, cut our losses and moved on?
That, at least, would be the intellectually honest thing to do rather than trying to delude everyone that the problem has been fixed when it clearly hasn’t.
But then climatology has never struck me as a field where intellectual honesty is viewed as a priority. Its founders weren’t too bothered about it and that tradition has been strongly continued by their acolytes.
Latimer, you write “Or, if there is no answer, isn’t about time that we filed it in the drawer of ‘impossible problems’, cut our losses and moved on?”
Unfortunately, too much water has flown under the bridge. We cannot move on. The IPCC claims, in the SPMs to the AR4 of WG1, that there is a >95% and >90% probability that certain things are true about CAGW. If CS has not, and cannot be, measured, then these claims are clearly fraudulent; and I use the word advisedly. And we cannot have a proper discussion as to how likely the claims in the SPMs are to be true, unless and until the warmists agree that CS has never been measuered.
It is a classic Catch 22 problem.
Latimer: Very little climate research is directly about determining CS. We are also trying to understand how the climate system works and here significant progress has been made. The discovery of natural variability is especially important. Mind you I think that $2 billion a year is excessive.
Willard: no an issue tree would only make my analysis clear in detail.
@david wojick
You are putting the cart before the horse when you say .
‘Very little climate research is directly about determining CS. We are also trying to understand how the climate system works and here significant progress has been made’
Because viewed from the outside all the other stuff is only of peripheral interest. The reason we (the public) have given the climatologists all the wonga and facilities and (rapidly diminishing) respect is because we need (or some people think we need) an answer to the CS problem. Not to let the climatologists play around in a sandpit of their own making building pretty sandcastles for 30 years.
If that’s what they have been doing rather then working on the problem we’ve asked them to do, then I fear that the fiscal retribution will be swift. There will soon be a point where the pollies are persuaded not to waste any more good money after bad.
And I confess that your remark ‘the discovery of natural variability is particularly important’ leaves me open-mouthed. Did no ‘scientist’ bother to play outside when they were children? Did the concept of a ‘good summer’ or a ‘bad summer’ never extend beyond UK? Because growing up in the UK in the 60s, the concept of natural variability was no stranger to us….we had it several times a day. It didn’t need ‘discovering’…it has always been all around us.
The question is what is the value of climate research? That science has not been able to answer the policy question is not the fault of science. The question turns out to be very hard. That in itself is probably the answer. As for variability weather is not climate. We have discovered and quantified many modes of climate variability that were previously unknown. That is not nothing.
@david wojick
I’m not expecting science to answer the policy question. I’m expecting science to answer the science question.
Science question: How big is this effect?
Policy question: As a result of the answer to the policy question, what should we do?
But if the answer to the science question is truly:
‘We don’t know and we probably never will’, then the honest thing to do is to fess up and tell us so clearly and unambiguously. It would be fraudulent to continue with the idea that ‘just another satellite or just another supercomputer or just another hockey stick or whatever it might be will give us the answer.
Climatology is using real resources. If they are all being spent on an unanswerable problem we (the public) might choose to spend them in other ways (or not).. But we need to make an informed choice.And that is where the intellectual honesty comes back in again…………
Latimer Alder, you hit the nail on the head. The science needs an overhaul.
@david wojick
‘The question is what is the value of climate research?’
With no answer to the CS problem, it is difficult to discern much value at all. And certainly not 100 thousand million bucks worth.
I guess its kept some airlines in business and many beachside luxury hotels and restaurants busy in the ‘conference’ trade. And – as one who used to be employed in the IT trade – boosted my income by acquiring a great deal of computer hardware. And it used to be good to fill airtime on rolling news channels who struggle to fill 24 hours so need lot of talking heads. Probably the dole queues are a bit shorter.
But these are all ‘spin off’ benefits (like Apollo brand frying pans). In terms of actual value delivered in return for our ‘investment’ it has got to have been one of the worst deals ever.
But there is a sum LA. It’s available at the University of Wikepedia, and is the sum credited with forecasting a 3C increase for a doubling of CO2. Here it is:
T∆ = 5.35 x λ x ln(CO2P/CO2O)
Where:
T∆ = Change in temperature
λ = Climate sensitivity = 0.8
CO2P = Present density of CO2 in the atmosphere in ppm
CO20 = CO2 pre industrial levels of CO2 at 280ppmW
Now plug 400 in as CO2P and see what T∆ pops out.
it’s more complicated than the cs community think the heat’s missing,
“Then too as Jim points out the scientific question is one of causality not arithmetic. Extrapolating the ratio to get a scientific prediction for doubling requires causality. So we first have to determine how much of the ratio is caused by the CO2 increase. This is the attribution problem and it cannot be solved by simple measurement.”
The issue of causality is not even at issue.
lets see if I can break this down for you.
Climate sensitivity is a system metric. It represents the sensitivity or gain of the system due to an increase of forcing. Delta C/ Delta W
The only causality you need to be concerned with is the fact that increasing the watts, increases the temperature. That casuality is only questioned by some sort of humean skepticism.
The only causality you need to be concerned about is the fact that changing watts causes a change in temperature. that is why you can calculate sensitivity from studying the reaction to volcanoes. CS is not about c02, but about the system change to a change in forcing.
once you calculate that, then its a simple matter to calculate the expected response to a change of 3.7 Watts.
Why 3.7 watts? because we know, tested verified known physics, that doubling c02 gives you 3.7 more watts.
> [N]o an issue tree would only make my analysis clear in detail.
I think your issue tree would prove that most of the comments have nothing to do with the purported ambiguity of CS.
This was only a neat trick to insert you pet topic, David.
David Wojick | April 12, 2013 at 7:46 am |
“If you read the comments carefully they reveal a number of different issues, most of which turn on ambiguity in the concept of CS. CS for doubling CO2 cannot be measured because CO2 has not doubled.”
True but it has increased by 18% since 1979 and know this with high precision/accuracy. We have had satellites measuring lower troposphere average temperature since 1979 with high precision/accuracy.
These are sufficient to establish a relationship between CO2 and temperature i.e. climate sensitivity in vivo with a caveat that nothing associated with anthropogenic CO2 production has changed which would include. approximately same amount of soot, aerosols, land use, methane, etc. It also rides with the caveat that nothing natural changed like TSI, GCR related cloud change, or other multi-decadal or longer natural oscillations.
Indeed it appears just such a multi-decadal oscillation caused measured climate sensitivity to agree with model predictions from 1979 – 1998 because temperature was measured on the warming side of a 60-year cycle called the AMDO. I believe the AMDO oscillation is caused by hysteresis in a feedback loop between northern hemisphere snow/ice cover and open ocean surface but that’s a different discussion.
Now it’s simply a waiting game. GAT hasn’t risin in 15 years which was predicted years ago by those of us who noticed that GAT was being measured on the rising side of the AMDO and felt the situation would be quite different on the falling side of same.
It is my belief that climate sensitivity has been exaggerated by a factor of three by incorrect physical assumptions in regard to the hydrologic cycle which makes the infamous 1.5C-4.5C ensemble model PDF really turn out to be 0.5C-1.5C. Therefore my guess is that actual sensitivity is either right at or below the lowest ensemble sensitivity. Indeed GAT has, over the past 22 years, drifted to the lower edge or just outside the edge of the 95% confidence interval. The so-called pause is killing the CAGW narrative. About all that remains to be seen is how badly the models were wrong. Reality is a harsh mistress for the scientist or consensus of scientists holding a flawed theory which is almost certainly the case here.
RickA | April 12, 2013 at 8:26 am |
We are only waiting on 560 ppm CO2, to actually obtain a direct measure of CS – isn’t that correct?
Short version:
You don’t need to wait for 560 ppmv. You can measure these things at any point and plug them into the formula and plot the results over time and see how they change. I’ve done it with no more than a spreadsheet, myself, from generally available data. You can do it with direct instrumental records. You can do it with paleo proxy data. It’s easy.
Long version:
You ask a really good question. At its core, it brings us face-to-face with the nugget of truth upon which Jim Cripwell’s fallacies are built: measurement, except counting, is always a fiction. Because Jim Cripwell draws us back over and over again to the same ab initio rehashing of this well-known, well-understood, commonly accepted truth of Science as if it were a freshly discovered scandal, we must answer step by tiresome step as if our audience were completely naive to address this concern. (In a forum of professional science, the whole thing would be disposed of with “go back to school” dismissal of this ploy.)
All measurements other than counting are metrics, comparisons of observed estimated properties to standard models. Uncertainty is introduced in error in estimation, error in the reference model, and unmeasured other factors. So the general form of a measurement is X +/- Y, as Jim Cripwell’s formalism requires, the X being the estimate (however accurate) and Y being the range of uncertainty (however precise). While Jim doesn’t say so explicitly — presumably so he can spring another proof of a proof of a proof level of regress on the unsuspecting — both X and Y themselves do not need to be actual numbers, but can be functions, in some cases quite complex functions of multiple variables, including past values of X itself.
The truth is, measuring global means is not straightforward, but a matter of choices and adaptation and improvisation and surmise. WUWT is practically founded on nit-picking and second-guessing every aspect of such choices. Steven Mosher’s own questions of this sort — and it’s good for science to revisit these technicalities — led to the BEST project, which assiduously built the most viable reconstruction of global land temperature means from weather station and satellite data available. (Incidentally, satellites ought have reduced the problems of evaluating X and Y, but instead we see all the millions of money spent on them essentially flushed down the drain and made useless for climate study due the poor quality of the equipment degenerating over climate scales; it’s fine for weather measurement, but next to useless for climatology, and worse it’s UAH keepers hid or did not know this fact for years).
These are the same difficulties as every metric in science faces, more or less, when science chooses to examine global means. And it’s true that in some cases the idea of a global mean is absurd: what is the average sex of a person; what is the average language of the globe; what is the mean religious belief of humanity?
Climate Sensitivity introduces all these questions in plenty: first, although we’re talking in terms only of CO2 and temperature, both of those terms neglect many other elements. In temperature, we ignore whether the temperature is of air or land or water — all of which have different specific heat capacity — and we ignore also that temperature is far from the only form of energy AGW takes (for instance, lightning and static charge, height of the solar tide, winds and water currents, chemical changes, even biology store energy). CO2 is not the only forcing, either, and not all CO2 is made equal, too. NOx emissions and land use changes are two more categories of forcings by human agency, and tropical volcanic intrusion into the stratosphere and solar changes too could also be forcings when they happen. And on top of forcings are feedbacks, which can be impossible to fully disentangle from forcings. And even forcings too small to consider might play some role disproportionate to their size (for instance, the simple addition of water or depletion of O2 by burning hydrocarbons, while it is only something like 0.02% of the amount of rainfall annually, is sometimes brought up by what people call ‘concern trolls’).
And we get to where that problem brings us: over time, and depending on time scale, CS varies for the same value of CO2 change. It’s been negative, it’s been positive, it’s grown from zero to over four in a few decades and fallen again from its peak to nearer three. The form X+/-Y is inadequate to represent CS of CO2. The real golden apple of climatology is about CS of forcing, and identifying how much forcing CO2 emission would have were it entirely separated out from all other components.
The best treatment of this question I’ve seen is Vaughn Pratt’s, here at Climate Etc., a few months ago. He came up with 2.85 as his with-feedbacks CO2 forcing sensitivity on multidecadal timescale, I believe. It should be easy to find his article here and read it and the comments on it.
This conversation with Jim Cripwell has happened so frequently, so often, that there’s really no point pursuing it. He asserts the same “no one ever has bla-bla-bla” line every few weeks, then spins out some regress on some fine point of this complicated topic, then huffs off dismissively when cornered, only to pop up whack-a-molishly sometimes the next day with the same invalid claims.
Thank you for both the short and long version answers Bart.
I agree that CS ignores many factors.
However, isn’t that by definition (and isn’t the definition the real problem).
My understanding is that CS is the change in global temperature caused by a doubling of CO2 (and only CO2).
The change in temperature caused by the change in the sun (over that period) is not relevant, neither is the change caused by carbon black, or methane, or cosmic rays, clouds, natural variability, blacktop/concrete, cities, cutting down trees, or whatever.
So when we get to 560 ppm – and we cast about trying to figure out the global mean temperature (probably using all the temperature records in BEST over the course of the year we hit 560 ppm), we may find a temperature difference of 3C, or it may only be 1.2C – the point is we don’t know what it will be yet.
Now, I am sure many will take the position that if it is below 3, that many other factors depressed the CS determination. Maybe natural variability impacted it, or maybe the heat is being hidden in the deep ocean, or maybe the sun’s heliosphere has increased cloud cover which impacted it, or maybe we paved 25 % of the world, or cut down 50% of the trees, etc.
The point being that all of these other factors are irrelevant to the definition of CS (as I understand it).
What I think you and many other people are saying is that the reason it is impossible to measure CS is that there is no way to isolate the change in temperature due to just CO2 – and even after we get to 560 ppm – we are measuring the temperature in a world with a doubling of carbon, but all the other variables were allowed to change as well, so we cannot isolate just CO2’s impact on temperature.
So I expect the fight to continue, even after we measure CS.
But the real problem is the definition of CS – which turns out is impossible to actually measure, because we cannot change only CO2 over that period of time (around 200 or so).
CS is a stupid definition.
Now, to me what really matters is the change in global temperature over that arbitrary period of time when we hit 560 ppm, caused by all of the factors (known and unknown [because we still don’t know them all]).
At least once we get a real measurement of the change in global temperature caused by all factors, we can begin to estimate the amplification factor of CO2.
Personally, I doubt it will turn out to be 3x, but something much smaller.
I hope I live until 560 ppm so I can see what the temperature increase turns out to be.
Here is a superb illustration of what I have long thought – that the ‘acdemic’ organisational model is the wrong one to use to help us to decide what (if anything) we need to do about ‘climate change’ or ‘global warming’ or ‘weather weirding’ or whatever today’s cause du jour is.
In 30 years they haven’t been able to come up with anything at all practically useful about the crucial ‘climate sensitivity’ question. Lots of ideas – and lots of different papers and citations (which are the true product of academe) …but nothing that politicians and policy makers can act upon.
Bart R has done a splendid job of producing an academic discourse of all the difficulties and problems and why its hard and very complicated and difficult.
And no doubt some young researcher is looking at that list and planning in his or her own mind a sequence of papers that will keep them nicely comfortable into middle-age and beyond..and exploring every facet of why its difficult and time-consuming and working out what position they plan to be in for AR6 or AR7 or or AR13 (if they live that long).
But – in true academic style – no sense of urgency. No desire to get to a real conclusion. Write a paper about it, argue about it, write another paper about it, get a prize, go to a conference, write another paper…..shun anything – like online review – that speeds it up…keep the sausage machine churning out the papers and the citations and the prizes and the conferences and the rise through the academic hierarchy.
But never, ever be tempted to finish the job. Too much riding on it. Too many people with too much prestige who’d be embarrassed if you did. Think how hated you would be if you did. All those careers cut short.
Compare and contrast the behaviour with that that we might expect from a bunch of engineers – by definition practical folk, whose prestige and reward is not determined by what they write but by what they do.
Here supposedly is the ‘biggest problem mankind has ever faced’. And the possible consequences are said to be huge. It could be a very urgent problem. And the determination of climate sensitivity is the most important thing to decide whether its a big problem, a little problem or no problem at all.
A good engineering leader would assemble the best folk into one team -whatever their background – and might attack the problem simultaneously on all fronts. Deadlines would be set. Regular reviews of resource allocation – and redeployment as needed from less promising to more promising areas. Kudos for doing the work, not for writing a paper.
And in the end a realisation that – for practical purposes – a good result today is often better than a perfect result in twenty or a hundred years time. Or – after it has been give a good go – the admission that the effort has failed and the question just can’t be answered.
The academic organisation model is not designed to achieve any of these things. It rarely shows urgency. It has almost no resource flexibility. It has absolutely no way of saying ‘we give up’. It cannot reward work, just publication. And negative results are very much frowned upon.
As a contrast, London was awarded the 2012 Olympic Games in 2005. Which gave just seven years to make it happen. the opening date was immovable. It had to start on the 27th July 2012. And a lot of engineering type people made it happen on time and in budget.
If it had been given to academic types to organise I suspect that they’d still today be writing papers about the ideal shape for the velodrome, the effect of climate change on the athlete’s transportation or the historical significance of Bradley Wiggins ‘throne’ at Hampton Court in the evolution of synbolic furniture within the English architectural tradition. But we’d never have had the games. Oodles of papers, lots of citations, many happy academics. But no Games. Academia is not a mechanism for generating useful results.
Is it really too much to expect that – after 30 years and 100 thousand million bucks – we might have got a decent answer to the CS question.
And if not may I make a plea that you all pull your fingers out and find one. Your failure to do so is becoming embarrassing.
So what I take from this discussions is the same BS creationists try to pull about how the theory of evolution is a waste of time, we haven’t discovered anything, etc etc “shut it down”.
@lolwot
I’m quite happy for people to go looking for climate sensitivity in their own time and with their own money. If they want to waste their time doing so, suits me.
But when it comes to public (i,e taxpayers) money, the circumstances are different. Without at least a sensible roadmap of how it is going to be done both in theory and practice – there must come a time when the right thing to do is to cut our losses and accept that it isn’t ever going to be done.
Your facile argument using evolution as an example could equally be extended to almost any magic money pit that you wish to extend the life of…homeopathy springs to mind as a great one. Or astrology. Or cold fusion.
Would you argue that ‘research’ into these should be funded forever – despite no results? Should we divert the money currently spent on CS to them instead? If not, why not?
If that is your best argument, then you are just reinforcing mine. Surely you can do better.
There have been results.
That’s my point. Like creationists, climate skeptics pretend there haven’t been results and then cry for the funding to be stopped.
Results, heh, what a mess. Who created this mess, and how, in Gaia’s name, will we get out of it?
=============
@lolwot
You say
‘there have been results’
Sure. but they are all different. If you measure/estimate/theorise about something a dozen different ways and get a dozen very different answers, what does that tell you?
I doubt if you’d conclude that measurement/theory/estimate number 13 or 15 or 27 was going to break the deadlock. You might even have the temerity to wonder if what you were trying to measure is measurable at all…or if it even exists..
And if somebody came along and quite reasonably said
‘We’ve given you 100 thousand million bucks and thirty years to come up with the answer and you’ve failed completely. Why should we give you even another cent?’
then what would your answer be?
So Bart you think we can measure CS with temperature and CO2 data. I agree.
Plug this data into your spreadsheet. Since 1998 global average lower troposphere temperature is flat to down slightly while CO2 increased 10%. If 10% CO2 increase resulted in no temperature then sensitivity during this period is zero. It follows that a 100% increase will still be zero given the unassailable fact that ten times zero is still zero.
Thanks for playing. Now we must wait because temperature did indeed rise in the prior 15 years where CO2 also increased 10% which yields a positive sensitivity. So the answer at this point is we have no answer except to say that the CS estimate based on data through 1998 appears to be wrong because the temperature rise halted while CO2 rise did not halt. We have to see how long the pause lasts. My prediction is that the pause turns into a decline which doesn’t begin to go flat again for another 10-20 years. We’ll be worried about global cooling, again, before the AMDO completes a full cycle in the satellite measurment era.
Latimer Alder | April 12, 2013 at 1:50 pm |
In theory, your points might be valid.
All these quibbles might amount to more than a hill of beans.
In practical terms, when we actually plot climate sensitivity just as a relationship of change in CO2 vs. change in temperature, a remarkable thing happens.
Just as the Mandelbrot set emerges unexpectedly, patterns that convey a deep relationship between CO2 and temperature emerge with regularity.
In particular, plotting — as BEST has done, and I’m sure you’re familiar with the graph — temperature trend to highlight the influence of volcanic eruptions in the tropics, we see the CO2 sensitivity rapidly recovers through a typical range at a typical rate, climbing from an apparent negative to a plateau near 3, then rising to about the mid 4-5 range over the longer term. Removing or smoothing volcanic effects, again we see the same key attractors appear.
Contemplating concerns is fine and dandy, but the observations give us the ultimate test of what is and is not relevant. And what is primarily relevant is CO2 change. All the rest is secondary, or less.
Bart R:
BEST’s fit to CO2 (as a proxy) plus volcanic forcings is nearly meaningless. By definition, it cannot tell us what climate sensitivity is. It cannot even approximate it. Because CO2 was used as a proxy, BEST’s results tell us nothing useful about climate sensitivity.*
Moreover, their volcanic fit is meaningless. We can ignore the fact they force a particular response curve. That doesn’t even rate as a concern. What really matters is BEST’s parameter for volcanic forcing is highly dependent upon the period one uses to calculate the fit. There are dramatic changes if one calculates the fit over a period with good data coverage vs. the full period used by BEST. In other words, BEST’s results fail basic in-sample sensitivity testing.
And to make matters worse, that failure is (partially) dependent upon their manual alteration of the volcanic record they use. They don’t disclose this. Their alteration may have been “correct,” but the fact it has a material effect on the credibility of their results is undisclosed. That is not correct. It is not okay. It is a failure on such a basic level as to be incredible.
*That is, on their own. One can try to use BEST’s results to work out what the actual climate sensitivity is. I don’t think anyone has actually done those calculations though.
Fitting to the BEST curve, one gets about 3C per doubling of CO2 concentration. I worked it out independently and anyone else can try it out themselves. The residual appears as red noise.
> Moreover, their volcanic fit is meaningless.
Chewbacca does science.
willard regrets not being able to erupt on demand.
===========
We regret Kim’s unceasing nonsensical implosions.
Howard is royally disgusted. I’m so sorry for them.
===================
The sensitivity of CO2 to Temperature changes is measurable and is based on simple principals.
http://popesclimatetheory.com/page44.html
The sensitivity of Temperature to CO2 changes is based on output of Climate Models that have been wrong for the most recent two decades.
As computers get bigger and faster the flawed forecasts come out more quickly and more wrong.
Brandon Shollenberger | April 13, 2013 at 5:03 am |
The concerns you express might in the abstract be worth knocking down were the effect limited to BEST. However, the effect is seen in every long enough temperature record compared to available CO2 data.
So you’d have to make the same BEST-specific claims repeatedly over the entire field of climatology, by which time your arguments would have been stretched so thin the very apparent holes in them would be large enough to drive a bigger truck through.
Bart R, I find it interesting you hand-wavingly dismiss what I said without making any effort to rebut it. You offered a single source to support your claim. I offered a specific criticiam of the source that is easy to verify. I’d like to think that would provoke some amount of curiosity and interest.
Oh well. If you think offering bogus results is appropriate when discussing “remarkable” things, that’s your call. It’s just one of the worst imaginable ways to defend a conclusion.
David Springer | April 13, 2013 at 9:22 am |
Plug this data into your spreadsheet. Since 1998 global average lower troposphere temperature is flat to down slightly while CO2 increased 10%. If 10% CO2 increase resulted in no temperature then sensitivity during this period is zero. It follows that a 100% increase will still be zero given the unassailable fact that ten times zero is still zero.
That’s exactly what I did do. Oddly, I obtained entirely different results from the actual data I used than you got.
http://www.woodfortrees.org/plot/gistemp/mean:101/mean:104/last:384/plot/esrl-co2/mean:101/mean:103/last:384/scale:0.01
What data did you use? I got a rise from 365 ppmv to 390 ppmv CO2 (+6.85%), which is much less than +10% since 1998. And as a difference of logarithms, is less significant than the previous 25 ppmv rise, which in turn is less than the 25 ppmv rise before it, etc.
Did you remember to take a running mean of at least 17 years to distinguish signal from noise?
Did you remember to process CO2 logarithmically?
http://www.woodfortrees.org/plot/gistemp/last:384/trend/plot/hadcrut3vgl/last:384/trend/plot/hadcrut4gl/last:384/trend/plot/rss/last:384/trend/plot/uah/last:384/trend/plot/esrl-co2/last:384/trend/normalise
I don’t pretend the CS plots I obtain are the same as the CS for CO2 with all other factors removed. In the short term, these other forcings might alter or dominate the CS figure derived. But so what? There are a clear attractors in the with-feedbacks curve, and that’s enough to establish a working value for the CS of CO2, by taking not the mean nor expecting to arrive at an exact always repeated outcome, but by selecting the dominant modes.
Thanks for playing. Come back when you’ve had a chance to practice and get some equipment.
To start with your mean was way too long which truncates the time series on each side.
http://www.woodfortrees.org/plot/esrl-co2/last:180/mean:12/plot/esrl-co2/last:180/mean:12/trend/detrend:27.8
Last 15 years exactly is +28ppm. Starts at 367 so increase is 28/367 or 8%. I rounded up to 10% because it doesn’t change the result. If 8% CO2 increase results in zero temperature increase then 10% increase results in zero temperature increase too. [shrug]
Satellite record is gold standard for global average temperature.
http://www.woodfortrees.org/plot/rss/last:180/plot/rss/last:180/trend
Trend has been slightly down for past 15 years according to best instruments we have to bring to bear on it. Doesn’t matter how much CO2 went up because if temperature went down then sensitivity must be less than zero.
Using these data sources and this period of time and given all other things are equal there is no other conclusion than sensitivity is zero or less. You can make excuses, use other time periods, use other temperature records and so forth but the fact remains that for RSS global lower troposphere and Mauna Loa CO2 records for the past 15 years you can measure climate sensitivity as a negative number.
Thanks for playing. Now you can return to making excuses.
David Springer | April 13, 2013 at 8:33 pm |
On the contrary, your mean is somewhat too short, and will lead to noisy results.
We _could_ work with such results, but it requires so much more work to do manually as we are for approximations. Even when we don’t hide that the only reason for a negative RSS 15-year mean is the cherry-picked endpoint and cherry-picked dataset.
http://www.woodfortrees.org/plot/rss/last:180/plot/rss/last:180/trend/plot/gistemp/last:180/trend/plot/hadcrut3vgl/last:180/trend/plot/hadcrut4gl/last:180/trend/plot/uah/last:180/trend/plot/rss/last:204/trend/plot/gistemp/last:204/trend/plot/hadcrut3vgl/last:204/trend/plot/hadcrut4gl/last:204/trend/plot/uah/last:204/trend
Why can we do this? Because we don’t expect climate sensitivity to CO2 done in this way to be invariate or even always positive. We expect it to vary widely as other forcings come and go, and perhaps as some feedbacks may go through negative phases, and while ocean variability goes through cycles. We aren’t expecting a linear relation, but one frequently changing due these conditions, just as we expect temperature itself to frequently change.
You can certainly understand the concept of a changing global temperature. Why not a changing global climate sensitivity?
Take the ratio of CO2 change and global mean temperature change for any period regardless of how small over a long enough time and find the mean of that over a long enough period to extract signal from noise (which we know will be longer than 17 years, as we know the signal from temperature itself is only 95% reliable at 17 years on the HadCRUT dataset), and you will find yourself with a graph that runs from below zero to above 4.5, with a mean values dependent on endpoints for shorter sections, and a dominant mode at around 2.9 +/- 0.1 and another mode near 4.5.
Sure, it is desireable to isolate climate sensitivity of CO2 from other forcings, but you must know that’s next to impossible at this time due the extraordindately limited amount of data compared to the complex inputs and feedbacks. Come back with sixteen hundred years of instrumental surface and ocean temperature and pressure and albedo and solar and volcano and so on records tracking each input forcing geographically and with good observations of the chemistry of the stratosphere to use as a guideline, and we might see some cunning scholar produce such a number. Or, we might not, since it might be a number that changes such that for any set of inputs there might be multiple values of CO2.
The past 180 months of the record is hardly cherry picked. It’s exactly the past 15 years.
David Springer | April 14, 2013 at 6:08 am |
The last 15 years isn’t cherry-picked? That is, it’s different from 14 or 16 years in some plausible way?
There’s good reason to pick 17 years, as 17 years has been determined to be the minimum span to distinguish signal from noise on HadCRUT.
There’s good reason to pick 30 years, as 30 years is the defined span of a climate.
At 32 years, we hit the next sigma level on confidence, a good reason to choose 32.
But 15? 15 just happens to have an endpoint on the 1998 outlier due the extreme El Nino. Heck, if the same El Nino happened today, it’d be considered minor, because so many years since 1998 without El Nino — or even with La Nina — have been extremely high compared to years prior to 1998. So there’s good reason to disqualify 15 on endpoints.
Heck, the fact that we’re looking at an end of the graph rather than the middle means we’re already facing the Endpoint Problem.
Some ways around this:
– Remove 1998, or the ENSO influence on 1998. Not an attractive manipulation, but better than cherry-picking an outlier for the initial value on a very short and noisy section of the data.
– Break down the last 15 years into smaller periods, say one year or one month, and calculate the 15 or 180 climate sensitivities on each of those periods and look for the dominant modes.
– Extend to all the 15-year running means available on the instrumental record. Mauna Loa only goes back to 1959, but there are good to fair approximations before that which can work as sources of CO2 level.
See, just having one negative or zero or near zero CS value does nothing to invalidate the mode at 2.9 +/- 0.1; this mode dominates and is a clear attractor on any sufficiently large dataset. It’s not the only predominant mode, and there’s a clear fat tail response.
We aren’t expecting a simple, linear outcome for CS using this approach without removing other forcings (if that’s even possible) and ocean cycles (if that’s even possible). Why pretend we should?
I would say the latest possible measurement is a reasonable endpoint.
Then going back in time to see how long the pause has lasted is a reasonable excercise.
If that brings you back to 1998, then so be it. The starting point is not chosen arbitrarily, which is the definition of cherry picking.
It is not cherry picking.
Norwood | April 16, 2013 at 10:12 pm |
Your vast experience in chartsmanship tells you that, does it? What a brilliant conclusion! If only Euler had thought of it! Or Bayes! Newton or Einstein! We’d be so much farther ahead today if we only knew! What fools they all were not to see it as clearly as you!
Tell me, when you say the latest endpoint, do you mean today? That is, the GMT for this day in history, collected at two points on the day as the highest and lowest temperature for the weather station, and then taken as the anomaly from the standard mean temperature, as of this hour? Because this day isn’t over yet in half the world. See, it spins and all.
Or do you mean from the less-than four decade-long satellite record as derived from some leaky old 1970’s technology that hasn’t seen maintenance or inspection since it was launched? And do you accept the UAH adjustments, or RSS, or some other published and peer-reviewed method?
No? Not today as of this hour? Then as of the end of the day at the International Date Line?
Or the mean for the month? And do you mean calendar month, or last 30 days, or sidereal, or what?
Or the mean for the year? It turns out there is enough difference north and south that if you don’t take an even calendar year, you skew your samples. That’s why Springer can take a trend ending in 2013 (which includes the northern hemisphere winter only) and come up with a cooling trend while a trend for a modulo 12 number of months has a warming trend.
And what if you go back 12 months from the most recently completed month and find the steepest single year climb in a 12 month period since 1997-1998? Would you say that settles it, the globe is warming faster than evar!?
Or 24 months? Or 36 or 48, and find it cooled slightly? Is that a cooling trend? Or 60 months, and it was warming even more sharply?
None of that is the Endpoint Problem yet, but all of those problems of signal:noise and confidence interval and definition mock your assertion.
And what if in the next 12 or 24 or 36 months, the ones that haven’t happened yet, some sudden new change we can’t really foresee happens and it’s enough to reverse either the up or the down trends when they’re stretched forward to include the new data?
Maybe consider that some of the most brilliant minds of the past half millennium have spent much of their lives studying and researching and calculating and writing about this stuff, and read some of that, before announcing your great discovery about how things ought be done?
Brandon Shollenberger | April 13, 2013 at 7:38 pm |
People line up around the block to handwavingly dismiss you. It’s practically a social movement, but it isn’t interesting.
Make invalid arguments long enough, misinterpret what is said to you willfully enough often enough, and the word ‘interesting’ is the last one that would be applied to the notion of exchanges involving you.
Which is sad, since it polarizes discourse to the point it ends; and who wants that?
Actually, I find this quite interesting. You come back to do nothing but insult me, days later, in a new fork. All while continuing to ignore the basic, irrefutable points I made with nothing more than willful ignorance.
If there’s a social movement, it’s because people who can’t offer meaningful or legitimate responses tend to look for excuses. They see each other’s and copy. It’s akin in effect to a mob forming. All the number of people involved shows is how many people let their irrationality control their actions.
Brandon Shollenberger | April 19, 2013 at 1:56 am |
/sarc on/ You’ve caught me. My cunning plot to lure you away from polarizing invalid argumentation to apply that wonderfully energetic and complex mind of yours to points that anyone but you cares about is unravelled before our very eyes.
I was trying to deceive you into saying something relevant and true, considering something not built on sophistry and paranoia, but you’re just too clever for me.
My cause of trying to involve you in meaningful discussion is lost. Alas. /sarc off/
nvw
“Dr. Forester has been helpful sharing the old data and code – have you approached him for a comment on your results?”
I’ve sent Dr Forest a copy of this article and invited him to comment.
The rationale for publishing your article before receiving commentary from Dr. Forester being … what, Nic Lewis?
Nic Lewis, please allow me to commend to your attention the norm of collegial reciprocity (which of course is an essential element of the polity of science).
Dr. Forester has provided Climate Etc readers with outstanding example in this regard, eh Nic Lewis?
Are you vounteering to do that for all your blog posts and comments?
Skepticism that responds to weak analysis with weaker analysis, and responds to imperfect collegiality with an absence of collegiality, scarcely contributes usefully to climate-change public dialog, eh sunshinehours1?
Fan –
I asked Nic a similar question in response to his post in June of last year – a question that was in reference to a question I asked him in response to his post of the previous year:
http://judithcurry.com/2012/06/25/questioning-the-forest-et-al-2006-sensitivity-study/#comment-213188
I told to him in June of 2011 that I found his response implausible. I explained further in June of 2012:
I also asked him about whether he might continue with a similar strategy in the future, and why or why not:
He didn’t answer at that time – but I guess I have an answer by virtue of his subsequent actions. Apparently, putting the authors in an uncomfortable position is no longer a primary concern of his. Well, either that, or he continues with the (IMO) illogical belief that throwing red meat out to a “skeptical” audience is in the authors’ best interest.
Where is the Forester coming from; isn’t it Dr. forest?
Forest.
A Fan of Moralistic Dystopia.
Skepticism should be welcome in science at all times. If not, then it is propaganda masquerading as science.
Followup It’s easy for Climate Etc readers to verify for themselves that Chris E Forest has responded politely, thoroughly, rationally, and collegially to Nicholas Lewis’s requests.
It’s much tougher to verify that Nicholas Lewis has reciprocated Dr. Forest’s collegiality. Judith Curry (as I see it) might reasonably have inquired of Mr. Lewis in this respect.
Please endeavor to do better in the future, Nicholas Lewis!
So, if Dr. Forester has been mis-represented here, he is welcomed to post his rebuttal. I don’t see the problem here, Fan of More BS. Your over-reaction is telling.
Nicholas Lewis (with Judith Curry’s assistance, ouch!) has made the same error in scientific judgment as Anthony Watts … he has publicized technical results before seeking review.
Mr. Lewis might politely, thoroughly, rationally, and collegially have asked Dr. Forest to review his calculations, eh Jim2?
Fan: I hope you hold the feet of Tamino, Mann, Hansen, etc, and websites like SkS, etc, to the same fire. I know I’m naive in that regard, but here’s hoping.
I find it especially interesting that you’re tolerated here and perhaps in other skeptical blogs — as low as your noise-signal ratio is — but you wouldn’t last more than a single posting as a skeptic at anti-skeptic blogs like SkS or Tamino’s.
James Hansen’s exemplary standards of scientific openness, civility, and collegiality are commended to all Climate Etc readers, eh Wayne2?
Nic Lewis, please take note!!!
” he has publicized technical results before seeking review.”
actually Nic has a paper that is in press on this topic. AR5 discusses this paper. However, they did not adjudicate the matter between Forest06 and Nic’s new paper. In their text they suggest that the discrepancy might be due to mis processing data. The subject is already in the air. Nic has an absolute right to discuss his approach and findings in public. Especially since behind the walls Ar5 is pressing forward.
The following are two distinct statements, eh Steven Mosher?
• “Nic Lewis has an absolute right”, versus
• “Nic Lewis did absolutely right.”
The “absolutely right” path for Nicholas Lewis (collegially speaking) would have been to solicit from Dr. Forest, before going public with his criticisms. Especially since Dr. Forest’s behavior to Nicholas Lewis has been so scrupulously civil and respectful.
Ain’t *this* the path of plain common sense and collegial good manners, Steven Mosher?
Fanny, Steve Mosher is right. This is a public matter. The paper being discussed is in a journal. Your fanny covering attempt to suggest that secrecy is called for is just anti-science. Forest is free to come here and discuss it calmly. Nic is very adult and doesn’t need you to tell him about ethics or scientific etiquit.
David Young, please reflect more deeply on the dynamic of scientific discourse. What Anthony Watts did wrong chiefly was to waste people’s time with defective research.
That’s why the “absolutely right” path for Nicholas Lewis (collegially speaking) would have been to solicit critical input from Dr. Forest, before going public with his criticisms. Because as Anthony Watts and the general public both learned (the hard way) there’s more to peer review (far more!) than formal peer review!
Sometimes the criticism you receive … from showing your work to your peers and humbly asking for criticism … is just plain correct! Ain’t *this* the path of plain common sense, *and* good manners, *and* better science, David Young?
No, Fan, Forest can come here and comment. He will receive respect and the result will be an improvement of science. It is a public forum to discuss a public matter.
Fan,
I’m not sure about Nic Lewis’ rationale, but in the op-ed we read:
> Whilst I failed to persuade GRL to take any action, Dr Forest had a change of heart – perhaps prompted by the negative publicity at Climate Etc – and a month or so later archived what appears to be complete code used for generation of the […]
This at least is that Nic Lewis entertains the hypothesis that his op-eds at Judy’s create negative publicity.
Not that this proves in any way that Nic Lewis wrote this, voluntarily wrote this, that would represent his true belief, etc.
The more I read about the harumphing and haromphing about some supposed breach (or not) of ‘academic etiquette’ and of the excitement so generated, the more I am convinced that many academics and their hangers-on behave little better than four-year olds arguing over whose turn it is to play with Teddy next.
As somebody else might say
‘The world out there really doesn’t give a s**t whether Mr Lewis wrote to Mr Forester on scented notepaper and delivered a box of chocolates with his note or not. Nor whether Mr Forester reciprocated in kind, with a tub of manure or not at all.
The real world is entirely unmoved by questions of the niceties of academic protocol, Isn’t that so FOMBS?’
You guys really really ought to grow out of nappies (diapers). You just make yourselves look immature, myopic and ridiculous.
Speaking of diapers, owning that one’s after negative publicity might be nice.
Please can somebody explain why they think that a long period of ‘review’ by a supposedly ‘anonymous’ reviewer -who may in fact spend only a few minutes on the paper’ and has what is only a one-way conversation is superior to a realtime interactive process with many named individuals actively taking part.
The old style peer-review is only done the way it is because of the old limitations of paper transmission through snail mail services. That was the best that could be done in the 1950s, but the internet has removed those limitations.
I find it hard to be convinced that the ‘instant’ availability of interested parties from all round the world debating in many-many conversations does not immesurably improve the end-result.
And I find it very difficult not to believe that those who most vehemently defend the old system were the biggest beneficiaries of its propensities for secrecy, ‘pal-review’ and advancement of ‘the cause’. And who are frightened that their own work will not stand up to open real-time scrutiny.
The days of the climatologits standing on the mountain and lecturing us mere mortals about ‘the Science’ – and expecting mute obedience are long past.
Marcott, Lewandowsky and Gergis are but three who have found this out the hard way. I hope their dreadful example will give their colleagues pause before they try to pull similar stunts.
One can both be critical of the peer-review system and of negative publicity.
Just a bit of logic there.
As to Nic Lewis’ rationale, perhaps this is informative?
Nic suspected that the authors tacitly accepted misuse of their data, and later saw evidence that firmed up his suspicion.
IMO, the bottom line here is correcting the science. It seems that Nic has made a contribution by concentrating his considerable skills on doing so. For that, IMO, he is to be commended.
But are other aspects related to his actions. He said that he proceeded as he did in order to minimize putting the authors in an uncomfortable situation. As I see it, although I have no reason to doubt his statement of intent, his logic is highly flawed in that regard.
In fact, I’d say that his actions – by first publishing (on the web) his criticism and then afterwards asking for feedback from the authors – maximized the uncomfortable situation for the authors.
Further, stating publicly that he believes the authors “tacitly approved” the misuse of their results does not seem consistent with trying to minimize their uncomfortable situation.
AFAIAC, these types of actions – of the sort that Nic took – are more same ol’ same ol.’ The question of the presentiment for the authors is secondary, IMO. They are adults. They can get past uncomfortable circumstances.
The problem, IMO, is that actions of the sort that Nic took exacerbate and encourage tribalism and finger-pointing. If that’s how people choose to act, so be it: such types of actions are ubiquitous in the climate wars. But at least acknowledge the outcomes of your actions, and if you’re interested, consider how you might choose to act differently.
Joshua.
Notice how you flip back and forth between talking about motivated reasoning and motivations.
In this case since you cannot address Nic science, you go to motivations.
What are your motivations? be accountable
FOMD.
I find it hilarious that you talk about the POLITY of science when the planet is at stake
The polity of science would keep Jim Hansen out of politics and would keep him from performing stunts that land him in jail.
I find it hilarious that you talk about the polity of science when folks like Nic Lewis are routinely attacked for NOT BEING SCIENTISTS.
I dont see you defending Nic as a scientist, I see you trying to hold him to quaint ineffective cultural norms, norms of a culture that wouldn’t accept Nic as a member. So, ya, Nic took to the streets to get his message out.
The same way Hansen took to streets to save the grandchildren.
If Nic is right, our grand children will be safer. I think he has a right to take it to the streets. Just like hansen, only on the other side.
steven –
Actually – I thought long and hard about that. I will say that my initial reaction, that Nic’s explanation for his actions was – as I stated earlier – “implausible,” was questioning his motives.
For that I should aplogize – as after further thought, and after thinking about how in not knowing Nic I can’t possibly have a clue as to his motivations – I tried to reframe my perspective.
His explanation is not “implausible,” but in my view it is illogical So, assuming his intent to minimize the discomfort for the authors, his actions show motivated reasoning – a bias that mediated between his intent and his actions.
I would also note that he also fell into the same trap that I fell into – by making assumptions about the authors’ “tacit approval” of mis-use of their data. In fact, he has no evidence on with to draw such an inference. The fact that he makes such an inference without sufficient data is oneof the ubiquitous problems that we see in the climate wars. It is like when someone makes an accusation about a “lie” when thy actually can’t make such a conclusion See my earlier comment to manacker in that regard.
And as always, steven, although you want to make this about me – I am not what this is about.
Yes, but Science burdens Joshua with a commitment he has not made and deflects away from Joshua’s point, which was about the consequences of negative publicity on collegiality.
One can remain neutral about negative publicity surrounding an audit and be critical of the washing of the auditor’s hands that oftentimes comes with it.
INTEGRITY ™ — We Wash Our Hands
FOMD, Joshua, and other defenders of etiquette
I’m a little bit confused on this notion of etiquette. I see you defending etiquette. Hey I’m all for that, but help me understand what is acceptable and what is unacceptable.
1. Is it acceptable to write to other scientists and accuse a fellow of being a fraud and a oil shill with no evidence? especially when the people you are communicating this to are likely reviewers of the man you are slandering. and the minute you became aware of such a case would you
call the accuser to account?
2. Is it acceptable to refuse code to a scientist when he is unable
to replicate your results because your code does things differently
than you describe in the paper. That he, your describe proceedure X
in the paper, but you actually did Y, and the scientist writes you
and says.. ” I did X, but got a different answer, can I see your code”
would it be good etiquette to keep him in the dark?
I can go on , but let me clear about the purpose of this.
the purpose is not to say, “they did it first”. I could give a rats ass.
The purpose is to understand your notions of good etiquette and to see if you are a good etiquette cop. Think of it like this. If you only arrested black folks for crimes and looked the other way when white folks did the same thing or worse, we’d be within our rights to question
A) your knowledge of the law
B) your fundamental fairness.
This would not mean the people you accuse are innocent. It would just mean that you are a bad cop and folks wont listen to you.
Lol! Where did I speak of etiquette?
In fact, I think that etiquette is largely irrelevant here. Straw men are a sign of motivated reasoning, Steven.
The question is, for me, maximizing beneficial outcomes. IMV, actions that exacerbate tribalism and finger-pointing diminish the potential positive outcomes.
In this case, the science could have been corrected without all the nonsense. And the nonsense, in fact, distracts from the science.
“Yes, but Science burdens Joshua with a commitment he has not made and deflects away from Joshua’s point, which was about the consequences of negative publicity on collegiality”
collegialty? Joshua has denied that Nic is their colleaque.
Kinda weird that he tries to hold Nic to the rules of a group that he denies him membership in. na..
Yet another green line test.
Notice how the issue is framed in terms of etiquette.
INTEGRITY ™ — Not Negative Publicity, Etiquette
willard –
This feels a little too close for comfort to steven’s “etiquette” straw man..
It isn’t the impact on collegiality, per se, that bothers me. It is the outcome of fanning (no pun intended) tribalism, finger-pointing, etc. Those are certainly related phenomena, but they certainly aren’t congruent.
steven –
Please read what I wrote more closely. What I said was that the description of him, in the newspaper article, was likely to mislead the majority of readers – and that it was inconsistent with how others had described him in print and how he had described himself.
I agreed that these categories are essentially arbitrary, and I also pointed out the weakness of your definition by virtue of exclusionary criteria (which, btw, you responded to with crickets)
Oy. Again steven makes it about me, in a series of posts, and I just fall right in line and respond accordingly.
When will I learn not to fall for that “distraction?”
It isn’t about me, steven.
steven –
Of course not. Why would it be? Why are you asking me that question? Did I ever suggest that it would be? Ever?
And even if I had (which I haven’t) – is it your contention that “Mommy, mommy, they did it firrrrrrsssttt” is a valid argument? Well, maybe you think so. I don’t.
You are right Joshua. you didnt speak about etiquette.
you spoke about
” the consequences of negative publicity on collegiality” , well thats how willard read it.
me, I just saw more motive hunting. Forget the fact that Nic has an absolute right to discuss anything he wants. Forget the fact that you deny him membership in the club of scientists, you still expect him to abide by their rules. Forget the fact that Nic has a history of being abused in the peer review system. You want to know his motives. As if the motive change the facts. As if the motives change the numbers. As if motive hunting has any other purpose other than discrediting his science by smearing his character. you are foul beast joshua.
Wanna know something? without the threat of publicity, without the ability to take his message direct to the public, there would still be errors in the sceince, still be errors in Ar4. But then you dont care abut the science.
> Joshua has denied that Nic is their colleaque.
Notwithstanding the blatant untruth, this introduces another episode of parsomatics according to which collegiality necessitates some ontological or social status, which is both false and irrelevant to the issue of negative publicity.
Here’s what an unwinnable looks like:
(1) Nic hypothizes that op-eds at Judy’s creates negative publicity.
(2) Nic posts an op-ed at Judy’s.
(3) Yes, but science.
INTEGRITY ™ — We Provide Squirrels
Joshua,
What about “some adverse consequences about which auditors wash their hands”?
We can also speak of side-effects, which might provide the incentive to negative publicists of providing legalese unreadable contract terms, like on Big Pharma ads.
INTEGRITY ™ — First Wash Your Hands
And one final thing Joshua. You complain about it when you perceive that folks make it “all about you.” Perhaps, you should consider the fact that when you go motive hunting on Nic, that a turn about is fair play. When you make it all about Nic’s motives, dont express surprise when people make it about your motives. And its not about mommy, its about can you play by the rules you establish. You establish by your conduct that attacking motives is acceptable. so, dont play the victim. own up and be accountable to your own biases here. go ahead.. lets see you be accountable.
Willard
“Notwithstanding the blatant untruth”
perhaps you are unaware of Joshua’s claim that Nic is not a climate scientist. he has denied that Nic is their colleaque. If he would like to ammend that determination when might then discuss whether the publicity was in fact negative. I look favorably on Dr, Forest because he did the right thing. I see nothing negative. Maybe some bruised feelings.. heck, all science is wrong, no shame in Forest being wrong. Our grand chidren may thank him some day
Big Dave,
Please acknowledge that Nic Lewis should earn his negative publicity.
Many thanks!
You have nothing much against negative publicity, Moshpit.
As you or bender would say:
> Next.
Josh,
This is meant as friendly advice. Quit trying to argue with Mosher. You get cut to shreds every time.
timg,
Do you agree that Nic should own his negative publicity?
willard. no such thing as negative publicity. you should know that.
tim –
Thanks for the advice, tim. And as a friendly response, I’ll tell you that if you’re favorably impressed by arguments based on distortions and outright inaccuracies, then you are certainly entitled – but it renders your advice to me as being basically worthless.
For example:
I say straw man followed by outright distortion – which given that he repeats it, graduates in my book to outright inaccuracy.
Now if you want to defend the veracity, have at it. And if you could make a legit case, then you might be able to redeem my consideration of the value of your advice.
willard,
I think the whole “negative publicity” thing is distracting BS.
the ontology of collegiality
http://en.wikipedia.org/wiki/Collegiality
‘Colleagues are those explicitly united in a common purpose and respecting each other’s abilities to work toward that purpose. A colleague is an associate in a profession or in a civil or ecclesiastical office.
Thus, the word collegiality can connote respect for another’s commitment to the common purpose and ability to work toward it. In a narrower sense, members of the faculty of a university or college are each other’s colleagues; very often the word is taken to mean that. Sometimes colleague is taken to mean a fellow member of the same profession. The word college is sometimes used in a broad sense to mean a group of colleagues united in a common purpose, and used in proper names, such as Electoral College, College of Cardinals, College of Pontiffs.
Sociologists of organizations use the word collegiality in a technical sense, to create a contrast with the concept of bureaucracy. Classical authors such as Max Weber consider collegiality as an organizational device used by autocrats to prevent experts and professionals from challenging monocratic and sometimes arbitrary powers. More recently, authors such as Eliot Freidson (USA), Malcolm Waters (Australia) and Emmanuel Lazega (France) have shown that collegiality can now be understood as a full fledged organizational form. This is especially useful to account for coordination in knowledge intensive organizations in which interdependent members jointly perform non routine tasks -an increasingly frequent form of coordination in knowledge economies. A specific social discipline comes attached to this organizational form, a discipline described in terms of niche seeking, status competition, lateral control, and power among peers in corporate law partnerships, in dioceses, in scientific laboratories, etc. This view of collegiality is obviously very different from the ideology of collegiality stressing mainly trust and sharing in the collegium.”
1 Nic has never been treated as a colleague.
a. critics ( take william connelley as an example question his abilities.
b. critics question whether he is working toward a common purpose..
2. Moshpit would as usual associate himself with Max Weber
willard –
Well,yes… but the clause “about which auditors wash their hands” is a bit distracting for me. Whether they wash their hands of it or not is not, IMO, what is important. What is important is whether they consider easily predictable consequences of their actions, and respond accordingly.
In fact, it isn’t likely that they would change their actions (in such a way as to reduce the tribalism) w/o accepting the responsibility for the negative outcomes of previous actions, but their accountability or lack thereof isn’t really the point of focus. Focusing on their lack of accountability will only produce more same o’l same ol’
tim –
I don’t agree that it is “distracting BS,” I also don’t think that it is the important consideration The “publicity” around these issues is very much a focus of activists on both sides (they both claim to be victims of such), but in the end, it doesn’t have a terribly large impact. The publicity surrounding this issue is negligible outside of the climate war food fight – and inside the climate war food fight all the participants are already furiously flinging Jell-O to be significantly impacted by publicity over any one specific issues.
The negative outcomes of Nic’s procedural decisions, IMO, is an aggravation of the tribalism. That is something that could (at least possibly) have been mitigated w/o compromising the advancement of the science.
Joshua
“Whether they wash their hands of it or not is not, IMO, what is important. What is important is whether they consider easily predictable consequences of their actions, and respond accordingly.”
yes, it was easily predictable to GRL that if they violated the ethics of science that they would be called out. Too bad they threw Forest under the bus.
Was was not predictable was the response to Nic’s post at Judiths.
A smart Forest would have come on, thanked Nic and offered to work hand in hand with him to resolve the issues and co author a paper.
Nic, then, would be in a hard spot and could hardly deny Forest’s request to work together.
> no such thing as negative publicity.
Perhaps Nic should consult a black hat marketer next time he’s writing op-eds in auspices where he surmises negative publicity might ensue.
Joshua,
I’ll have to agree to disagree about what is the main point here. But let’s stand that aside for the moment and notice how your “predictable” was taken as a bait to switch on more squirrels.
Do you think the last batch emails soon will get publicized?
Not that it would be negative publicity, mind you.
As if negative publicity exists.
steven –
I agree. And my point is what might Nic have done that would have maximized such an outcome. In my view, the best course of action towards that goal would have been to notify the authors of his findings and ask for a reaction of for collaboration on finding the answer.
The best course of action would not be to: (1) make an assertion that they “tacitly” approved the misuse of their results and (2) to come onto a “skept-o-sphere” blog making such statements in ways that clearly would foment accusations of “fraud.” It happened all up and down the original post – all easily predictable.
When I asked Nic why he followed his course of action rather than the one I suggested would have been more productive, he replied that he was trying to minimize the extent to which the authors would be put in an uncomfortable situation. I think that logic is faulty. I originally said I found his answer implausible, and on second thought realized that my view was resting on a judgement of motives for which I have insufficient evidence.
I stand by my opinion that his course action, given his stated intent, was illogical. And again, it looks to me like a rather classic case of motivated reasoning mediating the relationship between intent and actions/predictable outcomes.
Anyway – enough handbag fighting. We’ve both made our positions clear multiple times now…. and anyway, tim’s mind is made up and that’s all I cared about to begin with.
same ol’ same ol’. One might even say, “predictable.”
Since I could not care less about changing timg’s mind, I could follow-up on Joshua’s point:
There is more than faulty logic there, considering that:
(1) Nic surmises that one of his previous op-ed at Judy’s created negative publicity.
(2) Nic just posted another op-ed where he says more of the same.
Willard and Joshua
All this “would’ve, should’ve” banter is fairly senseless.
Let’s see whether and how Dr. Forest reacts to Nic Lewis’ recent study.
Then we’ll have some facts to talk about, rather than just wild speculations and opinions.
Max
> rather than just wild speculations and opinions.
The only speculation I see for now is Nic’s testimony about negative publicity at Judy’s.
But Nic’s testimony is written evidence.
Nic’s op-ed is also a fact.
MiniMax, Y U no play fair?
***
Acknowledging these facts and the small, obvious, no-nonsense ethical point it entails would suffice.
Josh,
RE: climate food fights and Jello flinging. Do you consider your role to be that of Jello salesman? One who likes to toss the occassional bowl at one particular side?
RE: tribalism. So where exactly are you in your quest to establish a new record for dead horse beating?
willard,
“Since I could not care less about changing timg’s mind”
You cut me to the bone.
I’m not here to change anyone’s mind, but perhaps my own.
‘I agree. And my point is what might Nic have done that would have maximized such an outcome. In my view, the best course of action towards that goal would have been to notify the authors of his findings and ask for a reaction of for collaboration on finding the answer.”
Nic did better than that. he followed the time honored practice of contacting the journal and asked them to honor the time honored practice of playing the honest broker.
Your complaint is with GRL. I noticed that you, willard and FOMD where all over their motivations. I really like the way you guys ripped into them for violating principles.
you want to own that?
na.
“Perhaps Nic should consult a black hat marketer next time he’s writing op-eds in auspices where he surmises negative publicity might ensue.”
You would think Nic would have learned from climategate that in some corners Forest’s refusal and GRL refusal would be seen as POSITIVE publicity. lets face it, as a cop you cant even arrest Gleick for what he did. you wont arrest lewandowski, or cook, or mann, or jones. lets face it, you think GRL was right to treat Nic like an outsider and you thnk firest was right to deny him.
Just for show you might want to throw a white guy in jail now and again.
thin green line..
> I noticed that you, willard and FOMD where all over their motivations.
Yet another untruth.
> lets face it, as a cop
Yet another untruth.
> lets face it, you think GRL was right
Yet another untruth.
> You would think Nic would have learned from climategate […]
When are this last batch of emails coming?
I thought Mosphit spent fifteen minutes of his life to sanitize the emails from personal information.
Wait.
Does that mean Moshpit had access to personal information?
Thin green line on chunder road sands
Face the vegemite mighty mice dance.
==============
> Nic has never been treated as a colleague.
Yet another untruth.
1. Here would be a minimal interpretation for Fan’s point:
http://en.wikipedia.org/wiki/Collegiality
Notice how this connotation is also more charitable to Fan’s point.
2. Here’s how Dr. Forest came at Judy’s and proceeded to show some respect for Nic’s commitment toward a common purpose:
http://judithcurry.com/2012/06/25/questioning-the-forest-et-al-2006-sensitivity-study/#comment-223311
Notice how this has been done, even after a blog post that might have attracted negative publicity, or so surmises Nic.
3. The example in #2 both satisfies #1 and provides sufficient evidence to consider the “has never been treated as a colleague” as pure prevarication.
Steven Mosher,
Oh look. A handbag fight. Again.
With the usual suspects Joshua, Mosher, and Willard. Again.
Why don’t the three of you grow the f*ck up.
Is there any moderation in this joint?
+100
The tinies are acting up again. Surely its bedtime soon?
Since none of them has anything of technical merit to say and since you havent read Nic’s paper and have nothing to say, you’ll have to pardon me while I amuse myself with their contorted view of reality. But hey, I enjoy talking to schizophrenics, they are not much different.
Yes, but science.
If Nic wishes a technical comment, he can try James’.
More like a knife fight.
With Mosher’s knife being at the end of a rifle, and Josh with a folding pocket knife. Meanwhile willard is throwing rocks from the side line.
Nic has a choice of venues.
he can choose to be slandered by bloom and others at James.
he can choose to be slandered here by FOMD and Joshua.
A man gets to choose his battlefield.
Now, if you want to go ask James if James will allow a guest post.. go ahead.. make my day
timg56,
I find it funny that with the planet at risk these folks concerned about the welfare of grand children are clutching their pearls about etiquette, negative pubilicity, collegiality, hurt feelings, blah blah blah.. Same people who have no problem calling people deniers, same people who have no problem with hansen calling other scientists ‘court jesters’. same people who have no problem with lewandowsky and cook lies, same people who have no problem with mann’s slanderous behavior. Same people who have no problem with Gleick. Same people who have no problem with Jones telling other to delete mails..Now, its all about the etiquette. poor dears.
It kinda goes like this: They tell Nic and the rest of us that we have to play on their fair battlefield. the battled field of peer review. So we try. and gosh, they dont really play fair on their own battlefield. They bribe the refs. So, we take it to the streets,, and now the poor baby’s cry foul.
boo fucking hoo.
> A man gets to choose his battlefield.
Indeed, he can choose one of which he says:
Once a man chooses the battlefield of negative publicity, he should own it, don’t you think?
Springer –
One of your better comments, actually. It has basically turned into a handbag fight.
Still – I think that issue does merit discussion. It is unfortunate that these discussions so often degenerate so.
Should Nic own that he thinks negative publicity might have played a role? Sure, he already has owned the fact that he thinks it might have played a role. Did it play a role? Dunno, before that comes the question
was there negative publicity or is Nic wrong about that? That’s a good question. Was there negative publicity? Since this is largely in the eye of the beholder and easily reframed I don’t know how you’d establish the fact. Did forest see it as negative? His choice, one simple sacking the exchange and he could have established a positional advantage.
yes Joshua, its a handbag fight.
Nic presents his findings to the public. FOMD elbows him for farting in public. Then we get philosophical about farting. Fine by me, Nic’s work stands and the room stinks.
Moshpit has nothing against the fact that Nic stated that his op-eds ad Judy have led to negative publicity.
Hence his food fight, which almost succeeded when he targeted Joshua.
Nick totes the upper handbag heavy,
Flitting through forest , twitters of light.
===============
Re: choosing the battlefield. Rihanna perhaps says it best,
Life’s a game but it’s not fair
I break the rules so I don’t care
So I keep doing my own thing
Walking tall against the rain
Victory’s within the mile
Almost there, don’t give up now
Only thing that’s on my mind
Is who gon’ run this town tonight
Speaking of turnabout, here’s an interesting application of fair play:
http://en.m.wikipedia.org/wiki/Fair_Game_(Scientology)
INTEGRITY ™ — You Asked for It
Dont confused fair play with fair game.
nice try, I said fair play for a reason. the principle of charity imposes requirements on you willard. follow them as a man of honor
Speaking of turnabout, not speaking of fair game.
Turnabout + fair play = fair game.
No willard, use charity to understand how what I said makes sense and is interesting
http://idioms.yourdictionary.com/turnabout-is-fair-play
In a rhetorical setting, turnabout should mean something like retaliation, not like playing turns:
http://www.merriam-webster.com/dictionary/turnabout
Retaliation does not count as a valid defence.
***
Besides, Joshua does not need to question Nic’s motives to say that:
> The problem, IMO, is that actions of the sort that Nic took exacerbate and encourage tribalism and finger-pointing. If that’s how people choose to act, so be it: such types of actions are ubiquitous in the climate wars. But at least acknowledge the outcomes of your actions, and if you’re interested, consider how you might choose to act differently.
http://judithcurry.com/2013/04/10/the-forest-2006-climate-sensitivity-study-and-misprocessing-of-data-an-update/#comment-311133
In other words, auditors should own their negative publicity. Arguing otherwise being unwinnable, let’s not wonder we’re having all this scurry of squirrels.
Acknowledging that Nic should own his negative publicity seems to step on some kind of green line, since all we hear is the silence of the squirrel throwers.
Ah reckon a squirrel is “fair game”.
A duck is “purty good game”.
An a deer is “real good game”.
‘Has denied’ serves a rhetorical function that can’t be supported by anything Joshua said.
Look, a black hat squirrel.
wearing that coonskin hat could get you shot as a squirrel.
Joshua on Nic being a colleaque of climate scientists
‘FWIW, while perhaps not in agreement with Judith that it is “astonishingly good,” and despite some nits (i.e., a rather strangely sloppy errors in calling Nic Lewis become a climate scientists), I think that the Economist article provides a pretty good overview of the debate.”
Thereafter ensued a discussion of whether or not Nic was a member in good standing of the college of climate scientists. Its fair to say that Joshua did not consider him to be a climate scientist. max weber would be instructive here.
Lol.
Notice the lack of specificity about the “ensuing discussion” – where I made it quite clear that I agreed that by arbitrary distinctions as well as steven’s laughable exclusion criteria, Nic (and practically anyone else) could be considered a climate scientist. I also made it clear that Nic did not describe himself as such previously in an autobiographical sketch here at Climate Etc., and that in a recent article, Ridley described Nic quite differently. Further, I made it clear that my point of disagreement was that in a newspaper article, such a description of Nic would likely be misleading to most readers. I also made it clear why I felt that way.
Also notice the veracity in the “ensuing discussion” of steven’s assertion that I stated Nic isn’t a scientist – and the bouncing ball of steven’s qualifiers when characterizing what I did and did not say
I disagree with FOMD’s criticism related to etiquette. I see that issue as largely irrelevant.
> Its fair to say that Joshua did not consider him to be a climate scientist.
Perhaps, but what was said here was a bit stronger than that, and is still unjustified when discussing about negative publicity.
Yet another squirrel.
sure that squirrel isn’t wearing a tinfoil hat?
MiniMax, Y U no play fair?
My squirrels are all climate scientists. Keen observers of weather and cats, too.
================
Hey, look – one of those squirrels has got long ears – could it be a Rabett?
If the equilibrium temperature of the climate (whatever that may mean) is raised by 1K, what is the expected change in atmospheric CO2 concentration?
I’m waiting…
Probably about 10-15 ppm.
There would be more sharing of data and the assumptions implicit in their handling if climatology actually was a real science –i.e., where a part of the definition of even trying to do good work means enabling others to come to the same answer by replicating your work.
Nic Lewis
Thanks for posting this.
Also thanks to Dr. Forester for making the data available to you.
This is the way that climate science (or any science) is supposed to work.
I hope Dr. Forester takes the time and effort to respond and the response can also be posted here.
Max
PS I’m sure this will be your approach, but I would ignore the feigned howls of outrage here from some bloggers, who see your analysis as a threat to a cherished dogma.
Correction: Dr. Forest – not Forester (Looks like I’m picking up Fan’s bad habits!)
“Nicholas Lewis (with Judith Curry’s assistance, ouch!) has made the same error in scientific judgment as Anthony Watts … he has publicized technical results before seeking review.”
Dear Fan,
Ok, but I can’t help thinking you’d not be making the same complaint were the results more friendly to your world view. As we’ve seen with Marcott et al, and innumerable papers before that, peer review isn’t what it’s cracked up to be. Which is why we can be so grateful for the Internet, and blogs like Climate Etc. I’d include alarmists blogs as well, as something to be grateful for, but for the fact that they don’t allow actual conversation. (what are we to make of that?)
.
Interesting possible criticism, but methinks not valid. Nic has offered critiques to the peer papers, has apparently gotten cooperative responses from Dr. Forest, and is very explicit here.
Rather, we have a glimpse of a new publishing paradigm, where stuff goes onto the information highway, not paywalled, for all to scrutinize and critique.
I have great hope for the future based on blogs like Climate Etc, Climate Audit, and beyond blogs for ebooks now much more economically available with illustrations.
The peer review process is going on right now. Dr Forest has been given credit for his co-operation but any pre-publication review by him of Nic’s paper is hardly likely to change anything in the paper.
Its now up to FOMD and others to scrutinise the head post and put their POV’s up on this blog for discussion. Much of the commentary on this thread is OT because they are not not referring to the topic of this head post.
I said “Much of the commentary on this thread is OT because they are not not referring to the topic of this head post.”
That was a load of twaddle wasn’t it? :)
Peter Davies, an accepted scientific norm is for Nicholas Lewis to write-up his critique as a preprint, and post it to the arxiv server, a free-as-in-freedom scholarly repository from which it can never be erased or removed (by anyone, even by Nicholas Lewis himself!). The results can be quite lively!
Obviously, it’s best (by far!) for Nicholas Lewis and Chris E Forest to talk extensively among themselves first! Otherwise everyone‘s time might be wasted on elementary misunderstandings, eh?
Wouldn’t that be simple good manners and common-sense … and in reasonable accord with well-working scientific norms and traditions, Peter Davies?
James Hansen and his climate-science colleagues embrace these public-spirited measures whole-heartedly. That’s good for everyone, eh Peter Davies?
Peter Davies, Climate Etc readers are welcome to verify for themselves that the comment “the results can be quite lively!” provides a link to Anastassia Makarieva et al. “Reply to comment of Bister and co-authors on the critique of the dissipative heat engine” (arXiv:1010.5753, 2010).
Please notice that this (admittedly dry-titled) Makarieva et al. critique exists within the arxiv domain “Atmospheric and Oceanic Physics” because it concerns … the thermodynamical physics of hurricane formation and sustainment … a topic of immense interest to every Climate Etc reader. And so, it can scarcely be off-topic to note the exemplary practices by which these climate scientists address technical areas of disagreement!
That is why these scientific practices are good, eh Peter Davies (and Nicholas Lewis, Rud Istvan, pokerguy, Peter Lang, David Young, Steven Mosher, etc.)?
FOMD.
Nic already has a paper on this submitted and accepted. please catch up.
FOMD I have already stated my view that much of this discussion is OT. Perhaps Judith might wish to start a new thread on the current status of scientific norms and traditions as applied to climate science, particularly in relation to the issue of peer review, which is IMO problematic for both sides of the AGW debate.
What is your opinion on the head post by Nic Lewis. Are there data processing issues with the original Forrest paper? If so what would the implications be for current mainstream climate science estimates of climate sensitivity?
See above, Peter Davies!
Nic Lewis,
Thank you for this update and all the work you have done over the past few years to understand ECS and communicate your findings to lay people like us here and on Climate Audit and Bishop Hill. From my perspective ECS is one of the four most critical inputs for cost-benefit analysis and robust analysis of policies to deal with AGW.
One message I take from your work is how important it is to use the correct statistical methods. This, of course, is another example of what was found with long history of the ‘Hockey Stick’, Steve McIntyre’s excellent discovery and the many enquiries.
Nic, or someone knowledgeable, could you please clarify for me? Is the PDF, of F06’s estimates of ECS, or of the real world ECS?
To try to clarify what I am asking, the title for the horizontal axis on the first figure says “Equilibrium Climate Sensitivity Seq – Global mean Temperature rise for doubled CO2. However, I think this title should be “PDF of F06’s estimates of equilibrium climate sensitivity”
Is my understanding I correct?
[repost with corrected formatting, sorry]
Nic Lewis,
Thank you for this update and all the work you have done over the past few years to understand ECS and communicate your findings to lay people like us here and on Climate Audit and Bishop Hill. From my perspective ECS is one of the four most critical inputs for cost-benefit analysis and robust analysis of policies to deal with AGW.
One message I take from your work is how important it is to use the correct statistical methods. This, of course, is another example of what was found with long history of the ‘Hockey Stick’, Steve McIntyre’s excellent discovery and the many enquiries.
Could you or someone knowledgeable please clarify something for me someone?
Is the PDF, e.g. in Figure 1, the PDF of F06’s estimates of ECS, or the PDF of the real world ECS?
The title for the horizontal axis on the first figure says “Equilibrium Climate Sensitivity Seq – Global mean Temperature rise for doubled CO2
However, I think this title should be “PDF of F06’s estimates of equilibrium climate sensitivity”
Is my understanding I correct?
I asked on a previous thread what is the effect of a reduction in our estimate of ECS from 3K to 2K on the break-even date (i.e. when AGW damages exceed the benefits)? According to Bjorn Lomborg (from Nordhaus, Tol and others), the estimated break-even date is about 2070. That is based on the IPCC AR4 estimates of climate sensitivity and inputs used for estimating the damage function (p23 here: http://nordhaus.econ.yale.edu/Accom_Notes_100507.pdf).
If ECS is 2K instead of 3K, when will break-even occur? (e.g. 2120?).
Peter Lang
“Break-even date” is a nebulous concept, as far as I am concerned.
But let’s look at the impact of replacing the previously assumed 2xCO2 ECS estimate of 3C (IPCC AR4) with a revised estimate of 2C.
IPCC AR4 has several “scenarios and storylines” for future GHG concentrations and projected warming.
Let’s take an average of all cases (B1, A1T, B2, A1B, A2 and A1F1).
These have CO2 equivalent rising to an average of around 698 ppmv by 2100 and around 570 ppmv by 2070.
So, if the “break-even” point was 2070 with the old ECS estimate of 3C, this means breakeven occurs at:
3C* ln(570/392) / ln(2) = 1.6C warming above today’s temperature
So until we reach this level of warming, the net result of AGW is beneficial (as I understand your qpremise).
Let’s ASS-U-ME that this is the case and that at warming exceeding 1.62C above today’s temperature we will start to see a net negative impact with added warming.
So when would we reach 1.62C added warming with an ECS of only 2C?
This would occur at 690 ppmv concentration:
2C*ln(690/392) / ln(2) = 1.62C warming above today’s temperature.
Using the average CO2 concentration of the IPCC AR4 “scenarios and storylines” cited above, this would occur in year 2098.
So we have moved the ASS-U-MEd “breakeven point” from 2070 to 2098.
Which would mean that essentially throughout this century AGW would have a net beneficial effect
Max
PS Let’s see if anyone wants to challenge this calculation.
Manacker,
Thank you for working through that calculation. It seems reasonable to me, although, instead of using an average of all the AR4 “scenarios and storylines” I’d suggest it would be better to use the inputs Bjorn Lomborg used, which I expect are the same as Nordhaus used.
If someone with more of the relevant skills than I have, want’s to do the calculation a more rigorously, and using the DICE2013 model (from which Bjorn Lomborg derived the break-even date of 2070 based on the AR4 values for ECS and other inputs) they can download the DICE (2013) here: http://nordhaus.econ.yale.edu/NotesonhowtoruntheDICEmodel.htm
and calibration of the input functions here: http://nordhaus.econ.yale.edu/Accom_Notes_100507.pdf
Probably wrong to include the mitigation scenarios in this type of calculation. Use A2 and A1F1 which are what would happen without mitigation, and compare the effects with mitigation scenarios.
Jim D,
Thanks for that. Is that the equivalent of the Nordhaus DICE (2013) ‘Baseline Scenario” which is “Delay controls for 250 years”. That is delay global mitigation controls but normal adaptation would occur?
http://nordhaus.econ.yale.edu/NotesonhowtoruntheDICEmodel.htm
Peter Lang, the A1F1 is a rapid economic growth as developing countries catch up, with fossil-fuel intensity. A2 is independent nations with no global mitigation policy. They reach 850-950 ppm by 2100.
Jim D,
Thank you. I didn’t make my point very well (I should have made a statement instead of a question). The estimated break-even date of 2070 is based on the ‘Baseline Scenario’ in the DICE (2013) model (I think). Therefore, if we want to project the the break-even date with an ECS of 2K, instead of 3K, we need to use the same inputs as the DICE ‘Baseline’ model (I think). The inputs for the DICE (2007) are here: http://nordhaus.econ.yale.edu/Accom_Notes_100507.pdf. However, I do not have the competencies to understand the models and change the inputs well enough to run the revised scenarios. I am hoping someone younger and brighter than me can do it for me and tell us the results.
I’d be very impressed if the CAGW believers would have a go. My hope is to try to get them to begin to understand why rationalists do not accept the policies they advocate, like carbon pricing.
MAnacker<
Nordhaus DICE (2007) projects 689.5 ppm CO2 by 2100 with the “Baseline” policy (i.e. “No controls” policy). So your assumptions is very close to the value projected by DICE (2010). Therefore, your calculation that the break-even date would be pushed out to 2098 seems reasonable to me.
I wonder what the break-even date would be if the damage function (damages per degree of warming) is halved? (e.g. perhaps 2200?).
And what if the rate of decarbonisation of the global economy accelerates as it could and should if we remove the regulatory impediments that are preventing it happening? (would the CAGW concern disappear altogether?)
Manacker,
I’ve further checked your assumed inputs against table 5-7 and Figure 5-7 (pp103-104) here: http://nordhaus.econ.yale.edu/Balance_2nd_proofs.pdf.
Your assumed inputs are very close to the projections from DICE (2007).
Peter Lang
You ask: what would happen to the Nordhaus “breakeven point” on AGW if 2xCO2 ECS were only half of 3C (or 1.5C), as it appears more recent observation-based studies are suggesting?
Just like your earlier question, the rough calculation is simple.
You wrote that Nordhaus tells us that the “breakeven point” is reached in year 2070 on the assumption that atmospheric CO2 grows exponentially reaching 689 ppmv by 2100, based on the “old” model-predicted 2xCO2 ECS of IPCC of around 3C. [As pointed out, this CO2 level by 2100 is very close to the average of all the IPCC AR4 “scenarios and storylines”.]
As we saw from the earlier calculation, switching from a 2xCO2 ECS of 3C to one of 2C shifts the Nordhaus assumed “breakeven point” from AGW by a calculated 28 years from 2070 to 2098.
The calculated temperature increase above today by 2070 (i.e. at “breakeven”) was 1.62C.
To reach this amount of warming at a 2xCO2 ECS of 1.5C would require a CO2 level of 829 ppmv:
1.5C*ln(829/392) = 1.62C
At the projected exponential rate of CO2 increase, this level would be reached by year 2129, or shifted 59 years beyond 2070.
Max
PS This is why the CAGW supporters (like Bart R) are strongly opposed to any new lower observation-based estimates of 2xCO2 ECS.
It is also why IPCC now faces the dilemma of
a) either acknowledging these new estimates (and losing the CAGW scare factor), or
b) “sweeping them under the rug”, as our hostess once wrote (and suffering further loss of credibility and public trust).
Hi Manacker,
Thank you for redoing the calculation at T2xCO2 = 1.5K. But I think you misread my question. I asked:
To answer this may need reference to the DICE (2013) model which can be downloaded (options of Excel or GAMS program) here: http://nordhaus.econ.yale.edu/NotesonhowtoruntheDICEmodel.htm
and to the calibration of the Damage Function, pp23-26 here: http://nordhaus.econ.yale.edu/Accom_Notes_100507.pdf
I’m still stumped by the idea of Nordhaus that there is any way to call any outcome that is involuntary on the recipient’s part a benefit of any particular value. It would be like someone handing me a magazine I hadn’t asked for, telling me it cost $10, and then demanding payment.
This is a flimsy and unfounded premise on its face.
But even if you don’t believe me, why don’t you believe Nordhaus himself?
http://www.nybooks.com/articles/archives/2012/mar/22/why-global-warming-skeptics-are-wrong/
On this point, I do not need to reconstruct how climate scientists made their projections, or review the persecution of Soviet geneticists. I did the research and wrote the book on which they base their statement. The skeptics’ summary is based on poor analysis and on an incorrect reading of the results.
..
This leads to the second point, which is that the authors summarize my results incorrectly. My research shows that there are indeed substantial net benefits from acting now rather than waiting fifty years. A look at Table 5-1 in my study A Question of Balance (2008) shows that the cost of waiting fifty years to begin reducing CO2 emissions is $2.3 trillion in 2005 prices. If we bring that number to today’s economy and prices, the loss from waiting is $4.1 trillion. Wars have been started over smaller sums.
So.. what’s up with chasing incorrect and disavowed interpretations of Nordhaus?
Bart R,
I don’t understand why you are stumped (other than you have mis-understood what you have quoted from the NYRB).
The Mitigation has a cost and if it avoids climate damages then the climate damages avoided is the benefit. See Table 5-1 (that the extract you quoted refers to) here: http://nordhaus.econ.yale.edu/Balance_2nd_proofs.pdf Notice the column heading for the third and fourth column:
“Present value climate damages”
“Present value abatement costs”
Now go to Table 5-3 (p89). This table shows the change in climate damages for each policy compared with the ‘Baseline” policy (“delay for 250 years”). The difference is the projected climate damages avoided – in other words, the estimated benefit of that policy. The first column is called:
“Benefit (Damages Avoided)”
It’s important to distinguish between the ‘benefit’ and the ‘net benefit’. The ‘net benefit’ is the ‘benefit’ minus the ‘abatement cost’.
What Bjorn Lomborg (and others) are pointing out is that AGW is net beneficial(benefits of AGW are greater than damages) until about 2070, based on the DICE analysis using AR4 data.
My point is that if ECS is lower than the figures in AR4, as now seems likely, then the break-even date will be delayed. Furthermore, if the damage function is less than Nordhaus used, as also seems likely, the break-even date is further delayed (e.g. to perhaps around 2200).
If we assume that the retards who are retarding progress become an endangered species soon, the rate of decarbonisation of the global economy will accelerate, and the problem will be resolved without prescriptive, economically irrational policies.
The real problem facing the world is to trying to educate the retards to stop retarding progress – for the benefit of all humanity. :)
Bart R
Nordhaus evaluates the concept of “winners and losers” resulting from AGW.
He concludes that “winners” outweigh “losers” on average until CO2 concentrations (and temperatures) reach levels projected to be reached by year 2070.
This is based on a projected CO2 level by 2100 of 689 ppmv
And it is based on the “old” model-predicted 2xCO2 ECS used by IPCC of around 3C.
If 2xCO2 ECS is only 2C (instead of 3C) the “breakeven point” between winners and losers would shift by 28 years to 2098.
If 2xCO2 ECS is only 1.5C the “breakeven point” would shift by 59 years to 2128.
Max
Bart R
CO2 is plant food (not a hormone or drug)
Experiments have shown that plants benefit from more food (higher CO2 concentrations) in two ways.
– They grow more rapidly
– They are less dependent on moisture.
This is true for all types of plants, but more so for C3 types (most crops and around 90% of all plants) than for C4 types (most weeds, grasses plus corn and a few minor crop grains)
So the added CO2 is a “win-win” across the board.
We had a 2.4X increase in crop yields from 1970 to 2010, at the same time that CO2 increased by 20%. Coincidence?
But let’s not try to second-guess Nordhaus.
Max
.
Peter Lang | April 12, 2013 at 1:18 am |
Again, no. Lomborg (and others) have it wrong, as Nordhaus explicitly reminds repeatedly and on many occasions.
Not that Nordhaus is perfect either, but by definition the author of a work is certainly its best arbiter of interpretation.
Let’s revisit some of the many assumptions that err:
1. If it isn’t measured by Climate Sensitivity, it isn’t an effect of CO2E. Well, we know that’s utter nonsense. Leaving aside the direct effects on biology of CO2 — a powerful plant hormone affecting drug with even stronger effects on the activites of soil and water microbes — and the slight effects of CO2E on weathering of stone (which ultimately is the vector by which CO2 leaves the biosphere), there’s the thermomechanical effect which in a large complex system accounts for all the energy of the TOA imbalance not expressed in temperature change. Mechanical changes in wind and currents, their length and speed and pressure and height and depth and frequency and on and on take the climate under the influence of CO2 forcing to constantly changing states. Each state change in a complex system if it does not entirely tip the system over will require at least as complex a path to return to initial conditions when the forcing stops. Which means the system will visit new extremes with greater frequency unpredictably.
Predictability is the foundation of not just the insurance industry, but of stable business in general. Who wants to invest in a business that will be made obsolete by the next change in climate? How can weather damage be insured against at all when no PDF is valid to describe its likelihood?
2. Economic benefits are benefits. No. This is a huge gaffe. An economic benefit accrues to an economy, but it is valued not at the apparent prices and monetary amounts associated with it but on the ability of the Market to take advantage of the economic benefits.
3. CO2 is a fertilizer? No. The fertilizer effect of CO2 in open fields is dubious, requires intensive nitrogen fertilization to take advantage of, and even more nitrogen fertilization to counter the damage done to soil by high CO2 levels. This is a benefit in the short run only, and it is shown to fall to the law of diminishing returns within five years, after which it is a heavy liability.
Need we go on?
As computer models go, on premise this one is far more flawed and demands far greater skepticism than any GCM.
Bart R,
This response makes no sense. It is a pile of twaddle.
For one thing, I think you are confusing the trajectory of costs and benefits, which is what this discussion is about, with the net cost and benefit of a given policy accumulated over a period of 500 years. That is what you are referring to. It’s a totally different discussion. And your understanding of that is incorrect too, but I won’t get diverted to that right now. We can take it up later.
Where does that assumption come from. I haven’t a clue what the relevance of this rant has to do with the discussion.
Sorry, Bart R, you seem to be smoking something again.
More irrelevant babble. I suspect you are trying to argue that the values DICE uses for the ‘damage function’ are wrong. If so, what do you suggest the values for the damage function should be and what is the basis for your revised values?
Bart R, I don’t think you have a clue what you are talking about. I think you are preaching your CAGW doomsayer’s dogma.
It’s not a GCM and has a totally different function. Clearly, you know nothing about any of this (even less than me).
Definitely not. Anything more would be just another waste of space.
> This response makes no sense.
Chewbacca is taking a hold on Peter’s soul.
Bart,
“but by definition the author of a work is certainly its best arbiter of interpretation.”
The author is the best arbiter of “his” interpretation. This says nothing about whether his interpretation is correct. That is for the audience to decide.
Peter Lang | April 12, 2013 at 2:13 am |
CAGW doomsayer dogma?
To be dogma, it’d have to be identifiably something someone else has said before, yet it so confuses you that it seems you’ve never heard it before. We know thereby you are throwing around labels you do not understand or do not believe, or are acting confused when you know well enough what is meant. Which it is, I cannot say. If you’re actually confused, I commend the timeworn remedy: read harder.
To be doomsayer, one would needs be a pessimist, and to be making prognostications; I am quite optimistic, and predict nothing.
And I have explained in past here often enough to expect that so diligent a denizen as yourself ought recall, I have no part in CAGW. Catastrophe is a misleading and frankly idiotic term. AGW would suffice, except I’m not all that committed to the W part either. For me, Forcing is enough, and my topic is in the area of Risk and Key Vulnerabilities. So if you must label my concerns acronymically then please use RaKVAGF (Risks and Key Vulnerabilities resulting from Anthropogenic Global Forcing).
Glad we could clear those points up.
Yes, I am saying the inputs to DICE are built on faulty assumptions, and would render it meaningless on that premise alone, were it not already an impossible to validate, impossible to verify, inadequate oversimplification.
And Nordhaus has repeatedly clarified the error of your trajectory proposition: The trajectory is already in the negative and heading further down. To find a time of ‘net benefits’, you would need to start around 1760 and stop by 1960. The current trajectory is not economically aboveground, and becomes more costly to recover from the longer the recovery is delayed.
Bart R,, 2/3 of that comment is avoidance – arguing about what ‘dogma’ means to you. What a waste of space. How silly. How irrelevant.
Your comments about DICE are based on ignorance. Your previous comments revealed you know nothing about it.
I agree the assumptions are academic and are not achievable in the real world. Nordhaus admits that on p68:
Here are some of the assumptions (in my words):
• Negligible leakage (of emissions between countries)
• All emission sources are included (all countries and all emissions in each country)
• Negligible compliance cost
• Negligible fraud
• An optimal carbon price
• The whole world implements the optimal carbon price in unison
• The whole world acts in unison to increase the optimal carbon price periodically
• The whole world continues to maintain the carbon price at the optimal level for all of this century (and thereafter).
If these assumptions are not met, the net benefits estimated by Nordhaus cannot be achieved. As Nordhaus says, p198 :
Moreover, the results here incorporate an estimate of the importance of participation for economic efficiency. Complete participation is important because the cost function for abatement appears to be highly convex. We preliminarily estimate that a participation rate of 50 percent instead of 100 percent will impose a cost penalty on abatement of 250 percent.
In other words, if only 50% of emissions are captured in the carbon pricing scheme, the cost penalty for the participants would be 250%. The 50% participation could be achieved by, for example, 100% of countries participating in the scheme but only 50% of the emissions in total from within the countries are caught, or 50% of countries participate and 100% of the emissions within those countries are caught in the scheme (i.e. taxed or traded).
Given the above, we can see that the assumptions are theoretical and impracticable in the real world.
All carbon pricing schemes will die out. Regional and individual carbon pricing schemes cannot succeed in the absence of a global carbon pricing scheme with a very high level of participation (nearly all countries and all GHG emissions from within all countries). Since this will not happen, there will be no global pricing scheme.
Nor should there be. The damages of carbon pricing would far exceed the benefits. The carbon pricing schemes will make no difference to the climate, but the damages to human well being, world wide, of inflated energy costs would far exceed the benefits (of reduced climate damages). Low cost energy is a huge positive externality that the people concerned only about climate change do not consider when advocating for carbon pricing.
Bart R
The CAGW premise has been summarized quite specifically and succinctly by IPCC in its AR4 report.
It postulates that there will be several negative (and potentially catastrophic) impacts on humanity and our environment as a result of anthropogenic global warming (AGW), unless human GHG emissions are curtailed significantly in the future.
If you’d like more specifics as to what “CAGW” as defined by IPCC in AR4 really means, let me know.
Max
Bart R,
Here is the relevant extract from authoritative economist, Bjorn Lomborg’s article in Monday’s Australian:
Read the whole article here: http://www.icapenergy.com.au/pop.market_news.php?id=2053 or on Climate Etc. here: http://judithcurry.com/2013/04/05/u-s-climate-policy-discussion-thread/#comment-310083
Peter Lang | April 12, 2013 at 6:38 pm |
.. authoritative economist, Bjorn Lomborg’s ..
Uh.. what?
Lomborg’s not an Economist, authoritative or no, by any measure. His ideas do not have the ring of Economic discourse, and his works are littered with what to any Economist would appear elementary errors, where he attempts to speak in economics terms at all.
Lomborg’s training is as a political scientist with a specialization in collectivism; I understand he’s very good at that. Still, while political science may be a social science, calling a political scientist — even a world-class one — an economist is a bit like calling a manicurist — even a world class one — a dentist.
See, if you’d said ‘authoritative Economist, Nigel Lawson’, you’d have a leg to stand on. And while I disagree with Lawson’s economics as overly simplistic and wildly inchoate, he does talk the talk and has walked the walk in economics, as Lomborg never has.
Or Rud Istvan; he’s a Harvard econometrist. That’s sort of in the ballpark. Plus, Istvan’s a brilliant polymath.
But Lomborg is not qualified as an authority in economics; indeed, he’s got a very dubious track record in claims of authority in all sorts of sciences he’s been known to express opinion about, regardless of his powers of self-promotion.
But enough ad hom by me. I prefer to discuss ideas.
Or, in this case, ideals.
Peter Lang | April 12, 2013 at 9:15 pm |
CORRECTION & RETRACTION
I applaud you sir for this small phrase. This embodies the best of scholarship. I am humbled by your example, and would wish to live up to it, as an ideal of scientific scrupple.
You had me fooled. All I’ve seen is avoidance of what is important and twisting some phrase so you can use it as a bridge to rant on about your doomsday dogma and beliefs, with plenty of ad homs thrown in for good measure.
http://www.copenhagenconsensus.com/projects/copenhagen-consensus-2012/participants/expert-panel
Several Nobel Prize winning economists there as opposed to the empty posturing of malcontents.
Lomberg talks sense and is influential.
Jim D
IPCC tells us in AR4 WG1 SPM that NONE of the SRES “storylines and scenarios” assume implementation of mitigation schemes:
Peter Lang
It is hard to tell exactly which “scenario and storyline” Nordhaus/Lomborg are using, but I checked Nordhaus’ estimate of temperature increase for 2105, and it checks with the figure I used, using the IPCC model-based estimate for 2xCO2 ECS..
This was a rough calculation (showing that the shift from an ECS of 3C to 2C gives us roughly 30 more years beyond 2070 to reach equilibrium between positive and negative AGW impact) but so far I have seen no others which refute it.
I hope someone like Jim D try to do so with another approach.
Max
Manacker,
Thank you. I agree with all that.
I agree, it would be great if Jim D and others could tackle the question with another approach.
CORRECTION & RETRACTION
The Nordhaus Yale-DICE (2013) model ‘baseline” scenario does not show warming is net beneficial at any time. It estimates that climate damages exceed benefits of global warming from now on. The Bjorn Lomborg articles I quoted was quoting conclusions from another model to support his statement:
You can see the net damages per 5 years estimated by DICE (2013) for the ‘Baseline” scenario (i.e. ‘no controls’) in the Excel file http://nordhaus.econ.yale.edu/NotesonhowtoruntheDICEmodel.htm, sheet “Base”, row 107:
Peter Lang | April 12, 2013 at 6:16 pm |
Some mistakes go so deep, it takes a while to explain them. Irrelevant or not.
I need know nothing about DICE; it is prima facia incapable of the use to which you put it, deciding when costs overcome benefits. While Lomborg argues for this approach, it is inherently untenable. No economic model can do this. If one could, then the Soviet Union’s managed economy would not have failed.
At best, DICE can be used comparatively. Where Nordhaus says, ..the optimal policy is a benchmark to determine how efficient or inefficient alternative approaches may be. he is indeed giving the most optimistic assessment too of his model’s utility. It is an intrinsic limit on this type of analysis. Any economist ought know that.
Further, Nordhaus makes elementary errors in some of his assumptions, requiring too strict conditions for his model to be operational. That’s fine, an economist can overparameterize his own construction arbitrarily; in academic exercises it does little harm, as everyone already understands the limitations of such models.. who is an economist.
You then compound Nordhaus’ restrictions with misreadings and overreaching, and overlook the potent role of trade sanctions on carbon price poachers. You think any nation with carbon-pricing would have difficulty with the concept of retaliating against cheaters?
Carbon pricing schemes, especially fee-and-dividend revenue-neutral mechanisms based on supply-and-demand price levels with full recycling of collections to citizens per capita, are highly stable. How do we know this?
We know this because this is privatization. Privatization of scarce, administerable, rivalrous, excludable resources is the heart of Capitalism.
I understand why Lomborg’s collectivism recoils in horror at Capitalism. Why do you?
The atmosphere is not rivalrous – there is no practical limit to the ability to contain any amount of CO2 that we could possibly put out in the foreseeable future. My ability to exhale does not inhibit your ability to breath – there is nothing exclusive about the atmosphere at all. What we have instead a Tort claim. A claim of injury of some kind that exists outside of a breach of contract.
The claim of injury from CO2 emissions appears tendentious at the very least. It depends on a chain of unproven assertions – and occurs in the nebulous future. It demands a compensation now for an injury that might or might occur. It is an injury that is moreover entirely avoidable with proper planning and foresight – and something I have discussed many times here.
Proper, pragmatic, multi-objective approaches with properly directed resources would better serve the needs of people than frivolous and fraudulent claims of injury and demands for compensation from quasi criminal conspirators. Properly directing resources for such things is the proper role of government – even if they are rarely very good at it.
It is suggested that if injury occurs from CO2 that it is with a great deal of contributory negligence from pissant progressives.
Bart R
I’d agree with you that any of the studies of economic impact of AGW (Nordhaus, Stern, Lomborg) are too dicey to tell us much of anything.
It is not even certain that AGW will be negative on balance for humanity and our environment rather than positive.
To date we cannot point with any degree of certainty to any negative or positive effects of the GH warming we have seen since the 18th century and we do not even know how much (if any) of the observed warming was caused by human GHGs.
Our hostess has emphasized that there will be “winners and losers” from a slightly warmer Earth.
IF (and that’s a mighty big word) the IPCC CAGW premise as outlined in its AR4 report is correct, we could see warming by 2100 of somewhere between 1.1C to 6.4C.
The lower value would in all likelihood present no problem at all (possibly even a net benefit as Lomborg has postulated).
The upper value could present a major problem.
But the whole premise is so hairy-fairy that it is impossible to put any kind of “price tag” on it.
If Lomborg’s estimate is correct that winners exceed losers up to an added 1.6C of warming above today’s value, which is estimated to occur by 2070 using the IPCC 2xCO2 ECS of 3C, then this “breakeven” point would shift further into the future if 2xCO2 ECS is lower than 3C.
But, as I wrote Peter Lang at the start of this exchange:
Max
Bart R,
As I said earlier, IMO your comments contain nothing worth wasting time discussing. They are just nonsense as far as I am concerned. We have no common ground. This sentence in your long rant of doomsayer dogma is an example:
I’ll leave you to your ideology and beliefs. I haven’t seen anything in your diatribe that suggests a rational discussion could be pursued. And, frankly, I don’t have the patience to argue about what interests you.
Hey, look, I’m sorry if I’ve offended your Lomborg-worshipping religion.
If you have to have a cult, there are more harmful things to put faith in, I suppose.
But if you ever do decide you want to discuss economics, and not just repeat messianic pseudobabble, I’m all for that.
http://www.copenhagenconsensus.com/research
Bart is as rational as always I see.
manacker | April 12, 2013 at 6:17 pm |
A cinnamon heart has much more carnuba wax in it than cinnamon, and is shaped like the mathematical figure known as a cardioid, which does not especially resemble an actual heart.
If I were to go around saying carnuba cardioid, I’d confuse the heck out of people, and even if they understood what I meant, they’d know I was being pedantic.
But if someone started calling cinnamon hearts “poison pills”, it would behoove me to correct them, and carnuba cardioid would be one way to go.
CAGW emphasizes two extremely dull — to me — elements of the discourse. They’re overdone and uninteresting dead ends. Warming is an outcome of Forcing, and Forcing’s the important thing to remember. Warming is just part of the mechanisms that increase risk, impact key vulnerabilities, and, sure, contribute to catastrophe at the extremely thin edge of the wedge. But if we only talk about catastrophe, we don’t account for 99% or more of the monetary impacts, and ideas like Nordhaus’ and Tol’s and Lomborg’s — if they sample only 1% of the costs — are 99% failure. The UK has likely experienced regional seasonal cooling as a result of Forcing. If that’s dismissed — as it is implicitly dismissed in if people only talk about warming, or only about catastrophe when snow-clearing is a real and large non-catastrophic expense — then the conversation misses the point.
So, yeah, regardless of how straw manishly you keep up the CAGW charade, I’ll keep knocking it down. It’s not why I’m here. If it’s the only reason you’re here, then it seems the answer to that is simple. Don’t lay CAGW at my feet, and I won’t stomp all over your invalid risk-and-vulnerability-and-forcing-dodging arguments.
Chief Hydrologist | April 13, 2013 at 1:26 am |
Lomborg talks a lot and is influential.
He’s also skilled at managing an agenda to produce the outcomes he desires. You put a hundred charities together at a dinner and tell them either they march to your tune or get shut out of the list of the top 100 charities, they’ll be marching before the soup course is served. After all, there are 300 other charities lined up outside the door.
Which is an example of being influential.
Doesn’t make him right. Real development economists shudder at his approach. You should talk to some, when Lomborg’s not around.
This rating hardship in order approach doesn’t work. You can’t bail out a sinking boat by bailing just the water from the hole nearest to you.
Chief Hydrologist | April 13, 2013 at 3:52 am |
What you say about the atmosphere being not rivalrous, hydrologists have been saying for years about the Great Barrier Reef.
Want to dump outflows and silt by the bargeload every second? Go ahead, the Great Barrier Reef is so huge it can absorb it all with no practical limits.
And really, it’s too big to exclude every little paddle-boarder from, hydrologists were given to say.
And now we have half the Great Barrier Reef that was there a mere four decades ago, thanks to these failures of hydrology that left the reefs vulnerable to predators and weather that never before dented them in one percent the way they do today.
CO2 takes so long to weather out of the atmosphere that in effect no CO2 emitted today will have its influence removed in the lifetime of its emitters’ children. In this sense, the Carbon Cycle is rivalrous.
Restricting ourselves only to lucrative CO2E emissions — which is all we really need to — we can indeed exclude the vast majority of emission by standards of retail measure on carbon-content of fuel and volatiles. This is so administratively simple, even Australia could manage it. And it has minimal costs to implement anywhere that has a retail tax scheme, piggy-backed on the tax system just like many places piggy-back insurance or garnishment or savings programs.
As for proof of harm? You really haven’t been listening. Capitalism isn’t in place to address harms. It exists to efficiently allocate scarce resources. Which we know no other system does as well.
Bart R
We all know that the availability of a reliable, low-cost energy infrastructure has been a key contributing factor to the high standard of living, quality of life and life expectancy we now enjoy in the industrially developed world.
This has been based largely on the use of fossil fuels.
These have generated CO2, which has been a principal cause for the increase in atmospheric CO2 level since pre-industrial times.
It is postulated, based on known laws of physics, that this added CO2 has been a contributor to the warming we have observed since the modern record started in 1850 (somewhere under 1C to date). The percentage of the past warming attributable to CO2 from fossil fuel combustion is highly disputed, but it is clear that it is well below 1C.
There have been no observed negative effects that can be attributed to the warming we have seen to date. Quite likely, the net impact has been beneficial.
The higher CO2 concentrations themselves have also had no negative effects on human, animal or plant life. It is very likely that the net impact for plants (including human crops) has been beneficial.
So there is absolutely no doubt whatsoever that fossil fuel combustion has been a major boon for humanity to date – without it, we would still be living short, brutal and poverty-stricken lives (as is the case for those unfortunate individuals who currently do not have access to a reliable.
energy supply).
Several large nations (China, India, Brazil, etc.) are now building up their economies as we did in the late 19th and 20thC, thereby improving the quality of life of their populations.
Others are still struggling to do so, but are not quite there yet.
These people will all benefit from having a reliable source of low-cost energy, as we did. And a good part of this energy will be supplied by fossil fuels, as it was for us.
So fossil fuel combustion not only has been beneficial to date, but will also continue to be so in the future, until something else, which is economically competitive, comes along.
However, it is posited by some climatologists (and by the IPCC) that we will at some time in the future reach the point where the impact of added greenhouse warming from added CO2 may become negative for humanity and our environment on balance. Just where this point is and when we will reach it is highly disputed.
That’s a summary of the situation as I can judge it.
Do you see it differently?
If so, how?
Max
The last 2 C degrees of warming we got were a vast boon to mankind and the whole earth’s biome. So will the next 2 degrees C of warming, if we get it, and the history of the Holocene suggests we won’t.
Oh, well, they promised, the wishful old fools.
===================
manacker | April 12, 2013 at 5:53 pm |
No. Nordhaus evaluates the concept of winners and losers_within the model_ only. The model cannot be used to assert actual real world outcomes. It can compare two different approaches and assert based on the behaviors of each compared to the other in the model which one ‘wins’ in a world that behaves like his model. See the difference?
But don’t believe me. Just read Nordhaus. Peter Lang even cites the exact passage where Nordhaus gives this caution.
In other words.. you’re doin’ it wrong.
manacker | April 12, 2013 at 6:08 pm |
CO2 is plant food and hormone-analog both, which makes it a plant drug, like steroids are for Lance Armstrong.
You can make all the assertions you want, but it takes only a little reading on the effects of CO2 on plant physiology to confirm this. Which we’ve been through before repeatedly at Climate Etc.
Under the influence of CO2 up to about 150 ppmv, plants obtain their necessary ‘CO2 food’. They need no more, though many tolerate larger doses before the hormonal influences overwhelm ordinary physiology, causing external plant sexual organs to deform or atrophy, and plant limbs to increase in mass while also becoming brittler and more susceptible to rapid onset of aging.
This isn’t bad for all plants, at least not equally. Weeds love it. But for plants bred for dwarf traits to force more vigor into fruit and seed, it undoes all the good of dwarfism.
Further, while the plants themselves gain mass more rapidly (though not nutrients; specific nitrogen-dependent proteins in particular suffer in most plants), and relatively transpire moisture less, they also gain less benefit of heat regulation through transpiration: their lack of uptake of moisture is a defensive response to reduce acidosis and hormone imbalance, as is reduced stomata concentration.
And soil microbes do not prosper under increased CO2, either; in particular they take up soil nitrates at a far higher rate and express them as NOx’s.
This 2.4x increase in crop yields from 1970 to 2010.. have you not heard of GMOs? Nitrogen fertilizers? A hundred changes in agricultural practices in the same period?
I get that you’re merely repeating Idsoisms.. but really, you should be more skeptical.
Bart R
I think I have addressed many of your points in my post above, but let me respond to the specific points on CO2 and plants.
CO2 (plus water) is the essential plant food. Studies have shown that plants grow better (and need less water) at atmospheric CO2 concentrations, which are higher than the current levels. Many greenhouse operators enhance the CO2 levels for this reason. They obviously would not do this if higher CO2 levels were not beneficial.
C3 plants (~90% of all plants plus most major crop plants except corn) benefit more from higher CO2 concentrations than C4 plants (corn, grasses plus most weeds).
I am aware that higher CO2 levels alone cannot be the sole cause for the sharp 2.4x increase in crop yields from 1970 to 2010, but they were undoubtedly a contributing factor.
Just to clear up some points on the practical implications of higher CO2 levels on plant growth.
Max
Manacker, Chief and anyone else reading Bart R’s writings, as I am sure you all ready know, he tries to pretend he understands Nordhaus’s work and models and is competent to critique them and say they are wrong. Bart R would like readers to believe he is knowledgeable on the economics and cost-benefits of AGW but he hasn’t a clue what he is talking about. He quotes bits of passages but his comments show he has next to no understanding of the context.
For anyone interested, here is a recent slide presentation by Nordhaus which explains important points about his work, from his perspective.
http://nordhaus.econ.yale.edu/documents/Prague_June2012_v4_color.pdf
And just to give my perspective, I welcome the modelling Nordhaus has done. It is clearly better than the work by Sir Nicholas Stern, Ross Garnaut and the Australian Treasury for example. Importantly it is accessible so we can discuss it. I use his results and take account of the assumptions. I do not blindly accept all his conclusions. The main benefits of using his modelling is that it is readily accessible, well explained for the non-specialist and, importantly, it is a communication bridge to the CAGW believers. With out something like this that both sides of the debate can discusss, it is almost impossible to even start a conversation about rational economics with a CAGW believer.
Peter Lang
I’ll hold my opinion until I get a response from Bart to my latest comment, but it appears that he also has some screwy ideas about the impact of higher CO2 concentrations on plant growth.
“Steroids”?
Ouch!
Max
A bridge to nowhere. It is quite clear that higher CO2 is good for the earth and its biome. Warmer temperatures will increase the carrying capacity of the earth for all life, and they will sustain greater diversity of life. All else is details, which will vary spatially.
======================
Peter Lang | April 13, 2013 at 5:10 am |
All models are wrong. Some are merely useful.
While Nordhaus’ model is very wrong, the use he commends it to may be useful within constraints.
You want to model a world with a CS of 1 vs a world with a CS of 2, DICE allows you to do that. You can see if, based on the Nordhaus assumptions — which are very, very wrong, but do not in the sense of picking winners and losers within the model automatically invalidate it — resultant flows are better on balance for case 1 vs case 2. You can’t however compare either case 1 or case 2 to anything outside the model, for example the real world.
You can’t use the model outputs to estimate actual climate sensitivity by rerunning the model over and over to find the most ‘real world like’ results and interpolating the CS in the model as representative of actual CS.
This Lomborgian proposition is the planned economy fallacy, that any tool or machine or panel of experts or politburro can outguess the Market. It is not a matter of ideology, but a mathematically obvious outcome validated by actual history. Although Nordhaus builds the tool Lomborg abuses to these ends, Nordhaus at every turn counsels against it in the strongest terms.
This is not about Bart R. You don’t see credentials listed in my Denizens entry or attached after my name; I’m not claiming authority or special knowledge. This is about the ideas themselves, which you just have completely wrong. If you continue as you are, you will only confuse people with little background or time to learn and understand for themselves and discredit yourself among people who have background and understanding.
Cost-benefit analysis is a wonderful precept. A great tool. But it is a specific tool for a specific job. When all you have is a hammer, everything looks like a nail. You cannot drive valid CS results through a plank with CBA. Cost-benefit analysis is invalid for understanding real economies holistically. Why? Simple:
1. Costs at optimal efficiency are determined by the law of supply and demand; using CBA to justify changes to the economy begs the question and returns an inherently inefficient allocation.
2. Benefits are incommensurable; what is a billion dollar benefit for some or one may be worthless to another, or a liability. Snow in May? Great for skiiers, lousy for farmers, unless they’re hoping for snowpack to ameliorate the drought conditions, but then it could be even worse for them if they’re in a location prone to flooding. See? No model can adequately express the benefit of any one outcome as a single figure.
With both costs and benefits invalid as used in the Nordhaus model, we see CBA fails.
The Stern Review is also easily accessible:
http://webarchive.nationalarchives.gov.uk/+/http:/www.hm-treasury.gov.uk/sternreview_index.htm
Oh, please, Stern is stupid propaganda. Was he deliberately stupid?
==========
manacker | April 13, 2013 at 5:15 am |
CO2 (plus water) is the essential plant food.
True, but oversimplified, and irrelevant.
Why irrelevant? Because the baseline level for plant starvation of CO2 is 150 ppmv, which level the atmosphere rarely descends to (except in the case of complete uptake by dense populations of plants in still air under optimal *conditions of peak sunlight, temperature, moisture and nitrogen availability.
These conditions never last long enough to damage plants (as they respond by torpor until the wind blows, CO2 levels again rise or the sunlight fades) and are rare and localized enough otherwise to call nonexistent in Nature.
By the principal of Liebig’s Law of the Minimum, CO2 food is practically never in Nature exhausted or fully exploited, not even during times in the distant past where CO2 levels fell as low as 180 ppmv globally (though glaciation did have a negative effect at those times on plant growth). This has been discussed previously at Climate Etc. at great length between late February and early December 2011.
Studies have shown that plants grow better (and need less water) at atmospheric CO2 concentrations, which are higher than the current levels.
This is nuanced; “better” connotes a value judgement.
Have you never wondered what specific mechanism makes CO2 ppmv (compared to Nitrogen parts per hundred or phosphate parts per thousand) so efficient at causing these drastic plant changes?
It’s because CO2 in tiny amounts affects the two major plant hormone groups responsible for size. In this way, it’s like a plant steroid, and its users are leafy Lance Armstrongs.
Between 150-1200 ppmv (sometimes more), the majority of plants with some notable exceptions put on additional limb mass, generally expressed as leggier stalks and branches, due mainly the effect of CO2 altering the influence and activity of auxins.
This can result in larger leaves, and even in some cases larger fruit, but in general also deforms plant sexual organs, makes structures more brittle, suppresses rooting and promotes early browning and wilting while depleting nitrogen-related proteins.
In any single species this response may vary widely, and no one has yet done an encyclopedic study of more than a few plants for these effects.
Also, “need less water” means only uptake of water is measurably lowered.
This is because plants reduce transpiration to reduce CO2 uptake when the CO2 level is too high.
As transpiration brings other nutrients into the plant (and moderates plant temperature in the same way as breathing and sweating do in animals), this cannot be considered a benefit.
If plants run out of water, they’ll “need less water” as a result, too.
All plants get the full ‘benefits’ of CO2 by about 1200 ppmv (it’s semi-logarithmic, so 90% of the ‘benefits’ express at ~600 ppmv and 80% by 300 ppmv, etc. depending on the plant and conditions).
This has been discussed previously at Climate Etc. at great length (example: http://judithcurry.com/2011/08/20/a-modest-proposal-for-reforestation/#comment-102977).
Many greenhouse operators enhance the CO2 levels for this reason. They obviously would not do this if higher CO2 levels were not beneficial.
In a greenhouse, Liebig’s law of the minimum doesn’t apply: greenhouse growers fertilize and water and warm and light their plants to peak. They find lower root mass attractive to prevent plants from becoming pot-bound.
And greenhouse growers could counterintuitively achieve exactly the same effect by merely cycling fresh air through their greenhouses even if the air has as little as 180 ppmv!
How does this happen?
Refer back to the rare natural conditions* where dense plant populations can deplete still air of CO2; this isn’t a rare incident in greenhouses, but commonplace as they provide all these conditions.
Pumping CO2 into a greenhouse doesn’t feed or fertilize the plants, it prevents their starvation while prompting (when in massive doses) hormone changes that make their limbs bolt and forces their growth out of the roots.
If they’re really dishonest, greenhouse growers can keep dwarf plants in two greenhouses, starving the one of CO2 below 150 ppmv and suppressing the dwarf trait in the other with CO2 above 500 ppmv, and claim wonders for CO2 ‘food’.
This has been discussed previously at Climate Etc. at great length. But you know this, you were there and have had over a year to avail yourself of the studies and reports cited to refute — which you have never done, so we must conclude you have no refutation for this information.
C3 plants (~90% of all plants plus most major crop plants except corn) benefit more from higher CO2 concentrations than C4 plants (corn, grasses plus most weeds).
See, this is misleading. Some major crop plants are C3; some are C4; as is true of weeds. Half of all ocean plant life is C4. Whether C3 is damaged more relative than C4 or vice versa, there will be global harm to a substantial sector of agriculture and the biome as a whole. Even if there were ‘pure benefit’ in some sense — which we know to not be anything like the actual case — the differences in benefits would lead one group of plants to edge out the other, and we don’t generally expect such shifts to favor beneficial plants.
Moreover, soil microbes are necessary for all plant life to thrive in the wilderness, and increasing CO2 levels turns formerly equilibrated nitrogen soil levels into gradual soil depletion rapidly; it takes no more than five years for soils to become markedly depleted of nitrogen with a mere 5% increase in CO2.
I am aware that higher CO2 levels alone cannot be the sole cause for the sharp 2.4x increase in crop yields from 1970 to 2010, but they were undoubtedly a contributing factor.
This is simply false.
There is, considering the huge uncertainties and limited study, substantial reason do doubt this claim in the 1970-2010 period (a change from 325 ppmv to 390 ppmv at Mauna Loa). Certainly, no greenhouse could produce anything like such actual benefits under controlled conditions for this 65 ppmv change where it never allowed the CO2 level to fall below 325 ppmv.
manacker | April 13, 2013 at 5:00 am |
We all know that the availability of a reliable, low-cost energy infrastructure has been a key contributing factor to the high standard of living, quality of life and life expectancy we now enjoy in the industrially developed world.
Do we know this? Is it true?
I call it an assumption, a marketing slogan, not a true claim.
‘Reliable’ is slipped in by some as a jab against renewables for their differential availability; it’s never been shown to be a requirement of a high standard of living at all, so far as you’ve established.
Go ahead, find me a proof of causation between ‘reliable’ energy and life expectancy, or standard of living, or quality of life.
I say there isn’t such a proof because there isn’t such a relationship.
‘Low-cost’? What the heck does that mean?
Well, in careful examination of most ‘low-cost’ claims, we find it actually means ‘state subsidized’.
In other words, “high cost” — as the state must extract from taxpayers by threat of force of law part of the consumer’s budget of monetary decision power to allocate by collective determination on a few favored beneficiaries, and this process is itself more costly than the Free Market.
And even where direct subsidies are expunged, indirect subsidies — the building of the infrastructure by the state borne on the taxpayers’ shoulders, the hiding of costs by failure to enforce standards of measures for all resources used, such as by expropriating land or giving away commonly held lands at fire-sale prices, or failure to price the carbon cycle — also distort the democracy of the Market and favor Free Riders.
And ‘key contributing factor’ is just a weasel worded handwave. Either this ‘availability’ does something, or it doesn’t. What exactly do you mean it does, specifically? How, exactly?
Leave slogans and propaganda to marketers and propagandists. . . and figure out that if they sloganeer and propagandize, they’re Lomborg.
Speaking of indirect subsidies and Lomborgian propagandists:
http://www.miningwatch.ca/mining-industry-criticism-looking-beneath-surface-assessment-value-public-support-metal-mining-indus
I note that this bizarre “Fan” creature (“Fan of Malicious Discourse”) already has SEVEN gassy, useless, non-substantive comments, all whining about some hobby horse of his but not addressing the content of the Nic Lewis post. The abuses of FOMD against reason and civility are even more notable for the hypocrisy that he pretends to be a “Fan” of reason and civility.
Skiphil,
To this date and hour, I note 68 comments in this thread.
How many do you count that would not qualify as gassy, useless, non-substantive and off topic?
Many thanks!
you have a point.
I’ll refrain from commenting about fan, as it is fairly obvious I think he’s an annoying little girl.
There’s an unwritten internet law waiting to be named for those occasions when a single poster has >10% of the comments made on a thread, and a corollary when <10% of those are on topic. Some here manage both regularly.
redcords,
Indeed, and I’m going to defy all Internet conventions and reply to your comment by paying due diligence to Skilphi’s hasty generalization. Here’s a synopsis of the 10 comments Fan made so far:
A comment about collegiality and the relevance of posting what Nic Lewis seems to consider being **negative publicity**:
http://judithcurry.com/2013/04/10/the-forest-2006-climate-sensitivity-study-and-misprocessing-of-data-an-update/#comment-310975
A comment in response to Sunshine’s irrelevant **tu quoque**:
http://judithcurry.com/2013/04/10/the-forest-2006-climate-sensitivity-study-and-misprocessing-of-data-an-update/#comment-310979
A comment amounting to an admonition of **negative publicity**, a practice Fan deplores:
http://judithcurry.com/2013/04/10/the-forest-2006-climate-sensitivity-study-and-misprocessing-of-data-an-update/#comment-310994
A comment reminding of Willard Tony’s mishap when he hurried to create **negative publicity**:
http://judithcurry.com/2013/04/10/the-forest-2006-climate-sensitivity-study-and-misprocessing-of-data-an-update/#comment-311006
A comment reminding of James Hansen’s collegiality:
http://judithcurry.com/2013/04/10/the-forest-2006-climate-sensitivity-study-and-misprocessing-of-data-an-update/#comment-311031
A comment distinguishing between being right and being collegial in the practice of creating **negative publicity**:
http://judithcurry.com/2013/04/10/the-forest-2006-climate-sensitivity-study-and-misprocessing-of-data-an-update/#comment-311036
A comment arguing that **negative publicity** can be a waste time:
http://judithcurry.com/2013/04/10/the-forest-2006-climate-sensitivity-study-and-misprocessing-of-data-an-update/#comment-311039
A comment hinting at the fact that there exists public venues to settle scientific issues outside the usual **negative publicity** circus:
http://judithcurry.com/2013/04/10/the-forest-2006-climate-sensitivity-study-and-misprocessing-of-data-an-update/#comment-311059
A comment arguing for the relevance of mentioning these public venues regarding the topic of collegiality and **negative publicity**:
http://judithcurry.com/2013/04/10/the-forest-2006-climate-sensitivity-study-and-misprocessing-of-data-an-update/#comment-311107
A comment linking to a previous comment:
http://judithcurry.com/2013/04/10/the-forest-2006-climate-sensitivity-study-and-misprocessing-of-data-an-update/#comment-311108
***
It might be a bit premature to invoke a cousin of Pareto’s law in Fan’s case.
Nic Lewis will have a tough time reconciling the practice of **negative publicity** and collegiality. He could claim politeness, but even then this could deserve due diligence. This is basically a PR venture.
INTEGRITY ™ — Appearance is Everything.
redcords,
Indeed, and I’m going to defy all Internet conventions and reply to your comment by paying due diligence to Skilphi’s hasty generalization. Here’s a synopsis of the 10 comments Fan made so far:
http://neverendingaudit.tumblr.com/post/47779078878
(Sorry I need to post it somewhere else for administrative reason.)
I conclude from my audit that it might be a bit premature to invoke a cousin of Pareto’s law in Fan’s case.
Nic Lewis will have a tough time reconciling the practice of negative publicity and collegiality. He could claim politeness, but even then this could deserve due diligence. This is basically a PR venture.
INTEGRITY ™ — Appearance is Everything.
Willard, whatever one thinks of the merits of the debates about collegiality and/or “negative publicity” that is all OT.
I happen to think that “Fan” is wildly mistaken in how he characterizes the output of Nic Lewis (not to mention his countless slurs against others over many threads), but on this thread that Fan’s comments (and therefore defenses or criticisms thereof) are clearly OT.
fwiw, Fan’s comment about Hansen links not some substantiation of Hansen’s asserted collegiality, but merely a list of papers. Oh they are open access, great and I applaud that, but publishing some open access scientific papers is hardly a comprehensive exhibition that someone (anyone) exhibits a high level of collegiality in all relevant aspects. Yet another of Fan’s links which prove to be (at best) of limited relevance to a matter that is itself OT.
Willard
Your last long-winded comment to redcords regarding Fan’s silly remarks about Nic Lewis only go to confirm how stupid Fan’s remarks really were in the first place.
Is that what you were trying to achieve?
If so, it worked.
Max
Skiphil,
Thank you for your comment.
You say:
> [W]hatever one thinks of the merits of the debates about collegiality and/or “negative publicity” that is all OT.
I disagree. Here’s Nic himself:
The subtext of the overall op-ed is quite clear. See for instance the last sentence:
> This case provides a useful illustration of the importance of archiving computer code as well as data – without both being available, none of the errors in F06′s processing of its data would have come to light.
However legitimate the fight for code and data might be, it is an end that comes with means, means that were discussed in Nic’s op-ed. Questioning these means plays the ball where it lands. Therefore, your claim that this is OT has no merit.
***
I could remind you that you’re trying an old Auditor’s trick here, but I’ll wait until you put better tricks on the table. Collegiality would be one. There are others.
Due diligence,
w
The Hahditor hikes his hems, Mann & Nucitelli bail the boat. Temperature’s rising, well, the water is anyway.
===================
Nic
Thanks for showing transparently the process you have undertaken. It shows that even with utmost goodwill on all sides, scholarship and diligence, it can take years to bring forward points of contention, resolve discrepancies and discuss issues.
So far as I can tell, there’s still very far to go on this, and already the world of science in many ways is passing this issue by. It may be obsolete before it is ever resolved.
Also, thanks for the admission in the first line of paragraph 11 that your guess “a)” was off base and completely wrong. It helps in the process when old errors are acknowledged by their authors and can be disposed of.
And hey, isn’t it great that you anticipated Dr. Forest’s archiving of his materials with your requests to GRL, even though they turned out to be completely redundant? Devotion to transparency in reporting is second in my mind only to balanced retelling of events exactly as they actually happened without wild guesses, surmises without foundation, or bloated self-congratulation.
Speaking of balance, I look forward to your review, with equal vigor, of those papers claiming lower climate sensitivity.. Could you provide links and references? I know the Vaughn Pratt CS article posted at Climate Etc. gave a value of 2.85, so I expect it doesn’t qualify for your list. Myself, when I did some comparisons using spreadsheets to ballpark, based on the same data WfT uses, found values centering on the range 3-5, dominated by values near 3, to be credible. And of course, if the Pliocene CO2 and temperature reconstructions are to be credited, a much higher CS is plausible too. I’m interested how did you resolve these issues for yourself?
Again, thanks for your efforts. You and Tony, Vaughn, Rud, and other denizen contributors are a tribute to Judith’s blog’s wide appeal and zeal for entering the amateur climate debate.
Crickets.
willard (@nevaudit) | April 12, 2013 at 9:35 am |
Nic must be really busy, and my questions to him did come a bit lower in the thread than some. I’m sure he’ll respond as soon as he has the time.
After all, he’s still working on questions on a single aspect of a paper he read two years ago, so we can’t expect speedy attention to everyone.
I suggest you follow FOMD rulz.
dont do this stuff in public.
maybe Nic should post a FAQ? isnt that the new etiquette?
Bart R,
If Nic ever gets your attention and decide that a FAQ would be the best way to respond to criticism, could you please remind him of that comment from James?
Here it is:
http://julesandjames.blogspot.ca/2013/02/a-sensitive-matter.html
Somehow, I think that:
> I’m not sure that “adjusted” is the best description of what I did regarding aerosol forcing.
and
> I agree that would have been a useful addition to my work.
http://julesandjames.blogspot.ca/2013/02/a-sensitive-matter.html?showComment=1359752369736
would deserve due diligence.
***
With the hope that Nic won’t consider James’ comments as negative publicity,
Have a good week-end,
w
PS: Your latest comment about Baseball Jim’s trickery was a gem, btw.
Dubious doubts, high wire act flouts.
===========
Proper etiquette would dictate that James and others restrict their comments to the peer review system
http://journals.ametsoc.org/doi/pdf/10.1175/JCLI-D-12-00473.1
Jules and James’ rules of blogging and twittering for scientists:
http://judithcurry.com/2013/04/10/the-forest-2006-climate-sensitivity-study-and-misprocessing-of-data-an-update/#comment-312511
See also:
http://neverendingaudit.tumblr.com/post/48071757685
bart
‘Speaking of balance, I look forward to your review, with equal vigor, of those papers claiming lower climate sensitivity.. Could you provide links and references? I know the Vaughn Pratt CS article posted at Climate Etc. gave a value of 2.85, so I expect it doesn’t qualify for your list. Myself, when I did some comparisons using spreadsheets to ballpark, based on the same data WfT uses, found values centering on the range 3-5, dominated by values near 3, to be credible. And of course, if the Pliocene CO2 and temperature reconstructions are to be credited, a much higher CS is plausible too. I’m interested how did you resolve these issues for yourself?”
Interesting definition of balance. are you willing to hold yourself to that standard and everyone else to that standard?
Steven,
I’m guessing these guys are hoping you run out of bullets. They apparently haven’t figured out how to keep their heads down.
Maybe they should consult with Dr. Mann. He’s the (self) acknowledged expert in trench warfare.
I get a value close to 3C per doubling of CO2 based on using land temperatures, which track the transient levels more closely. It will be a few more years before that estimate can be strengthened with more substantiated data. It will also take a few more years to weaken that estimate if trends reverse.
http://theoilconundrum.blogspot.com has the details.
Steven Mosher | April 12, 2013 at 11:53 am |
Interesting definition of balance. are you willing to hold yourself to that standard and everyone else to that standard?
I’m open to new and better definitions of balance.
And, as it’s clear balance for me remains a work in process, I’m open to pointers and observations, clarifications, advise, dissent, or whatever else about my ideas or remarks; it’s a standing invitation implicit in posting online.
If you do run out of bullets (unsettling how Cold Dead Hand timg56’s figures of speech run to; it’s like Jim Carrey’s in the same room), feel free to borrow some of mine. I’ve left plenty of live ammo lying around, and ordinance will go astray.
Here, a show of good faith:
http://www.amazon.com/BIC-Cristal-1-0mm-Black-MSLP16-Blk/dp/B004F9QBE6
That should keep willard busy reading customer reviews for long enough that you can point out any imbalances, and we can talk like civilized people. And if not that, perhaps this:
LANCELOT: (To GUENEVERE) I am honored to be among you, Your Majesty. And allow me to pledge to Her Majesty my eternal dedication to this
inspired cause.
GUENEVERE: (Slightly startled) Thank you, Milord. (To ARTHUR) How charming of you to join us, Arthur. This afternoon
..
LANCELOT: This splendid dream must be made a universal reality!
GUENEVERE: Oh, absolutely. It really must. Can you stay for lunch, Arthur?
We’re planning..
LANCELOT: I have assured His Majesty that he may call upon me at any time
to perform any deed, no matter the risk.
GUENEVERE: Thank you, Milord. That’s most comforting. Arthur, we have..
LANCELOT: I am always on duty.
GUENEVERE: Yes, I can see that. Can you stay, Arthur?
ARTHUR: With pleasure, my love. I want you to hear the new plan we’ve been discussing. Explain it, Lancelot.
LANCELOT: To Her Majesty, Sire? Would Her Majesty not find the complicated affairs of chivalry rather tedious?
GUENEVERE: Not at all, Milord. I have never found chivalry
tedious .. so far. May I remind you, Milord, that the Round Table happens to
be my husband’s idea.
LANCELOT: Any idea, however exalted, could be improved.
GUENEVERE: Really!
LANCELOT: Yes. I have suggested to His Majesty that we create a training program for knights.
ARTHUR: Marvelous idea, isn’t it?
GUENEVERE: A training program!?
ARTHUR: Yes. It’s a program for training.
LANCELOT: Yes, Your Majesty. There must be a standard
established, an unattainable goal that, with work, becomes attainable; not only in arms, but in thought. An indoctrination of noble Christian principle.
GUENEVERE: Whose abilities would serve as the standard, Milord?
LANCELOT: Certainly not mine, Your Majesty. It would not be fair.
GUENEVERE: Not fair in what way?
LANCELOT: I would never ask anyone to live by my standards, Your Majesty. To dedicate your life to the tortured quest for perfection in body and spirit. Oh, no, I would not ask that of anyone.
GUENEVERE: Nor would I. Have you achieved perfection, Milord?
LANCELOT: Physically, yes, Your Majesty. But the refining of the soul is an endless struggle.
GUENEVERE: I daresay. I do daresay. Do you mean you’ve never been defeated in battle or in tournament?
LANCELOT: Never, Your Majesty.
GUENEVERE: I see. And I gather you consider it highly unlikely ever to happen in the future?
LANCELOT: Highly, Your Majesty.
ARTHUR: How was the Channel? Did you have a rough
crossing?
GUENEVERE: Now tell me a little of your straggle for the perfection of the
spirit.
ARTHUR: But I want you to hear about the training program, Jenny.
GUENEVERE: I’m much more interested in his spirit and his noble Christian principles. Tell me, Milord, have you come to grips with humility lately?
LANCELOT: Humility, Your Majesty?
B’guess and b’golly
We’re near to the lolly.
==============
Webby
Looks to me like there have been a few independent studies recently, which all point to a 2xCO2 ECS of around half the mean value cited by IPCC in AR4 of ~3C.
These are all ESTIMATES, of course, but at least they are based on actual temperature CO2 observations rather than simply model simulations, with assumptions/estimates for natural forcing/variability and for the “hidden in the pipeline” portion.
The problem remains the large uncertainties in these estimated values.
Max
Bart,
A rational adult believes a firearm is nothing more than a tool. Not some scary boogyman.
Speaking of tools, perhaps you should talk to my youngest brother, a former prosecutor responsible for violent crime cases (county & federal) about the number of homicides involving a hammer. Puts the number involving an “assualt rifle” to shame. Of course, we are told climate change is killing 300,000 people a year. What’s a few thousand here or there from other causes worth worrying about.
timg56 | April 15, 2013 at 12:15 pm |
Perhaps you ought to speak to your younger brother about the difference in difficulty in prosecuting homicide by hammer and homicide by firearm. The justice system is roughly three times more successful at catching and convicting most other perpetrators as compared to those using firearms. Even with advances in forensics, as the rate of firearm homicide has risen the rate of unresolved cases has spiked.
And that must be some hammer – the rate of all blunt object murders in the USA fell between 2007 and 2011 from 647 to 496 while firearms claimed seventeen times as many in each year; between accidents and suicide quite a number of firearm deaths happened in 2011. (About half – almost 20,000 — of all suicide, over 850 firearm accidents, and two thirds – or ~11,000-11,500 in 2011 — of all assault deaths are due firearms.) There were 32,163 non-fatal firearm injuries in the USA in 2011.
What cherry pick you mean by ‘assault rifle’, I really don’t care. I know; I just don’t find it relevant. The cost to taxpayers of making it easier for criminals to mock the criminal justice system is what matters, and firearms shield criminals from prosecution far better than any other tool. Anyone in the justice system could tell you if you’re planning to murder someone and hope to get away with it, use a gun.
See, I’m not scared of your tool. I’m sure it’s very manly, and quite attractive, and no doubt fully functional. I’m simply speculating whether you’re growing confused about what the topic at hand is, or when to use a keyboard, and when to use a trigger.
http://www.fbi.gov/about-us/cjis/ucr/crime-in-the-u.s/2011/crime-in-the-u.s.-2011/tables/expanded-homicide-data-table-8
The topic is climate, etc.
Bart
“Interesting definition of balance. are you willing to hold yourself to that standard and everyone else to that standard?
I’m open to new and better definitions of balance.”
######################
That was not my question. You seem to employ a definition of balance
That requires Nic to investigate with equal vigor papers that have
low estimates for climate sensitivity. In other words, you think to be balanced one must investigate papers that have high estimates and low estimates with equal vigor. I am asking if that is your definition of balance?
Next, I will ask you if you can trust people unless they demonstrate balance?
Willard
Will you ever take what he publishes in trusted peer review seriously? Or is that some peer review you choose to ignore?
Would you take Nic seriously if james co authored? what would it take?
Steven Mosher | April 16, 2013 at 12:42 pm |
Call yourself a Black Hat Marketer?
I’m encouraging people with similar beliefs the chance to chat up in public forum all their various arguments with each other — what more friendly audience than an echo chamber? — while paying proportionally less attention to the viewpoints they’re trying to bury in obfuscation.
Look at the http://judithcurry.com/2013/04/17/meta-uncertainty-in-the-determination-of-climate-sensitivity/ topic and how much good it’s doing by exactly the balanced approach I promoted.
Speaking of James:
http://julesandjames.blogspot.ca/2013/04/egu-review-part-2.html
James does not mention the case of personal blogs that may attract negative publicity.
I’ll ask him about that.
The Quaternary climate changes are a result of interecations in a complex system in which CO2 levels are a feedback and not a driver. The major feedback involved albedo as ocean and atmospheric patterns change.
Even in the modern era attribution is fraught with complexities as emergent climate behaviour – internal reorganisation of climate that is separate from the idea of forcing – drives many of the changes we have seen.
Suppose that the climate system had three stable states.
There are a couple of possibilities.
The source of the mechanical analogy is the NAS report – Abrupt climate change: inevitable surprises.
Sensitivity here is dependant on an internal reorganisation of the system. Where the ball is balanced between finely between the two arms – a breath either way will push it over the edge. This is a bifurcation.
The result is a minor breath – a mere pulse of a butterfly – and the system shifts. The system is exquisitely sensitive at the point where it is balanced. .
Is there likely to be a climate shift anytime soon? It appears to be so if all these cycles turn out to be chaotic bifurcation – sudden shifts in a multiply coupled, non-linear, dynamical chaotic system.
Of course – if you hit the balance hard enough the ball may just roll off the table and under the sofa to plot with dust mites and mouldy potato crisps the entire overthrow of the household. You roll the dice and take your chances.
Peter Lang wrote:
“Is the PDF, e.g. in Figure 1, the PDF of F06’s estimates of ECS, or the PDF of the real world ECS? ”
You are of course right in thinking that the PDF is for F06’s estimate of ECS. The horizontal axis title matches that in F06 itself and in AR4 WG1 Figure 9.20 in not saying “estimated”, which I think is correct. However, it would have been better if in the title I had made explicit that this was an estimated climate sensitivity PDF – as all PDFs for physical parameters must inevitably be.
Nic Lewis,
‘Thank you for clarifying. I wasn’t meaning to criticise the wording in your figure. I think the distinction is not trivial. I think some people interpret the ECS PDF’s as the distribution of the ECS in nature. For example the ECS would vary from when there is a large areal extent of ice on ther planet to when there is none. Many other things would influence the actual value of ECS, even under conditions as exist now. But that is not what these PDF’s are showing. The PDFs are showing the distribution of the outputs from the analyses, models, scenarios, assumptions, etc. These are very different.
Importantly, we do not have a PDF of climate sensitivity for the Earth in the conditions that exist now, nor for any conditions.
Thanks Nic for identifying and correcting these errors. Such PDFs are typically used with the Weitzman Dismal Theorem to argue for making very high payments now to avoid future “fat-tailed” risks of catastrophes. However, Ross McKitrick found and corrected a major approximation in Weitzman’s work. See:
Ross McKitrick Cheering Up the Dismal Theorem 2012, Discussion Paper 2012-05, University of Guelph
Combining Lewis and McKitrick’s corrections with a realistically lower climate sensitivity, shows climate catastrophe alarms to be to unjustifiable and reality suggests change will likely not be that large, and that adaptation is likely much more cost effective than mitigation.
A PDF like that shown by Forest is a mix of epistemic and aleatory uncertainty, and only has to obey the mathematical identity that the integral under the curve sums to unity.
If they made a mistake in the scaling, no big deal, as it is the relative probabilities that matter on first glance.
As shown it tells us that the most likely sensitivity is 3C per doubling of CO2 and some likelihood for higher values due to positive feedbacks.
The actuarial sciences do this kind of analysis every day.
I wouldn’t be interested in pursuing the analysis myself if there wasn’t some uncertainty. It wouldn’t be a challenging scientific puzzle.
Nic shows the peak reducing to ” 2.4°C”.
There are also reports showing lower climate sensitivity. e.g.,
Sherwood Idso, CO2-induced global warming: a skeptic’s view of potential climate change, Climate Research Vol. 10, 69-82, 1998
The IPCC ignoring much lower climate estimates does not make them go away.
Using an quasi-actuarial like “analysis”, I think I’ve got ECS nailed down to somewhere between 1C and 10C. My best guess on TCR, however, is about 1.5C, give or take a bit.
https://sites.google.com/site/climateadj/simple-model-of-models
The notion of a climate sensitivity makes no scientific sense and the arguments about it are somewhat sterile and irrelevant. Some areas of the world will warm and some parts will cool. It says nothing of the impact on life in these areas, and IMHO it is a meaningless term designed for political purposes. It says nothing about how my sheep will be affected in Yorkshire (we had a good lambing despite the unseasonably cold weather). Back to lurking.
@Steven Mosher | April 11, 2013 at 9:14 pm
Steve, you say:
“To measure speed you measure distance and time.
To measure sensitivity you measure temperature and forcing”.
I’ve been measuring the time taken to travel various distances in my car and I keep getting different numbers. I think something must be affecting my average speed. Different traffic conditions perhaps.
But when you measure temperature and forcing you get the same constant value for temperature change per unit forcing every time, do you not? You have shown beyond question climate sensitivity to be invariant, I know. Why do people keep querying this important finding?
Cheers, simon
Mosher is making up his own definition of sensitivity.
http://www.ipcc.ch/publications_and_data/ar4/wg1/en/ch8s8-6-2.html
As defined in previous assessments (Cubasch et al., 2001) and in the
Steven substitutes “forcing” for CO2. This allows him to use an exceedingly unreliable measure of total power in at TOA minus total power out at TOA. This is the current fashion as it allows all kinds of numbers games to be played in the “forcing” estimate which is so close to zero that not even the sign of it is reliable.
I on the other hand use the IPCC definition of surface temperature response to change in atmosphere CO2.
We have exceedingly accurate measures of both atmospheric CO2 and global average lower troposphere temperature. The problem for AGW apologists like Mosher is that they don’t like the results obtained using these reliable measures. They liked it until about the year 2000. Since then they’ve been forced to abandon it because:
http://judithcurry.com/2013/04/10/the-forest-2006-climate-sensitivity-study-and-misprocessing-of-data-an-update/#comment-311140
Follow your cite to the source.
Sensitivity is change in C divided by change in forcing.
Springer selective quoting
‘6.2 Forcing-Response Relationship
6.2.1 Characteristics
As discussed in the SAR, the change in the net irradiance at the tropopause, as defined in Section 6.1.1, is, to a first order, a good indicator of the equilibrium global mean (understood to be globally and annually averaged) surface temperature change. The climate sensitivity parameter (global mean surface temperature response Ts to the radiative forcing F) is defined as:
Ts / F = (6.1)
(Dickinson, 1982; WMO, 1986; Cess et al., 1993). Equation (6.1) is defined for the transition of the surface-troposphere system from one equilibrium state to another in response to an externally imposed radiative perturbation. In the one-dimensional radiative-convective models, wherein the concept was first initiated, is a nearly invariant parameter (typically, about 0.5 K/(Wm-2); Ramanathan et al., 1985) for a variety of radiative forcings, thus introducing the notion of a possible universality of the relationship between forcing and response. It is this feature which has enabled the radiative forcing to be perceived as a useful tool for obtaining first-order estimates of the relative climate impacts of different imposed radiative perturbations.”
or wikipedia which dave might get
“Climate sensitivity is a measure of how responsive the temperature of the climate system is to a change in the radiative forcing.
Although climate sensitivity is usually used in the context of radiative forcing by carbon dioxide (CO2), it is thought of as a general property of the climate system: the change in surface air temperature (ΔTs) following a unit change in radiative forcing (RF), and thus is expressed in units of °C/(W/m2). For this to be useful, the measure must be independent of the nature of the forcing (e.g. from greenhouse gases or solar variation); to first order this is indeed found to be so[citation needed].”
Which part of this from IPCC AR4 did you not understand, Steven?
http://www.ipcc.ch/publications_and_data/ar4/wg1/en/ch8s8-6-2.html
I can’t see how they can be much clearer when they have a subchapter heading DEFINITION OF CLIMATE SENSITIVITY then proceed to define it in the very next sentence.
Do you really think your long-winded bs trying to deny what is plainly written is fooling anyone? Amazing.
Meh, moshe’s measurement is a poor estimate. See definitions, or whoopee, make up your own.
===================
“Mosher is making up his own definition of sensitivity.”
And his own definition of “measure.”
Andrew
The next paragraph from Big Dave’s citation begins with:
http://www.ipcc.ch/publications_and_data/ar4/wg1/en/ch8s8-6-2.html
David,
The definition you are using is a narrower version of the same definition Mosher uses. Climate sensitivity ultimately is a systems measurement of the climate that is brought about by forcings, one of which is due to radiative effect of CO2. You could have a value for CS that would represent all GHG forcings, that would include individual CS’s from CH4, N2O, etc… That would add to a total CS of all GHG’s. The general mechanism of the forcing is the same for them all, re-radiated energy. Mosher represents CS in its more basic and universal definition, you are looking at just CO2, which is a frequently used version of the definition and is more akin to calling all copiers ‘Xerox’ or all nose tissues ‘Kleenex’.
david,
You need to follow the cites from Ar4 back to Ar3.
Or read some history
What is the difference between
Climate sensitivity and the sensitivity to doubling ( ECS ) and the transient response.
Sensitivity:
Delta T = lambda DeltaF
Sensitivity to doubling C02
Doubling C02 = 5.35ln(560/280 ) ~ 3.7Watts
Delta T = lambda * 3.71
Lambda is the sensitivity. think of it as a gain.
if lambda = .5
Then
Sensitivity to doubling = 0.5 * 3.7 = 1.85
Dont confuse lambda ( sensitivity ) with the sensitivity to doubling.
AR4 supercedes AR3, Mosher.
Carpenter and Mosher: I quoted the defintion for climate sensitivity given in the latest report (AR4) from the Intergovernmental Panel on Climate Change.
It is what it is. It’s in writing and it’s plain as day. You boys don’t like it. I get it. But your not liking it doesn’t change what the frickin’ document says. Grow up and move on.
I dont suppose that anyone is interested, but CE allows me to record my thoughts on climate sensitivity. When I use the abbreviation CS, I mean the climate sensitivity, however defined, of CO2 added to the atmosphere from current levels. If anyone wants to use my thoughts, they are welcome; I use my own name, and I am proud of what I write. Here is what I believe, from just simple physics.
1. CS has never been measured. This means it has no measured value, and no accuracy of meaasurement.
2. CS is much more likely to be positive than negative.
3. There must be an upper limit to the value of CS. Reductio ad absurdum, no-one is suggesting that the doubling CO2 causes global temperatures to rise by 1,000,000 C.
4. It makes sense to use such little empirical data as we have, to estimate what the upper limit fo CS is.
5. No-one has measured a CO2 signal in any modern temperature/time graph, against the background of natural noise. Hence there is a strong indication that the value of CS is indistinguishable from zero.
6. Any number that anyone ascribes to CS is little more than a SWAG (Scientific Wild Arsed Guess).
Of course it’s been measured, Jim. CO2 in ppm is measured by Mauna Loa Observatory. Lower troposphere temperature is measured by satellite. With these two measurements one can produce a temperature response to CO2. I did so here:
http://judithcurry.com/2013/04/10/the-forest-2006-climate-sensitivity-study-and-misprocessing-of-data-an-update/#comment-311140
It’s not that it can’t or isn’t measured it’s that the CAGW apologists don’t like the result.
“It’s not that it can’t or isn’t measured”
David Springer,
Not measured. Calculated.
Andrew
Technically yes, it’s calculated. We measure change in CO2 (deltaCO2). We measure change in temperature (deltaTEMP). We calculate sensitivity by the formula deltaCO2/deltaTEMP.
Since the calculation is a single division operation on measured values there’s little room for error in the calculation. Please explain why such a direct calculation should not be called a measured value except for the case of silly semantic games to obfuscate a simple measured sensitivity response.
“Technically yes, it’s calculated.”
David Springer,
Its my belief that science is concerned with technicalities. Perhaps you have a different belief.
Andrew
Climate sensitivity is calculated based on computer output of CO2 forcing, not observed CO2 forcing. There is no experimental values of CO2 forcing in the first place, it is fiction.
David, you write “It’s not that it can’t or isn’t measured it’s that the CAGW apologists don’t like the result.”
As I have pointed out over and over again, it is theoretically possible to measure CS; it is just that we dont have the technology to do it. In any measurement in physics, it is essential to prove that any change in the value of the dependent variable – global temperature – is actually caused by the change in the independent variable – amount of exta CO2 in the atmosphere. We cannot prove cause and effect between CO2 and tempatature. That is why we cannot measure CS in the real world.
Jim,
If we have been unable to measure the climate sensitivity in more than 30 years, then it does not exist. We have instruments that can measure minute infrared radiations from the universe. We have all the technology needed to measure the alleged CO2 forcing and temperature change required to calculate climate sensitivity. Unfortunately, we have been chasing a ghost for over 30 years at an estimated cost to us of about $2.0 billions annually. I think enough is enough, it is time for a change.
Nabil, you write “I think enough is enough, it is time for a change.”
Unfortunately, as I wrote to Latimer, we cannot change yet. There is too much history that we must deal with first. The IPCC in the SPMs of the AR 4 to WG1, claim high probabilities that certain things with respect to CAGW are true; figures of >90% and >95% probability. These are in the literature, and unless they are removed, they can be used as references to claim that CAGW is an issue.
The fact that CAGW has not, and cannot be measured is carefully omitted from the IPCC discussions. This is a major omission on their part, and makes the figures of >90% and >95% at least doubtful, if not actually fraudulent. So if it is true that CS cannot be measured, then it is essential that we have a thorough discussion of whether the IPCC claims of high probabilities in the SPMs are justified.
And we cannot enter into this discussion with the warmists unless and until they agree that CS has not been measured. As I noted before, this is a classi Catch 22 situation.
David: “We measure change in CO2 (deltaCO2). We measure change in temperature (deltaTEMP). We calculate sensitivity by the formula deltaCO2/deltaTEMP.
Since the calculation is a single division operation on measured values there’s little room for error in the calculation. ”
It seems to me that if only CO2 had changed during that time period, you’d be correct. Or if all other significant variables were white noise which cancels out over that time.
I can calculate my sensitivity to environmental allergens, but if I’m not controlling for my intake of food allergens, among other factors, my sensitivity calculation will have much more uncertainty than I calculate.
Here is one for Cripwell. I have accurately quantified the mean quasi-adiabatic lapse rate for the Earth as well as for Mars, Venus, and the sun
http://theoilconundrum.blogspot.co.uk/2013/03/standard-atmosphere-model-and.html
This is straightforward scientific analysis using fundamental thermodynamic principles applied to climate science.
I ask that if this can be accomplished, why can’t a climate sensitivity be measured?
Beyond that, would anyone argue that climate science is not the most fun and challenging subject to study?
This conversation is amazing. Climate denier against climate denier. One claims CS is measured and is too small. Another claims CS hasn’t been measured. Another claims the concept of CS doesn’t exist.
Scramblin around like rats on the SS denial
lolwot
To correct your last comment.
2xCO2 ECS has NOT been measured.
It has been ESTIMATED based on model predictions (IPCC AR4) and, more recently, based on actual observations of temperature and CO2 change over the modern record, with ESTIMATES for the warming (forcing/variability) caused by natural factors.
Even though the more recent estimates are partially based on observations (as opposed to earlier AR4 estimates, which are not), they still are ESTIMATES.
Got it?
Max
“Beyond that, would anyone argue that climate science is not the most fun and challenging subject to study?”
I think someone said the science is already settled. ♫ Boring ♫
Andrew
David Springer
We MEASURE:
– Change in CO2
– Change in temperature
Then we ESIMATE the effect of natural forcing/variability over the period to ESTIMATE the CO2/temperature response.
Then we ESTIMATE the amount of forcing that is “still in the pipeline” in order to ESTIMATE the 2xCO2 ECS.
Lots of ESTIMATING there, David, and not much MEASURING.
Max
Webby
You make a calculation based on theoretical physics and then ask Jim Cripwell why 2xCO2 ECS cannot be measured”?
Let’s go through this step-by-step.
First of all, it HASN’T been measured to date.
It has been ESIMATED.
A few years ago, IPCC AR4 represented the latest ESTIMATE; this was a mean value of ~3C, and was based on model predictions.
More recently we have a few independent studies, which point to a lower level of 1.5 to 2C. These are also based on ESTIMATES, but they incorporate ACTUAL MEASUREMENTS of CO2 and temperature with ESTIMATED values for natural forcing and variability, so are a bit closer to reality than the old IPCC AR4 ESTIMATES.
Why can 2xCO2 ECS not be measured?
It possibly could be, in some sort of controlled environment simulating our atmosphere (like the Svensmark hypothesis will be tested at CERN), but it seems that this would be very complex and costly.
IMO there should be a strong effort to do just that, in order to settle once and for all what the 2xCO2 ECS really is.
But no one is proposing it as far as I can see.
Are you aware of any proposals to do so?
Max
svensmark is going to MEASURE how much global temperature increase by in response to cosmic rays?
lolwot
Nope.
Svensmark isn’t going to measure anything.
The CLOUD experiment at CERN has already established that the cloud nucleation mechanism proposed by Svensmark et al. (by cosmic rays) works in the presence of certain naturally occurring aerosols under reproducible experimental conditions.
So, just as for greenhouse warming, we have an experimentally validated mechanism.
What has NOT yet been established is the magnitude of the impact of either of these experimentally validated mechanisms.
CERN plans to do more physical experiments under controlled conditions simulating our atmosphere in order to either corroborate and quantify the impact of this mechanism or falsify it as a significant driver of our climate.
My point to Webby was that it would be a very good thing if something similar could be designed and implemented to experimentally corroborate and quantify the greenhouse impact on our climate. But so far I see no sign of something like this being proposed. Do you?
Max
“CERN plans to do more physical experiments under controlled conditions simulating our atmosphere in order to”
They aren’t simulating our atmosphere. There are 1001 things in our atmosphere that cannot and will not be simulated at CERN.
Wayne2
re; CO2 not isolated
According to the IPCC definition climate sensitivity is a change in temperature over change in CO2. Over the past 15 years CO2 rose about 10% and temperature rose not at all. Sensitivity is therefore measured at zero. If you think there’s something masking the measured sensitivity for this period that’s another story but it doesn’t change the story I just gave which is as factual as factual gets in science. Deal with it.
lolwot
CERN have not yet performed step 2 of the CLOUD experiment, but have only indicated very roughly what it will entail.
You have no notion what they plan to do and how, so how can you already second-guess their results?
These guys are not yo-yos, lolwot.
Max
“You have no notion what they plan to do and how, so how can you already second-guess their results?”
I can 100% confidently state they will not be simulating the atmosphere.
It cannot be done. A small scale model of the atmosphere will not suffice. There are large scale processes that exist in the atmosphere that cannot be reproduced on small scales.
The behavior of the atmosphere is also strongly coupled to processes in the ocean and on the land. So they’d have to simulate the ocean and land perfectly too.
It cannot be done. Unless they are planning to build a duplicate Earth out in space, which of course I am confident they won’t be doing.
You are going to have to accept that according to your own criteria the work of Svensmark will be testing non-Earth conditions. Ie garbage-in, garbage-out.
Heh, testing real mixtures of real gases instead of testing statistical mixtures of imaginary models.
===============
David Springer’s assertion is 100% correct!
In this regard, the free-as-in-freedom survey by Rasmus E. Benestad, Validating a physics-based back-of-the-envelope climate model with state-of-the-art data (arXiv:1301.1146, 2013), is heartily commended to all Climate Etc readers!
Conclusion Satellite measurements and thermodynamical analyses continue to jointly affirm, through 2013, the broad observational and theoretical correctness of Jim Hansen’s 1981 climate-change scientific worldview.
What is your next question, Jim Cripwell and Dave Springer?
Fanny
You are wrong (as usual).
(See my comment #311301 to david springer for why this is so.)
Max
lolwot,@7.51pm re CERN, admits complexity in climate,
‘things that cannot be simulated.’ Say, lolwot, do yer not
have similar reservations about climate models, you know,
… by climate modellers in cloud towers whiling away the
tenured hours? Hmmm, what’s the difference between
‘ whiles’ and ‘ wiles?’ )
A serf.
The difference Beth is that computer simulations include a hell of a lot more necessary processes on in the Earth’s climate necessary to simulate it. A cloud chamber does not.
A cloud chamber doesn’t even simulate land-ocean-atmosphere interactions. There is no jet stream in a cloud chamber. It doesn’t even actually simulate the processes that go on in the formation and life-cycle of clouds in the actual atmosphere.
I can accept Svensmark’s CERN work for what it is. An understanding of how certain processes are affected by cosmic rays in a controlled non-atmosphere-like environment. A controlled environment that doesn’t mirror the actual atmosphere, only elements of it.
Such results are only any use if you plug them into a climate model afterwards.
So they are much like the experiments which pass infrared radiation through a glass tube filled partially with CO2 to measure how much of the radiation gets absorbed.
But in and of themselves they are not going to “measure” the impact of cosmic rays on global temperature.
For consistency those climate skeptics who claim warming from CO2 cannot be measured and moan about how the science is a waste of time should be accusing Svensmark of fraud for wasting money on an activity which cannot, according to these skeptics, bear any meaningful scientific results.
But of course they won’t accuse Svensmark of fraud, because they are hypocrites.
Jim you would do better to stick to the definitions
Sensitivity:
DeltaT = lambda * DeltaF
lambda is sensitivity. If you increase the WATTS ( say the sun ) then
you will increase the Temperature. Delta T = lambda * Delta F
So, if lambda ( sensitivity ) = 1, then increasing the watts by 1
will get you a 1 C increase in temperature.
That’s sensitivity. It cannot be zero.
NEXT.
sensitivity to DOUBLING C02.
doubling C02 gives you 3.7 more watts
if lambda = 1, then
Delta C = 1 * 3.7 = 3.7C for doubling C02.
You must not confuse two things:
sensitivity ( lambda)
and
sensitivity to DOUBLING ( lambda * watts per doubling)
Keep those two things clear and separate..
Given the quality of their output, maybe climate scientists should be awarded a degree of MBA instead of an outmoded Dr.
Curious George
Climatologists go through this learning progression:
BS (we all know what that means)
MS (More of Same)
PhD (Piled higher and deeper)
Max
Isn’t it odd that Nic doesn’t mention this paper in his post, or provide a title, or mention the journal/publication date, or provide Climate Etc readers with any access to its content (not even an abstract)? What might be the rationale for these (very unusual) scientific choices, do you think Steven Mosher?
The contrast with Jim Hansen’s exemplary scientific openness, good manners, and collegiality is quite striking, don’t you think Steven Mosher?
Please take a common-sense lesson in openness and collegial reciprocity, Steven Mosher (and Nicholas Lewis, Rud Istvan, pokerguy, Peter Lang, David Young, Peter Davies, etc.)!
Fan,
Nic sent me his paper to review prior to the Ar5 deadline. Last I checked the paper was discussed in Ar5 and referenced as accepted. ( JoC) but I dont have the publication date. If you are a ar5 reviewer please request it through the TSU.
There are many reasons why Nic would not mention his paper. In my personal interactions with him he strikes me as a humble guy.
I do know this. he requested that the journal follow its own damn rules.
They didnt. its too bad Forest gets a small bruise because of their lack of decorum. . you should have a beef with GRL. take it up with them. They are putting the planet at risk by giving fodder to skeptics.
instead, you take it out on a guy who is too humble to mention his own publications. Instead you take it out on a guy who brings good news to our grand children and children.. with a lower sensitivity we dont have to choose between short term adaptation to help our children and long term mitigation to help our grand children. Nic does a great moral service to the planet and you complain that he farted.
That level of quasi-“humility” is scientifically dysfunctional, isn’t it Steven Mosher?
Well, Fan if you have another explanation why he would not mention his own publications I am all ears. While you enthrall us with your mind reading and motive seeking consider this and perhaps why people dont listen to you
http://www.reuters.com/article/2013/04/12/us-patients-fat-doctors-idUSBRE93B0S820130412
For me, I only have the facts I know to construct an explanation. tell me, from your personal dealings with Nic how would you describe his character. If you are going to destroy polity by attacking him at least have the decency to tell us about your personal involvement with him.
blockquote>Steven Mosher asks “If you have another explanation why [Nicholas Lewis] would not mention his own publications I am all ears.”It’s by no means too late for Nicholas Lewis to do so, eh Steven Mosher?
Rasmus Benestad’s above-mentioned pre-print Validating a physics-based back-of-the-envelope climate model with state-of-the-art data (arXiv:1301.1146, 2013) is a terrific role-model for Nicholas Lewis!
Fan, that is kind of an interesting paper to link. Since CO2 does have a radiant impact and since increased thermal energy tends to increase tropospheric over turning (that is an effective increase the the mean lapse rate), internal redistribution of energy would cause an imbalanced change, increase of decrease in atmospheric turnover. Kinda like the increase in north hemisphere SSW events and arctic sea ice decline while the southern hemisphere SSW grow milder and SH sea ice extent increases.
I didn’t realize you where a fan of higher natural variability impacts and lower climate sensitivity the atmospheric forcing. Back of the Envelope,a CO2e doubling has a 0.8 to 1.2 C surface impact where that surface is at sea level.
FOMD.
you’ve expressed doubt about Nics humility. On what basis? the planet is at stake. its a simple question.
i humbly submit, scheissolabo,
He don’t no can shinola know.
========
You are 100% correct CaptDallas! Supposing that the warming rate of 0.12–0.18 C/decade continues
• for one decade, then stops
the warming is lost-in-noise.
• for one century, then stops
the climate effects are livable.
• for one millennium, then stops
planetary-scale CAGW with a vengeance.
How long does it take the ice-caps to melt, and the ocean depths to warm, so that the effects of AGW are fully realized?
That time-scale is nearer to a millennium, than to a decade, eh CaptDallas?
Politicians and economists conceive that 20 years is a long time popes and poets and farmers conceive that 1000 years is a short time.
That’s the common-sense reason why time-scales matter, CaptDallas!
Fan, Time scales are important. A complex system with the heat capacity of a planet can make excursions of a large variety of time scales. Today’s climate is “unprecedented” for the past 160 years. Our instrumental record is so short you have to squint see that the southern hemisphere oceans where warmer in 1860s and slowly provided the energy to allow the NH to recover from the last little Ice Age. When you compare instrumental rapid response variations to 150 plus year smoothed paleo, you kind of lose sight of the important time scales.
Heck fan, you might even leap to false conclusions.
Millennial time-scales definitely are sobering, as we all appreciate, eh Captain?
Fan, millennial time scales may be sobering to you, but what’s time to a planet? The precessional cycle, that red haired step child of orbital forcing, is approximately 21,000 years, based on that cycle, 58.33 years is a day in the life of a planet, 1750 years is a month.
The deep ocean temperature lags the sea surface temperature by a precessional month. Bond events have an irregular timing of about a precessional month. The AMO and PDO are precessional daily events. The current rate of ocean heat uptake looks to be on a precessional weekly schedule. Right now, we are in the ocean precessional summer, then we will hit fall in about in a couple of precessional months.
“The dominant forcing factor appears to be precessional insolation; Northern Hemisphere summer insolation correlates to at least the early to middle Holocene climate trend. Spectral analysis reveals centennial-scale cyclic climate changes with periods of 1220, 1070, 400, and 150 yr. The record shows good correlation to East Antarctic ice cores and to climate records from South Georgia and Bunger Oasis. However, the record shows out-of-phase behavior with regard to climate records from the western Antarctic Peninsula and the Peru-Chile Current; such behavior hints at a climatic divide through Patagonia, the Drake Passage, and between West and East Antarctica.”
ftp://ftp.ncdc.noaa.gov/pub/data/paleo/contributions_by_author/nielsen2004/nielsen2004.txt
Pretty sobering
http://journals.ametsoc.org/doi/abs/10.1175/JCLI-D-12-00473.1
a new post on sensitivity (incl nic’s paper) is coming hopefully later today
Thanks Judith
C’mon, c’mon, c’mon. Nic counters Zeke’s critique and someone else points out that the number can only go lower if the sun gets into the act.
==============
That was Durango12. Nice discussion at the Bish’s, too.
==========
‘State-of-the-art reanalyses further imply increases in the overturning in the troposphere, consistent with a constant and continuous vertical energy flow. The association between these aspects can be interpreted as an entanglement between greenhouse effect and the hydrological cycle, where reduced energy transfer associated with increased opacity is compensated by tropospheric overturning activity.’
I don’t think FOMBS reads anything he links to. Gee whiz – this is central to Springers theory of climate – and certainly this is one of the compensating energy pathways as the system tends to move towards energy equilibrium at TOA.
The question however is how the warming from CO2 can be disentangled from the very many other processes to determine the quantum of warming caused by CO2 and therefore the sensitivity. The problem is still attribution. How to disentangle natural from anthropogenic warming when natural variability is uncertain and the modes of influence of anthropogenic CO2 on natural variability are uncertain.
‘The underlying net anthropogenic warming rate in the industrial era is found to have been steady since 1910 at 0.07–0.08 °C/decade, with superimposed AMO-related ups and downs that included the early 20th century warming, the cooling of the 1960s and 1970s, the accelerated warming of the 1980s and 1990s, and the recent slowing of the warming
rates.’ http://depts.washington.edu/amath/research/articles/Tung/journals/Tung_and_Zhou_2013_PNAS.pdf
The problem is still a lack of knowledge about fundamental aspects of the system – epistemic uncertainty as the webster might say when he wants to use a big word. Aleatory uncertainty doesn’t exist however – true randomness is not a property of climate – everything has a cause if we only knew.
If one cant disentangle multiple processes – sensitivity to one variable is moot.
The models are a different proposition.
‘Finally, Lorenz’s theory of the atmosphere (and ocean) as a chaotic system raises fundamental, but unanswered questions about how much the uncertainties in climate-change projections can be reduced. In 1969, Lorenz [30] wrote: ‘Perhaps we can visualize the day when all of the relevant physical principles will be perfectly known. It may then still not be possible to express these principles as mathematical equations which can be solved by digital computers. We may believe, for example, that the motion of the unsaturated portion of the atmosphere is governed by the Navier–Stokes equations, but to use these equations properly we should have to describe each turbulent eddy—a task far beyond the capacity of the largest computer. We must therefore express the pertinent statistical properties of turbulent eddies as functions of the larger-scale motions. We do not yet know how to do this, nor have we proven that the desired functions exist’. Thirty years later, this problem remains unsolved, and may possibly be unsolvable.’
http://rsta.royalsocietypublishing.org/content/369/1956/4751.full
There are still some fundamental mathematical breakthroughs to be made before a deterministic solution is possible. A true probabilistic solution depends on hundreds or thousands of model runs and new ways of interpreting the statistics of models,
‘The most we can expect to achieve is the prediction of the probability distribution of the system’s future possible states by the generation of ensembles of model solutions. This reduces climate change to the discernment of significant differences in the statistics of such ensembles. The generation of such model ensembles will require the dedication of greatly increased computer resources and the application of new methods of model diagnosis. Addressing adequately the statistical nature of climate is computationally intensive, but such statistical information is essential.’ TAR 14.2.2.2
The realisation of true probabilistic forecasts is still some time away. Current PGF are based on interpretation of the spread of opportunistic ensembles each member of which is chosen from an unknown range of solutions based on ‘a posteriori solution behavior’. http://www.pnas.org/content/104/21/8709.long
‘Uncertainty in climate-change projections3 has traditionally been assessed using multi-model ensembles of the type shown in figure 9, essentially an ‘ensemble of opportunity’. The strength of this approach is that each model differs substantially in its structural assumptions and each has been extensively tested. The credibility of its projection is derived from evaluation of its simulation of the current climate against a wide range of observations. However, there are also significant limitations to this approach. The ensemble has not been designed to test the range of possible outcomes. Its size is too small (typically 10–20 members) to give robust estimates of the most likely changes and associated uncertainties and therefore it is hard to use in risk assessments. ‘ Slingo and Palmer 2011 op cit
‘In each of these model–ensemble comparison studies, there are important but difficult questions: How well selected are the models for their plausibility? How much of the ensemble spread is reducible by further model improvements? How well can the spread can be explained by analysis of model differences? How much is irreducible imprecision in an AOS?
Simplistically, despite the opportunistic assemblage of the various AOS model ensembles, we can view the spreads in their results as upper bounds on their irreducible imprecision. Optimistically, we might think this upper bound is a substantial overestimate because AOS models are evolving and improving. Pessimistically, we can worry that the ensembles contain insufficient samples of possible plausible models, so the spreads may underestimate the true level of irreducible imprecision (cf., ref. 23). Realistically, we do not yet know how to make this assessment with confidence.’ McWilliams 2007 op cit
Confidence is the key word. In the face of overwhelming complexity and much epistemic uncertainty – realistically any confidence may be misplaced. In the context of abrupt climate change the future may indeed be surprising. Pragmatically any risk of unwelcome outcomes can be mitigated by moving to reduce anthropogenic impacts on global systems – an I include systems more widely than mere temperature – in practical ways that allow for maximum growth of economies.
Maximum growth of economies is perhaps the major sticking point on which we will never agree with the modern brand of pissant progressives. Such is life – as we say in Australian folklore.
LOL … read the simple reply above, C.H.!
Do you think I should take you at all seriously? Many serious issues raised and you focus a paper that you have linked to that talks about greenhouse gases and latent heat compensating – not I think the message you intended. I don’t think you read to the end of my admittedly long comment.
Confidence is the key word. In the face of overwhelming complexity and much epistemic uncertainty – realistically any confidence may be misplaced. In the context of abrupt climate change the future may indeed be surprising. Pragmatically any risk of unwelcome outcomes can be mitigated by moving to reduce anthropogenic impacts on global systems – and I include systems more widely than mere temperature – in practical ways that allow for maximum growth of economies.
Your lack of any serious intent or depth of understanding is monumental.
I should say …distract from a paper…
Chief, it will take Paleo and one kick butt ocean model to disentangle things to the satisfaction of most.
https://lh5.googleusercontent.com/-xq9JZHck064/UWh3AVlj6_I/AAAAAAAAHwk/ZzqlXPuCTWk/s912/average.jpg
That is long term instrumental averaged like paleo should be, from now and working back. The Average of those is almost exactly the Average of the southern hemisphere oceans exactly like it should be. Land is amplified by a factor of two, exactly like it should be. The roughly 150 year pseudo-cycle is nearly exactly like the Toggweiler et al. model said it should be.
These guys are chasing phantoms.
A Gordian knot awaiting an Alexander.
The sun gleams off Bob’s new drawn vortex blade. Snicker, snicker.
==================
Chief Hydrologist | April 12, 2013 at 4:34 pm | Reply
‘State-of-the-art reanalyses further imply increases in the overturning in the troposphere, consistent with a constant and continuous vertical energy flow. The association between these aspects can be interpreted as an entanglement between greenhouse effect and the hydrological cycle, where reduced energy transfer associated with increased opacity is compensated by tropospheric overturning activity.’
I don’t think FOMBS reads anything he links to. Gee whiz – this is central to Springers theory of climate – and certainly this is one of the compensating energy pathways as the system tends to move towards energy equilibrium at TOA.
———————————————————————————–
All reliable observations are central to Springer’s climate theory and are in perfect accord with it. Better measures of global average lapse rate and cloud height are coming out exactly as I predict. What I’ve been telling you will eventually be in Introduction to Climate Science 101 textbooks. Mark my words.
Latent heat is just one energy pathway and one that has already been discovered.
Clouds are rising or falling? http://www.sciencedaily.com/releases/2012/02/120222114358.htm
You need to look at the coupled system.
“These are the same difficulties as every metric in science faces, more or less, when science chooses to examine global means. And it’s true that in some cases the idea of a global mean is absurd: what is the average sex of a person; what is the average language of the globe; what is the mean religious belief of humanity?”
I have been hearing this argument — “global mean is absurd” — multiple times from climate scientists the last few weeks. Some comments:
1. This is the metric that climate science was happy to use from 1990 to 1998 when it seemed to validate their hypothesis and forecasts.
2. Now that is has been flat for 15 years, it seems climate science wishes to move the goalposts.
3. Any meteorological or climatological verification system must adhere to a measurement methodology regardless of whether the results seem favorable or unfavorable if the verification system is to have any integrity.
it hasn’t been flat for 15 years
That deaf, dumb and blind lolwot, sure plays a mean flat tilt.
===================
Mike, global mean is not absurd, only global mean is absurd. It is a complex system that requires numerous, “metrics” be compared.
Non-linear times series analysis is a bit like reading tea leaves. You can’t just read a tea leaf.
http://www.goertzel.org/dynapsyc/1999/NonlinearTimeSeriesAnalysis.html
Lolwot: See: http://www.woodfortrees.org/plot/hadcrut3vsh/from:1990 You are right, the general trend is for lower temperatures.
looks likes it’s going up to me
http://www.woodfortrees.org/plot/gistemp-dts/from:1990
Lolwot: Here are the four most commonly used temperature metrics rolled into one: http://www.woodfortrees.org/plot/wti/from:1990
Lolwot et al.,
Quick question.
Longest term average we have – Earth’s creation to present time –
Has the temperature of the Earth (you choose the definition, keep it reasonable, please) –
a) Risen
b) Fallen
c) Stayed the same
I believe it has fallen, and I can adduce measurements to support this proposition.
Now your turn. What’s your answer? And no, it’s not a trick question.
Live well and prosper.
Mike Flynn
Earth’s temperature has certainly been falling for the past 50 million years, and 10 million years and 1 million years and 10,000 years. In fact, it has only been in a clod house phase, as we are now in three times, in the past half billion years. There has been no ice at either pole for 75% of that time. We are certainly in a cold period and the trends look like we are getting colder. It really strains credulity to suggest the world risks catastrophic climate change from warming when we are in such a cold period.
Certainly fallen from when Earth was a molten ball of rock and before the formation of the crust.and the oceans. The sun is also cooling and so is everything else in the expanding universe since the very beginning.
This process is called entrophy and it is expected to continue until the universe reaches the gravitational limit of expansion and commences to contract again to a pinpoint, then next big bang and the whole process starts again.
Meanwhile humans are emitting so much CO2 into into the atmosphere that 21st century global temperature will be driven and dictated by human activity, not nature.
Fasten on a figure for climate sensitivity that frightens you, then calculate how much colder the earth would be now without anthropogenic effect in the past.
==================
Mike Smith, again you are linking to a graph showing a time period with rising temperature. That should be clear at a quick glance, but you can see the rise better by fitting an OLS line.
‘It is well known that Australia displays marked climate variability ranging from long and destructive droughts to sudden and pervading flooding, interspersed with severe life and property threatening bushfires. Therefore, in order to minimise the impacts on the social and economic security and well-being of Australians, the quantification and understanding of climatological and hydrological variability is of considerable importance for properly estimating the risk of climate related emergencies (e.g. floods, bushfires) occurring in an upcoming season or year. At present, risk estimation methods are largely empirical in that observed histories It is well known that Australia displays marked climate variability ranging from long and destructive droughts to sudden and pervading flooding, interspersed with severe life and property threatening bushfires. Therefore, in order to minimise the impacts on the social and economic security and well-being of Australians, the quantification and understanding of climatological and hydrological variability is of considerable importance for properly estimating the risk of climate related emergencies (e.g. floods, bushfires) occurring in an upcoming season or year. At present, risk estimation methods are largely empirical in that observed histories of climate extremes are analysed under the assumption that the chance of an extreme event occurring is the same from one year to the next (Franks and Kuczera, 2002). Traditionally, physical climatological mechanisms that actually deliver climate extremes have not been taken into account.
Despite the development of rigorous frameworks to assess the uncertainty of risk estimates, these techniques have not previously acknowledged the possibility of distinct periods of elevated or reduced risk. However, recent research has highlighted the existence of multi-decadal epochs of enhanced/reduced flood risk across NSW (Franks, 2002a, b; Franks and Kuczera, 2002; Kiem et al., 2003). In particular, Franks and Kuczera (2002) demonstrated that a major shift in flood frequency (from low to high) occurred around 1945. Previous authors have noted that the mid-1940’s also corresponded to a change in both sea surface temperature anomalies as well as atmospheric circulation patterns (Allan et al., 1995), suggesting large-scale ocean-atmospheric circulation patterns are linked to the Australian climate.’ http://www.em.gov.au/Documents/Climate%20variability%20in%20the%20land%20of%20fire%20and%20flooding%20rain.pdf
The rainfall patterns were ‘discovered’ in the 1980’s by a couple of fluvial geomorphologists from the University of Newcastle – at which both Daniele Verdon and Anthony Kiems work. They are part of a group formed around Stewart Franks who developed the idea. The link to ocean patterns was made possible by the description of the PDO by Steven Hare – who was chasing fisheries patterns in North America – in 1996.
Rainfall means vary considerably over multi decadal periods – so it is a non-stationary times series. The US has some of the same influences but is influenced by the Arctic as we are by the Antarctic.
http://s1114.photobucket.com/user/Chief_Hydrologist/media/USdrought_zps2629bb8c.jpg.html?sort=3&o=9
Fisheries, rainfall, global temperature and these patterns of global ocean and atmospheric variability share a temporal signature and the question as always is what drives it.
‘The work presented here is consistent with the interpretation of a recently reported effect [25] of solar variability on the North Atlantic Oscillation (NAO) and European winter temperatures over the interval 1659–2010 in terms of top-down modulation of the blocking phenomenon [52, 53]. ‘ http://iopscience.iop.org/1748-9326/5/3/034008/fulltext/
You can be assured that Australian scientists are hard at work understanding equivalent processes in the SH.
http://www.youtube.com/watch?v=wUwHIzbNHBE
It was the penguins what done it.
The first para contains duplications Chief but I understand the point that climate never repeats itself due to it being like any other natural phenomenon that are subject to periodic chaotic disturbances that causes sudden shifts in trend lines.
Double pasting – sorry.
Ergodic – ‘pertaining to the condition that, in an interval of sufficient duration, a system will return to states that are closely similar to previous ones: the basis of statistical methods used in modern dynamics and atomic theory.’
There are many states but we are assuming that the system is ergodic and the state space topology therefore stable. A non-ergodic system is a bit scary.
‘The fruits of AOS are the many forms of intrinsic variability that spontaneously arise through instability of directly forced circulations and have important feedbacks on large-scale, low-frequency fields. Their varieties include coherent atmospheric storms and oceanic eddies, gravitational and rotational waves emitted in internal adjustments, turbulent transports between different locations, and cascades of variance and energy across the space–time spectrum that effect the mixing and dissipation essential for evolution toward balance with the forcing. An AOS can provide reliable realizations for idealized processes. AOS solutions expose structural and dynamical relations among different measurable quantities. They yield space–time patterns reminiscent of nature (e.g., visible in semiquantitative, high-resolution satellite images), thus passing a meaningful kind of Turing test between the artificial and the actual. They exhibit emergent behaviors that are not (yet) mathematically deducible from known dynamical equations for fluids, such as a tornado, a Gulf Stream path, or a decadal “teleconnection” relation between western tropical Pacific cumulus convection and a nearly hemispheric standing-eddy pattern in surface air pressure.
Atmospheric and oceanic forcings are strongest at global equilibrium scales of 10^7 m and seasons to millennia. Fluid mixing and dissipation occur at microscales of 10^−3 m and 10^−3 s, and cloud particulate transformations happen at 10^−6 m or smaller. Observed intrinsic variability is spectrally broad band across all intermediate scales. A full representation for all dynamical degrees of freedom in different quantities and scales is uncomputable even with optimistically foreseeable computer technology. No fundamentally reliable reduction of the size of the AOS dynamical system (i.e., a statistical mechanics analogous to the transition between molecular kinetics and fluid dynamics) is yet envisaged. ‘ http://www.pnas.org/content/104/21/8709.long
webby’s incredible and improbable claims to the contrary.
Chief
A thought has been nagging me for some time. You express concern about the impact of escalating greenhouse gases as they may play some role at a bifurcation, ejecting climate cold or hot cataclysmically upon us here on earth.
I reflect that earth has been bombarded with comets and volcanic eruptions spewing all sorts of crud into the atmosphere. Yet, for 3 billion years or so, at least since water has dominated earth’s surface, earth’s surface temperature as recorded in the paleoclimate records, has oscillated within narrow boundaries.
What is different today than yesteryear? Why will surface temperatures run amuck when they haven’t before? What homeostatic mechanisms that have kept earth’s surface temperatures on an even keel for so long, suddenly quit working?
Frankly, I am not sure the trace CO2 story is a big deal. Since I am a pupil and not a master, I ask in humble attitude.
The apprentice modelers found a cryptic line by Arhennius in a volume they couldn’t otherwise translate. But look at the beautiful brooms they flourish.
=====================
Catastrophe in the sense of Rene Thom? Applies to things like earthquakes and avalanches.
Frankly I am not convinced that CO2 has even a dominant role in recent warming. But economies must grow and the proportion of emissions to natural flux must grow from 4% to 8%, 16% etc.
‘Nothing tells us that such a finite dimensional attractor exists, and even if it existed, nothing tells us that it would not have some absurdly high dimension that would make it unknown forever. However the surprising stability of the Earth’s climate over 4 billion years, which is obviously not of the kind “anything goes,” suggests strongly that a general attractor exists and its dimension is not too high. I will not speculate about what number that might be. But in any case and to use the IPCC terminology, it is very unlikely (<5%) that naïve temperature averages, 1 dimensional equilibrium models, or low resolution numerical simulations (GCM) can come anywhere close to solving the problem.' http://judithcurry.com/2011/03/05/chaos-ergodicity-and-attractors/
So we are assuming that certain states are preferred – especially those of the past 2.58 million year. It is probably a matter of being in the Goldilocks zone wrt the Sun and thus having liquid water.
'Recent scientific evidence shows that major and widespread climate changes have occurred with startling speed. For example, roughly half the north Atlantic warming since the last ice age was achieved in only a decade, and it was accompanied by significant climatic changes across most of the globe. Similar events, including local warmings as large as 16°C, occurred repeatedly during the slide into and climb out of the last ice age. Human civilizations arose after those extreme, global ice-age climate jumps. Severe droughts and other regional climate events during the current warm period have shown similar tendencies of abrupt onset and great persistence, often with adverse effects on societies.' http://www.nap.edu/openbook.php?record_id=10136&page=1
Chief, i am inclined to agree. i am not convinced CO2 has any role. I wish someone would do (or find results of) a real experiment demonstrating thermalization of IR by any IR absorbing/emitting gas. if the earth is in radiative thermal equilibrium with the sun, then we expect stable temperatures on millennial time scales. radiative thermal equilibrium temperature is independent of molecular composition and i would love to see an experiment demonstrating otherwise.
everything else we see on the surface is random weather chaos occurring within the constraints of stability of the planet in space.
As usual, the Chief is informative and interesting.
Well here’s Freeman Dyson ‘s heretical thoughts on climate
science apocalypse OMG – back – ter – the – golden – age
– arrest – all – change – thinking.
‘The fundamental reason why carbon dioxide in the atmosphere
is critically important to biology is that there is so little of it.
A field of corn growing in full sunlight in the middle of the day
uses up all the carbon dioxide within a metre of the ground
in about five minutes…
To stop the carbon in the atmosphere from increasing, we
only need to grow the biomass in the soil by a hundredth
of an inch per year … a tenth of an inch of good top soil.’
http://www.edge.org/documents/archive/edge219.html
So let’s worry about real pollutant problems in a can – do
pragmatic fashion, soil and chemical run off into rivers,
plastic et al waste management, etcetera, etcetera …
etcetera.
Btg
+1 +1 +1 !!
Gaia’s environmental consultant gasps for life-giving CO2 and trembles with sweet anguish at the prospect of poleward movement of growing zones. Go, baby humans, go.
======================
“To stop the carbon in the atmosphere from increasing, we
only need to grow the biomass in the soil by a hundredth
of an inch per year … a tenth of an inch of good top soil”
Or we could reduce total CO2 emissions into the atmosphere by 30 billion tons per year.
That’s just a 3% reduction in total emissions!
Beth in the article you linked, Dyson says:
“To stop the carbon in the atmosphere from increasing, we only need to grow the biomass in the soil by a hundredth of an inch per year. Good topsoil contains about ten percent biomass, [Schlesinger, 1977], so a hundredth of an inch of biomass growth means about a tenth of an inch of topsoil. Changes in farming practices such as no-till farming, avoiding the use of the plow, cause biomass to grow at least as fast as this. If we plant crops without plowing the soil, more of the biomass goes into roots which stay in the soil, and less returns to the atmosphere.”
Apparently, Dyson thinks plowing is a large cause of global warming, and non-till (no plowing) farming would curb further increases in temperature. I don’t know if non-till farming would make a significant difference in warming, but there are other benefits. However, plowing is a weed control measure, so non-till requires greater use of herbicides.
Dyson uses corn in his example, but makes no mention of how global warming affects corn. I wonder if he is aware warmer summers are not good for corn. If not, he might look into the subject.
The following excerpts are from a University of Nebraska article on the effects of heat on corn:
“Corn maximizes its growth rate at 86°F. Days with temperatures hotter than that cause stress. In the high yield areas, cool night temperatures — at or below 50°F — reduce respiration rates and preserve plant sugars, which can be used for growth or reproduction, or stored for yield.”
“In years when we get high day and nighttime temperatures coinciding with the peak pollination period, we can expect problems.”
“Corn is a “C4 Photosynthesis” plant, making it extremely efficient at capturing light and fixing CO2 into sugars. One drawback of this system is that with high daytime temperatures, the efficiency of photosynthesis decreases, so the plant makes less sugar to use or store. High nighttime temperatures increase the respiration rate of the plant, causing it to use up or waste sugars for growth and development.”
“Even with adequate moisture and timely silking, heat alone can desiccate silks so that they become non-receptive to pollen.”
“Heat also affects pollen production and viability. First, heat over 95°F depresses pollen production. Continuous heat, over several days before and during pollen-shed, results in only a fraction of normal pollen being formed, probably because of the reduced sugar available. In addition, heat reduces the period of pollen viability to a couple hours (or even less). While there is normally a surplus of pollen, heat can reduce the fertility and amount available for fertilization of silks.”
“For each kernel of grain to be produced, one silk needs to be fertilized by one pollen grain.”
http://cropwatch.unl.edu/web/cropwatch/archive?articleID=4900219
Max_OK, no till, crop rotation farming, while having
advantages of soil and moiiisture retention, and thus
reduction of run off into waterways, does have to vary
techniques re weeds including herbicides. Many farmers
in Australia are moving into no till practices as they seem
to consider the advantages out weigh the problems . Here:
.http://www.weedsmart.org.au/wp-content/uploads/2013/01/CIC_102505_Weedsmart-brochure_22-FINAL.pdf
Oh, I agree, on balance no-till looks better than till as an agricultural practice, but I doubt it will be the curb on global warming Dyson suggests.
The following report says “No-till makes little or no contribution to carbon sequestration in croplands.”
http://www.misereor.org/fileadmin/redaktion/No-till_really-climate-friendly_01.pdf
There is no doubt that it is possible to restore soil carbon in both cropping and grazing lands. e.g.
ftp://ftp.fao.org/agl/agll/docs/wsrr102.pdf
http://carbonfarminghandbook.blogspot.com.au/
http://soilcarboncoalition.org/challenge
World wide soil carbon in agricultural soils has declined substantially – in the US for instance from 7% to 8% to 3% to 4%. This sequestration potential for a 1% increase in soil organic content of agricultural soils is nearly twice total human emissions thus far. Part of it is green mulch and returning animal manure to soils and keeping the carbon from degrading to methane – especially in small holdings which are 70% of the total. The biggest potential is with grazing lands and intensive rotational grazing – which is dominant agricultural land use.
There are other food productivity, soil, water and ecological conservation benefits. It is part of a multi-objective approach encompassing black carbon, tropospheric ozone, ecological restoration – along with development, health, education, safe water and sanitation – that help to manage population pressures. This is the pragmatic and practical way forward.
http://thebreakthrough.org/archive/climate_pragmatism_innovation
We would suggest energy and sequestration research funding at about $100 billion globally per annum. You would do it by prizes and tendering in the usual way. It is about $2 billion for Australia. Much cheaper than the nonsense we have seen thus far.
Using the concept of PDF in presenting results of an analysis like the Forest et al 2006 is problematic and misleading. What’s shown tells only, how well each value of the parameter of the x-axis is consistent with the data assuming that the model is correct after integration over all values of the other parameters.
Contrary to what WHT writes in in one comment, there’s no reason to expect that the resulting curve has a finite integral. If the method cannot exclude arbitrarily large values, the integral is usually infinite and scalable to the integral of one only with the help of an artificial cutoff.
There are several fundamental problems in this approach, and getting to real PDF’s requires solving them all. The problems include:
1) The sparsity of data
In principle it’s possible to use sparse data directly, if the model can produce sets of values that correspond to the set of observations. Calculating with each combination of parameters a large number of such sets and taking into account also inaccuracies in the observations, it’s possible to determine the likelihood of the observed values for each set of parameters. This is, unfortunately, not possible in practice as the models are not detailed enough and as the required amount of computation is far too large.
Because the direct approach cannot be used in practice, various methods are used to process both the data and the model results to allow for an approximate application of the same idea. As far as I can see, all the problems that Nic discusses are related to the way that processing is done.
2) Dependence on the model
The whole approach is valid only as far as the model used has a similar relationship between the parameters being estimated and the observable quantities. This clearly a major problem, and the statements made by many even in this thread that “the climate sensitivity is not measured at all” is essentially equivalent to claiming that we have no good reasons to believe that the model has the correct relationship. I don’t accept that to be true, but I’m don’t think that the accuracy of that relationship is well known.
3) Dependence on all priors
To me this is perhaps the weakest point in the interpretation of the results. The problem of appropriate prior is bad enough in the case of one unknown parameter, but it’s very much worse when we have several unknowns. (I just realized that the best paper included in my doctoral thesis presented in 1973 was exactly on this issue in a very different physical problem.) Having a bad prior for another parameter affects the integration over all values of that parameter. Due to the correlations between the effects of the parameters on the set of predictions, the outcome may be seriously erroneous. Figure 3. of the Forest et al 2006 paper presents one view on this issue.
It’s customary to use uniform priors as if that would be an uniquely most correct way of proceeding when priors are not constrained strongly by solid arguments. There’s, however, nothing inherently superior in uniform priors in comparison with very many alternatives. What’s uniform depends on the choice of variables, and uniform priors in different sets of parameters may give totally different results. (This has been discussed in some earlier threads for the case of climate sensitivity vs. feedback strength, which are inversely related and lead to totally different conclusions on the high tail of sensitivity.)
With only one unknown parameter, we can at least tell that the resulting curve presents correctly relative likelihoods of ending up with the actual observations given the particular value of the parameter. This value is not changed through a nonlinear change of the single parameter. What changes non-linearly in such an operation is the x axis, not the likelihoods (conditional probabilities). With three parameters that’s true only for points in the three dimensional space, but not for the projections to one of the variables. As long as the priors are not constrained better than by setting them artificially as uniform, interpreting the results as PDF’s is not justified.
Sorry if I missed it, but it seems your policy certainty has left a trail of crumbs through that forest.
==============
Everything related to the long tail of high climate sensitivity in this paper is of little significance. Where their method is more powerful and less affected by the problems that I discuss is in telling that low values of climate sensitivity are unlikely and seem to contradict the data they use.
In other words their work supports the conclusion that ECS is 2.2C or higher with little power to tell more about the value.
Fasten on a figure for climate sensitivity that frightens you, and then calculate how much colder we would be without anthropogenic effect.
===============
Pekka,
The PDFs are not the PDF of climate sensitivity. They are PDF’s of our guesses/estimates of climate sensitivity. If we could accurately measure or estimate climate sensitivity the PDF would be a well defined peak with a narrow range – e.g. perhaps +/-0.1K at current global average temps and +/-0.5K for the full range of global average temperatures the planet has experienced in the past 0.5 billion years. I am just guessing the figures to illustrate the point; the point is that the PDF’s are not PDFs of climate sensitivity, but of our guesses/estimates of climate sensitivity.
Peter,
Yes. They are supposed to be posterior subjective probabilities for the parameter values, when these probabilities have been formed taking the empirical data into account.
Technically the curve is the (scaled) conditional probability of observing those values for the empirical results that have actually been observed, assuming that the parameter has each particular value (as estimated by the scientists using their model and having uniform priors for the other two parameters). That’s the value that’s calculated in Bayesian analysis.
It’s, indeed, important to realize that such a conditional probability is a very different thing than the frequency distribution of a stochastic variable. In this case the assumption is that the climate sensitivity has one correct value, and is thus not a stochastic variable that has a PDF: The curve tells about (subjective) level of knowledge about that single value.
Pekka, it is this: “the assumption is that the climate sensitivity has one correct value” that I most object to. It is the control knob assumption and a very strong claim with little justification. There are good reasons to believe that there is no unique climate response to a given CO2 level. How could there be with so many other things going on?
Perhaps they really mean ECS but ECS is just an abstraction. This is just one of the ambiguities in the use of CS that I alluded to earlier.
David,
Assuming that there’s a unique value for the climate sensitivity does not include strong assumptions concerning other sources of variability. If the Earth system is strongly chaotic on the level of climate variables, no unique value can be defined, but even strong stochastic variability is allowed, while the climate sensitivity (ECS) remains well defined, only the more difficult to estimate, the more variability there is.
The climate sensitivity that they try to estimate is ECS. That can be done, when the approach is based on a climate model as their analysis is, because the models can be used to calculate ECS for each set of input parameters.
They could use transient climate response TCR rather than ECS as the unknown parameter to describe the sensitivity. That would almost certainly give more accurate results as the difference between TCR and ECS is one of the details badly constrained by the empirical data. In particular that would make their result much less sensitive to the remaining uncertainty in another of their parameters, the effective diffusivity of the oceans (K).
In their approach the different combinations of ECS and K lead to similar results for many observables, and the related uncertainty in ECS is rather large, while TCR would certainly be better constrained. On the other hand using the data to get handle on ECS is a (or the) major motivation for the approach.
The data on deep ocean temperatures covers too short a period and is also to large degree too inaccurate to provide a reliable and accurate constraint on the diffusivity. Therefore much uncertainty is left in it’s value and that adds directly to the uncertainty in the estimate of ECS.
Doing this kind of analysis makes sense, but the papers do not tell sufficient details about the accuracy and reliability of the results. The lower edge is mainly determined by some constraints and the long tail by others. Analyzing and telling in more detail what’s decisive for each part of the outcome would be very useful. What I write above is based on intuitive reasoning and experience from making estimates in other cases.
We have had recently several cases where skeptical analysts like Nic here have looked at the issues much more carefully than the original scientists did themselves. Sometimes the faults and weaknesses that they find are not really relevant, but sometimes they do tell something essential on the subject matter. When complex models and methods are used, it’s unfortunately quite common that the scientists have not spent enough effort at checking the basis of their results. They have sometimes let trough pure artifacts. This paper is not that bad, but the points Nic has brought up deserve more attention.
Pekka,
You say “That can be done”, meaning ECS can be estimated. If that was true it would have been done by now with low uncertainty. It has not been as demonstrated by the very large uncertainty range. The range of values in the PDF is a clear demonstration of how poor is our understanding of ECS.
Pekka, I will take your word for it that CS really should mean ECS but that is not how the term is frequently used. It is typically defined as how the climate will actually be when (and if) CO2 is doubled. This concept of the real state is fundamentally different from ECS. In fact there may be no relation between the real state and ECS, given all the disequillibrating factors at work. Chaos is only one by the way.
So if they are saying CS while meaning ECS then the resulting ambiguity is fundamentally misleading.
Peter,
I discussed in my above comment one reason for the large uncertainty in the value of ECS.
Simplifying a little we could have a analysis that tries to estimate two parameters diffusivity K and ECS. Tee data on surface and atmospheric temperatures may give as the result a long narrow region in the 2-dimesional ECS-K plane. That region might constrain ECS fairly accurately assuming a given value for K but allow a very large range, when nothing is assumed about K.
Something like the above must be true for the actual analysis, although the accuracy of the estimate of ECS may be rather poor even when all other parameters are fixed.
TCR is defined exactly as the change in surface temperature over a period that ends with a doubling of CO2 concentration. That value is much less sensitive on the diffusivity and therefore easier to estimate empirically than ECS.
By “can be done” I meant that doing that is technically straightforward. Whether the value is reliable as a descriptor of the real Earth system is another matter.
Ah, a measurement, the value of which may or may not be reliable as a descriptor of the real earth system.
Real earth measurement. Now there’s a definition I can sink my teeth into.
========
“real earth system”
For real? Is this the same “real” as real genuine authentic synthetic cowhide?
Andrew
Hi Pekka,
Thank you for your two replies to me. I didn’t answer most of what you said in the first comment – @ April 13, 2013 at 7:39 am – because I found it confusing; I couldn’t understand what you were trying to say despite re-reading it several times.
If it “can be done” and “is technically straightforward”, why hasn’t it been done. We’ve spent $100 billion on climate research and policies over ~25 years and still climate sensitivity is very poorly known – i.e. there is enormous uncertainty in our estimates of what it is.
By the way, Many people are not interested in the details of “the science”. They just want what is relevant policy explained in a way that is readily understandable and not confusing. I am one of them. We need to be able to understand the costs and benefits of no mitigation policy (and apply robust analysis methods), for delayed policy mitigation, and for different types of policies. Climate sensitivity is an important input, as is the damage function and the potential decarbonisation rate of the global economy. Equally important is the domestic and international politics and the probability that a global policy can be successful if it causes early negative economic consequences for any group or region. So, can I please urge you to explain your message in a way those interested in policy can understand rather than just for academics, physicists and climate scientists.
At the moment I hold the belief that TCS and ECS are parameters that have a very small range – e.g perhaps +/-0.1C for conditions such as the Earth is now in – i.e. in a ‘cold-house phase’, with some ice at both poles, and average surface temperature about 15C which is about 1/3 of the way between the Earth’s minimum and maximum temperature (about 10C to 25 C). I expect ECS may have a range of perhaps +/-0.5C over the full range of hot house to cold house conditions the planet has experienced over the 0.5 billion years.
Given this is my belief at the moment, I see the enormous uncertainty and long tails on the ECS PDFs (e.g. ECS range of 0C to >20 C) as demonstrating we have very little understanding of what ECS is.
Also, while I am at it, I wonder why the climate scientists choose to quote the median value rather than the mode value as our best estimate of ECS (eg IPCC AR4, Figure 9.20 here: http://www.ipcc.ch/publications_and_data/ar4/wg1/en/figure-9-20.html)? Can someone please explain why this is?
I am very open to be persuaded to change these opinions.
I got a climate sensitivity of 1.23 deg C from the following excellent correlation between Annual CO2 concentration and a Secular GMST fit for the 61-years moving average:
http://www.woodfortrees.org/plot/hadcrut4gl/mean:732/from:1901/normalise/plot/esrl-co2/compress:12/normalise/offset:0.615/detrend:-0.125
Pekka,
“As long as the priors are not constrained better than by setting them artificially as uniform, interpreting the results as PDF’s is not justified.”
I basically agree with you. But in this case it is feasiblet to derive an objective joint prior for the three parameters involved. That prior is nothing like uniform in the parameters.
Also, ocean heat content data, while subject to large uncertainty over the period involved, nevertheless does provide a reasonable constraint on high ECS values.
Nic,
I wonder what you mean by
Could you elaborate on that?
Heh, even I can elaborate on that, but I’ll not condescend. Just contemplate uniform priors. Omigod, they did that?
===============
The last contemplative uniformed prior I saw was in a monastery.
I see Richard Tol has just published an other Integrated Assessment Model (which is what Nordhaus DICE and RICE are) in Excel.
http://bishophill.squarespace.com/blog/2013/4/13/diy-integrated-assessment-model.html
I used to toll Tol for his belief that the science was settled, but I’m deeply grateful for this narrative toy, dismal toy that it is. Maybe there’s a song in it. Let’s open the box.
=================
Er ..apology fer length of me previous ‘comment’ It was meant
to be an attachment!
It’s all good, muy linda; this way I read it.
=============
“the five decades comprised in 1946–1995; deep ocean 0–3000 m global temperature trend over 1957–1993; and upper air temperature changes from 1961–80 to 1986–95 at eight pressure levels for each 5-degree latitude band (8 bands being without data)”
This study appears to be resreicted to the post-1961 era. So it would be difficult to provide the correct initial conditions for period simlations. For example, the 1910 to 1940 period of 0.5C global temperature rise may or may not have been included and would have still been working its way through thr oceans. If this were a linear problem it would not matter, but it obviously was not.
It is interesting to observe the debate and try to separate evidence from belief. For example, climate sensitivity to CO2 is calculated if you measure the temperature and the forcing. Leaving aside whether believing the temperature is an act of faith, how then to we decide whether CO2 is the driver. Is that an act of faith?
What happens if the correlation becomes negative, which looks increasingly likely? Will the faith be shattered or will the believers find mechanisms to turn this into further supportive evidence? What about clouds, solar effects, other natural climate drivers, known or unknown?
Can the people claiming that sensitivity to CO2 can/has been measured produce evidence to show that other drivers can be ruled out? Of course not.
What it comes down to is this: was the warming period due to natural causes or man made CO2 or both? The answer is probably both. Could it be explained by natural changes alone? The answer is yes, we know it has been hotter in the past. Is the concentration of CO2 unprecedented? The answer is no, it has been much, much higher.
So what has triggered the current debate? Is it a new belief culture linked to environmentalism? Perhaps sloppy science? Maybe hijacking of science for power, financial gain and political motives? All of these.
All of this does not mean that we should abandon the science, but it does mean that proper scientific debate is pointless if every discussion has evidence and belief intertwined so tightly and never admitted.
“What happens if the correlation becomes negative,”
It has. The IPCC was never gane enough to publish the cross correlation between CO2 concentration and global average temperature. But between 1940 and 1970 the temperature was often falling, while CO2 concentration was increasing. The IPCC knew this but failed to report it. Also ever since 2000 the cross corellation has averaged zero.
Of course, for CO2 to be the culprit, it is a necessary condition for the correlation tp be positive most of the time. See my websire underlined above.
Schrodinger’s Cat writes ” All of this does not mean that we should abandon the science, but it does mean that proper scientific debate is pointless if every discussion has evidence and belief intertwined so tightly and never admitted.”
Precisely, and what I have been saying in different words. The facts are clear; climate sensisivity has not and cannot be measured. Unless and until the warmists admit this is a fact, then a meaningful discussion of what this means cannot occur between those of us who hold radically different views on CAGW. Which is a pity.
But in the end, it will not matter. The final arbiter in physics is the empirical data. When this shows conclusively that CAGW is wrong, then this fabulously expensive discussion will cease.
Climate science is very poorly understood and experimental evidence is difficult to acquire. This lack of evidence leads to the making of assumptions. Many of these assumptions become beliefs.
There is nothing wrong with having beliefs in science, provided the scientist remembers that it is still only an assumption until proven.
In these highly polarised debates, the assumptions should be admitted openly so that the relevant facts can be established and agreed. Then the assumptions can be debated. That would be very interesting and possibly productive.
When beliefs and evidence are confused, that is no longer science. It seems to me that deliberate confusion of facts and beliefs is at the heart of climate alarmism.
IPCC Stocker in a Weltwoche Interview
“But one issue that we address in the new report also is the climate sensitivity… The last report of 2007, we arrived at a value of 2 to 4.5 degrees. The question now arises: Enter the last fifteen years an indication that the climate sensitivity is the low side? This discussion is in science, even with skeptical colleagues – I can assure you.”
http://translate.google.com/translate?sl=de&tl=en&js=n&prev=_t&hl=en&ie=UTF-8&layout=2&eotf=1&u=http%3A%2F%2Fdiekaltesonne.de%2F
Pingback: Sunday Evening Jog Through The Park | The Lukewarmer's Way
Pekka Pirilä
“I wonder what you mean by
it is feasiblet to derive an objective joint prior for the three parameters involved”
Apologies for not responding earlier, and for the obvious typo. There is an article just up at WUWT where I give rather more information: http://wattsupwiththat.com/2013/04/16/an-objective-bayesian-estimate-of-climate-sensitivity/.
If you would like more details, please either obtain the full paper for my objective prior study, at http://journals.ametsoc.org/doi/abs/10.1175/JCLI-D-12-00473.1 , or let me know via Judith Curry that you would like a copy.
Nic,
While I don’t object on the plausibility on your prior, I cannot accept that it could be objective. That’s simply impossible.
To be more specific. I have seen many claims on objective priors. Those may be objective in the sense that they are derived from a more general hypothesis, but they are not objectively shown to be a more correct and or to be really a less subjective choice than other reasonable approaches. In every case additional assumptions are involved like here the assumptions behind the sentences:
No solid principle tells that those regions should be given less weight where data responds little to parameter changes. That statement assumes that we have a well defined measure for the variability in the data and that this variability should be kept uniform with the choice of measures used in the analysis. Measures and priors are meaningful on when both are defined. (The standard uniform non-informative prior corresponds to a constant prior in a space of Cartesian measure for the selected parameters.)
I do agree that it’s plausible and in many cases true that the situation discussed by Nic tell’s that the Cartesian volume of such a region represents badly it’s correct (objective) measure in the space of all parameter, but assuming that the data gives a correct measure is also a very dubious assumption. Within well defined theories we may have uniquely defined measures for the parameter space, but we have seldom the luxury of applying Bayesian analysis in the setting of such a theory. In practice we are always dependent on subjective choices, and the “objective prior” of this paper is just one example of such a subjective choice.
It must be remembered that the set of data and what kind of prior it leads to depends not only the actual physical system, but essentially also on what measurements have actually been done and how much data of each type we happen to have.
One more comment on this.
To me the fundamental beauty of the Bayesian approach is that it makes the subjective input explicit. The assumptions are brought in open and not hidden from sight.
The approach of using an “objective prior” based on data destroys this beauty. In that approach an additional assumption is introduced that’s not theoretically solid. The nature of that assumption is such that it does certainly give often good results, but only often, and there’s no reliable way of telling when.
The assumption is that the data tells about the measure in the parameter space that makes an uniform prior least informative, but this is really only an assumption that may also fail extremely badly.
In the present case we know already that the simplest look at the temperature data tells about a rather low sensitivity. The method of Nic is just a way of getting apparent confirmation of that with rather little real additional evidential power in comparison to the most simplistic approaches. It’s more or less known in advance that the data will weight the evidence in such a way. The same data is used to make the prior and to use it. It’s in a sense squaring the value of the data.
Speaking of objective priors – from a comment at WUWT by Matthew R. Marler:
Last I checked – Nic hadn’t responded.
Joshua,
I think that it’s not uncommon to think that there are, indeed, objective priors and that those can be fond looking at the data. Even on this site, Nic is not the first to have discussed such ideas positively. I had a rather lengthy argumentation on that in another thread, where the point was even more central.
Here we have a Munchhausean bootstrap: Using the data to prove that that particular data is stronger than it is.
Predict Mann, Jones etc Mosher to LOL will soon be running very very far away as MSM is beginning to realize how the’ve been had and will be letting the big boys investors who will be wanting wanting their money back
“date: Fri, 30 Jun 2000 12:30:43 -0600 (MDT)
from: Tom Wigley…
subject: Re: …
to: Keith Briffa…
Keith and Simon (and no-one else),
Paleo data cannot inform us *directly* about how the climate sensitivity
(as climate sensitivity is defined). Note the stressed word. The whole
point here is that the text cannot afford to make statements that are
manifestly incorrect. This is *not* mere pedantry. If you can tell me
where or why the above statement is wrong, then please do so.
Quantifying climate sensitivity from real world data cannot even be done
using present-day data, including satellite data. If you think that one
could do better with paleo data, then you’re fooling yourself. This is
fine, but there is no need to try to fool others by making extravagant
claims.”
My summary:
1. We don’t know the temperature or its first derivative during that time.
2. We don’t know what thermal forcings existed during that time.
3. We don’t know if stationarity is a valid assumption.
4. We don’t know how much snow and ice was around during that time.
5. We don’t know the ocean temperature profile during that time.
Therefore, we KNOW climate sensitivity to +/- 0.01 C/W/m^2. Sure
Pingback: Meta-uncertainty in the determination of climate sensitivity | Climate Etc.
Pingback: Non-centring in the Forest 2006 study « Climate Audit
Pingback: More and more likely that double CO2 means | Backfill for 'Note to Self'
If the adjustments are not correct then the CS fades to nearly nothing. Here is a comment I just made on another site. All of this hinges not on the actual variations in the temperatures but solely on the adjustments made to the temperature datasets.
—
I have decided to share this peculiar view of current climate science as I have recently stumbled upon, though I’m sure this has been raised though before, in pieces and and I have never it all together in one simple comment or post, but I have seen the traces but I never seemed to get the full thrust of what this shows.
First look at some various plots of the adjustments made to the various temperature datasets gathered over the last few years, they are all close to linear in the years past 1940 and will be dealt with as such, linear form start year to now. The red lines added were just for myself to get a close average rate it seems all datasets are being adjusted upward (artificially warmer) over time. Why it started right at 1940, I don’t know why. Quite honestly I don’t really care here how many peer-reviewed papers created the adjustments, just going to ignore that topic here.
Can artificial adjustments actually warm or cool the earth? Of course not, so they will be removed.
USHCN: http://i43.tinypic.com/s3m3wk.png
GISS: http://i39.tinypic.com/1zfrn1l.png
NOAA: http://i40.tinypic.com/2uy2bg4.png
Here is a plot of the latest accepted dataset after removing the +0.75°C/century (0.000625 °C/mo) artificial adjustments from the dataset starting in 1940.
http://i43.tinypic.com/90dchy.png
or with less smoothing:
http://i42.tinypic.com/j8fjwy.png
Any adjustments before 1940 were ignored but you may want to find actual datasets of these adjustments and get very precise but the changes you would see prior to 1940 to that plot are going to be very small. This is just a rough overview but you should see the point.
Put on your thinking hat and you decide what you gather from this set of data. I seem to see that all of the rise of temperature over and above the natural variance (of about ±0.25°C) is completely in the upward adjustments, without the adjustments it appears perfectly normal and symmetric the way I have always assumed nature to be, vacillations about the mean. I for one have the opinion that 1997-1998 was no warmer that the late 1930’s temperatures after information from elders living through the dust bowl years.
Read Callender’s 1938 paper, especially the comments from Society members at the end, and you just may see what I see is so amusing, seems nothing has changed at all, it was right at the peak of temperatures in 1938 also:
http://www.rmets.org/sites/default/files/qjcallender38.pdf
This was such a quick and simple look at that data but it sure left an impression and it might leave such on others who get confused by the complexities involved in the temperature series plots.
Some will say this is not proper science, true, but it is proper reality to look at what it was before the adjustments.
I believe everything published made a great deal of sense.
However, what about this? suppose you were to
write a killer headline? I ain’t suggesting your content isn’t solid., but suppose you added something that makes people desire more?
I mean The Forest 2006 climate sensitivity study and misprocessing of data
– an update | Climate Etc. is kinda plain. You should glance at Yahoo’s front page and
note how they create article headlines to get viewers interested.
You might add a related video or a pic or two to grab people excited about what you’ve written.
In my opinion, it could bring your posts a little bit more interesting.
Hey! I’m at work browsing your blog from my new iphone 4!
Just wanted to say I love reading through your blog and look forward
to all your posts! Keep up the excellent work!