
by Ross McKitrick
I have a new paper out in the journal Nature Scientific Reports in which I re-examine some empirical work regarding agricultural yield changes under CO2-induced climate warming. An influential 2017 study had argued that warming would cause large losses in agricultural outputs on a global scale, and this played a large role in an upward revision to the Biden Administration’s Social Cost of Carbon (SCC) estimate, which drives regulatory decision in US climate rulemaking. I show that a lot of data had been left out of the statistical modeling, and once it is included there was no evidence of yield losses even out to 5 C warming.
Background
In 2023 a team of economists working for the Biden Administration concluded the SCC needed to be increased by a considerable amount. The higher the SCC, the costlier the regulatory burden that can be justified by the agency. This not only affected US regulations but Canada’s as well since our own environment ministry adopted the new US values when justifying a sweeping set of new greenhouse gas regulations. I wrote an op-ed about the SCC change in May 2023 in which I drew attention to the important role played by a revision to projected agricultural yield damages. While it is difficult to trace where, precisely, all the changes came from, I estimate about $50 of an approximately $100 increase in the 2030 value of the SCC (holding the discount rate constant) was attributable to the revised agricultural yield damage estimates.
These revisions were attributed to estimates of crop yield losses from a 2017 paper published in Nature Communications by Frances Moore et al. called “New science of climate change impacts on agriculture implies higher social cost of carbon.” I’ll call that paper M17. I was familiar with this paper because Kevin Dayaratna and I had studied it while preparing a response to a comment by Philip Meyer on a paper of ours on the SCC. I knew, for instance, that M17 used a data set originally developed for a 2014 paper published in Nature Climate Change by Andy Challinor et al. called “A meta-analysis of crop yield under climate change and adaptation.” I’ll refer to that one as C14. But C14 and M17 had different implications about the impact of CO2-induced warming on crop yields. In the C14 model CO2 fertilization offsets the damage from warming, whereas in M17 the combined effect is negative for most crops across most warming paths. So why the difference?
It was not possible to tell simply by reading the papers. Neither one provided a detailed explanation of its regression analysis. M17, in particular, did not report its regression results nor was its model directly comparable to C14. So in 2023 I decided to get the data and try to replicate both sets of findings. While both papers said the data was available online at a website called http://www.ag-impacts.org no such site currently exists, and the Wayback machine entries did not include any data. I emailed Moore to ask for her data, but she was at that time working for the Biden Administration and her university email was inactive. I then reached out to Challinor who replied promptly and sent me his data set.
The C14 Dataset
The data was a compilation of results from many crop yield simulations done by other authors around the world. The file was an Excel spreadsheet with 1,722 rows each containing numerous variables drawn from the underlying studies including the crop type, study location, change in CO2 level (dC), change in temperature (dT), change in precipitation (dP), change in yield (dY), whether adaptation was included, and various other details. It was immediately apparent that many of the dC entries were missing. In fact only half of the data set appeared usable for regression modeling, which Challinor confirmed had been the case. It was a straightforward matter to replicate the Challinor results since they were based on a simple linear regression. The number of usable data rows in the version I received was slightly different from that reported in C14 and my replication was not exact, but it was close enough.
The M17 regression model was much more ornate than C14 since they included all possible cross-product terms plus some additional temperature data Moore’s coauthor Tom Hertel sent me. My coefficient estimates were similar to those reported in M17 but again not exact. I then used the M17 regression results to construct yield projections by crop type. I was able to compare my estimates to some unpublished calculations sent to me by Moore after she had finished her secondment in Washington. My replications were again not exact but pretty close so I was satisfied I was on the right track.
Many of the differences between M17 and C14 came down to different choices in setting up the regression equation. C14 allowed the CO2 fertilization effect to be linear as concentrations rose, whereas M17 imposed diminishing returns. In one version of my analysis I employed a flexible regression model that allowed the data to determine the response and it turned out to be close to linear, supporting the C14 version. But a referee later objected to my approach and while I didn’t agree with the objections I removed that discussion since it wasn’t necessary for the paper’s main point. M17 also restricted the role of adaptation so that if no climate change happened (dC = dT = 0) adaptation alone could not boost yields. This was a reasonable assumption to impose since the model is attempting to track climate change-induced yield responses.
But I was also curious about all those missing dC entries. I started checking the underlying source papers and found that in many cases either the number was available or could be recovered by consulting the documentation for the climate scenario being simulated. I recovered 360 missing dC entries which allowed me to do the regressions on a much larger data set. And that made a very large difference.
Reanalysis on the Expanded Dataset
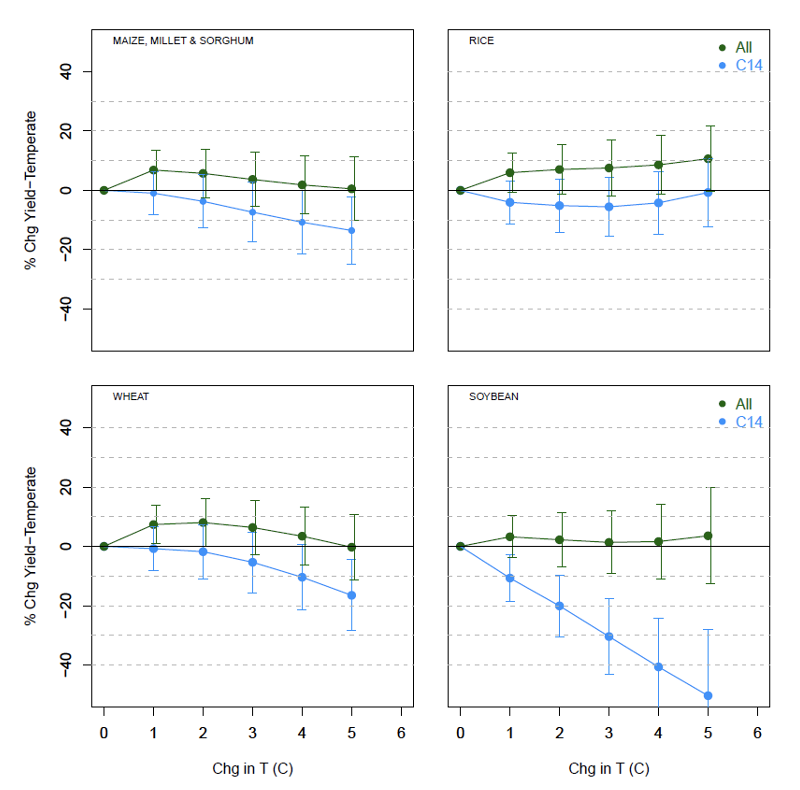
In the following figure, showing yield changes versus warming for four crop types, the original data set is called “C14”. On the expanded data set (“All”) the regression coefficients changed such that the yield simulations net of CO2 fertilization showed no output losses, even out to 5 C warming.

Even without doing the economic modeling I could therefore conclude that the M17 analysis did not justify any revision to the SCC estimate (except perhaps downwards).
I wrote up the results and submitted them to the journal in which C14 had been published: Nature Climate Change. This was about a year ago (end of February 2024). NCC declined even to review the paper, telling me “we are not persuaded that your findings will be of sufficiently immediate interest to the broader climate change community”. And I totally agree—I think my findings will be of no interest at all to the climate change community, since they don’t advance the cause! NCC suggested I submit my paper instead to Nature Scientific Reports which I did.
NSR had the paper reviewed and in early June I was told it was rejected. The reviewers argued that my equation connecting dC to dT was wrong and that my empirical analysis depended on choosing two key parameter values (baseline CO2 and climate sensitivity) but if I varied these slightly my overall results would fall apart. However, while there was a typo in my dC-dT equation it didn’t carry over to the code, and it was easy to show (since I submitted my data and code) that my results were invariant to the proposed parameter changes. So I decided to write the editor contesting the decision. A managing editor contacted me and said there is a formal appeal process and explained how to use it, but also cautioned me that it typically takes a long time to process an appeal request and they are rarely accepted. Nonetheless on a Friday in June I submitted all the documents. On Monday morning I was told my appeal had been accepted, and I was advised to submit a revised version of the manuscript, which I did right away.
I then waited a long time. In October I queried the journal and was told they were reaching out to new reviewers but so far had not received any responses. I queried again in December and was told they had found new reviewers but had not received the reviews. But in early January the new reviews came through and they were supportive. The requested revisions were mainly editorial but the analysis and conclusions were upheld. From that point on publication was routine.
Whither the SCC?
Of course the topic has now been rendered somewhat moot by the Trump Administration’s January 20 Executive Order suspending the SCC on the grounds that it is “marked by logical deficiencies, a poor basis in empirical science, politicization, and the absence of a foundation in legislation.” The EPA has until mid-March to issue guidance on how to address these problems including possibly scrapping the use of the SCC altogether. I have had no contact with people working on that undertaking but if any of them were to ask me I would tell them the following.
Measuring the SCC is not a scientific procedure akin to measuring the weight of an atom or the speed of light. The SCC is based on so-called Integrated Assessment Models (IAMs) that contain countless assumptions and yield complicated “if-then” statements. If the following assumptions are true, then a ton of CO2 emissions will cause $X worth of damage to the world. Whoever gets to pick the “If” statements determines what the “then” statement will be. And you can pick studies that guarantee any SCC value you like, although some are more plausible than others. Ultimately the SCC is determined by the political and social process of choosing who gets to write the report. The Biden-era SCC report was written by people whose antennae were up for any reasons whatsoever to boost the SCC estimate, and who ignored evidence pointing in the other direction. The report even warns the reader that they probably overlooked many reasons why the SCC is even higher than they have estimated because surely there are many other damages associated with CO2 that they have not yet thought of. (They claimed to have taken account of the benefits associated with CO2 fertilization in one of their two IAMs, but they did so based on the M17 analysis. Which means, in effect, they didn’t take it into account.)
From an economic perspective, the dirty little secret of climate policy is that CO2 emission reductions are so costly, even if the US government accepted the Biden SCC estimate very few climate policies would survive a cost-benefit test, and if the SCC were lowered to something more reasonable none of them would. So in that sense climate activists will get no joy from hanging onto the SCC.
But beyond the question of what the magic SCC number should be, the bigger question is how you convince a bureaucracy not to rig the report-writing process. The 2013 Interagency Working Group SCC report boasted of consulting 11 separate government agencies, and the 2023 report additionally boasted of input from the National Academies of Science and outside expert reviewers. Yawn. The more agencies involved the less scrutiny a report gets. It is all but certain that no one checked any underlying data or undertook any replication work. And I know from experience in the IPCC and other bureaucratic processes that review comments going against a chapter author’s biases are ignored or argued away, while comments confirming an author’s biases are welcomed at face value. The scientific establishment has resisted all attempts to fix climate assessment processes because they always got to pick the authors. But now a very different team is going to do the picking. If the establishment grandees suddenly decide they don’t like the process, they should have said something sooner.

Ross …
“If the following assumptions are true, then a ton of CO2 emissions will cause $X worth of damage to the world. Whoever gets to pick the “If” statements determines what the “then” statement will be. And you can pick studies that guarantee any SCC value you like, although some are more plausible than others. Ultimately the SCC is determined by the political and social process of choosing who gets to write the report.”
How true, how sad, how hopeful. Sad that science can’t escape human frailties. Hopeful that climate science may give us a better understanding of … ourselves.
As always, you write so well, it’s a pleasure to read you.
I had rather hoped climate science would give us a better understading of climate. Silly me! ;)
Bill: “And you can pick studies that guarantee any SCC value you like”
Bab: “That’s why they call them pseudo-sciences, because they can make up any ol’ explanation”
Finally, we can move on.
The “social cost” of CO2 is the total amount of money spent to reduce CO2, which is a total waste, because more CO2 in the atmosphere benefits our planet’s plants. And the animals and humans who eat plants.
Larger plants
(assume average. of +10% for +100 ppm more atmospheric CO2)
Longer growing seasons
More arable land area
AI gives us a better understanding of climate:
A Critical Reassessment of the Anthropogenic CO₂-Global
Warming Hypothesis: Empirical Evidence Contradicts
IPCC Models and Solar Forcing Assumptions
https://scienceofclimatechange.org/wp-content/uploads/SCC-Grok-3-Review-V5-1.pdf
New Study by Grok & Scientists Challenges CO2’s Role in Global Warming
Bill: “And you can pick studies that guarantee any SCC value you like”
That’s why they call them pseudo-sciences, because they can make up any ol’ explanation, but can’t guarantee anything and are not falsifiable.
Mailman: hope does not give understa[n]ding of climate science – it takes hard study, adequate intellect and adequate background in a number of physical sciences. Good luck.
Bruce … so you agree, there is no social cost of carbon.
Bill, Nope, your statement is false, and you don’t get to define what I agree with. If it is question, formulate it properly and put a “?” at the end.
The social cost of carbon is not knowable, and estimates are not falsifiable. That does not mean there isn’t any. The first pillar of science is rationality – good luck.
Bruce … if “The social cost of carbon is not knowable, and estimates are not falsifiable” then there is no worrying about CO2 levels.
The social cost of carbon is social science. It is not science. No honest scientist would play that game.
Bill, the physical impacts are knowable (measureable). CO2 and social impacts of AGW are not the same thing.
Bruce … agreed, CO2 can be measured. But the predictions, not social science ones, that the increase of temperatures supposedly due to CO2 will then result in certain manifestations, necessitating the elimination of fossil fuels, have been consistently wrong. Since it seems warmists ‘can’t guarantee anything’ then the social cost of carbon is a concept with no factual basis.
This is a fascinating reanalysis of the SCC revision process and its reliance on incomplete data. The discrepancies between the C14 and M17 models highlight the importance of transparency in climate policy decisions. It’s concerning how much influence selective modeling can have on regulatory frameworks. For those interested in open access to scientific literature, including studies like these, you can find resources at https://sci-hubse.com/.
not much different from the science from the scientists used by the biden administration and Paul erlich.
Norman Borlaug &. Swaminathan have a much better handle on the science.
Wouldnt surprise me that the climate scientists doing the agricultural study had no actual expertise in agriculture.
https://normanborlaugagriculturalhero.weebly.com/dwarf-varieties.html
Who are we to believe?
Real scientists or climate scientists trying to one up Paul erlich?
That’s a nice logical fallacy – false dilemma. Typical NNN comment.
Its directly on point – Faux climate scientists expressing scientific conclusions far beyond their actual knowledge.
This is an important study. Ross has finally been able to publish. I wish the Canadian government paid some attention to the SCC in setting policies like the carbon tax.
“ask the starving”
Way to scream you’re not really serious.
Andrew
I don’t scream, and I’m deadly serious. What I am not serious about is discussions about science with anti-science NNNs.
Bruce Andrew (B A)
You mean the same populations that have been suffering the same problem for generations well before CO2 could have possibly been the cause?
Perhaps, instead responding with tropes, address the issues with the data used in the studies that was raised in this article.
Yup, they are the most vulnerable, rapid climate change makes it worse.
As for your advice, thanks, but in this case not interested.
True to form – Bb initiates the unfounded insults
In mathematical analyses of this complexity there are known unknowns and unknown unknowns that affect their uncertainty estimates. Examples of known unknowns include future use of fertilizer and uptake of genetic modifications, both of which have some unpredictable variables. An unknown unknowns might be the effect of the scale of future warfare.
In this particular case, the uncertainty of the sensitivity, both ECS and TCS, is large. The literature contains ECS estimates of zero, which would have a significant effect on this topic if correct, so is not adequately treated by being included with non-zero values to derive a statistical average. Overall, as Ross McKitrick demonstrates, there is large uncertainty arising from possible cherry picking by authors that is not included in the formality. Short summary – ask the farmers, not the academics. Geoff S
Yep, like I said, ask the sub-Saharans that have to grow their own food. Oops, I guess we are engaging in “tropes”, instead of paying attention to cherry-picked statistical analysis.
PS, Geoff, no comment on the original work that you requested, which demonstrates the use of LINEST (linear statistics) for multidimensional least-squares analysis? Did you miss it, do you want the link again, or did the cat just get your tongue?
There are many things about climate change that were unknown back when fear of global cooling morphed into fear of global warming and the AGW climate change hoax was pushed onto the public psyche but an unknown unknown at that time was how much Western academia both in Europe and in America, really hate America and in the process of fomenting fear of modernity, really could care less about maintaining the honesty and integrity of science, both in the classrooms and in government!
You mention known unknowns. One large unknown will be the adaptation of seed varieties that match the current climate at a given point.
One needs to peruse the seed variety catalogs for the major providers to find there are numerous categories to choose from. Length of growing season, precipitation, soil composition, temperature range, and so on. You can find varieties for all the major crops that meet requirements all the way from Canada to southern Texas.
This alone can provide any result one could desire.
Bushaw,
One of our cats won best in class and a rare medallion for Burmese in the big Melbourne show some years ago. We took on this cat, we studied cats, we gained adequate hands on experience to know our tongues were not under threat. I replied already to your Linest comment. Been using it for years. It has many functions whose choice is up to the user, not dictated by onlookers. BTW I have invested a large slab of my 2025 time to date on deeper research into heatwaves. The new outcomes, still work in progress, do not look good for the “hotter, longer” crowd. Geoff S
Sherrington,
Nice try, you asked for an example of my original work, I gave one. You didn’t respond to that. Instead, you deflected to you having used LINEST in the past – really, then why aren’t you still using it?
You have not shown any evidence that you have ever used LINEST, or even understand how – unless, of course, you are trying to hide something by not calculating uncertainties. It is sort of like you claiming your hobby science efforts make you a scientist. No evidence for that either.
Good luck with your continuing efforts. You might want to try proper point and line graphs (with uncertainties) for anomaly time series. I’m surprised you didn’t begin your bar graphs at absolute zero – perhaps you could make those pesky slopes and uncertainties virtually disappear. Also, summary graphs and statistical analysis for the overall conclusions, to support the hand waving, might be nice.
https://mega.nz/file/4qc1ACyT#57PNs8KfMebGtKRfUJ3OVw4fGzn8-4mDmrw9NvguO5g
“The Trump administration told US government scientists working on a vital global climate report to stop their work, according to a scientist involved in the report – the latest move to withdraw the US from global climate action and research.
The US had been highly involved in planning for the next installment of the report due out in 2029 from the Intergovernmental Panel on Climate Change, the world’s leading scientific authority on climate change.”
So, we were going to have to wait until 2029 to shred it to pieces?
https://www.cnn.com/2025/02/21/climate/trump-blocks-scientists-ipcc/index.html
Surface greening is observed and theoretically calculated at 3.0% per decade. This supports Ross’s case.
https://doi.org/10.3390/e25010072
Photosynthesis is a thermodynamic cycle. If everything else is the same, more heat yields more crop. That’s how crop grows: during the warming season and not during the cooling season.
https://doi.org/10.1007/s00231-019-02768-x
Pingback: Debunking the 2023 hike in the Social Cost of Carbon – Climate- Science.press
When it is cold in winters it is a great relief for the grid when housholds get warmed by petrol and natural gas heaters.
Cold winters are not for the green energy transition experiments.
–
https://www.cristos-vournas.com
Our electric provider has a “beat the peak” program to help reduce load. They stated in the latest promotion of that the utility is a “”winter-peaking” system”. This is along the gulf coast so a lot of electric heater use.
Athens is also a Southern city, but it is very cold for some two weeks now, and the price for electricity is very high.
Before global warming occured it was much colder in winters in Athens for many weeks in a row, but houses were much warmer, because we could afford it.
–
https://www.cristos-vournas.com
As regards the real cost of SCC, the real Earth doesn’t work like the Earth in the models. The Earth’s atmosphere doesn’t actually work like a greenhouse either.
The only thing we know with any degree of certainty is that in the final analysis Western science failed Western civilization. The education complex became nothing more than a too-big-to-fail, self-perpetuating government bureaucracy living off of the blood, sweat and sacrifice of the productive.
‘Uncertainty plays a huge role in this issue. It’s not that we expect disaster, it’s that the uncertainty is said to offer the possibility of disaster: implausible, but high consequence. Somewhere it has to be like the possible asteroid impact: Live with it.’ ~Richard Lindzen
Obviously some do believe more not less CO2 is the devil’s work and can only lead to disaster. They must believe plants breath in pollutants to survive and humans breath out pollutants. The war against CO2 has turned into a war against humanity by conservationist catastrophists, radical environmentalists and fundamentalist global warming alarmists, all facilitated by socialist Western academia. Humanity needs more not less energy.
Nuclear power plants are a cost-effective adaptive strategy for either a planet suffering from man-made climate change or a naturally warming world that will eventually run short of fossil fuels. Nuclear energy is the world’s biggest source of non-fossil energy and emits virtually no greenhouse gases. The First World has generally turned away from nuclear power as activist lawsuits have driven up regulatory costs. ~Fred Singer, et al. (Unstoppable Global Warming: Every 1,500 Years)
In Greece “From January 1, 2025, the sale and installation of heating oil burners in all buildings is prohibited. This provision seeks to limit the use of oil …”
Now, that it is cold in Athens, many housholds get warmed by woods burning in the modern appartments’ fireplaces.
–
https://www.cristos-vournas.com
… a reminder of 2010 when British elders were burning old encyclopedias for warmth because they were cheaper to buy than coal…
The “Social Cost of Carbon (SCC) estimate” reminds of Climate Sensitivity:
“Climate sensitivity is a term used by the Intergovernmental Panel on Climate Change (IPCC) to describe to what extent rising levels of greenhouse gases affect the Earth’s temperature.”
–
https://www.cristos-vournas.com
Doesn’t remind me. I understand one is social “science” where you can make up anything you want, and the other is physical science based on empirical (measured) evidence. It is often easy to tell the difference – look for uncertainties and probabilities in the original literature (not popular media reports that tend to drop them).
Thank you, B A.
Please read at the top of the Ross McKitrick’s article:
“An influential 2017 study had argued that warming would cause large losses in agricultural outputs on a global scale, and this played a large role in an upward revision to the Biden Administration’s Social Cost of Carbon (SCC) estimate, which drives regulatory decision in US climate rulemaking.”
–
Don’t you see? Both, the “Climate sensitivity” and the “Social Cost of Carbon (SCC)”, both approaches to the Earth’s global warming are based on the mistaken assumption that there is an Anthropogenic Global Warming (AGW).
–
https://www.cristos-vournas.com
Judith, Its high time that both Bushaw and Vournas were banned, for say 3 months. Bushaw is just a disruptor and Vournas just keeps repeating his pet theory whatever is under discussion. It’s not helpful at all.
Ross McKitrick has written an article of some significance and it deserves to be discussed by serious contributors.
To paraphrase Louis Brandeis, the best way to counter unwanted speech is more speech.
Nice
I suspect that the linked McKitrick paper followed the format of the M17 paper modeling results. I am, however, wondering why explanatory variables were apparently not removed from the model using anova and/or log likelihood tests for the addition or removal of variables from the final model – those variables without statistical significance being prime candidates for removal. The explanatory variables cannot meaningfully be scaled with dummy variables so that precludes looking at the relative importance of the individual variables.
That is a very large difference in end results occurring by adding back some of the originally excluded data and is puzzling why the M17 author(s) did not perform cross validations on their less extensive original data.
I see this too frequently in climate science (not that it does not occur in other areas of science) from all sides of the issue of expected damage/benefits of climate change where studies come up with a result that fits policy predilections, gets published and later fails on neglected data and/or testing that seems the result of a hurry to the publishing finishing line.
I appreciate the clarity with which McKitrick writes here and in publications elsewhere.
Ken – I see variations of those type errors in most every study dealing with a controversial / politicalized subject. As you note, its quite common in climate science, though it was extremely common with most every study with covid. The only thing really surprising is the willingness to defend and promote studies with errors so obvious that layman can spot the errors, whether it be bad math, bad logic or inappropriate use of invalid or weak methodology.
I never–never–see anyone writing about this, but there is also a social cost of removing carbon.
From the point of view of one who spent most of his like in the field of ‘power generation’ (for electrical generation, marine propulsion, stand-alone land based use,–) a social cost, from several to many aspects, is enormous. What is worse, in today’s ways of life, very few a prepared for any change. On the contrary most everyone is moving on headlong on more dependence on plenty of power readily at hand. Even the production of the supposedly carbon-free power generation is fully dependent on carbon as a source of support.
I agree, Thomas.
I’m curious about the EU’s prioritization; between the social cost of carbon and the social cost of security.
The EU announced they will spend nearly $800+ billion in a collective defense spending buildup over the next year; essentially matching what the US spends any given year. Does this reflect a systemic change in funding priorities?
The question remains: will the EU spend on their defense every year, matching the US, or is their announcement a flaccid one-off year “ad”, to impress Russia/or the Ukraine? Is this a one-year promotional media buy statement—we’re not losers after all? If they’re not leeches and ingrates, they’ll be forced to spend every year to pull their “Western weight”. I doubt they will (I hope I’m wrong).
The EU has a real problem, spending on faux social equity concerns, or defending themselves against the new axis world order?
More carbon, or a much bigger axis; this is the question— feign future concerns, or the burn in reality.
Sooner or later reality bites …
in
evit
ably.
The premise that CO2 increase is a significant cause of planet warming is false. Examination of paleo proxy data and recent measured data shows that CO2 does not now, never has and never will have a significant effect on climate.
Measured water vapor has been increasing on average about 1.4 % per decade which is more than twice as fast as possible from just planet warming. The water vapor increase can account for all climate change attributable to humanity with no contribution from carbon dioxide (burning fossil fuels). An engineering/science analysis examining this is at https://watervaporandwarming.blogspot.com
It is not a premise, it is a well established scientific theory that seems to confound engineers – at least the ones that propose alternate hypotheses here on CE.
Whether or not it (the idea that CO2 change causes climate change) is a ‘well established scientific theory’ (by some) does not make it correct. Measurements and analysis demonstrate that it is wrong. The truth becomes apparent with correct calculation that demonstrates that water vapor has been increasing more than twice as fast as possible from just planet warming.
Dan: ” Measurements and analysis demonstrate that it is wrong.”
Which measurements and analysis? Citations please.
The measurements and analysis are documented in the link. When are you going to start thinking for yourself?
Thanks, Dan
Good luck, maybe you too can make a YouTube video. Or, you could submit it to a known atmospheric science journal and let experts review and comment on your claims.
I wonder how large the separation between the rapidly rising CO2 and barely-rising temperature will need to get for some people to begin to realize that perhaps they missed something.
Dan,
What do you think about the ratio of non-condensing green house gases to water vapor (H2O is the #1 green house gas) and could it cause higher air and ocean temperatures?
CO2 is only one of many GHG emissions that are increasing,
https://www.climatelevels.org/
Personally I think the 250,000 novel man-made molecules we are dispersing thru the biosphere are the real problem. It took us 40+ years to admit to the public that the toxic PFAS/PFOS family of chemicals can cause all kinds of illness and genetic damage. If they just affected humans it’s no big deal but to pollute the whole planet and all the other life forms seems suicidal.
We are the apex predator – who’s going to stop us?
Dan, If you are confident in your work and think it is important; submit it and let us know when it is published in a known journal, and has been vetted by experts in the field. Good luck.
Dr. Soon made a great video using archilolgical evidence to debunk CO2 driven climate change. https://youtu.be/rP_sfbslAh0
B A Bushaw:
It may be a well established scientific theory, but, in terms of causing global warming, it is FAR from being an actual fact.
Since about 1980, due to Clean Air legislation, industrial SO2 aerosol pollution has been falling, cleansing the air, and increasing the intensity of the solar radiation striking the Earth’s surface, causing warming. THIS is an irrefutable FACT.
But you and your ilk dishonestly (or stupidly) claim that this warming is due to rising levels of CO2!!
(Our modern warming has parallels in history, such as during the Roman and Medieval Warming periods, which were periods of very little volcanic activity, so that their atmospheres were essentially free of any dimming SO2 aerosol pollution during those times)
There is no proof that the increasing concentration of CO2 has impacted our climate, only a correlation which has recently been shown using the NOAA data to demonstrate that global warming drives the increasing concentration of CO2.
Pangburn is absolutely correct. Global warming is the result of the increasing concentration of water vapor.
You are correct, there is no proof (Popper), there is also no proof for what you and Dan, and Burl, and Christos, and to a lesser extent – Cutler, claim; that is clear since they are mutually exclusive. The best we can do is weigh the evidence and pick what seems the most probable. As a physicist and chemist, with background in high-resolution small-molecule spectroscopy (among other things), I find AGW – CO2(e) theory to be extremely likely, and substantially correct; while acknowledging there are many other effects that may contribute, in both directions, but I don’t see sufficient evidence to support any of them as major contributors to climate changes over the last 60 years or so.
https://climate.mit.edu/ask-mit/why-do-we-blame-climate-change-carbon-dioxide-when-water-vapor-much-more-common-greenhouse
Bruce …
“The best we can do is weigh the evidence and pick what seems the most probable.” That’s incomplete, at best. If you are advocating that society move from state ‘A’ to state ‘B’ to avoid state ‘C’, the burden is on you to prove your conjecture. Extraordinary claims, requires extraordinary evidence – C. Sagan.
Bill,
The problem with that is, there is extraordinary evidence.
B A Bushaw:
I had responded to this post earlier, but it was in moderation, so you may have missed it My response is above, March 1, 10:03 a.m.
Burl,
I didn’t miss your comment – I ignored it. You had nothing new to offer.
Bill,
Using a quote from Carl Sagan to justify climate inaction is a bit like finding a quote from Abraham Lincoln to justify slavery. Here are some more relevant things he said:
On contemplating photos of the earth taken from the moon:
“There is perhaps no better demonstration of the folly of human conceits than this distant image of our tiny world. To me, it underscores our responsibility to deal more kindly with one another, and to preserve and cherish the pale blue dot, the only home we’ve ever known.”
In testimony to Congress in 1985:
“here we are pouring enormous quantities of CO2 and these other gases into the atmosphere every year, with hardly any concern about its long-term and global consequences.”
On people like yourself:
“We live in a society exquisitely dependent on science and technology, in which hardly anyone knows anything about science and technology.”
“Using a quote from Carl Sagan to justify climate inaction is a bit like finding a quote from Abraham Lincoln to justify slavery.”
Oh please, a pathetic analogy. Excluding posed generalities, your framing translates tacitly to mean virtually nonexistent—though flower child appeal duly noted. We love Sagan, and especially our blue marble.
“…hardly anyone knows anything about science and technology.” Fortunately everyone knows plenty about political maneuvering, especially the IPCC.
“Excluding posed generalities, your framing translates tacitly to mean virtually nonexistent—…”
huh?
The proof that it is not CO2 is double. 1. Paleo and recent CO2 data shows no correlation between CO2 and T at CO2>300 ppmv. 2. Average global water vapor has been increasing about 1.4 % per decade which is more than twice as fast as possible from just planet warming. Analysis with graphs is at https://watervaporandwarming.blogspot.com
The WV increase results from tiny increase in residence time. The residence time increases to account for the time required for the WV to get from where it is added (mostly from increasing irrigation) to where it is precipitated.
Dan, since you are not a scientist, let me suggest a search term for you: “Is there proof in science?” If you don’t know what proof means, you can hardly offer it.
There is absolute proof for what I say.
The data and the thermodynamics show that over the period 1880 – 2019 the average global temperature determined solely from changes in the average global concentration of water vapor are within 0.06°C or 0.4% of the NOAA average global temperature measured in Celsius data.
Thanks for your thoughts, Bill – you are wrong. Provide references for your claims.
B A Bushaw.
I agree. Nothing new, but you have NEVER refuted the fact that warming will naturally occur whenever the amount of SO2 aerosol pollution in the atmosphere decreases.
And you have never provided any empirical proof that CO2 actually causes any global warming–it is just a an unproven hypothesis
https://mega.nz/file/4qc1ACyT#57PNs8KfMebGtKRfUJ3OVw4fGzn8-4mDmrw9NvguO5g
That is empirical disproof (real data sets, real math). Get over it.
Given that:
1. There is NO proof that CO2 plays a role in global warming;
2. The average global temperature record requires the heating from whatever is driving these significant changes to rise and fall, and, over time, except for the period 1899- 1903, the concentration of CO2, never declined.
3. Instead, the correlation of the cumulatively increasing average global temperature with the increasing concentration of CO2, is cited as evidence therefor, which just like the divorce rate in Maine correlates with per capita margarine consumption, is meaningless. Just like margarine consumption does not cause divorces, or divorces drive margarine consumption, the increasing concentration of CO2 does not drive global warming.
4. The reason that there is no proof that the increases in the concentration of CO2 drive global warming is because……… it doesn’t.
In fact, a recent stochastic study published by Dr. Demetris Koutsoyian shows just the opposite. The increases in the average global temperature precede the increases in the concentration of CO2. Global warming appears to be driving the increases in the concentration of CO2 and given that warming seas can retain and absorb less CO2, there appears to be a likely scientific explanation for that.
5. But global warming is very real, so what drives it?
Changes in the average global concentration of water vapor ALONE, drive the changes in the average global temperature.
This is not merely a correlation. The physics, validated by NOAA data proves this.
There can be no doubt that changes in the concentration of water vapor drive both global warming and cooling.
Moreover, these changes in the average global concentration of water vapor are driven by the same factors that drive global weather, El Niños and La Niñas, caused by significant changes in undersea currents and Tradewinds in the Eastern Tropical Pacific, five months earlier.
The increasing concentration of CO2 is not synergistically related or even indirectly relevant to the determination of the average global temperature.
Humankind does not have a role in climate change.
William van Brun:t:
It can actually be proven that CO2 has no climatic effect
See: Scientific proof that CO2 does NOT cause global warming
https://wjarr.com/sites/default/files/WJARR-2024-0884.pdf
The warming is actually due to decreased levels of industrial SO2 aerosol pollution in the atmosphere due to “Clean Air” legislation.
Burl, your paper is false and disproven. Give it up. Your ego is making you look foolish.
B AS Bushaw:
Your “disproof” is made-up garbage. It ASSUMES that CO2 has a climatic effect, which has never been empirically proven.
Get over it!
You already said that – it is a lie, and I already corrected you on it. One more time:
No, it doesn’t ASSUME CO2 has a climatic effect, it ALLOWS CO2 (really CO2(e)) to have a climatic effect, just as it allows SO2 to have a climatic effect. It is the DATA and REAL STATISTICAL ANALYSIS based on PHYSICAL CAUSALITY that SHOWS that CO2(e) is the major driver of current climate change (since 1900), and goes further to quantify the relative contributions and their statistical uncertainties.
Your hypothesis is still disproven, and you can’t defend it scientifically (it isn’t defensible); instead, calling the disproof “made-up garbage”, when it obviously isn’t.
Starting at about 9 minutes in, a fascinating interview with Nuclear Physicist Digby McDonald on this topic:
https://www.theepochtimes.com/epochtv/nuclear-scientist-exposes-flaws-in-the-theory-blaming-co2-for-climate-change-5815424?ea_src=frontpage&ea_cnt=a&ea_med=us-politics-right-3
Dr. McDonald is a member of the CO2 coalition:
https://co2coalition.org/publications/
This was meant as a reply to Wllliam Van Brunt’s post, temperature leads CO2.
Sometimes, not now.
Yes, now.
Greenhouse warming and internal variability increase extreme and central Pacific El Niño frequency since 1980
https://pmc.ncbi.nlm.nih.gov/articles/PMC9873625/
And then.
https://www.nature.com/articles/s41586-022-05536-w
Trunks, Nature paywall, but from the abstract:
“We find support for a relatively mild millennial-scale global thermal maximum during the mid-Holocene, but more research is needed to firmly resolve the conundrum and to advance our understanding of slow-moving climate variability.”
Right now, it is fast moving climate variability on climatic time scales, and the skeptics, you included, are frantic.
Internal climate variability is one of the stochastic oscillations that average to zero on world climatic time scales. What forcing do you claim creates the temperature change that produces
that ol’ unimportant CO2 (which happens to have a very well understood physical causality, and supporting empirical data).
https://pubsapp.acs.org/cen/coverstory/87/8751cover2.html
https://pubsapp.acs.org/cen/coverstory/87/8751cover2.html
We know that the climate warmed mid-Holocene, bab.
Nobel Laureate John Clauser delivers a presentation at the Competitive Enterprise Institute, he tackles the many false and misleading claims of climate activists and mainstream climatologists.
“The theory, and observational data is wrong”
https://co2coalition.org/media/nobel-laureate-john-clausers-speech-at-the-competitive-enterprise-institute/
Appeal to false authority. Dr. Clauser is not a climatologist, he is a quantum physicist interested in quantum entanglement. PLease cite his publications on climate matters. Thanks.
The whole IPCC narrative is a false authority.
I’ll add, relative to your own flapping hand, you’re also not a climate scientist, bab.
https://pubsapp.acs.org/cen/coverstory/87/8751cover2.html
December 21, 2009 Volume 87, Number 51 Web Exclusive
Climate Debate
Which Comes First, CO2 Or The Heat?
Stephen K. Ritter
–
Still…
jt:
“The whole IPCC narrative is a false authority.
I’ll add, relative to your own flapping hand, you’re also not a climate scientist, bab.”
I don’t claim to be a climate scientist, just a physical/natural scientist with lots of background (and publications) in electromagnetic radiative interactions. You, OTOH, are just another no-name nobody, with no known (or demonstrated) background.
I do appreciate the continued not-so-clever oblique Pollyanna references: (1) I’m glad I’m optimistic (2) it is a tell, when you get caught for claiming ridiculous things like The MWP is now (3) it continues to show what an a$$ you are.
Polly: “..with lots of background (and publications) in electromagnetic radiative interactions”
A tiny amount of published material compared to the two authors I’ve linked relative videos to. You’re low level science fodder, though while hand flapping you’ll still argue that you remain highly relevant.
jt,
“A tiny amount of published material compared to the two authors … “.
By all evidence, it is infinitely more than you have published.
And actually, I have published more than Dr. Clauser – yet another failed insult attempt. Who was the other one? pathetic trunks.
And such a weak deflection; you can cite anyone you want. So can I. But I was talking about you being an NNN. Nonetheless, go ahead – cite a scientific paper by Dr. Clauser that deals with climate change. If the only thing that matters is being a laureate, I can, and have, give(n) you a list of 78 Nobel science laureates who disagree with him.
Your logical fallacies and attempted insults remain the same – no value beyond watching you make a fool of yourself.
What climate paper, Polly? You’re a full of flap activist.
NNN – can’t answer my simple question = no value. I can answer it: I’ve published as many climate papers as Dr. Clauser.
The western circulation is braking hard in the stratosphere over North America, which will prolong winter in the US.
https://i.ibb.co/60VFkrGv/gfs-toz-nh-f00.png
Off the top of my head these are some of the influences, factors, mechanisms and processes that affect the Antarctic SMB, ice shelves and glaciers per hundreds of climate science studies.
ENSO, SAM, ASL, CDW, bathymetry, thermocline shallowing, Thermohaline, current speed, westerlies, easterlies, Interdecadal suppression of westerlies, barotropic variability, sedimentation basin variability, basal heat flux, firn density, subglacial hydrology, geothermal activity, unloading of AIS affecting magma which in turn influences level of basal heat flow, subglacial lakes, channelization, subglacial cavities, local rheology, basal sheer stress, ice flow direction and velocity, episodic high magnitude discharge from subglacial lakes, Interdecadal atmospheric variability, sea ice freshwater fluxes, baroclinic effects, coastal polynya buoyancy, tidal forces and ice shelf pinning points.
I’m sure there are many more that I have forgotten.
Even with all these factors that play a role in the dynamics of the AIS, ice shelves and glaciers, the climate catastrophe corps are obsessed with CO2.
Pathetic
It makes sense that more C02 is released during warm periods – processes of decay happen faster.
BA, At the point of saturation, does C02 release or retain more of the re-radiated infrared spectrum?
At what point does a scientist become a “scientist”? Considering the forefathers of old theories and scientific equations.
C02’s properties have been known a long time, but “man-made warming causation” findings are relatively new, why?
How many btu’s is C02 capable of providing vs water vapor?
Much of the plain speak on “greenhouse gases” mention water vapor first, C02 second.
Casual observance makes this especially noticeable with cloud cover and the timing of it. Sunny days warm the earth and when cloud cover or more moist air moves in overnight, the night time temperature is warmer. When nights are clear and dry, temps fall by a much greater degree
https://earth.nullschool.net/#current/chem/surface/level/overlay=co2sc/patterson
The Bell McDermott study of premature mortality due to increase on ground level ozone (96 US cities) provides an excellent lesson as to why scientists should not be overly enamored with “correlation”
The conclusion of the study was that increases in ground level ozone was directly associated with increases in pre maturity mortality. The correlation was around 60% for the increase in ground level ozone, yet the correlation with increases in temperature was nearly 100%. There were several other issues with the study, that the study authors ignored, if for no other reason is they got the answer they wanted.
The lesson being dont let yourself get fooled by “correlation.
“It makes sense that more C02 is released during warm periods – processes of decay happen faster.”
Yes – annual cycles are easily observed, and hemispheric cancelling is not complete.
” BA, At the point of saturation, does C02 release or retain more of the re-radiated infrared spectrum?”
Define the point of saturation. We clearly haven’t reached it yet. Nonetheless, very little of either (a false dichotomy). Collisional time and thermalization occurs in nanoseconds. It is mostly the higher kinetic (motional) energy of the background atmospheric gases that produce the (broadband) re-radiated IR.
“At what point does a scientist become a “scientist”? Considering the forefathers of old theories and scientific equations.”
When one starts understanding scientific method and its principles, and uses it to gain new knowledge about the physical universe.
What is it you’d like to have considered about old theories and equations?
I’d recommend “Scientific Method in Brief” by Hugh G. Gauch, Jr. [2012] if you are interested in the history of the development of scientific method (and hence what a scientist does).
‘C02’s properties have been known a long time, but “man-made warming causation” findings are relatively new, why?’
Because the effects had not grown enough to be distinctly observable until “recently” in the last 100 years. This is because long-lived GHG emissions integrate in the atmosphere (water does not). As for “relatively new” I refer you to Arrhenius 1896 (and subsequent comments) for theory, and Callendar (1938) for observation.
“How many btu’s is C02 capable of providing vs water vapor?”
Not specified well enough to give an answer. You can look at the IR spectra to see which is best matched to earth’s heat (IR) emissions. Clue: Water vapor has a transmission window there (~11 – 16 µm) while the CO2 bending vibration matches the earth’s emissions quite well, and lies within the “water window”.
‘Much of the plain speak on “greenhouse gases” mention water vapor first, C02 second.’
Yes they do: It is an important temperature mediated feedback that, at given average concentrations, causes more radiation trapping than the noncondensing GHGs.
“Casual observance makes this especially noticeable with cloud cover and the timing of it. Sunny days warm the earth and when cloud cover or more moist air moves in overnight, the nighttime temperature is warmer. When nights are clear and dry, temps fall by a much greater degree.”
Yes the phase changes of water are very important, that, and its reservoirs, make it very different from non-condensing GHGs.
For those who refuse to believe that an increase in atmospheric carbon can cause temperatures to rise, please explain to me what, other than the sudden massive release of fossil carbon to the environment, caused the Paleocene-Eocene Thermal Maximum. The evidence for a massive fossil carbon release is the decrease in the proportion of 13C.
Note for the catastrophists, other than benthic foraminifera, there were no mass extinctions during the PETM.
Perhaps your question is quite easy to explain now.
Background: Data has been collected now over several years from various sources, when and as they presented themselves. The root driver is large changes in earth’s obliquity. The latter was a questionable factor but now this last year proven for certain.
Pls see link here (the only way it can be shown):
https://www.facebook.com/photo/?fbid=1957722401069222&set=pb.100063509740636.-2207520000
The two graphs are two superimposed graphs. One is from an Ito & Hamano paper, latitude temp gradient for varying earth axial tilt. The other is a comparison of lat temp gradient for Eocene and as per today. The lower is for the present gradient, matching an ~22deg tilt; the higher is for Eocene matching a 40-50 deg tilt.
Eocene temp gradient is higher. At that higher tilt orientation, Thermal residence time is higher (earth as a rotating heat exchanger) ; ie higher temp levels.
The outstanding question there was ascertaining that obliquity varied more than thought. Now proven so.
That may explain the relative warmth of the Eocene, but it says nothing about the spike in temperature during the PETM.
I draw a blank on that; a temp spike in the Eocene. However such is not something unknown and it can be for similar reason; an obliquity fling.
Such is not unknown, in fact one has taken place in 173CE. To cut short see ref in link: https://melitamegalithic.wordpress.com/2022/10/31/searching-evidence-astronomy-for-the-heretic/
Ref paper at bottom specifically mentions a temp spike recorded in the sediment proxy.
Volcanic activity or methane hydrates conjectured to leading to a significant greenhouse effect resulting in global warming is a failed hypothesis from the get-go because, the ‘greenhouse effect’ is quite literally the result of a lack of convection not the addition of CO2. You can roast a dog in the backseat of a car when the windows are rolled up, even on a mildly sunny day, the hot dog having nothing to do with the addition of CO2. Moreover, volcanic activity most often results in cooling due to pollutants in the atmosphere blocking the sunlight. Saddam Hussein took Carl Sagan’s conjectured nuclear winter to heart when he torched oil wells in the Mideast.
There has never been convective energy transfer to or from space. All energy transfer is by radiation.
How about LIPs?
“Define the point of saturation”
I was referring to the molecule being saturated with energy. Assuming the wavelengths are continuously bombarding it. At some point I would think it will stop absorbing the wave and reflect it or allow it to bypass.
That “some point” would be well above the intensities available from earth’s thermal emissions. Particularly when that energy is not accumulated, but transfered collisionaly
Oops [cont] … but transferred collisionally to surrounding air molecules on nanosecond time scales.
Since most of your questions revolve about CO2, this may help.
https://doi.org/10.1002/wea.2072
UAH lower troposphere measurements show 2025 is colder than 2024.
2024 1 0.80
2024 2 0.88
AVG: 0.84
2025 1 0.46
2025 2 0.50
AVG: 0.48
It ain’t the hottest year EVA!!!
https://www.drroyspencer.com/2025/03/uah-v6-1-global-temperature-update-for-february-2025-0-50-deg-c/
No it doesn’t show that. It shows that the first two months of 2025 were colder than the first two months of 2024. And it shows temperatures averaged over the lower ~5 km of the atmosphere, not the surface, where “hottest years EVA” are compared. But that is OK and understood, rejectionists seem to need to find solace in misrepresentation wherever they can.
“The January global surface temperature was 2.39°F (1.33°C) above the 20th-century average of 53.6°F (12.0°C) and 0.05°F (0.03°C) above the previous record set last year, making last month the warmest January on record. According to NCEI’s Global Annual Temperature Outlook, there is a 7% chance that 2025 will rank as the warmest year on record.”
https://www.ncei.noaa.gov/news/global-climate-202501
The global coverage for NOAAGlobalTemp is inferior to UAH sat coverage. Also, I note NOAAGlobalTemp recently implemented a neural network in a (fruitless) attempt to make the series more accurate.
Jim2,
Nope, MSUs have no surface coverage at all, they only cover broad layers of the atmosphere.
Like I indicated, get your comfort where you can. I’ll go with the combination of ground stations and SURFACE satellites, such as GISTEMP or HADCrut.
You would be better off consulting chicken bones than NOAAGlobalTemp.
NOAAGlobalTemp is a conglomeration of disparate datasets thrown into a bucket and shaken. It’s laughable they report temperatures to the third decimal point.
Thank you, B A.
https://judithcurry.com/2025/02/21/debunking-the-2023-hike-in-the-social-cost-of-carbon/#comment-1015812
““The January global surface temperature was 2.39°F (1.33°C) above the 20th-century average of 53.6°F (12.0°C) and 0.05°F (0.03°C) above the previous record set last year, making last month the warmest January on record. According to NCEI’s Global Annual Temperature Outlook, there is a 7% chance that 2025 will rank as the warmest year on record.”
https://www.ncei.noaa.gov/news/global-climate-202501”
And,
https://judithcurry.com/2025/01/30/how-the-green-energy-narrative-confuses-things/#comment-1014987
“…the 20th-century average of 57.0°F (13.9°C).”
https://www.climate.gov/news-features/understanding-climate/climate-change-global-temperature
Somebody doesn’t read the highlights of the article they quote, much less the whole thing.:
“It was 2.12 °F (1.18 °C) above the 20th-century average of 57.0°F (13.9°C).”
–
–
First it was:
“the 20th-century average of 57.0°F (13.9°C)”
Now it is:
“above the 20th-century average of 53.6°F (12.0°C)”
Interesting, it is (1.9°C) warmer now!
–
https://www.cristos-vournas.com
Of the adjustments applied for GHCN Version 4, 64% (61% for Version 3) were identified on less than 25% of runs, while only 16% of the adjustments (21% for Version 3) were identified consistently for more than 75% of the runs. The consistency of PHA adjustments improved when the breakpoints corresponded to documented station history metadata events. However, only 19% of the breakpoints (18% for Version 3) were associated with a documented event within 1 year, and 67% (69% for Version 3) were not associated with any documented event. Therefore, while the PHA remains a useful tool in the community’s homogenization toolbox, many of the PHA adjustments applied to the homogenized GHCN dataset may have been spurious
https://www.mdpi.com/2073-4433/13/2/285
Jim2,I would trust chicken bones over you. NOAAGLOBALTEMP is consistent with all the other major global temperature data sets.
Christos, One is the January average, the other is the yearly average. Comprehension is a good thing – try it if you are able.
All the sewer flows during the Superbowl are consistent, but it’s still all s***.
Thanks, Jim,
Always good to know when the last vestiges of intellect have disappeared, the tell is when irrelevant potty joke show up.
Thank you, B A.
“Christos, One is the January average, the other is the yearly average. Comprehension is a good thing – try it if you are able.”
–
“the 20th-century average of 57.0°F (13.9°C)” (the yearly average)
“above the 20th-century average of 53.6°F (12.0°C)” (the January average)
Interesting, it is (1.9°C) warmer (on the yearly average) vs (on the January average).
–
Please, B A, why it is the globe (on average) is colder on January?
Earth is closer to the sun in January, because Earth is at Perihelion.
–
https://www.cristos-vournas.com
Well, the globe (on average) is colder on January.
Earth is closer to the sun in January, because Earth is at Perihelion.
Yet the GLOBE IS COLDER when it is closer to sun in January, when Earth is at PERIHELION.
And it is happening so, because Earth is in a millennials long warming pattern.
It is a warming pattern (not a cooling one), because Earth at Holocene Optimum was much colder – and it is getting warmer and warmer now.
At Holocene Optimum the Earth was not at warmest in Holocene Era, but at coolest.
Because everything is quite different, because everything is quite the opposite, than it is thought to be.
–
https://www.cristos-vournas.com
Yep, we are in the ‘New’ (Neoglacial) Age of the period following the peak of the Holocene Optimum.
NASA/RSS deleted their average global Total Precipitable Water (TPW) anomaly web site (TPW anomaly Jan 1988 thru Dec 2023). The site was deleted in early January but can still be obtained via the WaybackMachine. I wonder what they are up to. An email enquire re this to RSS support was non-committal. Perhaps a letter to the new NASA Administrator, Janet Petro, will be helpful.
Measured water vapor has been increasing at about 1.4 % per decade. This is more than twice the maximum possible from just feedback from planet warming and can account for all of climate change attributable to humanity.
Dan: “Measured water vapor has been increasing at about 1.4 % per decade.”
Yes, that’s what the science says.
Recent studies document a recurring pattern of extreme El Niño’s over the last 150 years, beginning in 1875. Resultant warming increased atmospheric WV; a feedback response ensued–ever increasing atmospheric WV/amplified warming/continuation of strong El Niño’s.
El Niño frequency since 1980
https://pmc.ncbi.nlm.nih.gov/articles/PMC9873625/
Measurements show that average global WV tracks the el Nino events, returning to pre-el Nino values at the end of each el Nino event. This is observed in the 1998 and 2016 el Ninos, e.g. Fig 7 & 7.2 in the engineering/science analysis at https://watervaporandwarming.blogspot.com . NASA/RSS has yet to report the WV measurements (as TPW anomalies) through 2024.
Banner at top of:
https://www.earthdata.nasa.gov/data/catalog/ghrc-daac-rss-monthly-1-deg-microwave-total-precipitable-water-netcdf-version7-revision-00-7
says:
” ! Content from all Earth science data sites are migrating into this site from now until end of 2026. Not all NASA Earth science data will appear across the site until then. Thank you for your patience as we make this transition.
Meteorological winter, which runs from December to February, ended this weekend. Not only did it give way to meteorological spring on March 1 in the Northern Hemisphere — it ended the coldest three month period in the United States since the winter of 2013 to 2014.
It was about 1.1 degrees below average as a whole in the contiguous United States, which was home to some of the most unusually cold air on the planet — a part of western Kentucky that was almost 7 degrees colder than average.
https://www.msn.com/en-us/weather/topstories/the-u-s-just-experienced-its-coldest-winter-in-more-than-a-decade/ar-AA1A8sEr
True, but also should be seen in the context of the whole world.
https://www.ncei.noaa.gov/news/global-climate-202501
see the temperature map.
‘Debunking?’ How about pulling Federal funding from schools that pay academics to blame persons for driving to work to feed their families and pay for the conveniences of modernity that Leftist would riot in the streets if deprived of, for raising the temperatures around the globe and threatening the future of all humanity, all the while planning for their next get together in Cancun or a luxury yacht in the port Hercule of Monaco?
Earth is going through a very slow and naturally caused warming trend!
Earth’s energy never balances, as both incoming and outgoing energies constantly vary.
Earth Energy balance, uses units of energy.
To actually find Earth’s energy Imbalance, energy-in must be compared to energy-out.
The temperature is going up – it’s called orbitally forced climate change phenomenon.
–
Planet Earth is very slowly getting warmer. It is happening due to orbital forcing.
=
Link: https://www.cristos-vournas.com
There is the widely used narrative which claims Earth is in orbitally forced natural cooling trend (Milankovitch), and the CO2 rising content greenhouse warming effect being very much stronger and overlcoming the natural cooling – and that is the cause of the global air temperature rise.
Well it is put on very convincingly – ‘you know, it should be naturally cooling, but it is warming – it is the fossil fuels burning to blame!’
Well, it is all wrong, because Milankovitch made a mistake. The orbital forcing is towards the natural warming, and not cooling.
Therefore there is not any significant influence on global air temperature from the fossill fuels burning.
–
Link: https://www.cristos-vournas.com
This is a follow up to a year-old conversation:
In March of 2024 Dr. Curry posted Javier Vinos’ article on “The Extraordinary Climate Events of 2022-2024”. The record high temperatures of 2023 were due to the Hunga Tonga volcano, he said. The coming year will be cooler, he said. Wrong. 2023 is now the second hottest year on record and 2024 is the hottest. Climate scientists were correct. This particular skeptic was wrong.
Until about two weeks ago one could read about the 2024 record, and about January 2025 being the hottest January on record, on the NOAA website. Unfortunately you can no longer do so there, but the Berkely Earth website still provides data. It appears that not only is US foreign policy now built on a lie, but going forward US climate policy will ignore inconvenient data and protect its citizens from it.
UAH sat data is much more consistent from year to year. No pair-wise adjustments, or a mishmash of disparate data sets with continual changes in the historical record as well as continual changes to the method. UAH is consistent! UAH shows the first two months of the year cooler than 2024. You can apply the lapse rate if you want to see the surface temp change, but there is no need for this as UAH is presented as anomalies.
That’s fine Jim. It’s still not where plants and animals live. And, you can’t make lapse rate projections: 6.5 C/km is an average of a variable that can vary anywhere from 3 – 9. You can stick with a couple of miles up it if it makes you feel better – you could pick something in the stratosphere, it is getting colder there – do you understand why? I appreciate your deflection, but it does not represent GSAT, the accepted standard for measuring global temperature changes (anomalies). You’re grasping at straws, but that is perfectly normal around here.
You are nothing if not a good water boy, Mr. B.
Essentially, you are saying that even though the lower trop temp for 1/25 is lower than that for 1/24; by some mysterious process, the ground temperature for 1/25 is higher than that of 1/24. You aren’t being logical.
Apparently mysterious to you, Jim. Not mysterious to atmospheric scientists. Guess you are one of the willful ignorants that believes that multiple measurements and cross- referencing are bad things. But then it has been clear for a long time that you have no idea of how science works.
Your response contains no explanation for the UAH results vs the NOAA series Just more name calling. I expected more of a real scientist.
Christos Vournas
The Earth has been around for billions of years.
Why is it only now warming up?
Thank you, burlhenry.
“Christos Vournas
The Earth has been around for billions of years.
Why is it only now warming up?”
–
I don’t know, burlhenry. Some say Earth, in billions of years, will evaporate.
I keep optimistic though. People will think of something.
–
Link: https://www.cristos-vournas.com
I think it is pizza deliveries, which have been steadily growing since 2013, and probably throughout the industrial age.
Jimmy, You have more than earned any insults I have for you, water boy.
That was a challenge for you to educate yourself on commonly known material – You failed.
https://newsroom.ucla.edu/releases/stratospheric-cooling-vertical-fingerprinting
All fluff, no meat.
Severe storm in central US. Tornadoes on the eastern side, snowstorms on the western side.
https://i.ibb.co/s9wSHJ5B/archive-5-image.png
B A Bushaw
“I think its pizza deliveries”
Bingo!
IP, check planetary conjunctions, particularly for yesterday (E,moon, J) and E,V. Gravity vector changes as site pass thru’ conj.
Two rulings issued today in the Mann V Simberg / NR/Steyn suit
1) Punitive damages reduced from $1,000,000 to $5,000
2) Judgment for damages of $1,000 + $5,000 punitive damages not stay.
Appears final result is that Mann is liable to NR for the $530K legal fees and only gets $7k from Styen and Simberg.
https://portal-dc.tylertech.cloud/app/RegisterOfActions/#/D71396C82ECD1A3BD3F9353D4EDBF6DC93A0975858B9A671863AE5073F2368E4/anon/portalembed
Steyn was assessed $1m in punitive damages by jury, today the judge reduced it to $5,000
Yep! Mann owes National Review over a half a million dollars in legal fees and costs…
The courts are not the best place to address the Left’s politicalization of science. The best place to address the loss of honor, ethics and reverence for truth in science is the ballot box and the evidence of the last election indicates the public has had enough of the lies underlying the climate change hoax.
Pingback: The social cost of (leaving out the) carbon - Climate Discussion Nexus
Pingback: Tidbits - Climate Discussion Nexus
Extolling the virtues of Small Modular Reactors
https://www.americaoutloud.news/small-modular-reactors-will-benefit-developing-economies/
From link “— use passive cooling systems–”
There’s no avoiding the 2nd law of thermo.
Advanced engineering when engineering is apparently going downhill as a choice career.
“There’s no time for us
There’s no place for us
What is this thing that builds our dreams
Yet tips ’em ‘way from us
Who wants to be an engineer?
Who wants to be an engineer?
There’s no chance for us
It’s all decided for us
This world has only one sweet moment
Set aside for us
Who wants to be an engineer?
Who wants to be an engineer?
Who?”
With apologies.
SMRs will have a perfect safety record as long as they stay on paper.
Test.
From an article in phys.org, 60,000 years ago, ‘humans left Africa to escape drying climate.’
Sometime before that, a few million years prior… hominoids came down out of the trees for the same reason.
https://beththeserf.wordpress.com/wp-content/uploads/2025/02/test-pit_l8_at_laetoli_site_s.jpg
I say ‘Thank goodness for that!’
Beth
When I fell out of a tree, I had simply just lost my grip.
Could it be, that some guest speakers suffer the same infirmity, have hit their head and now are speaking in tongues?
Hello RiHoO8.
There are some that say that pride goes before a fall.
.
.
.
Interesting piece …
Pitfalls in Global Warming and Climate Change Research:
Flaws in Ice Core Reconstructions of Atmospheric CO2
– The Naked King of 280 ppm at the Industrial Revolution –
Dai Ato
“Therefore, the assumption of an atmospheric CO2 concentration at the time of the Industrial Revolution of 280 ppm is no longer valid. The various related studies that assume this hypothesis are
all equally inappropriate. And an update of the previous report by the author (Ato) showed that, in the same manner, SSTs are the sole determinant of annual ΔCO2 and that human emissions
have no predictive power related to the atmospheric content of CO2 (Table 5).”
https://scienceofclimatechange.org/ato-pitfalls-in-global-warming-and-climate-change-research/
https://notrickszone.com/2025/03/04/new-study-casts-doubt-on-the-accuracy-and-reliability-of-the-modern-and-paleo-co2-record/
Attaboy Bill. Keep flooding the zone with sh*t.
The study may not be s****
One of the major problems / short comings etc throughout the paleo arena is the lack of high resolution proxies to nail down with any precision and/or accuracy the temps and in this case co2 concentrations. Extensive amounts of low and moderate resolution proxies that climate scientists have used to arrive at the supposedly result in very narrow confidence bands.
a prime example is the confidence band used for global temp circa 1890 is barely 0.2c. and as of 1850 its barely .4c. that is an insanely high level of confidence, not supported statistical analysis – except perhaps by the different statistical techniques used in climate science. See Wyner’s expert testimoney from the Mann trial.
Law Dome:
https://agupubs.onlinelibrary.wiley.com/doi/full/10.1002/jgrd.50668
There isn’t an ideal. Compromise range, maybe 300-350 ppmv. Of course, with current commitments, it’ll take decades – millennia to get there.
Ato writes “SST’s are the sole determinants of CO2 changes”. Nonsense. I have explained the “mass balance” or “carbon conservation” argument in detail before and won’t repeat it again. The atmospheric carbon rise is only about 45% of human emissions, meaning that natural processes are removing net carbon from the atmosphere that we have put there, not adding it. Wm Happer, who knows of my interest in this, sent me a personal link to an article posted on the CO2 Coalition website that uses this argument. Read it if you wish, but you should be able to figure that out yourself. Happer knows that Berry, Harde, Koutsoyiannis, and now Ato are all mistaken.
As for the optimum atmospheric carbon level, I have no opinion, other than a preference for stability over rapid and disruptive change. I think my grandchildren have the same preference, but they are too young to tell me.
Compared to thousands of parts per million during the dinosaur era to around 400 ppm today, Dr. William Happer believes that currently Earth’s atmosphere is CO2 deficient..
Andrew’s apparently doesn’t believe there’s such a thing as too little atmospheric CO2.
CO2 was at about 280 ppm mid 19th century. What’s baby bear Andrew’s just right number? I’m quite certain he doesn’t have an ideals conviction—nor chemistry BAB, the gas expert.
Tried to post this.
https://scienceofclimatechange.org/ato-pitfalls-in-global-warming-and-climate-change-research/
https://notrickszone.com/2025/03/04/new-study-casts-doubt-on-the-accuracy-and-reliability-of-the-modern-and-paleo-co2-record/
The hockey stick science of climate alarmism is settled. It is a politically driven hoax. The Left funds the climate charlatans and it has never been so blatantly obvious- e.g., New York Post, March 5th 2025:
‘The Biden administration funneled at least $20 billion dollars into environmental groups [i.e., climate change charlatans], most of which had only recently been founded…
‘In one case, former Vice President Kamala Harris handed over a check for nearly $7 billion to Bethesda, Maryland, based group Climate United Fund, which does not appear in the IRS’s charities database, and has no federal filings.
‘The non-profit fund had only been incorporated in Delaware on November 30, 2023, according to public records, five months before Harris handed over the cash in April 2024.’
The orbitally forced warming or cooling pattern is dependent on the orbital referense to the Perihelion Position.
From Earth’s Autumn Equinox in Perihelion – to Earth’s Spring Equinox in Perihelion – there is a POSITIVE the radiative solar energy imbalance period (~11.000 years).
And, from Earth’s Spring Equinox in Perihelion – to Earth’s Autumn Equinox in Perihelion – there is a NEGATIVE the radiative solar energy imbalance period (~11.000 years).
–
Link: https://www.cristos-vournas.com
An X post from Javier …
2023-24 warming was due to clouds, not CO2. Comparing the cloud cover anomaly with the SST shows a strong similarity. The tropical warming during the 2016 El Niño, with a much smaller cloud anomaly, proves that the widespread 2023 warming was due to clouds.
“Recent global temperature surge intensified by record-low planetary albedo” Goessling, Rackow, Jung
https://www.science.org/doi/10.1126/science.adq7280
Actually, it was due to fewer clouds (see your reference). Lower albedo due to ice/snow loss is also an expected feedback. Looks more like the usual interannual variability superimposed on the climatic trend of the last 50+ years
Roles of Earth’s Albedo Variations and Top-of-the-Atmosphere Energy Imbalance in Recent Warming: New Insights from Satellite and Surface Observations by Nikolov and Zeller
Our analysis revealed that the observed decrease of planetary albedo along with reported variations of the Total Solar Irradiance (TSI) explain 100% of the global warming trend and 83% of the GSAT interannual variability as documented by six satellite- and ground-based monitoring systems over the past 24 years.
https://www.mdpi.com/2673-7418/4/3/17
Bill, you forgot the next sentence, which clarifies the lack of commas in your quote:
“Changes in Earth’s cloud albedo emerged as the dominant driver of GSAT, while TSI only played a marginal role.”
And cloud albedo is a temperature feedback (reduced water vapor pressure saturation with increasing T), not a forcing (nor a “driver” nor a “control knob”).
And if we keep reading, the next three sentences:
The new climate sensitivity model also helped us analyze the physical nature of the Earth’s Energy Imbalance (EEI) calculated as a difference between absorbed shortwave and outgoing longwave radiation at the top of the atmosphere. Observations and model calculations revealed that EEI results from a quasi-adiabatic attenuation of surface energy fluxes traveling through a field of decreasing air pressure with altitude. In other words, the adiabatic dissipation of thermal kinetic energy in ascending air parcels gives rise to an apparent EEI, which does not represent “heat trapping” by increasing atmospheric greenhouse gases as currently assumed.
” …the adiabatic dissipation of thermal kinetic energy in ascending air parcels gives rise to an apparent EEI…”
And therein lies the error. Or rather, one of the errors.
The following have been identified as influencing the AIS SMB, glaciers and ice shelves.
ENSO, SAM, IPO, CDW, ASL, bathymetry, thermocline shallowing, thermohaline,current speed and direction, westerlies, easterlies, basal heat flux, geothermal activity, sedimentation basin variability, channelization, subglacial lakes and subglacial cavities.
“Texas Needs Equivalent of 30 Reactors to Meet Data Center Power Demand
Demand on the Texas power grid is expected to expand so immensely that it would take the equivalent of adding 30 nuclear plants’ worth of electricity by 2030 to meet the needs.”
https://financialpost.com/pmn/business-pmn/texas-needs-equivalent-of-30-reactors-to-meet-data-center-power-demand
“This study investigates how variations in the height of the Antarctic Ice Sheet (AIS) are connected to large-scale climate patterns. We used a statistical method to measure the effects of two climate phenomena: El Niño Southern Oscillation (ENSO) and the Southern Annular Mode (SAM). We found that the cumulative effects of these phenomena account for about 29% of the variations in AIS height on average, and up to 85% in some coastal areas.”
https://agupubs.onlinelibrary.wiley.com/doi/10.1029/2024GL108844
“ On the Antarctic slopes, geothermal heat flux has the greatest effect on basal melt. Air temperature is the second most important factor. If the ice thickness within the Antarctic slopes exceeds 1500 m, then in modeling the values of the surface mass balance and the thickness of the snow-firn layer can be ignored.
On the Antarctic coast, the leading factor that has the most significant effect on the subglacial processes is also the geothermal heat flux. The thickness of the ice sheet is the second most important factor.”
https://www.tandfonline.com/doi/full/10.1080/15230430.2024.2406622#d1e4526
“ We find that volcanoes beneath shrinking ice sheets are sensitive to the rate at which the ice sheet shrinks. As the ice melts away, the reduced weight on the volcano allows the magma to expand, applying pressure upon the surrounding rock that may facilitate eruptions. Additionally, the reduced weight from the melting ice above also allows dissolved water and carbon dioxide to form gas bubbles, which causes pressure to build up in the magma chamber and may eventually trigger an eruption. Under these conditions, we find that the removal of an ice sheet above a volcano results in more abundant and larger eruptions, which may potentially hasten the melting of overlying ice through complex feedback mechanisms.”
https://agupubs.onlinelibrary.wiley.com/doi/10.1029/2024GC011743
“ Relative uncertainties in basin-mean time series of the adjusted firn thickness variations range from 20 % to 108 %. At the grid cell level, relative uncertainties are higher, with median values per basin in the range of 54 % to 186 %. This is due to the uncertainties in the large and very dry areas of central East Antarctica, especially over large megadune fields, where the low signal-to-noise ratio poses a challenge for both models and altimetry to resolve firn thickness variations. A large part of the variance in the altimetric time series is not explained by the adjusted firn thickness variations. Analysis of the altimetric residuals indicate that they contain firn model errors, such as firn signals not captured by the models, and altimetry errors, such as time-variable radar penetration effects and errors in intermission calibration. This highlights the need for improvements in firn modelling and altimetry analysis.”
https://tc.copernicus.org/articles/18/4355/2024/
This passage captures the essence of many studies about Antarctica. There are very complex explanations for melting on various timescales and the models don’t have it right.
“ All the ASE glaciers flow into ice shelves, and it is the thinning of these since the 1970s, and their ungrounding from “pinning points” that is widely held to be responsible for triggering the glaciers’ decline. These changes have been linked to the inflow of warm Circumpolar Deep Water (CPDW) onto the ASE’s continental shelf. CPDW delivery is highly variable and is closely related to the regional atmospheric circulation. The ASE is south of the Amundsen Sea Low (ASL), which has a large variability and which has deepened in recent decades. The ASL is influenced by the phase of the Southern Annular Mode, along with tropical climate variability. It is not currently possible to simulate such complex atmosphere-ocean-ice interactions in models, hampering prediction of future change. The current retreat could mark the beginning of an unstable phase of the ASE glaciers that, if continued, will result in collapse of the West Antarctic Ice Sheet, but numerical ice sheet models currently lack the predictive power to answer this question. It is equally possible that the recent retreat will be short-lived and that the ASE will find a new stable state”
https://agupubs.onlinelibrary.wiley.com/doi/10.1002/2016RG000532
“ In this work we present a simplified mathematical model for the volume of warm water at Amundsen Sea ice shelf fronts that reproduces observed patterns of warm water variability. The modeled variability relies on interactions between ice shelf melt and coastal polynyas, regions where enhanced wintertime sea-ice production can trigger mixing that diverts heat carried by warm waters away from the ice shelf and into the atmosphere. Higher melt rates inhibit polynya convection, allowing more warm water into the ice shelf cavity and reinforcing a high melt state, whilst lower melt rates facilitate polynya convection, diverting heat away from the ice shelf and reinforcing a low melt state. Interannual variations in polynya sea-ice production trigger shifts between these reinforcing states. Our results promote the importance of coastal processes in explaining observed variations in Amundsen Sea ice shelf melt, which have previously been attributed to remote wind patterns.”
https://agupubs.onlinelibrary.wiley.com/doi/10.1029/2023GL104724
More evidence of a disconnect between the oversimplification of AGW melting WAIS and the actual complex processes involved.
“This suggests that the rate at which heat is transported toward the shore is likely more important than the temperature of the water in determining the melting of glaciers around the Amundsen Sea.”
https://agupubs.onlinelibrary.wiley.com/doi/10.1029/2022JC019535
“ Our findings suggest that unconstrained CMIP6 projections overestimate future AWW, particularly in the Barents-Kara seas, due to an overestimation of historical global warming and excessive sea ice
https://www.science.org/doi/10.1126/sciadv.adr6413?utm_source=sfmc&utm_medium=email&utm_content=alert&utm_campaign=ADVeToc&et_rid=267930073&et_cid=5554366
Saw this on X … Figure 6, no sign of hockey stick?
A Norway spruce Blue Intensity summer temperature reconstruction from the Central Scandinavian Mountains
Fredrik Karlsson, Mauricio Fuentes , Hans W. Linderholm
In the present study we explore the potential of increasing the fidelity of the climate information from Norway spruce tree-ring data by investigating Late Wood Blue Intensity (LWBI) measurements from trees sampled at the elevational tree line in the Central Scandinavian Mountains. We present -to the knowledge of the authors- the first LWBI chronology and summer temperature (June through August) reconstruction based on LWBI measurements from the species, which covers the period 1750–2020. The LWBI chronology has a substantially stronger temperature signal than its corresponding tree-ring width (TRW) chronology, and displays a good spatial representation across the Nordic countries.
https://www.sciencedirect.com/science/article/pii/S1125786525000189
What we see with belief in the hoax of global warming alarmism and scare tactics of Hot World Catastrophy memes are examples of religion over reason and a celebration of politics over science.
With, “the beginning of a rough and stormy pattern for eastern North America through the rest of March into early April” (see Accuweather), Leftists may have to explain how snow in in the US is a sign of global warming caused by humanity.
The scientific method tells us that ravings of fearmongering charlatans is irrelevant to nature.
Wags, what is the difference between regional weather and global climate? Science is a liberal (not leftist) art. Denial thereof is a regressive art without much skill involved. I appreciate your demonstrations of knowledge.
The scientific method is half-brained. It rewards the part of the brain that seeks verifiable knowledge. By contrast, belief in AGW is hairbrained?.
“Science is a liberal (not leftist) art.”
It is not an art, silly bird.
It’s clear that no amount of global warming will ever alter your ideological beliefs.
How much warming will it take? At how large a rate? Are there finite answers to these questions?
How much warming will it take until it’s no longer a “hoax?” Any number whatsoever?
More than 09°
By UAH sat data, the first two months of this year are cooler than the first two months last year. If you don’t believe those numbers, I would truly like a scientific explanation of why.
jim2 wrote:
By UAH sat data, the first two months of this year are cooler than the first two months last year.
So what?
Has the planet entered a long-term cooling period, based on these 2 months?
Wagathon wrote:
More than 09°
deg C?
Why this specific amount?
I believe, David, that is a deflection.
BAB,
Yeah, I know what scientists have decided ‘proof’ stands for. Let’s hear your ‘proof’ that CO2 change causes climate change. Oh, it doesn’t exist? Meanwhile:
The compelling evidence that it is not CO2 is double. 1. Paleo and recent CO2 data shows no correlation between CO2 and T at CO2>300 ppmv. 2. Average global water vapor has been increasing about 1.4 % per decade which is more than twice as fast as possible from just planet warming. Analysis with graphs is at https://watervaporandwarming.blogspot.com
The WV increase results from tiny increase in residence time. The residence time increases to account for the time required for the WV to get from where it is added (mostly from increasing irrigation) to where it is precipitated.
The analysis showing this is made public at https://watervaporandwarming.blogspot.com
Dan, you keep repeating yourself. It doesn’t make your evidence convincing, and even if it were convincing, it still wouldn’t be proof. The only thing that is convincing is your irrational personal bias and your inability to control it.
The truth does not change.
What does that have to do with your claim:
“no correlation between temperature and CO2 above 300 ppmv”.
It is clearly false.
Interesting correlation but it only works by cherry picking the data and changing the proportionality factor. If you don’t do all that, correlation fails. This is shown at Fig 12 at https://watervaporandwarming.blogspot.com
Dan, I do correlation mathematically. I also believe in parsimony.
https://mega.nz/file/4qc1ACyT#57PNs8KfMebGtKRfUJ3OVw4fGzn8-4mDmrw9NvguO5g
BAB
The mathematical correlation between average global temperature and water vapor plus two other factors is shown at Fig 10 in http://globalclimatedrivers2.blogspot.com . It results in an R^2 of 0.93.
” Paleo and recent CO2 data shows no correlation between CO2 and T at CO2>300 ppmv. ”
BS. Apparently, you know don’t know what correlation means any more than you know what proof means – you don’t. Here is a disproof (yes disproof is possible in science) of your false claim of no correlation between temperature and CO2 above 300 ppmv.
https://berkeleyearth.org/dv/carbon-dioxide-global-temperature-visualization/
Are you disappointed that hardly anybody here (except me) is bothering to respond to your pleas for people to look at your blog? Have you considered why? Have you yet figured out the difference between a forcing and a feedback? Sure doesn’t seem like it.
“Here is a disproof (yes disproof is possible in science)”
As a scientist please provide an extention of your disproof covering the last 100k years, demonstrating the historical context of evidence of the record, to substantiate your near-term holistic conclusion.
Trunks,
Sorry, I already disproved Dan’s claim. I Don’t care about your stupid deflections.
Pangburn wrote:
BAB, Yeah, I know what scientists have decided ‘proof’ stands for. Let’s hear your ‘proof’ that CO2 change causes climate change. Oh, it doesn’t exist?
Dan, you’re too old to be asking these questions again and again and again. Why do you do that?
“Increases in greenhouse forcing inferred from the outgoing longwave radiation spectra of the Earth in 1970 and 1997,” J.E. Harries et al, Nature 410, 355-357 (15 March 2001).
“Radiative forcing – measured at Earth’s surface – corroborate the increasing greenhouse effect,” R. Philipona et al, Geo Res Letters, v31 L03202 (2004).
“Observational determination of surface radiative forcing by CO2 from 2000 to 2010,” D. R. Feldman et al, Nature 519, 339–343 (19 March 2015).
“Comparison of spectrally resolved outgoing longwave data between 1970 and present,” J.A. Griggs et al, Proc SPIE 164, 5543 (2004).
“Spectral signatures of climate change in the Earth’s infrared spectrum between 1970 and 2006,” Chen et al, (2007)
“Measurements of the Radiative Surface Forcing of Climate,” W.F.J. Evans, ams.confex.com, Jan 2006
“Satellite-Based Reconstruction of the Tropical Oceanic Clear-Sky Outgoing Longwave Radiation and Comparison with Climate Models,” Gastineau et al, J Climate, vol 27, 941–957 (2014).
Links and more papers on this subject are listed here:
http://agwobserver.wordpress.com/2009/08/02/papers-on-changes-in-olr-due-to-ghgs/
You are not paying attention. I don’t deny that there is climate change/global warming, I don’t deny changes in OLR. What I have determined is that climate change is not caused by, or even significantly contributed to, by burning fossil fuels. All climate change attributable to humanity can be accounted for by the measured increase of water vapor.
http://globalclimatedrivers2.blogspot.com Water vapor has been increasing more than twice as fast as possible from just feedback from planet warming. https://watervaporandwarming.blogspot.com
The phrase for Dan is “fake denialism.”
No Dan, thinking TPW and WV are the same thing is delusion.
Dan Pangburn wrote:
1. Paleo and recent CO2 data shows no correlation between CO2 and T at CO2>300 ppmv.
Oh Dan, you choose to be so ignorant.
Why do you do this?
What does it get you?
See the only figure, a beautiful graph, in
“A Long View on Climate Sensitivity,” Luke Skinner
Science, 24 Aug 2012, Vol. 337, Issue 6097, pp. 917-919.
https://science.sciencemag.org/content/337/6097/917/tab-figures-data
As I said, the truth does not change.
It is abominable that so-called climate scientists avoid examining the measured increase in water vapor. It is more than twice what is possible from just feedback from planet warming and can account for all climate change attributable to humanity.
You offer a 14 year old article obscured behind a paywall. Perhaps you can pull a quote where the measured increase in water vapor is addressed. Perhaps not.
Methinks Dan is the one doing the avoiding:
Allan, R. P., Willett, K. M., John, V. O., & Trent, T. (2022). Global Changes in Water Vapor 1979–2020. Journal of Geophysical Research: Atmospheres, 127(12), e2022JD036728. https://doi.org/10.1029/2022JD036728
BAB
They claim that WV has been increasing at 1 % per decade when measurements show that the average increase has been about 1.4 % per decade through Dec 2023. And they don’t compare the measured increase to the maximum increase possible from temperature increase. The result is delusion.
No Dan, thinking TPW and WV are the same thing is delusion.
Here is the one phrase that shows all hard your work is horse crap.
“With CO2 rejected as a significant contributor to warming, the remaining factors to be explicitly considered are:
Ocean cycles
SSN
WV
”
You find CO2 has no effect, only because you don’t allow it to have one. What a joke, I certainly understand why you don’t submit it for review.
BAB
You are getting mired in minutia. TPW is the total column measurement, WV is what is being measured. The fluctuations of WV in space and time average out over time as seen in graphs showing the TPW measurements.
Take the blinders off. The discussion, with graphs, in Sect 11 of https://watervaporandwarming.blogspot.com shows that CO2 does not now, never has and never will have a significant effect on climate.
The joke is that many so-called scientists treat WV as a feedback from planet warming. If they did a valid calculation, they would discover that measured average global WV has been increasing more than twice as fast as possible from just feedback from planet warming.
Dan,
You are repeating yourself again.
“With CO2 rejected as a significant contributor to warming, the remaining factors to be explicitly considered are …”
That is not minutia, it is disqualifying.
What is 09- it’s when the ‘hockey stick’ was shot to Quatsch, as von Storch described it.
‘In 2009, Steve McIntyre and I published a letter in Proceedings of the National Academy of Sciences arguing that a recent paleoclimate reconstruction by Mann et al. does not provide reliable evidence about climate change over the past millennium, because their data are inconsistent and their confidence intervals are wrong.’ ~Ross R. McKitrick (2009)
The ‘hockey stick’ was bothing but a hoax by Western academic. charlatans to help stampede the lemmings off the cliff…
Hockey stick ‘science’ from Gore to Thunberg has been nothing but Leftist- Lib global climate activist flimflammary.
Glaciers started melting 14,000 to 3000 years ago such that the interior of the US back then was a huge freshwater lake and not a human around to blame it on…
Global warming essentially is what gave rise to the, ‘Early Civilizations.’
Q: “Global warming essentially is what gave rise to the, ‘Early Civilizations.’”
Correct: But what was the real driver? >> Obliquity. The instability of earth’s orientation wrt the sun, and driven by planets (Kepler’s Trigons + trigger moon)
The concept that added greenhouse gases cause warming is tied back to the idea that because greenhouse gases absorb longwave radiation, they will reduce the Outbound Longwave Radiation (OLR) thus causing an energy imbalance in the longwave spectrum. To correct for this imbalance Earth would be forced to warm. To achieve any type of energy imbalance in the longwave spectrum, the decrease in OLR, would have to exceed the increase in OLR from Planck radiation, as the planet warms.
Since year 2000 there has not been a decrease in the OLR, but greenhouse gas levels have increased.
https://link.springer.com/article/10.1007/s10712-024-09838-8
“The increase is the result of a 0.9 ± 0.3 Wm−2 increase absorbed solar radiation (ASR) that is partially offset by a 0.4 ± 0.25 Wm−2 increase in outgoing longwave radiation (OLR). ”
Before a social cost can be added to carbon, some empirical evidence that added CO2 is doing anything is required.
John,
I think you missed a couple of important points in the paper you cite:
“Satellite observations reveal that global mean net flux (NET) at the top-of-atmosphere (or equivalently, Earth’s energy imbalance) has doubled during the first twenty years of this century.”
“Continued monitoring of Earth’s radiation budget and new and updated climate model simulations are critically needed to understand how and why Earth’s climate is changing at such an accelerated pace”.
It is from decreasing albedo as a temperature mediated feedback reduces ice, snow and cloud cover.
B A, No I did not miss that, the numbers are in my quote, overall the energy imbalance is higher, but because the increase in shortwave Absorbed Solar Radiation,(ASR) not because of a decrease in OLR, that added greenhouse gases would affect.
One could claim the increase in ASR was a feedback from earlier warming, but the conditions that caused that supposedly caused that earlier warming are no longer present.
The more likely cause is global brightening as we cleared earlier air pollution. Still Human caused, just not related to greenhouse gases.
https://www.researchgate.net/publication/7862204_From_Dimming_to_Brightening_Decadal_Changes_in_Solar_Radiation_at_Earth%27s_Surface
“Over the period covered so far by BSRN (1992 to 2001), the decrease in earth reflectance corresponds to an increase of 6 W m-2 in absorbed solar radiation by the globe (22)”
Compare that increase of 6 W m-2 between 1992 and 2001 with the theorized forcing of all greenhouse gases since 1750,
less than 3 W m-3 per IPCC AR5.
John, you closed with “Before a social cost can be added to carbon, some empirical evidence that added CO2 is doing anything is required.“.
That is what I was responding to: there is an overwhelming amount of empirical evidence: it matters not if you accept it or not.
Please tell, what is the forcing that is driving the obvious (non-linear) feedbacks that are now starting to become apparent.
Here is something a little more recent about OLR.
https://agupubs.onlinelibrary.wiley.com/doi/10.1029/2021GL093047
You don’t see a large change in OLR because increased Planck emission and increased GHG absorption (nearly) cancel.
John, so you agree that increasing greenhouse gases are absorbing about 1/2 of the increase in Planck OLR. That is what would be expected: Energy from GHG absorption of OLR, is reradiated (Planck) from the thermalized atmosphere, with roughly half making it back to the surface, and the rest making it to the TOA.
I don’t really have a problem with your deflection, it is your closing remark, as already delineated, that is problematic.
Please describe any of this empirical evidence that added CO2 causes warming? The pathway that added greenhouse gases could cause warming is via an increase in the net longwave flux (longwave energy imbalance), but that has not been happening.
I suspect at a lower concentration added CO2 might cause warming, but I think once the central band (15 um) became saturated, the response curve shifted to a place where the Increase in Planck radiation, exceeds the forcing from added greenhouse gases. This would explain the observed data,
which is that added greenhouse gases since 2000, have not caused a decrease in the OLR.
No thanks, if you don’t know the empirical evidence for GHG theory at this point, I can’t help you.
It doesn’t matter if the OLR has or has not increased. What is important is the amount that is absorbed in the atmosphere – it has increased. Your argument is a silly deflection. Simple question: If surface Planck radiation is increasing, but TOA-OLR is not, where is that extra energy going?
So you claim that,
“there is an overwhelming amount of empirical evidence:”
yet you refuse to cite and quote some of this empirical evidence that added CO2 causes warming, why is that?
Could it be because you know that no such evidence actually exists?
Nope, because you are behaving like a sea lion.
https://www.climate.gov/media/13840
(a taste of empirical evidence).
About OLR, you clearly did not read your 2021 citation, Mine which found the same data was from 2024, but here is the findings from Loeb, 2021.
“For this period, the observations show a trend in net downward radiation of 0.41 ± 0.22 W m−2 decade−1 that is the result of the sum of a 0.65 ± 0.17 W m−2 decade−1 trend in absorbed solar radiation (ASR) and a −0.24 ± 0.13 W m−2 decade−1 trend in downward radiation due to an increase in OLR (Figures 2a–2c). ”
So the increase in Planck Radiation did not “nearly” cancel the decrease from added greenhouse gases, it turned the Longwave energy imbalance negative.
Consider that the forcing equation 5.35 X ln(CO2/CO2_old) cannot produce a negative number if the levels are rising?
Sorry you do not understand the difference between empirical evidence and a correlation!
While to correlation looks good, physics requires an actual mechanism, by which added CO2 would cause the warming.
The concept is that the added CO2 causes a positive longwave energy imbalance, (Which would cause warming) but the predicted longwave energy imbalance is not happening.
Arf, arf. Correlation is empirical evidence. If you now wish to deflect to physical causality, you may investigate the work of Fourier, Tyndall, Foote, Arrhenius, and Callendar – for starters. The physical “mechanism” has been known and refined (by empirical and theoretical studies) for a couple of centuries. Unfortunately, it seems you have not been able to absorb or understand it.
P.S. How would you know what “physics requires”?
I have read the studies of Arrhenius, and some of Callendar’s work, but they never found empirical evidence supporting the idea, that added CO2 caused warming, it was all hypothetical.
The mechanism is supposed to be that the added greenhouse gases cause a longwave energy imbalance by reducing the OLR. Since 2000, we have the capability of observing (Empirical) the energy in and out of the top of the atmosphere,
and the century old hypothesis is found wanting.
Between 2000 and 2024 the greenhouse gas levels increased, but the OLR did not decrease! This is what your own citation showed,
“and a −0.24 ± 0.13 W m−2 decade−1 trend in downward radiation due to an increase in OLR (Figures 2a–2c). ”
What physics requires is defined in just about every definition of the greenhouse effect, but I have been doing Physics related R&D for more than 4 decades.
Climate change is very highly correlated to albedo, as a result of the change in the amount of energy from the sun that is absorbed by the Earth. For example, fewer clouds means less reflectivity which results in a warmer Earth. Conversely, more clouds means greater reflectivity which results in a cooler Earth.
John: ” but I have been doing Physics related R&D for more than 4 decades.”
That’s great – what kind of physical science – got any references?
Project Earthshine data showed that the amount of `climate forcing’ that may be due to changes in atmospheric greenhouse gases is either overstated or countervailing forces are at work that GCMs [general circulation models aka global climate models] simply ignore. GCMs fail to account for changes in the Earth’s albedo. Accordingly, GCMs do not account for the effect that the Earth’s albedo has on the amount of solar energy that is absorbed by the Earth.
Empirical evidence that low cloud cover is related to greenhouse gases has never been shown.
According to a couple of AI sources, correlation is not definitive evidence of causation or even a meaningful relationship.
Andrew
Bell McDermott study of increase in premature mortality due to increase in ground level ozone in 96 US Cities is one of the best examples of misinterpreting “correlation”
The errors should be studied by all scientists so that they can grasp the fallacy of over confidence / over relience in correlation.
That is correct: an observed correlation is not “definitive” evidence, it is just another piece of evidence which must be evaluated and tested. “Definitive evidence” would imply proof.
“Science is a thought process, technology will change reality, and politics is how you rationalize the change.” – Me
Last month it was China’s Deepseek LLM & now Manus, the first opensource AI agent is giving us a taste of what artificial general intelligence (AGI) will look like.
I think AGI will convince many people that our emissions are severely degrading the planet and suggest ways we can avoid the worst outcomes. Most of us can ignore it. But what is next, artificial super intelligence AKA the singularity AKA p(doom) will completely rewrite humanity’s future and likely create a new transhuman species.
I’m just glad I was here to see the grand finale.
So far, however, the initial reactions from Manus users have been mixed. Derya Unutmaz, a professor at the Jackson Laboratory who researches cancer immunotherapy, praised the tool for “great quality outcomes” even though “it takes longer than OpenAI’s Deep Research to process the tasks.”
Others have complained that the service is too slow and sometimes crashes before completing tasks, likely due to the company’s limited computing resources. Some users have also found it made factual mistakes.
Source: Bloomberg.com
In China the government just ordered all students to have 8 hours of AI education.
“AI education will be mandatory for students from elementary school through high school.”
https://www.yahoo.com/news/chinas-capital-city-making-ai-080757111.html
In America we are eliminating the Dept. of Education and encouraging the states to cut public education funding and promote home schooling and charter schools. A self-administered frontal lobotomy on an entire generation.
When it comes to frontal lobotomies, the Dept. of Ed. wields the ice pick.
What are the idds Chinese AI is using my website as a data source?
Boomer asks- what do you know or think about self-actualization?
Chinese child of the 21st century- don’t know- it’s all Greek to me!
“correlation is not definitive”; but—
‘If it looks like a duck, eats like a duck, walks like a duck, quacks like a duck,,,, then you may know pretty well the choice of bird-shot.
Correlation on a multi-level likely leads to corroboration; the statistical level of being the correct issue rises.
Then someone might even come from the past and confirms it.
I’ve noticed in my admittedly limited interactions with AI, that it tends to promote conventional wisdom, whether or not it might be wrong/incorrect/in error.
Predictable, really. Better rim your glass with salt when you partake.
With the current state of the art, AI seems a good place to start a search, but not to finish.
“Changes in average weather conditions that persist over multiple decades or longer” (see, GlobalChange.gov) – we see nothing happening in the last half of the 20th century that did not also happen, as Walter E. Williams says, “throughout all 4.54 billion years of Earth’s existence.”
The only thing that is very highly correlated with global climate change alarmism is the public’s gullibility.
‘February 2025 in the US was cooler than February 1896 and many Februarys since.’ ~ Steve Malloy, 10Mar25
The AGW catastrophists will have to hang their hat on their make-believe, manufactured global average…
BA, My physics work is mostly wave optics stuff but I started that path doing lasers. CO2 is VERY difficult to excite optically, and has some long stable energy states that require Helium in a closed environment to prevent a population inversion where you do not want it. In the Atmosphere I suspect that CO2 spends much of it’s time not at ground state.It can pass off the energy through contact, but only with the right atom or molecule.
In a CO2 laser this requires a ~70% Helium mixture, but H20 could likely play the role in the atmosphere.
The real problem is that the atmosphere is too complex to account for all the variables, but we do have the net shortwave and longwave flows measured, and they are showing that Earth is not added any energy in the longwave spectrum, Were added CO2 to add any energy, it would happen in the longwave spectrum!
Thanks John,
Tells me all need to know. I’m not convinced. You don’t seem to understand that it is (total) energy balance, not balance by spectral region.
I worked some with lasers too. You can look me up on Google Scholar or Researchgate – my screen name here is my real name.
BTW, are you the John Bahm on LinkedIn? The time frames seem about right for what you claim, the activities not so much.
BA what you are missing is that the only way for added greenhouse gases to cause direct warming is via an energy imbalance in the longwave spectrum, Because Earth is not gaining and energy in the longwave spectrum, the added energy cannot be coming from added greenhouse gases.
The definition of Absorbed Solar Radiation (ASR) is the shortwave energy that reaches the surface and is not reflected.
More of the available sunlight is reaching the surface, and less of that sunlight is being reflected, this is why Earth is gaining energy (Warming). The longwave spectrum is actually reducing the increase from the increased ASR.
I think the work of Martin Wild is a far better explanation of the observed warming than added greenhouse gases.
https://agupubs.onlinelibrary.wiley.com/doi/full/10.1029/2008JD011470
I think that CO2 has passed a level where the earlier forcing response curve is no longer valid. The new curve is based on the area remaining under the curve for the pressure broadened absorption, but that curve falls off as the air pressure decreases.
At the lower efficiency the energy blocked is less than the increase in OLR from Planck radiation. As such added CO2 moving forward will not cause additional warming, but still helps plants.
The downside of our warming coming from efforts to reduce air pollution, is that we do not know where ZERO is.
As our skies clear, we will keep gaining ASR, but we do not know the limits. In any event Warming is better than cooling.
CO2 cannot redistribute energy at a higher energy state that is has, i.e. if the molecule absorbs a 15 um photon, (667 cm-1) it cannot pass off more than that energy level. Most people place the divide between shortwave and longwave radiation at 4 um, so consider how the capture and redistribution of 667 cm-1 photons could result in a greater than 2500 cm-1 energy increase?
I can only look at the observed data, and the CERES instruments are showing that Earth’s energy imbalance is coming from increases in the Shortwave ASR. Greenhouse gases, in theory cause warming by decreasing the outgoing longwave radiation, but between 2000 and 2024, the greenhouse gas levels rose, and the OLR also rose,
This is the opposite of what is predicted to happen.
Because the forcing equation cannot produce a negative number as CO2 levels rise, the only conclusion is that the equation is no long valid.
Imagine for a second that a CO2 molecule at the surface can absorb a 14 um photon, but unlike the central 15 um band, that ability gradually disappears with altitude.
Do you not think the forcing curve for the 14 um absorption of CO2 would be vastly different than the 15 um absorption that is not affected with altitude?
“Because Earth is not gaining and energy in the longwave spectrum, the added energy cannot be coming from added greenhouse gases.”
Common conceptual problem. There is no added energy from greenhouse gases, they just slow the rate of radiative loss of earth’s already acquired solar energy.
Another clue: The first law of thermodynamics, which is the basis of your (non) conservation arguments, applies only to total energy, not specific forms or spectral components.
You might consider the role N2 gas plays in the CO2 laser. then reverse it for what role it plays in the atmosphere. N2 (quasi) resonantly receives energy from the optically excited CO2 bending vibration.
“There is no added energy from greenhouse gases, they just slow the rate of radiative loss of earth’s already acquired solar energy. ”
So tell me what would the slowing of the radiative loss look like at the top of the atmosphere? To me the only why that would show up is a reduction in the outgoing longwave radiation(OLR). It sure is not going to change itself into increased incoming shortwave solar energy.
I understand that the idea is that forcing from added greenhouse gases are supposed to always exceed the increase from Planck radiation, that is why the natural log curve is show the way it is, but that is not what is happening! The increase in OLR means that the Planck radiation is exceeding the forcing from the added greenhouse gases. This has nothing to do with what is happening on the incoming shortwave side of the spectrum.
The role N2 mostly plays in a CO2 laser is vibration energy transfer at 4.3 um, after the N2 is excited electrically,
this would not work in reverse, because the CO2 energy state is only at 667 cm-1 not the needed 2326 cm-1.
“So tell me what would the slowing of the radiative loss look like at the top of the atmosphere?”
It would look like the saturated CO2 absorption at ~15 um does not reach baseline.
Your turn, where/how did you get your physics knowledge? It seems kind of shaky.
I did not ask what the 15 um would look like, I asked
how your stated slowing of the radiative loss look like at the top of the atmosphere? Back to the first law of thermodynamics, Energy cannot be created or destroyed, so a reduction in radiative (longwave) energy should show up as a decrease in the OLR.
Because no decrease in OLR is happening, it means that the Planck radiation is increasing faster than the decrease of radiiative loss. This should not happen within the scope of the forcing formula, which cannot produce a negative number as CO2 levels rise. Think about it for a second, if the forcing formula is invalid, what that does to all the computer simulations that start by assuming that a doubling of the CO2 level will produce a perturbation in Earth’s longwave energy imbalance?
Most of my Physics knowledge comes from projects related to constrictive interference of sounds waves, that I am not at liberty to discuss.
Radiative loss in the upper atmosphere is obvious as that’s exactly what happens every time a massive volcanic eruption spews tons of CO2 into the air; otherwise, we’d be sweltering given the laws of nature that GCMs pretend to duplicate.
Mt Etna is still degassing at a rate of 16,000 tons of CO2 daily…
Thanks.
Maybe I just can’t explain it well enough. Try this:
https://www.mdpi.com/2072-4292/10/10/1539
“Because no decrease in OLR is happening, it means that the Planck radiation is increasing faster than the decrease of radiiative loss.”
Actually, OLR is increasing with surface and atmospheric temperature, as expected. That does not stop further absorptions within the CO2 band (and further warming). The failure of your analysis lies with the bandwidth of CO2 absorption being much less than the Planck emission width: the total TOA-OLR increases outside the CO2 band, while there can still be increased energy absorption can still take place within that band. Your analysis and statements do not conform with reality.
https://www.mdpi.com/2072-4292/10/10/1539
It’s been pretty obvious all along that global warming alarmism is a Left ves right issue, having nothing to do with science but… It took the burning down of Tesla dealerships and charging stations for people to realize the Left is a bunch of weirdos.
It’s becoming increasingly clear that the literature about the reduction of the AIS SMB is leaving King AGW in the dust. Beyond the obligatory expression of fealty to the catastrophic monarch, these two studies reflect the essence of most studies about Antarctica melting. The essence is that natural variability rocks.
“ Ross Gyre variability modulates oceanic heat supply toward the West Antarctic continental shelf”
“ Ocean variability beneath Thwaites Eastern Ice Shelf driven by the Pine Island Bay Gyre strength”
https://www.nature.com/articles/s41467-022-35499-5?fromPaywallRec=false
https://www.nature.com/articles/s43247-024-01207-y
“ We have examined the time-varying evolution of Antarctic ice shelf thickness and ocean melt rates over a 26-year period. We show that overall thinning around Antarctica is consistent with previous studies but also that there has been a significant and consistent slowdown in rates of thinning since around 2008 across several West Antarctic and Wilkes basin ice shelves.”
“ We cannot offer a complete picture of the long-term impact of the processes we describe until they are adopted in fully coupled pan-Antarctic ice–ocean models. However, our findings indicate that by including ice dynamic feedbacks and the tendency for ice shelves to thin themselves into cooler waters, projections of ice loss may prove more complex and possibly more tempered than current estimates suggest.”
I don’t know if it’s the death knell of the argument that AGW is causing melting of Antarctica, but with more studies like this the case for natural variability just becomes much stronger. If the IPCC keeps pushing the Doomsday glacier catastrophe narrative, they will be embarrassing themselves before the world.
https://tc.copernicus.org/articles/17/3409/2023/
Kid Dunning-Kruger. You couldn’t tutor your granddaughter. Nor are you able to respond to the reality of SLR, and all you have left is your silly insults.
“ Reconstructions of the West Antarctic Ice Sheet have assumed that it retreated progressively throughout the Holocene epoch (the past 11,500 years or so). Here we show, however, that over this period the grounding line of the West Antarctic Ice Sheet (which marks the point at which it is no longer in contact with the ground and becomes a floating ice shelf) retreated several hundred kilometres inland of today’s grounding line, before isostatic rebound caused it to re-advance to its present position.”
“Our evidence includes, first, radiocarbon dating of sediment cores recovered from beneath the ice streams of the Ross Sea sector, indicating widespread Holocene marine exposure; and second, ice-penetrating radar observations of englacial structure in the Weddell Sea sector, indicating ice-shelf grounding. We explore the implications of these findings with an ice-sheet model. Modelled re-advance of the grounding line in the Holocene requires ice-shelf grounding caused by isostatic rebound. Our findings overturn the assumption of progressive retreat of the grounding line during the Holocene in West Antarctica, and corroborate previous suggestions of ice-sheet re-advance. Rebound-driven stabilizing processes were apparently able to halt and reverse climate-initiated ice loss. Whether these processes can reverse present-day ice loss6 on millennial timescales will depend on bedrock topography and mantle viscosity—parameters that are difficult to measure and to incorporate into ice-sheet models.”
https://www.nature.com/articles/s41586-018-0208-x
fwiw – when it is mentioned that the wais is melting partly due to the geothermal activity, the response from the agw is that the geothermal activity has been there for eons. Yet ignoring that geothermal activity flucuates significantly over time.
When the greatest loss of mass (FIGURE 3) is the same region as the greatest level of geothermal activity (FIGURE 1) then it is common sense to believe there is some association. Unless, of course, you have AGW on the brain. That doesn’t mean it is the only influence on melting, but it has to be considered when evaluating all the suspects.
https://www.science.org/doi/10.1126/science.aaz5845
https://agupubs.onlinelibrary.wiley.com/doi/10.1029/2020GC009428
There is another spectre in the story that is not at all considered. Planets are free bodies in space subject to orientation changes. For us Earth in particular. There are times when earth becomes unstable and its orientation to the sun changes. Leading to either ice accumulation of the contrary; melting. It has been doing so -melting- since 2346bce (my research). But also past four ice ages indicate it can trip into a freezing mode.
This may be interesting – as an example; short term-
https://www.insidehook.com/culture/scientists-reconstruct-collapse-european-ice-sheet-created-english-channel
The question is not how to avoid what is unavoidable, but how to survive the change as a species.
[ with a pinch of sugar here :) Science has genetically engineered well-fleeced mice in trying to bring back the arctic mammoth. Maybe a naturally growing mink coat to counter the long freeze for humans, when the oil runs out.]
Joe, I asked the kid if he had any evidence for thermal flux “varying substantially” over the last few decades of significant ice loss. His thought was no, and it’s very unlikely considering the timescale of magma bubble movements.
Do you have any evidence of changes in WAIS geothermal fluxes on that timescale, or was your comment just an ad hominem strawman?
Bush – Its well known – at least by geologists – that geothermal activity varies over time. Do we have direct evidence that it has changed over the last few decades – No because there are no instrumental records. We do have proxy data in the form of ice sheet coverage which has changed over time which shows a high likelihood of changes in geothermal activity over both the longer time frame and the much shorter last few decades.
Not sure why you would ask such a question given that it is commonly known by those who are following the changes in Antartic ice coverage.
ganon
It sounds as if you think the acceleration in melting is a recent event. There is a wealth of literature that indicates what is occurring now in the WAIS has happened before. It’s not warmer water that is the driver of melting. It’s the episodic incursion of relatively warm CDW onto the continental shelf that has been discussed in countless papers.
“ Our results suggest that sustained pulses of rapid retreat have occurred at Thwaites Glacier in the past two centuries. Similar rapid retreat pulses are likely to occur in the near future when the grounding zone migrates back off stabilizing high points on the sea floor.”
https://www.nature.com/articles/s41561-022-01019-9
“Geochemical signatures demonstrate the utility in evaluating meltwater drainage persistence, or transience, of subglacial drainage pathways through time. We identify sedimentary evidence that suggests an increase in magnitude of meltwater drainage beneath the TGT in recent centuries, and speculate that subglacial drainage may have preceded or accompanied recent ice-tongue unpinning.”
https://www.frontiersin.org/journals/earth-science/articles/10.3389/feart.2022.863200/full
There are a multitude of factors, influences, processes and mechanisms at play in the historical instability of the WAIS. ENSO, SAM, ASL, IPO, bathymetry, aquifer exfiltration, unpinning from the seafloor, discharging from subglacial lakes, shallowing of the thermocline, basal heat flux, subglacial hydrology, westerlies and many others. They are all interconnected and interdependent. Developing a causal inference with just one is beyond current scientific knowledge. Geothermal activity has been identified as a player in many studies. There is still a debate in the community about how much of a role it plays in. It might take a couple of generations before the relative importance is sorted out. It would be naive or willful ignorance to deny it has to be considered as a factor.
Kid, the accelerating ice melt has been going on globally for several hundred years. WAIS and Greenland are just canaries in the coal mine. Sea level up 5.6 mm last year – looks like you have given up on claiming SLR acceleration is insignificant, and instead are trying to understand what is happening in the WAIS to deflect from that. Good for you.
Joe, So you also have no evidence that there is any increase in WAIS thermal flux, and you admit it. Thanks. Your being in perpetual attack mode is well understood.
Both just willfully ignorant deflections. Science requires evidence.
Bab’s comment “Joe, So you also have no evidence that there is any increase in WAIS thermal flux, and you admit it. Thanks. Your being in perpetual attack mode is well understood.”
Bab –
1 – you should probably consult a few geologists before commenting further.
2- There is quite a bit of literature on the subject.
3- none of your responses even remotely address the point I made. – Perhaps because you did understand the topic (as usual)
ganon
Just like I enjoyed tutoring you about SLR and the inadequacy of your crayon graphs, I enjoy helping you understand the more complex issues of Antarctica. When we started this discussion last year you had been completely brainwashed into thinking that only AGW was affecting the AIS. After reading my links it’s finally dawned on you that the melting predates AGW.
“ Snow falling on an ice sheet provides continuous replenishment of a thick thermally insulating layer. As the ice temperature melting point decreases with pressure, the thicker the ice sheet, the easier it is for the geothermal heat flux to raise the basal temperature to the melting point. The sensitivity of basal melt to geothermal heat flux, qGHF, is revealed by the theory of Budd et al. [1984] for one-dimensional flow lines.”
Go ahead, stick with your 8th grade equations and fall further behind the rest of us who actually reads the literature.
https://agupubs.onlinelibrary.wiley.com/doi/10.1002/2017JB014423
5.6mm SLR measurement with error bands of +-4.0mm
https://climate.nasa.gov/vital-signs/sea-level/?intent=121
Bab –
Just so you grasp the correct issue, not the one you wish to deflect.
Its the climate scientists that dont know the extent of the geothermal activity fluctations because measurements dont exist, at least not with sufficient resolution and not over a sufficient time scale , yet operate as if its been constant. Both Climate scientists and activists such as yourself should make better use of geologists.
Oe K said:
“5.6mm SLR measurement with error bands of +-4.0mm
https://climate.nasa.gov/vital-signs/sea-level/?intent=121”
(1) The first thing your reference says:
“Key Takeaway:
Global sea levels are rising as a result of human-caused global warming, with recent rates being unprecedented over the past 2,500-plus years.”
(2) The uncertainty you quote is in the cumulative rise since 1993. You can find yearly uncertainty ranges here:
https://sealevel.nasa.gov/understanding-sea-level/by-the-numbers
Oe, You are joke that doesn’t understand what he is talking about. And, you still haven’t provided any evidence of significant change in the WAIS geothermal flux. All you have is a NNN’s speculation, now provide evidence or go away.
ganon
AGW is running last in the literature regarding melting in Antarctica. The overwhelming majority of studies identify episodic incursion onto the continental shelf of relatively warm CDW. Those studies don’t say the mean state of oceanic temperatures are rising. They say that the CDW is warm. A big difference. And the literature says those warm waters reach the grounding lines when there is a shallowing of the thermocline.
This is addressing the issue of geothermal warming of subglacial basal conditions.
“ As we have shown, magma chambers release more mass and heat with sufficiently high rates of ice unloading.”
Translation. There is variability in geothermal activity based upon the loading and unloading of the AIS in a feedback mechanism. Geo affects the loading and unloading and the loading and loading affects geothermal basal flux.
The Seroussi study linked above says that even without any changes in geothermal activity, changes in the ice sheet itself can increase the effective temperature of the subglacial environment.
https://agupubs.onlinelibrary.wiley.com/doi/10.1029/2024GC011743
Cerescokid, I appreiciate the numbers of interesting paper’s you’ve linked to in this string, this post in particular. My current interest is with gyre marine heatwaves—not the subject of this post to be sure, though certainly tangential to the influence gyres have to climate.
Marine heatwave science data is nascent, though they probably contribute considerably to climatic cause and effect.
The following article is anecdotal only, its posed questions piqued my interest about gyres: “…having this warm water stacks the deck toward warmer than normal air temperatures”…“The ocean has a lot of thermal inertia. It is very slow to warm or cool.” https://www.king5.com/article/weather/the-blob-is-back/281-f7fdf9b2-c565-47ca-86f3-342bd2a8a365
The article led me to: A global overview of marine heatwaves in a changing climate. “Marine heatwaves have profoundly impacted marine ecosystems over large areas of the world oceans, calling for improved understanding of their dynamics and predictability…To make progress on predicting and projecting marine heatwaves and their impacts, a more complete mechanistic understanding of these extremes over the full ocean depth and at the relevant spatial and temporal scales is needed, together with models that can realistically capture the leading mechanisms at those scale.
https://www.nature.com/articles/s43247-024-01806-9
The Nature article describes the lack of understanding in marine heatwaves (it doesn’t discuss gyres). The authors don’t have the slightest inclination to consider the legacy of heat—the proverbial chicken/egg scenario in this regard. They start with the predisposition of AGW, of course; it’s written from the AGW slant, no surprise.
The anecdotal questions I posed to myself: 1k years prior to 1980’s satellite data, how many severe heat waves persisted over the South Pacific Gyre (one gyre example). Gyre circulation is circular, captured energy is distributed through wind, wave action and vertical distribution in the water column.; a gyre doesn’t distribute energy as broadly as other currents do, i.e., the AMO.
Because gyre currents are circular, it can take thousands of years for their captured thermal inertia to dissipate. So what happens if a particularly strong, persistent heatwave were to sit over the 14 million square mile South Pacific Gyre for a few hundred years? This is far from an outlandish question, more like, how often has it happened (before satellite data). Do gyres, because of their circular currents, act as a sort of Gaia battery during climate optimums? Slowly releasing stored energy to the atmosphere, and from their periphery. Outlandish? I doubt it. Lot’s of climate effects should be expected.
JT
Thanks for your comments. There is so much more we need to know than what is currently known, the dynamics of the oceans is just one, even though a very important one. The more deep dives I do convinces me climate science has much, much more to learn.
Even though I bookmarked many studies on Antarctica over the last decade I hadn’t really done a concentrated and systematic analysis of how much the literature has concluded AGW is driving the SMB loss and glacier melting. The overwhelming majority of papers nearly ignore AGW in favor of dozens of other processes and mechanisms, especially the more recent ones.
My latest effort just reinforces my belief that the first IPPC report in 1990 was premature by many years. They didn’t know, and they don’t know as much as they think they know.
Here is a conclusion that says in a backward way, that natural variability is in charge.
“ Our findings have grave implications for the influence of greenhouse-gas emissions policy on sea-level rise from Thwaites Glacier. It might be hoped that lower emissions would lead to lower future ocean warming and lower rates of ice loss. However, our results show that ocean temperature changes exert a limited influence on the melting of Thwaites Glacier because it is also subjected to a strong geometric feedback. The feedback could continue to increase melting even in the absence of further ocean warming. This suggests that greenhouse-gas emissions mitigation will not prevent Thwaites Glacier from making a substantial sea-level contribution in the coming centuries.”
As if skeptics didn’t already know that.
https://agupubs.onlinelibrary.wiley.com/doi/10.1029/2023GL103088
“The overwhelming majority of papers nearly ignore AGW in favor of dozens of other processes and mechanisms, especially the more recent ones.”
I”ve noticed similar for a fair number of works. In many of these AGW references come across as obligatory. It’s difficult to read into; bottom line, staying in good grace is good politics, why rock the boat.
Sea level rise is no threat to humanity. It has been going up for hundreds of years.
https://sealevel.colorado.edu/
This article corroborates that ideological indoctrination masquerading as education should stop. Many kids have already been falsely indoctrinated, with bogus demonstrations no less, to believe that burning fossil fuels causes global warming/climate change.
The Deep State appears to be complicit. A web file of monthly measured average global water vapor increase has recently been deleted. The file, showing Total Precipitable Water (TPW) anomalies, was reported by NASA/RSS for from before 1988 through Dec 2023. It had been available at https://data.remss.com/vapor/monthly_1deg/tpw_v07r02_198801_202312.time_series.txt . (It is still accessible via the WaybackMachine)
Measured water vapor has been increasing on average about 1.4 % per decade which is more than twice as fast as possible from just planet warming. The water vapor increase can account for all climate change attributable to humanity with no contribution from carbon dioxide (burning fossil fuels). An engineering/science analysis examining this is at https://watervaporandwarming.blogspot.com .
An email enquire re this to RSS support was non-committal.
Dan, you are repeating yourself again. This has already been addressed. The files have been moved, not deleted. I already told you where to find them.
Now you stoop to making things up. As I said, the NASA/RSS files were deleted but can be resurrected from the waybackmachine. Go ahead and prove me wrong by providing a link to any other location for the NASA/RSS data. I am still waiting for NASA/RSS to report the data thru 2024.
BA, Sorry your citation of
https://www.mdpi.com/2072-4292/10/10/1539
does not strengthen your position. The study is mostly saying that
The OLR is increasing as expected with temperature.
The problem with this is that the added greenhouse gases were supposed to reduce the OLR greater than increase from Planck radiation. Without lowering the OLR more than the Planck increase, no net positive longwave imbalance could be generated.
Table 9.5 in IPCC AR5 chapter 9 shows a Planck Feedback column, as being a negative number smaller than the positive number for 2XCO2 forcing.
https://www.ipcc.ch/site/assets/uploads/2018/02/WG1AR5_Chapter09_FINAL.pdf
What we have been observing is that the added greenhouse gases have not reduced OLR, and your citation shows that OLR is following the expected Planck radiation.
I am not saying we are not warming, or even that Human activity is not involved, but that there is almost zero empirical evidence that CO2 is doing much of anything besides greening the planet.
I get that the concept that added CO2 could cause warming is plausible, but this is about what we can support with empirical data, and we are warming because of increased shortwave ASR,
a portion of the spectrum where greenhouse gases by definition are transparent.
What causes the increased ASR?
There is plenty of empirical data. Whether you acknowledge it or not, makes no difference.
“but this is about what we can support with empirical data”
Who is this regal “we”, you must have meant “I” – that would be understandable.
Thanks for admitting that current AGW theory is plausible. That is progress.
ASR is increasing because we are clearing air pollution from the skies. We had been dimming the skies since at least 1950, but likely before that. Wild’s studies should that ASR decreased from 1960 to 1990 by about 9 W m-2, but solar output increased in the same time window. Between 1992 and 2001, he also found an increase in ASR of ~6 W m-2.
https://www.researchgate.net/publication/7862204_From_Dimming_to_Brightening_Decadal_Changes_in_Solar_Radiation_at_Earth's_Surface
“Over the period covered so far by BSRN
(1992 to 2001), the decrease in earth reflec-
tance corresponds to an increase of 6 W m-2
in absorbed solar radiation by the globe (22)”
In short, ASR is increasing because blocked the slow solar
increases for an unknown period, and then released the blocking effect in just a few decades.
I know that CO2 had a secondary effect on ASR by causing a lot more greening, which does not reflect several shortwave high energy wavelengths, but those would not cause warming.
The plausibility of added CO2 causing warming is only that there will always remain some area under the curve to push the energy imbalance in the positive direction. Any increase in the imbalance would have to exceed the decrease in Planck radiation to produce a net positive in the longwave spectrum.
“There is plenty of empirical data.”
We know what the hockey stick is—for starters.
BA I am curious about what empirical data you think exists
that links increased CO2 levels with observed warming?
I asked you earlier, but you refused to cite and quote a source.
Sorry, your and Burl’s increase in warming due to aerosol decreases has a forcing change of only about 0.2 ± 0.1 W/m^2 per decade:
Hodnebrog, Ø., Myhre, G., Jouan, C. et al. Recent reductions in aerosol emissions have increased Earth’s energy imbalance. Commun Earth Environ 5, 166 (2024). https://doi.org/10.1038/s43247-024-01324-8
Anthropogenic aerosols have an absolute forcing since 1750 2014 of −0.17 W m−2 (reduction in aerosols results in warming):
Concentrations and radiative forcing of anthropogenic aerosols from 1750 to 2014 simulated with the Oslo CTM3 and CEDS emission inventory
https://gmd.copernicus.org/articles/11/4909/2018/
This can be compared to the preindustrial referenced CO2 ERF of +1.82 Wm-2:
Feldman, D., Collins, W., Gero, P. et al. Observational determination of surface radiative forcing by CO2 from 2000 to 2010. Nature 519, 339–343 (2015). https://doi.org/10.1038/nature14240
The ratio of |ERF(CO2)/ERF(A-aerosols)| = 10.7 is in substantial agreement with what I independently find (for the year 2000) using CEDS SO2 emission data as a proxy for all anthropogenic aerosols, and CO2 data (BerkeleyEarth) as a proxy for all anthropogenic GHGs:
https://mega.nz/file/4qc1ACyT#57PNs8KfMebGtKRfUJ3OVw4fGzn8-4mDmrw9NvguO5g
I obtain a ratio of 15.2, a bit higher, but not suprising, as my CO2 “channel” includes the effects of CH4 (which has a growth curve similar to that of CO2.
Conclusion: Decreasing anthropogenic aerosols (brightening) is important and should not be neglected, but it only accounts for roughly 10% of observed warming.
TTFN
John, I have answered, but it is apparently in moderation, The empirical data I consider is Hadcrut5.0.2.0, multiple sources for CO2 (BerkeleyEarth and Keeling curve, and CEDS SO2 emissions as a proxy for anthropogenic aerosols)
Short version of my interpretation of the empirical data:
https://mega.nz/file/4qc1ACyT#57PNs8KfMebGtKRfUJ3OVw4fGzn8-4mDmrw9NvguO5g
If the longer answer, with discussion and other references, does not come through eventually, I’d be glad to discuss my calculations further. I’d also be glad to see some of your “physics related” calculations to refute mine, instead of illogical hand waving.
Dan Pangdorm:
The increasing levels of water vapor are being caused by decreasing levels of atmospheric Sulfur Dioxide aerosol pollution, which increases the intensity of the solar radiation striking the Earth’s surface.
No Burl, increasing specific humidity is caused by increased evaporation with increasing temperature. SO2 decline is only a small part of that temperature increase, as I have shown quantitatively. Sad, that your comprehension skills are so low.
Just as0 an example of the mental capabilities: Dan’s last name is Pangburn. Must be rough when the STML sets in.
Sources of increasing water vapor are listed in Sect 6 of the engineering/science analysis available at https://watervaporandwarming.blogspot.com. The surge beginning around 1960 results from the surge in population and especially irrigation beginning around that time.
B A Bushaw:
“SO2 decline is only a small part of that temperature decrease”
Decreased SO2 aerosol pollution levels are the total CAUSE of temperature increases. Our temperatures exactly track their changing levels.
Are you really so stupid that you cannot recognize that fact?
No, I am smart enough to have already proven you wrong.
Lower SO2 equates to temperature increase. Burl scores.
Polly, a fountain of platitudes; “I’m smart enough”.
So now Polly ups the ante to “well mixed” science; some call this the depths of activism: https://agupubs.onlinelibrary.wiley.com/doi/10.1029/2021JD036251
Burl,
That is a deflection. What I disproved was your title:
“Scientific proof that CO2 does NOT cause global warming”
Besides my mathematical disproof, the title is self-disproving, but I don’t really expect you to understand:
https://www.forbes.com/sites/startswithabang/2017/11/22/scientific-proof-is-a-myth/
Maybe we should then get into cherry-picking a limited data set where there is an apparent visual correlation, and ignoring the larger data set (before 1980) which does not show the same correlation. Basically, the intentional cherry-picking makes you a scientific crook, and not even a smart one.
BA, Hadcrut and BerkeleyEarth are temperature datasets,
The Keeling curve is how CO2 have has risen, CEDS is emissions. They do not actually link added CO2 to the rise in temperature.
I am not contesting that A: the Average temperature is increasing, or that the CO2 level is increasing,
I am saying that to correlation does not equal causation, and that there is no empirical data that links added CO2 to observed warming. If you think such evidence exists and can cite and quote it, I will look it over, but so far the connection is inferred not observed.
I could not open your link, so find some other way to show that data.
B A Bushaw:
You say “the larger data set (before 1980) does not show the same correlation”
You are mistaken, the earlier, larger data set shows EXACT correlation with changing levels of atmospheric SO2 aerosol pollution, and it can be extend backwards to, at least, the Roman Warming period.
See: ” SO2 aerosol removal: The cause of global warming”
https://doi.org/10.30574/wjarr.2023.19.3.1996
Today Judge Irving of the Mann v Steyn/simberg trial has responded with a ruling sanctioning Mann for submitting and testifying to false information in his trial.
The order provides Mann with 14 days to provide reasons not to sanction and requires Styen to provide an accounting of costs to be reimbursed within the 14 days.
Fwiw – Mann lied, provided false testimony, documentation etc through the trial, demonstrating very problematic ethics. Tell us why we should trust his professional work when his personal ethics is so lacking.
Of course, correlation does equal causation. It is evidence supporting a physical causality model.
BerkeleyEarth also does CO2:
https://berkeleyearth.org/dv/10000-years-of-carbon-dioxide/
The CEDS data refers to SO2 emissions, as a proxy for anthropogenic aerosols not related to CO2, but related to climatic temperature change.
Your ignorance is and lack of comprehension is showing.
Here is another link (on dropbox) for my analysis.
https://www.dropbox.com/scl/fi/3uqt08obf0lyklv0lydk4/CO2SO2.jpg?rlkey=vbhm7s9timfq81y2pynifzgvd&st=pfy7d97g&dl=0
Oops,
Of course, correlation does NOT equal causation …
John, You can also find my prior reply, that was eaten by moderation, here:
https://www.dropbox.com/scl/fi/7giv9a301jleqhbwaqcy0/CO2SO2-txt.jpg?rlkey=0iayzw8yyep9rkfir3ztswv1y&st=0fq3wdyb&dl=0
I don’t think we have much more to discuss, unless you can quantify your hand-waving claims with appropriate mathematics and references (like I do).
B A, Your equation still uses assumptions to infer a response.
I am still looking for empirical evidence that added CO2 causes warming, You claim it exists but have not produced it.
Can you at least consider that the added CO2 is no longer on the natural log curve defined like 5.35 X ln(CO2/CO2_old)?
There is no way for that equation to produce a negative number as the CO2 level rises, but since year 2000, the observed data is a
negative number in the longwave spectrum, and the CO2 level did increase.
The other problem with what is inferred, is that you want people to believe that added CO2 that does not produce a positive longwave energy imbalance, can somehow cause more sunlight to reach the surface.
Also the sheer scale of the amount of additional ASR received,
(6 W m-2) just between 1992 and 2001. The added greenhouse gases (AGGI) between 1992 and 2001 would have in theory only added 0.277 W m-2, 21 times less than the measured increase.
What this comes back to is that the ratio between energy imbalance and warming is much lower than the IPCC claims (0.8C/W m-2), and that added greenhouse gases cannot account for the observed warming.
If we look at the empirical data, GISS says the temp increased by .31C, BSRN recorded a 6 W m-2 increase at the surface in the same time period, this would produce a ratio of 0.051C/W m-2.
“Your equation still uses assumptions to infer a response.”
Nope I make no assumptions about magnitudes within the given physical causality model. The response is determined by fitting the empirical data.
Yes, the logarithmic forcing equation is only an approximation, but obviously a good one over the current range of interest.
https://romps.berkeley.edu/papers/pubdata/2020/logarithmic/20logarithmic.pdf
You still don’t get it: the forcing equations relate to total radiative energy imbalance and temperature, not some cherrypicked spectral region.
But there is no physical energy pathway for the supposed
increase in greenhouse gases to cause the amount of observed increase in ASR. Also the mechanism by which added greenhouse gases are thought to cause warming (Reduced OLR) is not present. What you have shown is correlation not causation.
“But there is no physical energy pathway for the supposed
increase in greenhouse gases to cause the amount of observed increase in ASR”
Of course there is. It’s decreasing low-cloud cover, as relative humidity decreases with increasing temperature, as acquiring the latent heat of vaporization is rate limiting.
“What you have shown is correlation not causation”.
That is correct, the strong correlation is only strong evidence for the physical causality model being correct. That is the way science works – not a surprise that you don’t understand (or intentionally misrepresent) science fundamentals.
You really don’t know much about this stuff do you? But you try oh so hard. This may help if you feel the need to sea-lion more.
https://royalsociety.org/news-resources/projects/climate-change-evidence-causes/
Bye bye
“You still don’t get it: the forcing equations relate to total radiative energy imbalance and temperature, not some cherrypicked spectral region.”
No the only portion of the spectrum added greenhouse gases could affect is the longwave spectrum!
In theory it reduces the OLR (Outgoing Longwave radiation).
The question is does the added greenhouse gases reduce the OLR
more than the Planck radiation increases it? The answer from the
observed data is a resounding NO!
You sound like you tinkered with a CO2 laser, Why do you excite the gas to a 2325 Cm-1 level to produce a 943 cm-1 emission?
The answer is that if you excited the gas to the 667 cm-1 energy level, it would never have enough energy to produce a 943 cm-1 emission. Reducing the outgoing 667 cm-1 photons, cannot increase the amount of ASR on the shortwave side of the spectrum.
“Reducing the outgoing 667 cm-1 photons, cannot increase the amount of ASR on the shortwave side of the spectrum”.
Yes it can, and I already explained how. Pay attention.
No, the reason you pump to the 2325 cm-1 level is because it is radiatively metastable and can form a good population inversion with respect to lower-lying radiative excited states.
I have “tinkered” with, and built, lots of laser systems (since you apparently have some computer proficiency, you can search “researchgate b a bushaw”). However, I’m not really interested in your deflections. But, I would like to know about your physics education – it seems full of holes and illogical handwaving.
BA you are describing a secondary effect to added CO2 actually causing an initial perturbation, and the initial perturbation (An increase in the longwave energy imbalance) is not happening. What is wrong with the more plausible idea that Human activity dimmed slow natural warming, and then quickly removed the cause of the dimming, resulting in a rapid increase in the ASR. This is what most closely aligns with the observed data.
J: “What is wrong with the more plausible idea that Human activity dimmed slow natural warming, and then quickly removed the cause of the dimming, resulting in a rapid increase in the ASR. This is what most closely aligns with the observed data.
What is wrong is that it doesn’t fit the empirical data. As my, and other, analyses have shown, it is a real but minor effect compared to A-GHG warming. I worked strictly with the observed and publicly available data – it beats the hell out of “what if” hand waving and biased personal opinions. And, the dimming wasn’t quickly removed – 45 years after the peak it is barely past 1/2 removed.
Perhaps if you look at the evolution curve of SO2 (CEDS or our world in data) compared to that for CO2, maybe you can understand, at least intuitively, why it is so easy to separate and quantify the two effects with multiple variable least squares fitting.
BA
“What you have shown is correlation not causation”.
“That is correct, the strong correlation is only strong evidence for the physical causality model being correct.”
At least you admit that there is no empirical evidence linking added CO2 to warming, a strong correlation is still a correlation.
The problem is the correlation begins with an assumption that added CO2 causes an energy imbalance in the longwave spectrum, and this has net been verified, at the current CO2 levels.
If you have ever worked on a high vacuum system, and looked at
the transition between viscus flow vs molecular flow.
Under viscus flow the increase in vacuum is very fast, but once you get to molecular flow, the rate of increase in vacuum slows down a lot. I suspect something like this is going on with added CO2. For levels below say 200 ppm, The natural log curve may if fact fit, but at higher concentrations, it moves to another much slower curve. Planck radiation would look like a microscopic pin hole in the vacuum system, the higher the vacuum the larger the pin hole is relative to the vacuum level. At some point the system reaches equilibrium, where no matter how much longer you pump, the level of vacuum does not increase.
A correlation is evidence, a strong correlation is strong evidence. Sorry, you don’t understand how science works. When that strong correlation comes from measured (empirical) data, it becomes strong empirical evidence for the correctness of the proposed underlying physical causality. Get over it.
As Dr. Roy Spencer pointed out, the correlation between increases in the upper ocean temperatures and UFO sightings over the last half of the 20th century was better than 95%. Proving it is another matter…
I looked at what you proposed about the cloud feedback, and it is a If- Then type of concept, where the clouds respond to extreme warming, but the assumed future warming is based on a combination of an assumed high climate sensitivity and a high emission scenario.
https://www.nature.com/articles/s41561-019-0310-1
“In the simulations, stratocumulus decks become unstable and break up into scattered clouds when CO2 levels rise above 1,200 ppm. In addition to the warming from rising CO2 levels, this instability triggers a surface warming of about 8 K globally and 10 K in the subtropics. ”
What fits the empirical data better, that we warmed because added greenhouse gases may have caused a 0.277 W m-2 energy imbalance or that between 1992 and 2001 the ASR increased by 6 Wm-2, because more of the available sunlight made it to the surface, and less was reflected?
Over the last 150 years the correlation between CO2 and temperature is only 22%. However, the correlation with sunspots is 79%. And, when you combine the known effects of solar activity with various known ocean oscillations like the PDO (Pacific Decadal Oscillation) and the AMO (Atlantic Multidecadal Oscillation), the correlation is more than 95%.
The idea of the scientific method and global warming alarmism is an alien idea to Western academia.
We’d like to believe there would be some science behind AGW theory but looking at past climates there is no correlation between global warming and humanity’s emissions of CO2. Looking at information from ice cores CO2 lagged global warming: climate change was the cause not the result of increased atmospheric CO2. The climate was warm during the Medieval Warm Period and cool during the Little Ice Age.
If the MWP was warm and the LIA was cool. Then currently it must be hot.
https://sigmaearth.com/medieval-warm-period-vs-modern-global-warming/
“it is essential to emphasise that the MWP was not a globally synchronous event”
Only because science fact checkers insist that the AMO is regional.
Jungletrunks,
I think it more likely the author felt the need to emphasize magnitude and regionality because of people, like many here, who have and would try to use it to minimize the importance of current climate change with a false equivalence. Ring a bell?
Climatists know full well that after years of useless, senseless and superfluous testing, a causal link between CO2 and every dreaded malady known to a PhD will invariably be proven flatly impossible; but, in the meantime the global warming scam marches on as academia banks more bucks dreaming up phony links to every Earthly vagary.
I do know about impossible, but insignificant.
If we consider the fundamentals, the numbers do not add up.
The GISS’s alarmist and chief wrote an article about the greenhouse effect.
https://www.giss.nasa.gov/research/briefs/archive/2010_schmidt_05/
Back around 1900, they found that Earth was warmer than it would be without an atmosphere, 33C warmer because of a 150 W m-2 energy imbalance. This is an all time ratio of 33/150 = 0.22C per W m-2. Now the IPCC says that a doubling of the CO2 level will cause an imbalance of 3.708 W m-2, and that imbalance will result in 3C of warming, a ratio of 3C/3.708 = 0.809 C/ W m-2.
The question becomes, why would future energy imbalances show up with almost 4 times as much warming as past energy imbalances?
John, remember that “33C” difference is NOT for a real earth. The value comes from comparing real Earth to an imaginary sphere.
There are no liberal Utopian societies out there that have become great by eschewing energy. The global warming alarmists never live the way they want everyone else to live.
While the real-world consequences of Leftist ideology has been a record of misery, poverty and death, the thermageddon prophesized by Al Gore never happened. And yet, the government-education complex keeps the lie alive sewing its seeds of fear about a coming global warming doomsday.
The LIA and MWP both occurred at a very consistent 280 ppmv CO2. Fig 11 in https://watervaporandwarming.blogspot.com.
It would be interesting to test the accuracy of how ice cores preserved CO2 levels? A flight of P-38s landed in Greenland in 1942, and one was recovered in 1992 238 feet under the Ice.
I wonder what the recorded CO2 levels were at that levels in the ice? Were they near 280 ppm or at the 1942 level of about 325 ppm?
The electricity solution will come, like it or not.
Amazon, Alphabet’s Google and Meta Platforms on Wednesday said they support efforts to at least triple nuclear energy worldwide by 2050.
Source:hardware.slashdot.org/story/25/03/12/1350256/amazon-google-and-meta-support-tripling-nuclear-power-by-2050
The biggest problem I see with the Leftist-lib, AGW commie crowd is that they do not really stand for anything real. They don’t want to pump oil but are lynx-eyed against nuclear-which their smart French mentors went to years ago. And then, the Left blames big oil for rising gas and heating prices and makes it a political issue when the only thing that can make energy prices go down is a global recession. And for that the Left refuses to take credit. How many people have to suffer misery, poverty and death before Leftists realize that their ideology has already been tried and failed?
And the .01% will make the 99.9% of the rest of the world pay for it, just like we are paying for Neom.
https://wonderfulengineering.com/saudi-arabias-line-megacity-is-using-20-of-the-worlds-available-steel/
https://www.newcivilengineer.com/latest/anticipated-cost-of-saudi-arabias-neom-gigaproject-explodes-from-500bn-to-8-8-trillion-12-03-2025/
And not before time will the nuclear solution be achieved. I just hope we hear nothing further from the climate alarmists once the processes to establish nuclear as the main source of energy around the globe lifting people out of poverty and improving lives and self sufficiency on the journey.
To think we have wasted eight decades dithering around the most energy efficient solution rather than the best feel virtuous lunacy. There is no emergency to be expected at any time as long as human beings develop the many opportunities we can invent or ideas we can utilise.
That’s what we have done in the past and it is the alarmists that have caused the insane hesitations we have recently experienced. If they had proffered workable alternatives then all well and good but solar and wind? Don’t be so needlessly reckless with that nonsense when nuclear is standing right by you at a much more sustainable cost, superior in reliability and grid effective.
Near 55 years ago I came across that problem. A visiting engineer, brought out of retirement, to a concern of mine, had answered the matter. He said sale of nuke plants was stopped to foreign govts, because governments with no sense of the ‘conditions’ (tech impaired, to borrow a phrase), in a tight situation, the first thing they let go was maintenance.
Experience has proven him right; on more issues than maintenance. Power generation is the one industry plagued by gremlins with sharp teeth.
B A Bushaw:
I gave you a link to another paper
“SO2 aerosol removal: The cause of global warming'”
https://doi.org/10.30574/wjarr.2023.19.3.1996
It provides empirical proof that the warming since 1980 has been due to decreasing levels of atmospheric SO2 aerosol pollution, and that CO2 has NO climatic effect.
You stupidly commented on a different paper, try refuting this one.
On the plus side, the atmosphere can only get clear to a certain point, i.e. as clear as it was in say 1700. We do not know how much warming because of clearing air pollution remains.
I agree that there is no empirical evidence that added CO2 causes warming. If CO2 ever was on a positive energy imbalance curve, it is no longer on that curve, and now added CO2 reduces warming.
John Bahm:
You are correct, in the main, but your picking of the year 1700 was not a good example –it was during the LIA, which was caused by SO2 aerosols from multiple volcanic eruptions.
A better example would have been the MWP, which was a 300 year period with very few volcanic eruptions (only 31, VEI4 and higher), so that the atmosphere was free of any SO2 aerosols most of the time.
This was a global event, and it was a BAD time for humanity, with many droughts, floods, heat waves, stormy weather, etc.
Our air is still not as clean as then, primarily because China, India, and others are polluting the air with industrial SO2 aerosols, but the cleansing that has occurred so far has been sufficient to cause many wild weather events that could have been avoided with less cleansing of our atmosphere.
But I do disagree with your comment that added CO2 reduces warming–it has NO climatic effect, apart from reducing Earth’s albedo due to its global greening effect..
Burl,
I don’t look at, or respond, to your deflections. You did not provide scientific proof that CO2 doesn’t cause global warming, and you never will because it is false (disproven) and scientific proof doesn’t exist.
B A Bushaw:
Decreasing levels of atmospheric SO2 aerosol pollution increases the intensity of the solar radiation reaching the Earth’s surface, naturally causing warming. This is INEVITABLE , but this indisputable warming is ignored, and instead is attributed to rising levels of CO2 in the atmosphere.
This irrefutable.
So sad that you are unable to comprehend this simple fact!
It is acknowledged, and understood by almost everyone, except Burl. So sad that you can’t acknowledge or quantify the amount (around 10%).
Since you are wrong and are known to be wrong, let’s instead concentrate on the morality of truncating (cherry-picking) a complete data set so that the remaining data shows a (false) correlation that does not logically support your disproven hypothesis. Basically, you are a scientific cheat, and all the things you say about me and my disproof are ad hominem attacks on me because you are not able to defend your “scientific proof”, which doesn’t exist. So sad.
All of Earth’s CO2 ended up in oceans, limestone and in millions of years of decomposition of sediments from photosynthesis. Without modernity, it would never have been freed-up and delivered t:o the atmosphere. Guess you could say, modernity is the penultimate act of nature prior to the regreening of the Earth.
Thanks Ross for another excellent analysis.
Indeed the outcome of this process is largely irrelevant because the US has already decreased its CO2 emissions by 25% by replacing coal with natural gas. China now produces more CO2 and the next 6 countries combined and what we say is the SCC will make no difference to them.
A very dangerous low on the evening of March 14 will form in the central US. Winds over Texas will be so strong that they may cause snowstorms. Thunderstorms will develop on the eastern side and low temperatures on the western side.
https://www.ventusky.com/?p=38.5;-96.1;4&l=gust
Sorry, in Texas dust storms.
Zero Visibility: A severe dust storm with wind gusts approaching 100 mph caused a massive pileup on I-27 near Canyon, Texas, on March 14. https://bit.ly/4bv4o3w
We are approaching a new era of government spending- US taxpayers will no longer be required to fund Western academics to gather at prestigious resorts around the world to throw a log on the fire as they sit around and talk about their latest net zero strategies for saving humanity from itself.
Burl,
Average global water vapor increases naturally in response to temperature increase of the liquid water and resulting increase in saturation vapor pressure (ala Clausius-Clapeyron relation). Any effect from SO2 would be to contribute to the temperature increase of the liquid water. WV has increased more than twice as fast as possible from just temperature increase. Analysis showing this is at Sect 7 of https://watervaporandwarming.blogspot.com
The global environmental cult is making room for elite activists.
https://san.com/cc/amazon-rainforest-trees-cut-down-to-build-road-for-cop30-climate-summit/
Moreover, the hypocrisy of DC/Democommie energy policy as US energy producers were throttled back but despots, religious fanatics and autocrats in Russia and Iran to Saudi Arabia, and Venezuela were begged to pump more oil and are then flooded with cash at heady market rates. But, the public may be catching on to the insanity of the Hot World religion and politics that the fake news MSM, the half-baked educational industrial complex and Leftist blue state politicians have been dishing out since the ’90s.
Thunderstorms in US.
https://www.blitzortung.org/en/historical_maps.php
The Deep State has recently deleted a web file of monthly measured average global water vapor increase. The file, showing data reported by NASA/RSS from before 1988 through Dec 2023 had been available at https://data.remss.com/vapor/monthly_1deg/tpw_v07r02_198801_202312.time_series.txt Measured water vapor has been increasing more than twice as fast as possible from just planet warming and can account for all climate change attributable to humanity with no contribution from burning fossil fuels. https://watervaporandwarming.blogspot.com
“We Were Badly Misled About the Event That Changed Our Lives”
March 16, 2025 New York Times
I don’t have a subscription, so I can’t comment on what the article says about COVID matters, except from second hand sources. However, with the ‘vibe change’ that’s been happening in our culture I’m not surprised at the headline. Certainly the NYT isn’t undergoing wholesale change. But it is a sign of retrenchment. Not of economic costs, but the social costs of the Times’ editorial positions (which eventually translates to economic costs in lost subscriptions). I wonder what the headline will be for ‘climate change’?
Good question. Weather happens and there’s nothing we can do about it. Climate seems to be nothing more than hunks of it, usually at a minimum of– 30 year hunks of it and sometimes longer terms which are referred to as for examples, periods or ages and moreover, that way of referring to such epochs doesn’t apply only to climate. For example, we’ve been in a socio/politically-motivated misinformation and disinformation age since the end of World War II. For example, when I was a kid (and, TV was a new thing) people thought Walter Cronkite, for example, was a fair and balanced newscaster but mostly, didn’t even think in those terms which is how he got away with being a phony liberal.
Essentially, since the days of Cronkite, we’ve been in a culture war. And, since the days of Michael Mann, we’ve been in a climate war, which essentially is just an extension of the culture war- a Left versus right issue having nothing to do with science.
‘Increasing CO2 in the atmosphere does not increase the amount of IR radiation from the surface, nor does it increase the total amount of IR absorbed by the atmosphere since this was already virtually all absorbed within about a dozen metres of the surface even at preindustrial levels of CO2. What more CO2 does do is absorb the back radiated IR even closer to the surface. However, the thin layer near the surface which is being warmed is constantly being mixed into a vastly greater volume of the atmosphere by convection and wind turbulence. Wind and convection also carry large amounts of thermal energy away from the surface by evaporation and release it through condensation at high altitudes, where it can radiate away into space. Since increased CO2 does not increase the total amount of energy being absorbed and cannot “trap” it in a physically confined space as does an actual greenhouse, the “greenhouse effect” of more CO2 is highly ineffectual.’ ~Walter Starck
Another upper low with cold fronts will attack in the US in three days. I advise you to keep a close eye on forecasts and not to underestimate cold fronts at this time of year, as a large temperature difference in the front means the possibility of thunderstorms and tornadoes.
https://i.ibb.co/tPJqSvWf/gfs-o3mr-200-NA-f072.png
Wagathon, Walter Stark
Actually, it can be proven that CO2 has NO climatic effect, apart from decreasing albedo due to the greening of our planet
https://wjarr.com/sites/default/files/WJARR-2024-0884.pdf
Paleo and recent data corroborate the assertion that CO2 has no significant effect on climate. I have been working the water vapor data and discovered that the increase in WV can also account for all of the climate change attributable to humanity. The engineering/science analysis is documented at http://globalclimatedrivers2.blogspot.com
and https://watervaporandwarming.blogspot.com .
Dan Pangborn:
Your analysis looks to be airtight, but so does mine, which has been validated hundreds of times, indicating that SO2 aerosol levels are the Control Knob for our climate.
So, how can the two be reconciled? Any thoughts?
That they are able does not require that they actually do. My guess is that they both contribute. Also, perhaps there are other natural factors that contribute cooling. What caused the cooling from MWP to LIA??
Q ” What caused the cooling from MWP to LIA??” Million $$ question.
MIA and LIA are two consecutive inflection points in the Eddy cycle; spaced about 490 yrs apart. The cycle can be traced back for 8000 yrs. Likely not ‘control knobs’ but collaterals.
Water vapour is a thermal energy store in its phase change (unlike air), and stored and released due to other changes (eg pressure). The question to ask is: why the Eddy cycle inflection points?
Two such cases here: https://melitamegalithic.wordpress.com/2022/10/31/searching-evidence-astronomy-for-the-heretic/
RWP – at 173ce – provided a key. Warming. 2346bce being resolved in detail.
Dan Pangburn:
“What caused the cooling from the MWP to the LIA?”
Increased volcanic SO2 aerosol pollution!
The LIA began with the VEI7 eruption of Rinjani in 1257, VEI6 eruptions of Katia in 1262, Quilota in 1280, and six VEI5 eruptions of Tarawera between 1280 and1315.
VEI4 and larger eruptions per century totaled 18,13,13,32,28, 38, 1250-1850.
With respect to water vapor or decreasing SO2 warming, the amount of water vapor in the air is controlled by global temperatures, which are controlled by the amount of SO2 aerosols in the atmosphere, so I believe that WV warming has to be a second order effect.
SO2… explaining in part the link between volcanic activity and global cooling…
Wagathon:
“SO2”. Yes, I agree.
I have a longer comment regarding SO2 currently in moderation.
A dangerous low is developing in the central US, already giving thunderstorms and snowstorms in Nebraska and Kansas. As the low moves east, the cold front will pull more moist and warm air from the south, threatening to form strong storms on the front.
“Coincidence is God’s way of remaining anonymous.”
Albert Einstein
https://www.cristos-vournas.com
An image of a narrow street in a highly urbanized area.
No wonder the incident solar light doesn’t get reflected from the street – the light’s energy goes deep down and is entirely absorbed.
Link to image:
https://www.bing.com/images/blob?bcid=qE60dSHLTzsIrA
Sorry, doesn’t open.
Link to image:
https://img-s-msn-com.akamaized.net/tenant/amp/entityid/BB1maPpo.img?w=534&h=267&m=6
We often assume that making good decisions requires absolute certainty, but in reality, we rarely have all the information we need. This is where a little cognitive variability can be an advantage.
In uncertain situations, randomness in thought processes helps us adapt, explore different possibilities, and come up with better solutions.
–
https://www.cristos-vournas.com
In the case of warming since 1978 attributed to Human activity, we have not even properly identified the cause of the problem, or even if a problem exists. The recorded warming could be as simple as a complex interference pattern, or a clearing of air pollution, releasing slow natural warming, What it really cannot be is added CO2, as that would have a signature of increasing the
longwave energy imbalance by decreasing the Outbound Longwave Radiation (OLR) which is not happening.
John, the signature of GHGs is increased OIR absorption in the atmosphere, and converting that to thermalized (kinetic) energy (increased temperature) amongst all the atmospheric molecules. There is always “longwave imbalance”. The problem is that IR energy, absorbed and retained in the atmosphere, creates a TOTAL ENERGY imbalance. Sorry, you don’t get it, but willful ignorance often results in irrational thought processes, and repeating the same false speculation over and over again (like Burl) does not make it correct.
Of all of the descriptions for understanding possible reasons for behavior, anointing CO2 as an unassailable and holy, the One, as explaining AGW obsession concerning climate change, is the result of politics over reason in Western academia.
Scientifically weak minded Leftist global warming alarmists really do make this one element, [i]the One.[/i]
the One
Whether rooted in religion or superstition, it is not science!
B A Bushaw:
You need to Google the NASA article “Atmospheric Aerosols: What are they and why they are so important?”
It states that both volcanic and man-made SO2 aerosols reflect incoming solar radiation and cool the surface of the planet.
The corollary, of course, is that fewer aerosols will cause less cooling (i.e., warming) of the surface, which you deny
B A, You are still wrong, the only way that CO2 can directly add to the energy imbalance is in the longwave spectrum, it cannot change the amount of Sunlight that reaches the surface.
The longwave spectrum has a negative energy imbalance (Cooling), that reduces the positive imbalance from increased ASR.
True, calling CO2 a ‘greenhouse gas’ is an invalid inference. When it comes to heat, CO2 cannot, ‘“trap” it in a physically confined space as does an actual greenhouse,’ Walter Stark noted (see infra), ‘the “greenhouse effect” of more CO2 is highly ineffectual.’
Interesting paper with Grok 3 beta as lead author, with some help.
A Critical Reassessment of the Anthropogenic CO₂-Global
Warming Hypothesis: Empirical Evidence Contradicts
IPCC Models and Solar Forcing Assumptions
https://x.com/cohler/status/1903188524888887344
Not sure I agree with SSP 2 as being most likely, unless you’re counting nuclear as renewable.
Bill, (and Erikson),
The “Grok 3” authored paper confirms what we already knew about computers: GARBAGE IN, GARBAGE OUT. A quick scan of the authors of papers fed to this AI program show that they include multiple papers by Harde, by Salby, by Koutsoyiannis…, all thoroughly debunked. I did learn something though: I don’t have to take Wille Soon seriously since he is so gullible.
“Imagine your life without abundant, reliable, affordable electricity and transportation fuels,” says Paul Driessen (Holding Greenpeace accountable). “Imagine living under conditions endured by impoverished, malnourished, diseased Indians and Africans whose life expectancy is 49 to 59 years. And then dare to object to their pleas and aspirations, especially on the basis of dangerous manmade global warming speculation and GIGO computer models. Real pollution from modern coal-fired power plants (particulates, sulfates, nitrates and so on) is a tiny fraction of what they emitted 40 years ago – and far less harmful than pollutants from zero-electricity wood fires.”
Maybe Grok 3 should make up its mind. I asked it:
“What is causing the current rise in global temperature?”
It said:
“The current rise in global temperature is primarily driven by human activities, particularly the burning of fossil fuels like coal, oil, and natural gas. This releases large amounts of greenhouse gases, such as carbon dioxide (CO₂) and methane (CH₄), into the atmosphere. These gases trap heat from the sun, leading to a warming effect known as the greenhouse effect…”
I asked Grok 3:
“How good are the IPCC models of the atmospheric response to the increase in CO2?”
It gave a detailed response, concluding:
“Bottom Line:
The IPCC models are robust for global, long-term trends and the atmospheric CO₂ response, with a confidence level of ~90%+ for broad warming projections. They’re less reliable for decade-by-decade wiggles or pinpointing local impacts.”
Maybe Grok 3’s arm was twisted by co-authors?
Ask Grok 3 beta if Michael Mann’s hockey stick graph is an accurate representation of global climate change and if, as he claimed, he was awarded a Nobel prize for it?
I asked Grok 3 if Michael Mann’s hockey stick graph is an accurate representation of global climate change.
Grok 3 said:
“Tell Wagathon to ask his own questions.”
Dear Grok 3 beta, did Christian Schlüchter learn that Hannibal didn’t cross the icy Alps to attack Rome– his army crossed a forest. Meanwhile, we all learned that glaciers come and go on a lot faster Earthly timetable than we realized (i.e., they were gone both 2,000 and 4,000 years ago not just 10,000 years ago) and, the reason for their demise obviously had nothing to do with us moderns injecting our CO2 into the atmosphere.
Weather, the air temperature etc., it is all the convective heat exchange from the planetary surface accumulated solar energy.
Atmosphere doesn’t get warmed by the solar rays. Air gets warmed when in contact with surface. The air is very cold up there on mountains.
–
https://www.cristos-vournas.com
Battery installations for residential solar have surged in Texas and California. It occurred to me that solar destabilizes the grid in two different ways. Solar farms destabilize it due to fluctuations in supply, which are difficult to manage. But on the load side, when it’s been cloudy for several days, these residential solar units will be demanding more power from the grid all at the same time, creating a second grid instability. These solar powered residencies should be the first in line for load shedding when electricity supplies get tight.
THE_LINK:bloomberg.com/news/articles/2025-03-24/why-americans-are-adding-home-batteries-at-a-record-pace
Did you know that if just 20% of the customers defect from the grid it will be bankrupt?
“The threat of economic grid defection in the U.S. with solar photovoltaic, battery and generator hybrid systems”
https://www.sciencedirect.com/science/article/pii/S0038092X24006054
This is also known as the “utility death spiral”
Just wait till bi-directional EVs flood the market.
Sounds like a d*** good reason to ban solar. :)
More solar on the grid!
Well look what the deep red state of Utah just did.
“A new Utah bill allows portable solar power systems of up to 1.2 kW ac to connect directly to 120V outlets without interconnection applications or utility fees, provided they meet NEC and UL certification standards.”
March 5, 2025
https://pv-magazine-usa.com/2025/03/05/balcony-solar-gains-unanimous-bipartisan-support-in-utah/
If you think “green” energy does NOT destabilize the grid, just ask China.
But such a rapid expansion will require massive investment in long-distance transmission lines, energy storage, and flexible peak-loading to make up for clean energy’s intermittency.
“Coal and gas remain the most accessible balancing tools for grid stability,” said Huaneng’s Zhao.
The deluge of solar power has thrust electricity prices into negative territory in regions with liberalized energy markets, which bodes ill for the economics of further expansion.
Shandong province, home to China’s largest solar fleet, has been forced to curtail rooftop projects due to grid constraints
Another-Link:bloomberg.com/news/articles/2025-03-24/china-s-energy-transition-at-odds-with-solar-glut-cheap-power
In my opinion we are approaching the solar problem all wrong.
Poor duty cycle solar power would be better used as feed energy for hydrocarbon energy storage. Basically you create natural gas from Atmospheric CO2, Water, and electricity. The natural gas grid becomes the energy storage element, with the high efficiency combined cycle NG power plants providing on demand electricity.
The Un- Natural gas could also be used as the feedstock for transport fuels. As we grow solar capacity the problem will only get worse. By allowing the refineries to purchase surplus electricity at low prices we can sustain our energy growth without limits. Yes I know the round trip efficiency is low, but we are talking about surplus electricity that could damage the grid without a large flexible demand.
Here is another way to deal with CO2 emissions from that combined cycle gas generator and create additional revenue streams too.
“Scientists Create ‘Artificial Sand’ That Eats CO2, Could Transform Construction Industry”
https://scienceblog.com/557317/scientists-create-artificial-sand-that-eats-co2-could-transform-construction-industry
March 19, 2025 Northwestern University
“The carbon-trapping capacity of these materials is remarkable – they can store more than half their weight in CO2. For instance, one metric ton of the material (composed half of calcium carbonate and half magnesium hydroxide) could permanently sequester over half a metric ton of carbon dioxide.”
Some 30 yrs ago CO2 fro CC plant was being directed to large greenhouses to improve food output.
[ js C and O2 is the basis of life on earth. Locking it all in sand will reduce earth to another martian landscape. Oh, OK, we as a species will be gone long before that ].
There are no new CO2 emissions from burning CH4 made from atmospheric CO2, the process is carbon neutral.
John,
“You guys just don’t get it. CO2 has NO climatic effect!”
Of course!!!
–
Link: https://www.cristos-vournas.com
Jacksmith4tx
Sigh!
You guys just don’t get it. CO2 has NO climatic effect!
I agree but the CO2 level is useful for providing the raw material for a path to sustainable energy. The fact that it eases the minds of the alarmists is just an added benefit.
Remember that a gallon of gasoline requires about 4 lbs of carbon to create from scratch.
To try to excuse continuation of the misguided war on fossil fuels, the Deep State has apparently figured out how to obscure that water vapor increase can account for all of the climate change attributable to humanity. They deleted the web file that reported TPW anomalies thru 2023 and are not reporting the data for 2024. Calculations using data from the deleted record show that average global water vapor has been increasing more than two times faster than possible from just feedback from planet warming. The deleted file can be recovered via the Waybackmachine at https://web.archive.org/web/20250118043906/https://data.remss.com/vapor/monthly_1deg/tpw_v07r02_198801_202312.time_series.txt
The biggest emitter of are CO2 in the world, China, says to Western academia and all the moribund Eurocommies– pound sand!
The concept of sustainable energy from Solar is interesting, because the poor duty cycle means it is not a dispatchable source.
The irony is that the oil companies have the technology that will allow the necessary scale and duration of energy storage necessary to make solar viable, and will bring fuel products from those processes to market, when market conditions specify that is the most profitable path. This is not as far away as many people think, as the oil feedstock that goes into a refinery has a very real cost, and those costs will at some point be greater than the cost of making those feedstocks from water, atmospheric CO2 and surplus electricity. The demand for hydrocarbon fuel products will still be there, short of a MAJOR technology leap in battery technology.
The social cost of government-funded manufacturing of fear about the impact of anthropogenic- caused CO2 will depress future economic wellbeing as a result of the misallocation of scarce resources and penalizing those who live in the real world by showering preferences on those who pull strings in the metaworld to support hysterical Liberal attitudes about an impending doomsday.
I bet you feel better now that you’ve got that off your chest :-)
“…man-made global warming is a mere hypothesis that has been inflated by both exaggeration and downright malfeasance, fueled by the awarding of fat grants and salaries to any scientist who’ll produce the ‘right’ results.” ~Matt Patterson, NY Post
‘Thanks in large measure to the work of Monnett and Gleason, the polar bear became the official mascot for climate-change alarmism. Images of a lone polar bear perched forlornly on a shrinking ice flow served as efficient propaganda for indoctrinating children; Al Gore used the “polar bears are drowning” meme in his global warming scare-umentary “An Inconvenient Truth.”’ (ibid.)
And now, replacing the polar bear- ‘Greta has become almost a synecdoche for the global climate movement: its mascot, its theorist, its revolutionary, and a representative “victim” of generational malice.’ ~ David Wallace-Wells
Greta has moved on to be a supporter of Hamas–who would have guessed?
Environmentally conscious tho, e.g., taking a €2.7 million, 60′ racing yacht, the Malizia Ii (even the sails are carbon fiber) in lieu of a private jet!
The only ‘evidence’ we have so far is that the climatists’ GCMs are god-awful– GIGO… is the billions of dollars that have been wasted paying colluding, superstitious, fearmongering school teachers who loath America and corrupted science to destroy the economy.
Climatists’ GCMs are nothing more than modern-day divining rods. Andi Cockroft described the first digital weather model ever. It was a computer model by Edward Lorenz back when vacuum-tube computers were first introduced to science not much more than about fifty years ago. Lorenz used, “a set of a dozen or so differential equations involving such things as temperature, pressure, wind velocity etc.” As Concroft tells the story, Lorenz re-ran his program, “by entering a variable to 3 decimal places,” and to Lorenz’ surprise, “the results were completely at odds with what was achieved earlier.” As it turns out, “re-entering the variable to its full 6 decimal places produced a repeat of the initial results – from this Lorenzo drew the inevitable conclusion that with his dozen or so equations, even a miniscule variation on input is capable of creating massive change in output.”
I suspect there is a reason Hansen called his first Model “Wonderland” !
In Western academia’s ‘wonderland’ America is responsible for everything bad in the world… even bad weather!
Bad indeed. Yet America will be good again once we drop all tariffs, to become the globes everlasting social piggy bank–again. There it is, all bankrupt concerns resolved, the U.S. becomes the wonderland once more.
At first it was a hypothesis. And it was a wishfull hypothesis.
What if there is not a +33°C atmospheric greenhouse warming effect on Earth’s surface?
And if there is some – how much it is then?
Because if there isn’t a strong atmospheric greenhouse warming effect on Earth’s surface, then the 1,5°C temperature rise since the predindustrial era, then that 1,5°C temperature rise cannot be related to any greenhouse warming effect whatsoever.
–
Link: https://www.cristos-vournas.com
An inconvenient fact for global warming alarmists is that ocean temperatures were warmer when the first Vikings settled Greenland (in the 10th century) than they are today…
When it comes to global warming, humanity is just along for the ride…
I am currently reading a book on climate from the 1970’s which discusses in detail the early history of dentro reconstuctions and reconciling estimated temps based an tree ring width with the volumnous wine harvest records throughout europe. There was considerable variation in the start of the wine harvest based on weather. A 15 day difference corresponded roughly with 1c temp difference in france from 1801 through 1920ish. The current average start date for the wine harvest in the burgundary region is only about 5-8 days earlier than the the average start date from the early 1800’s. Granted, the methodology is somewhat crude, but it does point to a few issues in the paleo arena including but not limited to A) the failure to properly reconcile the proxies with known contemporaneous facts and B) the believe that reconstructions have extreme level of accuracy ie high confidence levels with very narrow error bars.
https://winegourd.blogspot.com/2017/10/grape-harvest-dates-and-evidence-for.html
https://cp.copernicus.org/articles/15/1485/2019/
Let’s suggest the period between 950-1250; this period isn’t–
“relevant for the understanding of past and present climate”
for grapes in Europe? How about between 250BC and 400AD?
I smell sour grapes.
The relevant period for grapes and climate change is the last 40 years, as shown in the references given. Funny – Joe and JT have no references at all – just personal beliefs (that is the noun form Joe), not at all unusual.
40 years is irrelevant within a chaotic climate system.
And it’s nothing personal, the relevance is that science recocognizes the periods referenced, you don’t.
Jungletrunks may have a good nose for sour grapes. Grapes are not a good indicator of climate.
One time I passed on my way by a large vineyard. It was a good year and I usually stopped by on my way for a look at the progressing harvest. On the day of the harvest there was much activity from early hours. A fine day, quite hot for August, plenty of crates, a truck with the winery’s logo, and sure, a tv crew. I was late; it was past 8:30am. Passed by after 1pm. The field was a foot deep in water after a sudden storm. After a good summer grapes absorb the abundant water and burst. You get tons more with the excess water, but only good for a weak vinegar. But it says nothing about that year’s weather/climate.
tunks, thanks for your opinion. It carries no weight and has no references. Don’t get it, do you?
The relevent period is the last 1k years. The 40 year time span you insist on is
A) too short of a period
B) an intentional use of a cherrypick period.
An honest scientist wouldnt try to hide using artificially short study periods.
I am not going to throw insults,
Melita, thanks for your anecdote. I don’t see how it relates to 600 years of records and the trends observed therein.
Joe K.
A) It is 600 years of data – (B) no cherry-picking. The last 40 are just the ones providing evidence of recent global warming. Those 40 years are not cherry-picked, they are compared to the whole 600-year period, to show how unique the current warming is. Nice try Joe. You are the one that brought it up from “some climate book” that you have been reading. Guess you don’t like it when you are refuted by peer-reviewed publications. As for no insults – thanks for that, but it doesn’t make up for all the ones you have levied in the past.
B A: Vines are susceptible to many issues. So many that here it is now illegal unless planted on american root stock.
Then again 600 yrs is still a very short period. Intcal 13 for C14 which is based on tree-rings shows disturbance points that follow the inflection points of the 980 Eddy cycle.
Still Intcal is a proxy that is itself based on other proxies; not accurate because of the time spread, when other sources have a much closer chrono indication.
Eg. For the date 3550bce Intcal 13 shows abrupt change from tree-rings. But there is also research that finds even change in the tree lines with a narrower time-line. Thus excluding spurious indication from pest infestations.
Another issue is that the vine (and wines), unlike trees, has been traveling to places at least from the times of the Phoenicians, with its baggage of pests and viruses.
Melita,
600 years is a good baseline for the last 40 years. An afternoon thunderstorm is not. Thanks for your thoughts.
There’s a common misconception that per capita consumption of energy and resources is directly related to negative environmental impact. We’re told that, because the average North American consumes 80 times as much as the average Bangladeshi, we cause 80 times the damage. But all one need do is travel to Bangladesh to see the impact of poverty on the environment. Forests are stripped bare for subsistence farming, rivers are fouled for lack of sewage treatment, and wildlife is severely reduced through poaching. These people need more resources, not less… As a sensible environmentalist, I believe we should be planting more trees and using more wood-the world’s most renewable resource- while building upon and sharing everything we’ve learned about forest sustainability. ~Dr. Patrick Moore (‘Confessions of a Greenpeace dropout’)
If the 1,5°C global temperature rise since the predindustrial time to be attributed to the CO2 content rise from 280 ppm to 400 ppm (a 120 ppm rise), then the entire 400 ppm the currect CO2 content should warm Earth’s averafe surface temperature by ~5°C.
Water wapor ~ 1% H2O content is ~10000 ppm, or it is 25 times that much.
Let’s calculate: 25 * 5°C = 125°C
125°C + 5°C = 130°C
–
https://www.cristos-vournas.com
Waiting for the global warming alarmists of Western academia to blame earthquakes on AGW…
It is, more likely, Earth is warmer than Moon, because Earth has a higher (N*cp) product.
–
Link: https://www.cristos-vournas.com
Thinking Earth’s massively higher thin, brittle crust to core ratio would be a significant contributor to surface instability.
Also thinking Earth’s thin atmosphere makes Earth warmer than Moon – that thinking is a mistake.
–
Link: https://www.cristos-vournas.com
This is not the end of severe weather in the US. Arctic fronts will continue to push westward on the US, bringing thunderstorms to the central and eastern US.
https://i.ibb.co/x8rttDb4/gfs-z100-nh-f72.png
SoCal is springing ahead- e.g., Birch trees are leafing out early.
Yeah, the cherry trees along the tidal basin are also blooming early. Must be some kind of plant conspiracy.
Western academia’s concerns about whether cherry trees blossom in Washington before or after March 28th is really about how many additional business-hating liberals and Leftists must the productive haul on their backs as they trudge up and down the mine shafts.
I’d recommend Strunk & White.
The flightless bird always sells form over function.
The intellectual birds prefer clear and concise communication over purple prose.
Wagathon says “Birch trees are leafing out early.” Why??
Here’s a parallel. A collection of potted fig trees (in driveway; east/west oriented. One tree south-facing broke into leaf withing hours of a hotter than usual day hours. The others in the shade some 3wks later.
Why hotter than usual. Gravity. New moon. It was/is common knowledge, but not known why, the ancients knew the new moon was/is a date to wait for particularly for sowing.
Why hotter?? Reduced gravity (Allais effect, gravity anomaly valley) during conjunction is/has a throttling effect on air moisture. maybe more noticeable at ground level – where the seed beds are.
The devil is always in the detail.
People tend to merge the idea that Earth is warming, with
the assumption that the observed warming is from added CO2.
The reality is that we are warming, but the cause is very subjective. Warming from added CO2 would show up as a decrease in the outgoing longwave radiation (OLR) but that has not been happening.
True, true- the Earthshine project showed that. The amount of `climate forcing’ that may be due to changes in atmospheric greenhouse gases is either overstated or countervailing forces are at work that GCMs simply ignore, e.g., GCMs fail to account for changes in the Earth’s albedo.
Nope, an increase in surface OLR increases both the amount absorbed in the atmosphere and the amount escaping at the TOA. And that is what is happening. Your logic is defective and does not relate to reality.
https://pmc.ncbi.nlm.nih.gov/articles/PMC4250165/
Forget about statisticians, McShane and Wyner who found absolutely no signal whatsoever in the proxy data Michael Mann used to fabricate the apocryphal hockey stick graph. Apparently, one ‘Mann’ signal is another man’s noise…
fwiw – both simberg and steyn filed separate motions last week for attorney fees associated with Mann’s and the attorney’s false statements and false exhibits. Defendents very likely to succeed on their motions.
Important point on professional ethics and integrity. Can you trust a persons scientific work when they are so dishonest in their personal life?
John Bahm:
You say that the cause of our warming is very subjective.
NO, ALL of our warming is due to decreasing levels of industrial SO2 aerosol pollution in our atmosphere due to “Clean Air” legislation and “Net Zero” activities–and cooling events are due to increasing levels of SO2 aerosol pollution in the atmosphere. No exceptions!
Subjective in that the mainstream IPCC position says that the warming is coming from increased greenhouse gases.
I agree with you that the observed warming since say 1978 is from our reducing air pollution and allowing more available sunlight to reach the surface.
Net Zero is about CO2 emissions, and when we get there(And we will, but not because of regulations), it will not change the
path the climate is on.
The fixation of the AGW Idiocracy on CO2 is as hair-brained as thinking we must green the Sahara by towing icebergs to Africa.
The discovery of ancient civilizations hidden from view for centuries suggests that the Amazon Forest was much smaller in earlier years than it is today
The history of civilization is replete with examples during times of hardship caused by vagaries in weather due to changes in the climate of the sacrifice of Innocents by a ruling cast to appease their gods.
Is Western academia’s war against CO2 and pogrom against modernity different from or the sacrifice of children by Incas and Aztecs?
Sacrificing fattened children to bring about climate change is an example of a negative outlook with horrible consequences on the business of living, whether it is done by Incas on the summit of Llullaillaco or by Leftists and liberal Utopians in Western classrooms.
How true…
Interesting article on a paper examining the distribution of Earth’s gravity and its effect on sea level.
https://earthlymission.com/indian-ocean-geoid-low-iogl-largest-gravity-hole-anomaly-solved/
https://agupubs.onlinelibrary.wiley.com/doi/10.1029/2022GL102694
Interesting. The effect on SLR is counterintuitive. I suspect that in a few generations what insights scientists will find about climate will be paradoxical and thus responsible for not understanding more of it earlier. We are such a logical species. Sometimes to our detriment. Thanks for the links.
Quote ” We are such a logical species.”
From wiki “– Plato in using myths was didactic.[76] He considered that only a few people were capable or interested in following a reasoned philosophical discourse, [added: or logic] but men in general are attracted by stories and tales.
A model built on assumption will only confirm those assumptions.
The link does not say how gravity changes abruptly due to short period planetary conjunctions; and the collateral effects.
Great example of, counterintuitive- e.g., if all the ice on Greenland melted the sea level there would fall!
e.g., countered to the Leftists intuition that the world would be a better place without Americanism, counter intuition is that because of Americanism, Leftists are free to think that way…
Perhaps some may wish to debate whether the use of proper mathematics in the field of climatology is optional but the debate is over. The AGW hypotheses certainly favors the view that ‘mathematical realism’ independent of the intuition and beliefs of researchers is indispensable but without the independence and objectivity of honorable users of the scientific method, all of the conclusions of the global warming alarmists amount to nothing more than dogma, politics and propaganda.
Cost of Carbon? Really? How about the benefits of Carbon? What is the NET benefit to Society of burning Fossil Fuels? It is enormous. No one railing against CO2 is willing to lead a life without the benefits of CO2. They live in luxury homes and fly in private jets.
An unprecedented coincidence !!! It is what the planet surface temperatures comparison method reveals.
Let’s see:
our Moon’s effective temperature Te = 270,4K
and our Moon’s average surface temperature Tsat = 220K
Moon’s average Albedo a = 0,11
and Solar Flux = 1361 W/m²
****
Mars’ effective temperature Te = 210K
Mars’ average surface temperature Tsat = 210K
Mars’ average Albedo a = 0,250
and Solar Flux = 586,4 W/m²
****
Now, Mars has a very much rare atmosphere – when compared even to Earth’s – Mars is almost airless.
It can be demonstrated, for the same as our Moon’s Albedo
a = 0,11 Mars would have the same as Moon the average surface temperature Tsat = 220K.
Thus, for Mars when with Moon’s Albedo a = 0,11 it would be
Tsat = 220K = Te.
Mars has 1361 W/m² / 586,4 W/m² = 2,32 times lesser solar flux incident on the surface.
So, why – at first approach – our Moon doesn’t have the average surface temperature Tsat = 270,4 K = Te ?
And why the Moon’s actual Tsat = 220 K is lower than Moon’s effective temperature, why it is lower by the very large difference of 50,4°C ???
–
Link: https://www.cristos-vournas.com
‘On America’s longest-established carbon trading system, you could buy the lifetime emission cuts of one car for about US$460 [e.g., the cost of planting 46 trees in a carbon offset program].
‘Yet, many countries subsidize each car to the tune of $5,000 or more [plus, travel in special EV Lanes, contribute nothing toward highway maintenance costs and enjoy lower nighttime electrical rates for charging batteries thanks to government tinkering of electrical costs].’ ~ Bjorn Lomborg (on the Left’s dysfunctional climate policy)
The Grok 3 beta et al.: A Critical Reassessment of the Anthropogenic CO₂-Global Warming Hypothesis paper … that I linked to in a post above, 3/22, has now been reposted by Science of Climate Change, a Norwegian journal.
https://scienceofclimatechange.org/
I found this paper interesting for two reasons. One, it used AI. And two, it adds to a growing vibe shift away from the demonizing of CO2 as the sole agent of warming. This is very important as the more the IPCC is challenged the greater the likelihood those challenges will increase, meaning more open debate and less reticence from those scientists/media/teachers/students who can’t afford to suffer the backlash from the maniacal alarmists.
Perhaps might even say,… their monomaniacal ravings of doomsday!
We are continually told so much about our electric systems that simply isn’t true.
This means that we are paying more for our electricity than we should, and utilities and green grifters are the reason. The green grift is based on the misinformation that life-giving CO2—that we must breath in and exhale with every breath—that is greening our world and increasing crop yields must be lowered. Somehow, this will stop global warming and make our weather better.
We are told wind and solar will lower our electric costs. It is just the opposite.
Wind produces electricity about 30% of the time and solar 20% of the time. Solar produces little or no electricity for the first and last hour of the day, which is important because our daily peak demand is from about 5 to 9 PM. This means on demand electricity must ramp up when the sun is setting or out go the lights.
https://www.realclearpolicy.com/articles/2025/04/03/our_electric_rates_continue_to_climb_because_of_greedy_utilities_and_climate_grift_1101708.html
Thank you, Jin2.
“The green grift is based on the misinformation that life-giving CO2—that we must breath in and exhale with every breath—that is greening our world and increasing crop yields must be lowered. “
How they are going to enrich atmosphere with the life giving CO2? What the mainstream IPCC position says?
It is a mystery…
Where do they think the atmospheric CO2 comes from in the first place?
What the mainstream IPCC position says?
–
Link: https://www.cristos-vournas.com
Half of the annually emitted CO2 “stays” in atmosphere, and half does not – it is absorbed by natural sinks.
When we humans stop emitting CO2, should we expect the natural sinks stop absorbing?
–
How about we stop emitting, but the CO2 content continues growing?
–
Because Nature is not an IPCC regulated entity…
–
https://www.cristos-vournas.com
Nature don’t lie.
The Antarctica Question
Billions have heard about it. Millions have nightmares about. Thousands have thought about renting a U-Haul and moving the furniture from the low country to the safety of the Mile High City so they can listen to Rocky Mountain High in peace.
But little by little the narrative is changing. Lady Liberty’s hem appears to be safe…..at least for now.
Studies are identifying time scales of the WAIS collapse of 200 to 900 years and “A number of recent studies suggest that TG and PIG are unstable under the current climate and could collapse on a timescale up to 2000 years.”
Even Cher will have packed it in by then.
The number of theories for the current melting in the ASE is endless. Some are contradictory. Everybody has his hustle.
“ At decadal timescales, this model shows enhanced ice-shelf melting under westward wind anomalies, a reverse relationship to previous studies”
“Past studies have suggested that West Antarctic ice shelves melt more during El Niño because of warmer ocean waters at the ice shelf bases. However, oceanic changes during El Niño lead to warming on the shelf near the ice which is difficult to isolate. That is because ENSO is only one of many drivers that impact shelf water temperatures“
https://agupubs.onlinelibrary.wiley.com/doi/10.1029/2023GL104518
https://tc.copernicus.org/articles/19/283/2025/
https://agupubs.onlinelibrary.wiley.com/doi/10.1029/2022GL100646
In Athens air is more polluted now. To get warm people use fire places and burn wood intensively.
When there are some cold evenings in winter – the air pollution very much worsens. You better stay in, because outdoors it is very smoky. We need to keep windows closed, not to let polluted air in.
–
https://www.cristos-vournas.com
Globally, March 2025 is colder than March 2024. 2025 continues to be colder than 2024 for all months thus far.
2024 Jan +0.80
2024 Feb +0.88
2024 Mar +0.88
2024 Avg +0.85
2025 Jan +0.45
2025 Feb +0.50
2025 Mar +0.58
2025 Avg +0.51
https://www.drroyspencer.com/2025/04/uah-v6-1-global-temperature-update-for-march-2025-0-58-deg-c/
Global Warming Petition Project
It’s now up to +9000 PhDs …
http://www.petitionproject.org/
The vibe shift continues …
Some of us worry about sea level rise, but that is not the only consequence of global warming. A paper in the March 27, 2025 issue of Science analyzes the global decline in terrestrial water storage, both loss of soil moisture and the lowering of (fresh) water tables. Interestingly, anomalies in gravitational data are one of the inputs. Likely this is the major near-term impact of AGW. I include links below, and a brief excerpt from a companion article for those without access to Science.
“Understanding the relationship between atmospheric carbon levels and global temperature dates back to 1895, when Swedish scientist Svante Arrhenius argued that variations in carbon dioxide concentrations could affect Earth’s heat budget. How climate warming affects Earth’s hydrological cycle—the continuous water movement between Earth and the atmosphere—is a key question for managing water resources and making weather predictions. Although local and regional changes in the water cycle have been observed (1, 2), conclusive proof of a global-scale shift has been elusive. Answering this question requires decades of global mean sea level data and advanced climate and hydrological modeling. On page 1408 of this issue, Seo et al. (3) report how the integration of multiple global geophysical datasets reveals a permanent decline in terrestrial water storage. The study provides robust evidence of an irreversible shift in terrestrial water sources under the present changes in climate.”
https://www.science.org/doi/10.1126/science.adw5851
https://www.science.org/doi/10.1126/science.adq6529
Dave
To show the significance of what is happening now you need to demonstrate it’s beyond what occurred in the past and that other factors other than AGW are not in play.
“We use this reconstruction to place recent hydrological changes and future precipitation scenarios in a long-term context of spatially resolved and temporally persistent hydroclimate patterns. We find a larger percentage of land area with relatively wetter conditions in the ninth to eleventh and the twentieth centuries, whereas drier conditions are more widespread between the twelfth and nineteenth centuries. Our reconstruction reveals that prominent seesaw patterns of alternating moisture regimes observed in instrumental data across the Mediterranean, western USA, and China have operated consistently over the past twelve centuries. Using an updated compilation of 128 temperature proxy records we assess the relationship between the reconstructed centennial-scale Northern Hemisphere hydroclimate and temperature variability.”
https://www.nature.com/articles/nature17418
“… the abstracted volume of water for human needs has increased from about 500 to ∼4000 km3 yr−1 over the last 100 years”
Section 5.3 has an interesting discussion of groundwater abstraction’s contribution to GMSLR.
https://iopscience.iop.org/article/10.1088/1748-9326/ab1a5f
“Dave
To show the significance of what is happening now you need to demonstrate it’s beyond what occurred in the past and that other factors other than AGW are not in play.”
That’s not how science works. It is up to you to disprove Dave’s hypothesis and evidence. In particular, show when something similar to now, particularly rates of change, has happened previously. And, it is up to you to show that factors other than AGW, and its temperature mediated feedbacks, have had a significant effect on climate change. Y’all have failed miserably on all counts, even though you’ve been trying for a quarter-century.
ganon
As usual you failed just like you continue to fail on Antarctica and GMSLR. When will it dawn on you that you bet on the wrong horse and it’s eating away on you subliminally. It’s up to the alarmists to prove what is happening has never happened before. He didn’t. You haven’t.
Little kid:
Nope, it is up to you to prove it has happened before. You have failed multiple times. “Could have happened” does not equal “did happen” – where’s the evidence? But then, you are a no-name nobody, with no evidence of any science background whatsoever. No surprise that you don’t understand how scientific evidence and disproof work.
PS, GMSLR was 5.6 mm last year, more than 3 times the 20th century average. It appears you are looking for another deflection/excuse (natural geothermal flux) from/for the rapid acceleration of SLR, because you can no longer deny it.
“GMSLR was 5.6 mm last year”
Now reconcile the warming evidence caused by extreme El Nino events between the late 19th century to now, with CO2.
ganon
My hypothesis is that it’s not outside the parameters of natural variability. Falsify my hypothesis. When are you going to learn about the scientific method?
JT. Don’t tell me what to do. If you wish to prove or disprove something, go for it.
Kid. Glad you understand how evidence and disproof work in the scientific method, now that I have explained it. Since you have no evidence that current warming is not unique, you hypothesis need not be disproved.
I don’t need to prove, or disprove.
A peer reviewed paper (posted on CE threads a half dozen times) has already quantified the warming caused by extreme El Nino events between the late 19th century to now, with CO2.
JT, “I don’t need to prove, or disprove”
Good thing you don’t have a need, because you can’t and don’t. S**t, you can’t even provide a citation for a reference to an unnamed paper. What’s the matter, is it a secret that is too embarrassing to reveal?
The link was directed to you at least a couple times. This says something about your own comprehension skills. Look it up.
JT, A lot of papers have been referenced to me. If you are too embarrassed to say which one, that’s OK.
Numerous tide gauges show a marked decline in SLR from the anomaly of 2024. As others have noted, Perhaps premature to hype a very short term cyclical trend.
https://tidesandcurrents.noaa.gov/sltrends/sltrends_station.shtml?id=8658120
the link will also link to all the other tide guages from the noaa data base
https://tidesandcurrents.noaa.gov/sltrends/sltrends_station.shtml?id=641-003
https://tidesandcurrents.noaa.gov/sltrends/sltrends_station.shtml?id=050-051
let me correct some grammar and clarify my last comment.
Much has been written about the 5.6mm SLR during 2024. As noted with the tide gauges from NOAA, quite a few tide gauges show a marked decline over the last three months of 2025 ( the decline seems to be the majority of tide gauges in the NOAA data base) . CU boulder and NOAA both show very short cyclical trends. The longer term trend is a much better indicator than using just using a one or two year trend. There is too much noise in using such a short period.
Over the last 30 years of the satellite era there have been several periods of rapid acceleration or deceleration that misconstrue the longer-term trend. See the attached record.
https://sealevel.colorado.edu/
Rob, Thanks for the reference. Look at the graph, look at the numbers, they do not support your statement. You have misconstrued the data. Sorry, you don’t understand it.
BAB-
Your pointless response ignores what the chart shows at several periods over the past 30 years.
Sure, Rob. You are the one doing the misconstruing, and I agree that you are misconstruing statistical noise and internal annual variability as being significant compared to the overall trend of over 100 mm SRL. Nice try – anyone is free to look at the graph and draw their own conclusions. MY conclusion is that you are trying to deflect from the obvious trend and its acceleration.
Regarding the lowering of water tables .. maybe it has something to do with pumping water from wells and not just global warming.
Exactly, George.
Not building dams where they’re needed causes issues, one would think?
Supporting acquifers requires inputs, otherwise it’s called poor land management.
Example: Tulare lake in CA once was the largest lake west of the Mississippi, it fed CA’s aquifers while supporting a large ecosystem. It dried up long ago. This land is now used for agriculture.
Instead of protecting the states acquifers CA instead tore down many of its dams, allowing the states excess water to drain directly into the Pacific. Sad.
B A Bushaw:
Are you aware that there was a warming period between 1727 and 1739, in the midst of the LIA, where temperatures increased by up to 1.0 Deg. C, according to the Central England Instrumental Instrumental Temperatures Data Set?
There were no volcanic eruptions during that period, so the atmosphere was free of any SO2 aerosol pollution, causing temperatures to rise.
Nothing due to AGW, but everything due to the absence of any SO2 aerosol pollution!
Yes. I am aware of regional climatic variations.
Except the LIA and MWP were global, not regional.
https://www.pnas.org/doi/abs/10.1073/pnas.1003719108
Dear old BAB(l) … as previously noted, your persistent low level sarcasm is simply meant to bolster your use of AI.
Implicating the role of factors other than AGW as the cause of long periods of global warming, even during Ice Age periods …
Dear little ianl,
The LIA cooling was global due to Milankovitch cycles, while the MWP and warm spots with in the LIA were regional and asynchronous. Neither are comparable to what is happening now. Your insults don’t make it so. And, to the best of my knowledge, the Peruvian Andes are regional. I didn’t even have to use AI to figure that out. Thanks for your thoughts, such as they are, anyway.
LIA caused by a 200-300 year milankovitch cycle ?
Interesting new theory? or just a diverson / deflection to obscure the sparseness of proxies used in the SH in reaching the high confidence level of paleo reconstructions ?
https://science.nasa.gov/science-research/earth-science/milankovitch-orbital-cycles-and-their-role-in-earths-climate/
Joe, No, I said “LIA cooling”. The LIA warming phase was (and is) dominated by AGW, which now dramatically exceeds any natural cooling, both in magnitude and rate of change.
https://eos.org/articles/the-little-ice-age-wasnt-global-but-current-climate-change-is
Joe, not an interesting new theory. Just one that makes sense for the observed MWP, LIA, and AGW combined temperature curves. And, one that you are apparently not aware of. It is the RWP, DCP, MWP, and LIA that fail as deflections from the magnitude and temperature change rate of AGW.
https://malevus.com/how-a-little-ice-age-shaped-europe-from-the-14th-to-the-19th-century/
https://eos.org/articles/the-little-ice-age-wasnt-global-but-current-climate-change-is
Bab – Here is your exact quote – Dont lie after getting caught
B A Bushaw | April 6, 2025 at 9:23 am |
Dear little ianl,
“The LIA cooling was global due to Milankovitch cycles, “
Joe, yep that is what I said “LIA cooling”. Unfortunate that I had to explain it too you; even more unfortunate, but not a surprise, that you still don’t understand it.
No Joe, this is the paraphrasing:
“LIA caused by a 200-300 year milankovitch cycle ?”
I never said that. You did – it is a false representation of what I said, and it is incorrect.
Joe, the only lie was your paraphrasing of what I said. Thanks for the exact quote, I stand by it.
Bushaw’s exact quote – its not paraphrasing –
“The LIA cooling was global due to Milankovitch cycles, “
“The LIA cooling was global due to Milankovitch cycles, while the MWP and warm spots with in the LIA were regional and asynchronous.”
That’s right, that’s what I said, and as I already said, I stand by it. Your paraphrase was: “LIA caused by a 200-300 year milankovitch cycle?” And the answer is no, the cooling phase of the LIA is part of a cooling phase of the combined Milankovitch cycles which has been going on since the Holocene climatic optimum, until it was overtaken by AGW (the warming phase of the LIA – it did get warm again, right?).
“It is the RWP, DCP, MWP, and LIA that fail as deflections from the magnitude and temperature change rate of AGW.”
–
Of course not. It is a natural warming trend, it is an orbitally forced phenomenon.
It happens in our time the temperature rise accelerates, because there are not much sea ice left in Northern Hemisphere to absorb the exsess heat as latent heat – simple.coincidence.
–
https://www.cristos-vournas.com
Christos,
Sorry, I’ll believe people that can publish in reputable journals over somebody who doesn’t publish, can’t do statistics, makes up fudge-factors, and indeed gets almost every physical causality backwards. Let us know when you get past peer review – I certainly won’t wait.
Thank you, B A.
“– I certainly won’t wait.”
–
Of course, it will take a while, some centuries, or millennials…
But it will come to that – companies will be subsidized to release as much CO2 as they can.
New start-ups will be on the way – the pumping off the oceans the CO2 gydrants will become the most profitable businesses, because it will be the must!
–
https://www.cristos-vournas.com
It is obvious now.
Half of the annually emitted CO2 “stays” in atmosphere, and half does not – it is absorbed by natural sinks.
When we humans stop emitting CO2, the CO2 content will gradually lessen.
–
The IPCC is very much right on that point.
–
https://www.cristos-vournas.com
The natural CO2 sinks never get saturated.
The natural tendency is towards the atmospheric CO2 content continue depletion.
When we humans stop emitting CO2, the CO2 content will gradually lessen.
It will gradually lessen until an inevitable ecological catastrophe occurs.
–
https://www.cristos-vournas.com
“The costliest error in the history of science.” Christopher Monckton.
Lord Christopher Monckton got it right: ‘The correct policy response to the non-problem of global warming is not to cap or tax carbon dioxide emissions. It is to have the courage to do nothing.’
It will never make sense to Leftists that being independent of foreign energy is better than being dependent on politicians. Spinning fears about global warming was necessary to float the Left’s global “cap and trade” scheme to control the worldwide production of energy. But talking about “cap and trade” is no longer helpful to the Left so they have gone back to their old environmental message of equating carbon dioxide to poison.
B A Bushaw:
“Yes, I am aware of regional variations”
This was NOT a regional variation, but a global event!
All events linked to the Eddy cycle were global. There’s 8000 yrs of that to prove it.
The last two cycles seem to be the only ones interesting. They were very mild. The previous in contrast were hellish. The proto-Mayans had a concept for that – Earth renewal. We live in the fifth renewal.
Give it up Burl. The CET is “representative of a roughly triangular area of the United Kingdom enclosed by Lancashire, London and Bristol” – REGIONAL.
https://hadleyserver.metoffice.gov.uk/hadcet/home.html
Most of us, except you, understand the effect of volcanoes – they are not evidence that anthropogenic SO2 decrease has created all the global warming since 1980. Nor are they an effective deflection from your false claims of “scientific proof”, which have been disproven.
B A Bushaw:
You are WRONG, as usual.
The CET data set is not just a regional data set, but a record of constant temperatures fluctuations, with each temperature decrease coincident with a known volcanic eruption somewhere around the world, and each temperature increase coincident with an absence of volcanic eruptions.
See: “The definitive cause of little ice age temperatures”
https://doi.org/10.30574/wjarr.2022.13.2.0170
Your claim that the LIA temperatures were due to Milanovich cycles is also nonsense, how can they explain the constant short-term temperature changes?
Burl,
Give it up Burl. The CET is “representative of a roughly triangular area of the United Kingdom enclosed by Lancashire, London and Bristol” – it is REGIONAL.
That is a direct quote from the people that maintain the CET.
I gave you the reference:
https://hadleyserver.metoffice.gov.uk/hadcet/home.html
Apparently you have lost the ability (if you ever had it) to read and comprehend – your personal opinions, fabrications, and cherry-picking do not interest me, other than perhaps to refute them.
Billions have been brainwashed into the mentality that every cool summer breeze is because of AGW. For those who believe that, including scientists who should know better, the empirical evidence is irrelevant. They have allowed themselves to be persuaded there was no global MWP and LIA because it reinforces the narrative that this warm period is unique and unprecedented. A superior public relations strategy.
“Human beings never think for themselves. For the most part, members of our species simply repeat what they are told – and become upset if they are exposed to any different view. The characteristic human trait is not awareness but conformity. We are stubborn, self-destructive conformists. Any other view of our species is just a self-congratulatory delusion.”
Michael Crichton
Kid quoting Crichton: “Human beings never think for themselves.”
That “never” is self-negation by hyperbolic absolute. Seems to fit the way you think very nicely.
He modified the statement with “for the most part”.
Did it hit a little too close to home since you seem to have swallowed the AGW schtick hook, line and sinker?
One of the hundreds of studies I read on Antarctica used the occurrence of westerlies as proof that relatively warm water of Amundsen Sea was a result of AGW. Really? As if westerlies were there only recently and that has never occurred before? This lack of scientific rigor is a result of brainwashing by the establishment.
Humans have a predilection to be cognitively lazy and allow others to think for them. That is why I am sure millions would agree with this statement, “When the top marginal income tax rate was 91%, there was massive income redistribution.” Sounds logical. Except they would be missing an important element. Almost no one paid the top marginal rate. Millionaires paid under 1% of total individual income taxes in many years in the 1950s and 1960s. In 1962 only 62 of the 340 millionaires paid a 91% rate. Myths are easy to propagate.
Could we count you in the group that believed the statement about massive income redistribution?
“He modified the statement with “for the most part”.
No he didn’t. It was in a different sentence and only expanded with an example of the false idea that “humans never think for themselves”.
Work on those comprehension skills.
B A Bushaw:
Your reference to the Hadset highlights your inability to think for yourself.
Although their temperature measurements are regional, they CANNOT exclude changes in global temperatures due to volcanic eruptions, etc., whenever they occur.
And with respect to my article on LIA temperatures, your refusal to read and comment upon it shows that you have NO competence as a scientist. Just a hack, with a closed mind.
Burl said “Your reference to the Hadset highlights your inability to think for yourself.”
No, it highlights your penchant for telling lies.
“Human beings never think for themselves. For the most part, members of our species…” is so true- which is why the Democrats get 47% of the vote to begin with in every election…
Even people who do not feel like they have the mindset of simply wanting to soak the paychecks of taxpayers to get what they want, still will vote in a New York minute for huge bond measures even if roundly opposed by everyone else who will actually pay them off, plus interest.
You apparently don’t know what “never” means.
… like Western academia that is all too willing to fleece the productive and sacrifice their honor, honesty and integrity on the altar of an anti-America socialist agenda.
I notice ganon is staying away from the purpose of the quote to begin with, AGW and LIA were global. The gullible public and the all in climate scientists are latching their wagons to the belief they weren’t global. Without it they succumb to the reality of the current warming. It’s most likely partially natural variability.
Kid,
Thanks for the reference, LOL. Here’s mine. The RWP, DCP, MCA, and LIA were all regional. The current warming is the only one that is/was globally coherent. The others are attributed to long-term internal stochastic CYCLES (which eventually average to near zero), particularly the AMO. There is little/no evidence that the current warming in part of an internal climatic cycle, no matter how much you, and others here, wish that was the case.
No evidence for globally coherent warm and cold periods over the preindustrial Common Era
https://www.nature.com/articles/s41586-019-1401-2
ganon
lol. More evidence how easily you get conned. Read another 100 studies that say there were MWP and LIA conditions all across the globe. Pacific Ocean, Antarctica, South America, South Africa, Australia. Not all regions are warming in a uniform fashion now. Heterogeneity was the rule then just as it is now.
Enron investors felt the same way when they realized they were conned. Read more and you will learn more. Don’t be such an easy mark for the hucksters.
Kid, uh-huh, guess it upsets you that I’m not ignoring the natural cycles, and instead I provide a citation for a highly regarded paper (cited over 400 times) that disproves your statement. You, OTH, suggest I read 100 more paper for which you give no citations. LMAO, you are a pathetic joke.
LIA and MWP in South Africa
https://www.researchgate.net/publication/230751443_The_Little_Ice_Age_and_medieval_warming_in_South_Africa
MWP Oceania
https://cdnsciencepub.com/doi/abs/10.1139/er-2019-0012
MWP Global
https://cdnsciencepub.com/doi/abs/10.1139/er-2019-0012
MWP LIA GLOBAL
https://www.int-res.com/articles/cr2003/23/c023p089.pdf
LIA GLOBAL
https://www.sciencedirect.com/science/article/abs/pii/S0277379116301196
South America
https://www.sciencedirect.com/science/article/abs/pii/S1040618218308322
Antarctica LIA
https://cp.copernicus.org/articles/8/1223/2012/cp-8-1223-2012.pdf
New Zealand
https://agupubs.onlinelibrary.wiley.com/doi/10.1029/2001GL014580
Kid, Thanks. Too bad they are mostly old and about asynchronous regional events. It is easier when you disprove yourself.
ganon
It does take common sense to understand when all the regions around the globe share like climate then in totality it means the globe is. But then I never have expected common sense from you. Nice deflection from reality. The literature says there were global LIA and MWP conditions.
Kid, apparently you don’t know the meaning of asynchronous, nor magnitude, nor rate. Thanks for your all your failed attempts at denial anyway, at least they are entertaining and easy to refute.
Some people never think for themselves, and choose to confirm that is what they (don’t) do. I appreciate the self-assessments, but I don’t believe it applies to all the people all the time.
Follow the money. The AGW Catastrophists will always be for the idea of ending catastrophic global warming caused by everyone but themselves, if all it means is curing a non-existent problem with taxes on the guilty—and, more taxes to fund government employee pay raises and pensions—and even if it means paying for government jobs that curtail the production of life-sustaining energy.
Most of the global warming on the globe occurs at French airports in the winter where the official thermometers are located and the asphalt runways are swept of snow and the jet engines provide a little added oomph compared to the surrounding snow-covered countryside.
All of this was known to high schoolers writing term papers about global warming back in the ’90s who understood then that the heat island effect had corrupted the official thermometers that their Leftist school teachers were pushing!
So… that’s about anyone 47 and older who doesn’t work for the DMV – and their kids – who voted recently to put an end to the AGW alarmism charade.
‘There was a time when I worked in a clinic and, uh, one day a young woman came in, she was in her early twenties for a routine checkup and, I said what‘s going on with you and she said I‘ve just become blind. And, I said, oh my gosh, really, when did it happen, she said, well just, uh, coming into the clinic, walking up the steps of the clinic I became blind. And I said, oh, and I‘m—by now I‘m looking through the chart and I said, well, has this happened before, she said yes, it‘s happened before. I‘ve become blind in the past, and, what she had of course was hysterical blindness. And the characteristic of that, is that, the severity of the symptom is not matched by the emotional response that‘s, that‘s being presented. Most people would be screaming about that but she was very calm, oh yes, I‘m blind again. And I‘m reminded of that whenever I hear, that we‘re facing, whether we wanna call it a crisis or not, a significant global event, of, of, of importance where we‘re gonna have species lost and so on and so forth— that we can really address this by changing our light bulbs. Or that we can really make an impact by unplugging our appliances when we‘re not using them. It‘s very much out of whack. And so if… we’re only gonna do symbolic actions, I would like to suggest a few symbolic actions that right—might really mean something. One of them, which is very simple, 99% of the American population doesn‘t care, is ban private jets. Nobody needs to fly in them, ban them now. And, and in addition, [APPLAUSE] let‘s have the NRDC, the, the Sierra Club and Greenpeace make it a rule that all of their, all of their members, cannot fly on private jets, they must get their houses off the grid, they must live in the way that they‘re telling everyone else to live. And if they won‘t do that, why should we. And why should we take them seriously. [APPLAUSE]’ ~Michael Chricton
Thank you, B A.
“Christos,
Sorry, I’ll believe people that can publish in reputable journals over somebody who doesn’t publish, can’t do statistics, makes up fudge-factors, and indeed gets almost every physical causality backwards. Let us know when you get past peer review – I certainly won’t wait.”
–
The global warming is happening, the global warming is real – there is no doubt about that.
The global warming is not anthropogenic, the global warming is caused by the natural orbital forcing.
–
See what you do, B A? You put publishing abilities and DPh over the common sense and over the logic.
Yes, I do not publish in reputable journals, and yes, I can’t do statistics – but everything else – I use my other abilities, which you do not have.
You do not understand – an equation valid for all airless planets and moons in solar system – an equation which is valid for our Earth too – that equation is preciselly calculates Earth’s average surface temperature – and it is a solid proofe of concept that there is not any significant atmospheric greenhouse warming effect on Earth’s surface – there is not anything to talk about.
–
Link: https://www.cristos-vournas.com
“See what you do, B A? You put publishing abilities and DPh over the common sense and over the logic.”
No, I put common sense and logic first, but you have already amply demonstrated that you don’t have any. That leaves you unable to publish or do statistics (your physics pretty much sucks, too). You also have a serious psychological problem thinking that your ridiculous ideas (and lies) are correct, over the work of 100s of brilliant scientists over hundreds of years. Kinda like Burl – neither of you are scientists, nor brilliant. And, you both cheat to get the results you want.
But you are right, there is really nothing more to talk about. GHGs definitively cause the majority of current global warming, and you are a narcissist that thinks you have all the right answers, when you have none.
Thank you, B A.
“GHGs definitively cause the majority of current global warming, ”
–
Interesting – shall we discuss why it is +9C at 3 pm in Athens Greece today? It is April 7 for God’s sake! It is the Southern Europe!
Northern Greece, which is also very Southern, experiences a severe snow right now.
–
https://www.cristos-vournas.com
B A Bushaw.
Among many other faults, you are also a LIAR!
For my part, I have NEVER cheated to “get the results I want”
All of my comments are based upon the empirical observation that whenever SO2 aerosol levels in the atmosphere, of either volcanic or industrial origin, increase, temperatures decrease, and if their levels decrease, temperatures increase.
This is supported by the NASA article “Atmospheric Aerosols: What are they, and why are they so important?
Hundreds of examples of such occurrences are available, from the other warming periods, the MWP, the LIA, the 1930’s warming, and all of the warming since 1980.
AGW exists ONLY to the extent that human activities can change the amount of SO2 aerosol pollution of our atmosphere.
And all of my articles that I have referenced, which you ignore, were peer reviewed.
Of course you are right, burlhenry.
B A thinks there are not any other forcings except the pet CO2 emissions narrative.
–
Burl,
Yes, you cheated. It is called intentional cherry-picked truncation of an existing data set to make it fit your disproven hypothesis. Embarrassing, eh?
Christos, We have nothing to talk about.
Φ- the Solar Irradiation Accepting Factor – SIAF.
–
Link: https://www.cristos-vournas.com
B A Bushaw:
Again, you lie.
I have never truncated a data set to make it fit my “hypothesis”, as you have.
Burl,
Again you lie. Your selected data range is only after 1980, the CEDS (and temperature) data is available to back before 1900. The data before 1980 does not fit your hypothesis (I showed it both graphically and with statistical multivariate least-squares analysis), so you left it out. That is cheating, and now that you have been caught, you lie about it.
To be clear, I am referring specifically to your paper entitled “Scientific proof that CO2 does NOT cause global warming”. Note that the title is also a lie, but could be attributed to ignorance, as previously discussed.
https://mail.wjarr.com/sites/default/files/WJARR-2024-0884.pdf
Along those same lines, would you like to explain all those “manuscripts” that you submitted to Researchgate claiming they had been accepted, yet they were mysteriously never published? Of course, then you discovered WJARR – a vanity blog site in India, where you can “buy” a “peer” review (3-day turn around – wow) and DOI number for a modest fee.
My advice: just shut up. The “I know you are, but what am I” defense doesn’t work well past grade school.
Germany scored an own goal with this “cheap” “green” energy. There is a lesson to be learned here.
Electricity prices in Germany will remain elevated as their link to natural gas is poised to strengthen over the coming years, analysts say.
Despite a strong start to the solar season in Europe, and record amounts of cheap new renewable capacity in Germany since the energy crisis, it’s natural gas that will increasingly decide how much households and factories in Europe’s biggest economy pay for electricity.
The reason is the way the European power market is designed, where it’s the last amount of electricity needed to meet demand that sets the price. After Germany’s exit from nuclear and the rapid closing of coal plants in the past five years, stations burning natural gas will increasingly play that role, according to analysts.
What have learned from Western Academia’s AGW Global Warming conjecture is the same valuable knowledge did learned from the Piltdown Man Hoax concerning man’s ascent from the jungle. Wasn’t the lesson learned wholly outside the claims that were made by the scientists that perpetrated that fraud? What was learned about is scientists can be fraudulent and deceitful and also fooled by charlatans and their own preconceived notions.
B A Bushaw::
I have repeatedly stated that I selected the period from 1980 and on for analysis, because that is the when our modern warming began, and the warming is clearly due to decreasing levels of SO2 aerosol pollution of the troposphere due to American and European “Clean Air” legislation, and Net-Zero activities, rather than to rising CO2 levels.
This is NOT cherry-picking, other eras, such as the 1930’s can also be separately analyzed for the cause of the warming that occurred then. The “dataset” that you speak of has many such discrete examples.
And there is nothing wrong with my WJARR publications, they are not “vanity”, publications, but just a less-expensive way of recording the results of my analyses
With regard to Research Gate, they usually found one of my articles, and asked whether it was written by me.
In all, Your stupidity constantly amazes me!.
Was the record flooding along the Kentucky River from all the heavy rain over the last week, leaving some roads under 48 ft of water, caused by AGW (i.e., human cause global warming)?
Apparently not. It was historically high but not record-breaking by about half a foot of a flood there in 1937. California has many examples like that… e.g., the great Sacramento flood, the San Diego River…
1896 (The Great Flood ) and 1916 (The Hatfield Flood) respectively…
The deadliest natural disaster in US history is said to be the Galveston Hurricane of 1900.
In spite of negative electricity prices on sunny days, Germans still pay high electric rates because deficits of electricity have to be supplemented by natural gas. Tried to post with link, but no dice here. NFO is from Bloomberg.
What changes have occurred in solar activity since 2008.
https://i.ibb.co/Vpg7KKbk/number-of-days-with-a-ge.png
We should admit – an equation valid for all airless planets and moons in solar system – an equation which is valid for our Earth too – that equation preciselly calculates Earth’s average surface temperature – and it is a solid proof of concept that there is not any significant atmospheric greenhouse warming effect on Earth’s surface.
–
https://www.cristos-vournas.com
We point out that this is an observational study, but we have determined cause and effect. We emphasized that there are plausible physical explanations for the findings.
Also, the weak distribution of CRITERIA on the Graph along with the high actual temperatures differences between planets and moons make the comparisons realistic.
Therefore, the comparison CRITERIA reflect the actual planets temperature behavior as a strongly dependent on the Rotational Warming Phenomenon.
–
https://www.cristos-vournas.com
The strength of the solar polar magnetic field on 2025.02.14.
https://i.ibb.co/spRGgTkk/Polar.gif
Heat Pump Fail …
From the Article:Gas Boiler Fittings Outnumbered Heat Pumps By 15 To One in UK Last Year – Report
https://news.slashdot.org/story/25/04/10/145225/gas-boiler-fittings-outnumbered-heat-pumps-by-15-to-one-in-uk-last-year—report
The faster rotating planet is warmer, because it absorbs more heat at solar lit HEMISPHERE, than the slower rotating one.
–
Link:: https://www.cristos-vournas.com