by Nic Lewis
Obviously doubtful claims about new research regarding ocean content reveal how unquestioning Nature, climate scientists and the MSM are.
On November 1st there was extensive coverage in the mainstream media[i] and online[ii] of a paper just published in the prestigious journal Nature. The article,[iii] by Laure Resplandy of Princeton University, Ralph Keeling of the Scripps Institute of Oceanography and eight other authors, used a novel method to estimate heat uptake by the ocean over the period 1991–2016 and came up with an atypically high value.[iv] The press release [v] accompanying the Resplandy et al. paper was entitled “Earth’s oceans have absorbed 60 percent more heat per year than previously thought”,[vi] and said that this suggested that Earth is more sensitive to fossil-fuel emissions than previously thought.
I was asked for my thoughts on the Resplandy paper as soon as it obtained media coverage. Most commentators appear to have been content to rely on what was said in the press release. However, being a scientist, I thought it appropriate to read the paper itself, and if possible look at its data, before forming a view.
Trend estimates
The method used by Resplandy et al. was novel, and certainly worthy of publication. The authors start with observed changes in ‘atmospheric potential oxygen’ (ΔAPOOBS).[vii] In their model, one component of this change (ΔAPOClimate) is due to warming of the oceans, and they derived an estimate of its value by calculating values for the other components.[viii] A simple conversion factor then allows them to convert the trend in ΔAPOClimate into an estimate of ocean heat uptake (the trend in ocean heat content).
On page 1 they say:
From equation (1), we thereby find that ΔAPOClimate = 23.20 ± 12.20 per meg, corresponding to a least squares linear trend of +1.16 ± 0.15 per meg per year[ix]
A quick bit of mental arithmetic indicated that a change of 23.2 between 1991 and 2016 represented an annual rate of approximately 0.9, well below their 1.16 value. As that seemed surprising, I extracted the annual ΔAPO best-estimate values and uncertainties from the paper’s Extended Data Table 4[x] and computed the 1991–2016 least squares linear fit trend in the ΔAPOClimate values. The trend was 0.88, not 1.16, per meg per year, implying an ocean heat uptake estimate of 10.1 ZJ per year,[xi] well below the estimate in the paper of 13.3 ZJ per year.[xii]
Resplandy et al. derive ΔAPOClimate from estimates of ΔAPOOBS and of its other components, ΔAPOFF, ΔAPOCant, and ΔAPOAtmD, using – rearranging their equation (1):
ΔAPOClimate = ΔAPOOBS − ΔAPOFF − ΔAPOCant − ΔAPOAtmD
I derived the same best estimate trend when I allowed for uncertainty in each of the components of ΔAPOOBS, in the way that Resplandy et al.’s Methods description appears to indicate,[xiii] so my simple initial method of trend estimation does not explain the discrepancy.
Figure 1 shows how my 0.88 per meg per year linear fit trend (blue line) and Resplandy et al.’s 1.16 per meg per year trend (red line) compare with the underlying ΔAPOClimate data values.
Figure 1. ΔAPOClimate data values (black), the least squares linear fit (blue line) to them, and the linear trend per Resplandy et al. (red line)
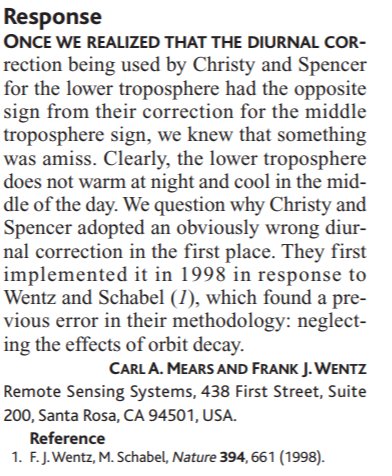
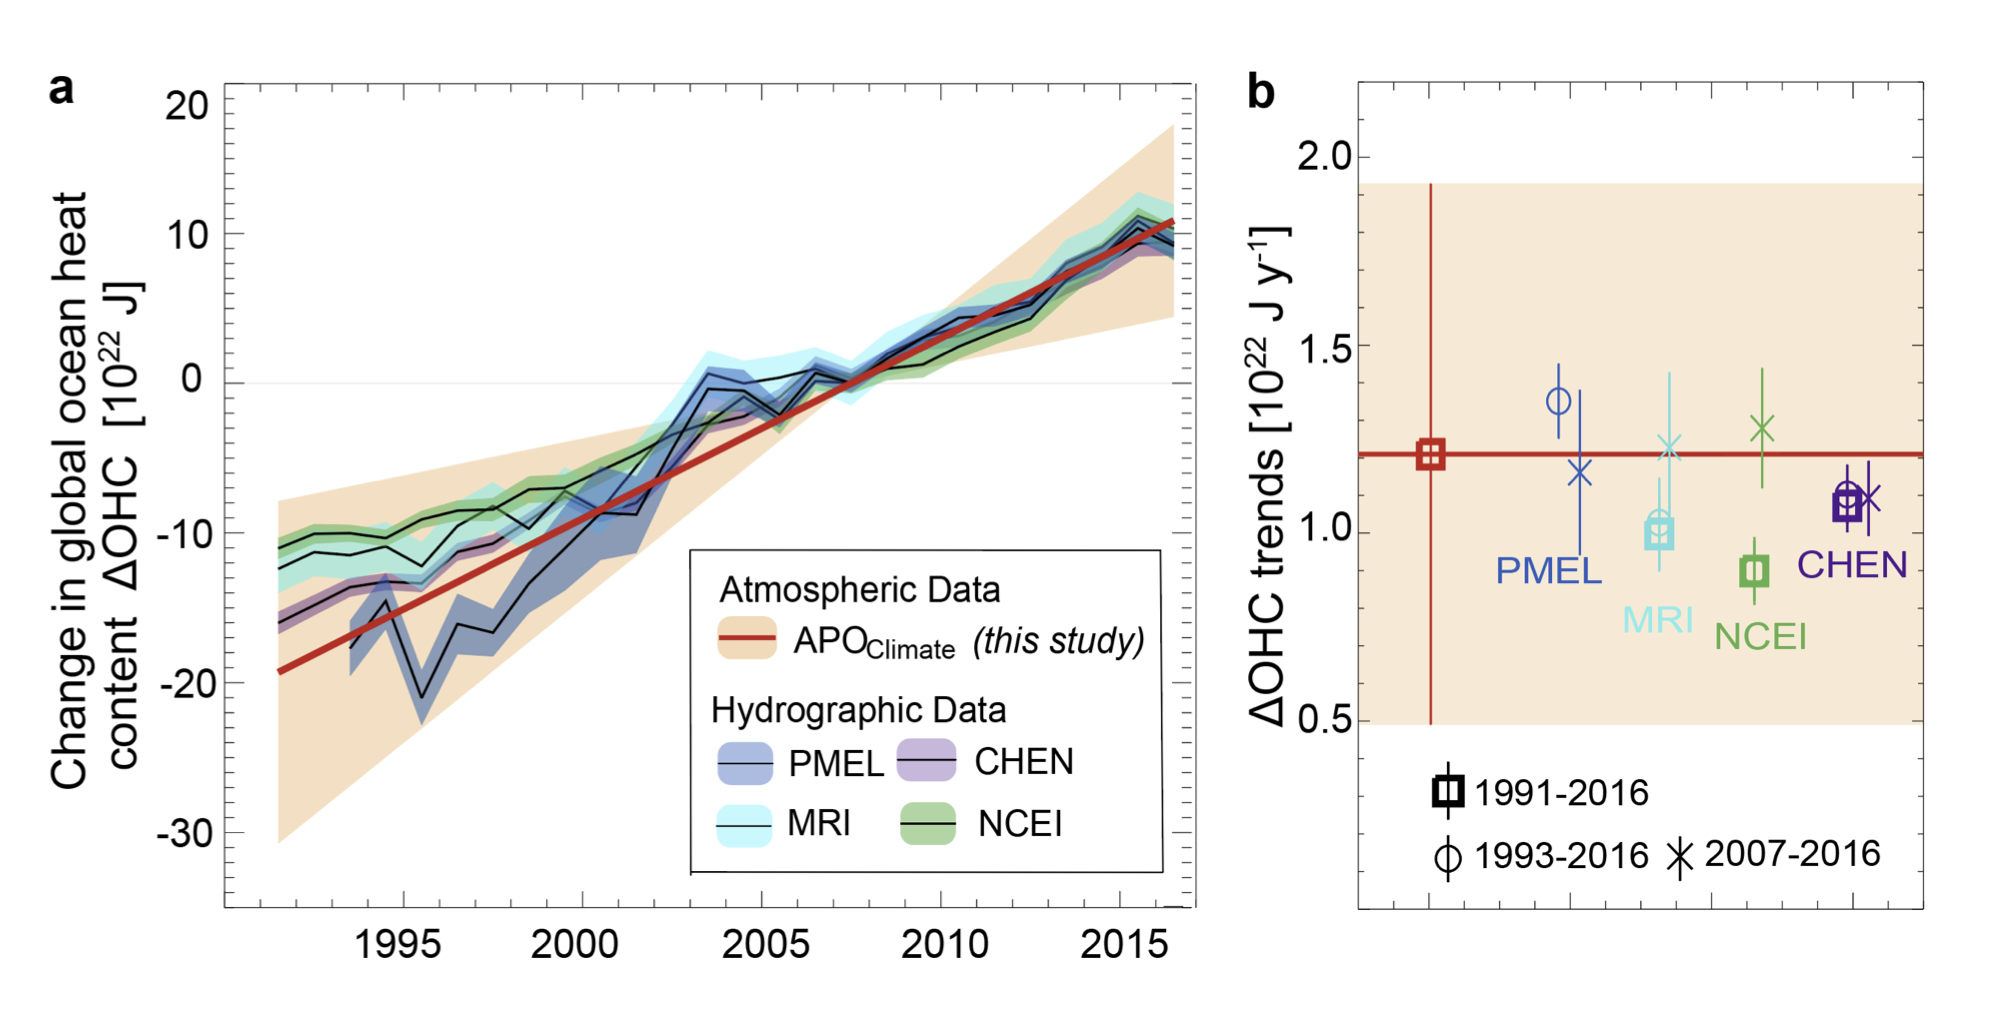
Assuming I am right that Resplandy et al. have miscalculated the trend in ΔAPOClimate, and hence the trend in ocean heat content (OHC), implied by their data, the corrected OHC trend estimate for 1991–2016 (Figure 2: lower horizontal red line) is about average compared with the other estimates they showed, and below the average for 1993–2016.
Figure 2. An adaptation of Figure 1b from Resplandy et al. with the
corrected estimate for the APOClimate derived ΔOHC trend added
(lower horizontal red line; no error bar is shown)
I wanted to make sure that I had not overlooked something in my calculations, so later on November 1st I emailed Laure Resplandy querying the ΔAPOClimate trend figure in her paper and asking for her to look into the difference in our trend estimates as a matter of urgency, explaining that in view of the media coverage of the paper I was contemplating web-publishing a comment on it within a matter of days. To date I have had no substantive response from her, despite subsequently sending a further email containing the key analysis sections from a draft of this article.
How might Laure Resplandy [xiv] have miscalculated the ΔAPOClimate trend as 1.16 per meg per year? One possibility is that the computer code for the trend computation somehow only deducted ΔAPOFF and ΔAPOCant from ΔAPOOBS when computing the 1991–2016 trend, thereby in fact obtaining the trend for {ΔAPOClimate + ΔAPOAtmD}, which is 1.16 per meg per year.[xv]
Uncertainty analysis
I now turn to the uncertainty analysis in the paper.[xvi] Strangely, the Resplandy et al. paper has two different values for the uncertainty in the results. On page 1 they give the ΔAPOClimate trend (in per meg per year) as 1.16 ± 0.15. But on page 2 they say it is 1.16 ± 0.18. In the Methods section they go back to 1.16 ± 0.15. Probably the ± 0.18 figure is a typographical error.[xvii]
More importantly, it seems to me that uncertainty in the ΔAPOClimate trend, and hence in the ocean heat uptake estimate, is greatly underestimated in Resplandy et al., because of two aspects of the way that they have treated trend and scale uncertainties affecting ΔAPOOBS. First, they appear to have treated corrosion, leakage and desorption errors in ΔAPOOBS as fixed errors that have the same influence each year.[xviii] But these are annual trend errors, so their influence is proportional to the number of years elapsed since the 1991 base year.[xix] Secondly, they appear to have treated both these trend errors and the scale systematic error in ΔAPOOBS as uncorrelated between years.[xx] However, each year’s error from each of these sources is simply a multiple of a single random trend or scale systematic error, and is therefore perfectly correlated with the same type of error in all other years.
On a corrected basis, I calculate the ΔAPOClimate trend uncertainty as ± 0.56 per meg yr−1, more than three times as large as the ± 0.15 or ± 0.18 per meg yr−1 values in the paper.[xxi] This means that, while Resplandy et al.’s novel method of estimating ocean heat uptake is useful in providing an independent check on the reasonableness of estimates derived from in situ temperature measurements, the estimates their method provides are much more uncertain than in situ measurement-based estimates, and are consistent with all of them.
Effect on climate sensitivity and carbon budgets
Resplandy et al. point out that a larger increase in ocean heat content (a higher ocean heat uptake) would affect estimated equilibrium climate sensitivity. That is true where such sensitivity estimates are derived from observationally-based analysis of the Earth’s energy budget. However, after correction, the Resplandy et al. results do not suggest a larger increase in ocean heat content than previously thought. In fact, using the corrected Resplandy et al. estimate of the change in ocean heat content over the relevant period (2007–2016) in the recent Lewis and Curry (2018)[xxii] energy budget study would slightly lower its main estimate of equilibrium climate sensitivity. Moreover, a larger estimated increase in ocean heat content would principally affect the upper uncertainty bound of the equilibrium climate sensitivity estimate. Contrary to what Resplandy et al. claim, the lower bound would be little affected and would remain well below 1.5°C, [xxiii] providing no support for increasing the lower bound of the IPCC’s range for equilibrium climate sensitivity to 2.0°C.
Resplandy et al. also make the bizarre claim that increasing the lower bound of the IPCC’s equilibrium climate sensitivity range from 1.5°C to 2.0°C would have the effect of “reducing maximum allowable cumulative CO2 emissions by 25% to stay within the 2°C global warming target”. In fact, that cumulative carbon emissions budget is very largely determined by a combination of carbon-cycle characteristics and the transient climate response.[xxiv] Observational estimates of the transient climate response are unaffected by the level of ocean heat uptake. Therefore, increasing the lower bound of the equilibrium climate sensitivity range would have little or no impact on the cumulative carbon emissions budget to stay within 2°C global warming.
Conclusions
The findings of the Resplandy et al paper were peer reviewed and published in the world’s premier scientific journal and were given wide coverage in the English-speaking media. Despite this, a quick review of the first page of the paper was sufficient to raise doubts as to the accuracy of its results. Just a few hours of analysis and calculations, based only on published information, was sufficient to uncover apparently serious (but surely inadvertent) errors in the underlying calculations.
Moreover, even if the paper’s results had been correct, they would not have justified its findings regarding an increase to 2.0°C in the lower bound of the equilibrium climate sensitivity range and a 25% reduction in the carbon budget for 2°C global warming.
Because of the wide dissemination of the paper’s results, it is extremely important that these errors are acknowledged by the authors without delay and then corrected.
Of course, it is also very important that the media outlets that unquestioningly trumpeted the paper’s findings now correct the record too.
But perhaps that is too much to hope for.
Nicholas Lewis 6 November 2018
[i] Examples are:
https://www.bbc.co.uk/news/science-environment-46046067
‘https://www.nytimes.com/2018/10/31/climate/ocean-temperatures-hotter.html
https://www.washingtonpost.com/energy-environment/2018/10/31/startling-new-research-finds-large-buildup-heat-oceans-suggesting-faster-rate-global-warming/
https://www.scientificamerican.com/article/the-oceans-are-heating-up-faster-than-expected/
https://edition.cnn.com/2018/11/01/australia/ocean-warming-report-intl/index.html
http://www.latimes.com/science/sciencenow/la-sci-sn-oceans-study-climate-change-20181031-story.html
https://www.usatoday.com/story/news/nation-now/2018/11/01/oceans-more-heat-study-global-warming-climate-change-nature/1843074002/
https://www.independent.co.uk/environment/climate-change-global-warming-ocean-temperature-heat-fossil-fuels-science-research-a8612796.html
[ii] Examples are:
http://www.realclimate.org/index.php/archives/2018/11/unforced-variations-nov-2018/
https://wattsupwiththat.com/2018/11/02/friday-funny-at-long-last-kevin-trenberths-missing-heat-may-have-been-found-repeat-may-have-been/
https://bskiesresearch.wordpress.com/2018/11/01/that-new-ocean-heat-content-estimate/
https://andthentheresphysics.wordpress.com/2018/11/03/new-ocean-heat-content-analysis/
‘https://twitter.com/Knutti_ETH/status/1057960390502608901
[iii] L. Resplandy, R. F. Keeling, Y. Eddebbar, M. K. Brooks, R. Wang, L. Bopp, M. C. Long, J. P. Dunne, W. Koeve & A. Oschlies, 2018: Quantification of ocean heat uptake from changes in atmospheric O2 and CO2 composition. Nature, 563, 105-108. https://doi.org/10.1038/s41586-018-0651-8 (“Resplandy et al.”)
[iv] A value of 13.3 zetta Joules (ZJ) per year, or 0.83 Watts per square metre of the Earth’s surface. ZJ is the symbol for zetta Joules; 1 ZJ = 1021 J. 1 ZJ per year = 0.0621 Watts per square metre (W/m2 or Wm–2) of the Earth’s surface.
[v] http://web.archive.org/web/20181103021900/https://www.princeton.edu/news/2018/11/01/earths-oceans-have-absorbed-60-percent-more-heat-year-previously-thought
[vi] However that is in comparison with an IPCC estimate for 1993–2010; estimates for 1991–2016 are higher.
[vii] ΔAPO is the change in ‘atmospheric potential oxygen’, the overall level of which has been observationally measured since 1991 (ΔAPOOBS). It is the sum of the atmospheric concentrations of O2 and of CO2 weighted respectively 1⤬ and 1.1⤬.
[viii] The authors break the observed change in ΔAPOOBS into four components, ΔAPOFF, ΔAPOCant, ΔAPOAtmD and ΔAPOClimate, deriving the last component (which is related to ocean warming) by deducting estimates of the other three components from ΔAPOOBS. ΔAPOFF is the decrease in APO caused by industrial processes (fossil-fuel burning and cement production). ΔAPOCant accounts for the oceanic uptake of excess anthropogenic atmospheric CO2. ΔAPOAtmD accounts for air–sea exchanges driven by ocean fertilization from anthropogenic aerosol deposition.
[ix] 1 per meg literally means 1 part per million (1 ppm), however ‘per meg’ and ‘ppm’ are defined differently in relation to atmospheric concentrations and are not identical units.
[x] The same data is available in Excel format from a link on Nature’s website, as “Source Data Fig. 2“.
[xi] Dividing by their conversion factor of 0.087 ± 0.003 per meg per ZJ. ZJ is the symbol for zetta Joules; 1 ZJ = 1021 Joules.
[xii] I used ordinary least squares (OLS) regression with an intercept. That is the standard form of least squares regression for estimating a trend. Resplandy et al. show all APO variables as changes from a baseline of zero in 1991, but that is an arbitrary choice and would not justify forcing the regression fit to be zero in 1991 (by not using an intercept term). Doing so would not in any event raise the ΔAPOClimate estimated trend to the level given by Resplandy et al.
[xiii] I took a large number of sets of samples for each of the years 1991 to 2016 from the applicable error distributions of ΔAPOOBS, ΔAPOFF, ΔAPOCant, and ΔAPOAtmD given in Extended Data Table 4, and calculated all the corresponding sample values of ΔAPOClimate using equation (1). I then computed the ordinary least squares linear trend for each set of 1991–2016 sampled values of ΔAPOClimate, and calculated the mean and standard deviation of the trends.
[xiv] Laure Resplandy was responsible for directing the analysis of the datasets and models.
[xv] This fact was spotted by Frank Bosse, with whom I discussed the apparent error in the Resplandy et al. ΔAPOClimate trend.
[xvi] All uncertainty values in the paper are ± 1 sigma (1 standard deviation). Errors are presumably assumed to be Normally distributed, as no other distributions are specified.
[xvii] The statement in their Methods that “ΔCant′ cannot be derived from observations and was estimated at 0.05 Pg C yr−1, equivalent to a trend of +0.2 per meg−1, using model simulations” is presumably also a typographical error. The correct value appears to be +0.12 per meg yr−1, as stated elsewhere in Methods and in Extended Data Table 3.
[xviii] On that basis , I can replicate the Extended Data Table 4 ΔAPOOBS uncertainty time series values within ±0.1. Note that all the values in that table, although given to two decimal places, appear to be rounded to one decimal place.
[xix] The overall uncertainties given in Table 3 in Resplandy et al.’s source paper for its errors in ΔAPOOBS support my analysis.
[xx] When using the Resplandy et al. Extended Data Table 4 ΔAPOClimate total uncertainty time series and assuming that each year’s errors are independent, despite the trend and scale systematic errors being their largest component, the estimated ΔAPOClimate uncertainty reduces to between ± 0.20 and ± 0.21 per meg yr−1. That is still slightly higher than the ± 0.15 and ± 0.18 per meg yr−1 values given in the paper. The reason for the small remaining difference is unclear.
[xxi] It seems likely that the same non-independence over time issue largely or wholly applies to errors in ΔAPOCant, ΔAPOAtmD and probably ΔAPOFF. If the errors in ΔAPOCant and ΔAPOAtmD (but not in ΔAPOFF) were also treated as perfectly correlated between years, the ΔAPOClimate trend uncertainty would be ± 0.60 per meg yr−1.
[xxii] Lewis, N., and Curry, J., 2018: The impact of recent forcing and ocean heat uptake data on estimates of climate sensitivity. J. Climate, 31(15), 6051-6071.
[xxiii] Even if the 2007–2016 ocean heat uptake estimate used in Lewis and Curry (2018) were increased by 3 ZJ yr−1 to match Resplandy et al.’s (incorrect) estimate for 1991–2016, the 1.05°C 5% lower bound of its HadCRUT4v5-based estimate of effective/equilibrium climate sensitivity would only increase to 1.15°C. Moreover, Resplandy et al.’s ΔAPOClimate data imply have a lower ocean heat uptake estimate for 2007–2016 than they do for 1991–2016.
[xxiv] See the IPCC’s 2018 Special Report on Global Warming of 1.5°C
Good stuff, Nic.
In Lewis’ error analysis is correct, then I congratulate him on catching that error, because I didn’t. He can feel free to submit his post as a comment or a response, so that it can undergo peer review.
However, I don’t think this reflects badly on Nature at all, or shows some conspiring on the part of media and climate scientists. After all, I remember a previous time a high-tier scientific journal published an incorrect result that was trumpeted by the media (and then years later by much of the Internet). It had something to do with members of UAH under-estimating tropospheric warming due to their poor homogenization:
https://pbs.twimg.com/media/DnqoAGNW4AA-o-R.jpg
[from: “Correcting Temperature Data Sets”]
“Although concerns have been expressed about the reliability of surface temperature data sets, findings of pronounced surface warming over the past 60 years have been independently reproduced by multiple groups. In contrast, an initial finding that the lower troposphere cooled since 1979 could not be reproduced. Attempts to confirm this apparent cooling trend led to the discovery of errors in the initial analyses of satellite-based tropospheric temperature measurements.”
http://science.sciencemag.org/content/334/6060/1232
“However, I don’t think this reflects badly on Nature at all…..”
Others may disagree with you.
“… a quick review of the first page of the paper was sufficient to raise doubts as to the accuracy of its results.”
Proposing peer review in this situation is a real chutzpah.
Re: “Proposing peer review in this situation is a real chutzpah.”
Not really. Last I checked, you rely on the fruits of peer-reviewed research everyday. Unless you’ve never taken medical treatment, eaten processed food, drank treated water, worn manufactured clothing, etc.
Is peer review perfect? No. Is peer review at top-tier journals good enough to be relied upon? Yes, as shown by your daily life and the scientific advances peer-reviewed research has brought us for centuries. Complaining that peer review is unacceptable because it sometimes lets mistakes through, is like complaining that medicine is unacceptable because doctors were not perfect in the past, or that flying in planes in unacceptable because pilots have crashed planes in the past.
I also love the selective outrage and special pleading of some faux “skeptics”. They complain that peer review is horrid when it lets through some flawed papers that present evidence in support of the mainstream evidence-based consensus. But those same “skeptics” will trumpet peer review that lets through Lewis and Curry’s papers. Or they trumpet peer review that let through the (later debunked) work of Spencer+Christy at UAH, work that challenged the mainstream evidence-based consensus. Or peer review that let through Lindzen’s paper that contained (in his own words) stupid mistakes:
“Dr. Lindzen acknowledged that the 2009 paper contained “some stupid mistakes” in his handling of the satellite data. “It was just embarrassing,” he said in an interview.”
http://www.nytimes.com/2012/05/01/science/earth/clouds-effect-on-climate-change-is-last-bastion-for-dissenters.html
Peer review is not some plot to feed the media “alarmist” (whatever that is) material. Peer review is done better at some journals that at others. It is an imperfect, relatively reliable process that served us well for centuries, and there’s always room for improvement in it. Respect it.
This is why I ask folks to post their analysis code
Nic Lewis does.
“Peer review is not some plot to feed the media “alarmist” (whatever that is) material.”
.
Absolutely right. Feeding the media with sensational, alarming material is done via blaring press releases at the same time as the paper’s publication.
Whataboutism show absolutely nothing except that Atomsk needs to change the subject.
It’s OK to make mistakes and then admit and/or fix them. This is what Christy did. This is what Lindzen did. This is what Michael Mann refused to do with his hockey stick. This is what Sherwood refused to do when he first used a deceptive color graph to “prove” the existent of a tropical hot spot, and when he later wanted us to believe that we should throw out balloon and satellite data and instead depend on his derivation of tropospheric temperatures through wind shear and an assumption of natural variability.
Hughes blamed 2016 GBR coral bleaching on global warming and Jim Steele, and then later Wolanski in a published paper, showed that bleaching was due to lowered sea levels from El Nino and natural current mechanics. Did Hughes admit any error?
Lister recently published a paper purportedly showing that insects in the Luquillo Forest of Puerto Rico died because of global warming– i.e., an (alleged) temperature rise from 26C to 28C!!! Lister ignored the widespread use of insecticides in Puerto Rico as a potential cause. It’s absurd to imagine that insects are dying because of 82F but all we’ll hear about is how that’s the future we’re facing.
Consensus climate science has all the fingerprints of advocacy science and maybe even a touch of downright dishonesty.
Peer review would work much better if Nic Lewis was considered a peer.
Not accounting properly for orbital decay is “poor homogenization?”
Atomsk: The important question is whether the peer-reviewers of this paper would have given similar scrutiny to a paper that concluded the ocean heat content was rising slower than expected rather than faster. As far as I can tell, faster ocean heat uptake will reduce the discrepancy between observational-based estimates of ECS (EBMs) and estimates from climate models. So the natural tendency of all supporters of the consensus constructed around AOGCMs would be more carefully scrutinize a paper which enlarged this discrepancy than shrank it.
The rivalry between UAH and RSS has ensured that the work of both sides has always be carefully scrutinized – and it has probably resulted in both parties scrutinizing their work more carefully than they might otherwise have. One the other hand, the discrepancy between observational-based and model-based ECS remained unrecognized for more than a decade before Nic Lewis’s contributions. Unfortunately for climate science, there are relatively few skeptics, and even fewer willing to deliberately “audit” the details.
Then there is the unwillingness (acknowledged by some) to publicly discuss doubts or problems that might be picked up by the conservative press and skeptical blogs.
IMO, the fact that auditing by Nic Lewis and Steve McIntyre has turned up so many problems (real problems as best this biased individual can tell) suggests that you and the whole climate science community should be deeply concerned about confirmation bias during peer review. However, that is another subject that can’t be publicly discussed without it reaching the conservative press and skeptical blogs. In many areas of research, there is a crisis in confidence in published work. Ionnaides, for one example. Pharmaceutical companies find their laboratories are unable to reproduce about 75% of key studies claiming to have validated a particular molecular targets (enzymes, receptors, etc) for new drug discovery.
Very well said.
Yes, Franktoo, well said. I would add however that some of this widespread problem in climate science (as in all fields) can simply be chalked up to a dysfunctional culture of peer review. There are huge numbers of papers to be reviewed and top researchers are very busy generating their own papers and results. Virtually all peer reviewers don’t have time to do even a cursory check of the work other than reading it for obvious problems and conflicts with already published papers. If peer reviewers were paid and expected to devote at least a couple of weeks to each review, the quality would be higher. The real problem here is that 90% of what is published is not worthy of the paper its printed on.
That’s why citizen scientists are exceptionally valuable.
Re: “Atomsk: The important question is whether the peer-reviewers of this paper would have given similar scrutiny to a paper that concluded the ocean heat content was rising slower than expected rather than faster.”
This case does nothing to support the line of reasoning you’re going towards. For example, I know of plenty of research that made it through peer review and which reduced estimates of climate trends. Take the following paper on the topic of altitude-dependent warming, a topic I’m interested in:
“Artificial amplification of warming trends across the mountains of the western United States”
And, of course, Curry herself co-authored research that later needed to be corrected:
“Correction for Liu et al., Impact of declining Arctic sea ice on winter snowfall”
http://www.pnas.org/content/109/17/6781
So no, you can drop the insinuations of slanted bias in favor of showing more warming in the context ocean heat content.
Re: “One the other hand, the discrepancy between observational-based and model-based ECS remained unrecognized for more than a decade before Nic Lewis’s contributions”
Oh, come on.
First, Lewis’ work uses an energy budget model. And you conveniently left out the paleoclimate observations that show a higher climate sensitivity that Lewis’ model-based approach. So your dichotomy between “observational-based and model-based ECS” here is a false one, if you’re acting as if Lewis doesn’t use a model:
“These studies employ observations but still require an element of modeling to infer ECS.
[…]
Forster & Gregory (2006, p. 39) overstated the benefits of such an approach by claiming, “Importantly, the [ECS] estimate is completely independent of climate model results.” As Equation 1 derives directly from conservation of energy, the Forster & Gregory (2006) claim would appear valid. But it in fact makes the assumption that the α derived from a particular observational period is the same as the α applicable under long-term climate change. Another way of stating this assumption is saying that the effective climate sensitivity (the apparent ECS diagnosed from a specific α) is the same as the true ECS. Uncertainties around the derivation of ECS from an energy budget approach can be attributed to two causes: the model used to translate α into an ECS estimate and the quality of the observation-based data sets.”
https://www.annualreviews.org/doi/abs/10.1146/annurev-earth-060614-105156?casa_token=vRrWzUdKwDEAAAAA%3AUMXASkMMfYggx6oKU4oOgDux4qh0qRfqgNYSuaj_sYPDCjHwsFgkCpNVZi6gWQc6sNAXQHSakfnCdME&journalCode=earth
“Proxies for CO2 and temperature generally imply high climate sensitivities: ≥3 K per CO2 doubling during ice-free times (fast-feedback sensitivity) and ≥6 K during times with land ice (Earth-system sensitivity). Climate models commonly underpredict the magnitude of climate change and have fast-feedback sensitivities close to 3 K.”
https://www.annualreviews.org/doi/full/10.1146/annurev-earth-100815-024150
Second, energy-budget-model-based and energy balance approaches were used long before Lewis’ work. And observations were compared to models. You were wrong when you claimed otherwise:
“To answer that question, starting in the 1960s scientists have used energy balance arguments combined with observed changes in the global energy budget, evaluated comprehensive climate models against observations, and analysed the relationship between external forcing and climate change over different climate states in the past (see Methods for a list of early publications).”
https://www.nature.com/articles/ngeo3017
I’ve told you this many times before, frank: please do not make false claims for which you have no cited evidence. It’s annoying.
Maybe instead of making baseless insinuations about peer review, you should spend instead more time reading the peer-reviewed literature? That would help stop you from making the sort of false claims you made above.
Re: “In many areas of research, there is a crisis in confidence in published work. Ionnaides, for one example”
And now you round things out with the usual abuse of Ioannidis’ work. Amazing. This is getting too predictable.
Ioannidis notes that the evidence (and level of certainty) on anthropogenic climate change is on par with the evidence (and level of certainty) that smoking kills people. He made this comparison because he recognizes that scientific hypotheses become more reliable (and more likely to be true) as more and more research groups test the hypothesis using different lines of evidence, methodologies, etc., and keep finding that the hypothesis passes the tests:
17:17 to 18:22 of:
“RS 174 – John Ioannidis on “What happened to Evidence-based medicine?””
http://rationallyspeakingpodcast.org/show/rs-174-john-ioannidis-on-what-happened-to-evidence-based-med.html
So no, don’t misuse Ioannidis work to support your spurious insinuations on the reliability of climate science.
Re: “It’s OK to make mistakes and then admit and/or fix them. This is what Christy did. This is what Lindzen did. This is what Michael Mann refused to do with his hockey stick. This is what Sherwood refused to do when he first used a deceptive color graph to “prove” the existent of a tropical hot spot, and when he later wanted us to believe that we should throw out balloon and satellite data and instead depend on his derivation of tropospheric temperatures through wind shear and an assumption of natural variability.”
The so-called “hot spot” has been shown to exist multiple times, both in research Sherwood co-authored and in research from other groups. I’ve read his IUK papers; they were not deceptive. The color-scale was clearly defined in the papers. Feel free to show otherwise. Here’s a sampling (I suspect that figure 6 of the 3rd paper is what you’re complaining about):
“Atmospheric changes through 2012 as shown by iteratively homogenized radiosonde temperature and wind data (IUKv2)”
“Warming maximum in the tropical upper troposphere deduced from thermal winds”
“Robust tropospheric warming revealed by iteratively homogenized radiosonde data”
Moving on: Mann doesn’t need to admit to all the mistakes you claim he made, especially if he didn’t make them. He also re-did the hockey stick analysis without tree ring data and with multiple different analysis techniques. Other people replicated the hockey stick result as well. Not my fault if you don’t accept it. I’d suggest you read papers such as:
“Proxy-based reconstructions of hemispheric and global surface temperature variations over the past two millennia”
“Robustness of the Mann, Bradley, Hughes reconstruction of Northern Hemisphere surface temperatures: Examination of criticisms based on the nature and processing of proxy climate evidence”
“A global multiproxy database for temperature reconstructions of the Common Era”
“A Reconstruction of Regional and Global Temperature for the Past 11,300 Years”
Re: “Consensus climate science has all the fingerprints of advocacy science and maybe even a touch of downright dishonesty.”
And pigs fly.
I remember when some conservatives made the same baseless claim on consensus medical science on smoking causing cancer. Or consensus climate / chemical science on CFC-induced ozone depletion. Or consensus biological science on human evolution. Or…
Franktoo wrote: “One the other hand, the discrepancy between observational-based and model-based ECS remained unrecognized for more than a decade before Nic Lewis’s contributions”
Atomsk wrote: “Oh, come on. First, Lewis’ work uses an energy budget model. And you conveniently left out the paleoclimate observations that show a higher climate sensitivity that Lewis’ model-based approach. So your dichotomy between “observational-based and model-based ECS” here is a false one, if you’re acting as if Lewis doesn’t use a model …”
The history of the failure of the IPCC to recognize the discrepancy between observational-based and model-based ECS is documented in great detail below. There is no reason (except confirmation bias) why recent and current efforts to understand the origins of this discrepancy shouldn’t have started a decade earlier. If the IPCC published reports that met Schneider’s standard for ethic science (the whole truth with all of the caveats), the discrepancy would have been candidly discussed in AR5.
http://www.thegwpf.org/content/uploads/2014/02/A-Sensitive-Matter-Foreword-inc.pdf
An energy balance model simply divides the current radiative forcing into two parts: 1) The current imbalance that is causing warming right now – mostly in the ocean. 2) The increase in OLR + OSR associated with a warmer planet. (OSR + reflection of SWR). d(OLR+OSR)/dTs is the reciprocal of ECS expressed in K/(W/m2) rather than K/doubling. As best I can tell, saying that EBM’s are merely models is functionally equivalent to saying applying conservation of energy to our climate system is “merely a model”. There are acknowledged uncertainties in the forcing and warming data, but I see no reason not to trust this “model” as much as I trust the law of conservation of energy.
Estimates of ECS from paleoclimatology similarly depend on conservation of energy. However, we have far more accurate information about the planet from 1970-2010 (the period used by Otto 2013)) and the instrumental period used by others (and hindcast by AOGCMs). Where EBM’s and paleo disagree, the more reliable answer should be obvious and the central estimate for EBMs is within the confidence interval for paleo. Citing paleo is misdirection.
You quoted a 2016 review by Forster. The full quote is:
“As Equation 1 derives directly from conservation of energy, the Forster & Gregory (2006) claim would appear valid. But it in fact makes the assumption that the α derived from a particular observational period is the same as the α applicable under long-term climate change. Another way of stating this assumption is saying that the effective climate sensitivity (the apparent ECS diagnosed from a specific α) is the same as the true ECS. Uncertainties around the derivation of ECS from an energy budget approach can be attributed to two causes: the model used to translate α into an ECS estimate and the quality of the observation-based data sets.”
I interpret this to mean that past surface temperature change has been forced by known phenomena that effect the radiative balance across the TOA and by unforced by chaotic fluctuations in ocean currents that control mixing between the surface and the deeper ocean (internal variability not arising from the TOA). EBM’s certainly assume that all warming is forced warming. The last sentence (the one you quoted) adds nothing new. The model used to “translate alpha into an ECS estimate” involves only F2x and conservation of energy and F_2x is only needed if you want to express ECS is terms of CO2 (K/doubling) instead of forcing (K/(W/m2)). The latter works for any forcing and is far more general. The quality of the observation-based data sets includes the confidence intervals around the inputs which produce the confidence interval around ECS and the possibility of systematic errors in forcing,
Atomsk finishes with: “And now you round things out with the usual abuse of Ioannidis’ work. Amazing. This is getting too predictable.”
I may have been misunderstood, but I didn’t intentionally abuse Ioannidis’ work. The point I was trying to make was that there is somewhat of a crisis of confidence in the reliability and meaning of published work in many areas of science. Standards are tightening, independent replication of important findings is getting more attention, what does it mean when 5 labs independently test a hypothesis, 4 don’t find a statistically significant effect (and don’t publish) while a fifth does find an statistically significant effect and does publish? In contrast, climate science charges forward with no public doubts despite: model parameterization and “ensembles of opportunity”, AR5’s revision of the lower limit for ECS after AR4 lowered it, decreased confidence in the MWP, the effect of GW on hurricanes, Climategate, misused of extreme weather …
Re: “The history of the failure of the IPCC to recognize the discrepancy between observational-based and model-based ECS is documented in great detail below”
You’re citing a 2014 GWPF document as your source on information, despite GWPF’s long history of publishing misleading reports for ideological reasons. That is why you’re confused on this topic. Please try reading better sources.
Instead of believing their claims about how the evil IPCC is suppressing science, actually read what the IPCC said. If you had, then you’d know that IPCC AR4 was already discussing observational estimates back in 2007. For example:
“Estimates of Climate Sensitivity Based on Instrumental Observations”
https://www.ipcc.ch/publications_and_data/ar4/wg1/en/ch9s9-6-2.html
And you’re simply repeating the mistakes I already addressed, without addressing the points. Again. To reiterate: you were already cited work comparing models and observational estimates, dating back to before the IPCC even existed. So you were wrong when you claimed this issue was ignored before Nic Lewis.
Re: “I interpret this to mean that past surface temperature change has been forced by known phenomena that effect the radiative balance across the TOA and by unforced by chaotic fluctuations in ocean currents that control mixing between the surface and the deeper ocean (internal variability not arising from the TOA). EBM’s certainly assume that all warming is forced warming. The last sentence (the one you quoted) adds nothing new.”
First, I didn’t just quote the last sentence. Second, your interpretation is wrong. The quote is actually pointing out that the assumption that estimate for the recent historical record is the same as the estimate that will apply at later periods of time. To quote the relevant portion again:
“But it in fact makes the assumption that the α derived from a particular observational period is the same as the α applicable under long-term climate change. Another way of stating this assumption is saying that the effective climate sensitivity (the apparent ECS diagnosed from a specific α) is the same as the true ECS.”
https://www.annualreviews.org/doi/abs/10.1146/annurev-earth-060614-105156?casa_token=vRrWzUdKwDEAAAAA%3AUMXASkMMfYggx6oKU4oOgDux4qh0qRfqgNYSuaj_sYPDCjHwsFgkCpNVZi6gWQc6sNAXQHSakfnCdME&journalCode=earth
As Forster notes, this assumption is not just conservation of energy; it’s an assumption one can reject without rejecting conservation of energy. Thus you’re wrong when you claim that EBM-bsed approach is just using conservation of energy. There are plenty of papers that call the assumption by pointing out how the effective climate sensitivity increases with time, such that the recent effective climate sensitivity need not be equivalent to the true ECS. For instance, see the following and the references cited therein:
“Internal variability and disequilibrium confound estimates of climate sensitivity from observations”
You’re also assuming that EBM-based approaches necessarily show lower climate sensitivity than models. And that’s not the case either. For example:
“Reconciled climate response estimates from climate models and the energy budget of Earth”
Re: “Citing paleo is misdirection.”
Nope. It’s citing evidence that you’re trying to avoid, by acting as if the EBM-approach doesn’t use a model that depends on challenge-able assumptions. In fact, the higher climate sensitivity estimate of paleo support rejecting the claim that the “the α derived from a particular observational period is the same as the α applicable under long-term climate change”. For example:
“A better characterization of feedbacks in warm worlds raises climate sensitivity to values more in line with proxies and produces climate simulations that better fit geologic evidence. As CO2 builds in our atmosphere, we should expect both slow (e.g., land ice) and fast (e.g., vegetation, clouds) feedbacks to elevate the long-term temperature response over that predicted from the canonical fast-feedback value of 3 K.”
https://www.annualreviews.org/doi/full/10.1146/annurev-earth-100815-024150
Re: “The point I was trying to make was that there is somewhat of a crisis of confidence in the reliability and meaning of published work in many areas of science. […] In contrast, climate science charges forward with no public doubts despite”
Of course there are public doubts, which are often baseless. If there weren’t such doubts, then websites like this wouldn’t exist. Similarly, there are often baseless public doubts about whether Earth is round, HIV causes AIDS, humans evolved from non-human animals, etc. Public doubt isn’t necessarily rational.
You also make claims about a “crisis of confidence”. But you ignored why such a “crisis” does not apply in the scientific community to various topics, like humans causing most of the recent global warming, and smoking having caused at least hundreds of thousands of cases of cancer. As your own source Ioannidis notes, these scientific scientific hypotheses become more reliable (and more likely to be true) as more and more research groups test the hypothesis using different lines of evidence, methodologies, etc., and keep finding that the hypothesis passes the tests. This has occurred for both the science on smoking killing people and the science on anthropogenic climate change. So your misuse of Ioannidis’ work as applying to climate science, is as misguided as someone using his work to cast doubt on the medical science regarding smoking causing cancer.
Frank wrote: “The history of the failure of the IPCC to recognize the discrepancy between observational-based and model-based ECS is documented in great detail below” and referenced “A Matter of Sensitivity”.
Atomsk replied: You’re citing a 2014 GWPF document as your source on information, despite GWPF’s long history of publishing misleading reports for ideological reasons. That is why you’re confused on this topic. Please try reading better sources.
Frank replies: No, I’m citing an article by NIc Lewis and Marcel Crok (who ran climatedialogue.com, which hosted debates between both skeptics and supporters of the consensus). And the report was endorsed by in a forward by the host of this blog. Pick any evidence cited by in this article and check to see that it is factually correct. For example, you provided a link to what AR4 said about ECS. If you had bothered to read the history section of Lewis and Crok, you would know that Froster and Gregory (2006) was the only pre-AR4 study to report a low central estimate for ECS (1.6 K) that is in reasonable agreement with most recent publications using energy balance models. Foster and Gregory (2006) got the “right answer” found later by Otto (2013, with 11 co-authors supporting the consensus and one skeptic, Lewis) and many others. The consensus vehemently disagrees that this is the correct value for future climate change. However, the AR4 Figure you linked reprocessed the pdf from F&G (2006) using a Bayesian methodology so that the median was greater than 2 K and consistent with AR4’s conclusion that ECS must be above 2.0. AR5 had to reverse this conclusion and return the lower limit to 1.5 K. Numerous studies seeking to identify the reason why EBMs and AOGCMs are somewhat inconsistent didn’t begin until after Otto (2013).
Of course, you haven’t read the report or audited any of this report’s evidence. If it was published by the GWPF, it must be wrong. That is confirmation bias. I certainly don’t believe everything the GWPF publishes, but experience has taught me to have respect for these particular authors. That doesn’t mean I believe everything they say.
Atomsk wrote: “Internal variability and disequilibrium confound estimates of climate sensitivity from observations”
This statement is correct. However, the IPCC chooses to ignore the possibility of high internal variability when they say (with inappropriately high certainty) that at least 50% of warming since 1950 must be anthropogenic. In that case, they rely upon climate models to estimate that natural variability likely contributes less than +/-0.1 K to warming and state that the best estimate for anthropogenic warming is observed warming. So they dismiss the possibility of high internal (unforced) variability when making attribution statements, but cite high internal variability as an excuse for ignoring EBMs. Unforced variability of +/- 0.1 K would cause little impact on the conclusion from EBMs.
Even worse, EBM’s give low estimates for climate sensitivity when applied to a great variety of periods. Otto (2013) analyzed each decade between 1970 and 2010 individually and the four decades as a whole and obtained similar best estimate for ECS. This was a period with little change in aerosol forcing, the greatest source of uncertainty. Lewis and Curry have studied 65 and 130 year periods to negate the effects of AMO. They averaged over starting and ending periods long enough to average out the any effects from ENSO and avoided volcanos. Others have studied the entire 20th century and obtained low climate sensitivity. It seems almost absurd to suggest that unforced variability had a similar distorting influence over all of these periods. I say almost, because most of the signal in terms of forcing and warming comes from the period after 1970.
Logically, you have two choices: a) You can say AOGCM’s are correct when they say that unforced variability is low. In that case, the high climate sensitivity of AOGCMs us inconsistent with observations from EBMs. b) You can say that unforced variability can be high enough to badly distort the results from EBMs and AOGCMs must be wrong about unforced variability being low. One way of the other, AOGCMs appear to be inconsistent with observations.
Atomsk cited Richardson (2016) as a refutation of low ECS from EBMs: “Reconciled climate response estimates from climate models and the energy budget of Earth”. He doesn’t cite Lewis’s rebuttal to that paper:
https://climateaudit.org/2016/07/12/are-energy-budget-tcr-estimates-biased-low-as-richardson-et-al-2016-claim/
Nic has some substantial counterarguments. With dozens of defenders of the models, it is impractical for Lewis to respond to each with formal journals articles. If these papers went through an appropriately skeptical peer review process, many of the discrepancies and complications Nic reports would be dealt in these papers. At the moment, Richardson’s paper shouldn’t be taken as the definitive work on this subject.
Furthermore, Richardson is saying that AOGCMs produce 24% more warming than we expect to have observed – which is one way of saying that models are wrong. AOGCM’s (with huge, parameterized grid cells on either side of the surface are completely incapable of properly modeling the micro-environments where we measure GMST and heat transfer between them. In normal science, observations are “right” and inconsistent hypothesis are wrong. In the crazy world of climate science, it is perfectly acceptable to say the observations are wrong. An AOGCM Is a hypothesis about how our climate system responds to forcing – or more accurately a large family of possible hypotheses created by ad hoc tuning incapable of identifying an optimum set of parameters.
Atomsk writes: “You also make claims about a “crisis of confidence”. But you ignored why such a “crisis” does not apply in the scientific community to various topics, like humans causing most of the recent global warming, and smoking having caused at least hundreds of thousands of cases of cancer. As your own source Ioannidis notes, these scientific scientific hypotheses become more reliable (and more likely to be true) as more and more research groups test the hypothesis using different lines of evidence, methodologies, etc., and keep finding that the hypothesis passes the tests. This has occurred for both the science on smoking killing people and the science on anthropogenic climate change.”
There have been numerous articles over the last decade in Science and Nature about the reproducibility of important scientific work and the limitations of peer review.
There is no doubt in my mind that rising GHGs slow radiative cooling to space, and therefore must cause the planet to warm. These are the consequences of applying conservation of energy and the physics of radiation (quantum mechanics) to the planet’s radiation balance. (Thanks to the central role AOGCMs play in IPCC reports, there are a lot of misinformed people who don’t understand this “settled science”.) IMO, climate science takes over from physics with the climate feedback parameter – how much does the planet need to warm to emit or reflect enough radiation (W/m2/K) to restore a steady state – given all of the feedbacks associated with warming. Climate science has made no progress on this subject since Charney in 1979! This post supports the current lower end of this range. (The apparent absence of progress may be due to earlier over-confidence.)
There is no crisis of confidence in climate science – as there is in many areas of science – because it is politically impossible for climate scientists to discuss this subject publicly. Given that IPCC SPMs must be unanimously approved by all delegates (mostly political appointees), there is no chance that any of what Schneider called the “ifs, ands, buts and caveats” characteristic of ethical science is going to appear in SPMs.
“Peer review is not some plot to feed the media “alarmist” (whatever that is) material. ”
It can be. It depends on whom the editor chooses for peer review, and the quality and nature of the review those persons produce. In most cases the reviewers are anonymous, but that’s not necessarily a good idea since it keeps the process opaque.
It is not a plot; it is a paradigm. Speaking of which here is my latest for CFACT:
http://www.cfact.org/2018/11/07/climate-alarmism-paradigm-protection-at-nsf/
The beginning:
In his landmark book “The Structure of Scientific Revolutions,” Thomas Kuhn discusses at great length how a scientific field can be captured by a system of false ideas, to the point where these beliefs determine what the legitimate scientific questions are. He called such belief systems “paradigms,” an example being the Earth centered model of the solar system.
Kuhn had no name for the way that a paradigm shields the field from hard questions and contrary evidence, so I call it “paradigm protection.” Paradigm protection is rampant in the field of climate science, where the controlling paradigm is the idea that humans are causing dangerous climate change.
The US National Science Foundation has just produced a remarkably clear example of alarmist paradigm protection. It is a multi-million dollar research funding Program cleverly titled “Navigating the New Arctic.”
There is a lot more.
In this case it is alarmist research empire building.
First things first, scientists should always question results, seems that the climate change promoters didn’t do their due diligence; hence egg on their face, compounded by not responding tot he per-publication disclosure -indicative of a bias perhaps?
Wow, just wow!
Well done—yet again. Kudos.
Whoah. Good work Nic.
We’ve seen estimates of OHC trend get adjusted up and up over the last 8 years. The purpose is clearly to bootstrap and justify higher sensitivity estimates observed surface T changes won’t support.
Clean, clear, well written, well cited, all homework completed.
Well done, that man!!
w.
“But perhaps that is too much to hope for.”
.
Of course it is. If it bleeds, it leads. “New paper is found in error, and when corrected is consistent with earlier estimates” doesn’t get a bid of press coverage.
“the prestigious journal Nature.”
“the world’s premier scientific journal”
I think I see your problem.
It is very good you found this apparent error, but it does mean two things:
1) The Nature reviewers didn’t actually review the paper (except maybe for typos), which is unfortunate. I would suggest confirmation bias, but maybe that is too harsh.
2) You are not going to be the authors’ favorite person in the world.
The interesting question is if Nature will ever publish a correction. My bet: not an icecube’s chance in Hell.
the mechanism exists but Nic needs to write it up and submit.
or you can
I didn’t see the paper, only the press releases, but my immediate reaction was: “Well, if that is right, then thermal expansion has to have been the dominant cause for measured sea level rise, and ocean mass increases (melting of land supported ice) estimated from Grace data have to be WAY wrong. That seems unlikely.”
Just a thought, but with higher CO2 levels driving increased photosynthesic activity, and O2 being a direct byproduct of photosynthesis, would one not expect O2 levels to rise in the atmosphere? After all, this was the mechanism that generated oxygen in the first place. This increase in O2 would on the surface, appear to correlate well with the increased crop production and greening shown by Dr. Spencer and NASA studies.
Atmospheric oxygen is falling in line with its consumption by the burning of fossil fuels.
http://scrippso2.ucsd.edu/assets/imce/ljo_o2_plot.gif
http://scrippso2.ucsd.edu
VTG,
I think it is falling somewhat less than what would be expected from combustion of fossil fuels, due mostly to greater overall plant growth and oxygen production. You can also see it in the slight increase in the magnitude of seasonal fluctuation of oxygen near the end of the record compared to the early part of the record.
vtg — Thanks for sharing, haven’t seen before, that is interesting.
I just ran the numbers. Scripps (see link) says oxy is reducing by 0.0019% by weight per year.
Carbon annual emissions are ~ 9 gigatonnes. This requires 9 * 32/12 = 24 gigatonnes of oxy to make CO2.
Oxy weight in atmosphere is 1,186,250 gigatonnes. Reducing that by 24 GT per year is a reduction of ~ 0.002% per year …
w.
Willis,
The numbers I found for CO2 emissions from fossil fuels for 2017 correspond to ~26.7 gigatons of oxygen consummed, not 24 gigatons. Maybe we should compare our sources.
Willis,
Here is my source: https://www.google.com/amp/s/www.carbonbrief.org/analysis-global-co2-emissions-set-to-rise-2-percent-in-2017-following-three-year-plateau/amp
stevefitzpatrick | November 9, 2018 at 7:42 pm |
Steve, mine was calculated from a number I gave as “~ 9” gigatonnes of carbon. Your number is undoubtedly more up-to-date.
w.
“Earth’s oceans have absorbed 60 percent more heat per year than previously thought”. Settled science?
No such claim was ever made. Straw; half and puff; goal.
spelchekker – huff
Which claim? “60% more heat” or “settled science”? The 60% more heat claim certainly was made, but no claim of settled science. An paper which claims earlier work was way off also implicitly says the science is not settled.
Ah – settled science does not extend to oceans.
The paper is, as I understand it, the first to employ its approach. How could it have anything to do with settled science?
Clearly it doesn’t have anything to do with settled science. But considering that it looks like it has serious (freshman physics level) mistakes, it might be better considered ‘erroneous science’. I hope all the blaring press releases and frightening MSM headlines get walked back, something like say “Sorry, we were mistaken, it really isn’t worse than we thought”….. but I won’t hold my breath.
And I won’t hold my breath waiting for people to take back cheap goals.
It wants to add to and strengthen “the many lines of evidence” for “global warming”, which according to the consensus is settled science.
Cheap goal? I don’t think so.
The cheap goal was all the incorrect information that has been fed to the public from this paper, and that will never be taken back. If it weren’t for the blaring press releases and frightening MSM headlines that followed, a paper with problems like this could be (and likely would be) handled very differently. Maybe an exchange of email messages, followed by a low keyed joint correction published in Nature. That is not possible when a paper makes dramatic claims which are then breathlessly pitched to the MSM about how dire things are, accompanied by comparably breathless quotes from the authors about the ‘seriousness of the new findings’. When a scientific paper instantly becomes a bludgeon used to advance political goals, it had damned well better be bulletproof and perfect. And the truth is, very few are. If all press releases about new papers in climate science were withheld for 4 months, civility in resolving errors would be a lot more likely.
Nice work Nic. This fits with my contention that a lot of climate science deals with noisy data and uses poor methods (and poor quality control) to reach conclusions that are dubious. Mann has a new post at RealClimate that perfectly illustrates these points. The bulk of the post is about how “simple physics” explains worsening weather. “simple physics” is another way of saying vague verbal formulations that lack quantification.
We are all in your debt for doing the homework so called “peer reviewers” seem disinclined to do.
Maybe peer review needs to be changed for public review, with a reporting restriction in place for eg 1 month before the media may report on it.
After having read of this, I came to the conclusion that peer reviewing is dead in climate science, since many years.
The Wegman Report, 2006, already explained that, for the infamous hockey stick results of MM… and its closely tied little “community” of researchers confirming his astonishing results, using the same base of data and without having the possibility to check his code.
Today’s name of the game is pal-reviewing.
This paper has been, clearly, pal-reviewed, and this explains very well why it got published without the referees spotting its obvious mistakes… the reviewers did not think that their pals could have been wrong, since they hold them in good esteem.
“Of course, it is also very important that the media outlets that unquestioningly trumpeted the paper’s findings now correct the record too.”
The odds of winning the Powerball are better than that happening.
I wish I had a dollar for each paper I read that used a “novel method”.
Apparently novel is better than proper. But if it gets you what you want, what the hey.
It’s not a problem of the media foremost , they did a “good job” according to https://climatefeedback.org/evaluation/washington-post-accurately-describes-ocean-warming-study-with-potential-implications-for-future-carbon-budget-chris-mooney-brady-dennis/ . ;)
The source of this hyped attention is the aper itself, it’s unjustified conclusions relating to carbon budget and ECS. This was found from many observers. Not so the flaw in the methods, also not “climatefeedback” raising some questions about this “feddback”.
The other day I spilled coffee on my keyboard and my up and down scroll buttons don’t work. There are a couple of comments in the thread that I cannot copy:
https://i.imgur.com/hjuO833.png
https://i.imgur.com/etmH2Ht.png
Well done. Short, succinct, to the point. Clear and irrefutible.
In immortal praise even.
“ Atomsk’s Sanakan (@AtomsksSanakan) | November 6, 2018
I congratulate him on catching that error”
On page 1, Atom, worth rereading Nic’s logic.
I am hopeful you have done a McIntyre on this paper’s conclusion.
Before everyone gets to excited, John Kennedy tweeted something 3 days ago that suggests there might be a legitimate reason for the difference. It has to do with weighting data by uncertainty. Weighting by uncertainty is a legitimate thing to do. It is something that would need to be called out in the paper and so on and so on. Also, the difference between weighted and unweighted results should be called out.
https://platform.twitter.com/widgets.js
I’m trying to see if he’ll say more on twitter.
Lucia,
The direct quote from the paper is:
“From equation (1), we thereby find that ΔAPOClimate = 23.20 ± 12.20 per meg, corresponding to a least squares linear trend of +1.16 ± 0.15 per meg per year”
I don’t see how a least squares linear trend becomes one based on 1/unc^2
at least not without there being some explanation.
They say more in the methods section. They do a million simulations for trend, presumably varying numbers according to the stated uncertainties. For each one, they do a OLS regression, so the terminology is correct. The uncertainty has an effect because the earlier terms are more likely to be close to their more highly trending values in each sample, so the overall effect is uncertainty-weighted.
Lucia, thanks for drawing this to readers’ attention.
John Kennedy’s weighted regression method (which could indeed be that used by Resplandy) forces the regression fit through zero in 1991. There is no justification for doing so, as I point out in note [xii]. The uncertainties aren’t really zero in 1991; it is simply that the 1991 data value has been deducted from all years’ data. The uncertainty only appears to be low in the early years because 1991 is used as the base year. One could instead have deducted the 2016 data value from all years’ data. That would result in zero uncertainty in 2016 and maximum uncertainty in 1991. Using weighted regression would then force the fit through the 2016 data point and produce a very low trend, as the slow growth in the (then lower uncertainty) later years dominates the fit.
The underlying issue is that the error in dAPO_Climate values is dominated by trend and scale systematic errors in its components. Those errors give rise to irreducible uncertainty in the trend in dAPO_Climate. It is arbitrary which year is used as a base to measure trend errors from. Whichever year is chosen, the trend error magnitude will be zero in that year and grow in both directions away from it. If the method used results in the estimated dAPO_Climate linear trend depending on the arbitrary choice of base year for measuring the trend error, it must be wrong. Where data error ranges arise due to trend uncertainty that affect all years’ data in proportion to distance from a base year, it is not appropriate to weight the data values inversely with their error variance, as Kennedy’s method does.
Ni Lewis,
Thank you for another excellent post and for the explanation you provide in this comment.
Nic,
Fair enough. I haven’t read the papers. So I assumed theses were some sort of published measurement uncertainties — similar to what we would do with instrumentation. (Hadcrut has published uncertainties that exist external to any individuals decision to fit the data. )
I agree the uncertainty is defined as zero for 1990, and then that’s not legitimate. (If one does want to do that, at least define it as zero in the midpoint of the time range! Even then that’s not quite right.)
“estimate the rate of change in the original quantity”
The original quantity is APO. But they are looking at trend in APO_climate. That involves attribution, which you can do for a change. But not necessarily for the original quantity.
It’s like where you measure temperature of a place since 1991, and during that time the location has shifted up a hill. You can talk about the part of the change that was due to climate, and the part that was due to location change. But it doesn’t make sense to ask what fraction of the temperature in 1991 was due to climate, and what fraction due to location. So there is no absolute definition of T_climate.
I reproduced Nic Lewis’ numbers.
I cannot reproduce John Kennedy’s numbers.
I can reproduce John Kennedy’s numbers. The R code is here, with lewis.csv being derived from the linked xlsx file:
v=read.csv(“lewis.csv”)
x=v$year
y=v[,2]
wt=v[,3] # to deal with zero uncertainty at 1991
wts=1/wt/wt
wts[1]=100
h=lm(y~x,we=wts)
print(summary(h))
That gives the same slope of 1.162, and the std error 0.0514, which JK notes is lower than the paper. The essential thing, as Nic says, is that the regression is constrained to pass through 0 at 1991. I agree with Nic that this may not be the right thing to do, even though it is the defined reference value. If you don’t, but assign an uncertainty same as 1992, the slope is 1.014.
Nick:
Agreed. If we put an arbitrarily large weight (100) on the first observation, the slope is indeed 1.16 (+/-0.05).
I used Gretl.
> wts[1]=100
Wow! Did they really do that?!
“Wow! Did they really do that?!”
No, they did nothing like that, or like what Nic did either. It’s just my shortcut for a regression with fixed intercept. What they in fact did was create a statistical model for the uncertainties of the data, create a million ensembles (realizations) and derive the statistics of that.
It takes a lot more analysis that what is given here to work out the effect of what they did. What John Kennedy did was to show that an uncertainty weighting with fixed intercept was adequate to explain the trend. It mimics some of the effect of what they did, but it isn’t the same.
Nic Stokes,
“If you don’t, but assign an uncertainty same as 1992, the slope is 1.014.”
Assign the uncertainty for all the data points to be the same as 1992? If so, how could it not just be the same as an OLS calculation?
“Assign the uncertainty for all the data points to be the same as 1992? I”
No, assign the uncertainty of 1991 to be the same as 1002. At present it is artificially zero because it is chosen as the reference value.
Nick Stokes,
OK, so assigning the starting point some (small) uncertainty moves the resulting calculated slope about half way to Nic’s result of 0.88. But that doesn’t answer Nic’s question of the validity of having ever growing uncertainty the further away in time from 1991. Do you think this is reasonable, and if so, why?
“Do you think this is reasonable, and if so, why?”
It may well be. It is, as said, ΔAPO, the difference between a given year and 1991. That becomes more uncertain as time proceeds, and the difference becomes larger.
Seems to me the way to do this is to not use deltas and estimate the rate of change in the original quantity. All the data points then have roughly the same measurement uncertainties.
Nick Stokes,
” It is, as said, ΔAPO, the difference between a given year and 1991.”
But could it not just as easily be calculated based on the differences between a central year and both earlier and later years? (the signs for the ΔAPO’s before and after would be different, of course) Seems to me what date you choose as a reference point ought not substantially change the calculated slope.
David
“estimate the rate of change in the original quantity”
The original quantity is APO. But they are looking at trend in APO_climate. That involves attribution, which you can do for a change. But not necessarily for the original quantity.
It’s like where you measure temperature of a place since 1991, and during that time the location has shifted up a hill. You can talk about the part of the change that was due to climate, and the part that was due to location change. But it doesn’t make sense to ask what fraction of the temperature in 1991 was due to climate, and what fraction due to location. So there is no absolute definition of T_climate.
(apologies for misplacing response upthread).
“Seems to me what date you choose as a reference point ought not substantially change the calculated slope.”
“If the method used results in the estimated dAPO_Climate linear trend depending on the arbitrary choice of base year for measuring the trend error, it must be wrong. ”
That seems correct. I can measure how wrong every opinion is by its distance from my own.
There are 2 further problems to discuss.
One is the magical pudding result of this paper.
It is all very well to say we have been underestimating the amount of heat that went into the oceans but where is it?
(Hansen).
If it really truely occurred it has to be detectable by Argo the satellites and (choke) the models.
But it is not there.
Are our observations so unbelievably wrong? Rhetorical.
It is one thing to make a grandiose claim.
You have to be able to show proof of the result of that claim.
And how did it get there without first heating the troposphere?
Second is the concept.
Of using O2.
The authors start with observed changes in ‘atmospheric potential oxygen’ (ΔAPOOBS)
And CO2.
the recent paper that [quantifies] ocean heat uptake from changes in atmospheric O2 and CO2 composition, by Resplandy et al
Reliably.
For the world.
I understand they have figures. Nic has found the figures. But seriously.
We are talking about these levels at sites all over the world and yet using a presumed aggregate of levels at a few sites possibly not even related to the oceans themselves.
The potential standard deviations are enormous.
CO2 level estimation is only done at a couple of places with very por correlation to that at sea level over the oceans which is substantially unmeasured.
O2 measurement is even more fragile and unreliable.
While the concept is great it is of one of those measures that should help to provide backup and reassurance to our observations, not refute or challenge them.
A glaring difference like this raises two possibilities. The measurements of CO2 and O2 potential have serious limitations or errors (do more measurements in different places).
Or worse, confirmation bias of the worst sort.
The desperate effort to find some way to refute observations which question AGW (climate change) makes people do strange things. Mann, Gerghis and the holy grail (hot spot) searchers come to mind.
Re: “the holy grail (hot spot) searchers come to mind.”
How many times do people need to cite you evidence showing the hot spot exists (evidence you promptly evade and ignore, so that you can later claim the hot spot doesn’t exist)?
https://twitter.com/AtomsksSanakan/status/1013527104443633669
Kneeling agrees with me, Atomski
“In addition, we realized that the uncertainties in the assumption of a constant land O2:C exchange ratio of 1.1 in the calculation of the “atmospheric potential oxygen” (APO) trend had not been propagated through to the final trend.”
Just curious: I tried to do a back-of-the-envelope calculation. If I did the math right, this paper says that we’ve increased the average temperature of the *entire ocean* by about 0.065 degrees in the past 25 years.
First, did I do the math right?
Second, assuming I did, if the ocean is warming more slowly than the atmosphere, would that mean that over time, the ocean will dampen the effect of CO2 warming?
And an aside: the said that they found an error of 60% in the estimate of ocean heat uptake. It’s a pretty big error. Is there any reason that the error couldn’t have been “the other way”? As in: could we have found that the oceans absorbed 60% less heat? And, if so, what does that say about our ability to understand the climate at all?
Most of the heat should stay/ warm the upper ocean so the SST should go up more than your estimate. Secondly the temperature changes are minute whereas what we are fed in OHC sounds massive even for 0.01 C of warming. I imagine your calculations could be good.
Nic, Wondering if you had seen this
https://twitter.com/micefearboggis/status/1058817553097785350?ref_src=twsrc%5Etfw%7Ctwcamp%5Etweetembed%7Ctwterm%5E1058817553097785350&ref_url=https%3A%2F%2Fandthentheresphysics.wordpress.com%2F2018%2F11%2F03%2Fnew-ocean-heat-content-analysis%2F
used a novel method
Novel as in fiction?
“We show that the ocean gained 1.33 ± 0.20 × 10²² joules of heat per year between 1991 and 2016, equivalent to a planetary energy imbalance of 0.83 ± 0.11 watts per square metre of Earth’s surface.”
An energy (sic) imbalance of 0.83 W/m2 is consistent with both Argo heat and CERES raw monthly power flux imbalance. Thus the first hurdle is passed. Although I suspect that the result may at lest unconsciously be tuned to that.
Natural variability continues to be underestimated. There is clearly some not so simple physics – Rayleigh–Bénard convection – in cloud formation over oceans that is related to ocean surface temperature. From observation cloud variability over the eastern and central Pacific is the dominant source of global cloud variability (Clement et al 2009).
e.g. https://www.nature.com/articles/s41467-018-04478-0
The cloud radiative effect is the result of a non-linear relationship of rain to the internal kinetic energy of water vapor molecules in the presence of nucleating aerosols. Closed convection cells persist for longer over cool ocean surfaces before raining out from the center. It leads to modulation of TOA power flux by inter-annual to millennial variability in the Pacific state. The rate of ocean heating changed in the late 1990’s as a result of low frequency climate variability – largely to do with shifts in the Pacific state. That will shift again within the decade.
https://watertechbyrie.files.wordpress.com/2018/11/resplandy-ocean-heat.png
In a practical sense the estimated components on the RHS of this equation have uncertainties greater than +/- 20%. And I suspect that biological component is radically underestimated through neglect of the terrestrial system.
e.g. http://environmentportal.in/files/Temperature%20associated%20increases%20in%20the%20global%20soil.pdf
These estimates are unlikely to be significantly improved leaving CERES and Argo as the most refined energy observing systems. Nonetheless – this study is a refreshingly new and plausible idea in Earth system science – one that opens up a different perspective – and they get serious scientific points.
The noise around it is simply incredulous hyperbole from the climate tribes as usual – sound and fury signifying nothing.
Robert I. Ellison
If CERES provided robust absolute values for energy going in and out, there would be nothing more to debate – the energy budget would be seen to either track CO2 levels or not.
But since there is still a debate, I’ll take it CERES isn’t up to that vital measurement ?
CERES and SORCE it is. And the mismatch is a little more than 1% – some 4W/m2. But of course the EEI is less than that – somewhere around 0.8 W/m2 in the most recent decade – it is subject to a one off adjustment to close the budget.
The result is most intriguing.
https://watertechbyrie.files.wordpress.com/2018/05/power-flux1.jpg
Power flux imbalances change from negative to positive on an annual basis. The average is 0.8W/m2 – consistent with the rate of ocean warming. Adjusted to be so. The trend over the period of record is negative as the planet tends to maximum entropy. The large swings in imbalances are due to the current orbital eccentricity. Nor is carbon dioxide the major source of change in precisely and stably measured outgoing energy anomalies. There is no substantive ‘debate’.
Robert I. Ellison
Thanks for your comments.
So the earth system is supposedly warming at 0.8 w/m^2. But is that energy budget something that is
– directly measured, in absolute energy units ? or
– something that is merely modelled from relative radiation changes ?
But even if we grant that figure, why do you then go on to say it isn’t consistent with the overall CO2 trend ?
And what exactly do you maintain is there “no substantive debate” about ?
> Power flux imbalances change from negative to positive on an annual basis … The large swings in imbalances are due to the current orbital eccentricity. <
Intriguing indeed. Varying distance from the sun I assume you mean.
And what is the prognosis for our orbit and its eccentricities ?
Trending at rank exploits (the blackboard) and at ATTP. Guess WUWT next.
Reblogged this on Climate Collections.
Bravo, Nic.
Sheesh, Trenberth and others will have to go in search of the missing heat again.
Regards,
Bob
Bob Tisdale *STILL* doesn’t understand what Trenberth meant about the missing heat.
Nic- Can you replicate reported PMEL, MRI, NCEI and CHEN linear trends in Table 1?
Re: “Nic- Can you replicate reported PMEL, MRI, NCEI and CHEN linear trends in Table 1?”
The results for those have been published elsewhere for awhile. For instance:
https://1.bp.blogspot.com/-FIX9S4rp9AM/W9uoeRr9EuI/AAAAAAAABsc/peMoOzCL1p8gydN8qu803ZWwU0jdB5LNwCLcBGAs/s1600/ocean%2Bheat%2Bcontent1.PNG
[Page S76 of “State of the climate in 2017”]
(CHEN is IAP/CAS)
Nic ==> Thank you for the review. The paper and conclusion set off my “multiple errors” alarm, but the analysis was far beyond my abilities.
Besides this, Nic needs to write a letter to Nature if he wants his objection to be considered seriously, where the original authors can reply and the science community can read. Few scientists read blogs.
Looks like you are not being blocked.
“Few scientists read blogs.” I wonder if that includes all the scientists who actualy host blogs. Is that an ‘appell’ to your personal authority, or do you have some published citations?
or do you have some published citations?
Do you? What % of scientists host blogs?
I don’t know how many scientist host blogs, but there obviously are some who work in climate science. But I didn’t make the claim of “few scientists read blogs”, Appell did. He ought to be able to substantiate that claim if he thinks it is true.
David
I agree . if there is a mistake it needs to be pointed out to the journal..
Which raises the interesting question that IF this is a mistake how did it slip through peer review of a publication like Nature??
What criteria is used to thoroughly examine submitted papers and does that vary according to the topic or the author or the journal?
tonyb.
David Appell: Besides this, Nic needs to write a letter to Nature
I agree.
I forgot to write the recommendation when I posted my “thank you” to Nic Lewis.
> Nic needs to write a letter to Nature
Yes now that blogs have highlighted the issue, Nature will find it more difficult to bury / decline it.
“Earth’s oceans have absorbed 60 percent more heat per year than previously thought”
Should this read
“Earth’s oceans have absorbed 60 percent more heat per year than ever detected”?
Figure 1 is amazing. Is it correct that there are only about 25 data points, and that you can see their mistake just by graphing and eyeballing the data? And that it looks like a linear trend doesn’t fit right and the shape is concave, which is even worse for their conclusions? It may be an honest mistake, but it looks inexcusably sloppy, especially when there are 10 authors who presumably have at least read the paper but none of them noticed an obvious major error. Not to mention the referees and editor!
Nic,
“On a corrected basis, I calculate the ΔAPOClimate trend uncertainty as ± 0.56 per meg yr−1,”
I think your approach is overly simplistic here, and doesn’t take account of the Monte Carlo aspect of what they have done. As I read it, the steps are
1. They form, in effect, a statistical model of the data
2. They input this to a million OLS regressions
3. The result trend stated is an average of these, and their σ is deduced from the distribution of results.I think that the σ’s in Table 4 col 3 are also from these million realisations of the stat model.
They are clearly aware of the non-independence of some of the error terms, as mentioned in their methods text. I think the way they have done the Monte Carlo is where there is effective uncertainty weighting. I don’t know if the underlying stat model is a good one, but the key thing will be whether they vary the terms like corrosion independently from year to year.
As John K said, a simple unc-weighted regression gives a much smaller standard error than theirs, but with similar trend. It is possible that their Monte Carlo gives an error that is larger because of correlation, but is more discriminating than your idea of a single regression. Of course, it may also be wrong.
Nick
I had thought that they did what you say. I consider that to be an appropriate method, provided the statistical model used for the data is realistic. It is what I did, initially using, in effect, their statistical model. (I took 200,000 rather than 1,000,000 samples for faster computation.) See my note [xiii]. This method gives a dAPO_Climate trend estimate of 0.88 per meg per year.
However, the wording in their Methods section is not very clear, and I now think it likely that they did something different, as follows:
1. They form, in effect, a statistical model of the data.
2. They sample from it a million times to obtain a million realisations of the dAPO_Climate time series.
3. They compute the standard deviation sd[i] of the million realisations for each year i.
4. They carry out a million weighted least squares (not OLS) regressions, using weights w[i] = 1 / sd[i]^2
5. The result trend stated is the mean of the regression slopes, and their σ is their standard deviation.
6. Alternatively they might have carried out a single weighted least squares regression on the best-estimate dAPO_Climate time series (Col. 2 of their Extended Data Table 4) using the above-mentioned weights. That is what John Kennedy did.
Both variants of this procedure give a slope estimate of 1.16 per meg per year, but the error is much smaller in the second case. Unfortunately neither variant is appropriate, given the nature of the data errors.
I like you think that the σ’s in Table 4 col 3 are also from their million realisations of the stat model.
Interesting though the question is, how Resplandy et al actually derived their estimated trend and uncertainty is not the key issue. Rather, the key issue is how the trend and uncertainty should have been derived, and what their resulting correctly-derived values are. I consider that the approach I used, as set out in the Uncertainty analysis section of my article, is a reasonable method (albeit it could be improved slightly), and that the results of Resplandy’s method – whatever its details – cannot possibly be justified.
My comments are being blocked here. Judith, really?
As I understand it Nature / Resplandy et al. didn’t publish their computer code. I don’t see that Nic Lewis published his either.
Did I miss something here?
Speculating and guessing about errors in other people’s code instead of just inspecting and/or rerunning the code in this day seems strange.
Their paper includes the following
“Code availability. ESM codes are available online for IPSL-CM5A-LR (cmc.ipsl.fr/ipsl-climate-models), GFDL-ESM2M (mdl-mom5.herokuapp.com/web/docs/project/quickstart), UVic (climate.uvic.ca/model) and CESM (www.cesm.ucar.edu/models/).”
and on data
“Data availabilityScripps APO data are available at http://scrippso2.ucsd.edu/apo-data. APOClimate data, contributions to APOOBS and ocean heat content time series are available in Extended Data Figs.1–4 and Extended Data Tables1–5. Model results are available upon reasonable request to R.W. (IPSL anthropogenic aerosol simula-tions), L.B. (IPSL-CM5A-LR), M.C.L. (CESM-LE), J.P.D. (GFDL-ESM2M) or W.K. (UVic).”
Requests for code seem to be a kneejerk response from people who really have no idea what is involved. They didn’t just do a regression; they did a million-member ensemble. They used several GCM’s. So what code do you want?
are people guessing at how they did the regression?
Kevin Trenberth is father to the idea that humanity’s heat is there but it’s hiding from our detection in the deepest of the deep, deep ocean. AGW alarmism is a sort of extended Trenberthian that takes us right up to the edge of the cliff where nothing is left but the simple reality that, we can’t see humanity’s heat amidst all that pesky natural variability.
Broken peer review goes hand in hand with 97% consensus
https://tambonthongchai.com/2018/05/06/consensus-science/
Nic Lewis, thank you for the essay.
Pingback: Alarmist Study On 'Overheated Oceans' Fails Scientific Scrutiny | PSI Intl
A day in moderation and nothing has improved.
https://judithcurry.com/2018/10/27/week-in-review-science-edition-88/#comment-883097
When they say it is at the higher end of warming rate estimates – it is the more credible end.
CERES and Argo data are incontrovertible – the planet is warming at a rate of about 0.8W/m2. Understanding why is the next level.
Quibbling about difference in rates that are within confidence limits is an almighty waste of time.
Pingback: Oops. The oceans are warming, fast! Resplandy et al. shows how peer review can fail, even at Nature | Watts Up With That?
Pingback: Oops. The oceans are warming, fast! Resplandy et al. shows how peer review can fail, even at Nature |
This Matlab code is how I read the methods section. It gives a standard error of 0.21, close to what Resplandy found, but a slope of 0.89:
for i=1:1000000;
%normrnd returns a random drawing from a normal distribution
v1 = normrnd(data(2:26,4),data(2:26,5));
v2 = normrnd(data(2:26,6),data(2:26,7));
v3 = normrnd(data(2:26,8),data(2:26,9));
v4 = normrnd(data(2:26,10),data(2:26,11));
v5 = v1-v2-v3-v4;
%add the zero back in
v5 = [0; v5];
beta = inv(x’*x)*x’*v5; %OLS
t(i) = beta(2);
end
mean(t)
std(t)
This simplest of calculations shows their error that led Nic to dig deeper.
“ΔAPOClimate = 23.20 ± 12.20 per meg” divided over the 26 years under study.
23.2/26 = 0.89.
Significant deviations from that cannot be justified. Minor deviations, yes.
Any other weighting, or extensive statistical processing and/or selection of a base year is subjective without sound first-principle reasoning. As done, it is susceptible to cherry-picking. And importantly, is not fully described (whatever was done) in Methods by the authors. There can be no excuses for this without invoking an intent.
Richard
Thanks for confirming. That is how I also had read the methods section when I wrote my article. As my Uncertainty analysis section and endnote [xx] indicates, I effectively did almost the same as you, and obtained the same trend and trend uncertainty. (I took their dAPO_Climate values and uncertainty values from columns 2 and 3 of their data table, which had already had the subtraction and adding of errors in quadrature performed).
However, as I wrote in my Uncertainty analysis section, this procedure is clearly wrong since it treats errors as being uncorrelated between years, whereas in fact the largest components of the error are perfectly correlated across all years – the same error just scales with time elapsed since 1991. When one allows for this, the mean trend estimate doesn’t change, but its uncertainty becomes much larger.
I reran the code. Larger slopes are associated with lower standard errors on the slope.
If I use the weighted mean of the 1 million slope estimate, rather than the raw mean, it indeed goes up, from 0.8900 to 0.8996.
and if I assume perfect correlation, the weighted trend goes to 0.96 …
Looks like we’ve got as much El Niño as we’re going to get.
http://www.bom.gov.au/climate/enso/#tabs=Outlooks
https://youtu.be/O45Kn6lywVE
“Looks like we’ve got as much El Niño as we’re going to get.”
Your BoM link starts out
“All surveyed models predict the tropical Pacific Ocean will continue to warm in the coming months.”
https://i.imgur.com/y2hadJY.png
https://i.imgur.com/VbDbO92.png
https://i.imgur.com/SKqiNGo.png
“The dependence of the prediction skills of ENSO on its phase is linked to the variation of signal-to-noise ratio (SNR). This variation is found to be mainly due to the changes in the amplitude of the signal (prediction of ensemble mean) during different phases of the ENSO cycle, as the noise (forecast spread among the ensemble members), both in the Niño3.4 region and the whole Pacific, does not depend much on the Niño3.4 amplitude. It is also shown that the spatial pattern of unpredictable noise in the Pacific is similar to the predictable signal. These results imply that skillful prediction of the ENSO cycle, either at the initial time of an event or during the transition phase of the ENSO cycle, when the anomaly signal is weak and the SNR is small, is an inherent challenge.” https://journals.ametsoc.org/doi/abs/10.1175/JCLI-D-18-0285.1
A sophisticated understanding of the limitations of models – and of the system dynamics – is possible – then there is a naive waving them about like magic talisman.
https://www.ospo.noaa.gov/data/sst/anomaly/2018/anomnight.11.5.2018.gif
Pingback: Major Math Error Puts Widely-Cited Global Warming Study On Ice – students loan
Pingback: Major Math Error Puts Widely-Cited Global Warming Study On Ice – iftttwall
Pingback: Major Math Error Puts Widely-Cited Global Warming Study On Ice | Newzsentinel
Pingback: Major Math Error Puts Widely-Cited Global Warming Study On Ice | peoples trust toronto
Pingback: Major Math Error Puts Widely-Cited Global Warming Study On Ice | StockTalk Journal
Pingback: Major Math Error Puts Widely-Cited Global Warming Study On Ice - open mind news
Pingback: Major Math Error Puts Widely-Cited Global Warming Study On Ice | Real Patriot News
Pingback: Major Math Error Puts Widely-Cited Global Warming Study On Ice – TCNN: The Constitutional News Network
Someone first has to ask “How Does CO2 and LWIR between 13 and 18 microns warm the oceans?” That is the first basic question that has to be asked. Everything has to tie back to CO2’s contribution. CO2’s only contribution is through the radiation or thermalization of 13 to 18 micron LWIR. That is the only mechanism defined by which CO2 can affect climate change.
You can test in a lab if 13 to 18 micron LWIR will warm water. It won’t, in fact, Ice emits shorter wavelength IR than CO2 emits. 0.00 Degree C Ice emits 10.5 micron LWIR.
http://www.spectralcalc.com/blackbody_calculator/blackbody.php
The oceans are warmed by shortwave/high energy visible blue light, not LWIR. CO2 is transparent to visible radiation. The warming oceans are the greatest evidence that CO2 is not the cause of global warming. What is warming the oceans is also warming the atmosphere above it.
To warm the oceans you need either 1) a hotter sun 2) fewer clouds or 3) both. That is in fact exactly what has happened during the recent warming period.
The Millennial Turning Point – Solar Activity and the Coming Cooling
https://wattsupwiththat.com/2018/11/02/the-millennial-turning-point-solar-activity-and-the-coming-cooling/
https://1.bp.blogspot.com/-8lZ4DCHLT00/W9y9yozeuFI/AAAAAAAAArk/OY8SjWNg4R8DxBeAqoElxF1QbTuJJO3KACLcBGAs/s1600/Tropical%2Bcoud%2Bcover.jpg
Real Climate Science is Finally Figuring Things Out; Its the Sun Stupid
https://co2islife.wordpress.com/2018/11/04/real-climate-science-is-finally-figuring-things-out-its-the-sun-stupid/
I also downloaded the data. Sure enough, the slope is 0.88 as indicated by Mr. Lewis. (I used Python).
You don’t need to be a climate scientist to run a linear regression.
“You don’t need to be a climate scientist to run a linear regression.”
But it helps to be able to read. They didn’t do just a linear regression.
Pingback: Major Math Error Puts Widely-Cited Global Warming Study On Ice – Forex news forex trade
Pingback: Major Math Error Puts Widely-Cited Global Warming Study On Ice – secretsforex.com
Pingback: Major Math Error Puts Widely-Cited Global Warming Study On Ice - forex analytics Forex Factory provides information to professional forex traders; lightning-fast forex news; bottomless forex forum; famously-reliable forex calendar; aggregate ...
Pingback: 1 – A major problem with the Resplandy et al. ocean heat uptake paper | Traffic.Ventures Social
Pingback: Major Math Error Puts Widely-Cited Global Warming Study On Ice – Binarybrokersblog.com – binary options trade forex
Pingback: Major Math Error Puts Widely-Cited Global Warming Study On Ice – forex-4you.com, الفوركس بالنسبة لك
Pingback: Major Math Error Puts Widely-Cited Global Warming Study On Ice - pustakaforex.com
Pingback: Major Math Error Puts Widely-Cited Global Warming Study On Ice - aroundworld24.com
Pingback: Major Math Error Puts Widely-Cited Global Warming Study On Ice - entertainment-ask.com
Pingback: Major Math Error Puts Widely-Cited Global Warming Study On Ice – top10brokersbinaryoptions.com
Pingback: Major Math Error Puts Widely-Cited Global Warming Study On Ice - megaprojectfx-forex.com
Pingback: Les Principaux Erreur De Math Met Largement Cité Réchauffement Climatique Étude Sur La Glace – forex-enligne-fr.com
Pingback: Major Math Error Puts Widely-Cited Global Warming Study On Ice – forexreadymax.info
Pingback: Major Math Error Puts Widely-Cited Global Warming Study On Ice – Forex news – Binary options
Pingback: Major Math Error Puts Widely-Cited Global Warming Study On Ice - forexdemoaccountfree.com
Pingback: Major Math Error Puts Widely-Cited Global Warming Study On Ice – fastforexprofit.com, الفوركس بالنسبة لك
Pingback: Major Math Error Puts Widely-Cited Global Warming Study On Ice – 4-forex.info
Pingback: Major Math Error Puts Widely-Cited Global Warming Study On Ice « Socio-Economics History Blog
What I take from this is that the raw data in Figure 1 supports Argo very well even to the apparent break in the gradient around 2005.
https://upload.wikimedia.org/wikipedia/commons/thumb/5/5c/Ocean_Heat_Content_%282012%29.png/320px-Ocean_Heat_Content_%282012%29.png
If you do the conversion this line would agree with the black line in Figure 1, both averaging 10 ZJ/yr for 1991-2016.
The controversy is about the red line fit, not the raw annual data. I regard Argo as a more direct measure anyway, with perhaps more uncertainty in the early years, so here is an independent dataset that also supports those early years. Useful plot to have in addition to Argo.
While the average monthly power flux imbalance over CERES is 0.8 – it is trending to zero as the planet tends to maximum entropy.
https://watertechbyrie.files.wordpress.com/2018/05/power-flux1.jpg
You can see from Argo that the imbalance is robustly positive on decadal scales. The gradient in the last 10 years is the same as the previous 10, and Argo is better for the imbalance than CERES.
You can see from CERES that it is positive all century thus far. #jiminy doesn’t like CERES because he doesn’t want to know why. But here I will cite Mark Twain again.
Oh – and consistent with Argo.
They use Argo to anchor CERES because of sensor drifts.
https://link.springer.com/article/10.1007/s40641-016-0053-7
It is called calibration – standard for instruments of all kinds. It is needed not for drift – that can be compensated for and the satellites these days are made to be as stable as humanly possible – but because there is no known absolute value of power flux with which to compare the instrument reading. Once it is calibrated you can go on your merry way.
And I answer only because #jiminy’s cites are as rare as hen’s teeth. I like to encourage him.
It is “calibrated” over the whole period, which I call correction not calibration.
So it is designed to be consistent with Argo and provides information on TSI in and SW and IR out giving imbalances directly?
That’s what they say. Drifts of comparable magnitude prevent using them for long-term averages. A common satellite problem. They need a ground truth to anchor them.
Wow – it is of course a whole lot more complex. It is about multiple – redundant – satellites including Terra and Aqua for CERES. It is about cross validation over many platforms.
Yet, when in situ data is also available why not use it too? And they do. They’re not fools.
Eh – https://www.researchgate.net/publication/258792863_Overview_of_Intercalibration_of_Satellite_Instruments
Yes I know that they are not…
Lots of messing about needed there.
The Argo Marine Atlas embeds the Roemmich-Gilson Argo climatology
http://sio-argo.ucsd.edu/RG_Climatology.html
There are a few climatologies last time I checked – all different.
Which is why independent verification from the Resplandy paper is so useful especially for the pre-2000 period where some skeptics don’t like the Argo warming so much.
I am tempted to just write Mark Twain – rather than say that Argo commenced in 2004 with about a 1000 floats and what seems a bit of a glitch. XBT coverage doesn’t come close to that coverage. And I have given the 1990’s Josh Willis data many times.
https://watertechbyrie.files.wordpress.com/2014/12/wong2006figure7-e1520585725503.png
Any anthropogenic signal there is lost in the ‘noise’ of low frequency climate variability.
And despite Resplandy et al being a fun idea with promise – well yes – that’s what it is – a fun idea with promise. Stop sucking the life out of science to buttress your silly, superficial partisan rhetoric.
You point to stuff from the distant past. We now know better than that. Keep up.
Mark Twain.
1835-1910
Mark Twain is of course code for not arguing further.
Pingback: Major Math Error Puts Widely-Cited Global Warming Study On Ice – customchakra.com
Pingback: Major Math Error Puts Widely-Cited Global Warming Study On Ice – comparforex.com
Pingback: Major Math Error Puts Widely-Cited Global Warming Study On Ice – stocksoptionsandforex.com
Pingback: Major Math Error Puts Widely-Cited Global Warming Study On Ice – forex analytics forexpic.com
Pingback: Math Error Puts Widely Cited Global Warming Study On Ice | Thought Crime Radio
CERES edition 4.0 data is beautiful. Errors are a fraction of a percent – and the instruments are relentlessly stable.
https://journals.ametsoc.org/doi/full/10.1175/JCLI-D-17-0208.1
#jiminy is one will will reject science – bizarrely without reading it and on the basis solely of what is happening in his head at the time – and then claim that it validates the warmer members of a CMIP opportunistic ensemble.
“In sum, a strategy must recognise what is possible. In climate research and modelling, we should recognise that we are dealing with a coupled non-linear chaotic system, and therefore that the long-term prediction of future climate states is not possible. The most we can expect to achieve is the prediction of the probability distribution of the system�s future possible states by the generation of (perturbed physics ensembles of model solutions. This reduces climate change to the discernment of significant differences in the statistics of such ensembles. The generation of such model ensembles will require the dedication of greatly increased computer resources and the application of new methods of model diagnosis. Addressing adequately the statistical nature of climate is computationally intensive, but such statistical information is essential.” IPCC as long ago as 2001.
I am inclined to think that nothing can validate opportunistic ensembles.
“A one-time adjustment to shortwave (SW) and longwave (LW) TOA fluxes is made to ensure that global mean net TOA flux for July 2005–June 2015 is consistent with the in situ value of 0.71 W m−2”.
In situ – that’s Argo. One-time adjustment assumes a linear drift. Maybe it is, maybe it isn’t. Maybe they don’t know so they do what they can. However it tells you this is not an independent measure of the OHC.
Ah – bold is mine. And Mark Twain.
Pingback: Major Math Error Puts Widely-Cited Global Warming Study On Ice – mudahnyaforex.com
Pingback: Major Math Error Puts Global Warming Study On Ice | PSI Intl
Reblogged this on Quaerere Propter Vērum.
Pingback: Quality Control Sorely Needed In Climate Science: Half Of Peer-Reviewed Results Non-Replicable, Flawed.
“The press release [v] accompanying the Resplandy et al. paper was entitled “Earth’s oceans have absorbed 60 percent more heat per year than previously thought”,[vi] and said that this suggested that Earth is more sensitive to fossil-fuel emissions than previously thought.”
Declining solar wind temperature/pressure since the mid 1990’s, driving a warm AMO phase via the NAO, driving a decline in cloud cover. It’s a negative feedback.
https://www.nodc.noaa.gov/OC5/3M_HEAT_CONTENT/meantemp_0-2000m.png
So – another WP glitch?
seems to be, hope it goes away soon
yes – me too 😊
Reblogged this on 4TimesAYear's Blog.
Pingback: At the Fall Snow Café... | Top 10
I think the interesting question here is what would have happened to the paper if the results, as Lewis describes them, had been described by the authors themselves? I suspect they wouldn’t have tried to publish it, or, if they had, Nature and the referees would have declined it. Does anyone really doubt this?
One should focus on the facts. In the main post Nic rolled out a “major problem” in the methods which questions the basic findings in the Resplandy et al. (2018) paper. Only a hasty look at fig.3 of the paper shows, that an inceasing of APOclimate of more than 1 per meg/year is very unlikely for the time span of 25 years after 1991:
https://i.imgur.com/sqoGoxw.jpg
A more stringent peer review should have steped in to avoid further confusion.
On the other hand it was also mentioned by Nic:
“Moreover, even if the paper’s results had been correct, they would not have justified its findings regarding an increase to 2.0°C in the lower bound of the equilibrium climate sensitivity range and a 25% reduction in the carbon budget for 2°C global warming.
The conclusions ot the paper are not justified at all by the results of the paper. This was shown by other scientists, e.g. Thomas Stocker, James Annen too.
Both findings are reasons enough that this paper ( as we find it at the time in “Nature”) should have never been released. IMO this should also lead to some questions relating the processes in the editors policy of the journal.
Was really disappointed in how Curry advertised this blogpost as “Nature strikes out again”. If she really thinks that, PNAS (which is about a high-tier a journal as Nature) also struck out when it published error-containing research Curry co-authored. The double-standard in Curry’s position is amazing.
As I said before, if Lewis analysis is correct, then I congratulate him on catching that error, because I didn’t. He can feel free to submit his post as a comment or a response, so that it can undergo peer review. But this doesn’t reveal some deep unreliability in Nature, unless people also accept that Curry’s past mistakes mean she’s unreliable. And I doubt people would be willing to accept that.
https://twitter.com/AtomsksSanakan/status/1061068408631054337
Seriously, Atomsk? You’re comparing the actual error in the Nature paper (if Nic is correct, which he appears to be given that the authors agreed with him that the uncertainty was too small) with Dr. Curry’s error, which was:
“The authors note that the legends for Figs. 1, 2, and 3 appeared incorrectly.”
Other than the fact that this is a totally trivial error, it’s not even clear who made it, Dr. Curry or the Journal. Nor does it matter. It’s as important as a typo, which is to say, not at all. Unlike the error Nic found, it doesn’t change any of her claims or conclusions in the slightest.
How petty can you get? Sheesh …
w.
Re: ““The authors note that the legends for Figs. 1, 2, and 3 appeared incorrectly.”
Other than the fact that this is a totally trivial error, it’s not even clear who made it, Dr. Curry or the Journal. Nor does it matter. It’s as important as a typo, which is to say, not at all. Unlike the error Nic found, it doesn’t change any of her claims or conclusions in the slightest.
How petty can you get? Sheesh”
JC SNIP: This is irrelevant. The lead author on this paper was my postdoc. He corrected a minor error in the journal.
Re: “Other than the fact that this is a totally trivial error, it’s not even clear who made it, Dr. Curry or the Journal. Nor does it matter. It’s as important as a typo, which is to say, not at all. Unlike the error Nic found, it doesn’t change any of her claims or conclusions in the slightest.
How petty can you get? Sheesh …”
JC SNIP: this is a guest post and technical thread. Your specious criticisms about things that I have previously written that are irrelevant to this thread are worse than irrelevant.
Atomsk’s Sanakan (@AtomsksSanakan) | November 9, 2018 at 10:59 pm |
Not true at all. If the error required her to retract even one of her claims, it would have had to be mentioned in the correction.
It was not. Not one of her ideas, claims, or conclusions were required to be changed, corrected, or retracted based on the error in the legends.
Ergo, unlike the problem that Nic identified, it was a trivial error, not something that affected her scientific claims.
But you knew that …
w.
Re: “If the error required her to retract even one of her claims, it would have had to be mentioned in the correction”
Please read more closely, Willis. I didn’t say anything about retracting her claims. I said it would be difficult to use the uncorrected figures alone to support informed acceptance of the conclusions, because the uncorrected figures are difficult to interpret. That’s why the figure legends needed to be corrected.
Re: “Ergo, unlike the problem that Nic identified, it was a trivial error, not something that affected her scientific claims. But you knew that …”
And you failed to meet my challenge, as expected, because you made your claims without knowing what the actual error in the figure legends was. This is why you’ve been warned before to actually read scientific sources before you comment on them, instead of relying on press pieces or your gut feeling:
https://tamino.wordpress.com/2017/07/22/does-willis-eschenbach-have-any-honor/
So, once again:
Tell me what the error was in the legends. Or in other words: tell me how the figure changed between before the correction and after the correction.
I’ll give you more time to answer, since I need to step away for awhile anyway.
You are comparing a blueberry to a grapefruit and claiming they are the same because both are roughly spherical. The central claims of the paper appear to be just wrong, and the stated uncertainty clearly so. That is bad for any journal….. even Nature. The question people should be asking is how the review process failed in this case, and how it could be improved. My guess is that had Nic been a reviewer the paper would not have been published in the form it was. Maybe that points toward how reviewers of ‘groundbreaking’ papers should be selected.
There should be massive opportunities for future generations for case studies of how well reviewers were prepared academically to fully grasp the methods and approaches that were “novel” or untried. But, if interviewed, I wonder how many would be candid and say “ I had no idea what they were doing” just out of embarrassment of such an admission.
To be around in 2050 for such a retrospective. And not just this issue but being able to analyze the entire decision making process of the establishment for the preceding 70 years. Oy!!!
Re: “You are comparing a blueberry to a grapefruit and claiming they are the same because both are roughly spherical. The central claims of the paper appear to be just wrong, and the stated uncertainty clearly so”
The central claim of the paper was using a novel, proxy-based method to show that ocean heat content increased. That central claim is true. At best, Lewis showed the OHC increased was over-estimated and the uncertainty under-estimated. And people are now disputing his claim on that, which is why I recommended he submit it for peer review.
Re: “That is bad for any journal….. even Nature.”
We’ve been over this:
https://judithcurry.com/2018/11/06/a-major-problem-with-the-resplandy-et-al-ocean-heat-uptake-paper/#comment-882996
Once again:
This isn’t a black eye for Nature, unless you want to claim that the journals that published Spencer and Christy’s debunked UAH work, are also garbage. And note that in those cases, unlike this case, the central claim was wrong. Spencer and Christy’s central claim was that satellite-based MSU analysis did not show tropospheric warming. They were wrong.
Re: “The question people should be asking is how the review process failed in this case, and how it could be improved.”
People have been asking how to peer review can be improved since before you or I were born. This blogpost offers nothing novel for that discussion.
Atomsk’s Sanakan,
“The central claim of the paper was using a novel, proxy-based method to show that ocean heat content increased. That central claim is true.”
Please. The central claim of the published paper, and the one that was blared across every publication from Scientific American to the NY Times, is that the new method indicates with *high confidence* that actual warming of the oceans is ~60% greater than earlier temperature based estimates. The paper goes on to say that the new analysis is directly policy relevant: the lower limit for EBM estimates of ECS should be increased to 2.0 per doubling and cumulative fossil fuel use needs to be 25% lower to limit warming to 2C above pre-industrial.
All that was simply wrong.
The central estimate for the corrected analysis (http://www.realclimate.org/images//resplandy_new_fig1.png) is only as high as it is because the authors simultaneously changed another part of their original calculation: the “oxidative ratio (OR) of land carbon” was 1.1 in the original paper, but in the revised calculation this was reduced to 1.05. This change had the effect of increasing the estimate of the trend by 0.15, yielding a net of 1.05 ± 0.62 per meg/yr. Absent the change in oxidative ratio, the revised calculations would have produced a trend of 0.90, very close to what Nic suggested (0.88), and a central estimate of ocean warming BELOW earlier estimates. I take the authors at their word that the value of 1.05 for oxidative ratio on land is “more appropriate” in the calculations. Some may think that change was made mostly to “save” central estimate from the paper. But in any case, the now extremely broad uncertainty makes the results overlap the entire uncertainty ranges of earlier temperature based estimates….. the new study in fact can’t say much of anything about the rate of ocean warming, only that it is warming (but we knew that already). Earlier studies clearly provide better estimates of ocean warming.
I am sure you will continue to say the errors in the paper in no way reduced its “scientific importance”. You will continue to be mistaken about that.
Steve, The authors can’t have it both ways. If 1.05 Is a more appropriate value for OR why did they use 1.1 in the original paper? The circumstantial evidence is that they used this parameter to get the result to be more credible.
Pingback: Oops. The oceans are warming, quick! Resplandy et al. paper reveals how peer evaluation can fail, even at Nature | Tech News
I am not sure that the ‘error’ has been demonstrated even close to conclusively or that it not utterly trivial as well. We shall see. On the other hand the personal, the politics, the motivated sociology, the self lauding verbosity and the prominence of trifling debating points from #atomski is most certainly inconsequential.
You comment much too much and spout a huge amount of nonsense. Do everyone a favor and put a cork in it.
I make one or two comments a day – instead of a morning paper with my coffee. And respond to people as they respond. And this sort of nonsense from you is contrary to blog rules – so unless you have something interesting to say… and that would be novel for you.
Pingback: Oceani, ritrovato il calore mancante? : Attività Solare ( Solar Activity )
I have been wondering about the connection between O2 depletion, N2 and CO2 increase. I found some interesting stuff.
“While no danger exists that our O2 reserve will be depleted, nevertheless the O2 content of our atmosphere is slowly declining–so slowly that a sufficiently accurate technique to measure this change wasn’t developed until the late 1980s. Ralph Keeling, its developer, showed that between 1989 and 1994 the O2 content of the atmosphere decreased at an average annual rate of 2 parts per million. Considering that the atmosphere contains 210,000 parts per million, one can see why this measurement proved so difficult.
This drop was not unexpected, for the combustion of fossil fuels destroys O2. For each 100 atoms of fossil-fuel carbon burned, about 140 molecules of O2 are consumed. The surprise came when Keeling’s measurements showed that the rate of decline of O2 was only about two-thirds of that attributable to fossil-fuel combustion during this period. Only one explanation can be given for this observation: Losses of biomass through deforestation must have been outweighed by a fattening of biomass elsewhere, termed global “greening” by geochemists. Although the details as to just how and where remain obscure, the buildup of extra CO2 in our atmosphere and of extra fixed nitrogen in our soils probably allows plants to grow a bit faster than before, leading to a greater storage of carbon in tree wood and soil humus. For each atom of extra carbon stored in this way, roughly one molecule of extra oxygen accumulates in the atmosphere.
At first glance, this finding appeared to be good news to those worried about the climatic effects of the ongoing buildup of anthropogenic CO2 in the atmosphere, for it suggested that during this five-year period an amount of carbon equal to one-third of that burned for energy production had taken up residence in the biosphere. As another third was taken up by the ocean, this meant that between 1989 and 1994 only one-third of the CO2 we produced by burning fossil fuels accumulated in the atmosphere. However, this enormous biospheric storage is likely an anomaly reflecting an unusual climate, perhaps related to persistent El Niño conditions or emissions by the volcano Pinatubo. A burst of plant growth during this period allowed carbon storage to exceed respiratory losses temporarily, but once climate conditions return to normal the products of this burst will be eaten up, releasing this carbon stored in organic matter back into the atmosphere as CO2 gas. Thus, we can’t use Keeling’s observation as evidence that the biosphere will serve as a major sink for the CO2 we generate. But through Keeling’s O2 measurements we now have a reliable means to monitor the ongoing changes in global biomass. Eventually his record will allow us to diagnose the response of the Earth’s biomass to changing climate and nutrient availability.” by Wallace S.Broecker http://www.columbia.edu/cu/21stC/issue-2.1/broecker.htm#footnotes
I think it questions the methodology of using CO2 level and O2/N2 ratio as an exact thermometer.
The greater issue that the likes of Atomski don’t confront, is : How much can the consensus and its peer-review be trusted ? Have they really ceased practicing the advocacy science so clearly revealed by their whitewashing of the Climategate, are have they just got better at it ?
No scientists read blogs, someone above said. Well, blogs are how peer-review itself can now be reviewed and kept honest. Without blogs, would a paper with the above content this have any chance of seeing the light of day ? Would Resplendy et al have deigned to respond ? Or would the gatekeepers of Mannian “redefined” peer-review have buried it ?
I’ll plow this plowed ground and beat this dead horse yet some more. Maybe somebody will step up and ‘splain scientifically how/why I’ve got it wrong – or not.
Radiative Green House Effect theory (TFK_bams09):
1) 288 K – 255 K = 33 C warmer with atmosphere, RGHE’s only reason to even exist – rubbish. (simple observation & Nikolov & Kramm)
But how, exactly is that supposed to work?
2) There is a 333 W/m^2 up/down/”back” energy loop consisting of the 0.04% GHG’s that absorbs/”traps”/re-emits per QED simultaneously warming BOTH the atmosphere and the surface. – Good trick, too bad it’s not real, thermodynamic nonsense.
And where does this magical GHG energy loop first get that energy?
3) From the 16 C/289 K/396 W/m^2 S-B 1.0 ε ideal theoretical BB radiation upwelling from the surface. – which due to the non-radiative heat transfer participation of the atmospheric molecules is simply not possible.
No BB upwelling & no GHG energy loop & no 33 C warmer means no RGHE theory & no CO2 warming & no man caused climate change.
Got science? Bring it!!
Nick Schroeder, BSME CU ‘78, CO PE 22774
Experiments in the classical style:
https://principia-scientific.org/debunking-the-greenhouse-gas-theory-with-a-boiling-water-pot/
Pingback: Bits and Pieces – 20181111, Sunday | thePOOG
Pingback: Half Of Climate Science Results Non-Replicable, Flawed | PSI Intl
Pingback: Scientists acknowledge key errors in study of how fast the oceans are warming – Worldw1de.com
Pingback: Scientists acknowledge key errors in study of how fast the oceans are warming | Everyday News Update
Pingback: Scientists acknowledge key errors in study of how fast the oceans are warming – 365NewsToday
Pingback: Scientists Acknowledge Key Errors In Study Of How Fast The Oceans Are Warming - The Global Warming Policy Forum (GWPF)The Global Warming Policy Forum (GWPF)
Pingback: Resulta que los océanos NO se están calentando más rápido; era un error, y sólo los “negacionistas” lo han visto | PlazaMoyua.com
Gotta love the power of Dr. Judith’s blog, as well as the change in where the scientific discussion is occurring.
People have been ragging on Nic, telling him that he had to publish his results in the journals or write a letter to the journal in question.
However, I note that the authors have now made a correction to their article, based solely on Nic publishing his results here.
Congratulations to Nic and Dr. Judith, well done both!
w.
http://www.365newstoday.com/2018/11/14/scientists-acknowledge-key-errors-in-study-of-how-fast-the-oceans-are-warming/
https://www.sandiegouniontribune.com/news/environment/sd-me-climate-study-error-20181113-story.html
Keeling et al. have even acknowledged it at RealClimate
Resplandy et al. correction and response
http://www.realclimate.org/index.php/archives/2018/11/resplandy-et-al-correction-and-response/
(Wonder when they will have the courtesy/courage to post at Climate Etc?)
Nah.
Submitted Lewis’ titles and links to RealClimate. Will they post?
Maybe, maybe not. But it doesn’t matter, the obvious errors have been corrected. The claims of have to reduce cumulative emissions by 25% don’t now seem supportable, but Keeling didn’t address that in his post at RealClimate.
But it DOES matter. The scientific world and the public need to study ALL of Nic’s arguments and ALL the errors he found in Keeling, learn from them, and build on them. Not just an indirect reference that he identified one smaller problem. Study in how Richard Feynman (1974) identified the problem of researcher Young systematically studying and successfully identifying ALL the significant problems in his rat maze study – BUT then to have the rest of that branch of science (psychology via rat mazes) ignore his discoveries – and continue to publish irreproducible results! Cargo Cult Science http://calteches.library.caltech.edu/51/2/CargoCult.htm
Pingback: Worse than we thought, the sequel – My CMS
Willis as the climate grows colder due to weakening magnetic fields I wonder when you will admit to being wrong on your climatic theories which do not and have not held up when viewed against the historical climatic record.
I am more confident then ever that those of us who agree solar is the main driving climatic force will be proven right over the next few years.
Thank you for the reference Willis.
What is the meaning with “saving one`s ass”?
Here is a good example:
“It isn’t clear whether the authors agree with all of Lewis’s criticisms, but Keeling said “we agree there were problems along the lines he identified.”
Paul Durack, a research scientist at the Lawrence Livermore National Laboratory in California, said promptly acknowledging the errors in the study “is the right approach in the interests of transparency.”
But he added in an email, “This study, although there are additional questions that are arising now, confirms the long known result that the oceans have been warming over the observed record, and the rate of warming has been increasing,” he said.
Gavin Schmidt, head of the NASA Goddard Institute for Space Studies, followed the growing debate over the study closely on Twitter and said that measurements about the uptake of heat in the oceans have been bedeviled with data problems for some time — and that debuting new research in this area is hard.
“Obviously you rely on your co-authors and the reviewers to catch most problems, but things still sometimes slip through,” Schmidt wrote in an email.
Schmidt and Keeling agreed that other studies also support a higher level of ocean heat content than the Intergovernmental Panel on Climate Change, or IPCC, saw in a landmark 2013 report.
Overall, Schmidt said, the episode can be seen as a positive one.
“The key is not whether mistakes are made, but how they are dealt with — and the response from Laure and Ralph here is exemplary. No panic, but a careful reexamination of their working — despite a somewhat hostile environment,” he wrote.
“So, plus one for some post-publication review, and plus one to the authors for reexamining the whole calculation in a constructive way. We will all end up wiser.””
At least they are trying hard.
Pingback: Climate contrarian uncovers scientific error, upends major ocean warming study | Headline of the Day
Pingback: Réchauffement des océans : des chercheurs ont commis des erreurs – Technologie Média
Resplandy et al. correction and response
14 November 2018
Guest commentary from Ralph Keeling (UCSD)
http://www.realclimate.org/index.php/archives/2018/11/resplandy-et-al-correction-and-response/
Pingback: Climate scientist offers stunning response to ‘mistakes’ in major study on accelerated ocean warming – Liberty Redux
Pingback: We’re Waiting for Media’s Corrections on Ocean Warming
Pingback: The Oceans Are Boiling! Oh, Wait—Never Mind | TrumpsMinutemen
Pingback: JustOneMinute: The Science Was Unsettled | Top 10
Missed it earlier, but this is quite a comment earlier from Don132:
“Hughes blamed 2016 GBR coral bleaching on global warming and Jim Steele, and then later Wolanski in a published paper, showed that bleaching was due to lowered sea levels from El Nino and natural current mechanics. Did Hughes admit any error?”
It’s important to try to stay in reality. Nic’s (laudable) finding of the error here does not retroactively endorse or prove every flight of fancy questioning a mainstream paper that has been posted on a contrarian blog (and we all know there are many).
No, Hughes didn’t admit an error. Mass coral bleaching is the result of elevated ocean temperatures, of course. Steele’s article about sea level didn’t “show” anything, it offered an alternative hypothesis free of supporting evidence (and wildly physically implausible – coral bleached to depth of 40m, unlikely to have been affected by ~10cm sea level changes).
Wolanski’s paper is about the local weather mechanics of why elevated water temperatures persisted, it does not reject the Hughes premise that bleaching is due to water temperature.
Think critically and skeptically – *especially* of things you want to believe.
Why did corals survive when tropical sea temperatures were up to 15 C warmer than now?
Better to talk to an expert about a specific epoch. The most obvious reasons:
* shorter term adaptation – under the more gradual rates of change that appear more normal in the geologic record, reef locations can more easily shift over time (see last glaciation sea level changes – the current Great Barrier Reef is only ~20K years old)
* longer term adaptation/evolution. Reefs receding or disappearing for a time and coming back thousands of years later under better conditions, or with different groupings of coral species, is a blink in geologic time. But it’s not a blink in the timeframe of human civilization and economies.
In general adaptation and evolution aren’t magic – they happen over longer periods of time. This is the crux of the entire “abrupt climate change disrupts ecosystems” discussion.
Importantly, it is just an error in reasoning to think this sort of observation (corals have been around for awhile) contradicts the directly observed mass coral mortality we’re seeing in the real world. This is basically rejecting observations in favor of theory. Any implied theory of coral super-resilience has been falsified by observations in nature…
Geoffmprice,
Flora and fauna adapt rapidly to climate changes. Species that were struggling at one temperature thrive at the warmer temperature, while others are disadvantaged. Some die out. Species move rapidly to new habitats on ocean currents and wind.
In which case it began at the LGM, when sea temperatures were some 5C coldest than and yet it is still thriving. Coral reefs in much warmer temperatures that the GBR are also thriving. Coral atols have grown up 140 m as temperatures rise from the LGM and sea levels rose.
There is ample evidence that life thrives as temperatures warm up from the severe coldhouse conditions Earth is presently in. And ample evidence that life thrives much better than now at substantially warmer temperatures.
Pingback: Climate Scientists Discover Error in Major Ocean-Warming Study By Jack Crowe | RUTHFULLY YOURS
Pingback: The Oceans Are Boiling! Oh, Wait—Never Mind – The Coach's Team
Pingback: Off the Cuff #36: Worldview bias in Academics, Theology and Discipleship | More Than Cake
Pingback: The Oceans Are Boiling! Oh, Wait—Never Mind - NoPaperNews
Pingback: Researchers walk back major ocean warming result | Everyday News Update
Pingback: 14 November 2018 | World Politics News
Pingback: Local weather Researchers Acknowledge To Main Math Mistake Immediately after World-wide Warming Research Debunked – Viralmount
Pingback: Climate Scientists Admit To Major Math Error After Global Warming Study Debunked | peoples trust toronto
Pingback: Climate Scientists Admit To Major Math Error After Global Warming Study Debunked | SPLIT INSTITUTE
Pingback: Climate Scientists Admit To Major Math Error After Global Warming Study Debunked - Get the latest financial news. Free real time quotes, 25 Trading Tools, Technical analysis, and much more.
Pingback: Climate Scientists Admit To Major Math Error After Global Warming Study Debunked – iftttwall
Pingback: Climate Scientists Admit To Major Math Error After Global Warming Study Debunked - Financial News & Business News
Pingback: Climate Scientists Admit To Major Math Error After Global Warming Study Debunked – The Deplorable Patriots
Pingback: Climate Scientists Admit To Major Math Error After Global Warming Study Debunked – TradingCheatSheet
Pingback: Climate Scientists Admit To Major Math Error After Global Warming Study Debunked | Newzsentinel
Pingback: Climate Scientists Admit To Major Math Error After Global Warming Study Debunked | StockTalk Journal
Pingback: Climate Scientists Admit To Major Math Error After Global Warming Study Debunked - Novus Vero
Pingback: New Findings Cast Doubt on Claim That Oceans Have Warmed 60% More Than Scientists Thought | SoftLabPro
Pingback: Climate Scientists Admit To Major Math Error After Global Warming Study Debunked | ValuBit
Pingback: Climate Scientists Admit To Major Math Error After Global Warming Study Debunked - InternetticA
Pingback: Climate Scientists Admit To Major Math Error After Global Warming Study Debunked | Real Patriot News
Pingback: Climate Scientists Admit To Major Math Error After Global Warming Study Debunked - noticiasp
Pingback: Scientists Just Found Errors in a Huge Climate Study That Made Headlines Two Weeks Ago – Techsemut English
Pingback: Climate Scientists Admit To Major Math Error After Global Warming Study Debunked | SOUL POSITION
Pingback: Scientists Just Found Errors in a Huge Climate Study That Made Headlines Two Weeks Ago - Science News Hub
Pingback: Scientists Just Found Errors in a Huge Climate Study That Made Headlines Two Weeks Ago - Science Finest
Pingback: Scientists just found errors in a huge climate study that made headlines two weeks ago - Science Daily Press
Pingback: High-profile ocean warming paper to get a correction – News Online
Pingback: High-profile ocean warming paper to get a correction – Time Traveller Wiki
Pingback: The Oceans Are Boiling! Oh, Wait—Never Mind • Just Conservative Views
Pingback: IFFY SCIENCE | J F Beck
Pingback: Climate Scientists Admit to Major Math Error After Global Warming Study Debunked « Financial Survival Network
Pingback: ‘Alarming’ Study Claiming Global Warming Heating Up Oceans Based on Math Error - Novus Vero
Pingback: ‘Alarming’ Study Claiming Global Warming Heating Up Oceans Based on Math Error - Daily Callout
Pingback: ‘Alarming’ Study Claiming Global Warming Heating Up Oceans Based on Math Error | Real Patriot News
Pingback: Climate Scientists Admit To Major Math Error After Global Warming Study Debunked « Socio-Economics History Blog
Pingback: Climate Scientists Admit To Major Math Error After Global Warming Study Debunked | COLBY NEWS
Pingback: Climate Scientists Admit To Major Math Error After Global Warming Study Debunked – TCNN: The Constitutional News Network
Pingback: Never been sure how these folks call themselves scientists. | The Brains You Were Born WIth
Pingback: Climate Scientists Admit To Major Math Error After Global Warming Study Debunked – Conspiracy News
Pingback: ‘Alarming’ Study Claiming Global Warming Heating Up Oceans Based on Math Error • Just Conservative Views
Pingback: A major problem with the Resplandy et al. ocean heat uptake paper – Weather News Blog
Pingback: Climate Scientists Admit To Major Math Error After Global Warming Study Debunked
Pingback: Неопределённость математического обоснования «глобального потепления» от 10% до 70% — Вокруг Света
Pingback: Ученые признали ошибку в исследовании глобального потепления | Финансы и экономика
Pingback: Climate Contrarian Uncovers Big Scientific Error, Upends Major Ocean Warming Study
Pingback: Water Cooler 11/15/18 Open Thread; Facebook Participates In Slave Trade ???; Great Christmas Gift; Whoops Not Quite The Apocalypse – Gears of Corruption
Pingback: Water Cooler 11/15/18 Open Thread; Facebook Participates In Slave Trade ???; Great Christmas Gift; Whoops Not Quite The Apocalypse – Liberty Redux
Pingback: Serious Errors Found In Widely Cited Global Warming Study | peoples trust toronto
Pingback: Correcting Overheated Math in Alarming Ocean-Warmth Study – USA News Hub
Pingback: Water Cooler 11/15/18 Open Thread; Facebook Participates In Slave Trade ???; Great Christmas Gift; Whoops Not Quite The Apocalypse - InternetticA
Pingback: Error Bars – John Bartos' Blog
Pingback: Water Cooler 11/15/18 Open Thread; Facebook Participates In Slave Trade ???; Great Christmas Gift; Whoops Not Quite The Apocalypse
Pingback: OOPs! My Bad! Oceans Are Not Warming 60% Faster After All
Pingback: PowerLine -> John Hinderaker – Avenatti Agonistes + In defense of American nationalism – Hoax And Change
Pingback: High profile climate change paper issues retraction…I wonder how many will see the correction « The Western Front
Pingback: Researchers Slipped Up: The Oceans May Not Be Warming Faster After All | Science & Tech Blog
Pingback: Climate Change Study Just Embarrassed Liberal Media
Pingback: Climate Change Study Just Embarrassed Liberal Media - Novus Vero
Pingback: WRONG: ‘Alarming’ Climate Study on Heating Oceans Debunked & Retracted Due to Math Error - InternetticA
Pingback: Serious Errors Found In Widely Cited Global Warming Study – A Sweet Dose of Reality | The Mad Truther
Pingback: One Man’s Discovery Sinks Major Climate Study – Lexington Libertarian
“Nic Lewis Owes Resplandy et al an Apology,” 11/15/18
https://davidappell.blogspot.com/2018/11/nic-lewis-owes-resplandy-et-al-apology.html
It was a response to David A. and I made a mistake in placing it. Sorry
In your blogpost you write: ” So only two days after he pointed out what he thought was an error, Nic Lewis was already castigating Resplandy et al for not acknowledging his analysis. He gave them no-to-little time for analysis, no time to figure out what he was saying or to address the subtleties involved…”
This is not true. The lead author Resplandy was informed about the issues on the 1st. of November as Nic wrote in his post:” …so later on November 1st I emailed Laure Resplandy querying the ΔAPOClimate trend figure in her paper and asking for her to look into the difference in our trend estimates as a matter of urgency.” Indeed the given time was much more than two days. At RC you introduced the wording “gentleman scientist”, one should introduce also the wording “gentleman commenter” and it’s first duty: not to lie!
Pingback: Late And Fevered Ethics Musings, 11/15/18: Pardon Hillary, And More Surprises | Ethics Alarms
Pingback: Mathematician Catches Global Warming Paper Overstating Temp Rise by Up To 600% • Just Conservative Views
Pingback: Mathematician Catches Global Warming Paper Overstating Temp Rise by Up To 600% – 53percenter's Blog
Pingback: A Mathematician’s Take On A Climate Change Article | Melva Gifford
Pingback: WRONG: ‘Alarming’ Climate Study on Heating Oceans Debunked & Retracted Due to Math Error - Big Sky Headlines
Pingback: Error in Global Warming Study | Delightful & Distinctive COLRS
Pingback: Correction to climate change study highlights flaws in peer-review processWorld News | World News
Pingback: Correction to climate change study highlights flaws in peer-review process - Daily Canada News
Pingback: Correction to local weather change research highlights flaws in peer-review course of | CBC Information – SomeNews
Pingback: Correction to climate change study highlights flaws in peer-review process - Fort McMurray\'s source for news and events
Pingback: Correction to climate change study highlights flaws in peer-review process | CBC News
Pingback: Correction to climate change study highlights flaws in peer-review process | CBC News – Viral Topic Zone
Pingback: Correction to climate change study highlights flaws in peer-review process – Real Estate, Breaking News, Finance | Happy Home Magazine
In your blogpost you write: ” So only two days after he pointed out what he thought was an error, Nic Lewis was already castigating Resplandy et al for not acknowledging his analysis. He gave them no-to-little time for analysis, no time to figure out what he was saying or to address the subtleties involved…”
This is not true. The lead author Resplandy was informed about the issues on the 1st. of November as Nic wrote in his post:” …so later on November 1st I emailed Laure Resplandy querying the ΔAPOClimate trend figure in her paper and asking for her to look into the difference in our trend estimates as a matter of urgency.” Indeed the given time was much more than two days. At RC you introduced the wording “gentleman scientist”, one should introduce also the wording “gentleman commenter” and it’s first duty: not to lie!
Pingback: Forskare erkänner avgörande fel i studie om hur snabbt haven värms upp | Samhällsnytt
Pingback: Correction to climate change study highlights flaws in peer-review process | CBC News – Update Trend News
Pingback: Scientists Just Found Errors in a Huge Climate Study That Made Headlines Two Weeks Ago - Science Level
Pingback: Climate Change - by how much are the oceans warming? -
Pingback: Scientists Just Found Errors in a Huge Climate Study That Made Headlines Two Weeks Ago - Science News
Pingback: Scientists just found errors in a huge climate study that made headlines two weeks ago - Oni Science
Pingback: Scientists Just Found Errors in a Huge Climate Study That Made Headlines Two Weeks Ago - New Now Science
Pingback: Scientists Just Found Errors in a Huge Climate Study That Made Headlines Two Weeks Ago | Science News Magazines
Pingback: Scientists Just Found Errors in a Huge Climate Study That Made Headlines Two Weeks Ago - Science Alarm
Pingback: Scientists just found errors in a huge climate study that made headlines two weeks ago - Science News Mag
Pingback: Scientists Just Found Errors in a Huge Climate Study That Made Headlines Two Weeks Ago ⋆ Discovery
Pingback: Correction to climate change study highlights flaws in peer-review process-Times of News USA
Pingback: Scientists just found errors in a huge climate study that made headlines two weeks ago - Science Nuclear
Pingback: Climate contrarian uncovers scientific error, upends major ocean warming study – Nwo Report
Pingback: Scientist Admit They ‘Muffed’ The Reports: Global Warming Data Now Worthless – Life and Liberty | Gds44's Blog
Pingback: When Climate Change Consensus Becomes Dogma, Not Science
Peter Lang,
“Flora and fauna adapt rapidly to climate changes… life thrives as temperatures warm”
Armchair biology theorizing is fun but pretty useless, divorced from empiricism.
Why are coral dying en masse all over the world as waters warm, instead of thriving, Peter?
Mostly (a) you have no idea, (b) you confuse ~millennial-scale geologic time with short-term ~decadal human experience timeframes, and (c) your “rapid adaptation” theory has been falsified in the real world, but you’re more interested with philosophy than what’s real.
We all get to choose whether we put more faith in empirical, scientific reasoning or in such personal philosophy. Knock yourself out. Your theorizing is off-topic for this thread, I just wanted to point out the earlier whopper of an error in somebody believing heat stress-based bleaching of coral has been debunked (by alternative amateur/blog theory). That’s an obviously and dangerously incorrect thing to believe.
Pingback: UFOs seen on the Irish coast by airline pilots – Here are the details - Be Viral
Pingback: Error in major climate study revealed – warming NOT higher than expected - worldviral7
Pingback: Error in major climate study revealed – warming NOT higher than expected – Worldupdateus.info
Pingback: Error in major climate study revealed – warming NOT higher than expected – MUSCLE CARS VIDEOS
Pingback: Error in major climate study revealed – warming NOT higher than expected | News Articles from Popular News Portal
Pingback: Error in major climate study revealed – warming NOT higher than expected – American News
Pingback: Error in major climate study revealed – warming NOT higher than expected – News-Pix
Pingback: Error in major climate study revealed – warming NOT higher than expected – Gossipify
Pingback: Error in major climate study revealed – warming NOT higher than expected – Your True News Source
Pingback: Error in major climate study revealed – warming NOT higher than expected – Time Traveller Wiki
Pingback: Error in major climate study revealed – warming NOT higher than expected - Internet of This
Pingback: Error in major climate study revealed – warming NOT higher than expected - Daily The News
Pingback: Error in major climate study revealed – warming NOT higher than expected | all world info
Pingback: Error in major climate study revealed – warming NOT higher than expected – Politics News
Pingback: Error in major climate study revealed – warming NOT higher than expected | Easy life, Easy time
Pingback: Allcharts.co.za
Pingback: Error in major climate study revealed – warming NOT higher than expected – LITTLE OF ALL
Pingback: Error in major climate study revealed – warming NOT higher than expected - Big Sky Headlines
Pingback: Error in major climate study revealed – warming NOT higher than expected – Muscle Cars Info
Pingback: Media Hyped Warming Study, Some Still Haven’t Admitted Its Flaws | PA Pundits - International
Pingback: Se reveló un error en un importante estudio sobre el clima: el calentamiento NO es mayor de lo esperado - Tecnologias Online
Pingback: Error in major climate study revealed – warming NOT higher than expected | True Median
We in the US are extremely proud of Nic Lewis. He has proved and validated that President Trump was always right, and that climate change isn’t for real. Nic Lewis has become a star among us Trump supporters to help tell people the real truth about climate. Thank you for this great gift. Jesus has said warmth is in the hearts of people. May God bless you Nic Lewis. You have done America a great favor.
https://www.foxnews.com/science/error-in-major-climate-study-revealed-warming-not-higher-than-expected
Pingback: Resplandy et al. Part 3: Findings regarding statistical issues and the authors’ planned correction | Climate Etc.
It is surprising and impressive that this post cut through the noise to be heard. I’m also impressed that the the researchers acknowledged their mistake. Was their a back story that helped you be heard, or did you just get lucky? Tell us if you can. I am curious. https://discourse.peacefulscience.org/t/the-art-of-correction-a-blog-post-corrects-nature/2995?u=swamidass
Pingback: Climate scientists admit to major math error after global warming study debunked | i am a malaysian
I propose there are numerous flaws in the entire global warming situation, simply because no one is willing to consider other factors beyond the green house effect, that may be contributing to the problem.
Theory one. They lied to us. The Earth is not traveling around the sun in a perfect orbit , but is rather, being sucked into the sun and as we get closer each moment, storms are becoming more violent, skin cancers are rising, the polar ice cap is melting, and ocean temperatures are rising. This theory of ine will undoubtedly be scoffed at, until someone in the scientific community claims it as thier own, and studies are conducted.
We keep discovering new planets at the edge of oursolar system. They’re being sucked in also..like a bath drain.
Mars is suddenly sprouting water as it settles into our planets former orbit while our climate becomes more like that of Venus each day..
No? Look at a whirlpool. Look at a hurricane’s eyewall. Look at a twister. To believe we are in some sort of perfect orbit is insane..if the sun can capture Jupiter it csn certainly draw us in as well.
We all know what kind of heat source is needed to heat the ocean waters…Which brings me to theory 2, and another obvious potentially overlooked contributor to the problem…
Engines require oil, and coolant to operate.so does the earth.
We live on tectonic plates..masses of dirt and rock that float on a sea of molten lava at the Earth’s core. The oceans are the Earth’s cooling system…and the oil is the only thing that separates the plates under our feet, and the magma below them.
That layer of oil is what we pump out of the ground every day. Oil companies like to say the oil is a natural biproduct of the cooling magma..not that it matters. It is what keeps the magma from engulfing all the lands of the earth.
We have plenty of alternative fuel possibilities, yet the world will not be satisfied until, like locusts, we consume every last drop of a limited resource.
Either or both of the above theories alone or in combination with the greenhouse effect, could all be contributing factors, and if so, there isn’t anything we can do about it. No one is willing to see a bigger picture. No one will consider other causes. Except me. Now you all can mock me for being right about it.
Pingback: Error in major climate study revealed – warming NOT higher than expected #NoPainNoGain – Breaking News
Pingback: Unsettled Science: Scientists reveal serious calculation errors in "global warming" study touted by MSM
Pingback: Unsettled Science: Scientists reveal serious calculation errors in “global warming” study touted by MSM - Novus Vero
Pingback: Unsettled Science: Scientists reveal serious calculation errors in “global warming” study touted by MSM | TrumpsMinutemen
Pingback: The science is settled | Catallaxy Files
Pingback: A failure of peer review – It's Karl
Pingback: Bits and Pieces – 20181118, Sunday | thePOOG
Pingback: Unsettled Science: Scientists reveal serious calculation errors in “global warming” study touted by MSM - Conservative News & Right Wing News | Gun Laws & Rights News Site : Conservative News & Right Wing News | Gun Laws & Rights News
Pingback: Imágenes de aviones no tripulados muestran más de 100 ballenas encarceladas en cárceles submarinas - Tecnologias Online
Pingback: Drone Footage Shows More Than 100 Whales Imprisoned In Underwater Jails - Be Viral
Pingback: Correction: Ocean heat Buildup • Skeptical Science
Pingback: Resplandy et al 2018 | climat-evolution
Pingback: Grave error en estudio: el océano NO se está calentando más de lo previsto - BLes.com
Pingback: Man-made error in man-made global warming study, oceans are not 60% warmer | OpentheWord.org
Pingback: Signs of the Times | Lion of Judah Blog
Pingback: Celine Dion lanza la línea de ropa neutra de género "Illuminati-esque" - Tecnologias Online
Pingback: The Left is Wrong Again-Climate Change – The Alter of Deceit
Pingback: Celine Dion Launches ‘Illuminati-esque’ Gender Neutral Clothing Line - Be Viral
Pingback: Ocean study criticism shows benefits of scientific method - GEORGIANBAYNEWS.COM
Pingback: Settling the Science | Common Sense with Paul Jacob
Pingback: Bad Science Journalism: Is it Fake News? – getwifed
Pingback: Don’t Blame Climate Change For California’s Fires - InternetticA
Pingback: Peer Review: Selfie-Sticks & Snobbery | Big Picture News, Informed Analysis
Pingback: Don’t Blame Climate Change For California’s Fires - Novus Vero
Pingback: Don’t Blame Climate Change For California’s Fires • Just Conservative Views
Pingback: Don't Blame Climate Change For California's Fires
Pingback: Ocean Warming Study Criticism Shows How the Scientific Method Works – Olduvai.ca
Pingback: Resplandy et al. Part 4: Further developments | Climate Etc.
Pingback: Nic Lewis: More Problems With Resplandy et al. - The Global Warming Policy Forum (GWPF)The Global Warming Policy Forum (GWPF)
Pingback: Error in major climate study revealed – warming NOT higher than expected – End Times Buzz
Commentators,
I find your comments regarding Nic Lewis’s review of the ocean warming paper by Resplandy et. al. interesting. And, while I am not a climate scientist, I find it interesting that no one commented on the appropriateness of including the whole delta APO climate data set (1991 to 2017) in the least squares trend analysis (Figure 1 in Lewis’s paper).
It appears to me that there is a clear change in the trend at about year 2005 which would indicate a slowing in the change rate from years 1991 to 2005. Since the Resplansky study least squares trend line is significantly above the data trend and the data trend is clearly falling below Lewis’s trend line, it would appear that including the data from 2005 to 2017 is biasing the outcome of the analysis.
It would appear that the big question is what caused the change in trend at or about 2005.
Any comments,
Pingback: Global Warming or Global Cooling? Further Evidence the Science Isn't Settled ⋆ Unite or Die
Pingback: Climate Scientists Admit To Major Math Error After Global Warming Study Debunked
Pingback: HOW TO STOP CLIMATE CHANGE: COWS, TERMITES, LANDFILLS, PERMAFROST | Simone Super Energy
Pingback: We're Waiting for Media's Corrections on Ocean Warming | Global Climate