
by Dr. Willie Soon, Dr. Ronan Connolly & Dr. Michael Connolly
Gavin Schmidt at realclimate.org attempts to dismiss our recent papers, including pseudo-scientific takedowns. This post takes a deep dive into the controversies.
In the last month, we have co-authored three papers in scientific peer-reviewed journals collectively dealing with the twin problems of (1) urbanization bias and (2) the ongoing debates over Total Solar Irradiance (TSI) datasets:
- Soon et al. (2023). Climate. https://doi.org/10.3390/cli11090179. (Open access)
- Connolly et al. (2023). Research in Astronomy and Astrophysics. https://doi.org/10.1088/1674-4527/acf18e. (Still in press, but pre-print available here)
- Katata, Connolly and O’Neill (2023). Journal of Applied Meteorology and Climatology. https://doi.org/10.1175/JAMC-D-22-0122.1. (Open access)
All three papers have implications for the scientifically challenging problem of the detection and attribution (D&A) of climate change. Many of our insights were overlooked by the UN’s Intergovernmental Panel on Climate Change (IPCC) in their last three Assessment Reports (AR), i.e., IPCC AR4 (2007), IPCC AR5 (2013) and IPCC AR6 (2021). This means that the IPCC’s highly influential claims in those reports that the long-term global warming since the 19th century was “mostly human-caused” and predominantly due to greenhouse gas emissions were scientifically premature and the scientific community will need to revisit them.
So far, the feedback on these papers has been very encouraging. In particular, Soon et al. (2023) seems to be generating considerable interest, with the article being viewed more than 20,000 times on the journal website in the first 10 days since it was published.
However, some scientists who have been actively promoting the IPCC’s attribution statements over the years appear to be quite upset by the interest in our new scientific papers.
This week (September 6th, 2023), a website called RealClimate.org published a blog post by one of their contributors, Dr. Gavin Schmidt, the director of the NASA Goddard Institute for Space Studies (NASA GISS). In this post, Dr. Schmidt is trying to discredit our analysis in Soon et al. (2023), one of our three new papers, using “straw-man” arguments and demonstrably false claims.
As we summarize in Connolly et al. (2023),
“A “straw man” argument is a logical fallacy where someone sets up and then disputes a position that was not actually made by the group being criticised. Instead, the group’s arguments or points are either exaggerated, misrepresented, or completely fabricated by the critics.”
In our opinion, while this rhetorical technique might be good for marketing, political campaigning, “hit pieces”, etc., it is not helpful for either science or developing informed opinions. Instead, we strive in our communications to take a “steel-manning” approach. As we point out in Connolly et al. (2023),
“Essentially, this involves addressing the best and most constructive form of someone’s argument – even if it is not the form they originally presented.”
With that in mind, we will first steel-man Dr. Schmidt’s apparent criticisms of Soon et al. (2023).
Steel-manning Dr. Schmidt’s criticisms of Soon et al. (2023)
In his latest RealClimate post, Dr. Schmidt claims the following:
- He asserts that one of the two Total Solar Irradiance (TSI) time series that we considered in Soon et al. (2023) is flawed, out-dated and unreliable. (As an aside, this was also one of the 27 TSI series we considered in Connolly et al. (2023) but he does not discuss this paper here)
- He claims that a 2005 paper by Dr. Willie Soon looking at the relationship between TSI and Arctic temperatures has been disproven by the passage of time.
- He argues that the “rural-only” Northern Hemisphere land surface temperature record that was one of the two temperature records we analysed in Soon et al. (2023) is not representative of rural global temperature trends or even rural Northern Hemisphere temperature trends.
Later in this post, we will respond to each of Dr. Schmidt’s claims and show how they are incorrect. But, first it may be useful to provide some background information on RealClimate.org.
How reliable is RealClimate.org?
RealClimate.org was created in 2004 as a blog to promote the scientific opinions of the website owners. It is currently run by five scientists: Dr. Gavin Schmidt, Prof. Michael Mann, Dr. Rasmus Benestad, Prof. Stefan Rahmstorf and Prof. Eric Steig.
Anybody with scientific training (or even just a careful reader) who actually reads our paper will be able to see that each of the claims in Dr. Schmidt’s recent blog-post are either false, misleading or already clearly addressed by our paper. Therefore, scientifically speaking, his post doesn’t contribute in any productive or meaningful way.
Instead, unfortunately, the goal of his post seems to be to try and stop inquiring minds from reading our paper.
If people were only to read his blog-post then they might be discouraged from even looking at our paper – and therefore wouldn’t find out that Dr. Schmidt’s alleged “criticisms” are without merit.
This type of pseudoscientific “take-down” of any studies that disagree with the RealClimate team’s scientific opinions seems to be a common pattern. For example, in November, they posted a similar “take-down” of our 2021 study that they disdainfully titled “Serious mistakes found in recent paper by Connolly et al.” That post summarized their attempted “rebuttal” of our Connolly et al. (2021) paper by Richardson & Benestad (2022).
Anybody who reads both Connolly et al. (2021) and Richardson & Benestad (2022) will quickly realize that their attempted “rebuttal” was also easily disproven. Indeed, two of our three recent papers explicitly demonstrate that Richardson & Benestad (2022)’s claims were flawed and erroneous.
Again, it seems that the goal of Richardson & Benestad (2022) and RealClimate’s accompanying post in November was NOT to further the science, but rather to discourage people from actually reading Connolly et al. (2021)!
Connolly et al. (2023) is our formal reply to Richardson & Benestad (2022)’s attempted rebuttal of our earlier Connolly et al. (2021) paper.
For anybody who is wondering what our response to Richardson & Benestad’s November 2022 RealClimate post is, we recommend reading the full papers themselves.
All three articles were published in the peer-reviewed journal, Research in Astronomy and Astrophysics (RAA for short).
- Connolly et al. (2021): here
- Richardson & Benestad (2022): here
- Our reply, Connolly et al. (2023): abstract; preprint here (final version is still being typeset)
Addressing claim 1: What is the most reliable TSI time series available?
A key challenge that is the subject of considerable ongoing scientific debate and controversy is the question of how Total Solar Irradiance (TSI) has changed since the 19th century and earlier.
It was only in late 1978, during the satellite era, that it became possible to directly measure the TSI from above the Earth’s atmosphere using TSI-measuring instruments onboard satellites.
Even during the satellite era, it is still unclear exactly how TSI has changed because:
- Each satellite mission typically only remains active for 10-15 years.
- Each satellite instrument gives a different average TSI value.
- Each satellite implies subtly different, but significant differences in the trends between each sunspot cycle.
These problems can be seen below:

We can see from the above that, even though the data from each satellite mission are different, all of the instruments record the increases and decreases in solar activity over the roughly 11 year “solar cycle” which is observed in many solar activity indicators.
However, because the individual instruments typically only cover 10-15 years and they show different underlying trends relative to each other, it is unclear what other trends in TSI have occurred over the satellite era.
Several different research teams have developed their own satellite composites by combining the above satellite data in different ways and using different assumptions and methodologies. See this CERES-Science post for a summary.
Some of the main recent composites are:
- “ACRIM” – The ACRIM group finds that in addition to the 11 year solar cycle, there are important trends between each cycle. They find there was a significant increase in TSI between each solar minimum and maximum in the 1980s and 1990s, followed by a slight decrease in the early 2000s. See e.g., Scafetta et al. (2019).
- “PMOD” – The PMOD group applies several adjustments to the data of some of the early satellite missions and uses different methodological choices and assumptions. They find there has been a slight decrease in TSI between each of the cycles, but that it has been quite modest. See e.g., Montillet et al. (2022).
- “RMIB/ROB” – The ROB group (previously called RMIB) argues that there has been almost no change in TSI over the satellite era other than the 11 year solar cycle. See e.g., Dewitte & Nevens (2016).
- “The Community Composites” – Dudok de Wit et al. (2017) offer two different TSI composites. One using the original satellite data implies a reconstruction intermediate between the RMIB and ACRIM composites. The other using the PMOD-adjusted satellite data implies a reconstruction similar to the PMOD composite.
For the pre-satellite era, we don’t have direct measurements. Instead, researchers have to rely on “solar proxies” that they hope are accurately capturing important aspects of changing solar activity.
Some of the proxies include: sunspot numbers, group sunspot numbers, solar cycle lengths, the ratios of penumbra and umbra features of sunspots, bright spots in the sun’s photosphere (called solar faculae), cosmogenic isotope measurements, etc.
Typically, the solar proxies are calibrated against the satellite measurements during the satellite era. The calibrated solar proxies are then used to estimate the changes in TSI during the pre-satellite era.
Already you are probably thinking this is a complex and challenging problem. You are correct! Although, some scientists act as if these problems have all been fully resolved, those of us who have been actively researching these problems for many years can tell you that it is a thorny and contentious subject.
Depending on (a) which satellite composite is used; (b) which solar proxies are used; and (c) what methodologies are used, different research teams can develop very different long-term TSI reconstructions.
For example,
- Matthes et al. (2017) is the one IPCC AR6 used – based on the average of two other TSI reconstructions – Krivova et al. (2007)’s “SATIRE” and Coddington et al. (2016)’s “NRLTSI2”. All three match well to the PMOD composite.
- Dewitte et al. (2022) is a simple reconstruction based on simply rescaling the sunspot number record to match the RMIB composite.
- Egorova et al. (2018) developed 4 different estimates. Each shows far more variability over the last few centuries than the IPCC estimates.
- In a 2019 NASA study, Scafetta et al. (2019) updated the original Hoyt and Schatten (1993) TSI reconstruction using the ACRIM composite. This is a somewhat unique reconstruction because unlike most of the other reconstructions that only use one or two solar proxies, Hoyt and Schatten used five solar proxies in order to capture multiple aspects of solar variability.
- Penza et al. (2022) implies that TSI has changed significantly over the past century or so, but not as much as the Egorova et al. (2018) or the updated Hoyt and Schatten (1993) reconstruction.
In Connolly et al. (2023), we analysed a total of 27 TSI reconstructions, including all of the above. However, in Soon et al. (2023), for simplicity, we focused on just two of the above reconstructions – Matthes et al. (2017) and the ACRIM-updated Hoyt & Schatten reconstruction.
Dr. Schmidt clearly does not like either the ACRIM composite or Hoyt & Schatten’s original TSI composite. We can understand why! It implies a much larger role for the Sun in the climate changes since the 19th century than the RealClimate team claims exist.
However, it is worth noting that Hoyt and Schatten (1993) was used as one of the 6 TSI series considered by the CMIP3 modelling project that the IPCC used for their detection and attribution analysis in their 4th Assessment Report (2007). This can be confirmed by checking the list of “SOL” (i.e., TSI) time series on pages 11-12 of the Supplementary Material for Chapter 9 of IPCC AR4 Working Group 1.
The CMIP5 and CMIP6 modelling projects that contributed to the 2013 and 2021 AR5 and AR6 reports did not consider Hoyt and Schatten (1993) as a potential TSI series. However, this seems to partly be due the influence of Dr. Schmidt. He was the lead author of Schmidt et al. (2011), i.e., the paper recommending the climate modelling forcings to be used for the PMIP3 and CMIP5 projects.
At any rate, as we mentioned above, in Connolly et al. (2023) we considered a total of 27 different TSI reconstructions and we still reached similar conclusions to Soon et al. (2023). So, the specific choice of Hoyt and Schatten is just one way to demonstrate that the IPCC was premature in their AR6 attribution.
Addressing claim 2: Was Soon (2005) wrong?
In Soon (2005), Dr. Soon noticed a remarkable correlation between the Hoyt and Schatten (1993) TSI series and Arctic temperatures from 1875 to 2000.
In a follow-up paper, Soon (2009) repeated his analysis using (a) a newer version of the Hoyt and Schatten TSI series that had been updated to 2007 and (b) NASA GISS’ Arctic temperature record from 1880-2007.
The comparison is shown below adapted from Figure A.1 of Soon (2009):
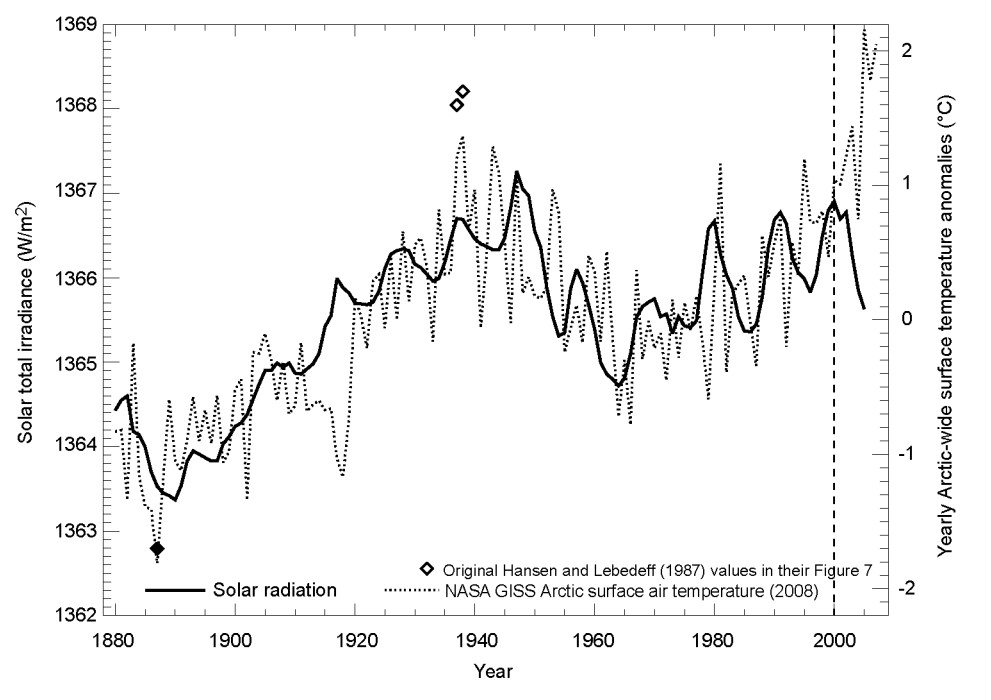
In this week’s blog post, Dr. Schmidt conceded that the fit looked ok in 2005, but he claims it no longer holds:
“But time marches on, and what might have looked ok in 2005 (using data that only went to 2000) wasn’t looking so great in 2015.”
Dr. Schmidt then showed a plot he did in 2015 using a different TSI record from that used by Soon. His reanalysis failed to identify a compelling correlation when applied to the updated NASA GISS Arctic temperature record.
On the other hand, also in 2015, as part of our analysis of Northern Hemisphere rural temperature trends, in Soon et al. (2015) we included our own update to the original Soon (2005; 2009) analysis.
Below is Figure 27(d) of Soon et al. (2015). The blue line represents Arctic temperatures, while the dashed red line represents TSI:
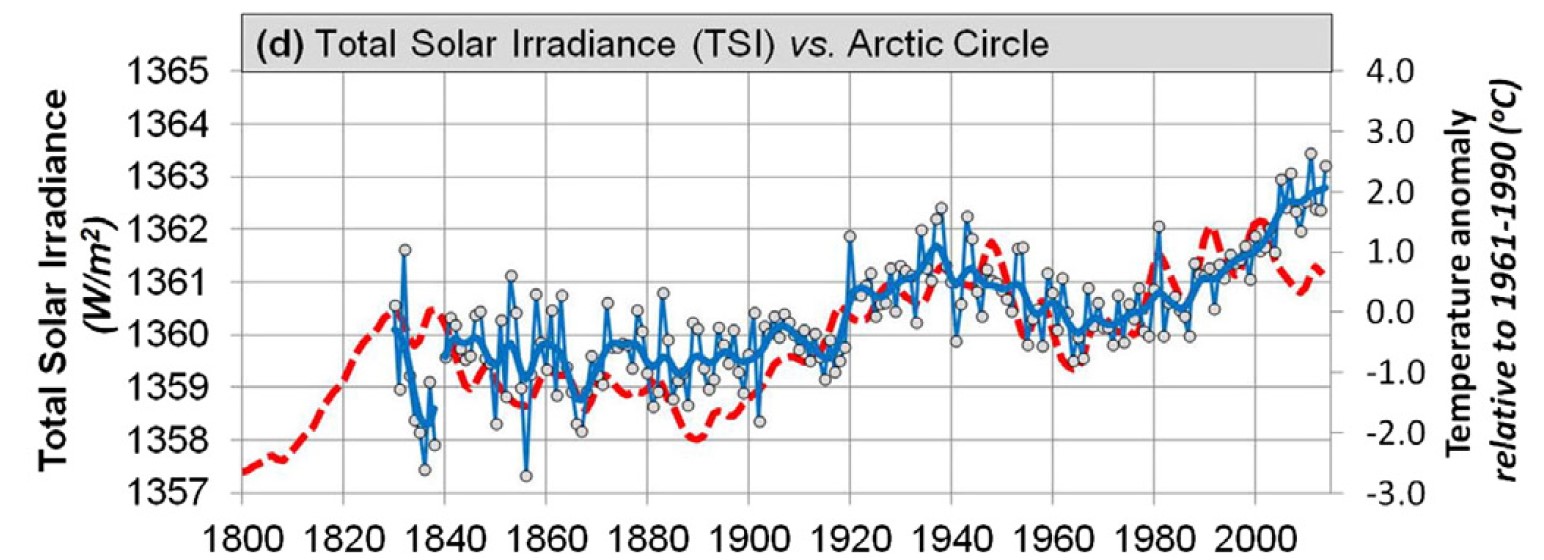
Dr. Schmidt’s attempt to update Soon (2005)’s analysis to 2015, by using a different TSI record, failed.
In contrast, Soon et al. (2015)’s update’s that used the updated version of the TSI used by Soon (2005) and Soon (2009) confirmed the original findings of the earlier studies.
Addressing claim 3: Is our rural-only Northern Hemisphere temperature record representative of genuine climate change?
Dr. Schmidt appears to be confused about the rural-only Northern Hemisphere temperature record that we used as one of two comparative temperature records in Soon et al. (2023) and also as one of five comparative temperature records in Connolly et al. (2023).
We are surprised that he does not seem to have understood how these temperature records were constructed, since the construction of all five temperature records was described in detail in Connolly et al. (2021), along with a detailed discussion of the rationale for each temperature record. Details were also provided in the Soon et al. (2023) paper he was criticizing.
However, perhaps he hasn’t actually taken the time to read Connolly et al. (2021) yet. When Connolly et al. (2021) was published, Dr. Schmidt was asked to comment on the paper by a journalist for The Epoch Times. According to The Epoch Times:
“When contacted about the new paper, Gavin Schmidt, who serves as acting senior advisor on climate at NASA and the director of the Goddard Institute for Space Studies, was also blunt.
“This is total nonsense that no one sensible should waste any time on,” he told The Epoch Times.
He did not respond to a follow-up request for specific errors of fact or reasoning in the new RAA paper.”
– The Epoch Times, August 16th, 2021
One of the key problems we were highlighting in Soon et al. (2023) was the so-called “urbanization bias problem”. It is well-known that urban areas are warmer than the surrounding countryside. This is known as the “Urban Heat Island (UHI)” effect.
Because urban areas still only represent 3-4% of the global land surface, this should not substantially influence global temperatures.
However, most of the weather stations used for calculating the land component of global temperatures are located in urban or semi-urban areas. This is especially so for the stations with the longest temperature records. One reason why is because it is harder to staff and maintain a weather station in an isolated, rural location for a century or longer.
As a result, many of the longest station records used for calculating global temperature changes have probably also experienced localized urban warming over the course of their records. This urban warming is not representative of the climate changes experienced by the non-urban world.
Urban warming that gets mistakenly incorporated into the “global temperature” data is referred to as “urbanization bias”.
It is still unclear exactly how much the current global warming estimates are contaminated by urbanization bias. In their most recent report, the IPCC stated optimistically that urbanization bias probably accounted for less than 10% of the land warming. However, they did not offer a robust explanation for why they felt this was so.
Indeed, as described in Connolly et al. (2021), Soon et al. (2023) and Connolly et al. (2023), several scientific studies have suggested that urban biases accounted for more than 10% of the land warming – and possibly much more.
Brief detour: background to how and why we developed our rural-only Northern Hemisphere temperature record
In Connolly et al. (2021), we attempted to resolve the urbanization bias problem by developing a rural-only temperature record that only used temperature records from rural stations or stations that had been explicitly corrected for urbanization bias. However, we faced two major problems that we had been trying to resolve for nearly a decade:
- There was a severe shortage of rural stations with temperature records of a century or longer.
- Many weather stations with long temperature records are contaminated by other non-climatic biases, such as station moves, changes in instrumentation, etc.
When we looked at how other international groups (including Dr. Schmidt’s group at NASA GISS) were accounting for the non-climatic biases in the data, we discovered that they were not making any effort to contact the station owners for “station history metadata”, i.e., information on any changes associated with the station over its record.
Instead, most groups (including NASA GISS), were relying on automated computer programs that tried to guess when station changes might have introduced a bias. These programs used statistical algorithms that compared each station record to those of neighboring stations and applying “homogenization adjustments” to the data.
In a series of three “working papers”, two of us (Dr. Ronan Connolly and Dr. Michael Connolly) had published in 2014, we described how:
- There were serious flaws in the homogenization algorithms used by NOAA, the group whose homogenized data NASA GISS used for their global temperature estimates. (https://oprj.net/articles/climate-science/34)
- There were also serious problems with the additional “urbanization bias” adjustment computer program that NASA GISS applied to NOAA’s homogenized data (see https://oprj.net/articles/climate-science/31)
- All of the published studies up until at least 2013 that purported to have ruled out urbanization bias as a substantial problem had methodological flaws that meant their conclusions were invalid (see http://oprj.net/articles/climate-science/28)
In April 2015, while we were visiting New York City (along with Dr. Imelda Connolly), we offered to discuss these problems with Dr. Schmidt at the NASA GISS offices and see if possible solutions could be found. Dr. Schmidt declined the invitation explaining that he was not very familiar with how NASA GISS’ global temperature dataset was constructed. But, he kindly arranged for us to discuss the working papers with Dr. Reto Ruedy who was the lead scientist in charge of NASA GISS’ temperature dataset (called “GISTEMP”) at the time. All four of us (Dr. Reto Ruedy, Dr. Imelda Connolly, Dr. Michael Connolly and Dr. Ronan Connolly) met in the iconic “Tom’s Restaurant” right beside the NASA GISS office building.
Dr. Ruedy admitted that none of their research team had considered the various problems we had raised in our working papers. We asked him if he could see any problems with our analysis. He said that he couldn’t immediately, but he promised to e-mail us if he could see any mistakes in our analysis. Since he never e-mailed us, we assume that he couldn’t find any errors.
During our meeting with Dr. Ruedy, we warned him of a problem with NOAA’s homogenization algorithm which we call the “urban blending” problem, but others have called the “statistical aliasing problem”. Recently we have confirmed the severity of this problem in Katata et al. (2023).
We warned him that because of this problem, the urban warming biases in the data would become more deeply embedded in his global temperature estimates if he used NOAA’s homogenized version of the data.
He admitted that this was a problem, but he explained that the NASA GISS team in charge of the GISTEMP dataset were only allocated a limited number of hours per week to work on the data. So, he said that they had to trust that NOAA’s homogenization efforts were better than nothing.
We left our meeting with Dr. Ruedy quite disappointed to discover that even NASA GISS’ well-resourced research team didn’t know how to resolve these key scientific problems and were effectively just hoping that someone else was looking after the data.
We decided, if nobody else was going to try and properly resolve these problems, we would try.
At the time, NOAA provided two types of urban ratings associated with each of their Global Historical Climatology Network (GHCN) dataset – one based on local populations and the other based on the intensity of night-lights in the area. This was version 3 of the GHCN and NOAA kept it updated until late 2019. The current version of GHCN (version 4) does not include any urbanization metrics. So, for now our main analysis has focused on version 3. However, we are working on expanding our analysis in the future using version 4 – see Soon et al. (2018); O’Neill et al. (2022) and Katata et al. (2023) for more details on this later work.
We decided to sort all 7200 of the GHCN stations into three categories – “rural” stations are those rural in terms of both GHCN urban metrics; “urban” stations are those urban in terms of both metrics. All other stations we classify as “semi-urban”.
Immediately, we found several problems:
- Less than 25% of the GHCN stations are “rural”.
- Most of the rural stations had very short station records – often only covering 40-50 years or so.
- The few rural stations that had long records reaching back to the late-19th century or early-20th century were almost entirely in the Northern Hemisphere – and confined to a few regions: North America, Europe, East Asia and several Arctic locations.
- Many of the rural stations with nominally long station records often contained large data gaps and sudden shifts in the average temperature that could potentially be due to non-climatic station changes.
Most of the groups generating global temperature records from the weather station data rely on the temperature homogenization computer programs mentioned above to automatically adjust the original temperature records to remove “non-climatic biases” from the data.
If these homogenization computer programs were as reliable as many scientists have assumed, then these “automatically homogenized” temperature records should no longer be contaminated by non-climatic biases.
However, as we had discovered (and discussed with Dr. Ruedy in our 2015 meeting), these homogenization algorithms have serious statistical problems that introduce new non-climatic biases into the homogenized data.
In subsequent years, we have demonstrated the severity of these biases and statistical problems in several peer-reviewed scientific articles: Soon et al. (2018); O’Neill et al. (2022) and the recent Katata et al. (2023).
Therefore, we realised that the other groups analysing the weather station data were inadvertently making a major scientific blunder by relying uncritically on this automatically “homogenized” data.
Instead, to correct for non-climatic biases in the data, we need to start making more realistic experimentally-based corrections.
We decided to begin our analysis by identifying the areas with the longest rural records and the most information on the non-climatic biases associated with the data. We found that just four regions accounted for more than 80% of all the rural stations with data for the late-19th century/early-20th century. All four regions are in the Northern Hemisphere.
In our opinion, there was simply not enough Southern Hemisphere rural data to construct a global rural-only temperature series that would reach back to the late-19th century.
Therefore, we confined our analysis to the more data-rich Northern Hemisphere.
One region where we think we can expand our analysis in the future is for Europe (as we discuss in the papers). Currently, our European rural temperature analysis is confined to Ireland because we were able to obtain the key station history metadata for the Irish stations from the national meteorological organization (Met Éireann). However, in a recent paper, O’Neill et al. (2022), we carried out a large collaborative effort with scientists across Europe to compile the station history metadata for more than 800 weather stations in 24 European countries – see here for a summary. Most of these European stations are urbanized, but our preliminary analysis suggests that we should be able to use this metadata in the future to develop a more data-rich “rural Europe” temperature record.
How does our rural-only series compare to the standard “urban and rural” record?
The top panel shows the standard Northern Hemisphere land temperature estimates using all stations – urban as well as rural. The bottom panel shows our rural-only temperature estimate.
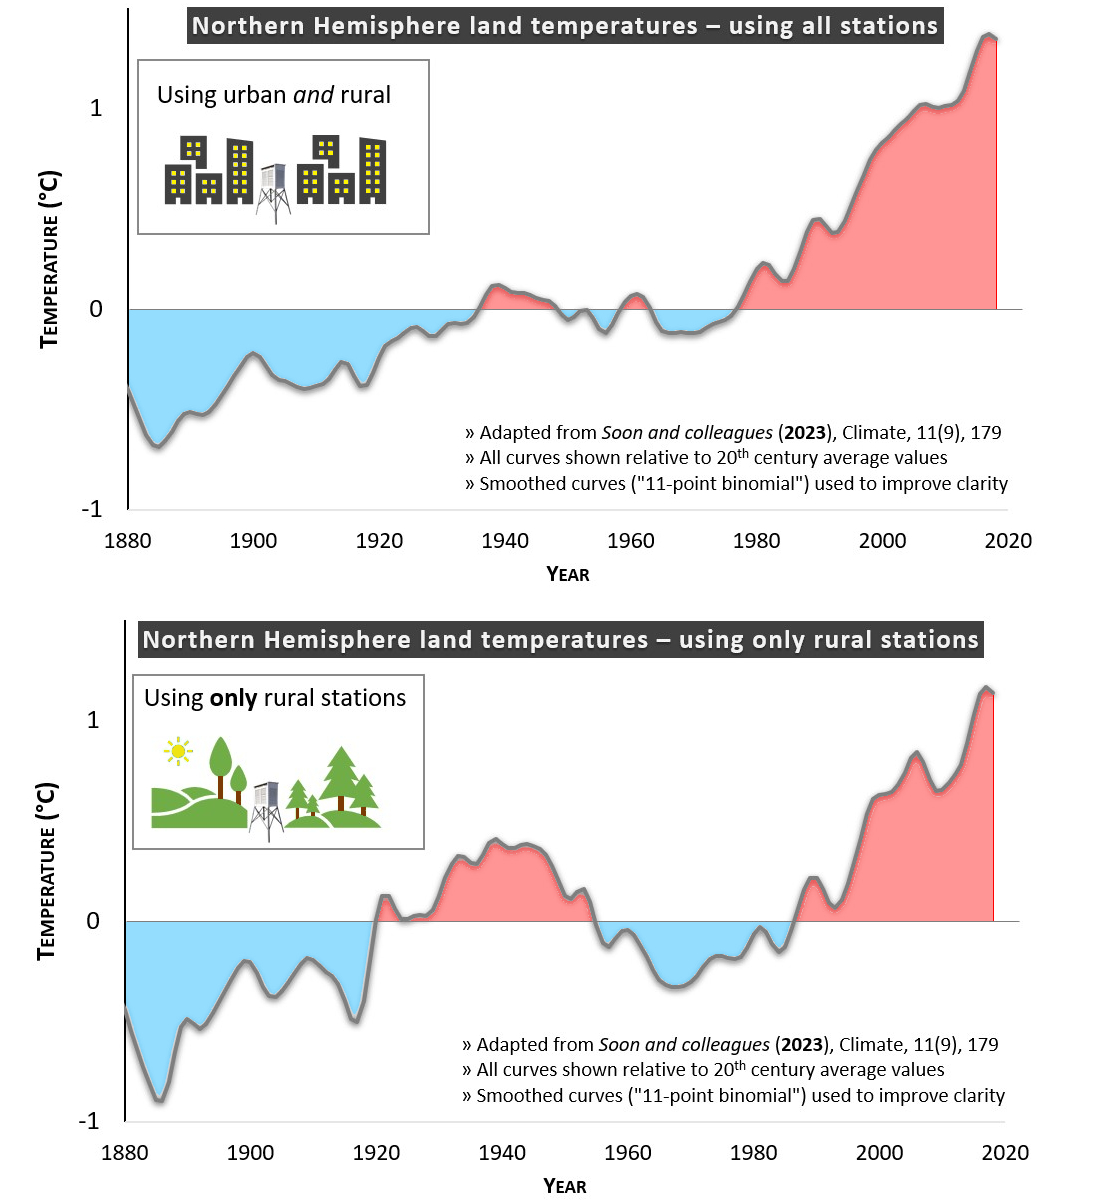
In Soon et al. (2023) – the paper Dr. Schmidt was complaining about – we consider both temperature estimates. We also consider two different TSI records – the Matthes et al. (2017) TSI series used for the attribution experiments in IPCC AR6 and the updated Hoyt and Schatten TSI series that we discussed earlier.
See below for a summary of some of our key findings:

Dr. Schmidt complains that our Northern Hemisphere rural-only temperature record is not reliable because,
“It’s not a good areal sample of the northern hemisphere, it’s not a good sample of rural stations – many of which exist in the rest of Europe, Australia, Southern Africa, South America etc., it’s not a good sample of long stations (again many of which exist elsewhere).”
This is a rather clever, but deceptive, misrepresentation of the data. Notice how he splits up his statement into two parts.
For the first part, he correctly says that there is “a good sample of rural stations” in other regions from those we analysed, but he neglects to explain that they are mostly stations with short records.
Indeed, if we look at the number of stations available in the year 2000, there are indeed many rural stations around the globe:

Then in the second part of his statement, he correctly says that there are many long station records outside of the regions we analysed, but he neglects to explain that they are not rural!
Below are the stations with data available in 1880. We have highlighted the three Southern Hemisphere regions he implied we should have also incorporated, i.e., Australia, Southern Africa and South America:
Do you see why Dr. Schmidt’s characterization of the available data was disingenuous?

But, what about other estimates of Northern Hemisphere temperatures?
In Soon et al. (2023), we were assessing the Northern Hemisphere land surface warming (1850-2018) based on the weather station data. However, in Connolly et al. (2023), we also considered an additional three Northern Hemisphere temperature series. One was generated from the Sea Surface Temperature (SST) data. The other two were based on temperature proxy data: (a) tree-ring temperature proxies or (b) glacier-length temperature proxies.
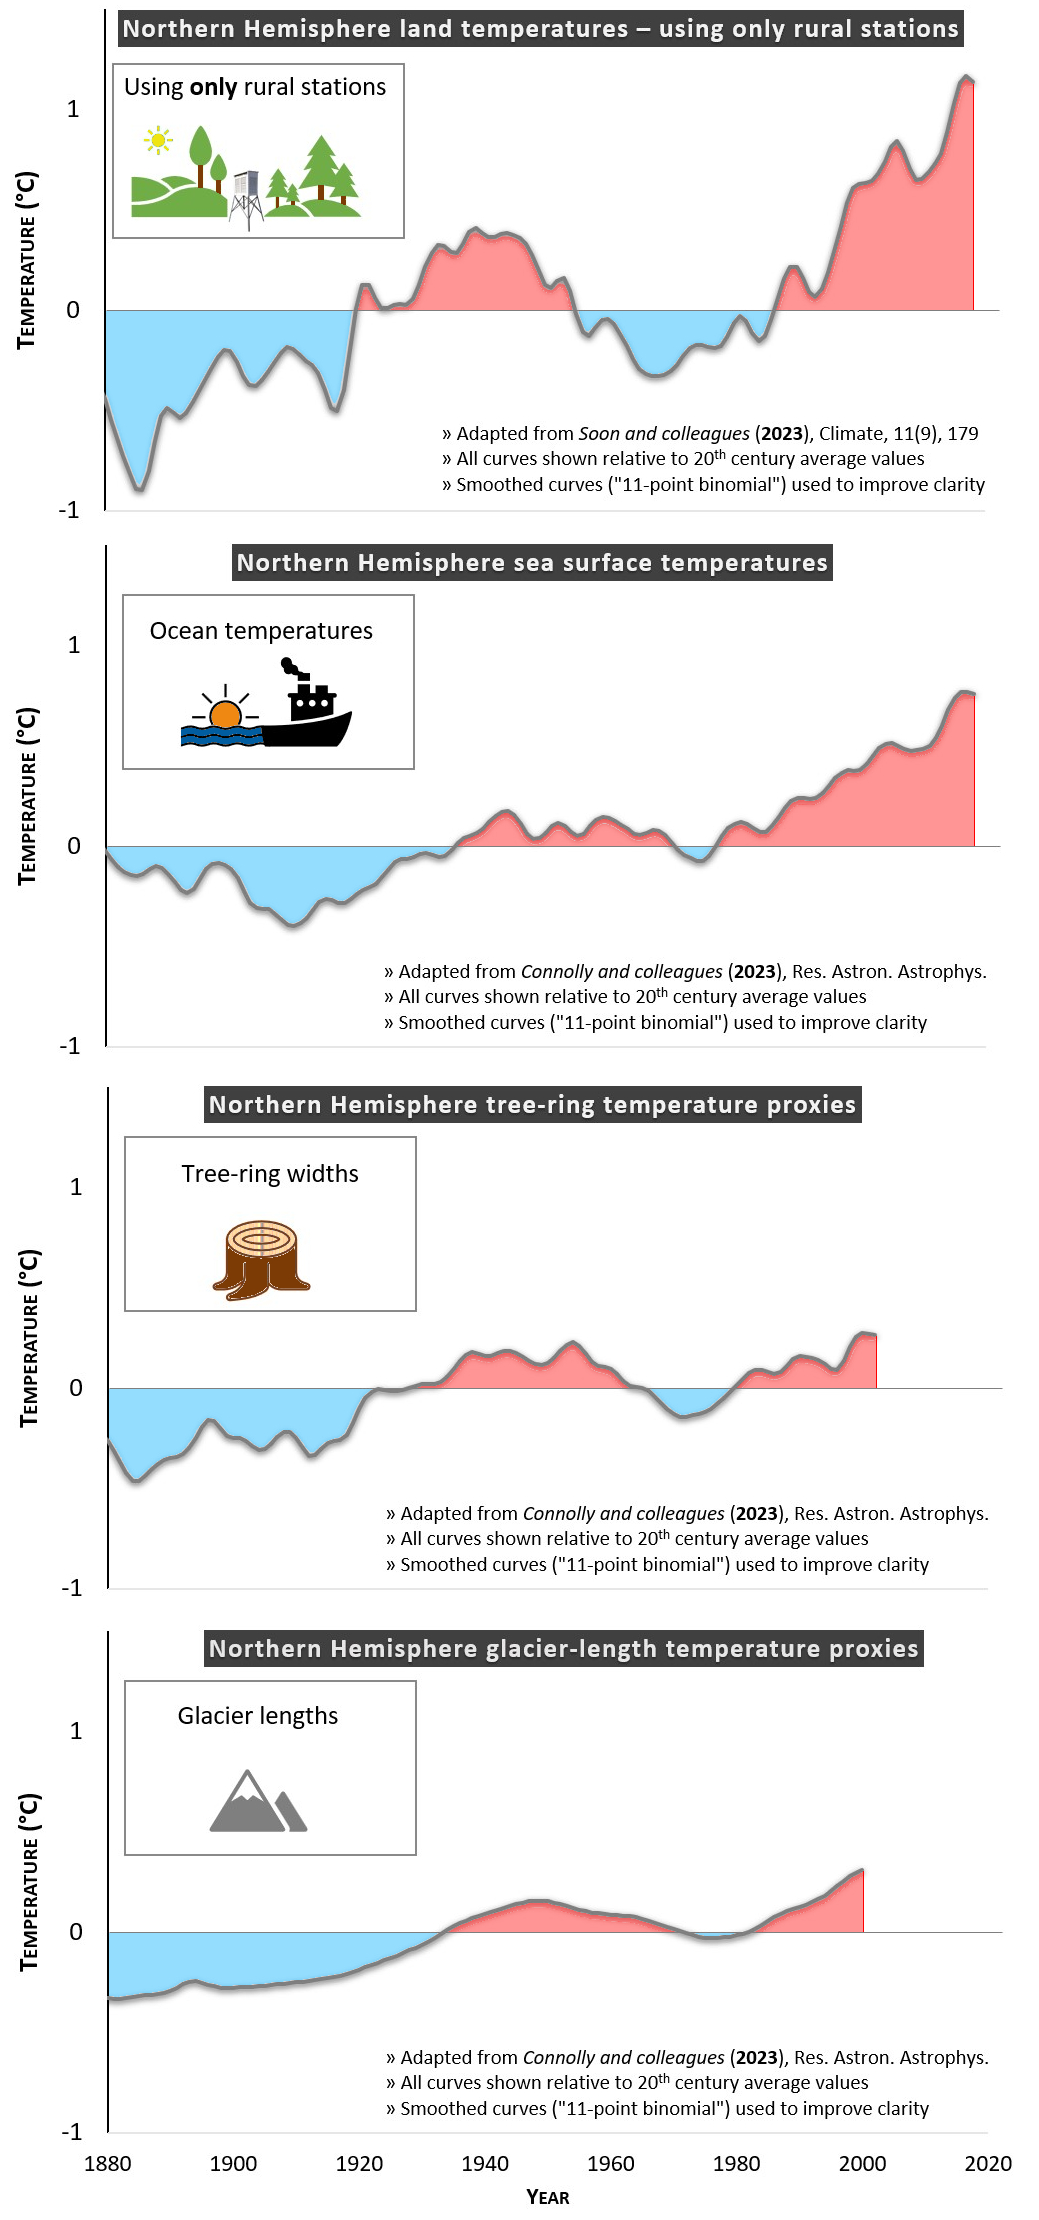
Dr. Schmidt claimed that our rural-only temperature series was not representative of Northern Hemisphere temperature trends. If he is correct, then presumably these other temperature estimates would show very different trends. Let’s see!
What do you think?
Obviously, they are not exactly identical. However, in our opinion, all three of these alternative temperature estimates are broadly similar to our rural-only temperature record.
Therefore, we disagree with Dr. Schmidt’s claim.
Finally, if you recall from the beginning, Dr. Schmidt didn’t like the second TSI series we analysed in Soon et al. (2023). However, in Connolly et al. (2023), we analysed a total of 27 TSI series.
For each temperature record, we carried out statistical analysis in terms of the “natural” and “anthropogenic” (i.e., human-caused) climate drivers that the IPCC used for their attribution experiments. The IPCC only considered two natural drivers – TSI and volcanic eruptions. We used all of the IPCC’s climate driver records, but we repeated our analysis using each of the 27 TSI series in turn.
In both Connolly et al. (2023) and Soon et al. (2023), we adopt a similar approach to the IPCC’s attribution analysis. That is, we compare the results you get by considering:
- “Only natural factors” (which the IPCC defines as TSI and volcanic)
- “Only anthropogenic factors”.
- “Natural and anthropogenic factors”
If you want to see the results from all of these combinations, we recommend reading the full papers. But, for simplicity, let us just compare the first two combinations.
In Figure 6 of Connolly et al. (2023), we compared the “natural factors only” fittings using three of the best-fitting TSI series to the “anthropogenic factors only” fits. See below:
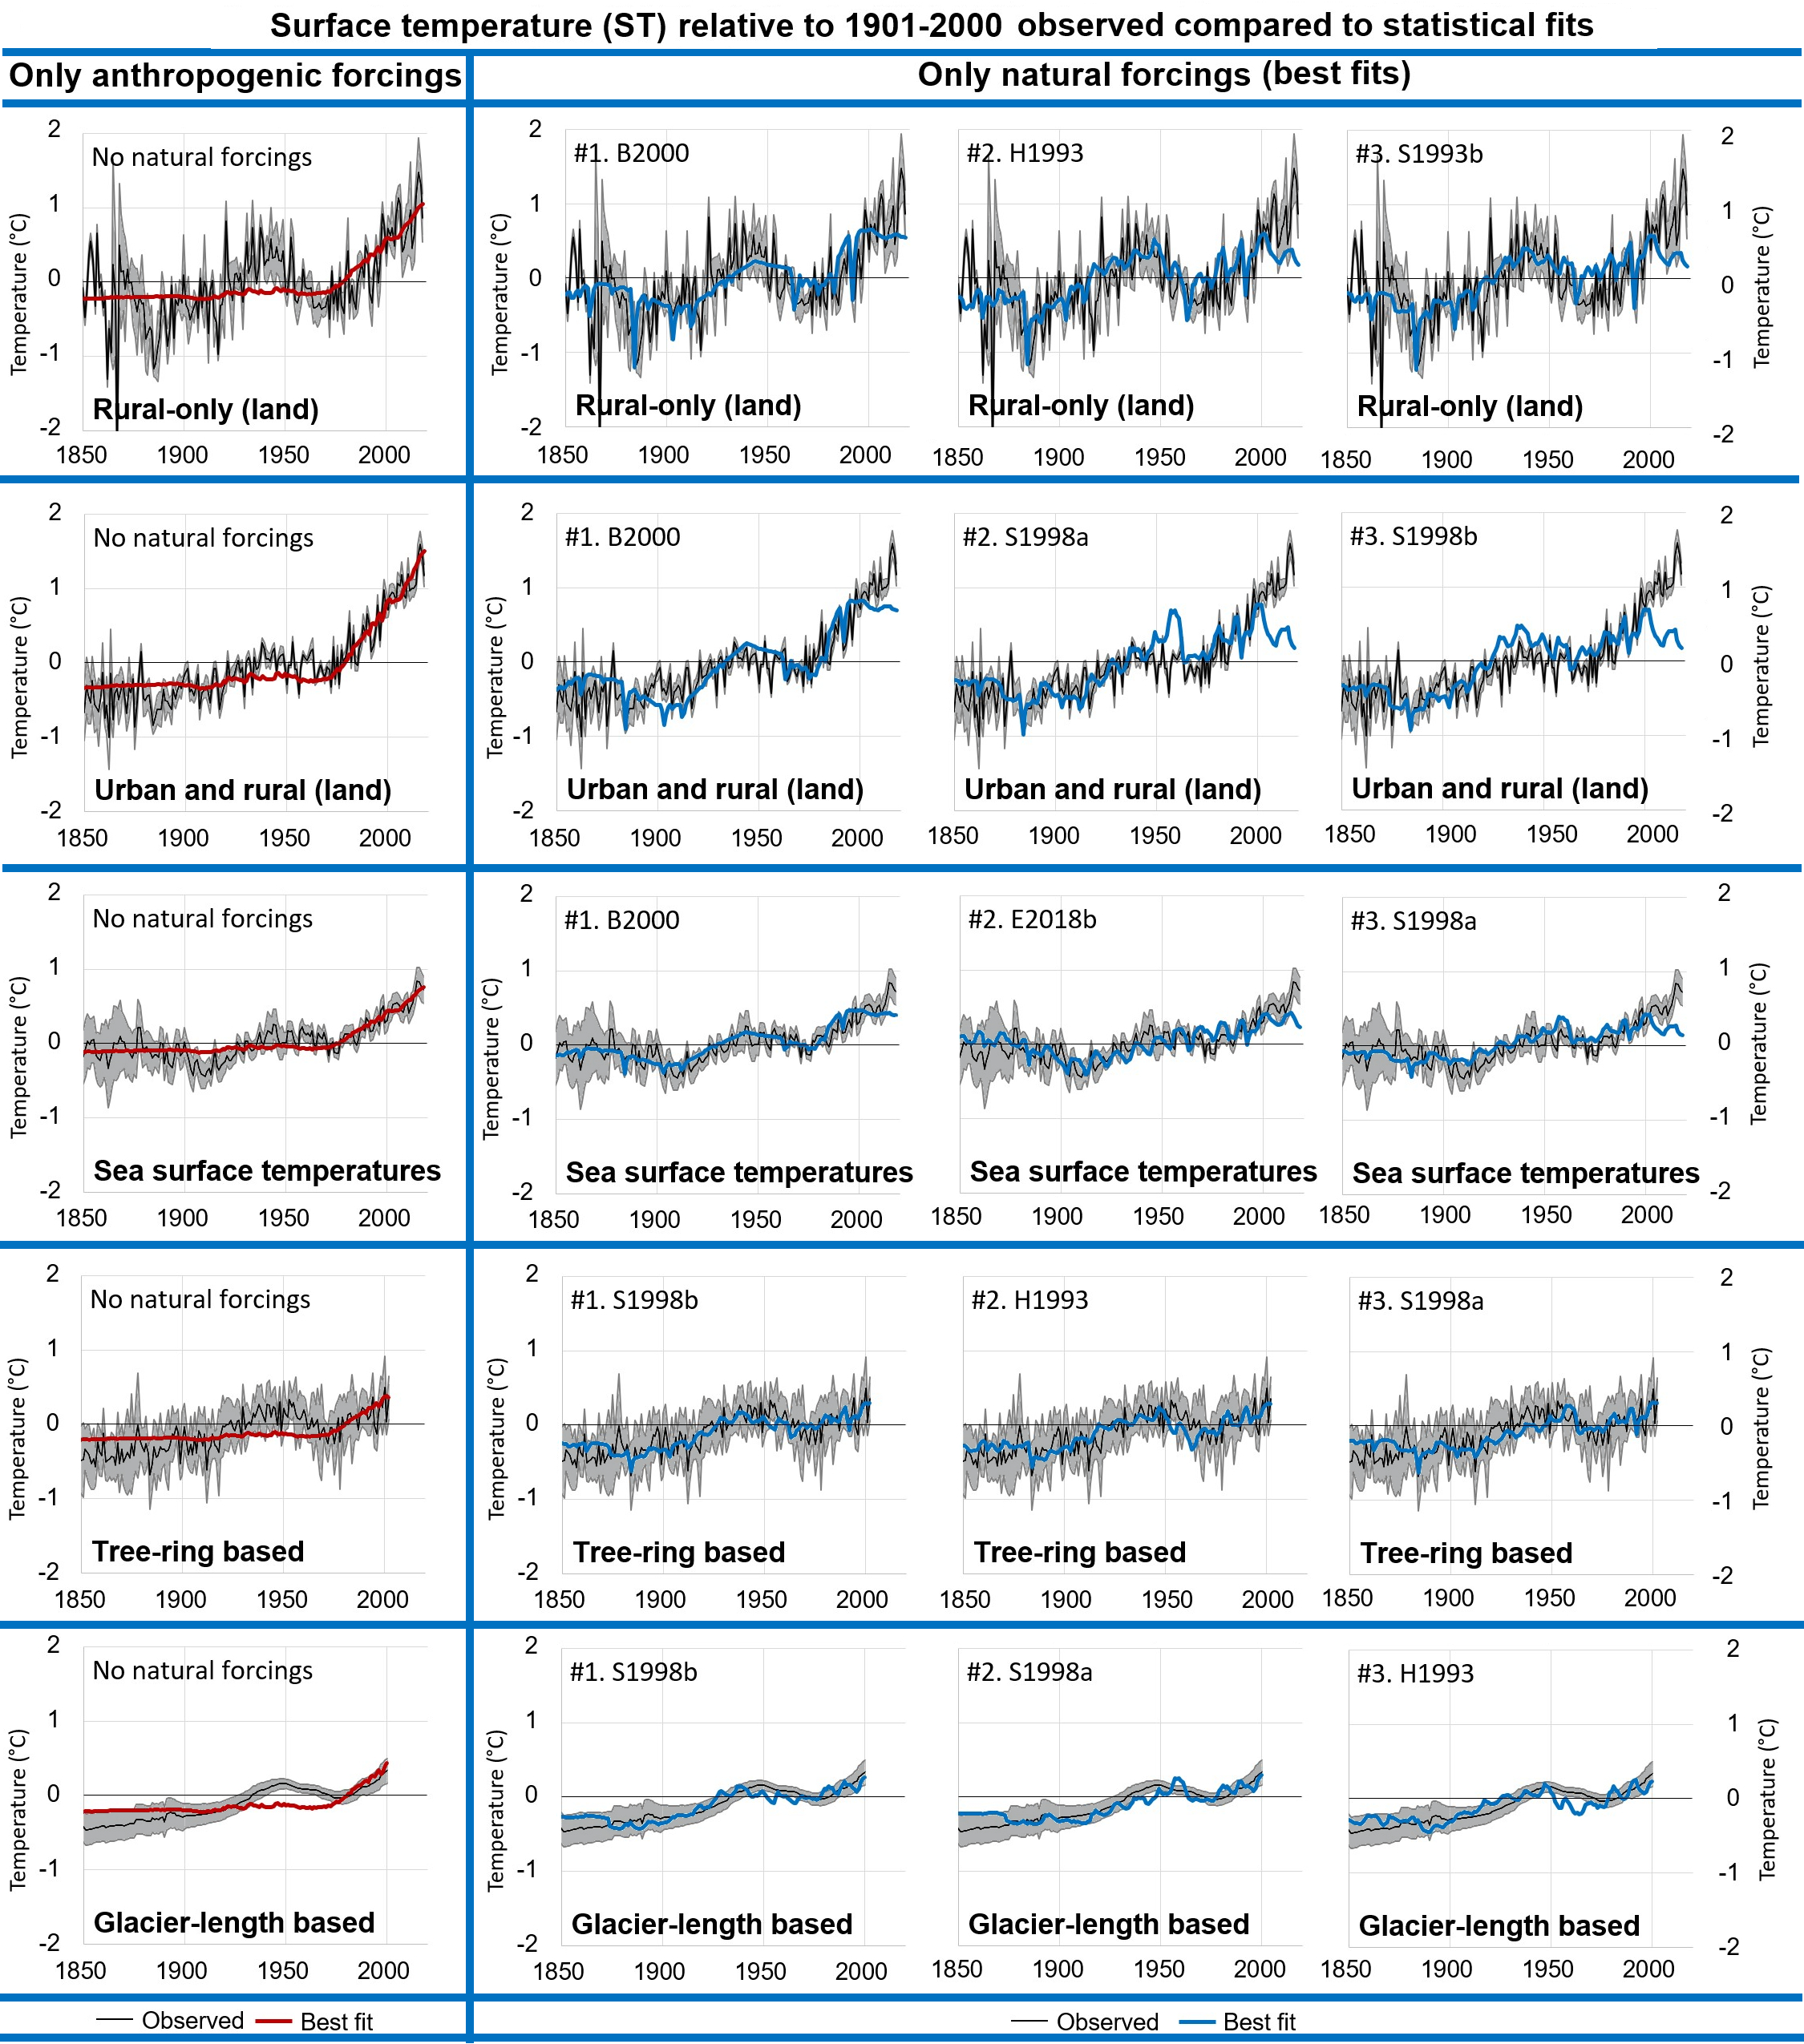
The TSI record that Dr. Schmidt was complaining about is labelled here as “H1993”. But, notice how for each temperature record, we can obtain similarly good fits using other TSI estimates.
Conclusions
In Soon et al. (2023), we reached the following key conclusions:
“(1) urbanization bias remains a substantial problem for the global land temperature data; (2) it is still unclear which (if any) of the many TSI time series in the literature are accurate estimates of past TSI; (3) the scientific community is not yet in a position to confidently establish whether the warming since 1850 is mostly human-caused, mostly natural, or some combination.”
These conclusions are consistent with our findings in another two of our papers that were also published in the last few weeks – in separate peer-reviewed scientific journals and using different independent analyses.
That is, in Katata et al. (2023), we confirmed that the IPCC’s estimate of the extent of urbanization bias in the global temperature data was much too low. Meanwhile, in Connolly et al. (2023), we concluded that it is “unclear whether the observed warming is mostly human-caused, mostly natural or some combination of both”.
Dr. Schmidt and the RealClimate team apparently do not want you to read our papers. They seem to be afraid that if you did, their claims on climate change would no longer seem so convincing.
In contrast, we are not afraid of people reading papers that disagree with us. In fact, we encourage people to read multiple scientific perspectives and form their own opinions. We agree with J.S. Mill’s quote below:

Below are links to the papers we mentioned above. We look forward to further discussion on our papers
References mentioned
- W. Soon, R. Connolly, M. Connolly, S.-I. Akasofu, S. Baliunas, J. Berglund, A. Bianchini, W.M. Briggs, C.J. Butler, R.G. Cionco, M. Crok, A.G. Elias, V.M. Fedorov, F. Gervais, H. Harde, G.W. Henry, D.V. Hoyt, O. Humlum, D.R. Legates, A.R. Lupo, S. Maruyama, P. Moore, M. Ogurtsov, C. ÓhAiseadha, M.J. Oliveira, S.-S. Park, S. Qiu, G. Quinn, N. Scafetta, J.-E. Solheim, J. Steele, L. Szarka, H.L. Tanaka, M.K. Taylor, F. Vahrenholt, V.M. Velasco Herrera and W. Zhang (2023). “The Detection and Attribution of Northern Hemisphere Land Surface Warming (1850–2018) in Terms of Human and Natural Factors: Challenges of Inadequate Data”, Climate, 11(9), 179; https://doi.org/10.3390/cli11090179. (Open access)
- R. Connolly, W. Soon, M. Connolly, S. Baliunas, J. Berglund, C.J. Butler, R.G. Cionco, A.G. Elias, V. Fedorov, H. Harde, G.W. Henry, D.V. Hoyt, O. Humlum, D.R. Legates, N. Scafetta, J.-E. Solheim, L. Szarka, V.M. Velasco Herrera, H. Yan and W.J. Zhang (2023). “Challenges in the detection and attribution of Northern Hemisphere surface temperature trends since 1850”. Research in Astronomy and Astrophysics. https://doi.org/10.1088/1674-4527/acf18e. (Still in press, but pre-print available here)
- G. Katata, R. Connolly and P. O’Neill (2023). “Evidence of urban blending in homogenized temperature records in Japan and in the United States: implications for the reliability of global land surface air temperature data”. Journal of Applied Meteorology and Climatology. 62(8), 1095-1114. https://doi.org/10.1175/JAMC-D-22-0122.1. (Open access)
- R. Connolly, W. Soon, M. Connolly, S. Baliunas, J. Berglund, C. J. Butler, R. G. Cionco, A. G. Elias, V. M. Fedorov, H. Harde, G. W. Henry, D. V. Hoyt, O. Humlum, D. R. Legates, S. Lüning, N. Scafetta, J.-E. Solheim, L. Szarka, H. van Loon, V. M. Velasco Herrera, R. C. Willson, H. Yan and W. Zhang (2021). “How much has the Sun influenced Northern Hemisphere temperature trends? An ongoing debate”. Research in Astronomy and Astrophysics, 21, 131. https://doi.org/10.1088/1674-4527/21/6/131. (Open access)
- M.T. Richardson and R.E. Benestad (2022). “Erroneous use of Statistics behind Claims of a Major Solar Role in Recent Warming”. Research in Astronomy and Astrophysics, 22, 125008. http://dx.doi.org/10.1088/1674-4527/ac981c. (pdf available here).
- N. Scafetta, R.C. Willson, J.N. Lee and D.L. Wu (2019). “Modeling Quiet Solar Luminosity Variability from TSI Satellite Measurements and Proxy Models during 1980–2018”. Remote Sensing. 11(21), 2569. https://doi.org/10.3390/rs11212569. (Open access)
- Montillet, J.-P., Finsterle, W., Kermarrec, G., Sikonja, R., Haberreiter, M., Schmutz, W., & Dudok de Wit, T. (2022). “Data fusion of total solar irradiance composite time series using 41 years of satellite measurements”. Journal of Geophysical Research: Atmospheres, 127, e2021JD036146. https://doi.org/10.1029/2021JD036146. (Preprint here)
- S. Dewitte and S. Nevens (2016). “The Total Solar Irradiance Climate Data Record”. The Astrophysical Journal, 830 25. https://doi.org/10.3847/0004-637X/830/1/25 (Open access).
- T. Dudok de Wit, G. Kopp, C. Fröhlich and M. Schöll (2017). “Methodology to create a new total solar irradiance record: Making a composite out of multiple data records”. Geophysical Research Letters, 44(3), 1196-1203. https://doi.org/10.1002/2016GL071866. (Open access)
- K. Matthes, B. Funke, M.E. Andersson, L. Barnard, J. Beer, P. Charbonneau, M.A. Clilverd, T. Dudok de Wit, M. Haberreiter, A. Hendry, C.H. Jackman, M. Kretzschmar, T. Kruschke, M. Kunze, U. Langematz, D.R. Marsh, A.C. Maycock, S. Misios, C.J. Rodger, A.A. Scaife, A. Seppälä, M. Shangguan, M. Sinnhuber, K. Tourpali, I. Usoskin, M. van de Kamp, P.T. Verronen and S. Versick (2017) “Solar forcing for CMIP6 (v3.2)”. Geoscientific Model Development, 10, 2247–2302. https://doi.org/10.5194/gmd-10-2247-2017 . (Open access).
- N. A. Krivova, L. Balmaceda and S. K. Solanki (2007). “Reconstruction of solar total irradiance since 1700 from the surface magnetic flux”. Astronomy and Astrophysics, 467, 335-346. https://doi.org/10.1051/0004-6361:20066725 . (Open access).
- O. Coddington, J.L. Lean, P. Pilewskie, M. Snow and D. Lindholm (2016). “A Solar Irradiance Climate Data Record”. Bulletin of the American Meteorological Society, 97(7), 1265-1282. https://doi.org/10.1175/BAMS-D-14-00265.1 . (Open access)
- S. Dewitte, J. Cornelis and M. Meftah (2022). “Centennial Total Solar Irradiance Variation”, Remote Sensing, 14(5), 1072. https://doi.org/10.3390/rs14051072 . (Open access)
- T. Egorova, W. Schmutz, E. Rozanov, A.I. Shapiro, I. Usoskin, J. Beer, R.V. Tagirov and T. Peter (2018). “Revised historical solar irradiance forcing”. Astronomy and Astrophysics, 615, A85. https://doi.org/10.1051/0004-6361/201731199 (Open access)
- D.V. Hoyt and K.H. Schatten (1993). “A discussion of plausible solar irradiance variations, 1700-1992”. Journal of Geophysical Research Space Physics, 98(A11), 18895-18906. https://doi.org/10.1029/93JA01944 . (pdf available here)
- V. Penza, F. Berrilli, L. Bertello, M. Cantoresi, S. Criscuoli and P. Giobbi (2022). “Total Solar Irradiance during the Last Five Centuries”. The Astrophysical Journal, 937(2), 84. https://doi.org/10.3847/1538-4357/ac8a4b . (Open access).
- W. W.-H. Soon (2005). “Variable solar irradiance as a plausible agent for multidecadal variations in the Arctic-wide surface air temperature record of the past 130 years”. Geophysical Research Letters. 32, 16. https://doi.org/10.1029/2005GL023429 (Open access)
- W. W.-H. Soon (2009). “Solar Arctic-Mediated Climate Variation on Multidecadal to Centennial Timescales: Empirical Evidence, Mechanistic Explanation, and Testable Consequences”. Physical Geography. 30, 144-184. https://doi.org/10.2747/0272-3646.30.2.144 (pdf available here).
- W. Soon, Ronan Connolly and M. Connolly (2015). “Re-evaluating the role of solar variability on Northern Hemisphere temperature trends since the 19th century”. Earth-Science Reviews, 150, 409-452. https://doi.org/10.1016/j.earscirev.2015.08.010. (Preprint version)
- P. O’Neill, R. Connolly, M. Connolly, W. Soon, B. Chimani, M. Crok, R. de Vos, H. Harde, P. Kajaba, P. Nojarov, R. Przybylak, D. Rasol, Oleg Skrynyk, Olesya Skrynyk, P. Štěpánek, A. Wypych and P. Zahradníček (2022). “Evaluation of the homogenization adjustments applied to European temperature records in the Global Historical Climatology Network dataset”. Atmosphere, 13(2), 285. https://doi.org/10.3390/atmos13020285. (Open access)
- W.W-H. Soon, R. Connolly, M. Connolly, P. O’Neill, J. Zheng, Q. Ge, Z. Hao and H. Yan (2018). Comparing the current and early 20th century warm periods in China. Earth-Science Reviews, 185, 80-101. https://doi.org/10.1016/j.earscirev.2018.05.013. (Preprint version)
- G.A. Schmidt, J.H. Jungclaus, C.M. Ammann, E. Bard, P. Braconnot, T.J. Crowley, G. Delaygue, F. Joos, N.A. Krivova, R. Muscheler, B.L. Otto-Bliesner, J. Pongratz, D.T. Shindell, S.K. Solanki, F. Steinhilber, and L.E.A. Vieira (2011). “Climate forcing reconstructions for use in PMIP simulations of the last millennium (v1.0)”. Geoscientific Model Development, 4, 33–45, https://doi.org/10.5194/gmd-4-33-2011. (Open access).

Can I be my usual boring self here and point to win-win solutions that work regardless of the nature, extent, cause and direction of climate change? Reducing obscene levels of food waste throughout the system from farm to fork and often bin would help here and see also https://regenfarming.news/articles/1699
That’s a great idea if you can pull it off without government intervention.
I agree with the ‘works regardless of the n, e, c and d of climate change’, but: the authors don’t help themselves by being lazy early on in their piece:
‘ Just to complicate matters further, observations from the Arctic show that expected heating may have been underestimated. Rising temperatures melt ice so less solar energy is reflected and darker surfaces absorb more heat. ‘
Anyone with the most basic knowledge of Arctic Sea Ice data knows that it reached a nadir about a decade ago and has been recovering since. It might be helpful if people took on the hypothesis that arctic and antarctic ice extents are cyclical and out of phase with each other.
As for being lazy early in on the piece:
“Many of our insights were overlooked by the UN’s Intergovernmental Panel on Climate Change (IPCC) in their last three Assessment Reports (AR), i.e., IPCC AR4 (2007), IPCC AR5 (2013) and IPCC AR6 (2021).”
If the “insights” discussed were published in 2023, exactly how were they overlooked 2007, 2013, and 2021.?
IPCC works off the available literature, and the literature wasn’t available. Lost me right there, with such carelessness (bias?) right off, there in the introduction.
As for rtj1211:
“… Arctic Sea Ice data … reached a nadir about a decade ago and has been recovering since. It might be helpful if people took on the hypothesis that arctic and antarctic ice extents are cyclical and out of phase with each other.”
It looks like there were 2 very low years in 2007 and 2012 and that it has been pretty flat (not recovering) since. Also, they MAY have out-of-phase components due to decadal ocean oscillations, but there is not really enough data to tell, and they do not seem to be enough to explain the overall loss trends.
The claim that the Soon (2005) correlation continues to be valid is patently false. Even using the updated HS93. https://twitter.com/ClimateOfGavin/status/1700561317285843341/photo/1
Have to agree with Gavin on this one. Figure 3 still shows temperatures rising past 2005 even as the TSI drops.
https://www.researchgate.net/figure/SORCE-total-solar-irradiance-TSI-data-from-2003-to-present_fig1_353450951
Gorilla – lots of studies of tsi showing drop in tsi beginning circa 2005 then elevated starting in 2011. Did Gavin cherry pick a version of TSI to fit his narrative?
Every day, usually, the temperature rises past noon for a few hours while solar intensity declines. Does that show the sun has nothing to do with daytime heating? Of course not.
Every year temperatures rise for a couple of months after solar activity peaks and declines from the June solstice.
Lags. Thermal inertia. Soon knows his stuff.
Is there really a correct TSI reconstruction. So while Gavin can’t insist that this particular reconstruction was cherry picked, neither can Soon claim that this fits his so-called Northern Hemisphere composite. Nick Stokes completely shreds that myth. They used Chinese urban stations in their reconstruction just because it showed a strong 1935 peak.
“Every year temperatures rise for a couple of months after solar activity peaks and declines from the June solstice.
Lags. Thermal inertia. Soon knows his stuff.”
There is no room for thermal inertia in the receivables Soon generates — it might set readers and PR executives to considering the disparity between the time scales of advertising campaigns , elections, and long cons on the one hand, and stellar evolution on the other.
Operating as it does on the level of a Marc Morano movies, this whole affair is beginning to sound like a rewrite of the Norwegian Parrot skit in which John Cleese drags his office mates along to witness his argument with the pet store owner.
https://vvattsupwiththat.blogspot.com/2023/09/wuwt-are-you-or-have-you-ever-published.html
Can we reasonably infer by your comment that you agree with the strong correlation between TSI and temp up until about 2005, and only after that there is a strong divergence?
Soon needs to hide the decline?
The test of any hypothesis, (and there are many regarding climate change), is to look at predictions made years ago by climate crisis proponents and see how the predictions have held up over the years. For myself, I watched for 30 years for sea level rise at my dock in a Maryland tidal creek and saw no change in the level of the tides over those 30 years. The tides were still going out to reveal the muddy bottom just like it did when my wife and I built our home adjacent to the creek those years ago. I would like to have Dr. Schmidt and others explain what all the concerns are regarding climate change as the Earth has its own time frame and responses to its own and planetary and solar dynamics.
Not sure exactly where you are located, but in general we are seeing rising shore waters in Va, Md due to sinking ground (subsidence from glacier age, groundwater extraction) and some background level of sea level rise.
Changes in land height frequently dwarf actual changes in sea level at many locations. Prior to the satellite era it was very difficult for climate scientists to determine the actual rate of sea level rise
You have the sign wrong on postglacial isostasy
One of the interesting things about my sunspot model is that I figured out a way to separate the sunspot signal into two signals, which I call x1 and x2. The x1 signal looks very much like signals related to the solar magnetic field (e.g. modulation potential), and x2 looks very much like reconstructions of TSI. As shown in the following plot against both the PMOD version of the space-sensor data, and a TSI reconstruction from Greg Kopp’s TSI Page.
https://localartist.org/media/x2vTSIGreg.png
This next plot shows how the two components contribute to global temperature. The thing to note is that the x2 component, which seems to visually relate to TSI reconstructions, is not a major contributor to recent warming. Recent warming is almost entirely due to the x1 component, which visually relates to the solar magnetic field, and it’s temperature contribution looks very much like the anthopogenic forcing in the plots above.
https://localartist.org/media/SeperateComponents.png
The other interesting thing is that the m(x2) plot looks very similar to the results obtained from the cycle-length models of Friis-Christensen & Lassen (1991 and 2000) where they were attempting to relate solar activity to sunspot cycle length.
If you haven’t already seen it, a basic description of my model is available on github.
https://github.com/bobf34/GlobalWarming/blob/main/hybridmodel.md
I am trying to connect or get the contact information for Dr. Judith Curry.
If you look at the “About” section of the blog you will find:
You can contact me via email at: curry.judith (at) yahoo.com
Here is something no one seems to be talking about: The heat generated by things that work. Not CO2, just heat. Forget GHG. Could it not be that all the things we do that are not 100% efficient (so, everything) simply heat the atmosphere? Take an EV, if you like. They are touted as 70% efficient, but that is the efficiency of the battery to the wheels. Most of that electricity comes from a fossil-fueled plant today. Between the generations of the electricity, line losses, and battery charging losses, the overall efficiency of EV’s is about 35%. That means 65% is lost along the way as heat. ICE’s are about the same. Kitchen stoves make heat. Air conditioning makes heat. Working out makes heat. All that heat goes into the atmosphere. Doesn’t it follow that, with Earth’s population doubling since 1970, humans are simply producing more heat? To the extent climate change is being affected by humans, maybe it’s mostly just a function of population. I don’t think you’ll be hearing a proposal to reduce population at COP 28 in Dubai.
Brian, it’s an interesting thought, but there’s a significant difference in scale. Just take electricity. In the US, we generate about 4000 billion kWh/year. Let’s pretend for the moment that all of that is converted to heat. The sun provides about 5kWh/m^2/day at ground level. This is a number you would use for estimating solar panel output, so it’s low in terms of terrestrial heating as some of the radiation is absorbed by the atmosphere. The US land area is about 10 million square kilometers. If I did the math right, then the solar inbound radiation over just US land is around 18 million billion kWh/year, or 4,500 times the total electrical generation.
I believe your figures are way off for well to wheels heat losses. Many studies have found EVs are about 3x more efficient than ICEs due to heat losses in the latter. Here’s one: https://cleantechnica.com/2020/06/10/this-stunning-chart-shows-why-battery-electric-vehicles-win/
I believe he’s including the fossil fuel powerplant that powers the grid that runs the battery charger, or the handy diesel generator that gets placed next to the battery charging station to run it.
Still, it is a question of scale. The energy mankind uses is pretty trivial compared to the amount of sunlight that hits the planet. If you look at the cross sectional area of the Earth, which is always lit by the sun, and multiply that by 1362 Watts/square meter, it produces a number that’s 22,000 times larger than the world’s electric production. Toss in fossil fuels for transportation and smelting and we still wouldn’t be using 0.01% of the energy hitting the top of the atmosphere.
Figure A.1 of Soon (2009)
That’s a total disaster, it will make people believe that Arctic temperatures directly follow net changes in solar irradiance. Arctic temperatures follow AMO temperatures, which are colder when the solar wind is stronger, and warmer when the solar wind is weaker. Every other warm AMO phase is during a centennial solar minimum. And something is amiss with the late 1800’s to early 1900’s Arctic temperatures in Figure A.1, the AMO was in its warm phase in the late 1800’s, and cooled strongly into the early 1900’s.
At annual scales there were warmer AMO anomalies in 1969 and 1979-80, because there were major lows in the solar wind then, clearly overwhelming the higher TSI at sunspot cycle maximum.
https://www.woodfortrees.org/graph/esrl-amo/from:1880/mean:13/plot/sidc-ssn/from:1880/normalise
“clearly overwhelming the higher TSI at sunspot cycle maximum”
That doesn’t make sense, scrub that. The important point is that AMO anomalies are always colder around sunspot cycle minimum during a cold AMO phase, and never colder around sunspot cycle minimum during a warm AMO phase. Only the changes in the major highs and lows of the solar wind can account for that. From the 1990’s the major lows shifted from sunspot maximum to just after sunspot minimum.
Climate change is not an academic debate. If we get this wrong, America can not survive.
After a life time engineering management, a score of nuclear power plants, two score fossil fueled (carbon) power plants and assessing advanced technologies, I remember my days in the research lab, the banner over the door:
Truth is a function of room number and
Those with the gold own the truth.
We must do better.
I don’t know why they cannot say concisely what their rural set that they compared with others was, and why they chose such a bizarre collection (as Gavin rightly said) from a restricted region. I dug into their SM, and I found that it was made up thus:
1. the component of GHCNV3 CONUS tagged rural. This is coincident with USHCN, and so they sought also to apply a TOBS cottection.
2. Arctic, anything above 60N tagged rural in GHCN V3
3. Same with Ireland, with NI merged in
4. A very strange treatment of China. They included a lot of stations , but some that were definitely not rural. What stood out at the head of the list were Beijing and Shanghai. Then Tianjin, Fuzhou and similar. These are big cities and are marked U (urban) in GHCN. There are 14 of those, and 71 others that were marked I (intermediate) in GHCN. I can’t see why China would be chosen anyway; I doubt if it is because of accessible metadata. But Beijing? Shanghai? Rural?
I found that they had actually calculated all combinations of U+R, R and all NH, their funny region. So you can see that the choice of that region has an effect in the i930-40 peak which is similar to the choice of rural vs U+R. I graphed their results here:
https://s3-us-west-1.amazonaws.com/www.moyhu.org/2023/09/Soon44.png
The black is all NH land stations; the red is rural from their funny region (including Beijing). The blue is what they should have compared with the black, where the regions match. The green, rural but all-NH, shows the effect of the region selection on rural.
‘If we didn’t know better, we’d think the operative rules were: Never seek logical or alternative answers, if you can blame a phenomenon or problem (like decreasing frog populations) on global warming.’ ~Soon & Legates
Gavin and I are discussing this on twitter. Here is a response from Connollys and Soon
Gavin and others who apparently never read Hoyt & Schatten (1993) have been pushing the false claim that it was a “solar cycle length” reconstruction since Lean et al. (1995) when Judith Lean invented that idea.
This zombie argument seems to have been reawakened recently by Dr. Chatzistergos in his 2023 paper that we discuss in Soon et al. (2023). However, if you read Hoyt & Schatten (1993), you can see that this is nonsense.
Hoyt & Schatten (1993)’s TSI reconstruction was based on 5 solar activity proxies for the pre-satellite era and the NIMBUS-7 satellite for calibration and the satellite era. (As an aside, the updates by ACRIM have essentially updated the satellite component using the ACRIM TSI composite instead of the original NIMBUS-7).
All the main TSI reconstructions except for Dewitte et al. (2022)’s rescaled Sunspot Number (SSN) reconstruction use multiple solar proxies – each trying to capture different aspects of solar variability.
Hoyt and Schatten (1993) included Solar Cycle Length (SCL) as 1 of its 5 proxies, but only one. And they didn’t use the unusual statistical filtering that Laut (2003) was criticising.
Moreover, Laut (2003) was NOT criticising the use of SCL as a solar proxy, but rather Friis-Christensen & Lassen (1991)’s claim that Northern Hemisphere temperatures were well correlated to a statistically filtered version of the SCL data up until the 1980s.
So, the claim by Gavin and others (e.g., Chatzistergos) that Hoyt & Schatten (1993)’s TSI reconstruction was somehow “debunked” by Laut (2003) is completely wrong.
Meanwhile, in Connolly et al. (2023), we carried out an independent analysis of 5 different estimates of Northern Hemisphere temperatures – as well as the two we analysed in Soon et al. (2023), we also considered sea surface temperatures (SST); glacier-length temperature proxies; tree ring temperature proxies.
We also considered a total of 27 different TSI reconstructions (including Hoyt and Schatten, 1993; Matthes et al., 2017; and the SATIRE and NRL TSI 2 reconstructions).
We reached similar conclusions to Soon et al. (2023).
—
Further details,
Hoyt & Schatten (1993)’s 5 solar proxies in their TSI reconstruction are:
1) Mean sunspot number
2) Decay rate of the solar cycle
3) The fraction of penumbral spots
4) Solar equatorial rotation rate
5) Solar cycle length
In contrast, the Matthes et al. (2017) composite is the mean average of two similar TSI reconstructions: Krivova et al.’s “SATIRE” model and Lean et al.’s NRL TSI 2 reconstruction
NRL TSI 2 uses three solar proxies:
1) Hoyt & Schatten (1998)’s Group Sunspot Number (GSN) (from 1610 onwards)
2) Sunspot areas (from 1874 onwards)
3) 10.7 cm radio flux readings (from 1950 onwards)
The version of SATIRE used by Matthes et al. (2017) uses:
1) The International Sunspot Number (ISN) v2.
2) Sunspot areas
You can see from Hoyt and Schatten (1993) reference list that they have not even mentioned Baliunas
and Jastrow (1990) paper nor the study of sun-like stars …
“Willie Soon and Sallie Baliunas (2003) reviewed more than 200 previous studies and concluded that the evidence for the existence and global extent of both the Medieval Warm Period and the Little Ice Age was well established. It was hardly a controversial result, yet the Soon and Baliunas (2003) paper was greeted by a firestorm of controversy. Three editors of the academic journal in which the study had been published resigned in protest.”’ ~David Deming, ‘Global Warming, the Politicization of Science, and Michael Crichton’s State of Fear.’ JSE. 2005 Jun;19(2).
Global warming/climate change modeling is essentially an updated game of monopoly with the chance drawing of a card allowing politicians to arbitrarily raise various costs of production like, energy.
TSI reconstructions are highly speculative and depend on an increase in facular brightness over time that is based on thin air, as the sunspot data and cosmogenic isotopes do not support such an increase in solar activity.
Natalia Krivova of Satire and Judith Lean of NRLTSI2 explain it in a 2018 publication:
“While the sunspot and facular indices estimate solar cycle changes, an additional long-term facular contribution produces secular irradiance changes speculated to underlie the solar activity cycle at times prior to 1950. According to simulations of eruption, transport, and accumulation of magnetic flux on the Sun’s surface since 1617 using NRL’s magnetic flux transport model including variable meridional flow, a small accumulation of total magnetic flux and possibly the rate of emergence of small, magnetic bipolar (“ephemeral”) regions on the quiet Sun can produce a net increase in facular brightness (Wang, Lean, and Sheeley, 2005). The resulting modeled increase in TSI from the Maunder Minimum to the present-day quiet Sun is about 0.04 % (see estimates by Lean et al., 2005). Since this background component is speculative, the associated uncertainty in the reconstructed TSI on these time scales is equal to the magnitude of the adopted background component itself.”
https://arxiv.org/ftp/arxiv/papers/1601/1601.05397.pdf
The problem with climate science is that a lot of the data is unreliable, and it is important to know when we are relying on such data. In fact, many times like this one, it is not data at all but the output of a model. Models are products of the human mind without connection to the real physical world. Models do not produce evidence.
TSI reconstructions are not fit for purpose because the trend they show is bogus and introduced by researchers based on unsupported assumptions.
TSI changes are too small to have a climate effect. That tiny change of 0.1% in the total energy received by the Earth is lost in the climate noise. All the effects of the variable Sun on climate are indirect, caused by changes induced on the atmosphere. Plenty of evidence of this that people don’t want to consider, including:
– The first solar effect detected by Karin Labitzke in 1987 takes place in the polar atmosphere during the polar night, when the Sun is not even shining.
– The effects of solar activity on Earth’s rotation rate can only be explained through changes in atmospheric circulation.
The discussion between Willie and Gavin is meaningless.
@Javier While I agree and it is by definition that models are not evidence of ANYTHING in science, you are clearly just plain wrong in so many ways in your assumptions about TSI and the Soon / Connolly papers vs the Gavin Schmidt dissembling/straw man/obfuscation nonsense.
You need to read the papers more carefully and really try to understand them, and the physics and mathematics involved, before making the patently absurd claim that TSI changes are too small to have a climate effect. That just exhibits massive ignorance of basic physics.
@Jonathan Cohler,
The calculations have been done. You have them at:
Wigley, T.M.L. and Raper, S.C.B., 1990. Climatic change due to solar irradiance changes. Geophysical Research Letters, 17(12), pp.2169-2172.
https://agupubs.onlinelibrary.wiley.com/doi/abs/10.1029/GL017i012p02169
“It is easy to estimate roughly what the range of global-mean temperature changes should be for the Foukal-Lean data. For the high frequency component, the maximum solar irradiance change is ΔI ≃ 1.1Wm-2, which translates to a radiative perturbation at the top of the atmosphere of ΔQ = (l-a) ΔI/4 = 0.19Wm-2 where a is the planetary albedo. For λ-1 = 0.3-1.0°C/Wm-2, the equilibrium ΔT would be 0.06-0.19°C.
The transient ΔT range, however (i.e., the temperature change that would actually be observed), is much less than this because of the strong damping effect of oceanic thermal inertia. At a frequency of 0.1 cycles per year, the damping is
about 77-87%, with greater damping occurring for greater λ-1 (see Wigley, 1988, Table 1). Using these percentages gives a transient ΔT of between 0.23×0.06 = 0.014°C and 0.13×0.19 = 0.025°C. These values are so small that the solar effect would be virtually undetectable.”
Changes in temperature due to changes in TSI should be undetectable, because they should produce a change in temperature that is below the uncertainty in our measurements. The fact that we are able to detect a four times bigger change than expected (0.1°C) introduces the need for an amplifying mechanism.
Arguments about the climatic effect of TSI changes are akin to medieval discussions about how many angels can stand on the tip of a pin. The solar effect on climate is clearly not due to changes in TSI and those that insist on TSI changes to either defend a big solar effect or refute it will never understand how the variable Sun changes the climate.
@Javier wrote The calculations have been done. You have them at:
Wigley, T.M.L. and Raper, S.C.B., 1990. Climatic change due to solar irradiance changes. Geophysical Research Letters, 17(12), pp.2169-2172.
https://agupubs.onlinelibrary.wiley.com/doi/abs/10.1029/GL017i012p02169
Is this a serious response or a joke?????
The “study” you cite is a MODEL study, which as you pointed out is evidence of NOTHING. If you haven’t gotten the picture yet, the ONE thing that we know for SURE is that all the models are WRONG. Models are not used for the purpose of evidence. They are used to help us gain insight and understanding.
Referring to some calculations done by an antiquated computer MODEL 33 years ago, and declaring case closed, is perhaps the best example one could give to explain the problem with Gen X-Y-Z / Millennials masquerading as “climate scientists” today.
The CURRENT papers by Soon et al are based on REAL PHYSICAL EVIDENCE, i.e. EMPIRICAL DATA. You need to understand the difference DATA and MODEL OUTPUT before you can begin to understand the scientific process.
You are the one not understanding. The calculation of how much the global temperature should change for a 1.1Wm.2 change in TSI does not involve a model. It is a very simple calculation that I have posted and anybody can follow. Whether the authors of the study use models for other things is unrelated. The change in TSI is too small to change the surface temperature enough to detect it.
@Javier Wrong again. Here is the Abstract of the paper YOU cited from 1990.
Abstract
Solar irradiance reconstructions back to 1874 are used to estimate the effect of the Sun on global-mean temperature. The importance of the history effect, whereby recent temperature changes may be influenced significantly by past forcing changes, is evaluated. Modelled temperature changes are shown to be relatively insensitive to model uncertainties. The overall range of modelled temperature variations is extremely small, 0.05°C.
An equation that you make up is also a MODEL. It doesn’t matter how much you believe in the equation. It is still a MODEL. It is not EVIDENCE of ANYTHING.
Yes, I was wrong. I said anybody could follow the calculation I have quoted above and understand where it comes from, but clearly you can’t.
@Javier Beautiful. The next example of Gen X-Y-Z / Millennial response. First try obfuscation. Then try straw man. Then try dissembling. Then try non-sequitur, and if all else fails, the ever-ready ad-hominem attack!
In any case, getting back to civilized discussion, a mathematical model is just that — a model. Just because you believe in a model (or calculation as you called it) does NOT mean that it represents reality.
In science, we do experiments to see if we can validate models NOT the other way around. We don’t use models to validate reality. Reality is what it is.
In this case, the paper you cited is a 33-year-old letter about a model. It is not experimental evidence of anything, and nothing was solved there. And your equations are nothing more than models.
The papers by Soon et al, on the other hand, are real science. They look at real physical evidence, and indeed they are quite convincing in showing that the models in which you so fervently believe are indeed WRONG.
The 0.1% change in TSI associated with a single solar cycle is indeed lost in the noise. When I compute the coherence between the sunspot number and global temperature, there is very low coherence at a frequency of 1/11 year^-1. That said, I do suspect that long-term changes in TSI affect climate, as well as changes in solar magnetic field strength. One piece of evidence supporting magnetic effects on climate also comes from the coherence function. While the coherence is low for the 11-year cycle, it’s high for the 22 year cycle.
@Robert Cutler,
Changes in surface temperature will not lead to the solar effect on climate. It has been tried for 200 years. Karin Labitzke demonstrated a solar effect on stratospheric North Pole temperature during winter, i.e., when the Sun is not even shining. It is all a dynamic effect from the ozone layer to the global atmospheric circulation, affecting the rate of rotation of the Earth.
@Javier, I’m not sure what you meant by “Changes in surface temperature will not lead to the solar effect on climate.” Surface temperatures are not a forcing function on the sun.
Here’s another coherence result you may want to consider. There is a strong coherence at 1/2.5 year^-1, which is suspiciously close to the frequency of the 28-month QBO. This is another frequency I have observed in the sun’s toroidal magnetic fields. The sun doesn’t have to shine if magnetic fields are the forcing function.
Yet another frequency where the coherence is high is 1/3.7 year^-1. I don’t know if there’s a climate oscillation associated with that frequency. I suspect that if there is one, you’ll know it off the top of your head.
Sure, the 3.7 year frequency might be ENSO. The solar effect on ENSO has been reported multiple times.
The 22-year frequency is unlikely to be the Hale cycle, despite being a frequency reported many times, particularly in tree rings and drought indices in the US midwest. The climate system is unlikely to respond noticeably to a change in polarity in the solar magnetic field. My guess is that since the solar effect is cummulative, it becomes stronger after two high or two low activity solar cycles, and these pairs are common in the record, giving the impression of a 22-year cycle.
I totally agree. I’ve been pondering more. We were not there 1 million years ago to see what the climate was like in Northern America. The prevalence of some fossil of a creature now located in an entirely different part of the world is just an indicator. It can’t tell you exactly when this animal was here. As for monitoring the sun and its fluctuations, satellites were not there thousands of years ago to tell us exactly what the sun was doing. A lot of the conclusions made in this field are based off our own conclusions, which is circular reasoning. That’s the logic of using a model. This field is so new, and there is so much we don’t know.
Javier – agreed, total TSI variability is very low, but are there specific wavelengths where changes are more significant?
I’d be looking for wavelengths where significant changes occur during the cycle and between cycles and cogent mechanisms for how such wavelengths could be transformed into energy stored within the earth’s total energy system.
You are correct, rtj. The UV changes 10 times more, but the UV is only 1% of the energy. It is not the energy. The actual mechanism was proposed by Colin Hines in 1974 in this article:
Hines, C.O., 1974. A possible mechanism for the production of sun-weather correlations. Journal of the Atmospheric Sciences, 31(2), pp.589-591.
https://journals.ametsoc.org/view/journals/atsc/31/2/1520-0469_1974_031_0589_apmftp_2_0_co_2.xml
He was right. That is how the Sun changes the climate. It is fully explained in my forthcoming book, together with the supporting evidence.
@Javier wrote The calculations have been done. You have them at:
Wigley, T.M.L. and Raper, S.C.B., 1990. Climatic change due to solar irradiance changes. Geophysical Research Letters, 17(12), pp.2169-2172.
https://agupubs.onlinelibrary.wiley.com/doi/abs/10.1029/GL017i012p02169
So you argument, in essence is, we believe in the equation by which we calculated TSI’s theoretical impact on global temperature (from this 33-year-old letter), and therefore all actual experimental results and data we therefore ignore.
Haha! Brilliant!
No. We believe the fact that a 1.1 W/m2 out of 1361 W/m2 is just too little a change and therefore has a negligible effect. Where is the evidence of the opposite?
Please note that evidence that solar variations have an effect on climate does not constitute evidence that it is the change in TSI that is responsible for that.
We know that TSI varies about 0.1% over the course of a single solar cycle. What we don’t know is how TSI varies over the course of multiple cycles, which is why we have PMOD, ACRIM, etc composite reconstructions. Even if a given composite is correct, we still don’t know how much TSI has changed in the 200 years prior to 1978. We can’t even reliably measure TSI from the earth’s surface using modern instrumentation, so there aren’t going to be any reliable proxies other than sunspot records, and perhaps records relating to solar magnetic activity. TSI models that use these proxies, even if correct, cannot be proven as being correct. We don’t have the data.
I’ve noticed that almost all of the models that use sunspots as a proxy are overly focused on the characteristics of individual sunspots or sunspot groups, which is fine if you want try and detect solar influences on weather, but not if you want to detect solar influences on climate. For that you need to look over much longer time periods, and you can’t afford to haphazardly throw away information which is exactly what happens when sunspots are reduced to basic statistical parameters such as their peak, minimum, cycle length, tail length, area, etc.
When I think about solar activity I find it helpful to think of the sunspot signal as a modulated carrier of information, and that there’s more information in the frequency modulation than in the amplitude modulation (e.g. number of sunspots). In the following short-time FFT (STFT) plot, the 11-year cycle is at 0.09 year^-1, and the 100-year cycle at 0.01 year^-1. Note how the 11-year cycle is generally increasing with frequency over time and the 100 year cycle is decreasing in frequency. It’s a little hard to see here, but the amplitudes (as computed over long time periods) are changing very little; something worth consider this when attempting to extrapolate TSI based on cycle-to-cycle variations in amplitude over the last few sunspot cycles.
https://localartist.org/media/stftSunspots100_180grid.png
The STFT result is computed using two different record lengths with the usual tradeoff between frequency and time resolution. I prefer this type of analysis to wavelet analysis, at least for this particular dataset. Note how what appear to be frequency shifts in the upper plot sometimes resolves into multiple frequencies in the lower plot.
As I mentioned before, Friis-Christensen & Lassen (1991 and 2000) were attempting to relate solar activity to sunspot cycle length. This makes sense if you accept that a warmer, brighter sun is going to have faster convection currents, but I believe that their results failed because their simple model failed to capture a lot of useful information in the sunspot signal (math errors didn’t help).
My sunspot-based model reacts to both amplitude and frequency modulation.
https://github.com/bobf34/GlobalWarming/blob/main/hybridmodel.md
Dr. JC: Did you not know of Leif Svalgaard’s work? He made a solid case for a relatively flat solar TSI floor that precludes the large TSI excursions of HS93, and he specifically rejected HS93.
https://svalgaard.leif.org/research/TSI-Reconstruction-2014.png
Svalgaard’s TSI model is the most restrictive among them all, and is all that is necessary to understand that sunspots can be used with existing TSI data to create a useful SN-TSI model.
Using an empirical flat floor PMOD TSI model perfectly yields the actual 30ya HadSST3 difference between 1890-2010 of 0.47°C.
https://i.postimg.cc/769RYf0b/S-B-Equation-and-Sun-Climate.png
The HS93 TSI reconstruction provides too large a TSI difference between the first and second halves of the series, resulting in a calculated temperature change that is far too high between these two halves using the Hansen Planetary Temperature Equation (ie a modified Stefan-Boltzmann equation).
Sadly the big problem is everyone involved in this discussion has frozen viewpoints from the 1990s that have already been falsified.
Here is Leif’s 2018 Four Centuries of Total Solar Irradiance:
https://svalgaard.leif.org/research/Four-Centuries-TSI.png
Back in 2018 I used PMOD v1709 with the new v2 SN to produce two TSI models, a non-linear model and a linear model. They are plotted over Svalgaard’s graphic below:
https://i.postimg.cc/tCDrySqx/Svalgaard-vs-Weber-TSI-models.jpg
In my comment above, second link, I used the non-linear model which has a more restrictive TSI range than Leif’s TSI model.
The non-linearity stems from large sunspot areas depressing TSI when area is very high, and is most apparent during high activity sunspot cycles.
Notice in the NASA CERES TSI Composite, there are very few TSI downspikes (in blue) during this solar cycle compared to the previous two cycles. This has contributed to the 2023 first eight months TSI average being higher than every complete year since 2000, making it a top-tier TSI year so far.
https://i.postimg.cc/YCfvqVMn/Ceres-TSI.png
High TSI is what has/is forcing this predicted warming El Niño:
https://i.postimg.cc/Ls4MK1GJ/Sunspots-TSI-and-Eq-OHC-last-year-05-Sep23.png
The sun most likely produces a very narrow TSI range, not the large decadal excursions favored in HS93, but a solar TSI floor as established by Dr. Svalgaard, and a solar TSI ceiling, probably limited by the size of the sun.
“Gavin and I are discussing this on twitter. Here is a response from Connollys and Soon”
JC – did you mean “Soon and I” vs “Gavin and I”?
thanks
>> Gavin and I are discussing this on twitter.
>> Here is a response from Connollys and Soon
Aw, this is highly interesting! Any chance you might give an update on this discussion?
So far the state here is, Soon wrote something, Schmidt commented on it and Soon had some remarks..
Is there anything further from Schmidt?
“You can see from Hoyt and Schatten (1993) reference list that they have not even mentioned Baliunas
and Jastrow (1990) paper”
Given that Hall & Lockwood were unable to recover the Baliunas & Jastrow result by reanalyzing their data, that is hardly surprising.
‘This isn’t the first time we’ve seen such deceptive scientific high jinks. “NASA’s Goddard Institute, now under Mr. Hansen’s successor Gavin Schmidt,” says Jenkins (HW Jenkins Jr.), “put out a release declaring 2014 the ‘warmest year in the modern record’ when it was statistically indistinguishable from 2005 and 2010.”’
If the Left is looking for human-caused disaster, they need look no further than communism, the socialism of Greece and dead and dying Old Europe, the liberal Utopianism of California, radical Islam’s inhumanity to man and the Democrat party’s spending of trillions of dollars on Hot World alarmism without leaving a trace.
The differences in the various satellite readings concerns me. They are getting lower over time so are the readings becoming more accurate? Are the newer satellites reading the same thing? Are they being manipulated to give lower readings? Which one is right? How are they stitched together and which one is take as the standard to be adjusted to? Measurement is so critical to all of these variables, many of which are inherently variable to a greater degree than the result claimed.
Grant, you might find this 2018 paper by Svalgaard of some interest.
https://arxiv.org/abs/1812.09301
Here’s a direct link to the pdf
https://arxiv.org/pdf/1812.09301
I’ve concluded that we really don’t know how TSI has changed over the last 45 years, much less over the last several hundred.
Exactly. TSI data is unreliable out of the last cycles.
TSI reconstructions are fairy tales.
Why don’t you read more of Svalgaard’s work instead of just relying on one paper that criticizes the consensus TSI? He has made a case for a relatively flat solar TSI floor that precludes the large TSI excursions of the HS93.
https://svalgaard.leif.org/research/TSI-Reconstruction-2014.png
“Exactly. TSI data is unreliable out of the last cycles.
TSI reconstructions are fairy tales.”
Your advice is unreliable and your stories are fairy tales. You wish to critically broad brush all TSI work as equally bad so you can continue to dismiss TSI forcing out of hand.
Congratulations on maintaining your 1990s frozen views.
This is a great write up with an appropriate tone and data/logic to marshall the arguments. I haven’t yet read the original papers but will certainly do so. I’ve been a green energy lawyer and in the climate policy field for almost 30 years. I’m always open to new data and these data seem rather important for the climate science and policy communities to discuss broadly. If the conclusions are accurate, it would be truly a sea change in our understanding of climate. It would not, however, change my views about the need to shift rapidly toward a fully or almost fully green energy economy. I was lead author on a report for the Central Coast region of Santa Barbara back in 2008 and we concluded that even if climate fears were overblown, other concerns such as local control, air pollution, peak oil (still a concern though timing is as ever uncertain), foreign policy, and economics, all still weigh heavily in favor of the green energy transition.
Aramis720 – While I agree with your comment that we should shift to cleaner forms of energy, we should be shifting to both a cleaner and more efficient form of energy. Cleaner but less efficient forms of energy are often in reality dirtier.
Germany and most of europe is currently in its 33rd straight day with electric generation running less than 25% of normal (about 10-15% of capacity). Germany and most of europe experienced a 19 day period in Dec 2022 where electric generation from both solar and from wind ran approximately 10% of normal (granted solar only runs 5%-10% of capacity during winter due to the latitude).
What “cleaner” forms of energy are you referring to?
Jonathan Cohler | September 11, 2023 at 8:57 am |
What “cleaner” forms of energy are you referring to?
Jonathan – I dont know the answer to that question or what type of clean energy will evenutualy evolve (other than nuclear) – just noting that the wind is not nearly as efficient or as clean as the advocates claim. Solar does fill a nice productive niche, though limited due to night. As demonstrated by the Feb 2021 freeze, wind and solar are simply not a solution for 100% renewable. Wind was a 90% plus failure across the north amercian continent for 4 days, and 9 days in Texas.
Yes, the “clean” energy proposed by the climate crazies (Wind and Solar) is definitely neither “clean” nor capable of producing anywhere near the amount of energy needed. It is just communist dogma used as an excuse to steal huge sums of money from the middle class and poor people of the world to subsidize their “clean energy” false conspiracy and at the same time funnel huge sums of money to our geo-political enemies.
What do you mean by efficient in this context? Solar and wind are of course highly efficient today in terms of harnessing available energy for electricity. Germany is leading the world in many ways in showing how a large economy can relatively quickly transition away from fossil fuels while still maintaining a thriving economy.
aramis720 | September 11, 2023 at 9:07 pm |
“What do you mean by efficient in this context? Solar and wind are of course highly efficient today in terms of harnessing available energy for electricity. ”
Aramis – Solar and wind are both highly efficient and extremely inefficient.
When there is fuel (sun and wind) they are highly efficient. However , when there is no fuel (no wind , no sun) they are pieces of junk. Germany and most of europe is currently in its 34th straight day with electric generation from wind averaging 10-20% of normal. Germany went through 19 days in December 2022 with significant lack of wind generation averaging below 15% of normal during most of those 19 days. That of course occurred during the short days of the year, so solar was only producing less than 8% of normal.
Solar north of the 45th parallel is junk during Nov, Dec, jan and early feb during the lack of sun.
Summer solar is efficient, but not during winter.
Germany is also restarting coal electric generation due to the failure/shortcoming of their renewable binge.
Aramis720 – You stated that you are an attorney with expertise in renewable energy laws. Therefore I am presuming that you are familiar with electric generation by source data. I am linking to Germany’s electric generation by source website. the real time raw source data provides a more clear insight than the typical talking points we hear from advocates.
https://www.agora-energiewende.de/en/service/recent-electricity-data/chart/power_generation/12.08.2023/12.09.2023/today/
It’s easy to say Germany’s push to green energy is a success only if you ignore reality.
2. It has created the highest global electricity prices per household in the world. In 2019, German households were paying 34 cents per kilowatt-hour compared to 13 cents in the United States. The price of energy has doubled since 2000, when Germany first mandated decarbonization, an effort that forced energy companies to purchase long-term inefficient renewables at high, fabricated prices.
3. It has meant the burning of coal. Even before Russia began cutting off supply, Germany was more reliant on coal than the United States. This week, Germany’s Economy Minister Robert Habeck, who earlier this year rejected a European Union label of nuclear energy as “green,” announced that in an effort to avoid future gas shortages—because cars can’t run on wind—the government would incentivize the use of more coal-fired power plants.
The “transition” to green that Germany began 30 years ago has not worked. In 2000, Germany obtained 84 percent of its energy from fossil fuels. By 2019, it was 78 percent. As Vaclav Smil pointed out a couple of years ago, at this rate, Germany would still be deriving 70 percent of its energy from fossil fuels by the year 2050. With a move back to coal in 2022, it will surely be even later, if ever.
https://thefederalist.com/2022/06/21/germanys-green-energy-disaster-is-a-warning-to-the-united-states/
Germany’s industries are leaving, primarily due to high energy prices caused by “green” energy.
Also, the key chart showing adjusted TSI and global temps do seem to show a strong divergence in the last decade or so, after a close correlation for the previous 150 years. Do any of the linked papers discuss this strong divergence and how it came about?
Brilliant work as always from Dr. Soon and the Connolly clan!! It is so refreshing to read actual science and logic and not the usual non-scientific blather coming from so many Millenial/Gen X-Y-Z so-called “climate scientists” who love to talk about non-scientific oxymoronic absurdities (and blatant lies for that matter) such as “scientific consensus” and who regularly — indeed virtually constantly — deal only in the tactics of totalitarians and Marxists: ad hominem attacks, straw man arguments, non-sequiturs, obfuscation, dissembling, and outright Goebbels-style lying.
Brilliant science by Dr. Soon and the Connolly clan once again!!
It’s so sad to to see the non-scientific attacks, and lies (yes lies), in the form of straw man arguments and the like, from Gavin Schmidt, but that seems to be mostly what we have gotten from him over the years.
When one is sworn in in court, one is admonished to tell “the truth, the whole truth, and nothing but the truth”. Sadly, we have rarely if ever seen that from Schmidt.
Soon and the Connolly’s are exemplars of truth in the scientific world.
Why are the climate crazies so oblivious to the fact that if you spend trillions of dollars on X, that necessarily means you are NOT spending trillions of dollars on Y. And that simple fact can be EXTREMELY dangerous. So BEFORE you decide to spend trillions of dollars on something, you had better be VERY sure that it is beneficial. Unfortunately, the climate crazies never talk about two things: (1) the fact that all their Marxist policies STEAL HUGE amounts of money from Y, and (2) the probability that their predictions are correct is EXTREMELY low.
And that’s why they RELY almost entirely on propaganda, lying, deceit, and a brainwashed populace.
Thank God for real scientists like Dr. Soon and the Connolly clan!!
For me, the greatest controversy is the clan of sceptic scientists who feel that we have entered an extended period of low solar activity, and which will result in the Atlantic Multidecadal Oscillation shifting to its cold phase.
That is irrational, as centennial lows in solar activity are typically associated with negative North Atlantic Oscillation conditions which bring the cold to Europe, but negative NAO conditions drive a warmer AMO. Plus we can see the warmer AMO phases during the current and previous centennial solar minima in the AMO time series.
This winter/spring forecast sets up a favorable environment for one or more sudden stratospheric warming events. With elevated global surface and atmospheric temperatures we could see a very energetic and chaotic polar vortex next year.
https://www.severe-weather.eu/global-weather/polar-vortex-forecast-winter-2023-2024-cooling-weather-impact-united-states-canada-europe-fa/
Jack – there seems to have been a plethora of SSWs the past decade: is there any reason why this has happened naturally, or should tin-foil-hat addicts start asking if the US military has been ‘testing new weapons’ to see how to create SSWs naturally?
One theory offered by Dr. Jennifer Francis postulated that the increase in the temperature gradient between the poles and equator have disrupted the normal stratospheric winds causing more blocking high pressure zones. She also claims that reduced polar ice albedo has contributed to these air mass displacements.
Low solar activity weakens the vortex, making SSW more likely to happen.
Prior to WWII humanity had no idea SSW events even existed until they lost a few weather balloons (same thing that caused that Chinese balloon to stray over N. America earlier this year).
Javier,
Correlation is not causation. Maybe you can create a graph that maps these SSW events to low solar activity. One thing we have observed is SSW events leads to a rapid increase in ozone destruction as well as an increase in ionization of other gases like nitrogen. The composition of the atmosphere at these altitudes is very different than where our weather happens.
jacksmith,
I am not talking of correlation. The reason why SSW rarely occur in the austral vortex is because it is much stronger. An SSW is a vortex breaking event that forces air to abruptly sink, causing the warming. To break the vortex, its strength is a major factor. It is known since 1959 that vortex strength responds to solar activity. This has been studied since. One of my latest articles here was about a 2022 paper by Veretenenko that constitutes one of the latest additions to the effect of solar activity on the state of the vortex.
It would be nice to have a “round up” post like before for some of the “etc.” bits.
Using fossil fuels has no significant effect on climate. Water vapor radiates to space from within the troposphere. Radiation energy absorbed by CO2 from the surface is redirected wrt wavenumber via gaseous conduction to replenish the energy radiated to space by water vapor. https://energyredirect3.blogspot.com
All parties to this discussion continue to disregard the third side, published years ago, demonstrating a solar drive to ENSO and more. Wallace, Hydrological Sciences Journal 2019. If my peer reviewed pub is right, then the others must be a bit wrong.
At the risk of stepping on toes, it seems that everyone has an answer but no one has the answer.
Javier discusses in 12.10 Kindle version of his book, that the longest period of solar activity in 600 years could be a good candidate for causing the current warm period. With the long memory of the oceans, any solar variability shorter than a few decades raises red flags for me.
I haven’t read anything more convincing as the primary cause of the modern warming than this long period of high solar activity, certainly not AGW.
Other than terraforming most of the arable land surfaces, dispersing 250,000 man made molecules into the environment that are destabilizing biosphere, the oceans and atmosphere nothing has really changed.
https://www.climatelevels.org/
Jack
Let me quote you from above.
“Correlation is not causation.”
I do like your MSM scare tactics graphs though.
The human body is made of 100’s of thousands of different kinds of chemicals. Chemicals are good.
I love chemicals. I just wish we were more careful in how we use them. We are all guilty of falling into the Jevons paradox*, me included.
*The Jevons Paradox states that, in the long term, an increase in efficiency in resource use will generate an increase in resource consumption rather than a decrease.
I’m not getting how Jevons Paradox is actually a paradox. It’s just how reality works much of the time. It’s kind of paradoxical one would consider it a paradox.
More on Jevons Paradox. If my car becomes more efficient, it is cheaper to drive some extra miles. It makes perfect sense I would use it more. If it suddenly became less efficient, it would cost me more and I would drive it less. This is just common sense IMO. Not a paradox.
jim2,
If your car is more efficient then it should last longer… unless you wear it out sooner by driving those ‘cheap extra miles’. Ever wonder why the average US household has 2.5 TVs? I can only watch one screen at a time but darn it, I really need that 85″ because… its bigger!
There is no Jevons Paradox unless there is an assumption that cutting back on consumption is desirable. This is not a goal for everyone and it shouldn’t be. A lot of this nonsense is driven by the assumption that man-generated CO2 will lead to a disaster, which not even the UN will stipulate. For some, there is an assumption that less CO2 emissions is desirable. With this assumption, Jevons Paradox takes on some meaning, but it’s a bad assumption. There is no paradox here.
jim2,
Its not just about CO2. I made a point a while back that man-made CO2 is perhaps the most powerful catalyst humans contribute to climate change. Not because its a GHG but because it is a necessary byproduct of a million other processes that require its energy to make all those other 249,999 molecules.
CO2 producing activities have extended the life span of humans at least by 100%. There are some aspects of technology that reduce lifespan somewhat, but these pale in comparison to the positive effects. We are much better off with our CO2 producing activities.
jim2 wrote:
CO2 producing activities have extended the life span of humans at least by 100%.
No, it’s ENERGY PRODUCTION that has aided mankind. It doesn’t matter how the energy was produced, except for its negative externalities, of which fossil fuel have two huge problems (pollution and climate change).
Fossil fuels have some wonderful properties. They are a cheap source of energy with which to generate electricity and manage the grid. Wind and solar, not so much. They are portable, pipe-able, and energy dense. We already have the infrastructure in place. Of course they also are raw materials that go into most of our material possessions.
No David, it isn’t just any ole kind of energy. It’s fossil fuel energy that built this world.
I think this constitutes an answer, or at least a challenging response to many arm waves.
In 2019 I published on solar forcing of ENSO, the parameter that all use as a (tin) foil for not being able to predict climate. Two and a half years in intense peer review. Thanks all for reading, using and citing for past 5 years. I’ll assume it was read because of solar and enso keywords. Real researchers along with editors and reviewers presumably still use search tools, to ensure they aren’t missing something. In any case, now I’m moving forward within peer review goals and social media to share pics like this. The outline of ENSO roughly matches the lagged correlation of surface temperature to sunspot numbers.
Sure I leave out a LOT. but have to save something for peer review. any can ask for a detail or nit if they like, but once box is opened, many might have to shift causal chess pieces around,
https://twitter.com/Mike8Wallace/status/1701981894341271807/photo/1
and
https://twitter.com/Mike8Wallace/status/1701963700729475374/photo/1
CKid wrote:
Javier discusses in 12.10 Kindle version of his book, that the longest period of solar activity in 600 years could be a good candidate for causing the current warm period. With the long memory of the oceans, any solar variability shorter than a few decades raises red flags for me.
Handwaving gibberish.
The fact remains that the Earth’s surface temperature simply isn’t very sensitive to changes in solar irradiance. I’ve given the calculation here many times. The result is 0.1 K of surface warming per (W/m2) of solar irradiance.
Appell
What You wrote is amateurish irrelevance. Think cumulative.
We showed that the ozone regulation does not only peak during austral summer but is significant throughout the ENSO lifecycle. Therefore it can be argued that ENSO initiation is primarily a result of a slight central Pacific tropical perturbation in atmospheric physical and chemical properties that determine the lower stratospheric ozone equilibrium and how much of the solar UV-B energy anomalously warms the upper troposphere. This to some extent perturbs the WC which is amplified through ozone regulated process that grows through positive feedback mechanisms until the ENSO peak is reached during austral summer before progressively dying out during autumn. In this way the lower stratosphere could provide an “external” forcing on the tropical Pacific upper troposphere on intra-seasonal timescales that vary interannually and manifesting as ENSO extremes. Feedback mechanisms among the lower stratosphere, upper troposphere and surface may explain why once initiated, the ENSO event mostly completes its normal lifecycle. However it has to be acknowledged that our confidence in the linkages between the ozone regulation and ENSO which we have presented here is not exhaustive, primarily due to the lack of a quantitative and prognostic theory for dynamical coupling between the stratospheric and tropospheric circulations. But if the observations in this work are supported through modeling experiments, then the ozone/UV-B forcing can become the primary driver of solar induced tropical tropospheric climate variability.
https://www.nature.com/articles/s41598-017-05111-8
When UVC radiation decreases ozone production falls and more UVB radiation reaches the upper troposphere.
El Nino intensifies when solar activity decreases after the peak of solar activity.
The ozone layer strongly absorbs UVB radiation, so it has a cooling effect on the surface. Counterintuitively, a decrease in the sun’s magnetic activity and ozone can result in stronger surface heating.
Ozone absorbs 250 nm photons so effectively that we find no 250 nm photons on the Earth’s surface. In fact, we could sit in the same place for millions of years without detecting a single 250 nm photon! At these very short wavelengths, the sky is completely black.
‘When the model started with the decreased solar energy and returned temperatures that matched the paleoclimate record, Shindell and his colleagues knew that the model was showing how the Maunder Minimum could have caused the extreme drop in temperatures. The model showed that the drop in temperature was related to ozone in the stratosphere, the layer of the atmosphere that is between 10 and 50 kilometers from the Earth’s surface. Ozone is created when high-energy ultraviolet light from the Sun interacts with oxygen. During the Maunder Minimum, the Sun emitted less strong ultraviolet light, and so less ozone formed. The decrease in ozone affected planetary waves, the giant wiggles in the jet stream that we are used to seeing on television weather reports.”
https://earthobservatory.nasa.gov/images/7122/chilly-temperatures-during-the-maunder-minimum
https://www.cpc.ncep.noaa.gov/products/stratosphere/strat-trop/gif_files/time_pres_TEMP_ANOM_ALL_EQ_2023.png
The temperature rises in the upper stratosphere in the reaction of O2 dissociation by photons shorter than 242 nm. In this reaction, excess energy must be transferred to a neighboring molecule to form an O3 molecule.
“Oxygen atoms are highly reactive and react quickly with oxygen molecules to form ozone via\
O2 + O + M –> O3 + M
M represents any other molecule (most likely N2 or O2, since these two molecules make up 99% of the atmosphere).
A reaction involving 3 molecules is called a thermolecular reaction (a reaction involving only 2 molecules is a bimolecular reaction). A third neutral body (M) is needed for the energy balance of the reaction. This particular reaction proceeds at a very fast rate.”
Thus, in the Chapman reaction, the entire stratosphere (O2 and N2) in the vicinity heats up.
Therefore, the highest temperature in is in the upper stratosphere, as less and less UV radiation shorter than 242 nm reaches the lower layers, and the lowest temperature is invariably in the tropopause.
https://www.cpc.ncep.noaa.gov/products/stratosphere/strat-trop/gif_files/time_pres_TEMP_MEAN_ALL_EQ_2022.png
http://www.ccpo.odu.edu/SEES/ozone/class/Chap_5/5_2.htm
Thank you: Dr. Willie Soon, Dr. Ronan Connolly & Dr. Michael Connolly
Great discussion.
Be nice if Connolly responded to Willis’s question.
Rob … My comment of ‘Great discussion’ was for all of you, not the authors, as they have not (as of yet?) responded to any comment. However, their post did produce this discussion, and some discussion on X.
The Sun’s role in climate change has been a subject of scientific inquiry and debate for many years. It is incredibly complex topic that highlights the multifaceted nature of climate science. While the consensus among climate scientists is that human activities, particularly the emission of greenhouse gases, play a significant role in recent global warming, the Sun’s influence is still crucial factor to consider. Understanding solar cycles, irradiance variations, and their potential effects on our climate is essential for a comprehensive view of the Earth’s climate system. This ongoing scientific investigation reminds us of the intricacies of our planet’s climate and the need for continued research to better comprehend all contributing factors. It is a testament to the dedication of scientists worldwide who work tirelessly to unravel the mysteries of our climate.
Man’s role in warming is to urbanize huge areas and cover them with concrete and asphalt.
What percentage of the Earth’s surface area is covered by concrete and asphalt?
Pingback: Glibertarians | Saturday Morning Cat Food Links
Fluxes do not add, because when flux hits matter, flux doesn’t get absorbed – flux interracts with matter first, some of it gets reflected, some of it gets transformed into IR and re-emitted as IR, and only a small portion gets absorbed in inner layers and gets conducted as heat further on.
–
https://www.cristos-vournas.com
A graph of galactic radiation from Oulu shows changes in solar activity over the last two cycles. Galactic radiation is repelled by the magnetic field of the solar wind. Changes in galactic radiation indicate a weakening of the sun’s magnetic activity.
https://i.ibb.co/rvKCZsS/onlinequery.png
” the ongoing debates over Total Solar Irradiance (TSI) datasets:
It was only in late 1978, during the satellite era, that it became possible to directly measure the TSI from above the Earth’s atmosphere using TSI-measuring instruments onboard satellites.
Yet it is still unclear exactly how TSI has changed .
Each satellite instrument gives a different average TSI value.
Each satellite implies subtly different, but significant differences in the trends between each sunspot cycle.”
–
I have written a little about this in the past.
It should be clear to everyone that there is no proven valid reason to associate temperature changes over the solar cycles that have been defined by sunspot changes with the solar cycles.
For every solar cycle that seems to have a bit of warming associated with it others will show confounding results.
Yet there is ample evidence of the ability of the sun to run a little bit hotter or colder over time on its own.
We have the ability to produce data sheets of actual TSI, the reasons for the flawed results should be investigated and sorted out.
If we are measuring the irradiance directly by satellite it should be the only type of measurement used and each set of instruments must be compatible with all other such measurements.
Once we know how much TSI is being produced we can work out if the sun is varying by enough to explain our long and short term temperature variations.
—
Why is this simple point so hard to understand?
Write a paper and be sure and cite wallace HSJ 2019. Explain therein why you must be rigjt and what you found that i somehow overlooked. That’s the rule, and you don’t get a pass.
Oh look! We finally found the guy who makes the rulz!!!
My rulz are replication is the gold standard of science, not smear review. And even that isn’t enough.
9/18/2023
Last September Hurricane Ian showed that the Sun changed from the average surface temperature cooling to the average surface temperature warming.
Nature has now changed from adding additional heat to removing the added heat to the earth’s environment, melting ice, to keep a relatively constant average surface temperature.
BLUNTLY STATED, NATURE IS NOW LOWERING THE SURFACE AREA, COVERED BY WATER, OF THE EARTH TO REFLECT LESS HEAT TO THE BLACK SKY!!!!!
DRILL baby DRILL
That’s nonsensical enough to present to a Heartland Conference. Are you planning a lecture tour of Australia ?
Thank-you
At least I know it was read.
How exactly is the Earth’s surface area, covered by water, decreasing?
Data only.
It should be clear to everyone that there is no proven valid reason to associate temperature changes over the solar cycles that have been defined by sunspot changes with the solar cycles.
–
The reason for this is the nature of the processes in the sun itself. It is a ball of plasma with ongoing energy production due to nuclear fusion which has been running for over 4 billion years at a relatively steady rate.
–
Common sense says that with the way the processes happen that it will run at a fairly even but not constant temperature.
Just like currents in our seas the plasma at the surface will have years of being slightly warmer or colder.
–
These temporary for the sun but months to years for us deviations in TSI when measured correctly show the range of fluctuation possible and that it is fluctuating all the time not in obvious correlation with sunspots.-
–
Sadly this means that any person trying to tie climate changes to sunspot changes will be very disappointed.
They should instead focus on linking the actual TSI per day week month and year to the global temperature.
“Sadly this means that any person trying to tie climate changes to sunspot changes will be very disappointed.”
–
We need a rethink on the mechanisms of the interaction of the TSI and the earth’s atmosphere.
The definition of TSI is both all over the shop and technically wrong but let that be.
Roy Spencer has shown convincingly that cloud formation is a major player in the actual global temperature.
Small increases/decreases in cloud cover at the right time and place can cause significant increase and decrease in the true TSI that actually reaches the true earth surface..
Thus even a small increase in TSI on a non cloudy day increases significantly both the amount of energy that reaches and leaves the earth surface to cause warming.
This is the mistake that Javier makes when he decries how much extra a small change in TSI can produce.
Diminishing one effect without acknowledging the other at all lacks rigor.
Note I do not wish to denigrate the works of the authors here nor Javier.
Gavin Schmidt at realclimate.org helps run a site full of disinformation.
He is and has been a head of significant Climate data analysis collection – 2016 “Dr Gavin Schmidt is director of the NASA Goddard Institute for Space Studies.”.
Like many people heavily invested in a belief system that demands a theory of AGW. he looks at his data through a very thick lens and disputes any evidence that may contradict his theories.
Calling his dismissal of these papers as pseudo-scientific take downs puts the wrong slant on things.
Motivated science scientific take downs would be a better term as he is like the men he is criticizing a scientist.
Thus his dismissal of data sets because of whom composed them rather than of what they show is very instructive as to his motivated reasoning, something he could consider next time but will not.
The map is not the territory but when the map makes no attempt to represent the territory all, and that means nearly every article we complain about on the earth’s surface energy budget needs to be thrown out.
What are the problems?
–
1 The TSI is related to the amount of energy reaching a flat earth disc area at one solar unit.
This is just plain wrong, out by possibly as much as 10 percent and hence all figures for amount of Infra red in, amount of visible light in amount reflected, absorbed by clouds and carried aloft in thermals is just plain wrong.
By 10 percent.
Yet these are the figures that go into the computer climate models to give them the data to run their computations on!
Yet people are afraid to acknowledge it as it is so imbedded in the system trhat taking it out would mean admitting everything else is wrong.
2. (ECS) is one of the most important metrics in climate science. It measures the amount of global warming over hundreds of years after a doubling of the atmospheric CO2 concentration.
When you put wrong data about the amount of energy in a system you get wrong results out.
3 Radiative Forcing and TOA imbalances
If we are not putting the true amount of energy in and out of the system at TOA all our conclusions and understanding of the amount of energy in the system are wrong.-
And they are wrong.
Hi angech!
“1 The TSI is related to the amount of energy reaching a flat earth disc area at one solar unit.
This is just plain wrong, out by possibly as much as 10 percent and hence all figures for amount of Infra red in, amount of visible light in amount reflected, absorbed by clouds and carried aloft in thermals is just plain wrong.
By 10 percent.”
–
Why?
Should it be 10 percent higher, or 10 percent lower?
–
https://www.cristos-vournas.com
Hi Christos
It should be a lot higher because the amount of energy into the flat disc area is boosted by energy absorbed by the rim of atmosphere outside this area which the adds to the energy the area receives directly.
This extra energy dips known about and accommodated into some assessments of the earths energy balance but is quite significant and ignored when it should not be.
Since the atmosphere receiving energy outside the disc area adds an extra 30 to 60 kilometres to the radius of the disc that can absorb energy, most of the IR and some of the visible light spectrum by clouds and transmits it to said disc it should be counted.
10% is a good guess.
Thank you, angech, for your detailed explanation.
Now I understand what you ment.
–
Record ozone hole over Antarctica so far.
https://www.cpc.ncep.noaa.gov/products/stratosphere/polar/gif_files/ozone_hole_plot_N20.png
perhaps flourocarbons are not the cause of the increase in the ozone hole. Perhaps the political science was settled while the physical science remains open for debate.
Worth revisiting the scientific debate and discarding the settled political science.
fwiw – I have no opinion on the subject matter
Lucky it is winter there or the UV index would be damaging to the DNA of many species.Plankton doesn’t do well in high UV environments and they form the base of the food chain in Antarctic waters.
Occasionally I push my nose into other tents, hoping that they will cite my solar forcing of ENSO paper. If solar forces ENSO, then game over. But Lukewarmers swim in a bubble of own making and won’t play by rules. Who is jim2?
Why should we think solar influences ENSO?
https://www.tandfonline.com/doi/full/10.1080/02626667.2019.1567925?scroll=top&journalCode=thsj20&needAccess=true
Stratospheric intrusion in the northwestern US brings snowfall to the Rocky Mountains.
https://i.ibb.co/7QV1jFy/gfs-hgt-trop-NA-f000.png
Circulation in the lower stratosphere will bring precipitation to California.
https://earth.nullschool.net/#2023/09/27/0300Z/wind/isobaric/70hPa/orthographic=-110.00,49.94,485
California’s temperature forecast at 3,500 meters as of Sept. 30, 2023.
https://earth.nullschool.net/?fbclid=IwAR19jHjSNnOsFFzbmWrIySEcC6mm7P3i3yZQsmIoXZySpfiH0Ri_r0cEVQg#2023/09/30/0600Z/wind/isobaric/700hPa/overlay=temp/orthographic=-110.66,53.45,846
Everything and I mean everything is affected by external forces beyond our solar system. It takes 260 million years to make one journey around the center of the milky way and we have done roughly 18 so far.
We have no idea whats forces our solar system encounters during these journeys.
Clearly if/when we encounter these objects, could be super massive stars or perhaps massive magnetic fields that we travel through.
In any event when this happens its clear as day that these objects and their magnetic force will interact with our solar systems magnetic fields and poles.
The rest is rather obvious and for me its clear we are now coming upon such an interaction.
The earthquake activity and volcanoes are off the charts, before the first 6 months of 2024 are over we will have seen the beginnings of the coming earth catastrophe or maybe the whole thing.
Pingback: Era Of 'Unquestioned And Unchallenged' Climate Change Claims Is Over - ZubuBrothers.com
Pingback: Era Of ‘Unquestioned And Unchallenged’ Climate Change Claims Is Over – iftttwall
Pingback: Era Of 'Unquestioned And Unchallenged' Climate Change Claims Is Over - Investing Book Deals
Pingback: Era Of ‘Unquestioned And Unchallenged’ Climate Change Claims Is Over – NewDYRTO
Pingback: Era Of ‘Unquestioned And Unchallenged’ Climate Change Claims Is Over – Patriosity.com
Pingback: Era Of ‘Unquestioned And Unchallenged’ Climate Change Claims Is Over – 67x.info
Pingback: Era Of ‘Unquestioned And Unchallenged’ Climate Change Claims Is Over – altnews.org
Pingback: Era Of ‘Unquestioned And Unchallenged’ Climate Change Claims Is Over – D4RKW3B
Pingback: Era Of ‘Unquestioned And Unchallenged’ Climate Change Claims Is Over : by Tyler Durden – Dawson County Journal
Pingback: Era Of ‘Unquestioned And Unchallenged’ Climate Change Claims Is Over | New Covenant Network News
Pingback: Era Of ‘Unquestioned And Unchallenged’ Climate Change Claims Is Over - Conservative News & Right Wing News | Gun Laws & Rights News Site
Pingback: Era Of ‘Unquestioned And Unchallenged’ Climate Change Claims Is Over – ConservativeNewsBriefing
Pingback: Era Of 'Unquestioned And Unchallenged' Climate Change Claims Is Over | New Covenant Network News
Pingback: Era Of ‘Unquestioned And Unchallenged’ Climate Change Claims Is Over – Bugaluu – News
Pingback: Era Of ‘Unquestioned And Unchallenged’ Climate Change Claims Is Over - The International Energy Transition
Pingback: Sandstone
Pingback: Era Of ‘Unquestioned And Unchallenged’ Climate Change Claims Is Over - Invito Energy Partners
Pingback: Era Of ‘Unquestioned And Unchallenged’ Climate Change Claims Is Over - DB Energy Advisors
Pingback: Era Of ‘Unquestioned And Unchallenged’ Climate Change Claims Is Over - The Crude Truth
Pingback: Era Of ‘Unquestioned And Unchallenged’ Climate Change Claims Is Over – Activist Post – news.freeptomaineradio.com
Pingback: Stále více vědců odhaluje klimatické lži a dostává se do sporů s propagandisty z OSN » Oral.sk - Necenzurované správy
Pingback: Era of ‘Unquestioned and Unchallenged’ Climate Change Claims Is Over – Vietnamese-American Conservative Alliance (VACA)
Pingback: From the Epoch Times | The Big Picture Blog
Pingback: Era of ‘Unquestioned and Unchallenged’ Climate Change Claims Is Over « Better in their words…
Pingback: WARNING; THE GREEN DRAGON OF CLIMATE CHANGE DECEPTION CONTINUES PROWLING; Pope (5) Francis Joins The Climate Cult - The Night Watchman
Pingback: Era of ‘Unquestioned and Unchallenged’ Climate Change Claims Is Over | Everett Chiropractic Center Blog
Pingback: The Period Of 'Unquestioned And Unchallenged' Local weather Change Claims Is Over - The Owl Report
Pingback: The Era Of ‘Unquestioned And Unchallenged’ Climate Change Claims Is Over – altnews.org
Pingback: The Era Of 'Unquestioned And Unchallenged' Climate Change Claims Is Over - Solveit3.com
Pingback: The Era Of ‘Unquestioned And Unchallenged’ Climate Change Claims Is Over - maywoodtimes.com
Pingback: The Era Of ‘Unquestioned And Unchallenged’ Climate Change Claims Is Over | Tallbloke's Talkshop