
By Frank Bosse and Nic Lewis
A recent article by Roy Spencer was (strongly) criticized by Gavin Schmidt over at “Real Climate”.
In the summary Gavin S. wrote:
“Spencer’s shenanigans are designed to mislead readers about the likely sources of any discrepancies and to imply that climate modelers are uninterested in such comparisons – and he is wrong on both counts.”
Let’s have a detailed and objective look if the wording “…to mislead the readers” is sound.
In his 1st figure Gavin S. cites a chart of Roy S. and makes remarks (in red):

Figure 1: A reproduction from the “Real Climate” article.
The annotations of Gavin are numbered, are they sound?
Point 1: Not sound. While Roy’s chart stated that the GMST-anomalies are calculated with respect to the 1991-2020 mean, it also stated that “Figures have been adjusted to align trends starting in 1979.” It is obvious from the chart that it is the multi model mean (MMM) anomalies that were adjusted to start in 1979, which is fully compatible with the pre-adjustment MMM anomalies having been calculated with respect to the mean over 1991-2020. The “This is just false” claim of Gavin S. is thus… just false. Moreover, this issue is irrelevant to the issues being studied.
Point 2: The use only of the MMM and not pointing to the model spread. Indeed: the MMM only shows the impact of the forcing (the temperature response to a given unit W/m² forcing), not the “wiggles” of single models as estimates of some internal variability. Gavin S. points to an own chart with the “spread”:
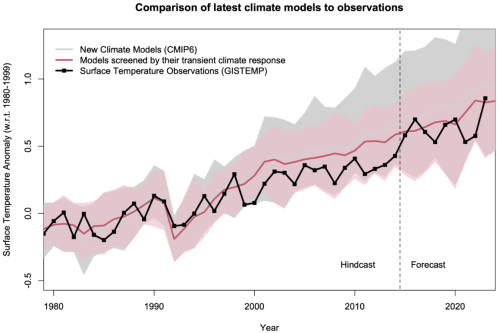
Fig. 2: A reproduction of the 2nd figure in “Real Climate” Article.
The spread shows that simulations by some models warmed no more than observations. That is consistent with Roy’s report, which said “it is generally true that climate models have a history of producing more warming than has been observed in recent decades”, and pointed out that “two models (both Russian) produce warming rates close to what has been observed, but those models are not the ones used to promote the climate crisis narrative. Instead, those producing the greatest amount of climate change usually make their way into, for example, the U.S. National Climate Assessment”. Nevertheless, the “spread” is foremost an illustration of different model sensitivities. On the basis that the real world has globally only one real TCR, the “spread” mainly represents the huge range of TCR values among different models, and this makes it of little relevance. Taking the multi-model mean enables a fair comparison between the average model’s forced warming response and observed warming, and also vastly reduces the influence of model internal variability. The actual climate system’s internal variability (“weather”) does affect observed warming (as does observational uncertainty), but over a period approaching half a century long its influence is substantially muted.
Hence this accusation of Gavin S. is unsound also.
Point 3: Gavin proposes to use a “constrained subset” of models whose TCRs were within the latest (AR6) IPCC assessed TCR “likely range” (1.4–2.2°C), which while not, as Gavin implies, being directly constrained by observations, eliminates the most-overwarming models. This is the “red zone” in Fig. 2 with a MMM as a red line. More sophisticated approaches to correcting the historical over-warming of the CMIP6 multi model ensemble, involving using observed warming as an “emergent constraint” on TCR were developed by different authors, in Tokarska et al. (2020) and Nijsse et al. (2020). Their approaches were very similar: The authors used regression to derive the relationship between TCR and historical warming across all CMIP6 models and estimated the “true” TCR from the point on the regression line corresponding to the observed warming. Tokarska et al. (2020) (T 20 in the following) thus found an ” observationally constrained” TCR best estimate of 1.70°C/2*CO2 (see Tab. S3 lower part 1981–2017 for CMIP5 and CMIP6 combined). Using a slightly different model ensemble selection, study period (1975–2019) and estimation method Nijsse et al. estimated TCR at 1.68°C /2*CO2, almost identical. These values are somewhat below the mean TCR of a screened subset of CMIP6 models with TCRs within the IPCC AR6 ‘likely range’, of about 1.75°C. In T20 the tight relation of the temperature trend slopes (If the time frame used is long enough) and the corresponding TCR is also discussed.
When eyeballing fig.2 (which includes also the huge GMST-jump in 2023) one can see that the trend slope (and hence the TCR) of the “TCR screened” MMM is slightly steeper than the observed slope. Gavin S. mentions this in his article: 0.20°C/ decade for observations; 0.23°C/decade for the screened MMM and 0.26°C /decade for the “raw CMIP6 MMM”. These relations can be used to scale TCR mean values of 1.75 found for Gavin’s “screened subset” of models, leading to a TCR (observed) of 1.52°C/2*CO2 as best estimate, almost identical to the given value in Lewis (2022). The “raw CMIP6 MMM”, scaling 1.75°C by 0.26/0.23, calculates to 1.98°C, very near the MMM value of 2.01°C given in Nijsse et al.
Conclusion for Point 3: Gavin S. is partially right, in that the CMIP6 MMM overestimates the warming to 2023 by 30%, however this was also the message of Roy S. Moreover, Gavin’s “screened subset” of models also over-warms, by 15%.
Point 4: In the following section of his article Roy S. describes the warming contrast Observations vs. CMIP6’s in the “Corn Belt summers” of the USA. For Americans this is for sure a very important region for the agriculture and save foods also in the future. Gavin S. headlines:
“Cherry-picking season”
Instead of “one small area” (CHERRY PICKING!) he recommends to plot global GISS summer trend slopes. His figure about this issue misses the point of the whole issue- it was a model-observations comparison. Therefor how well models represent the observed annual local summer (JJA) temperatures is shown here in the mentioned 1973 – 2022 time period:
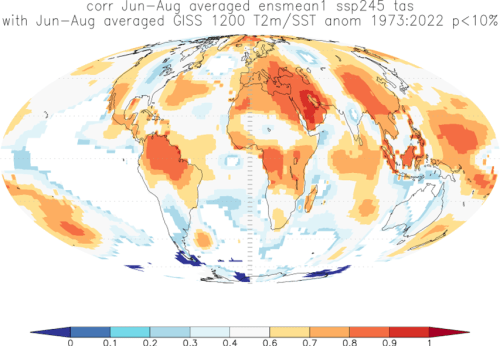
Fig. 3: The correlation of the near surface temperatures 1973-2022, representing 50 years of observations, not “odd” as Gavin S. stated. Note the scale: Correlations below R= 0.5 (“by chance”) are marked in blue colors, above 0.6 in red colors. The figure was generated with the KNMI Climate Explorer.
In the “Corn Belt Region” in the USA the CMIP6 MMM has a very low performance indeed. This is also true for Australia, big Parts of South America, Central Asia, Parts of South Asia, whole Antarctica on land. The ocean performance is also weak in the East Pacific (the “pattern effect”), in the whole Southern Ocean, the South Atlantic and big parts of the North Atlantic. The region in question is not cherry picked, it’s the other way around: Looking for good matching regions with R >0.8 (i.e. West Asia, Northern South America, the Indo-Pacific warm pool) is even harder.
The point of Gavin S. is not sound.
Point 5: With his last chart Gavin S. compares the Temperatures of the lower Troposphere (TLT) from Observations and CMIP6 models:
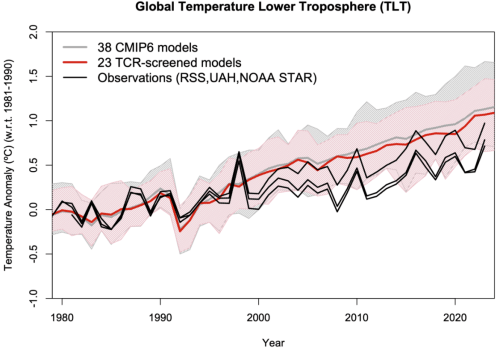
Fig. 4: The TLT comparisons of Gavin S. He also gave the trend slopes in the caption.
It’s obviously: Two observational datasets (UAH and STAR) are generated by independent research groups and very similar. The RSS set has a much steeper (factor 1.5) trend, coming from a divergence in 2000-2006. There seems to be a problem with RSS. When one compares the likely trend slopes (0.14 for the STAR and UAH observations; 0.29 all models; 0.27 K/Dec. for selected models) as stated by Gavin S., one finds that the CMIP6 models overestimate the TLT warming (where almost all the weather is made) by a factor of about two. When the Earth’s climate is described as a coupled atmosphere-ocean-land system and one of them is so far from reality in the latest model family (CMIP6) one should not take some calculations as face value for the real world. Moreover the “screened models” seem to be adjusted only on the ground temperatures, in the TLT this adjustment method fails. This suggests problems with model physics do not relate simply to misrepresentation of feedback strength and hence climate sensitivity.
This point of Gavin S. is also not sound.
One issue remains: What is the message of Gavin Schmidt’s article? One more open question…

What is the consensus of opinion as to what constitutes a not too hot and not too cold but just right, subsistence level of economic development, for the world’s inhabitants? With all of the barefaced certainty about global warming amidst all of the demonstrated uncertainty about climate change, someone should tell climatologists – Western science’s arrogantly unerring keepers of pharaoh’s omniscient and omnipotent laws of global warming. There’s a new god in town- the public is finally starting to cut through all the hypocrisy and western academic duplicity and see global warming alarmism for what it is: a hoax and a scare tactic.
All of this belongs in the scientific literature. But of course, Roy avoids the scientific literature with his blog…..
You mean submit it to a journal so Michael Mann can berate and threatening the editor, wanting it to be assigned to pet hostile peer reviewers? At the same time Michael can then hurl around his standard epithet that the authors are climate deniers.
Journals are dead as a means of disseminating information. They just won’t lie down.
Chris – One major issue to note in the Mann v Steyn/Simberg trial is the extreme willingness to commit perjury. M Mann has committed perjury at least 200 + times throughout this case counting all his pleadings/filings, interogatories, depositions, and trial testimony. JP Abraham had 3-4 instances of his perjury in his short testimony. Can you really trust the climate science industry when two of the top ten are so willing to commit perjury.
Bafflegab.
Yeah, David Appel. Why, everyone knows that Michael Mann has more papers published in the scientific literature than Einstein, Feynman and Bohr… combined!
How did science ever advance prior to our religious adherence to the scientific literature?
Also of Note – JP Abraham, climate scientist who testified on behalf of Mann, who perjured himself in claiming that Mann’s reputation among scientists was hurt solely by the Simberg/Steyn blog post, has approx 500 published papers in 12-15 years. Approximately 30 papers per year, an astonishing volume of peer reviewed papers.
curious – what percentage of those papers are based on actual field research vs library research?
Curious – what percentage of climate science papers are based on actual field research vs library research.
Those indisposed to read the scientific literature are left as clueless as those who refuse to do arithmetic- the scientific basis of climate forcing was well understood before Bohr and Einstein were born, and reasonably quantified while they were still students.
https://vvattsupwiththat.blogspot.com/2014/10/climate-wars-salt-talks.html
Too often, peer review is nothing more than lipstick on a pig.
The scientific method does not include publishing to a peer reviewed journal as a step. Just sayin’.
Scientific time is generally better spent in journal libraries than pigsties or courtrooms.
Scientific time would be better spent making sure your material is correct. Also better spent reproducing results instead of pal review.
“All of this belongs in the scientific literature.” Yes. Provided that the scientific literature would not reject it.
Gavin Schmidt does himself no favors by suggesting that all the runs in the ensemble should be shown in comparison with the actual measured temperatures. Because of the large variance in all the models, it makes it even more obvious that they do not perform well and most run too warm. The problem is, the only way to deal with the issue is to subjectively truncate the warm runs. How does one rationally justify where to draw the line? I might suggest ignoring all but the Russian runs.
A decade agi I started to examine the CMIP process as to accuracy of procedures. I found some relevant data, but not much interest has resulted.
I continue to be uncertain why so much data is taken at face value. There are many, many suggestions that the temperatures input to the land surface temperatures shown here are indeed inaccurate, some by substantial amounts.
So, again, I raise these words about the accuracy of CMIP. When you combine the criticisms of the temperature data with those of the CMIP data, a substantial question mark hangs.
Geoff S
………………………….
From a decade ago:
Accuracy of CMIP modelling can be seen by comparisons. In 2007, David Douglass et al published in Int. J. Climatol. (2007), “A comparison of tropical temperature trends with model prediction”.
http://www.blc.arizona.edu/courses/schaffer/182h/Climate/climatemodel.pdf
Table 2 from it:
http://www.geoffstuff.com/cmip_accuracy.jpg
From the Abstract,
“We examine tropospheric temperature trends of 67 runs from 22 ‘Climate of the 20th Century’ model simulations and try to reconcile them with the best available updated observations (in the tropics during the satellite era). Model results and observed temperature trends are in disagreement in most of the tropical troposphere, being separated by more than twice the uncertainty of the model mean. In layers near 5 km, the modelled trend is 100 to 300% higher than observed, and, above 8 km, modelled and observed trends have opposite signs.”
Here is the modelled trend of temperatures at various altitudes above the Earth surface, expressed in milli⁰C per decade.
Pressure Results #15 Average of all 67
hPa milli⁰C/decade milli⁰C/decade
1000 163 156
925 213 198
850 174 166
700 181 177
600 199 191
500 204 203
400 226 227
300 271 272
250 307 314
200 299 320
Model # 15 is Australia’s CSIRO MK3.0.
Attention is drawn to the exceptionally good model results at mid-altitude. They agree with the average of the other runs/models to one millidegree C per decade. Accurate estimates to one thousandth of a degree per decade?
How, in a world full of GPS, gadgets that point things with nanoradian accuracy, quantum systems that operate in environments controlled to microdegrees K, and scientic calculators on every cel phone can so many blog commenters plead Ignoramus or swear that it is impossible to measure things more accurately than they know how?
Link, please.
“The RSS set has a much steeper (factor 1.5) trend, coming from a divergence in 2000-2006. There seems to be a problem with RSS.”
It seems like it has been many years now since Roy Spencer’s UAH had a dispute with Mears’s RSS over the calibration of one of the satellites and perhaps some other differences in code. Has there been more debate over which analysis of the satellite data is correct?
A major development since then is that NOAA, the US government climate agency that actually owns and manages the satellites, has independently developed its own satellite microwave sounder based mid-troposphere temperature record, STAR, so providing a third source. STAR agrees closely with the UAH record (in fact it warms marginally less than UAH), and disagrees with the more strongly warming RSS record where it diverges from UAH, which mainly occurs prior to 2002. It looks like RSS made faulty decisions during that period as to how to adjust for problems with satellite instrumentation, particularly with the NOAA-15 satellite.
As you probably know, RSS uses a model to “supplement” the instrumental data.
https://twitter.com/WHUT/status/1753480199709098014
https://twitter.com/25_cycle/status/1753481652091691368
UAH +0.44 record Jan.
ERA5 ~ +0.1
NCEP~ +0.15
JRA55~+0.06
Hi Paul, I tried to educate you at RC yesterday, with no success I’m afraid. Of course the TLT (not UAH, only describing it) must be more senstive to ElNino than the T2m or GMST (with the temperatures of the mixed layer of the oceans included) because the involved mass and hence the thermal intertia of the (thin) air makes this. And it’s not a “mystic procedure” to make temperature readings from the raw data, STAR does it in the same way coming to very similiar results. No use to diss UAH!
best Frank
PS: Paul, you abused one of the authors of this article (I’m the other one) on RC with those words: “of course the clown prince of analysis-obfuscation Nic Lewis is now chiming in.” I don’t think that you should expext any politeness anymore. All the best 2u!
I can’t help but suspect that NASA intended to confirm RSS. So it’s kind of funny.
Hi Ron…to be fair, it was Gavin S. himself who announced the new STAR Dataset and made comparisons with other products, see https://www.realclimate.org/index.php/archives/2023/04/a-noaa-star-dataset-is-born/
best Frank
Hi Frank, reading Gavin’s RealClimate post confirms he was disappointed with his new Star. “It’s not a democracy where the ‘right’ answer is decided by majority vote!” (What a nice Gavin quote to remember. ha ha.)
RSS now has the highest trend of all the indexes, including land, radiosonde, satellite and reanalysis, while UAH and STAR tie for the lowest trend, Gavin’s point is to discount all satellites as too uncertain. So, RSS still helps the cause.
Of course, weather stations measure temperature 2 m above the ground whereas sats measure most of the troposphere.
What I like to do is treat it statistically, assuming all models have an equal claim to validity. Then you find that the models are high, outside the 95% confidence interval. Not only that, but their 3 sigma is about +/- 4 degrees. TOTALLY useless for setting policy.
Without Michael Mann’s ‘hockey stick’ and the assumptions underlying it, there is no alarm about humanity’s release of CO2 into the atmosphere. Climate models run hot because the underlying assumptions are wrong. Besides, global warming is not a net-negative: it’s been good for all living things. The UN’s official climate science prognostications of doom have really been a stick up!
“Exaggerated, worst-case claims,” says Bjorn Lomborg (The Alarming Thing About Climate Alarmism), “result in bad policy and they ignore a wealth of encouraging data.” The current research on climate (see–e.g., Monckton, et al, below) shows, “the now-realized projections of the general-circulation models have proven to be relentlessly exaggerated.” Moreover, even if humanity arguably does have some minor impact on the global temperature of the Earth it is estimated that about half of the effect will occur over the next 100 years and is likely to be a good thing (e.g., fewer natural disasters and less poverty) while, “the equilibrium temperature response [caused by the remaining effect] may not be attained for several millennia.” Our schoolteachers aren’t really alarmed about the weather in 4015: they are scared today about something that hasn’t happened.
‘It is no accident that 90% of the world’s living species thrive in the warm, wet tropics, while only 1% live at the cold, dry poles.’ ~Monckton, et al., (Why models run hot: results from an irreducibly simple climate model)
“The current research on climate (see–e.g., Monckton, et al, ”
You do realize that in real life Christopher Monckton was my shirtmaker for many years , and remains a member of London’s Worshipful Company of Broiderers?
https://vvattsupwiththat.blogspot.com/2012/02/when-did-monckton-lose-his-shirt.html
By the time I met him in 2006, he had sadly sold his shirt business and mover on to less repectable occupations like editing Sudoku, selling puzzles by mail, and , sadly climate grifting .
The beginning of rain and snowfall in California.
https://i.ibb.co/0jCQ1NC/Zrzut-ekranu-2024-02-04-140735.png
What do the satellites measure?
https://www.cpc.ncep.noaa.gov/products/stratosphere/strat-trop/gif_files/time_pres_TEMP_MEAN_JFM_EQ_2024.png
https://www.cpc.ncep.noaa.gov/products/stratosphere/strat-trop/gif_files/time_pres_TEMP_ANOM_JFM_EQ_2024.png
Is it worth scaring about sea surface temperature anomalies?
https://i.ibb.co/0cVyDF6/ct5km-hs-v3-1-global-current.png
Is El Niño causing drought in Australia? It doesn’t. But it does bring flooding in Peru and California. Lake Tulare is going to get bigger again.
https://i.ibb.co/QmNRbtS/himawari9-ir-07-P-202402041050.gif
https://i.ibb.co/zbNg8Sh/himawari9-wv-mid-07-P-202402041050.gif
Since climate science became politicised by the Hockey Stick (if not before), surely this is a good time for climate science to sort itself out and return to real integrity in research method, explanation and inference. For sure the clean-up of pitiful climate papers gets tougher and tougher as the political abuse continues and it is time those responsible for the abusers (and we all know who they are) to be named and shamed. Perhaps then we will see people with brains and independent minds back in academic control and not just the ‘catastrophic’ followers and their bullies. Proper debate has been missing for too long.
Perhaps then the hysteria will quieten down and with better leadership our energy bills can return to something resembling real values in modern economies, without the huge wasted energy (in production AND use) and cash continuing to be thrown away on solar and wind. Perhaps the billionaires responsible for inappropriate policy decision making can pay for the removal and recycling of all the dreadful turbines and panels littering our land and seascapes and perhaps ordinary people will get their democracy back too. Those billionaires could do with being returned to Earth with a bump and not treated as special beings which they are not.
And perhaps with the NZ by 2050 pressure off research into electric vehicles could be done before more explosions harm people unnecessarily, if not physically then certainly via their pockets. Haven’t we wasted enough cash already without having to clear up and dispose of all the potential wrecks we are busy creating?
Following is a succinct description of evidence against catastrophic anthropogenic global warming.
Please provide a similarly succinct description of evidence FOR catastrophic anthropogenic global warming:
Antarctic ice core analysis indicates that climate change is due to naturally recurring 100 thousand year cycles … and that CO2 FOLLOWS, not leads, temperature changes.
See the “Temperature and CO Records” graph that clearly shows this temperature lead/CO2 lag at liberal Wikipedia (en.m.wikipedia.org/wiki/File:Co2-temperature-records.svg).
The cycles are driven by the Sun, not by natural OR human caused CO2.
We are nearing the peak of a 100 thousand year warming cycle that has not yet reached previous maximum levels … still 2 degrees C colder than previous (when humans were not around).
That Earth may be warming, therefore, is not surprising. But global temperature has increased less than 1 degree C over the past 50 years.
UN IPCC Assessment Reports in fact do not support a catastrophic outlook. That catastrophic outlook strictly is a political message to drive ideological, financial and power positions.
The few IPCC models that do predict large temperature increases have been discredited for using debunked starting temperatures and Equilibrium Climate Sensitivity “factors”.
1,607 scientists including two Nobel Prize winners signed a science-based declaration stating: “the planet is warming slower than is predicted and has not driven a spike in natural disasters.”
The infamous Mann “Hockey Stick” removed data for the Medieval Warming Period and The Little Ice Age to get misleading results that otherwise would have shown no abnormal recent warming.
No evidence exists that human impact on global warming is significant.
What is the cause of the ~1 C rise in the last 50 years?
The cause is the 100 thousand year temperature cycles that have occurred for eons.
Earth is nearing the peak of a 100K year warming cycle that has not yet reached previous maximum levels (when humans were not around).
That Earth may be naturally warming, therefore, is not surprising.
Nope, the last Milankovitch maximum occurred about 10,000 years ago. And the last temperature maximum, the Holocene optimum, occurred 6-8 thousand years ago; since then, until about 150 years ago, the global temperature was slowly decreasing. Solar activity nor orbital changes can explain the rapid temperature increase of the last 50 years.
https://climate.nasa.gov/climate_resources/189/graphic-temperature-vs-solar-activity/
https://climate.nasa.gov/news/2948/milankovitch-orbital-cycles-and-their-role-in-earths-climate/
“[Neither] Solar activity nor orbital changes can explain the rapid temperature increase of the last 50 years.”
I agree that Milankovitch (orbital) cycles are responsible for the glacial cycle that we see in the geologic record for the last 1.8 million years (the Quaternary Ice Age). I agree there is strong evidence that there was a temperature local maximum 6-8 thousand years ago and a local minimum 23 Ka ago, after ~100 Ka of cooling in a yet larger cycle.
You omitted mention of ENSO caused oscillations and a 60-yr cycle thought to be due to an ocean current oscillation. The later was powerful enough to change the reverse the 20th century warming trend from 1945-1975.
Before the ACC (AGW) movement was into high gear the consensus among paleoclimatologists was there was a ~1 Ka cycle of greater magnitude than the 60-yr cycle but less amplitude than Milankovitch 41-Ka cycle.
One of the behind the scenes stated goals of the climate community has been to erase the 1 Ka cycle. I remain agnostic on the evidence of global 1 Ka cycle mainly because there are very little records of the southern hemisphere. And there is good ice core evidence that the two hemispheres oscillate out of phase. BTW, the MBH reconstruction being of only the northern hemisphere invalidates it, on top of all its other problems, as being a global reconstruction.
With all the above qualification I also accept there is strong evidence that CO2 is partly responsible for our warming trend. I am not at all convinced this is a top concern. If CO2 had a cooling effect reinforcing (rather than countering) Milankovitch cooling I would be much much more alarmed.
Ron,
I don’t mention internal oscillations of the climate system (there are many of them) because they do not change total system energy, only rearrange it. While they are quite observable regionally (MCA, LIA) they have only small effects on global average temperature or energy content.
Basically, the internal oscillations cannot explain the increasing energy stored in the oceans.
I think that (most of) the 1945-1970 cooling (small, ~0.1 C) is generally attributed to post WWII industrial growth and particulate generation, particularly sulfates from burning coal. This was reversed by “clean air” acts that put fly ash and SO2 scrubbers on smoke stacks, and the temperature increases resumed. I do not doubt that the ocean oscillations and anthropogenic particulate effects are real, but appear to be small compared to the 1+ C rise over that last 50 years.
El Niño provides an excellent example of how internal variability can influence energy stored in the oceans. During La Niña conditions, wind stress causes accumulating warm water volume to build in deeper and narrower regions of the tropical Pacific Ocean largely out of contact with the atmosphere. La Niña also reduces wind driven evaporation in the extratropics, and does so cumulatively over multi year events. El Niño releases the stored tropical warm water volume and places it in contact with the atmosphere so it can radiate into space, so that El Niño reduces total heat stored in the climate system.
“I don’t mention internal oscillations of the climate system (there are many of them) because they do not change total system energy, only rearrange it.”
The problem is that measuring surface temperatures, either through thermometer records or ice cores, they tell us nothing about internal energy content of the oceans.
Unfortunately, we have less than a 20-yr record of ocean heat content. Thus, everything in your first paragraph is speculation, not fact.
“I think that (most of) the 1945-1970 cooling (small, ~0.1 C) is generally attributed to post WWII industrial growth and particulate generation, particularly sulfates from burning coal.”
Wow, is this the consensus? I know they blame the US southern border on climate refuges, so there is no shortage of laughably contrived explanations.
The cooling from 1945-1975 was powerful enough to reverse CO2 warming, which I acknowledge was a forcing. We have zero idea whether this was internal or not. We do know we had good global coverage with thermometers after WWII.
The Clean Air Act was not a global event. China does not abide.
I agree there is significant warming going on since 1975. I believe it’s less than 1C if you are normalize the ENSO cycle.
The overall point of the current post is that the IPCC contributors are highly motivated to exaggerate warming in any way they can and there are endless adjustments to accomplish that. But even despite that the models have been poor predicters of trend slope. Do you agree?
Ron,
I find the global temperature increase over the last 50 years to be about +1.4 C. HadCRUT 5.0.2.0 through Dec. 2023
https://mega.nz/file/V7FECaZT#U4WWWmTX0sYUzPYqGKaoQw2MrZwFEH5-tbDbM70dyd0
And yes, the slight temperature drop 1940 – 1970 is generally attributed to increased anthropogenic particulates/aerosols from naval warfare during WWII and postwar industrial growth. It’s a simple search: “What caused global cooling 1940 – 1970?”
Ganon1950:
The “slight temperature drop 1940-1970” was sufficient to generate fears of a return to a new ice age. Look it up.
BA, according to the latest peer reviewed article the global warming rate for the last 50 years is 0.19C/dec, which is 0.95 C, which is less than 1.0 C. https://www.nature.com/articles/s43247-023-01061-4#:~:text=Applying%20the%20method%20to%20the,0.19%20%C2%B0C%2Fdecade13.
Interestingly, there is a significant divergence of the NH from the SH, which would be counter-intuitive of your air pollution cooling theory (or online warmists consensus).
ganon 1950,
Has the global ocean system ceased to act as a proxy global thermometer, expanding when it became hotter so quickly ( as you allege) in the last 150 years?
Geoff S
Geoff,
No.
Geoff, As with most proxies, have to account for other influences; changes in landed ice (significant), and more recently, fresh water sequestration; even changes in atmospheric water content.
BA Bushaw (ganon1950) | February 6, 2024 at 9:31 am |
Geoff, As with most proxies, have to account for other influences; changes in landed ice (significant), and more recently, fresh water sequestration; even changes in atmospheric water content.
Which explains why the multitude of HS recreations with the near straight shafts and sharp blades greatly over state the confidence levels.
JTNCS,
“Which explains why the multitude of HS recreations with the near straight shafts and sharp blades greatly over state the confidence levels.”
How do you know they “greatly overstate the confidence levels”? I know that rate of temp. change over the last 50 years is 10-20 times greater than in any similar period in the last couple of thousand years. I’m not worried about the fine details of the past (the shaft) which are unrelated (or a perceived excuse for) the currently changing shape of the blade.
BA Bushaw (ganon1950) | February 6, 2024 at 1:04 pm |-“I know that rate of temp. change over the last 50 years is 10-20 times greater than in any similar period in the last couple of thousand years. ”
Ganon – No – you do not know that
Based on the data available , no one knows whether that is true or not. Further – you know that statement you made is not true.
An honest scientist would be honest with what is known and what is unknown.
Pingback: Laufen Klimamodelle zu heiß? – KlimaNachrichten
Stronger precipitation in Southern California today.
https://i.ibb.co/1MDQ9mY/Zrzut-ekranu-2024-02-05-083618.png
Pingback: Weekly Climate and Energy News Roundup #586 – Watts Up With That?
A planet reflects the incident solar SW EM energy not only diffuselly, but also specularly. The specular reflection was neglected in planet
Energy in = Energy out
radiative balance equation, and thus the specularly reflected SW EM energy was mistakenly considered as part of the “Energy in”.
–
https://www.cristos-vournas.com
Not to forget:
Perihelion – Aphelion = 7% more solar irradiation intensity at closer to sun perihelion, than at Aphelion.
But at Perihelion a stronger sun falls on oceanic waters and gets accumulated year after year, and causes the currently observed global warming.
–
it is not a yerly cycle accumulation process, but a multimillennial one.
12 thousands years ago, the Perihelion occured at Northern Hemisphere’s summer. The 7% stronger sun fell on the land and was accumulated much less.
–
And that is why we experience a global warming trend now!
–
https://www.cristos-vournas.com
So why has that warming accumulation only been happening for the last 150 years, not the last 8,000?
Link:
https://www.timeanddate.com/astronomy/perihelion-aphelion-solstice.html
ganon,
“So why has that warming accumulation only been happening for the last 150 years, not the last 8,000?”
–
Thank you, ganon, for your response.
It is not happening for the last 150 years, but for the last 8,000. It was a Glacial (remember?), and now we are in an Interglacial.
–
What you asking is the why it is getting hotter so fast now.
Well, it is an impression we have as living creatures. We have our biology producing heat. When it is warm enough it becomes difficult for us to cool our bodies, so we start to swet.
This time of the year (when we swet) is in mid July and August.
We do not swet in March, not in April, not in May, not even in June – all this months there is a warming accumulation happening on the Northern Hemisphere!
–
Thank you again.
–
https://www.cristos-vournas.com
Correction, instead of “swet”
it should be
sweat
Nope, the Holocene optimum was 6-8 thousand years ago. And the last 50 are not a matter of personal perception – Scientific temperature measurements over that time period are quite accurate.
Also, ellipticity is currently 0.0167 about 25% of the 7% that you quote; the perihelion – aphelion difference is quite small and will stay that way for 10s of thousands of years. The major climatic effects of Milankovic cycles comes from the ellipticity (112 ka – driver of glacial – interglacial cycles for the last million years) and obliquity (41ka – dominated greater than 1 million years ago). Precession of the equinoxes (22 ka) only has relatively minor effects, particularly now, while eccentricity is low.
Well, NATURE has its own mechanism – it is a gradual reducing the amount of ice and getting the oceanic depths a little warmer…
ganon,
“The major climatic effects of Milankovic cycles comes from the ellipticity (112 ka – driver of glacial – interglacial cycles for the last million years) and obliquity (41ka – dominated greater than 1 million years ago). Precession of the equinoxes (22 ka) only has relatively minor effects, particularly now, while eccentricity is low.”
“Precession of the equinoxes (22 ka) only has relatively minor effects, particularly now, while eccentricity is low.”
–
I was not reffering to Milankovitch cycles.
And, yes, Precession of the equinoxes (22 ka) only has relatively smaller effects, particularly now, while eccentricity is low…
A couple of thousands years and we shall be in the cooling pattern again.
–
https://www.cristos-vournas.com
Christos wrote:
“12 thousands years ago, the Perihelion occured at Northern Hemisphere’s summer. The 7% stronger sun fell on the land and was accumulated much less.”
Yes, you were referring to Milankovic cycles, even if you don’t know it.
–
“Christos wrote:
“12 thousands years ago, the Perihelion occured at Northern Hemisphere’s summer. The 7% stronger sun fell on the land and was accumulated much less.”
Yes, you were referring to Milankovic cycles, even if you don’t know it.”
–
Milankovitch cycles predict a cooling pattern in our century.
What I am reffering to is a REVERSED Milankovitch cycle.
–
Do I reffer to Milankovitch cycle?
–
https://www.cristos-vournas.com
When there is not much ice left, the temperatures rise faster.
–
Thank you again.
–
https://www.cristos-vournas.com
This is exactly what we observe in the northern hemisphere. At the same time, warm oceans will bring more precipitation, including snow, which will slowly begin to accumulate in the north.
First of all, it is important to realize how thin the troposphere is, especially in winter in mid- and high latitudes. The more the role of the stratosphere and the ozone zone, where the shortest solar radiation directly acts.
https://i.ibb.co/ZzD4Z4W/zt-nh.gif
Polar cyclone over northern California.
https://i.ibb.co/9c6p0VK/Zrzut-ekranu-2024-02-05-102804.png
Details on model used in RSS calcs.
https://www.remss.com/announcement/earth-gridded-microwave-radiance-data-collection-published/
ECMWF Reanalysis v5 (ERA5)
ERA5 is the fifth generation ECMWF atmospheric reanalysis of the global climate covering the period from January 1940 to present. ERA5 is produced by the Copernicus Climate Change Service (C3S) at ECMWF.
ERA5 provides hourly estimates of a large number of atmospheric, land and oceanic climate variables. The data cover the Earth on a 30km grid and resolve the atmosphere using 137 levels from the surface up to a height of 80km. ERA5 includes information about uncertainties for all variables at reduced spatial and temporal resolutions.
https://www.ecmwf.int/en/forecasts/dataset/ecmwf-reanalysis-v5
Frank Bosse and Nic Lewis, thanks for your contribution to the oft neglected analysis of the climate model performances in replicating, within reasonable bounds, the historical changes in the observed global mean surface temperatures.
The most critical criterion for judging the capability of climate models to predict future global temperature changes would seem, obviously, to be able to reproduce reasonably well the observed changes over an extended time period.
In my analyses of the CMIP6 (and CMIP5) models, I have found that the models’ trends in the future periods, that follow directly in time the historical periods, under several different forcing scenarios, correlate well with the sensitivities determined for these models in the form of TCR and ECS. These same models can perform very differently in the extended observed (historical) period. Some continue to produce trends that correlate with sensitivity, for both models with lower and higher sensitivities, while some higher sensitivity models produce trends that are reduced by various amounts as though there has been an attempt to force the models’ trends closer to the observed ones.
With these differences in mind, I do find it difficult to represent the models using a mean GMST change in the historical period. One the other hand, since the models follow closely the sensitivities assigned in the future period, using a mean in that period seems more appropriate. In addition, using means of models takes away from an effort that I pose most important in determining, at least as a first step, a method to judge the validity of models for predicting future temperature changes.
Differences in model trends in the historical period are mostly attributed to how the models handle aerosol forcing. More papers have been published in recent years attempting to understand and put some limits on the differences, but I see little in the way of eliminating models for predicting future GMST trends based on poor performance in the observed period.
Below is a link to an analysis I did whereby I used a filtering method that extracts models with GMST changes that can be regressed against the model TCR values to find a constrained TCR value. Those values found ranged from 1.27 to 1.42, depending on the filtering criteria and OLS or TLS regression.
https://www.dropbox.com/scl/fi/z63180ykf3pfguc5zf4xw/New_Method_Emergent_Constraint_Obs_TCR_Edit.pdf?rlkey=z7mgyx633y0g6jsp3ajo1182t&dl=0
Frank and Nic … as always, you guys are on it. Thank you.
JTNCS,
“An honest scientist would be honest with what is known and what is unknown.”
Within obvious constraints, yes. More to the point, a dishonest scientist does not imply science, or other scientists, are inherently dishonest.
More fronts with precipitation will reach California from the northwest.
And still no succinct description of the evidence that supports the argument for catastrophic anthropogenic global warming.
“If you can’t explain it simply, you don’t understand it” Albert Einstein quote:
Since Spencer did not say which model simulation he was comparing to, why did Gavin S only present TCR simulations in his graph?
Pingback: Politische Klimawissenschaft - Philosophieren für alle