by Javier Vinós
A recent paper by Svetlana Veretenenko provides important support for the effect of solar activity on the lower atmospheric circulation through its effect on the polar vortex. Veretenenko’s paper is an important step in demonstrating the solar effect on global atmospheric circulation, an important part of the Winter Gatekeeper Hypothesis.
1. Introduction
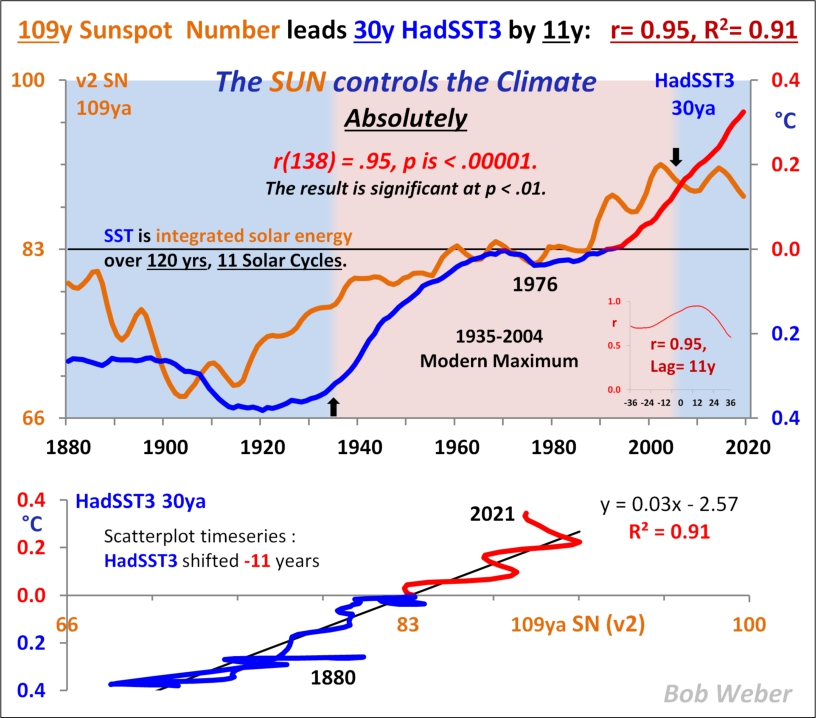
The Winter Gatekeeper Hypothesis, proposed by this author in his book “Climate of the Past, Present and Future” (Vinós 2022), is based on evidence that climate change is primarily the result of changes in poleward energy transport, and that solar variability is an important modulator of this transport. The hypothesis addresses two important issues: How climate changes naturally on the multi-decadal to the millennial time scale, even in the absence of changes in the greenhouse effect; and how changes in solar activity can profoundly affect climate despite their small energy changes. One conclusion of the hypothesis is that the Modern Solar Maximum of 1935-2005 contributed to 20th-century global warming, implying a significant reduction in climate sensitivity to carbon dioxide.
The reader is referred to parts III, IV, and V of “The Sun-Climate Effect: The Winter Gatekeeper Hypothesis” series of articles for additional information on meridional (poleward) transport mechanisms, and to part VII for a summary of the hypothesis.
The Winter Gatekeeper Hypothesis integrates different components of the transport system in the stratosphere, troposphere, and ocean. A schematic of the energy processes involved is presented in Fig. 8.1, with energy transport represented by white arrows. Solar modulation starting in the stratosphere affects all transport, and Vinós (2022) showed a solar effect on ENSO and the polar vortex. The mechanism by which solar activity modulates ENSO activity is still unknown, but this author proposes a solar modulation of the Brewer-Dobson tropical upwelling, known as the “tropical route” of the “top-down mechanism” (Maycock & Misios 2016; Vinós 2022).

Fig. 8.1. Northern Hemisphere winter meridional transport outline. The energy gain/loss ratio at the top of the atmosphere determines the maximal energy source in the tropical band and the maximal energy sink in the Arctic in winter. Incoming solar energy is distributed in the stratosphere and troposphere/surface where it is subjected to different transport modulations. Energy (white arrows) ascends from the surface to the stratosphere at the tropical pipe (left dashed line) and is transported towards the polar vortex (right dashed line) by the Brewer–Dobson circulation. Stratospheric transport is determined by UV heating at the tropical ozone layer, which establishes a temperature gradient affecting zonal wind strength through thermal wind balance, and by the quasi-biennial oscillation (QBO). This double control determines the behavior of planetary waves (black arrows) and determines if the polar vortex undergoes a biennial coupling with the QBO (BO). In the tropical ocean mixed-layer, ENSO is the main energy distribution modulator. While the Hadley cell participates in energy transport and responds to its intensity by expanding or contracting, most energy transport in the tropics is done by the ocean. Changes in transport intensity result in the main modes of variability, the AMO, and PDO. Outside the tropics, most of the energy is transferred to the troposphere, where synoptic transport by eddies along storm tracks is responsible for the bulk of the transport to high latitudes. The strength of the polar vortex determines the high latitudes winter climate regime. A weak vortex promotes a warm Arctic/ cold continents winter regime, where more energy enters the Arctic exchanged by cold air masses moving out. Jet streams (PJS, polar; TJS, tropical; PNJ, polar night) constitute the boundaries and limit transport. Red oval, the part of the Winter Gatekeeper Hypothesis studied in Veretenenko 2022. Figure from Vinós 2022.
The effect of solar activity on the polar vortex, first reported by Karin Labitzke in 1987, is better understood. There is now considerable evidence that solar activity affects the state of the polar vortex. The mechanism, which was already proposed in the 1970s, is called “Planetary Wave Feedback” (Gray et al. 2010). The amount of energy and momentum impinging on the polar vortex depends on the state of the stratosphere that is affected by solar activity. During periods of low solar activity, more energy is delivered, perturbing the polar vortex, which is more stable under high solar activity. The stability of the polar vortex is of fundamental importance for the winter climate of the Northern Hemisphere mid-latitudes and for the amount of energy reaching the Arctic.
The Winter Gatekeeper Hypothesis puts this known solar mechanism into context as part of a more general effect of solar activity on meridional transport through the stratosphere and troposphere from the tropics to the poles. It also shows that the important climatic effect of transport changes is due to changes in the amount of energy leaving the planet as outgoing longwave radiation in the polar regions.
- Polar Vortex and Its Role in Atmospheric Processes
The recent paper by Svetlana Veretenenko, from the Ioffe Institute in St. Petersburg, Russia (Veretenenko 2022, Ve22 from here), provides important support for the effect of solar activity on the lower atmospheric circulation through its effect on the polar vortex. Veretenenko’s paper focuses only on the troposphere-polar vortex part of the Winter Gatekeeper Hypothesis (Fig. 8.1, red oval). It also lacks an explanation of the energetic changes necessary to change the climate. The Winter Gatekeeper Hypothesis has provided such an explanation through changes in outgoing radiation (Vinós 2022). Nevertheless, Veretenenko’s paper is an important step in demonstrating the solar effect on global atmospheric circulation, an important part of the Winter Gatekeeper Hypothesis. It is not uncommon in science for unrelated authors to independently reach similar conclusions at about the same time. The Winter Gatekeeper Hypothesis was already developed in 2018 and was included in the first edition of “Climate of the Past, Present and Future.” This hypothesis could not have been developed 20 years ago because there was insufficient knowledge and data to support it. The time has come to make a major breakthrough in our understanding of natural climate change and the role of the sun in it. This author is proud to be a part of it and welcomes Veretenenko’s paper “Stratospheric Polar Vortex as an Important Link between the Lower Atmosphere Circulation and Solar Activity.” The main findings of this article are discussed below.
Ve22 defines the polar vortex and its role in atmospheric processes very well:
The stratospheric polar vortex is a large-scale cyclonic circulation that forms in the cold air mass over the Polar region during [the] cold half of the year and that extends from the middle troposphere to the stratosphere. A circular eastward motion of air arises, which isolates the polar air from the warmer air of mid-latitudes, contributing to a temperature decrease inside the vortex. The vortex is seen as a belt of strong western winds at latitudes ~50–80° N, with the wind velocity reaching ~50–60 m s–1 at the upper levels. In Figure 2b, the magnitude of the horizontal temperature gradients at the level 20 hPa is presented for January 2005.

Fig. 8.2 (a) Distribution of mean monthly velocity of zonal wind (in m·s−1) at the 20 hPa level (stratosphere) in the Northern Hemisphere in January 2005. (b) distribution of mean monthly magnitude of the horizontal gradient of temperature (in °C/100 km) at the 20 hPa level in January 2005. Figure from Ve22.
Fig. 8.2 constitutes a nice illustration of the winter gatekeeper concept. The strong winds that circle the poles in winter act as a gatekeeper determining how much energy is going to enter the polar region, creating a steep temperature gradient. The strength of the polar vortex is tied to the Northern Hemisphere winter atmospheric circulation:
The polar vortex is known to be an important element in the large-scale circulation of the atmosphere. The location and state of the vortex affect the development of the North Atlantic Oscillation (NAO) and Arctic Oscillation (AO). Baldwin and Dunkerton [5] showed that under strong vortex regimes, the NAO and AO indices tend to be positive and that the tracks of extratropical cyclones shift to the north. Gudkovich and colleagues [6] linked the alternations of cold and warm epochs in the Arctic with changes in the vortex state, warm and cold epochs being associated with strong and weak vortex regimes, respectively. Labitzke [7] was the first to reveal that the effects of solar activity on the characteristics of the stratosphere and troposphere depend on the phase of the quasi-biennial oscillations (QBO) in the atmosphere, the findings by Labitzke suggest that the polar vortex strength may also influence the atmosphere response to solar variability.
3. Spatial and Temporal Variability in Galactic Cosmic Ray Effects on Troposphere Pressure
Ve22 believes that the solar effect is mediated by galactic cosmic rays, but we must remember that solar activity, often assessed by sunspots or the 10.7 cm radio flux, is strongly correlated with the inverse of cosmic rays, as shown in Fig. 8.3. There is a lag of about one year, but finding a similar lag in a correlation of climate effects cannot be interpreted as evidence for cosmic ray involvement, since the lags can arise independently.

Fig. 8.3. Solar activity (sunspots) and cosmic rays (inverted). Figure from http://www.climatedata.info.
Ve22 correlates solar activity with atmospheric pressure, as has been done previously by many authors since the Labitzke and Van Loon studies of the 1980s. Ve22 also points out the correlation reversals that have taken place in the solar-climate signal, extensively discussed in Parts I, II, and IV.
Figure [8.4] presents the spatial distribution of the correlation coefficients between pressure and GCR variations, with the linear trends being removed, for two different time periods: 1953–1981 [not shown here] and 1982–2000. Troposphere pressure was characterized by the mean yearly values of geopotential heights at the 700 hPa level … The mean long-term (climatic) positions of Arctic and Polar fronts, which are the main atmospheric fronts at extratropical latitudes, are also shown … Arctic fronts separate cold air masses forming in the Arctic region from the warmer air of middle latitudes, whereas Polar fronts separate mid-latitudinal and tropical air masses. They play an important part in cyclonic activity at middle latitudes, as the formation and evolution of extratropical cyclones are closely associated with these fronts … the distribution of the correlations is closely related to the climatic atmospheric fronts. In the previous period, 1953–1981 [not shown here], the distribution of the correlation coefficients between pressure and GCR fluxes was quite similar to that in 1982–2000 … However, the signs of correlations in all these areas were quite opposite to those in 1982–2000.

Fig. 8.4. Spatial distribution of the correlation coefficients between mean yearly values of geopotential height at 700 hPa (troposphere) and cosmic rays rate for the period 1982–2000. Curves 1 and 2 show the climatic positions of Arctic fronts in January and July, respectively. Similarly, curves 3 and 4 are the same for Polar fronts; curves 5 and 6 are the same for the equatorial trough axis. This figure corresponds to Figure 3a from Ve22 and has been modified by the addition of land contours and a yellow box for what Ve22 calls the North Atlantic cyclogenetic zone (zone of most intensive cyclone formation) along the eastern coasts of North America (20–30° N, 280–300° E, and 30–40° N, 290–310° E).
4. Temporal Variability of Solar Activity Effects on Troposphere Pressure in the Northern Hemisphere and the Epochs of Large-Scale Circulation
For longer temporal analyses, Ve22 uses the sunspot number as a proxy for solar activity and its correlation with sea level pressure in two areas, the North Atlantic cyclogenic zone (yellow box in Fig. 8.4) or the polar region (60-85° N). As we can see in Fig. 8.4 the correlation with solar activity in these two areas is opposite. Fig. 8.5 shows that their opposite correlation with solar activity is maintained over time, but undergoes reversals at certain times.

Fig. 8.5. (a) Correlation coefficients between yearly values of sea level pressure and sunspot numbers R (SLP, SSN) for the Polar region (solid line) and the North Atlantic cyclogenetic zone (dashed line) for sliding 15-year intervals. Dotted lines show the 95% significance level. (b) Fourier spectra of sliding correlation coefficients as in (a). Figure from Ve22.
The presented data allow the suggestion of a close interconnection between dynamic processes developing the North Atlantic cyclogenetic zone and in the Polar region as a response to phenomena related to solar activity. The correlation reversals took place in the end of the 19th century, in the 1920s, near 1950, and in the early 1980s, which indicates a roughly 60-year variation in solar activity effects on troposphere circulation.
Ve22 takes the dates of the correlation reversals rather than the dates on which the trends change, so it misses known climate regime shifts identified in the Pacific, such as the one in 1976 that precedes the correlation reversal of the early 1980s by about six years. This prevents Ve22 from relating the detected changes to a more global phenomenon involving meridional transport by the multidecadal stadium-wave oscillation that shows the same 65-year frequency (Vinós 2022). Moreover, unlike the Winter Gatekeeper Hypothesis, Ve22 has no explanation for the correlation reversals, something that has puzzled solar climate researchers for a century.
Thus, the obtained results allow us to suggest that the reversal of the correlation links between pressure variations (development of extratropical baric systems) and solar activity phenomena may be associated with changes in the large-scale circulation epochs.
Ve22 supports the correlation between solar activity and atmospheric pressure with a similar analysis using the atmospheric circulation index (Vangengeim-Girs) that this author also used in Vinós 2022 Fig. 11.10d. Ve22 correctly identifies the relationship between solar activity and meridional circulation, which is one of the bases of the Winter Gatekeeper Hypothesis.
Thus, the character of solar activity … effects on cyclonic processes (pressure variations) at extratropical latitudes seems to be closely related to large-scale circulation epochs and especially to the evolution of meridional circulation forms. Indeed, the results of the spectral analysis (Figure 5, right panel) showed that annual occurrences of the meridional circulation forms … are characterized by dominant harmonics of ~60 years… Thus, the obtained results allow us to suggest that the reversal of the correlation links between pressure variations (development of extratropical baric systems) and solar activity phenomena may be associated with changes in the large-scale circulation epochs.
5. Evolution of the Polar Vortex as a Possible Reason for Temporal Variability in Solar Activity Effects on the Lower Atmosphere Circulation
Ve22 relates the observed changes in atmospheric circulation and its changing correlation with solar activity to changes in the state of the polar vortex. Using reanalysis, Ve22 shows a period of strong stratospheric vortex from the mid-1970s to the late 1990s, characterized by stronger zonal winds at 60-80°N and lower polar temperatures. Weaker vortex phases occurred in the two decades before and after that period.
More controversial are Ve22 findings on surface changes in sea-level pressure and temperature in the Arctic region.
One can see that the period with a strong vortex (~1980–2000), when stratospheric winds were enhanced (Figure 7), was really accompanied by a decrease in pressure and warming in the Arctic. The previous period with a weak vortex (~1950–1980), on the contrary, was accompanied by an increase in pressure and a cold epoch in the studied region.
This makes little sense, as a strong vortex creates a zone of lower surface pressure and lower temperature. The data bear this out, as the Arctic has experienced intense winter warming since the 1997 shift to a weaker vortex phase, not the cooling shown in Figure 7 of Ve22. This author suspects a problem with Ve22 figure 7 or with the polynomial trend removal methodology.
6. Destruction of Cloud-Galactic Cosmic Rays Correlation: Possible Role of the Vortex Weakening
Ve22 next examines the correlation between the low cloud anomalies and cosmic rays that formed the basis of Svensmark’s theory. As Ve22 shows, the correlation disappeared after 2000, and Ve22 attempts to relate the end of the correlation to a change in the polar vortex. In this author’s opinion, the attempt is unsuccessful. Svensmark’s theory requires a direct effect of cosmic rays on cloud condensation nuclei. It is not possible to justify that more cosmic rays go from inducing more clouds to inducing fewer clouds. However, Ve22 attempts to do so by substituting an unspecified effect on cyclogenesis for the physical effect of cosmic rays on condensation nuclei.
One can see that the correlation coefficients for pressure–GCRs [galactic cosmic rays] and cloud–GCRs vary in opposite phases. The highest positive correlation R (LCA, FCR) took place in the period, when the effects of GCRs on cyclone development were the most pronounced. In the late 1990s, this correlation started decreasing and changed the sign simultaneously with the reversal of the pressure–GCR correlation. Thus, the presented data provide evidence that a high positive correlation between cloud amount and galactic cosmic rays revealed on the decadal time scale [16,39] was due mostly to the effects of GCR on the development of dynamic processes in the atmosphere under a strong polar vortex.
This seems a convoluted alteration of Svensmark’s theory to maintain the hypothesis that solar effects on atmospheric circulation are due to cosmic rays. The explanation that the effects are due to dynamical changes initiated by changes in UV rays mediated by stratospheric ozone (the “top-down” mechanism; Maycock & Misios 2016), supported by considerable evidence and incorporated into the Winter Gatekeeper Hypothesis constitutes a simpler, more specified, and better-supported alternative.
Next, Ve22 goes into a highly speculative and rather lengthy discussion of the possible effects on the polar vortex of solar proton events, auroral phenomena related to geomagnetic activity, magnetic storms, and solar wind. She even argues for a 60-year periodicity in total solar irradiance that is not observed in sunspots. She also raises the possibility that changes in the chemistry of the middle atmosphere are involved in variations in the strength of the polar vortex. This author finds it surprising that the main factor known to affect polar vortex stability, the planetary wave feedback mechanism (Gray et al. 2010), is not considered in this paper.
- Conclusions
Ve22 ends with 3 conclusions:
-
Temporal variability of solar activity phenomena on the circulation of the lower atmosphere reveals a roughly 60-year periodicity that seems to be associated with changes in the epochs of large-scale circulation…
-
In turn, changes in the circulation epochs seem to be related to the transitions between the different states of the stratospheric polar vortex…
-
The state of the polar vortex may be affected by different solar activity phenomena contributing to a roughly 60-year oscillation of its intensity…
The first two are clear and supported by the evidence. As advocated by the Winter Gatekeeper Hypothesis, meridional transport features epochs separated by climatic shifts and characterized by distinct states of the winter atmospheric circulation and polar vortex strength. The periodicity of this multi-decadal transport oscillation, which also involves the oceans, is c. 65 years. Solar activity is one of the main modulators of meridional transport changes through its action on three control centers: the tropical ozone layer, the polar vortex (also identified by Ve22), and ENSO (Vinós 2022).
For the first time in a hundred years, a mechanism has been proposed to explain the solar effect on climate that is consistent with all the evidence and includes the ability to alter the planet’s energy budget through coincident changes in outgoing energy. It explains how a very small change in UV energy in the stratosphere is able to alter the meridional transport of energy making it easier or harder for the planet to conserve energy. Ve22 provides evidence for the solar activity → polar vortex → atmospheric circulation connection and identifies the polar vortex control center as one of the links between solar activity and atmospheric circulation.
- References
Gray LJ, Beer J, Geller M, et al (2010) Solar influences on climate. Reviews of Geophysics 48 (4)
Maycock A & Misios S (2016) Top-down” versus “Bottom-up” mechanisms for solar-climate coupling. In: Matthes K, De Wit TD & Lilensten J (eds.) Earth’s climate response to a changing Sun. EDP Sciences, France, 237-246. Free book download
Veretenenko S (2022) Stratospheric polar vortex as an important link between the lower atmosphere circulation and solar activity. Atmosphere 13 (7), 1132
Vinós J (2022) Climate of the past, present and future. A scientific debate, 2nd ed. Critical Science Press. Free book download
Leave a Reply