
Guest post by Antonis Christofides, Demetris Koutsoyiannis, Christian Onof and Zbigniew W. Kundzewicz
On the chicken-and-egg problem of CO2 and temperature.
Bare facts vs. mechanism
A car is travelling at 80 km/h, and a ray of light is travelling parallel to the car, in the same direction. Its speed relative to the Earth is 300,000 km/s. What is its speed relative to the car? Today we know that the answer “300,000 km/s minus 80 km/h” is wrong. But in 1887, people thought that it was self-evident and undisputable—after all, it’s basic logic and simple arithmetic. At that time, physicists Michelson and Morley had devised a method with sufficient accuracy to measure the small differences in the speed of light, and in an effort to discover details about its movement, they conducted one of the most famous experiments in the history of science. The results were baffling. The speed of light was constant in all directions—the direction of the Earth’s movement, the opposite direction, and the perpendicular direction. There was no explanation for that—it defied all logic.
However, we have to look at the bare facts, regardless how impossible they seem. Michelson and Morley did not feel compelled to provide an alternative theory of light, or of anything. They concluded that their results “refute Fresnel’s explanation of aberration” and that Lorentz’s theory “also fails.” Had they written “we have no idea what’s going on” it would have been the same. Making their negative results public opened the road to further research. It was a long road, and it took almost twenty years of work by distinguished scientists before arriving at the theory of relativity.
It goes without saying that this is hardly the first or the last mystery in the history of science. One that is still unsolved is the changing mass of the International Prototype of the Kilogram. Until a few years ago, the kilogram was defined as the mass of a platinum-iridium object stored in the International Bureau of Weights and Measures in Paris. It has been found that its mass changes over time by something like 0.000005% per century, and no-one knows why exactly. That no-one knows the mechanism does not alter the fact that the mass does change.
How a clear case of causality can become a noisy mess
Imagine a beach being hit by small waves. Once in a while, a series of noticeably larger waves arrive. There’s a port 10 km further, and ships are departing from it. We might notice that the departures of the ships are correlated to the instances of larger waves, and suspect that there could be a causal relationship.
In reality, in this case we understand the mechanism through which the ships cause the waves; but if we assume we don’t, here is how we might try to investigate: we might draw a chart like the following, where the horizontal axis is time, the orange line shows ship departures (the vertical axis showing the size of the ship) and the blue line shows sea level. If every departure was reliably followed by a temporary increase in wave height, we could conclude that the departures of the ships potentially cause the increase in wave height, especially if we noticed that the size of the ship is correlated to the size of the increase in wave height.
We say “potentially” because we can never be certain about causation. It could be that the departures and the waves both have a common cause. Even if someone was shot in the head, we can’t be certain it was the bullet that killed him—he might have suffered a stroke just before the bullet entered his brain (Agatha Christie’s Poirot has resolved several mysteries of similar type). So we can hardly be 100% certain that X causes Y. One thing is clear, however: the waves do not cause the ships to depart. The reason is that first the ship departs and later the waves hit the beach. The effect cannot precede the cause.
Even in this simple case where there’s an impulse (the departing ship) followed by a response, things can quickly get complicated. Ships could be going in many different directions, and the response would not always appear in an equal time interval after the impulse. For some impulses the response could be totally absent (e.g. for ships that depart in a direction away from the beach). The interval between departures could be smaller than the time it takes for the response to arrive, and the intertwining of impulses and responses could be confusing. Sometimes responses might appear out of the blue, without impulse (for example, there could be arriving ships that cause that, which we might not have taken into account). It might not be as easy to distinguish the wave response from the other waves if the sea is rough. Add all these factors together, and the blue line could be a big noisy mess.
And in a real world example, like in the question of whether CO₂ concentration affects the temperature, both lines can be a big noisy mess.
Investigating potential causes
So here is the question: given two processes, how can we determine if one is a potential cause of the other? We deal with this question in two papers we published last year in the Proceedings of the Royal Society A (PRSA): Revisiting causality using stochastics: 1. Theory (preprint); 2. Applications (preprint). We reviewed existing theories of causation, notably probabilistic theories, and found that all of them have considerable limitations.
For example, Granger’s theory and statistical test have already been known to be identifying correlation (for making predictions), not causation, despite the popular term “Granger causality”. What is more, they ignore the fact that processes exhibit dependence in time. Hence, formally testing hypotheses in geophysics by such tests can be inaccurate by orders of magnitude due to that dependence.
As another example, Pearl’s theories make use of causal graphs, in which the possible direction of causation is assumed to be known a priori. This implies that we already have a way of identifying causes. Moreover, insofar as those theories assume, in their use of the chain rule for conditional probabilities, that the causality links in the causal graphs are of Markovian type, their application to complex systems is problematic.
Another misconception in some of earlier studies is the aspiration that by using a statistical concept other than the correlation coefficient (e.g. a measure of information) we can detect genuine causality.
Having identified the weaknesses in existing theories and methodologies, we proceeded to develop a new method to study the question whether process X is a potential cause of process Y, or the other way round. This has several key characteristics which distinguish it from existing methods.
- Our framework is for open systems (in particular, geophysical systems), in which:
- External influences cannot be controlled or excluded.
- Only a single realization is possible—repeatability of a geophysical process is infeasible.
- Our framework is not formulated on the basis of events, but of stochastic processes. In these:
- Time runs continuously. It is not a sequence of discrete time instances.
- There is dependence in time.
- It is understood that only necessary conditions of causality can be investigated using stochastics (or other computational tools and theories)—not sufficient ones. The usefulness of this, less ambitious, objective of seeking necessary conditions lies in their ability:
- To falsify an assumed causality.
- To add statistical evidence, in an inductive context, for potential causality and its direction.
The only “hard” requirement kept from previous studies is the temporal precedence of the cause over the effect. Sometimes it can happen that causation goes both ways; for example, hens lay eggs and eggs hatch into hens (and it was Plutarch who first used the metaphor of hen and egg for this problem). Conveniently, we call such systems “potentially hen-or-egg causal”. Our method also identifies these, and also determines in these cases which of the two directions is dominant.
To deal with dependence in time, often manifested in high autocorrelation of the processes, we proposed the differencing of the time series, which substantially decreases the autocorrelation. In other words, instead of investigating the processes X and Y and find spurious results (as has been the case in several earlier studies), we study the changes thereof in time, ΔX and ΔY.
A final prominent characteristic of our method is its simplicity. It uses the data per se, rather than involved transformations thereof such as the cross- and auto-correlation functions or their Fourier transforms —the power spectra and cross-spectra. The results are thus more reliable and easier to interpret.
Atmospheric temperature and CO₂ concentration
In our PRSA papers we implemented our method in several case studies, such as rainfall-runoff and El Niño-temperature. One of the case studies was CO₂ concentration and temperature, and this one gave strong indications that temperature is potentially the cause and CO₂ the effect, while the opposite causality direction can be excluded as violating the necessary condition of time precedence.
However, the scope of these two papers was to formulate a general methodology for the detection of causality rather than to study a specific system in detail, and the case studies were brief. With regard to the relationship between temperature and CO₂ concentration, we hadn’t gone into details as to the effect of seasonality and time scale, or the exploration of many sources of data. So in our latest paper, published a week ago in Sci (“On hens, eggs, temperatures and CO2: Causal links in Earth’s atmosphere”), we studied the issue in detail. We used CO₂ data from Mauna Loa and from the South Pole, and temperature data from various sources (our published results are for the NCAR/NCEP reanalysis, but in the previous papers we used satellite data too). We used both historical data and the outputs of climatic models. We examined time scales ranging from months to decades.
The results are clear: changes in CO₂ concentration cannot be a cause of temperature changes. On the contrary, temperature change is a potential cause of CO₂ change on all time scales. As we conclude in the paper, “All evidence resulting from the analyses of the longest available modern time series of atmospheric concentration of [CO₂] at Mauna Loa, Hawaii, along with that of globally averaged T, suggests a unidirectional, potentially causal link with T as the cause and [CO₂] as the effect. This direction of causality holds for the entire period covered by the observations (more than 60 years).”
The math is a bit too complicated to present here. However all three papers have been reviewed extensively by referees and editors (notice in the last paper that four editors were involved as seen on the front page of the paper). The results in the earlier papers were criticized, formally by a commentary in the same journal and informally in blogs and social media. Some concerns expressed by critics, such as about lengths of time series, effect of seasonality, effect of timescale, are dealt with in this new paper. No-one has however developed any critique of the methodology.
In addition, the following graphic (taken from the graphical abstract of the paper and inserted here as a quiz) aims to make things even clearer. In this we plot the time series on the annual scale to avoid too many points. Hopefully even the annual scale of this graph (in contrast to the monthly scale we used in our detailed results) suffices to suggest that there is very little doubt as to the potential causality direction.
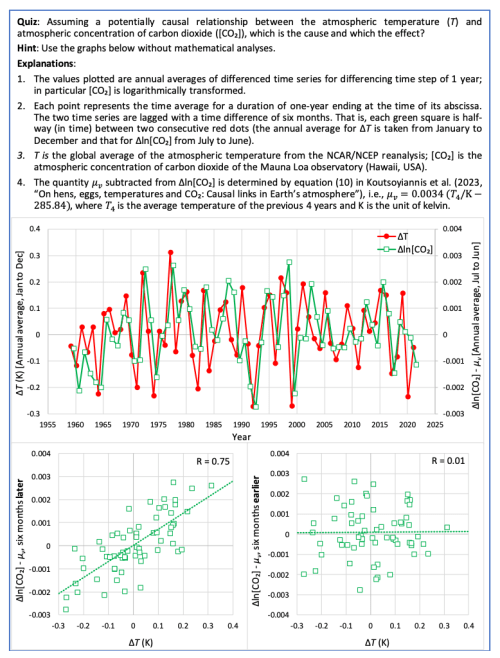
Do climate models faithfully represent the causality direction found in the real world data? This question is also investigated in our new paper. The reply is clearly negative: the models suggest a causality direction opposite to the one found when the real measurements are used. Thus, our methodology defines a type of data analysis that, regardless of the claims we infer about the detection of causality per se, assesses modelling performance by comparing observational data with model results. In this, it contributes in studying an epistemological problem and, in particular, it casts doubt over the widespread claims that “in silico experimentation” with climate models is the only option we have and that this can be justified by the (insufficiently validated) assumption of an “increasing realism of climate system models”.
One might think that the potential causality direction we determined is counterintuitive in the light of the well-known greenhouse effect, and that the effect of temperature on CO₂ concentration would be subtle. But no, it is quite pronounced. In fact, human emissions are only 4% of the total, natural emissions dominate, and the increase of the latter because of temperature rise is more than three times the human emissions. This it is visible in a graph we included in an Appendix to the paper.
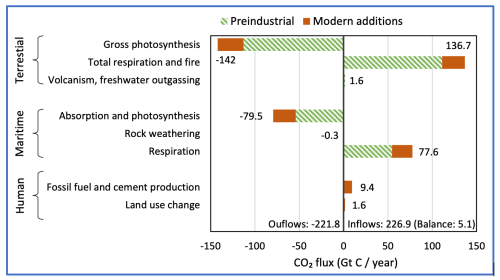
Figure A1 from Koutsoyiannis et al. (2023): Annual carbon balance in the Earth’s atmosphere in Gt C/year, based on the IPCC estimates. The balance of 5.1 Gt C/year is the annual accumulation of carbon (in the form of CO2) in the atmosphere.
Of course, several questions remain. Why does the temperature increase? And why does the temperature rise potentially cause an increase in CO₂ concentration? Is the temperature change a real cause of the CO₂ concentration change, or could they both be the result of some further causal factor? It’s not hard to speculate. Yet we briefly investigate quantitatively possible mechanisms for these causal relationship in the appendices to the paper. However, if we stick to the facts, two things are clear: (i) changes in CO₂ concentration have not been warming the planet; (ii) climate models do not reflect what the observational data tell us on this issue.
JC comment: I find this analysis to be very interesting. The global carbon cycle is definitely “unsettled science.” I think what this paper shows is that CO2 is an internal feedback in the climate system, not a forcing (I think that Granger causality would reveal this?). Yes, this all depends on how we define the system, and humans and their emissions are currently acting outside of the system in most climate models and are considered as an external forcing. Again, as emphasized in the paper, human emissions are small fraction of natural emissions so this issue of internal versus external isn’t straightforward. By analogy, in the 1970’s climate models specified cloud cover, and hence clouds acted as an external forcing. However, clouds vary in response to the climate, and now with interactive clouds, clouds are now correctly regarded as a feedback and not a forcing.
References
- Koutsoyiannis, C. Onof, A. Christofides, and Z. W. Kundzewicz, Revisiting causality using stochastics: 1.Theory, Proceedings of The Royal Society A, 478 (2261), 20210835, doi:10.1098/rspa.2021.0835, 2022.
- Koutsoyiannis, C. Onof, A. Christofides, and Z. W. Kundzewicz, Revisiting causality using stochastics: 2. Applications, Proceedings of The Royal Society A, 478 (2261), 20210836, doi:10.1098/rspa.2021.0836, 2022.
D. Koutsoyiannis, C. Onof, Z. W. Kundzewicz, and A. Christofides, On hens, eggs, temperatures and CO₂: Causal links in Earth’s atmosphere, Sci,

Is a chicken a “forcing” or a “feedback” of an egg?
Good question… Difficult answer…. So, we preferred different phraseology (and different foundation of our math) as you may see in the paper.
Argumentum ad ignorantiam is a bad opening move. You aver that the standard Kilo in Paris
” has been found that its mass changes over time by something like 0.000005% per century, and no-one knows why exactly.”
The loss is due to two mechanisms, one physical and one chemical. Despite care in handling, the platinum -iridium cylinder is not immune to mechanical and atmospheric erosion. At the time of the metric standards manufacture, zone refined high purity ( 99.9999+%) platinum and iridium did not yet exist.
The Victorian era mass cylinders and standard meters accordingly contain amongst other impurities ,hundreds of parts per million of osmium, which slowly oxidizes in air to form highly volatile OsO4.
As a general rule, reviewers who check facts rigorously stop short at the first counterfactual they encounter. Yours is on Page 1 Para3.
I have to agree with Russell on this, plus the long rambling intro about M&M etc. is a tedious way to make a point which can be easily stated clearly.
I don’t see why you choose different averaging periods for your two variable. Use Jan-Dec for both. If you want to find the lag with the highest correlation, do a cross-correlation analysis.
Also, dividing a temperature by “Kelvin” to pretend it is a dimensionless quantity you can subtract from ln(CO2) is not credible physics. What is “temperature per kelvin” supposed to be physically? Sorry, this is silly. This question of causality is crucially important and needs to be done competently. Please try again.
IIRC, Rae Allen showed about 15y ago that SST correlated with d/dt (CO2) , far better than a simple lead/lag correlation.
Both with oceanic out-gassing and terrestrial consumption of CO2 by plants or production by decomposition, it is dCO2 that relates to temperature.
https://climategrog.files.wordpress.com/2015/04/mlo_dco2_sst.png
“Also, dividing a temperature by “Kelvin” to pretend it is a dimensionless quantity you can subtract from ln(CO2) is not credible physics. ”
Some reading of the SI (International System of Units) Brochure (available online is open access) would be useful to learn how to express mathematically a physical equation.
Copying from section 5.4, “Rules and style conventions for expressing values of quantities”
“Symbols for units are treated as mathematical entities. In expressing the value of a quantity as the product of a numerical value and a unit, both the numerical value and the unit may be treated by the ordinary rules of algebra. This procedure is described as the use of quantity calculus, or the algebra of quantities. For example, the equation p = 48 kPa may equally be written as p/kPa = 48. ”
Read more in the SI Brochure.
“I don’t see why you choose different averaging periods for your two variable. Use Jan-Dec for both. If you want to find the lag with the highest correlation, do a cross-correlation analysis.”
“Please try again.”
Yes Sir!
Note that we are able to reverse causality and do what you requested with a lag of minus three years. Please see our paper “Atmospheric temperature and CO₂: Hen-or-egg causality?”, Sci, 2 (4), 83, doi:10.3390/sci2040083, 2020.
I hope our Figures 11 and 14 in that paper satisfy your requests.
To be picky ln{[CO2]/ppm} has no units, you need an estimate of the climate sensitivity in °C/(W/m2) as a multiplier so ΔT= A ln {[CO2]/[CO2]o} where [CO2]o is the concentration at some reference period. This is the dimensionally proper equation.
That implies that [CO2] has an effect on temperature as well as temperature on [CO2]. We know from measurements that more CO2 is being emitted by burning fossil fuels than remains in the atmosphere. We also have measurements showing that ~105 _+ 8 Pg C from these emissions has been absorbed in the oceans* and the biosphere has i** and we have measurements and theory on how temperature and salinity affect CO2 partial pressure in the gas phase above sea water*** where a difference of 1C corresponds at best to a few ppm.
Of course we know that the atmospheric concentration of CO2 has increased from ~290 to ~430 ppm over the last 150 years.
This poses some obvious problems for any statistical treatment which claims that CO2 concentration follows changes in temperature
*Feely, R. A., Sabine, C. L., Takahashi, T., & Wanninkhof, R. (2001). Uptake and storage of carbon dioxide in the ocean: The global co~ 2 survey. OCEANOGRAPHY-WASHINGTON DC-OCEANOGRAPHY SOCIETY-, 14(4), 18-32.
**Amthor, Jeffrey S. “Terrestrial higher‐plant response to increasing atmospheric [CO2] in relation to the global carbon cycle.” Global Change Biology 1.4 (1995): 243-274 and especially the annual cycle
***Weiss, R. F., Jahnke, R. A., & Keeling, C. D. (1982). Seasonal effects of temperature and salinity on the partial pressure of CO2 in seawater. Nature, 300(5892), 511-513.
I do not think that the expression “ln{[CO2]/ppm}” appears anywhere in our paper. Notice, we use Δln[CO2] which is dimensionless per se (= ln[CO2]_t – ln[CO2]_t’ = ln([CO2]_t / [CO2]_t’). So, you can say: “This [i.e., what we write] is the dimensionally proper equation”.
Dimensional analysis tells us what a mathematical expression can be, not which is related to which. Therefore, statements like “implies that [CO2] has an effect on temperature as well as temperature on [CO2]” are not defendable, in my opinion.
If I wrote ΔT= A ln {[Pigs]/[Pigs]o}, would that prove global temperature has an effect on pigs and vice versa?
Hi Jim2
If the result of a calculation based on climate physics and chemistry gave you the result that the ln[Pigs] was proportional to the change in temperature, why yeah test that. It might be the case in a sty, but there is serious doubt it would apply to the globe.
Hey Eli. Run a statistical correlation between pigs and T. You just might find a positive one.
Jim2
As the pastafarians put it:
We believe that global warming, earthquakes, hurricanes, and other natural disasters are a direct effect of the shrinking numbers of pirates since the 1800s.
As the number of pirates decreased, global temperatures increased.
https://pastafarians.org.au/pastafarianism/pirates-and-global-warming/
However the disconnect with physics puts paid to the statistical correlation. It’s been fun and thanks for the reminder.
demetriskoutsoyiannis
Again being pedantic, but there is a reason Δln[CO2] is dimensionless because it equals ln[CO2(t2)]/CO2(t1)] as I pointed out. ln[CO2] by itself is improper dimensionally because you can only take a log of a dimensionless number.
But that leaves you with the same problem.
1. You need a constant which relates ln[CO2(t2)]/CO2(t1)] to ΔT for your model. This relationship is derived from the physics of climate models showing that Δln[CO2] drives the increase in temperature and the models provide estimates of the constant. It is not a result of statistics
2. We know that [CO2] has grown by 140 ppm in 130 years.
3. We know that ΔT(global) has increased about 1K.
4. We know that the amount of fossil fuel burned in that time would have roughly doubled the observed increase of CO2 in the atmosphere if there were not sinks
5. We can trace that the excess CO2 from combusion has gone mostly into the oceans and some into soils/plants
6. We know that the increase in CO2 above sea water for an increase in temperature of 1K is only a few ppm
Therefore the observed increase in [CO2] cannot be driven by the observed increase in temperature
(see references in my earlier comment)
Eli Rabett, no need to repeat (once more) the conventional wisdom (or official propaganda) taught to all of us every day by all types of media and even to kids at kindergarten.
(See also section SI2 in Supplementary Information of the paper).
Eli,
“Therefore the observed increase in [CO2] cannot be driven by the observed increase in temperature.”
–
[CO2] is a trace gas (~400 ppm) in the Earth’s atmosphere. Earth’s atmosphere, as a whole, is a very thin substance to have any significant greenhouse warming effect on the Earth’s surface.
Earth’s atmospheric [CO2] content is too small to have any influence on the planetary radiative energy balance.
–
Eli,
“2. We know that [CO2] has grown by 140 ppm in 130 years.
3. We know that ΔT(global) has increased about 1K.”
–
Since the [CO2] 140 ppm do not influence the ΔT(global) temperature increase, thus there is only one conclusion:
The increase in [CO2] content by 140 ppm in 130 years is driven by the ΔT(global) increase about 1K.
–
https://www.cristos-vournas.com
“Therefore the observed increase in [CO2] cannot be driven by the observed increase in temperature”
1. You need to account for the increase in respiration due to increase in temperatures. From experiment 1C change in temp causes (at least) a 26% change in respiration.
2. You need to explain the high variance in atmospheric CO2 that lag temperature change in the paleoclimatological record:
“The majority of the stomatal frequency-basedCO2 estimates for the Holocene do not support the widely accepted concept of comparably stable CO2concentrations throughout the past 11,500 years (Indermu.hle et al., 1999). The available high-resolution CO2 reconstructions based on plant fossils suggest that century-scale CO2 fluctuations contributed to Holocene climate evolution (Rundgren and Beerling, 1999; Wagner et al.)”
Kouwenberg 2004: “However, atmospheric CO2 levels are influenced by temperature- induced changes in biospheric and marine feedback systems. ”
Steinthorsdottir et al 2013:”first to minimum values of 175-190 ppm at theGS-1/Holocene boundary (3.24 depth), before rising sharply to280-300 ppm, and staying at that level through the next 95years….This again indicates a ca 100 ppm rise in CO2 in <100 years"
"which marks a shift from a warmer to a colder climate state, CO2 increases markedly before the boundary and peaks at ca 400-425 ppm before it decreases again and then stabilizes after the boundary into a pattern of lower-amplitude
fluctuations withaverage values of 230-250 ppm during GS-1"
@ Eli Rabett – good summary. Thanks.
Christos Vournas
“[CO2] is a trace gas (~400 ppm) in the Earth’s atmosphere. Earth’s atmosphere, as a whole, is a very thin substance to have any significant greenhouse warming effect on the Earth’s surface.”
“Earth’s atmospheric [CO2] content is too small to have any influence on the planetary radiative energy balance.”
At atmospheric pressure per m3 there are ~1E22 CO2 molecules/m3. Work that backwards and the average distance between them is about 5E(-8)m or 5E-2 microns. The IR wavelengths that CO2 absorbs are ~ 15 microns. QM is very strange, often stranger than we can think.
Another way of looking at it is to measure the absorption of CO2 in the 15 micron band. It turns out that the average distance a photon in that region can trave is about 10 m on the peaks of the rotational lines and about 50m in the valleys.
https://rabett.blogspot.com/2020/10/no-overlaps.html
It also turns out that the overlaps with water vapor (including the difference in concentrations) are very small. (same link)
Since 15 microns (or 650 cm-1) is the peak of thermal emission for something at 280K, yes, 400 ppm [CO2] can effectively block a significant amount of the IR thermal emission from the surface reaching space
agnostic2015
The variation due to respiration is the source of annual variation in CO2. It’s been accounted for by direct measurement
https://www.co2.earth/seasonal-co2-cycle (with video)
Eli Rabett,
“Since 15 microns (or 650 cm-1) is the peak of thermal emission for something at 280K, yes, 400 ppm [CO2] can effectively block a significant amount of the IR thermal emission from the surface reaching space”
–
The 288K is the Earth’s meassured average surface temperature. Earth’s surface doesn’t emit at 288K.
–
The planet’s upgoing radiation cannot be compared with the 288K emission curve.
–
“The large bite into the blackbody emission at ground level …” cannot be explained by the absorption by the CO2 and H2O.
The large bites show what earth’s surface has never emitted, when mistakenly comparing with the 288K emission curve.
The trace gasses in the thin Earth’s atmosphere are not capable to absorb so much IR radiation.
They have never absorbed what was not emitted from the Earth’s surface.
–
https://www.cristos-vournas.com
If you poach it, it ends up cooked either way
https://vvattsupwiththat.blogspot.com/2023/09/why-didnt-they-think-of-climate-week.html
Amazing – The cause comes before the effect – somebody should tell the IPCC and the consensus scientists. Here is a quote from my Blog at https://climatesense-norpag.blogspot.com/
6. CO2 -Temperature and Climate.
“The whole COP Net Zero meme is founded on the flawed assumptions and algorithms which produced the IPCC- UNFCCC model forecasts of coming dangerous temperature increases.
The “consensus” IPCC models make the fundamental error of ignoring the long- term decline in solar activity and temperature following the Millennial Solar Activity Turning Point and activity peak which was reached in 1990/91 as shown in Figure 1
The amount of CO2 in the atmosphere is .058% by weight. That is one 1,720th of the whole. It is inconceivable thermodynamically that such a tiny tail could wag so big a dog. (13)
Stallinga 2020 (14) concludes: ” The atmosphere is close to thermodynamic equilibrium and based on that we……… find that the alleged greenhouse effect cannot explain the empirical data—orders of magnitude are missing. ……Henry’s Law—outgassing of oceans—easily can explain all observed phenomena.” CO2 levels follow temperature changes. CO2 is the dependent variable and there is no calculable consistent relationship between the two. The uncertainties and wide range of out-comes of model calculations of climate radiative forcing (RF) arise from the improbable basic assumption that anthropogenic CO2 is the major controller of global temperatures.
Miskolczi 2014 (15) in “The greenhouse effect and the Infrared Radiative Structure of the Earth’s Atmosphere “says “The stability and natural fluctuations of the global average surface temperature of the heterogeneous system are ultimately determined by the phase changes of water.”
AleksanderZhitomirskiy 2022,(16) says:
“The molar heat capacities of the main greenhouse and non-greenhouse gases are of the same order of magnitude. Given the low concentration of greenhouse gases in the atmosphere, their contribution to temperature change is below the measurement error. It seems that the role of various gases in the absorption of heat by the atmosphere is determined not by the ability of the gas to absorb infrared radiation, but by its heat capacity and concentration. ”
Zaichun Zhul et al 2016 (17) in Greening of the Earth and its drivers report “a persistent and widespread increase of growing season integrated Leaf Area Index (greening) over 25% to 50% of the global vegetated area from 1982 – 2009. ………. C02 fertilization effects explain 70% of the observed greening trend.”
Policies which limit CO2 emissions or even worse sequester CO2 in quixotic CCS green-washing schemes would decrease agricultural food production and are antithetical to the goals of feeding the increasing population and bringing people out of poverty.
The tropical rain forests and tropical oceans are the main source of the atmosphere’s water vapor and the rainfall essential to life and agriculture on land. Potable and agricultural water supplies are now stretched to their limits in many areas because of the differing national demographics of global population increase. Temperature limits and Net Zero CO2 targets as set in the Paris Accords to ameliorate future temperatures are completely useless when formulating policies relative to adaptation to the actual real world problems. These require more local inputs for particular regional ecosystems delineated by coastlines, major river basins and mountain range limited intra-continental divides.
“The amount of CO2 in the atmosphere is .058% by weight. That is one 1,720th of the whole. It is inconceivable thermodynamically that such a tiny tail could wag so big a dog. (13)”
To quote Iago “You keep using that word [inconceivable]; I do not think it means what you think it means.”
[1] The major atmospheric components N2, O2, Ar are >99% of gaseous components (H20 is a special case) do not absorb infrared radiation. If molecules that do absorb IR are considered, CO2 is a major component, 2nd only to water vapor, with absorption near the peak of Earth’s blackbody radiation, and lying in the 12 – 18 micron H20 transmission window.
[2] Consider adding to a gallon of water 1 ml of blue food coloring (0.026%): Is it “inconceivable” that this could absorb a significant fraction of red light trying to pass through it? QED
thank you dr. curry for continuing to post relevant climate change articles. appreciate your comments at the end too.
The foundation of modern science is the Royal Society’s motto “nullius in verba” (Take Nobody’s Word for it). https://royalsociety.org/about-us/history/
Koutsoyiannis and team provide a powerful breakthrough in extending scientific causality to effectively “kick the tires”.
Koutoyinnnis et al.’s quantifying how Temperature leads CO2 is vital application of causality theory with the very important application of testing models against evidence.
Finding today’s “Climate Change” models wanting that assert majority anthropogenic global warming may be unpopular is some circles. However it critically impacts how trillions of dollars of our taxes are spent, and the prosperity of our children and grandchildren.
Using cheap geologically stored solar energy is vital to continue to raise up the extreme poor into productive livelihoods. To compliment that we need a long term strategy to transition to sustainable fusion power (rather than prospering the CCP).
Why must Ovid always be be misquoted?
He wrote :
Nullius addictus judicare in verba magistri quo me cumque rapit tempestas, deferor hospes— quo me cumque rapit tempestas, deferor hospes.
Roughly rendered as “Not compelled to swear allegiance to a captain’s words, wherever the storm drags me, I come ashore as a guest.”
The bet brief paraphrase may be Harry Truman’s
“I’m from Missouri”
im suppose to take the word of a Motto.
This notion of Take no ones word for it.
stupid.
look at you taking the Royal societies word for it.
This issue has been beaten to death over the years.
The short term dependence of ΔCO2 on ΔT is due to to the biological response from plants, algae and phytoplankton. But this flux has a negative effect on the long term increase in CO2 which has a human origin.
So, what Koutsoyannis et al. are detecting is unrelated to the question of how much warming the anthropogenic increase of CO2 is causing.
It is not only that a change in CO2 causes a change in temperature and a change in temperature causes a change in CO2. It is also that both change due to different causes, so the relationship between both does not result in a clear correlation but the lack of correlation is uninformative about causality.
This scatterplot is from Figure 2D of Westerhold et al. 2020. It shows an incredible lack of correlation between CO2 changes and temperature changes during most of the past 55 million years. At almost any time either CO2 is changing or temp. is changing, but no diagonal is apparent until the mid-Pliocene is reached. Even more astonishing is that the authors, based on this data defend the opposite.
https://i.imgur.com/TsVyCRh.png
We write: “We examined time scales ranging from months to decades.”
Please read the paper, in particular section 6, “On the Timescale of Validity of Results” before you speak about “short term dependence of ΔCO2 on ΔT”
“Slopes” are seen when we increase the time scale. And we have done that. But we let the data speak for themselves, rather than dictating them what to tell.
“in particular section 6”
I read it and I didn’t change my mind. CO2 shows an annual cycle as T does, and in that cycle CO2 from biosphere photosynthesis and decay responds to T. And on the 3-year scale you are detecting CO2 responding to ENSO, as has been known since the 1970s.
Other than its annual cycle and its responses to ENSO and volcanic eruptions, CO2 presents a rising trend since the 1950s, due to human emissions.
T changes a lot more on every temporal scale because it responds to any change in radiative fluxes and ocean-atmosphere heat fluxes. All those changes are unrelated to the cuestion of CO2-T relationship. T presents a rising trend only since 1976, so it is clear that radiative and heat fluxes dominate the decadal scale. That T changes independently of CO2 does not mean it does not change in response to CO2 changes. But it means the response will be much more difficult to measure. That’s why nobody knows the sensitivity.
The technique you are using will not give you the answer you are looking for. With that technique you can only detect the CO2 response to T explained in the first paragraph, so that will not settle the question of how much warming an increase in CO2 would produce.
It’s obvious that you did not change your mind. I am afraid, whatever I say you won’t…. And I can hardly imagine something stronger than the information provided in our figures 4 and 5, which are for time scales up to two decades. You assert that “CO2 presents a rising trend since the 1950s, due to human emissions”. Well, you are not the only one, of course. But we show with data that this is clearly not the case. It violates a necessary condition.
The annual cycle is irrelevant to our analyses.
We are not “detecting CO2 responding to ENSO”. Actually, we show that CO2 responds to temperature, which responds to ENSO. See Fig. 13 and Appendix A3.
Apparently we have different views. But we support our view with data analyses. Actually, we have formed this view after we analysed the data. I guess your view is supported by climate models. But we also show, with analyses similar with those we used for real world data, that climate models have incorporated a causality direction opposite to the real one.
It is not correct that “T presents a rising trend only since 1976”. Please see our Figure SI3 (in Supplementary Information).
Demetris, the slope of temperature in its derivative is zero with a slight offset from zero.
The slope of the yearly CO2 emissions ánd the increase in the atmosphere increases with a factor 3-4 over the period 1960-2020.
Besides that, the carbon mass balance shows that human emissions are fully responsible for the increase in the atmosphere with a small (13 ppmv) increase due to higher seawater temperatures since the LIA.
Both oceans and vegetation are proven sinks for CO2, not sources.
Your analyses only shows the cause and effect of the +/- 1.5 ppmv variability around the trend, not the cause of the 130 ppmv increase itself…
Ferdinand, the difficult thing is to model the derivative–the change. It is then easier to get “the 130 ppmv increase” right. Please see section 9, “Discussion and Further Results”, where we write “The explained variance for Delta-ln[CO2] was drastically increased from 34% to 55.5% and that for [CO2] is an impressive 99.9%.”. In graphical form, the 130 ppmv are well reproduced in the lower panel of Fig. 15.
Demetris,
There is a lot of the points in chapter 9.3 which could be discussed…
The influence of temperature on the CO2 levels is exactly known: around 16 ppmv/K as seen in the 420.000 years Vostok ice core:
http://www.ferdinand-engelbeen.be/klimaat/klim_img/Vostok_trends.gif
The average 8 ppmv/K is for Antarctic temperatures. For global temperatures, that gives around 16 ppmv/K for very long term changes (including deep ocean and vegetation changes) over thousands of years.
Further, the equilibrium CO2 level between ocean surface and atmosphere is directly controlled by the ocean surface temperature by the formula of Takahashi, which is independent of the seawater composition:
∂ln pCO2/∂T=0.0423/K
See: https://www.sciencedirect.com/science/article/abs/pii/S0967064502000036
That means that for the current average ocean surface temperature, the equilibrium would give around 295 ppmv CO2 in the atmosphere. That is all.
According to the IPCC figures that you used, human emissions are only 4% of all emissions, but human sinks are near zero and both oceans and vegetation are more sink that source, no matter how much faster the natural carbon cycle got. Even if it doubled: that has zero effect on the CO2 levels in the atmosphere, only the difference between ins and outs…
Demetris, there could be a lot of discussion about what you wrote in chapter 9.3…
While there is an increase of the natural carbon cycle both in the oceans as in vegetation, that doesn’t influence the in/decrease of CO2 in the atmosphere, as long as the ins equal the outs. In this case the IPCC figures (and the measurements) show that both oceans and vegetation are net sinks for CO2, thus impossible that these have any contribution to the increase…
The slopes in the derivatives are clear enough:
http://www.ferdinand-engelbeen.be/klimaat/klim_img/dco2_em8c.jpg
Ferdinand, I don’t view the world as static and I am happy that it is ever changing. Hence, I don’t think that there were periods where “ins equal the outs”. [CO2] has also been changing. As we cite in our Appendix A.5 “the atmospheric [CO2] was much higher (up to 27 times) than the current one for most of the time during the phanerozoic”.
Actually, if the world was static, we would not exist. We are a result of change / evolution. And yes, our civilization emits CO2 (nb., this is not identical with saying that it increases the Earth’s temperature). But without that level of civilization we wouldn’t discuss in this blog. We wouldn’t have computers and models.
To emit CO2 or any other gas is not a sin, neither is the fact that “human sinks are near zero”. Undoubtedly, our existence and our civilization have also created problems (to ourselves). And we have effectively been remedying them all the time by employing civilization, technology and economy.
Demetris, I do agree that there was a lot of CO2 variability over the period that the earth exists, but let us focus on recent time frames:
– Over the past 2 million years, the long term (multi-millennia) ratio between CO2 and T was about 16 ppmv/K as seen in ice cores (past 800,000 years) and sediments (2 million years).
– Over the past 1,000 years there was a small CO2 dip in the high resolution (20 years) ice core of Law Dome which shows about 10 ppmv/K for the depth of the LIA around 1600.
– Over the past 60+ years the short time (2-3 years) ratio is about 3-4 ppmv/K.
– Within a year, the ratio is about 5 ppmv/K over the seasons, but in opposite direction: warmer = less CO2.
Over the past 60+ years the CO2/T ratio is near 120 ppmv/K. That can’t be caused by temperature, that is physically impossible.
In the same period, humans emitted some 200 ppmv CO2.
The latter cause fits all known observations and violates none.
See: http://www.ferdinand-engelbeen.be/klimaat/co2_origin.html
One can discuss the effect of that extra CO2 on temperature, but that humans are the cause of the recent increase of CO2 is very solid science.
Ferdinand,
You said, “That can’t be caused by temperature, that is physically impossible.” I would agree that temperature can’t be responsible for all the increase in the atmosphere if one assumes that it all comes from the oceans — but it contributes. What it appears that you are overlooking is that the Tundra is melting, contributing CO2 and CH4, which oxidizes to CO2 and H2O in about a decade. Additionally, NASA has documented ‘greening’ of the Earth, which means that there is more annual bacterial-CO2 from vegetation detritus. Lastly, recent submarine surveys have nearly doubled the known number of seamounts, meaning that there is the potential for a greater volcanic CO2 flux than is generally accepted, based on observations of terrestrial volcanoes alone. I think it is premature to assume that we have all the answers.
Demetris, I too have concerns about the method used. When you plot the spectrum of the CO2 signal as I did here, you’ll find not only a strong spectral peak at 1 year, but also at 6 months (2 Year^-1) which is the delay you’ve observed, assuming I’ve interpreted your graph correctly. Further, the difference method used, when considered in the frequency domain behaves similar to a differentiator which enhances noise with frequency. The CO2 spectrum doesn’t have a lot of energy at the higher frequencies.
https://localartist.org/media/MaunaLoaCO2.png
OK, now for a bit of good news. I took the Mauna Loa CO2 data and computed the Frequency Response Function using HadCRUT5 global temperature anomaly data. Delay can be estimated from the slope of the phase response. A negative slope indicates that the CO2 is delayed relative to the temperature. A positive slope would indicate the opposite. This method avoids some of the potential pitfalls of the method you used.
Here’s the result computed using different observation lengths to allow different amounts averaging at the expense of frequency resolution. I’ve plotted a reference line corresponding to a 6 month delay of CO2 relative to temperature.
https://localartist.org/media/CO2_Temp_FRF.png
What this result appears to show is that the temperature precedes CO2 by about 6 months for the energy below 1 Year^-1.
The way I see it (trying not to be too technical): On the timescales that the authors address, temperature does wiggles in CO2, humans do slope. Plants do much larger wiggles, but they don’t do much slope. The authors see wiggles (waves on the beach in the analogy) but can’t see slope. So they don’t address the effect of CO2 on temperature, which is a slope thingy.
“Slopes” are seen when we increase the time scale. And we have done that. But we let the data speak for themselves, rather than dictating them what to tell.
Sorry, I must have put the above reply here….
Demetris, agreed that CO2 varies on all time scales, but let us focus on the past few million years up to the past 60+ years, where we have better and better data…
– Over the past 800,000 years the ratio between atmospheric CO2 and T is about 8 ppmv/K for Antarctic temperatures or about 16 ppmv/K for global temperatures. Confirmed by 2 million year old sediments over a longer time span.
– Over the past 1000 years, there is a small dip in the CO2 level in the high resolution (~20 years) Law Dome ice core of about 8 ppmv for a temperature dip of about 0.8 K (depending of what reconstruction you prefer) at 1650, the depth of the LIA.
That gives about 10 ppmv/K:
http://www.ferdinand-engelbeen.be/klimaat/klim_img/law_dome_1000yr.jpg
– Over the past 60 years, we see a variability of around 3-4 ppmv/K on short term (2-3 years) changes.
– Within a year, the seasons give about 5 ppmv/K, but… in opposite direction for CO2: higher T, lower CO2!
The CO2/T trend over the past 60+ years is about 106 ppmv / 0.9 K or near 120 ppmv/K, which is physically impossible…
In this case, T is not responsible for the increase of CO2.
In how far the increase of CO2 is responsible for the increase in T is a matter of discussion, but T is certainly not the main driver for the recent increase of CO2.
Further, by using Δln[CO2] i.s.o. Δ[CO2] you are hiding the enormous difference in trend between the temperature increase and the CO2 increase in the derivatives:
http://www.ferdinand-engelbeen.be/klimaat/klim_img/wft_T_dT_dCO2_trends.jpg
Besides the two trends in the derivatives I have added the direct temperature trend, as some others (like the late Dr. Salby) wrongly compare the T trend with the dCO2/t trend, which gives spurious results…
Ferdinand, could you tell where exactly we “are hiding the enormous difference in trend between the temperature increase and the CO2 increase in the derivatives”?
And if we were hiding that enormous difference, how would it be possible that our curves “data” and “model” are indistinguishable in the lower panel of our Fig. 15?
Demetris, the visual difference is striking, but not essential. See your first figure and my figure where the full derivatives are compared:
http://www.ferdinand-engelbeen.be/klimaat/klim_img/temp_co2_der.jpg
What is essential, is that in equations (8) and (9) you assume that the relation between T and CO2 is causal, which is impossible:
Near all variability is caused by temperature variability with a few months lag, but the trend is absolutely not caused by temperature: it is physically impossible to have an increase of 120 ppmv/K from a small temperature increase over 170 years, while the short-term variability shows only 3-4 ppmv/K and very long term (multi-millennia) changes show not more 16 ppmv/K…
While another one-way source provides about twice the observed increase…
Should I repeat my suggestion to see our Fig. 15 and its discussion? I prefer not. You have already concluded that “the trend is *absolutely* not caused by temperature”. But I cannot see you suggesting any error in our model and methodology.
If you feel safe with your *absolutely* safe conclusions, you may keep them.
Dear Demetris,
The discussion about Fig. 15 is here and now:
There is an increase of 100 ppmv CO2 in the atmosphere over the past 60+ years.
There is an increase in temperature of 0.9 K over the same time span (as seen in Hadcrutgl4).
That means that the CO2/T ratio gets about 110 ppmv/K.
There is no known natural source on this earth that delivers such an amount of CO2 as net result in such a short time span… The more that both oceans and vegetation are proven net sinks for CO2. Not sources.
Together with the known relation between T and CO2 from Takahashi (~16 ppmv/K), that disproves your assumption as base for Fig. 15 that temperature is the driving force for the observed CO2 increase…
Javier, the mechanism which links surface ocean temperatures to atmospheric concentration of CO₂ is very well known by physicists. It is the solubility of CO2 in water. Warm Coca-Cola degases its CO₂, oceans too.
https://www.woodfortrees.org/plot/esrl-co2/from:1979/offset:-336.14/scale:0.013/derivative/mean:12/mean:14/normalise/plot/uah6/from:1979/offset:0.25/scale:1.8/derivative/mean:12/mean:14/normalise
Paul. Nice graph. The offset and scaling are redundant since you normalise afterwards. I suggest 12,9,6 month triple running mean rather than 12,14 mo. Otherwise the CO2 lag is clear.
But as Mike Jonas pointed out all this is analysing the wiggles not the longer term secular increase.
So here is the question: given two processes, how can we determine if one is a potential cause of the other?
we proceeded to develop a new method to study the question whether process X is a potential cause of process Y, or the other way round.
In other words, instead of investigating the processes X and Y and find spurious results (as has been the case in several earlier studies), we study the changes thereof in time, ΔX and ΔY.
Yep, everyone is looking at ΔX and ΔY and no one is looking for a possible ΔZ that is likely more important as cause than either ΔX or ΔY.
Ice core records clearly indicate that ice extent is primary cause of temperature change and not result of temperature change, clearly, from much historic evidence CO2 change has been a result of temperature change, now, in addition some other factor is also causing CO2 change, an unknown ΔW.
Most on the different sides only look at ΔX and ΔY and not looking for ΔV or ΔW or Δ?[s].
Question everything and start looking at all the known evidence, without using consensus for any unknowns!
Thanks for the comment. I think we look at “ΔV or ΔW or Δ?”; please see section 9, “Discussion and Further Results” and Appendices.
You look at “ΔV or ΔW or Δ?” to some extent, but you stay constrained by climate consensus, which has multiple factors locked into incorrect assumptions, that limits and prevents, understanding of “ΔV or ΔW or Δ?”
By finding that Temperature LEADS CO2, Koutsoyiannis explicitly INVERT the “climate consensus” NOT ‘stay constrained by it”.
How do you logically argue that they are “locked into incorrect assumptions”?
David L. Hagen, the point is that the conclusions from the authors is only valid for the short term (2-3 years) response of CO2 to short temperature variability of about 3-4 ppmv/K, not for 70 ppmv increase in the full 60+ years period…
The latter can’t be caused by the few tenths that the ocean surface increase in the full period. while human emissions were average twice the measured increase over the full period…
Engelbeen says : “the conclusions from the authors is only valid for the short term (2-3 years) response”. Why “only valid” ? If a 1 year signal is followed some months later by a 1 year response, why wouldn’t the same mechanism produce a 400 year response to a 400 year signal ?
May be you are right (not sure), but you have to give, at least, some valid argument.
paulabrin,
Because the 2-3 year response and the 400 year response are caused by different mechanisms.
For the 2-3 year response, we know that the main response is by vegetation. Here the graph:
http://www.ferdinand-engelbeen.be/klimaat/klim_img/temp_dco2_d13C_mlo.jpg
The increase in the derivatives for CO2 follows changes in T with a few months delay, which is what Demetris ea. did prove (and nobody disputes), but the interesting point is that the 13C/12C ratio goes down when CO2 goes up. That points to vegetation as source (e.g. by drying out of the Amazon during an El Niño).
Short term higher temperatures make that vegetation is even a net emitter of CO2 into the atmosphere, while long time increased temperatures are beneficial for plant growth…
If the increase was from warmer oceans, CO2 and d13C changes would parallel each other.
Still the oceans are a net sink for CO2 during an El Niño, as at that moment the CO2 rich upwelling near Peru stops, but the CO2/water sinks near the poles still go on.
Longer time scales like the MWP-LIA dip (~10 ppmv) up to 800,000 years ice ages/interglacials show that mainly the (deep) oceans are involved as there is only a small change in d13C for a huge (up to 100 ppmv) change.
And that humans are the main cause of the CO2 increase can be seen in the fast drop of the 13C/12C ratio in both atmosphere (ice cores, firn, direct measurements) and ocean surface waters (coralline sponges):
http://www.ferdinand-engelbeen.be/klimaat/klim_img/sponges.jpg
Vegetation and fossil fuels both have a low 13C/12C ratio of app. -26 per mil. The difference between the two can be calculated from the oxygen balance: If there is vegetation growth, then there is oxygen produced when CO2 is absorbed or reverse for plant decay. See:
https://tildesites.bowdoin.edu/~mbattle/papers_posters_and_talks/BenderGBC2005.pdf
Last page, Figure 7 for an overview.
“And why does the temperature rise potentially cause an increase in CO₂ concentration?”
I think that the answer to this is found in an examination of the seasonal variations of atmospheric CO2. What I call the ramp-up phase during the Winter, appears to be the result of bacterial decomposition of plant detritus, respiration from tree roots (particularly boreal trees), and decomposition of photosynthetic plankton. If the temperature gets below freezing, the bacteria shut down. Above the freezing point, increasing temperatures cause an increase in bacterial activity. As the trees leaf out in May, they draw down the CO2 in the Summer, but not enough to counteract the Winter increase.
Please note, seasonality does not play any role. We use difference series for differencing step of one year, so we reduced the effect of seasonal variations. Furthermore, we examine CO2 in the South Pole and the lags are the same, if not greater. Please see section 5, “Investigating the Possible Effect of Seasonality”. (Nb., we also analyzed other CO2 locations with similar results–not reported in the paper).
What seasonality does is provide insight on the range and rate of change of the atmospheric concentration of CO2. Human contributions are virtually constant and a small fraction of seasonal flux, pointing out that biological processes are dominating the system. This in turn, answers your question, “And why does the temperature rise potentially cause an increase in CO₂ concentration?”
https://wattsupwiththat.com/2021/06/11/contribution-of-anthropogenic-co2-emissions-to-changes-in-atmospheric-concentrations/
https://wattsupwiththat.com/2022/03/22/anthropogenic-co2-and-the-expected-results-from-eliminating-it/
Thanks, I see your point.
You wrote:
“And why does the temperature rise potentially cause an increase in CO₂ concentration?”
The oceans are carbonated water, open a warm and cold carbonated drink and take note of the differences. The vapor pressure of the vapor CO2 depends on the temperature of the carbonated water.
More CO2 is proven good, it makes green plants that we depend on for life to grow better.
Looking at history, we are well inside of a “Climate Optimum”, the “Climate Optimum” as far as mankind is concerned. The most recent ten thousand years is Climate Paradise compared to the past fifty million years. The previous Climate Optimum was when the Dinosaurs roamed and we were not around.
Why are oxygen levels dropping in the air and oceans if the rising CO2 is supporting more photosynthesis? Maybe those huge ocean hypoxia dead zones are a clue that just because it’s green doesn’t mean it’s good for the biosphere.
Oxygen level in the air is dropping by 0.1% per century. Let’s worry about it in year 3023.
Clyde, I have reread the discussion there and you were completely wrong.
Even for the current discussion: the seasonal CO2/T ratio is opposite to the short to very long CO2/T ratio, as the main reactant on temperature changes is vegetation that removes CO2 with increasing temperatures, while on all other time scales CO2 increases with increasing temperatures…
Ferdinand,
Your unstated assumption is that the ramp-up seasonal phase is equal to the draw-down phase. They are not equal. The ramp-up phase, driven primarily by bacterial decomposition of vegetation detritus and dead photosynthetic plankton (secondarily by respiration of tree roots), lasts longer than the draw-down phase, so that photosynthetic organisms are NOT a net sink unless they are buried where bacteria/fungus don’t have access. A significant amount of CO2 was removed during the Carboniferous, and more recently frozen in the Tundra. Both are now releasing that temporarily sequestered CO2.
Clyde, indeed there are differences between the two phases as the first is just photosynthesis, while the second is by molds and bacteria and can go on even at freezing under a layer of snow…
The only important point is that the net result at the end of the year is more sink than sources, that is what the oxygen balance shows…
Is it possible to kindly share the code and data used to produce the “quiz” figure?
The software is Excel and the data sources are listed in detail in section “Data Availability Statement”.
El Nino episodes cause drying of tropical forests, which then release plumes of CO2, but the warm eastern equatorial Pacific El Nino waters are CO2 deficient.
El Nino episodes are teleconnected to lagged major warm pulses of the AMO (via negative North Atlantic Oscillation conditions), peaking around August, particularly during the warm AMO phases. That is part of the lag between El Nino driven temperature peaks and rises in CO2 levels. Because the North Atlantic is a major CO2 sink. And as the AMO is normally warmer during each centennial solar minimum, we can think of the reduced CO2 uptake as a negative feedback.
https://digital.csic.es/bitstream/10261/67041/3/Atlantic_Ocean_CO2_uptake.pdf
I’m old enough to remember when Judith said something to the effect of, no one serious doubs the basic physics of the (anthropogenically caused) GHE, the only real question is the magnitude of the warming from anthropogenic emissions.
Times have changed.
This has nothing to do with the current post Joshie. CO2 can be both a forcing and a feedback. The question is quantifying these effects accurately. In recent years there are some reasons to think its more complex than the simplistic IPCC model says. climate scientists used to say that the tropospheric hot spot was the “fingerprint” of global warming. When data failed to show this was happening, they said stratospheric cooling was the fingerprint. Now that stratospheric cooling seems to have flattened out, they have stopped talking about fingerprints. They are just riding the secular religion of climate catastophism despite evidence that the world keeps getting better and people keep prospering. The only negative effect of warming that looks undisputed is sea level rise.
1. Just because something gets put on this blog does not mean Judith agrees with it. I have found that she likes to put things here that help discussion and further the science. This article does that.
2. This paper actually does not cast serious doubts on the basic physics of GHE. Only the magnitude of the warming. That magnitude could well be within the error of the measurements and still exist. If so this method does not determine that it does not exist, merely that it is too small to be detected in the correlation.
3. Have a problem with the method? That would be a good discussion.
The established consensus has been that CO2 ppm before the industrial age was a feedback to global surface temperature changing the equilibrium concentration of CO2 saturated ocean surfaces. Ice core charts show CO2 ppm lagging temp peaks and troughs through the late Pleistocene. Then when humans began bringing sequestered carbon (fossil fuels) out of the ground CO2 ppm became a combination of anthropogenic emissions and the prior feedbacks. Following on this, as the CO2 ppm rises above the equilibrium ocean solubility for a given sea temperature the oceans become a CO2 sink and a negative feedback to CO2 ppm.
Does the current paper refute any of this?
” I think what this paper shows is that CO2 is an internal feedback in the climate system, not a forcing (I think that Granger causality would reveal this?). “
Before the 19th century, it was. That is because nothing was forcing CO2. There was just a finite amount (about 2000 Gtons) of C in circulation, and whether it was in the sea, air or biomass was determined by climate variability.
But then a unique event occurred. We dug up about 600 Gtons C and put it in the atmosphere. Arrhenius in 1896 noticed this was happening, and calculated the warming trhat it would produce. Most other scientists since have agreed. And sure enough, it warmed. That is a causality that hasn’t happened before. And it will continue.
Copying from our paper, section 9:
The mainstream assumption of the causality direction [CO2] -> T makes a compelling narrative, as everything is blamed on a single cause, the human CO2 emissions. Indeed, this has been the popular narrative for decades. However, popularity does not necessarily mean correctness, and here we have provided strong arguments against this assumption.
But what you go on to say, which somewhat agrees with what I have said, is:
“However, popularity does not necessarily mean correctness, and here we have provided strong arguments against this assumption. Since we have identified atmospheric temperature as the cause and atmospheric CO2 concentration as the effect, one may be tempted to ask the question: What is the cause of the modern increase in temperature? Apparently, this question is much more difficult to reply to, as we can no longer attribute everything to any single agent.
We do not claim to have the answer to this ques
tion, whose study is far beyond the article’s scope. Neither do we believe that mainstream climatic theory, which is focused upon human CO2 emissions as the main cause and regards everything else as feedback of the single main cause, can explain what happened on Earth for 4.5 billion years of changing climate.”
Nick By “Modern” I think he means since the depths of the Little Ice Age. The Minoan, Roman and Roman Warm periods and Little Ice Age cold were Not driven by CO2 but rather CO2 lagged T. Modern T leads CO2. The cause(s) of the previous warm/cold periods including the warming since the Little Ice Age are still open to quantitative analysis.
It’s more than just an assumption. It’s a theory based on physics. But more than that it implies a prediction. One of the best ways to explore causality is by making an assumption about what will happen with a change in a variable. And that’s what’s been done. And the prediction seems to follow. That’s not dispositive in and of itself, but that kind of prediction along with even perhaps even more importantly a dose effect between the change in the variable and the predicted outcome, presents a strong case.
“Not driven by CO2 but rather CO2 lagged T. Modern T leads CO2. The cause(s) of the previous warm/cold periods including the warming since the Little Ice Age are still open to quantitative analysis.”
David,
There is very little evidence that CO2 changed at all during those periods (MWP etc). Yes, the cause of those periods in Europe is open to analysis, but has no relevance to CO2.
Hi Nick. You and David created a question that the author’s conclusions need to address: did the Little Ice Age show a drop in CO2 from the Mediaeval Warming Period? If not, and the evidence for a significant drop in GMST between 1000AD and 1650AD, and there is no detectible drop in CO2, does this challenge the author’s theory, or at least put the resolution of the effect at the millennial scale? BTW, I replied to your comment on the Scafetta post.
We use the term “assumption” for “the causality direction [CO2] -> T”. We also use the term “mainstream climatic theory” (as quoted above) for what is based on that assumption. But even if we call the “assumption” a “theory”, it does make it correct. I guess the “caloric theory” was a theory, but it was proved incorrect, once statistical thermophysics entered the scene. And since then, we can hardly speak of physics without statistics/stochastics.
The questions we tried to deal with are those allowed to study by the modern CO2 concentration data (Mauna Loa etc.). We did not want to delve into the controversial issue of data sets before that period.
In this, we do not propose a new climatic theory, but we try to see what the data say.
In any case, I do not believe that a theory of climate, whose very definition relies on stochastics, can be built without stochastics.
demetriskoutsoyiannis –
> I guess the “caloric theory” was a theory, but it was proved incorrect, once statistical thermophysics entered the scene.
I assume (yes, assume is appropriate here) that by “caloric theory” you mean the energy balance model related to nutrition? If so, I’d like to see where is was “proved incorrect,” as I’ve looked a fair amount and from what I’ve seen there’s quite a bit of controversy about that. There seems to be many with domain area knowledge who say that the energy in vs energy out model still applies, although over time the understanding of related factors has certainly complicated what was once considered a rather basic formula. But certainly, you won’t find ANYONE who questions whether there’s a causal relationship in place (between energy in and obesity, or energy in and energy out). In that sense it would be rather ironic if you’re saying that the nutrition energy balance model has been “proved incorrect” as an analogy, since certainly NO ONE would question the basic underlying causality or direction of causality there.
Further, it seems odd to me that your basic framing is related to the science of assessing causality as being “proved incorrect.” Certainly you must know that using “proved” in that context of causality is highly problematic.
Regardless, my more significant point, as opposed to the use of “assumption” versus “theory”, was that a key focus of addressing causality is related to making predictions as to what would happen when a variable related to the mechanism of causality changes over time. And once again, that’s what we’ve see here – which is generally considered pretty important as support for a theory of causal mechanism. And also importantly, the theory of an anthoropogenic GHE brings in a dose-response relationship which looks to pan out, one of the key components of the Bradford Hill criteria for establishing causality.
You didn’t address that.
Joshua: No, I mean the caloric theory.
Copying from wikipedia, https://en.wikipedia.org/wiki/Caloric_theory :
“heat consists of a self-repellent fluid called caloric that flows from hotter bodies to colder bodies. Caloric was also thought of as a weightless gas that could pass in and out of pores in solids and liquids.”
Don’t you think it was proved incorrect?
demetriskoutsoyiannis –
OK, sorry for my confusion.
Although in a general sense I have a problem with “proved” being used in a discussion of causality, I would imagine it would likely be reasonable in that context. As it would, of course, be for any number of theories from the 17th century. I’m not sure how useful that would be as an analogy, however. Sure, someone was the first to offer “disproof” of that theory from hundreds of years ago, and you might be the analogous scientists here offering “disproof” for an anthropogenic GHE, but I’m not able to assess your argument on its technical merits. At my level of assessment, I would say there’s a major difference between a 17th century theory being “disproven” over hundreds of years of further scientific development and someone saying they’ve disproven a theory that has WITHSTOOD decades of scientific interrogation along with ever increasing scientific sophistication. That is the context of your assertions. As such, imo, your use of caloric theory as an analogy actually weakens your argument.
Of course, that’s not dispositive. You could be the “disprovers” of an AGHE, but you’ve got the probabilities working against you – only made more disfavorable for you by analogy with the caloric theory.
At any rate, the aspects I’m most interested in you addressing remain unaddressed.
“Everything” isn’t blamed on CO2, but the longterm warming trend since around 1980 has been. Year to year variations have many causes.
Joshua, on the contrary, my example of caloric theory is absolutely relevant. It shows that it may take centuries before we can safely say that a theory is proved incorrect. (By the way, I don’t think that we used that expression for modern theories). And it may take even more centuries before the incorrectness is assimilated by the scientific community.
For example, the caloric theory, being deterministic, still remains the basis of thinking for many. Most colleagues contrast physics with statistics/stochastics. But there cannot be physics without stochastics–and this is particularly the case in climate.
There are cases where correct theories had been formulated but were not accepted for millennia (e.g. the heliocentric system and the explanation of the Nile’s floods; see details in my paper From mythology to science: the development of scientific hydrological concepts in the Greek antiquity and its relevance to modern hydrology, Hydrology and Earth System Sciences, 25, 2419–2444, 2021, http://dx.doi.org/10.5194/hess-25-2419-2021 ).
So, it is our duty, I think, when we think we find problems in existing theories, to try to highlight them. In this way, we may contribute to scientific progress. Otherwise, we can be sure that the wrong theories will prevail forever.
demetriskoutsoyiannis –
> It shows that it may take centuries before we can safely say that a theory is proved incorrect.
My guess it may have taken not hundreds but thousands of years to disprove you can control the rather by sacrificing virgins. How long did people believe the earth is flat?
I think that’s a rather weak platform to use for supporting an argument that decades of analysis by scientists using modern scientific technology, are equally likely to be wrong as people who were convinced about the benefits of sacrificing virgins or the dangers of sailing off the edge of the earth.
This is a quicksand discussion. Yes, accepted theories have been wrong in the past. That is not a valid support, imo, for the contention that any particular argument that runs against the mainstream is correct today. They are independent phenomena.
I await your response on the issues I’ve emphasized.
I think I have answered your scientific questions and those related to epistemology and philosophy. I am not discussing your other issues, e.g. about virgins and flat earth, which are not scientific. As per the Bradford Hill criteria, we did not refer to those as they are suitable for human epidemiologic studies, while we study geophysical processes. We explain in this post and in the articles the peculiarities of the latter and why they need a different approach based on stochastics.
If you have specific questions on the papers, please let me know, but I do not think I can discuss other irrelevant issues.
demetriskoutsoyiannis –
I’m having trouble following your logic. You introduce one analog of a theory being disproven, and then bring up more such analogies, and then say you’re not interested in questions related to the relevance of other theories being disproven.
As for Hill’s criteria – I wasn’t suggesting that you should have addressed them in your analysis. Of course not! But because they were developed and usually applied in the context of epidemiology doesn’t mean that they aren’t useful for assessing causality in other contexts, imo. And of course the question of predictions made re patterns in outcomes in association with longitudinal changes over time in potentially causal variables has nothing to do with Hill’s criteria. .
Since I can’t analyze the technical issues at hand, I try to engage those presenting technical analyses in good faith engagement on the related aspects of their presentation – for example your discussion of how to meaningfully interrogate causality. That helps me to have a way of parsing technical exchanges when I read them. I can get a sense of patterns I bow people realm. In such a way I hope to get information to evaluate the probabilities of their technical analyses being sound.
Thank you for at least exchanging enough to give me some information in that regard, even if you have declined to do so further.
At last, a kind reply, Joshua, thank you!
As I wrote, I can still reply to specific questions/comments on the papers, including on technical/methodological issues, but I reacted negatively in changing the stage from science to flat earthers and virgins.
demetriskoutsoyiannis –
> but I reacted negatively in changing the stage from science to flat earthers and virgins.
I can kinda understand that, but I think that your negative reaction rests on a basically arbitrary distinction, based on a subjective definition of what is or isn’t “science.”
My point was that virgin-sacrificers were operating on a view of causality, probably for a very long stretches of time. Again, the fact that they had a view on causality for a very long time, that has subsequently been “disproven,” isn’t directly relevant, imo, to whether you think you’ve “disproven” a causal relationship in anthropogenic, atmospheric CO2—> warming.
Regardless, saying that people have sometimes been wrong in the past is, imo, a weak platform upon which to stand up what seems to me to be your argument; that I should look at past long-enduring (scientific) errors as informative in evaluating the probabilities of your assertions being correct.
But if we follow what seems to be your distinction between science and non-science (for the sake of argument), we could just as well go with the long-standing “science” that the Sun orbits the Earth (as you brought up earlier).
What people with less sophisticated scientific methodologies believed for a long time is essentially irrelevant to whether or not a causal belief that ACO2—> atmospheric warming has or hasn’t withstood decades long interrogation with far, far more sophisticated scientific methods.
Indeed, it’s possible that you are another Galileo, but the fact that decades’ long interrogation with very sophisticated methodologies hasn’t “disproven” the anthropogenically caused GHE theory is far, far more relevant, imo, than that for thousands years people who had a very rudimentary understanding of the scientific method believed that the Sun orbited the Earth.
You seem to be suggesting the reverse and that doesn’t seem very logical to me. I think that decades of the AGHE standing up to modern scientific scrutiny is far more relevant than centuries of a belief among people with very little scientific sophistication believing in a geoctentric solar system (indeed, universe).
“There was just a finite amount (about 2000 Gtons) of C in circulation, and whether it was in the sea, air or biomass was determined by climate variability.”
The White Cliffs of Dover, the huge volume of biogenic limestones worldwide, and the limey muds of the Bahamas argue against that claim.
These results agree with the work of Salby, Harde and Berry as well as others that do not think anthropogenic CO2 is the main cause of recent rise in atmospheric CO2.
David, all three are wrong: if one adds 10 PgC/year as CO2 and the result is an increase of 5 PgC/year in the atmosphere, the difference is going into oceans and vegetation. Both are proven net sinks for CO2, not sources.
That means that there is no other possible cause of the increase. None.
The problem of the analyses by the late Salby, Harde and Berry is that they use the residence time (app. 4 years) as the rate of change of CO2 in the atmosphere, but that is the EXchange rate of change, not the speed of removal of any excess CO2 above equilibrium, which is around 50 years e-fold decay rate or 35 years half life time.
No – you are far too certain of this. The processes that fix CO2 are much less temperature dependent than processes that release CO2 (biota decaying). That is an imbalance in the system, and why we see CO2 increasing in warm years with a lag. This holds true over ALL timescales with a couple of notable exceptions.
Thanks to the authors for their forthright analysis of this issue. Proponents of the IPCC consensus view of the carbon cycle miss two important points, of which Koutsoyiannis took full measure and drew the logical conclusions.
From section 9:
“In terms of the carbon cycle (point 1 above), several physical, chemical, biochemical and human processes are involved in it. The human CO2 emissions due to the burning of fossil fuels have largely increased since the beginning of the industrial age.
However, the global temperature increase began succeeding the Little Ice Period, at a time when human CO2 emissions were very low. To cast light on the problem, we examine the issue of CO2 emissions vs. atmospheric temperature further in the Supplementary Information, where we provide evidence that they are not correlated with each other. The outgassing from the sea is also highlighted sometimes in the literature among the climate-related mechanisms.
On the other hand, the role of the biosphere and biochemical reactions is often downplayed, along with the existence of complex interactions and feedback. This role can be summarized in the following points, examined in detail and quantified in Appendix A.1.
Terrestrial and maritime respiration and decay are responsible for the vast majority of CO2 emissions [32], Figure 5.12.
Overall, natural processes of the biosphere contribute 96% to the global carbon cycle, the rest, 4%, being human emissions (which were even lower in the past [33]).”
1. The vast majority of CO2 emissions from nature did not stop when humans began burning hydrocarbons. They continue to increase with warming and decrease with cooling.
2. Atmospheric CO2 is a result of two very different fluxes. The human one is a simple addition, but the massive natural one must be integrated over time in order understand its effect.
According to Antarctic Ice Core Records, CO2 went up from 260 to 280, starting about five thousand years ago without a corresponding rise in temperature, where CO2 had followed temperature before that. Temperatures have not proportionally followed recent CO2 increase.
Temperatures are still currently very low compared to the most recent ten thousand year’s records. This warm period is colder than all previous warm periods in ten thousand years, in fifty million years.
“All evidence resulting from the analyses of the longest available modern time series of atmospheric concentration of [CO₂] at Mauna Loa, Hawaii, along with that of globally averaged T, suggests a unidirectional, potentially causal link with T as the cause and [CO₂] as the effect. This direction of causality holds for the entire period covered by the observations (more than 60 years).”
Simple quantitative mass balance arguments make nonsense of this. There is a very clear cause of the rise in CO₂ in the air. We are mining and burning C. If you look at the actual mass of C in the air over the last millenium, it was steady up until past 1800, despite those supposed huge natural emissions (which are actually just moving the same C around). Then, as we burnt carbon, the mass of C in the atmosphere increased in almost exact proportion. Half stayed in the air, half went into the sea.
The other fact is that, while there has been warming, it is nowhere near enough to account for the CO₂ rise. At the end of the last glaciation, CO₂ stood at about 180 ppmv. Then T rose by about 6°C, and CO₂ rose to 280 ppm, about a 55% rise. Since 1850 CO₂ has risen another 50%, but there has been nothing like a 6°C rise in T.
That actually isn’t correct at all. If you focus on ice core CO2 proxies, then I can understand that point of view, but they are very coarse – approx 800 years resolution. Stomata and foraminifera show much greater variability. Some examples, MWP showed CO2 levels at around 390 ppm. Another example, during the Bolling-Allerod CO2 levels rose to over 420 ppm while temperatures were cooling, but then dropped precipitously.
On all time scales we can measure, temperature almost always precedes CO2 changes, with the above as an interesting exception. The reasons for that are unlikely to have stopped simply because man has contributed to CO2. It’s likely we have contributed to increase in CO2 but it’s clearly not considered that CO2 would have increased anyway inline with warm excursions for which we have a number of precedence throughout the holocene.
Agnostic: again, stomata data are local/regional proxies with a local bias, they reflect local changes which can be enormous over a day and over the years.
Ice core inclusions are global and direct measurements of ancient air, thus NOT “proxies”, measured with the same equipment (GC or mass spectrometer) as for direct air measurements.
The only drawback is that the data are for a mix of 8 to 600 years. The resolution of e.g. the DSS ice core MWP is only 20 years, not 800 years and that shows some 10 ppmv/K dip for the MWP-LIA cooling. Not 110 ppmv/K. Not 390 ppmv during the MWP from unreliable stomata data… And it is the extra CO2 pressure in the atmosphere of 120 ppmv above equilibrium that presses extra CO2 into oceans and vegetation. If we stop our emissions, there is not the slightest chance that any natural flow will suddenly increase, because the CO2 pressure above equilibrium is still the same…
The null hypothesis has never been rejected, e.g.,
There is no scientific justification for some of the extremist economic and social penalties that a minority of zealots are trying to impose on the people of the world. ~Koutsoyiannis
…given that virtually no research into possible natural explanations for global warming has been performed, it is time for scientific objectivity and integrity to be restored to the field of global warming research. (Ibid.)
… they are unable to predict weather beyond a week or two, yet in conjunction with the IPCC they presume to tell us what to expect over the next few decades. (Ibid.)
A challenging 2023 temperature jump followed by a later CO2 increase: “32% of Sea Surface Temperature warming since 1995 occurred in a mere 3 weeks within 2023” & “the surge in Global Sea Surface Temps PRECEDED the associated CO2 rise, by a full month…” @EthicalSkeptic on Twitter. Now to determine the cause. https://twitter.com/EthicalSkeptic/status/1666101958287978496
Judith, you wrote: “I think that Granger causality would reveal this?”
Yes, you are right. We had applied the Granger method in an earlier publication (http://dx.doi.org/10.3390/sci2040083), before we developed our new stochastic method.
As we detail in that paper, if we don’t difference the time series, the direction seems to be [CO2] -> T. But as we demonstrate in the paper, this result, which was also found in earlier publications by other authors, is spurious. It is an artifact produced by the very high autocorrelation of the raw time series. In particular, that of [CO2] is almost 1 for all lags (see Fig. 9 in thar paper).
When we removed the cause producing the spurious results, we found (quoting from that paper):
“For both lags η = 1 and 2 and for the entire period (or almost), T -> [CO2] dominates, attaining p-values as low as in the order of 10^−33.”
Thank you for the link to Koutsoyiannis (2020), especially figure 11.
https://rclutz.files.wordpress.com/2023/09/koutsoyiannis-2020-fig.-11.png
That result enables anyone to calculate the changes in past atmospheric CO2 from past temperature changes. I did this bringing the analysis up to end of 2022. Correlation was 0.9985.
T, not ∆T, is the cause of ∆CO2.
∆CO2 = f(T)
Approximately
∆CO2 = C*T
Please see section 9 “Discussion and Further Results”, and in particular Fig. 15.
https://woodfortrees.org/plot/hadcrut4gl/from:1955/normalise/plot/esrl-co2/mean:12/derivative/normalise
When specifying sampling on the interactive chart one can see the CO2 tracks HadCRUT very well. I also notice that during the volcanic eruptions of El Chichon (1982) and Pinatubo (1991) that CO2 scales higher than Temp and then by 1998 Temp is scaling higher with the super El Nino and likely suppression of CO2 in cooler years just prior. https://woodfortrees.org/plot/hadcrut4gl/from:1955/normalise/mean:9/plot/esrl-co2/mean:12/derivative/normalise/mean:9
I also see that CO2 track temperature in the Holocene prior to the industrial age. https://co2coalition.org/2021/10/29/15282/
Interestingly, that is not what my plot on that site show. There is a consistent and definite lead of temps over CO2 since 1961. https://www.woodfortrees.org/plot/esrl-co2/mean:12/scale:0.2/isolate:60/plot/hadcrut4gl/isolate:60/mean:12/from:1961
Charles Michael Scott:
“There is a consistent and definite lead of temps over CO2 since 1961.”
Very interesting. Have you published that graph in any scientific publication?
To Charles Michael Scott, the effect is even clearer if you take the derivative of both series, it removes the possibility of a spurious correlation :
https://www.woodfortrees.org/plot/esrl-co2/derivative/scale:0.2/mean:12/mean:14/offset:-0.01/detrend:0.03/plot/hadcrut4gl/derivative/from:1961/mean:12/mean:14
The challenge of looking at the data in the time domain, is that there are different processes at work.
The annual co2 cycle, which is easy to see in these woodfortrees plots, is delayed less than two months ( 0.14 year), while most everything else has a six month delay.
https://judithcurry.com/2023/09/26/causality-and-climate/#comment-994090
edimbukvarevic, please compare variables of the same order, the late Dr. Salby made the same error by assuming that CO2 increase is caused by the integral of temperature. That is a non-existing variable and implies that 1 K temperature increase will cause a CO2 increase until eternity…
paulaubrin by detrending in this case, you don’t remove a spurious trend, you just removed the real cause of the trend…
Isn’t the simplest explanation for the plot correlations that global temperature fluctuations proportionally modulate the uptake of CO2? This would be consistent with a net global sink as well as short term temperature control of CO2.
Ron Graf wrote:
Isn’t the simplest explanation for the plot correlations that global temperature fluctuations proportionally modulate the uptake of CO2? This would be consistent with a net global sink as well as short term temperature control of CO2
Ron, do you wait to turn your car on until the temperature increases?
Bob Cutler wrote:
The annual co2 cycle, which is easy to see in these woodfortrees plots, is delayed less than two months ( 0.14 years)
Utterly false.
Atmospheric CO2 reacts immediately to changes in seasonal vegetation.
If not, where do you think the CO2 goes to hide for two months? The Moon maybe?
David: “Do you wait to turn your car on until the temperature increases?”
I think you are saying that it’s obvious engine heat is created by the combustion, not the combustion by the engine heat. But that would not be the case if we never saw the engine turn on or off and did not know about spark plugs or glow plugs. (My first actually car kept running for a bit after turning it off.)
“Atmospheric CO2 reacts immediately to changes in seasonal vegetation.”
Bacterial colonies might take weeks to fully take advantage of an improvement in their temperature as well as die more slowly than their decrease in reproduction rate do to chilling. Or maybe the delay is in atmospheric mixing to the point of the top of Moana Loa. We didn’t make the data up.
Ron Graf wrote:
David: “Do you wait to turn your car on until the temperature increases?”
I think you are saying that it’s obvious engine heat is created by the combustion, not the combustion by the engine heat.
No, I’m not saying that at all.
Your car emits CO2.
Do you wait for the temperature to go up for that to happen?
Or do you emit CO2 regardless of the temperature?
In the industrial era, CO2 leads temperature.
Ron Graf wrote:
Bacterial colonies might take weeks to fully take advantage of an improvement in their temperature as well as die more slowly than their decrease in reproduction rate do to chilling. Or maybe the delay is in atmospheric mixing to the point of the top of Moana Loa. We didn’t make the data up.
Do you think bacteria decide to take a time out and sit around before chemically reacting to changes in temperature and carbon dioxide???
Do you?
Thank you to the authors for these works and thanks to Judith for publishing it.
It is worthwhile to point out the logically similar chicken-and-egg problem of total CO2 concentration vs human CO2 emissions.
When the trend of Mauna Loa-measured CO2 concentration and the trend of estimated fossil fuel emissions are detrended similarly to these excellent works on CO2 vs temperature by Antonis Christofides, Demetris Koutsoyiannis, Christian Onof and Zbigniew W. Kundzewicz, then it is shown by the same causality logic that CO2 from fossil fuels is not the cause of the increasing global CO2 concentration (i.e. the Keeling Curve.) The slope of fossil fuel CO2 emissions is not driving the slope of global CO2 concentration, thus CO2 emissions from fossil fuels burned by humans cannot be the cause of global temperature trends nor any other trends which are alleged to be co-dependent with global CO2 concentration, including warming or cooling, greening, desertification, climate change, sustainability, climate justice, polar ice melting, etc.
Responsiveness of Atmospheric CO2 to Fossil Fuel Emissions: Updated. by statistician Jamal Munshi, PhD., Emeritus Professor, Business Administration. (One of several papers on this subject by this data scientist. Links below.)
“ABSTRACT: The IPCC carbon budget concludes that changes in atmospheric CO2 are driven by fossil fuel emissions on a year by year basis. A testable implication of the validity of this carbon budget is that changes in atmospheric CO2 should be correlated with fossil fuel emissions at an annual time scale net of long term trends. A test of this relationship with insitu CO2 data from Mauna Loa 1958-2016 and flask CO2 data from twenty three stations around the world 1967-2015 is presented. The test fails to show that annual changes in atmospheric CO2 levels can be attributed to annual emissions. The finding is consistent with prior studies that found no evidence to relate the rate of warming to emissions and they imply that the IPCC carbon budget is flawed possibly because of insufficient attention to uncertainty, excessive reliance on net flows, and the use of circular reasoning that subsumes a role for fossil fuel emissions in the observed increase in atmospheric CO2.”
Full paper available:
https://papers.ssrn.com/sol3/papers.cfm?abstract_id=2997420
These results are consistent with prior works that found no evidence to relate the rate of warming to the rate of emissions. Many examples of spuriousness and circular logic. Many references.
A list of papers by Dr. Munshi can be found here: https://papers.ssrn.com/sol3/cf_dev/AbsByAuth.cfm?per_id=2220942
Thank you for your kind words about our works and for the links to the paper(s) of Dr. Munshi, which I was not aware of.
Budbromely – If I understand your logic –
In summary are you stating (somewhat similar to ) that the rate of co2 increase post 1950 greatly exceeds the rate of warming. While the rate of warming from circa 1880 to the 1940’s greatly exceeded the rate of the increase in co2?
apologies if oversimplyfing (or putting my own spin on it).
One question that has always baffled me is how the planet shifted from a cooling trend to a warming trend circa the late 1800’s when co2 increased from 280ppm to 281ppm. That shift from a cooling trend to a warming trend being comparable or greater that the current rate of warming
Bud,
Munshi did make an essential error: she looks at the DEtrended variability of CO2 and compared that to human emissions which have a huge trend and hardly any variability.
Of course her conclusion is that there is no correlation, because she removed the cause of the trends…
Further, she attributes items to the IPCC which they never said or intended: the IPCC never said that human emissions should correlate with the yearly increase in the atmosphere. “driven by” is not equal to “should correlate”…
As human emissions were always higher than the increase in the atmosphere, there is no way that another (natural) source is the cause of the increase.
Pingback: Causality and climate - Climate- Science.press
The paper: “On hens, eggs, temperatures and CO2: Causal links in Earth’s atmosphere” provides the greatest insight on the topic of causes of climate change in terms of objectivity and unparalleled analysis, I have come across.
The data analysis with respect to CO2 and it being an effect, not the cause, of climate change are unequivocally correct.
There is no question that ENSO SST changes drive changes in the average global concentration of water vapor, TPW, which drives and fully accounts for the YoY changes in mean global temperature some 5 months later and the decadal average increases in the devastation wrought by catastrophic weather, the percentage change in which changes as the of multiple of 130 x the decadal percentage change in TPW.
The 11% increase in TPW since 1972 drove a 24% increase in latent heat which drove a 400% increase in the incidence of catastrophic weather events and a 1,400% increase in resulting devastation which over this period is responsible for:
1. The loss of two million lives
2. 4 billion displaced or injured,
3. In terms of both intensity and incidence – more extreme heat waves, flooding, long term drought and driven famine and massive wildfires,
4. Extensive ocean heat waves, and,
5. Average annual, near term global economic losses of 170 billion USD, now a cumulative loss of more than 4 trillion USD.
The good news is that all of these effects of climate change are driven by changes in the concentration of water vapor. The data shows, this is reversed as the concentration of water vapor declines which occurs when average global precipitation exceeds the average global evaporation. Therein lies the solution to climate change.
Very glad to read this positive assessment of our paper; thanks!
It’s pretty obvious that what is being proposed here is simply wrong. It’s very clear that the increase in atmospheric CO2 that has occurred over the last ~100 years is due to human emissions and that this is the dominant drive of global warming. One probably doesn’t really need to go much further. However, if you do want to better understand the problem with the analysis presented here, you could read this PubPeer comment.
https://pubpeer.com/publications/7828A34E1F905217D557E4F8E93CC1#2
This is not an argument which directly addresses the findings of these studies. Are you saying that the findings of these two papers, i.e. that the rise in temperature precedes the increase in CO2, is wrong? In which case what is your criticism of the methodology. Please demonstrate how you think it is flawed.
What an honour to meet someone who knows that “…and Then There’s Physics”… Someone who knows in advance, in July 2022, that a paper that will be published in September 2023, will be wrong…. Who sees that this is “pretty obvious” and hence there is no need to suggest any errors in the methodology.
The only problem I see here is related to the follow-up post, also of July 2022, https://andthentheresphysics.wordpress.com/2022/07/27/revisiting-causality-using-stochastics
I read: “I thought I might simply highlight that I started a PubPeer thread about this paper and Gavin Cawley has already posted a couple of useful comments. A PubPeer thread about the Zharkova et al. paper produced quite an extensive comment thread and probably played a role in it being retracted.”
But it seems that the vision of Royal Society, which had published our two papers a couple of months earlier than July 2022, and to which this post was apparently addressed, was not clear enough to see that “It’s pretty obvious that what is being proposed here is simply wrong”. And thus, they did not retract our papers….
Let’s see if the editors of /Sci/, which published our new paper, have a better vision, so as to retract our new paper…
As I thought was obvious, I was referring to the papers published in Proceedings of the Royal Society A, which presents the method and makes the same argument about atmospheric CO2 concentrations. Given that you refer to the two PRSA papers in the post above, I assume the method is the same in the new paper, hence the same criticism applies. However, to be blunt, anyone who thinks that the increase in atmospheric CO2 is not pre-dominantly due to anthropogenic CO2 is probably not someone who will get these basic arguments. Feel free to prove me wrong, but I’m certainly not planning to hold my breath (although, not doing so is not going to increase atmospheric CO2 concentrations).
“As I thought was obvious, I was referring to the papers published in Proceedings of the Royal Society A”
But then you forgot to write “it’s rather embarassing that one of the Royal Society’s journals could publish a paper with what is, these days, a very obviously wrong result” (copying from your blog…).
It’s always interesting to see when “skeptics” argue that peer review is valuable, and when they argue it’s worthless.
I suspect there might be a pattern of causality but for the life of me I just can’t figure out what it might be.
Peer review is hit and miss. In science, replication by one or more other groups or people is the gold standard. Even that doesn’t guarantee truth.
All of the CO2 data begs the question as to how, when and where is the concentration measured. Early morning would typicall show higher CO2 levels and lower O2 levels in the sampling media whether it is atmospheric, marine or aquatic in temperate latitudes. The seasonal influence is also important to deduce causality. Individuals that understand these influences may be introducing error into their equations due to poor experimental set up. Two questions I ask is what gas is not a “greenhouse gas” and why has few researchers sided the CO2 concentrations with O2 concentration along with temperature and the locations, time of day and seasonal information? All Green plants do release CO2 when they respire at night. I have seen estmates for one mature oak tree releasing as much as 40 kg/year of CO2.
Most base CO2 measurements are done as far as possible from vegetation and other possible sources/sinks.
That is e.g. at Mauna Loa on barren (volcanic) ground where most of the time the trade winds blow for thousands km over the oceans. Or other islands or at the South Pole, an ice desert or coastal when the winds blow from the seaside…
See the different base stations at:
https://gml.noaa.gov/dv/iadv/
“… where most of the time the trade winds blow for thousands km over the oceans.”
And then are orographically uplifted, sweeping across the heavily vegetated lower slopes of the mountain, before encountering the “barren volcanic ground.”
Keeling studied such daily variation and it was those observations that lead to selection of Mauna Loa for the CO2 Observatory where they would be minimized as described in the link below
https://library.ucsd.edu/scilib/hist/Keeling_Influence_of_Mauna_Loa.pdf
I think that the authors don’t take into account that there are two important sources in case: temperature and CO2 releases from humans.
The influence of temperature on the CO2 levels is exactly known: around 16 ppmv/K as seen in the 420.000 years Vostok ice core:
http://www.ferdinand-engelbeen.be/klimaat/klim_img/Vostok_trends.gif
The average 8 ppmv/K is for Antarctic temperatures. For global temperatures, that gives around 16 ppmv/K for very long term changes (including deep ocean and vegetation changes) over thousands of years.
Further, the equilibrium CO2 level between ocean surface and atmosphere is directly controlled by the ocean surface temperature by the formula of Takahashi, which is independent of the seawater composition:
∂ln pCO2/∂T=0.0423/K
See: https://www.sciencedirect.com/science/article/abs/pii/S0967064502000036
That means that the effect of the ocean surface warming of app. 0.8 K since the LIA is good for about 13 ppmv CO2 increase in the atmosphere. That is all.
The observed increase of CO2 since the industrial revolution is about 130 ppmv. The calculated increase caused by human emissions, if all emissions remained in the atmosphere, is about 200 ppmv. That means that human emissions are the main cause of the increase, or one violates the carbon mass balance.
The difference is what oceans and vegetation did absorb. Since 1958 with the more accurate measurements at Mauna Loa and South Pole (and several other stations) in every year, nature was more sink than source, with some borderline El Niño events:
http://www.ferdinand-engelbeen.be/klimaat/klim_img/dco2_em8c.jpg
The graph shows the increase of CO2 emissions from fossil fuel burning and cement manufacturing (light blue),
The small drop due to the Covid pandemic (purple) and the increase measured in the atmosphere (red).
The CO2 sinks in vegetation and oceans (green) is the difference between human emissions and the increase in the atmosphere.
The temperature variability is enhanced with a factor 3.5 to show the same amplitude as for the CO2 variability.
Everything is expressed in ppmv/year (1 ppmv = 2.13 PgC = 2.13 GtC)
Then what is the problem with the author’s work?
The point is that the authors did look at the variability around the increase, not at the cause of the increase itself.
Temperature indeed gives a fast response for the CO2 rate of change, lagging the temperature rate of change with about 6 months.
But in the derivatives, there is no slope at all in temperature (only a slight offset from zero), while yearly human emissions ánd the increase in the atmosphere increases with a factor 4 between 1960 and 2020…
While the authors are right for the short time (months to years) and very long time (centuries to multi-millennia) cause and effect of T on CO2, they are wrong about the current CO2 increase, which largely is caused by human emissions.
See for further information:
http://www.ferdinand-engelbeen.be/klimaat/co2_origin.html
According to the best evidence we have, humans have emitted ~700 GtC into the atmosphere since the beginning of the industrial revolution, including fossil fuel emissions, cement and industrial processes and land use change. The authors of this paper apparently have no idea where this carbon went. But concurrent with our emissions, CO2 concentrations have risen. This paper has no idea where this CO2 comes from, since both land and oceans have been net carbon sinks during this time frame. So if this paper is correct, temperature magically creates CO2. Is this even remotely believable?
Let’s do some simple math. Of the 700 GtC originating from human activity, about 44% stays in the atmosphere, and the rest gets absorbed by the oceans and land. So of our emissions, there is about 308 GtC in the atmosphere. That’s the equivalent of 1130 GtCO2. That can be converted to ppm by dividing by 7.81, so 1130/7.81 = 145 ppm. Funny how that corresponds pretty well to the amount of increase in CO2 above preindustrial levels.
So this paper wants us to believe that all this carbon we put into the atmosphere just disappears and then temperature causes CO2 to magically appear in the atmosphere at exactly the same quantities to match our emissions. Seriously?
For sure, CO2 is less soluble in warmer water, so warming SSTs will cause a ocean-to-atmosphere CO2 flux. During the glacial cycles of the Quaternary, this may account for as much as 100 ppm for a 5 C increase in CO2. or 20 ppm/C. At 1.2 C warming, though we’ve seen a 140 ppm increase in CO2, while the oceans have been a net sink, absorbing about 25% of our emissions.
This paper makes no sense.
SJS,
You said, “3. You can’t explain why the increase in atmospheric CO2 corresponds EXACTLY with the amount of our emissions.”
It doesn’t. You yourself said, ” Of the 700 GtC originating from human activity, about 44% stays in the atmosphere, …” To be more precise, the increase in the atmosphere is numerically equivalent to 44% of anthropogenic emissions. You do not provide any evidence that it is actually anthropogenic.
Great paper … great discussion. Thanks.
I thank you, billfabrizio! What an interesting contrast with the previous comment, which concludes “This paper makes no sense”…
So do you have a response to the criticism above that preceded the conclusion “this paper makes no sense”? I haven’t seen one yet.
Dear scottjsimmons, if someone had already concluded that your work “makes no sense”, would you find any reason respond?
… *to* respond.
Yes, if I believed my paper did make sense and the other person’s conclusion was erroneous, I might explain why my paper does makes sense. The fact remains that:
1. Humans are responsible for ~700 GtC emissions, and you don’t know where it went.
2. CO2 has increased by 140 ppm, and you don’t know where it came from.
3. You can’t explain why the increase in atmospheric CO2 corresponds exactly with the amount of our emissions.
I think that the authors don’t take into account that there are two important sources in case: temperature and CO2 releases from humans.
The influence of temperature on the CO2 levels is exactly known: around 16 ppmv/K as seen in the 420.000 years Vostok ice core:
http://www.ferdinand-engelbeen.be/klimaat/klim_img/Vostok_trends.gif
The average 8 ppmv/K is for Antarctic temperatures. For global temperatures, that gives around 16 ppmv/K for very long term changes (including deep ocean and vegetation changes) over thousands of years.
Further, the equilibrium CO2 level between ocean surface and atmosphere is directly controlled by the ocean surface temperature by the formula of Takahashi, which is independent of the seawater composition:
∂ln pCO2/∂T=0.0423/K
See: https://www.sciencedirect.com/science/article/abs/pii/S0967064502000036
That means that the effect of the ocean surface warming of app. 0.8 K since the LIA is good for about 13 ppmv CO2 increase in the atmosphere. That is all.
The observed increase of CO2 since the industrial revolution is about 130 ppmv. The calculated increase caused by human emissions, if all emissions remained in the atmosphere, is about 200 ppmv. That means that human emissions are the main cause of the increase, or one violates the carbon mass balance.
The difference is what oceans and vegetation did absorb. Since 1958 with the more accurate measurements at Mauna Loa and South Pole (and several other stations) in every year, nature was more sink than source, with some borderline El Niño events:
http://www.ferdinand-engelbeen.be/klimaat/klim_img/dco2_em8c.jpg
The graph shows the increase of CO2 emissions from fossil fuel burning and cement manufacturing (light blue),
The small drop due to the Covid pandemic (purple) and the increase measured in the atmosphere (red).
The CO2 sinks in vegetation and oceans (green) is the difference between human emissions and the increase in the atmosphere.
The temperature variability is enhanced with a factor 3.5 to show the same amplitude as for the CO2 variability.
Everything is expressed in ppmv/year (1 ppmv = 2.13 PgC = 2.13 GtC)
Then what is the problem with the author’s work?
The point is that the authors did look at the variability around the increase, not at the cause of the increase itself.
Temperature indeed gives a fast response for the CO2 rate of change, lagging the temperature rate of change with about 6 months.
But in the derivatives, there is no slope at all in temperature (only a slight offset from zero), while yearly human emissions ánd the increase in the atmosphere increased with a factor 3-4 between 1960 and 2020…
While the authors are right for the short time (months to years) and very long time (centuries to multi-millennia) cause and effect of T on CO2, they are wrong about the current CO2 increase, which is largely caused by human emissions.
See for further information:
http://www.ferdinand-engelbeen.be/klimaat/co2_origin.html
Part 1 of a long comment:
I think that the authors don’t take into account that there are two important sources in case: temperature and CO2 releases from humans.
The influence of temperature on the CO2 levels is exactly known: around 16 ppmv/K as seen in the 420.000 years Vostok ice core:
http://www.ferdinand-engelbeen.be/klimaat/klim_img/Vostok_trends.gif
The average 8 ppmv/K is for Antarctic temperatures. For global temperatures, that gives around 16 ppmv/K for very long term changes (including deep ocean and vegetation changes) over thousands of years.
Further, the equilibrium CO2 level between ocean surface and atmosphere is directly controlled by the ocean surface temperature by the formula of Takahashi, which is independent of the seawater composition:
∂ln pCO2/∂T=0.0423/K
See: https://www.sciencedirect.com/science/article/abs/pii/S0967064502000036
That means that the effect of the ocean surface warming of app. 0.8 K since the LIA is good for about 13 ppmv CO2 increase in the atmosphere. That is all.
The observed increase of CO2 since the industrial revolution is about 130 ppmv. The calculated increase caused by human emissions, if all emissions remained in the atmosphere, is about 200 ppmv. That means that human emissions are the main cause of the increase, or one violates the carbon mass balance.
Further with part 2…
Part one of a long reaction…
I think that the authors don’t take into account that there are two important sources in case: temperature and CO2 releases from humans.
The influence of temperature on the CO2 levels is exactly known: around 16 ppmv/K as seen in the 420.000 years Vostok ice core:
http://www.ferdinand-engelbeen.be/klimaat/klim_img/Vostok_trends.gif
The average 8 ppmv/K is for Antarctic temperatures. For global temperatures, that gives around 16 ppmv/K for very long term changes (including deep ocean and vegetation changes) over thousands of years.
Further, the equilibrium CO2 level between ocean surface and atmosphere is directly controlled by the ocean surface temperature by the formula of Takahashi, which is independent of the seawater composition:
∂ln pCO2/∂T=0.0423/K
See: https://www.sciencedirect.com/science/article/abs/pii/S0967064502000036
That means that the effect of the ocean surface warming of app. 0.8 K since the LIA is good for about 13 ppmv CO2 increase in the atmosphere. That is all.
The observed increase of CO2 since the industrial revolution is about 130 ppmv. The calculated increase caused by human emissions, if all emissions remained in the atmosphere, is about 200 ppmv. That means that human emissions are the main cause of the increase, or one violates the carbon mass balance.
You are analyzing the association between year to year variability in CO2 and temperature about the trend line. Your finding applies to that context: A truncated distribution of temperature losing the longterm trend varies from year to year as driven by temperature. This signal is consistent with temperature variation altering the year to year and seasonal fluctuations of CO2 more than year to year emissions control the year to year variation of temperature. The approach masks the longterm trendline, which would have a different direction of causation.
Exactly. To my knowledge no one would be surprised to learn fluxes on seasonal or annual time scales may respond to temperature. That’s not evidence that the long-term increase in CO2 is due temperature and not to CO2 emissions.
Looks like the ice cores confirm CO2 lags temperature.
https://rclutz.files.wordpress.com/2023/03/co2-and-temps-antarctic-ice-cores-gl-smith.png
Mr Clutz,
Show where ice cores show 140 ppm increase in CO2 with a 1.2 C increase in temperature. Since CO2 is less soluble in warmer water, there is an ocean-to-atmosphere CO2 flux with warming. But since we started putting carbon in the atmosphere through our fossil fuel emissions, that’s all changed. Henry’s Law is pretty clear on this. The oceans and land are both net sinks, taking up about half of our emissions.
Your assumption Scott. Humans are adding 4% on top of 96% natural emissions. And you are ignoring the longer term storage of CO2 (human and natural) in
Scott, humans are adding 4% on top of 96% natural emissions of CO2. BTW the errors in estimating maritime and terrestrial emissions is greater than our 4%. So it’s an assumption to think they are sinks and no longer stimulated by the warming starting from the LIA. You also should not ignore the longer term storage of CO2 (human and natural) into calcium carbonate.
Contrarians love to be confused about flux. Human emissions annually contribute about 4% of total emissions. They contribute about 0% of total sinks. Since the natural carbon cycle is nearly balanced, all the increase in CO2 is from human activity.
That is one way CO2 can indeed work. How can you generalize from that? Our CO2 emissions certainly weren’t caused by temperature, and didn’t lag it. Why is CO2 today rising at the same time as temperature and not at a lag from it?
SJS,
You said, “They contribute about 0% of total sinks.”
It has been shown that concrete takes CO2 out of the atmosphere. Your exaggeration does not lend credence to the rest of your claims.
SJS,
You said, “Since the natural carbon cycle is nearly balanced, …”
An assertion for which the facts are not in evidence.
Cyde Spencer,
Looks like I had missed these points from you:
“It has been shown that concrete takes CO2 out of the atmosphere. Your exaggeration does not lend credence to the rest of your claims.”
Still about 0% of total sinks.
“You said, ‘Since the natural carbon cycle is nearly balanced, …’
An assertion for which the facts are not in evidence.”
The evidence is in the IPCC report and is summarized right in the paper. Natural sources and sinks are nearly balanced with sources slightly smaller than sinks. The graph showing this is Figure A1 right in this blogpost. Human emissions flip that carbon cycle to a net source.
“The approach masks the longterm trendline, which would have a different direction of causation.”
Sorry, Paul, as we discuss in the paper, the available instrumental data cannot give us answers about what happens on time scales longer than a couple of decades. We stick on what these data can say, without masking anything. And they say that, up to the time scales of a couple of decades, there is a unidirectional, potentially causal link with T as the cause and [CO₂] as the effect, while the opposite direction can be excluded as violating a necessary condition of causality.
But your argument demonstrates that you agree with mine: Just because the dataset doesn’t allow you to extend to longer timescales doesn’t mean you can just assert that it works. You ARE masking the longterm trend & then just excusing it because that’s all the data allow. You can’t make assertions about a ~50 year trendline. Everything else is truncating the distribution so that the relevant data is lost.
It’s not an assumption that you just failed to supply evidence that 1.2 C warming can produce a 140 ppm increase in CO2. It’s also not an assumption that you don’t understand the carbon cycle. Annually, nature adds about as much carbon as it contributes to the atmosphere. The increase is 100% caused by human activity. There is no rational objection to this.
The authors claim : “In fact, human emissions are only 4% of the total, natural emissions dominate,”
It is human emissions that increased atmospheric CO2 by 50% since 1850.
There are lab spectroscopy measurements of the effects of increasing CO2. The authors make no attempt to refute those studies by claiming CO2 acts completely differently in the atmosphere.
Ms Curry wrote:
“Again, as emphasized in the paper, human emissions are small fraction of natural emissions”
That statement is false. The seasonal carbon cycle flows should not be called CO2 emissions. They do not increase the year over year CO2 levels. The human CO2 emissions should be called emissions because they DO increase year over year atmospheric CO2 levels. And they have been increasing atmospheric CO2 since 1850.
In summary, the authors have no idea what they are talking about, and it is very sad that Ms. Curry finds this article to be worthwhile.
She has apparently lost touch with real climate science to join the fantasy world of science denial, where CO2 is imagined to NOT be a greenhouse gas increased by human CO2 emissions that impedes Earth’s ability to cool itself at night.
“The authors make no attempt to refute those studies by claiming CO2 acts completely differently in the atmosphere.”
That is not an unreasonable assumption. The behavior of a single variable in a controlled experiment can be quite different from the unconstrained behavior in a complex dynamic system with feedback loops.
When empirical evidence contradicts a hypothesis, I go with the data.
Pingback: On Hens, Eggs, Temperatures And CO2: Causal Links In Earth's Atmosphere
Climate contrarians run around in circles. A paper by Humlum and others did a similar analysis and made similar wrong conclusions a decade ago The notion that the bulk CO2 rise is caused by temperature is soundly rebutted by the simple fact cited by Engelbeen and others here: emissions are 2x the atmospheric rise, insuring that land/sea reservoirs have been net sinks throughout the industrial era. I cannot help but notice that the authors have made no response to this.
Dr. Curry recommended this paper to us even though she states clearly in her book that humans are responsible for the CO2 rise. Dr. Curry, I believe you owe us an explanation for your endorsement of a rehashed argument that you had apparently once rejected. Can YOU explain to use how sinks cause the rise? I think not.
> Dr. Curry recommended this paper to us even though she states clearly in her book that humans are responsible for the CO2 rise.
Judith has stated for years that she doesn’t listen to anyone who dismisses the basic GHE. She has mocked people who describe “skeptics” as rejecting the basic GHE, and stated that “skeptics” don’t question that theory, they only question the magnitude of the warming effect. This is even as she has in the past, stated that some theories that dispute the basic physics of the GHE are “interesting.” She took the same position on Salby’s work.
>Dr. Curry, I believe you owe us an explanation for your endorsement of a rehashed argument that you had apparently once rejected.
Take note – although promising to do so, Judith NEVER provided a scientific analysis of Salby’s theories. I suspect you won’t be getting any such explanation here.
I love how Dr. Curry’s blog brings out the control freaks.
The greenhouse effect is different from the carbon budget. This paper is about the carbon budget, and Salby’s papers were about the carbon budget (not the greenhouse effect).
My book states that there are quantitative uncertainties in the carbon budget.
This blog is about discussing interesting (and sometimes controversial) topics.
Disagreement and debate is the spice of the climate blogosphere. We all stand to learn something.
Dr. Curry,
With all due respect, the carbon budget doesn’t allow the conclusions of this paper. Human emissions of CO2 are about double the increase in CO2 concentrations, and both land and oceans are net carbon sinks. That means that if the measured increase in atmospheric CO2 doesn’t come from human emissions, then human emissions must magically disappear, and temperature must magically generate CO2 in about the same quantities of our emissions. This is absurd.
Demetris,
While you have used the IPCC data, your conclusion is quite different…
So where is the problem?
The problem is in the assumption for equations (8) and (9) where you assume that not only the short term variability (+/- 3-4 ppmv/K) is caused by temperature variability, but also the trend over the past 170 years and that is physically impossible, as that includes a response of 120 ppmv/K…
That you can “predict” the past 60+ years increase is due to the fact that you have guessed the best fit parameters with an algorithm, not based on any physical process…
The maximum increase in the atmosphere over mid- and very long periods is about 16 ppmv/K, as observed over the past 2 million years…
No, our calculations are based on the physical process that temperature rise leads to increasing [CO2], which we substantiate in our paper.
“… and temperature must magically generate CO2 in about the same quantities of our emissions.”
Maybe you just aren’t looking in the right places. Natural sources swamp anthropogenic emissions. The uncertainties in the Carbon Cycle could easily result in confusing sources. Something that doesn’t get mentioned is the melting in the Tundra, which is a result of increasing temperature — about 2-3X the global average. Probably Winter respiration of boreal tree roots are increasing from the increasing Arctic temperatures. Also, the submarine emissions of CO2 may be a serious underestimate considering that a recent survey nearly doubled the known number of sea mounts.
Demetris,
The short term (2-3 years) variability that you use to prove that temperature is the main driver for the CO2 increase is going in the opposite direction of the general CO2 trend: the variability in CO2 is the variability in net uptake (not net release!) by both vegetation and oceans. That trend is increasingly negative. Thus never can be the cause of the increase in the atmosphere.
See: http://www.ferdinand-engelbeen.be/klimaat/klim_img/dco2_em8.jpg
Further: the exact influence of temperature changes over longer periods on CO2 levels is known by the formula of Takahashi for the ocean surface:
∂ln pCO2/∂T=0.0423/K
Or about 13 ppmv since the depth of the LIA. That is all the influence of temperature on CO2 levels over the past 1,000 years.
For vegetation, the net sink rate also grows with more CO2: the earth is greening… Thus only a negative influence on the CO2 increase.
If we plot human emissions, increase in the atmosphere and net sinks, then we have:
http://www.ferdinand-engelbeen.be/klimaat/klim_img/delta_p.jpg
In the first graph, we have plotted the calculated human emissions, the observed CO2 level in the atmosphere, the calculated influence of temperature on CO2 levels and the difference in pCO2 calculated from the observed CO2 level and the temperature caused CO2 increase. That is the driving force for the uptake by oceans and vegetation.
The second graph is the observed net sink rate of CO2 into oceans and vegetation.
The third graph is the calculation of the e-fold decay rate (~50 years) as result of the increasing pCO2 difference between atmosphere and ocean surface.
What is important:
– The observed variability in net sink (not source) rate is peanuts compared to the total increase of CO2 in the atmosphere.
– The total influence of the temperature increase since the LIA is only some 10% of the increase, all the rest is from human emissions.
– The lead of temperature in the variability is around a negative trend in net sink rate, while the atmospheric CO2 level all the time is positive.
That all means that your conclusions are based on a wrong assumption: that the lead/lag as seen for the variability around the trend is applicable for the lead/lag of the trends…
Well, I do think it is quite possible that some of the increase in CO2 is due to a warmer climate. But I agree that the majority must have been due to fossil fuel combustion.
The reason the carbon budget is very important is we don’t understand it very well and its a big source of uncertainty. It is possible that as CO2 increases ecosystem productivity will go up a lot increasing carbon sequestration in forests, sedimentation in the oceans and lakes and weathering of rocks. This was a point made by Freeman Dyson. That’s perhaps why activist scientists don’t want to discuss it because its a benefit of more CO2.
I still don’t understand the ritual garment ripping that accompanies controversial papers and theories. It’s obviously politically motivated and mostly by known activists who often can’t offer any real scientific critiques. And that’s the key here. With the exception of Nick Stokes, the detractors commenting here offer nothing that has scientific merit.
The problem with this paper and similar papers from Berry, Harde, the late Salby is that these violate at least the carbon mass balance and several other observations.
The carbon mass balance is quite accurately known with small error margins, because we have good knowledge of human emissions and good measurements of the CO2 increase. That is all we need.
No need to know any natural flux or its variability, as we know the end result: more sink than source.
Human emissions are around twice the increase in the atmosphere and every year since 1958 larger than what remains in the atmosphere. Thus nature is a proven sink for CO2. Not a source.
Whatever the (temperature induced) variability of the CO2 increase, there is simply no room for a large part of the increase due to temperature.
Any theory or calculation that violates one (or more) observations is to be rejected.
Including this paper.
Salby’s argument, if I understood it correctly, was that CO2 is constrained by temperature, and that the system alters the natural sources and sinks to balance the CO2 concentration regardless of what our emissions are. You can’t deflect this argument by simply asserting that the sources and sinks in balance led to an increase that was determined by our emissions because we know the size of our emissions. If he was right, a reduction of our emissions under conditions of rising concentrations would still leading to increases at the same rate. I’m not satisfied with the evidence he presented, but his point can’t be deflected just by arguing the we created the imbalance. The real problem is that he didn’t present evidence how the system achieves what he suggests. If sources and sinks don’t respond enough to temperature AND concentration, then concentration isn’t determined by this balance, and adding CO2 will cause an increase in concentration.
Ferdinand, could tell us where exactly our paper does “violate at least the carbon mass balance” and which exactly are the “several other observations” that it also violates?
Please note:
-We just use observations, as they are registered in official databases.
– We use the IPCC carbon mass balance; see Appendix A1.
I think Ferdinand you are offering a too simplistic logic. Without any temperature increase, there would be less CO2 in the atmosphere because the outgassing would be less than it is. It’s a legitimate question what the size of this effect is.
Demetris and dpy6629
Indeed the logic may seem simplistic, but my experience with very smart people like Salby, Berry, Harde and many others is that they have troubles to understand simple things like a household budget, which (hopefully) any housewife/man understands: If you spend more money than you earn, you run into trouble…
“Since we have identified atmospheric temperature as the cause and atmospheric CO2 concentration as the effect”
From the text is the main point in this discussion.
The authors have proven that all the variability of CO2 is caused by temperature variability.
I don’t think that many people on this earth will dispute that.
Then the authors use that to “prove” that the total increase in the atmosphere since 1958 also is caused by temperature and that is simply impossible.
The carbon mass balance is as follows:
Increase in the atmosphere = human emissions – human sinks + natural emissions – natural sinks
The increase in the atmosphere is quite accurately known: 2.5 ppmv/year with an error margin of +/- 0.2 ppmv
Human emissions are quite accurately known from fossil fuel use (taxes!) and burning efficiency, maybe somewhat underestimated, due to human nature to avoid taxes, but certainly not overestimated: 5 +/- 0.5 ppmv/year
The main natural fluxes are only roughly known due to ocean surveys and the oxygen balance for vegetation.
For the current budget app. per year:
2.5 ppmv = 5 ppmv – 0 ppmv + X – Y
X – Y = -2.5 ppmv
No matter what X and Y are, Y is always 2.5 ppmv larger than X with a small error margin.
If X = 10 ppmv then Y = 12.5 ppmv
If X = 100 ppmv, Y = 102.5 ppmv (app. current natural cycles)
If X = 1000 ppmv, Y = 1002.5 ppmv
Thus it doesn’t matter at all how much natural CO2 is cycling through the atmosphere from other reservoirs, human emissions are the main cause of the increase…
Ferdinand, I appreciate your calculations. But I guess we are discussing ours in this blog post. So, if you find errors in ours, as reflected in our Appendix A1 and our Fig. A1, please let us know–and also let the IPCC know, because our figure is entirely based on the IPCC estimates.
It seems that some comment of mine still is somewhere in cyberspace, but here in short:
The main error of this paper is in one assumption that precedes formula (8) and (9):
The authors assume that the cause and effect found in the short term CO2 rate of change variability also can be used for the longer time (decades) trend.
That assumption is wrong, because the year by year variability has little to do with the 60+ years trend, which is (near) fully caused by human emissions.
The short time ratio is about 2-3 ppmv/K for 2-3 years temperature variability. For many thousands of years, the ratio is about 16 ppmv/K.
By iteration a “best guess” factor can be found to fit the Mauna Loa data, but that has no physical ground: that implies some 120 ppmv/K effect of temperature on CO2 levels which is physically impossible.
“The main error of this paper is in one assumption that precedes formula (8) and (9): The authors assume that the cause and effect found in the short term CO2 rate of change variability also can be used for the longer time (decades) trend.
That assumption is wrong, because the year by year variability has little to do with the 60+ years trend, ”
Main error? Short term? Our results did not indicate time precedence of CO2 change over temperature change for any time scale that the data allow to study, i.e. up to a couple of decades. Can you make calculations similar to ours, i.e. based on bare data and not on conjectures and models, that support the opposite direction?
Paul Roundy,
The problem of the late Salby’s approach is that he compared the increase of temperature with the increase of the derivative of CO2.
Then he used the integral of temperature to calculate CO2 as if that temperature was the main driver for the CO2 increase.
That is plainly wrong: compare temperature with CO2 or the derivative of temperature with the derivative of CO2, not the temperature with the derivative of CO2…
Moreover what is the integral of temperature? A non existing physical unit.
The effect of e.g. 1 K increase in temperature sustained over a long period would give a constant increase of extra CO2 in the atmosphere until eternity or opposite for 1 K cooling…
Why Salby (and others) were wrong is understandable: if you plot dT/dt with T and dCO2/dt then you will see that both dT/dt and T have almost exact the same variability, but with a 90 degrees shift in time… dT/dt has no slope, T and dCO2/dt have a slope:
http://www.ferdinand-engelbeen.be/klimaat/klim_img/wft_T_dT_dCO2_trends.jpg
That makes that the variability in dT/dt is the proven driver for dCO2/dt, but T variability near completely synchronizes with dCO2/dt variability and nobody can say which one drives the other.
Any sinusoidal variable behaves in similar way…
Judith –
So just to clarify, you’re saying that this analysis doesn’t put into question the basic physics of the GHE, which you fully accept, but despite that we’re pumping so much ACO2 into the atmosphere there may not be any warming effect from those CO2 emissions?
Do I have that right?
I get that there are carbon sinks but I’m guessing you agree they don’t completely account for the CO2 emissions. In which case wouldn’t the GHE imply that the remaining CO2 would necessarily warm by virtue of the GHE?
Hopefully you’ll explain that logic in simple terms I could understand.
I guess it might be related to your argument that despite saying you don’t question the basic physics of the GHE, and despite continued ACO2 emissions, you believed there was a “pause in global warming” based on a temporary decrease in the rate of increase in surface temperatures only (basically ignoring OHC despite the significant role OHC plays the energy budget).
Of course, a similar kind of logic led you to predict 10 years ago, a continued “pause” of global warming into the 2030s. What’s your assessment of that prediction some 10 years in? Do you think it has been validated? If not, why not? Just not enough time yet it or was there some kind of conceptual problem with your theory of the mechanism of warming/cooling/not warming?
Tia.
.
I’m not answering for Dr. Curry, but just a note: No matter if the source of the increase in CO2 we see is anthropogenic or from other sources, it is increasing. Dr. Curry has stated she believes about half the warming is due to the increase. AFAIK, she has never stated CO2 does NOT increase surface warming.
Jim –
> . AFAIK, she has never stated CO2 does NOT increase surface warming.
So I’ve never understood that. How could there be a “pause” in global warming” (as Judith testified to before Congress) if the emissions which (at least in part) cause warming didn’t pause?
At best, seems to me, what we saw was a temporary decease in the rate of ongoing increase in warming. IOW, at best a “pause” in one (relatively less indicative) signal of global warming and NOT a “pause in global warming.”
Well, Josh, pauses in surface temperature increases are a fact. Obviously, there are factors other than CO2 levels that affect it. I believe that is part of what some scientists are attempting to dissect.
Jim –
> .Well, Josh, pauses in surface temperature increases are a fact.
Weko, as near as I can tell, that seems to me to be a matter of perspective and not a “fact.” . What some would call a “pause,”* others would call noise in a long term trend of consistent increase. Especially if there’s no theory of casual mechanism to explain the supposed “pause.”
Judith offered such a theory of causal mechanism. Is it time yet to reevaluate that theory?
* looking beyond the strangeness of calling a (possibly temporary) decrease in the rate of increase in one, relatively less indicative metric, a “pause in global warming (as if OHC doesn’t exist/isn’t a more indicative metric).
Dr. Curry,
Yes, Salby’s papers were about the carbon budget and they were wrong. The carbon budget is quite well constrained. Read Ballantyne et al’s 2012 Nature paper. There is no room for the conclusions of this paper.
I know you preach uncertainty. Invoking it here is tantamount to promoting misinformation.
David,
And it’s one thing to invoke the need to acknowledge uncertainties. It’s quite another a to assume all uncertainties work in your favor. And in this case, even if you did make that assumption, the conclusions of this paper are still impossible.
“the conclusions of this paper are still impossible”
I am taking a note of this; I may use it as a motto for a next paper….
“Invoking it [this paper] here is tantamount to promoting misinformation.”
Thanks for unveiling that the origin of some of the reactions against our papers and Dr. Curry’s stance are of political type, related to the “misinformation agenda”–a euphemism to silence or at least censor opinions that do not serve the interests of those making the agenda.
Please see the quotation we use as the motto of our paper by none other than Carl Sagan. I repeat part of it here:
“The suppression of uncomfortable ideas may be common in religion and politics, but it is not the path to knowledge”.
demetriskoutsoyiannis,
The issue here is that you have yet to respond to the substantial criticisms of your paper. Let me state these to you as questions:
1. Given that humans have emitted ~700 GtC into the atmosphere, if that has not raised CO2 concentrations, where did all that mass of carbon go?
2. Given that land and ocean are both carbon sinks, if the increase in atmospheric CO2 didn’t come from human emissions, where did it come from?
If you can’t answer these questions, you can’t make a case that temperature is causing CO2 to increase, and not the other way around.
It is completely unsurprising that some carbon fluxes respond to temperature. This can be observed seasonally and even annually with ENSO. But long-term you have to account for the carbon cycle and human emissions of carbon.
Actually, the “substantial criticisms” are not criticisms. They are questions already replied to by our Fig. A1. But I will explain the replies in words (even though I am not sure if words can be better understood than geometric depictions). I will use annual rates (Gt/year) for the current period rather than cumulative quantities for all years, in accord to what is depicted in our Fig. A1 and IPCC’s Fig. 5.12.
“1. Given that humans have emitted ~700 GtC into the atmosphere, if that has not raised CO2 concentrations, where did all that mass of carbon go?”
Every year, of the 9.4 Gt/year of CO2 fossil fuel emissions (or 9.4/3.7 = 2.5 Gt C), plus other additions tantamount to 50.2 Gt/year (see decomposition in question 2 below), a quantity of 5.1 Gt CO2 (named “Balance” in our figure) is stored in the atmosphere. The remaining quantity is intercepted by absorption and photosynthesis in the terrestrial and maritime parts of the Earth, at a proportion of 142 / 79.5 = 1.8:1 (see the numbers in the figure).
“2. Given that land and ocean are both carbon sinks, if the increase in atmospheric CO2 didn’t come from human emissions, where did it come from?”
The increase in atmospheric CO2 comes from:
(a) an increase in terrestrial respiration and fire by 25.6 Gt/year, (b) an increase in ocean respiration by 23 Gt/year, (c) human fossil fuel and cement production emissions of 9.4 Gt/year, (d) land use change of 1.6 Gt/year,
minus
(e) an increase in terrestrial photosynthesis by 29 Gt/year, (f) an increase in ocean absorption and photosynthesis by 25.5 Gt/year.
The above increases (relative to 1750 AD), both in emissions and absorptions, result from increased temperature, as explained in the paper.
demetriskoutsoyiannis,
You answered the first question wrongly, but you didn’t answer the second. You got your units wrong.
1. Human emissions are ~10 GtC, not 9.4 GtCO2 annually. Let’s use your numbers and correct your units to 9.4 GtC, of which 5.1 GtC is annually added to the atmosphere. That means human emissions causes an increase of 5.1*3.67/7.81= 2.4 ppm increase in CO2 concentrations annually.
2. You failed to answer this question. According to the carbon budget, both land and ocean are carbon sinks, so they take up more CO2 than they contribute to the atmosphere. You know that difference between the 9.4 and 5.1? That difference of 4.3 GtC is taken up by the land and oceans in roughly equal quantities, meaning the net contribution of land and ocean sources of CO2 to the atmosphere is 0 GtC.
Now how much does CO2 increase each year? Let’s use a 10 year average. In 2013, the annual average was 396.74 ppm. In 2022, it was 418.56. That means on average CO2 has increased by 2.2 ppm each year. If you use the correct units, we can see from your own admissions that humans are responsible for virtually all the increase in CO2.
I wrote: “even though I am not sure if words can be better understood than geometric depictions”.
I must now rephrase it as: “even though I am sure that words cannot be better understood than geometric depictions”.
Hence, there is no meaning in continuing this exchange.
The graphical depiction in the carbon budget make my point. The increase in atmospheric CO2 each year is 5.1 GtC entirely from human activity. It’s clear in the numbers:
1. Human flux: 1.6+9.4 = +11 GtC annually.
2. Land flux: +.1-.3-1.9-3.4+1.5 = -4 GtC annually.
3. Ocean flux: +.6-2.5 = -1.9 GtC annually.
Total: 5.1 GtC annually
Both land and oceans remove precisely the difference between our emissions and what remains in the atmosphere, so it must be that ~100% of increase in CO2 comes from human emissions. I can see why you’d conclude that “there is no meaning in continuing this exchange.” The numbers you shared from the IPCC and illustrated in your Figure A1 prove you wrong.
You confirm that our numbers our correct, and you conclude that our correct numbers prove us wrong.
I conjecture that the logic behind your arithmetic is this. A tree, before taking a molecule in its photosynthesis, first examines its origin, whether it was emitted by land or ocean or humans, and uses it only in the first case (and likewise for the ocean).
demetriskoutsoyiannis,
In your initial comment to me, your units were wrong, but the numbers with corrected units are correct. And yes, they prove you wrong. As you can easily see from these numbers, human emissions are ~2x the increase in concentrations with land and oceans taking up the difference between our emissions and the airborne fraction. This means necessarily that human activity is responsible for ~100% of the increase in CO2.
If you extend these numbers back to 1750 using values from the carbon budget, this doesn’t change. The natural carbon cycle is nearly balanced – it’s actually a bit of a net sink. It’s human emissions that flip the carbon cycle to a net source. So all the increase in CO2 comes from human activity.
I make this point using the 2021 carbon budget and 5 independent lines of reasoning and evidence.
https://woodromances.blogspot.com/2022/09/how-do-we-know-that-humans-are.html
Your conclusions require that human CO2 magically disappears and temperature creates CO2 magically in the same quantity as our emissions.
An earlier comment admitted that the ice cores show CO2 changes lagging temperature changes, and admitted that datasets since 1980 show CO2 lagging. But then asserted that all the CO2 increase since 1850 is from humans.
Well, there’s good evidence LIA temps started rising before CO2.
https://rclutz.files.wordpress.com/2023/09/co2-and-temps-250-yr-lag-during-lia.png
Ron, here is a paper that compares global temperature to CO2 from ice cores. You can’t use the temperature proxy from the ice cores because that reflects the local temperature where the ice is.
https://judithcurry.com/2023/09/26/causality-and-climate/#comment-993795
“You confirm that our numbers our correct, and you conclude that our correct numbers prove us wrong.”
Once we correct the units in your comment, yes those numbers were correct and they prove the conclusions of your paper wrong. It cannot be that either the land and ocean are the source of the increase in CO2 because they are a net CO2 sink.
“I conjecture that the logic behind your arithmetic is this. A tree, before taking a molecule in its photosynthesis, first examines its origin, whether it was emitted by land or ocean or humans, and uses it only in the first case (and likewise for the ocean).”
No, that is not a conjecture behind the logic of my math. That may be a conjecture behind yours, but natural sinks don’t care about the origin of the CO2 molecules. What matters is that the natural cycle is a net sink and the human contribution is a net source.
For example, if you have an income of $1000/week and your expenses are $990/week, you can save $10/week. But if someone has figured out a way to steal $50/week from your account, you’re going in debt (or your savings are being depleted) by $40/week. Why? Because someone is stealing your money. The theft is flipped your budget from being in the black to being in the red, and the weekly theft is 100% of the problem.
Likewise, human emissions are flipping the carbon cycle to a net source, and human emissions are 100% responsible for the increase in CO2. That’s what those numbers in your paper demonstrate.
jim2,
“You can’t use the temperature proxy from the ice cores because that reflects the local temperature where the ice is.”
–
It is a very important conclusion. If it is locally cold enough, below the temperature of CO2 freezing point, CO2 will be heavily sequestered in ice.
Thus, the colder it was, the more CO2 in the ice cores.
–
https://www.cristos-vournas.com
jim2, if you are referring to my LIA chart, note that the Moberg temperature series is a NH reconstruction, and that the Kouwenberg CO2 is a stomata series.
We are considering the vast CO2 natural reservoirs (oceans and land), we are considering their vast CO2 content, along with the tiny ~400 ppm CO2 content in the actually very thin atmosphere.
–
At current average global temperature it is the ~400 ppm CO2 content which is in equilibrium interaction with the CO2 natural reservoirs. Or, to say diferently, at current average global temperature, the natural CO2 reservoirs with their mighty CO2 content “support” the ~400 ppm CO2 equilibrium content in earth’s atmosphere.
–
What we observe is that there is a rise in earth’s global temperature.
Also, it is measured, that there is an annual ~2 ppm CO2 content rise in earth’s atmosphere.
And, it is estimated, ~4 ppm CO2 content (as added amounts of CO2 from the fossil fuels burning) is annually added to the earth’s atmosphere.
–
So, we have, from the fossil fuels burning, annually added
~4 ppm CO2, but the annual rise of CO2 is ~ 2 ppm.
–
It is the 400 ppm which are actually being “supported” by natural reservoirs.
The average global temperature rise is the cause of that
~2 ppm CO2 rise in earth’s atmosphere, and not the fossil fuels burning.
–
Let’s discuss it arithmetically:
the current CO2 content of ~400 ppm is 100%
the ~2 ppm rise is then 0,5%
and the fossil fuels “contribution” is 1%
–
so, a layman’s logic, if we stop burning fossil fuels, there would not be the 1% “contribution”
–
so, if we suddenly stop burning fossil fuels, there will be a natural mitigation of ~0,5%.
–
So far, so good… in ten years there will be ~5% less CO2 content in earth’s atmosphere
–
in a hundred years there will be – the simple arithmetic cannot answer the question, because the simple arithmetic is very simple.
–
https://www.cristos-vournas.com
When I read a paper like this, I’m not seeking ‘truth’ or even trying to quantify uncertainty, i’m seeking to learn something. This paper has provoked me to think more deeply about causality in a complex system with feedbacks. That’s how I roll as a scientist. I don’t play ‘truth’ arbiter like the folks at realclimate
Dr. Curry,
Again with all due respect, this is your blog, and of course you can do with it as you please, and I doubt anyone wants you to be a “truth arbiter.” But science does seem to have a lot to do with accurate assessments of what conclusions can be drawn from the available evidence, and what conclusions cannot be drawn. That is, science should be about understanding how the actual world operates and conveying that accurately and honestly. I would think that should have a lot to do with how “scientists roll.” This paper fails to account for the carbon budget. We know it’s conclusions can’t be drawn from the evidence, since human emissions roughly double the increase in atmospheric CO2 concentrations and land and ocean are net sinks. So this paper is wrong.
This blog has promoted several papers like this recently, and it gives the impression that you’ll promote just about any old thing that criticizes climate science, even if it’s fatally flawed and obviously wrong.
The methodological problem of the paper is that they “used the mean (CMIP6 mean) of the output series of the Coupled Model Intercomparison Project (CMIP6) averaged over the globe” when testing causality in model world. But that isn’t at all parallel to their test of causality for Earth, which is more like testing a single instance of a model. Ask the authors to apply their causality approach to a single model run, and see what happens!
MMM: If you read the paper before criticizing it, you would perhaps see this in section 3:
“To check whether the results of our methodology would change if we chose any particular member of the ensemble instead of the mean, we also retrieved outputs from a
single model, namely the UK Earth System Model (UKESM1 [21]). For the sake of brevity of this paper, we give this latter analysis (whose results eventually do not differ from those
of the CMIP6 mean) in the Supplementary Information”.
I’m glad you did that calculation. However, in digging into the UKESM paper, I realized another problem with your model comparison… you need to pick an ESM that is emission driven, not concentration driven.
From the UKESM paper: “All of the results in section 4, and most of the simulations that will be submitted to CMIP6, are driven by CO2 concentrations rather than CO2 emissions”
If you don’t have a model with a dynamically coupled CO2 concentration, of course you won’t see temperature effects on CO2!
Judith, I wish to express my special thanks to you, not only for posting our piece and your insightful comment on it, but also for teaching us the qualities that could make us real scientists:
“i’m seeking to learn something”
“provoked me to think more deeply”
“I don’t play ‘truth’ arbiter”
I, too, believe, humility goes hand-in-hand with knowledge.
You also wrote:
“Disagreement and debate is the spice of the climate blogosphere. We all stand to learn something.”
May I expand the first part: Disagreement and debate are the food of science. Its growth depends on them. (Like the growth of plants and the entire ecosystem depends on atmospheric CO2 :-)
More generally: «Tὸ ἀντίξουν συμφέρον καὶ ἐκ τῶν διαφερόντων καλλίστην ἁρμονίαν καὶ πάντα κατ’ ἔριν γίνεσθαι»
“Opposition unites, the finest harmony springs from difference, and all comes about by strife” (Heraclitus, Fragment B 8).
Dr. Curry,
Here is another perspective on truth. Science advances when original but wrong ideas are discarded because of empirical evidence. That is why science progresses better than, say, philosophy. I have yet to see a climate skeptic ever admit an error, and that is why you go around in circles: from Humlum to this paper for example. Truth matters. The alternative way science advances was stated by Planck: “one funeral at a time.”
Mr/Dr/Prof Andrews. Science is likely to advance faster if a 30+ year gravytrain amounting to $1bn+ of public funding were not wasted on ‘computer models’ which do not accurately represent how climate works, but are used to force a religious doctrine onto 7.5 billion people.
As a biologist, I can tell you that carbon dioxide is not a poison, it is the fundamental requirement for all photosynthesising organisms to exist. And without those photosynthesisers producing oxygen, all the respiring mammals wouldn’t exist. We as humans would never have existed without atmospheric carbon dioxide, and don’t you ever forget it.
You would also do well to realise that the rates of photosynthesis on earth, at constant temperatures, are higher as carbon dioxide concentrations rise (basic Michaelis-Menten enzyme kinetics). So if you want trees to grow faster, grass to grow lusher, global leaf area to increase, the quickest way to do that is to increase carbon dioxide in the atmosphere. It will be a self-regulating mechanism, because in the end the rate of photosynthesis will start to bring down the levels of carbon dioxide, which will reduce the maximum photosynthetic capability as well. Of course, that also depends on rainfall, atmospheric moisture remaining somewhat constant too, as water is the other key input to the photosynthetic reaction and plants in general will need sufficient water absorption to replace their loss via transpiration if they want to photosynthesise effectively.
Of course, if humans set about destroying soil to turn it dead by deforestation, by spraying poisons all over the earth, by killing aquatic wildlife through release of toxic chemicals etc etc, then this isn’t going to help photosynthetic capability, is it? But that’s got nothing to do with oil production, cars driving. It’s got to do with heavy industry not being appropriately regulated and it’s to do with forestry conglomerates thinking that only money matters.
The carbon dioxide fixation occurred when rebellious environmentalists decided they wanted to go mainstream and earn lots of money from ‘Big Green’.
Sorry to all, for some duplicates…
There were several attempts to post something without any direct response of publication, while others did appear directly. That was very confusing, as some (long) reactions seemed to disappear in cyberspace…
Demetris,
I still see no discussion by you of the question: have land/sea reservoirs been net sinks or sources in the industrial era? How does that effect your conclusion?
“I still see no discussion by you of the question: have land/sea reservoirs been net sinks or sources in the industrial era?”
I thought it was obvious that they are net sinks, wasn’t it?
And that we, humans, are net emitters… Isn’t that obvious from our Fig. A1, also reproduced in this post?
But we are trying to see the entire system, which includes, as an essential part, humans (a species that I personally don’t wish to go extinct…). So, our conclusions are for the entire system.
Demetris, if the main emitters are humans and both oceans and vegetation are sinks, the only conclusion can be that (near) all the increase of CO2 in the atmosphere is from human emissions. All other possible sinks and sources are much slower in exchange rate than these three sources (and sinks for oceans and vegetation).
Again, the problem is in the small +/- 3-4 ppmv/K natural variability which maximum result (Pinatubo, El Niño) is only +/- 1.5 ppmv around the 90+ ppmv trend since 1958:
You expand the results of the short-term variability to the trend itself, while variability and trend(s) have very different causes, except for a small contribution of warmer ocean temperatures…
Here the difference in slopes between the derivatives:
http://www.ferdinand-engelbeen.be/klimaat/klim_img/temp_co2_der.jpg
Here for the period 1985-2000, with the 1991 Pinatubo and the 1998 El Niño for T and CO2:
http://www.ferdinand-engelbeen.be/klimaat/klim_img/wft_trends_rss_1985-2000.jpg
No, Ferdinand, it is not correct that “the main emitters are humans and both oceans and vegetation are sinks”. The humans emit 4%–they cannot be “the main emitters”. Rather, the “the main emitters” (responsible for 96%) are “oceans and vegetation”. And they are also sinks.
As a hydrologist and civil engineer, I have been familiar with several types of balances. It never made sense to me to isolate a part of the balance as if it were something autonomous and isolated from the other parts. As I wrote above, I always try to see the entire system.
Demetris,
I should have included the word “net” sinks for oceans and vegetation…
In a balance you have two sides: incoming and outgoing data.
No matter how much natural carbon cycling is going on, as long as the increase in the atmosphere is smaller than the human contribution, only humans are responsible for the bulk of the increase. Even if the natural C cycle doubled or halved from one year to the next: the natural C cycle in the past 60+ years was always more sink than source.
That means that the natural C cycle can’t be the main source of the CO2 increase in the atmosphere: that is a net sink, not a net source…
If you have a lot of cycles, more or less in equilibrium and one additional one-way source, it is only that (even small) extra that causes the increase, not the bulk of the cycles.
BTW, even with 4-5% of the inputs, the current, measured (from the 13C/12C ratio), human contribution in the atmosphere is already around 10% and in the ocean surface around 6%. In vegetation more difficult to quantify.
“a lot of cycles, more or less in equilibrium”
In my humble opinion, Nature hates “equilibrium” (like she hates vacuum) and never materializes it. Systems in equilibrium are dead systems. Change is the only rule in Nature–and this presupposes that a system is not at equilibrium.
See a toy example in my article: A random walk on water, http://dx.doi.org/10.5194/hess-14-585-2010
Demetris, I said “more or less”, but still nature tries to get back to a dynamic (*) equilibrium with a speed that is directly proportional to the distance to that equilibrium:
The current CO2 level in the atmosphere would be around 295 ppmv for the current (area weighted) average ocean surface temperature.
The current uptake by oceans and vegetation is about 2% of the difference between actual CO2 level and the dynamic equilibrium with the ocean surface: 120 μatm (~ppmv) difference gives ~2.4 ppmv net sink rate.
The interesting thing is that the natural variability in sink rate (caused by temperature variability) is very small: about +/- 1.5 ppmv/year for the largest extremes, while natural fluxes are around 100 ppmv/year.
(*) dynamic: a lot of CO2 is released near the equator and absorbed near the poles to return with the THC waters about 1000 years later near the equator. If the average temperature or CO2 pressure changes, the process dynamics change to reduce the disturbance.
Ferdinand Englbeen: “as long as the increase in the atmosphere is smaller than the human contribution, only humans are responsible for the bulk of the increase.”
This is fundamentally incorrect.
Currently humans contribute approx twice as much CO2 into the atmosphere than it is increasing by. That does NOT mean that humans are causing the CO2 in the atmosphere to increase. The system is out balance because the rate at which biota decays releasing CO2 and methane is faster than at the rate at which it can be fixed, regardless of our contribution.
Mans contribution can make more CO2 available and mean photosynthesis can happen more efficiently, but not linearly. There have been periods in the last 1000 years when CO2 levels have been comparable to today. Given they have not quite reached modern levels, it’s reasonable to argue that we have had an impact on the net increase. But it is not reasonable to argue that we have been responsible for the entire increase because on all other time scales the warming precedes CO2 increase and the mechanism for that is (I thought) well understood:
Processes that release CO2 are more temperature dependant than processes that fix it. When it warm and CO2 is released faster than it is fixed, then atmospheric CO2 increases.
Agnostic –
> because on all other time scales the warming precedes CO2 increase and the mechanism for that is (I thought) well understood.
What is the mechanism that explains the warming (an increase that’s directly proportional to anthropogenic CO2 emissions) if it’s not anthropogenic CO2 emissions?
Joshua, that is merely a coincidence from the relative ratio of human and natural CO2 emissions currently. Skrable et al (2021) showed that despite an estimated 205 ppm of FF CO2 emitted since 1750, only 46.84 ppm (23%) of FF CO2 remains, while the other 77% is distributed into natural sinks/sources.
As of 2018 atmospheric CO2 was 405, of which 12% (47 ppm) originated from FF. And the other 88% (358 ppm) came from natural sources: 276 prior to 1750, and 82 ppm since. Natural CO2 sources/sinks continue to drive rising atmospheric CO2, presently at a rate of 2 to 1 over FF CO2.
https://rclutz.files.wordpress.com/2022/07/history-of-atm-co2-1.png
Ron –
If the rise in (non-anthropogenic) atmospheric CO2 is caused by warning (warning that just happens to be proportional to anthropogenic emissions), what has caused the warming?
Joshua,
You asked: “If the rise in (non-anthropogenic) atmospheric CO2 is caused by warning (warning that just happens to be proportional to anthropogenic emissions), what has caused the warming?”
Consider this:
https://github.com/bobf34/GlobalWarming/blob/main/hybridmodel.md
Joshua, what warming proportional to human hydrocarbon emissions?
https://rclutz.files.wordpress.com/2023/02/uah-global-1995to202301-w-overlay.png
What we see is the sun and oceans doing their thing.
Ron. –
I guess I wasn’t clear.
There’s a decades-long, steady trend of temperature increase (you know the one that supposedly “paused”*) concurrent with a similar pattern of increase in anthropogenic CO2 emissions and accumulation of those emissions in the atmosphere.
Where is the similar trend of increase of some other forcing?
Hand-waving at oceans and the sun seems sub-optimal. If it’s not the anthropogenic CO2 that caused the warming, where is the signal in some other forcing (other than anthropogenic or even non-anthropogenic, atmospheric CO2) that caused the warming, that in turn putatively caused the rise in the non-anthropogenic, atmospheric CO2?
*It’s always interesting to me how “skeptics” say there was a “pause” in the warming and then say “Warming, what warming?”
If you’re going to go with “There isn’t a trend of warming,” then apparently you think Demetris’ theory is crap.
Robert –
Thanks for providing Yuri answer to my question.. So I guess I wasn’t so unclear after all. Sssms others have had unexplained trouble answering.
So, apparently you think the signal of the forcing is sunspots. Do you think there’s evidence of a correlation between sunspots and (lagging) increase in atmospheric CO2 in the past, where warming functions as the mediator variable?
Joshua. Sunspots are not the forcing signal, they are a proxy for solar activity. The sunspot data is only accurate enough for my purposes back to about 1800, and my model uses more than 100 years of data (to deal with solar constraints), so predictions only are reliable back to about 1900.
My interest in Demetris’ result was that if solar activity is the primary driver as my empirical model suggests, then co2 doesn’t play a role, or it must at least lag temperature.
https://judithcurry.com/2023/09/26/causality-and-climate/#comment-993850
The results in my comment above confirm that temperature and co2 are coherent to some degree, and also confirm Demetris’ result that temperature leads co2 by 6 months — at least over the time scales for which we have measured co2 data.
Demetris
I ran the experiment again for NH and SH data with the same delay result as for global temperature. I also switched from a Hamming to a Flattop window just to make sure that window leakage wasn’t affecting results. Finally, I ran the experiment with ln(co2). That result is shown here.
https://localartist.org/media/CO2_Temp_FRF_ln_flat.png
So Joshua, you want an answer to what caused the warming recovery after the LIA. Lots of research and theories for you to read and satisfy yourself. All we know for certain is that the LIA was not ended by warming from humans burning fossil fuels.
BTW Ronald can’t come out and play any more, he has work to do.
Robert –
> Joshua. Sunspots are not the forcing signal, they are a proxy for solar activity.
Well, that’s what the link you provided said. And it’s also what I meant when I described the casual chain with a mediator variable.
So I was asking you (and I guess the question still stands) about historical evidence where there’s an association between sunspot activity and (lagging) atmospheric CO2 (with an assumption of warming as the mediatorl.
IOW, proxy for solar activity and signal of forcing would be synonymous.
Joshua: “What is the mechanism that explains the warming (an increase that’s directly proportional to anthropogenic CO2 emissions) if it’s not anthropogenic CO2 emissions?”
Firstly, why “directly proportional”? Human emissions and temperature do not correlate terribly well. The slight cooling from 1940-1970 occurred when emissions where increasing exponentially.
Secondly, the mechanism for warming is likely to be similar mechanisms that caused warming in the Minoan, Roman, Medieval warm periods, and their absence likely the reason for the cold periods especially the LIA. They are not well understood, but it is unlikely that it is because CO2 is a control knob.
The scope of the paper we are discussing is whether or not the causality is correct – that the CO2 CAUSED the recent warming. On all time scales, including short time scales, where we have good data, CO2 nearly ALWAYS lags temperature. So the causality cannot be that CO2 CAUSES temperature to increase. It’s the other way around. That does not mean that CO2 does not cause further warming – it’s a positive feedback.
Agnostic –
It’s interesting to see the high confidence you express in your opinions in this thread as it is my recollection from back in the day that you were more “agnostic” than how it appears here. That’s just an aside, and not directly relevant.
> Firstly, why “directly proportional”? Human emissions and temperature do not correlate terribly well. The slight cooling from 1940-1970 occurred when emissions where increasing exponentially.
Of course, I don’t really know the details very well, but it is my assumption that there is a general, directly proportional relationship. That doesn’t mean that there wasn’t “noise.” I don’t see “noise” as disproving a directly proportional correlation (even if that doesn’t prove causation). I’m talking along the lines of a relationship that would look like a dose-response relationship over decades (starting when anthropogenic emissions reached a critical threshold). My assumption is that people who study this wouldn’t for decade, identity such a proportional relationship, if none existed. And then there’s the critical aspect, imo, for identifying causality, which is that before the fact this relationship was projected and predicted.
> Secondly, the mechanism for warming is likely to be similar mechanisms that caused warming in the Minoan, Roman, Medieval warm periods, and their absence likely the reason for the cold periods especially the LIA. They are not well understood, but it is unlikely that it is because CO2 is a control knob.
So this is what I keep asking, and near as I can tell what i’m getting in return isn’t particularly convincing. The closest was a response that sunspot evidence indicates solar activity as the “cause” for the trend in warming, but when I asked for more information related to pin that down, I didn’t get any particularly convincing.
Of course, you wouldn’t need to convincingly identify a different cause of warming to disprove the theorized direction of causality between warming of unknown etiology and atmospheric CO2. But when there is such a compelling case made in advance, that has played out over such a long period of time, of a correlational relationship, it’s not particularly convincing to me when “disproof” is claimed without a more clear alternative explanation.
> On all time scales, including short time scales, where we have good data, CO2 nearly ALWAYS lags temperature. So the causality cannot be that CO2 CAUSES temperature to increase. It’s the other way around.
So I see you repeat. And I see technical responses being repeated. And so I see people making technical arguments I can’t evaluate. That leaves me at the place of trying to evaluate probabilities, from indirect evidence. On the one hand, I see a minority of people, some anonymous, some with no known quantity of domain relevant expertise, some with seemingly adjacent domain relevant expertise, some with directly applicable domain relevant expertise, arguing that a phenomenon long ago predicted, that played out over decades, has been completely misunderstood by a majority of people with varying levels of domain relevant expertise, but most significantly the vast majority of people with the most domain relevant expertise.
It doesn’t help when Demetris backs up his arguments about the probabilities by arguing that beliefs long-held by people without modern analytical tools being eventually disproven, as compared to decades of confirmation of a belief done by people with the most modern of analytical tools, strengthens his argument.
> That does not mean that CO2 does not cause further warming – it’s a positive feedback.
Well, that is also problematic, IMO. It looks a bit to me like people saying that they don’t doubt the GHE, but nonetheless there’s been a “pause in global warming” even though there’s been no pause in anthropogenic CO2 emissions.
Agnostic commented:
There have been periods in the last 1000 years when CO2 levels have been comparable to today.
Really? When?
Show your data. Good data.
Here’s an interesting paper on CO2 vs temperature via proxies.
https://www.researchgate.net/publication/223987444_Global_Warming_Preceded_by_Increasing_Carbon_Dioxide_Concentrations_during_the_Last_Deglaciation
Jim2, here are the data from the Vostok ice core for the last start of new glaciation (the end of the Eemian, about 130,000 years ago), where methane clearly follows the temperature decrease, but CO2 stays high for thousands of years and only starts declining when temperature reached a new minimum and land ice a new maximum:
http://www.ferdinand-engelbeen.be/klimaat/eemian.html
The point that methane follows closely the temperature change and CO2 does not, proves that the lag of CO2 isn’t an artifact of dating problems for ice vs. gas in the ice core, because both are from the same enclosed gas bubbles.
The subsequent drop of 40 ppmv CO2 had no clear effect on temperature or land ice formation, that points to a low to al low influence of CO2 on temperature…
Further, the snow that falls on the center of Antarctica, including Vostok, originated from near all the SH oceans, be it condensing to snow near Antarctica. Even so, it reflects far more than “local” temperatures.
For coastal ice cores, that is snow originating from nearby oceans waters…
How do you explain the contrary evidence presented by the paper I linked?
jim2, your link goes to Shakun et al. (2012). At the time many took issue with it. Don Easterbrook raised many questions about it here:
https://wattsupwiththat.com/2012/04/08/did-shakun-et-al-really-prove-that-co2-precede-late-glacial-warming-part-1/
I’ve no axe to grind, but the paper may not prove what it claims.
Noted.
I want to thank Ms. Curry for allowing my prior comment, very critical of this article and her choice to include it here. Some conservative websites would have made a similar comment “disappear”.
I want to thank Mr. Engelbeen, especially, and Mr. Simmons for their excellent comments, making these comments worth reading, even though the article was not. With editing, Mr. Engelbeen’s combined comments would make a great article.
Those two commenters were very polite to Ms. Curry for allowing this article on her website. Fortunately, I did not inherit the polite gene.
Ms. Curry acts as the editor of this website. It is her job to read and evaluate articles before inflicting them on visitors.
I am the editor of a climate and energy blog where I list 30 conservative articles worth reading each day — half of them on climate and energy.
I do not have to agree with any author, but they must sound like they know what they are talking about, or MY own reputation is trash. That’s why this article would never qualify for my blog, and allowing it here tarnishes the reputation of Ms. Curry.
In my opinion, this website has devolved into a variety of real climate science articles and science denying articles like this one.
That is the result of bad editing, and bad editing has consequences. For one example, I’ve deleted this website from my climate and energy website Bookmarks list.
What is the link to your site?
I did not include a link because I suspected it would “disappear”
http://www.HonestClimateScience.Blogspot.com
How lucky we are to have someone commenting here and passing judgment on my blog, who is so much smarter than Koutsayiannis (not to mention myself)
Demetris Koutsoyiannis is professor of Hydrology and Analysis of Hydrosystems in the National Technical University of Athens. He has served as Dean of the School of Civil Engineering, Head of the Department of Water Resources and Environmental Engineering, and Head of the Laboratory of Hydrology and Water Resources Development. He was Editor of Hydrological Sciences Journal for 12 years (2006-18), and member of the editorial boards of Hydrology and Earth System Sciences, Journal of Hydrology, Water Resources Research, Hydrology and Sci. He has been awarded the International Hydrology Prize– Dooge medal (2014) by the International Association of Hydrological Sciences (IAHS), UNESCO and World Meteorological Organization (WMO), and the Henry Darcy Medal (2009) by the European Geosciences Union (EGU). His distinctions include the Lorenz Lecture of the American Geophysical Union (AGU) (San Francisco, USA, 2014) and the Union Plenary Lecture of the International Union of Geodesy and Geophysics (IUGG) (Melbourne, Australia, 2011). He has served as professor of Hydraulics at the Hellenic Army’s Postgraduate School of Technical Education of Officers Engineers (Athens, 2007-10). He has been visiting academic/professor at the Imperial College (London, 1999-2000), Hydrologic Research Center (San Diego, 2005), Georgia Institute of Technology (Atlanta, 2005-06), University of Bologna (2006 & 2019) and Sapienza University of Rome (2008 & 2019).
Careful Judith. If there’s one thing that “skeptics” hate, it’s an appeal to authority. I’m sure there will be massive incoming any second now. Please take cover.
“How lucky we are to have someone commenting here and passing judgment on my blog,”
Thank you for the complement, Ms. Curry: Being honest, without self censorship, is the first step to winning the climate change “battle”.
You are lucky to have more than one commenter who point out that an article by a Professor contradicts the basic climate science consensus ( I estimate a 99.9% consensus) that humans have added a lot of CO2 to the atmosphere.
And I added that a Ph.D. Editor seems to believe the diversity of opinion should include a junk climate science article, while I completely reject junk science as the editor of my own blog (with over 630,000 page views, by the way).
You are lucky that a reader named Mr. Engelbeen spent a lot of time very effectively refuting the article.
The Appeal to Authority logical fallacy you just invoked to defend the author is worthless. It is the Appeal to Authority logical fallacy that is frequently used to defend the climate science consensus — the IPCC predictions of climate doom — and I don’t go for that.
My providing DK’s credentials is not an appeal to authority. I am willing to given anyone with credible credentials a a peer reviewed publication an opportunity to have their paper discussed here, provided it is on a topic that I regard as relevant.
I also provide opportunities for people with no credentials, and that I have no familiarity with, to publish articles here. I am far more selective of such articles (many are submitted to me each week); many have turned out to be excellent contributions and collectively have contributed to several books being written by these authors.
In reading the comments, i do not regard anyone to have stated the irrefutable final word on this issue.
Dear Judith,
My experience with fierce discussions with extreme smart people like Salby, Berry, Harde and several others with a lot of academic titles is that they have a lot of trouble to understand simple things like a household budget or a mass balance…
The basic error in professor Koutsoyiannis work is quite obvious at a very basic level:
If you have a one-way source that delivers twice the amount of CO2 as the increase in the atmosphere, then that is the main cause of the increase, no matter how much the other sources / sinks do circulate over the atmosphere. The other sources are net sinks that remove CO2 out of the atmosphere and can’t be the cause of the increase.
No calculation or graph or assumption or model on this world can beat that fact.
The post has attracted a lot of comments and some useful back and forth that has helped me understand the issues. People who have no scientific skill set sometimes seem a little bit uncomfortable with the discussion and resort to unscientific “consistency” arguments.
Joshua, Your selectivity and bias are very obvious. You I believe have a personal and unhealthy obsession with Judith Curry who is a fine scientist and a believer in open intellectual discussions. You should find a more productive use of your time. There must be other people in your life.
In fact you have a decades long track record here of posting long winded word salads with no technical or scientific content, misrepresenting what others say, and generally obstructing constructive dialogue with your trivia and personal attacks. This is what has gotten you banned at other blogs like Lucia’s.
Dr. Curry,
I think it may be pretty obvious that you should know you’re in trouble when you can’t defend the conclusions of the paper, so you resort to just listing the credentials of the authors. Those of us following the discussion in the comments have asked Demetris Koutsoyiannis several questions to clarify points in his paper, and he can’t answer them satisfactorily. In fact, data he included in his own paper, which he took from the IPCC, show that the carbon budget only balances if virtually all the increase in CO2 comes from human activity.
I’m not sure how a paper that includes its own refutation gets past peer review or why this paper would get selected for promotion here from among all the other papers getting published today that don’t refute themselves. It’s your blog, obviously, and you can do what you want, but this is a bit of a head scratcher.
Judith –
This is just silly. Why do you delete my comments for merely stating the obvious? Should I cry about CENORSHIP! and FREE SPEECH! Are you really that sensitive that you can’t handle a critical viewpoint? Are you really that worried that someone might read a view critical of what you say on your website? Bizarre. Aren’t you a big fan of FREE SPEECH?
Of course you appealed to Demetris’ authority (credentials and qualifications).
There’s nothing inherently fallacious about listing someone’s credentials as a way of reinforcing the validity of their analysis, but that doesn’t changed that you appealed to Demetris’ credentials as a way to reinforce the quality of his.
People can decide for themselves whether your appeal to Denetris’ credentials (authority) was fallacious but you should try to be consistent in your arguments.
If I appealed to Gavin’s credentials as a way to reinforce his disaagreement with Demetris, the cries of outrage would be fast and furious here in your blog.
Joshua, You need to be self aware. The reason his credentials are relevant is that you have no credentials and have never made a single comment with any technical or scientific content. In short, you are a non-scientist politically motivated hack who has no credibility. You are like a mouse biting the toe of an elephant.
Demetris, first, thanks as always for a most fascinating post.
A question. You say:
Gaussian random numbers have no autocorrelation. They don’t depend on what happened before. As a result, their Hurst exponents are ~ 0.5.
Natural datasets, like say average TOA solar reflection, global surface temperature, or average cloud height, do indeed tend to have high autocorrelation. Respectively, the Hurst exponents of those three are 0.71, 0.87, and 0.78 (CERES data).
However, differencing those time series leads to negative correlation. Respectively, the Hurst exponents of the differences of those three are 0.05, 0.22, and 0.11.
If, as you say, “high autocorrelation” (Hurst exponents >> 0.5) causes “spurious results”, wouldn’t negative autocorrelation (Hurst exponents << 0.5) also cause spurious results?
Serious question …
And Dr. Judith, thanks as always for all you do.
w.
Thanks very much, Willis, and nice to hear from you. I will try to reply your question, adding some explanations.
In correlation between two different variables, there is a type of (anti)symmetry. Multiply one of the two by -1, and you have a couple of positively correlated variables. So what we infer for positively correlated variables (e.g. confidence limits) holds also for negatively correlated.
But when we go to AUTOcorrelation, things are fundamentally different. For instance, multiplying a series by -1, you again get a positively autocorrelated series.
A positively autocorrelated series results in increasingly high uncertainty as the Hurst coefficient is increasing (for large time scales). Hence, large Hurst coefficients affect seriously statistical inference.
On the contrary, Hurst coefficients < 0.5 make the uncertainty smaller than in a purely random process.
So, the reply to your question "wouldn’t negative autocorrelation (Hurst exponents << 0.5) also cause spurious results?" is categorically NO.
For further information, you may google my book “Stochastics of Hydroclimatic Extremes – A Cool Look at Risk” and download it — it’s in open access. In particular, see “Digression 3.B: What is dependence in time?” and “Digression 6.J: Does periodicity affect estimation of K-moments?”, Note, negative autocorrelation, else antipersistence, is typically regarded as “quasi-periodicity”–and what is written in Digression 6.J is also valid for negatively autocorrelated processes. The Figure in Digression 3.B may help understanding why negative autocorrelation decreases uncertainty and bias as the time scale increases.
Thanks, Demetris, much appreciated.
w.
I’m impressed by your humility — even in the obvious absence of the politeness gene.
Equation 9 is very problematic, it is a big assumption replacing the long term human contribution via fossil fuels with a bunch of guessed at parameters that appear by magic.
It suggests that CO2 levels will collapse to zero if the temperature drops below 285K, it also suggests CO2 levels will race away if the temperature rises appreciably over 285K. There is not enough analysis or support given for equation 9.
(Furthermore 5 fitted parameters in equation 10 is not parsimonious!)
I’m finding it hard to get past the criticism that you have identified a trailing causality to temperature in the seasonal aspect of CO2 fluctuation, and this does not extrapolate to the long term trend.
James,
Equation (9) is just curve fitting without any physical base…
There is no process on this earth that can deliver 110-120 ppmv CO2/K into the atmosphere.
One can fit the same observed Mauna Loa curve as a simple factor of human emissions, which then is a real cause/effect, but even so just a matter of coincidence:
http://www.ferdinand-engelbeen.be/klimaat/klim_img/acc_co2_1900_cur.jpg
The coincidence is in the fact that human emissions increased linear each year, leading to a slightly quadratic increase in emissions, a similar increase in CO2 level and therefore a similar net sink rate increase.
That makes that there is a rather fixed ratio between increase in the atmosphere and human emissions around 50-55%.
If humans would halve their emissions, the net result in the atmosphere would be some variability around zero trend of CO2.
I have yet to read one paper that proves, applying the published data and thermodynamic principles that the increase in CO2 is the cause the driver of global warming.
Without this, the results of computer model are meaningless. In fact when applied in hindsight and compared to the the average global temperature record since 1880, the differences in outcomes of these models is of the order of 1 (K), the total increase since the early seventies, thus, proving that they are meaningless.
All I have seen is hypotheses and conjecture that since both the average global temperature and the atmospheric concentration of CO2 have risen since the early seventies, therefore, the increasing concentration of CO2 is the driver of the increasing global temperature.
Notwithstanding billions having been spent on the study and research, the tens of thousands of minds brought to bear on this topic, a whole industry arising related to this topic, this has been the state of play for the last 30 years. By now, the clear inference is that the increasing concentration of CO2 cannot be the cause of the increases global temperature.
“All I have seen is hypotheses and conjecture that since both the average global temperature and the atmospheric concentration of CO2 have risen since the early seventies, therefore, the increasing concentration of CO2 is the driver of the increasing global temperature.”
Well, no, there’s some physics involved. Start with Arrhenius (1896).
My comment starts out with the statement “I have yet to read one paper that proves, applying the published data and thermodynamic principles that the increase in CO2 is the cause, the driver of global warming.”
Proof requires the application of physics to the data on changes in the concentration of CO2 to show that the results match the temperature record.
Well, yes, I know that Arrhenius did not prove “that the increase in CO2 is the cause, the driver of global warming”.
If you believe that you can prove, not assume or hypothesize, but prove that, “applying the published data and thermodynamic principles that the increase in CO2 is the cause, the driver of global warming”, please set out this proof.
OK, you want ‘proof’; I’ll settle for the overwhelming consilience of evidence.
The same result is reached when, upon the realization that there is a gaping whole left as a result of the fact that the science cannot prove that the increasing concentration of CO2 alone is the cause of global warming, (an increase of 1(K), requires an increase in heating of 8 w m-2 and the maximum theoretical increase in heating that the 80 ppmv increase in the concentration of CO2 over this period could provide is 1 w m-2 ) requiring the development of wholly unproven assumptions about the positive feedback or multiplier effects of water vapor on the heating of the planet due to the increases in evaporation driven by the increase in the concentration of CO2.
Again, there are no thermodynamic principles set out to support any of these assumptions.
Given that the increasing concentration of CO2 is not the cause of global warming, the debate set out in these comments about the cause or sources of this net increase in the concentration of CO2 and humanity’s contribution to the increase is …..irrelevant.
Perhaps I’ve missed it among the 170+ comments here, but has no one mentioned the isotopic evidence?
The concomitant decrease in atmospheric O2 with increase in CO2 indicates that carbonaceous material is burning.
The concomitant decrease in atmospheric 13C with increase in CO2 indicates that the carbonaceous material is plants.
The concomitant decrease in atmospheric 14C with increase in CO2 indicates that the plants are ancient (fossil).
This evidence, along with the mass balance arguments, unequivocally establish that the dominant source of the current increase in atmospheric CO2 is fossil fuels.
I suppose this could be regarded as a ‘feedback’ from increasing temperature if we were burning all that coal and oil to pump up the air conditioning :-)
fizzy, the first and most important point was the mass balance, but I have provided a link to my comprehensive overview of all evidence that proves that humans are the cause of the increase:
http://www.ferdinand-engelbeen.be/klimaat/co2_origin.html
Moreover, I note, that the focus on global warming has for the most part ignored the massive threat posed by the growth in catastrophic weather, the devastation from which has increased tenfold over this period.
The growing, but still rather limited number of comments on this massive increase in the devastation wrought by catastrophic weather in general opine that, yes, the weather has worsened and go on to state as it were a fact, that this is the result of global warming, offering no proof that and a total failure to explain how, a 0.6% increase in absolute land temperature and a 2% increase in the heating power of land since 1972 can account for the 1,400% increase in near term devastation over this period.
This is the real, massive and immediate existential threat posed by climate change.
What is you evidence that catastrophic weather disasters have increased? Is it perhaps the $$$ value of damages?
There is no evidence that weather is worse because weather has improved with global warming. This is especially true for the US, for which I have data. Not that weather and climate are the same thing, so blaming bad weather on climate change is complete nonsense unsupported by data:
COMING CLIMATE CHANGE CRISIS PROPAGANDA
IS SO EFFECTIVE THAT IT PREVENTS MOST PEOPLE
FROM ENJOYING TODAY’S WONDERFUL CLIMATE.
U.S. HURRICANES MAKING LANDFALL HAVE BEEN IN A DOWNTREND SINCE THE LATE 1800s.
MAJOR US TORNADOES HAVE BEEN IN A DOWNTREND
SINCE THE 1950s.
US HEAT WAVES, DROUGHTS AND FOREST FIRE ACRES BURNED PEAKED IN THE 1930s.
THE 1930s STILL HAVE THE MOST US STATE MAXIMUM HEAT RECORDS OF ANY DECADE, BY FAR.
Yes, annual losses increased by 1,400% in constant dollars, since the seventies, $4 trillion cumulative to date, plus 4 billion left displaced or injured and the loss of 2 million lives.
If pre Taylor Swift is ancient history, then maybe. But if you do some actual research over the last millennium, you’ll see this period doesn’t really stand out.
https://pbs.twimg.com/media/FMhXoEaXIAYb1Yf?format=png&name=900×900
https://wattsupwiththat.files.wordpress.com/2016/10/clip_image0121.jpg
https://pbs.twimg.com/media/Fnktjk2WAAIMjx0?format=jpg&name=small
https://pbs.twimg.com/media/FnktJD0XgAEHZRK?format=png&name=medium
https://pbs.twimg.com/media/FgelXyEXwAEnPfm?format=jpg&name=medium
Sea level rise started 200 years ago. It’s difficult to see much acceleration in the rate.
https://tidesandcurrents.noaa.gov/sltrends/plots/680-140_meantrend.png
https://tidesandcurrents.noaa.gov/sltrends/plots/120-012_meantrend.png
The 1930s heat in the US was quite something.
https://bobtisdale.files.wordpress.com/2016/03/figure-gd-1-10.png
No upward trend in major hurricanes.
https://climatlas.com/tropical/global_major_freq.png
80% of The Alps glacier retreat was completed for the 19th Century by 1875.
https://tc.copernicus.org/articles/12/3311/2018/tc-12-3311-2018.pdf
Losses as % of GDP
https://joannenova.com.au/s3/s3.amazonaws.com/jo.nova/graph/storms/billion-dollar-disasters-storms.png
Decreased trend in severe weather in China
https://www.nature.com/articles/srep42310
Global insured catastrophic loss as % of GDP
https://pbs.twimg.com/media/Floo-WnakAErmEO?format=jpg&name=large
NH droughts more severe 11th to 15th Centuries than 20th C.
https://www.science.org/doi/10.1126/sciadv.1500561
Great Plains drought worse pre 1200
https://www.nature.com/articles/384552a0
In contrast to my respect for you questioning the GHE from the thermodynamic principles (as Gerlich and Tscheuschner do) I’m very astonished about your opinion concerning “the growth in catastrophic weather”. Even the IPCC reports (at least AR5 and AR6) can’t recognize ANY trends! For AR6 see the figure page 1856 of Working Group 1.
Driving your conclusion relying on exploding assurance losses is like claiming nutritional value of bread is greater because as its price has increased three times.
William V.B. – This is the real, massive and immediate existential threat posed by climate change is actually a secondary effect: the push for intermittent energy sources and at the same time the push to change to EVs and generally use electricity for everything fossil do now.
That’s what will bring us down.
Sustainable living powered by fossil fuels and not a solar panel in sight.
https://www.constructionweekonline.com/projects-tenders/saudi-arabias-neom-launches-new-sustainable-tourism-destination-leyja
Hi Jack. I’m sure the rich will enjoy those new “sustainable” buildings that were build with 85 million tons of cement.
Strikes me I do not even recall any major fossil fuel companies (coal or oil) or industry organizations suggesting CO2 increase was not caused by fossil fuels. Very rough generalization- coal industry (decades ago) felt global warming was not bad, whereas oil industry focus (decades ago) was on disputing T rise as result.
I put here my reply to the comment by Robert Cutler, https://judithcurry.com/2023/09/26/causality-and-climate/#comment-993850 , as the structure of the discussion has been perplexed due to the large number (> 200) of comments.
Robert, I really thank you for your effort to find this results and for your comment presenting them. This is really constructive.
I fully understand that you “have concerns about the method” that we developed. This is a normal reaction for newly proposed methods, and, I would say, it is a healthy reaction, because new methods should be scrutinized.
Please allow me to say that, what you call “potential pitfalls of the method”, in our view are strong points. As we write in our post: “A final prominent characteristic of our method is its simplicity. It uses the data per se, rather than involved transformations thereof such as the cross- and auto-correlation functions or their Fourier transforms —the power spectra and cross-spectra. The results are thus more reliable and easier to interpret.” (I hope the graph in the quiz illustrates that.)
Anyhow, I am very glad that your spectral method (despite its pitfalls :-) confirmed our results for frequencies below 1 Year^-1 (period / timescale above 1 year). As you can see in our Table 1, we found somewhat higher lags, up to ~1 year for increased time scales up to 16 years. But this is a minor detail, explainable by the different methodology and the different temperature data set. What is important for causality, in my view, is temporal precedence.
This is my reply to Judith Curry’s comment, https://judithcurry.com/2023/09/26/causality-and-climate/#comment-993831
Thank you so much, Judith, for noticing my CV and presenting my credentials here. To dispel fears that were expressed after your comment, I can reassure them that my humble self is not an authority. Just I was lucky in some respects, in my professional career.
First, being a Greek, I got in contact with ancient Greek thought since my childhood, which was crucial in understanding what science, the scientific method, and their philosophical foundations are. For instance, σαφήνεια (saphenia, hastily translated as clarity), logic, stochastics, climate are concepts founded by ancient Greek thinkers (in my book, in open access in https://www.itia.ntua.gr/2000/, I devote some Digressions to explain these terms and their history).
Second, it happened to become a professional civil engineer and hydrologist. The former helped me to be in continuous contact with reality and be conscious of the risks when I depart from it, as well as to appreciate the value of data vs model outputs. The latter helped me to appreciate the huge uncertainty in Nature and avoid naïve and dangerous deterministic thinking and deterministic approaches.
Third, I was lucky that my colleagues recognized my work and rewarded me.
All these are coincidences as far as my humble self is concerned, who is not an authority. But in a sense I feel some pride to mention here that the greatest authority in explaining Earth’s climate, Milutin Milankovitch, was a civil engineer. Also, an authority in hydrology, Harold Edwin Hurst (whose contribution in understanding uncertainty in climate is most essential, even though, sadly, is not well known to climatologists) was a hydrologist.
One of the important qualities we learn in civil engineering is the respect of time frames and time limits (e.g. all projects have deadlines whose violation destroys you). Another one is the importance of assessing cost vs. benefit. A third one is effectiveness. All these preclude endless processes and even more so endless repetitions of same things.
In this respect, I wish to summarize here my impressions from this discussion.
First, I am glad that all did well with our quiz. Nobody refuted the fact that the data we present show time precedence of temperature changes over [CO2] changes. Moreover, some confirmed our result independently by additional graphs and different analyses. What was questioned is the time scale of the validity of our findings. We insist that this is at least a couple of decades and could be found longer if we had longer data sets–but we don’t. After all, the paleoclimatic data confirm the same causality direction for very large time scales. Is there a mechanism that, at intermediate time scales, magically reverses directionality? Perhaps, but no analysis has shown that. So, I look forward to seeing scientific papers showing the reversal of directionality at intermediate scales. I mean, showing that, based on data and not on imagination and models full of assumptions.
Second, I am glad that our graph on carbon balance, while initially found wrong by some, was eventually confirmed by the same. The graph clearly shows that, in comparison to what happened in 1750, now there are additional emissions of 59.6 Gt C/year, of which 9.4 Gt C/year are due to fossil fuel combustion. (Nb., in a comment above I incorrectly wrote Gt CO2/year; the correct is Gt C/year as correctly shown in the Figure). Even without considering the emissions from fossil fuels, there is a surplus of 50.2 Gt C/year with respect to the 1750 rate. The temperature rise explains this surplus, as shown in our calculations in Appendix 1. The counterarguments presented here, which are based on isolating the total balance into three parts, as well as on the emphasis on that we, humans, are net emitters, do not make sense in my humble view. The Earth works as a whole, includes us in its dynamics, but even before we existed as a species, the Earth used to change the CO2 in the atmosphere by more than an order of magnitude.
Third, nobody presented any argument against our important finding that climate models suggest a causality direction opposite to the real one. Perhaps this should be worrying. Even those who refuse the large-scale applicability of time precedence, but accept the short-scale one (which no one refuted), perhaps could worry. I think this was not discussed in literature before, so I look forward to seeing more scientific papers investigating this issue.
Fourth, I am glad that, by invoking “misinformation” and by suggesting punishment of Judith Curry (deleting her website, etc.) because she hosted our article, some commenters unveiled their real motivation. This is consistent with political agendas which aim to suppress freedom of opinion, expression and scientific inquiry. And here I shall repeat for a second time a part of Carl Sagan’s quotation: “The suppression of uncomfortable ideas may be common in religion and politics, but it is not the path to knowledge”.
All these increased my confidence that we have done our duty as scientists by doing this (fully unfunded) research and by presenting these findings, which are correct and important.
There are a lot of other impressions that are negative and made me sad, but I preferred to focus on those which made me glad.
demetris
“ .. by invoking “misinformation” and by suggesting punishment of Judith Curry (deleting her website, etc.) ..”
This appallingly anti science mentality is ubiquitous in climate science and among its AGW proponents. It’s the only reason I began to research the issue in more depth a decade ago after having accepted the establishment narrative beginning in the 80s.
I applaud your efforts and courage to challenge the orthodoxy. Having the bravery to face a full frontal assault shouldn’t be part of the equation in contemporary climate science, but that is how the dialogue has devolved.
Keep on being a true scientist. History will remember those who are.
Dear Demetris,
Some reaction of mine did not appear, so I fear that you haven’t understood the main problems with your work…
Nobody disputes that temperature variability is the main driver for the year by year CO2 variability around the increase. That is not the point of discussion.
The main problem is that you assume that the short-term CO2 lag over T of the variability (3-4 ppmv/K) around the trend shows that temperature also drives the 90 ppmv trend of CO2 (120 ppmv/K) over the past 60+ years.
That is physically impossible.
Moreover, the observed variability is the variability in net sink rate (not net source rate!) in oceans and vegetation, thus increasingly negative (!), while the CO2 trend in the atmosphere is going up.
See: http://www.ferdinand-engelbeen.be/klimaat/klim_img/acc_decay.jpg
In the upper graph, human emissions and measured increase are plotted, together with the calculated increase of CO2 in the atmosphere, based on the formula of Takahashi for the ocean surface temperatures (based on hundred thousands of seawater samples):
∂ln pCO2/∂T=0.0423/K
The difference between the observed CO2 increase and the sea water pCO2 is what drives the net uptake of CO2 into the oceans
Next part 2.
“Nobody disputes that temperature variability is the main driver for the year by year CO2 variability around the increase.”
I dispute it. Temperature controls the seasonal ramp-up phase, but the draw-down phase is driven by photosynthesis, which operates over a large range of temperatures.
“Moreover, the observed variability is the variability in net sink rate (not net source rate!) in oceans and vegetation, …”
Not so! See particularly Figure 3, and note how the warm 2015-16 El Nino year significantly increased the slope and peak of the ramp-up phase. The draw-down phases are unremarkable in their similarity.
https://wattsupwiththat.com/2021/06/11/contribution-of-anthropogenic-co2-emissions-to-changes-in-atmospheric-concentrations/
Part 2…
The second graph shows the net sink rate caused by the CO2 pressure difference (ΔpCO2) between the atmosphere and the ocean surface (including vegetation, where pCO2 measurements are very difficult). That shows an increasing net sink rate in oceans and vegetation, where the variability around the trend is entirely caused by temperature variability, but the trend is entirely caused by the increasing CO2 pressure in the atmosphere.
Thus indeed, temperature variability modifies the net sink rate, but hardly influences the trend itself, as that depends of the huge CO2 increase in the atmosphere minus a small influence of warmer ocean temperatures.
Your assumption that temperature is the main driver for the CO2 increase in the atmosphere hereby is falsified.
The third graph is the calculated e-fold decay rate for any extra CO2 above equilibrium, not of interest here, but used in discussions with others about the speed of removal of our emissions (as mass: residence time vs. Bern model, both are wrong…).
Further, you still have not answered the basic questions from Mr. Simmons and others and me about the question where human emissions go if temperature/nature was the main driver and where in nature that extra (net) source could be.
That e.g. the carbon cycle in vegetation increased is true, but that is an increasing net sink, not a net source. Looking only at the increase in input(s) is not what one calls a “balance”…
If there was another net extra source, then the increase in the atmosphere would be larger than of human emissions alone…
Demetris –
> Further, you still have not answered the basic questions from Mr. Simmons and others and me about the question where human emissions go if temperature/nature was the main driver and where in nature that extra (net) source could be.
I was looking to see you address that issue. It does seem pretty fundamental to your analysis. I would think you must have already addressed it and I missed it? Perhaps it’s addressed by your statements that human emissions are only 4% of total emissions (and the driving effect of non-human emissions effectively swamp any GHE effect human emissions might have)?
At any rate, could you point to where you already answered this or hopefully, answer it again in simple language a non-expert could understand?
Joshua,
I have spoken to the issue of the overlooked sources. Ferdinand has not addressed it. Apparently you also are reading comments selectively.
Clyde –
Please link your comment or at least give me a string to seerxh for.
I’m not sure that would substitute for Demetris answering the question but itt would be a start.
Clyde, i may have missed your question of “overlooked sources”, but in fact that is completely irrelevant: we don’t need to know anything of any natural source or sink to know the overall performance of all sources and sinks together.
We know human emissions: 5 ppmv +/- 0.25 ppmv per year
We know the increase in the atmosphere: 2.4 +/- 0.2 ppmv
The performance of all natural in/out fluxes then is -2.6 +/- 0.45 ppmv per year. The margin error is probable smaller, but forgot how to calculate a multiple error propagation…
“…, we don’t need to know anything of any natural source or sink to know the overall performance of all sources and sinks together.”
What you are essentially saying is that it does not matter whether the natural fluxes are large or small. The only thing that matters is that the annual increase is about half the anthro’ emissions. I’m afraid I can’t buy that.
Joshua,
https://judithcurry.com/2023/09/26/causality-and-climate/#comment-993797
https://judithcurry.com/2023/09/26/causality-and-climate/#comment-993799
https://judithcurry.com/2023/09/26/causality-and-climate/#comment-993812
I may not come back to this thread, so to continue, catch me on this topic over at WUWT.
Spencer –
Let me see if I understand you correctly. And since I’m not entirely sure what you believe, and I can’t see where Demetris answers certain questions (or can’t understand what he said when he did so) I’ll ask you some questions to hopefully clarify your view and hopefully where it converges or diverges with his theory.
You believe that natural emissions of atmospheric CO2 have increased (more or less) contemporaneously or lagging behind a proportional increase in atmospheric (and presumably ocean) temperatures, and that the increase in atmospheric CO2 is explained by temperature increase. Thus, any warming effect of anthropogenic CO2 emissions is negligible. Is that correct?
So then, what do you think happens to the anthropogenic emissions? Is it just that the warming effect of those emissions is negligible because they are so small compared to the increased atmospheric CO2 emitted from other sources?
And what is it that’s causing the warming? Just natural cycles that haven’t yet been identified? Would you just ssy “unknown” and that it lies beyond the scope of your view to determine a cause?
Oops, sorry. I meant Clyde.
I think you misunderstood “deleting her website”. It was only one commentator who deleted the link to JC’s side on HIS blog from the bookmark list.
Pingback: Causality and Climate • Watts Up With That?
Pingback: Causality and Climate • Watts Up With That? - Lead Right News
Demetris –
It is interesting how often you suggest you’re only a medium, and it’s the data which are speaking. Seems to me that you’re the one speaking about your interpretation of the data. When you say it’s merely the data speaking, and deemphasize that it’s you that are collecting and interpreting the data, then you are effectively making an unfalsifiable (and self-sealing) argument.
https://diagrammonkey.wordpress.com/2023/09/28/let-the-datas-speek/
This is totally irrelevant to the scientific issues Joshua. Why don’t you address the science instead of vague and fallacious irrelevancies.
Joshua,
Your summary of my position is essentially correct. Warming started about 20,000 years ago, and then accelerated about 12,000 years ago. Ocean levels have been increasing almost linearly for about the last 7,000 years, despite warming and cooling episodes. Milankovitch cycles seem to be playing the long game, being modulated by volcanic aerosols. Although, the Maunder Minimum may have reduced insolation for a long time, with the Earth still trying to get back to where it was before sunspots took an extended vacation.
There is a huge reservoir of organic material sequestered in the Tundra, which is releasing CO2/CH4 as it melts, through bacterial decomposition. Also, increased photosynthesis is allowing an increase in global biomass, which means that the annual ramp-up phase of CO2 is growing because the bacteria have more to work with. The ramp-up and draw-down seasonal phases are not symmetrical, with photosynthesis not being able to re-capture all the CO2 emitted in previous Winters. Given enough time, the system may equilibrate, but is currently in a transition state.
clydehspencer wrote:
Ocean levels have been increasing almost linearly for about the last 7,000 year
Sea level rose only about 1 m in the 5000 yr prior to the industrial era. An average of 0.2 mm/yr.
https://en.wikipedia.org/wiki/Early_Holocene_sea_level_rise#/media/File:Post-Glacial_Sea_Level.png
Sea level is now rising at 4+ mm/yr, over 20 times faster.
02
Wrong again. Get some training in understanding science.
https://tidesandcurrents.noaa.gov/sltrends/plots/1612340_meantrend.png
https://tidesandcurrents.noaa.gov/sltrends/plots/680-140_meantrend.png
https://tidesandcurrents.noaa.gov/sltrends/plots/120-012_meantrend.png
https://tidesandcurrents.noaa.gov/sltrends/plots/9410660_meantrend.png
“Sea level is now rising at 4+ mm/yr, over 20 times faster.”
Looking at high temporal resolution sea level for recent times shows that there have been events similarly showing high rates. However, they have declined. It is the same old story of the trend being modulated by ‘noise.’ There is no way of being certain that the current high trend will continue. Past behavior suggests that it won’t.
clydehspencer wrote:
Looking at high temporal resolution sea level for recent times shows that there have been events similarly showing high rates.
When?
There is no way of being certain that the current high trend will continue. Past behavior suggests that it won’t.
No decline in sight. Fundamental physics says there is none in sight. But yet, in 50 years rabbits might rule the world.
Appell
With so much data and so many conclusions pointing to much lower future SLR than feared, it’s time to be cautious rather than rash in our public policy choices.
Acceleration found in these papers, 0.018mm/yr2, Kleinherenbrink 2019; 0.00007/yr2, Parker 2019; 0.009mm/yr2, Church 2011; 0.0042mm/yr2, Wenzel 2014; 0.0128mm/yr2, Houston 2021.
AGW fingerprint too small, errors 2-3mm/yr hemispheric scale Palanisamy 2015. Acceleration hardly detectable Meyssignac 2012. Not significantly different from zero Watson, 2019. Much reduced acceleration, Kleinherenbrink 2019. Negligible acceleration, Boretti 2020. Acceleration uncertainty 0.062, Prandi 2021
Having been at this since attending the celebration of the award of the Nobel Peace Prize to Gore and the IPCC, in 2007, in OSLO, when listening to what wasn’t being said and then doing back of the envelope thermodynamics, I realized that I had been totally taken in by the CO2 is the problem mantra and it is not.
It has taken me over 18,000 hours of independent study to both confirm that and to come to understand what the driver of climate change, both global warming and the real threat, the incredible rate of growth of truly massive catastrophic weather, is….It is the increasing global concentration, 11% global average, from ‘72 to date, of water vapor. This I can prove.
The published data and physics totally support the conclusions set out by Drs. Koutsoyiannis, Onof, Kundzewicz and Christofides and show how climate change, both global warming and the growth of truly massive catastrophic weather can both be limited and best of all, reversed.
On this journey I also came to understand how ridiculously incompetent, many of the climate and CO2 deniers were and naïve, incompetent, ignorant or, while I would like to think not, possibly, conspiratorial, cowardly and callously adherent to the mantra of CO2, many of the faithful for the CO2 is the problem hypothesis, were, (some of the foregoing comments confirm this), notwithstanding the growing massive and truly existential threat of climate change. This is geocentric type thinking of a volume and breadth I would never have dreamt possible.
There are exceptions to this, of course, but I have come across very few.
The only expert I have come across, until now, as knowledgeable, objective and willing to take a stand is the brilliant, courageous Dr. Cook….Dr. Cook, thank you, and now Drs. Koutsoyiannis, Onof, Kundzewicz and Christofides, who luckily all write well and with whom, this 79 year old former rocket scientist and retired lawyer, would love to collaborate.
Sagan could not be more correct – “The suppression of uncomfortable ideas may be common in religion and politics, but it is not the path to knowledge”.
Mr. Van Brunt
Over “18,000 hours of independent study” in the wrong direction just moved you further from the truth.
Weather extremes are NOT increasing.
Water vapor in the troposphere is determined by the temperature of the troposphere — it is a dependent variable — a feedback to changes in troposphere average temperature.
The amount of water vapor in the atmosphere is a consequence of warming rather than a driving force,
The measurements of global average atmospheric water vapor percentage is currently impossible — that’s why scientists guess an average of 2.0% to 3.0%.
There are some compensating effects that breakdown the positive association between atmospheric water vapor and temperature. e.g., convective aggregation leads to more efficient precip processes with warming, and net drying of the atmosphere. This phenomenon is especially effective in the tropics.
“a feedback to changes in troposphere average temperature.”
The word “feedback” means it both acts upon and is acted on.
Yes, and the Sun orbits our Earth.
Is CO2 well mixed in the atmosphere and in what layers? Does CO2 near the tropopause radiate into space or to the surface?
https://earth.nullschool.net/#current/chem/surface/level/overlay=co2sc/equirectangular
https://www.cpc.ncep.noaa.gov/products/stratosphere/strat-trop/gif_files/time_pres_TEMP_MEAN_ALL_EQ_2022.png
I’m afraid that soon waves of cold air will start coming down from the north.
https://www.cpc.ncep.noaa.gov/products/stratosphere/strat-trop/gif_files/time_pres_HGT_ANOM_ALL_NH_2023.png
Climate science starts with the claim that humans have added a lot of CO2 to the atmosphere since 1850. I estimate 99.9% of scientists would agree.
That agreement includes the most famous “skeptic scientists” such as Richard Lindzen, Willam Happer, Roy Spencer and I had previously thought Judith Curry too. All Ph.D.’s. But the credentials do not matter unless their writing, speaking and editing of their websites, if they manage one, makes sense.
This article is from one of the 0.1% who refuse to believe humans have increased atmospheric CO2 by about 50% since 1850.
That means this author rejects the 99.9% consensus of climate scientists living on our planet … essentially completely rejecting all climate science, similar to the false claims of a few crackpot scientists, led by Ed Berry.
In 25 years of climate science reading, I have never seen a reader (Mr. Engelbeen) whose comments so effectively refuted an article by an author who has impressive credentials, but no common sense.
Humans added a lot of CO2 to the atmosphere. CO2 is a greenhouse gas. The arguments then begin over the effect of more CO2, and sometimes continue over whether more CO2 in the atmosphere is good news or bad news.
The author here embarrasses himself by claiming humans did not add a lot of CO2 to the atmosphere. The web owner embarrasses herself by publishing this article.
What we learned here is that credentials and Ph.D. degrees do not guarantee common sense, BUT junk science articles like this one do lead to a lot of comments and page views.
Richard Greene
Bingham Farms, Michigan
… where we celebrate global warming,
and our plants love more CO2 in the atmosphere. We don’t need Ph.D. scientists or climate computer games to tell us what to believe about the climate that we live in.
https://honestclimatescience.blogspot.com/
” I estimate 99.9% of scientists would agree.”
Science is not about authority or consensus.
“Why 100? If I were wrong, one would have been enough. [In response to the book “Hundred Authors Against Einstein”]”
“This article is from one of the 0.1% who refuse to believe humans have increased atmospheric CO2 by about 50% since 1850.”
You have misunderstood the premise of the paper. The author makes no such claim, and nor does Dr Curry.
The premise about causality. Since temperature leads CO2 changes on all time scales then the causality between global warming and CO2 as it typically understood is wrong. This actually isn’t new, there are plenty of papers that show this, but this is a new and more robust way, using IPCC approved data sets.
That means that CO2 should be treated as a feedback not a forcing. For some context, global temps were around what they are today during the medieval warm period, and CO2 levels according to multiple high resolution proxy reconstructions were as much as 380-390ppm. Ice cores do not show these excursions for a number of reasons but primarily because their resolution is on millennial scales and not decadal.
Humans ARE a net source of CO2, but the carbon cycle is extremely complex. The biosphere is both source and sink and these are not always in balance. Processes that release carbon are more temperature dependent than processes that fix it, so the biosphere will suck more CO2 out of the air during cooler periods, regardless of where it came from. During warmer periods, bacteria and fungus break down biota to release CO2, CH4, and H2O faster than the biosphere can suck it out of the air. If there is more CO2 available, then the transient biosphere can expand to a larger sizer and faster, so the relationship is non-linear.
CO2 is a feedback when changes in ocean temperature, from any cause, change the ocean / atmosphere CO2 ratio as explained many times by Mr. Engelbeen.
CO2 is a forcing when humans burn hydrocarbon fuels and add a lot of CO2 to the atmosphere. Also explained by Mr Engelbeen multiple times.
These are two different processes that happen at the same time.
The rise of ocean temperatures since 1850 added a small amount of CO2 to the atmosphere. If humans had not added more CO2 to the atmosphere since 1850, plants would have absorbed all of the small CO2 increase from the small amount of ocean warming.
So why did the atmospheric CO2 increase by 140ppm since 1850?
Simple common sense: Because humans added +200 to +250ppm of CO2 to the atmosphere. There is no other source of the added CO2. And at least 99.9% of scientists have agreed with that claim for over 50 years.
The estimated 0.1% who disagree are claiming 100% of consensus science is completely wrong, and they are right. Not 90% wrong. Not 99% wrong. But 100% wrong. Does anyone with common sense really believe the most basic claim of climate science — humans added a lot of CO2 to the atmosphere in the past two centuries – is 100% wrong?
There appears to be one author here who does, one blog owner who does by supporting that author, and several commenters too.
That basic climate science denial is why conservatives will lose the worthwhile battle to refute predictions of CAGW.
When the conservative argument starts with ‘humans did not cause the large CO2 increase since 1850’, we conservatives automatically lose the debate. Impressive credentials do not predict common sense.
Just where is that +200 to +250ppm of human CO2 emissions hiding if not in the atmosphere?
And how could a one degree C. warming of the oceans possibly cause atmospheric CO2 to increase +140ppm?
Temperature leads CO2 in the ice core era before manmadeCO2 emissions existed.
Manmade CO2 emissions lead temperature in the era of burning hydrocarbon fuels.
Science denial is a mental disease.
“So why did the atmospheric CO2 increase by 140ppm since 1850?”
Because the earth warmed.
That warming started LONG before human emissions could be responsible for it.
(Incidentally – I am not conservative. I am left-leaning in my politics, but it has no bearing on the logic, reason and evidence presented here).
The issue here is causality. You cannot claim causality, that CO2 CAUSED the earth to warm, if the warming started BEFORE the rise in CO2.
THAT is simple common sense.
Excepting ENSO, the oceans are not the largest part of the carbon cycle, the land is, especially the Northern Hemisphere.
” There is no other source of the added CO2.”
Yes there is.
The source is the Carbon that has been trapped by processes that fix it over the eons. This in fact is how we have fossil fuels to burn!!
The residence time carbon in soils varies greatly between environments. It can be from a few years to 250 years. There is transient release of CO2, say from deciduous foliage, and there is longer term release of CO2 from larger organisms such as dead trees, or most importantly the soil. The warmer (and also to an extent the wetter) conditions are the FASTER the release of CO2.
Are you saying that processes that cause organic matter to decay are in EXACT balance with processes that fix it (photosynthesis)?
What do you make of the high variability of CO2 from other proxies such as stomata and foraminifera? Given that ice cores are unsuitable for showing resolution of CO2 changes of less than 800 years, these show that the biosphere is able to release and trap CO2 of the same order of magnitude as we are experiencing today. What do you make of that? Where do you think the CO2 came from in those times?
You can look for yourself – this paper is not the only one making this point. It’s long bothered me why this is not discussed. How can CO2 be driving temperature change if temperature change came first?
This is not to say that CO2 does not have warming effect – of course it does, but it should be treated as a feedback NOT a forcing. Human emissions are just a fraction of the sources for CO2, and the biosphere is indifferent to where the CO2 came from.
Agnostic wrote:
The premise about causality. Since temperature leads CO2 changes on all time scales then the causality between global warming and CO2 as it typically understood is wrong.
Again, wrong.
Humans are flooding the atmosphere with CO2. Independently of the temperature.
How does temperature lead CO2 in that case?
No, not wrong. Specifically what did I say was wrong? There is plenty of evidence for this if you are willing to look.
Humans are not “flooding” the atmosphere with CO2. That is just subjective nonsense. We contribute 4-5% of all sources. Sinks of CO2 expand and contract depending partly on temperature and partly on the availability of CO2. This is the reason for past variation of CO2 we see in the proxy record.
“How does temperature lead CO2 in that case?”
Because it does.
Warming began from about from the late 18th, long before human emissions were sufficiently large enough to have an impact atmospheric CO2 or temperatures. CO2 only began to rise significantly from mid-20th C, long after temperature had started to increase.
It really is as simple as that – you can’t claim CO2 CAUSED the warming if the warming started first. You can claim that the warming was enhanced by the extra CO2. That’s a FEEDBACK not a FORCING.
And you see that on ALL timescales where we have adequate data. In ice cores for timescales of millennia, and stomata for timescales of decades/centuries.
Since Ferdinand and others have clearly described the errors in this paper, the comments that follow may amount to duplication and “beating a dead horse”. But perhaps reinforcing and rephrasing some of the contradictions the paper contains may help Demetris and others if they do not yet understand.
1. I have previously cited Ballantyne, et al., 2012: Increase in observed net carbon dioxide uptake by land and oceans during the past 50 years, Nature, vol 488 pp 70-72. doi:10.1038/nature11299. They focus on “net global uptake”, the difference between human emissions and atmospheric CO2 rise or, by carbon conservation, the quantity by which land/sea reservoirs of mobile carbon have increased. Ballantyne documents the increase in this quantity between 1960 and 2010. Their numbers for that entire period are:
Human emissions 350 + 29 PgC (petagrams of carbon)
Atmospheric accumulation 158 + 2 PgC
Net global uptake 192 + 29 PgC
Note that carbon, not CO2, is being tracked, as it is the conserved quantity. Note that arriving at net global uptake by using carbon conservation this way is much more accurate than taking the difference between uncertain estimates of natural absorptions and natural emissions. Our knowledge of net global uptake over this period is good to 15%. (If anyone wishes to dispute that, we can discuss the methods of Ballantyne et al., but I do not think that should be necessary.) Attempts to deny human responsibility for atmospheric CO2 rise with vague statements about “uncertainty in the carbon budget” without doubt misinform. That is not a political statement as Demetris suggests. It is a fact. I have to note that rebutting an argument by calling it “political” is a sign of weakness.
2. The atmosphere (see Mauna Loa), vegetation (see testimonials to the greening effects of CO2), and the oceans (see ocean acidification) all contain more carbon now than they did in 1960. Oil and gas reserves and coal seams within the earth contain less. But we are asked by this paper to conclude that removing that fossil carbon from the earth and burning it is not the reason other carbon reservoirs have increased. Nonsense.
3. I agree with the Demitris‘ approach of treating the whole system together. Some (e.g. Harde and Salby) have gotten in trouble by analyzing “human carbon” and “natural carbon” separately. I also agree that “causality” in complex systems is tricky. Ballantyne et al. see an approximately linear increase, decade by decade, in net global uptake. But they also see fluctuations superposed on that trend, perhaps attributable to volcanic activity. In other words, atmospheric CO2 levels do depend somewhat on natural processes as well as human activity, making it difficult to call 100% of the industrial age increase anthropogenic (though I have done that elsewhere myself). Still, there can be no doubt that the dominant cause of long-term atmospheric CO2 rise in our era is fossil fuel burning.
4. Sadly, however strong a case is made against this paper, from experience I have little hope that it will be retracted. That is the divided world we live in.
“Our knowledge of net global uptake over this period is good to 15%.”
How do you justify making such an assertion when no one has mentioned what is happening in the Arctic, the NASA observation of ‘greening,’ and the utterly unknown situation of submarine volcanic emissions?
How do you propose to identify and dismiss spurious correlations?
Clyde as said elsewhere, we do not need any natural flow for the carbon balance: that is exactly known from human emissions minus increase in the atmosphere: that is exactly what nature did in the same year: always more sink than source in the past 60 years…
David, one of the problems with Demetris’approach is that he doesn;t include the whole system: he is looking only at the input side and forgot to account for the output side…
Even if one looks at the whole picture, it is clear that his “temperature cause” is wrong:
Take all human emissions away at once, and suddenly the whole system is a net sink of (first year) 5.1 GtC, next year a little less etc. back in the direction of the 295 ppmv equilibrium (if that is ever reached is a different discussion…).
Temperature has little to do with the increase as that is only 16 ppmv/K
“Take all human emissions away at once, and suddenly the whole system is a net sink”
I think this has been addressed elsewhere, but it’s worth putting a comment here (since it really is sand in my pants).
It does NOT follow that taking away human contributions would make the “whole system a net sink”. All that it would mean is that the system would expand slightly slower. If temperature is driving warming, then the system increases in size to adapt to available CO2, and were we to have not emitted any CO2, atmospheric concentrations would have still increased, just as they did in pre-industrial times on time scales of centuries and millennia.
We are considering the vast CO2 natural reservoirs (oceans and land), we are considering their vast CO2 content, along with the tiny ~400 ppm CO2 content in the actually very thin atmosphere.
–
At current average global temperature it is the ~400 ppm CO2 content which is in equilibrium interaction with the CO2 natural reservoirs. Or, to say diferently, at current average global temperature, the natural CO2 reservoirs with their mighty CO2 content “support” the ~400 ppm CO2 equilibrium content in earth’s atmosphere.
–
What we observe is that there is a rise in earth’s global temperature.
Also, it is measured, that there is an annual ~2 ppm CO2 content rise in earth’s atmosphere.
And, it is estimated, ~4 ppm CO2 content (as added amounts of CO2 from the fossil fuels burning) is annually added to the earth’s atmosphere.
–
So, we have, from the fossil fuels burning, annually added
~4 ppm CO2, but the annual rise of CO2 is ~2 ppm.
–
It is the 400 ppm which are actually being “supported” by natural reservoirs.
The average global temperature rise is the cause of that
~2 ppm CO2 rise in earth’s atmosphere, and not the fossil fuels burning.
–
https://www.cristos-vournas.com
Christos,
For the current ocean surface temperature, the equilibrium CO2 level in the atmosphere would be 295 ppmv per Henry’s law. Not 400 ppmv. Quantities play no role at all, only CO2 pressure (differences) at the ocean surface and in the atmosphere.
Shake a 0.5, 1 or 1.5 liter bottle of Coke from the same batch and you will find about the same CO2 pressure under the screw cap…
Ferdinant,
“Clyde, i may have missed your question of “overlooked sources”, but in fact that is completely irrelevant: we don’t need to know anything of any natural source or sink to know the overall performance of all sources and sinks together.
We know human emissions: 5 ppmv +/- 0.25 ppmv per year
We know the increase in the atmosphere: 2.4 +/- 0.2 ppmv
The performance of all natural in/out fluxes then is -2.6 +/- 0.45 ppmv per year. The margin error is probable smaller, but forgot how to calculate a multiple error propagation…”
–
Your’s above comment is a perfect description of how exactly about the CO2 performance out there the things are…
–
You also said
“For the current ocean surface temperature, the equilibrium CO2 level in the atmosphere would be 295 ppmv per Henry’s law. Not 400 ppmv. Quantities play no role at all, only CO2 pressure (differences) at the ocean surface and in the atmosphere.”
–
Well, of course the CO2 partial pressure in the atmosphere is one of the factors, another one is the temperature. Those are some of the major contributing factors in regulating the equilibrium CO2 level in the atmosphere…
–
The GLOBAL equilibrium level in the atmosphere is 400 ppmv.
On the other hand, Henry’s law has to do with the gases/liquid equilibrium in a closed volume.
–
Atmospheric CO2 equilibrium with oceanic waters has similar dependencies as Henry’s law, dependencies on CO2 partial pressure in the atmosphere, and on the temperature of the water and the temperature of the atmosphere – to mention few of the major factors.
Henry’s law cannot be applied as it is in the case of GLOBAL atmospheric CO2 equilibrium with oceanic waters.
–
In Henry’s law estimation of “the equilibrium CO2 level in the atmosphere would be 295 ppmv per Henry’s law.” there is only one temperature plays role.
–
In the case of atmospheric CO2 equilibrium with oceanic waters we do not have a fixed average temperature, what actually we are dealing with is a much more complex phenomenon there.
–
That is why I insist “The GLOBAL equilibrium level in the atmosphere is 400 ppmv. ”
–
https://www.cristos-vournas.com
Christos, the equilibrium CO2 level in the atmosphere for the atmosphere – ocean surface equilibrium over the past 800,000 years changed with about 16 ppmv/K over multi-millennia. That is all. 13 ppmv since the LIA, not 135 ppmv.
For the current, area weighted, ocean surface temperature, the pCO2 of the oceans would be 295 μatm (~295 ppmv).
The temperature of the atmosphere plays no role, the CO2 pressure (~415 μatm) is what counts: a difference of ~120 μatm. That is what pushes more CO2 into the oceans than they release.
That is a dynamic equilibrium: some 40 GtC/yr is released by equatorial upwelling waters, some 40 GtC/yr is taken away by sinking waters near the poles. With currently ~2 GtC/yr more uptake than release, caused by the extra CO2 pressure in the atmosphere.
Similarly for vegetation, but the pCO2 in plant leaves is difficult to measure, but the result is known: ~2.5 GtC/year net uptake.
The temperature influence on the pCO2 of seawater is exactly known by the formula of Takahashi, based on hundred thousands of seawater samples:
∂ln pCO2/∂T=0.0423/K
See: http://www.sciencedirect.com/science/article/pii/S0967064502000036
There are enormous differences in sea surface pCO2: between 750 μatm near the equator to 150 μatm near the poles. That gives the release and uptake of CO2 in seawater. At the poles that CO2 sinks with the THC waters into the deep to return ~1000 years later near the equator.
There is no difference in a static pCO2 for a uniform temperature over all oceans or for dynamic real ocean with the same average temperature. A sudden increase of 1 K over the full surface will give the same ~16 ppmv increase in the atmosphere:
http://www.ferdinand-engelbeen.be/klimaat/klim_img/upwelling_temp.jpg
Ferdinand,
“There are enormous differences in sea surface pCO2: between 750 μatm near the equator to 150 μatm near the poles. That gives the release and uptake of CO2 in seawater. At the poles that CO2 sinks with the THC waters into the deep to return ~1000 years later near the equator.”
–
Good.
–
“There is no difference in a static pCO2 for a uniform temperature over all oceans or for dynamic real ocean with the same average temperature.”
–
Ferdinant, are you aplying Henry’s law to “for a uniform temperature over all oceans or for dynamic real ocean with the same average temperature.” ?
–
https://www.cristos-vournas.com
Ferdinand, from the good article you provided :
http://www.sciencedirect.com/science/article/pii/S0967064502000036
–
Here it is what I consider very important:
“Seasonal variation of pCO2 in surface waters
On a global scale, the temperature effect on surface-water pCO2 is similar in magnitude but opposite in direction to the biological effect, in which changes of the total CO2 concentration is the dominant factor. The pCO2 in surface ocean waters doubles for every 16°C temperature increase (∂ln pCO2/∂T=0.0423°C−1, Takahashi et al., 1993). For a parcel of seawater with constant chemical composition, its pCO2 would be increased by a factor of 4 when it is warmed from polar water temperatures of…”
“The pCO2 in surface ocean waters doubles for every 16°C temperature increase (∂ln pCO2/∂T=0.0423°C−1, Takahashi et al., 1993).”
–
Below I reference an important paper from 1974. Maybe it is 50 years old, but it never losses its actuallity!
https://refp.cohlife.org/_carbon_dioxide/Carbon%20dioxide%20in%20water%20and%20seawater_%20the%20solubility%20of%20a%20non-ideal%20gas%20(1974)%20%5B10.1016_0304-4203(74)90015-2%5D%20-%20libgen.li.pdf
https://refp.cohlife.org/_carbon_dioxide/Carbon%20dioxide%20in%20water%20and%20seawater_%20the%20solubility%20of%20a%20non-ideal%20gas%20(1974)%20%5B10.1016_0304-4203(74)90015-2%5D%20-%20libgen.li.pdf
Christos Vournas,
“Ferdinand, are you aplying Henry’s law to “for a uniform temperature over all oceans or for dynamic real ocean with the same average temperature.” ?”
A am applying that for the real oceans, with an enormous difference between pCO2 of the oceans near the poles and at the equator.
If the oceans increase 1°C in temperature everywhere over all oceans, then the local temperatures near the equator would increase from 30°C to 31°C and the local pCO2 of seawater will increase from 750 μatm to app. 766 μatm (by the formula of Takahashi). That makes that the pressure difference of CO2 between ocean surface and atmosphere near the equator will increase from 750 – 415 = 335 μatm to 766 – 415 = 351 μatm.
Because the uptake / release is directly proportional to the pressure difference, that means that the original ~40 GtC/year emissions from the oceans increased to about 42 GtC/year.
The opposite happens near the poles, where the uptake by a warmer ocean surface also reduces with some 4%, initially giving an extra 4 GtC/year out of the ocean imbalance.
The following increase of CO2 in the atmosphere then has the opposite effect: the increasing pCO2 in the atmosphere reduces the pCO2 difference between ocean surface and atmosphere until a new equilibrium is established at about 16 ppmv higher in the atmosphere, exactly the same increase as if the whole ocean surface had the same temperature as one big static sample.
Here in graph form for a sudden increase of 1°C in ocean surface temperatures:
http://www.ferdinand-engelbeen.be/klimaat/klim_img/upwelling_temp.jpg
Ferdinand,
“If the oceans increase 1°C in temperature everywhere over all oceans,”
–
For the oceans to increase 1°C in temperature everywhere over all oceans is impossible.
Ferdinand, you are aplying Henry’s law to “for a uniform temperature over all oceans or for dynamic real ocean with the same average temperature.”
It is impossible.
–
https://www.cristos-vournas.com
Look at the seasonal variation in CO2 in both hemispheres near the surface. Especially pay attention to vegetation in the oceans. Do you really think the magnitude of CO2 added by man is greater than the natural variability? Recall what the oxygen content of the atmosphere was before cyanobacteria took over the oceans?
https://earth.nullschool.net/#2023/08/30/0600Z/chem/surface/level/overlay=co2sc/equirectangular
Human addition indeed is near always larger than the natural variability:
+2.5 ppmv/year emissions
+/- 1 ppmv/year natural variability
+1.5 ppmv for an El Niño years
-1.5 ppmv for the 1991 Pinatubo.
What happens within a year over the seasons is of no interest for the mass balance over a full year, neither what happened in ancient times…
One way to think about this might be to ask yourself what would happen if global climate cooled. As long as the rate of addition of man-made CO2 was constant, I would expect the oceans to absorb a greater proportion of the total CO2 in the atmosphere. The surface layers of the ocean mix with atmosphere pretty well, so the effect might be seen in a few years.
So in this case I would expect the atmospheric concentration of CO2 to go down. More would be absorbed than before the temperature decrease.
The increase in the atmosphere with a constant CO2 addition would go down a little (16 ppmv/K), but still increase until net sinks and human addition are equal.
With a sink rate of 2% of the pCO2 difference and a constant 5 ppmv/year addition, the sinks will reach 5 ppmv/year at 250 ppmv over the current 295 ppmv equilibrium. Thus at 545 ppmv in the atmosphere…
Engelbeen – so if a colder global mean temp would cause a decrease in CO2, then a warming mean would shift the equilibrium between atmosphere and ocean towards the ocean emitting more CO2. Therefore, not all the increase is from humans.
Jim2, I do agree, but the increase caused by temperature is only 13 ppmv since the depth of the LIA, around 1600.
All the rest of the app. 135 ppmv increase is caused bu human emissions, so 90% human, 10% natural. Not reverse (according to Salby, Harde, Berry,…)
jim2,
Agreed: only 10% (13 ppmv) is from warming ocean surfaces, 90% from human emissions…
Below, I am making public my replies to a personal exchange with Ferdinand:
I think I have rebutted all the different critiques ON MY PAPERS. I am not going to reply to critiques on any other issues related to the issue of climate. Please make your critiques SPECIFIC, by quoting phrases in my papers that you think are incorrect. And before it, please read the papers.
For example you say:
> And that would be the cause of the CO2 increase in the atmosphere?
If you read the paper you will see that we write (p. 17): *What is the cause of the modern increase in temperature? Apparently, this question is much more difficult to reply to, as we can no longer attribute everything to any single agent. We do not claim to have the answer to this question, whose study is far beyond the article’s scope. Neither do we believe that mainstream climatic theory, which is focused upon human CO2 emissions as the main cause and regards everything else as feedback of the single main cause, can explain what happened on Earth for 4.5 billion years of changing climate.*
You say:
> What you forgot to mention is that the additional natural sinks also increased, even more than the additional natural sources (amounts not given in your graph, but visually likely).
*So, why you say we forgot it, since you recognize that it is in our graph?
You say
> Nothing of magic, but CO2 is lagging temperature on short (2-3 years) time scales with a CO2/T ratio of 3-4 ppmv/K
> On very large time scales (centuries to multi-millennia) CO2 is lagging T with a ratio of 16 ppmv/K
> Over the recent 170 years the ratio suddenly increased to 110-120 ppmv/K which must be magic, as it is physically impossible that temperature suddenly has a much larger influence on CO2 levels than in shorter ánd longer periods.
> While there is an elephant in the room, human emissions that released twice as much CO2 as measured in the atmosphere…
We have proposed a necessary condition for causality, which is time precedence of the cause over the effect. I hope you accept that necessary condition, am I wrong? We make our inference based on this necessary condition. Your numbers make no reference of time succession. When you find a way to test whether the direction in time is reversed, that will be great. But for now, all this looks to me an unproven conjecture. I hope you can excuse me that, being a Greek, I have to stick to Aristotelian logic.
You also say:
> While there is an elephant in the room, human emissions that released twice as much CO2 as measured in the atmosphere…
If this is the elephant, what is (copying from our paper, p. 25), *a total global increase in the respiration rate of ΔR = 31.6 Gt C/year. This rate, which is a result of natural processes, is 3.4 times greater than the CO2 emission by fossil fuel combustion (9.4 Gt C /year including cement production)*.
Demetris,
On my question what is the cause of the CO2 increase, you answer with what the cause is of the temperature increase, which is not an answer to my question…
Nevertheless:
The answer indeed is in the IPCC graph:
Between 1750 and now, the natural CYCLE (not only the natural releases, also the natural sinks) increased with over 30 GtC/year.
What you forgot is that a balance has two sides: earnings and expenses. In this case, the expenses increased with 5.1 GtC/year MORE than the earnings.
That respiration did grow with 31.6 GtC/year is absolutely irrelevant for the carbon balance: only the difference between the sum of all ins and outs is important.
In detail: both the oceans and vegetation are proven, increasing (!) sinks for CO2, thus these two can’t be cause of the increase in the atmosphere.
It really is that simple…
Then the T-CO2 lead/lag point.
All you have proven is that the 2-3 year CO2 variability in sink (not source!) rate around the net sinks trend (of oceans and vegetation) is caused by temperature variability. Nobody disputes that.
Because the trend of the net sinks in nature is negative with a positive temperature trend, it simply is impossible that temperature is leading the net sink rate. The increasing pressure difference between pCO2 in the atmosphere and the oceans is what increases the net sink rate.
Again the relevant graph:
http://www.ferdinand-engelbeen.be/klimaat/klim_img/dco2_em8.jpg
At last, equation (9) is just curve fitting and has no physical base.
In the same way, one can show that human emissions are for 99% responsible for the increase, just by comparing the trends:
http://www.ferdinand-engelbeen.be/klimaat/klim_img/acc_co2_1900_cur.jpg
Already since 1900 (including ice core CO2 measurements). Need some update for the last decade, but that will not change the curve.
That this is just coincidence is thanks to the fact that human emissions increased slightly quadratic over time (linear in the derivatives)…
Ferdinand Engelbeen.
You wrote: “If humans are not to blame, what is the “other” source (both oceans and vegetation are increasing net sinks) and where resides all that human CO2?”
Don’t you think that subject is beyond the scope of the paper? The chicken and egg problem is the first question that needs to be answered. But if you do want to know what might be driving temperature, I suggest you look here.
https://github.com/bobf34/GlobalWarming/blob/main/hybridmodel.md
You also wrote: “Because the trend of the net sinks in nature is negative with a positive temperature trend, it simply is impossible that temperature is leading the net sink rate. The increasing pressure difference between pCO2 in the atmosphere and the oceans is what increases the net sink rate.”
I suggest you consider my original response to Demetris above. This analysis simply looks at two signals, which could represent anything and asks not only how they are related, but also if they’re related. The fact that the both signals trend up doesn’t prove that they’re related. What I’ve shown is that the co2 signal is related to the temperature signal, and that it lags the temperature signal by six months. Forget sources and sinks. This is a basic fact for these two signals.
https://judithcurry.com/2023/09/26/causality-and-climate/#comment-993850
I know that everyone might not understand my results, so allow me to expand on them here.
First, look at the spectrum of the Mauna Loa CO2 signal.
https://localartist.org/media/MaunaLoaCO2.png
Ignore the largest term near 0 year^-1. That’s the energy of the overall trend, from which it is impossible to tell what leads and what lags. Also ignore the 1 year and 6 month (2 year^-1) oscillations. Those season tones are also not important, and won’t interfere with my results in a frequency-domain analysis. What’s important is the stuff that looks like noise that falls off with frequency. It’s not noise, it’s detail.
Here’s the spectrum again this time I’ve added the spectrum of global temperature. What I want you to notice is that the temperature spectrum looks very similar to the co2 spectrum between 0 and 1 Year^-1. OK, but are they the same?
https://localartist.org/media/co2tempspec.png
The answer is that while they aren’t identical, they do share a common signal. I can see that in the the coherence analysis.
https://localartist.org/media/CO2_Temp_FRF.png
The coherence and spectrum analysis shown here break the signal into smaller chunks and averages the results together. The reason for doing this is that if two signals are uncorrelated, they wont have the same phases over time even if they have the same spectral shape in amplitude. In the frequency response, any uncorrelated signal such as noise goes away with averaging. In the coherence plot, where the signals have something in common the coherence will be remain high. For frequencies where the signals have little commonality, the coherence will decrease with an increase in the number of averages. That’s why I’m showing three results, so we can observe the trends as the number of averages is increased. Unfortunately, with a finite amount of data, I have to use shorter chunks, which results in less frequency resolution.
You might wonder why the delay in the phase response is shown as a sloped line. The reason for this is that a fixed delay represents a different amount of sinusoidal phase depending on frequency. For a 1-year cycle, a six month delay is 180 degrees. For a two-year cycle, the same delay is only 90 degrees.
The bottom line is that the c02 signal lags the temperature signal by six months, and that appears to be true for any interval you might want to consider longer than 1 year, or at least for frequencies lower than 0.75 Year^-1, which is where the coherence starts to drop.
I’ve plotted the Hamming window shape in the coherence plot. That’s to help understand the extent of the large low-frequency spike and sidelobes as frequency resolution changes
For completeness, I’ve recreated the graph, this time using the ln(CO2) and also using a Flattop window, which has very low side lobes. This eliminates any possibility that the analysis was tainted by window leakage.
https://localartist.org/media/CO2_Temp_FRF_ln_flat.png
I’ve also performed the analysis using Northern and Southern temperature data. The 6-month delay result doesn’t change.
“In detail: both the oceans and vegetation are proven, increasing (!) sinks for CO2, thus these two can’t be cause of the increase in the atmosphere.
It really is that simple…”
And ironically, this is exactly where you are wrong. Just because they are increasing as sinks does not mean they cannot be increasing as sources. I think you are too stuck on the idea of a “budget”, it’s a linear view. It’s the “net” thing that is where the misunderstanding is.
The biosphere is indifferent to our contribution. If there is more CO2 available it will expand regardless of where it came from. Temperature increase, particularly in winter, means that more CO2 is released in biodegradation than normal. If it releases more than is fixed during the summer growing season, then atmospheric CO2 levels will increase.
During the growing season, if there is more CO2 available, then the biosphere can grow more vigorously and expand. Some of this is semi-permanently fixed, and some will only fix during the growing season to be available to be released as CO2 during the next winter.
If the humans made no contribution, the atmospheric CO2 would still go up, though perhaps not by as much, just as it did in other warm periods during the holocene. This “budget” idea is what is causing the confusion.
Robert,
I do vaguely remember what frequency analyses does, but never used it, as in my job the focus was on mechanical/chemical problems.
The question to you that I posed somewhere else (lost in all the replies…) is what happens if you have two independent variables: one with a huge slope and zero variability and the other with zero slope and a lot of variability. The dependent variability showing a huge slope and a lot of variability…
That is what happens with CO2 in the atmosphere today.
My impression is that with frequency analyses you will find that there only is a correlation between temperature and CO2 variability and nothing from human emissions for the simple reason that there is hardly any variability in human emissions, only a slope.
Have a look at the real life trends and variability (temperature enhanced with a factor 3.5 to have a similar amplitude as CO2 variability) in the derivatives:
https://www.woodfortrees.org/plot/hadcrut4gl/from:1958.2/mean:12/scale:3.5/derivative/plot/hadcrut4gl/from:1958.2/derivative/trend/plot/esrl-co2/mean:12/derivative/plot/esrl-co2/derivative/trend
Keep in mind that the slope of human emissions is twice the slope of the CO2 increase in the atmosphere…
The answer to the question of what happens to human CO2 and what is the natural source of the CO2 increase as result of the very small T increase over time therefore is quite essential.
Ferdinand
“The question to you that I posed somewhere else (lost in all the replies…) is what happens if you have two independent variables: one with a huge slope and zero variability and the other with zero slope and a lot of variability. The dependent variability showing a huge slope and a lot of variability…”
Allow me to apologize, I didn’t see your question. There is a lot of traffic.
First, here are some new plots with markers and a bit more overlap in the averaging. The ln() function is not used for these.
https://localartist.org/media/CO2_Temp_FRF_global.png
https://localartist.org/media/CO2_Temp_FRF_NH.png
https://localartist.org/media/CO2_Temp_FRF_SH.png
The quick answer to your question is that the trend is captured in the low-frequency peak, and everything to the right of the peak is the non-trend energy. As computed, averaging will reduce the contributions of any signal that is not correlated to the temperature signal — except for the trend. The frequency of the trend is too low.
Here’s the long answer, if anyone’s interested.
The FFT used to compute spectrums maps the time series onto an orthogonal set of sinusoids. If I have a 10-year time record then frequencies of the sinusoids would be 0, 1/10, 2/10, 3/10 … yr^-1
For the data we’re discussing here, the upward trends is not a sinusoid, nor is it even close to being periodic within the dataset. If I didn’t use a window to force periodicity on in, then the trend would map onto a large number of frequencies giving the impression of significant frequency content where there is none. With a window, the long trend maps mostly onto the first few frequencies. That’s the large low-frequency spike in the top plots with an amplitude of almost 40dB. You can think of this as a form of detrending as all of the spectral energy to the right of that spike is faster than the trend.
Now, as to identifying what’s dependent and what’s not, I’ll start by saying that I can’t do that for the overall trend with this analysis, the frequency is too low for cancellation from randomized phases, but I can provide some detail about what’s going on elsewhere.
To keep my discussion as carbon-free as possible, I’m going to talk about a generic system which I’ll describe in the frequency domain as Y(f)=H(f)X(f)+N(f), or more simply Y=HX+N.
For the plots above I chose x(t) as temperature and y(t) as CO2. The top and middle plots are estimates of H. You could describe N as non-temperature related CO2, but it would also include random measurement noise. If n(t) and x(t) are uncorrelated then we can also say that the expected value of NX* is zero where * denotes the complex conjugate operator.
We start by computing the cross spectrum as YX* = (HX+N)X* = HXX*+NX* . If we compute YX* over different time intervals and average the results together, the NX* term in the cross spectrum tends to zero as the number of averages increase.
The H1 estimator of H is average(Gyx)/average(Gxx) and the coherence is computed as |avg(Gyx)|^2/(avg(Gyy)avg(Gxx)). The value of this coherence estimator is that the numerator tends to zero if y(t) and x(t) are uncorrelated, or be low if there is very little x in y. Coherence helps us judge the quality of the H1 estimator.
Looking at any of the three graphics you’ll see that the magnitude of the trend term doesn’t vary. Unfortunately, we can’t use that as evidence of anything. We could as why it’s so big, but we can make the same statement about the peak at 1 yr^-1. More on that below.
The marker at a frequency of 0.3 yr^-1 is relatively stable with averaging at about 3 ppmv/K, and the coherence, while low, is not unreasonably low. This seems to hold out to about 0.5 yr^-1. These frequencies are also where we observe a 6-month lag in CO2.
Things become a bit more interesting for the annual cycle. The amplitude is dropping rapidly with averaging. Without more data we can only guess at where it would settle out. You can see that the coherence is quite a bit lower for the annual cycle than it is for the “noise” below 0.5 yr^-1. There are two ways to interpret this. First there may be uncorrelated energy in N at ~1 yr^-1. Second, H(f) may actually be H(f,t) which randomized the phase of X, e.g. some form of dynamic feedback.
If you look carefully at the NH and SH plots. The coherence is higher at 1 yr^-1 in the NH result. Also, if you compare the drop in magnitude between the left and right plots, you’ll find about an 8 dB drop for the NH, and a 14 dB plot for the SH.
Agnostic wrote:
If the humans made no contribution, the atmospheric CO2 would still go up, though perhaps not by as much, just as it did in other warm periods during the holocene.
Why?
David Appell: “Why?”
I have explained this numerous times, but to reiterate:
Because sources and sinks are coupled interdependent variable reservoirs. One reservoir (sinks) is less temperature dependent than the other (sources), so there is always an imbalance. It’s well known that sinks are expanding and they expanding faster than our contribution – about twice as fast. They are expanding largely because there is more CO2 available, the so called “fertilisation effect”.
The reason is, during warm periods, more CO2 is produced by temperature dependent processes (biodegradation) than is fixed by photosynthetic processes (trees, algae in the oceans etc), thus atmospheric CO2 increases. But when there is more CO2 available, the reservoir that fixes carbon GROWS – it expands – offsetting the increase in CO2 induced by the warmth from biodegradation.
We don’t have to guess at that, we can see it in the paleo record on all timescales. There is plenty of evidence showing fluctuations of 100ppm or more on timescales of less than a century.
Furthermore, there are annual fluctuations of natural sources that are LARGER than the total annual emissions from humans. That means that annual changes to sinks of CO2 are of an order that can adjust to the amount of CO2 that humans emit, it just means the sinks remain larger than they would have been had we not emitted CO2 (about 4% larger). It’s entirely possible that levels of CO2 would have risen to current levels even if we were not emitting CO2. I suspect though, that we HAVE contributed to atmos CO2, but probably only as much as the difference between current levels and levels from prior warm periods such as the MWP…so around 25-30ppm.
Demetris, thank your for your research, publication and participation in this discussion. As you are Greek and also philosophical in your reflections, the dialogue above reminded of your ancestors. I was introduced to their wisdom by an American Philospher, Mortimer Adler. Here are some words from him pertaining to this search for truth.
Knowledge refers to knowing the truth, that is understanding reality independent of the person and his/her ideas. By definition, there is no such thing as “false knowledge.”
When I show you two marbles then add two more marbles and ask you how many marbles there are, the answer is not a matter of opinion. You have no freedom to assert any opinion other than the answer “four”. By the axioms of mathematics we know the true answer to this question.
A great many other issues in human society, politics and culture are matters of opinion, and each is free to hold an opinion different from others. In such cases, the right opinion is usually determined by counting noses with the majority view ruling.
Note that school children are taught right opinions. That is, they are told what their elders and betters have concluded are the right answers to many questions about life and the world. Those children do not yet possess knowledge, because as Socrates well demonstrated, you have knowledge when you have both the right opinion and also know why it is right. Only when you have consulted the evidence and done your own analysis does your opinion serve as knowledge for you, rather than submission to an authority.
Any teacher will tell you it is much easier to teach a student who is ignorant than one who is in error, because the student who is in error on a given point thinks that he knows whereas in fact he does not know. . .It is almost necessary to take the student who is in error and first correct the error before you can teach him. . .The path from ignorance to knowledge is shorter than the path from error to knowledge.
Ron,
Perhaps with your wisdom, you can tell us how to reconcile the contradictions in Demetris’ argument. He agrees that more carbon from anthropogenic sources is going into the atmosphere than stays there. Good. He concedes that land/sea reservoirs are therefore net sinks of mobile carbon. Good. He understands that those of us criticizing his paper consider this the central issue, the “elephant in the room”. Good. But his response is simply to say that gross natural emissions exceed anthropogenic emissions, ignoring natural absorbtion processes which he has conceded are greater! Where does the increased carbon in the oceans, in vegetation, and in the atmosphere come from if not from the depleted fossil fuel reserves and calcum carbonate used in cement production? Demetris is being crushed by the elephant in the room! He needs your help!
Spare us the sarcasm David. As I showed earlier in this thread, changes in CO2 lag changes in temperature on all time scales. It is simple but wrong to explain all the CO2 rise in atmosphere is from the 4% human contribution.
I understand the IPCC takes two things that are measured: monthly atomspheric CO2, and estimates of hydrocarbon emissions calculated from changes in fuel inventories based on assumptions of combustion efficiencies. So it is tempting to claim nothing else matters but those two data.
Back in the day when IPCC was interested in scientific facts, estimates of CO2 natural emissions were more realistic:
https://rclutz.files.wordpress.com/2017/05/co2-natural-emissions.png
Note that insects are estimated to produce up to 10 times what human do. And the variation in oceanic emissions is estimated to be 10 times what humans emit. Those are the elephants in this discussion whose behavior is poorly measured, but considered to be an order of magnitude greater.
Ron,
Thanks for your response. I think we have an opportunity for a “teaching moment” for you, and for Demetris if he is reading. Perhaps also for Dr. Curry.
I did not know that insects may produce up to 10x the CO2 emissions of humans, but I will take your word for it. Let’s think about the carbon in those insect emissions. I am not an entomologist and don’t know if caterpillars exhale CO2, but they surely return carbon to the atmosphere if they get squashed and subsequently decay. Where had that carbon been before? Some would have come from a leaf the caterpillar chewed. The leaf would have pulled carbon out of the atmosphere during photosynthesis, maybe last spring. The atmospheric carbon could have come from many sources, including the caterpillar’s late grandfather. You can see where I am going. The insect emissions are part of the carbon CYCLE, more specifically the “fast carbon cycle”. The insects are part of this cycle, but don’t add any carbon to it. Their carbon “emissions” to the atmosphere are balanced, quite precisely in the long term, by processes like photosynthesis that have removed carbon from the atmosphere.
When you and I eat our breakfasts, exhale, etc. we are like insects: participating in the carbon cycle and not materially changing the amount of carbon in it. But you and I, with some help, do something else that insects don’t do. We dig up and burn fossil fuel carbon that had been sequestered for millions of years, adding it to the fast carbon cycle. This increases carbon in the atmosphere, oceans, and biosphere. It is inappropriate for you to dismiss the anthropogenic contribution as “only 4%”. Demetris makes the same mistake of comparing apples with oranges. New carbon fluxes into the fast carbon cycle from fossil fuel burning and cement production are not the same as carbon fluxes already there.
Your final comment about “poorly measured” natural processes suggests that you have not understood the power of computing “net global uptake”, but I will not repeat in detail my earlier comment here. Indeed total natural emissions and total natural absorptions are both poorly known, but their difference is known quite accurately.
look.
I watched the Fires in Maui, the fires Caused Sparks and Embers.
Now people are arguing that Embers and Sparks Cause Fires!!!!
Imagine that, causes coming before And After Effects.
bottom line you dont need statistics or data to Know
Physics tells you
A increased C02 causes a slowing of the flux out
flux out reduction cause temperature increase.
if your data and stats argue otherwise, you screwed up.
B. increased temperature causes increased C02.
as for figuring out the chicken and egg
you need a Nobel Brain. not a water brain
> if your data and stats argue otherwise, you screwed up.
Data and stats don’t argue. Demetris argues.
Now there’s in interesting study for direction of causality.
The problem is that Demetris doesn’t address the legitimate questions that arise from his calculations:
If humans are not to blame, what is the “other” source (both oceans and vegetation are increasing net sinks) and where resides all that human CO2?
Ferdinand writes: “If humans are not to blame, what is the “other” source (both oceans and vegetation are increasing net sinks) and where resides all that human CO2?”
The same question has to be asked to explain the high variability of CO2 atmospheric concentration prior to industrialisation. The CO2 had to come from somewhere: during the MWP it was as high as 380-390ppm before dropping to 285ppm. During the Bolling-Allerod CO2 increased to as much as 420ppm while temps were actually cooling, a break in the pattern of Temp leading CO2 which holds over all timescales.
The answer is that the biosphere is massively more complex than you are appreciating. You claim that the biosphere is net sink because our emissions are grater than the amount that atmospheric CO2 is rising, but that thinking is too simplistic. It is likely, almost certain given previous periods of warming, that atmospheric CO2 would have risen anyway, but perhaps by not as much, which is our contribution.
The biosphere is expanding because more CO2 is available and is therefore a source as well as a sink. Were we not contributing our share, it would be a net source.
Agnostic,
As far as I know, there is no “high variability” before the industrial revolution in the CO2/T ratio: from ~10 ppmv/K between MWP and LIA, as seen in the high resolution (~20 years) Law Dome ice core and 16 ppmv/K in low resolution (560-600 years) ice cores over the past 800,000 years and up to 2 million years in sediments.
Vegetation had some role, but was not the dominant respondent over glacial/interglacial changes, as there is little change (a few tenths of per mil) in the 13C/12C ratio, which is the main difference between the response of seawater and of the biosphere on temperature changes.
If you refer to e.g. stomata data, these are “proxy’s”, not direct measurements, while ice cores are direct measurements of ancient air, be it from a mix of years, depending of the snow accumulation rate.
Stomata data have some problems: they reflect local CO2 in air, not “background”, as they are influenced by local changes like changes in landscape, also in the main wind direction. Even the main wind direction may have changed in the past in certain periods (MWP vs. LIA).
Thus what is your source of these high CO2 levels?
Ferdinand:
“As far as I know, there is no “high variability” before the industrial revolution in the CO2/T ratio”
And I guess that’s the crux of the problem – you do not know.
Stomata and foraminifera proxies calibrated to air flasks show much much greater variability than ice core data. The problem with ice cores is diffusion, so they do not become fixed until they pass the firn layer which takes decades. As such they are not useful for resolution of <800 years.
Here are some papers showing CO2 levels comparable to today:
https://tinyurl.com/4923z3kn
"CO2 rises somewhat (230-250 ppm) immediatelyafterthe GI-1/GS-1 (Allerød/Younger Dryas) boundary before decreasingabruptly again to values around 200 ppm"
"first to minimum values of 175-190 ppm at theGS-1/Holocene boundary (3.24 depth), before rising sharply to280-300 ppm, and staying at that level through the next 95years….This again indicates a ca 100 ppm rise in CO2 in <100 years"
"which marks a shift from a warmer to a colder climate state, CO2 increases markedly before the boundary and peaks at ca 400-425 ppm before it decreases again and then stabilizes after the boundary into a pattern of lower-amplitude
fluctuations withaverage values of 230-250 ppm during GS-1"
That whole period is absolutely fascinating.
Wagner et al 2004:
"Both records provide independent evidence for rapid CO2 fluctuations on time-scales varying from decades to centuries. While the estimated amplitudes of 20 to 30ppmv in the Q.roburrecordare in good agreement with the fluctuations documented for the Preboreal oscillation and the 8.2kyr event, the maximum change up to 60ppmv estimated in the T. heterophylla record exceeds the other records."
There are dozens like this. Where did all that CO2 come from?
Agnostic,
Please… Stomata data are LOCAL data from trees that grow on soils which respire hundreds of a ppmv each night and remove the same and more during the day.
Local data in modern stations in a rural (!) surrounding, not even in a forest, may show hundreds of a ppmv difference between day and night under inversion. Here an example of Giessen/Germany, where CO2 samples are taken every half hour, compared to the raw (!) data of Barrow, Mauna Lao and South Pole, including all outliers:
http://www.ferdinand-engelbeen.be/klimaat/klim_img/giessen_background.jpg
So why you believe that stomata data are accurate CO2 proxies for global CO2 levels?
They show the local variability of what happens in the main wind direction. For e.g. St. Odiliënberg, South Netherlands, all the changes since the Middle Ages, like more land taken from the sea, from pasture to forests (and reverse). Up to the industrialization today. Even the main wind direction of today or the MWP may have changed in the LIA from SW to East.
As you can see in the above graph: South pole measurements are far more stable, especially over more years and reflect global CO2 levels, not local.
Stomata date have a better resolution, but don’t reflect global CO2 levels. It is that simple…
“So why you believe that stomata data are accurate CO2 proxies for global CO2 levels?”
For the same reason that Mauna Loa is regarded as accurate representation of global CO2 levels: it is considered a well mixed gas in the atmosphere.
In actual fact, it is not AS well mixed as it is supposed, with individual readings from polar regions typically less than for regions closer to the equator.
But stomata and foraminifera (which are made up of shellfish and show similar variability when used as proxies for CO2) are far more useful as proxies for CO2 whatever their short comings because ice cores simply cannot capture resolutions that are meaningful in the context of modern warming and human emissions. Their problems are well documented. They are great for getting a picture of CO2 levels over millennia but they are simply unable to capture short term (approx 100 years or so) variability of atmospheric CO2.
This is constantly ignored in discussions about modern CO2 levels and putting our emissions and CO2 increase into context.
Agnostic wrote:
The CO2 had to come from somewhere: during the MWP it was as high as 380-390ppm before dropping to 285ppm. During the Bolling-Allerod CO2 increased to as much as 420ppm while temps were actually cooling, a break in the pattern of Temp leading CO2 which holds over all timescales.
Source?
Really would like to know.
Agnostic wrote:
Here are some papers showing CO2 levels comparable to today:
https://tinyurl.com/4923z3kn
Where in that paper?
Table 3 Aller0d 3.43 sample depth=343 (m I presume)?
For a mere 0.01 m?
Bølling–Allerød warming?
Proves nothing that is natural about the modern CO2 increase. Where do you suppose the 1.5 GtC that humans have emitted has gone?
Appell: “Where in that paper?”
I quoted directly from the papers so you can do a word search.
“Bølling–Allerød warming?”
The Bolling-Allerod was the period that lead to the Younger Drays when the climate cooled, yet CO2 levels increased. It began with extremely rapid global warming that marked the end of the Older Dryas. It was accompanied by a large spike on CO2, which continued increasing even as the climate cooled, probably a lagged effect of the sudden warmth. According this paper:
https://www.academia.edu/2949675/Stomatal_proxy_record_of_CO2_concentrations_from_the_last_termination_suggests_an_important_role_for_CO2_at_climate_change_transitions?email_work_card=reading-history
…CO2 may have reached as much as 425ppm.
“Proves nothing that is natural about the modern CO2 increase.”
There isn’t good enough data to “prove” anything. What we CAN say, and what the paper that is the topic of this post is showing is that increase in CO2 cannot be driving the warming because the warming started first. It’s not the only paper to have pointed this out.
“Where do you suppose the 1.5 GtC that humans have emitted has gone?”
Into the biosphere. The biosphere expands and contracts depending on temperature and available CO2. That is what it did in the past and there is no evidence supporting that it is no longer happening now.
Agnostic wrote:
What we CAN say, and what the paper that is the topic of this post is showing is that increase in CO2 cannot be driving the warming because the warming started first.
What caused the warming first?
Do you wait for the temperature to increase before you start your car?
No? Then CO2 leads.
Appell: “What caused the warming first?
Very likely the same factors that caused MWP, the Roman Warm Period and the Minoan Warm Period. If I could tell you exactly what they were I’d be up for a Nobel prize.
No? Then CO2 leads.
LOL. You are using an argument from ignorance to re-write reality. Can’t find your left shoe? Therefore left shoes don’t exist.
Regarding the William Nordhaus video presentation, some comments by Ross McKitrick:
“And what would be a climate policy that we could confidently say would be consistent with making people better off around the world over the next 80 years, all things considered?
There aren’t many economists that think about it in that framework. One one of them who does is William D. Nordhaus who won a Nobel Prize in 2018 for his work in climate economics. A lot of the activist crowd were jubilant, thinking finally the economists have noticed climate change. And look at William Nordhaus: He’s an advocate for carbon taxes he won the Nobel Prize.
They don’t want to mention the fact that his modeling work showed that: We should do a bit of mitigation to eliminate some of the lowest value activities that generate greenhouse gas emissions, but otherwise the optimal policy is just to live with it and adapt to it.
And that’s the upshot of his modeling work and it’s been a very robust result over the 20 or so years that he’s been doing this modeling work. And it convinced the profession enough that his papers are in the best journals and he won a Nobel Prize for it.
Yet as I say the implications are lost on people including a lot of people in this climate economics field that you refer to. Who somehow think the fact that William Nordhaus got the Nobel prize in economics means we should all rush to net zero, even though his own analysis would say absolutely not. That result is not defensible and would make us incomparably worse off and be worse than doing nothing; be worse than just ignoring the climate issue altogether and pursuing economic growth.”
Appell asked, “Source?
Really would like to know.”
The elephant in the room with an eerily wiggling trunk is the carbon sequestered in the Tundra. It is a large reservoir of carbon that no one seems to want to acknowledge.
Agnostic wrote:
The CO2 had to come from somewhere: during the MWP it was as high as 380-390ppm before dropping to 285ppm.
Where are these data?????
All of the critiques of Demetis relie on the fract that the NET netural feedback to increasing atmospheric CO2 is negative. The argument being that the human CO2 sources are conter-acted by the the negative feedback resulting in a atomospheric CO2 concentration less than half the extected.
But this argument ignores the influence of temperature on the individual natural sources and sinks. An increase in temperature might very well tent to increase the net natural source of CO2 and
even be more important than the human CO2 source.
Peter,
The temperature influence on CO2 levels is known:
between 3 ppmv/K and 16 ppmv/K, from months to multi-millennia.
Only in the past 170 years, CO2 increased with 110-120 ppmv/K. That is not caused by any known physical process.
Over the same time span humans released some 200 ppmv. If that didn’t cause the bulk of the increase. what then else and where has that gone?
What an interesting article and what a pleasure to read expert people responding to a subject they know well. Good debate and thanks to one of the authors participating and defending their position.
We shouldn’t forget that warm and cold periods have waxed and waned throughout the Holocene without much change in C02 concentrations. That has brought with it periods of substantial greening, as occurred with such peoples as the Romans, whereby Carthage and North Africa was their breadbasket, in contrast to today.
And what is it that’s causing the warming?
–
It is the natural cycles described by Millutin Milankovitch.
–
Only their graphs should be read reversed.
–
https://www.cristos-vournas.com
The Original Milankovitch Cycle states:
“You get an interglacial when the Summer is warm enough to melt the snow that fell during the Winter.
You get a glacial period when there is not enough summer heat to melt the snow. Then each year the thickness of the snow increases until you have new ice sheets.”
–
–
The Reversed Milankovitch Cycle states:
You get an interglacial when Winter on North Hemisphere occurs close to Earth’s Perihelion. The Southern Hemisphers’s vast oceanic waters are tilted towards the sun, when Earth is at its closest to the sun.
Thus, as it occurs in our era, during the North Hemisphere’s warmer Winter, the very much hotter Southern Hemispher’s SUMMER oceanic waters are heavily accumulating, and that is why we observe the current Global Warming.
–
https://www.cristos-vournas.com
Christos, I appreciated your earlier point about all CO2 sources required to support the level of atmospheric concentration at any point in time. Ed Berry made this point in an Epoch Times article in this way.
He explained that when you look at the flow of carbon dioxide—”flow” meaning the carbon moving from one carbon reservoir to another, i.e., through photosynthesis, the eating of plants, and back out through respiration—a 140 ppm constant level requires a continual inflow of 40 ppm per year of carbon dioxide, because, according to the IPCC, carbon dioxide has a turnover time of 3.5 years (meaning carbon dioxide molecules stay in the atmosphere for about 3 1/2 years).
“A level of 280 ppm is twice that—80 ppm of inflow. Now, we’re saying that the inflow of human carbon dioxide is one-third of the total. Even IPCC data says, ‘No, human carbon dioxide inflow is about 5 percent to 7 percent of the total carbon dioxide inflow into the atmosphere,'” he said.
[Today’s level of nearly 420 ppm means that 120 ppm of inflow is required. So that would be 6 ppm of FF (5%) and 114 of natural emissions.
So, to make up for the lack of necessary human-caused carbon dioxide flowing into the atmosphere, the IPCC claims that instead of having a turnover time of 3.5 years, human CO2 stays in the atmosphere for hundreds or even thousands of years.
“[The IPCC is] saying that something is different about human carbon dioxide and that it can’t flow as fast out of the atmosphere as natural carbon dioxide,” Mr. Berry said. “Well, IPCC scientists—when they’ve gone through, what, billions of dollars?—should have asked a simple question: ‘Is a human carbon dioxide molecule exactly identical to a natural carbon dioxide molecule?’ And the answer is yes. Of course!
“Well, if human and natural CO2 molecules are identical, their outflow times must be identical. So, the whole idea where they say it’s in there for hundreds, or thousands, of years, is wrong.”
Ron,
Please! The Epoch Times?!
Of course CO2 molecules from human sources and from natural sources behave the same. This is one of Berry’s standard straw men. Nothing in the simple analysis showing definitively that the combined land/sea carbon reservoir has been a net sink for the last 60 years and longer (but not always in the geological past) assumes “human” and “natural” carbon behave differently.
Atmospheric carbon from whatever source mixes with land/sea carbon on a time scale of about a decade, and that is where Berry, like Harde and Salby and Skrable go wrong. They all focus on the “human carbon” vs “natural carbon” composition of the present atmosphere, and find the “human” part small. That is no surprise, because it has mixed with the much larger land/sea inventories. Mixing prevents the source of atmospheric CO2 growth from being inferred from the present atmosphere’s composition.
But there is indeed a difference between a flux of carbon into the atmosphere from, say, outgassing oceans and a flux of carbon from a coal fire. In the former case, that carbon had only recently been absorbed from the atmosphere. It is part of the fast carbon cycle. It was just passing through and did not add to the inventory of the fast cycle. (If oceans were outgassing ancient carbon, the carbon’s radiocarbon signature would show it.) In the coal burning case, carbon that had been sequstered for millenia is being added to the fast carbon cycle, first to the atmosphere and then distributed to land/sea. It is devoid of radiocarbon. It is the TOTAL carbon in the fast cycle that may take a long time to subside if and when fossil fuel contributions are zeroed out, though exacly how long is disputed. Fossil fuel burning adds to the fast cycle; ocean outgassing does not.
If you want to challenge the consensus, please understand it first, and be cautious about using Ed Berry and the Epoch Times as your authority.
IPCC disagrees with you, why don’t you straighten them out and stop stalking me?
The removal of human-emitted CO2 from the atmosphere by natural processes will take a few hundred thousand years (high confidence). Depending on the RCP scenario considered, about 15 to 40% of emitted CO2 will remain in the atmosphere longer than 1,000 years. This very long time required by sinks to remove anthropogenic CO2 makes climate change caused by elevated CO2 irreversible on human time scale. {Box 6.1} Source: om Chapter 6 Working Group 1 AR5
I’m not surprised by Epoch Times interest in this. So many people are tired of the relentless greenhouse gaslighting, they will look far and wide for some straight talk.
Ron,
OK, you got me. Replace “human-emitted carbon “ with “carbon inventories raised by human emissions “ and everyone is happy.
Yes, I am picking on you to see if I can find one contrarian capable of understanding, or willing to admit understanding, that simple elephant in the room argument which I won’t repeat. Guess I will have to look elsewhere.
Ron,
“Ed Berry made this point in an Epoch Times article in this way.
He explained that when you look at the flow of carbon dioxide—”flow” meaning the carbon moving from one carbon reservoir to another, i.e., through photosynthesis, the eating of plants, and back out through respiration—a 140 ppm constant level requires a continual inflow of 40 ppm per year of carbon dioxide, because, according to the IPCC, carbon dioxide has a turnover time of 3.5 years (meaning carbon dioxide molecules stay in the atmosphere for about 3 1/2 years).”
–
Ron, here it is what I think about it:
The GLOBAL equilibrium level in the atmosphere is 400 ppmv.
On the other hand, Henry’s law has to do with the gases/liquid equilibrium in a closed volume.
–
Atmospheric CO2 equilibrium with oceanic waters has similar dependencies as Henry’s law, dependencies on CO2 partial pressure in the atmosphere, and on the temperature of the water and the temperature of the atmosphere – to mention few of the major factors.
Henry’s law cannot be applied as it is in the case of GLOBAL atmospheric CO2 equilibrium with oceanic waters.
–
In Henry’s law estimation of “the equilibrium CO2 level in the atmosphere would be 295 ppmv per Henry’s law.” there is only one temperature plays role.
–
In the case of atmospheric CO2 equilibrium with oceanic waters we do not have a fixed average temperature, what actually we are dealing with is a much more complex phenomenon there.
–
That is why I insist “The GLOBAL equilibrium level in the atmosphere is ~400 ppmv. ”
–
https://www.cristos-vournas.com
Ron Clutz wrote:
I’m not surprised by Epoch Times interest in this. So many people are tired of the relentless greenhouse gaslighting, they will look far and wide for some straight talk.
The Epoch Times is a worthless rag:
“The Epoch Times is a far-right[1] international multi-language newspaper and media company affiliated with the Falun Gong new religious movement.”
https://en.wikipedia.org/wiki/The_Epoch_Times
Not surprised Ed Berry wrote for them. He is a sad & deluded man who has turned against all his scientific training in order to serve his personal anger and disillusionment.
Reply to Robert Cutler, https://judithcurry.com/2023/09/26/causality-and-climate/#comment-993975
“The results […] confirm that temperature and co2 are coherent to some degree, and also confirm Demetris’ result that temperature leads co2 by 6 months — at least over the time scales for which we have measured co2 data. […] I ran the experiment again for NH and SH data with the same delay result as for global temperature.”
Thanks so much, Robert. I am happy and grateful for your independent confirmation of our results by a different method. This is something substantial, in line with our view that science should rely on facts manifested in data, rather than imaginative speculations. And you strengthen our conclusions by showing that all data series, whether global or hemispheric, exhibit the same behaviour. This agrees with the result we report for the South Pole.
Furthermore, your remark “at least over the time scales for which we have measured co2 data” agrees with ours (p. 8 of our paper): “Overall, our results in this paper are those allowed by the available data at the time periods and timescales resolved by those data—more than 6 decades at the monthly scale. What would happen at other times—or if the data sets were longer and would resolve intermediate or even longer timescales—we cannot tell. The climate system is too complex to allow for hasty generalizations.”
But those claiming that, for timescales (a) longer than those allowed by the >60 years long instrumental data sets and (b) shorter than those allowed by paleoclimatic proxies, there is a reversal of causality, have to prove that this reversal exists. And to prove it, they not only need to invoke correlation or, even worse, invoke popular narratives. They need to deal with the necessary condition of time precedence of cause from effect.
Thank you for your kind response, Demetris.
For those that might not understand why the phase response is a sloped line, the answer is very simple. A fixed delay represents a different amount of phase shift at different frequencies. For a one-year cycle, six months is a 180 degree phase shift. For a two-year cycle, the same delay is only 90 degrees. For a four-year cycle, the delay is only 45 degrees. The negative slope is because I’ve treated the temperature as the driving function, so the output, co2, is behind by, i.e. negative phase. If the slope had been positive, the temperature would have been driven by co2.
Robert,
I didn’t use any frequency analyses in the past 60 years, as my job had quite different (pure technical/chemical) problems…
But I always wondered what the result would be of a frequency analyses if you have two independent variables, one with a huge slope and zero variability and another with a lot of variability and zero slope, resulting in a dependent variable with a lot of slope and much variability…
In this case:
How can you separate the increase in CO2 between temperature with a very small slope and a lot of variability and human emissions with about twice the slope and hardly any variability?
See: http://www.ferdinand-engelbeen.be/klimaat/klim_img/temp_co2_der.jpg
Thank you Agnostic! I couldn’t say it better than you did in https://judithcurry.com/2023/09/26/causality-and-climate/#comment-993988
Where ocean algae now produce oxygen.
https://earth.nullschool.net/#2023/09/30/1500Z/chem/surface/level/overlay=co2sc/equirectangular
Pingback: Scientifically intriguing? | …and Then There's Physics
Pingback: Scientists agree on the ACTUAL cause of CO2 increase – UK Reloaded
The Paper and your Comment Judith, shows a fundamental misunderstanding of systems analysis and resulting modelling.
A system analysis distinguishes between:
Forcing: The Sun, Burning of fossile fuels
State variables: CO2 in atmosphere, temperature, Cloud cover
Processes: Photosynthesis and respiration, exchange with the ocean.
Some processes are coupled, which e.g. means that CO2 is affecting temperature, and temperature affects CO2 concentrations
“The Paper and your Comment Judith, shows a fundamental misunderstanding of systems analysis and resulting modelling.”
No it doesn’t. It is establishing a causal relationship based on available data. There is no dispute (or discussion) about the radiative effect of CO2, merely that CO2 lags temperature on all timescales so treating it as a forcing for that temperature change is wrong because it causally the wrong way around. TBH, that ought not be controversial but here we are.
Agnostic,
The fundamental error is that the findings are only true for the lead/lag of the variability around the trend, but completely wrong for the trend itself:
All the variability is in the net sink (not source!) rate of CO2 into nature, while sinks are increasingly negative and temperature is slightly increasing over the same time 60+ years time span…
Thus temperature is NOT the cause of the increase.
“All the variability is in the net sink (not source!) rate of CO2 into nature, while sinks are increasingly negative and temperature is slightly increasing over the same time 60+ years time span…
Thus temperature is NOT the cause of the increase.”
No – this is where you are completely wrong.
The source is ALSO variable. Highly variable. The sinks which you describe as “variable” are ALSO sources, they are interdependent and non-linear in their relationship.
During the growing season, some of the growth fixed via photosynthesis is trapped and some decays during the winter. How much decays is predominantly temperature dependent. The is why you see CO2 follow temperature on ALL timescales that we reliably measure.
Agnostic,
I did write NET sink rate, it doesn’t matter that the variability is caused by the sinks or the sources or as is mostly the case, by both.
All what matters is that the +/- 1.5 ppmv/year variability indeed is caused by the +/- 0.5°C/year temperature variability, positive with temperature, while the trend in uptake is negative with temperature:
from -0.5 ppmv/year to -2.2 ppmv/year over the past 60+ years while there is a slight positive trend in temperature.
http://www.ferdinand-engelbeen.be/klimaat/klim_img/dco2_em8.jpg
Thus temperature is NOT the cause of the increasing trend in CO2 sinks and by extension, not the cause of the bulk of the increase in the atmosphere, as that is not more than 13 ppmv since the Little Ice Age.
My point is that the authors expand the short-term variability (“noise”) analyses, which are completely right, to the trends, which one may not do, as variability and trends have different causes…
“as that is not more than 13 ppmv since the Little Ice Age.”
That again is where you are wrong. The high resolution records show much greater variability than that – up to 100ppm in some cases, in less than 100 years. If it is possible then it why would that not be possible now?
Thank you for an excellent paper and discussion on something that as been bugging me for years.
People are asking “if not from humans where is the extra CO2 coming from?”
Apart from the argument from ignorance, there is the causality argument which simply cannot be ignored:
– CO2 lags temperature on all timescales we can measure.
Unless you are disputing that, then it has to be understood that CO2 is a feedback not a forcing of the temperature. If previous warm periods showed a corresponding increases in CO2, then the same question has to be asked “where did the CO2 come from and go to?”
https://www.sciencedirect.com/science/article/pii/S016819232300254X
“Soil respiration in terrestrial ecosystems is critical for assessing the net ecosystem carbon (C) balance, because it represents the second largest global C flux (100 Pg C yr−1) between ecosystems and the atmosphere (Bond-Lamberty et al., 2018). This amount is more than 10 times what is currently produced by fossil fuel combustion. Thus, even a small change in soil respiration could substantially affect current changes in atmospheric CO2. Rising atmospheric CO2 levels can enhance the greenhouse effect, likely resulting in global warming. Global warming can substantially stimulate soil respiration, leading to a greater release of CO2 into the atmosphere.”
Additionally, the Carbon cycle is vastly – vastly – more complex than this discussion has touched on or seems to be generally appreciated. It subsumes our contribution.
https://www.ncbi.nlm.nih.gov/pmc/articles/PMC6213238/
Processes that release C into the atmosphere (biodegradation) are far more temperature dependent than processes that fix it (photosynthesis). So there is already a systematic imbalance regardless of anything we do. It is not just a linear “budget”.
During cooler periods, the rate at which CO2 is removed is greater than the rate at which it is released, leading to lowering of CO2 in atmosphere such as LIA. During periods of warmth, especially winter, more CO2 is released than is fixed leading to an increase. But the relationship is not linear.
As more CO2 is available, the transient biosphere expands and grows more vigorously. Some is trapped and some is released at the end of the season. How much is released is dependent on warmth (and to a lesser extent moisture in soils).
We hear the biosphere being described as a “net sink” which is growing because humans emit more C than is remaining in the atmosphere. But it is faulty thinking.
If we did not contribute, then atmosCO2 would still go up, making the biosphere a “net source”. That’s because the biosphere expands and contracts depending on how much CO2 is available and how warm it is. The CO2 comes from trapped sources particularly in the soils, released by increased temperatures which is a much larger overall source than human emissions.
IMO, it is better to think of carbon sources and sinks as dynamic reservoirs that are never perfectly in balance and which have a non-linear relationship with each other. We contribute to the source side, but the biosphere can tell the difference between man’s CO2 and naturally emitted, so characterising it as “budget” is where the confusion arises. The “budget” is always changing in non-linear interdependent way. It is not fixed.
Agnostic:
CP2 lags T over all time scales, except for the past 170 years, where CO2 leads T.
The authors only proved that T variability around the trend leads CO2 variability around the trend and then applied that to the trends itself, which you may never do that, as the cause of the trend is completely different from the cause of the variability…
The short term CO2/T ratio is:
-5 ppmv/K for seasonal variability
3-4 ppmv/K for 2-3 years variability
5-16 ppmv/K for centuries to multi-millennia
110-120 ppmv/K for the past 60-170 years.
The latter is physically impossible and the authors have not supplied a satisfactory answer where that extra CO2 comes from, neither where the 200 ppmv human emissions did go over the same time span.
Then:
“If we did not contribute, then atmosCO2 would still go up, making the biosphere a “net source”.”
Which is impossible: nature is a net sink in ratio to the extra CO2 in the atmosphere. Currently about 120 ppmv above equilibrium, leading to about 2.4 ppmv/year net uptake in oceans and vegetation.
If humans stop any emissions today, the first year, the net sink would remain the same at 2.4 ppmv/year, as the atmospheric level still is 120 ppmv above equilibrium.
The second year, that is 117.6 ppmv and a net sink of 2.35 ppmv/year, etc… until the equilibrium of 295 ppmv gets reached +/- the natural variability around that equilibrium.
The e-fold decay rate is for a linear process and in this case is about 50 years (2%/year of the disturbance) or a half life time around 35 years.
“CP2 lags T over all time scales, except for the past 170 years, where CO2 leads T.”
No it doesn’t:
https://www.woodfortrees.org/plot/esrl-co2/mean:12/scale:0.2/isolate:60/plot/hadcrut4gl/isolate:60/mean:12/from:1961
CO2 lags Temperature an ALL timescales, including modern timescales, hence the questioning of causality of modern CO2 increase and temperature.
The relationship is not perfect though. There are cases where temp has increased and CO2 has not, or even where CO2 has increased and temperatures have fallen. To an undefined amount, it is nearly ALWAYS the case that temp leads CO2, and that includes the last 170 years. I have not seen reliable data that supports that conclusion.
“The latter is physically impossible and the authors have not supplied a satisfactory answer where that extra CO2 comes from, neither where the 200 ppmv human emissions did go over the same time span.”
They do not have to.
They are showing that the causality implies it is temperature that causes CO2 to change.
Ferdinand you have to grapple with this, you can’t just ignore it. Statisticians will tell you in detrended data, you can’t claim something is causing something else if the changes occur after it. These guys are not the only ones to say this.
https://tinyurl.com/993xu7jf
“The maximum positive correlation between CO2 and temperature is found for CO2 lagging 11–12 months in relation to global sea surface temperature, 9.5–10 months to global surface air temperature, and about 9 months to global lower troposphere temperature”
On top of that, there are plenty of stomata and foraminifera proxy’s showing high atmospheric CO2 variability in warm periods during the holocene, with CO2 levels comparable to today. Where did the CO2 during THOSE periods come from?
Agnostic,
You appear to have removed the trend, so your plot does not somehow refute the point that Ferdinand was making:
ATTP: “You appear to have removed the trend, so your plot does not somehow refute the point that Ferdinand was making:”
Yes it does. That’s because you detrend in order to compare other important information, in this case causality. In the detrended data set you can see clearly that changes in temperature are FOLLOWED by changes in CO2.
This occurs over ALL time scales. Yearly, decadal, centennial etc. You can see this in high and low resolution proxy data. Ferdinand is trying to make a distinction between short term fluctuations and long term trends of CO2 and temp. But clearly similar processes involved in the short term processes are involved in longer term ones as well.
We add to the reservoir of carbon sources, which fluctuate in size from year to year, decade to decade, century to century. The sinks ALSO fluctuate at different rates, that’s because they are governed by different processes.
Sources are governed more by temperature than are sinks. It is not a fixed budget.
Yes, this is not a surprise. It is well understood that the variability around the trend is driven by temperature variations (the physical processes are changes to the solubility of CO2 in the oceans and changes to vegetation in the terrestrial biosphere). However, this does not mean that the long-term trend (i.e., the one since about the mid-1800s) is a response to changes in temperature. It is very clear that this long-term trend is a consequence of anthropogenic emissions of CO2.
Agnostic,
Yes it does:
https://www.woodfortrees.org/plot/hadcrut4gl/from:1958.2/mean:12/scale:3.5/derivative/plot/hadcrut4gl/from:1958.2/derivative/trend/plot/esrl-co2/mean:12/derivative/plot/esrl-co2/derivative/trend
In your graph, as ATTP said, you simply removed the trend, so your graph only shows that temperature variability causes the variability in CO2 rate of change (factor 3.5 for ppmv/K), but T is certainly NOT the cause of the CO2 trend since 1958! Neither in the variables, nor in the derivatives.
That is the crux of the matter in this discussion: the whole calculation shows that the variability in CO2 rate of change is caused by temperature rate of change, which nobody disputes, but then applies that to the trend, while there is hardly a trend in temperature (and none in the derivatives) and there is one in CO2 and its derivatives and twice as much in human emissions.
Agnostic,
All what the authors and other statisticians like Humlum have proven is that T variability causes CO2 variability around the CO2 trend, with a maximum of +/- 1.5 ppmv around a 100 ppmv trend.
Nobody did prove that the 100 ppmv trend in the past 60+ years is caused by temperature, as that is physically impossible: there is no known natural source than even can provide such an amount of CO2 in such a short time period (except for a meteor impact).
Natural variability in net sink rate over the past 60+ years was not more than +/- 1% of the natural in/out cycle, which for a bunch of natural processes is a very small variability, but that is what the data show.
Then, you may be convinced that in the past some proxies show the real CO2 variability, while ice cores are “unreliable”.
In reality, ice cores with extreme differences in temperature and accumulation rate (thus resolution), all show the same CO2 levels within +/- 5 ppmv for the same time period. Including an overlap of ~20 years (1958-1978) between the Law Dome ice core and direct measurements at the South Pole:
http://www.ferdinand-engelbeen.be/klimaat/klim_img/law_dome_sp_co2.jpg
Within one ice core the repeatability of CO2 is +/- 1.2 ppmv at the same depth.
Antarctic CO2 measurements show near global CO2 levels and so do ice cores, be it mixed over several (8 to 600) years.
For the MWP, the resolution is about 20 years.
Other “high” measurements are from proxies which show local CO2 levels and have far more problems than ice cores…
Stomata data e.g. are calibrated over the past century against… ice cores, firn and atmospheric data…
If the stomata data show a different average over the time span of the ice core resolution, then the stomata data are wrong and need recalibrated to the ice core data, not the other way out…
BTW, do you have a reference to the high MWP CO2 levels?
If the global temperature increases, the equilibrium point of CO2 exchange between ocean and atmosphere will shift towards CO2 moving from the ocean to atmosphere. This isn’t a binary relation. Most of the CO2 increase may well be from man-generated CO2, but not all of it. Some will come from the ocean.
Jim2,
Indeed the temperature increase of 0.8 K since the depth of the Little Ice Age (depending of which reconstruction you like…) is good for about 13 ppmv increase in the atmosphere. The rest of the 135 ppmv increase comes from human emissions.
Or about 10% natural (temperature), 90% human…
Ferdinand:
“Nobody did prove that the 100 ppmv trend in the past 60+ years is caused by temperature, as that is physically impossible: there is no known natural source than even can provide such an amount of CO2 in such a short time period (except for a meteor impact).”
No that simply isn’t true. There IS a known source, the same source that caused CO2 variability in other epochs. It’s called the biosphere.
The crux of the matter is the notion that there is carbon “budget” which is fixed. It is NOT fixed.
In past epochs CO2 has varied by as much as 100ppm in as little as 100 years. There is plenty of high resolution proxy data to support that.
CO2 lags temperature over ALL time scales INCLUDING centennial scales which is what you are suggesting is different this time around because of emissions. But it is not. Temperatures began to increase BEFORE atmospheric CO2 increased significantly and BEFORE mans contribution could have caused it. Causality is the wrong way around. I’ve long noticed this and it has always bothered me.
Concentrating on soils for the moment, CO2 and methane is produced during degradation of biological matter. There are numerous papers showing different bacterial processes, mesophilic and thermophilic processes.
“Temperature is one of the most important factors affecting microbial growth and biological reactions.”
https://pubmed.ncbi.nlm.nih.gov/15142802/
You will recall that tree rings indicate periods of warmth and are used as a proxy for temperature, but the main reason for that during warm periods there is more CO2 about. Enzymes involved in photosynthesis are also thermophilic but to the extent microbes that break down organic matter are.
There is therefore an imbalance. During COOLER periods, degradation slows MORE than photosynthesis. This traps CO2 and atmos CO2 decreases. This is both a transient effect (seasonal) and long term. The residence time for trapped carbon varies hugely between various environments, from a few years to 250 years.
During warm periods, carbon trapped in soils is released faster than photosynthesis can fix it, and atmospheric CO2 increases. There is dynamic interplay since as the biosphere expands and contracts with viable CO2.
We know for SURE that this happens because those processes has been the source of energy for 200 years of modern civilisation. And you can see it happening on all timescales we can reliably measure.
All that happens with our contribution, is that it causes the (especially transient) biosphere to expand by a little bit more, but were we not emitting CO2, CO2 would still be increasing in line with CO2 increases during warm periods in other periods of the holocene.
To reiterate, the SOURCE for increased carbon is the huge carbon reservoir primarily in soils. It is not a fixed budget – it expands and contracts depending on temperature.
Agnostic,
“No that simply isn’t true. There IS a known source, the same source that caused CO2 variability in other epochs. It’s called the biosphere.
The crux of the matter is the notion that there is carbon “budget” which is fixed. It is NOT fixed.”
I never said that there is a fixed natural carbon “budget”.
All I said is that the whole biosphere is a net increasing sink for CO2. Proven by the oxygen balance:
http://www.bowdoin.edu/~mbattle/papers_posters_and_talks/BenderGBC2005.pdf
See Fig. 7, last page.
Thus whatever bacteria, insects, trees, cows or whatever natural sink or source did do over the past 60 years, the biosphere did absorb more CO2 than it released. Thus NEVER can be the cause of the CO2 increase in the atmosphere, at least not in the past 60 years.
Or by extension the past 170 years, as increasing temperatures over periods more than 3 years mean more plant growth than decay…
The natural CO2 level in the atmosphere for the current average ocean surface temperature would be 295 ppmv with a maximum change of 16 ppmv/K over the past 800,000 years, per Henry’s law. The 415 ppmv as seen in today’s atmosphere is not natural and caused by our ~200 ppmv emissions since 1850.
” never said that there is a fixed natural carbon “budget”.
All I said is that the whole biosphere is a net increasing sink for CO2. Proven by the oxygen balance:”
Biosphere is only a “net sink” because we consider emissions to push that balance “over-budget”. But it is faulty way to think of it. If there were no emissions the biosphere would be a net source.
Ferdinand, the biosphere does not care whether a CO2 is emitted naturally or from human emissions. It expands when it is warm and it contracts when it is cool. Think of the biosphere is an interdependent non-linear system emitting and capturing CO2. We are small player in that. If there is more CO2 about then the biosphere can expand. That is why CO2 is pumped into commercial greenhouses.
The oxygen balance does not prove that emissions caused the CO2 to rise in the atmosphere. All it proves is that the overall carbon cycle is larger – but you would expect that if the system is dynamic, which it is.
I think we need to get away from the idea of a “budget” and using “net” source and sink. It’s the wrong conceptual model. Think of it as a reservoir with in-flows and out-flows moderated by temperature.
Ferdinand, you said: “… there is no known natural source than even can provide such an amount of CO2 in such a short time period …”
Do you have reliable numbers for the emission of CO2 and CH4 from the Tundra?
Ferdinand Engelbeen wrote:
CP2 lags T over all time scales, except for the past 170 years, where CO2 leads T.
CO2 also leads T when it’s independently ejected into the air, like in the PETM via volcanic eruptions.
And like today.
clydehspencer wrote:
Do you have reliable numbers for the emission of CO2 and CH4 from the Tundra?
Do you?
Even a Fermi calculation?
Are you aware of how the atmospheric increase in ratios of C12, c13 and C14 show the added atmospheric CO2 is due to long-buried carbon?
https://en.wikipedia.org/wiki/Suess_effect
https://www.oxfordreference.com/display/10.1093/oi/authority.20110803095556824
If not, get up to speed. 30 years too late. Learn the science before questioning science determined long ago.
It has been a big pleasure to “meet” you here, Agnostic! I appreciate your deep knowledge on the carbon cycle. Even though I am not an expert on that issue, which you are, I believe I can tell the difference between scientific and childish arguments. Also, I can easily discern those who (while accusing Judith for Appeal to Authority) feel to be authorities themselves, so as we have to accept their judgement and statements about “fundamental errors”, “absolutely not caused”, “paper makes no sense”, “pretty obvious … simply wrong” , “be retracted”, “tarnishes the reputation of Ms. Curry”… Without feeling obliged to specify which error they find in the paper and where exactly…
I am particularly glad that you identified the robustness of our method for detecting causality. This was the focus of our method and our papers—not to analyse the carbon cycle. And this is reflected in the structure of the body paper. But in order to address the review comments, we had to add the Appendices and their discussion in the body of the paper (we clearly state that in its Acknowledgements), including that on the carbon cycle. We understood the reviewers’ concerns: The result we found seems weird to most people, as not complying with the official narrative. For this reason, we had to delve into issues which were not included in our initial plan, and try to justify our finding. A finding that, while opposing the popular beliefs, it does not oppose logic. Well, this eventually added value to the paper. And I am so glad that you, a knowledgeable person on carbon cycle, confirms that we did not err in our considerations, analyses and conclusions on that issue.
I learned a lot from your insights, thank you!
PS. Of course, given the lack of arguments against our analyses, I fully understand the clearly stated aims to enforce retraction of our paper(s), as well as the accusations to Judith for triggering the discussion–instead of following the politically correct tactic of silencing or eliminating “nonconforming” scientific views and analyses. This is a sign of intellectual decadence. As we have written in our paper http://dx.doi.org/10.5194/hess-25-2419-2021 (not retracted–yet :-), “Signs of similar decadence are also present in our era, particularly in the Western World, where ideas are being replaced by ideologies and reason by stereotypes of “correctness”.
I have read other similar papers that came to the same conclusion, one in particular by statistician. They were adamant that from a statistical POV you cannot claim causality the way round it is traditionally viewed.
I am NO expert on the carbon cycle, by any means. But it has been bone stuck in my head for a long time because I AM interested in paleoclimatological record. Ice core data is what is generally used to show that CO2 levels are at “unprecedented levels”, yet we know that ice core data is unreliable and too low resolution to speak about short intervals of warming of 300 to 400 years which we appear to be in.
High resolution proxies clearly show similar concentrations of CO2 in the atmosphere to today, yet that is not put into context. Where did THAT CO2 come from?
The other thing that bothers me is the “budget” approach to CO2 as if there was a fixed amount of C that can be released or absorbed yearly. Yet just the tiniest forays into biodegradation and soil hydrology shows how an incredibly complex and interdependent picture it is, and that’s to say nothing of the oceans.
As usual with climate science, conclusions are made to support a narrative or a pre-existing conviction and the complexity be damned.
Then, you are a humble expert (meant one with humility, if my English betrays me), Agnostic! (And, by the way, I appreciate your Greek nickname…).
I second what you said about temporal resolution. I find it interesting that people (including in this thread, if I remember well) compare instrumental data at annual or monthly time scale with paleoclimatic data at a timescale of hundreds or thousands of years as if they were indeed comparable. I have tried to illustrate how misleading this is using data of one of the longest available instrumental time series, that of rainfall in Bologna, using annual and 30-year time scales. If interested, you may see my Figure 4 in the replies to reviewers of Round 1 (Author Response — not included in the paper per se) of my paper “Rethinking climate, climate change, and their relationship with water”, http://dx.doi.org/10.3390/w13060849 (the review archive is available online). After seeing this figure, imagine that the 30-years scale becomes a 1000-year one …
Agnostic,
Even the worst resolution ice cores (Vostok with 600 years resolution) would show an CO2 increase of 135 ppmv in 170 years as a “peak” of near 40 ppmv in the ice core, which would certainly be noticed as abnormal in the 100 ppmv increase over 5.000 years from some 6 K in temperature increase.
There is no such peak in any ice core, while the high resolution Law Dome sees a dip of about 10 ppmv/K at the depth of the LIA around 1600:
http://www.ferdinand-engelbeen.be/klimaat/klim_img/law_dome_1000yr.jpg
If your stance against ice cores is based on what the late Dr. Jaworoski said, here my experience with his remarks:
http://www.ferdinand-engelbeen.be/klimaat/jaworowski.html
Demetris and Agnostic,
Even if there are large differences in resolution between different ice cores and proxies, one item is conserved: the average over any time frame.
If there is a discrepancy in average CO2 level between a 20 year resolution ice core in the MWP and some (near) yearly resolution proxy which shows a much higher or lower CO2 level over any 20 years period, then one of them must be wrong.
Highly probable the proxy, as the ice cores do reflect the real atmospheric average CO2 level over any time frame within +/- 5 ppmv. Here the differences between ice cores with temperature differences between -20°C (Law Dome) and -40°C (South Pole core) and accumulation differences between a few mm per year (South Pole) and 1.2 meter ice equivalent (Law Dome) for the same average gas age over the past 1,000 years, with resolutions between 8 years Law Dome (DE08-1/2) and app. 400 years (South Pole):
http://www.ferdinand-engelbeen.be/klimaat/klim_img/antarctic_cores_001kyr_large.jpg
Ferdinand:
There is plenty of evidence showing much higher variability of CO2 levels on the scale of what we are seeing today relative to ice cores. They are useful for timescales of millennia but not so great time scales of centuries. The problems are well documented.
“If there is a discrepancy in average CO2 level between a 20 year resolution ice core in the MWP and some (near) yearly resolution proxy which shows a much higher or lower CO2 level over any 20 years period, then one of them must be wrong.”
Not exactly. 20 year period is much too short. Even Law Dome, which is the highest resolution ice core, the firn layer is not reached until 90 years. Then there is the problem of diffusion, essentially acting as a low pass filter for any fluctuations of a scale of centuries.
The reason they are favoured is that they are contiguous, and stomatal proxies are not. But there is good agreement between the various stomatal and foraminifera CO2 proxies and they show very high variance, over short timescales of 100 years or so. The stomatal evidence for MWP show that CO2 reached a peak of up to 390ppm (some show over 400ppm) just as the LIA was getting under way and it fell from around 1500 to early 20th C. This again is temp leading CO2 not the other way around.
NB…all this is not to suggest that man has not had some influence on CO2 levels since industrialisation. It’s just my speculation but I think we might have been responsible for the difference between the peak following the MWP and current levels, so perhaps 20-30ppm. All I am saying is:
– high resolution proxies show atmospheric CO2 variance similar to current in previous ages
– there is no reason to suppose those processes are not at work today
– causality is almost ALWAYS temp leading CO2 on ALL time scales including since industrialisation. Warming began long before CO2 really increased.
– the carbon cycle is interdependent non-linear system that can be characterised as a reservoir rather than a limited budget. Carbon is trapped during cool periods and released in warm periods as per the proxy record.
– the paper under discussion is ONLY showing that causality is the wrong way around for emissions to be driving warming.
Agnostic …
> IMO, it is better to think of carbon sources and sinks as dynamic reservoirs that are never perfectly in balance and which have a non-linear relationship with each other.
Good point. Thanks.
I agree that this has been an interesting discussion that has expanded my viewpoints of the climate system, regardless of who is correct on each specific point.
What’s a forcing? IMO it’s a variable external to the system that can impact the system’s equilibrium, for example Milankovitch cycles. But even here the orbital influence can vary depending upon the system’s state, like whether the perihelion is in the southern or northern hemisphere winter, or how much ice albedo exists at that particular moment, or how thick the glacier is, or the altitude the glacier reaches to, or global conveyor, and other variables. We think of fossil fuel as a forcing because the source of the carbon was outside the system until humans dug it up. But even if we grant CO2’s radiative effects CO2 does not account for temperature swings in the Holocene, and not even of the warming of the last 150 years without assuming inherent positive feedbacks of 1.5X to 3X within the system.
The AGW concerned scientists argue that higher unexplained variability indicates evidence of higher feedbacks and thus higher sensitivity to forcing (like extracting fossil carbon). That could be the case but it also might be that there is simply poorly understood variability. If the establishment truly believed that unexplained variability, like the MWP and LIA, were evidence of higher feedbacks they would be promoting them rather than preferring to erase them.
It’s not accepted that CO2 drove global temperature in the Pleistocene or Holocene before fossil fuels. It is accepted that CO2 lags global temperature, both on the millennial scale, and now we see, on the annual scale. This certainly puts some burden on the AGW consensus to have independent proofs of causation.
Ron Graf commented:
It’s not accepted that CO2 drove global temperature in the Pleistocene or Holocene before fossil fuels. It is accepted that CO2 lags global temperature, both on the millennial scale, and now we see, on the annual scale.
OMG.
CO2 certainly had an effect during the Pleistocene, as a feedback to warming and cooling.
BUT TODAY: we’re pumping CO2 straight into the atmosphere.
We don’t wait for the temperature to increase before we do this.
So in this case, CO2 leads temperature.
It’s so completely obvious and simple, it’s amazing so many people can’t understand it.
David Appel wrote: “CO2 certainly had an effect during the Pleistocene, as a feedback to warming and cooling.”
I am assuming you remember An Inconvenient Truth (2006). That Nobel Prize winning piece of science which claimed that CO2 concentrations could be superimposed onto the ice core chart of the Pleistocene, proving CO2’s control of temperature. Now you are admitting that Sir Al Gore was mistaken and all of the school children worldwide who have been shown the film were misinformed. Is that right? CO2 was just a feedback? Okay, how powerful of a feedback could it be if the surface temperatures had to warm for hundreds of years before CO2 got released from the oceans entering interglacials and conversely glaciation occurred suddenly while CO2 levels remained high for hundreds of years while Henry’s Law slowly went to work to uptake the CO2 in the slowly cooling oceans?
Remember, the more power you assign CO2 to explain the paleo temp chart the less you can assign to ice albedo and water vapor concentration change and other positive feedbacks.
Also, how does CO2 explain the wavy waterslide of the thermometer record compared to the atmospheric CO2 record?
Also, the global temperature and CO2 took a dive ~500 years ago and began to rebound ~330 years ago. Why?
Government funded climate scientists would these questions be erased from discussion. Why?
Below, I am making public my replies to another personal exchange with Ferdinand:
As per your scientific remarks, to avoid repetition I will focus on one I haven’t already discussed. Specifically, you say:
> …variability and trend have different causes…
My reply has four points.
1. Nature exhibits variability. The trend is a human invention. Not a scientific one — and not anything objective: if you change the beginning and ending points, or the mathematical expression, you get another trend. I have not seen a decent definition of a trend which could classify as scientific. The best I have seen is poetic: “A trend is a trend is a trend / But the question is, will it bend? / Will it alter its course / Through some unforeseen force / And come to a premature end?” (Sir Alec Cairncross, 1969, signing as “Stein Age Forecaster”). My coauthor and I have used this “definition” as a motto of our paper: “Projecting the future of rainfall extremes: better classic than trendy”, http://dx.doi.org/10.1016/j.jhydrol.2020.125005
2. In stochastics we may easily get rid of the nonscientific notion of a trend by using varying timescales. And then it enters the scene the Hurst-Kolmogorov stochastic dynamics. I am listing a few papers as an introduction to this behaviour:
— Fig. 1 in my paper “Nonstationarity versus scaling in hydrology”, http://dx.doi.org/10.1016/j.jhydrol.2005.09.022 , explains why we need long data series to make inference and how misleading our models can be, in absence of adequate data.
— My paper Hydrology and Change, http://dx.doi.org/10.1080/02626667.2013.804626 , explains the dominance of change in all natural processes, its different aspects with respect to timescale, and the Hurst-Kolmogorov dynamics–I hope in the simplest possible manner.
— The paper “Nature’s style: Naturally trendy” by the late Tim Cohn and by Harry Lins explains the dramatic impact on statistical inference of the neglect of this stochastic dynamics.
3. Why you claim that variability and trend (whatever the latter is–in my view is also variability at another scale) have different causes? They can well have the same cause. Our paper discussed here, and in particular its Figure 15, proves that they can have the same cause, with the longer term variability described by a function applying to a larger timescale. Notice that this function is also characterized by time precedence of temperature. Also notice that we do not propose this model as a decent one. We clearly say that it is a toy model. It serves our purpose to show that (a) our method can be further advanced in building a model, in addition to identifying causality and (b) the time precedence of temperature can also explain what you call “trend”.
4. We do not present our above toy model as a conclusive one. There is room to explore the data and mechanisms further, and make a better model. But a better model does not mean that we could arbitrarily replace what is seen in the data with arbitrary assumptions. In particular, we should respect the causality direction as given by the data. If you reverse the causality direction at longer time scales, you should first prove, based on data, that such reversal can be justified by the data.
Dear Demetris,
I am not a Greek philosopher, just an engineer who in his (working) life had to do with brilliant people who from time to time needed to put again with their two feet back on the ground.
That being said, here the reactions in four parts…
————————————————————
Item 1. About to trend or not to trend…
You always said “let the data speak”.
Well the (trend (*) through the) data say that in 1960:
Human emissions: 1.2 GtC/year
Increase in the atmosphere: 0.8 GtC/year
Increase in temperature: 0.013°C/year
The data for 2020, 60 years later:
Human emissions: 4.8 GtC/year
Increase in the atmosphere: 2.4 GtC/year
increase in temperature: 0.013°C/year.
In 60 years time a fourfold increase in emissions, a threefold increase in residuals in the atmosphere for exactly the same temperature increase.
How then can the yearly increase in the atmosphere be caused by temperature?
(*) It hardly makes a difference if one uses the exact data from 1960 to 2020 and not the trended data, only there is more temperature induced “noise”:
http://www.ferdinand-engelbeen.be/klimaat/klim_img/dco2_em8.jpg
———————–
You have a point that a trend changes with the choice of a begin- and endpoint.
On the other side: trends can be statistically calculated, including error margins and statistic relevance including how much years is needed to emerge a relevant trend out of the noise.
In this case, the 60 years from 1960 to 2020 are more than enough to show that the trends are relevant…
Ferdinand Engelbeen wrote:
The data for 2020, 60 years later:
Human emissions: 4.8 GtC/year
No, human emissions for 2020 are about 10 GtC.
Getting the data right is a necessary first step in any analysis.
David, indeed, units on the graph were ppmv/year not GtC/year of about half the GtC/year…
Item 2. Trend vs. stochastic.
I fully agree that natural changes are stochastic in the case of short term temperature changes and short, up to very long term for precipitation.
Even for temperature, the (very) long term changes are in large part non-stochastic, but directly influenced by the Milanchovitch cycles. And many other “stochastic” events in temperature as introduced by (deep) ocean oscillations may be caused by calculable events (solar, lunar), only we don’t now the real causes up to know (and there is little research money for that).
And we have human emissions which are quite steadily increasing each year. That is a straight forward trend since 1750, without much variability (even hardly any from Covid). Hardly anything “stochastic” in the trend…
Item 3 doesn’t show up… maybe later?
seems solved… now as duplicates…
Item 3. Different causes.
In the answer to Aubrin ( https://judithcurry.com/2023/09/26/causality-and-climate/#comment-994056 ) I did show that the short term variability in CO2 response to T variability is caused by vegetation. That can be seen in the opposite CO2/d13C changes: vegetation CO2 changes and 13C/12C ratio changes do change in opposite direction when CO2 is taken away or released by vegetation. Here the graph:
http://www.ferdinand-engelbeen.be/klimaat/klim_img/temp_dco2_d13C_mlo.jpg
When temperature changes due to e.g. an El Niño, the Amazon dries out, releasing a lot of CO2. During the Pinatubo eruption, the temperature dropped, but more leaves could take up CO2 due to the scattered sunlight by the aerosols in the stratosphere.
Over longer time frames than a few years, increasing temperatures (and more CO2) increase plant growth, thus plants are not the cause of the CO2 increase over time frames of more than 3 years.
Over very long time frames, hundreds to hundred thousands of years, the 13C/12C ratio of the atmosphere hardly changes, as that is mainly caused by (deep) ocean temperature changes.
And over the past centuries, the human influence is quite visible in the 13C/12C ratio, both in the atmosphere (ice cores, firn, direct) and in ocean surface waters (coralline sponges):
http://www.ferdinand-engelbeen.be/klimaat/klim_img/sponges.jpg
Figure 15 is just curve fitting, which in this case is quite simple as the result is a simple slightly quadratic curve. Only there is an enormous difference in factor: factor 3.5 for short term variability, factor 110 for the 60-year trend. Not really believable
One can fit the increase in the atmosphere as good as a % of human emissions: a factor 0.53 since 1900 fits as nice. And much more plausible…
Item 3.0 Different causes.
In the answer to Aubrin ( https://judithcurry.com/2023/09/26/causality-and-climate/#comment-994056 ) I did show that the short term variability in CO2 response to T variability is caused by vegetation. That can be seen in the opposite CO2/d13C changes: vegetation CO2 changes and 13C/12C ratio changes do change in opposite direction when CO2 is taken away or released by vegetation. Here the graph:
http://www.ferdinand-engelbeen.be/klimaat/klim_img/temp_dco2_d13C_mlo.jpg
When temperature changes due to e.g. an El Niño, the Amazon dries out, releasing a lot of CO2. During the Pinatubo eruption, the temperature dropped, but more leaves could take up CO2 due to the scattered sunlight by the aerosols in the stratosphere.
Over longer time frames than a few years, increasing temperatures (and more CO2) increase plant growth, thus plants are not the cause of the CO2 increase over time frames of more than 3 years.
Item 4.
In a question asked to Robert Cutler, he answers ( https://judithcurry.com/2023/09/26/causality-and-climate/#comment-994045 ) that the signal of human emissions is suppressed by the signals from the temperature variability, because the variability of human emissions is too low.
The method used doesn’t allow for any attribution of the trends…
Thus as I repeatedly said, all what you have proven is that the +/- 3.5 ppmv/K variability around the trend is caused by temperature variability, but that doesn’t imply that the 90 ppmv increase 1960-2020 is caused by temperature.
That is the crux of the matter…
Ferdinand,
You wrote: “In a question asked to Robert Cutler, he answers ( https://judithcurry.com/2023/09/26/causality-and-climate/#comment-994045 ) that the signal of human emissions is suppressed by the signals from the temperature variability, because the variability of human emissions is too low.”
This is factually incorrect. I never attributed the trend to anything. Please correct your statement.
Robert,
I did understand that the “signal” in this case is the variability of both variables, where the strong variability of the temperature suppresses the variability of the near zero variability in human emissions.
Which of course attributes all variability to temperature with a lag.
And that one can’t attribute the trends to one or the other in these circumstances…
Or my question remains the same:
Make a simple mix of two variables yourself: one variable with only a strong trend and no variability, just a straight line.
The other variable with no trend at all and the result of two repeating sinusoids of different length.
Add both variables together with some lag for the sinusoids and then give them the full frequency analysis treatment.
I wonder if the method will recognize that the full trend is from the first variable…
demetriskoutsoyiannis wrote:
The trend is a human invention. Not a scientific one — and not anything objective: if you change the beginning and ending points, or the mathematical expression, you get another trend.
Obviously.
That doesn’t make trends useless. There’s been a strong warming trend since 1975 — almost 50 years. Its uncertainty is reasonably small. It needs to be explained. Manmade GHGs are the only known reason for the warming. Importantly, that’s also the prediction.
David, there was fast warming 1910-1945 hardly any CO2 increase and a slight cooling thereafter 1946-1975 with slightly increasing CO2.
As long as there is no explanation for the first warming and subsequent cooling (and no, aerosols are only a scapegoat), you can’t attribute all warming to CO2 alone…
Ferdinand Engelbeen wrote:
David, there was fast warming 1910-1945 hardly any CO2 increase and a slight cooling thereafter 1946-1975 with slightly increasing CO2.
There is an explanation:
1) increase in solar irradiance
2) clearing out of volcanic dust from 1250-1900
3) increase in CO2: for the early changes in CO2, the radiative forcing is linear, not logarithmic.
ln(C/C0) = ln[(C0+dC)/C0] = ln(1+dC/C0) =appx dC/C0
Ferdinand Engelbeen wrote:
….and a slight cooling thereafter 1946-1975 with slightly increasing CO2.
Come on, this has been discussed into exhaustion — it’s due to the rise in aerosols from vehicle emissions after WW2 and before the adoption of pollution controls on vehicles.
Demetris –
> The trend is a human invention.
Indeed. So is the characterization of what “the data say” when they “speak.”
It would take hundreds of years for the oceans to equilibrate with the added CO2 from burning fossil fuels and this would only remove about 80% of the anthropogenic CO2. The sinks just aren’t there for the increase to be natural even if mathematically possible. There is also an incredible lack of evidence that CO2 is the primary climate driver. So yes, that man is adding CO2 to the atmosphere is pretty solid. That CO2 is driving temperatures isn’t solid at all and that is the real problem since it is that premise that makes our would-be masters want to direct everything in our lives.
Steven,
The 80% removal in equilibrium is what the IPCC’s Bern (and similar) model(s) say.
Fortunately for us, the deep oceans (and vegetation) keep on going to absorb our CO2, practically unrestricted until complete redistribution between all reservoirs at a half life speed of about 35 years.
If all human emissions are distributed in the deep oceans, that would increase the C content there with 1%. In equilibrium with the atmosphere that gets +3 ppmv above the current equilibrium of 295 ppmv, that is all…
The influence of CO2 on temperature indeed is much smaller than the IPCC’s models show…
El Niño is weakening.
http://www.bom.gov.au/archive/oceanography/ocean_anals/IDYOC007/IDYOC007.202310.gif
Pingback: CO2 Fluxes Are Not Like Cash Flows - Climate- Science.press
If light water evaporates faster than heavy water, then heavy water will turn to ice or snow before light water. Does anyone know if that’s accounted for in the ice core records used for temperature?
That’s how they determine temp from ice cores. O18 isotope is higher in layers that correspond to higher temps.
Exactly the point.
Carbon isotope ratios are used as an argument that the atmosphere is changing because of the burning of fossil fuels. However, I haven’t seen any research specifically about isotopic fractionation of out-gassing of CO2 from upwelling seawater, isotopic fractionation of respired CO2 from tree leaves/needles and roots, or selective use of calcium carbonate (calcite/aragonite) by calcifiers. There is a lot we still don’t have numbers for.
Clyde, these are known for the seawater-air and reverse transitions: -10 per mil sea-air and -2 per mil air-sea, resulting in -8 per mil for a CO2 cycle that is in equilibrium.
As the ocean surface is between +1 and +5 per mil (due to organic life), the average in the atmosphere over the whole Holocene is -6.4 +/- 0.2 per mil.
Currently at -10 per mil thanks to human emissions. For vegetation, that is in average -24 per mil, near the same as for the current mix of fossil fuels at -26 per mil and the difference between these two can be seen in the oxygen balance… Then we have carbonates: one type was used as “standard” thus zero per mil: Pee Dee Belemnite (PDB) but nowadays there is fixed standard. Carbonates have about the same isotopic ratio as the surrounding waters, thus around 1-5 per mil.
clydehspencer wrote:
However, I haven’t seen any research specifically about isotopic fractionation of out-gassing of CO2 from upwelling seawater, isotopic fractionation of respired CO2 from tree leaves/needles and roots, or selective use of calcium carbonate (calcite/aragonite) by calcifiers.
That’s a statement about you, not science.
Dr Curry,
The above article addresses the question, “given two processes, how can we determine if one is a potential cause of the other? ”
I respectfully point out that it is coherence (n.b. not corelation) which provides the required determination because an effect cannot occur before its cause. And their coherence indicates that changes to atmospheric CO2 concentration (measured at Mauna Loa since 1958 )follow changes to global temperature. This was first determined by Kuo et al and published in Nature in early 1990.
(ref ‘Coherence established between atmospheric carbon dioxide and global temperature’; Kuo C. Lindberg C & Thomson D; Nature; February 1990
The abstract of their paper says,
“The hypothesis that the increase in atmospheric carbon dioxide is related to observable changes in the climate is tested using modern methods of time-series analysis. The results confirm that average global temperature is increasing, and that temperature and atmospheric carbon dioxide are significantly correlated over the past thirty years. Changes in carbon dioxide content lag those in temperature by five months.”
The finding of Kuo et al. that “Changes in carbon dioxide content lag those in temperature by five months ” is clear, and it induced two groups of follow-up studies by other workers. i.e.
(a) One group confirmed that the CO2 changes lag behind temperature changes but the length of the lag varies with distance from the equator.
(b) The other group also confirmed the coherence but argued that feedbacks in the climate system create the apparent lag of CO2 changes after temperature changes. (I regret that I doubt these arguments because understanding of such feedback mechanisms would enable construction of a time machine similar to that imagined by HG Wells, and there are no reports that members of the group have constructed such machines.)
Richard
Yet this point is already well understood, and doesn’t refute the point that longterm rise in CO2 results in higher surface temperatures. By looking at the shorter timescale (which associates with bigger short term changes in CO2 and temperature, in which temperature causes locally big fluctuations) you miss that those signals aren’t generally cumulative, but the smaller year to year rises due to our emissions build up over time and lead to a positive correlation between CO2 and temperature on the longer timescale.
No, that does not follow.
Longterm rise in CO2 should result in higher surface temperatures as you say, but this “should” be treated as a positive feedback, not a forcing.
Temperatures began to rise from around 1850 and more significantly from early 20th long before human emissions were significant, or CO2 increase in the atmosphere. Causality is the wrong way of you are claiming CO2 is the driver of the increase in temperature.
It’s not true that natural process increasing CO2 in the atmosphere are not cumulative, because the carbon cycle has long term processes and short term transient processes. Residence time for carbon varies hugely from different types of environments, from just a few years to 250 years. Processes that release CO2 from organic matter are more temperature dependent than processes that fix it. During cooler years CO2 is trapped, and warmer years it is released.
As a simple model, imagine a deciduous tree in a field. During the growing season it draws CO2 out of the air and water from the soil and produces foliage and grows slightly. The foliage drops to the ground during autumn and then decays, most of which will return to the atmosphere as CO2 and CH4. But some is fixed in the tree itself.
There is a big storm in winter, and the tree loses a branch. The branch represents years/decades of fixing carbon from the atmosphere, but now it begins the process of decay. It continues to release CO2 for a decade or more, but the rate at which it does this much more dependent on temperature than the processes that trapped it. It’s for this reason that we refrigerate food.
The foliage represent transient short term processes capturing and releasing CO2 into the atmosphere, the branch represents long term processes that release CO2 continuously over decades.
Fixing and releasing of CO2 are two processes that are not in balance, and this occurs over short time periods and long. And we see this in the stomatal record against long term temperature proxy record.
Agnostic
And our burning of gas, oil and coal is just another one of those natural longer term carbon cycles.
Thanks for this important information, Richard!
Demetris
The rise in temperature to 1940 wasn’t monotonic, and it was mostly driven by a big El Niño surface T spike in the early 1940s.
Paul Roundy,
And the relevance of your comment about changes “in the 1940s” is what? As I said, Kuo et al. analysed the measurements at Mauna Loa analysed which did not start until 1958.
Richard Courtney
Thank you for providing the reference to Kua et al. I don’t have access to Nature, but the abstract sounds very much like the approach I used here to validate the results described in this article. The only difference is that I found the delay to be six months, but then I have 30 years of additional data to work with. Perhaps I should stop complaining about the limited length of the datasets!
https://judithcurry.com/2023/09/26/causality-and-climate/#comment-993850
https://judithcurry.com/2023/09/26/causality-and-climate/#comment-994045
The only work that cites the work of Kua ea. is from Kaufmann and Stern (1997) and is titled:
“Evidence for human influence on climate from hemispheric temperature relations”
https://www.nature.com/articles/40332
with full access…
While it is mainly about the precedence of temperature changes between NH and SH, it uses CO2 emissions and sulfate emissions (which are antagonists for any temperature effects).
That ends with:
“This is consistent with the hypothesis that the south-to-north causal order is generated by the historical combination of greenhouse gases and tropospheric sulphates.”
While I doubt the result of any model based on sulfate aerosols, which is largely (ab)used as adjustment control to explain the 1946-1975 dip, the fact that they assume that CO2 influences T, despite the work of KUA e.a. is interesting to investigate further…
Ferdinand Engelbeen,
You assert, “The only work that cites the work of Kua ea. is from Kaufmann and Stern (1997) ”
If that wre true then so what? Kaufmann and Stern (1997) assessed coherence of CO2 changes between NH and SH hemispheres which is not relevant to coherence between CO2 at Mauna Loa and global temperature.
And the references provided in this thread demonstrate your assertion is not true.
Richard Courtney wrote:
Kuo et al and published in Nature in early 1990.
(ref ‘Coherence established between atmospheric carbon dioxide and global temperature’;
“On the causal structure between CO2 and global temperature
Adolf Stips, Diego Macias, Clare Coughlan, Elisa Garcia-Gorriz & X. San Liang , Scientific Reports volume 6, Article number: 21691 (2016).
“Abstract”
“We use a newly developed technique that is based on the information flow concept to investigate the causal structure between the global radiative forcing and the annual global mean surface temperature anomalies (GMTA) since 1850. Our study unambiguously shows one-way causality between the total Greenhouse Gases and GMTA. Specifically, it is confirmed that the former, especially CO2, are the main causal drivers of the recent warming. A significant but smaller information flow comes from aerosol direct and indirect forcing and on short time periods, volcanic forcings. In contrast the causality contribution from natural forcings (solar irradiance and volcanic forcing) to the long term trend is not significant. The spatial explicit analysis reveals that the anthropogenic forcing fingerprint is significantly regionally varying in both hemispheres. On paleoclimate time scales, however, the cause-effect direction is reversed: temperature changes cause subsequent CO2/CH4 changes.”
(emphasis mine)
David Appell.
Yoiu quote Stips et al. (2016) as saying,
“We use a newly developed technique that is based on the information flow concept to investigate the causal structure between the global radiative forcing and the annual global mean surface temperature anomalies (GMTA) since 1850. Our study unambiguously shows one-way causality between the total Greenhouse Gases and GMTA. Specifically, it is confirmed that the former, especially CO2, are the main causal drivers of the recent warming. ”
Firstly, I am interested to know how Stips et al. determined the annual greenhouse gas emissions “since 1850”; did they use a ‘crystal ball’?
Secondly, how did Stips et al. assess the reliability of their “newly developed technique” when there is no independent data set for it to assess or to use for calibration?
Importantly, I want a time machine, and time series analyses – such as that of Kuo et al. – demonstrate CO2 changes follow temperature changes: therefore, I ask why Stips et al. have not used their “unambiguous” understanding to construct a time machine?
Note that we cited Stips et al. (2016) in both our first Royal Society paper (Revisiting causality using stochastics: 1.Theory, Proceedings of The Royal Society A, 478 (2261), 20210835) and our first Sci paper (Atmospheric temperature and CO₂: Hen-or-egg causality?, Sci, 2020). We showed that in Gaussian processes the method simply finds correlation, not genuine causality, of course. But most importantly, it does not mention at all the problem that high autocorrelations (as documented in both our papers) make the results spurious.
An independent critique of the method was provided by Goulet Coulombe P, Göbel M. On Spurious Causality, CO2, and Global Temperature. Econometrics. 2021; 9(3):33.
Richard,
I don’t think this is one of the the follow-up papers you’re referring to, but there’s a 2009 paper by Jeffery Park: “A re-evaluation of the coherence between global-average atmospheric CO2and temperatures at interannual time scales”
A pdf of the paper is available here:
https://agupubs.onlinelibrary.wiley.com/doi/pdf/10.1029/2009GL040975
The core frequency-domain methodologies and results are similar to what I’ve shown here, namely six-months delay and sensitivity of ~3ppm/K. I’m not seeing their 90deg phase lag in the data I’ve used. Their exploration of temperature is much more extensive.
Thanks again for the reference to Kuo. et al.
Robert Cutler, Thanks for the link to Park’s 2009 paper.
I notice that park says, ” Coherent
annual-cycle fluctuations in CO2 and temperature are
evident in the 1958– 1988 time series, but not since 1979.”
Oh my! The coincidences!
I refer you to my submission to the ‘Climategate’ Inquiry (i.e. whitewash) by the UK Select Committee which was also in 2009. It is recorded in Hansard (i.e. the official record of the UK Parliament’s business) here https://publications.parliament.uk/pa/cm200910/cmselect/cmsctech/387b/387we02.htm
The submission concerns one of the emails from me which were among those leaked from the Climate Research Unit (CRU) of East Anglia University (UEA): that email was from 2003 and is part of my complaints at the nefarious method being used to block publication of my paper which explained need to revise methods for determination of mean global temperature (MGT).
My submission to the Inquiry explained the nefarious method used to block the and provided a draft (as Appendix B) of the blocked paper.
As Appendix B of the Submission shows, the blocked paper also mentions 1979 when it says,
“The data sets keep changing for unknown (and unpublished) reasons although there is no obvious reason to change a datum for MGT that is for decades in the past. It seems that—in the absence of any possibility of calibration—the compilers of the data sets adjust their data in attempts to agree with each other. Furthermore, they seem to adjust their recent data (ie since 1979) to agree with the truly global measurements of MGT obtained using measurements obtained using microwave sounding units (MSU) mounted on orbital satelites since 1979. This adjustment to agree with the MSU data may contribute to the fact that the Jones et al., GISS and GHCN data sets each show no statistically significant rise in MGT since 1995 (ie for the last 15 years). However, the Jones et al., GISS and GHCN data sets keep lowering their MGT values for temperatures decades ago.”
Richard
Until a few years ago, the kilogram was defined as the mass of a platinum-iridium object stored in the International Bureau of Weights and Measures in Paris. It has been found that its mass changes over time by something like 0.000005% per century
nope. its Mass is the same.
its the standard it cant change, or rather you cant find an independent way to measure it.
However, we have to look at the bare facts, regardless how impossible they seem.
bare facts? THERE ARE NO BARE FACTS.
FACTS ONLY APPEAR IN A THEORETICAL SETTING.
Here is what we know.
we know CO2 cause a rise in temperature.
Yes, but the causality is the wrong way if CO2 was a forcing. CO2 and its radiative effects should be treated as a positive feedback.
Warming causes processes that breakdown organic matter to speed up which releases more CO2 than normal from a vast and virtually endless reservoir, which causes more warming etc etc.
As long as the overall feedback coefficient is not too high, the feedback can go in both directions. If temperature changes give a 10% increase in CO2 and CO2 a 10% increase in temperature, both go up 21%:
http://www.ferdinand-engelbeen.be/klimaat/klim_img/feedback.jpg
without run-away effect…
The fact that CO2 concentrations have been much higher in the past and the Earth didn’t cook implies there are more “control knobs” than the alleged CO2 one.
Yeah there is non-linear interdependence. As warming results in more CO2 being released, then the biosphere expands which tends to absorb more CO2 – a negative feedback. But then as the enlarged biosphere dies off and releases CO2 back, then it releases more CO2 than in cooler times, and this results in the lag.
Long-term CO2 proxies.
https://paleo-co2.org/
Agnostic commented:
Yes, but the causality is the wrong way if CO2 was a forcing. CO2 and its radiative effects should be treated as a positive feedback.
CO2 is a positive feedback. That’s why it’s warming.
Do you think CO2 doesn’t absorb IR, or do you think the Earth doesn’t emit any?
we know CO2 cause a rise in temperature.
In palaeoclimate we know that CO2 is unrelated to temperature.
https://ptolemy2.wordpress.com/2019/07/16/the-cult-of-carbon-dioxide-is-leading-palaeo-climate-research-on-a-road-to-nowhere/
https://ptolemy2.wordpress.com/2020/07/05/the-ordovician-glaciation-glaciers-spread-while-co2-increased-in-the-atmosphere-a-problem-for-carbon-alarmism/
Phil Salmon wrote:
In palaeoclimate we know that CO2 is unrelated to temperature.
Really??
How do we know this?
Phil Salmon wrote:
In palaeoclimate we know that CO2 is unrelated to temperature.
Appells response – “Really??
How do we know this?”
We dont know that for sure – however, temp has had large fluctuations with moderate to low correlation to co2
The results are clear: changes in CO₂ concentration cannot be a cause of temperature changes.
on the contrary, because we know Co2 concentration Does causechanges in temperature we know
1. your data is bad OR
2. your Method is Junk.
say hello to modus tollens
Steven Mosher,
You seem to be confused. CO2 changes do cause temperature to change if ALL OTHER THINGS DO NOT CHANGE. But the climate system is complex and several of its parts respond when temperature is changed ;e.g. more heat means more evapouration, which induces more clouds that reflect solar heat back to space (as every sunbather has noticed when a cloud passes in front of the Sun).
Thus, any change to the CO2 may induce a temperature rise which is too small to observe because temperature variability is much larger.
An effect which is too small for it to be detected has an actual reality but does not exist in practical reality.
Richard
Demetris,
I decided to run one last experiment where I detrended the data prior to computing the Frequency Response (FRF) and Coherence functions. My motivations for doing this were to better validate the results at 1/10 yr^-1. By detrending the data I can reduce any effects of window leakage without resorting to a window with significantly worse frequency resolution.
The experiment was performed both with co2 and ln(co2). Results were similar, so the ln(co2) will not be shown.
This first plot you’ve seen before, but I’ve added a marker at 0.1 yr^-1. This is the data without detrending. I’ve also added a delay marker for the 1-year cycle, just for fun.
https://localartist.org/media/CO2_Temp_FRF_no_detrend.png
The next two plots were detrended by subtracting 1st and 3rd order polynomial approximations of the temperature and co2 trends.
https://localartist.org/media/CO2_Temp_FRF_1st_detrend.png
https://localartist.org/media/CO2_Temp_FRF_3rd_detrend.png
My conclusion is that original result, while noisier because of a small amount of window leakage, is valid at 0.1 yr^-1. In other words, the temperature still appears to lead the CO2 by approximately six months even over 10-year time scales. While the magnitude of the frequency response does trend up with cycle length (down with frequency), it’s not doing anything that I can detect that is suggestive of a sudden change in behavior for periods longer than 10 years, which is a significant fraction of the 65 year dataset.
Fortunately, even with the coarse trends removed, there’s still a large amount of low-frequency energy in the result to work with, especially for the 1st-order polynomial. The key benefit is that there’s a lot less troublesome energy in the zero-frequency bins of the individual results over which the average is performed.
With detrending, the low-frequency FRF amplitude response is now falling with the number of averages, which suggests to me that the low frequency trend, just like the 1-year cycle, involves a different process than for frequencies say from 0.1 to 0.75 yr^-1.
The phase response is quite linear below 0.75 yr^-1, and while it’s noisier with fewer averages, it’s not distorted as it would be if the there was some other large signal, unrelated to temperature, added to the mix. It would therefore seem likely that temperature is still driving CO2, but that the process is nonlinear at low frequencies.
Many thanks Robert! I am glad to see the agreement of our results for scales larger than annual, such as decadal. This is very nice, yet not surprising. If you see our Figure 4, for the direction T -> CO2, there is an impressive agreement of the cross-correlation function obtained by the IRF and the empirical one, directly estimated by the data. This agreement spans time lags from -10 to 10 years. And since spectra are Fourier transforms of auto/cross-correlations, your results had to agree with ours, I guess…
Demetris,
“And since spectra are Fourier transforms of auto/cross-correlations, your results had to agree with ours, I guess…”
Yes, they do. I think the biggest difference between our two methods is that I believe you are computing the difference on the signals first.
In the time domain, the difference is a positive and negative impulse, which in the frequency domain is a sinusoid which amplitude and phase modulates the spectrum. So while I’ve seperated out the intersting bits spectrally, you’re filtering out the trend, annual and six-month energy with a difference functions that are multiples of one year in length.
Hopefully I haven’t misrepresented what you are doing.
On Steven Mosher’s comments
“nope. its Mass is the same.”
“bare facts? THERE ARE NO BARE FACTS.”
“1. your data is bad OR 2. your Method is Junk.”
Copying from my paper “From mythology to science …”, whose link I have given above:
“we may assert that the development of science complies with the development of axiology and of ethical values, including the promotion of the truth as an ethical value and the modesty of those seeking it. Even the term philosophy reflects this modesty. Notably, the term philosopher replaced the earlier term sophos (σοφός, translated into English as sage or wise, as in the expression “Seven Sages”[…]). According to a Heraclitian aphorism, wise is only one (έν το σοφόν, meaning something supernatural, i.e. God), and henceforth Pythagoras introduced the term philosopher, meaning lover (or friend) of wisdom (φίλος σοφίας). This is clarified in the following quotation:
“Pythagoras was the first to name it philosophy and himself a philosopher […] for no man is wise, but God alone.” (Diogenes Laertius, Lives of the Philosophers, 1.12)
PS. I guess, some physicists will be in big trouble after the first of Steven Mosher’s “revelations”. Quoting from Wikipedia, https://en.wikipedia.org/wiki/International_Prototype_of_the_Kilogram#Stability_of_the_IPK
“The reason for this [mass] drift has eluded physicists who have dedicated their careers to the SI unit of mass. No plausible mechanism has been proposed to explain either a steady decrease in the mass of the IPK [International Prototype of the Kilogram], or an increase in that of its replicas dispersed throughout the world.
Earth in our era is in a very long term continious warming period. This warming is caused by natural orbital forcing.
–
It is the continuation of the MWP. The LIA was a phenomenical cold because of the intensive mitigation of sea ice. During the LIA period, Earth continued accumulating solar energy, Earth continued getting warmer.
–
https://www.cristos-vournas.com
I’m starting to believe that the reason no one knows exactly what is going on is because Mother Nature hasn’t quite figured out what she is going to do herself.
“The imagination of nature is far, far greater than the imagination of man.”
Richard Feynman
Late to the party. –
Well, I guess Roy Spencer has a halfway decent chance at being right
And I admire Judith Curry.
The sensible thing would be to go over to Climate etc and test out a few arguments
I will put forward a few salient(to me) and let people shoot them down.
–
Very simply. Reality connect.
1. CO2 is multi factorial with an enormously large turnover yearly.
2. CO2 in the atmosphere is in balance with its sources and sinks.
3. CO2 production by humans in a number of ways is only a very small amount of that large turnover between sources and sinks.
4. CO2 levels are intensely temperature dependent,
a little cherry picked research.
Average annual atmospheric levels of carbon dioxide (CO?) reached a record high of 418.56 parts per million (ppm) in 2022, a year-on-year increase of 0.5 percent. Or 2 ppm.
Humans generate CO2 when burning fossil fuels such as gas, petrol, oil, and coal. This is claimed to add an additional 9.1 billion tonnes of CO? to the atmosphere each year
It is claimed 4.1 billion tonnes of CO2 stays in the air, increasing the atmospheric concentration of carbon dioxide annually
Each part per million of CO2 in the atmosphere represents approximately 7.82 gigatonnes of CO2.
So humans might actually only contribute 25% of the annual atmospheric increase in volume rather than 200%
Angech, you have the units wrong: humans add app. 10 GtC/year (carbon as CO2 or 12:44 in molecular weight) not 10 Gt CO2/year.
About half that remains (temporarily) in the atmosphere, thus the full increase is from humans, no matter how much circulates. Human CO2 is one way… And point 2 is wrong: CO2 is in unbalance, as that would be 295 ppmv for the current ocean surface temperature, not the measured 415 ppmv…
Ferdinand,
“CO2 is in unbalance, as that would be 295 ppmv for the current ocean surface temperature, not the measured 415 ppmv…”
–
Please, Ferdinand, how much is the current ocean temperature, and how do you calculate the 295 ppmv ?
–
https://www.cristos-vournas.com
Christos, current average ocean surface temperature, according to NOAA:
14.8°C, 0.9°C higher than the 1900-1999 average. See: https://www.climate.gov/news-features/understanding-climate/climate-change-global-temperature
The difference between the LIA and current temperatures is around 0.8°C, depending what reconstruction you like.
The difference in CO2 level between the LIA (280 ppmv) and today (295 ppmv) can be calculated with the formula of Takahashi, no matter if that is for a static ocean with equal temperatures all over the surface or for the real ocean surface with enormous differences between the equator and the poles:
http://www.sciencedirect.com/science/article/pii/S0967064502000036 :
∂ln pCO2/∂T=0.0423/K
Thank you, Ferdinand, for the important links.
–
“… can be calculated with the formula of Takahashi, no matter if that is for a static ocean with equal temperatures all over the surface or for the real ocean surface with enormous differences between the equator and the poles:
http://www.sciencedirect.com/science/article/pii/S0967064502000036 :
∂ln pCO2/∂T=0.0423/K ”
–
I’ll read them carefully, I’ll try to understand.
–
https://www.cristos-vournas.com
Ferdinand, I carefully read the material you provided.
“Seasonal variation of pCO2 in surface waters
On a global scale, the temperature effect on surface-water pCO2 is similar in magnitude but opposite in direction to the biological effect, in which changes of the total CO2 concentration is the dominant factor. The pCO2 in surface ocean waters doubles for every 16°C temperature increase (∂ln pCO2/∂T=0.0423°C−1, Takahashi et al., 1993). For a parcel of seawater with constant chemical composition, its pCO2 would be increased by a factor of 4 when it is warmed from polar water temperatures”
–
It says nothing about the calculations.
Please, would you like to show me the exact calculations?
–
You wrote:
“The difference in CO2 level between the LIA (280 ppmv) and today (295 ppmv) can be calculated with the formula of Takahashi, no matter if that is for a static ocean with equal temperatures all over the surface or for the real ocean surface with enormous differences between the equator and the poles:
http://www.sciencedirect.com/science/article/pii/S0967064502000036 :
∂ln pCO2/∂T=0.0423/K ”
Also, the
“Christos, current average ocean surface temperature, according to NOAA:
14.8°C, 0.9°C higher than the 1900-1999 average. See: https://www.climate.gov/news-features/understanding-climate/climate-change-global-temperature
The difference between the LIA and current temperatures is around 0.8°C, depending what reconstruction you like.”
–
I did not found in the link any mention of
“current average ocean surface temperature, according to NOAA:
14.8°C, 0.9°C higher than the 1900-1999 average.”
–
https://www.cristos-vournas.com
The mass balance is valid in all material handling systems, let it be an industrial chemical reactor a distillation column or a warehouse in operation.
Mass can not be destroyed (no nuclear application considered).
The mass balance, as well as an energy balance, is applicable in all time scales, seconds to millennias, -always.
The atmosphere can be considered as a chemical reactor or a warehouse (or a bank account) and the mass balance is always applicable :
what goes in has to come out or the difference will accumulate
By burning fossil fuels, directing the exhausts primarily to the atmosphere then the amount of carbon dioxide has to increase by that corresponding amount in the atmosphere. If not then there are other sources or sinks making the atmospheric carbon dioxide amount to increase more or less.
By detrending data the accumulation is exluded and only the remaing variability around the trend will be investigated.
Kind regards
Anders Rasmusson
Christos,
About the temperature: “The year 2022 was the sixth warmest year since global records began in 1880 at 0.86°C (1.55°F) above the 20th century average of 13.9°C (57.0°F).”
Or the current average temperature is 14.8°C
Easy to overlook in the text.
The formula of Takahashi can be set in an easier way to make the calculations:
(pCO2)sw @ Tin situ = (pCO2)sw @ Teq x EXP[0.0423 x (Tin-situ – Teq)]
as used in calculations of continuous seawater pCO2 measurements in commercial sea ships to compensate for the (small) change in temperature between the water inlet (“in situ”) and the point of measurement.
If you fill in the CO2 pressure at around 1600 of 282 ppmv and a temperature difference of 0.8°C, that gives an increase of:
pCO2(today) = 282 ppmv (1600) * EXP(0.0423*0.8) = 282 * 1.0344 = 292 ppmv.
One can discuss the exact values of the temperature differences and CO2 levels, but the main point is that the influence of temperature on CO2 levels is very modest and can’t be the cause if the 100 ppmv increase since 1958…
Thank you, Ferdinand, for your explanation.
–
It will take me some time to sort the things out.
–
I have focused on your following remark:
“the main point is that the influence of temperature on CO2 levels is very modest and can’t be the cause if the 100 ppmv increase since 1958…”
–
Do you agree that the fossil fuels burning does not causes the global warming then?
–
https://www.cristos-vournas.com
Antonis and colleagues
Thanks for sharing this important article.
It’s an important insight that the system is open and complex and the question of causality and its direction is far from simple.
The biggest error in simplistically assuming CO2 causation from simple correlation is failure to recognise other sources of causation especially from internal chaotic dynamics.
FWIW here’s my take on that and the question of dimensionality of nonlinear-chaotic systems:
https://ptolemy2.wordpress.com/2023/09/18/the-dimensional-haircut/
Phil Salmon wrote:
The biggest error in simplistically assuming CO2 causation from simple correlation is failure to recognise other sources of causation especially from internal chaotic dynamics.
How does internal chaotic dynamics create the observed planetary energy imbalance, heating of the surface, troposphere and ocean, and cooling of the stratosphere?
Doesn’t it just shuffle heat around?
David
Thanks for replying.
As for shuffling heat around – I take the view of Richard Lindzen that even if net heat at top of atmosphere is in complete balance, there can be plenty of climate change because the oceans contain such a vast amount of heat to shuffle. Note that during glaciations deep ocean water is warmer, for instance. Such is the heat content of the oceans that climate heat looks like a zero sum game. That’s why I think focus exclusively on heat in and out at TOA is a red herring and internal dynamics of for instance vertical heat transfer can serve up plenty of climate change.
From the current temperature data there is of course no question that we remain firmly in a steady secular warming period – for whatever reason.
Phil Salmon wrote:
As for shuffling heat around – I take the view of Richard Lindzen that even if net heat at top of atmosphere is in complete balance, there can be plenty of climate change because the oceans contain such a vast amount of heat to shuffle.
What is the evidence that ocean is losing heat?
As far as I know, the ocean is *gaining* heat:
https://www.ncei.noaa.gov/access/global-ocean-heat-content/
Rasmussen said, “If not then there are other sources or sinks making the atmospheric carbon dioxide amount to increase more or less.”
Therein lies the problem. You are assuming that we have identified and accurately measured all the source and sinks. What is the rate of precipitation of limey muds in shallow, tropical seas such as the Bahamas? What is the emissions rate of CO2/CH4 in the Tundra, and the Winter CO2 respiration from roots in the Boreal forests of North America and Siberia?
clydehspencer just commented:
The elephant in the room with an eerily wiggling trunk is the carbon sequestered in the Tundra. It is a large reservoir of carbon that no one seems to want to acknowledge.
Its emissions?
Give data, sources, citations. Not useless speculation.
Clydehspencer : “….. You are assuming that we have identified and accurately measured all the source and sinks.….”
For the atmosphere we know the mass of CO2 :
• Accumulated, derived from air analysis (Mauna Loa).
• Inlet from fossil fuels combusted.
The atmospheric CO2 mass balance :
In_Fossil + In_from_Nature = Out_to_Nature + Accumulated
==>
In_Fossil – Accumulated = Out_to_Nature – In_from_Nature
The left hand part is, accurately enough, known to be positive for at least sixty years and then the right hand part also is positive. The Nature is a net sink, give it six decades or a single year.
The mass balance has to be fulfilled when making theoretical models.
Kind regards
Anders Rasmusson
Clyde, during the previous warmer interval, the Eemian, much permafrost was melted, trees did grow up to the Ice Sea and 1/3 of Greenland ice was melted.
CO2 levels then: 300 ppmv. CH4 levels then: 700 ppbv. Current: 415 ppmv and 2000 ppbv, thanks to human emissions, not nature…
Anders Rasmussen: “The mass balance has to be fulfilled when making theoretical models.”
It’s this that is fundamentally flawed – the idea of mass balance between sinks and sources. Here is why:
The amount of C trapped in sinks is virtually an endless reservoir, and its residence times are seasonal, a few years, to 250 years, and occasional millennial time scales (which is how we get fossil fuels). It is NOT fixed, so this idea there is a mass that has to be balanced each year or over some arbitrary time scale is flawed.
We know this FOR SURE because we have the geological record of different epochs with different CO2 levels.
The idea of a “net sink” is similarly equally flawed. The sinks are also sources, it’s just that biosphere is expanding faster than our emissions, trapping them along with other sources. It cannot tell whether the CO2 was man made or from natural sources.
Think about it: If our emissions roughly doubled from the 90s to the 2000s and the proportion of our emissions was removed from the atmosphere remained the same, that means the biosphere was expanding.
We also know for sure that the main limiting factor for photosynthesis is the availability of CO2. So if there is more CO2 around it will grow faster and expand.
It bears repeating – processes that release CO2 into the atmosphere are more temperature dependent than processes that fix it. There is no shortage of Carbon in the soils and in the oceans so any temperature increase that accelerates the release of CO2 is not limited by the need for a “mass balance”.
The total mass of Carbon on Earth must remain constant sans radioactive decay, escape from Earth, or something from space crashing on Earth.
“The total mass of Carbon on Earth must remain constant”
Obviously, but from the point of view of CO2 atmospheric variations, the source for carbon is virtually limitless. Beneath your feet is enough carbon to raise atmospheric CO2 to levels well beyond anything we are experiencing now. The “mass balance” argument implies there is only a limited fixed amount of carbon circulating from sources to sinks and back again. But it’s not true – it’s nearly not true as we can see in the paleoclimatological record.
I see your point about the amount of sequestered CO2 vs atmospheric.
Murry Salby nailed this over a decade ago. Rate of change of atmospheric CO2 concentration is proportional to temperature anomaly. The relationship has held for the entire satellite record and continues to hold.
https://woodfortrees.org/plot/esrl-co2/mean:12/from:1979/derivative/plot/uah6/scale:0.18/offset:0.171
I see people like Ferdinand is still pushing his static oceans hypothesis and Nick is still pushing the ridiculous “mass balance” argument. There are none so blind as those who will not see.
He Bart, I was missing you in this debate (already 10 years or so ago that started…).
Salby was wrong and the mass balance must be obeyed at every second of time, but for the rest no problem…
Why was Salby wrong? Because the integral of temperature doesn’t have any physical meaning and assumes that a single step temperature change in any direction gives a continuous change in CO2 release or uptake until eternity.
Plus that in reality, there is a negative feedback from the increasing CO2 pressure in the atmosphere, which is way higher than the (area weighted) temperature average dictates…
Ferdinand – Yes, I got tired of trying to make headway against people who do not understand dynamic systems. But, nothing has changed. The pseudo-mass balance argument is still as stupid as it was 10 years ago. The rate of change of CO2 is still tracking temperature anomaly.
The integral of temperature certainly has a physical meaning – it represents the throttling of a steady flux into and out of the surface system. Temperature rise impedes outward flux, leading to accumulation.
I may or may not respond to any further posts. There’s really nothing more to argue about that we haven’t covered over a decade ago.
UAH global average LT anomaly = 0.90 C relative to 1991-2020.
https://www.drroyspencer.com/2023/10/uah-global-temperature-update-for-september-2023-0-90-deg-c/
Record high
Third month in a row that’s warmest in the record for its month.
Higher than all previous El Ninos.
(and we’re not even in an El Nino yet.)
= 1.08 C relative to 1980-2009. (a proper baseline)
It keeps getting warming.
As expected.
Has been for a long time now.
No natural explanation.
UAH LT overall trend = 0.14 C/dec
acceleration = 0.02 C/dec^2
Pearson coefficient^2 = 0.50
20-yr trend = 0.20 C/dec
Stay tuned as lots more record highs roll in for the surface as the month goes by.
All,
I see that David Appel has taken my duty to respond on a lot of unsubstantiated misinformation that gives skeptics a bad name…
That humans are the cause of the CO2 increase is rock solid science and insisting that we are not to blame just distracts from the main points of debate: how much warming does that give and is that a disaster or just beneficial.
About the current work, all what Demetris Koutsoyiannis ea., supported by Robert Cutler, have shown is that temperature variability causes CO2 variability over time frames of 2-3 years. That contains zero information over the cause and effect of temperature and CO2 over shorter (seasonal) and longer (decennia to multi-millennia) trends.
There is a simple way to prove that the findings only apply to the short time variability by looking at which are the main reactants:
– On seasonal scale, CO2 drops with a lag after temperature increases, because of the huge absorption in spring-summer by vegetation. Visible in the 13C/12C ratio and the oxygen balance.
– On 2-3 years scale, CO2 increases with a lag after temperature, because of drying out of tropical forests under El Niño conditions. Visible in the 13C/12C ratio and the oxygen balance.
– On longer time frames, CO2 uptake again increases in vegetation: the earth is greening. Again measurable in the oxygen balance and an increase in chlorophyll.
Oceans follow temperature changes at all time frames, but much slower and very modest at a few ppmv/K over short time frames up to 16 ppmv/K over very long time frames. For the short time frames, vegetation is dominant.
So that means that while almost all 2-3 years variability is caused by the influence of temperature on vegetation, there is not the slightest relationship between temperature variability and long(er) term CO2 trends. None at all, as these have different directions in vegetation and only a modest influence in the oceans.
What is left is human emissions which are twice the observed increase and fulfill all observations. All alternatives violate on or more observations and must be rejected…
See: http://www.ferdinand-engelbeen.be/klimaat/co2_origin.html
That is it for now…
Ferdinand, you write,
“I see that David Appel has taken my duty to respond on a lot of unsubstantiated misinformation that gives skeptics a bad name…
That humans are the cause of the CO2 increase is rock solid science and insisting that we are not to blame just distracts from the main points of debate: how much warming does that give and is that a disaster or just beneficial.”
I see that after a decade of people pointing out your errors you are still persisting with your promotion of unsubstantiated assertions which promote the superstitious belief that “humans are the cause of the CO2 increase”. Indeed, you claim your superstition amounts to “rock solid science”: it does not.
There is no clear empirical evidence which categorically indicates a mostly natural or a mostly anthropogenic cause of recent atmospheric CO2 rise.
(a) The mass balance argument is facile because the flows in and out of the ‘sinks’ are not known with sufficient accuracy.
(b) The dynamics of the seasonal fluctuations strongly suggest the ‘sinks’ can easily absorb the annual total emission to the air (both natural and anthropogenic) but they don’t, and this indicates the equilibrium of the system is changing (the most likely cause of the changing equilibrium being temperature rise from the LIA).
(c) The magnitude of observed change in the 12C:13C isotope ratio is wrong by a factor of 3 (i.e. has difference from expectation of 300%) from that which would be expected if the rise were accumulation in the air of CO2 from combustion of fossil fuels and
manufacture of cement (your dilution argument to excuse this difference is silly because if nature can make that much “dilution” then it may be responsible for the entire change).
(d to N) etc.
The nearest things to incontrovertible evidence we have are
(i) the coherence of changes to atmospheric CO2 and global temperature shows CO2 changes lag behind temperature changes at all time scales,
and
(ii) the consistency analysis of Ed Berry indicates the rise in atmospheric CO2 concentration is primarilly natural.
Both these facts support the contention that emissions of CO2 from human activities are ‘a bit player’ in the cause(s) of recent rise in atmospheric CO2 concentration.
Richard
All,
I see that David Appel has taken my duty to respond on a lot of unsubstantiated misinformation that gives skeptics a bad name…
That humans are the cause of the CO2 increase is rock solid science and insisting that we are not to blame just distracts from the main points of debate: how much warming does that give and is that a disaster or just beneficial.
About the current work, all what Demetris Koutsoyiannis ea., supported by Robert Cutler, have shown is that temperature variability causes CO2 variability over time frames of 2-3 years. That contains zero information over the cause and effect of temperature and CO2 over shorter (seasonal) and longer (decennia to multi-millennia) trends.
There is a simple way to prove that the findings only apply to the short time variability by looking at which are the main reactants:
– On seasonal scale, CO2 drops with a lag after temperature increases, because of the huge absorption in spring-summer by vegetation. Visible in the 13C/12C ratio and the oxygen balance.
– On 2-3 years scale, CO2 increases with a lag after temperature increases, because of drying out of tropical forests under El Niño conditions. Visible in the 13C/12C ratio and the oxygen balance.
– On longer time frames, CO2 uptake again increases in vegetation: the earth is greening. Again measurable in the oxygen balance and an increase in chlorophyll.
Ferdinand,
Once again you have chosen to mischaracterize my responses. You wrote:
“About the current work, all what Demetris Koutsoyiannis ea., supported by Robert Cutler, have shown is that temperature variability causes CO2 variability over time frames of 2-3 years. That contains zero information over the cause and effect of temperature and CO2 over shorter (seasonal) and longer (decennia to multi-millennia) trends.”
In https://judithcurry.com/2023/09/26/causality-and-climate/#comment-994090 I specifically addressed validating the results at a frequency of 0.1 yr^-1 and noted that “While the magnitude of the frequency response does trend up with cycle length (down with frequency), it’s not doing anything that I can detect that is suggestive of a sudden change in behavior for periods longer than 10 years, which is a significant fraction of the 65 year dataset.”
Also, the methodology I use actually works quite well for seasonal trends. I specifically noted that the delay is different for the annual cycle, less than 2 months instead of 6. That, and the fact that the amplitude is dropping with averaging implies a different process at work. In other words, The delay of 2 months is accurate relative to temperature, but probably doesn’t tell the whole story as daylight hours also change with an annual cycle.
As for David Appel, he just wasted my time by referencing a paper that doesn’t apply here. In the paper “On the causal structure between CO2 and global temperature” you’ll find the following statement “The results prove to be robust against detrending the data (SI, Table SI2), selecting shorter time periods as e.g. using only the last 100 years, or against using decadal means only (results not shown).
This tells me two things. 1) All of their results incorporate proxy data. 2) The authors may not have particularly liked the results that included measured data.
I do find it strange that the authors wouldn’t include the “robust” 100 year and decadal results after starting their paper with: “During the past five decades, the earth has been warming at a rather high rate…”.
Robert, sorry, indeed I am wrong about the short term seasonal part, but I still am right about the signs and trends of the different responses…
Have a look at the response of CO2 after T over a year:
http://www.ferdinand-engelbeen.be/klimaat/klim_img/seasonal_CO2_d13C_MLO_BRW.jpg
CO2 goes down when T goes up and vv. The opposite CO2 and δ13C ratio show that vegetation is the main reactant. The global amplitude is about 5 ppmv/K.
As you did find an about 2 months delay and near zero trend over longer periods, that is just fine.
Then we have the main 2-3 years frequency:
http://www.ferdinand-engelbeen.be/klimaat/klim_img/temp_co2_der.jpg
According to your analyses, all variation in CO2 is caused by the variation in temperature, plus the trend, or part of the trend? That is not clear for me, but that is simply impossible:
First, again vegetation is the main reactant, proven by the opposite CO2/ δ13C changes.
Second, in this case, higher temperatures cause higher CO2, opposite to the seasonal changes.
Third, while the trend in the atmosphere is positive, in vegetation the trend is negative: an increasing net sink for CO2. As good as in the oceans. That is proven by the oxygen balance, the solubility of CO2 in seawater, the increase of inorganics (DIC) in the ocean surface and the mass balance for the remainder in the deep oceans…
Here a nice overview for the period 1990-2000. I have seen an update for 1990-2010, but can’t find it again…
http://www.ferdinand-engelbeen.be/klimaat/klim_img/bolingraph.gif
The only conclusion possible is that the method does not detect the contribution to an increase as that is caused by a variable that adds twice as much CO2 as the measured increase, but has near no variability…
Ferdinand,
“According to your analyses, all variation in CO2 is caused by the variation in temperature, plus the trend, or part of the trend? That is not clear for me, but that is simply impossible:”
This is not the correct interpretation of my results.
This link is to the result shown before where I’ve detrended the data using a 1st-order polynomial, i.e. I’ve removed the slopes and offsets from both datasets. This detrending leaves almost all of the low-frequency energy in the waveforms, and since there’s no way to determine causality betwen two sloped lines with different units, we haven’t really lost much information.
https://localartist.org/media/CO2_Temp_FRF_1st_detrend.png
What this result shows, is that there are at least three different processes at work. I know this because of how the results change with frequency and averaging. Going back to my model of Y(f)=H(f)X(f)+N(f) where I’ve chosen Y as CO2 and X temperature, N(f) represents noise, or any additive signal in Y that is not related to X. With the type of analysis I’m performing, the bias that N introduces is diminished with the number of averages.
https://judithcurry.com/2023/09/26/causality-and-climate/#comment-994045
If you look at 2-3 years (frequency of 0.3 yr^-1), you’ll see that the result is stable with averaging. It also has high coherence, so N(f) is not too large. That’s process #1. Based on both the delay (phase slope), and the minimal changes in sensitivity, that process runs from 0.1-0.5 yr^-1, or durations of 2-10 years. This is a minimum range. I believe that this process extends to periods longer than 10 years by some amount as there’s no obvious distortion suggesting that the response is in the process of changing significantly.
If you look at the annual cycle, it’s sensitivity is dropping with averaging. It also has a different delay from process #1. This is process #2. I’m not going to try to say what these processes represent, but will point out that there are many things with an annual cycle that could also be forcing CO2 with the same period, but different phasing. Daylight hours, for example.
The data shows that the remaining low-frequency energy, for periods longer than 10-years, also contains a significant amount of energy that is not correlated to temperature as evidenced by the decline in the amplitude response with averaging. In other words, some of the trend CO2 is added by a process not related to temperature. This is process #3. I would add that since we can’t see evidence of a significant change in sensitivity, or delay, going from 2-10 years, that it’s likely that most of the CO2 in the long-term trend is not related to temperature. Remember that we’re only analyzing 65 years of data and we can’t see evidence of a different process for energy with periods of 10 years.
This is how I interpret the signals.
As a side note, in the plots that I’ve shown,the frequency resolution is also changing with the number of averages, which also affects has an effect.
Here’s an example where I’ve held the frequency resolution constant and only changed the number of averages, which increasingly uses more of the data set.
https://localartist.org/media/frfcoh1_5_10_fixedRBW.png
If you look at the top, middle panel, the annual cycle now has a null splitting the peak in two. This is the magic of the random phasing between different processes with similar frequencies at work.
Part 2:
Oceans follow temperature changes at all time frames, but much slower and very modest at a few ppmv/K over short time frames up to 16 ppmv/K over very long time frames. For the short time frames, vegetation is dominant.
So that means that while almost all 2-3 years variability is caused by the influence of temperature on vegetation, there is not the slightest relationship between temperature variability and long(er) term CO2 trends. None at all, as these have different directions in vegetation and only a modest influence in the oceans.
What is left is human emissions which are twice the observed increase and fulfill all observations. All alternatives violate on or more observations and must be rejected…
See: http://www.ferdinand-engelbeen.be/klimaat/co2_origin.html
That is it for now…
Sorry for the duplicates…
Ferdinand – many thanks for your explanations of driers of CO2 change on different timescales. The role of vegetation is striking of course.
It has been observed that there is a tendency for CO2 to increase – not decrease – at glacial inceptions, when glaciations begins and spreads toward the equator. Could vegetation be an explanation for this. Not only on land but at sea a lot of photosynthetic production would be lost presumably?
https://ptolemy2.wordpress.com/2020/07/05/the-ordovician-glaciation-glaciers-spread-while-co2-increased-in-the-atmosphere-a-problem-for-carbon-alarmism/
A short answer: it is entirely possible that not only CO2 uptake is reduced, but also that a (large) part of vegetation dies and is oxidized back to CO2. The 13C/12C ratio is a very reliable indication of what vegetation in the past did: a net sink (13C/12C ratio up), a net source (13C/12C ratio down).
It is near impossible to separate the cause in vegetation: is it in less/more growth or in more/less decay…
Phil Salmon wrote:
It has been observed that there is a tendency for CO2 to increase – not decrease – at glacial inceptions, when glaciations begins and spreads toward the equator. Could vegetation be an explanation for this.
The paper you cite gives the explanation:
“The integrated datasets are consistent with increasing
pCO2 levels in response to ice-sheet expansion that reduced silicate weathering.”
paper:
https://t.ly/6fVyf
David
How quickly can silicate weathering changes occur? Photosynthesis change would be immediate acting over the decadal-century timescales of rapid glacial inception. Note that escape from past global snowball earth glaciations is attributed to CO2 buildup (to very high levels) due to lack of photosynthesis – not only weathering. Maybe a significant role for both?
I believe that Ferdinand Engelbeen’s patient and articulate critique of the Cause and Effect paper under discussion here is best summarized in his link below. I judge that reading it and presenting any counter arguments to it could cut to chase and avoid the high noise level here.
http://www.ferdinand-engelbeen.be/klimaat/co2_origin.html
Thanks Kenneth… but my comment on any comments on that work (the result of similar discussions already 15-20 years ago) will have to wait as we are leaving for a nice trip…
Thanks for all the fish, Mr. Engelbeen!
Out of all of all the comments, I would like to see Agnostic write up his concepts in a more extended stand-alone piece. I found his arguments the most intriguing.
I second that!
That’s very kind, but I really do not have the expertise. I am an avid consumer of science and especially climate science for nearly 2 decades. The only reason I am commenting so hard on this, is because I have long noticed this causality issue and it’s always bothered me.
The information is “out there” and I too would love someone to actually collate that information into a cohesive and comprehensive and even more importantly – CLEAR – text.
I attempted a synopsis
https://rclutz.com/2023/10/01/co2-fluxes-are-not-like-cash-flows/
Off topic: Agnostic, you wrote:
“Incidentally – I am not conservative. I am left-leaning in my politics, but it has no bearing on the logic, reason and evidence presented here.”
I would also like to say that. But I am confused in terms of my political identity… For instance, do you think that those promoting ideas initially processed and propagandized by the Rockefellers and their attaché Kissinger, and currently by Kissinger’s student Schwab, count as left-leaning?
If you didn’t know the history of the development of ideas about climate change, please see section 6 (The Term “Climate Change”) in my paper “Rethinking climate, climate change, and their relationship with water”.
I will appreciate your reply.
Link: http://dx.doi.org/10.3390/w13060849
Demetris –
Thanks for linking that paper. It looks like it explains much. For example, I look forward to reading how it is “commonly thought” that water is “just” affected by climate, and isn’t an element of what drives climate.
> Concerning, in particular, the relationship of climate and water, the analysis of Section 5 shows that water is the main element that drives climate, rather than just being affected by climate as commonly thought
This part is interesting:
> By scrutinizing the definitions, several questions may arise. A first is: Why “at least a 30-year period”? Is there anything special about 30 years? It appears that this reflects a historical belief that 30 years are enough to smooth out random weather components and establish a constant mean. In turn, this reflects a perception of a constant climate, and a hope that 30 years would be enough for a climatic quantity to stabilize to a constant value.
Wait. Let’s go back to those quotes of the definitions:
>> Climate–The slowly varying aspects of the atmosphere–hydrosphere–land surface system.
>> Climate–The average of weather over at least a 30-year period. Note that the climate taken over different periods of time (30 years, 1000 years) may be different.
>> Although climate essentially relates to the varying states of the atmosphere only, the other parts of the climate system also have a significant role in forming climate, through their interactions with the atmosphere.
>> Climate–Climate in a narrow sense is usually defined as the average weather, or more rigorously, as the statistical description in terms of the mean and variability of relevant quantities over a period of time ranging from months to thousands or millions of years.
This is interesting also:
> Thus, the dominant idea is that a constant climate would be the norm, and a deviation from the norm would be an abnormality, perhaps caused by an external agent.
But then you yourself say,
>> However, such belief is incorrect and inconsistent with the reality of an ever-changing climate. This was pointed out almost 50 years ago by Lamb
So according to you, if someone describes an anomaly, they are expecting (total) consistency? I find that a strange argument to make. If I describe a person’s behavior as anomalous, it doesn’t mean that I expect their behavior to be (totally) consistent.
Methinks as I read further, I will find further such subjective interpretation of what people mean when they say things. Methinks you would do well to consider “cognitive empathy” a bit more.
A good rule of thumb, I think, is if you’re going to characterize a person’s beliefs, that you confirm with them that your view of what they believe is consistent with their view of what they believe.
Do you seriously think that many climate scientists will think that climate is unchanging?
There’s a tiny little nugget in your wording (my bold, of course):
> Thus, the dominant idea is that a constant climate would be the norm, and a deviation from the norm would be an abnormality, …
Your wording suggests that the view is that “a deviation,” would be that any deviation from the norm would be an abnormality. I suggest that’s not what people argue. The use of “anomaly” is contextual, an inherently linked to associated parameters. It doesn’t exist as some kind of universal condition applied all contexts.
Your reading strikes me as entirely rhetorical, and your description (of what people think) is likewise rhetorically fashioned, supported by highly selective reading. And that’s even assuming that your selected excerpts aren’t curated in a similar fashion (I think it’s a reasonable they weren’t – you do quote “authoritative” sources, but I wouldn’t be entirely shocked if you left out sort of applicable caveats from those sources).
I hope I can find some time for more reading.
I can’t parse your technical arguments, but your rhetorical arguments are an interesting lens.
Thanks, Joshua, for reading my paper and your comments, which I will consider to my next writings.
Hi Demetris:
That “climate change” has been co-opted to mean “change to the climate caused by man” is something Dr Curry discusses in her recent book “Climate Uncertainty and Risk”. I don’t think at this point there is any reasonable doubt that it is essentially a politically loaded term. I read your section 6, and it’s in accordance with this.
However, I don’t think it is unreasonable to note that human civilisation is at its largest and most impactful of all time and that we should consider our impact on the environment and ensure we don’t cause problems down the line. I would consider myself a “genuine environmentalist”, but philosophical I don’t make the distinction between man and nature that many so-called environmentalists do. We are entitled to do what we do in order to survive and thrive, just as much as any creature on the planet.
A fundamental belief I have is the principle of mediocrity. Things are never as bad as, or good as, they seem. OTH, if everything was somewhere in the middle, that would itself be extreme. There’s a sort of bell curve for how good or bad things can get and most things, including our impact on the environment including climate is probably in the middle.
I started to write a little on my political beliefs but I don’t want it to distract from what has been an important and long overdue discussion on the lead/lag issue of CO2 and temp – and I must thank you for a fantastic contribution to it. Suffice to say I am not a single issue voter – I may vehemently disagree on climate and policy with someone who I agree with on most other things.
Thanks Agnostic—even though your answer does not help very much to clarify what is left and what is right… But you are right, let’s not “distract from what has been an important and long overdue discussion…”
“if everything was somewhere in the middle, that would itself be extreme”: Good point. Entropy would tend to minus infinity, as we tried to describe in our paper “Entropy and wealth”.
Link of the latter paper: http://dx.doi.org/10.3390/e23101356
Demetris, I think left and right are not very descriptive of current politics pertaining to issues like CO2 emissions.
I thought this article enlightening
https://americanmind.org/salvo/socialism-and-the-great-reset/
I agree with you, Ron. They lost their meaning. Thanks for the link.
I note, Ron and demetriskoutsoyiannis, that under Socialism, almost everyone becomes more equal in the sense that almost everyone’s standard of living sinks to an equally low level. However, look at Socialist and Communist countries and you find the upper echelon of the governments live quite well. But of course, they have made everyone but themselves equal, so they deserve more than most.
Concerning the political spectrum, it is relative over time and space. The right in the US would be more middle if compared to right of 1900. The left in some countries is out-right Communistic, while in others it is simply some degree of socialism. The entire world has lurched left over time. There is no good definition that I can see.
Thanks jim2, but you did not reply to my question. My question was “do you think that those promoting ideas initially processed and propagandized by the Rockefellers and their attaché Kissinger, and currently by Kissinger’s student Schwab, count as left-leaning?”. To make it clearer and expand it, do you think that the contrarians to these ideas classify as right- or far-right-leaning? Nb., I gave a reference where I have documented the origin of these ideas.
The relativity over time does not hold as the climate change agenda is on air for half a century now. Also, the relativity in space is not relevant as the same climate change agenda is promoted globally. (Schwab’s consultant Harari uses it to justify his promotion of what he calls “New Global Empire”). Finally, practices of silencing different views and punishing people for their opinions, classify as left-, right-, far-right-leaning, or what?
@demetriskoutsoyiannis
The paper you linked is long and contains only a reference to Rockefeller. Could you specify to what “ideas initially processed and propagandized by the Rockefellers” you refer?
Generally, I consider those who favor government control of people and the economy to be Communists/Socialists/Leftists.
The devil is in the details because every organized society has some laws and regulations, rendering that society less than completely free.
Again generally, I consider those who want to control us because of “climate change” leftists. I also think “climate change” skeptics tend to be right-leaning. However, that does not imply any given skeptic does not believe CO2 will tend to drive up global temperatures.
The entire subject is too complex to fully and fairly cover in a comment.
No, I give three references which you can locate as I also give the links (if they don’t work anymore, try the Wayback Machine). Plus, I give several references to Time magazine (if you do not know its link, see Rockefeller Center in Wikipedia), to Kissinger, to intelligence agencies, etc.
The ideas are all about climate change, as described in the paper.
The stereotypes do not provide a good guide even in politics.
@demetriskoutsoyiannis
Unless you specify your concerns, the links are useless. There is so much material, I can’t make heads nor tails of your concerns.
Thanks jim2. You have already helped me a lot.
angech (Comment #225129)
October 5th, 2023 at 8:42 am Edit Delete
The concept is this.
The earth is not a beaker in a laboratory with a fixed amount of CO2 able to go in and out of solution with changes in pressure and temperature.
Where adding in a soupcon of CO2 means there is extra working CO2 for ever.
–
The earth is best envisaged as a cup with sides lined by the earth’s surface with a thin layer of water over the inner sides and full of the atmosphere which cannot escape from the top of the cup because of gravity.
Or you can use a three layer flat model if you wish.
The earth has been covered by water for billions of years but some parts at the top of the cup are only in contact with the atmosphere.
The earth contains masses of CO2 in mineral and organic forms.
Only the parts touched by water or air can absorb or release this CO2 by chemical processes. This is the original and ever renewable source that can produce CO2 forever.
The earth surface is at a pH equivalent to that of the oceans in general.The reason should be obvious to anyone who thinks about it, about 8.1
[***Could people not nitpick , this is an overall estimate].
The CO2 from chemical processes in the earth to air is gaseous.
There earth acts as a substrate and a sink for all CO2.
The CO2 from chemical process in water is quite different as various forms of Carbonic acid (H2C03) exist . The hypothetical acid of carbon dioxide and water. It exists only in the form of its salts (carbonates), acid salts (hydrogen carbonates), amines (carbamic acid), and acid chlorides (carbonyl chloride).
These release CO2 to the atmosphere and take it back in in a process driven by temperature in much greater amounts than earth to air.
The amount of CO2 in the air is fixed in a range determined by the temperature of the atmosphere in contact with water and earth surfaces.
I cannot find a formula for it but it could be worked out backwards since we can estimate all parts of the equations apart from the actual amount of substrate going from water to air and back.
-In answer to questions about why the equations as Mr Engelbeen finds them yield seemingly low amounts of CO2 increase compared to large temperature changes [1C]. the answer is simple.
The amount of CO2 being held in water is vastly underestimated as it is not only the oceans and lakes but at least another third as much again in the land which has moisture in the to 20 cms with vast surface areas reaching the atmosphere.
The moisture in the air in the form of water vapor also contains large amounts of CO2 in acidic form, much more than the air itself holds.
This is the actual basis of the sinks and sources that maintain that total mass of CO2 in the atmosphere.
It is approximately 3.36×10^12 tons, according to Steve F and no 40 GT does not figure at all compared to that large amount held in place by physics.
That’s enough
Angech : “….. no 40 GT does not figure at all compared to that large amount held in place by physics…. “
In reality the mass balance is always fulfilled :
what goes in has to come out or the difference will accumulate
During the industrial era the fossils have been lifted from one system. By combustion the corresponding amount of CO2 have been transferred to and accumulated in another system, the atmosphere and the nature.
From atmospheric analysis we know that the amount of increased CO2 in the atmosphere is less than the amount of CO2 from combustion of fossils – the missing amount have been transferred to and accumulated in the nature, land and ocean.
Mathematical models have to fulfill the material balances when simulating the real processes.
See one example considering the dynamical atmospheric CO2 mass balance and the driving forces, concentration differences, between the atmosphere and the ocean :
https://www.drroyspencer.com/2019/04/a-simple-model-of-the-atmospheric-co2-budget/
Please see also the comprehensive presentation by Ferdinand Engelbeen :
http://www.ferdinand-engelbeen.be/klimaat/co2_origin.html
Kind regards
Anders Rasmusson
Sorry : “….. concentration differences …..” to be replaced by “….. difference in partial pressures …..”
/ Anders
From The Blackboard where the discussion is also ongoing and heated.
Ken Fritsch (Comment #225153)
“Angech, I think you best should study the link I posted above from Ferdinand Engelbeen and come back here with your understanding of what he was saying.”
-Thanks Ken,
Appreciated.
I did note that you have posted the same link at Judith’s towards the end of the comments there.
–
“Steve’s point on the earth’s sink for CO2 is that the human addition to CO2 to the atmosphere is not distinguished from any other sources other than different isotope ratios of carbon, but there is a limit to rate the sink can take up CO2.”
–
Ken,
What is a sink?
Why is a sink a sink?
Serious questions for you and Steve F and Mr Engelbeen to consider.
CO2 goes into and out of the ocean and all other liquid sources at a rate dependent on the temperature of the water and adjacent atmosphere.
Also their concentration in the water in their various forms.
So by the way do all the other atmospheric gases.
No prizes for not knowing that each and every gas has a concentration in the atmosphere depending on available substrate.
Hence in that sense only there is no sink, only a transfer between the interfaces.
When one describes sinks or sources that are extraneous to this concept, biomass, fossil fuel burning respiration etc you have to realize that if they did not exist there would still be an overwhelming mass of CO2 in the atmosphere at close to the same ppm.
[ This is one of those hypotheticals where everything else is in current proportions]
–
” If not the atmosphere would be sucked dry of CO2.”
–
See, you just said it something totally unscientific because CO2 ….
Think about an earth where we turn off all non natural CO2 production.
The earth has massive amounts of CO2 in the ocean and more in the land underneath. Nothing would change.
The atmosphere would not be sucked dry of CO2 in a billion years.
If we stopped the earth would have to put in an extra 40 GGT to keep the amount of CO2 in the air for its current P/V/Substrate/Temp scientific causation.
“The extra human addition therefore must lead to an increase of CO2 in the atmosphere. If there was not a sink but instead a source the atmospheric CO2 levels would be much higher.”
–
No.
I have explained why above.
Additions and depletions on a minuscule scale, ie non natural or manmade have no bearing on the vast amounts of material in balance.
angech : “….. manmade have no bearing on the vast amounts of material in balance.”
And :
agnostic2015 | October 5, 2023 at 10:26 am | :
“….. It’s this that is fundamentally flawed – the idea of mass balance between sinks and sources. …..”
If the inlet mass flows to the system are bigger than the outlet mass flow then there is an accumulation of mass in the system – that’s how the mass balance works in all real systems :
All_inlets = All_Outlets + Accumulated
If not fulfilled then mass is destroyed.
Kind regards
Anders Rasmusson
It’s the wrong conceptual model for the carbon “cycle”. There is a virtually limitless source of carbon locked up in soils, deep ocean, and ocean beds, as well as rocks and vulcanism.
No mass is “destroyed”.
When the climate warms, the equilibrium between the source and sinks shift with sources out-stripping sinks ability to fix carbon. I gave examples above. This happens on short timescales (for example foliage growing and falling) and medium timescales (for example a branch falling off a tree or smaller organisms dying and decaying) and large timescales (for example an entire tree decaying).
This is also the reason why there is a lag. After a climate optimum, during which the biosphere has expanded, it takes time for the mass of biodegradation to be absorbed by processes such as photosynthesis.
These things are never truly in balance. It’s the idea that what ever is being emitted has to be immediately reabsorbed so that there is a fixed budget that circulates between sinks and sources that is wrong. And we know for sure that its not the case because we see fluctuations of more than 100ppm in the recent paleo record.
Agnostic, so am I getting this right in your scheme: the biosphere expands and contracts at all temporal scales, sometimes of greater total mass, sometimes lesser? And that this means a distinction between the living mass and the dead mass (organic matter not alive)? Sorry to ask basic questions, I need to orientate myself. Any expansion on this by you is welcome. Also, if all this is so, can we characterize some of the other reasoning in the comments as too mechanistic?
I am not sure what you mean by “mechanistic”, but yes – the idea of a “budget” with “net sinks” and “net sources” is faulty. The biosphere makes no distinction between whether CO2 is emitted from soils, oceans, or from human emissions. Sinks and sources are often the same – one is growing, the other is decaying.
The biosphere’s size is largely dependent on temperature. Things that draw down CO2 from the atmosphere (largely photosynthesis) are less temperature dependent than processes that release it from soils, oceans etc so there is an inherent imbalance. On all timescales we can measure reliably, we see that if it warms, atmospheric CO2 goes up, and if it cools, it goes down.
This is always lagged, because the size of the biosphere takes time to adjust. As it is warming, there is not enough biota to remove CO2 from the atmosphere, so atmospheric CO2 increases. The biosphere increases in size offsetting the increase from decaying biota. As it cools, it takes time for the biota that is already there to die off, and as it does it keeps CO2 levels reasonably high until it decays and a new equilibrium is met.
There are processes that release or capture CO2 nearly instantaneously, some that take a few days, months, then years, decades and finally centuries. I think my model of a tree is a good one to conceptualise: The tree’s foliage represents transient short term processes, the branch falling off in a storm medium term, and the entire tree long term. And that’s before we think about soils.
Just focussing on soils for the moment, degradation of biological material is nearly entirely dependent on temperature (water availability is also a factor). During cool phases, CO2 captured by living things that then die are trapped in the soil which is then buried by the next generation. That is in effect how we get fossil fuels – it’s the product of these processes. But during warm periods more of Carbon that is trapped can be released by decaying process which leads to greater CO2 concentrations in the atmosphere. The soil is emitting CO2 from a greater depth.
You can see this clearly in the stomatal record, and to a lesser extent foraminifera record.
It’s because of this that I think that “mass balance” or carbon “budget” is a faulty concept. It implies there is a fixed amount of CO2 moving from atmosphere to biosphere and back again. There is in fact a virtually endless source of carbon trapped in soils, rocks, deep ocean etc that is released when temperatures are increasing. Bartemius, who has commented on this also thinks it’s wrong but from dynamic systems point of view (his area of expertise I believe). I’ve just come at it from a slightly different angle.
We have the evidence of high resolution CO2 proxies, and from experiments on the decay rate of waste relative to the growth time from photosynthesis.
agnostic2015 | October 6, 2023 at 4:00 am :
”….. It’s the idea that what ever is being emitted has to be immediately reabsorbed so that there is a fixed budget ….. its not the case because we see fluctuations of more than 100ppm in the recent paleo record.”
And
agnostic2015 | October 6, 2023 at 6:59 am :
“….. I think that “mass balance” or carbon “budget” is a faulty concept. It implies there is a fixed amount of CO2 moving from atmosphere to biosphere and back again. There is in fact a virtually endless source of carbon trapped …..”
As you say, the “Inlets” is in principle never equal to the “Outlets”, so therefore the “Accumulation” is in the mass balance :
Inlets = Outlets + Accumulation
The “Accumulation” take all the fluctuations (variability) : dm/dt.
Only when the “Inlets” is equal to the “Outlets” the “Accumulation” is zero, no fluctuations (variability).
Kind regards
Anders Rasmusson
Accumulation in one reservoir or the other (either the biosphere or the atmosphere) is temperature dependent. When temps are rising the biosphere expands and CO2 rises. When temps are stabilise, then CO2 will continue to rise until the biosphere expands to meet the amount of CO2 from its sources that is released into the atmosphere.
That “mass” of CO2 comes from trapped CO2, which is trapped again when the climate cools and the biosphere contracts. In that sense there is mass balance.
My objection is that the idea of a “mass balance” implies a fixed amount that is transferred between sinks and sources. I think it is the wrong conceptual model, I am not saying that it is mathematically wrong. It’s reasonable, but not logical.
For example, human emissions are roughly twice the rate of atmospheric growth, but describing the biosphere as a “net sink” implies that we are fully responsible for that growth. There are plenty of people here that actually think that. But if we did not emit anything, atmospheric CO2 would still go up, because the limiting factor for biosphere growth is the amount of available CO2. That would make the biosphere a “net source”. That’s why I object to the characterisation of “mass balance”. It’s technically correct, but doesn’t describe what is happening in a useful way.
Agnostic: I see it, that the biosphere is expanding and contracting, possibly in a 1/f power law distribution, at every temporal scale. And because everything at the Earth’s surface and near surface is, to play a little loose with language, soaked in carbon, the total carbon mass potentially involved is much greater than currently modelled in more limited “budget” or “balance” approaches that do not cover the entire carbon inventory. Would you say? Or would you see it differently?
The next thing though, and I really don’t have an agenda here, how then does mineral carbon that is exhumed and burnt fit in? I don’t care if it’s humans and narratives involving all sorts of moral overtones, just see it as a geological process involving a certain mammalian organism. So T is already rising, for unknown reasons. The carbon-based biosphere expands due to greater heat energy, and this is happening in a cycle that began some centuries ago.
So I’m not clever here: how does the extra CO2 from exhumed and burnt mineral carbon fit in? It wouldn’t normally be a part of the biosphere’s carbon sources, right? Once released, does it add to a greenhouse effect in a significant way? Does it start doing bizarre things to the preexisting process of biosphere expansion and temperature rise? In particular, does it add a distinct accelerating component to that pre-existing temperature rise? Or not? I’m sorry for my ignorance and do hope you have the patience to respond, from your point of view.
You are absolutely bang on, as I see it.
I once read a remark from a scientist “nature has found a way to unlock its stores of carbon, but the agent for this is having an existential crisis about it”.
We only contribute a small amount to sources of CO2 annually – only around 4-5%. Annual variations of CO2 from natural sources vary by nearly twice our annual output – so whatever nature is doing to draw down the extra CO2 in one year, it is able to draw down our emissions in any year. What it means is, the biosphere is expanding very slightly faster than it would do if we were not emitting any CO2. Exactly how much is hard to say. We probably have helped accelerate atmospheric CO2 by a small amount.
Most CO2 proxies are insensitive once CO2 rises above a certain level. So most likely underestimate high levels of CO2 in the atmosphere. But if we conservatively suggest levels of around 380-390ppm in MWP when temps were similar, then the difference we experience today is probably our contribution – so maybe around 20-30ppm with the rest being absorbed into the expanding biosphere.
We’re ignorant of the scale and complexity of the C/CO2 system. But those invested in the anti-ACO2 narrative don’t need reflexively to repudiate the authors’ work; it’s still possible ACO2 is a T-accelerator even if it doesn’t cause the T-trend. Just embrace uncertainty. ACO2’s significance can’t be known until the C/CO2 system is better understood and other causes of the T-trend are better identified. For the former we need observation in places we haven’t been looking (terrestrial+marine). For the latter we need better research into causes of historical T-shifts during recent millenia.
“But if we did not emit anything, atmospheric CO2 would still go up, because the limiting factor for biosphere growth is the amount of available CO2. That would make the biosphere a “net source”. That’s why I object to the characterisation of “mass balance”. It’s technically correct, but doesn’t describe what is happening in a useful way.”
I am amazed that despite clear explanations from Ferdinand, Anders, and others of the consequences of what is being called “mass balance” (I prefer the term “carbon conservation”) many, including “Agnostic”, remain confused. At least he concedes that “Accumulation = Inputs – Outputs” is “technically correct”.
Carbon conservation is not only technically correct, it is quite useful in enabling limited simple conclusions to be drawn on the complex carbon cycle. Those who have taken a physics course know that applying conservation of energy to complex problems can almost magically shortcut detailed dynamical calculations and allow certain conclusions to be drawn. Yes, the carbon cycle has many unknowns. No, that does not negate the rigorous conclusion that land/sea reservoirs have been NET SINKS consistently for the last century. They have removed carbon from the atmosphere. They have not added it.
“Agnostic” asserts that atmospheric CO2 would have gone up in the last decade regardless of human emissions. His rationale is obscure: “the limiting value for biosphere growth is the amount of available CO2.”(?!). He would have us believe that, contrary to data, the biosphere has lost carbon in this period. He would have us believe that, contrary to data, the oceans have lost carbon and become less acidic.
Here is a description of what is happening that is intuitive, useful, and consistent with the data: Natural two-way exchanges between the atmosphere and oceans move a lot of carbon around, but the carbon that is emitted by the oceans was recently absorbed by them from the atmosphere. The gross fluxes are high, much higher than human emissions, but the net fluxes are not. Similarly, natural emissions from the biosphere were recently absorbed from the atmosphere, say by photosynthesis. Carbon was moved around, but again net fluxes were small. On the other hand, when the burning of fossil fuel adds carbon that had been sequestered from the fast carbon cycle for millennia to roughly balanced exchanges, the carbon content of the atmosphere (see Mauna Loa data) , biosphere (see testimonials to the observed greening effects of higher carbon levels), and the oceans (see data on ocean acidification) all go up. How can the biosphere get greener if it is losing carbon as “technically correct” carbon conservation demands? How can the oceans get more acidic if they are losing carbon?
David: “The gross fluxes are high, much higher than human emissions, but the net fluxes are not.”
I agree. The biome is exchanging CO2 constantly and the flux in both directions must fluctuate in rate proportional with global temperatures. Both, processes of reduction (life) and oxidation (decay), are positively temperature sensitive. It’s reasonable then that the Moana Loa CO2 signal represents this short-term carbon cycle modulation, fossil fuel emissions, and both superimposed on the Henry’s law governed equilibrium potential for CO2 to dissolve in the surface waters, where the velocity of CO2 flux is governed by atmospheric partial pressure, existing concentration in water bodies and the temperature of the water surface.
As has been pointed out the ocean surfaces are acidifying, showing uptake of CO2, which makes perfect sense the atmospheric CO2 is only rising at half the rate of fossil fuel emissions.
Taking fossil fuel out of the system, we can see from the paleo record that atmospheric CO2 lags global temperature by several hundred years, showing the slow uptake or release of CO2 regardless of the short carbon cycle of oxidation and reduction.
Because the ocean surfaces are overturning with deep water it takes ~800 or 1000 years to equilibrate. So any time in the paleo record we should expect the oceans would be taking up CO2 at times when the surface temperatures were colder than the trailing 800-year average or releasing CO2 if warmer than average, assuming the short carbon cycle remained in equilibrium and no new previously sequestered CO2 entered the system.
The question comes down to how much carbon the biome can sequester or release from sequester on a decadal or centennial scale and how sensitive is it to temperature. What evidence is there that carbon is being released from sequester besides fossil fuel?
Ron Graf: “Taking fossil fuel out of the system, we can see from the paleo record that atmospheric CO2 lags global temperature by several hundred years, showing the slow uptake or release of CO2 regardless of the short carbon cycle of oxidation and reduction.”
There are processes that emit and remove CO2 nearly instantaneously, some that over months, some over years, some over decades and some over centuries.
There is plenty of evidence in stomata and foraminifera high resolution proxies that atmosCO2 can change as much as 100ppm <100 years. CO2 lags temperature on ALL timescales. Carbon residence time in soils varies between a few years to 250 years depending on the ecosystem.
https://www.sciencedirect.com/science/article/abs/pii/S0921818112001956
"Mean residence time (MRT) of topsoil carbon (SOC) turns over within years or decades."
https://www.sciencedirect.com/science/article/pii/S0016706122001173
"We distinguish two forms of soil C: ‘ephemeral C’, denoting recently-applied plant-derived C that is quickly decayed to CO2, and ‘lingering C,’ which remains in the soil long enough to serve as a lasting repository for C derived from atmospheric CO2. "
https://www.sciencedirect.com/science/article/abs/pii/S0341816221001302
"The results showed that significant regional differences were found in the MRTa and MRTs in the surface upland soils (0–20 cm) across China, in which the longest MRTa and MRTs values were 72 d in the north China and 24.0 yr in the northeast China, the shortest MRTa and MRTs values were 12 d and 4.7 yr, respectively, both in the south-central China, while relatively small regional differences were observed in the values of the surface paddy soils (0–20 cm)."
https://agupubs.onlinelibrary.wiley.com/doi/pdf/10.1029/2009JG001004
"Estimated mean residence times of carbon ranged from 2 to 10 months for metabolic litter and microbial biomass pools, from 1 to 3 years for foliage, fine root biomass, and structure litter pools, and from 17 to 1362 years for woody biomass, slow and passive soil organic matter pools at three forrest sites".
This is clear then; there is a temperature dependent reservoir of carbon that can be emitted or captured to and from the atmosphere across timescales of days to centuries.
Agnostic: “There is plenty of evidence in stomata and foraminifera high resolution proxies that atmosCO2 can change as much as 100ppm <100 years."
Sure. In a scenario before fossil fuels if the temperature were below the millennial average and was rising CO2 would be being emitted from the oceans reinforcing the CO2 being released from accelerated release from warming soils. But as soon as an increase of 100ppm could occur the reverse forces of absorption from increased photosynthesis and the then absorbing oceans. So the oceans would act as a stabilizing governor.
Today, at 420ppm the oceans are aggressively absorbing CO2, accounting for half the current fossil fuel emission or about the same as the amount accumulating in the atmosphere. BTW, if this is right then if FF emissions are halved the atmosphere would stabilize at ~420 ppm. If FF ceased then atmospheric CO2 would fall a few ppm/yr.
Your comment: https://judithcurry.com/2023/09/26/causality-and-climate/#comment-994290
…is the most reasonable one so far in this discussion.
However: “But as soon as an increase of 100ppm could occur the reverse forces of absorption from increased photosynthesis and the then absorbing oceans. So the oceans would act as a stabilizing governor.”
Do you have evidence that at 100ppm above an arbitrary level the “forces of absorption” would be reversed?
2nd point, the oceans do appear to somewhat act as a governor, however, they also net emit CO2 during transient warm periods, and there are other factors that seem to influence CO2 absorption by the oceans. Foraminifera tiny shellfish whose shells absorb carbon and depending on the atmospheric CO2 of the day a proportion of 14C which can act as a proxy for CO2 concentrations, and the paleo record shows high variance.
I haven’t read anything that convinced me that oceans were the principle regulator of CO2, other than they appear to respond similarly to land-based biota, but with some added complexity. By concentrating on soils, which for all their complexity are simpler to understand than oceans, and are the largest source of CO2 during warm phases, I hope I am showing how it is that atmospheric CO2 can be driven by temperatures and not the other way around.
https://iopscience.iop.org/article/10.1088/1755-1315/237/2/022009/pdf
“The correlations between the growth rate of atmospheric CO2 concentrations and the El Niño–Southern Oscillation (ENSO) events are well known.”
Agnostic, the ocean’s CO2 dynamics seem easy to understand. Waters are either supersaturated with CO2, emitting it, at a particular temperature and concentration (and PH), or they are not yet saturated and dissolving CO2 from the atmosphere. The rate in either direction is proportional to size of the gradient, the distance to the equilibrium, the saturation point. This will vary locally due to the local chemistry and temperature but will produce a global net result on the atmospheric CO2 mass balance, being either a net sink or net source of accumulation.
You and Demetris have met the mass balance issue by claiming the system boundary is growing or ill-defined. That is a confusing argument. The mass balance is physics 101 and must be answered. If the system boundary is drawn at the wrong place you should clarify things by stating why the boundary has changes proportionally with GMST during ENSO, or multi-decadal oscillation, or paleo cycles. But even if this fluctuates fossil fuel CO2 must be accounted for. The biosphere is either a net sink or source over the past 100 years. It can’t be both.
Firstly, the oceans are far more complicated wrt CO2 than you have characterised. Deep waters are richer in C than warmer shallower waters and CO2 can be brought to the surface by upwelling currents. CO2 drawn down from exchange with atmosphere can be very quickly absorbed by photosynthesis:
https://en.wikipedia.org/wiki/Algal_bloom
I’ve read several papers on ocean CO2 uptake and they are contradictory, uncertain, highly complex. The simple henry’s law gas transfer just doesn’t cover it. Suffice to say that paleoclimatologic evidence from foraminifera show high variance in line with stomatal proxies indicating that while they are probably less sensitive to atmospheric temp change, they nevertheless run in the same direction.
” The mass balance is physics 101 and must be answered. ”
No it doesn’t because it is trivially true. It’s unimportant. Your insistence on it is the source of confusion. It ONLY matters if there is fixed or very limited amount of carbon moving from atmosphere to biosphere, but that isn’t the case. The carbon is locked up in soils, seabeds, organic matter yet to decay, and that reservoir is almost limitless. The carbon is there waiting to be released by warmer temperatures.
Worrying about whether mass is conserved is completely missing the point. I’ll state again – there is virtually limitless amount of carbon that is locked away. Obviously it is finite but from the point of view of the changes we are talking about, worrying about how much that is pointless. It’s more than enough to increase atmospheric CO2 levels to 1000s even 100,000s ppm. Most of the planets atmosphere was CO2 originally, before stromatolites came along and turned into O2 – trapping carbon in the process.
You are saying the material balance is unimportant when the reservoir is large. So in essence your model is that half the FF CO2 is being sunk into the overwhelming reservoir while the increase in the atmosphere is controlled by global temperature. This is plausible but is falsified in my judgment by the plot of Moana Loa CO2, the Keeling Curve. The thermometer record does not follow that curve.
While the showing CO2’s short-term response to temperature is an important addition to the knowledge base, it does not sync with the Keeling Curve, which is indicative in the long-term of accumulation, not temperature response. Although temperature may be having multiple influences on atmospheric CO2, the simplest explanation is that they are simply modulating the rate of the sink into the biosphere, which now is about half the rate of accumulation.
“The gross fluxes are high, much higher than human emissions, but the net fluxes are not.”
That’s not correct at all. What evidence do you have for that? Because there is a lot of evidence showing that the opposite is true.
“How can the biosphere get greener if it is losing carbon as “technically correct” carbon conservation demands? ”
Because there is a lot more carbon trapped in soils than is moving between the biosphere and the atmosphere as a “cycle”. There is effectively an endless amount trapped that can be released if temperatures warm. We know this for sure, because if it didn’t, we wouldn’t have fossil fuels, which is trapped carbon that until now has not been released.
https://www.sciencedirect.com/science/article/pii/S016819232300254X
“Soil respiration in terrestrial ecosystems is critical for assessing the net ecosystem carbon (C) balance, because it represents the second largest global C flux (100 Pg C yr−1) between ecosystems and the atmosphere (Bond-Lamberty et al., 2018). This amount is more than 10 times what is currently produced by fossil fuel combustion. Thus, even a small change in soil respiration could substantially affect current changes in atmospheric CO2.”
Those small changes are triggered by changing temperature:
https://pubmed.ncbi.nlm.nih.gov/15142802/
Temperature is one of the most important factors affecting microbial growth and biological reactions.
https://www.sciencedirect.com/science/article/abs/pii/S0045653505004765
“Northern summer temperatures in the region 30–60 °N…have become relatively more closely correlated with CO2 increment. This trend has become increasingly stronger in recent years, suggesting an increasing role for growing season processes in the northern midlatitudes in affecting global CO2 increment. Once non-lagged annual tropical temperature variations are accounted for, terrestrial ecosystems, especially the temperate-boreal biomes, also show a coherent large scale lagged response. This involves an inverse response to annual temperature of preceding years centered at around 2 years before. This lagged response is most likely linked to internal biogeochemical cycles, in particular N cycling.”
The problem with the “mass balance” argument which you are championing here, is that while mass is obviously conserved, for the purposes of describing the carbon flow between biosphere and atmosphere it is misleading. There is not a fixed amount of CO2 that flows between them. If there was, you would not have an increase of CO2 during past warming which we can see very evidently in the climatological record, and we can see on short timescales, by amounts that are much greater than human contributions. The proportion that makes up that variance has to come from somewhere, and that somewhere is the biosphere, especially soils.
Because the processes that govern biodegradation are more temperature dependent than processes that govern photosynthesis, during warming periods, carbon moves from the reservoir where it has been trapped into the atmosphere.
But because humans emit more CO2 than the atmosphere is increasing by, the “budget” approach implies that the biosphere is a “net sink”. But that is faulty thinking. The biosphere does not make a distinction between CO2 from humans and naturally emitted CO2. It expands with the availability of CO2, the net sink approach disguises that fact and were we not contributing CO2, atmospheric CO2 would still be increasing, just as it has done in the past during warming phases.
Sorry, I don’t know how to reply to every single comment because lack of the word “Reply” at some commenters, so here a reply to :
Agnostic | October 6, 2023 at 6:02 pm | :
“….. But if we did not emit anything…..”
Two comments :
1. If the industrial era was not established then the atmospheric CO2 concentration variability would have continued as before.
2. If we today completely stop emitting fossil CO2 then the atmospheric CO2 concentration will drop at the same speed as the the Nature, land and oceans, today is receiving CO2 from the atmosphere.
“….. the idea of a “mass balance” implies a fixed amount that is transferred between sinks and sources. I think it is the wrong conceptual model……It’s technically correct, but doesn’t describe what is happening in a useful way.…..”
The system mass balance (conservation) has to be fulfilled – if violated, the mass is either destroyed or created (not applicable).
As commented above an amount of carbon have been lifted from one system, the fossil source, and its mass balance then says :
InletsF (~0) = OutletsF + AccumulationF
==>
AccumulationF = – OutletsF
We, accurately enough, know those terms.
That same amount have been transferred to and accumulated in another system consisting of the Atmosphere and the Nature (oceans and land).
The mass balances for those two systems, here the Atmosphere :
InletsA = OutletsA + AccumulationA
We, accurately enough, know the AccumalationA from the last six decades of air analysis (Mauna Loa).
Here the Nature:
InletsN = OutletsN + AccumulationN
We don’t accurately know those single terms.
The atmospheric mass balance can further be expanded from above :
InletsA = OutletsF + OutletsN
OutletsA = InletsN
So for the atmospheric mass balance we get :
OutletsF + OutletsN = InletsN + AccumulationA
==>
OutletsF – AccumulationA = InletsN – OutletsN
As pointed out above we know the left hand part during the last six decades and then the right hand part is exactly equal to that – in other words the Inlets to Nature is bigger than the Outlets from Nature. Then we also know how much have been accumulated in the Nature during those six decades :
InletsN – OutletsN = AccumulationN
That AccumulationN, known from the atmospheric balance as above, have been distributed between the oceans and the land, whose individual mass balances are much harder to specify but have been done to lower accuracy.
Further information about that, please, see also comments from Ferdinand Engelbeen above and his :
http://www.ferdinand-engelbeen.be/klimaat/co2_origin.html
Logic reasoning, statistical, causality analysis and mathematical models all have too obey the mass balances (conservation of mass).
Thats all for now
/ Anders Rasmusson
“1. If the industrial era was not established then the atmospheric CO2 concentration variability would have continued as before.”
No. I am disputing that. CO2 concentration varies greatly over timescales of centuries – from about 100ppm <100 years. There is plenty of evidence for that. This is a lagged response to changes in temperature. If you think this is no longer occurring then you need to explain why not occurred previous warm periods and not today, leaving only anthropogenic sources to account for the rise.
"2. If we today completely stop emitting fossil CO2 then the atmospheric CO2 concentration will drop at the same speed as the the Nature, land and oceans, today is receiving CO2 from the atmosphere."
No. Also not correct. The biosphere expands and contracts in response to increased CO2 available and finds equilibrium after warming has stopped. That's what occurred in the past and there is no reason to think it would not occur now.
"The system mass balance (conservation) has to be fulfilled – if violated, the mass is either destroyed or created"
That's true but trivial in the context of the carbon cycle.
Photosynthesis and biodegradation occur at different rates depending largely on temperature. Photosynthesis is LESS temperature dependent than so if it warms, there is faster decay which releases CO2 into the atmosphere than there is photosynthetic processes there to remove it – hence atmospheric CO2 increases.
The CO2 comes from trapped Carbon in the ground, in leaf litter, in woody mass that is decomposing etc. No mass is destroyed or created, but the reservoir of trapped carbon is vast and is tapped into when temperatures increase.
"Logic reasoning, statistical, causality analysis and mathematical models all have too obey the mass balances (conservation of mass)."
As I say, that's true but trivial, unimportant and misleading. The idea of "mass balance" implies that the amount of carbon circulating is fixed. It is NOT. It increases because stores of carbon in the soils or in decaying vegetation release FASTER during warming periods, and continue to build even after warming stops because biosphere fixing it has yet to catch up. That is why there are lags, short term for quick repossess and long term for large vegetation accumulation.
Reply to
Agnostic | October 7, 2023 at 4:27 am | Reply
One final comment :
If your data, covering the “Mauna Loa era”, obey the mass balance formulas as above then you are right.
Kind regards
Amders Rasmusson
“He would have us believe that, contrary to data, the biosphere has lost carbon in this period.”
No – just the opposite. I would have you believe that the biosphere has EMITTED CO2 from its soil reserves due to warming. Most carbon on the planet is trapped there and on sea floors, and is released during warming events.
“He would have us believe that, contrary to data, the oceans have lost carbon and become less acidic.”
No I have not discussed oceans. Warming oceans has a similar effect on photosynthetic lifeforms such as algae which expand the biosphere, but they are more complex and even more uncertain.
The biosphere is both a source and a sink, and a net sink. The ocean is not acidic, it’s alkaline, but dissolved CO2 renders it less alkaline.
A second general comment for some particular “authorities” posting here comments, only a few of which I have replied to.
They perhaps don’t know it, but their style of writing is not new. For instance,1900 years ago Aelius Aristides described (in his work «ὑπέρ τῶν τεσσάρων» / “huper ton tessaron”) this style in this way:
«προπηλακίζουσι δ’ ὡς κρείττονες, δύο τοῖς ἐσχάτοις καὶ τοῖς ἐναντιωτάτοις ἔνοχοι κακοῖς ὄντες, ταπεινότητι καὶ αὐθαδείᾳ» (Greek text available in open access via archive.org).
(“they are insolent as if they were of higher rank, since they are involved in the two most extreme and opposite evils, baseness and willfulness” (translation by Charles Allison Behr, in: The Complete Works By Aelius Aristides, Volume 1, Brill, 1981).
In a modern context, some reading about the Dunning–Kruger effect would also be useful for all of us.
The problem as I see it, is that people are stuck on the carbon “budget” – the “mass balance” conceptual model. They see that net sinks are increasing, but do not see that net sources are as well, thus the increase taking the budget “over” is due to human emissions. Human emissions do contribute, but only by a small amount relative to the variability of other natural sources.
A common comment is that the mass has to be conserved, without noticing that soils (and the oceans to a lesser extent) act as a vast reservoir that can act as a source of carbon and that its tapped into during warm periods. That means that “budget” is not fixed regardless of anything humans do.
That they are stuck on this is hardly surprising – it has been received wisdom for a long time, and these paradigms are extremely difficult to shift even in the face of over-whelming evidence.
Agnostic,
1. Soil is part of the land/sea reservoir and is included in the statement “land/sea reservoirs have been net sinks in the Industrial Era” as deduced from carbon conservation. Soil takes in carbon as well as emitting it. If land/sea reservoirs were emitting more than absorbing because of temperture inceases, atmopsheric CO2 accumulation would exceed anthropogenic emissions.
2. Pointing to paleoclimate data is irrelevant. That “net global CO2 uptake” is positive is an Industrial Age empirical fact and did not always hold as atmospheric CO2 levels fluctuated in the geological past.
3. Your confusion is evident in your statement “net sinks are increasing, but net sources are too.” When we say a reservoir is a net sink, we mean that gross absorption is exceeding gross emissions. We don’t have a good handle on the size of the gross fluxes. Carbon conservation only determines the net flux, and definitively determines that land /sea reseervoirs are net sinks. They cannot be net sources ar the same time.
“If land/sea reservoirs were emitting more than absorbing because of temperture inceases, atmopsheric CO2 accumulation would exceed anthropogenic emissions.”
No – and this is why the “mass balance” model is so misleading. As CO2 increases, the biosphere ITSELF expands. This offsets the amount of CO2 building up in the atmosphere. And this will continue for a good while AFTER warming has stopped as the biosphere (sinks) catches up.
2. No, pointing to pale climate data is NOT irrelevant because it is how you put in context what is going on today. Atmospheric CO2 did fluctuate in the past and is extremely highly correlated with temperature. That is the point – CO2 nearly ALWAYS lags temperature, on every timescale that we can reliably measure including today. You cannot ignore that reality.
3. “Your confusion is evident in your statement “net sinks are increasing, but net sources are too.”
I should have not included the word “net”, but the principle is the same. Sinks and Sources are BOTH increasing, with sinks catching up. That would be the case even if we did not emit CO2. If we were not emitting, the biosphere would be a “net source”. It’s misleading to think in that way.
You are right we do not have a good handle on the size of the fluxes which is why we turn to how CO2 and temperature behaved in the paleoclimatological record!
Demetris –
> second general comment for some particular “authorities” posting here comments…
Which posters are you referring to? I see many commenters here including yourself, who write with great authority about their views. Often times, statements about matters where there is much uncertainty are not expressed as opinion, but as statements of fact. I wonder if there’s a selectivity in where you identify this phenomenon.
Selectivity? Perhaps….
But isn’t the “phenomenon” real?
Of course it’s real.
Our local binary red dwarf continues to belch omnidirectional gaseous perturbances; full of sound and fury, signifying nothing.
Demetris,
Indeed, despite 550 comments on this site you have not addressed the carbon conservation argument except to say that natural gross fluxes are much bigger than human ones, as we all agree. You must realize by now the clear demonstation that for the last century natural land/sea reservirs are net sinks is a big probem for your model. That is, it falsifies your conclusion.
You began your paper with a discussion of how Einstein overturned conventional wisdon, implicitly associating yourelf with him as you sought to overturn climate science. But Einstein understood the theory he was contesting, while you have shown that you did not understand all the argument of climate science.
You also quoted Carl Sagan on the necessity in science to challenge and make people uncomfortable with innovative ideas. I overlapped with Carl Sagan for 15 years in the Cornell physics department, knew him and greatly admired him. He had integrity. If one of his ideas turned out to conflict with data, he would willingly retract it. The question I have is whether you have the same integrity as the man you quote.
Thank you, David! Yes, the land and sea are net sinks, but this does not falsify our conclusion. Our conclusion is that our Figure A1 reproduced above (from our Appendix A1) is correct. Please see the red bars, as well as the totals. I must thank some commenters here who provided arguments and explanations of its correctness–in particular Agnostic.
I do not think we mentioned Einstein. Rather, we mentioned Michelson’s and Morley’s measurements. It is thus arbitrary to say that I “implicitly associating [mys]elf with him [Einstein]”. It would be laughable if I did. Although I’m all for a laugh, I wouldn’t dare make a fool of myself that much.
I did not know Carl Sagan (or Einstein), but I think I can quote their phrases I find neat, regardless of the answer to your question about my integrity, which I feel unable to answer. So you may keep wondering. However, as I wrote in my comment above (September 29, 2023 at 2:19 am), the discussion here “increased my confidence that we have done our duty as scientists by doing this (fully unfunded) research and by presenting these findings, which are correct and important.”
Demetris,
Agnostic asserts that if human emissions had never happened, atmospheric CO2 would still have risen more or less as it did. I assume you agree with him as you have endorsed his positions. I most certainly do not agree. Perhaps this way of posing the question sharpens and clarifies our disagreement and is preferable to an abstract discussion of causality in a complex system.
A world without human emissions is a counter factual situation for which we have no data, but we can still test whether Agnostic’s assertion is reasonable.
Using numbers from your A1 plot, here are real world numbers:
Human emissions 9.4
Atmospheric accumulation 5.1
Net global uptake 4.3
In the counter factual world with no human emissions
Human emissions 0
Atmospheric accumulation 5.1 or so
Net global uptake -5.1 or so
Does it make sense to a hydrologist that removing the human emissions would cause the natural world to change from a net sink to a net source? I know it bothers Agnostic enough that he thinks carbon conservation is “misleading”.
David, please note that the biosphere is included in the definition of the climatic system, not only the one I proposed (I have given a reference above), but in the more generally accepted definitions, such as that of WMO. Once the biosphere is included, the climatic dynamics becomes overly complex–and this is reflected in the complex response of the atmospheric CO2 to temperature changes, as revealed in paleoclimatic reconstructions. This response is not the same in all periods, because the biosphere may change a lot. For example, copying from Appendix A5 of our paper, “Veizer et al. […] presented evidence for decoupling atmospheric CO2 and global climate during the phanerozoic, questioning the role of the (partial pressure of) CO2 as the main driving force of past global (long-term) climate changes, at least during two of the four main cool climate modes of the phanerozoic.”
Since you highlight my speciality in hydrology, may I take the opportunity to refer you to my paper “A random walk on water” (Hydrology and Earth System Sciences, 14, 585–601, doi:10.5194/hess-14-585-2010, 2010.) In that, I present a toy model focusing on water availability, which contains a little bit of biosphere, with ridiculously simple dynamics. You will see the changes produced by the system itself (despite its low dimensionality and fully known deterministic dynamics–because it is intensionally a simple toy model) without any external forcing.
So, based on my experience, with respect to your question about what would happen in a counterfactual world with no human emissions, my reply is that again the climate would change, including the concentration of CO2. What would be the direction and the balance, I cannot tell. But I am confident about the change, because the change has been the rule in the past.
Clarification: My phrase “What would be the direction and the balance, I cannot tell” is meant in an unconditional setting, i.e. if we know nothing specific of this would-be world. In a conditional setting, such as knowing that temperature has increased, we could predict the direction, i.e., that the [CO2] would increase.
David Andrews: “on this site you have not addressed the carbon conservation argument”
Demitris didn’t say it, but the point is he doesn’t have to! It is outside the scope of the paper.
The paper (and there are others that come to a similar conclusion) merely asserts that CO2 cannot be causing the warming, because CO2 *LAGS* warming. The causality is the wrong way around. This paper is just robustly showing that CO2 lags temperature.
I am on here trying to point out that in my reading the mechanism for this is clear, because a lot of people, including you, are stuck on “but where did the CO2 come from?” question or the “mass balance argument” which implies that the amount of CO2 moving between the biosphere and the atmosphere is fixed. Even the IPCC discuss this but only in the context of manmade land use changes.
“You must realize by now the clear demonstation that for the last century natural land/sea reservirs are net sinks is a big probem for your model. That is, it falsifies your conclusion.”
No it does NOT falsify his conclusion. Your reasoning about “net sinks” is what I have been trying to tackle in my discussions. It is faulty.
HIS conclusion is about the temporal arrangement of CO2 and temperature. It confirms other studies. EXPLAINING why that is, is down to OTHER studies. I have read papers that touch on this, especially wrt paleoclimate, and this is what I am trying to explain.
I’ll try once more: sinks and sources are BOTH expanding. The sinks increase in size dependent on the amount of CO2 (its the main limiting factor in plant growth) and sources grow in response to warming.
Sources are MORE temperature dependent than sinks, so when there is a temperature change THEY MOVE FIRST. Sinks take time to grow and expand to adjust to the availability of CO2 and this is why there is a lag. It’s the warming that drives increase in atmospheric CO2 as it takes longer for sinks to grow in order to remove it from the atmosphere. That’s the reason for Demtris’s and others results wrt to causality.
If you dispute this, then you need to show that:
a) biodegredation is NOT heat dependent or
b) photsynthesis and biodegradation move at exactly the same time.
c) carbon cannot be trapped in soils and therefore fossil fuels cannot exist
d) explain why CO2 lags temperature in paleo record on all timescales and why it is no longer doing so now.
My recommendation to you is to let go of the notion of a “budget” and using the words “net” to describe sinks and sources. It’s not because they are wrong, it’s because it is the wrong conceptual model leading to a false conclusion. The “budget” changes.
Thank you demetriskoutsoyiannis, and agnostic for both the science, and rounded commentary; it’s all been very engaging, which is what science should be.
Thanks, Jungletrunks, for your kind comment.
Demetris,
You wrote, “the land and sea are net sinks, but this does not falsify our conclusion.”
Except that it does. Temperature does not magically create CO2 molecules. If atmospheric CO2 is rising because of temperature, those CO2 molecules must be coming from somewhere – either land or oceans. Since both are net sinks, the increase in CO2 can’t becoming from the land or the oceans. However, we are emitting carbon at sufficient rates to account for all the increase in atmospheric CO2. Your paper literally includes its own refutation.
“It is therefore mathematically impossible for your analysis to say anything about the human contribution”
Mathematically impossible? Why? If the graphs on our quiz were the opposite of what they are now, what would be the conclusion?
Unless we have the conclusion already drawn (everything is due to fossil fuel burning), and everything that contrasts it should be rejected…
“Your paper literally includes its own refutation.”
Is that because “Temperature does not magically create CO2 molecules.”
Did we say that temperature creates CO2 molecules?
Demetris and Agnostic,
Figure 3 in this link does not suggest that the current CO2 growth is just natural processes doing what they have always been doing.
https://www.unep.org/news-and-stories/story/record-global-carbon-dioxide-concentrations-despite-covid-19-crisis
Demetris and Agnostic,
1. You both agree that natural land/sea reservoirs have removed more mobile carbon from the atmosphere than they have emitted in recent decades. That net global uptake, defined as the difference between human emissions and atmospheric accumulation, has been positive for the last century is an undisputed empirical fact. To say that this does not need to be addressed by someone asserting that these same natural reservoirs are the primary cause of the atmospheric rise (even while they are on balance removing carbon from the atmosphere) is absurd. It is very much within the scope of any analysis of human responsibility for CO2 rise. No credible analysis can pick and choose which empirical facts it addresses.
2. Of course temperature influences CO2 levels. Ferdinand has been over that in detail. The only thing in dispute is the root cause of the decadal trend that most of us are worried about. The root cause of the decadal trend does not have to be the same as the root cause of seasonal variations.
3. You, especially Agnostic, postulate all this temperature-driven new carbon coming into play. You argue that “sources move first”. Why then did this not make net global uptake negative, instead of positive as is observed? You characterize the conservation of carbon argument as “technically correct but misleading”. You see it as “misleading” only because it falsifies your model.
4. You both want to bring in paleoclimate records of CO2. Figure 3 in the attached link shows data you want me to consider. https://www.unep.org/news-and-stories/story/record-global-carbon-dioxide-concentrations-despite-covid-19-crisis This plot does not tell me that the present situation can be dismissed as “just the usual natural variation”. It is qualitatively different.
Thank you, David, for the additional comment.
I never understood why you (and others) insist on highlighting “net” in uptake, sink etc. Does this add any important information? Well, at any time any part would be either a net emitter or a net sinker. (With probability one, we can exclude the case that emissions precisely equal sinks in each part.) Furthermore, if there is a net emitter (humans) it is reasonable to expect at least one net sinker. It would be unreasonable to expect that all parts are net emitters simultaneously, as this would lead to the improbable (and thus with lower entropy) situation where all changes are dealt with (gathered) by the atmosphere alone.
In addition, you insist on the mass conservation of carbon. Why? Did anyone dispute it? Did our Figure A1, also reproduced above, violate the mass conservation? On the other hand, do you think that just one equation suffices to explain everything in our complex world?
As per the decadal trend: we have shown in the paper (section 6) that it is explainable by the same principles as those for the shorter scale changes. It wouldn’t be justified to add another principle once a single one can cope with the entire phenomenon over the 60-year period covered by instrumental data.
The link you provide is to a political organization (UNEP), and I do not trust political organizations promoting political agendas. Also, I do not trust politically driven “science”. In particular, their figure 3, mixing up data from radically different time scales, is problematic. I have explained why in another reply above. To avoid repetition, please search for the phrase “If interested, you may see my Figure 4 in the replies to reviewers of Round 1”, follow the link I provided and see that Figure 4 in the Author Response.
Demetris
You write: “On the other hand, do you think that just one equation suffices to explain everything in our complex world?”
The one equation in question does not explain everything. It, combined with uncontroversial data, only demonstrates that natural reservoirs are net sinks.
I am puzzled why you have difficulty understanding the importance of the word “net” in front of sources and sinks. It is essential to the argument. Gross fluxes are not as well known.
[Thank you for posting my comment over the weekend when I was impatient with the review process.]
Thank you, David. I see you are now convinced that I do not dispute the mass conservation. I do not dispute that the natural reservoirs, at present conditions, are net sinks. I do not dispute that the fossil fuel emissions contribute to the carbon balance (at a rate of 9.4 Gt/year out of a total increase of 50.2 Gt/year since 1750, as seen in our figure which is a summary of IPCC’s). But none of these proves or even suggests a causality direction [CO2] -> T.
See also Agnostic’s comment: https://judithcurry.com/2023/09/26/causality-and-climate/#comment-994205
Furthermore, see Agnostic’s question “When did emissions begin and when did temperatures rise?” in https://judithcurry.com/2023/09/26/causality-and-climate/#comment-994323
For an additional analysis of this question, see our section “SI2 On correlations of temperature with CO₂ emissions” in the supplementary information of our paper.
A correction: “at a rate of 9.4 Gt/year out of a total increase of 50.2 Gt/year since 1750” should read “at a rate of 9.4 Gt/year out of a total increase of 59.6 Gt/year since 1750”.
(50.2 is the difference, 59.6 – 9.4).
“1. You both agree that natural land/sea reservoirs have removed more mobile carbon from the atmosphere than they have emitted in recent decades.”
I am not sure about Demitris, but I do not agree with that. That is the fundamental thing I do not agree with, and I posted papers indicating that not to be true. Natural reservoirs of carbon have emitted MORE than has been removed from the atmosphere and that is why atmospheric concentrations have gone up.
“That net global uptake, defined as the difference between human emissions and atmospheric accumulation, has been positive for the last century is an undisputed empirical fact.”
And this is where you are getting confused, and to be fair you are in good company. The problem is the conceptualisation of “net uptake” or “net sources/sinks”. I’ll try again:
The relationship between atmosphere and biosphere is interdependent non-linear with one side dependent on CO2 availability and the other side dependent on temperature. There is virtually an inexhaustible amount carbon locked up in soils and decaying vegetation that is released when temperatures increase. Human emissions only add to that side of that equation…as if temperatures were slightly warmer (by about 4% – the extra CO2 released if temperatures were ~4% or so warmer).
The biosphere expands with the available CO2 and is larger, meaning transient (one paper described it as “ephermal”) CO2 also increases, but the expansion of the biosphere OFF-SETS the increase in CO2 in the atmosphere. This is why there is a lag between temperatures and CO2, and why if temps remain higher, so does CO2.
Agnostic,
You assert:
1. “Natural reservoirs of carbon have emitted MORE than has been removed from the atmosphere and that is why atmospheric concentrations have gone up.”
I hope you agree:
2. We humans have been net emitters.
If both of these statements were true, then atmospheric accumulation would have EXCEEDED human emissions. Data say otherwise.
The conclusion that 1. is false does not rest on “budgets”. It rests on a simple comparison of the two numbers we know best: atmospheric accumulation and human emissions, as clearly laid out by Pat.
“If both of these statements were true, then atmospheric accumulation would have EXCEEDED human emissions. Data say otherwise.”
No they would not. This is the point you (and so many others) get wrong.
Natural emissions HAVE gone up. Humans add 4% on top of those increase in emissions.
Why does accumulation not exceed human emissions? Because the biosphere has INCREASED in size and OFFSETS the accumulation.
It will continue to increase in size even after warming has stopped until an equilibrium has reached, and until it does CO2 will continue to accumulate.
2. “Ferdinand has been over that in detail. The only thing in dispute is the root cause of the decadal trend that most of us are worried about.”
Ferdinand makes a distinction between short term variance of CO2 driven by T and longer term. But this is where he is wrong. I have shown paper after paper (and in fact the IPCC show as well) that there are short AND long term processes releasing CO2 into the atmosphere. They range from days to millennia.
https://tinyurl.com/ydjn47nc
The longer term processes represent trapped carbon, in the same way fossil fuels are. These processes are more temperature dependent than photosynthesis, and that’s why temperature drives the rate at which they are released more than photosynthesis traps them again.
“3. You, especially Agnostic, postulate all this temperature-driven new carbon coming into play. You argue that “sources move first”. Why then did this not make net global uptake negative, instead of positive as is observed”
Because you are too focussed on the “budget” model and why I characterise the “mass balance” as “misleading”. It does not falsify my model at all. Mass is conserved – the mass comes from trapped carbon that is not part of short term cycles.
Consider the difference between foliage which falls each year – it is made up of trapped carbon from the atmosphere, and when it decays it releases that carbon back into the atmosphere, and a branch that fell from the tree. It decays much more slowly over decades. If it decays FASTER than the time it took to grow, then atmospheric CO2 will go up…BUT…it’s not the only source of CO2. Then consider an entire tree that has fallen. Then consider the huge amount of carbon locked in soils that were the temperature not sufficient to release them eventually become permanently locked away to eventually become fossil fuels.
“4. You both want to bring in paleoclimate records of CO2. Figure 3 in the attached link shows data you want me to consider.”
This is not paleoclimatological data. But it does show that increases in CO2 in the atmosphere are insensitive to mans contribution. I would prefer to you look at AR5:
https://tinyurl.com/2p95erhk
And compare it to temperature rise: https://www.woodfortrees.org/plot/hadcrut4gl
When did emissions begin and when did temperatures rise?
Then I would ask you to look at ice cores versus stomata: https://tinyurl.com/ycx32azx
And I could show you the same for foraminifera (which show high CO2 variability in the oceans) and you’ll see that CO2 variability is much higher than is shown by ice core proxies. It’s worth noting too that even stomata may be underestimating high levels of CO2 because most CO2 proxies (all that matter to us) become less sensitive at higher CO2 concentrations.
….oh and note that emissions rose precipitously during a period when temps were cooling. CO2 continued to rise in the atmosphere, but not as fast as emissions were. So CO2 rise ignored the changes in mans contribution, and it continued to rise as biosphere made a lagged response to the increase in CO2 availability.
The scientific argument has been rich and extended because when it is admitted that temperature changes precede CO2 changes, the whole justification for Net Zero collapses
I received by email the following comment by David Andrews, who says he was unable to post it, even though he tried twice. So I am attempting to post it for him, removing the link that may have caused the problem (?)
Demetris and Agnostic,
1. You both agree that natural land/sea reservoirs have removed more mobile carbon from the atmosphere than they have emitted in recent decades. That net global uptake, defined as the difference between human emissions and atmospheric accumulation, has been positive for the last century is an undisputed empirical fact. To say that this does not need to be addressed by someone asserting that these same natural reservoirs are the primary cause of the atmospheric rise (even while they are on balance removing carbon from the atmosphere) is absurd. It is very much within the scope of any analysis of human responsibility for CO2 rise. No credible analysis can pick and choose which empirical facts it addresses.
2. Of course temperature influences CO2 levels. Ferdinand has been over that in detail. The only thing in dispute is the root cause of the decadal trend that most of us are worried about. The root cause of the decadal trend does not have to be the same as the root cause of seasonal variations.
3. You, especially Agnostic, postulate all this temperature-driven new carbon coming into play. You argue that “sources move first”. Why then did this not make net global uptake negative, instead of positive as is observed? You characterize the conservation of carbon argument as “technically correct but misleading”. You see it as “misleading” only because it falsifies your model.
4. You both want to bring in paleoclimate records of CO2. Figure 3 in the attached link shows data you want me to consider. [deleted link for a UN site entitled Record global carbon dioxide concentrations despite COVID-19 crisis] This plot does not tell me that the present situation can be dismissed as “just the usual natural variation”. It is qualitatively different.
At the risk of unnecessarily repeating what others (Engelbeen, Simmons, Andrews, et al.) have said here, but in the hope of providing some clarification, I offer the following:
1. Conservation of mass, properly stated, says that the rate of change of the mass of CO2 in the atmosphere equals the amount of CO2 entering the atmosphere (per unit time) by whatever means, minus the amount of CO2 removed from the atmosphere (per unit time) by whatever means:
d(CO2)/dt = (CO2)in – (CO2)out
The units of (CO2)in and (CO2)out are CO2/time.
This equation holds at every instant, past, present and future; it holds instantaneously whether or not there are lags between forcing and response. It holds regardless of where and how CO2 is coming from, produced or removed.
2. We can say that the term (CO2)in is the sum of (CO2)ff and (CO2)inxx, where (CO2)ff is that due to burning fossil fuels and (CO2)inxx is that due to every other process, known or unknown, that puts CO2 into the atmosphere, be it biological, volcanic, chemical, or other.
So:
d(CO2)/dt = (CO2)ff + (CO2)inxx – (CO2)out.
3. The point of writing the equation in this form is, of course, because the quantities d(CO2)/dt and (CO2)ff are known reasonably well from observations. Roughly,
d(CO2)/dt = 17 Gt/year
(CO2)ff = 38 Gt/year
It any case, it is certain that d(CO2)/dt is less than (CO2)ff.
4. The quantities (CO2)inxx and (CO2)out may be (and are estimated to be) much greater than both d(CO2)/dt and (CO2)ff. But their difference must be, by conservation of mass, exactly equal to d(CO2)dt – (CO2)ff, or about -21 Gt/year, and certainly negative.
Now in the old days, when (CO2)ff = 0, a slight imbalance between (CO2)inxx and (CO2)out might have led to a potentially large rate of change, d(CO2)/dt, even greater than that of today. It could have been positive our negative. One can argue about whether there is evidence for such a large imbalance or not, but it doesn’t matter for what is going on today, because today we know what d(CO2)/dt is: it’s about 17 Gt/year.
Now suppose I insist that the current rise in atmospheric CO2 is primarily due to some component of (CO2)inxx, perhaps soils, much larger than (CO2)ff. That is, an imbalance in the ‘natural’ fluxes is responsible for the rise in CO2. Presumably such an imbalance would exist whether or not we are burning fossil fuels. But conservation of mass, and the known values of d(CO2)/dt and (CO2)ff then demand that the input component is (more than) offset by some component(s) of (CO2)out, because today (CO2)imxx – (CO2)out is observed to be negative. An imbalance in the non-fossil fuel fluxes cannot cause the current increase in CO2, regardless of whether they lead, lag or are otherwise related to some forcing.
So what about causality, the subject of this post? We already knew that temperature variations commonly lead CO2 variations in the paleo record, as they do with respect to ENSO and the annual fluctuations, observations consistent with Demetris’ analysis. But, as argued by many others here, his analysis, although sound in regard to fluctuations, does not yield useful information about causality for a monotonic component of the increase in CO2.
Demetris asked “Why…claim that variability and trend… have different causes?” Perhaps because a “different cause” was introduced when we started putting 30 Gtons/year of recently unavailable CO2 into the atmosphere.
Would this post have been so controversial had the authors not asserted that “…changes in CO₂ concentration have not been warming the planet…”? That statement seems to be supported only by the (suspect) extrapolation that “the time precedence of temperature can also explain what you call “trend’”. The time precedence found by Demetris and co-authors cannot explain the trend, when physical principles are accounted for. The introduction of fossil fuels does, without violating causality arguments.
Pat Cassen:
“1. Conservation of mass…”
This point is true but trivial. It would only be important if the amount of carbon circulating between the biosphere and atmosphere was fixed. It is not. The biosphere holds a virtually limitless supply of carbon that is trapped, either in vegetation or soils.
The problem with your equation is that it is linear. The term “(CO2)inxx” incorporates both randomly occurring events and sources that also have dependencies on “d(CO2)”!!
Some questions for you to answer:
1. If seasonally grown foliage (CO2 out) that falls does NOT fully decay during winter, what happens to atmospheric CO2?
2. If a branch that took 30 years to grow, decays fully in 25 years what happens to atmospheric CO2?
3. If a tree that took 150 years to reach full maturity takes 75 years to fully decay, what happens to atmospheric CO2?
Your equation disguises the interdependent non-linear relationship between the atmosphere and biosphere and is therefore unphysical.
Do you acknowledge that:
a) processes governing biodegradation are more temperature dependent than processes governing photosynthesis?
b) that the equilibrium is broken between atmospheric CO2 and biosphere is broken when temperature changes because of “a)”?
c) that the biosphere GROWS in response to more CO2 being available – ie the “fertilisation effect”?
The SOURCE for carbon that is released when temperatures increase is well understood – it is in biomass that has trapped Carbon already and releases it on timescales ranging from a few days to millennia. The reason why CO2 increase in the atmosphere is LESS than the amount of increase in CO2 from sources PLUS human emissions, is because the biosphere itself has increased in size which OFFSETS the increase of CO2 in the atmosphere.
Agnostic says:
“Your equation disguises the interdependent non-linear relationship between the atmosphere and biosphere and is therefore unphysical.”
Oh, oh.
It might help if you would write down your version of conservation of mass. Then put some numbers in. Equations are not metaphors; they have quantitative consequences.
Incidentally, for anyone interested in what the pros have to say about atmospheric carbon dioxide, check out https://www.annualreviews.org/doi/pdf/10.1146/annurev-environ-012220-125406
“Insights from Time Series of Atmospheric Carbon Dioxide and Related Tracers”
(open access)
“It might help if you would write down your version of conservation of mass. Then put some numbers in. Equations are not metaphors; they have quantitative consequences.”
I might do that, but before I do, you might try to answer my questions.
The problem with this whole discussion is that it is conservation of mass that obsessed over. It is unimportant in understanding the dynamics of the carbon cycle.
Try to understand: the amount of carbon that flows from one domain (the atmosphere) and the other (the biosphere) is not fixed. It isn’t REQUIRED to balance mass – there is in an over abundance of carbon sequestered in soils and decaying vegetation already.
Instead of worrying whether one side is balanced with the other (they will of course one way or the other) try to understand the relative speed of processes that draw carbon out of the atmosphere and those that release it into the atmosphere.
The processes that release carbon have a virtually inexhaustible supply of carbon to draw from, so worrying about mass balance is absolutely besides the point.
Agnostic2015:
“…you might try to answer my questions.”
The source of our disagreement is not how CO2 is transferred between the atmosphere and biosphere, so I suspect we would agree on the answers to your 1- 3, based as they would be on a common understanding.
Likewise for a) and c). (I’m not sure exactly what you mean by “the equilibrium… between atmospheric CO2 and biosphere”, so I’ll pass on b).
The source of our disagreement is your assertion that “conservation of mass … is unimportant in understanding the dynamics of the carbon cycle.” You seem to think that conservation of mass says something about the capacity of reservoirs, or some requirement about balancing absolute mass, or something similar. It doesn’t.
Conservation of mass is a constraint on the instantaneous rates at which changes of mass occur, whatever their sources, variability, relation to forcing, lags, leads, or sexual orientation. It’s really useful, especially when you know a couple of the key terms.
So that’s why it would be interesting to see your version of conservation of mass. Preferably in equation form.
I think Agnostic is trying to say …
C sub mass, soil >>>>> C sub mass, atmosphere
and
C sub mass, ocean >>>>> C sub mass, atmosphere
Where “>>>>>” means “wayyyyyyyyyy greater than” ;)
“So that’s why it would be interesting to see your version of conservation of mass. Preferably in equation form.”
Well, I’ve made a start on it as time allows, but you will not see any terms conserving mass. It will be all about differing rates of release and capture depending on temperature, interdependent and non-linear.
The reason I think conservation of mass is not applicable is for the same reason we don’t concern ourselves with it when considering the formation of clouds and/or their effect on sea level. The sea is virtually an unlimited reservoir for clouds.
Carbon is sequestered on time scales of days to millennia. Much of it is sequestered for so long a pink ape comes along, digs it up and burns it.
You should really consider answering by “b)” since it is crucial. During periods of temperature change – on ALL scales – the rate at which carbon is sequestered and released changes. Since the source is virtually inexhaustible, worrying about whether what is going into the atmosphere is the same as what is coming out is missing the point and why people are getting so confused. It leads people to assume that human emissions have caused the increase in CO2 without considering that CO2 maybe the limiting factor in expansion of sinks, and therefore CO2 would have accumulated in the atmosphere ANYWAY – as it has done in other warm periods in the holocene.
Instead of worrying about the absolute amount, because it is nearly impossible to know, worry about the flux rate and its TEMPERATURE dependency. That’s what “b)” is trying to get you to answer.
The scale of sources for CO2 is what is generally not appreciated. We are the 4% cherry on top.
Go on – give “b)” a go…
Agnostic –
“…worrying about whether what is going into the atmosphere is the same as what is coming out is missing the point…”
Correct. Conservation of mass neither requires nor implies that what is going in is what is going out.
“Instead of worrying about the absolute amount… worry about the flux rate…”
Agreed! Conservation of mass is a statement about how the flux rates are related to the rate of change of the absolute amount.
So we agree about that. We also probably agree on a lot about how CO2 is exchanged between atmosphere and biosphere.
But we disagree on the relevance of the (properly stated) conservation of mass law. A consequence of the law, when well-known quantities (rate of increase of CO2 in the atmosphere and rate of emissions due to fossil fuel burning) are accounted for, is that ’natural processes’ cannot account for the current increase in atmospheric CO2. The conclusion follows straightforwardly, as demonstrated, step by step, in comments by many here, including myself. It is independent of the complexities with which you are concerned.
You are reluctant to accept the quantitative consequences of the law; I believe they are robust.
The conclusion says nothing about causality. It is problematic if one accepts Demetris’ assertion that the current trend is temperature driven. I think his assertion is based on an unjustifiable extrapolation of an otherwise sound analysis of variability.
You get the last word.
” ’natural processes’ cannot account for the current increase in atmospheric CO2. The conclusion follows straightforwardly, as demonstrated, step by step, in comments by many here, including myself. It is independent of the complexities with which you are concerned.”
No it isn’t, which is why I object to the characterisation as a conservation of mass issue. The amount of carbon released from sources – just from land alone – is unknown. Only our contribution which around 4% is known with anything close to certainty. Those complexities are intrinsic.
We know fairly well, our contribution, and CO2 accumulation in the atmosphere. We know both sinks and sources must be expanding, because atmospheric CO2 has increased by half our contribution would have increased it by had everything else been equal. Beyond that the range of error is that we have contributed nearly all of CO2 rise to none at all.
I’ll repeat that: natural processes could account for ALL of post-industrial CO2 atmosphere increase. Not just a portion – but ALL of it. That’s because sources increase emitting CO2 proportional to temperature (within a certain range) and sinks absorbing them which expand offsets this increase, but always with a lag.
So if sources increased by an amount greater than sinks (although both increase because source from temp and sinks from CO2), then atmospheric concentration of CO2 would increase, but be offset by the increase in sinks. If our contribution had very little effect on atmospheric concentration because sinks adjust, then we would see it in the data….and whaddaya know, we do! Covid and the huge decline in emissions had no effect on atmospheric accumulation. Exponential growth since the 50s had almost no effect on CO2 levels. Flat growth since the 2000s had no effect on the rate of increase.
https://www.nature.com/articles/ncomms13428
Paul Roundy: “I’m not sure how people think they can assess causality in the long-term trend signal by looking at signals at any shorter timescale. ”
Because the processes that cause short term variations can also be the cause of longer term ones. What is a long term trend other than short term variations that add up one way or the other?
In the case of natural sources, there are very similar processes that cause short term variation (eg seasonal foliage decomposition) and medium-term (larger masses such as branches etc) and long-term (an entire tree). The main limiting factor that determines their rate is temperature. If temps go up, so does the speed at which they occur across all timescales.
Pat: “It is independent of the complexities with which you are concerned.”
Agnostic: “No it isn’t, which is why I object to the characterisation as a conservation of mass issue. The amount of carbon released from sources – just from land alone – is unknown. Only our contribution which around 4% is known with anything close to certainty. Those complexities are intrinsic.”
I’m very intrigued with this discussion. Is there conclusive science that defeats agnostic’s argument here? I’d like to see it, since alas, the AGW mantra is that AGW is absolutely settled science; AGW arguments about settled science have not been compelling.
I”m very interested in this discussion. Both demetriskoutsoyiannis and agnostic present arguments that consensus seemingly flounder upon.
Thanks agnostic, for your thought provoking contributions here.
@Pat Cassen – There are two primary issues being batted around. The first is mass balance. No one has said the mass of CO2 will not balance. This is not in contention.
The other issue is cause and effect. Does temperature drive up CO2 concentration, or does CO2 concentration drive up temperature. This isn’t an either/or situation. And the answer to this can depend on the time scale.
jim2 – Agreed.
Jim2 wrote: “… Does temperature drive up CO2 concentration, or does CO2 concentration drive up temperature. This isn’t an either/or situation. And the answer to this can depend on the time scale.
Honestly, I’m only interested in time scales within the last 65 years. We have measured data for this time period, and anthropogenic green-house gases are supposedly the main drivers of climate change over this same period.
The frequency domain analysis I’ve discussed previously is solid and it shows that, for periods of 2-10 years, CO2 lags temperature by six months. This matches Demetris’ result. It also shows that the annual process has less than a two-month lag.
For periods longer than 10 years, I’ve come up with a time-domain approach that may offer some qualitative insights. I’m not completely confident in the approach as there’s some subjective fitting of gain and offset. The single frequency parameter in my model is also subjective. So feel free to accuse me of over-fitting if you think it’s warranted.
My previous frequency-response computations suggested, both in magnitude and phase, that the CO2 response to temperature might be that of a single-pole low-pass filter, at least over the frequency range of 0.1-0.5 yr^-1. So I’ve created a model that filters the temperature data. This filtered result can be visually compared to the CO2 data.
Let me first describe the sequence of operations before I show you the result.
1. I apply a 12-month moving average to both the HadCRUT5 Northern Hemisphere temperature data and the Mauna Loa CO2 data. This gets rid of the annual process and attenuates some of the other higher-frequency energy that we don’t need.
2. I detrend both temperature and CO2 data by individually fitting and subtracting first-order polynomials. This leaves only the low-frequency fluctuations, and it doesn’t remove information that affects causality.
3. I apply a single-pole low-pass filter to the temperature data and plot it on the same scale as the temperature data. In other words, the gain and offset are unchanged.
4. I plot the CO2 data on a separate scale and manually adjust the scale limits. The sensitivity is shown in the y-axis label.
https://localartist.org/media/tempModelForCO2_annot.png
I’ve made some annotations on the result, but I’ll leave it to you to draw your own conclusions.
What’s interesting is that the Mount Pinatubo eruption, which likely injected a significant amount of CO2 into the atmosphere, appears to have caused CO2 levels to drop. Your thoughts on this? This is the only place where causality is briefly reversed. As the reversal starts before the eruption, there must be something else going on here as well. Also, CO2 and temperature don’t appear to track the large temperature dynamics between 1980 and 1990, and CO2 diverges from temperature after 2008.
I’m not sure how people think they can assess causality in the long-term trend signal by looking at signals at any shorter timescale. Detrending always truncates the relevant distribution and raises the relative amplitude of shorter timescale signals associated with many different causes. On any shorter timescales, internal natural variations will nearly always be stronger.
Robert, your toy model and graph inspired me to make another depiction of the lower panel of Figure 15 of the paper, by transforming (linearly with time) the vertical axis, so that the inclined curve turns to almost horizontal. This enables better visibility of the difference between data and (toy) model. I also averaged at a 6-monthly scale to make legibility easier. Note, I do not use “anomalies” – I don’t like this practice, which hides a large part of the variability. Also, while one could call the above transformation “detrending”, I do not like to call it thus—I prefer not to use ambiguous concepts such as “trend” and “detrend”. “Linear transformation” suffices—and its expression is shown in the vertical axis.
So here is the graph:
https://blog.itia.ntua.gr/wp-content/uploads/2023/10/TransformesAxis.png
The fitting looks much better after 1980 than before. Pinatubo did not worsen the model behaviour nor did it influence the relationship of T and [CO2], even though it influenced T. This may explain why it “caused CO2 levels to drop”, as you say.
Please note that our toy model incorporates the time lags of [CO2] from T as in equations (8) and (9). Therefore, no time lag should emerge in the graphic—and it doesn’t. Also, remember, this is just a simple toy model.
In response to:
https://judithcurry.com/2023/09/26/causality-and-climate/#comment-994361
Demetris replied:
https://judithcurry.com/2023/09/26/causality-and-climate/#comment-994366
“The fitting looks much better after 1980 than before. Pinatubo did not worsen the model behaviour nor did it influence the relationship of T and [CO2], even though it influenced T. This may explain why it “caused CO2 levels to drop”, as you say.”
I should have been a bit more careful with my comment on the effects of Pinatubo on CO2 concentrations. The eruption did not cause a drop in concentrations, but rather a decline in the the rate of increase. The effect looks like a drop with the linear trend removed from the data.
Here is the same result, but without any modifications to the temperature or CO2 data. I’ve added trend lines to help highlight the effects of the Pinatubo eruption on CO2 concentrations. The scaling is arbitrary.
https://localartist.org/media/tempModelForCO2_notrend.png
Here’s the original plot:
https://localartist.org/media/tempModelForCO2_annot.png
Robert, you said: “The eruption did not cause a drop in concentrations, but rather a decline in the rate of increase.”
That I meant too. See my graph, which facilitates seeing the rates thanks to the transformed vertical axis.
Pat, thanks for the comment and its tone.
But why don’t you like controversy? Isn’t it the path to scientific progress? In a joint editorial by editors of seven major hydrological journals, published simultaneously in all seven, we wrote:
“Additionally, other qualities of a paper should in fact favour
publication, even though they are often regarded as reasons
for rejection, for example:
– a controversial attitude;
– provoking discussion and thought; and
– challenging established ideas, methods or wisdom.”
The Joint Editorial’s title is “Fostering innovation and improving impact assessment for journal publications in hydrology”– in case you wish to see it.
To prove that what you call “different cause” is indeed a cause, you should necessarily (albeit not sufficiently) demonstrate time precedence. We were not able to demonstrate that.
Actually, we demonstrated that at time scales resolved by the available data (up to a couple of decades) the temperature insists on emerging as a potential cause and CO2 concentration insists not being one.
About other issues of your comment, to avoid repetition, please see my reply to David above, which I inserted a few minutes ago.
Link to my reply to David: https://judithcurry.com/2023/09/26/causality-and-climate/#comment-994316
Note to retraction zealots:
“joint editorial by editors of seven major hydrological journals, published simultaneously in all seven”
Difficult to have that one retracted… Perhaps better just ignore it…
Demetris,
You don’t accept data you don’t like.
You think a net sink can add carbon to the atmosphere.
I think we are done.
Of course, it adds–and at the same times it removes. The two processes, adding (respiration) and removing (photosynthesis), are fundamentally different. With probability one, one of the two would dominate. The “net” just expresses which one.
I don’t see which data I don’t accept.
And OK, we are done–thanks for the exchange.
David Andrews:
It appears to be YOU that does not accept data you don’t like. CO2 cannot be responsible for the increase in temperatures if temperatures increased first. That does not mean that CO2 does not have radiative effect, it means that CO2 should be regarded as a feedback not a forcing.
You’ve claimed that he hasn’t provided a physical basis for that, but he does not have to. He is showing the data and we have to make sense of why that is. I have explained the physical basis and provided enormous amount of data and evidence in the form of peer-reviewed literature, but you don’t want to accept that, or perhaps don’t understand it.
David, what I hear Demetri and Agnostic saying is that the turnover of the natural system is so great that fossil fuel emissions are so small that they get immediately absorbed (sunk) and temperature becomes independent from those emissions as proven by their data.
I think we all agreed that atmospheric CO2 has an equilibrium, controlled by Henry’s Law, with the surface waters. They are saying the global system is too large for its equilibrium to be affected by fossil fuel emissions. I am skeptical of this and know you and many others are too. The paper does not address this.
angech (Comment #225453 at Lucia’s transferred here
Take our world less people and plants.
A vast sea full of H2CO3 in salty water at pH 8.1 is slowly heating up from 13C to 15C due to a minute increase in the suns temperature.
It’s atmosphere is O2, N and CO.
The Three gases increase in amount as the air gets warmer over a hundred years as more of them come out of solution.
The amount dissolved in the oceans also increase because a larger amount is needed in the oceans to be in balance with the increased amounts in the air (?).
These extra amounts come from the earth land substrate dissolving more CO2 at higher temperatures.
Hence there is both more CO2 in the air and more CO2 in the water as it gets hotter.
–
This is physics 101.
What is the CO2 level in ppm?
SteveF and Mike M and Ken Fritz can say this is rubbish as much as they like, and will but the answer is obvious to all. It is not due to temporary incidentals like volcanoes.
At the lower Temp the Ppm will be less than 300 and at the higher temp it will be greater than 400.
–
How can anyone argue about this fact?
Hi Angech, I see the discussion on Lucia’s. I think what the debate boils down to is that the authors and their proponents feel that the biosphere’s fast carbon cycle is so broad that it overwhelms even 38Gt of CO2/year. Basically, they claim it all gets absorbed within short order and the atmosphere equilibriums are mostly maintained by global temperature.
This is very far from the consensus and evaluations of ratios of carbon isotopes. But I like controversy. :)
Take our world less people and plants.
A vast sea full of H2CO3 in salty water at pH 8.1 is slowly heating up from 13C to 15C due to a minute increase in the suns temperature.
It’s atmosphere is O2, N and CO.
The Three gases increase in amount as the air gets warmer over a hundred years as more of them come out of solution.
The amount dissolved in the oceans also increase because a larger amount is needed in the oceans to be in balance with the increased amounts in the air (?).
These extra amounts come from the earth land substrate dissolving more CO2 at higher temperatures.
Hence there is both more CO2 in the air and more CO2 in the water as it gets hotter.
–
This is physics 101.
What is the CO2 level in ppm?
SteveF and Mike M and Ken Fritz can say this is rubbish as much as they like, and will but the answer is obvious to all. It is not due to temporary incidentals like volcanoes.
At the lower Temp the Ppm will be less than 300 and at the higher temp it will be greater than 400.
–
How can anyone argue about this fact?
I have a question for demetriskoutsoyiannis or anyone who might have read the paper and knows the answer.
Are the cross-correlations between the residuals to the fits for ΔΤ and Δln(CO2) been discussed anywhere in “On Hens, Eggs, Temperatures and CO2: Causal Links in
Earth’s Atmosphere” (These would correspond to E(v_x*v_y )(h) /sqrt(E(v_x^2)E(v_y^2) ) in what would be the discrete form of equation 1 in the paper (1).
I’ve been looking for these but I am unable to find any discussion, so I thought asking here might be helpful.
Cross-correlations are discussed for the variables x and y. See figure 4 for the data and figures 11 and 12 for the model results. Equation (1) involves a single v, not two v_x and v_y.
The problem that I and most have is that we are used to seeing ice core CO2 charted through the Pleistocene topping out during interglacials at ~300ppm.
Now putting on my hat defending the contentious plausibility that temperature mainly controls atmospheric CO2, what if the CO2 levels in the Holocene and previous interglacials had seen 420ppm for short times that are lost in the low resolution filter in the paleo ice core record? This could be explained by temporary buildups of decaying biomass during cold periods whose CO2 stayed in dissolved state in situ until a warming trend. Then the warming, releasing CO2 according to T in Henry’s Law, acted as a positive feedback springboard, ever increasing air CO2 until reaching an apex were photosynthesis began consuming it faster than its release, leaving an advantaged growth medium even well after CO2 peaked, until CO2 sunk sufficiently, along with the fall in T, to result in a global die off. Then the biomass slowly decays again building tension toward the next cycle. This could explain a millennial cycle that we see T, i.e. the Minowan, Roman, and Medieval warmings.
Indeed, yet there is tons of evidence showing that CO2 was highly variable throughout the holocene. I guess if you thought it was very stable, then it is understandable to think the sudden and dramatic increase is due to the only known difference – human emissions.
But this is why I have been so active on this blog post, because my interest over the last couple of years has been making sense of proxies showing high variability and the relation to temperature. Here is one such looking at oceans (which I have steered clear of because it is just so fraught with complexity)
https://www.nature.com/articles/s41598-022-07774-4
Here is another trying to understand it but I think it is a bit confused and not very convincing. It does have a lot of detail and data in it though:
https://bg.copernicus.org/articles/16/2543/2019/bg-16-2543-2019.pdf
This is also interesting but localised:
https://www.sciencedirect.com/science/article/abs/pii/S0031018201003364
And this one literally starts with:
“Inconsistencies between Holocene climate reconstructions and numerical model simulations question the robustness of climate models and proxy temperature records.”
https://www.nature.com/articles/s41467-022-33362-1
demetriskoutsoyiannis
Sorry, that doesn’t answer my question. I must not have stated it clearly.. Figure 4 shows cross-correlations for x and y themselves.
I know you have (h) discussed abundantly.
I’m curious about cross-correlations in *the residuals of the fits*. That is
y-E(x|y) = “residual of y” which I’ll call v_y,fit.
y has different units from x. E[x|y] has the units of x. So you cannot subtract two quantities with different units. “y-E[x|y]” does not make sense.
Sorry for the typo, I mean (y-E[y|x]). I’m afraid I often don’t proof reade carefully. And the residual to the fit would correspond to (y-E[y|x]).
Did perform a correlation to the residuals to the fit?
Since I left out “you” and “cross”: Did you find the *cross-correlation* to the residuals to the fits? If so, is that shown in the paper?
So, if I understand it correctly after these exchanges and clarifications, you ask about the cross-correlations of v := y – E[y|x] (which you say you call v_y], with x (because there is no v_x).
If this is your question, this is a valid one.
Lucia, if you were a reviewer and if you asked this, it would be a useful comment, and we would add a sixth appendix to study it. As you may see in our Acknowledgement section, we note that reviewers’ requests were the reason to add the appendices. We say:
“We also acknowledge the comments in five reviews in the two rounds of the review process of this paper, which triggered an expansion of the study by adding the Appendices, not contained in the original version, and their discussion in the body of the paper.”
Eventually, our paper became too broader than our initial scope and too longer than our initial plan—and this was not our fault.
Please also notice our discussion about “avenues” in the “Discussion and Conclusion” section of our second paper in Royal Society. We borrowed the term “avenue” from Goulet Coulombe and Göbel (2021) who seemed to agree with/verify our finding but do not like it. So they thought of avenues to find an opposite result. To reverse that, we hopefully may dream of an avenue enabling a lot of additional stuff for future research, after ours. Not everything fits in one (or even three) papers.
Coming to the essence of your question: We have not explicitly presented anything about corr[v,x] in the paper. But since you are interested, these cross-correlations are fairly low, of the order of +/-0.1.
Yet our Figure 4 implicitly shows that these cross-correlations (corr[v,x]) are low. Were they high, there wouldn’t be good agreement between empirical and modelled corr[y,x] (compare the continuous blue lines with the black dashed lines in the upper right panel). Perhaps we must have written something about this in the paper.
PS. Papoulis’ book is holy bible. I think it is hubris to imply it’s crap.
@ Robert Cultler – on Mt. Pinatubo.
The article doesn’t specify how this happened, unless I missed it, but it might be a place to start.
“One of the key findings of this work is that the climate effects of volcanic eruptions such as those of Mount Pinatubo can play important roles in driving the variability of the ocean carbon sink,” said coauthor Yassir Eddebbar, a postdoctoral scholar at Scripps Institution of Oceanography.
Pinatubo is the second-largest volcanic eruption of the 20th century. The estimated 20 million tons of ash and gases it spewed high into the atmosphere had a significant impact on climate and the ocean carbon sink. The researchers found that Pinatubo’s emissions caused the ocean to take up more carbon in 1992 and 1993. The carbon sink slowly declined until 2001, when human activity began pumping more carbon dioxide into the atmosphere — the ocean responded by absorbing these excess emissions.
https://news.agu.org/press-release/ocean-uptake-of-co2-could-drop-as-we-cut-carbon-emissions/
@ Robert Cutler – here you go …
Enhanced vegetation growth from
more diffuse and less direct solar radiation took more carbon dioxide out of the
atmosphere than normal, temporarily reducing the observed long-term increase in
carbon dioxide.
http://climate.envsci.rutgers.edu/pdf/VEAChapter1_Robocknew.pdf
We tend to focus on Ocean chemistry, but there is vast plant life in the ocean. It, too, responds to changes in CO2 as well as a host of other factors.
Lucia,
if you were a reviewer and if you asked this, it would be a useful comment, and we would add a sixth appendix to study it.
Alas I was not. I agree that if I were a reviewer, I would have forced you to do this analysis. I was not expecting you to do it here in comments.
.
Thank you for a useful answer.
.
One the Pappoulis issue– that seems to be directed at me.
.
I have not said, suggested or implied Pappoulis book is crap!!
.
I have said in comments at my site that my husband said he is throwing away “crap” in the basement, by which he means “boxes of stuff” we still have from graduate school, but which we don’t use. Heck, it may include a copy of Lamb. It probably does not contain an actual holy bible, though who knows? An unsuitable boyfriend once gave me one written in French thinking it was just the right thing for me. Somewhere in a box, the stash of “stuff” contains a dead tree version of Pappoulis (and likely two because both my husband and I took a course that required the book. )
.
When stuff sits in the basement and is unused for decade, it becomes referred to has crap. This is not an evaluation of it’s full, true inherent value, but merely a diagnosis of current utility to us in our lives. Even Waterford crystal goblets become “crap”. (We are retired.)
.
FWIW: I found a pdf version. So the dead tree version of Pappoulis can go with all the “other crap”. I’m not telling my husband to be careful and reverently set the dead tree version aside. It can get tossed in the same bin as the French version of the Jerusalem Bible.
Lucia, I am glad that you found my reply useful, and even more glad that the crap stuff about Papoulis is not valid!
PS. Papoulis was Greek but with a career in the USA. I met him once, when my university honoured him with an honorary doctorate. I owe him a lot. As a student, I had very bad professors in probability and related stuff, and so I hated that stuff. But it happened, years after my graduation, in a visit to a bookshop, to see an Indian student edition of the 2nd edition (1965) of Papoulis in a special price, almost nothing. So I bought it, and its reading made me an enthusiastic fan of stochastics. When the third edition was out (1991) I bought it too. I keep both editions in hardcopies–even though I have scanned the latter and always have it in my laptops and tablets. So my encounter with stochastics, a very fortunate moment of my life, was stochastic per se.
I inserted a reply many hours ago, but it seems it was lost in space. I wrote that I am glad that you found my answer useful, and even more so that the crap stuff about Papoulis is not valid. I also described my encounter with Papoulis, but I leave it out for now–perhaps the system’s demon doesn’t like it…
demetriskoutsoyiannis
I did find your answer to my question useful. I am trying to limit time wasting questions and am only asking when I have question about what things you did or did not do in your analysis. As you are aware, there is a large amount of material. I’m writing questions to myself and when I cannot find something I may be asking something again.
I have not in anyway shape of form criticized Papoulis. I did find your answer useful. I don’t know why you think I suggested Papoulis’s book was crap (other than I may not need to have a two paper copies of the thing in some unknown box somewhere down in the basement. ) I certainly have nothing against him personally having never met him.
Comments do get held up.
Demetris Koutsoyiannis, I have now read, over 10 days, not just the “On Hens…” paper but 4 of your papers found through open access. Some took long hours because mathematically challenging but all were enriching and well worth the time. You have given us much to contemplate and many new subjects to research. (You understand, of course, I can’t yet say if you’re always right :)) Thank you for your science, thank you for your healthy skepticism, thank you for your confidence, and thank you for showing that the unabashed brilliance of the great classical Greek thinkers lives. You are a treasure for your country. (And – thanks to Ms. Curry – you’re a treasure for us here in the USA as well).
Botanist, I have no words to thank you for reading my works and for your kind words…
Thanks to Pat Cassen, I have taken a stab at quantifying based on experimental evidence the ratio of anthropogenic CO2 and working out a simple equation to illustrate it.
Too many caveats to list, but the main one is that I have only considered soils.
GRdecay = change in growth per 1C change in temp
GRphoto = change in growth per 1ppm change in CO2
From soils alone, the rate of increase of CO2 per degree of celsius is roughly linear. From this experiment: https://bg.copernicus.org/articles/14/703/2017/bg-14-703-2017.pdf
…550ug@25C – 1420ug@35C = 87ug/C
Therefore, rate change of 2.6 per 10C or 0.26/C
There has been 1.1C warming since so; 285ppm x (0.26 GRdecay) x 1.1 DeltaT) = 81ppm
Total = 366ppm
But this will be OFFSET by increases in the biosphere:
“Across a range of FACE experiments, with a variety of plant species, growth of plants at elevated CO2 concentrations of 475–600 ppm increases leaf photosynthetic rates by an average of 40% (Ainsworth & Rogers 2007).”
Concentrations current to the time of the paper was 385ppm so an increase of 152ppm corresponds to 40% increase in growth. Therefore an increase of 130ppm is about 34%. On average 70% of a plant is the CO2 it draws from the atmosphere (not allowing for the fact that this actually increases slightly as more CO2 is available). So that means photosynthesis is capturing about 23.8% more CO2 than it did at 285ppm pre-industrial levels during the growing season. We’ll say the growing season is 6 months, so it is 11.9% more CO2 captured relative to pre-industrial levels.
Therefore, plausibly 11.9% of the 130ppm increase is re-captured by sinks, so 366-15.5 = 350.5ppm is natural, leaving the remaining 415ppm (current levels) – 350.5 = 64.5ppm the contribution man is responsible for.
So Sources:
DeltaCO2ppm = I(ppm) x (DeltaT x GRdecay)
…where “I” = initial level of CO2
Sinks:
DeltaCO2 = DeltaCO2sources x GRphotsynthesis x 0.7 (carbon portion) x 0.5 (growing season)
The GR for photosynthesis is surprisingly close to decay = 0.263, which is the coefficient from growth in the presence of extra CO2, but only 70% of the mass is actually CO2 from the atmosphere, the rest coming from water and other minerals form the soil. Also, the growing season is roughly half the year.
The amount of CO2 in atmosphere form warming is actually LESS than I thought it would be, but not wildly so. I am basing it on one experiment and I have not included oceans into the calculation. It’s in the region of plant stomata variation for other warm periods say from Wagner et al: https://www.sciencedirect.com/science/article/pii/S0277379104001039
“The majority of the stomatal frequency-basedCO2 estimates for the Holocene do not support the widely accepted concept of comparably stable CO2concentrations throughout the past 11,500 years (Indermu.hle et al., 1999). The available high-resolution CO2 reconstructions based on plant fossils suggest that century-scale CO2 fluctuations contributed to Holocene climate evolution (Rundgren and Beerling, 1999; Wagner et al., 1999a;McElwainetal.,2002;Wagneretal.,2002; Rundgren and Bjo.rck, 2003; Kouwenberg, 2004).”
Point is, trying to quantify via mass balance is a fools errand and people continually end up confused by seeing the Carbon cycle as a budget that is balanced, with only nature affecting short term variations – which it isn’t. And even if these calculations are wrong (they almost certainly are) they illustrate that there is a non-linear interdependence between atmosphere and biosphere with a virtual limitless amount of CO2 trapped that can be modulated by temperature in the case of decay, and CO2 availability in the case of photosynthesis.
Thanks, Agnostic for your calculations. You say: “Therefore, plausibly 11.9% of the 130ppm increase is re-captured by sinks, so 366-15.5 = 350.5ppm is natural, leaving the remaining 415ppm (current levels) – 350.5 = 64.5ppm the contribution man is responsible for.” Could you also give the rates (ppm/year), for current and older conditions, so that we can compare your rations with ours?
Sorry I am not sure what you mean by “current and older conditions”. I am pretty sure that the change in the rate of emissions form sources will be roughly the same from one period to another, though it will have regional differences for sure. If you mean the atmospheric concentrations in previous periods, then the Wagner et al 2004 is where to go for perhaps the most comprehensive estimates for the holocene. Also Kouwenburg 2004 show stomata levels that correspond to as much 390ppm. It’s important to note that CO2 from nearly all types of proxies lose sensitivity the higher the atmospheric concentration, so while 390ppm is the upper end of the error range, it is also quite likely.
From Kouwenberg 2004:
“However, atmospheric CO2 levels are influenced by temperature- induced changes in biospheric and marine feedback systems. In order to investigate the potential of rapid CO2 changes as a forcing factor in climate over the last millennium, the CO2 record is compared to global tempera- tures. Some remarkable correlations are revealed between the stomata- based CO2 record and a multiproxy-based reconstruction of global mean temperature (Mann and Jones, 2003), particularly with respect to the timing of the warm periods and the CO2 maxima ca. A.D. 950 and A.D. 1300 (Fig. 4D). The overall picture suggests a clear covariation between CO2 and global temperature.”
Agnostic, sorry I was not clear, so you say “Sorry I am not sure what you mean by ‘current and older conditions’.”
In our Appendix A1 we tried to determine the difference in natural emission (respiration) rates (R, in Gt C /year) currently (2022) and 65 years ago (1958 = older). We estimated this difference as ΔR = 31.6 Gt C/year.
Can your calculations suggest what that difference would be as a rate (Gt C/year or something equivalent)? I believe rates are more indicative than absolute numbers as in your result “64.5ppm the contribution man is responsible for”, because that 64.5 (or whatever) ppm would be the result of integration of many complex processes over the years.
“I believe rates are more indicative than absolute numbers as in your result “64.5ppm the contribution man is responsible for”, because that 64.5 (or whatever) ppm would be the result of integration of many complex processes over the years.”
I completely agree, and I would be very surprised if my “result” was correct. But I would also be surprised if we had not contributed, because even with the uncertainty of insensitivity of higher levels of CO2 detection in all proxies, most of them do not show levels quite as high as today, and that’s before equilibration. Our warm period is probably only now peaking, and CO2 peak will lag, meaning it will get higher still. Temperatures are probably similar. So the difference in CO2 levels may well be our contribution, and the biosphere will catch up in time (and equilibrate).
My aim was to show how temp drives CO2 changes, and CO2 drives biosphere expansion.
https://www.nasa.gov/technology/carbon-dioxide-fertilization-greening-earth-study-finds/
As to your question, if there was 0.3C warming from 1850 to 1958, then the increase in AtmosCO2 would be 22.23ppm and only about 2ppm being removed by sinks – so maybe a “natural” rise of 20ppm or so. But as you point to, this is only very simple model, a back of the envelope type of thing to demonstrate the interdependence of CO2 and temp.
Right, but you do not give figures in a per-year basis, so it is not possible to compare our results.
We did not say, of course, that “we had not contributed” to the atmospheric [CO2]. Rather, we estimated “a total global increase in the respiration rate of ΔR = 31.6 Gt C/year [with the difference taken between 2022 and 1958]. This rate, which is a result of natural processes, is 3.4 times greater than the CO2 emission by fossil fuel combustion (9.4 Gt C /year including cement production).”
And, of course, I agree with you that “temp drives CO2 changes, and CO2 drives biosphere expansion”, and I am thankful to you, Agnostic, for substantiating that.
PS. I think the paper, which the NASA site you linked refers to, is Zhu et al., Greening of the Earth and its drivers. Nature Climate Change 2016, 6, 791–795 (the NASA link to it does not work any more). We have cited it in our paper.
No – my method really only works out the proportion of change relative to some starting point. I guess I could work out an estimate by looking at the change from one year to the next as an “average” increase in temp and CO2.
But it’s hard to see how useful it is because it leaves out so much. There is no input from changes to ocean circulation, temperature on CO2 exchange with the ocean. The reaction rate for decay was just boreal soil – enough for a ballpark estimate but pretty unsophisticated. Photosynthesis is also enhanced by temperature (though not very much over 1.1C), and it also uses less water at higher CO2 levels, drawing more of it from the air.
Demitri, thanks to you and your coauthors for this potentially very important contribution. If confirmed it should affect the future of the global economy as nations form global energy policy.
If Agnostic’s calculations are even roughly showing the magnitude of global temperature affect on atmospheric CO2 then policy would have been poorly informed to try to lower CO2 by cutting emissions. Rather geoengineering (to increase Earth’s albedo) becomes a more attractive control knob in that it would not only lower temperature directly but also indirectly by shifting the Henry’s Law equilibrium to a stronger gradient for ocean and soil uptake of CO2.
Ron – you can get a lot of bang for your buck if you let coal plants emit SO2. Geoengineering plus cheap electricity to boot! A great deal all round!
Jim2, I would not get carried away. I don’t think I could ever be convinced coal burning and mining would be clean enough to be acceptable.
Putting on my futurist hat, I could see the optimal stewardship of the planet in 50-100 years as consisting of maintaining a 400ppm CO2 for its fertilization and winter moderation effects. At the same time a colloidal aerosol dispersion could be placed in the upper stratosphere or ionosphere that would reduce insolation.
If precipitation control could be refined and then accentuating in polar regions (to build ice mass and albedo), as well as in targeted tropical situations to disrupt tropical cyclone formation, sea level ceases to be a problem.
Power will be from nuclear fusion – eventually.
“Power will be from nuclear fusion – eventually.” 100% – and sooner than most people think.
I agree Agnostic, about fusion: “100% – and sooner than most people think.” I assume you’ve been following Lockheed Martin’s prototype reactor work; but there’s other programs advancing too.
On the topic of mitigation solutions:
Why not cultivate phytoplankton blooms to sequester CO2? The concept isn’t new, but I’ve only heard the idea described and dismissed because of associated risks; but for programs near coastal regions. The risks such a program presents to coastal areas are unacceptable, they’re already stimulated by a soup of pollutants. Presumably the idea never advanced beyond the rudimentary concept.
But there’s roughly 14 million square miles of oceanic desert in the South Pacific Gyre; a zone described as near lifeless by science. Create massive artificial phytoplankton blooms, using tailored organics, in a relentless seeding program. Turn it on and off at will by regulating inputs. Benefits: 1) Create a massive CO2 sink as phytoplankton dies. 2) Perhaps expand the ecosystem for fish, including possible economic benefits. Once an ecosystem establishes itself trawlers could supplement the program by seeding while they fish, a literal feedback loop while reducing stress on legacy fishing grounds; all in what were otherwise dead oceans.
Ron, thanks so much for your words.
We live in a peculiar era, in which truth and pragmatism do not matter. So, I am not optimistic about any impact of our study on the “global economy” and “global energy policy” that you mention.
Anyhow, such impact was not our aim. We see our role as scientists pursuing the truth and nothing more. And as I wrote above (https://judithcurry.com/2023/09/26/causality-and-climate/#comment-993853), I feel “we have done our duty as scientists by doing this (fully unfunded) research and by presenting these findings, which are correct and important”.
The correctness of our method and our findings stand still, after being challenged in the extensive and multifaceted discussion in this blog. See also my summary in my same comment above.
I do not regard repetition of conjectures, speculations and official narratives as threatening our method and findings. Real challenging would need (a) use of data, (b) mathematics/calculations and (c) conformity with the scientific method.
Nonetheless, I am thankful to all for their contributions in challenging or confirming our method and results, and above all to Judith Curry for giving to all of us this opportunity.
Demetris,
a) Data:
From 1960 to 2010
Cumulative Human Emissions 350 + 29 PgC (1 PgC = 1 Gtonne)
Atmospheric Accumulation 158 + 2 PgC
(Source: Ballantyne, A. P. Alden, C.B., Miller, J.B., Tans, P.P., 2012: Increase in observed net carbon dioxide uptake by land and oceans during the past 50 years, Nature, vol 488 pp 70-72. doi:10.1038/nature11299)
b.) Math:
atmospheric accumulation of Carbon = cumulative Emissions – cumulative Absorption
C = E – A
Breakdown the cumulative emissions and absorption into “Human” and “Natural”
E = EH + EN
A = AH + AN
Perhaps someday direct carbon removal will change this, but for now AH = 0. Thus
C = EH + EN – AN or
AN – EN = EH – C which is Ballantyne’s “net global uptake”, the amount of carbon REMOVED from the atmosphere and taken into land/sea reservoirs by natural processes.
Putting in the 1960-2010 numbers, natural processes have removed 192 + 29 PgC. This is hardly surprising. The much larger partial pressure of CO2 from human emissions in the atmosphere drives carbon into the oceans and stimulates plant growth.
Some skeptics have called the above “circular reasoning” but decline to elaborate. Other skeptics, like Agnostic, say “what about soil emissions?” (or freshwater ponds, or volcanoes…) not appreciating that they are all included in EN.
c.) The scientific method:
The crux of the scientific method is to make testable predictions based on some hypothesis. Your hypothesis that temperature is causing atmospheric carbon to increase leads to an obvious prediction: the accumulation of carbon in the atmosphere will exceed human emissions. Data falsifies your hypothesis.
I had said I was done with this discussion, but I found your pious summary statements about science and continued evasion of the obvious offensive. I needed to make my own summary. Science requires integrity as well as originality.
Thanks, David.
I too believe your reasoning is circular. Your math is not enough to show causality. You just use some version of carbon balance. We too use it, but not as the core of our method. We use it just to see if our result is justifiable. And as seen in the discussions here, those who initially disputed our carbon balance, eventually they accepted it.
You need to prove time precedence of the cause, and I do not see it anywhere in your math.
You say, “Your hypothesis that temperature is causing atmospheric carbon to increase leads to an obvious prediction”. But we did not make this hypothesis.
Our hypothesis was very simple: That T and [CO2] are potentially causally linked. We did not hypothesize the direction of potential causality. (Actually, we expected to see both directions, like in hens and eggs). But the *result* (and I stress it again, not the hypothesis) was clear: That the potential causality is T->[CO2] and that [CO2]->T is excluded. At *all time scales*. And with all combinations of T and [CO2] data sets.
Demetris,
1. Do I really have to measure a time delay between burning a lump of coal and watching CO2 go up the chimney to know that one caused the other?
2. I have a simple reason for understanding why land/sea reservoirs have lately been sinks. It is the anthropogenic carbon put into the atmosphere, above the levels previously in equilibrium with the ocean carbon content. You admit you have no explanation for temperature increases. More importantly, you also have no explanation for why, in the industrial age, natural reservoirs are sinks. Ballantyne shows the sink rates are increasing as atmosheric carbon increases. In your way of thinking, that is just another interesting unexplained coincidence. Isn’t Occam’s Razor a Greek concept?
Yes, David, Occam’s Razor is a Greek concept, and I will give you the following two original Greek quotations, which would perhaps help you to see that you do not follow it (and I refrain to discuss your example of the chimney).
Ἒστω γὰρ αὕτη ἡ ἀπόδειξις βελτίων τῶν ἄλλων τῶν αὐτῶν ὑπαρχόντων, ἡ ἐξ ἐλαττόνων αἰτημάτων ἢ υποθέσεων ἢ προτάσεων (Αριστοτέλης, Αναλυτικά Ύστερα, I, 25).
Translation: We may assume the superiority, other things being equal, of the demonstration which derives from fewer postulates or hypotheses or propositions (Aristotle, Posterior Analytics, I, 25).
Φανερὸν ὅτι μακρῷ βέλτιον πεπερασμένας ποιεῖν τὰς ἀρχὰς, καὶ ταύτας ὡς ἐλαχίστας πάντων γε τῶν αὐτῶν μελλόντων δείκνυσθαι, καθάπερ ἀξιοῦσι καὶ οἱ ἐν τοῖς μαθήμασιν (Αριστοτέλης, Περί Ουρανού, ΙΙΙ, 4).
Translation: Obviously, it is much better to assume a finite number of principles, as few as possible yet sufficient to prove what has to be proved, like in what mathematicians demand (Aristotle, On the Heavens, ΙΙΙ, 4).
Then you need explain why there is such strong correlation with CO2 and temperature in the high resolution proxy record, where CO2 reached levels not hugely less than today – but with a lag.
If as you say science makes “testable hypothesis” then we can hypothesise that if temp was driving CO2 we would see it in previous warm excursions and also on geological time scales – and we do.
Kouwenburg 2004:
“However, atmospheric CO2 levels are influenced by temperature- induced changes in biospheric and marine feedback systems. In order to investigate the potential of rapid CO2 changes as a forcing factor in climate over the last millennium, the CO2 record is compared to global tempera- tures. Some remarkable correlations are revealed between the stomata- based CO2 record and a multiproxy-based reconstruction of global mean temperature (Mann and Jones, 2003), particularly with respect to the tim- ing of the warm periods and the CO2 maxima ca. A.D. 950 and A.D. 1300 (Fig. 4D). The overall picture suggests a clear covariation between CO2 and global temperature. ”
https://pubs.geoscienceworld.org/gsa/geology/article-abstract/33/1/33/129251/Atmospheric-CO2-fluctuations-during-the-last
All Demitris paper does is point out, along with many other papers, that causality is the wrong way around for CO2 changes to by driving temps. He does not (and not do I) say that there is no radiative effect. All that I am saying (and the paper does not) is that CO2 should be treated as a feedback not a forcing, albeit we have added to what was already a natural effect.
You can’t duck this issue:
1. Warming began BEFORE – LONG before emissions were significant to impact the climate.
2. We see temp lead CO2 on ALL TIME SCALES that we can reliably measure.
What would any reasonable person deduce from that?
What would we deduce from that? That CO2 naturally does follow temperature, and then reinforces it. But human CO2 emissions from fossil fuels don’t follow temperature. They’re largely independent of temperature. It’s not surprising that except for periods of high volcanic activity, past CO2 concentrations would have been mostly dominated by temperature.
Agnostic,
1. Analyzing paleoclimate data is fine. But don’t you think that humans adding about 10 GT/yr might change the picture for the time frame that matters, namely the last century?
2. You assert that carbon is a feedback from temperature changes, not a forcing. But what about the anthropogenic carbon? Is your logic that higher T’s mean we turn our fossil-fuel-driven airconditioners on more?
3. Although you have not agreed with the data and math that says unequivocally that natural resevoirs have been been net carbon sinks for a century, Demetris at least has acknowledged that they are. But he still shrugs and calls these very sinks the cause of atmospheric CO2 rise. Can you explain to me either:
a.) why Demetris and I are wrong and natural resevoirs have really been been net sources
or
b.) how Demetris would have us believe that these these same natural sinks are the cause of CO2 rise. I understand his emphasis on time lags, though I do not accept his analysis of decadal scale correlations in the modern era. But for the life of me, I cannot understand how anyone can consider processes which REMOVE carbon from the atmosphere be the cause of the rise.
David, you wrote: “…Demetris at least has acknowledged that they are [sinks]. But he still shrugs and calls these very sinks the cause of atmospheric CO2 rise.”
What I hear Demetris and Agnostic saying is that the volume of natural CO2 flux is large enough compared to the ACO2 to both sink it and also take control of the equilibrium dynamics. And, they’re saying that the net CO2 is more sensitive to surface temperature than temperature is to CO2, in short-terms. In the long terms, before there was ACO2, we see this was true as well.
David, I agree that ACO2 is a forcing since it was not part of the natural system until we introduced it, and that the radiative physics seems to be well grounded. At the same time it could be weaker as a forcing (at ~3.7W/m per doubling) than as a feedback.
As far as what is the primary cause of the GMST trend, and what exactly is the GMST trend when uncontaminated with UHI and LULC, the science is not settled, IMO.
David Andrews:
1. It’s not unreasonable to think so until you actually look at it properly. Warming started BEFORE emissions, we have seen episodes of warming closely followed by CO2 rise NATURALLY, and we note that CO2 rise is insensitive to changes in human emissions. Human emissions only represent 4-5% of natural sources on average, but that varies by amounts we are hugely uncertain of and which are larger than those emissions.
In the past we saw that warming was followed by CO2 rise until the warming stopped or reversed. CO2 continued to rise for a short time until reaching an equilibrium with sinks.
2. No my logic is that our emissions are the EQUIVALENT of extra warming, not that it caused it (excepting the radiative effect from the extra CO2). Any warming causes rates of decay to increase which increases atmospheric CO2 concentrations. We add about 4% on top of that. The biosphere expands in size offsetting the increase until it eventually equilibrates and if there was no other change in temp, CO2 levels would stabilise at higher concentrations.
The part you (and many others) are struggling with is that from the point of view of the biosphere, there is no difference between a CO2 emitted by humans or one emitted by nature. It’s all part of the big pot.
3.
a) The problem is the use of the concept “net”. Sinks and sources ARE the biosphere. They both emit and absorb but at different rates, one determined by temp and the other by CO2 availability. By thinking about them in terms of “net loss or gain” you end up confusing yourself as to what is going on. That’s why I object to the carbon cycle characterised as a “mass balance”. From the POV of the biosphere, there is a virtually limitless source of carbon that is trapped which is unlocked when emissions outpace absorption. The amount of carbon circulating INCREASES. It DECREASES when it cools as the amount of biosphere drawing down CO2 is larger than processes emitting caused by the cooling. Using a “balance sheet” approach implies a fixed amount moving from one reservoir to the other and that’s why there is confusion.
b) Think of a tree: it has foliage, branches, and a trunk. They represent 3 levels of trapped carbon. Annual changes are the foliage, decadal changes the branch, and centennial changes the trunk. If a branch falls off and it decays FASTER than it grew, what happens to atmospheric CO2?
That tree is the source AND sink. It is trapping carbon on short, medium and long time scales. When the biosphere expands (sink) it also BECOMES the source – it is a larger size contributing to the emission of CO2 when its foliage drops, when its branches fall off, and when it dies altogether. There is MORE foliage, branches and trunks.
We don’t have to guess at this. We see it clearly in the paleo record when using proxies of appropriate resolution. We see it at all timescales we can reliably measure.
So if you don’t think that is occurring now, what explanation do YOU have for this close correlation with CO2 and temp yet with CO2 LAGGING temp?
Paul Roundy: “But human CO2 emissions from fossil fuels …. largely independent of temperature.”
While that’s true you are forgetting the other side of the flux – the biosphere is dependent on CO2. The biosphere expands to offset the rise and eventually equilibrate. If our emissions do not increase, and temperatures do not go up, then CO2 concentrations will eventually level off at a higher level than preindustrial proportional to the temperature change which includes our contribution.
From the POV of the biosphere, it does not tell the difference between human CO2 or natural. And our contribution is very small next to total emissions of the biosphere. Our input of CO2 is as if the temperature rise was very slightly higher.
OK, it’s reasonable to suggest that the biosphere responds to CO2 concentration, but what’s the evidence of how strong this sensitivity is?
Paul Roundy: I refer you to this comment: https://judithcurry.com/2023/09/26/causality-and-climate/#comment-994390
Also this paper:
https://www.nature.com/articles/ncomms13428
https://www.pnas.org/doi/10.1073/pnas.2015283118
A little research will yield a huge amount of uncertainty – one papers saying its stable, some that it is overestimated, underestimated…on and on.
The evidence I point to is experimental evidence showing the relationship of temperature on decaying vegetation. I am pretty sure the one piece of evidence I point out in my comment is underestimating the rate of decay as a global average but it serves to illustrate the effect of increasing temperature has on atmospheric concentrations of CO2. For every 1 C change affects the rate of decay by about 26%. So since pre-industrial times, the biosphere is releasing about 29% more CO2 into the atmosphere. This is offset by increase in photosynthesis but only at a rate of 13%. That’s why CO2 levels go up or down during changes of temp. It also lags because it takes time for trees (proxy for biomass of all types) to grow to equilibrate CO2 when it warms and to decay when it cools.
You can very reasonably argue that there has been more CO2 increase than that and it’s probably due to humans. I suspect we have contributed, but not be as much as that.
Ron and others – the gap between “green” dreams (nightmares?) and harsh reality continues to increase.
Coal consumption in 2022 rose by 3.3% to 8.3 billion tonnes, setting a new record, according to the IEA’s mid-year Coal Market Update, which was published today. In 2023 and 2024, small declines in coal-fired power generation are likely to be offset by rises in industrial use of coal, the report predicts, although there are wide variations between geographic regions.
https://www.iea.org/news/global-coal-demand-set-to-remain-at-record-levels-in-2023
Some Ocean Deep Calculations for CO2 Concentration Levels
Area of the ocean 360,000,000 km2
Average depth of the ocean 3,682 meters
Volume of photic ocean surface waters, first 200 meters = 0.200 km x 360,000,000 km2 = 72,000,000 km3
Volume of aphotic ocean zone, below 200 meters = 3.482 km x 360,000,000 km2 = 1,253,520,000 km3
Ratio of volumes of aphotic zone to photic zone = 1,253 / 72 = 17.41 : 1
From the measurements done at the Natural Energy Laboratory in Hawaii (NELHA on the Kona coast) the concentration of CO2 in cold deep sea water, which is 2°C to 3°C, is 10% greater than surface water, which is 30.5 °C.
Doing the calculation of the ratio of CO2 in aphotic sea water to photic sea water = 17.41 x 1.10 : 1 = 19.15 : 1
The amount of CO2 dissolved in aphotic sea water is almost 20 times that in photic surface waters.
What does that mean?
When the Deep Ocean Conveyor causes cold, CO2 and nutrient rich, aphotic sea water to rise to the surface in the Indian Ocean, after its 1500 year journey, the CO2 that was removed from the atmosphere 1500 years ago has a chance to be released into the atmosphere from the warm tropical waters.
Does anyone directly measure the CO2 being released from tropical waters in the Indian ocean?
The satellite measurements of CO2 levels over the Indian Ocean are not relevant, since the CO2 which is being released will be quickly disbursed around the planet, first into the southern hemisphere, later into the northern hemisphere.
Is there day and night variability in the CO2 levels of the Indian Ocean surface waters, when the photosynthetic plankton are active.
How much is the Indian Ocean diurnal CO2 release and consumption variation, and is it a significant variation?
Researchers at NELHA could quickly measure how the concentration of CO2 in 2°C to 4°C sea water changes as it warms to 30°C.
From text book calculations of CO2 solubility, at different temperatures and pressures, the outgassing of CO2 is very significant.
It can be a major source of natural variability in the paleo climate record, and in the last 100 years.
What I have read regarding ocean based CO2 is that changes to deep ocean currents brings “nutrient rich” – predominantly but not exclusively dissolved carbon – to the surface. This promotes exchange of CO2 which is why CO2 increases correlate so well with ENSO, and photosynthesis which provides food for fauna and so on.
I haven’t got my head around oceans – my research tends to be focussed on the Bolling-Allerod/Younger Drays/Holocene for no other reason than Academia.eu keep sending me fascinating papers on the subject. I must have clicked something. This is still open as one of my (very many) tabs:
https://iopscience.iop.org/article/10.1088/1755-1315/237/2/022009/pdf
“The correlations between the growth rate of atmospheric CO2 concentrations and the El Niño–Southern Oscillation (ENSO) events are well known.”
Thanks Agnostic,
The timing of the warm periods and the CO2 maxima roughly 1070 years ago (950 AD) and 720 years ago (1300 AD) correspond to periods when the higher levels of atmospheric CO2 would have been dissolved / sequestered in cold North Atlantic sea water, to be down welled onto the beginning of the Deep Ocean Conveyor.
With an estimated circulation time of 1500 years, the excess dissolved CO2 from 1300 AD should be arriving at the Hawaii NELHA site.
The excess
dissolved CO2 from 950 AD should be entering the upwellings in the Indian Ocean.
And Yes, both the dissolved nutrients and the dissolved CO2 will act as fertilizers for phytoplankton growth.
Re-entering my reply to David Andrews, which apparently blog’s demon did not like. I am removing the original Greek text now, as I suspect this might be the reason of demon’s disapproval.
Yes, David, Occam’s Razor is a Greek concept, and I will give you the following two original Greek quotations, which would perhaps help you to see that you do not follow it (and I refrain to discuss your example of the chimney).
We may assume the superiority, other things being equal, of the demonstration which derives from fewer postulates or hypotheses or propositions (Aristotle, Posterior Analytics, I, 25).
Obviously, it is much better to assume a finite number of principles, as few as possible yet sufficient to prove what has to be proved, like in what mathematicians demand (Aristotle, On the Heavens, ΙΙΙ, 4).
For completeness, a second attempt to enter the Greek original (now without classical accents):
Έστω γαρ αύτη η απόδειξις βελτίων των άλλων των αυτών υπαρχόντων, η εξ ελαττόνων αιτημάτων ή υποθέσεων ή προτάσεων (Αριστοτέλης, Αναλυτικά Ύστερα, I, 25).
Φανερόν ότι μακρώ βέλτιον πεπερασμένας ποιείν τας αρχάς, και ταύτας ως ελαχίστας πάντων γε των αυτών μελλόντων δείκνυσθαι, καθάπερ αξιούσι και οι εν τοις μαθήμασιν (Αριστοτέλης, Περί Ουρανού, ΙΙΙ, 4).
A more modern and less clear version of the second Aristotle’s quotation, usually attributed to Einstein:
Everything should be made as simple as possible, but not simpler.
Actually, using David Andrews analogy: “Do I really have to measure a time delay between burning a lump of coal and watching CO2 go up the chimney to know that one caused the other?”
He is watching CO2 go up the chimney and claiming it is causing the coal to burn.
This discussion of net sinks and net sources reminds me of the parable of the group of blind men, touching and feeling all over the elephant to determine what kind of object they have found.
The ocean is not one monolithic thing. Different parts of the ocean can be a sink for CO2 while at the same time other parts of the ocean can be a source of CO2 emissions. The rates of the various sinks and sources can change over time.
In the cold North Atlantic, in the Arctic Ocean, and in the Circum Polar Currents around Antarctica (known as the roaring 40’s) CO2 is a natural sink at the ocean surface. The Bunsen coefficient for the solubility of CO2 in sea water (35 g/kg salinity) and 2°C is roughly 1.33 g / liter. This is where CO2 is more likely to dissolve from the atmosphere (a CO2 sink) into sea water, some of which begins a 1500 year journey on the Deep Ocean Conveyor.
In the warm tropical surface waters the Bunsen coefficient for the solubility of CO2 in sea water at 30°C is roughly 0.57 g / liter. This is where CO2 can emerge from the ocean reentering the atmosphere (a CO2 source), some of which is ending its journey on the Deep Ocean Conveyor.
The change in the Bunsen coefficient of CO2 solubility in sea water from 2°C to 30°C is:
1.33 g / liter – 0.57 g / liter = 0.76 g / liter
The change in CO2 solubility can be up to a 57% loss of dissolved CO2 upon warming.
(Dissolved Gas Concentration in Water, by John Colt, 2012, second edition, Northwest Fisheries Service Center, Seattle, WA, page 108, Table 2.31)
One of the things we have very little knowledge about is how underwater volcanos add CO2 to deep ocean water, or may cause it to outgas. One can imagine scenarios where both can occur for the same underwater eruption. Near the hot parts of the eruption, the volcanic steam, CO2, and hydrogen sulfates, are clearly net gas producers. But those hot materials must travel through thousands of meters of cold sea water (2°C to 4°C) before reaching the surface, where they can enter the atmosphere, there is much time and distance for these gases to be re-dissolved in sea water.
The surprise underwater eruption of Hunga Tonga–Hunga Haʻapai on January 15, 2022, should be a wake up call to scientists as to how meager our knowledge and theories really are.
Nice comment, Wren4161, thank you. But few care “how meager our knowledge and theories really are”, and prefer the convenience of conventional wisdom.
From the current temperature data there is no question that we are firmly in a steady secular warming period.
*****
Every planet is subjected to its annual average surface temperature (the mean surface temperature) T (K).
The planet annual average surface temperature is a dependent on the planet’s distance from sun value.
Of course it is dependent on the planet’s radiative energy balance.
It is also dependent on the planet’s rotational warming phenomenon.
And, in addition to all that above, the planet annual average surface temperature is a dependent on the annual planet surface temperature differentiation.
The less planet surface temperatures annually differentiated – the higher is the planet annual average surface temperature.
And the more planet surface temperatures annually differentiated – the lower is the planet annual average surface temperature.
–
In our times Planet Earth is in an exceptional annual orbital pattern, which pattern (earth’s orbit eccentricity, when Earth is at its closest to the sun during the North Hemisphere’s winter, and it is very much close to the sun at the times of winter Solstices…)
–
At current times Earth’s annual orbital pattern creates a lowering the Planet Earth’s the annual average surface temperature differentiation.
This exact phenomenon is what creates the observed in our era the very slow (millennia’s long) continuous (gradual) Global Warming.
–
https://www.cristos-vournas.com
So here’s a fable.
Aesop has a pond on his property. The water level in the pond fluctuates from year to year depending on rainfall, drought, what’s planted around it, etc. Aesop wants to raise the average water level, so he runs a pipe from his well into the pond and turns the water on. Not too much, because he doesn’t want to run the well dry.
He doesn’t notice much difference the first couple of years but, as expected, the water level eventually starts to rise. It looks like he’s losing about half his piped water, maybe into the ground or the vegetation around the pond, but the average water level is definitely increasing.
Aesop’s friend comes by and tells him he’s wasting water – the amount in the pond would have gone up anyway, just because the weather was changing. Heck, the friend remembers, way back, when the pond level was much higher anyway.
Aesop says “I dunno, seems like if I run water in that’s what’s raising the level. Besides, if I’m losing half my water now, won’t I still be losing it if I turn off the pipe flow? Why should the weather change that?”
So Aesop’s friend shows him a bunch of estimates of where the water is going and coming from, and how it will all change or not change as soon as the pipe is shut off, so the water will keep rising anyway.
Aesop says “Hmmm. I wish I had another pond so we could do a comparison.”
Replace your well with a virtually inexhaustible source of water – say from a large river. How does the fable play out then?
Agnostic:
“Replace your well with a virtually inexhaustible source of water – say from a large river.”
Well, I suppose it could go like this:
Aesop has a pond on his property. The water level in the pond fluctuates from year to year depending on rainfall, drought, what’s planted around it, etc. Aesop wants to raise the average water level, so he runs a pipe from a river with a virtually inexhaustible source of water into the pond and turns the water on. Not too much, because he doesn’t want to blast the pipe off its connection.
He doesn’t notice much difference the first couple of years but, as expected, the water level eventually starts to rise. It looks like he’s losing about half his piped water, maybe into the ground or the vegetation around the pond, but the average water level is definitely increasing.
Aesop’s friend comes by and tells him he’s wasting water – the amount in the pond would have gone up anyway, just because the weather was changing. Heck, the friend remembers, way back, when the pond level was much higher anyway.
Aesop says “I dunno, seems like if I run water in that’s what’s raising the level. Besides, if I’m losing half my water now, won’t I still be losing it if I turn off the pipe flow? Why should the weather change that?”
So Aesop’s friend shows him a bunch of estimates of where the water is going and coming from, and how it will all change or not change as soon as the pipe is shut off, so the water will keep rising anyway.
Aesop says “Hmmm. I wish I had another pond so we could do a comparison.”
And here’s another verion:
Aesop has a pond on his property. The water level in the pond fluctuates from year to year depending on rainfall, drought, what’s planted around it, etc. Aesop wants to raise the average water level, so he runs a pipe from a river with a virtually inexhaustible source of water into the pond and turns the water full on. The pond gets flooded out in a day and nobody wonders where the water is coming from.
Pat, the first thing I learned in climate science is that all analogies fail here. It’s climate’s unique complexity. This also works just as much against Demetris’s analogies at the beginning of the post, BTW. So I’m not endorsing the Hen-egg hypothesis. But their paper clearly adds a clue sliver to the puzzle.
The carbon cycle has been well studied by carbon isotope analysis. I would be swayed much further if Agnostic or Demetris could use carbon isotope ratios to prove fossil fuel is so quickly sunk by the hydrosphere that CO2’s rise more the result of T rise dynamics than currently believed by the consensus, and CO2 rise is not simple accumulation (like a filling pond).
Ron G:
“…in climate science…all analogies fail…”
Agreed. Hey, it’s just a fable.
“The carbon cycle has been well studied by carbon isotope analysis.”
Indeed. To all: If you haven’t yet read
“Insights from Time Series of Atmospheric Carbon Dioxide and Related Tracers”
https://www.annualreviews.org/doi/pdf/10.1146/annurev-environ-012220-125406
(open access)
I recommend it.
Incidentally, Ron, the “non-fable” argument is given (rigorously, I believe) in my comment of Oct 8, 2023, 7:42 pm. (Sorry, I don’t know how to link directly to previous comments.)
Yep. Isotopes probably provide the best evidence.
Pat.
Thanks for highlighting this article, which I had not seen before:
“Insights from Time Series of Atmospheric Carbon Dioxide and Related Tracers”
https://www.annualreviews.org/doi/pdf/10.1146/annurev-environ-012220-125406
(open access)
It should be required reading for anyone posting on this thread, and especially for Demetris, who disrespects scientists and established science by seeking to overthrow theories he is clueless about. I suggest that Dr. Curry make it her next featured article.
Thanks for the suggestion, David. Also, thanks for the compliment that I seek to overthrow established theories. Whatever I seek, I try not to disrespect scientists. Disagreement is not synonymous to disrespect, is it?
I am afraid it would be impossible not to disagree with the article’s Table 1, entitled “The global carbon budget for January 2010–December 2019” as if the global carbon budget only depends on human actions (emissions & land use change), leaving out the 96% of that global carbon budget.
As evident in the title of its Table 1, this is based on Friedlingstein et al. (2020; “Global carbon budget 2020”). In our paper, we cite (and also criticize) the newer version of it, (Friedlingstein et al., 2022; “Global carbon budget 2022”). So, we may not be so clueless as you think.
“It should be required reading for anyone posting on this thread, and especially for Demetris, who disrespects scientists and established science by seeking to overthrow theories he is clueless about.”
Dear god, that is the literal definition of irony.
Demetris,
1. General
No, disagreement is not disrespect. But assuming that mainstream climate scientists are foolish without understanding their arguments is disrespectful. Evading questions is disrespectful, not only to the questioner but also to the Socratic method (and by extension to the Greek Homeland!) Your evasions leave me unclear on what you understand and what you don’t. Calling valid comments “political” is disrespectful, and you have called my arguments such twice. But I took those statements as compliments, since in both cases they showed you had no real rebuttal.
At one point someone argued that controversy was good, but that might have been Dr. Curry, not you. Controversy for controversy’s sale should not be the goal of these exchanges. Understanding should be the goal. We can certainly agree that the topics we are arguing about are important inputs to public policy. I think our political decision-making process (especially in the US) needs more understanding, not more noise and controversy. I would not spend any time on sites like Dr. Curry’s if I were not seeking to learn as well as teach different viewpoints. Too many people talk only to those they agree with.
2. Mass balance/carbon conversation
Your strong reaction to Table 1 in Keeling and Graven suggests you don’t understand it. The left column expresses carbon conservation in that (9.4 + 1.6) – (5.1) = (3.4 + 2.5) or (human emissions) – (atmospheric accumulation) = (net global uptake). That is how the sum of the last two numbers, the net global uptake, was determined from data. Ferdinand, Pat, myself and others had not broken the land/sea sink into separate land and sea sinks as that takes much more analysis. Everyone knows that gross exchanges are larger and not well known. Evidently Keeling and Graven saw no purpose in tabulating them.
In your Appendix A1, you criticize Friedlingstein for showing perfect balance between inputs and outputs in preindustrial times. We know that atmospheric carbon levels are changing much more rapidly now than they ever did historically, even using the dubious stomata data instead of the gold standard ice core data. So the imbalance between the natural inputs and outputs, presently a few percent was then much less and probably indistinguishable from 0. You can only complain about them calling it exactly zero, if that is what they did, rather than essentially zero.
A common misconception (which I believe Agnostic shares based on his fixation on “balance sheets”) is that the big blunder in the standard explanation of CO2 rise is that natural processes are assumed to remain constant. But the conclusion that global natural processes must necessarily be net carbon sinks, not sources, does not need any such assumption. It only needs the understanding that if you put a known amount of carbon somewhere, and then find only half of it remains, the missing carbon must have gone somewhere else because carbon is conserved. That somewhere else cannot be the source of what remains.
2. (continued)
You have called the mass balance argument “circular reasoning” without explanation. Perhaps you were joking or perhaps you are ignorant. The question of whether net global uptake is positive (global natural processes are sinks) or negative (global natural processes are sources) is an empirical one. Measurements of atmospheric carbon accumulation could have come out greater than human emissions, but they did not. I do not believe circular reasoning allows different conclusions from different data.
You have claimed falsely that people like me who have been arguing with you have gone away converted to your way of thinking. They have not. They have stopped commenting and asking questions because their experience tells them they will get no answer from you. I will give you another chance:
If natural reservoirs have consistently been global net sinks for the last century, how can they simultaneously be the source of atmospheric CO2 rise?
David,
a. I searched the entire thread, as well as the paper, for the word “foolish” and it appears I have not used it. Let alone the phrase “climate scientists are foolish”.
b. I think I did not put words in the mouths of others that did not say them.
c. I generally avoid judging other people. I try only to discuss what they say.
So, at least I have not violated three necessary principles of respect. If I had, the assertion that I am disrespectful would be valid.
PS. I have clarified several times that I answer questions related to the subject of the paper, not any question related to climate (let alone non-climate issues raised by some). I think this is not “evasion”. It is (i) recognition that I do not know everything related to climate, (ii) attempt to make the discussion more focused, and (ii) attempt to use my time more effectively. Nb., I have more papers in preparation–and I have also to avail time on important non-scientific duties.
“Your strong reaction to Table 1 in Keeling and Graven suggests you don’t understand it.”
This is an ironic statement given you have either not read the Keeling document or YOU have not understood it. It absolutely is not supporting your point.
“…the standard explanation of CO2 rise is that natural processes are assumed to remain constant. But the conclusion that global natural processes must necessarily be net carbon sinks, not sources, does not need any such assumption.”
And that is where the confusion and misunderstanding lies. I’ll try again: from the POV of the sinks in the biosphere, it cannot tell the difference between a manmade CO2 molecule and one emitted by nature. The atmospheric concentration is the total of all sources. By describing it as a “net sink” because you make distinction between manmade CO2 and natural is what causes the confusion.
If humans were not emitting CO2, it would be a net source.
It is absolutely is crucial to understand that natural processes change the rate at which they emit CO2 when temperature changes. (BTW – you will find no discussion of that in the document you are championing.)
“here is a consensus that the sink is at least partly accounted for by CO2 fertilization, but the magnitude of this effect is still highly uncertain [±100% (22)], and the relative role of other processes such as climate impacts on land ecosystems and the role of anthropogenic nitrogen inputs is unclear ”
“If fossil-fuel burning were the only influence on the gradient, an intercept of zero and slope of >0.60 ppm/Pg C year–1 would be expected (53). The negative intercept could have several causes (52, 54) but is best explained by natural processes”
Throughout the document, some of the uncertainties and confounding observations relative to theory are apparent. Here is the equation they give in 2.1:
“M · dCa/dt = FF + LU − O − B”
Not dissimilar to other linear and completely unphysical equations which do not account for changes to the rate of respiration due to temperature, and the change in the rate of photosynthesis due to CO2. They explicitly show all they estimations of changes in sources to be ONLY human – either fossil fuels or land use, they do not even mention or consider any changes to emission in the biosphere.
C14 levels in the atmosphere as an indicator of CO2 from fossil fuel is not reliable which is why it is rarely talked about. That’s because levels of C14 vary over time – it is not produced at a constant rate.
https://www.pnas.org/doi/10.1073/pnas.1719420115
” We measured 14C ages of calendar-dated tree rings from AD 1610 to 1940 from southern Jordan to investigate contemporary 14C levels and to compare these with IntCal13. Our data reveal an average offset of ∼19 14C years, but, more interestingly, this offset seems to vary in importance through time. While relatively small, such an offset has substantial relevance to high-resolution 14C chronologies for the southern Levant, both archaeological and paleoenvironmental. For example, reconsidering two published studies, we find differences, on average, of 60% between the 95.4% probability ranges…”
Demetris,
Wasn’t a topic of your paper the cause of atmospheric CO2 rise in the last century? Yet you disrespect science by ignoring clear arguments and refusing to answer the main question several of us have: how can natural land/sea reservoirs, which globally have been nets sinks for a century, be the cause of that rise? That you did not know this argument when you wrote the paper is excuasable. Not addressing it now is not. It is very much relevant to your paper.
Agnostic,
1. You don’t want to get me started on the misuse of radiocarbon data by Harde, Salby, Berry, Essenhigh, Skrable and probably others.
2. Can you comment on column 1 of Keeling and Graven? I am unclear whether you are saying it is wrong, or if you say my comments about it were wrong.
Agnostic:
“… natural processes change the rate at which they emit CO2 when temperature changes. (BTW – you will find no discussion of that in the document you are championing.”
Huh? If you’re talking about Keeling & Graven, you missed a big part of their discussion.
Agnostic:
““M · dCa/dt = FF + LU − O − B”
Not dissimilar to other linear and completely unphysical equations which do not account for changes to the rate of respiration due to temperature, and the change in the rate of photosynthesis due to CO2.”
Well, that “completely unphysical equation” is just our old friend (pardon me for bringing it up again) conservation of mass. Which holds instantaneously whether the terms on the right are changing or not.
Do you speak math? Take the time derivative of that equation, use the chain rule to convert derivatives with respect to time to derivatives with respect to temperature, and you’ll see that the delta T terms you are concerned about affect the second derivative of the atmospheric CO2 content; that is, how fast the accumulation rate is changing, not the instantaneous rate itself.
Keeling and Graven assume that you understand all this.
David and Pat, I am not claiming Demetris claim is close to reality but I’m not agreeing with you on your logic of why.
Agnostic wrote: “If humans were not emitting CO2, it would be a net source.”
I think we all agree from paleo evidence as well as Demetris’s Hen or Egg paper that if:
1) GMST record was as it is today
2) CO2 was not a GHG
3) fossil fuel did not exist
then
4) CO2 level would show a rise somewhat similar to the Keeling Curve but just with some lower trend.
5) The difference between the Keeling Curve in this scenario and the one we see today depends upon how much of that curve is made from ACO2 accumulation versus T effects on the CO2 equilibrium of the fast carbon cycle.
The answer to #5 depends upon how sensitive CO2 levels are to temperature and also on the mass and speed of the fast carbon cycle. There are several cycles contained within one. There is not only the biological carbon cycle but also the ocean surface solubility cycle. Upwelling (cold and CO2 rich), water warming in the tropics emits CO2 as downwelling of cooling water in the northern portion of the global conveyor is sinking CO2. If the size of the sink in the north was powerful enough, for arguments sake, to take up 100% of ACO2 then the atmospheric CO2 is 100% controlled by GMST influence. If there is zero sink then it’s 100% the result of ACO2 accumulation.
You mass balance equation assumes 50% sink capacity on ACO2 but also zero T influence. I think you agree that this is incorrect. The question then becomes simply to what magnitude.
C14 is confounded by nuclear bomb testing but probably still useful. I am not sure about the accuracy issues with C13 but this seems to be the place to study.
Pat Cassen: “Huh? If you’re talking about Keeling & Graven, you missed a big part of their discussion.”
Then enlighten me. Where in the equation does it account for the change in the rate of respiration from natural sources, and where in the paper does it discuss it?
Pat Cassen: ” that is, how fast the accumulation rate is changing, not the instantaneous rate itself.”
That is for the rate of accumulation which is NOT what I am talking about, not the change in rate of respiration.
I really am not sure how much clearer I can be. By not accounting for the change in the rate of natural respiration, you cannot separate the anthropogenic component of the accumulation rate.
You won’t be able to get that without a term expressing the rate change (which BTW – is extremely uncertain) in your equation. Also you have terms which are interdependent. CO2 on T, and T on CO2. That is not expressed there and why the mass balance argument is silly.
You really need to get on to Bartemius who will be able to explain it mathematically better than I. That’s his area of expertise and he is pretty scathing about the mass balance argument too – I just came to it much later and from and different angle – via paleoclimatology.
David Andrews:
“1. You don’t want to get me started on the misuse of radiocarbon data by Harde, Salby, Berry, Essenhigh, Skrable and probably others.”
Oh really? Your answer is whataboutism? I merely pointed out that radiocarbon fractions in the atmosphere is not talked about these days because it is (now) well known that C14 which is created primarily in the stratosphere by cosmic particles changes over time, confounding the separation of fossil fuel derived CO2 with natural.
“2. Can you comment on column 1 of Keeling and Graven? I am unclear whether you are saying it is wrong, or if you say my comments about it were wrong.”
No, I am saying that the Keeling document is pretty good at pointing out the uncertainties. I quoted a couple but there are many more.
If you mean Table 1, can you point to me there where it indicates the rate of change respiration as a function of temperature?
You’re awfully close.
Imagine Aesop’s pond has permanent inlet taking water from a dam. He notices that if it doesn’t rain or there isn’t any other source of water, the pond loses water slowly. There must be a leak somewhere. The dam has to continually feed the pond otherwise it will run dry.
He wants to raise the level so he runs a pipe from the dam and turns on the water harder. He notices a curious thing; the pond water level doesn’t go up by as much as the extra water he is putting in (as expected) because the pond is still leaking, but he realises that it is now leaking faster. The reason is there is more water available – there is greater pressure increasing the rate at which the pond is losing water.
Eventually, the pond reaches a certain level and stops going up.
Then one winter, they get a lot of rain and the dam fills up. He noticed that the water in his pond went up a little bit initially (because of the rain), but he didn’t doing anything to the pipe running from the dam and yet the pond level keeps going up. The reason is there is now more water pressure coming from the dam. Without doing anything the pond level rose on its own.
Folks, your Aesop’s fable are too complicated. In fact, Aesop was very simple and concise. An example (The Shepherd who cried “Wolf!”):
There was a boy tending the sheep who would continually go up to the embankment and shout, ‘Help, there’s a wolf!’ The farmers would all come running only to find out that what the boy said was not true. Then one day there really was a wolf but when the boy shouted, they didn’t believe him and no one came to his aid. The whole flock was eaten by the wolf.
The story shows that this is how liars are rewarded: even if they tell the truth, no one believes them.
One can only pray for the simple day that climate sheherds stay home, so nothing will still happen to climate. Give the sheep a break.
As a matter of fact it was a similar analogy that I heard years ago that explained how this interdependence worked except using a bathtub and a bucket or something like that. I’ve never forgotten the over-arching principle.
Ron,
“the first thing I learned in climate science is that all analogies fail here. It’s climate’s unique complexity.”
–
But,
In our times Planet Earth is in an exceptional annual orbital pattern, which pattern (earth’s orbit eccentricity, when Earth is at its closest to the sun during the North Hemisphere’s winter, and it is very much close to the sun at the times of winter Solstices…)
–
What we witnessing in Northern Hemisphere is the summers being cooler and winters being warmer.
The opposite phenomenon, (the summers being hotter and the winters being colder) which actually takes place in Southern Hemisphere, is being smoothed by the Southern Hemisphere’s vast oceanic waters areas.
As a result, at current times Earth’s annual orbital pattern creates a slow lowering the Planet Earth’s the annual average surface temperature differentiation.
–
This exact phenomenon is what creates the observed in our era the very slow (millennia’s long) continuous (gradual) Global Warming.
–
https://www.cristos-vournas.com
Christos, the waning side of the obliquity cycle is however offsetting the precession effect you describe. But in a few thousand years they will both be increasing the Earth’s surface temperature differentiation. We better save some coal.
Ron,
“But in a few thousand years they will both be increasing the Earth’s surface temperature differentiation. We better save some coal.”
–
Of course.
What I am afraid of is that with the current rate of births, in a few thousand years there hardly will some humans left.
–
https://www.cristos-vournas.com
Demetris,
1. General
No, disagreement is not disrespect. Disagreeing with arguments that you do not understand is disrespectful. Evading questions is disrespectful, not only to the questioner but also to the Socratic method (and by extension to the Greek Homeland!) Your evasions leave me unclear on what you understand and what you don’t. Calling valid comments “political” is disrespectful, and you have called my arguments such twice. But I took those statements as compliments, since in both cases they showed you had no real rebuttal.
At one point someone argued that controversy was good, but that might have been Dr. Curry, not you. Controversy should not be the goal of these exchanges. Understanding should be the goal. We can certainly agree that the topics we are arguing about are important inputs to public policy. I think our political decision-making process (especially in the US) needs more understanding, not more noise and controversy. I would not spend any time on sites like Dr. Curry’s if I were not seeking to learn as well as teach different viewpoints. Too many people talk only to those they agree with.
2. Mass balance/carbon conversation
Your strong reaction to Table 1 in Keeling and Graven is unjustified. You do understand, I hope, that the left column expresses carbon conservation in that (9.4 + 1.6) – (5.1) = (3.4 + 2.5) or (human emissions) – (atmospheric accumulation) = (net global uptake). That is how the sum of the last two numbers, the net global uptake, was determined from data. Ferdinand, Pat, others, and I had not broken the land/sea sink into separate land and sea sinks as that takes much more analysis.
In your Appendix A1, you criticize Freidlingstein for showing perfect balance between inputs and outputs in preindustrial times. (I have not checked on this but take your word.) We know that atmospheric carbon levels are changing much more rapidly now than they ever did historically, even using the politically motivated (that’s a joke) stomata data instead of the gold standard ice core data. So the imbalance between the inputs and outputs was then much less than the perhaps few percent of today, and I think you should cut Freidlingstein a break for taking it as 0 instead of maybe 1 + – 1%.
A common misconception (which I believe Agnostic shares based on his fixation on “balance sheets”) is that the big error in the standard explanation of CO2 rise is that natural processes are assumed to remain constant. But the conclusion that global natural processes must necessarily be net carbon sinks, not sources, does not need any such assumption. It only needs the understanding that if you put carbon somewhere, and then find only half of it remains, some must have gone somewhere else because carbon is conserved. That somewhere else cannot be the source of what remains.
You have called the mass balance argument “circular reasoning” without explanation. Perhaps you were joking or perhaps you are ignorant. (In any case you are disrepectful.) The question of whether net global uptake is positive (global natural processes are sinks) or negative (global natural processes are sources) is an empirical one. Measurements of atmospheric carbon accumulation could have come out greater than human emissions, but they did not. I do not believe circular reasoning allows different conclusions from different data.
You have claimed falsely that people like me who have been arguing with you have gone away converted to your way of thinking. They have not. They have stopped commenting and asking questions because their experience is that they get no straight answers from you. I will give you another chance:
If natural reservoirs have consistently been global net sinks for the last century, how can they simultaneously be the source of atmospheric CO2 rise?
David,
“A common misconception (which I believe Agnostic shares based on his fixation on “balance sheets”) is that the big error in the standard explanation of CO2 rise is that natural processes are assumed to remain constant. But the conclusion that global natural processes must necessarily be net carbon sinks, not sources, does not need any such assumption. It only needs the understanding that if you put carbon somewhere, and then find only half of it remains, some must have gone somewhere else because carbon is conserved. That somewhere else cannot be the source of what remains.”
–
“That somewhere else cannot be the source of what remains.”
–
Yes, it can partly be a sourse of what remains. The otherwise way of thinking leads us inevitably to the [CO2] extinct from the atmosphere.
–
https://www.cristos-vournas.com
Christos,
Don’t make the mistake that others have made of confusing the present composition of the atmosphere with the cause of the increase. The large gross two-way fluxes indeed mean that little of the increased CO2 in the present atmosphere is anthropogenic. The atmospheric CO2 and land/sea reservoir CO2 mix on a time scale of about a decade. Therefore the “Suess effect” (reduction in radiocarbon fraction of atmospheric CO2 by the introduction of “cold” anthropogenic carbon) is substantially smaller than it would be without the mixing. Only about a decade’s worth of fossil fuel cold carbon emissions remain. Suess himself noted that would be the case. That is one of a couple of errors that Skrable made.
“If natural reservoirs have consistently been global net sinks for the last century, how can they simultaneously be the source of atmospheric CO2 rise?”
I have answered this but you have ignored it. They are BOTH sources AND sinks. The problem is with your use of the word “net”. It leads to the confusion that you and others seem to get stuck on.
Think of a tree; it has leaves, branches, and a trunk. It’s model for the biosphere. It is both SINK and SOURCE of carbon. During the growing season the tree grows leaves, and in autumn they fall off, decay and release the CO2 it trapped during the growing season back into the atmosphere.
So it is BOTH a sink and a source.
When it warms, MORE of the CO2 it originally trapped is released back into the atmosphere. It means there is more CO2 next time around for growth. That’s why CO2 increase lags temp change, because the temp change has to come first.
If the temperature didn’t change, an equilibrium is reached between CO2 from decay and photosynthesis capturing it. When it warms CO2 in the atmosphere goes up until photosynthesis catches up.
Question for you that will help you understand: If a branch (representing decadal residence time for CO2) that falls off the tree takes LESS time to decay than it took grow, what do you think happens to atmospheric CO2?
Agnostic.
The word “net” is not a source of confusion, it is absolutely essential. For any given year, “net global uptake” for that year is ONE NUMBER, the sum of positive terms from around the globe and negative terms from around the globe. It is cannot be positive and negative at the same time. The positive contributions come from photosynthesis, dissolution of carbon in the oceans, etc: any process which removes carbon from the atmosphere. The negative contributions come from plant respiration, decay, soil emissions, ocean outgassing, etc: any process which adds carbon to the atmosphere. Yes a tree is sometimes a source and sometimes a sink.
Your attempt to estimate individual terms and their temperature dependence is well-intentioned but futile. You are doing the analysis the hard way. Evidently you never took a physics course and learned the power of conservation laws. Carbon conservation allows us to conclude that for the past century, while humans burned fossil fuels, net global uptake has been consistently positive. Photosynthesis plus dissoultion of carbon in the oceans have on balance exceeded plant respiration, decay, and ocean ourgassing. If that were not true, net global uptake, (human emissions) – (atmospheric accumulation) would have been measured to be negative.
You did not answer my question about column 1 of Table 1 in Keeling and Graven. Are you sayiing it is wrong or are you saying I misunderstand it?
Agnostic,
Good luck with your calculations. Be sure to calculate absorption rates as well as emission rates, as they are larger. I am glad you are concerned with uncertainties. Ballantyne et al figure that net global uptake netween 1960 and 2010 was 192 +-29 PgC. You can compare your results with theirs when you are done.
Sorry Agnostic but I wish to leave Lucia’s question below in full view.
I need to put up some of my thoughts on this thread as well.
The earth we live on .
The atmosphere in gas phase, the oceans etc in liquid phase and the crust in solid mineral phase or as ice and snow.
It has an inbuilt source of heat which is important.
The vast majority of the heat present at the surface comes externally from the sun.
The minerals making up the earth are the original source of the atmosphere and the oceans.*
The earth is basically a hot meteorite slightly cooling down.
If we could imagine it a lot further away from the sun in orbit we would find it to have very little atmosphere as most of the oxygen and nitrogen would be frozen as a layer on the surface with the oceans as solid ice.*
The earth, and meteorites, have a pH depending on their mineral composition which for the earth is around pH 8.1.
When the temperature increases ( planet closer to the sun in our case) water becomes liquid on top of the solid mineral surface and engages in chemical reactions which lead to it equilibrating with the pH of the surface of the earth in general.*
When water is present a third gaseous layer develops from the large amount of gases given off by the warming water.
This is far greater than any trace gases such as on the surface of the moon.
The gases in the atmosphere are present as per Boyle’s law each by how much is dissolved in the water at that temperature and pressure from the solids presented by the earth.* Oxygen.
CO2 in the air is present in minuscule amounts compared to CO2/H2CO3 various forms and CaCO3 in water.
In turn the earth has massive amounts of CaCO3 and other Carbonates.
The earth pH 8.1 is in equilibrium with the water pH 8.1 overall.*
The CO2 in the atmosphere has been there for over the last two billion years. It has always come from the water dissolving carbonates when it is warm enough to do so.
The water keeps an average 400 ppm in the atmosphere with an average surface temperature of 14.9 C at 1 atmosphere of pressure.
Since the sea surface acts as a buffer any minor addition to the atmosphere by fossil fuels immediately reabsorbed with a minute, virtually indistinguishable change in PH. Possibly 0.00001.
Sinks in that sense are nonsensical.
–
The proof that temperature drives CO2 is actually very simple to demonstrate and before everyone’s eyes at sea level but not at the height of Mauna Loa for obvious reasons (too high).
–
All the CO2 readings are done on 24 hour and annual bases.
Over land and sea at hourly intervals through a day and night cycle an amazing thing happens. The level of CO2, particularly over the sea fluctuates in harmony with the actual sea temperature. it falls significantly during the cold of night and rises significantly with warming of the water by the sun every day.
–
We can nit pick about winds and currents, equilibrium meanings and pressure changes.
If anyone can prove that this description of CO2 changes at surface level is wrong I will shut up for a week
An aside for everyone.
If temperature precedes CO2 other mechanisms have to explain how and why this could be so.
Most people, not all acknowledge that Temperature rise will lead to CO2 outgassing from the sea but say the claimed magnitude of this out gassing is to small to account for the CO 2 rise by standard theory .
The simple answer might be that the amount of water surface available for out gassing is seriously underestimated.
I might be wrong but I would feel that standard assessments are only made on the surface water area of the oceans, seas, lakes and rivers ignoring three other large sites of water surface area available to take up and put out CO2.
–
The obvious one is all the water in the land subsurface that is still on contact with the air itself in the first meter of the earth surface, ignored because it is not visible.
–
The second is every living plant and animal on the earth who also contain water and transmit CO2 back to the air through our lungs and pores and skins.
–
The third is every water droplet in clouds, rain mist sea spray and waves which again increase the amount of sequestered CO2 available to the atmosphere.
People forget that a raindrop has a surface area and a pH much lower than the ocean, around 5 which suggests up to a thousandfold more CO2 in the raindrop than outside it yet still pouring CO2 into the temperature as the atmosphere heats up 10C or more during the day with no ocean restricting the heat rise.
Such sources might double or triple the standard CO2 rise for a Centigrade change in temperature.
Would that be enough.
–
If temperature increase ( sun, distance from sun, NH/SH, albedo change due to clouds and the fact that energy in does not conveniently equate with temperature of the earth as it is hottest when the sun is further away from the earth) does not match the CO2 level accurately then the idea is disprovable.
Further these variables would have to match a spike in true (CO2 outgassing increase) for the idea to work.
– I repeat myself
The third variable not considered by Engelbeen et al is the true amount of water/air interface available because clouds, raindrops at pH 5 have a lot of CO2 in them a lot more that cannot be counted as CO2 in the atmosphere and there is a vast amount of water in the earth with similar access to air which is never counted.
Anyway though temp and CO2 are going up and I would expect match the parameters for outgassing the two do not show the synchronicity needed on pure temp CO2 graphs.
The CO2 spike drops in May? Whereas the orbital distances (energy in) are not helpful unless they provide more cloud cover.Very difficult.
–
OK a desperate try.
An aside for everyone.
If temperature precedes CO2 we would have to come up with mechanisms to explain how it does so when the current physics only allows a small change in CO2 per degree C rise.
–
My understanding is that the physics is predicated on a surface area of gas exchange purely from ocean’s ,seas, lakes and rivers which is too small.
A larger surface area might be compatible with known CO2 rises.
My contention is that we severely underestimate the amount of surface area of water in contact with the air in three ways.
There is a lot of water in the top meter of earth which is in virtual direct contact with air. Unlike the ocean air can penetrate most soils to this depth.
Secondly the water in every living plant and animal also contains CO2 and exchanges with the air through lungs, pores and skin and sweat glands.
Thirdly every drop of rain, mist sea spray and cloud is made in part of water droplets at a pH of 5, a thousand fold increase in PH indicating at least 60 if not a thousand times more CO2 in solution.
This is often said to be equivalent to a square meter of water in the air in height extending around the earth.
How much bigger is that possible surface area in tiny bubbles?
–
If temperature increase ( sun, distance from sun, NH/SH, albedo change due to clouds and the fact that energy in does not conveniently equate with temperature of the earth as it is hottest when the sun is further away from the earth) does not match the CO2 level accurately then the idea is disprovable.
Further these variables would have to match a spike in true (CO2 outgassing increase) for the idea to work.
Repeating myself.
The third variable not considered by Engelbeen et al is the true amount of water/air interface available because clouds, raindrops at pH 5 have a lot of CO2 in them 60 lot/lots more that cannot be counted as CO2 in the atmosphere and there is a vast amount of water in the earth with similar access to air which is never counted.
Anyway though temp and CO2 are going up and I would expect match the parameters for outgassing the two do not show the synchronicity needed on pure temp CO2 graphs.
The CO2 spike drops in May? Whereas the orbital distances (energy in) are not helpful unless they provide more cloud cover.Very difficult.
angech,
“…every water droplet in clouds, rain mist sea spray and waves…”
It is a wondeful insight, I agree with everything you say!
–
angech – also include bubbles in the ocean caused by wave action. Huge surface area!
In my opinion the surface area of the atmospheric water is millions of times larger than the earth’s surface area. Maybe billions of times larger.
–
https://www.cristos-vournas.com
David Andrews: No….the word “net” is absolutely irrelevant. you have to understand that from the POV the biosphere, there is no difference between CO2 emitted from man and that emitted from the biosphere. Anything in the atmosphere is just CO2 available for photosynthesis. That’s why “net” is pointless because it doesn’t tell you anything, or well…it does but it just leads to confusion.
“Good luck with your calculations. Be sure to calculate absorption rates as well as emission rates, as they are larger.”
I already have. The absorption rates are about HALF the emission rates. Actually they are almost identical except that you have to account for the fact that absorption is typically only 6 months of the year, and only 70% of is from the CO2 that is drawn from the atmosphere.
I also think I have underestimated the emission rate change. But it is close enough to demonstrate that at least HALF of 20th CO2 rise is due to natural emissions.
Agnostic, I will try to give you an example of why your reasoning is wrong…
You start a new business with lots of goods in your shop.
The first day, you put $100 of your own money in the cash register to start the day.
After a lot of transactions during the day, including the sales of $100 of donuts, you end the day with $50 in the cash register.
The second day, you put $200 in the cash register of your own money, the sales are going better, including $200 of donut sales and you end the day with $100 in the cash register.
The third day, you put $300 in the cash register, $300 donuts sold and $150 in the cash register at the end of the day.
Etc…
According to me, 100% of the daily “gain” is from the twice as high daily input of your own money and your business makes a loss every day, whatever the sales of the donuts.
According to you, the increased sale of donuts is responsible for halve the “gain” of your business…
Conclusion: the NET balance of CO2 ins and outs is all what counts, individual CO2 fluxes have not the slightest interest, as long as the increase in the atmosphere is less than what humans one-way add to the atmosphere…
jim2 | October 21, 2023 at 1:55 pm |
angech – also include bubbles in the ocean caused by wave action. Huge surface area!
–
Uh,no. Each bubble in the ocean merely replicates conditions in the atmosphere inside the atmosphere of the bubble itself.
You know that.
Does nothing to the CO2 level in the atmosphere.
Whereas each liquid drop of moisture or rain in the atmosphere is drawing CO2 out of the air. Since the humidity is very constant year round there is always a lot of water in the air to provide an extra mechanism of drawing in CO2 which is not considered in the ocean surface area only type models .
This could explain howCO2 is more sensitive to temperature than the sensitivities Mr Engelbeen etc use.
Christos Vournas | October 21, 2023 at 2:42 pm |
In my opinion the surface area of the atmospheric water is millions of times larger than the earth’s surface area. Maybe billions of times larger.
–
Uh no.
Orders of magnitude in science are very important in making sure answers stay in the range of observations.
Your suggestions are far too large.
You may remember that the outline of a coast length can be double or tripled by going down to measure factual indentations but that’s about it.
–
Jim2 actually provides a good point and example about atmospheric CO2 which I will use at Lucia’s as well.
Both in coke cans and oceans the CO2 in a bubble of air that forms must have oxygen, nitrogen (to give one the bends) and CO2.
But this bubble will have the amount of CO2 in at at a depth of 10 atmospheres that will give 421 ppm of CO2 when it expands, reaches the surface and out gases at 1 atmosphere and 14.9C surface temp .
A myriad of decreasing concentrations as it rises.
Yet all perfectly in eventual balance with the surface when it pops and outgasses.
What possible role gas any human minute fossil fuel use thousands of kilometers away got to do with how much CO2 is in that bubble.
None.
Yet like Feynman says it knows how to come out at exactly the right concentration for the atmosphere it is allowed to discharge into.
This is actually a very pertinent point for those who choose to dispute the influence of only (mainly) temperature and pressure on the CO2 levels in the atmosphere.
I hope it will change people’s minds if given due consideration.
“Agnostic, I will try to give you an example of why your reasoning is wrong…”
It’s a good analogy in that it helps me show we YOUR reasoning is wrong:
“The first day, you put $100 of your own money in the cash register to start the day.”
Right there is the problem. You think of the carbon cycle as a linear transaction. It is not. You have 2 interdependent factors, temperature and CO2 availability. It is not like simply exchanging cash in a cash register for goods.
Using your analogy structure we might describe it likes this:
You have a virtually unlimited loan from a financier in order to run your shop selling lemonade. You sell your glasses of lemonade for £1, and you have £100 in your till. On most weeks, the cost of your ingredients for your lemonade equals the amount you sell it for (I didn’t say it was great business), so you always have £100 in your till.
One week there is a heat wave, and the demand for lemonade goes up. So you put your prices up by 20% by the end of the week. Your suppliers of lemonade ingredients have noticed that you and all the other lemonade sellers are needing more ingredients, so they put THEIR prices up the following week.
By the end of the following week, their prices have gone up by 20% too. Initially you made a profit, until your suppliers caught up with the costs. By the end of the 2nd week, you still have £120 (or whatever) in your till, you are still selling at £1.20/glass, but it’s costing you £1.20. No profit but you aren’t losing money either.
Then, there follows a cold snap. Suddenly the lemonade market drops. People stop buying lemonade and as well as the drop in sales, you have to drop your prices. But your suppliers are still trying to sell you ingredients at £1.20. Eventually you stop buying as much ingredients and they have to drop their prices too. By the end of the 2nd week, when business returns to “normal”, You have lost the extra £20 you had in your till and while not making a loss any more you are not making a profit, so your till goes back to having £100 in it.
THIS is a much better representation of the carbon “budget” than your overly simplistic analogy. You have to have 2 INTERDPENDENT factors – respiration rate change modulated by temperature, and biota growth modulated by CO2 availability.
Ferdinand,
“The third day, you put $300 in the cash register, $300 donuts sold and $150 in the cash register at the end of the day.”
The third day, you put $300 in the cash register, and $150 in the cash register at the end of the day…
Angech, two points:
The uptake/release of CO2 by the ocean surface layer (at about 1,000 PgC, compared to the atmosphere at 860 PgC) is only 10% of the change in the atmosphere at equilibrium, due to the Revelle/buffer factor. Henry’s law is only for CO2 gas, not for bicarbonates and carbonates. Pure dissolved CO2 is only 1% in seawater (99% in fresh water), 90% are bicarbonates and 9% carbonates.
If CO2 in the atmophere doubles, it doubles in the ocean surface from 1% to 2%, the rest only increases with 10%, as result of the lowering pH.
Still 10 times more CO2 uptake for seawater than for fresh water…
The ocean surface thus is not the main player on short term temperature changes, vegetation is. As can be seen in the opposite CO2 and 13C/12C ratio changes.
Second, the year by year variability of all natural CO2 fluxes together is not more than +/- 1.5 ppmv for the extremes (Pinatubo, 1998 El Niño) around a trend of +100 ppmv since 1958 with some 180 ppmv human emissions over the same period.
No matter that any natural flux doubled or halved over that period, the sum of all natural CO2 ins and outs was always negative over the full period.
Individual CO2 fluxes play no role at all, as long as the increase in the atmosphere is less than what human emissions supply.
The latter is one-way, all other fluxes are two-way and proven more sink than source, both for vegetation (the earth is greening) as for the ocean surface (as measured as an increase in DIC (dissolved inorganic carbon) over the past 30 years in several sampling stations.
Sorry, can’t send the references, as I am traveling and have no access to my files…
Hello, I have another question. In “Revisiting causality using stochastics: 1. Theory Demetris Koutsoyiannis1, Christian Onof2, Antonis Christofides1 and Zbigniew W. Kundzewicz3
”
I read after (30) the information for the y :- [ y_j+1-mu, y_j+1-mu_y,…. , y_L-j-mu_y] and so on.
I’m interpreting this to mean that in the set of equations indicated by (34) the estimate for the mean has been subtracted from all the “y” and “X” measurements. I assume the estimate of the means are from the data set. (So, if the y’s are measurements– or data–, you subtracted mean(y) from all the y’s.)
Is this correct? Thanks.
Thanks very much, Lucia. I guess you refer to our postprint (2022-06-11) as the numbering of equations in the official paper is different.
You are right, we subtract the means from the “y” and “x” measurements and we estimate the means from the data sets.
If you use a numerical method of optimization, like we did, it is not necessary to use the vector form of the framework, i.e. equations (30) – (37). It is simpler to use equations (24) – (29) (in scalar form and without subtracting means),
I have made a simple example illustrating the method numerically by using Excel (and its solver), which you may find in https://www.itia.ntua.gr/2216/
The postprints can be downloaded from my site https://www.itia.ntua.gr/2193/ and from researchgate, https://www.researchgate.net/publication/360843886 (Tab Public full-texts).
For completeness of the information, in our initial formulation (which is that contained in the official version), the vector form (equations (3.26) – (3.33) was also for the data without subtracting means. This should also work OK for a numerical method of optimization that does not use partial derivatives. But in a method that uses theoretical partial derivatives, we later discovered that these should include those of μ_v, and we felt it easier to reformulate in terms of differences from means, than to use partial derivatives of μ_v. So, we changed it in the postprint (but only for the vector version).
Demetrius ?
Thank you for helping provide Lucia the details you have.
You may get shot down or you might luck out as she is very good.
Being prepared to share information is a sign of common sense and good science aspirations.
Wish that more people were that helpful.
It is also a sign that Judith is a good judge if letting people put forward their ideas Hope you are right.
angech, thanks so much for the flattering words and for your important contributions!
No doubt, Lucia is good and I appreciate her insights and willingness to check the method.
Of course, all possibilities (being shot down, lucking out) are open. Yet we have “tortured” everything, the philosophy, math, physics, climatology, as much as we could. It took us years. And we may also be good as a team that comprises, in addition to my humble self, a philosopher and expert is stochastics, an expert in hydrology and climate, who was the IPCC lead for water, and a PhD student on causality.
We have clearly stated that we welcome scrutiny. In our conclusion of the second Royal Society paper, we wrote:
“Our innovative findings should be given considerable attention as well as careful and critical scrutiny in the form of public discussion by the scientific community, which will undoubtedly improve understanding. If the methodology we proposed in the companion paper [1] stands up to scrutiny,
then our novel, high-impact results, i.e. those of cases #23 – #28 in the present paper, will have to be taken seriously and interpreted.”
Demetrios,
Thanks for answering my question.
Sorry if the paper I have doesn’t quite match the final! I’m not sure where I downloaded. I didn’t get a paywall version. :)
The footer to the version of “Revisiting causality using stochastics: 1. Theory Demetris Koutsoyiannis1
, Christian Onof2 , Antonis Christofides1 andZbigniew W. Kundzewicz3
Reads “Postprint (2022-06-11) with updates on the analytical solution (p. 22, equations (30)-(37))
and a correction of a typo in equation (27)”. That’s inside a bright yellow box on page 1.
I’m going to be using R because it’s easier to proof read. I’m using https://cvxr.rbind.io/cvxr_examples/cvxr_intro/
It’s slow because I haven’t been doing many calculus in a while and I need to make sure I get things working out.
I also need to revive Latex at my blog. :) So this is s_l_o_w.
As Angech told you, I’m looking at a number of “major questions in my mind”. But I know some can be resolved by asking “small questions”– which basically amount to being clear about precisely what you did. As it appears the papers I have my differ from what was finally published, I guess I have another question.
In
Revisiting causality using stochastics: 2. Applications
Demetris Koutsoyiannis1, Christian Onof2, Antonis Christofidis1 andZbigniew W. Kundzewicz3
The version I have has a “Table 1” on page 5. I’m interested in the synthetic cases. I count 18 of those. Is that correct? (I am planning some additional test cases– but if you actually did them, I wouldn’t want to just waste my time repeating. I’m confident that you know how to run a code just do the meat grinding of the test cases.)
Lucia, right, the non-paywall version with the yellow box you describe is the final version. The numbering of equations is different in the official (paywall) version (the journal numbers equations by section). So, since you have this (postprint) version, that’s OK.
And, right, there are 18 synthetic cases in paper 2, plus some other versions thereof in the supplementary information, section “SI2.1 Assessment of uncertainty in the identification of the impulse response function and its characteristics”.
We may have made more, but we thought those 18++ are enough to present in the paper–they show the behaviour of the method. If you think of an additional one that would be useful, please let me know.
Nb., we used a rather advanced filtered-Hurst-Kolmogorov process, described in the paper, to generate the time series for the synthetic cases. The reason we preferred it is that this process generates apparent trends (also sometimes called secular trends) within stationarity.
By the way, I believe, unless we have a decent deterministic model predicting a change based on a deterministic equation (as opposite to statistical regression using time as an independent model), we should use stationary models with long-range dependence.
See additional information in my book “Stochastics of Hydroclimatic Extremes – A Cool Look at Risk” https://www.itia.ntua.gr/2000/
In particular, see my take on the history of related ideas in “Digression 3.E: The Time Series School and its processes”. Slutsky helped to tear down one of the four “components” of time series, originally proposed by Persons (1919), i.e., secular trend, seasonal variation, cyclical fluctuation, and a residual factor, by showing it is a statistical artifact. I believe the same for secular trend–it is just a result of narrow optic (due to insufficient time series length) on a complex system that exhibits changes on all time scales.
I’ll be doing some and discussing after I do them.
The “meat grinder” is what I call the actual tool you use to process the equations. It can be Excel based, matlab based, R etc. Once you have a tool, you can throw whatever data into it.
On trend and terms: Sure. But not everything is stochastic. Pappoulis even discusses this. And some processes contain *both* deterministic and stochastic parts. (Thank heavens for that or we wouldn’t be able to design devices that work even though flows are turbulent.) I do use “trend” for the deterministic aspects.
By “other stuff” I mean “the stuff in y that is not explained or predictable by “x”.
Of course, stochastics incorporate deterministic relationships (or “parts”, if you wish, but I prefer not to split things into parts). But “deterministic” means that it is produced by reasoning based on mathematics and physics (deduction, not induction). What is determined by statistical equations (like “trends” determined by regression using time as an independent variable) is statistical, not deterministic.
I am tempted to respond “The expected value of the pressure drop between the two ends of a pipe is the expected value of a pressure drop between two ends of a pipe is the expected value of the pressure drop between two ends of a pipe. And this is true even if ”
And I could add, “If the system is ergodic– which we often assume for ‘steady-state flows’, I can get an estimate that expected value from a sufficiently long time average of the pressure drop. Sufficiently long is a sufficiently integral time scales for the stochastic variations.” (We generally ascribe those stochastic variations to “turbulence”.)
Oh. I just did respond that way. :)
It will take some time, but I will be using the term “trend” and, for time series, connecting that to “the rate of change in the Expected Value of (x)”. So d(E(x))/dt = “Trend in X with respect to time”. If you think d(E(x))/dt≠0 is something that never exists , or that there is no word for it, I’m a big mystified. If you know they exist, I’m a bit surprised you think there is no scientific word for what d(E(x))/dt is.
And of course when engineers say “pressure gradient in a pipe flow” they usually mean “d(E[P(x)]/dx”, and we all have this notion that it is often the case that d(E[P(x)]/dx≠0 (and that when this “pressure drop” is observed in a horizontal pipe filled with fluid, we will generally see fluid flow. And that flow occurs both in laminar flows– which are totally deterministic, and turbulent flows, which have some stochastic looking behaviors.
And I note: Pappoulis certainly never suggests d(E(x))/dt≠0 never happens and discussed the difference between stationary and non-stationary processes.
For what it’s worth: I believe that not everything is stationary.
As I said, I will be running some toy models. It is not my intention to give you homework based on my thought which, after all may not turn out the way I anticipate. And in anycase they will be easier to explain to my audience using my own toy models, constructed in the more “engineering” way I think and illustrating outcomes in those situations.
But I think you are being silly in suggesting that “trend” has no scientific definition. And it’s really hard to let such a thing pass.
demetriskoutsoyiannis
I have “D. Koutsoyiannis, C. Onof, Z. W. Kundzewicz, and A. Christofides, On hens, eggs, temperatures and CO₂: Causal links in Earth’s atmosphere, Sci, ”
I have looked your stuff by (8) and (10). I will reserve comment on that as it is unimportant. All I can say for now is “Those aren’t the droids I’m looking for”.
Sorry, I can’t be entirely clear. I will not be able to be so until I have run some toy models and can explain. I am sure you understand it sometimes takes work to show what you mean.
“you are being silly in suggesting that “trend” has no scientific definition”
Perhaps I am silly. But I haven’t seen any decent (rigorous and non-circular) definition, have you?
Of course, there are nonstationary processes, which for the mean might imply E[x(t)] ≠ 0. But this E[x(t)] is the ensemble mean, not anything related to temporal means (which are also stochastic processes).
A time series of a geophysical process (formed from observations of that process) provides no means to know the ensemble mean, as we only have a single time series.
This is different from your example “the pressure drop between the two ends”, in which we can have as many (laboratory or field) experiments as we wish. And we can control the conditions of the experiments, so as to be the same (repeatability).
To say that a stochastic process is nonstationary you need to use deduction–not induction based on statistical relationships. For example, that the random walk is a nonstationary process has a proof derived by deduction.
I have written lots of papers trying to clarify those issues. As an example, see:
D. Koutsoyiannis, and A. Montanari, Negligent killing of scientific concepts: the stationarity case, Hydrological Sciences Journal, 60 (7-8), 1174–1183, doi: 10.1080/02626667.2014.959959, 2015.
There’s no scientific definition of a scientific definition.
“There’s no scientific definition of a scientific definition.”
Right. Because this is not part of science but of the scientific method. And scientific method is branch of philosophy, not of science.
About the hierarch of knowledge see: Gauch, H.G., Jr., 2003. Scientific Method in Practice. Cambridge University Press, Cambridge, UK.
Demetris –
I was being sarcastic. If we want to be Sophists (we’re they Greek?) we could argue about what’s really “scientific” ’till the views come home.
I think it’s pretty sophistic to argue that any science that speaks of trends is inherently “unscientific.” I doubt that you’d do so, but that seems to me like a reasonable extension of your logic.
The point is, imo, that the term “trend” is perfectly fine for communicating about scientific concepts. How many angels can dance on the head of a pin and what does that have to do with the price of tea in China?
Yes, Joshua, sophists were Greeks in ancient times. But they did not dominate the Greek spirit. Perhaps, now they have expanded all over the world.
Here is how Socrates thought of sophists, as quoted by Xenophon (Memorabilia, 1.6.13): “So is it with wisdom. Those who offer it to all comers for money are known as sophists, prostitutors of wisdom).
Perhaps, if we assume that I have some wisdom, this should be of very low value and no one wants to buy it. That’s why I am doing unfunded research. But this also means that I can hardly classify as sophist.
Demetris –
One needn’t be a Sophist to make a sophistic argument.
I wasn’t intending to suggest you’re a Sophist.
demetriskoutsoyiannis
I’m not sure what “μ_v”… Oh wow. cutting and pasting turned that from a “box_v”. (Maybe it will show in mine?)
It looks like you mean the “mu subscript v” in equation 8 in my version of the “applications” paper — that’s added to the term involving the sum of the product of (g, xij).
So, basically, the “other stuff” term. Yes. If you take the derivative of the “y” on the left hand side you would need to take the derivative of everything on the right hand side.
If that term *did* happen to actually contain a deterministic portion that happened to be an honest to goodness real trend, it would be come a constant. And if I understand correctly, you then subtracted out when you subtracted off when you threw stuff in “the meat grinder” of Excel.
Right, Lucia, it is “mu subscript v”.
No, in the Excel file I referred to, we do not use derivatives and it was not necessary to subtract anything. See the “mu subscript v” in cell D2 (from equation (24) after taking expectations).
I am not sure what you mean by “other stuff” and “meat grinder”. If you mean that “mu subscript v” may depend on something, then yes, it may. See paper 3 (in /Sci/), equations (8) – (10) and Figure 15.
I believe “dependence” is a proper stochastic term, while “trend” is not. The former has a scientific definition, the latter not. Please search this thread for “A trend is a trend is a trend” to locate another comment of mine and see what I mean. See also my other comment (reply to you) I inserted a few minutes ago.
Lucia, thanks for the explanations on “meat grinder” and “other stuff”. So, my reply re. “other stuff”, i.e. “See paper 3 (in /Sci/), equations (8) – (10) and Figure 15.” is suitable for what you meant.
ganon1950: “You are looking at annual /seasonal variation. Equally valid, and making sense with the underlying physics, is that the temperatures (atmospheric and sea surface) lag the peak of CO2 respiration cycles by 0 – 3 months.”
The annual and seasonal variations are part of variations that include medium and long term processes. Think of a tree; foliage represents short term seasonal, the branch medium term, the trunk long term.
Long term variations are controlled as much by the rate of change respiration as short term. A branch simply takes longer to decay.
Question; if a branch that falls from a tree takes less time to decay than it takes to grow, what happens to atmospheric CO2?
Demetri,
“Nature confuses them too. She never told me “that’s the one, that’s the other”.
I’m sure that’s the case with natural forcings, but I don’t think there is too much confusion between burning of fossil fuels and biosphere respiration cycles – even though some “agnostics” here seem to have a problem conflating the two.
“but I don’t think there is too much confusion between burning of fossil fuels and biosphere respiration cycles – even though some “agnostics” here seem to have a problem conflating the two.”
Interesting observation. You should tell nature not to eat the human CO2s then, since you are so sure there is a difference. Sounds like you are sucker for branding.
Agnostic,
“You should tell nature not to eat the human CO2s then, since you are so sure there is a difference.”
Nature only “eats” a fraction of human CO2, and excretes more of it response. And, yes I’m sure of the difference, it is called “source”.
“Nature only “eats” a fraction of human CO2, and excretes more of it response. And, yes I’m sure of the difference, it is called “source”.”
Don’t tell the mass balance guys. They won’t hear of it.
But it’s pretty impressive how nature can pick and choose its CO2 sources.
Yes I have. I gave you one. It is not circular. That you may have a mental block, I can understand. But “trend” being a gradient of some sort in the Expected value of something is perfectly non-circular.
Of course E[x] is the ensemble mean of the processes.
But if you think ensemble means are never related to temporal means, I would like to point you to the preface of the third edition of Pappoulis.
You may read 13-1.
You can read more there. You will find some general discussion of estimating moments of a stochastic process based on a time series.
I think you might also benefit reading Chapter 10: Stochastic processes. The earth’s climate is one realization of a particular physical process. I would write the symbol for that realization here, but Wordress doesn’t seem to like greek variables.
Of course we know that the time series of earths temperatures is the only realization of the earth’s weather/climate process we can access. That we can access only 1 realization of a particular stochastic process does not mean the process does not exist.
TBH: I find it odd that you even want to use terms like “variance” or “mean” in your papers– calculating them based on time series, and not recognizing that E(XY) = R_XY is also an “ensemble average”. And that when you estimate this based on your time series, you are assuming that your “X” and “Y” are ergodic. That is you are assuming that time series and ensemble averages can be interchanged. And moreover, when you use the vocabulary like “mean”, “variance”, “covariance” you are implying the existence of an ensemble, of which your particular case is a member. But you may, of course, find any number of E(something) to refresh your memory in Pappoulis.
No need to point me to Papoulis and no need to ask me to refresh my memory on it; I think it’s alive as, I believe, I have understood what Papoulis says. Remember my earlier suggestion to you that Papoulis is holy bible.
If you find it odd that I use variance and mean, see my book (google “Stochastics of Hydroclimatic Extremes”) and in particular:
– Table 4.1 Different variants of the variance of a stationary process in discrete time, as an example for clarifying the four different concepts. [because “variance” describes four different things].
– Digression 3.A: Misuses of stationarity and ergodicity
(Nb., to estimate the (ensemble) variance in a stochastic process from data, it needs to be stationary and ergodic.)
See also my paper with Montanari that I mentioned above (where we also mention Papoulis).
By the way, Papoulis’ holy bible does not contain the word “trend”. Not even once.
But …. if you think that your definition of a trend, which is about “some sort in the Expected value”, counts as a scientific definition, then this, compared with what I wrote, proves that we have insurmountable difficulties in communicating. Sorry.
A famous graph due to James Hansen showed T and CO2 in perfect lockstep during the 8 glacial and 8 interglacial periods according to the Antarctic ice core. (I’m told that in his movie Al Gore used this graph, vastly expanded so that he had to ride a cherry picker to go from the minima to the maxima of each period.) Later, improved resolution allowed identification of the moments when T and CO2 began to change at the beginning of each glacial and interglacial period. In 16 out of the16 cases, CO2 lagged T by about 600 (+-400) years. We conclude that a change in T may have caused a change in CO2 (perhaps Henry’s Law?), but that a change in CO2 could not have caused a change in T.
That is true for paleo glacial – interglacial cycles, where initial forcing is change in insolation (Milankovitch cycles). It is not true where the major forcing is increase in GHG concentrations (current situation) and CO2 and temperature (GSAT) rise are nearly synchronous (on the timescale of the G-IG transitions) with temperature lagging slightly; with two components corresponding to the heat capacity of the atmosphere (weeks to months) and the ocean (years to decades). Trying to equate the behavior of the different forcings is disingenuous. It is pretty simple and logical: Forcing comes first, effects (which may include various feedbacks) follow.
” CO2 and temperature (GSAT) rise are nearly synchronous (on the timescale of the G-IG transitions) with temperature lagging slightly”
Is this your reply to our quiz?
No, it was supposed to be a reply to Lance Arthur Wallace’s comment. Guess I hit the wrong “reply” button.
Thanks! Curious to see your reply to our quiz, whatever “reply” button you hit… Which lags which?
I think I already answered that, if not specifically in response to your quiz: It depends on what is the (change in) forcing – that always comes first. E.g., if the forcing is an explosive volcano eruption, with particulate reduction in surface insolation, GSAT cooling comes after the eruption, not before. Of course, it is much easier to tell with a rapid, transient change in forcing, rather than a longer-term quasi-continuous increase such as the anthropogenic build up of CO2.
ganon1950,
“… a longer-term quasi-continuous increase such as the anthropogenic build up of CO2.”
–
ganon1950, do you think without the fossil fuels burning we would have faced a large [CO2] deficit in Earth’s atmosphere?
–
https://www.cristos-vournas.com
Christos Vournas,
No, I don’t think there would be a large deficit of [CO2] without the burning of fossil fuels. I think there would still be a growth in [CO2], but much slower (maybe 10%), from other anthropogenic sources such as cement production and land use (deforestation) processes.
Robert Cutler,
“Wouldn’t your simple ocean-integration explanation require that CO2 be the lower-order trend in my simple analysis?”
I think you want to be plotting Delta_T vs. ln([CO2]_t/[C02]_0).
And keep in mind that dT proportional to ln([CO2]. . . is only an approximation based on the Beer – Lambert law. The reality of the absorption response is more complex because of the CO2 absorption band shape, broadband (BBR) excitation, and changing lineshape with pressure and temperature (altitude), particularly the tail response when band center is saturated.
Since we are really talking about causality, I’d suggest looking at: “On the causal structure between CO2 and global temperature” Stips et al., Nature Scientific Reports (2016).
https://www.nature.com/articles/srep21691
And since considering the induction time for warming the ocean, perhaps IPCC AR6 WG1, section 7.5 (Estimates of Equilibrium Climate Sensitivity and Transient Climate Response).
And finally, my usual closing question on this subject: If, in the current circumstances, rising temperature (GSAT) is causing [CO2] to rise, what is the forcing that is causing the GSAT to rise?
Agnostic,
Thanks for the demonstration that, with sufficient data manipulation, you make what you want out of the noise. Here’s the same thing with minimum allowable smoothing:
https://www.woodfortrees.org/plot/esrl-co2/mean:3/scale:0.2/isolate:3/from:1960/to:1980/plot/hadcrut4gl/isolate:3/mean:3/from:1960/to:1980
I see nothing that is consistently leading or lagging, just noise.
“Thanks for the demonstration that, with sufficient data manipulation, you make what you want out of the noise.”
And then:
“Here’s the same thing with minimum allowable smoothing:”
Minimum allowable smoothing?
Everything looks like noise if you scale out enough.
Here is your graph again with your “smoothing” over a smaller time period: https://tinyurl.com/4whfp729
You can see CO2 generally (nearly always) lagging Temp. If you don’t believe me then:
“During the study period north boreal ecosystems show a strengthening of the lagged correlation with temperature in recent years, ”
https://tinyurl.com/ycy6jzdt
“The maximum positive correlation between CO2 and temperature is found for CO2 lagging 11–12 months in relation to global sea surface temperature, 9.5–10 months to global surface air temperature, and about 9 months to global lower troposphere temperature. The correlation between changes in ocean temperatures and atmospheric CO2 is high, but do not explain all observed changes.”
https://tinyurl.com/y2pfx5zr
There are many, many other papers coming to the same conclusion. CO2 lags temperature on ALL timescales, including the recent period.
> what is the forcing that is causing the GSAT to rise?
ABC.
> what is the forcing that is causing the GSAT to rise?
A random walk on water, http://dx.doi.org/10.5194/hess-14-585-2010 (search for “forcing” in the pdf)
ganon1950: “Thanks for the demonstration that, with sufficient data manipulation, you make what you want out of the noise”
Certainly media rigor has the necessary skill to smooth granularity of all the raw data provided by CAGW science; ask any climate shepherd about this obvious truism—it’s settled then.
Agnostic:
“The maximum positive correlation between CO2 and temperature is found for CO2 lagging 11–12 months in relation to global sea surface temperature, 9.5–10 months to global surface air temperature, and about 9 months to global lower troposphere temperature. The correlation between changes in ocean temperatures and atmospheric CO2 is high, but do not explain all observed changes.”
Hens, eggs and biased interpretation. You are looking at annual /seasonal variation. Equally valid, and making sense with the underlying physics, is that the temperatures (atmospheric and sea surface) lag the peak of CO2 respiration cycles by 0 – 3 months.
Understanding, and correlating with, physical causality, is more important than adjusting the data until you see what you want to see.
Demetri,
“A random walk on water”.
I think you confuse internal variability of an attractor constrained chaotic system with a deterministic forcing.
Jungletrunks:
“Certainly media rigor has the necessary skill to smooth granularity of all the raw data provided by CAGW science; ask any climate shepherd about this obvious truism—it’s settled then.”
Yes, and the “shepherds” can, and do, provide statistical analysis of correlation, and an explanation of the underlying physical causality. I see neither from Agnostic. And yes – it’s settled.
ganon1950: “I see neither from Agnostic. And yes – it’s settled.”
What? I just linked to one and you hand-wave it away saying it “hens and eggs biased”.
Sorry, but like it or not CO2 lags temperature on all timescales when looked at by scientists who understand the statistics.
The woodfortrees graph was linked to me by one such.
The mechanism for this well known and well represented in the literature.
ganon1950,
“I think you confuse internal variability of an attractor constrained chaotic system with a deterministic forcing.”
Perhaps, but it’s not my fault. Nature confuses them too. She never told me “that’s the one, that’s the other”.
Agnostic2015,
Would you prefer it if I said: The choice of phase offset for correlated cyclical signals that extend beyond the measurement period is arbitrary?
“The mechanism for this well known and well represented in the literature.”
Sure, how about a reference.
CO2 – temperature can have causality in both directions; and it depends on the particular circumstances and the underlying physical causality. General statements like “CO2 lags temperature on all timescales” are, at best, misrepresentation.
On the causal structure between CO2 and global temperature
https://www.nature.com/articles/srep21691
“CO2 – temperature can have causality in both directions; and it depends on the particular circumstances and the underlying physical causality. General statements like “CO2 lags temperature on all timescales” are, at best, misrepresentation.”
That CO2 can effect temperature means it should be regarded as a FEEDBACK, given that CO2 lags changes to temperature on all timescales. On shorter timescales precipitation is also an important factor. It is not a misrepresentation to say that CO2 lags temp on all timescales that we can reliably measure – it is a fact. You can ignore the data all you like it doesn’t change that reality.
ganon1950: “The mechanism for this well known and well represented in the literature.”
“Sure, how about a reference.”
No problem.
“On these timescales, warm years tend to be associated with more rapid increases in at- mospheric CO2, and cool years with reduced growth rates (Braswell et al., 1997). This positive relationship between temperature and atmospheric CO2 is attributed primarily to an increase in ecosystem respiration (Re) with increasing sur- face temperature, and a concurrently muted gross primary production (GPP, or photosynthesis) (Doughty and Goulden, 2008).”
https://acp.copernicus.org/articles/13/9447/2013/acp-13-9447-2013.pdf
“Soil respiration and soil organic matter (SOM) decomposition are most sen- sitive to a temperature increase in areas where soil temperatures are low, as is the case in tundra and boreal forests”
https://tinyurl.com/rnbc776
That article, Moren & Lindroth, quantifies the CO2 efflux in a boreal setting using eddy covariance instruments. It’s fascinating and well written article that goes some way to helping show the complexities and confounding factors in involved, but the fact that respiration changes differently to GPP (gross primary production) or photosythensis is measured, quantified as best those confounding factors allow.
“The cumulative GPP was practically independent of the temperature in early autumn. In late autumn, air temperature could explain part of the variation in GPP but the temperature sensitivity was very weak”
https://bg.copernicus.org/preprints/6/7053/2009/bgd-6-7053-2009.pdf
There’s tons and tons of this. There is even a society called “Fluxnet” who studies this and collates the results from across the world.
Demetris,
would you care to comment on the paper “On the causal structure between CO2 and global temperature” (https://www.nature.com/articles/srep21691). It seems to contradict your “CO2 lags temperature on all time scales”.
Perhaps that is true, but perhaps not true at all time, and not for all (biogeochemical-) physical processes.
I continue to smile at the attempts to use biosphere respiration cycles to imply that fossil fuel emissions -> rising temperature, are caused by some unspecified leading temperature rise. Causality: Of course, CO2 rise follows T in respiration cycles: First there is temperature rise due to seasonal insolation cycles (Northern Hemisphere, where most landed photosynthesis takes place), followed by increased foliage and photosynthesis, which causes reduction in atmospheric CO2, reaching a minimum in mid-summer shortly after the solstice (max NH insolation). Then as photosynthesis falls and decay increases, the CO2 levels rise to start the cycle all over again (with baseline changes from non-cyclic sources – the Keeling curve). It is no surprise that the amplitude of the CO2 (decline and) recovery is correlated with the prior seasonal temperature rise. Certainly, choosing a 1-year sampling period, with +/- 6 month offset between CO2 and temperature isolates and demonstrates this rather obvious correlation. I guess this is my answer to the “quiz”. I still do not see how it relates to, or disproves, the CO2 -> T relationship of fossil fuel burning.
ganon1950
The challenge of using correlation on data with multiple processes involved is that you can only separate the processes by filtering the data. For example, taking the annual difference is a filter which attenuates not only the seasonal signal, but also low-frequency energy. This particular filter has a peak response for 2-year cycles (frequency of 0.5 yr^-1).
My frequency-domain approach to this problem does not suffer from this problem, it has the opposite issue which is that the FFT window attenuates the ends of the series and favors the middle, which is less of a problem if the processes are reasonably stationary, which the trend is not. This is what limits my analysis on the low end to 10-year periods with confidence, and 20 year periods with some subjective analysis.
Here’s an example using South Pole CO2 data with NH temperatures. The nominal delay is 0.7 years, and the delay for the seasonal variations is a bit less. Using SH temperatures, the nominal delay is the same, but the seasonal delay is only 0.4 years.
https://localartist.org/media/frfcoh5_10_20_NH_SPO.png
Anthropogenic CO2 emissions have not risen in a perfectly smooth trend. The variations in the trend should be detectable in temperature give how potent you seem to think the effect is. It doesn’t matter if the oceans are integrating the trend, that would simply show up in my analysis as the frequency response falling off at a rate of 1/f. I can find no evidence of this. I can also find no evidence that changes in temperature are responsible for the bulk of the temperature rise.
The paper you keep referencing begins the introduction with “During the past five decades…” and then starts the results section with “We use this technique to analyse the recently measured global mean surface air temperature anomalies (GMTA)36 and various reconstructed external forcings covering the period from 1850 to 2005 (156 years)” This is a common head-fake theme I’ve found in this type of paper.
The reason for so much interest in a trace gas is that it’s being blamed for warming over the last century. We have measured data for the last 65 years, which is where the anthropogenic emissions are the greatest. Do you have any evidence, using measured data, that CO2 forces temperature more than temperature forces CO2?
You asked what I thought was driving the temperature trend if not CO2. Take a look at this. I have yet to find a reason to dismiss this result as a spurious correlation.
https://github.com/bobf34/GlobalWarming/blob/main/hybridmodel.md
I’ll end by asking you one more question. If CO2 is responsible for most of the warming, then what do you believe explains the two long pauses over the last 20 years?
P.S. I took a look at SOI->Temperature->CO2 relationships. I tried to post this, but I guess there were too many links. If there’s interest I’ll break the post into parts and try again.
Robert Cutler,
Why use sunspots as a proxy? There is very good solar irradiance reconstruction date, e.g.:
(https://climate4you.com/Sun.htm#Solar%20irradiance%20reconstructed%20since%201610)
I note that the largest peak to valley change for the largest 11-year solar cycle (1980) is 0.08%, and the full range since the Maunder minimum is only 0.2%. Also, there has been no increase in the low frequency components since 1940, indeed they have been in rather steep decline since 1990.
The average insolation (spherical geometry and diurnal average) is about 340 W/m^2 so the solar Forcing (change) due to 0.08% (max) solar cycle change is down to 0.27 W/m^2. This can be compared to the ~3.7 W/m2 that is attributed to GHGs.
See also: https://climate.nasa.gov/climate_resources/189/graphic-temperature-vs-solar-activity/
I expect that “Bob” would not have been able to produce the same results if he had used solar irradiance instead of sunspot number.
As for what the causes the two “flat spots” in the GMST curve over the last 20 years – I don’t know. I have never claimed that CO2 concentration is the only thing that changes GMST, only that it is the major forcing causing the “big picture” changes over the last ~ 60 year. I expect the the flat spots are, at least partially, what the eye wants to see, combined with quasi-chaotic internal system cycles such an ENSO which has about the right frequency but only a small (but real) effect on GMST.
ganon1950
“Why use sunspots as a proxy? There is very good solar irradiance reconstruction date”
Several reasons:
1. No one really knows how TSI has changed over the last century or two. There’s even disagreement on how to composite measured data from space-based sensors. Those promoting CO2 warming generally use the TSI reconstructions with the least variance. I can provide several sources, but try this 2018 paper from Egorova et al. “Revised historical solar irradiance forcing”. First sentence from abstract: “There is no consensus on the amplitude of historical solar forcing.”
2. TSI reconstructions incorporate sunspot data in the models. Much information is lost in the process as the sunspot signal is parameterized.
3. The sunspot signal is a proxy, it is not the activity. You seem to think that activity is linearly encoded in the sunspot signal amplitude. It isn’t. There are a number of ways that solar activity is encoded in the signal.
4. Irradiance is not the only source of solar forcing. Solar magnetic fields may also play a role through the modulation of galactic cosmic rays. GCR’s are thought by some to modulate cloud and ice-crystal formation. I’m seeing hints that this might be true. For example, the coherence between temperature and the sunspot signal is low for the 11-year cycle and high for the 22-year cycle.
Robert Cutler.
Fine, double my quoted (most probable) values, and you get to the maximum of range quoted by Egorova et al.. It doesn’t change my conclusions – it can only be a minor forcing compared to CO2.
No, I make no assumption about linearity of “encoding” of irradiance in sun spots. In fact it is not, the reverse is more important, and change of sunspot number from zero to maximum observed changes TSI by less than 0.4%.
While all your unquantified objections to uncertainty in TSI may (or may not) be real, it is the primary activity and is certainly more precise than counting sunspots (are they normalized for size, or the intensity of association flares – which are actually the source of TSI changes?). As long as we are not being quantitative: All your proposed uncertainties are quite minor (just my opinion) and cannot explain what has been easily observable for the last 60 years.
Which is why we should be treating CO2 rise as feedback not a forcing….
“temperature (GSAT) rise are nearly synchronous (on the timescale of the G-IG transitions) with temperature lagging slightly; ”
No it doesn’t, hence Demtris’s paper. Where do you see temperature lagging CO2?
Anthropogenic CO2 is both a forcing and a (sublinear) feedback.
If you think rising CO2 is an effect, what forcing do you think is causing its rise?
Temperature is lagging CO2 right now. We’re just beginning to see the temperature rise. Dynamics of the last glacial-interglacial transition: started with insolation temperature rise in the Arctic, followed globally by CO2 rise and positive feedback(s) that drove the rest of the deglaciation. From a number of G-IG transitions, an approximately 1.5x increase in CO2 (180 to 280 ppm) caused ~8 C warming. Currently, anthropogenic CO2 emissions have caused another 1.5x in concentration, yet, so far, an increase of only about 1.2 C in GSAT has been observed. I deduce that temperature will continue to rise for decades to centuries, even if CO2 emissions are stopped at the current level (i.e., Temperature lagging CO2).
“Global warming preceded by increasing carbon dioxide concentrations during the last deglaciation,” Shakun et al., Nature volume 484, pages49–54 (2012)
https://www.nature.com/articles/nature10915/
ganon1950
“Temperature is lagging CO2 right now. We’re just beginning to see the temperature rise.”
What evidence do you have to support this statement? The greenhouse gas effect is optical, and the CO2 well dispersed in the atmosphere. Why would there be a significant lag in temperature?
Robert Cutler,
Sorry, my longer answer would not post.
But OK, the answer is simple: Because the ocean has much higher heat capacity than the atmosphere, and it is not well mixed, particularly below the thermocline.
ganon1950
“OK, the answer is simple: Because the ocean has much higher heat capacity than the atmosphere, and it is not well mixed, particularly below the thermocline.”
So you’re implying that the ocean is integrating the CO2 forcing. In theory that’s possible, and I clearly observe that integration in my solar forcing model.
If you’re correct, then perhaps you can explain this result. I’ve taken the log of the CO2 data and fit a first-order polynomial to both temperature and CO2 over time. I’ve also applied a 1-year moving average to both signals to remove the seasonal variation. What I observe, and have verified by fitting second-order polynomials, is that the CO2 trend is modeled very well by a second-order polynomial, while the temperature is primarily first order. Wouldn’t your simple ocean-integration explanation require that CO2 be the lower-order trend in my simple analysis?
https://localartist.org/media/longtrends_ln_global.png
“Temperature is lagging CO2 right now.”
No it’s not.
https://www.woodfortrees.org/plot/esrl-co2/mean:12/scale:0.2/isolate:60/plot/hadcrut4gl/isolate:60/mean:12/from:1961
“If you think rising CO2 is an effect, what forcing do you think is causing its rise?”
Temperature induced increase in the rate of biodegradation (respiration).
It might be worth reading some of the posts in this thread where this is discussed. Demitris’s paper (and its not the only one to do this) shows that CO2 lags temperature on all timescales.
“Dynamics of the last glacial-interglacial transition: started with insolation temperature rise in the Arctic, followed globally by CO2 rise and positive feedback(s) that drove the rest of the deglaciation. ”
Which is still temperature leading CO2.
The period in question is the Bolling-Allerod, which was the period of very sudden warming at the end the Older Dryas. Following the sudden warming, temperatures cooled down to the Younger Dryas while CO2 went up (to as much as 425ppm), however that was likely a lagged effect of the warming that caused the Bolling-Allerod.
“which marks a shift from a warmer to a colder climate state, CO2 increases markedly before the boundary and peaks at ca 400-425 ppm before it decreases again and then stabilizes after the boundary into a pattern of lower-amplitude
fluctuations withaverage values of 230-250 ppm during GS-1”
https://tinyurl.com/4923z3kn
Note also that stomata (and other high resolution proxies) show much greater variability than ice cores.
https://tinyurl.com/ycx32azx
The Bolling-Allerod/Younger Dryas is a fascinating period during which climate, temperature and CO2 were relatively “de-coupled”. I have a theory that the collapse of the North American Ice Sheet precipitated a huge die off that contributed to CO2 rise in the atmosphere, which then slowly declined until it reached equilibrium just as temperatures were beginning to recover. Whatever the cause, on ALL timescales, including BA/Younger Dryas into the holocene, and also today, temps lead CO2.
1. I think we can all agree: atmospheric CO2 fluctuations in the distant geological past were not caused by human emissions. Some then leap to the unjustified conclusion that they are not causing them now.
2. Pay attention to the rates of rise now, compared to rates of rise in the geological past. They are much higher. What is happening now is most definitely NOT “business as usual” with fluctuating natural processes. What is different between then and now? Humans are emitting nearly 10GtC/year, two times the amount needed to account for the present rapid rise.
3. Clearly Agnostic’s model is wrong, if it gets natural emissions > natural absorption, because an immediate corallary is atmospheric rise > human emissions which is empirically falsified.
They are not “much higher”.
“The majority of the stomatal frequency-basedCO2 estimates for the Holocene do not support the widely accepted concept of comparably stable CO2concentrations throughout the past 11,500 years (Indermu.hle et al., 1999). The available high-resolution CO2 reconstructions based on plant fossils suggest that century-scale CO2 fluctuations contributed to Holocene climate evolution (Rundgren and Beerling, 1999; Wagner et al., 1999a;McElwainetal.,2002;Wagneretal.,2002; Rundgren and Bjo.rck, 2003; Kouwenberg, 2004).”
https://tinyurl.com/ycx32azx
You have yet to actually show why my model is wrong.
Answer this question; If a branch from a tree takes less time to decay than it took to grow, what happens to atmospheric CO2?
1. How can you defend the stomata data? Look at the plot in your own link. There are wild differences between measurements at around 8000 BP, some series are well above the ice core data and some are well below. They are rubbish.
2. Your model is wrong because it predicts an atmospheric CO2 rise rate greater than human emissions, as I have noted about 10 times without rebuttal.
3. In the course of a branch’s life it removes carbon from the atmosphere and then returns it. If it decays more quickly, then at any given time fewer branches are decaying than growing, maintaining the overall balance between emissions and absorption. Of course the greening stimulated by higher CO2 levels currently has upset the balance and the biosphere is currently removing net carbon from the atmosphere.
Agnostic, stomata data are proxies that reflect the LOCAL CO2 levels of the previous growing season plus a myriad of local infuences like precipitation, etc.
They are calibrated against the gold standard: ice core CO2 that reflects the GLOBAL CO2 levels within a few ppmv, be it with less resolution (between 8 and 600 years) depending of local snow precipitation.
If the stomata data show a different average than the ice cores over the time resolution of the ice cores, then the stomata data MUST be recalibrated against the ice cores, not the other way out…
David Andrews:
1. Because they are one of the only high resolution CO2 data we have. Ice cores do not cut it they are too low resolution. They are not “rubbish” – they are calibrated to air flask readings in the instrumental era. I’m sorry if you do not like the data, but that’s science. The evidence doesn’t change just because you think it is “rubbish”.
2. I have rebutted it SEVERAL times my friend. The reason atmospheric concentrations do not exceed human emissions is because it is OFFSET by increases in the biosphere that FIX carbon. Why is this so hard to understand? Emissions grow, but sinks ALSO grow, just not at the same time – there is a lag. And that’s EXACTLY what we see on all timescales we can reliably measure.
3. “If it decays more quickly, then at any given time fewer branches are decaying than growing, maintaining the overall balance between emissions and absorption. ”
And that’s why you get this so wrong. There is NEVER a balance between emissions and absorption. How CAN there be? Think about it, you are talking about 2 completely different processes. The main limiting factor on decay is temperature – that’s why we put food in fridges. That’s why you see the variability on short time scales, but it extends to long time scales.
Think about it – if branches are decaying faster than they are growing, CO2 in the atmosphere is going to go up. If the branches are growing faster than they decay, then CO2 in the atmosphere is going to go DOWN. The decay is dependent on TEMPERATURE and the growth is dependent on CO2.
Ferdinand:
“stomata data are proxies that reflect the LOCAL CO2 levels of the previous growing season plus a myriad of local infuences like precipitation, etc.”
Which can be calibrated and checked for local bias. From Wagner et al 2004:
“To address the critique that these stomatal frequency variations result from local environmental change or methodological insufficiencies, multiple stomatal frequency records were compared for three climatic key periods during the Holocene, namely the Preboreal oscillation, the 8.2 kyr cooling event and the Little Ice Age. The highly comparable fluctuations in the palaeo-atmospheric CO2 records, which were obtained from different continents and plant species (deciduous angiosperms as well as conifers) using varying calibration approaches, provide strong evidence for the integrity of leaf-based CO2 quantification.”
“They are calibrated against the gold standard: ice core CO2 that reflects the GLOBAL CO2 levels within a few ppmv”
The “gold standard”? Says who?
https://tinyurl.com/58eek722
“Smoothing of the CO2 record by diffusion at this depth/age is one or two orders of magnitude smaller than the smoothing in the firn. However, simulations for depths of ∼930–950 m (∼60–70 kyr) indicate that smoothing of the CO2 record by diffusion in deep ice is comparable to smoothing in the firn.”
https://www.tandfonline.com/doi/pdf/10.3402/tellusb.v51i2.16276
“For the calculations presented here, what matters more than the actual Q10 values is the fact that, globally speaking, respiration is more sensitive to temperature than NPP, which is what is expected (J. Lloyd, personal communica- tion). This can be verified for particular eco- systems. For example, Grace et al. ( 1996 ) show that for a tropical rainforest, respiration is far more sensitive to temperature than is photosyn- thesis.”
Ferdinand: “then the stomata data MUST be recalibrated against the ice cores, not the other way out…”
No – they are calibrated to AIR FLASK measurements – actual instrumental measurements of CO2. Ice cores are NOT calibrated to Stomata. You also have foraminifera records which agree better with stomata than ice cores. Ice cores suffer not only diffusion in the firn layer, but also beyond that with other chemical interactions. This tends to reduce short term variability – smoothing the record. Stomata also have this problem but not so acutely. As concentrations go up, and stomata decline, there is a lower limit they will decline to, even if CO2 levels increase. So variability MAY be even greater than stomata show.
1. One stomata series in the plot you posted puts CO2 at about 275 ppm 8200 years before present and another puts it at about 210 ppm. Which one should I take as correct?
2. “Emissions grow, but sinks ALSO grow, just not at the same time ”
Are you trying to argue that a lag between absorption and emissions somehow invalidates the carbon conservation argument? I believe that on this thread someone correctly pointed out that it holds at all times. But unless one is studying seasonal variation, it only makes sense to compute net global uptake in blocks of full years. If last year’s natural absorption exceeded emissions, as it did, and the previous year’s natural absorption exceeded emissions, as it did, etc etc, then you must conclude that in the present era natural reservoirs are overall net sinks, lags be damned. (I used the word “net” which you don’t like again since I don’t know how to talk aboout these things without it.)
Or you might be trying to argue that if natural emission processes are quicker than nature absorption processes, then emission rates are larger. Trees decaying quicker than they grew makes peak emission rates > peak absorption rates for that tree. But the higher emission rates persist for a shorter time, because the tree cannot emit carbon that it had not previously absorbed. That is why it is called “the carbon cycle”.
3. “Balance” is not an assumption of the standard understanding of the carbon cycle, it is in the data. In the case of the tree you discussed, it is enforced by carbon conservation. The emission and absorption processes may look totally dfferent, but they constrain eachother.
David Andrews:
1. Who said they were at the same time? You are looking at a graph with poor temporal resolution. What we know is that atmospheric CO2 can vary much faster than is generally appreciated. Secondly each stomata or proxy series is calibrated individually because they may be different species etc. So comparing one with another has to be done carefully – not the purpose of the graph which is to show that individual proxies show greater variability than ice cores.
2. “Are you trying to argue that a lag between absorption and emissions somehow invalidates the carbon conservation argument?”
The rest of your question/point is why I get a little exasperated, because I keep having to repeat this. The answer is NO. It’s the whole notion that it will tell you anything. OF COURSE carbon is conserved, but there isn’t a perfect balance between CO2 that is emitted and CO2 that is captured. The residence time for Carbon/CO2 in the biosphere can range from a few minutes to millennia. You only need to change the residence time just a tiny little bit to have massive impact on atmospheric concentrations. That’s why I keep asking you to answer; if a branch falls from a tree and takes LESS time to decay than it took to grow, what happens to atmosCO2?
The branch represents medium term capture of CO2 which is stored. If temp does not change, then sinks and sources are in balance (eventually). If temp changes, then respiration changes first (since it is governed by temp) and sinks follow. Hence the lag. The store of CO2 is virtually inexhaustible, so trying to work out the balance between natural emissions, which is virtually unknown, and human (which is known) is impossible. The reason is because there is no difference between a human made CO2 and natural one, so the biosphere absorbs them both just the same.
Do you really not see that?
3. I pretty much addressed that above.
“The emission and absorption processes may look totally dfferent, but they constrain each other.”
No they do NOT constrain each other, but they are interdependent. Respiration is constrained by temp (primarily) and GPP is constrained by CO2 (primarily).
The rates for emission and absorption are different when there is a change of temperature. They equilibrate over time if there is no change in temp. It’s not the only factor, but it is key. Have a read of this paper:
https://tinyurl.com/rnbc776
You will see that they EMPIRICALLY observed boreal Forrests as a source of CO2. There is also this paper:
https://tinyurl.com/2j5wb674
Where they actually have a mathematical model, far superior to mine that incorporate the difference in rate of respiration (in these circles known as Q10 – the rate of change of R per 10C).
1. “CO2 fluctuations in the distant geological past were not caused by human emissions”. That is an oblique understatement. NASA’s position is that ∆T actually caused ∆CO2 during pre-industrial times i.e. forever(?) until the US Civil War. (https://svs.gsfc.nasa.gov/cgi-bin/details.cgi?aid=11362) So – honestly – the “unjustified conclusion” is rather the theory that contemporary man suddenly dominates the natural processes of Earth and is the main influencer of T. That’s the position that has the burden of proof.
2. “[The rates of rise] are much higher [now]”. This is not at all proven for ∆T. There are many periods during millenia of human civilization when ∆T likely exceeded 1ºC (up or down) in any 15-decade span. As for ∆CO2, what the measurements from recent decades actually tell us is: Be humble; nobody truly understands the complex carbon system or the extent to which atmospheric CO2 has a feedback effect on T.
3. As a life scientist I’ve found Agnostic’s comments on this thread highly stimulating and pity those who can’t contemplate them with an open mind. He(she) read the Koutsoyiannis et al paper; he trusted the math; he did not reflexively deny the results; and he asked, How might this be? And the answer he has begun to articulate (and is surely still earnestly trying to work out, as I hope hundreds of other fine minds will also do) could be paradigm-shifting for those of us interested in the viability of the biosphere. We all know the biosphere itself is highly dynamic; what he is suggesting is that we expand our vision of the larger carbon system with which the biosphere dynamically interacts. It is an incalculably large and complex system extending from Earth’s mantle through the crust and sediments and oceans and continents and soils and myriad layers of organic material and all forms of life and into the atmosphere and includes countless parts, and all of the parts are simultaneously expanding or contracting with different amounts of CO2-uptake and CO2-release at different rates interacting with each other in part depending on T, and there is no magical equilbrium-state or perfect pH in the ocean or perfect amount of vegetation or perfect amount of H2O-vapor or perfect amount of CO2 because all the parts are always in flux and when any one part changes we cannot be sure what is happening anywhere else or how any of the other dynamic rates will change. We can’t accurately quantify or model that system (although Koutsoyiannis et al’s Fig.A1 makes a helpful try); it is simply too vast; there is too much carbon cycling on Earth. However, we can be fairly confident – given the scale of the system – that anthropogenic CO2 is just a tiny part. And we can be fairly confident that we are witnessing a relatively massive expansion of the biosphere presently.
So there is so much research still to be done. Personally I’m optimistic about Earth because I’m thankful for the expansion of the biosphere.
We certainly don’t want the biosphere to contract.
Botanist,
Take a physics course and learn to appreciate how conclusions can be reached from simple and reliable conservation laws. Sure, the detail is complicated. But trying to evaluate the detail as Agnostic is doing is a fool’s errand.
David Andrews:
Then these scientists are also on a fools errand:
https://www.tandfonline.com/doi/pdf/10.3402/tellusb.v51i2.16276
“As discussed by Etheridge et al. (1996), the decrease in CO2 is unlikely to have been the primary cause of the LIA cooling. It is more likely that the reduced temperature (driven by other factors) affected the carbon exchange between different reservoirs, changing the global CO2 concentration level. d13C over this period is higher than the mean pre-industrial level, and we explore this fact as a means of determining the most likely pro- cesses involved.”
“For example, Grace et al. ( 1996 ) show that for a tropical rainforest, respiration is far more sensitive to temperature than is photosyn- thesis. In general, photosynthesis is less sensitive to temperature than respiration, especially at lower CO2 concentrations. As NPP is the balance between plant respiration and photosynthesis, the Q10 value for NPP lies between the values of Q10 for plant respiration and photosynthesis, so is less than the respiration value.”
https://tinyurl.com/ycy6jzdt
“there is a fairly strong positive year- round correlation between tropical mean annual temperatures (leading by 4 months) and annual CO2 throughout the time series since 1960, agreeing with the generally held view that the tropics play a major role in determining inter-annual variability in CO2 increment”
Agnostic, there can’t be more decay that there is first photosynthesis. Only on very short term (2-5 years) that can be the case with a strong El Niño (1998), but followed by a fast increase in photosynthesis.
On longer term, photosynthesis exceeds respiration and decay of plant rests, already sinds the 1990’s…
The earth is greening!
“Agnostic, there can’t be more decay that there is first photosynthesis.”
Ferdinand if you really believe that, then that’s where you have been going wrong. I strongly recommend you look into this. Start with this really excellent paper. They show using eddy covariance measurements that boreal Forrests are net source of CO2.
https://tinyurl.com/rnbc776
I really think you should look into this properly. What you are saying is just not right. The residence for CO2 that is drawn from the atmosphere can range from a hours/days to millennia.
Just consider my model of a tree – leaves, branches, trunks corresponding to short to long term storage of carbon.
If a branch takes less time to decay than it took to grow, what happens to atmosCO2?
There IS more decay than there is photosynthesis when it warms (also known as GPP) and the rate of change is called Q10 – the change in the rate of decay per 10C of temp change. When the warming stops, eventually photosynthesis catches up (biosphere growth). Then it is in relative balance. That’s because the rate of change decay is TEMPERATURE dependent – much more so than Photosynthesis.
“The cumulative GPP was practically independent of the temperature in early autumn. In late autumn, air temperature could explain part of the variation in GPP but the temperature sensitivity was very weak”
Agnostic,
Again, stomata data are LOCAL data, which reflect LOCAL CO2 levels during the growing season, which depend of changes in land use in the main wind direction. They are calibrated against ice cores AND firn AND direct measurements over the past century, not only against direct measurements. Here the calibration curve 1900-1990, thus including 58 years of ice core and firn measurements:
http://www.ferdinand-engelbeen.be/klimaat/klim_img/stomata.jpg
With a wide range of CO2 levels at the same stomata index level…
Compare that to the ice core vs. air measurements during the 1958-1978 period, some 20 year overlap:
http://www.ferdinand-engelbeen.be/klimaat/klim_img/law_dome_sp_co2.jpg
One can calibrate the stomata data to ice cores over the past century, but what if the local bias changed over the centuries? One of the main places used for stomata data is in the SE Netherlands, with huge changes in landscape and agriculture over the centuries in the main wind direction, even the main wind direction was probably different during warm periods (S.W.) and cold periods (East)…
You misinterpretated the ice core “problems”: diffusion only spreads the peaks in the relative “warm” coastal ice cores from 20 years resolution to 22 years at medium depth and to 40 years at full depth, that is all. That doesn’t change the average CO2 level over the period of the resolution! Thus if stomata data show a different average over the same time frame, they MUST be recalibrated against the ice cores…
There is no measurable diffusion in the much colder inland Antarctic ice cores.
Chemical problems are mainly seen in ice cores from Greenland, where frequent acidic dust from nearby Icelandic volcanoes in-situ and during the old wet methods could react with carbonates from the ocean dusts. That is not a problem in Antarctic cores, where ice cores with extreme differences in temperature, yearly precipitation and thus resolution all show the same CO2 levels for the same average gas age within 5 ppmv…
“Again, stomata data are LOCAL data, which reflect LOCAL CO2 levels during the growing season, which depend of changes in land use in the main wind direction. They are calibrated against ice cores AND firn AND direct measurements over the past century, not only against direct measurements.”
Ferdinand, I really think you should look into this a bit more. Stomata are NOT calibrated to ice cores. They calibrated to the same species in the instrumental record. There have been attempts to reconcile stomata with ice cores because it has been noted that ice cores do not show the same short term variability.
Next they do not include land use changes since this before widespread land use change that could significantly affect CO2 levels in forrest biomes.
There is also foraminifera which agree better with stomata than ice cores which ALSO show high variability. This article is worth reading:
https://www.nature.com/articles/s41598-022-07774-4
It also shows variations of ~100ppm, but its resolution is not as high as stomata.
“Thus if stomata data show a different average over the same time frame, they MUST be recalibrated against the ice cores…”
No your logic does not follow. The problem with ice cores is that they remove short term resolution:
https://tinyurl.com/dxpe55ww
“In order to interpret firn air measurements in terms of past atmospheric concentrations and isotopic ratios, we need to know the age of the air in the firn. However, due to the mixing processes in the firn, air at a particular depth in the firn is a mix of different air parcels that left the atmosphere over a range of times in the past. Thus firn air is not characterized by a single age, but a distribution of ages.”
“The processes of diffusion in the firn and bubble trapping tend to smooth out the atmospheric record. The air at a particular depth therefore has an age distribution that depends on both the diffusion and bubble trapping”
This paper (also by Trudinger) has an attempt to model the rate of change of decay (Q10) against GPP just as I say should be done, rather than try to balance a carbon “budget”.
https://www.tandfonline.com/doi/pdf/10.3402/tellusb.v51i2.16276
In order to convince me that ice cores DO have adequate resolution to say something meaningful about short term CO2 variance, you need to explain or discuss these things:
1. Discussion of the smoothing effect of CO2 at high resolution sites – CO2 is in lower concentrations at the poles – before being trapped.
2. Diffusion in the firn layer, which mix atmospheres of different ages.
3. Diffusion in the closed off layer. Its a smaller effect but it still occurs.
4. Attempts to reconcile stomata and ice cores tend to smooth out stomata. Stomata at different locations show good agreement with the each other, which is why the “but its local” argument does not hold much weight.
Ferdinand, you should address the fact that we say that CO2 is a “well-mixed” gas which is why we rely on Moana Loa CO2 instrumental record. Trees respond to available CO2 by either increasing or decreasing the amount of stomata for collecting CO2 – a trade off between preventing loss of moisture and gathering CO2, so if the gas is well mixed, it will turn up in stomata.
You haven’t actually given me a reason why leaf stomata are “only a local effect”. They are no more or less local than the sites where ice cores trap CO2 in bubbles.
Note this table:
https://lawr.ucdavis.edu/classes/ssc219/biogeo/table8.htm
Tropical:
“Previous studies have highlighted the occurrence and intensity of El Niño–Southern Oscillation as important drivers of the interannual variability of the atmospheric CO2 growth rate, but the underlying biogeophysical mechanisms governing such connections remain unclear. Here we show a strong and persistent coupling (r2 ≈ 0.50) between interannual variations of the CO2 growth rate and tropical land–surface air temperature during 1959 to 2011, with a 1 °C tropical temperature anomaly leading to a 3.5 ± 0.6 Petagrams of carbon per year (PgC/y) CO2 growth-rate anomaly on average.”
https://www.pnas.org/doi/10.1073/pnas.1219683110
Boreal:
“EC data revealed that increasing autumn temper- ature significantly enhances TER:” – TER = Total Ecosystem Respiration
“The cumulative GPP was practically independent of the temperature in early autumn. In late autumn, air temperature could explain part of the variation in GPP but the temperature sensitivity was very weak…” GPP = Gross Primary Production (ie photosynthesis).”
https://bg.copernicus.org/preprints/6/7053/2009/bgd-6-7053-2009.pdf
“After disturbance, summer measurements in Boreal chronosequences suggest that it takes about 10 years before growing season carbon uptake offsets the decomposition emissions.”
https://pubmed.ncbi.nlm.nih.gov/17633035/
“Soil respiration and soil organic matter (SOM) decomposition are most sen- sitive to a temperature increase in areas where soil temperatures are low, as is the case in tundra and boreal forests (Lloyd and Taylor, 1994; Kirschbaum, 1995). Therefore, the combination of a large carbon pool in boreal soils (Dixon et al., 1994) and increas- ing temperature, will inevitably increase soil respi- ration rates and SOM decomposition, which might transform many boreal forests into carbon sources (Kirschbaum, 1995).”
https://tinyurl.com/rnbc776
“On interannual timescales, varia- tions in fluxes from terrestrial ecosystems, driven by changes in surface temperature and precipitation, are the dominant drivers of variability in atmospheric CO2….On these timescales, warm years tend to be associated with more rapid increases in at- mospheric CO2, and cool years with reduced growth rates
(Braswell et al., 1997). This positive relationship between temperature and atmospheric CO2 is attributed primarily to an increase in ecosystem respiration (Re) with increasing sur- face temperature, and a concurrently muted gross primary production (GPP, or photosynthesis) (Doughty and Goulden, 2008).”
https://acp.copernicus.org/articles/13/9447/2013/acp-13-9447-2013.pdf
It’s really not just me.
ganon1950 | October 23, 2023 at 10:18 am | Reply
“CO2 and temperature (GSAT) rise are nearly synchronous (on the timescale of the G-IG transitions) with temperature lagging slightly”
ganon1950 | October 24, 2023 at 12:02 am |
“Agnostic,
Thanks for the demonstration that, with sufficient data manipulation, you make what you want out of the noise.”
ganon1950, I appreciate your effort to manipulate the data, but, alas, your manipulation was not “sufficient”.
You are supposed to show us synchronous rise and temperature lagging. But the cross-correlations in your graph are zero, so where is your synchrony and lagging?
Demetri,
Yes, the cross correlations are (close to) zero, and that is what would be expected when the “noise” is extracted from the signal, and then treated as if the noise is the signal.
I showed no data on the timescale of glacial – interglacial transitions (thousands of years); however, I am quite sure that if you looked at temperature and [CO2] over the last 2k years, the rapid rise of both over the last 70 years will appear synchronous. Another clear demonstration that temperature follows a rising CO2 level can be seen in figure 2a from:
“Global warming preceded by increasing carbon dioxide concentrations during the last deglaciation” Shakun et al., Nature (2012).
https://www.nature.com/articles/nature10915/
(full pdf available at ResearchGate)
Right, but you also wrote “increase in GHG concentrations (current situation)” (sorry that I did not include this part of your phrase). So, I thought your data manipulation aimed to show synchrony and lagging in the current situation.
Our paper is about the last 60-65 years, in which we have instrumental data, and thus it becomes more difficult to manipulate to produce a desired result :-)
Demetri, I’m sorry if you thought my comments on data manipulation were directed to your paper – they weren’t. They were directed to Angnostic’s treatment of the (noise) in instrumental data. Similarly, for the comments regarding the separation/conflating of biosphere respiration cycles and FF burning. ;-)
ganon1950 | October 24, 2023 at 2:15 pm |
“Demetri,
> Nature confuses them too. She never told me ‘that’s the one, that’s the other’.
I’m sure that’s the case with natural forcings, but I don’t think there is too much confusion between burning of fossil fuels and biosphere respiration cycles”
Nature’s problem is that, once emitted, the two get well mixed–that’s why she is confused.
Demetris,
Of course fossil fuel emissions get well-mixed with carbon already in the fast carbon cycle. The total carbon in that cycle therefore rises: atmospheric CO2 levels go up, the oceans get more acidic, and the biosphere expands. It is really pretty simple.
I believe the question raised by the article is: How is it possible that ∆T causes ∆CO2 in recent decades when there is such widespread concern about fossil fuel emissions? The best answer seems to be: Because the same natural climate-drivers that have existed for millenia are irrepressible and continue to drive T, which continues to drive a vast, poorly understood, underestimated natural carbon/CO2 system (regardless of fossil fuel emissions, which are apparently relatively trivial). I hope because I said that I will not be instructed by a young man to take (another damned) physics course.
Botanist,
“Because the same natural climate-drivers that have existed for millenia are irrepressible and continue to drive T”
OK, which one(s) of the natural climate drivers is driving what has been observed and measured for the last 50 years? And what is the evidence for it?
You can see an analysis of all the forcings in play since 1850 at (second figure):
https://www.carbonbrief.org/analysis-why-scientists-think-100-of-global-warming-is-due-to-humans/
I’m going to jump in on this one, not because I think it explains the recent trends except maybe on the ENSO timescale, but because it is obvious that not every change in temperature in the climate system is induced by a forcing. You can add up the effects of all forcings, and temperature can differ because internal variability in the climate system can change the temperature without a forcing. e.g., on interannual to decadal timescales, ENSO can store heat in the oceans and occasionally rapidly release it to the atmosphere. Other kinds of ocean-atmosphere coupling can lead to temperature changes on larger timescales that have no greenhouse gas or external forcing to explain them.
Botanist/ Agnostic,
Human emissions are perhaps “trivial” compared to gross natural emissions, but they are large compared to natural net fluxes. They dominate carbon increases in ocean, land, and atmospheric reservoirs.
Paul Roundy,
You are getting perilously close to Roger Jones and the escalator
https://apo.org.au/node/34095
Another thing that is really strange about this study is that it looked at global temperature and CO2 in Hawaii. Hawaii is famous for having a climate that does not change much between summer and winter and there is very little annual variation in the CO2 record at Mauna Loa (even less south of the equator). There are long records at Barrow with much more variation in both, but the trends are essentially the same over decades. Of course, it’s been studied to death.
Elliott, W. P., & Angell, J. K. (1987). On the relation between atmospheric CO2 and equatorial sea-surface temperature. Tellus B: Chemical and Physical Meteorology, 39(1-2), 171-183.
https://www.tandfonline.com/doi/pdf/10.3402/tellusb.v39i1-2.15335
Eli,
RE Elliot (1987), I do not find it surprising, after removing known “external” forcings, fossil fuel burning and biosphere respiration cycles (via seasonal insolation cycles), that the remaining T – C02 relations, largely due to quasi-chaotic internal climate system oscillations (e.g., ENSO), show T driving CO2. One should remember that T-CO2 forcings are bidirectional and the underlying physics causality for each system studied must be considered. It is quite silly to apply the results of insolation forcing, or internal variability/oscillations, to try and deny the CO2 forcing of fossil fuel burning.
Eli, I’m not sure what you’re saying. Do you somehow believe that internal variability can’t change temperature?
Demetris –
> that’s why she is confused.
It’s interesting that along with being a medium through which data speak you also understand nature’s mindset
Thanks for noting it, Joshua. I just try–it’s not at all easy…
Interesting that the CO2 record at Mauna Loa is now questioned…
Copying from the post above: “We used CO₂ data from Mauna Loa and from the South Pole”.
We also examined Barrow (Alaska) and the NOAA’s global average: same conclusions (with even higher lag); see D. Koutsoyiannis, and Z. W. Kundzewicz, Atmospheric temperature and CO₂: Hen-or-egg causality?, Sci, 2 (4), 83, doi: 10.3390/sci2040083, 2020.
You are trying to borrow an argument here. Not questioning Mauna Loa, just saying that for the type of study you were trying to do working with the entire Scripps network which would have shown delays between warming and [CO2] due to fast biogeochemical interactions as a function of latitude in a region where El Nino/La Nina is basic to the climate.
Again, as the cite provided showed, this sort of delay has long been studied and known and it has also been shown that the trend in the last 150 years was due to a new forcing, burning of fossil fuels, with a bit of land use changes in the beginning. Noted in passing that you did not cite Elliot and Angell
“this sort of delay has long been studied and known”
And yet it is not advertised much…
The delay is short, but it appears on all time scales, up to a couple of decades. Has it also long been studied and known?
“fast biogeochemical interactions as a function of latitude in a region where El Nino/La Nina is basic to the climate”
After El Nino/La Nina, first comes the temperature, then the CO2. See Fig. 13 in the paper.
There is no proof, based on the laws of thermodynamics, of the CO2 hypothesis.
The support lies solely with the correlation of increases in the concentration of CO2 and increases in the average global temperature over time, a correlation that does not prove cause.
In fact, if you compare the first order derivatives of these changes THERE IS NO CORRELATION. The correlation coefficient of year over year percentage changes in average global temperature and percentage changes in the concentration of CO2 is, 0.16 – no correlation.
Dr. Koutsoyiannis has PROVEN that the increasing average global temperature is the cause and the concentration of CO2 is the effect.
Science is based on facts and numbers, not wishful thinking. Disagreement with what he has proven without proof, not speculation or hypotheses, proof, to the contrary is not science, baseless and a waste of the reader’s time.
The physics bear Dr. Koutsoyiannis out.
The cause of climate change, both changes in the average global temperature and changes in the incidence and intensity of catastrophic weather, are the changes in ENSO SST.
Both changes in climate follow these ENSO SST changes. The coefficient of correlation is 0.78.
“Dr. Koutsoyiannis has PROVEN that the increasing average global temperature is the cause and the concentration of CO2 is the effect.”
I think that is overstating what his paper shows. He shows that because of the lag of CO2 to temperature, CO2 can not be FORCING temperature. And he has a robust methodology based on IPCC “approved” data confirming what other papers have found.
It’s for us to argue over as to why that is. I agree with you, CO2 changes in atmosphere ARE drive by temp and the mechanisms for that are well known if poorly quantified.
Demetris,
I hope you have you found time to read a reference I have cited on this thread before: Ballantyne, A. P. Alden, C.B., Miller, J.B., Tans, P.P., 2012: Increase in observed net carbon dioxide uptake by land and oceans during the past 50 years, Nature, vol 488 pp 70-72. doi:10.1038/nature11299. They use CO2 concentration data from a network of approximately 40 marine boundary sites (the NOAA/ESRL flask network). They find net global CO2 uptake between 1960 and 2010 to be 192 +- 29 PgC. The uncertainty quoted takes into account sampling errors.
Our knowledge that absorption of CO2 by land/sea reservoirs exceeded emissions in this time period is an over 6 standard deviation effect.
Thanks for the suggestion of the paper, David. I took a note to see it. I see IPCC (2021) cites it without contradicting it. As we used the IPCC estimates (our Fig. A.1, also reproduced in this post), I guess there is consistency.
Pingback: Do Human Greenhouse Gas Emissions Cause Significant Climate Change? - maywoodtimes.com
Pingback: Do Human Greenhouse Gas Emissions Cause Significant Climate Change? – altnews.org
Pingback: Do Human Greenhouse Gasoline Emissions Trigger Important Local weather Change? - The Owl Report
ganon: “OK, which one(s) of the natural climate drivers is driving what has been observed and measured for the last 50 years?” Yes – right question.
Koutsoyiannis et al’s paper is focused on T/CO2 causality; it does not pretend to know the answer to your question. But its appendices do show that ∆ of three known drivers – albedo, ENSO and ocean-heat – all preceded ∆T in recent decades (unlike ∆CO2). So that’s an instructive start.
Personally I think a large part of the answer is in the hydrologic system (dynamics of oceans /∆H2Og /clouds /albedo /precipitation) as minor trend-changes could have far-reaching impacts on T that dwarf the effect of ∆CO2. (E.g. imagine the effect on T of a sustained % decrease in cloud-albedo…) As the biosphere needs precipitated H2O, we in life sciences welcome increased knowledge in the H2O domain.
Botanist: “Koutsoyiannis et al’s paper is focused on T/CO2 causality”
No, it focused on correlation without causality, as you noted. I can, and have quoted, other papers that show a very high correlation for CO2 causing temperature rise over the last 150 years; with the rather obvious, and accepted causality: burning fossil fuels (and land use changes) increase atmospheric CO2 concentrations, which increases the green house effect (underlying physical causality very well understood), which increases atmospheric temperature.
https://www.nature.com/articles/srep21691
I do not deny that there are other cases where causality may go in the other direction (e.g., solar irradiance); but it seems to me that there is a lot of arguing about the color of black and white mice in the room and using that to throw doubt on the big white elephant in the room. I still wait for an underlying physical explanation for what causes the temperature to rise with the time signature of the last 70 years, if not the well understood, and accepted explanation of integration (with losses) of anthropogenic GHG emissions.
I would also note that ENSO/LNSO are not a global forcing, rather an internal oscillation of the climate system, which no doubt affects regional climates dramatically, but not so much the global average temperature by more than 0.1 C (and it is oscillatory, not a (quasi) continuous temperature rise over cycles.
https://www.climate.gov/news-features/blogs/enso/enso-running-fever-or-it-global-warming.
Perhaps I should change my moniker to “chemist-chemist-physicist”, LOL
ganon1950
From the link to the paper you cited;
“In a strict sense, it is precise only for linear systems (the original Eq. (2) applies to any systems, though), but the validations have shown that it is a good approximation for nonlinear time series and has seen remarkable success with highly nonlinear touchstone systems, such as the aforementioned system in55 which fails transfer entropy and hence Granger causality tests. ”
From the paper which is the subject of this blog;
” the time series that were correlated were Δ𝑇
and Δln[CO2]”
Using linear tools to find causality on unadjusted nonlinear data is not superior to using linear tools to find causality on nonlinear data that has been pre-adjusted to fit the linear equations. Mathematically the paper that is the subject of this blog is an improvement over the paper you cited.
If you read with an unbiased mind both papers are trying to find causality as opposed to correlation.
From your provided link;
“The more challenging problem is to ‘attribute’ this detected climate change to the most likely external causes within some defined level of confidence. As already noted in the Third Assessment Report11, unequivocal attribution would require controlled experimentation with the climate system. Since that is not possible, in practice attribution of anthropogenic climate change is understood to mean demonstration that a detected change is ‘consistent with the estimated responses to the given combination of anthropogenic and natural forcing’ and ‘not consistent with alternative, physically plausible explanations of recent climate change that exclude important elements of the given combination of forcings12. Therefore attribution analysis is mainly performed through the application of Global Circulation Models that allow testing for causal relationships between anthropogenic forcing, natural variability and temperature evolutions.”
Unequivocal attribution would require controlled experimentation which is not possible. So we need to do something else that both papers propose a solution to.
From the paper that is the subject of this blog;
“By reviewing various approaches to causality, the study located several problems in identifying causal links. Hence, the study developed the theoretical background of a stochastic approach to causality, with the objective of formulating necessary conditions that are operationally useful in identifying or falsifying causality claims. It also developed an effective algorithm applicable to large-scale open systems, which are neither controllable nor repeatable.”
Your assertion that “it focused on correlation without causality” is true in the sense that neither paper actually did a controlled experiment on the climate. To imply that the paper you cite is superior is not correct, however. A careful reading of this blog’s paper will yield that the current paper looked at other studies such as the one you cited, and found a superior method which is what was conducted and yielded the result that the level of CO2 is controlled by the temperature, not the other way around.
What this paper does not show is that there is no effect of CO2 on temperature. However, the effect would need to be small enough to not be detected by the method.
Rabett Run has a post with a couple of figures that do a good job of explaining the confusions
https://rabett.blogspot.com/2019/07/systems-thinking-lumpers-and-splitters.html
There are close connexions between global temperature, atmospheric water vapour. the extent of polar ice caps and levels of greenhouse gases (GHGs) in the atmosphere. When one of these is disturbed, the others react through processes that amplify the orignal disturbance und a new. different climate equibrium is reached.
In the glacial cycles over the past million years, the disturbance came from fluctuations in the Earth’s orbit around the Sun. This caused temperatures to change, in turn inducing rapid changes in water vapour, and much slower changes in ice caps and greenhouse gas levels, which together amplified the temperature change.
In modern dimate change, the disturbance comes from human-induced changes in atmospheric CO2, and other greenhouse gas levels. In both cases, the disturbance is amplified by similar reinforcing processes.
ganon, thank you for the link to the interesting 2012 article by Shakun et al which examines T/CO2 causality during the last deglaciation based on modeling from analysis of sea-ice cores. I have not read many studies in that subfield but believe the current position of mainstream climate-science remains that ∆T->∆CO2 in recent millenia until about the time of the US Civil War. See (again) NASA:
https://svs.gsfc.nasa.gov/cgi-bin/details.cgi?aid=11362
Wrt to the present day, one important aspect of the Koutsoyiannis et al paper is that it is based on actual recent measurements accepted by the IPCC, not models of implied data from 20k-yr-old frozen ocean-H2O. So the present paper is distinguished because it is based on solid recent data. It is telling us: ∆T->∆CO2 over the last 6 decades.
This Koutsoyiannis et al paper is (to me and others, surely) frankly stunning and monumentally important.
It shows that the same pre-industrial pattern ∆T->∆CO2 referred to by NASA remains the norm DESPITE fossil fuel emissions.
If you have found an error in their work, please describe it so I and others can temper our excitement about this major breakthrough.
Otherwise, it might be wise to reflect whether one is (understandably) wedded to the conventional paradigm, emotionally unwilling to accept that ∆CO2 might NOT be driving ∆T and that FF CO2 is not such a big factor.
In any case, wouldn’t it be wonderful news for humanity if FF CO2’s effects were not as simply awful as conventional wisdom says?
Wouldn’t we all rejoice if it was NOT inevitable that the world was heading toward climate-catastrophe wholly because of our FF CO2?
Given the extremely positive implications of the Koutsoyiannis et al study, it is imperative that it be considered carefully and rationally (not dismissed reflexively) and that as many fine scientists as possible continue research into non-CO2 climate-drivers and into the staggeringly vast and complex natural system of carbon-flux on Earth to which FF CO2 is added as an apparently trivial part.
“Perhaps I should change my moniker to “chemist-chemist-physicist”, LOL”
Not an attempt to be explosive; but if moniker change is under consideration, maybe consider “canon”.
I like that, unfortunately it wouldn’t reflect my education or career background. I think I’ll just stick with what I’ve got. ;-)
Folks, today, 26 October, is my name day, which in Greece is regarded more important than birthday–and celebrated accordingly.
So, my name day gift to all of you is the third edition of my book:
D. Koutsoyiannis, Stochastics of Hydroclimatic Extremes – A Cool Look at Risk, Edition 3, ISBN: 978-618-85370-0-2, 391 pages, Kallipos Open Academic Editions, Athens, 2023.
It was completed and uploaded *today* in https://www.itia.ntua.gr/2000/ (download the Full text; 14375 kB; fully open access).
Reference to the paper in discussion has been included. Some of the comments posted here were considered.
So, thanks to all!
Demetris
Have a good name day Demetris!
Thank you for your gift!
Christos
Many thanks, Christo!
Good day Demetris, and thank you for the book.
Have only looked at the first few pages, and enjoyed reading the excerpt from Aeschylus.
“Moreover, number, the most excellent
Of all inventions, I for them devised,
And gave them writing that retaineth all,
The serviceable mother of the Muse.”
As from one engineer to another that was an intriguing piece. But there was more the Muse gave humanity, an insight into the use of ‘number’; for astronomy, as a tool in agriculture, to avert periodic famine.
You may be interested in this https://melitamegalithic.wordpress.com/2017/02/24/first-blog-post/
Demetris
Thank you for the book. Looking at the table of contents I am sure I will learn much.
And thank you for sharing about the importance of name day in Greece. That was new to me.
Christos, melita, cerescokid, very pleased to see your reactions!
Melita, thanks for spotting the most important point of my book, which I stole from Aeschylus. Well, stealing has been very trendy today, but I try to steal diamonds instead of modern clichés…
Have been through the first chapter. Interesting, but I fear the rest is not my cup-of-tea by a long stretch. However I find the digressions very interesting, particularly the Greek origins.
You find diamonds in the ancient authors. I agree fully with that. There are plenty more, perhaps in the rough, invisible to the non technical. Rereading Plato these last two days – Timaeus- re the statement ‘now this sounds like a myth but signifies a declination of the heavens-‘. For the first time and with some hindsight I realised the earlier Phaethon myth is an ancient experience, told in Plato’s style as a parable. The sun carriage is driven east to west but at a point in time it went south for a short duration before continuing west. That also involved a precession jump. Thus in Digression 1C Milankovitch cannot be correct due to step changes.
(ps A similar corroborative story exists in Akkadian texts)
melitamegalithic, flattered to hear that you read the first chapter and glad that you found the digressions useful. I am impressed by your notes on Plato.
Pingback: Do We Really Know That Human Greenhouse Gas Emissions Cause Significant Climate Change? • Watts Up With That?
Pingback: Do We Really Know That Human Greenhouse Gas Emissions Cause Significant Climate Change? • Watts Up With That? - Lead Right News
“I try to steal diamonds instead of modern clichés…”
Nice. Real gems are bound by perfect chemistry.
Cliché is a lazy device, a convenience to advance sales; to facilitate commoditization of many endeavors, including politics. Cliché isn’t much useful for advancing science. Unfortunately certain fields of science are compromised by cliché. Some in science gawk at fools gold; or worse, they direct to it.
Science must make a diamond first, before it settles on canon.
demetriskoutsoyiannis, I hope you’ll consider visiting CE often, including an occasional comment. You do more than follow the science, you advance it; I thank Dr. Curry too for the same.
jungletrunks, thanks so much for the flattering comment! I will try to follow your advice. But several (bad) developments, irrelevant to my scientific activities, may be big obstacles…
Pingback: Do We Actually Know That Human Greenhouse Fuel Emissions Trigger Vital Local weather Change? • Watts Up With That? - Finencial
Pingback: Do We Really Know That Human Greenhouse Gas Emissions Cause Significant Climate Change? • Watts Up With That? - News7g
Pingback: Do We Really Know That Human Greenhouse Gas Emissions Cause Significant Climate Change? - Climate- Science.press
Hi, a non scientist here.
I recall seeing the graph in the movie, An Inconvenient Truth, that showed two sine like waves of temperature and CO2 over the very long term. I understand that they had to remove this bit from the movie in the UK or place some sort of disclaimer on it because T lead CO2 and not the other way around. Apparently this long term wave was driven by solar or orbital changes (for my purposes here it doesn’t matter why – I don’t think at least!). I have been curious to know that if an increase in T causes an increase in CO2 (as shown in the movie) AND an increase in CO2 causes an increase in T (as argued by the IPCC et al) why haven’t we spiraled into the abyss already?
Thanks, Ringo. Al Gore, the maker of the movie, An Inconvenient Truth, is also a non-scientist. He is a politician. I see it natural that politicians are involved in the climate agenda, which is a political agenda. I also see it natural that politicians use their own approach (propaganda, etc.). Problem is when scientists enter the arena of that agenda. But this is a big issue, out of the scope of this discussion.
Demetris,
“But beware, the forest should be natural/physical, not virtual. I am afraid, in the case of climate, the natural forest was replaced by a fictitious narrative dictated by political agendas.”
Sorry, but despite the euphemisms we are using, I find that (particularly “replaced”) to be a blanket ad hominem attack on the vast majority of climate scientists, particularly equating/including their views with those of politicians, activists, and “alarmists”. And once again, no reference until called on it.
ganon1950,
> particularly equating/including their views with those of politicians, activists, and “alarmists”
I don’t think I equate them. I am sorry if I gave that impression. But, if you agree that a scientist has a duty to inspect the forest, he also has the duty to see that what, determines the agenda, is politics.
I support the independence of science from politics, politicians and oligarchs.
Demetris –
> I support the independence of science from politics, politicians and oligarchs.
I know you said it’s outside the scope of the discussion, but then again is it appropriate for you to drop comments on a topic and then say that the topic is beyond the scope of this discussion?
Do you think your views expressed here and in your papers are independent from the political overlay? Are you sure that your science is devoid of any political or ideological aspect?.
I have seen comments from you that I think clearly, and more importantly explicitly, are not independent from the political and ideological aspects.
Perhaps it would be helpful if you could describe how you delineate between what does and doesn’t demonstrate independence.
Demetris,
What if the “agenda” (which seems to carry a lot of bias, like “alarmist”, or “denier”) is to better understand the “truth”, whatever that may be, and thus to be able to predict the future and better prepare for its possibilities. Is that a “political agenda”? What if the agenda is to throw doubt on the currently accepted “truth” for socio-economic reasons or simple personal convenience that does not go beyond one’s lifetime, as opposed to true skepticism for the advancement of science. I, of course, assume you are of the latter, but not so for many others here.
The answer is simple, before about 200 years ago global temperature anomalies were driven by orbital changes (Milankovitch cycles) and CO2 was an amplifying feedback.
In the last since, maybe 1850 or so, the increase in global temperature anomalies has been driven by fossil fuel burning coupled with an amplifying freedback from CO2 and water vapor
Put up a nice illustration of this on Xwitter
https://twitter.com/EthonRaptor/status/1718042740217290807
Thanks, Eli. It seems some can’t see the forest for the trees.
I have repeatedly asked for commentary on the paper “On the causal structure between CO2 and global temperature”, (https://www.nature.com/articles/srep21691)
which also uses novel data analysis to address the causality question; it agrees with your very clear physical description of the processes, but disagrees diametrically with many of the results discussed here. So far, I have only heard crickets in response.
When two (or more) mathematically complex data treatments come up with very different answers to the same question, my inclination is to go with the one that makes sense for an underlying physical mechanism.
ganon1950: “It seems some can’t see the forest for the trees.”
Good point. I have always supported the vision of the forest. For example, see p.588 in:
D. Koutsoyiannis, A random walk on water, Hydrology and Earth System Sciences, 14, 585–601, doi:10.5194/hess-14-585-2010, 2010.
In this, I also highlight the importance of the balance between seeing the trees and the forest, for keeping science alive.
But beware, the forest should be natural/physical, not virtual. I am afraid, in the case of climate, the natural forest was replaced by a fictitious narrative dictated by political agendas.
No need to discuss again the Stips et al. paper, based on the theory by Liang (its last author). Please see that have we already discussed them in our papers, starting from the 2020 one.
You may also be interested to see the review reports (click on “review history”) in both our Royal Society papers. One of the reviewers insisted on Liang’s theory and results, and we had to rebut these comments. We cited these papers even in our rebuttal reports. So we have been fully aware and we have nothing to add.
Demetris,
In my view, the trees are the internal variability of the climate system and the forest is the external forcings that cause the “trees” to change.
I’ll be glad to look at your rebuttals – if I can find them. I find it a bit egocentric for you to expect people to be familiar with all your works and reviews thereof, without referencing them when asked. But now you have done so, so thank you.
I also note that I get very suspicious when someone invokes the conspiracy theory of a generalized ad hominem attack on the greater community of scientists/climatologists with a blanket attribution of political motives rather than of scientific ones. It reeks of an attempt at defense where a real one cannot be found.
ganon,
“I find it a bit egocentric for you to expect people to be familiar with all your works and reviews thereof, without referencing them when asked”
I think I always provide links (DOIs or URLs). Sorry if I missed in some case. Therefore, perhaps I am not as egocentric as you think.
“a blanket attribution of political motives rather than of scientific ones”
No, I have made research on this and have given links. Repeating again:
Section 6 in D. Koutsoyiannis, Rethinking climate, climate change, and their relationship with water, Water, 13 (6), 849, doi:10.3390/w13060849, 2021.
D. Koutsoyiannis, The political origin of the climate change agenda, doi:10.13140/RG.2.2.10223.05283, School of Civil Engineering – National Technical University of Athens, Athens, 14 April 2020.
“I get very suspicious when someone invokes the conspiracy theory”
You will see in the last work (p. 67) that “conspiracy theories” (whatever this means) are unnecessary.
Because there is not an infinite reserve of CO2. Because the temperature responds to CO2 sublinearly (approximately ΔT = k*ln(CO2(T)/CO2(T_0)). There are also many feedbacks, both positive and negative, that are temperature dependent and with limited range, e.g., cloud cover, water vapor pressure, decrease in polar albedo stops when the ice is gone, the biosphere grows more and absorbs more CO2 as heat and humidity increase (part of the short carbon cycle), also as heat, humidity and precipitation increase, CO2 sequestration as carbonates increases through weathering of silicate rocks (part of the long carbon cycle).
What you ask is the subject of climate modeling, involving energy balance, carbon and water cycles, ocean circulation, solar irradiation, etc. While it is reasonably well understood, it is certainly not completely understood. And of course, we don’t have a real good idea of what the short and long term response to a very rapid, large increase in atmospheric CO2 from fossil fuel burning because it has never happened before. A better understanding is one of main goals of ever improving (and ever more complex) climate models.
The sine waves you refer to were/are probably Milankovitch orbital cycles, which change the amount of sunlight reaching different parts of the earth (latitudes) in an astrophysically calculable manner. These are thought to be the “triggers” or “synchronization drivers” for the glacial – interglacial cycles of the last million or so years. The actual cycles of CO2 and temperature with glacial-interglacial appear as saw tooth waves – rapid warming out of a glacial period, slow decline back in. On the time scale of the G-IG saw tooth the CO2 and temperature rise and fall appear nearly synchronous, although the is some disagreement (particularly on this forum) about which leads or lags, and under what circumstances. Right now, we should be in the slow decline back in phase, but the excess anthropogenic CO2 may have messed with that.
In terms of the time evolution of climate, it can generally be described by quasi-chaotic oscillations of the (nonlinear) coupled feedbacks (first paragraph above, and see 2021 Nobel prize in physics) with an attractor that has kept temperature in the “Goldilocks zone”, at least for the 2.5 million years or so. A deeper understanding can be reached through (openminded) study of paleoclimatology and biogeochemistry.
Hope that helps more than it confuses. ;-)
Christofides and coauthors mislead using the same mathematical trick that Murray Salby did long ago. From their 2023 paper:
“We note that differencing is of very common use in economics literature (e.g., [4,5]). In particular, for the [CO2] it proposed taking the logarithm before differencing (something resembling techniques used in economics [5]) and thus the time series that were correlated were Δ𝑇 and Δln[CO2], where the differences are taken over 12 months. By studying lagged correlations of the two, the study asserted that, while both causality directions exist, the results support the hypothesis that the dominant direction is T → CO2.”
Sounds reasonable, but here is the trick: human CO2 emissions have been approximately exponentially increasing over the past few decades, leading to an exponential increase in atmospheric CO2. By taking the logarithm of CO2, they convert the exponential into a linear increase. By then taking the differences, they convert the linear increase into a constant offset. And finally, they analyze this with the correlation, cross-covariance, and other functions that all begin by _subtracting off a constant offset_. All told, their process is perfectly designed to make the human CO2 emission disappear.
They use the same process to completely remove the linear trend in temperature from their analysis.
This leaves only the real, but much smaller effect of short term temperature changes influencing CO2. Because they have neatly subtracted off the enormous long term trend from their analysis, they give the impression that these tiny month-to-month fluctuations are the dominant effect. But it’s only dominant because they have specifically designed their process to make human emissions invisible.
Now this might be reasonable if you believe that long-term trends are never important and should be removed as the first step of any analysis. But the most pressing question in climate involved long term trends in CO2, temperature, and the relation of human emissions to those. So this type of analysis seems at best foolish, and at worst intentionally deceptive.
“So this type of analysis seems at best foolish, and at worst intentionally deceptive.”
Wow!
PS. Why differencing is necessary: Supplementary information, section SI2.2 “On high autocorrelations and spurious IRF estimates” in
D. Koutsoyiannis, C. Onof, A. Christofides, and Z. W. Kundzewicz, Revisiting causality using stochastics: 2. Applications, Proceedings of The Royal Society A, 478 (2261), 20210836, doi:10.1098/rspa.2021.0836, 2022.
Your process perfectly cancels out the anthropogenic contribution to both CO2 and temperature. It is therefore mathematically impossible for your analysis to say anything about the human contribution, or any other long term trends. Which, again, is the most important question in climate. You may think this is necessary, but I say it is bad analysis.
Nepal
If Demetris’ approach concerns you, then please look at my results which reach the same conclusion using different methods. These have been described in other postings.
First the result without any detrending. This is a frequency-domain approach so delay shows up as a slope. The slope is negative if temperature leads CO2 and positive if CO2 leads temperature.
https://localartist.org/media/CO2_Temp_FRF_no_detrend.png
With linear de-trending, which doesn’t remove any low-frequency information, but does reduce FFT window leakage, we can observe the low frequencies a bit better.
https://localartist.org/media/CO2_Temp_FRF_1st_detrend.png
Finally, by using a second-order de-trend, we can visually observe the results in the time-domain. This de-trend doesn’t remove multi-decadal fluctuations. I’ve used the Southern Hemisphere data here just to highlight the fact that the trends that I’m removing don’t even have the same shape. So I ask you, what in any of these results, which support the original paper, do you object to?
https://localartist.org/media/longtrends_SH.png
“It is therefore mathematically impossible for your analysis to say anything about the human contribution”
Mathematically impossible? Why? If the graphs on our quiz were the opposite of what they are now, what would be the conclusion?
Unless we have the conclusion already drawn (everything is due to fossil fuel burning), and everything that contrasts it should be rejected…
Demetris,
The reason I said that it is mathematically impossible for your analysis to say anything about the human contribution, is that your first step is to subtract the human contribution. Obviously the following steps, however fancy they may be, will be completely blind to the portion that you have set to zero…
“your first step is to subtract the human contribution”
No, we don’t do that.
Demetris,
I have already shown you do exactly that. Differencing followed by mean subtraction (which you do in your correlation analysis) 100% removes a linear trend, and greatly attenuates any slow trend, even if it deviates from linear.
Do you have an actual response to this, or are you just going to say “nope”?
“Do you have an actual response to this”.
I have given you the response and I repeat it here for your convenience.
Wow!
PS. Why differencing is necessary: Supplementary information, section SI2.2 “On high autocorrelations and spurious IRF estimates” in
D. Koutsoyiannis, C. Onof, A. Christofides, and Z. W. Kundzewicz, Revisiting causality using stochastics: 2. Applications, Proceedings of The Royal Society A, 478 (2261), 20210836, doi:10.1098/rspa.2021.0836, 2022.
In addition:
You may also see Figure 15, whose lower panel is not differenced nor detrended nor deseasonalized. And is T->[CO2].
Nepal,
Thank you! I had intuitively come to, more or less, the same conclusion; that short term cyclical fluctuations, particularly seasonal biosphere photosynthesis respiration and decay (which has an easily explainable T -> CO2 causality), were being isolated from a long-term unidirectional (increasing) baseline. As I analogized; they were determining whether the mice in the room were black or white, while ignoring the large white elephant.
I’m glad you were able to provide a more formal, mathematical rebuttal.
“seasonal biosphere photosynthesis respiration and decay (which has an easily explainable T -> CO2 causality)”
I understand that you like to be so. But, no. We have excluded the effect of seasonality by (a) differencing at a lag of one year and (b) examining sites from north to south pole.
The result is always the same.
“seasonal biosphere photosynthesis respiration and decay (which has an easily explainable T -> CO2 causality)”
The seasonal process is at a frequency of 1 yr^-1. You can easily observe that the delay is different for that process, 0.14 yr, or less than two months.
https://localartist.org/media/CO2_Temp_FRF_no_detrend.png
ganon1950
“What is the frequency of a nearly linear and continuously rising signal? Just the inverse of the measurement duration (with apodization artifacts)?”
A sloped line, or trend doesn’t have a frequency. However, when performing an FFT, periodicity is assumed/forced. How the trend gets mapped onto the sinusoidal basis functions is determined by the window selection. In no case will all of the energy land at one frequency, it will mostly follow the frequency-domain shape of the window. That’s one of the reasons I plot half of the window shape in the background of the coherence plot.
Removing the linear trend prior to computing the spectrums doesn’t really remove information, but it does reduce the “window leakage” affects that might obscure the analysis of signals riding on the trend.
Was there a point to your question?
Thanks ganon.
Robert, I haven’t fully processed the story you’re telling with that data, but I share Ganon’s concerns: the long-term trends (which are, probably, the result of human emissions) are not easily analyzed in the frequency domain. The Fourier series of a line is just (-1)^n / (n pi), convolved with whatever window function you use. So it is highly dependent on your measurement window. In fact, the (non-windowed) Fourier transform of a linear slope is a delta function plus a delta function derivative. Not at all well behaved.
“Removing the linear trend prior to computing the spectrums doesn’t really remove information”
Of course it does. It removes the linear trend, which is nearly the entire contribution of human emissions. However hard you look at the resulting calculations, they won’t include anything about human contributions because you have set those to zero.
Nepal
Removing the linear trends does not remove any useful information as it relates to determining the causality relationship between two signals with different units. Using only scaling and offset you can create any causal relationship you want.
The causality information is in the variations around the trend and the frequency-domain analysis I performed is well suited for this purpose, to a point, because it allows the different delays of different processes to be separated without filtering. What the analysis shows is that for periods of 2-10 years, the CO2 lag is ~0.5 yr, and the sensitivity is less than 5ppm/°C. I’ve looked at the data enough that I’m reasonably confident that this result applies to 20-year periods as well with slightly higher sensitivity.
What I didn’t observe in the result was the start of any transition to a different process where temperature lags CO2 and the sensitivity is much higher, which is what I expected to see if CO2 was a significant driver of temperature.
If you believe this chart, then anthropogenic CO2 emissions are not a smooth trend. There’s low-frequency variation that should be detectable.
https://www.statista.com/statistics/276629/global-co2-emissions/
If the impact on temperature is significant as you think it is, then I should be able to see, at a minimum, a distortion in the phase response at 0.05-0.1 yr^-1. The only distortion I see, middle-left panel, is what appears to be the lag increasing below 0.1 yr^-1.
https://localartist.org/media/CO2_Temp_FRF_1st_detrend.png
The reason I produced this time-domain result with 2nd order detrending is that I wanted to verify my frequency-domain observations. A second-order detrend retains most of the low-frequency information. While I didn’t expect to be able to establish causality of the longer trends, I did expect to see much higher sensitivity for the decadal trends if there was a different process taking over for the longer periods. I didn’t. The scaling of the detrended data is 6ppm/°C which is consistent with the 2-10 year process where CO2 lags temperature.
https://localartist.org/media/longtrends_SH.png
Demetris,
Maybe I’m just dense, but it seems to me averaging T and CO2 over annual periods that are offset by 6 months emphasizes seasonality, not removes it.
Robert Cutler,
RE: https://www.statista.com/statistics/276629/global-co2-emissions/
It is my understanding that the appropriate CO2 variable is atmospheric concentration, not emissions. Thus the Keeling curve which exhibits much smaller low frequency components.
ganon1950
“It is my understanding that the appropriate CO2 variable is atmospheric concentration, not emissions. Thus the Keeling curve which exhibits much smaller low frequency components.”
All of my analysis use CO2 concentrations, and the algorithms are sensitive enough to detect the small effect that temperature has on CO2 concentrations at low frequencies. But, you already knew that.
Robert,
No, I only knew what was the correct data to use, not what you actually use. The data you referenced indicated otherwise.
“but it seems to me averaging T and CO2 over annual periods that are offset by 6 months emphasizes seasonality, not removes it.”
I understand that it seems to you so. But it is not so.
Please read the explanations in the Figure introducing our quiz. In the first one, we write:
“The values plotted are annual averages of differenced time series for differencing time step of 1 year”
So we first differenced the time series at a time step of 1 year. This is supposed to remove seasonality. Then we average at an annual time scale. This removes seasonality, too, if some is left from the first. So after having taken these two steps, no trace of seasonality is left.
Now about the six months offset. Six months is the best choice as it is just half a year. Each green point is halfway between two red points. At the same time, each red point is halfway between two green points.
Perfect symmetry for perfect simplicity of the quiz! Is it the symmetry and simplicity the reason that you do not like it and try to find problems that it doesn’t have?
Also try lags different from six months. For example, try zero lag or one year lag. You will get cross-correlations as those shown for the case “ΔΤ – Δln[CO₂], fixed year” in Figure 14 in this earlier (2020) paper:
D. Koutsoyiannis, and Z. W. Kundzewicz, Atmospheric temperature and CO₂: Hen-or-egg causality?, Sci, 2 (4), 83, doi:10.3390/sci2040083, 2020.
In this case you will find that [CO2] lags T with a lag of 1 year. See Table 1 in this paper, columns under the title “Annual Time Series—Fixed Annual Wind”.
See also Figure 1 in this same paper, which is for monthly scale, without averaging.
We are “torturing” the data for four years now in every possible way. What we found was not what we initially expected. You may understand that if you read this earlier paper. In that first paper, we had not yet developed the stochastic methodology we then developed and published in the Royal Society. That is, we only relied on cross correlations (plus the Granger theory).
What we persistently find all these years is this. Whatever “torturing” we do, whatever combination of time series we make, the result is always the same and always clear:
[CO2] changes lag behind T changes.
Robert Cutler,
What is the frequency of a nearly linear and continuously rising signal? Just the inverse of the measurement duration (with apodization artifacts)?
Nepal, you say:
Umm … no. The log of atmospheric CO2 can be well approximated by a quadratic equation, but it’s a very poor fit to its linear trend.
https://rosebyanyothernameblog.files.wordpress.com/2023/10/linear-and-quadratic-fits-log-co2.png
Next, you say:
“They use the same process to completely remove the linear trend in temperature from their analysis.”
Nah. Taking the log of the temperature does NOT convert it to a straight line. Far from it. It doesn’t change the shape of the temperature record much at all.
w.
Thanks, Willis! You may also see our toy model, which fully captures those “trends” both in logarithmic and Cartesian plots for both undifferenced and differenced time series– see Figure 15 of the paper. The toy model is based on the premise T -> [CO2], which was inferred from previous analysis.
Willis,
The log of CO2 is well enough approximated by a linear trend that it is nearly eliminated by de trending.
Worse, though, Christofides and coauthors don’t just detrend, they take differences. This is a discrete derivative, which in the frequency domain is approximately the same as multiplying by f. That means that, even though log CO2 isn’t a perfect line, the residual is still a low frequency signal that is _severely attenuated_ by differencing. Meanwhile, short term fluctuations are amplified.
The same goes for temperature (which, by the way, they do not take the log off). Differencing the signal completely eliminates the linear trend in temperature, and severely attenuates any long term trend, even if it differs from linear.
In this case log differencing was applied to the CO2 mixing ratio, flattening it and removing the trend, which was compared to theglobal temperature anomaly
https://otexts.com/fpp2/stationarity.html
There is a lot of literature on this, the TL:DR being don’t do this if you are looking for a long term trend, if what you are looking for is a variation for much shorter time periods than the total data set, go right ahead.
Nepal | October 27, 2023 at 3:36 pm |
As my graph shows, log(CO2) is well approximated by a quadratic equation, and poorly approximated by a linear trend.
Next, I’d missed that you said:
“By then taking the differences, they convert the linear increase into a constant offset. And finally, they analyze this with the correlation, cross-covariance, and other functions that all begin by _subtracting off a constant offset_.”
True, and a valid objection.
w.
From the current temperature data there is no question that we are firmly in a steady secular warming period.
—
Every planet is subjected to its annual average surface temperature (the mean surface temperature) T (K).
The planet annual average surface temperature is a dependent on the planet’s distance from sun value.
Of course it is dependent on the planet’s radiative energy balance.
It is also dependent on the planet’s rotational warming phenomenon.
And, in addition to all that above, the planet annual average surface temperature is a dependent on the annual planet surface temperature differentiation.
The less planet surface temperatures annually differentiated – the higher is the planet annual average surface temperature.
And the more planet surface temperatures annually differentiated – the lower is the planet annual average surface temperature.
–
In our times Planet Earth is in an exceptional annual orbital pattern, which pattern (earth’s orbit eccentricity, when Earth is at its closest to the sun during the North Hemisphere’s winter, and it is very much close to the sun at the times of winter Solstices…)
–
At current times Earth’s annual orbital pattern creates a lowering the Planet Earth’s the annual average surface temperature differentiation.
This exact phenomenon is what creates the observed in our era the very slow (millennia’s long) continuous (gradual) Global Warming.
–
https://www.cristos-vournas.com
“This exact phenomenon is what creates the observed in our era the very slow (millennia’s long) continuous (gradual) Global Warming.”
I believe that the Earth’s temperature curve, except for the last 200 years, has been in very slow (millennia long) continuous (gradual) Global Cooling, since the Holocene maximum some 8,000 years ago.
ganon1950,
“has been in very slow (millennia long) continuous (gradual) Global Cooling, since the Holocene maximum some 8,000 years ago.”
Thank you for your respond.
–
Quite the opposite happens!
Please visit LINK:
https://www.cristos-vournas.com
Christos,
Thanks for the link, but I prefer to do my own literature searches and check multiple sources. Mostly what I find confirms my statement, e.g, https://www.science.org/doi/10.1126/science.1228026
(particularly Figure 1, right column).
There are also a couple that show the temperature essentially flat since the Holocene optimum, e.g.,
https://phys.org/news/2021-11-global-temperatures-years-today-unprecedented.html
(and the Marcott and Shakun, Nature (2021) paper cited therein).
ganon1950,
“Christos,
Thanks for the link, but I prefer to do my own literature searches and check multiple sources. Mostly what I find confirms my statement, ”
–
Ganon, what we discuss is about the trace gas [CO2] in the thin Earth’s atmosphere.
–
https://www.cristos-vournas.com
Christos,
OK, looked (quickly) at your link. I fail to see what it has to do with “global warming” on a millennial timescale. Are you claiming that the Earth’s rotation is speeding up?
Also, perhaps you could explain what you mean by:
“2). Some of SW gets transformed straight into IR (by omitting to decay as heat) which IR instantly gets emitted as IR”
Thank you, ganon1950, for your interest in my work, and for the very important questions you have forwarded.
“Christos,
OK, looked (quickly) at your link. I fail to see what it has to do with “global warming” on a millennial timescale.”
–
At current times Earth’s annual orbital pattern creates a lowering the Planet Earth’s the annual surface temperatures differentiation.
For the sphere’s the same annual radiative balance, for the same amount of the planetary TOTAL the IR emitted radiative energy, the less planet surface temperatures differentiated are, the higher is the planetary average (mean) surface temperature.
Therefore, the planet average surface temperature (Tmean) would be higher – the planet would be warmer.
It is exactly what happens to our planet Earth in our era. Planet Earth gets warmer.
–
“Also, perhaps you could explain what you mean by:
“2). Some of SW gets transformed straight into IR (by omitting to decay as heat) which I R instantly gets emitted as IR””
–
I describe the way matter interacts with the incident radiative energy. The not reflected portion of the incident solar energy is not entirely getting absorbed as heat.
Only a small part of the not reflected solar energy gets absorbed.
The greatest part of the not reflected solar energy gets transformed straight into IR (by omitting to decay as heat) which I R instantly gets emitted as IR.
–
https://www.cristos-vournas.com
Christos
You’ve stumbled into Holder’s inequality. Take a look at Arthur Smith’s note
https://arxiv.org/pdf/0802.4324.pdf
which deals with rotating planets and geometrical effects of illuminated spheroids. The result is not what you think and is very small for the earth because of rapid rotation and the large heat capacity of the oceans
Eli,
“Christos
You’ve stumbled into Holder’s inequality. Take a look at Arthur Smith’s note
https://arxiv.org/pdf/0802.4324.pdf
which deals with rotating planets and geometrical effects of illuminated spheroids. The result is not what you think and is very small for the earth because of rapid rotation and the large heat capacity of the oceans”
–
Thank you, Eli, for your respond.
Holder’s inequality does not apply to the rotating solar irradiated spheres (as the planetary diurnal cycle interacts with solar irradiance), but it is applied to the annual the planet surface temperatures differentiation.
–
Since you mention the Arthur Smith’s note, “Proof of the Atmospheric Greenhouse Effect “, please, explain what we read here:
From the Arthur Smith’s note:
TABLE I: Relevant parameters for the planets. See http://nssdc.gsfc.nasa.gov/planetary/factsheet/.
λ for Eq. 23 (at the equator, ξ = 0) estimated from thermal inertia, solar day, and the other parameters. It is particularly small for Earth thanks to rapid rotation and the high heat capacity of water covering most of the surface.
Planet solar constant albedo solar day Teff Tave Difference λ
……………(W/m2)………………. (Earth days)… (K)… (K)……. (K)
Mercury 9127…….. 0.12……. 176……. 434……. ?……….. ?…….. 11
Venus 2615………… 0.75……. 117……. 232…… 737…. 505……. 0.7
Earth 1367…………. 0.306 ……..1……… 255…… 288…… 33……. 0.04
Moon 1367………… 0.11…… 29.53…. 270…… 253…. -17……. 20
Mars 589 …………….0.25…….. 1.03….. 210…… 210……. 0……… 0.2
–
For Mercury Teff =? and Tave =?
For Moon Tave =253K ?
For Mars both Teff =210K and Tave =210K ?
–
https://www.cristos-vournas.com
Christos,
Thanks, I guess I must be confused. I thought you were referring to the daily rotation of the earth. But if you are isolating the eccentricity (?), and saying this causes planet warming is a bit naive; both eccentricity and obliquity are currently decreasing, causing warming (as you suggest) and cooling, respectively. The majority of recent (last 8000 years, as already discussed for GMST or T_mean) paleo-temperature and CO2 (proxie) data, indicates that CO2 was very slowly rising (Berkeley Earth: “10,000 Years of Carbon Dioxide” while temperature was slowly decreasing, until the last couple of hundred years (how does that fit with T ->CO2 causality?). To me, this indicates a complex situation where both eccentricity and obliquity (and their relative phases) play an important role and currently (mostly) cancel. Also, regional/hemispheric climate, seasonal, land mass and albedo differences play important roles that are, to some extent, cancelled in global annual averages.
As for “2). Some of SW gets transformed straight into IR (by omitting to decay as heat) which I R instantly gets emitted as IR”
(1) Repeating the same thing does not make it clearer (I realize there may be some language difficulties, but unfortunately, I do not read Greek).
“Only a small part of the not reflected solar energy gets absorbed”
If it is not reflected, but only a small part is absorbed, where does the difference go? Inelastic scattering?
As for SW being “instantly” converted to IR, the only process that I’m aware of that does that at significant levels is laser-based frequency difference generation. If it is either radiative decay cascade or collisional deactivation with re-radiation, neither is instantaneously. If you simply mean blackbody emission is happening at the same time as absorption, then OK, I think that becomes a matter of energy balance and “instantly” doesn’t seem to apply.
Thank you, ganon1950, for your respond.
–
I am very sorry, but it is getting very late in Athens, Greece – 11:30 PM.
I would like to continue our discussion with you, Ganon, and with Eli very much.
Thank you both for your participation and interest.
I will be back in about some 15 hours from now.
–
https://www.cristos-vournas.com
Eli,
TABLE I: Relevant parameters for the planets. See http://nssdc.gsfc.nasa.gov/planetary/factsheet/.
λ for Eq. 23 (at the equator, ξ = 0) estimated from thermal inertia, solar day, and the other parameters. It is particularly small for Earth thanks to rapid rotation and the high heat capacity of water covering most of the surface.
Planet solar constant albedo solar day Teff Tave Difference λ
……………(W/m2)……………(Earth days) (K)……. (K)……. (K)
Mercury 9127…….. 0.12……. 176……. 434……. ?……….. ?…….. 11
Venus 2615………… 0.75……. 117……. 232…… 737…. 505……. 0.7
Earth 1367…………. 0.306 ……..1……… 255…… 288…… 33……. 0.04
Moon 1367………… 0.11…… 29.53…. 270…… 253…. -17……. 20
Mars 589 …………….0.25…….. 1.03….. 210…… 210……. 0……… 0.2
–
For Mercury Tave =?
For Moon Tave =253K ?
For Mars both Teff =210K and Tave =210K ?
–
*********
Mercury Tave:
https://en.wikipedia.org/wiki/Mercury_(planet)
Surface temp. min mean max
0°N, 0°W [14] −173 °C 67 °C 427 °C
85°N, 0°W[14] −193 °C −73 °C 106.85 °C
Mercury Tmean 0°N, 0°W [14] 67 °C = 340K
–
********
Moon Tave:
https://simple.wikipedia.org/wiki/Moon
Surface temp. min mean max
equator 100 K 220 K
85°N[3] 70 K 130 K 230 K
Moon Tmean equator 220K and not 253K
–
*******
Mars
For Mars both Teff =210K and Tave =210K ?
How is it possible?
–
https://www.cristos-vournas.com
LINK:
https://nssdc.gsfc.nasa.gov/planetary/factsheet/
ganon1950,
“both eccentricity and obliquity are currently decreasing, causing warming (as you suggest) and cooling, respectively. ”
–
I was reffering to the Precession.
“The third and final of the Milankovitch Cycles is Earth’s precession. Precession is the Earth’s slow wobble as it spins on axis. This wobbling of the Earth on its axis can be likened to a top running down, and beginning to wobble back and forth on its axis. The precession of Earth wobbles from pointing at Polaris (North Star) to pointing at the star Vega. When this shift to the axis pointing at Vega occurs, Vega would then be considered the North Star. This top-like wobble, or precession, has a periodicity of 23,000 years.”
https://geol105.sitehost.iu.edu/images/gaia_chapter_4/milankovitch.htm
“Due to this wobble a climatically significant alteration must take place. When the axis is tilted towards Vega the positions of the Northern Hemisphere winter and summer solstices will coincide with the aphelion and perihelion, respectively. This means that the Northern Hemisphere will experience winter when the Earth is furthest from the Sun and summer when the Earth is closest to the Sun. This coincidence will result in greater seasonal contrasts. At present, the Earth is at perihelion very close to the winter solstice.”
–
*****
“If you simply mean blackbody emission is happening at the same time as absorption, then OK, I think that becomes a matter of energy balance and “instantly” doesn’t seem to apply.”
–
I mean, at the instant of the SW solar energy incidence to the surface, the IR emission takes place without an absorption. The incident SW solar energy gets IR emitted on that very spot, without being accumulated in inner layers as heat.
–
The result is that only a small portion is accumulated as heat and gets IR emitted later at night, or at different times.
–
Thus it is impossible to consider the incident solar flux to be averaged over the entire planet surface, because it is not averageble – the incident solar energy mostly is getting out from the sunlit side of a planet. Only a small part is converted to heat and gets accumulated.
The 240 W/m2 has no physical meaning, has no physical analog, for radiative energy subjected spheroids (planet Earth) and, therefore, the planet Te =255K is simply a mathematical abstraction, and cannot be a comparison model for planet average surface temperature.
–
https://www.cristos-vournas.com
Christos,
Thank you for the brief lesson on Milankovitch cycles, although I am already quite familiar. I picked the eccentricity (100,000 years + longer components) and obliquity (41,000 years) because they seem to be the influences that are sufficiently large to trigger deglaciation. However, no doubt relative phase of precession also plays a role.
As for “instantaneous” – thank you, I now understand what you mean. However, BBR is occurring continuously and an instantaneous SW (change) in exposure does not change that. Perhaps I am just too picky about the use of “instantly”. Or, on the moclecular level, that conversion of an incoming SW photon is (nearly) instantly converted into an outgoing LW photon happens less than 10% (a guess, but an easy experiment), and the bulk heat diffusion cannot be ignored.
Regarding planetary revolution, as I obliquely suggested, perhaps it is just a matter of semantics; “warmer” – a steady state equilibrium value, “warming” – an increase in temperature.
Christos,
“Northern Hemisphere will experience winter when the Earth is furthest from the Sun and summer when the Earth is closest to the Sun. This coincidence will result in greater seasonal contrasts. At present, the Earth is at perihelion very close to the winter solstice.”
And the reverse is true for the Southern Hemisphere, although there are differences due to land surface distributions; seasonal variance tends to be less in the SH because of greater ocean surface area and its heat capacity’s larger thermal averaging.
ganon1950,
“And the reverse is true for the Southern Hemisphere, although there are differences due to land surface distributions; seasonal variance tends to be less in the SH because of greater ocean surface area and its heat capacity’s larger thermal averaging.”
Yes, exactly.
And
When SW solar energy hitting water, because of water having five (5) times larger than land heat capacity…
When SW solar energy hitting water, the induced surface layer’s temperature is much-much lower, and, the convertion of incoming SW into outgoing LW is less intensive…
As a result, less IR is instantly goes out, and more SW solar energy is accumulated in form of heat…
–
https://www.cristos-vournas.com
Christos, I have learned something new regarding rotational rate – and find it intellectually interesting – Thank you. However, since eccentricity is near the minimum of its 400,000-year cycle component, eccentricity is quite small and only slowing changing, I doubt that precession of the equinoxes has a significant effect on CE climate CHANGE.
I would be so bold as to suggest some kind of rewrite of your subtitle “Earth is warmer than Moon, because Earth rotates faster”. That seems misrepresentation to me. Maybe something like “Earth is even warmer because of its high rotational rate”?
I look forward to seeing your ideas condensed into a publishable note.
Thank you, ganon1950.
Demetris,
“The causality information is in the variations around the trend”
That is a statment by Robert Cutler, but I believe it is one you would endorse. Of course, as you remove the main signal by taking logarithms and differences, statistical noise becomes more prominent. Your whole argument is based on a statistical analysis, yet remarkably you assign no statistical level of confidance to your surprising conclusion.
The main argument against you, the mass balance argument, shows that between 1960 and 2010, natural processes were net sinks, 6.6 standard deviations removed from 0! (See the Ballantyne et al. article previously cited.) You argue statistically that natural processes are sources but give no indication how
statistically robust that conclusion is. Of course it is your analysis of the trend or deviations around the trend that you need to defend, not the causality of seasonal variations.
David, you say:
>“The causality information is in the variations around the trend”
> That is a statment by Robert Cutler, but I believe it is one you would endorse.
Well, I try to approach the Aristotelian ideal of “saphenia”, and thus I do not use the notion of a trend, which, as I have written several times here and elsewhere, is unfounded. (Explanations for saphenia are given in my book that I referred to in other comments. The inappropriateness of approaches based on “trends” is thoroughly discussed in Chapter 1 of this book).
But I understand Robert’s statement and I think its essential meaning is OK. I would rephrase this statement as “The causality information is better seen in the changes of the processes in study”.
And those changes are seen after differencing the time series.
In theory, the result in both cases, with or without differencing, should be the same. See the simple proof in:
D. Koutsoyiannis, C. Onof, A. Christofides, and Z. W. Kundzewicz, Revisiting causality using stochastics: 2. Applications, Proceedings of The Royal Society A, 478 (2261), 20210836, doi:10.1098/rspa.2021.0836, 2022.
(Equations numbered (10) and (11) in the preprint version, or numbered (2.8) and (2.9) in the official published version).
On the other hand, in the differenced series, which show the changes, the results are clearer and more robust, because they are not affected by the high autocorrelations. About this effect, see section “SI2.2 On high autocorrelations and spurious IRF estimates” in the Supplementary Information of the same paper.
Demetris,
So far:
1.) You have declined to discuss the mass balance argument that unequivically shows that natural processes (such as temperature increases from whatever source) absorb more carbon from the atmosphere than they emit to it.
2.)You have declined to estimate the statistical robustness of your surprising claim that contradicts 1.), namely your claim that temperature changes cause the CO2 emissions “ON ALL TIMESCALES” that have taken atmospheric CO2 from 240 ppm to over 400 ppm in the Industrial Age.
Because of 1.) I am confidant your conclusion is wrong, but if only as a personal challenge, I would like to go futher and either explictly identify your error or show that the causality you claim is a statistically weak conclusion. I had hoped to learn something from your response to my question about 2.), but you ignored it, so I will try again.
I suspect your “log differencing” of the data USING DISCRETE ALGORITHMS is the problem. Look at your Figure 15. The lower plot is the familiar CO2 ppm plot, a steadily rising curve with annual seasonal maxima: 10 per decade. But the “delta ln (CO2)” plot above it is quite different”: about 6 maxima per decade. Any CONTINUOUS transformation of the original data would have produced a curve with annual maxima. The transformed data has a markedly different temporal structure than the raw data, even ignoring “trends”, yet it is that very temporal structure which you use to assess the direction of causality.
Do you care to comment?
David, you say “Do you care to comment?” I have consistently tried to comment on your comments and reply to your questions. And you decide that I have declined to discuss.
The mass balance is contained in the paper, Appendix A1, and I haven’t seen anyone pointing to any error in it. What absorbs more and what less is also faithfully reproduced in this. You seem convinced that what absorbs more and what less can be a basis for some inference about causality.
But this is your thought, not mine. I cannot think how this could be used for causality inference, sorry. I insist that inference of causality should involve time: time precedence of the cause over effect. See our arguments about why this is a necessary condition in our Royal Society papers.
The statistical robustness of our algorithm has extensively been investigated in the two Royal Society papers and their Supplementary Information reports.
Of course, you have the right to be “confidant [that our] conclusion is wrong”. But that’s an issue that concerns you, not us, the authors, nor our paper.
I do not understand why you emphatically say “USING DISCRETE ALGORITHMS”. Algorithms are part of discrete mathematics, and any of them is discrete by definition (as a finite sequence of computational steps).
Our algorithm is, as far as I know, the only one whose theoretical foundation is based on continuous time and the behaviour in discrete time is inferred by deduction from that in continuous time. For example, it differs from Granger’s algorithm in this respect. We discuss these issues in the two Royal Society papers.
Finally, I think it is a waste of time and effort to try to find differences in the upper and lower panels of our Figure 15. Both panels contain precisely the same information, except the lower is cumulative in time and the upper not.
And it is not correct to say “The lower plot is the familiar CO2 ppm plot”. No, it’s not your familiar one. Perhaps you missed seeing that it contains two curves. The green is your familiar one, the data. But there is also the purple dashed line. It may look indistinguishable from the green curve, but it’s conceptually different: it is our “toy model”. The fact that the two are indistinguishable means that the toy model behaves well.
And most importantly, the purple dashed line is exclusively based on the T -> CO2 causality direction.
Fig. 15?? not in http://www.itia.ntua.gr/2194/
“Fig. 15?? not in …”
I guess you refer to my phrase:
“You may also see Figure 15, whose lower panel is not differenced nor detrended nor deseasonalized. And is T->[CO2].”
It meant Figure 15 in the paper in discussion here, i.e.,
D. Koutsoyiannis, et al., On hens, eggs, temperatures and CO₂: Causal links in Earth’s atmosphere, Sci, 5 (3), 35, doi:10.3390/sci5030035, 2023.
Many thanks. Having seen that, comments
1. We know that El Nino and large volcanos are two natural causes of temperature changes on short time scales and that they will, by raising the temperature change [CO2]. You have found those effects. They were seen in many previous studies. See for example Robock Figure 4
https://climate.envsci.rutgers.edu/pdf/VEAChapter1_Robocknew.pdf
2. Most, if not all of your results are dominated by these links between global T and [CO2] especially since your transformation of the data almost eliminates long term trends which dominate the [CO2] data. Your IRF is capturing only part of the response.
3. To be able to interogate the long term trends you may have to eliminate El Nino/volcano/emissions variation short time scale changes as you did with the seasonal changes. There is btw a complete temperature record taken at Mauna Loa
Malamud, B. D., Turcotte, D. L., & Grimmond, C. S. B. (2011). Temperature trends at the Mauna Loa observatory, Hawaii. Climate of the Past, 7(3), 975-983.
Eli Rabett
“Most, if not all of your results are dominated by these links between global T and [CO2] especially since your transformation of the data almost eliminates long term trends which dominate the [CO2] data.”
I know your comment is directed at Demetris. However, what I’ve found is that the only variations in [CO2] not driven by temperature can be completely described by a 2nd-order polynomial. This is not the result I would expect if anthopogenic CO2 emissions were a significant factor.
https://judithcurry.com/2023/09/26/causality-and-climate/#comment-994931
When I looked at the relationship between ENSO and temperature I found that ENSO quickly loses significance for frequencies lower than 0.15 yr^-1. That can be seen here in both the amplitude response, and in the coherence.
https://localartist.org/media/SOI/frfcoh43_6_12_SOI_dt1_1866.png
This result was computed using a different (longer) Southern Oscillation Index (SOI) than was used in appendix A.3 of the Demetris et al. paper (see plot title). However, the temperature lag of 0.3 years matches the result in the appendix. The only exception is a 6-month lag for 0.6 yr^-1 frequencies, and possibly a 3-month lead at 0.7 yr^-1. . Note that I had to invert SOI as it is inverted relative to temperature. This inversion introduced a 180-degree phase shift at all frequencies.
Eli,
“Christos
You’ve stumbled into Holder’s inequality. Take a look at Arthur Smith’s note
https://arxiv.org/pdf/0802.4324.pdf
which deals with rotating planets and geometrical effects of illuminated spheroids. The result is not what you think and is very small for the earth because of rapid rotation and the large heat capacity of the oceans”
–
Thank you, Eli, for your respond.
Holder’s inequality does not apply to the rotating solar irradiated spheres (as the planetary diurnal cycle interacts with solar irradiance), but it is applied to the annual the planet surface temperatures differentiation.
–
Since you mention the Arthur Smith’s note, “Proof of the Atmospheric Greenhouse Effect “, please, explain what we read here:
From the Arthur Smith’s note:
Eli,
TABLE I: Relevant parameters for the planets. See http://nssdc.gsfc.nasa.gov/planetary/factsheet/.
λ for Eq. 23 (at the equator, ξ = 0) estimated from thermal inertia, solar day, and the other parameters. It is particularly small for Earth thanks to rapid rotation and the high heat capacity of water covering most of the surface.
Planet solar constant albedo solar day Teff Tave Difference λ
……………(W/m2)……………(Earth days) (K)……. (K)……. (K)
Mercury 9127…….. 0.12……. 176……. 434……. ?……….. ?…….. 11
Venus 2615………… 0.75……. 117……. 232…… 737…. 505……. 0.7
Earth 1367…………. 0.306 ……..1……… 255…… 288…… 33……. 0.04
Moon 1367………… 0.11…… 29.53…. 270…… 253…. -17……. 20
Mars 589 …………….0.25…….. 1.03….. 210…… 210……. 0……… 0.2
–
For Mercury Tave =?
For Moon Tave =253K ?
For Mars both Teff =210K and Tave =210K ?
–
*********
Mercury Tave:
https://en.wikipedia.org/wiki/Mercury_(planet)
Surface temp. min mean max
0°N, 0°W [14] −173 °C 67 °C 427 °C
85°N, 0°W[14] −193 °C −73 °C 106.85 °C
Mercury Tmean 0°N, 0°W [14] 67 °C = 340K
–
********
Moon Tave:
https://simple.wikipedia.org/wiki/Moon
Surface temp. min mean max
equator 100 K 220 K
85°N[3] 70 K 130 K 230 K
Moon Tmean equator 220K and not 253K
–
*******
Mars
For Mars both Teff =210K and Tave =210K ?
How is it possible?
–
https://www.cristos-vournas.com
Robert,
You say:
>I know your comment is directed at Demetris. However, what I’ve found is that the only variations in [CO2] not driven by temperature can be completely described by a 2nd-order polynomial.
Would you agree to change “not driven by temperature” to “not driven *linearly* by temperature”? Because again what you model by a 2nd-order polynomial could again be driven by temperature, but in a nonlinear manner.
To see this, take out toy model, equation (10), and perform summation in time to eliminate deltas. Then you will see that ln[CO2] is expressed as the sum of a linear term of past temperatures plus a nonlinear term of past temperatures (the latter results from the sum of consecutive mu_v’s)
Demetris,
1.) Putting a (correct) table in your paper does not mean you have addressed your mass balance problem. You must also tell us how natural reservoirs that are net carbon sinks cause atmospheric CO2 rise, while keeping net global uptake positive. Further, your insistence that causality can only be determined by timing measurements defies common sense. You did not respond to my earlier assertion that if I am burning a lump of coal and find CO2 in the chimney, then I can reasonably conclude the former caused the latter without making a timing measurement. I believe it was “Agnostic” who sarcastically noted “[Andrews] probably thinks the CO2 in the chimney caused the coal to burn.” No, I do not. Agnostic, you, and I all know the causality direction in this example without timing data.
2.) You have sent me to supplementary data in another paper rather than answer my question: “What is the statistical level of confidence of your conclusion that CO2 rise lags T on all time scales?” A simple numerical answer would have sufficed if you had one. I may see if I can dig out your reference later, but not now.
3.) My criticism of your discrete log differencing technique was wrong, and I retract it. I see now that one-year differencing should eliminate the seasonal fluctuations that I was concerned were the root cause of your result.
4.) I have a new issue: I believe your presentations of IRF’s are deceptive. First, you set g(h) = 0 when the calculation comes out negative for that time lag. This means that the IRF’s presented are always positive or 0. Second, you limit the IRF calculation to typically +- 20 months. Both ploys leave you with one smooth positive peak. I do not know how much your additional elimination of “roughness” contributes to the smoothness. In the narrow window chosen, we could hardly expect a second peak, since the T data is in one-year bins and effectively act as a low pass filter. All of us that look at data intuitively separate signal from noise by observing scatter in the data. You deprive us of a chance to assess for ourselves the statistical validity of your peak, the purported signal, by truncating it when it is negative, restricting the range, and artificially smoothing it. Showing a recalculated Figure 2 with +- 10 year time lags, allowing negative IRFs, and with no smoothing would either be a big step forward in making your case or, more likely in my estimation, would show that you are chasing noise.
I am a bit late in this discussion!
I like the analysis done here, but disagree with one key sentence:
“””
The results are clear: changes in CO₂ concentration cannot be a cause of temperature changes.
“””
That might have been the case in the past, but if anthropogenic CO2 is at least partially responsible for the change of the atmospheric CO2 partial pressure (it´s not called “concentration” for gas mixtures), it most certainly does change the absorption behavior and temperature of the air!
The ACS has an estimate on their webpage giving a direct temperature effect of about 1°C for a doubling of the CO2 amount in the atmosphere from 280 to 560ppm, based on measurements, but also MODTRAN spectra calculations.
Thanks, morfu03. Good to hear you like the analysis and that you disagree on one key sentence. Disagreement is the food for the growth of science.*
Partial pressure is pressure, typically measured in pascals. We use ppm.
We are aware of calculations based on theories/models, but we only use observational data. So our findings and the statement you disagree with result from data analysis.
—
*Some pursue “settled science”. I think this phrase is self-contradictory. I am a follower and admirer of Heraclitus, who among his important apophthegms (the very few that were saved), included this:
“Opposition unites, the finest harmony springs from difference, and all comes about by strife” (Fragment B 8 — the original in Greek has been posted above).
*Some pursue “settled science”
Some may also call such a oxymoronic discipline, unless it was only advertised settled as a tool of obfuscation, but not. Is the latter politics, or religion? I suppose it could be both. Climate shepherds are not bound by scientific discipline, they’re bound by what emotively works.
Joshua,
I tried twice to post replies to your last comment by the system’s demon did like them. I am trying again leaving out some words and links that the demon might disapprove. Here is one of these replies.
“I have seen comments from you that I think clearly, and more importantly explicitly, are not independent from the political and ideological aspects.”
Right, there may not be independent. But they are scientific, i.e., results of the scientific research I have conducted. I tried to follow the scientific method to trace back the links of certain scientific developments with politics. That’s not politically or ideologically driven. It’s scientifically driven. I am doing that for the pleasure of scientific discovery.
Joshua, another reply:
“I know you said it’s outside the scope of the discussion, but then again is it appropriate for you to drop comments on a topic and then say that the topic is beyond the scope of this discussion?”
You are right. But I was asked in comments and thought I had to reply providing links. Perhaps I should have avoided that…
Joshua, that demon refused for third time to approve my reply to your question, related to independence.
So I am trying a trick to give you a hint using a possible workaround.
– Locate and download my paper “Scale of water resources development and sustainability: Small is beautiful, large is great, Hydrological Sciences Journal, 56 (4), 553–575, doi:10.1080/02626667.2011.579076, 2011.”
-In this, find the reference to Klemes (2008). Google its title (I avoid writing it here, as this may be what the demon disliked).
– Locate and download that talk by the late Vit Klemes. See particularly the highlights in p. 4.
This is not a complete reply, of course, but I hope to publish an opinion paper on that issue before too late.
Demetris –
> Right, there may not be independent. But they are scientific, i.e., results of the scientific research I have conducted. I tried to follow the scientific method to trace back the links of certain scientific developments with politics. That’s not politically or ideologically driven. It’s scientifically driven. I am doing that for the pleasure of scientific discovery.
I question your ability to cleave ideologically-driven from scientifically-driven. Not just you, of course. It’s a widely shared difficulty.
The scientific method is indeed the means by which to do that and I think it’s possible to use that method to some extent. Some research suggests that’s a foolish self-delusion, and I can’t rule it out that it is – but I like to remain hopeful.
But for me a near certain sign of failure is when people claim an exemption as it appears you have done here. Or, when people assign an ability to cleave off the ideological drive disproportionately, leaving those with whom they agree as relatively more exempt. The science on this topic predicts that people who are ideologically-driven will find ideological drive more prevalent in those with whom they disagree.
This has long been an issue I’ve tried to get our host
( and many of her denizen) to address, with little success.
J
I hope you are including yourself in those concerns. A little self reflection is always healthy.
Not long until the primaries.
Kid –
Of course I do.
But even if I didn’t, that would be immaterial to my comment
Are you really limited to nothing beyond tu quoque in your approach to thinking about these issues?
Joshua,
So, if …
> The scientific method is indeed the means by which to do that and I think it’s possible to use that method to some extent. Some research suggests that’s a foolish self-delusion, and I can’t rule it out that it is – but I like to remain hopeful.
And, I assume since we cannot easily divorce ourselves of ideology, or belief, since you say …
> I question your ability to cleave ideologically-driven from scientifically-driven. Not just you, of course. It’s a widely shared difficulty.
Then, I would assume you would (hopefully) welcome anyone who attempts to do so, provided their argument relies upon scientific standards? Accusing Demetris of failure (by omission?) …
> But for me a near certain sign of failure is when people claim an exemption as it appears you have done here.
… is essentially saying no one can argue that ideology influences science, nor that the scientific method is capable of presenting findings without bias. If so, then it seems you’ve dashed your own hopefulness, and condemned yourself to a sort of nihilism … unless, you can prove his argument does not employ scientific standards and is ideologically driven.
Can you?
Bill –
> … is essentially saying no one can argue that ideology influences science, nor that the scientific method is capable of presenting findings without bias.
I’ll reiterate.
> But for me a near certain sign of failure is when people claim an exemption as it appears you have done here. Or, when people assign an ability to cleave off the ideological drive disproportionately,
Okay … so where did he ‘disproportionately’ do that?
Bill –
> Okay … so where did he ‘disproportionately’ do that?
I didn’t say that he did. I’ll reiterate:
> But for me a near certain sign of failure is when people claim an exemption as it appears you have done here
Well … you did imply it with:
> But for me a near certain sign of failure is when people claim an exemption as it appears you have done here. Or, when people assign an ability to cleave off the ideological drive disproportionately, leaving those with whom they agree as relatively more exempt. The science on this topic predicts that people who are ideologically-driven will find ideological drive more prevalent in those with whom they disagree.
No matter, as you wish to stay with the statement that he … ‘claimed an exemption’. So, let me ask how did he claim this exemption?
If you answer that question, please keep in mind that if we ‘hope’ that science can ‘cleave’ ideology from truth seeking endeavors, those statements from science which criticize particular scientific results as ideologically driven may very well be about one ideology. That being the case, it doesn’t rule out other ideologies from similar behavior in science. It just means in one particular instance, that an ideology has sought (successfully or otherwise) to influence the direction of science for its own/non-scientific purposes.
Bill –
I don’t think I did imply that. I explicitly distinguished between claiming exemption and asserting disproportion (aligned with ideology).
But sorry if I should have made it clearer still.
>… if we ‘hope’ that science can ‘cleave’ ideology from truth seeking endeavors,
That’s a false dichotomy imo. Truth seeking is not mutually exclusive with ideological influence.
> those statements from science which criticize particular scientific results as ideologically driven may very well be about one ideology.
I’m not really sure what you’re talking about there but it looks like a non sequiitur. The science on motivated reasoning and the like predicts that people will find a disproportion in the influence of ideology in scientific findings, in line with their own ideological orientation. (It only stands to reason, imo.) Sure, it’s theoretically possible that only those you disagree with are biased in their science (related to climate change?), but that runs against the likely causal mechanisms – related to cognitive attributes (e.g., pattern finding, fundamental attribution error, etc.) and psychological attributes (e.g., identity-protecrion) that are more or less universal. If you find ANY evidence that those types of attributes are distributed disproportionately across ideological divides, please pass it on, I’d love to see it.
> That being the case, it doesn’t rule out other ideologies from similar behavior in science.
Again, I can’t follow.
> It just means in one particular instance, that an ideology has sought (successfully or otherwise) to influence the direction of science for its own/non-scientific purposes.
Again, can’t quite follow.
> That’s a false dichotomy imo. Truth seeking is not mutually exclusive with ideological influence.
If so it’s your false dichotomy. Reread your posts.
I asked specifically for you to point out how Demetris ‘failed’ and you didn’t do it.
Instead you cite the science of motivated reasoning predicting …
… and what I’ve tried to point out is that you originally said scientific reasoning may be capable of separating ideology from science only to then say Demetris failed because … the science of motivated reasoning says he can’t do it?
Demetris didn’t fail. Your criticism has.
You should retract it.
Bill, I just fired a directional flare, I hope you can see it.
You wandered into a large gaseous nebula, the red dwarf Joshua is nestled at its center. Escape velocity should be easy since this red dwarfs mass and gravitational tug are nominal, though the gaseous expanse surrounding him is dense, it may leave you in a bewildering stupor if you hang too long. Please engage retros immediately towards the flare for a speedy return to enlightened space.
jungletrunks …
LOL!!!!!
… on my way.
Bill –
> If so it’s your false dichotomy. Reread your posts
I don’t think that any of my comments suggest that seeking truth and ideological influence are mutually exclusive.
But if they conveyed that meaning then I wasn’t clear.
I more or less conclude that everyone here is “seeking truth,” and all of us are ideologically influenced (to one degree or another).
Bill –
> … and what I’ve tried to point out is that you originally said scientific reasoning may be capable of separating ideology from science only to then say Demetris failed because … the science of motivated reasoning says he can’t do it?
Well, some interpret the science of motivated reasoning to suggest that freedom from motivated reasoning can’t be achieved.
I’m not really convinced one way or the other. And I like to hope that the scientific method can do a reasonable enough job of controlling for ideological biases. I operate from a baseline belief that it’s worth trying even if the ultimate goal may not be achievable.
Bill –
> only to then say Demetris failed because … the science of motivated reasoning says he can’t do it?
Again, your interpretation is different than my intended meaning. Not entirely sure why the keeps happening but I’ll try to clarify.
No, I dont think the science of motivated reasoning says Demetris can’t cleave off ideological bias from his science. Some interpret the science of motivated reasoning to suggest it’s not possible for anyone to do it. Some interpret the science differently. I think it’s certainly worth a try, using the scientific method. But it would be a mistake in any case to single out the science as saying something about Demetris in particular (as opposed to anyone else).
It is my personal interpretation that anyone, including Demetris who claims exemption from ideological bias is fooling themselves. That would apply to Demetris and Gavin and you and me.
You remember what feynman said about fooling yourself, right? I agree with feynman about that.
Joshua …
Agreed.
Enjoy your day.
Joshua, Bill,
When we started this discussion, we included political and ideological aspects. I would also add (and I mentioned somewhere above) economic interests. But then the discussion focused only on ideological aspects, which I believe are minor if compared to political and economic aspects.
Like weather and climate, ideology is not static, but is subject to change, both at the social and personal level. For example, after my research on the origins of the climate change agenda (and my discovery of the links with politico-economic interests) I changed my ideology.
Keynes has reportedly said “When the facts change, I change my mind. What do you do, sir?”
I concur with that. I believe we should respect the facts and sacrifice our ideology if we see it contradicting the facts.
Another comment that the demon disliked… Tying to rephrase and repost…
It aimed to be a reply to the comment by Robert Cutler | October 30, 2023 at 5:38 pm |
Robert, you say:
“I know your comment is directed at Demetris. However, what I’ve found is that the only variations in [CO2] not driven by temperature can be completely described by a 2nd-order polynomial.”
Would you agree to change “not driven by temperature” to “not driven by temperature linearly”? Because there could be a nonlinear dependence not captured by your (or our) method in its standard application. A 2nd-order polynomial suggests nonlinearity, but not necessarily a driver other than temperature.
This can be shown by means of our toy model, i.e. equation (10), which is fully driven by temperature but not in a purely linear manner. If you perform summation on equation (10) in order to eliminate the deltas, you will find that ln[CO2] is the sum of two terms, where the former depends linearly on past temperatures (is a weighted sum of them) and the latter (resulting from the sum of mu_v terms) depends nonlinearly on past temperatures.
Demetris
“Would you agree to change “not driven by temperature” to “not driven by temperature linearly”? Because there could be a nonlinear dependence not captured by your (or our) method in its standard application. A 2nd-order polynomial suggests nonlinearity, but not necessarily a driver other than temperature.”
What my analysis appears to show is that all of the fluctuations around the 2nd-order [CO2] trend are driven by temperature, and that the maximum sensitivity is on the order of 6ppm/°C. There is no evidence of a transition from decadal processes driving the fluctuations to a different process with much higher sensitivity driving the 65-year trends. My conclusion, based only on the measured data, is that the long-term trends in temperature and [CO2] are unrelated. Which is, of course, not a very satisfactory conclusion for anyone as the question now becomes, which came first, the hen or the turtle egg?
Could temperature and [CO2] be related through a non-linear process? I suspect so, but it would likely have to be a process which does not respond to small decadal deviations in temperature. In other words, not only a non-linear process, but a process with long memory, or hysteresis. Bearing in mind that I don’t know much about carbon cycles, here’s my toy example, which ignores sinks. Retreating (land) ice uncovers new CO2 sources (nonlinear) which remain uncovered (memory) for as long as temperatures generally continue to rise.
Thanks for your insights, Robert.
Reply to billfabrizio | October 30, 2023 at 11:38 pm |
“Demetris didn’t fail. Your criticism has.
You should retract it.”
Bill, I really appreciate your support and the clear arguments you provided. Thanks very much.
Ironically, in the beginning of this thread there was discussion about the expectations (or hopes) of some for retraction of our papers… Now you turned it to a retraction of criticism about me that was expressed in a comment :-)
Retraction is unnecessary even in this case, I believe…
Demetris …
> Bill, I really appreciate your support and the clear arguments you provided.
Clear arguments? That’s way past kindness. ;-)
Just so you know, Joshua is actually one of the few commenters on here who has ever ‘retracted’ a statement. For that alone, he has my respect.
You’ve really done a superb job with this post, not only the essay but facilitating the commentary. As one commenter above said, I hope you’ll come back with another piece.
Reply to the comment by David Andrews | October 31, 2023 at 10:23 am |
David, why do you think that our “presentations of IRF’s are deceptive”? Why do you think that we resorted to “ploys”?
The issues you pose are discussed in full detail and explained extensively in paper 1 in the Proceeding of the Royal Society. Please read that paper.
The issue of nonnegativity was also discussed with the reviewers, so please read also the review reports and replies (openly available in Royal Society’s site along with our paper).
The effect of roughness or smoothness was additionally discussed in the Supplementary information of the Royal Society paper 2, section “SI2.1, Assessment of uncertainty in the identification of the impulse response function and its characteristics”. So please read that too.
See also sections “SI2.3, Parametric approach to identification of the impulse response function” and “SI2.4, Example of application of the parametric approach to modern temperature and CO₂ datasets”. The latter also contains negative ordinates. So please read those too.
As I have repeatedly said, we “tortured” everything for years before we submitted those papers, and we had constructive dialogue with the reviewers, after which we further improved the papers. The fact that you try now to find caveats in our methodology does not mean that we (or the reviewers) haven’t thought about possible caveats before you.
It is fully understandable that you do not like our results. But this does not imply that our method is not good. Actually, it does not imply anything at all about our methodology, its presentation, and our results. Moreover, it does not imply that we resorted to deceptive presentation and ploys.
Demetris,
Unfortunately my home institution, the University of Montana, appears not to subscribe to Proceedings of the Royal Society, so your earlier paper is behind a pay wall. I can probably get a librarian to get it for me, but am not that motivated to do so.
Reviewer reports are accessible, but nowhere do I see a reviewer asking the obvious question: what is the statistical significance of the statistical inference which has been made here. That is why I am asking you.
Of course I am skeptical of a claim in tension with carbon conservation, and which I have come to realize uses data smoothing and truncation in the presentation of its conclusions.
Here is my present view of your analysis:
– the calculated IRF as a function of time lag is statistically noisy
– the noise has effectively been passed through a low pass filter since the T data is in annual bins
– you select one time lag where the noise is positive, apply a little smoothing, eliminate negative going noise just by not showing it in the plot, and eliminate all information about time lags removed from your selected peak by only showing what your algorithm yields near that peak.
I note that the Figure 5 plots, which are key because they are the ones which you use to defend your “all time scales” claim, show growth in IRF at time lags of 20 months. But you cut it off! And you take an average of what is not cutoff which is clearly dependent on your arbitrary cutoff!
I see your presentation as intent on selling, not edifying.
It’s your problem that you “see [our] presentation as intent on selling”–not ours.
And it is your problem that you use that phraseology and tone.
No need to ask your librarian anything. I am posting preprints/postprints of everything I produce (papers, presentations, educational notes, etc.) on my personal web site and on ResearchGate.
Everything I have ever produced is open and free to download. I also include the supplementary information, review reports, even rejection prehistories in papers that had been rejected and published elsewhere.
I will also post with a pdf of this discussion here.
You can easily locate these preprints, postprints etc. through google or google scholar by searching for their titles.
In addition, for the Royal Society paper 1 I have already given the precise links in earlier comments above. See e.g. my comment:
demetriskoutsoyiannis | October 21, 2023 at 2:31 am |
Also, all my books are open and free to download. This clearly proves that my intent is on selling, not edifying.
Demetris …
The demon ate my first response. I think it was better than this one below.
> But then the discussion focused only on ideological aspects, which I believe are minor if compared to political and economic aspects.
> Like weather and climate, ideology is not static, but is subject to change, both at the social and personal level.
For me, ideology utilizes our beliefs, mores, norms, traditions, philosophies, etc … in a ranked structure, or order. Add one or more of the above, change the ranking, and you may have a new ideology.
Yet, I believe what may be more in line with what you said, or maybe meant, are when we discover contradictions in our preferred ideology. By that I mean, when we have ranked a particular structural element (belief, etc?) higher than another, and discover that it should not be so due to contradictions that result.
A rather stark example, although in front of us, is the ideological view that ‘social justice’, where ‘victim’ and ‘oppressor’ are declared, can legitimately be pursued via … any or unlimited … types of violence. Leaving aside defining the terms above and appropriate labeling, a victim employing unlimited violence against an oppressor contains the inherent contradiction of making an oppressor a victim. Creating a new victim via unlimited violence would seem to allow that victim to utilize unlimited violence in return.
Since no one/group is without ‘sin’, in order to avoid the possible resultant cycle of victim/oppressor, some ideologies have a strict, ranked order for the use of varying degrees of violence tied to specific conditions. This places resolution of victimhood below unlimited violence in ideological rank of priorities to be avoided.
To be clear, the above doesn’t eliminate victimization from undesired results to be ameliorated. It just says that other means, rather than unlimited violence, should be employed.
As for climate science … ;-) … my point is that the ranking of priorities (beliefs, etc?) may be where we should look when assessing our ideology with the ‘facts’ we see developing before us.
Hope that wasn’t an obtuse way of saying I agree with you.
“Hope that wasn’t an obtuse way of saying I agree with you.”
LOL…
I agree with you, too…
Below, I am making public my reply to a personal exchange with Ferdinand (I also tried 2 days ago, but there must have been a problem with the server):
– – –
Your quantification of the current carbon balance helped me a lot to clarify our different views. Thanks so much!
Your version is this:
Ins: 4% human, 96% natural
Outs: 0% human, 98% natural.
Balance:
Humans: +4%
Nature: -2%
Atmosphere: +2%
My premise is that nature does not make individual balance per source but works holistically. Hence, my version of the carbon balance is roughly this:
Ins: 4% human, 96% natural
Outs: 0% human, 98% natural.
Atmospheric storage difference: +2%
(so that: Ins = Outs + Atmospheric storage difference)
Balance = Atmospheric storage difference: 2%, of which,
Humans: 2% X 4% = 0.08%
Nature: 2% X 96 % = 1.92%
where 1.92% : 0.08% = 2400%
My version works for the entire history of the Earth. Knowing that the atmospheric CO2 content has been changing, we may assume that, during the 4.5 billion years of Earth’s history, there was some period, before the 18th century AD, in which the atmospheric storage was increasing at the same rate as today, +2% of “ins”. In this, the carbon balance would be modified as follows:
Ins: 0% human, 100% natural
Outs: 0% human, 98% natural.
Atmospheric storage difference: +2%
(so that again: Ins = Outs + Atmospheric storage difference)
Balance = Atmospheric storage difference: 2%, of which,
Humans: 2% X 0% = 0% (instead of 0.08%)
Nature: 2% X 100 % =2% (instead of 1.92%)
And this is another reply of mine from to a personal exchange with Ferdinand
—
You wrote:
> no process on earth can give that amount in such short time span, except an enormous meteor impact, starting hundreds of volcanoes to erupt at once..
See our calculations in Appendix A1, which show that the amount of respiration increase is large enough and, hence, no meteor impact is needed. The last two paragraphs are also copied here:
> Now the literature gives representative average Q10 values of 3.05 for terrestrial respiration [57] and 4.07 for maritime respiration [59]. If RB and RE denote the respiration rate at the beginning and the end of the 65-year period, and DR := RE – RB, then according to (A4), .
> … (A6)
> and hence
> …(A7)
> For the above given values of Q10 and DT, the expression in parentheses becomes 0.172 for the terrestrial part and 0.104 for the maritime part. Multiplying these by the RE values shown in Figure A1, i.e., 136.7 and 77.6 Gt C/year, respectively, we find DR = 23.5 and 8.1 Gt C/year, respectively, i.e., a total global increase in the respiration rate of DR = 31.6 Gt C/year. This rate, which is a result of natural processes, is 3.4 times greater than the CO2 emission by fossil fuel combustion (9.4 Gt C /year including cement production).
Paul Roundy,
“the increase from one year to the next is roughly half our emission rate.”
Yes, roughly 1/2 of our emissions are absorbed by biosphere and hydrosphere sinks. The other half increases the atmospheric concentration – extremely fast on geologic time scales, even natural climate change cycles time. Try to imagine the results of rapidly transferring a large amount of carbon from the slow carbon cycle to the fast carbon cycle.
I’m not sure what you are trying to claim with these % rates. It’s widely accepted that the human contribution is small compared with the naturally occuring increases and decreases associated with the seasonal cycle. If the human contribution is causing the trend, it would emerge from that small component, and, indeed, the increase from one year to the next is roughly half our emission rate.
As I wrote above, I am a fan of full transparency and I post on my website even the prehistories of rejections of my papers. I thought it would be relevant to give here some information on the prehistory related to the paper in discussion.
The prehistory starts from the date that our two earlier papers were published in the Proceedings of the Royal Society. Not surprisingly, several colleagues were annoyed. We are not against criticism. On the contrary, we concluded our second paper inviting “careful and critical scrutiny in the form of public discussion by the scientific community”.
One Commentary on our second paper was approved and published by the Royal Society:
Asbrink, L., 2023. Revisiting causality using stochastics on atmospheric temperature and CO2 concentration. Proceedings of the Royal Society A, 479(2269), doi: 10.1098/rspa.2022.0529.
I conjecture that more Commentaries were submitted, and this one was selected, after review, as the best one. My conjecture is based on the reply I received from the Royal Society to my email expressing our willingness to provide a Reply to each Commentary they received. They clarified in their reply that their policy is only to publish one comment article on a paper.
There is evidence that the Royal Society received complaints from other people or groups asking for the retraction of our paper. I will say a few words about this in a subsequent comment.
We prepared a Reply to Asbrink’s Commentary, which the Royal Society refused to publish (or even to send to review), despite our complaints that their decision was contrary to their stated rules. But, a posteriori, I fully understand them after the rumblings by certain groups, and the pressure to retract our papers. I am satisfied that the Royal Society resisted that pressure.
Eventually we prepared a stand-alone paper which was published in /Sci/ — the paper in discussion here. In this we also included replies to all issues raised in that Commentary. We have left nothing unanswered.
After the publication of our /Sci/ paper, we informed the author of the Commentary as well the editors of the Royal Society about it, also noting that it contains information that answers all issues raised by Asbrink. Subsequently, we had some exchanges with him, in which we gave further explanations and clarifications.
Overall, I am thankful to Leif Asbrink for his scientific (as opposite to politico-activistic) approach to submit and publish his Commentary on our papers.
And once more, I am thankful to Judith Curry for making possible and encouraging the present discussion of our papers.
Some information about the evidence of pressures to retract our papers I have given in an earlier comment:
demetriskoutsoyiannis | September 27, 2023 at 10:32 am
In my exchanges with the Royal Society, I noticed that they spoke about “other readers who have emailed in” about our papers, but I cannot know the content of their emails. However, a recent post in another blog is quite revealing:
https://andthentheresphysics.wordpress.com/2023/10/01/scientifically-intriguing/
Here I am copying the relevant extract:
“When the Proceedings of the Royal Society A paper came out last year, I emailed the editor to point out that they’d published a paper with a rather nonsensical result. I didn’t get a response. However, I was cc’d into a response to someone else who had also complained. This response was, unfortunately, rather dismissive and somewhat insulting. The response said that the criticism had been discussed with the board member and subject editor who handled the paper. According to them, the criticism misinterpreted what was in the paper and was not well-founded. Apparently, the result was scientifically intriguing and would be of interest to many of their readers.”
In my view, the author of this extract, without knowing it, composed a hymn to the Royal Society, to which I express my gratitude for its attitude.
My gosh, that is the most heartening information about the Royal Society appreciating your stimulating work and resisting censorship. The stories of its naturalists making wondrous discoveries in earlier centuries still inspire botanists today. What a joy to know they’re still open to learn!
Until a few weeks ago I’d always thought like Ferdinand. This elegant paradigm (below) now seems so simple and obvious, I’m not sure how I did not see it before reading the Hens paper and the article hereabove and contemplating certain helpful comments hereabove. Am I crazy; this strikes me as genius. Can something so simple be.
” My premise is that nature does not make individual balance per source but works holistically. Hence, my version of the carbon balance is roughly this:
Ins: 4% human, 96% natural
Outs: 0% human, 98% natural.
Atmospheric storage difference: +2%
(so that: Ins = Outs + Atmospheric storage difference)
Balance = Atmospheric storage difference: 2%, of which,
Humans: 2% X 4% = 0.08%
Nature: 2% X 96 % = 1.92%
where 1.92% : 0.08% = 2400% “
And you, Botanist, express yourself in a simple and direct way. Your comments are a pleasure to read. I am glad that my simple calculations helped you to think better.
Demetris,
You say “I have answered all questions”. But you have not answered a very important one: What is the statistical significance of your conclusion that changes in T precede changes in CO2 ON ALL TIME SCALES? No one is arguing about paleoclimate phenomena. No one is arguing about seasonal fluctuations in the present era. Almost everyone is arguing about your surprising claim that temperature changes also precede CO2 changes on a decadal scale in the present era. Those are the CO2 changes that are of concern and which are well explained by human emissions.
When I asked about error analysis before, you referred me to material supplemental to your Royal Society papers, and I tracked it down. It was a response to a reviewer who, like me, had noted “These results suggest it really would be useful to have some estimates of uncertainty in the identification to assess how much confidence we should have in the inference.” In Section SI2.4 of your response, you analyze errors in present era data BUT YOU MAKE NO ATTEMPT TO SEPARATE SEASONAL EFFECTS FROM DECADAL EFFECTS. (Yes, your paper was published anyway, despite your evasion of the real question.)
Can you fill in the blank in the following statement: “ My statistical analysis shows with ____% confidence that temperature changes have been the primary cause of the ~100 ppm increase in atmospheric CO2 over the last 60 years“? Granted, it is not an easy analysis, but it is an essential one.
Extraordinary claims require extraordinary evidence. You do not provide it.
David,
1.
> You say “I have answered all questions”.
Do I? I have searched the entire thread for what you put in quotation marks, and it appears once, in your comment (now it will appear twice, the second time being this reply).
2.
> BUT YOU MAKE NO ATTEMPT TO SEPARATE SEASONAL EFFECTS FROM DECADAL EFFECTS
(Emphasis yours).
Our method does is not affected by seasonal effects. We have excluded them. I have explained it several times, in several of my replies, e.g.:
demetriskoutsoyiannis | September 26, 2023 at 3:37 pm |
We are dealing with annual to (over)decadal effects.
3.
> Can you fill in the blank in the following statement: “ My statistical analysis shows with ____% confidence …”
Do you see anywhere in our paper the word “confidence” (except an informal appearance in the acknowledgments)? I think: No. So, I am afraid I cannot obey your order to fill that gap.
Please feel free to do it yourself. It will take you a couple of papers, and your result will most probably be erroneous, because, by asking that question, you give away that you are not aware of the developments about significance testing in climate and geophysics. As a beginning, I would suggest reading:
– My paper “Climate change, the Hurst phenomenon, and hydrological statistics”, Hydrological Sciences Journal, 48 (1), 3–24, doi:10.1623/hysj.48.1.3.43481, 2003.
– The paper “Nature’s style: Naturally trendy” Geophysical Research Letters, 32(23), L23402, doi: 10.1029/2005GL024476, 2005, by the late Tim Cohn and by Harry Lins. It explains the dramatic impact on statistical inference of the model assumed for the process studied (or the inappropriateness thereof, e.g. the neglect of stochastic dynamics such as Long-Term Persistence). I highlight the following phrase from this paper: “In changing from one test to another, 25 orders of magnitude of significance vanished.”
– My book “Stochastics of Hydroclimatic Extremes”. I have given the link in an earlier comment. Start reading the Prolegomena by Harry Lins, but the entire book would be useful to understand that a time series is not a sample and statistical tests and their related significance are not valid when dealing with time series. You will need advanced Monte Carlo techniques, about which you may also read in my book (chapter 7).
4.
> I think we are done.
This is from a comment of yours about four weeks ago. But you insist on making the same or similar comments, and asking the same or similar questions, as if we were not done.
Demetris,
I have shown you respect by chasing down supplemental material to your papers. Now you want me to read about why putting confidence levels on statistical inferences is old-fashioned. Are you at last admitting that you too have no confidence in your conclusions?
I think I have achieved what I set out to do, and why I returned to the conversation. I understand now why you got your result in conflict with carbon conservation.
I respect originality. I respect truth more.
“I have shown you respect by chasing down supplemental material to your papers.”
Apology accepted.
Pingback: Hydrogen Replacing Carbon Fuels Is Exorbitant | Worldtruth
Pingback: Replace Carbon Fuels with Hydrogen? Absurd, Exorbitant and Pointless - Climate- Science.press
Judith Curry (curryja | September 27, 2023 at 7:25 pm) wrote:
“This blog is about discussing interesting (and sometimes controversial) topics. Disagreement and debate is the spice of the climate blogosphere. We all stand to learn something.”
I feel we have all served the purpose of this blog. I think I really learned something. I thank and say goodbye to everyone who contributed. I hope to “see” you soon.
I have converted this thread into a “book” of 372 pages, featuring 989 contributions in 184 groups from 83 commenters. I acquired a doi for it:
“Causality, Climate, Etc.”, DOI: 10.13140/RG.2.2.21608.44803
I thought the entire material is public, and, hence, I did not ask for permissions. If someone has an objection, please let me know to remove the “book” from the public space and keep it for my own use.
Thanks again and best wishes,
Demetris
http://dx.doi.org/10.13140/RG.2.2.21608.44803
Also, in my research team’s site:
Causality, Climate, Etc. – ITIA, http://www.itia.ntua.gr/2353/
Thank you, Demetris,
It is very useful (sometimes embarrassing and/or entertaining) to have these comments compiled in a single, searchable source.
Dear Demetris,
It was very unfortunately that I was traveling during this discussion, because I had no access to my files and thus could not use all arguments I wanted to use.
My point was and is that your method shows that the short term (1-3 years) variability is caused by temperature variability and that is the only conclusion you can have from your method.
There is absolutely no way that your method can show that the 120 ppmv rise since 1850 is caused by temperature, because the main reactant to rising temperatures: vegetation, increases CO2 for increasing temperatures and reverse on short time (Pinatubo, El Niño), but decreases CO2 with rising temperatures over longer periods, opposite to the short term variability. The earth is greening. Same cause, different responses…
The difference in response between oceans and vegetation is easy to see in the CO2/δ13C ratio: if the oceans are dominant, then CO2 and δ13C changes parallel each other. If vegetation is dominant, then they oppose each other. The latter is the case. Here for the 1991-2002 period to make it clear:
http://www.ferdinand-engelbeen.be/klimaat/klim_img/temp_dco2_d13C_mlo.jpg
Also note that the temperature derivative has no trend, while the CO2 derivative has one.
Thus temperature is not responsible for the slightly quadratic increase of CO2 in the atmosphere, only for a slight (~10 ppmv) linear increase.
In the period 1992-2002, vegetation was a proven net sink for CO2, except during the 1998 El Niño:
https://tildesites.bowdoin.edu/~mbattle/papers_posters_and_talks/BenderGBC2005.pdf
See Fig. 7 at the last page.
So that is my last word on this and maybe we meet some other day to discussion things out to the bottom…
Ferdinand’s reply brings home something else that has not been discussed, that log differencing a time series decreases variability and depressing trends
“Transformations such as logarithms can help to stabilise the variance of a time series. Differencing can help stabilise the mean of a time series by removing changes in the level of a time series, and therefore eliminating (or reducing) trend and seasonality.”
https://otexts.com/fpp2/stationarity.html
Demetris,
Your “apology accepted” comment was disingenuous. I had no need to apologize and did not. I said I valued truth over originality. You provide some of the latter but none of the former.
Ferdinand has made the more complete case against your “holistic” and naive analysis of the carbon cycle. I will not pursue that further.
You point out that nowhere in your paper do you discuss statistical confidence levels. Yet you make the unambiguous claim in the paper that “changes in CO₂ concentration cannot be a cause of temperature changes. ” It would have been helpful to point out to readers from the outset that you yourself have no confidence in this claim, rather than wait until the end of a book-length thread.
Can’t wait to see if this new AI will disrupt the private weather forecasting business model -> I’m looking at you
CFAN (AKA Ms. Curry).
“Weather forecasts for the hour, the week and the century”
Google DeepMind details GraphCast AI, a weather forecasting AI that is more accurate for 3-10 day predictions than the best conventional systems, a first for AI
https://www.science.org/doi/10.1126/science.adi2336
GraphCast outperformed the current gold standard digital forecasting tool on 90% of its forecasts in terms of accuracy and lead time.
GraphCast uses machine learning, and was trained using a total of 36.7 million “parameters” based on historical weather data. It can produce a 10-day weather forecast in under a minute on a single Google machine-learning optimized device — a sharp contrast to traditional weather models that use vast amounts of computing power to produce their predictions.
…
Machine learning models are taking over in the field of weather forecasting, from a quick “how long will this rain last” to a 10-day outlook, all the way out to century-level predictions. The technology is increasingly important to climate scientists as well as apps and local news stations — and yet it doesn’t “understand” the weather any more than you or I do.
…
ClimSim models work similarly to the ones discussed above: Instead of plugging numbers into a physics-based, hand-tuned model, they look at all the data as an interconnected vector field. When one number goes up and reliably causes another to go up half as much, but a third to go down by a quarter, those relationships are embedded in the machine learning model’s memory even if it doesn’t know that they pertain to (say) atmospheric CO2, surface temperature and ocean biomass.
I believe AI will be a force for the shorter term forecasts, but century-level data to train on is very limited and uncertain.
Agriculture will love this and if it’s really accurate it will eliminate some of the unpredictability of renewable energy and improve grid resilience.
If the universe is deterministic then the past does predict the future, “arrow of time” and all that…
I think coupling a reservoir model with a vector graph model could give a good 30 year forecast, depending on the type, amount and quality of the data.
“Can’t wait to see if this new AI will disrupt the private weather forecasting business model -> I’m looking at you
CFAN (AKA Ms. Curry).”
Hi Jacksmith. Al as it stands is more of a feeding trough for l lightweights and posers, Dr. Curry certainly isn’t within this category. AI first needs data before it can present knowledge–it’s not intelligent, yet.
For example, when it comes to AI poser disruption credentials ask unemployed denizen Ganon, aka JJBraccili; or Hollywood for short (a reasonable working label for actors). As the local AI dog-eared cliff note multimedia reference junkie activist canon stamper; one always looking for a method to elevate self worth, he’ll have an answer if AI can provide something that’s been input. AI”Can’t wait to see if this new AI will disrupt the private weather forecasting business model -> I’m looking at you
CFAN (AKA Ms. Curry).”
Hi Jacksmith. Al is a feeding trough for lightweights and posers, Dr. Curry isn’t in this category. AI first needs data before it can present, uh, AI data.
For example, when it comes to AI poser disruption credentials ask unemployed denizen Ganon, aka JJBraccili; or Hollywood for short (a reasonable working label for actors). As the local AI dog-eared cliff note multimedia reference junkie intellect wannabe activist canon stamper; one always looking for a method to elevate self worth for short. He’ll have an answer if AI can usually provide something , AI”Can’t wait to see if this new AI will disrupt the private weather forecasting business model -> I’m looking at you
CFAN (AKA Ms. Curry).”
Hi Jacksmith. Al is a feeding trough for lightweights and posers, Dr. Curry isn’t in this category. AI first needs data before it can present, uh, AI data.
For example, when it comes to AI poser disruption credentials ask Ganon, aka JJBraccili; or Hollywood for short (a reasonable working label for actors). As the local AI dog-eared cliff note multimedia reference junkie intellect wannabe activist canon stamper; or one who’s always looking for a method to elevate self worth, for short. AI can always provide something believable, at least apropos to the uninitiated.
Re AI and weather forecasting, this is the route I think it needs to take:
https://www.cfanclimate.net/_files/ugd/867d28_ed1ed959be454673bf48cfb1191e534f.pdf