
by Javier Vinos
Over the past two decades, solar activity has been characterized by an extended solar minimum spanning two solar cycles, known as the Clilverd Minimum. This phenomenon is currently affecting the climate, but before we can understand its impact, we must address the significant discrepancy between the solar effects observed in paleoclimate proxy records and modern observations.
The relationship between solar signals and climate response is complex and not fully understood. However, there is substantial evidence from models and reanalyses that the relationship exists. A recent hypothesis is that the solar signal modulates heat and moisture transport to the Arctic, which explains its relatively small effect during a single solar cycle. However, when an anomaly in solar activity persists over several cycles, as it did during the 70-year modern solar maximum, its effect accumulates and has a large impact on the planet’s energy budget. Understanding this mechanism is critical to understanding the overall impact of solar activity on our climate.
Current Solar Activity
The monthly sunspot number for June 2023 reached 163.4. While this figure may be revised slightly, it’s likely to stand as the highest number seen in over two decades, since September 2002. Solar Cycle 25 is relatively young, only three and a half years old, which means there are ample opportunities over the next three years to surpass this month’s 20-year record. Based on recent data, it seems very likely that Solar Cycle 25 will surpass Solar Cycle 24 in terms of activity.

Figure 1. Daily and monthly sunspot numbers over the past 13 years, as provided by SILSO.
Both solar cycles 24 and 25 show significantly low activity compared to the average of the last 300 years. Together they represent an extended solar minimum, recently proposed to be known as the Clilverd Minimum.[1] This name proposal is due to a paper published in 2006 by Mark Clilverd and colleagues, in which they successfully predicted the occurrence of this event.[2]
Contrary to earlier speculations, the likelihood of a solar grand minimum in the 21st century is becoming increasingly remote. Similarly, predictions that the current extended solar minimum would lead to a marked decrease in temperature are incorrect. However, this doesn’t mean that the Clilverd minimum has no effect at all. Changes in solar activity indirectly affect surface temperatures in a complex way. Understanding how these solar variations affect the climate is crucial to identifying their effects.
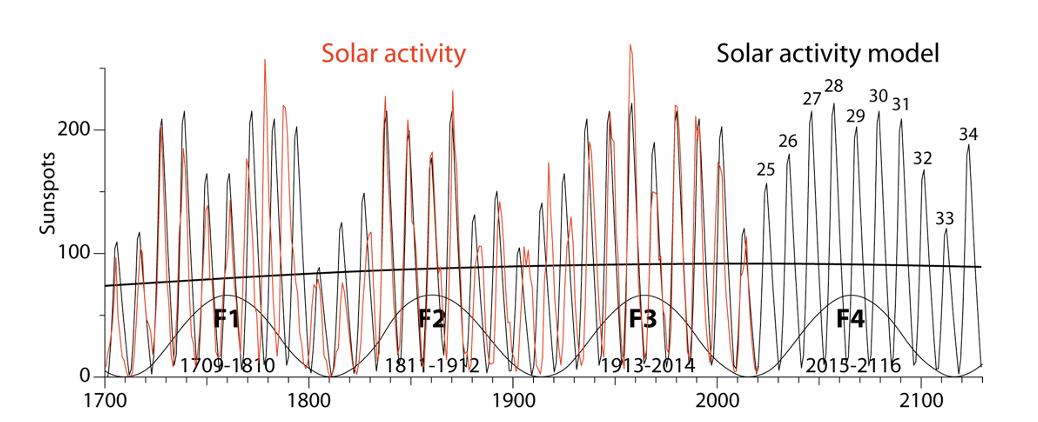
Figure 2. Projected solar activity based on my 2018 model, which relies on long-period solar cycles. The model uses the total number of sunspots in a cycle, rather than peak activity, and assumes regular 11-year cycles. At each point, it estimates the effect of five different long cycles, considering their historical impact on sunspots or 14C records. Four Feynman (100-year) solar cycle periods are indicated at the bottom.
The solar effect on climate (I). Modern observations
There exists a great discrepancy between the solar effects observed in paleoclimatic proxy records and modern observations. According to satellite instruments, the change observed over the solar cycle amounts to a mere 1.1 W m–2, and the variability observed over the past 9,000 years doesn’t appear to be much higher, approximately 1.5 W m–2.[3] This presents another challenge because the change is so minuscule that its impact should be indiscernible amidst the noise of climate data. However, numerous studies consistently identify a climate influence of approximately 0.1°C attributed to the solar cycle, which is about four times larger than expected from the slight radiative change. Consequently, there arises a necessity for an amplifying mechanism to account for this second discrepancy.
Adding to the complexity, the effect of the solar cycle on surface temperatures is not what would be expected from a marginal increase in total irradiance over the entire surface. Rather, it reveals a highly dynamic pattern characterized by certain regions experiencing warming of more than 1°C, while others show cooling trends (Figure 3). Interestingly, this pattern is similar to the warming observed between 1976 and 2000. During this period, the Northern Hemisphere experienced more warming than the Southern Hemisphere, land surfaces warmed more than the oceans, and the mid-latitudes of the Northern Hemisphere experienced the most pronounced warming effects.

Figure 3. Regional changes in surface temperature from minimum to maximum of the 11-year cycle.[4]
This pattern is thought to result from an amplification mechanism rooted in the effects of increased solar activity on the ozone layer, leading to increased ozone levels and stratospheric temperatures. Consequently, these changes affect the speed of zonal winds and the stability of the polar vortex. Through the stratosphere-troposphere coupling, the solar signal is transmitted to the troposphere. The strength of the polar vortex plays a critical role in determining the winter state of the North Atlantic Oscillation, which becomes markedly positive during periods of high solar activity. In addition, the position of the jet stream is influenced by the strength of the vortex, causing it to shift poleward during these periods of high solar activity. As a result of this movement, cold Arctic air masses are trapped in the Arctic region, leading to warmer winters in the mid-latitudes of the Northern Hemisphere.
In tropical regions, changes in atmospheric circulation occur due to the poleward motion of the jet stream and a reduction in the upward branch of the Brewer-Dobson circulation. As a result, the Hadley circulation expands, leading to a corresponding shift in the subtropical jet. These changes significantly affect precipitation patterns and contribute to mid-latitude warming, as less heat is transported to the Arctic due to a strengthened polar vortex.
Both data assimilation reanalysis products and climate models that incorporate ozone chemistry and stratospheric circulation can reproduce these effects in response to prescribed changes in solar activity. However, they do so in a somewhat muted manner, resulting in smaller changes than those observed.
Nevertheless, because solar activity rises and falls over the course of a solar cycle, the cumulative effect of its changes over several cycles is considered insignificant.
The solar effect on climate (II). Paleoclimatic observations
As noted above, there is a stark contradiction between the relatively small climatic impact observed during the solar cycle and the evidence provided by paleoclimate proxy data. Remarkably, the climate patterns observed over the past 2000 years are consistent with a millennial cycle of solar activity known as the Eddy Cycle, named after astronomer John Eddy, who revived interest in the Maunder Minimum in the 1970s. Notably, the Little Ice Age, the coldest period in the Holocene, coincided with three solar grand minimums that occurred within a span of less than 500 years.
It is important to note that the onset of the Little Ice Age cannot be attributed to changes in greenhouse gas levels, as CO2 levels remained constant between 1100 and 1500 AD. In addition, the Little Ice Age cannot be explained by volcanic eruptions alone, as no significant volcanic events were recorded for an extended period of three hundred years, from 1458 to 1765.
The evidence linking solar activity to major climate changes strongly suggests that the Eddy Cycle has played a major role in shaping the climate of the past 2000 years. This is illustrated in Figure 4, which shows the 14C record – a proxy for solar activity – with its 1000-year bandpass frequency sinusoidal. In addition, the figure shows a climate proxy: the measurement of petrological tracers in benthic cores that reflect the amount of iceberg discharge in the North Atlantic.[5] These tracers are carried by icebergs and released as they melt. During colder periods with increased winter snowfall, coastal glaciers advance and release more icebergs, resulting in a higher amount of tracer.
While the two curves may not be perfectly aligned at all times, their overall correlation is too compelling to dismiss as mere coincidence. Any increase in iceberg activity, indicating colder temperatures and increased snowfall, corresponds to a decrease in solar activity. Consequently, this observed relationship implies that solar activity has served as the primary driver of climate on a centennial time scale over the past 2000 years.

Figure 4. The millennial solar-climate cycle over the past 2000 years. The anomaly in 14C production levels (black curve), a proxy for solar activity, is compared to iceberg activity in the North Atlantic (dashed blue curve), a climate proxy. The pink sine curve shows the millennial frequency. It defines two warm and two cold periods, supported by a large amount of evidence, some of which are represented by red and blue bars (see main text).
The climate of the past two millennia can be divided into four distinct phases:
- The Roman Warm Period (ending around 400 AD)
- The Dark Ages Cold Period, which consists of two parts — an early part around 500 AD and a late one around 700 AD
- The Medieval Warm Period (centered around 1100 AD)
- The Little Ice Age (beginning around 1300 AD)
This scheme, marked by its millennial quasi-periodicity, finds strong support from an abundance of historical, biological, geological, and climatic evidence. A recent publication presents some of this compelling evidence in the form of colored bars (Figure 4), where warm indicators are represented by red bars and cold indicators by blue bars.[6]
The problem can be summarized as follows: If we do not acknowledge the substantial effect of low solar activity, we are left without a satisfactory explanation for the occurrence of the Little Ice Age. The application of causal identification techniques within systems theory sheds light on this problem of explainability.[7] These techniques involve comparing forced identification, using the forcings identified by the IPCC, with free identification, where no specific forcings are assumed. This analysis shows that a large solar forcing is needed to explain both the Medieval Warm Period and the Little Ice Age. As a result, the IPCC hypothesis of low climate sensitivity to solar activity is shown to be incorrect.
Resolving the discrepancy about the solar effect on climate
Ignoring evidence that contradicts a hypothesis is never a good idea in science. The IPCC reports rely on paleoclimate proxy evidence to assert that ongoing climate change is highly unusual and that current temperatures are most likely the highest they have been in a long time. However, when it comes to examining the paleoclimatic consequences of past variations in solar activity, the IPCC reports find the proxy evidence inconclusive.
In fact, the evidence is abundant and consistent, clearly indicating that the solar effect on climate does not result from small variations in total solar irradiance at the surface. On the contrary, solar changes primarily affect atmospheric circulation and, in turn, the intensity of heat and moisture transport to the Arctic, especially during the winter season when atmospheric circulation is enhanced.
During winter, the Arctic has a weak greenhouse effect because its atmosphere contains minimal water vapor – a critical component responsible for 75% of the greenhouse effect along with cloud formation. Consequently, the polar regions act as cooling systems within the thermodynamic heat engine of the climate. Changing the amount of heat transported to the Arctic during winter has a noticeable impact on the planet’s energy balance. Although the impact may seem small in a single year, it quickly accumulates to a large effect when changes in solar activity persist over several decades, as was the case during the Modern Solar Maximum for most of the 20th century.
This hypothesis not only reconciles paleoclimate and modern evidence, but it also has great explanatory power, i.e., it explains a greater number of facts, sheds light on puzzling observations, relies less on authority and more on empirical observations, makes a minimum of assumptions, and is more easily falsifiable. This makes it a better hypothesis than the one based on the enhanced effect of CO2 changes.
An academic book has recently been published by this author presenting the new hypothesis.[8] It has also been further explored in several blog posts on this site. In addition, a forthcoming book aimed at a broader audience will provide a compelling evidence-based explanation of the influence of changes in heat transport on recent climate changes.
This new mechanism does not contradict existing theories, such as the effects of increased human emissions, but it significantly reduces their potential impact. Paleoclimatic evidence strongly suggests that this mechanism serves as the primary driver of climate change on centennial to millennial time scales.
[1] Vinós, J., 2022. Climate of the Past, Present and Future: A scientific debate. 2nd ed. Critical Science Press. amazon.com/dp/B0BCF5BLQ5/
[2] Clilverd, M.A., et al., 2006. Space Weather, 4 (9). doi.org/10.1029/2005SW000207
[3] Gulev, S.K., et al., 2021. Climate change 2021: The physical science basis. 6th AR IPCC. p.297. doi.org/10.1017/9781009157896.004
[4] Lean, J.L., 2017. Sun-climate connections. In: Oxford Research Encyclopedia of Climate Science. doi.org/10.1093/acrefore/9780190228620.013.9
[5] Bond, G., et al., 2001. Science, 294 (5549), pp.2130–2136. doi.org/10.1126/science.1065680
[6][6] Moffa-Sánchez, P. & Hall, I.R., 2017. Nat. Commun. 8 (1), p.1726. doi.org/10.1038/s41467-017-01884-8
[7] de Larminat, P., 2016. Annu. Rev. Control, 42, pp.114–125. doi.org/10.1016/j.arcontrol.2016.09.018
[8] Vinós, J., 2022. Climate of the Past, Present and Future: A scientific debate. 2nd ed. Critical Science Press. amazon.com/dp/B0BCF5BLQ5/

Javier – thanks for a very interesting article. I am interested in your “increased solar activity on the ozone layer, leading to increased ozone levels and stratospheric temperatures” and how they “affect the speed of zonal winds”. Do you have any further information/links on any of that? I am particularly interested in anything that can help to understand the Antarctic region.
Mike, great work. I applaud your efforts since I currently make more than $36,000 each month from just one easy web company. Even though these are the most fundamental internet operations tasks, you can start making a reliable hf-11 online revenue with as low as $29,000.
.
.
Modify how you connect————————————>>> GOOGLE WORK
Mike, the strength of the stratospheric zonal circulation during winter depends on the speed of the westerlies, which is modulated by the latitudinal temperature gradient through a phenomenon known as thermal wind balance . The steeper the gradient the faster the winds. If the westerlies are very fast, they deflect the planetary waves coming from the troposphere. These waves carry a lot of energy and momentum. When they are not deflected they can impact the polar vortex and release their momentum. This causes the winds that form the vortex to reduce their speed and the vortex weakens and can destabilize.
You probably want to read the papers by Kunihiko Kodera and Yuhji Kuroda, jointly or separately. One of them is:
https://agupubs.onlinelibrary.wiley.com/doi/pdf/10.1029/2002JD002224
The Southern polar vortex is a lot more stable, because fewer planetary waves are generated in the SH due to less continental land and orography. The solar effect on the Southern Annular Mode is similar but with less effect.
https://agupubs.onlinelibrary.wiley.com/doi/pdf/10.1029/2005GL022516
Javier – Thx, will read.
Dear Javier
The paragraph following Fig 3. “This pattern is thought to result from an amplification mechanism” etc.
These series of events have not been proven, simply because there is no evidence. The theory is speculation, and wrong.
To form any further climate related theory from this is without foundation.
Why does the ozone minimum above both Poles occur within days in late September. Atmospheric dynamics are not well understood.
Martin
Dear Martin,
There is observational evidence for the series of events described. The change in ozone amount with the solar cycle, the change in stratosphere temperature, the change in winter atmospheric circulation, the shift of the jets, the change in the Hadley circulation, the change in the Brewer-Dobson circulation. Some of the events are detected through reanalysis, like the change in planetary wave amplitude.
There is little doubt that the top-down solar amplification mechanism is real. The only question is its importance.
Even the IPCC reports, that are notoriously anti-solar in their stance, recognize the existence of the mechanism.
AR5 page 886.
https://www.ipcc.ch/site/assets/uploads/2018/02/WG1AR5_Chapter10_FINAL.pdf
Javier
I would appreciate clarification about the above statements
“However, numerous studies consistently identify a climate influence of approximately 0.1°C attributed to the solar cycle, which is about four times larger than expected from the slight radiative change. Consequently, there arises a necessity for an amplifying mechanism to account for this second discrepancy.”
“ Although the impact may seem small in a single year, it quickly accumulates to a large effect when changes in solar activity persist over several decades, as was the case during the Modern Solar Maximum for most of the 20th century.”
It’s unclear if the 0.1C is the “large effect” and more to the point, is that the amount you would attribute from solar out of the ~1C increase in temperatures since 1850-1900 base period.
I don’t remember seeing the 0.1C number in your book.
Thanks. I enjoyed your book. The interrelationships between the atmosphere and oceans are overwhelmingly complex but you put structure to it and give the layman a fighting chance.
Hi CKid,
Based on energy alone, the solar effect on climate should not be detectable given the climate noise.
Wigley, T.M.L. & Raper, S.C.B., 1990. Geophys. Res. Lett. 17 (12), pp.2169–2172. doi.org/10.1029/GL017i012p02169
The detected effect from the solar cycle is higher. About 4 times higher in surface temperature (0.1ºC). In the heat budget of the subsurface tropical ocean the effect is 10 times higher.
White, W.B., et al., 2003. J. Geophys. Res. Oceans, 108 (C8) 3248. doi.org/10.1029/2002JC001396
The 0.1ºC difference between solar minimum and maximum has been stablished by several studies, starting with Camp & Tung 2007. Temperature goes up about 0.1ºC as solar activity goes from minimum to maximum, and then comes down by about 0.1ºC when it goes from maximum to minimum. Therefore, over several cycles it is not expected to affect the long term temperature.
My hypothesis is that solar activity affects temperature also by a different mechanism, changing the amount of heat transported to the Arctic in winter. As that heat exists the planet through outgoing longwave radiation, transporting more leads to an energy content decrease in the climate system, while transporting less leads to an energy content increase in the climate system. As this effect on the energy budget is cumulative, it leads to important changes when solar activity deviates from average for a long period of time. Over the LIA it led to cooling, in the 20th century the Modern Solar Maximum led to warming.
Javier
I’m not trying to be a pain, I’m just trying to make sure I understand precisely your 0.1C difference between solar maximum and minimum, as opposed to the somewhat similar statement by the IPCC on the bottom of page 885 in the link above. IPCC references both 0.1C and less than 0.1C,
but let’s use 0.1C here.
If I compare your statement and their statement they seem about the same, which could imply you are not that different from the IPCC, and solar only affects temperatures by 0.1C.
Or, are you suggesting that the positive solar signal from maximum solar acts as a catalyst for your mechanism to amplify further heating and thus the totality of warming is really 0.1C solar plus an additional amount from your suggested mechanism? Could your mechanism be viewed as a derivative of the change from the cumulative solar maximum and thus, becomes together, a larger fraction of the 1C increase in global temperatures since LIA?
If that is the case what share of that 1C would you attribute to solar (0.1C) and your mechanism?
Thank you for your patience.
I don’t mean to detract from your points, but I just have to make a comment about the IPCC reports in general. They have the most redundant, turbid, turgid, obtuse and confusing and worthless prose ever concocted by man. The section on pages 885 and 886 is an example where they say the same thing in different ways and seem to contradict other sections. They seem to be too cute by half with some of their paragraphs while adding little to understanding. There, got that off my chest.
CKid, your comments are welcome. I am also interested in making myself clear about my view on solar-induced climate change.
Firstly, the observed 0.1ºC cannot be precise as it obviously depends on the specific solar cycle studied as they have different activity. Also, it is very difficult to measure but, by using different techniques, different researchers come to a similar effect. That is why it is accepted by the IPCC. This 0.1ºC obviously does not accumulate. During a single cycle, it is produced from minimum to maximum, followed by the corresponding –0.1ºC from maximum to minimum.
In the second place, nobody knows how this effect is produced, but it is clear that it is not due to receiving more energy from the Sun, as the change in TSI is too small. Also, the temperature-change pattern is inconsistent with a general increase in solar energy. Dynamic changes in the atmosphere have been identified that could be responsible for the temperature change and pattern. This is known as the top-down mechanism, which has abundant support from observations but has not been mathematically defined. A different mechanism relies on changes in tropical ocean evaporation driving changes in cloud cover, known as the bottom-up mechanism. It has less support from observations but it is not incompatible.
In third place, these changes cannot induce global climate change if they don’t change the radiative flux at the top of the atmosphere. Energy redistribution within the climate system does not alter its energy content. To induce a global climate change a change in the energy content is required. This is a rule with few exceptions. CO2 causes climate change by increasing energy retention and thus the energy content.
My hypothesis based on observational evidence is that the atmospheric changes induced by the top-down mechanism cause their effect on temperature by altering the amount of heat transported to the Arctic. Since the greenhouse effect is several times weaker during the polar winter this alters the radiative flux at the top of the polar atmosphere (observed). As a result, the amount of energy in the system increases when solar activity is high and decreases when it is low.
If the solar cycles were regular and always had the same average activity and span this mechanism would not change the climate. But sometimes the Sun presents several cycles in a row with significantly higher or lower activity. When this happens, the solar effect accumulates. For example, after 1935 the effect of each solar cycle for 70 years was to add an energy increment to the climate system. As a result, mid-20th-century cooling was smaller and late-20th-century warming was larger.
But when solar activity is persistently high there are still years of low solar activity partly reducing the gain. When in a solar grand minimum, all years have very low activity and the loss is never reduced, so their effect on climate is dramatic.
The relative contributions of this solar mechanism and the increase in CO2 to modern warming cannot be calculated, but paleoclimatology supports a larger solar effect on climate from solar variations. I have little doubt that the Modern Solar Maximum is responsible for more than half of the observed warming.
I hope to have solved your doubts to the extent I am capable. If not, let me know.
CKid,
Thank you for your kind comment on my book. It was not written for the layman and I am glad you find it enjoyable. The book is doing extraordinarily well for an academic book. It shows there is a lot of interest on the science of climate change even at a high level. The next book with Andy is addressed to a more general readership with some science basic knowledge and should be a lot more accesible.
Warming since 1977 may be over. No one knows. The minute increase of anthropogenic CO2 in the atmosphere was certainly not the cause of warming- that was a continuation of natural cycles that occurred over the past 500 years.
“However, there is substantial evidence from models and reanalyses that the relationship exists.”
What comes out of models is not “evidence”. If it were, I’d be a rich man, because that’s what my model of the stock market said.
And reanalyses are climate models, just models that are constantly being nudged back onto the rails.
And unlike nature, which is highly damped, what goes into one end of a climate model comes out the other.
So it’s no surprise that models and reanalysis models show solar effects … but the fact that you are touting them as your “evidence” is evidence of nothing but the weakness of your claims.
Regards to all,
w.
Your opinion over models is just opinion. For non-experimental sciences, models are invaluable to increase knowledge. A lot of knowledge on climate has been gained through the use of models. Thinking that anything that comes out of models is “tainted” is not a very scientific stance.
In the article:
Mitchell, D.M., et al., 2015. Q. J. R. Meteorol. Soc. 141 (691), pp.2011–2031. doi.org/10.1002/qj.2492
They analyze for reanalysis products and say;
“In general, the solar signatures reported are primarily due to the assimilation of observations, rather than the underlying forecast model used in the reanalysis system.”
Detected solar effects come from observations. They cannot come from the programming of the models as nobody knows how to code them. That they come out of models without being coded into them indicates they are rooted in the physics equations of the models, and not in the parameterization, tunning or prescribed forcings.
I know that will not serve you given your biases, but it may serve others with a more open mind.
“anything that comes out of models is “tainted””
No. But it is not an observation.
The fabrication of GCMs (General Circulation Models– the numerical models used by UN-approved global warming charlatans and climate change hoaxsters to simulate the laws of nature, the universe and everything to realize an ersatz digital reality they find useful to exaggerate the effects of CO2 on temperatures) to scare children, to stampede the superstitious and ignorant and to feather the nests of Leftist Western Academics in ivory towers who then spin prophecies of an impending Hot World catastrophe out of anti-science and hate-America babel, is not a productive activity in any economic sense.
I remind you that 2009 was the year of the lowest solar activity in many years.
https://i.ibb.co/xJPpnkz/onlinequery.gif
This means that much of North America and Europe could be frozen in one winter.
Impact of the 2009 major sudden stratospheric warming on the composition of the stratosphere
Comparing simulations with and without mixing, we find that after SSW, polar air transport increases, not only through the vortex edge, but also through the subtropical transport barrier. Moreover, the SSW event at the same time accelerates the polar descent and tropical ascent of the Brewer-Dobson circulation. Accelerated ascent in the tropics and descent in high latitudes first occurs in the upper stratosphere and then propagates downward into the lower stratosphere. This downward propagation takes more than 1 month from a potential temperature level of 1000 to 400 K.
https://www.researchgate.net/publication/307722532_Impact_of_the_2009_major_sudden_stratospheric_warming_on_the_composition_of_the_stratosphere
https://www.researchgate.net/publication/307722532_Impact_of_the_2009_major_sudden_stratospheric_warming_on_the_composition_of_the_stratosphere
Well sure, when the polar vortex weakens the Brewer-Dobson circulation accelerates, and when the polar vortex strengthens it decelerates. A SSW implies a major disruption of the vortex. Lots of warm air enter the Arctic and lots of cold air exit it, impacting NH mid-latitudes winter weather.
IP, thanks for the link.
My interest here is from a very different perspective. This link happened to offer another example of something I am after.
Specifically – from text:
“2 Dynamical background
The definitions for SSW and classifications are extensively
discussed by Butler et al. (2015). According to commonly
used criteria (Christiansen, 2001; Charlton and Polvani,
2007), we identify the warming event on 24 January by the
reversal of 60 N westerly zonal-mean wind at 10 hPa. As
has been pointed out (Taguchi, 2011; Gómez-Escolar et al.,
2014), use of the highest polar cap temperature instead of the
zonal wind reversal at 60 N and 10 hPa, characterizes the
response of the BDC to SSWs better. Thus, we identify the
central SSW day as the date when 5-day smoothed polar cap
temperature at 10 hPa reach its peak within 5 days of the
wind reversal date. 23 January is used as the central day in
our study because the polar cap temperature reached its peak
on 23 January.”
Event date is 24 January 2009. Interesting planetary orientation/distribution, and including a new moon (critical, between E-sun). Earth axial orientation one month after winter solstice. The possible effect of the gravity vector change. The past 15 months offered several examples of such disturbances.
When the model started with the decreased solar energy and returned temperatures that matched the paleoclimate record, Shindell and his colleagues knew that the model was showing how the Maunder Minimum could have caused the extreme drop in temperatures. The model showed that the drop in temperature was related to ozone in the stratosphere, the layer of the atmosphere that is between 10 and 50 kilometers from the Earth’s surface. Ozone is created when high-energy ultraviolet light from the Sun interacts with oxygen. During the Maunder Minimum, the Sun emitted less strong ultraviolet light, and so less ozone formed. The decrease in ozone affected planetary waves, the giant wiggles in the jet stream that we are used to seeing on television weather reports.
https://earthobservatory.nasa.gov/images/7122/chilly-temperatures-during-the-maunder-minimum
Why does a strong weakening of the polar vortex occur in the north in winter? The reason lies in the weakening of the magnetic field over the Arctic Circle due to the two geomagnetic centers and the strengthening of the Siberian center and the weakening of the Canadian center. This affects the uneven distribution of ozone in high latitudes, which is pushed toward eastern Siberia in winter and then over northern Canada. This causes strong stratospheric intrusions in North America. This is because ozone as a diamagnetic is repelled by a strong magnetic field.
What does this have to do with solar activity?
Well, a strong solar wind strikes at high latitudes (the visible image is the shape of the aurora borealis) and its magnetic field pushes ozone outside the range of the aurora borealis.
Therefore, during times of strong solar activity, the stratospheric polar vortex is stronger.
http://www.geomag.bgs.ac.uk/images/charts/jpg/polar_n_z.jpg
https://i.ibb.co/dpfWp91/gfs-toz-nh-f00-2.png
https://i.ibb.co/3mbktkD/gfs-t100-nh-f00.png
Ozone is produced in the stratosphere by UVC. In the formation of O3, an infrared photon is transferred to a neighboring air molecule. This is a condition for the persistence of the O3 particle. Ozone then absorbs UVB and is broken down into oxygen. When UVC decreases ozone production decreases and UVB levels near the surface increase.
“UV-A light (320-400nm) is UV light with the longest wavelength, and the least harmful. It is more commonly known as “black light”, and many use its ability to cause objects to emit fluorescence (a colored glowing effect) in artistic and celebratory designs. Many insects and birds can perceive this type of UV radiation visually, along with some humans in rare cases such as Aphakia (missing optic lens).
UV-B light (290-320nm) causes sunburns with prolonged exposure along with increasing the risk of skin cancer and other cellular damage. About 95% of all UV-B light is absorbed by the ozone in Earth’s atmosphere.
UV-C light (100-290nm) is extremely harmful and is almost completely absorbed by Earth’s atmosphere. It is commonly used as a disinfectant in food, air, and water to kill microorganisms by destroying their cells’ nucleic acids.”
http://solar-center.stanford.edu/about/uvlight.html
A decrease in temperature in the upper stratosphere in the tropics means a decrease in ozone production. The temperature in the stratosphere rises when two-atom oxygen is broken down by ultraviolet photons at the highest energies.
UV radiation increases during strong solar flares, of which there are few in cycle 25.
https://www.cpc.ncep.noaa.gov/products/stratosphere/strat-trop/gif_files/time_pres_TEMP_ANOM_ALL_EQ_2022.png
https://www.cpc.ncep.noaa.gov/products/stratosphere/strat-trop/gif_files/time_pres_TEMP_ANOM_ALL_EQ_2023.png
https://www.spaceweatherlive.com/en/solar-activity/top-50-solar-flares.html#SWL_Page
The northern polar field appears to have reversed polarity in late March 2023. Solar max normally occurs 0.5-2 years after the first polar field reversal. We can expect solar max for cycle 25 sometime between September 2023 and March 2025.
https://solen.info/solar/polarfields/polarfields.png
As of March 2023, solar wind strength, despite fairly strong spikes, has remained virtually on average at the same level.
https://i.ibb.co/s2xWn2g/onlinequery.gif
https://cosmicrays.oulu.fi/webform/monitor.gif
Pingback: Solar Activity: Solar Cycle 25 Surpasses Cycle 24 - Climate- Science.press
“Changing the amount of heat transported to the Arctic during winter has a noticeable impact on the planet’s energy balance. Although the impact may seem small in a single year, it quickly accumulates to a large effect when changes in solar activity persist over several decades,”
The AMO can shift from a cold phase to a warm phase within a decade or less, due to weaker indirect solar forcing causing negative North Atlantic Oscillation regimes.
“The strength of the polar vortex plays a critical role in determining the winter state of the North Atlantic Oscillation, which becomes markedly positive during periods of high solar activity.”
Not when there is a major low in the solar wind around sunspot maximum, as in 1968-69 and in 1979-81. That gives negative NAO regimes, and the associated warmer AMO anomalies.
https://www.woodfortrees.org/graph/esrl-amo/from:1880/mean:13/plot/sidc-ssn/from:1880/normalise
AMO changes were unrelated to solar changes in the 1920s and early 1930s when solar activity was low and AMO shifted to the warm phase.
The AMO should be warmer when solar activity is lower, every other warm phase of the AMO is during a centennial solar minimum. Which is why the millennial scale mean AMO frequency is 55 years.
Colder AMO anomalies occurred when the solar wind was the strongest in the space age observations, in the mid 1970’s, mid 1980’s. and early 1990’s. Associated with positive NAO regimes. The AMO then shifted to its warm phase with the generally weaker solar wind states from 1995 onward, during negative NAO regimes 1995-1999 and 2005-2012.
The same pattern occurred from 1911 and from 1921, cold AMO anomalies, and continental heatwaves, regardless of smaller sunspot cycles, and and nearer to sunspot minimum, as in the mid 1970’s and mid 1980’s. The warming of the AMO from 1925 is associated with negative North Atlantic Oscillation regimes, suggesting weaker indirect solar forcing.
“The AMO should be warmer when solar activity is lower”
The AMO can become warmer or cooler regardless of solar activity. For the past 20 years solar activity has been lower and the AMO has been warmer.
“The AMO can become warmer or cooler regardless of solar activity”
Not regardless of the solar wind strength, the colder AMO anomalies are all during faster solar wind states, and the AMO is always warmer during each centennial solar minimum.
“Responses of sea-surface temperature to solar wind speed on the seasonal timescale have been found, and in the North Atlantic region in winter they resemble the North Atlantic Oscillation. At the locations of the peak (negative) response in the North Atlantic the SST decreases by approximately 1 °C for 100 km s−1 increase in solar wind speed.”
https://www.sciencedirect.com/science/article/abs/pii/S1364682616300360
Just a general comment about the interpretation of long proxy records: narrowband thinking is narrow thinking (based on wishful thinking). Noting also that the author does not need it for his argument, which relies on apparent correlation. Hope this is somewhat helpful.
The link to the Eddy cycle can be extrapolated back to about 5200bce with near certainty; with enough evidence. However the cycle length may be variable as it depends on a number of factors (mainly planetary conjunctions.)
This link may be found interesting. https://www.nature.com/articles/s43247-023-00882-7
The main point I find of importance is the emphasis on ‘abrupt’. Various other sources of research have noted the abruptness of the changes. Some of those have been found in sediments in the Mediterranean and around the African continent (P DeMencal for the 3550bce Eddy peak, and the abrupt Sahara desiccation).
Climatic changes and energy residence times (between absorption and rejection) may vary, but appear to be secondary collateral happenings. The main drivers are elsewhere.
“Understanding past mean changes to the east-west asymmetry is directly relevant to understanding tropical Pacific mean state changes under future warming. Virtually all climate models project a pronounced warming in the eastern equatorial Pacific relative to the western equatorial Pacific. However, these projections fly against recently observed trends that show the opposite to have occurred during the last decades, suggesting that the model projections may be in error. This potential error has strong implications for future regional projections of climate. Like interannual El Niño, multidecadal to multicentennial changes in sea surface temperatures (SST) in the tropical Pacific that mirror the ENSO pattern can lead to changes to regional climates throughout the globe mediated through atmospheric teleconnections. Paleoproxy information that documents changes to the tropical Pacific mean climate, in particular its east-west asymmetry, can provide a valuable perspective on this problem.”
https://www.tropicaltidbits.com/analysis/ocean/cdas-sflux_sst_global_1.png
Surely everyone read the news from yesterday! It was the hottest day on earth in 100,000 years!! Oh, my! Well, that was not true in Phoenix — it was only 111 degrees on July 4, 2023 and that’s normal for us. Not sure where their thermometers are being placed, but all things are status quo here in Phoenix.
If you had a friend with an above ground pool, you’d remember when everyone would walk in a circle, adding energy, it’d create a smooth, controlled whirlpool. It was when everyone got out or stopped that the water became choppy & chaotic with rogue waves.
The Planet Surface Rotational Warming Phenomenon is what accounts for the full difference between Earth and Lunar mean global surface temperature.
–
https://www.cristos-vournas.com
“Nevertheless, because solar activity rises and falls over the course of a solar cycle, the cumulative effect of its changes over several cycles is considered insignificant.”
When you leave out the cumulative effect of solar irradiance you will get insignificant results for both single solar cycles and more.
The entire 30ya SST is a function of this solar cumulative effect.
https://i.postimg.cc/769RYf0b/S-B-Equation-and-Sun-Climate.png
Since the 30ya SST is also a linear function of the integrated MEI when the integrated MEI is mostly positive, there can be no doubt that the ENSO is also forced by this cumulative solar effect.
https://i.postimg.cc/3wHnhy0d/30y-SST3-v-30-i-MEI.jpg
“However, numerous studies consistently identify a climate influence of approximately 0.1°C attributed to the solar cycle, which is about four times larger than expected from the slight radiative change. Consequently, there arises a necessity for an amplifying mechanism to account for this second discrepancy.”
Some of those studies are based on treating ENSO activity as a separate forcing, but I found out the step-changes are related to solar activity, so the solar forcing is far greater than 0.1°C/cycle.
TSI forced a 0.35°C peak SST in solar cycle #24, annually, and a net of about 0.25°C by the solar minimum, greater than 0.1°C!
https://i.postimg.cc/K88JNykw/Figure-16-SC24-v-SST.jpg
You are still relying too much on weak mechanisms and old work rather than learning primary solar forcing of the ocean first hand.
There is no need for any amplifying mechanism re the Arctic to explain solar forcing, as the TSI-warmed ocean is driving the Arctic changes, as I’ve mentioned here many times before:
https://i.postimg.cc/xTMLm9cV/NH-SST-NH-Sea-Ice-Extent-and-80-N-Temperature-Correlations.png
I have my doubts about AI for a lot of proposed “job stealing” use cases, but AI is good at finding patterns. Seems like the climate data would be a good time.
Javier … I read your book. It was difficult for me as a non-scientist. But in the end I understood the overall theory. I certainly can’t critique it as others have done here. Yet, I can say that it is a pleasure to see a theory expounded where others can only seem to pick at the extremities. Let’s not lose the appreciation for such an elegant attempt at trying to make sense of our world. I definitely value the criticisms presented here. Would that they offered what they see as an error with what they see as excellent. But … science seems not to work that way. Great job, to you and Andy!
Thanks Bill
“Would that they offered what they see as an error with what they see as excellent. “
“They”? You do mean me, as everyone else kisses his ring.
I have been waiting for that exact treatment. I don’t even get to hear what people think are errors in my ideas because no one counters with facts, and very few have noticed the excellence.
My criticisms are at the very core of Javier’s hypothesis, not the extremities, which is his rejection of TSI as the main climate driver. He does not respond to the evidence I present in favor of TSI, a pattern he established as far back as his first articles.
I resent that Javier did not go through the stages I have gone through with my work, which is formulating research questions and models, making predictions, getting results, reporting the research at conferences and discussing it with professional scientists in the particular fields. No, he put himself on a pedestal, circumventing normal science procedures, and went straight for the book first. I am the only real peer review he’s gotten.
Everyone else is just kissing his ring over small potatoes.
I started my interaction with the science community in 2018 with two presentations, two in 2020, one in 2021, and two in 2022.
After eight years of continual research I was finally going to come forward on skeptical blogs last summer when Javier’s article hit.
I resent that Javier and his supporters can’t respect the steps I have taken, nor the quality, precision, and accuracy of my work and predictions; he has muddied the waters terribly.
Furthermore I resent that Javier Vinos was so extremely rude to Dr. Leif Svalgaard at WUWT a few years ago that he no longer contributes there.
What is really happening here is a double standard is being enforced upon skeptics by Javier. He gets his own rules, including a much reduced burden of proof for him and a much higher burden of proof for someone like me.
Bob Weber –
I am not going to agree or disagree with your opinion on TSI
Though a couple of notes
1) the AWG community claim is that TSI is non factor since TSI has been dropping since the 1950’s thus, the last 70+ years of warming cant be due to TSI
2) on the other hand TSI is up since the late 1800’s,
The question I have raised is how much a factor is TSI and if so, how much of a delayed effect is TSI. Seems the AGW advocates, consider TSI to be an immediate effect , turn the gas stove down and there is immediate cooling. On the other hand, since TSI is still higher than the 1800’s, is it still heating, just at a slower rate , and/or is the early 1900’s heat stored in the oceans and being slowly released over the last 70+ years?)
I havent gotten a good explanation, or at least a good explanation that I can understand.
I’m not responding because I’ve already responded several times, and it’s something that is widely accepted by the scientific community in the face of strong evidence. Changes in TSI involve too little energy to change the climate. This is why solar theories were abandoned in the 1970s when satellite measurements began. You are beating a dead horse. Even if I am wrong, you cannot be right and the answer lies elsewhere. Energy is what makes things happen in this universe, and that includes climate change.
I’ve been no ruder to Leif than he’s been to me, and as scientists we both enjoy a good fight. If he doesn’t contribute to WUWT anymore, it’s not because of me. Perhaps he has finally realized the futility of writing comments in a place where most people just want to express their partisan affiliation. Blaming me for Leif’s absence is no different than what you do with sunspots, the evidence is completely lacking. If you want to do science, you have to do research, not just look for correlations. In this case it would be easy to find Leif’s address and ask him before making unfounded accusations.
Joe, the oceans are not releasing heat, they are soaking it. Ocean heat content is increasing. The oceans always oppose climate change. They will release heat when there is cooling.
Jqavier’s comment – “Changes in TSI involve too little energy to change the climate. This is why solar theories were abandoned in the 1970s when satellite measurements began”
Javier – I realize that you were responding to Bob and not me, though that explanation makes sense. time for me to abandon my misunderstanding.
Bob …
I applaud the passion. Once in a while a fast ball high and tight is just business. Can’t have them crowding the plate. Used sparingly, it has the best effect.
I’ll say it again, I’m not a scientist. I come at this trying to learn and use the information to make the best decision I can for policy support. From where I stand, you and Javier, and Ulric, and Judith, and many others here are on the same team. It’s just competition as to who gets the ball to pitch that day. The other team? That’s easier. The CO2 team. Why easier? Because they control not just the greater narrative, but they keep a tighter lid on the internal narrative. They, generally, have greater mutual support. Their message is simple.
Javier’s WGK hypothesis fills a gap that I see as a main problem for your team. You’re limited by the science publishing establishment and the MSM. Any … any … publication that can get to the unwashed masses, like me, is welcomed and sorely needed. Judith’s book is long overdue. If you have a book, or papers, I’d love to read them. But a book reaches the masses better than a published paper. The format allows for better explanation and … repetition. Us small minded folk need things repeated. The other team … they have a nice simple message they keep repeating like an advertisement for cereal. Your team can only respond with ‘it’s more complicated than that’. And so you need ways to simplify the complicated message.
The WGK hypothesis is elegant, as it uses many trees in the forest of climate science to render the complex understandable. Is it 100% correct? Beats me. Do I care? Hell no. I expect the rest of the team to criticize what’s wrong, but compliment what’s good. Get it together, or your team is definitely going to lose.
“I’m not responding because I’ve already responded several times, and it’s something that is widely accepted by the scientific community in the face of strong evidence. Changes in TSI involve too little energy to change the climate. “
You are both deceitful and a hopeless enumerate. I have shown you this graphic numerous times and you most definitely have not responded to it.
https://i.postimg.cc/769RYf0b/S-B-Equation-and-Sun-Climate.png
There were 10.2 more watts of TSI in the 120 years from 1890-2010 than the 120 years before then, driving the 30-year average global SST higher by 0.43°C, the exact amount computed using Jim Hansen’s Planetary Temperature Equation, a modified Stephan-Boltzmann Equation.
Respond with a falsification or I will continue to believe you are avoiding doing physics calculations. You made so many unsupported claims regarding your hypothesis and earth’s energy budget, and no one but me called you out on it, that I have to assume that you have some inherent sense of entitlement that you don’t have to do any actual science work like calculations to verify anything, and that you can continue to slide on your over-inflated sense of superiority.
Javier: what you resist persists.
“You are beating a dead horse. Even if I am wrong, you cannot be right and the answer lies elsewhere. Energy is what makes things happen in this universe, and that includes climate change.”
Don’t lecture me about energy, I am an electrical engineer who for nine years did nothing but solely focus on and derive the energy source for climate changes. Your arrogance is showing.
Everyone decided against TSI more than 30 years before it could be even understood. Shame on you for not knowing that.
The fact is no one could have performed this type of calculation until as recently 2018 when PMOD TSI ended.
https://i.postimg.cc/769RYf0b/S-B-Equation-and-Sun-Climate.png
I just showed you again where the energy came from to drive global warming, TSI. You have no bargaining chips left Javier. You have been shown the evidence that I am right and the answer does not lie elsewhere.
If anything is dead, it’s you being brain-dead dense. You claimed the power of the Modern Maximum but you don’t even know what that power was or how it worked on the climate.
@Joe the non climate scientist
[1]”On the other hand, since TSI is still higher than the 1800’s, is it still heating, just at a slower rate , [2] and/or is the early 1900’s heat stored in the oceans and being slowly released over the last 70+ years?)”
Joe, the short answer is the TSI warming has been ongoing with any pauses/cooling due to various short-term solar slowdowns.
1. Yes, TSI is right now today still heating during current high sunspot activity and TSI, that started high sooner and is now stronger than the last solar cycle #24 in the 43rd month.
https://i.postimg.cc/Cx38Mp4N/Solar-Cycle-25-update-month-43.png
Which had and is having a predicted by me last year equatorial ocean heat content anomaly warming effect that has occurred as a pattern over at least the last 9 solar cycles.
https://i.postimg.cc/7hvjBJz5/Solar-Cycles-and-Tropical-Step-Changes.png
https://i.postimg.cc/NGZ9Q4M7/Sunspots-TSI-and-Eq-OHC-last-year-27-Jun23.png
Which had and is having a general global ocean warming effect following solar activity, TSI, ie, exhibiting solar supersensitivity, which means when solar activity increases, the temperature eventually follows, sometimes right away like it is doing now, although imperfectly due to ocean ASR upwell and storage time, and from irregular activity within/between solar cycles.
https://i.postimg.cc/sfhfndqm/Solar-Supersensitivity-in-2023.png
2. The second part of your question relates to ocean absorbed solar radiation (ASR) storage time, level of solar activity, and the decadal sun-ocean warming threshold of 95 v2 sunspot number, 120 sfu F10.7cm solar flux, and TSI threshold equivalents calculated for each radiometer based on the SORCE TSI value of 1361.25 W/m2.
ASR has accumulated ever since the early 1900s due to sunspot number exceeding this threshold. When you sum and detrend the cumulative SN>threshold, 95 SN*, you get the orange and dark red curves in the next figure 21(c), which indicates the cumulative SN and TSI over the decades that is net geo-effective for warming/cooling (ie above the threshold).
*This image was from my 2018 AGU poster, when I used 94 SN.
https://i.postimg.cc/8C0Nx1m5/Fig21-Solar-driven-post-1700-s-climate-shift.jpg
The 70-year Modern Maximum was the high-point, it was first calculated on the long-term running average, but activity was still high enough for warming during the cycle #15 preceding the 1935-2004 Mod Max to start the warming upward trend.
Even though the solar cycles are lower now and and the detrended sum SN>95 is negative going, there is the ocean heat reservoir residence time of 120 years still supplying heat, which is now being added to with new heat from this solar cycle.
@Bob Weber:
Where do you get the values for TSI going back as far as 1890? I share your disappointment that Javier hasn’t refuted your work, but I am skeptical that TSI can be measured to that degree of accuracy back to 1890.
My understanding has also been that TSI varies too little to account for more than a trivial change in temperature, but that changes that UV varies a lot more and affects the stratosphere and ozone layer which in turn affects jet streams much as Javier has outlined in the OP, and that is what drives centennial scale climate change.
Few people realize that the ozone zone in the stratosphere floats the circulation in the troposphere. Even in summer, this influence can be seen. The graphic shows large amounts of ozone in the tropopause in the north and moist ozone-free air in the south. The ozone wave pushes water vapor out of the tropopause, so this air is very dry. In such air, temperatures can change between summer and winter extremes.
https://i.ibb.co/9y6wqKv/gfs-o3mr-150-NA-f024-1.png
Of course, such dry air is conducive to fires in Canada.
Javier when will your book reaching a wider range of audience be available? I am part of this group as there is a lot of complicated terminology in your book. The climate is wayyyy more complex than I thought.
I can’t really give you a date, Walter. It should only be a few months, though.
The climate is one of the most complex systems we can investigate. That is why it is always surprising us. Nobody understands it, and those who have definite answers are lying and they know it.
“Nobody understands it, and those who have definite answers are lying and they know it.”
You just lied. You don’t know that, so you can stop lying.
Your passive-aggressive opinion was devoid of content.
The irony is you’re able to make an absolute statement that no one else can make an absolute statement, a double standard!
Another one of Javier’s ‘rules for thee, not for me.’
“You don’t know that”
Of course I know that. It is self-evident. The climate is too complex to be understood, especially at the present very inadequate level of knowledge. Richard Feynman said the same thing about quantum mechanics: “I think I can safely say that nobody understands quantum mechanics.”
The problem is that the Dunning-Kruger effect is rampant among people who study climate change.
I’m pretty sure I don’t understand climate change, and I’m wrong about a lot of things. I just hope that I am right about the essentials. But it is only a hope.
“The problem is that the Dunning-Kruger effect is rampant among people who study climate change.”
Look at yourself first, you are the easiest person to fool.
“you are the easiest person to fool.”
I know that. I have been trained not to trust my hypotheses. I’ve rejected hundreds of my hypotheses the moment the evidence didn’t agree with them. I would reject this hypothesis in a moment if I thought it is incompatible with the evidence and I would look for another one.
Anybody that knows me from my beginnings in climate science knows I did not think about this initially. It took me years to develop it, and all the while I was rejecting possibilities. My “Nature unbound” series here starting in 2016 does not mention this hypothesis because I hadn’t developed it back then.
Unlike you, I don’t care if my hypothesis is right or wrong. I only care about finding the truth, and if my hypothesis is wrong I am the first person who wants to know it, because I have no interest in sticking to a wrong hypothesis.
“I only care about finding the truth, and if my hypothesis is wrong I am the first person who wants to know it, because I have no interest in sticking to a wrong hypothesis.”
You think you are like this, but in reality your actions belie you.
Your hypothesis has already been falsified, but you stick with it.
You have not responded either to my criticisms or my TSI work.
So you are fooling yourself on all counts, and many others too.
Bob
“ Your hypothesis has already been falsified, but you stick with it.”
How has Javier’s hypothesis been falsified?
This story might be apocryphal but it’s the supposed genesis of the Dunning-Kruger effect when Dunning, a Cornell college professor, read about it.
In planning a bank heist a prospective robber had read how lemon juice could be used in creating invisible ink. Using some mysterious logic he decided to rub lemon juice over his face so that his face would be invisible and not be picked up by the security cameras. When apprehended by the police a few hours after his caper he said “But I wore the juice”
That’s exciting. I can’t wait. I have an unrelated question. I’ve taken a look at the temperature trends at my location (in a relatively rural station). Since 1975, winter minimum temperatures have gone up rather significantly. Is this related to the rapidly warming Arctic from the 1997 CS? Does that also explain why winter has warmed faster than the other seasons in the Northern Hemisphere?
“Since 1975, winter minimum temperatures have gone up rather significantly.”
Winter temperatures outside the tropics depend on the amount of heat transported poleward by the winter circulation.
In the 1975-1997 period, the vortex was stronger, less heat was transported to the Arctic and the midlatitudes had warmer winters. Since 1997 the vortex is weaker, more heat makes it to the Arctic and the frequency of cold winters has increased, much to the surprise of scientists, who do not know why as models did not predict it.
“A recent hypothesis is that the solar signal modulates heat and moisture transport to the Arctic, which explains its relatively small effect during a single solar cycle. However, when an anomaly in solar activity persists over several cycles, as it did during the 70-year modern solar maximum, its effect accumulates and has a large impact on the planet’s energy budget.”
Atmospheric humidity events into the Arctic won’t accumulate, but warm pulses of the AMO will, although the AMO can change fully from a cold phase to a warm phase in as little as half a solar cycle.
Note the rules at play, during the cold AMO phase, the colder AMO anomalies are always near solar cycle minimums, and during the warm AMO phase, the AMO is never colder near sunspot cycle minimums.
This phase reversal of temperatures versus solar cycles has been noted in UK temperatures, Greenland temperatures (Jason Box?), the NAO index, and other series.
The only possible explanation for the phenomena, is the shifting positions of the major lows and highs in the solar wind through the solar cycles.
Over the full envelope, the AMO remains locked to solar cycles, and as every other warm phase is during a centennial solar minimum, the long term mean AMO frequency has to be 54-55 years. The most recent 60 year and 70 year AMO envelopes are due to the previous centennial solar minimum being 130 years before the present centennial minimum.
The 1800’s should have had much shorter AMO phases.
https://www.woodfortrees.org/graph/esrl-amo/from:1880/mean:13/plot/sidc-ssn/from:1880/normalise
That’s exactly what it is. It’s the solar wind that affects pressure in high latitudes. The strength of this influence depends on other oceanic and stratospheric (QBO) cycles.
‘Pressure’ is a function of the gravity vector. It appears to also be effected by planetary conjunctions.
A good example is storm Ian. September 28th saw the close conjunction of, primarily, sun-new moon- earth and Jupiter.
Wiki here: https://en.wikipedia.org/wiki/Hurricane_Ian (see Meteorological history) gives a near 12hourly stages of its development each time the site moves under the conjunction line, where due to the Jupiter pull there appears to be a drop in barometric pressure. (I recall hearing on the US weather news saying the pressure drop at midnight on the worst night was quite abrupt. Midnight is right in line with conjunction).
There are other similar examples.
New Moon 25th Sept 2022, Jupiter opposite the Sun 26th Sept 2022. There was though a sharp uplift in the solar wind on the 27-28th Sept, which is a more likely candidate for cyclone intensification.
https://www.lmsal.com/solarsoft/ssw/last_events-2022/last_events_20220928_2358/index.html
Tidal effects will be very small compared to indirect solar forcing of Northern Annular Mode anomalies.
I looked at English daily temperatures through about 150 winters. Correlations with full and new Moon revealed a colder couple of days if it was already colder than normal, but with average and above average temperatures there was no apparent effect. There is a paper published which did the same study and came to the same conclusion.
The conjunction line is critical. Sites on earth approach and move away quickly, twice in a day. However the planets move slowly. The moon is the faster, and the time it is in conjunction it is very effective.
A second point is the planets orientation, especially when earth is on one side of all others. Then change of gravity vector and its tidal effects are more pronounced, including on the earth’s brittle crust. See effect of the planetary orientations for Feb 6th., with full moon in opposite of conjunction. Does not have to be precise conjunction but net resultant effect of all. There are may examples so there is something to it.
Gravity vector change though small has some effect on thermodynamics of water vapour in atmosphere, a throttling process.
The Climate Doomers are scaring the scientific rabble again. Seems they have an odd concept of “history.”
The Southwest United States is about to endure a heat wave that could rank among its worst in history — both for its intensity and longevity.
The heat wave will affect much of Arizona and New Mexico and build into interior California, probably peaking during the second half of next week. The National Weather Service office in Phoenix says it will “rival some of the worst heat waves this area has ever seen.”
https://www.msn.com/en-us/weather/topstories/extreme-heat-wave-bound-for-phoenix-and-southwest-could-be-worst-ever/ar-AA1dzj2j
@Jim2 – When is the “heat wave” expected to hit Arizona and NM? We’ve had some “weather” anomalies of late, e.g. June, normally our hottest month of the year (remember the 124 degree temp back in 1993(?), which typically precedes the Monsoon season that begins early July when the humidity and dew point both rise and the storms come from the south.
June of this year however, was different in that we had only one day of 100-degree temp, which was actually pretty nice! Everyone was noticing this cooler weather in June, commenting on it. July is here and the temperatures have hit new highs for this month — the 10-day forecast on my phone app calls for 110-115 degree temps, with continuing lower humidity and lower dew points. So what’s up? Are we having June temperatures in July? And what would cause that? Solar activity? El Nino? (Maps show a La Nina off the coast of southern California/northern Mexico.)
We always get “heat wave” warnings every day, but in actuality it’s just summertime in the desert! Nothing unusual. But observationally, a bit different in June and July this year.
SOI is again positive and trending upward.
https://www.longpaddock.qld.gov.au/soi/
The atmosphere in the South Pacific is not responding to the Niño 1.2 temperature rise because the polar vortex to the south is strong and generates easterly winds in the central equatorial Pacific.
How many times have these id eee ots predicted an ice free Arctic? Will they ever learn?
New research has moved up the time by which the Arctic Ocean is predicted to be free of summer ice.
A paper published Tuesday in the journal Nature has concluded that those northern waters could be open for months at a time as early as 2030, even if humanity manages to drastically scale back its greenhouse gas emissions.
“It brings it about a decade sooner,” said Nathan Gillett, an Environment and Climate Change Canada scientist and one of the co-authors of the study.
Gillett and his colleagues had noticed the growing differences between what climate models say should be happening to sea ice and what’s actually going on.
“The models, on average, underestimate sea ice decline compared with observations,” Gillett said.
https://www.cbc.ca/news/canada/north/arctic-sea-ice-1.6351508
What’s actually going on with sea ice:
https://i0.wp.com/www.climate4you.com/images/NSIDC%20GlobalArcticAntarctic%20SeaIceArea.gif?ssl=1
The pause is entering its 16th year. The gains in ice in Greenland this past June were also pretty impressive. Why does this stuff never make the news?
I’m a lay person and have listened to Valentina Zharkova and am wondering what you think about her ideas?
Her 400 year cycle is at full amplitude during the Sporer minimum, so she invoked a supernova as the cause of the decades of cold weather. That doesn’t put her loyal supporters off from her hero like status. Refuting Zharkova on social media can cause considerable upset with them.
She is wrong. She was shown to be wrong in her interpretation of past solar changes by Ilya Usoskin and she is wrong about solar cycle 25 activity. There is really not much more to it, In science is very common to be wrong. Good scientists accept it and move on.
Pingback: Solar Activity: Solar Cycle 25 Surpasses Cycle 24 - The Truth Central
The model below shows the action of the solar wind magnetic field at high latitudes. This action repels ozone, as a diamagnetic, outside the polar vortex and strengthens the polar vortex.
https://earth.esa.int/eogateway/tools/amps-model
Pingback: ‘Global Warming’ Morphs Into ‘Global Boiling’ as the Global Climate Hoax Turns Up the Heat - The Truth Central
Pingback: “Global Warming” Morphs Into “Global Boiling” as the Global Climate Hoax Turns Up the Heat – ConservativeNewsBriefing
Pingback: ‘Global Warming’ Morphs Into ‘Global Boiling’ as the Global Climate Hoax Turns Up the Heat – Allah's Willing Executioners
Pingback: AmericanThinker: 'Global Warming' Morphs Into 'Global Boiling' as the Global Climate Hoax Turns Up the Heat - wlvrns!
Pingback: The Lies that Scare – UN turns up the hysteria as people fail to show an acceptable amount of fear – UK Reloaded
Increase solar activity in the models and you get increased poleward ocean heat transport. How long would it take for that increased ocean heat transport including all the secondary effects to come to equilibrium? You could easily decrease the transport and still have warming as long as that equilibrium hadn’t been achieved.