
by Rud Istvan
There is no doubt that interglacials change sea level (SL). And that sea level rise (SLR) can be dramatic on millennial interglacial time scales.
That’s what happens when the vast Laurentide ice sheet (among others) melts. But sea level has changed relatively little in the past 7 millennia. We know from archeology that it rose somewhat in the Medieval Warm Period, dropped some during the Little Ice Age, and has been rising slowly since based on tide gauge records. This mostly natural variation is, from 1950-2000, about +1.8mm/year (reference follows below). That rate is no cause for alarm. We coped with it for the past century, and can cope with it for the next.
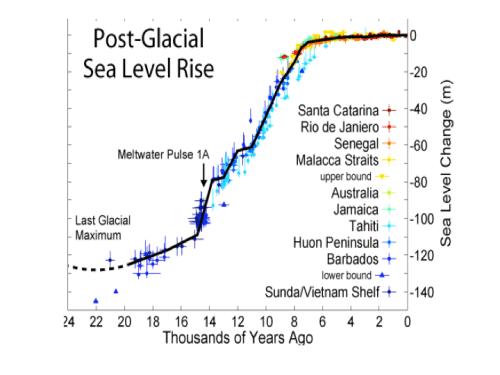
The anthropogenic global warming (AGW) question is whether SLR will accelerate into catastrophic AGW (CAGW) requiring urgent mitigation. Warmunists argue yes, with many alarming images such as National Geographic’s photo-shopped Statue of Liberty half submerged (which would require that all of Greenland and Antarctica melts before the next glaciation sets in). We do know that in the last interglacial (the Eemian) the sea level high stand was about 6.6 meters above present sea level, so the ice sheets did melt more with global temperature about 2C higher (and perhaps 8C higher in Greenland). This took about 3000 years to achieve, at a rate of 660cm/30 centuries, or 22 cm/century, or roughly 2.2mm/year. That rate is no different than the best estimate of present ‘true’ SLR found in what follows. A previous guest post Tipping Points argued there were no realistic concerns about sudden abrupt acceleration of SLR. This post discusses the same issue from a historical SLR perspective.
Consensus Belief
There are two parts to the SLR alarm meme:
- SLR is accelerating because of AGW.
- SLR will therefore become a big problem even if not one today.
Ergo, future AGW requires urgent mitigation. Hansen says up to 1 meter SLR by 2060 (and maybe more with tipping), so goodbye Miami Beach. The Obama administration uses occasional recent high tide flooding there to support his climate urgency– without revealing that Miami Beach is 2/3 fill dredged from Biscayne Bay, and is subsiding as the fill compacts and as the underlying Biscayne Aquifer also subsides as it is drained to provide Miami’s fresh water.
There are many seemingly authoritative graphics floating about that support the SLR acceleration alarm.
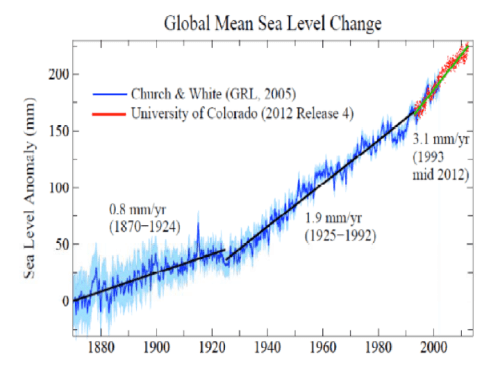
This seemingly authoritative graphic has been constructed out of two deceptions.
(1) Uses tide gauge records uncorrected for land motion. (C&W 2005 is actually doubly misrepresented: C &W data before 1950 is W,C,&G GRL 2006 [C&W 2005 is only 1950-2000], and there is no 1925-1992 reference period in the 2006 paper). C&W 2005 SLR 1950-2000 was 1.8 mm/year rather than 1.9 and was not accelerating. C&W used approximately 350 long record tide gauges for their ‘accelerating’ reconstruction. There are only 146 PSMSL tide gauges within 1000 meters of a differential GPS to correct for vertical land motion of whatever cause, and only about 70 of those are long record tide guages. So vertical land motion is NOT excluded in either C&W paper.
(2) Splice on satellite measurements since 1993 that fail the closure test below: observed SLR should roughly equal the sum of observed sea level contributions from thermosteric rise (OHC causes the estimated water column to expand as it warms) plus ocean mass increase (water volume from ice sheet losses).
Side comment: in the SLR literature, there are also two lesser possible SLR contributors: mountain glaciers, and groundwater extraction. Both are sufficiently uncertain and small that they are ignored in this post. There is little doubt that glaciers have been receding most places since 1900, for example in the Himalayas. But IPCC AR4 issued a retraction concerning its alarming conclusion that they would disappear by 2030. Most terrestrial groundwater is annually replenished; else water tables would fall. That which is not replenished (e.g. the Ogallala Aquifer) is de minimus in the context of global SLR. (Ice density at 0C is 0.9187, water is 0.9998, so if 365 Gt ice (roughly 365 cubic km) equals 1mm of SLR [reference below] then 1mm of SLR requires adding about 335 cubic kilometers of water. Ogallala withdrawals are about 26-30 cubic km/year.)
Tide Gauge SLR
The actual rate of sea level rise is uncertain, let alone possible detectable AGW acceleration. There are two basic uncertainties.
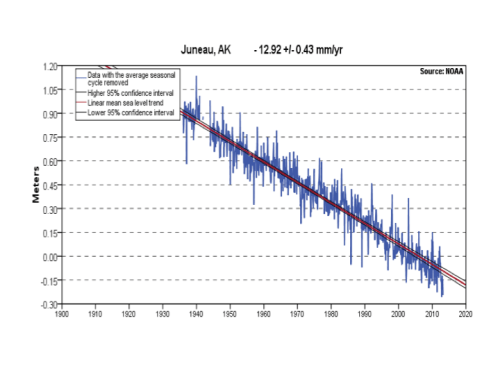
- SLR is inconstant because of multiannual changes in lunar tides (~18 year periodicy) and ocean currents/oscillations (~30-60 year periodicy). Tide gauges show this natural multiannual variability almost everywhere. So fluctuations over only few years should be discounted.
- SLR is locational because of geographic inhomogeneity. Land does not stand still thanks to plate tectonics, glacial isostatic adjustment (GIA), ground resource extraction (water, oil), and river delta sediment compaction (as in Bangkok). The NH is much better represented than the SH. One paper even said NH SLR is 2.0mm/yr, while SH SLR is only 1.1mm/yr. This peer-reviewed paper would be logically implausible to any 2 year old familiar with bathtubs and water.
SLR fluctuating and land not standing still are both illustrated by Juneau Alaska:
So, what is the ‘true’ tide gauge measured SLR? There are three ways to estimate this: some big average of a lot of tide guages hoping land motions cancel out (the Church and White example above, ~1.8mm/yr), model GIA corrected tide guages, and direct measurement differential GPS corrected tide guages.
There have been a number of papers that have used various subsets and time frames of the ‘stationary’ (GIA or dGPS corrected) PSMSL tide guages to infer more reliable estimates of SLR as noted by the IPCC. Past half-century estimates range from about 1.7mm/year to about 2.0mm/year, with little to no acceleration. The most relevant recent estimate is Mörner, 2.2mm/year from 1970-2010 during the period when AGW was supposedly happening. This seems plausible, as the average dGPS tide gauge SLR for Western Europe (2.2mm/yr), the US (2.1mm/yr), Japan (2.3mm/yr), and Australia (2.2mm/yr) over roughly the same period are all similar. Also proving the sea isn’t truly level, and dGPS isn’t completely accurate.
Satellite Altimetry
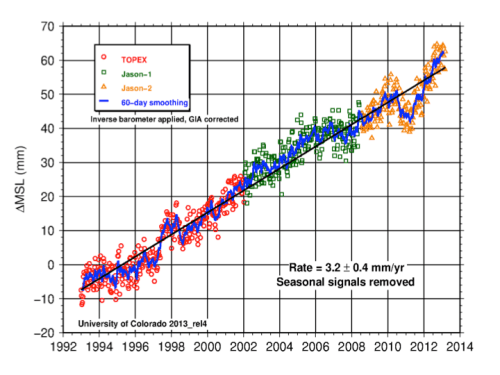
As the second chart above illustrated, satellite altimetry tells a very different story, and that story has ‘accelerated’ over time. The present NASA estimate from 1993 to the present is 3.4mm/year (with GIA +0.32mm/yr). So is the estimate from University of Colorado (with GIA +0.31mm/yr).
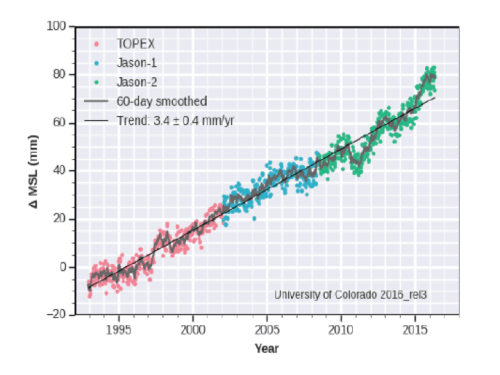
In 2012 it was 3.1mm/year. In 2013 it was 3.2mm/year, as the chart below illustrates.
The ‘acceleration’ arises from Jason-2. But the Jason-2 specification is for instrument stability not exceeding 1mm/year of drift.[i] The acceleration could just be instrument drift. Certainly there has been no causative change in global temperature; Jason-2 is flying during the infamous global warming ‘pause’.
Closure
The dGPS tide gauges do not agree with satellite altimetry by a factor of about (3.4/2.2) 1.5x. So which is more correct? SLR should roughly equal the sum of thermosteric rise and ice mass loss. Lets examine those components separately.
Thermosteric rise was estimated to be 1.23mm/year through 2003. Say 1.2.
Greenland’s ice loss depends on which decade, since the 1990’s lost less than the 2000’s. A peer-reviewed PNAS estimate for 2003-2009 is 243Gt annually equaling 0.68mm/year. (The official NASA conversion factor is 365Gt = 1mm, which would give 0.67) Other published estimates for multiple years since 2000 range from 0.66 to 0.74. Say 0.7 for closure purposes.
Antarctica is controversial. Perhaps the best estimate is the new dGPS estimated GIA correction to GRACE, which is 135Gt/year, or 0.37mm/year. Say 0.4.
The sum is 1.2+0.7+0.3 = 2.2mm/year. Cazenave’s independently derived estimate from several other references in NCC (paywalled, caption to figure 3) is also 2.2mm/year. This agrees precisely with the dGPS corrected SLR of 2.2mm/year. There is exact closure.
There is anything but closure with the satellite altimetry. NASA presently says on one web page that thermosteric rise is 0.8mm/yr, mass gain is 1.8mm/yr, and that SLR is 3.4mm/yr. NASA apparently does not realize that 0.8 + 1.8 = 2.6 ≠ 3.4. NASA climate stuff is seemingly off in a lot of places–temperatures, SLR, Antarctic ice loss. . .
There have been three attempts to reconcile satellite SLR closure. One set of three similar papers cherry pick short time frames when satellite SLR was less (2.4, 2.5, 2.4mm/yr, respectively), and throws in higher Antarctic ice loss contributions. [ii], [iii], [iv] A second argues that satellite altimetry signal processing is wrong (Topex in particular) so the satellite era is really only 2.6mm/year (but accelerating with Jason-2) with closure achieved using higher Antarctic ice loss contributions. The third argues that NASA’s +0.3 GIA is modeled wrong, and according to Peltier’s ICE-5g(VM2) GIA model it should really be -1 with corrected SLR (3.4 -0.3 – 1) 2.1mm/year and closure.[v] None of these attempts seem very credible.
Conclusions
Tide gauges cannot be relied on for short periods, or without vertical land motion corrections. Correctly used, they presently estimate about 2.2mm/year. That estimate closes nicely with thermosteric rise and ice mass loss. The satellite altimetry SLR used to assert SLR acceleration is inconsistent with tide gauge estimates and has a large closure p
[i] OSTM/Jason-2 Products Handbook, JPL ref. OSTM-29-1237 (1/20/2009)
[ii] Chen et. al., Contributions…to recent sea level rise, Nature Geoscience 6: 549-552 (2013).
[iii] Li et. al., Assessing the global averaged sea level budget from 2003-2010, Acta Oceanol. Sin. 32: 16-23 (2013)
[iv] Willis et. al., Global Sea Level Rise, Oceanography 23: 26-35 (2010)
[v] Peltier, Closure of the budget of global sea level rise, Quaternary Science Reviews (2009), doi:10.1016/j.quascirev.2009.04.004
JC note: As with all guest posts, please keep your comments civil and relevant.

Thanks Rud,
Much clearer now.
In the end the values discussed, whether 2.2 or 3.3 mm/yr are very small and suppose no risk for any reasonable policy decision timeframe. The acceleration cannot be demonstrated and if wrong in a few years the disparity between actual and expected rise will become obvious.
The problem is the total disconnect between the evidence and what is being published by alarmists like Hansen and echoed through the mass media, so a lot of people become convinced of the dangers of SLR.
I agree. The Hanson link in the post is just terrible nonsense. A model completely detached from reality.
Rud Istvan,
Thank you for this post. Clear and intersting.
Javier,
I agree. The cost over a century would be negligible.
The problem is the total disconnect between the evidence and what is being published by alarmists …
Hansen is a vocal critic of the sea level science groups.
What is being published is the evidence. Disbelief is not an argument. Grouping everybody with Hansen is not an argument.
The disconnect is between skeptics and the evidence, and it’s growing rapidly.
Since the actual numbers don’t work for you, you take the argument in another direction. You still got nothin’
I’ve been saying that for some time. Even with conceding the higher number to the SLR scaremongers, they still have nothing. 3.4 mm/yr is not a threat to civilization.
Adapting the Mediterranean to the rising waters in the Strait of Gibraltar.
https://youtu.be/9bbFyKE2DWw
The problem:
https://youtu.be/4vyn9njKt6w
For example the Mediterranean Sea
A natural barrier to stop hurricanes in Florida, the Caribbean Sea and the Gulf of Mexico and in turn regulate sea level.
https://youtu.be/9bbFyKE2DWw
https://goo.gl/n8eiQG
Tito, The bridge looks pretty cool but i don’t expect it’ll be built soon. There are some migration issues that need to be resolved first. There are also some very strong currents in the Strait, the environmental impact might be severe if they were severely constrained – although you could probably run turbines with them, which would make it okay then.
The National Geographic clip however, is a prime example of the unmitigated bilge spewed by the mass media – as mentioned by Javier in the comment above.
Quite interesting in fact. The Med is very (very!) salty, so the water sinks and flows on the bottom out into the Atlantic while fresher Atlantic water flows in on top. I wouldn’t mess with it.
From this article: http://datab.us/i/Strait%20of%20Gibraltar
It is estimated that, were the straits closed even at today’s higher sea level, most water in the Mediterranean basin would evaporate within only a thousand years,…
Thank you for an excellent article. I don’t trust satellite altimetry unconditionally. It measures the sea level mostly over ocean basins. Despite the fact that the ocean surface is far from flat – waves can be up to 29 m high – they claim an overall accuracy in tenths of millimeter. They also know that the Earth is not a sphere and adjust for a local shape of the “geoid”. I wonder how stable is the geoid? Let’s say ice accumulates in the Antarctica. That additional weight would push the whole continent down. Would that effect push the sea level up, partly compensating for the effect of the transfer of water to Antarctic glaciers?
CG, there are at least three problems with satellite altimetry that seem to compound each other. I believe the biggest is instrument drift not exeeding 1mm/yr, with locational repeatability to within 3mm (now two with better processing). That is the best that could be done at the time, and it raises a huge uncertainty monster. IMO, the ‘dip’ that Cazenave tried foolishly to expain (essay Pseudo Precision, on which this post is based) was probably just negative instrument drift for 3 years. The two multiyear upticks thereafter visible in the 2016 chart, interrupted by a downtick, look like instrument drift. Jason-2 was more sensitive but less reliable.
Second is the geoid. They try to map this off GRACE, but that is supersensative to GIA; see closure attempt 2. The sea level is not flat, it is higher over positive gravitatiinal anomalies, lower over negative anomalies (Grace did map that, and there is ‘sloshing’ just like sand piles are unstable.) Sat alt is the entire ocean. Gravitational anomalies tend to be in deep ocean, especially the western pacific (major subduction zones), and not along most coastlines. There are GRACE geoid anomaly maps available via Google images. So what Grace measures isn’t exactly equivalent to tide gauges.
Third is signal processing. See closure attempt 3. After all, sat alt is just the timing of return radar pulses. There are three main sub problems in the Jason-2 manual (fn. 1) 1. Waves, because troughs reflect better than crests. Jason -2 manual says a 2 meter average wave produces an error bias of 1-2 cm! They hope this averages out over time. 2. Troposphere water vapor, which changes the atmosphere’s index of refraction. More retards signal. They sense this in three microwave frequencies and apply a computed humidity correction. Residual uncertainty is still 1.2cm RMS error. 3. Electric charge in the ionosphere. More retards. Varies diurnally, seasonally, and with solar activity. At the nominal 2meter wave height. J-2 Manual says the Ku band ionosphere correction is accurate to +/- 0.5 cm. Again the strategy is to smooth over a large sample.
Big uncertainty monsters.
In the end, the result fails the closure test and NASA’s webpage doesn’t care. The answer they get is the answer they believe true, while asserting without any statistical support I could find that its uncertainty is just +/-0.4mm/year.
Got sat alt closure atempts 2 and 3 backwards in the preceding comment. Cannot even remember my own post after 1 day.
Given that waves are chaotic oscillations, their effect on measurement error should not average out over time. Rather the average should itself oscillate chaotically. These are sometimes called “strange statistics” in chaos theory.
NASA –
“The second component of the ocean height measurement is the range from the satellite to the ocean surface. Each spacecraft carries a radar altimeter that provides this information: the CNES Poseidon-3 instrument, the latest model on OSTM/Jason-2, emits microwave pulses at frequencies of 13.6 and 5.3 GHz.. To take a measurement, the onboard altimeter bounces these pulses off the ocean surface and measures the time it takes the pulses to return to the spacecraft. This measurement, multiplied by the speed of light, gives the range from the satellite to the ocean surface. After correction for atmospheric and instrumental effects, the range measurements are accurate to less than 3 centimeters. The range measurements are subtracted from POD-derived estimates of the satellite orbital height, resulting in ocean height measurements that are good to 3 centimeters (just over 1 inch) relative to the center of the Earth.
This accuracy figure pertains to a few-kilometer spot on the ocean surface directly beneath the satellite. By averaging the few-hundred thousand measurements collected by the satellite in the time it takes to cover the global oceans (10 days), global mean sea level can be determined with a precision of several millimeters.”
Notice the words “after corrections” and “averaging the few-hundred thousand measurements”.
The shape of the geoid in any case, is constantly changing,
Additionally, tides are not precisely regular, and cannot be predicted with accuracy. Even NOAA states that tides can only be predicted at locations where tide data has been collected.
I’ve mentioned before, 0.1 mm is close to four one thousandths of an inch (human hair thickness), and of course 0.01 mm is one tenth of this.
Even the NASA claim of accuracy to 3 cm (possibly theoretically possible, but I’m not even sure about that – colour me skeptical), is maybe misleading.
All the adjustments and averaging in the world cannot make fantasy into fact. Make your own assessment.
Cheers.
David, this is the first time I read that waves are chaotic oscillations. Could you please provide a link?
Mike – I have a bigger problem with the “ocean surface” part of “the range from the satellite to the ocean surface.” Rud addressed that. I also vaguely remember that they make certain statistical assumptions about the surface.
You will want to track the progress of Jason-3 and its calibration process. I haven’t seen the latest results but the initial results (early this year) for sea level differed slightly from Jason-2 although they have identical orbital paths and are only about 80 seconds apart. It would be interesting to know how the calibration process actually works (physical/software adjustments to devices and/or mathematical corrections to collected data).
Ultimately the two satellites will be shifted into parallel orbits (relative to their ground tracks) to increase the resolution of the data. At some point, you may be able to test your instrument drift theory as differential drift in the two satellites should begin to become apparent over time.
I have often wondered about the magnitude of the forces exerted on a satellite by solar wind and solar radiation pressure. I suspect that these are highly variable and very difficult to model.
The Nyquist-Shannon sampling theorem states that in order to avoid aliasing, an analog signal must be sampled at a rate that is at least twice the highest analog frequency component.
The Jason satellites have an orbital period of about 10 days during which they make 254 passes. So any given point on the earth’s surface is sampled once every 10 days by each satellite, or about once every 3.3 days.
High frequency waves whose wavelength is much smaller than Jason’s radar aperture will probably tend to average out within each sample. But lower frequency waves, such as lunar tides, will result in aliasing. Each time that Jason measures sea surface elevation at a particular point, that reading will be offset by the magnitude of the tidal wave and other low-frequency waves at that moment in time. To the extent that these waves are known and understood, they can be corrected for. But it seems to me that our limited knowledge of low-frequency waves would make it risky to simply assume that the aliasing effects will just cancel out if we take enough samples over a long period of time.
Imagine that a satellite passes over a building in Manhattan once every 3.3 days and measures the current elevation of the building’s elevator car. Imagine that the elevator car also contains an altimeter that continuously records the car’s elevation at 10-second intervals. The motion of that car is not random. People enter and leave the building in waves. There is a daily cycle. There is a weekly cycle, since most people don’t work on weekends. If the building has seasonal business, there may also be a quarterly or annual cycle. If we wish to know the mean altitude of the elevator car, we can use the in-car altimeter as our gold standard. But if we average the satellite data, with one sample per 3.3 days, how long will it take for the satellite average to converge with the in-car altimeter average?
Another way of approaching this problem would be to down-sample the Jason data by averaging only 1/2, 1/3, 1/5, 1/7, or 1/11 of the data points. I am using prime numbers in order to avoid alignment with natural harmonic frequencies. If the average computed using all of the data points is accurate, then an average computed using 1/2 of the data points should be nearly as accurate. If we get significantly different averages when we *decrease* the sampling frequency, that would suggest that we might get significantly different averages if we were to *increase* the sampling frequency.
Maybe you were getting carried away at a few points (“warmunists”?) but good article overall. I will take a look at Woppelmann, et al., but you might have been too quick to dismiss their surprising findings when you wrote:
What about density differences, OHC differences, shifting currents/wind trends? The fact that the Pacific Ocean is 20+cm higher than the Atlantic (Caribbean) side of the Panama Canal should warn us to be careful when estimating “global” average sea levels. But also to be careful when suggesting the global ocean rapidly levels out as if it were a single giant bathtub.
Please provide a link to a measurement of a sea level difference over Panama Canal. Does it take tides into account?
See FAQ #3: http://www.psmsl.org/train_and_info/faqs/
The tides are also significantly higher on the Pacific side.
Thanks.
Good point opluso, but differential SLR rates in NH and SH are measured over a long period, allowing plenty of time for “smoothing”
My basic problem with Woeppelman (othr than common sense) is that many of his SH dGPS tide gauges were in very tectonically active places. See The locational results table. There is a standalone .pdf of it googlable through images, labeled table 1, from a secondary publication. The more tectonically active, the more dGPS uncertainty bites. Remember 1D (VDOP) is better than 2D horizontal, but still has some uncertainty.
Oddly, Woeppelman did not include the CSIRO dGPS work for relatively stable Australia, and did not include a calculation of his own for Australia, perhaps because it would have challenged his published result. Or perhaps he did his own calculations and left them out. Dunno. There is no GRACE hemispheric gravitational anomally that could explain his result. Currents are doubtful give the large geographic diversity. Its one of those oddities that screams maybe not true
Opluso, warmunists were precisely defined with footnotes at the end of an essay in my ebook Blowing Smoke, with footnotes.
The term is meant as homage to former Czech president Vaclav Klaus in his 2007 book Blue Planet in Green Chains. (I am half Czech, sort of. The poorer former Slovakian side.) The background truth is Lysenkoism. The moniker fits warmunists perfectly.
Excellent post. I have had difficulty in the past reconciling many long term TG records with the 3.4 satellite trend. Those that are well above 3.4 can be explained by subsidence and groundwater abstraction. Those TG records with negative trends can be explained by isostatic rebound. But then there are many that should not be influenced by either process and they are in the 1 to 2 mm/yr range. Until someone can find fault with those on the ground data, I’m just accepting that they are a good represention of GMSL.
I appreciate your efforts, not only with this post, but in making comments that try to raise some common sense questions about claims that defy common sense.
showing
Equally important is the absence of any clear acceleration of the SLR rate in those very long term TG records. They just don’t show up.
CK, your s cond comment is IMO most important. There may or may not have been slight acceleration in TGs since 2000. There are two issues: 1. During the pause acceleration makes little sense unless from ocean natural variation (two sources noted in the post) is at work. After all, temps were not increasing this century unless Karlized. So where would increased melt and thermosteric rise originate? 2. There is known natural variation from lunar and ocean cycles. Detectible differences are within the estimate error.
Acceleration was mostly manufactured by appending sat alt post 1993, apples to oranges equivalent to Mike’s hockey stick Nature trick, resulting IMO from spurious sat signals equivalent to one Yamal larch and Bristle cone pines. A corrupted science pattern starts to emerge. See subcomment above for many gory details from the downloadable J-2 manual that were deliberately omitted from the main post.
Sunlight goes into the oceans. During the pause, less energy than normal came back out. The water expended.
Expanded.
Trenberth – it was either reflected back to space or it went into the oceans.
JCH, what does “normal” mean in your strong claim (or is it just speculation, hard to know the difference in climate science)?
Normal is roughly all of it comes back out.
It isn’t necessary for SSTs to be warming for the ocean to be warming on the whole. SSTs only need to be WARMER than the equilibrium state temperature from hundreds of years ago. Trenberth may well be a case of “be careful what you ask for because you just might get it” for the agw crowd. If AGW is real, the anticipated surface warming may never materialize…
Vuk has a graph down thread that shows that the rate of sea level rise looks an awful lot like the temperature rise (over the past century). It’s not a WARMING temperature that is needed for sea level rise, rather it is a WARMER temperature that is needed…
That SLR rates vary over time is apparent to everyone. What is not so evident is the analytic behavior of the trailing regressional trend used to estimate those rates. That metric is in effect a crude band-pass filter whose output at any time is highly dependent not only upon the length of the data series, but also upon the spectral signature of the underlying process. Alas, none of the different rates reported in the literature take into full account this purely mathematical aspect of the SLR estimation problem.
What might it do if they did take it into account?
It might temper their temptation to emphasize minor differences and to believe in any persistence of acceleration.
Dihydrogen monoxide, is very slippery stuff.
Yes Arch, Dihydrogen monoxide, slippery stuff,
risin’ ‘n fallin’, gettin’ into evertthin’, a real source
of fear ‘n guilt. Thx rud fer the long view.
Thanks for making this post accessible to the layman. Now I can say I have a basic understanding. Regarding bathtubs and the different NH and SH SLR rates, I’m reminded of the waterskiing team that couldn’t find a lake with enough of a slope on it.
TY. That was my goal. If you don’t have it, you might enjoy my ebook Blowing Smoke. This post is derived from one of 52 essays, all similar in style to this guest post. In fact, 13 of the essays were essentially previous guest posts. And a foreword from Judith herself.
Had not heard the waterski team joke before. A definite keeper.
Sea level rise can be different for each hemisphere if the water temperature for the whole column is changing at a different rate. Imagine a set up where the Southern Hemisphere water mass below the thermocline is gradually cooling while idem in the northern hemisphere is gradually warming….sea level change will be very different.
This is why I support including the geothermal energy flux into the sea temperature reanalysis so we can get a better idea of the overall system behavior.
That would require a temperature difference between NH and SH equal to (2.0-1.1) 0.9 thermosteric rise/1.2 ocean overall equal 75% every year, for years. ARGO sees nothing of sort. See my subcomment upthread to opluso for my explanation.
I didn’t write that it was rising differently. I merely stated it could. The ocean is much larger than a bathtub. This is why it’s fairly easy to track El Niño using sea level change in the pacific. It’s also the reason why Funafuti has occasional high sea level stands. The water gets really hot around Funafuti.
“This is why it’s fairly easy to track El Niño using sea level change in the pacific.”
Such changes are more closely tied to barometric pressure than OHC – but you knew that, right?
Jason 1 trends in SLR are dominated by La Ninã conditions… winds have stacked water in the Western Pacific:
http://www.aviso.altimetry.fr/fileadmin/images/data/Products/indic/msl/MSL_Map_J1_Global_IB_RWT_NoGIA_Adjust.png
Jason 2 trends in SLR are dominated by the current El Niño:
http://www.aviso.altimetry.fr/fileadmin/images/data/Products/indic/msl/MSL_Map_J2_Global_IB_RWT_NoGIA_Adjust.png
Hell no, i didnt, i thought it was the water temperature.
Compare 2mm /year of sea level rise with a warning, “that the world,” says investment guru Larry Edelson today (‘What the Heck Is Going On?’) is, “breaking apart at the seams… new wars and new terrorist groups in the Middle East,” not to mention, the EU will, “start to break apart like an eggshell.” It’s time for the global warming alarmists to stop selling American down the river and begin shoring up the economy from the looming disaster of the Leftist policies that have driven the EU to the brink.
Waggy
Anyone reading edelsons articles will be able to see why the corrupt inefficient and democratically challenged EU has been given the boot by us Brits. I only hope we can disentangle ourselves in time to stop us being dragged further into the mire
Rud amply illustrates here that agw is of trivial concern. We have far more urgent and worrying things to worry about.
Tonyb
The big scare comes of course from Stefan Rahmstorf, he scarese the world with the West Antarctic Ice Sheet collapse. We’ll see shortly…
http://members.casema.nl/errenwijlens/co2/dcvsdenhelder.gif
From that graph I conclude Prof Rahmstorf will retire before 2050.
+1
However, satellite-based GMSL estimates do not include an allowance for potential instrumental drifts (bias drift). Here, we report improved bias drift estimates for individual altimeter missions from a refined estimation approach that incorporates new Global Positioning System (GPS) estimates of vertical land movement (VLM). In contrast to previous results (for example, refs 6,7), we identify significant non-zero systematic drifts that are satellite-specific, most notably affecting the first 6 years of the GMSL record. Applying the bias drift corrections has two implications. First, the GMSL rate (1993 to mid-2014) is systematically reduced to between +2.6 ± 0.4 mm yr−1 and +2.9 ± 0.4 mm yr−1, depending on the choice of VLM applied.
Hay – 1900 to 1990 – 1.2mm/yr
Watson – 1993 to 2014 – between +2.6 ± 0.4 mm yr−1 and +2.9 ± 0.4 mm yr−1
AVISO – Jason 2 – 2008 to present – 4.49mm/yr
ristvan
Thanks very much.
If the sea level CAGW meme can’t show damages beyond natural variation such as the Fukushima uplift due to seismic activity the entire spend lots of money for precautionary impacts falls apart.
How much due to seismic and how much from groundwater extraction based subsisdence both overwhelm the signal from acceleration.
A good article.
thanks again
Scott
Errata as I reread the post.
1. The last sentence was chopped as posted: p=> problem.
2. Somehow in the post gauge got mispelled guage a few times. As submitted as .docx, all gauge. Oops.
3. A real but minor goof. Closure should read 1.2+0.4+0.4 (not 0.3) = 2.3. Cazenave is 2.2. Close enough for evening amateur work but should not have happened at 10 pm. It still closes within uncertainty; NASA does not.
4. Two intended links are underlined but not highlighted in blue. If they are inoperable, google fu will lead you to them quickly.
can’t quite follow. if you can make the changes to your original doc using msword markup i can make the changes
on its way. Then delete errata comment as nobody but me picked up on any. Why this stuff is much better than peer review.
New and longer tide-gauge re-
cords have become available since the AR5. Updates of two of
the GMSL reconstructions used in the AR5 give 1.77±0.28
[15] and 1.9±0.3 mm year −1 since 1900 <b<(and 3.1± 0.6 mm year − 1
for 1993 to 2009)
“There is a good agreement between the
rate of sea level rise (3.2 ± 0.4 mm·yr −1) calculated from satellite altimetry and the rate of 3.1 ± 0.6 mm·yr −1
from tide gauge based reconstruction for the overlapping time period
(1993–2009).’ – Jevrejeva
Jch
Was there supposed to be a link in your blue wording?
Tonyb
We use 1277 tide gauge records since 1807 to provide an improved global sea level reconstruction and analyse the evolution of sea level trend and acceleration.
In summary, recent analyses confirm the twentieth century sea level rise, with some analyses showing a slightly smaller rate before 1990 and some a slightly larger value than reported in the AR5. There is now more evidence of an acceleration in
the rate of rise.
The Jevrejeva paper……”We estimate an acceleration of 0.02+-0.01mm yr….” Big Kahuna error bar.
Also,”….. gives an acceleration of 0.001mm/yr, which is much smaller than the 0.009 mm/yr reported by Church and White (2011). Teeny weenie estimates but a major difference with another SWAG result in another paper.
I don’t highlight the numbers for any inconsistencies. But in their insignificance, one has to ask the question whether they really know what they doing.
Here is an interesting correlation of CO2 level change (Mona Loa) and MGSL change (CSIRO data). The data plotted is for 1960-2014. The y-axis for CO2 is made so that the two data sets overlap. The 2nd degree equations are then extrapolated to year 2100. This graph IS NOT intended to indicate that CO2 level CAUSES the MGSL change! Just that CO2 level can be made to mimic MGSL change and do it well! The projections are about 0.5 meter of MGSL increase and about a 280ppm CO2 increase at 2100 from the polynomial extrapolations (based on the data for the past 55-years).
http://pages.swcp.com/~jmw-mcw/Curry_CO2_and_MGSL_projection_of_last_50_years_data.jpg
Clicking the fig gives the updated version with the rate of MGSL rise every decade (slope: 3.2 mm/y at 2010 to 7.3 mm/y at 2100). Even with these increases in rate (if they actually were to hold to 2100), a 0.5m-rise in MGSL during the next 86 years hardly seems catastrophic!
Association between natural global events may exist even when current understanding of such events has no convincing physical explanation
http://www.vukcevic.talktalk.net/SLR-MD.gif
Reblogged this on TheFlippinTruth.
Revisiting the contemporary sea-level budget on global and regional scales
Dividing the sea-level budget into contributions from ice sheets
and glaciers, the water cycle, steric expansion, and crustal move-
ment is challenging, especially on regional scales. Here, Gravity
Recovery And Climate Experiment (GRACE) gravity observations
and sea-level anomalies from altimetry are used in a joint inver-
sion, ensuring a consistent decomposition of the global and re-
gional sea-level rise budget. …
https://pbs.twimg.com/media/Ca6xEpxW0AEcRFm.jpg
The pie chart map demonstrates that regional sea level changes are what really matter. These are driven by regional temps, currents, winds. Our present state of knowledge (e.g., climate models) cannot predict very far into the future in this regard.
And here I thought we are all bunched up like too many farm kids in a bathtub.
As for the future, it’s simply not that hard.
“As for the future, it’s simply not that hard.”
Daftest comment I’ve seen this year.
In the spring of 1836 my ancestors planted corn on my farm in Missouri. Summer followed and the corn grew. I suspect it still works.
NAS has an upcoming webinar (and report) on decadal scale natural variability. I wonder if it includes SLR? Y’all be there.
http://us4.campaign-archive1.com/?u=eaea39b6442dc4e0d08e6aa4a&id=f77d2cc717&e=1fb63d8b69
The satellite record begins during the last gasp of the positive phase of the PDO index. Blue, cold natural variability working against warming, dominates the record:
http://www.carbonbrief.org/wp-content/uploads/2016/06/NOAA-PDO-Index.png
The PDO went positive in 2015. Note the large departures from the trend… hot natural variability working for warming; cold natural variability barely noticeable:
http://www.aviso.altimetry.fr/fileadmin/images/data/Products/indic/msl/MSL_Serie_MERGED_Global_IB_RWT_GIA_Adjust.png
Repeatedly, people will announce that what really matters most is the trend of something or another over the last 2 years. Summer Arctic ice will be gone by 2013 (or 2017 at the latest); kids will grow up without knowing snow; the Kilimajaro ice cap will soon be gone. Here is your stab at the exercise. Maybe you will be proved true in 10 years time — if so, please be sure to remind us.
Mechanism; physics… versus, hopefully 10 years will change the subject by providing a cooling miracle… like the stadium wave. Well, it’s waving… for my side.
Until then I imagine you’ll keep wearing your rubber boots and little inflated arm floats to bed every night.
“Until then I imagine you’ll keep wearing your rubber boots and little inflated arm floats to bed every night”
And sleeping on a rubber sheet…
This is all you two little chitheads have… lol.
I went to NOAA tide gauge data, all the sea level rise is linear even going back to 1848. I looked through hundreds and could find no acceleration from CO2 anywhere.
http://tidesandcurrents.noaa.gov/sltrends/sltrends.html
Yup. Said the same thing using just the PSMSL subset. SLR acceleration is a warmunist artifact similar to Mann’s hockey stick.
Shhhh … Don’t let JCH hear you say that. He might start thinking he’s paranoid.
This is from AR5:
“However, fitting a quadratic term to tide gauge data after 1920 results in highly variable, insignificant quadratic terms (Rahmstorf and Vermeer, 2011), and so only studies that use data before 1920 and that extend until 2000 or beyond are suitable for evaluating long-term acceleration of sea level.”
“A long time scale is needed because significant multi-decadal variability appears in numerous tide gauge records during the 20th century (Holgate, 2007; Woodworth et al., 2009, 2011; Mitchum et al., 2010; Chambers et al., 2012). The multi-decadal variability is marked by an increasing trend starting in 1910–1920, a downward trend (i.e., leveling of sea level if a long-term trend is not removed) starting around 1950, and an increasing trend starting around 1980. The pattern can be seen in New York, Mumbai and Fremantle records, for instance (Figure 3.12), as well as 14 other gauges representing all ocean basins (Chambers et al., 2012), and in all reconstructions (Figure 3.14). It is also seen in an analysis of upper 400 m temperature (Gouretski et al., 2012; Section 3.3.2). Although the calculations of 18-year rates of GMSL rise based on the different reconstruction methods disagree by as much as 2 mm yr –1 before 1950 and on details of the variability (Figure 3.14), all do indicate 18-year trends that were significantly higher than the 20th century average at certain times (1920–1950, 1990–present) and lower at other periods (1910–1920, 1955–1980), likely related to multi-decadal variability.”
“Thus, while there is more disagreement on the value of a 20th century acceleration in GMSL when accounting for multi-decadal fluctuations, two out of three records still indicate a significant positive value. The trend in GMSL observed since 1993, however, is not significantly larger than the estimate of 18-year trends in previous decades (e.g., 1920–1950).
What I am reading is that long time frames are being used. That there are something like 60 year cycles to consider.
Yup. Actually roughly 18 and 60, per the post. So any tide gauge accerleration 9 years or less is automatically suspect.
Satellite series likely includes the “cycle’s” slide to negative phase, and the initial recovery.
So this is why we have to squint to find sea level rise along geologically stable NSW coastline. Thanks for explaining that, Rud.
It is better to sum slow trends over longer periods where they become more robust. For example for 1900-1950 the rise was 70-80 mm. For 1950-2000, the rise again was 70-80 mm. For the 25 years since 1990, the rise again is 70-80 mm. That is, in the last 25 years the rise is already as much as it used to be in 50-year windows, which is a doubling of the 20th century average rate.
Let’s take 75 mm instead of 70-80 mm. 75 mm in 50 years is 1.5 mm per year, in the whole 20th century. That’s 15 mm in 1990-2000. Then another 60 mm to 2015, 4 mm per year. Jim, it is not a doubling, it 2 2/3 times as much. That number is surely more robust than official estimates.
So, you are not disputing 75 mm since 1990. This is a critical point to acknowledge for the acceleration. Non-acceleration would be more like 35-40 mm in this period. It’s a big difference and well outside error bounds.
I love your creative use of overlapping intervals. It reminds me of an old story of a guy asking for a raise. The boss looks at his papers and says: You know, the year has 365 days. You only work 8 hours a day, that’s 1/3, yielding 122 work days. There are 52 weeks in a year, 104 weekend days when you don’t work, that leaves 18 days. You had 2 weeks of vacation, that leaves 4 days you actually worked. And you want a raise?
Good grief – where do I start showing the holes in this?
1. you shortened the period by half, thus not apples-to-apples
2. you didn’t show 25 year periods 1900-25, 1925-50 etc
3. you didn’t show 1965-2015
4. 1950-2000 was the same as 1900-1950, but 1990-2015 was twice as large. So it must all be in the last 15 years then?
5. you didn’t cite a source
“It’s a big difference and well outside error bounds.”
Only if you can show (you didn’t) that other 25 year periods are 1/2 their 50 year periods.
6. If there is a 60 lunar cycle (there is), the shorter period may be only the “upswing” and no the following “flattening” (or down trend). You ignore this to claim the sky is falling.
I am not saying you are wrong – I am saying you didn’t convincingly show you are right.
I chose three periods when people don’t dispute that the sea level rise was 70-80 mm, an easily measurable increment. It just so happens that the last of those three was half the length of the other two. How long will the next 70-80 mm take? Probably much less than even 25 years at the rate it is accelerating.
“Probably much less than even 25 years at the rate it is accelerating.”
It isn’t accelerating.
You’re making stuff up again.
“Probably much less than even 25 years at the rate it is accelerating.”
As I said, you didn’t convincingly show it IS accelerating.
Nor did your reply respond to any of my concerns.
Presumably, if you even bothered to look at the data again, it didn’t show what you wanted it to, so you are now in denial that there even is a problem with your method.
Thanks for playing.
You haven’t yet said which of the numbers you disagree with, because they show an acceleration. The last 25 years has twice the average rate of the last century. Yes?
“It is better to sum slow trends over longer periods where they become more robust.”
“The last 25 years has twice the average rate of the last century.”
Interesting juxtaposition, is it not?
And still you don’t show any other 25 year period – let alone all of them – to compare against.
Once again, I am not saying you are wrong, I am saying you do not make a fair comparison, thus the argument is not convincing.
It seems clear at this point that you won’t show other 25 year periods – one can only assume that doing so would undermine your argument.
Nor can you fairly say I should show them – you didn’t even mention, let alone cite, a source.
Your turn…
Very well done, Rud. The only thing I might add is that gravity anomalies occur along convergent margins whether or not those are also continental margins. And, there are anomalies wherever there are structural basins, as along the California coast. Satellite orbits are also affected by gravitational anomalies, more for low-orbits. But NASA is well aware of that.
Regarding the correlation of magnetic anomalies with sea-level rise – as the magnetic field is thought to be caused by fluid flow within Earth’s outer core, it would make sense that Earth tides that are sufficiently long period to distort the shape of the mantle-core boundary could affect the magnetic field strength. And, Earth tides can affect sea level. This is just off the top of my head; I haven’t really thought about this before. Someone would need to think a bit more about it to decide the mechanics of it, and if the correlation should be positive.
Rud Istvan ==> In my research on the topic, I checked this page for data on Jason 3.
Quoting the Mission Summary:
“The primary instrument on Jason-3 is a radar altimeter. The altimeter will measure sea-level variations over the global ocean with very high accuracy (as 1.3 inches or 3.3 centimeters, with a goal of achieving 1 inch or 2.5 centimeters). Continual, long-term, reliable data of changes in ocean surface topography will be generated and will be used by scientists and operational agencies (NOAA, European weather agencies, marine operators, etc.) for scientific research and operational oceanography for the benefit of society.”
That satellite was launched January 2016. They hoped to eventually be accurate to 1 inch or 2.5 cm.
I am mystified as to how they achieve single digit millimeter precision with such an instrument.
Have you written them and asked?
IF they are now quoting such precision, surely they have published how they reach it, given that the initial stated goal was > 10 times this amount.
Given the problems that satellite data has in terms of constructing global temperature trends, is it surprising if it also has problems in terms of constructing global sea level trends?
I doubt that ‘satellite data is the best data we have’ as Judith Curry said when she was talking in front of Ted Cruz. Instrumental data and tidal gauge data seems more robust and reliable.
-1=e^iπ ==> I have done quite a bit of research on sea level and tide gauges. Tide gauges are terrific for monitoring Local Relative Sea Level to the accuracy needed to keep harbors and commercial sea lanes open and safe — and to provide the data to supply accurate tide predictions for those purposes. They are good for measuring gross changes in relative sea level.
The problems arise when one realizes the need to factor in the movement of the land mass itself (tides are where the sea meets the land). The land is itself in motion — up, down, east, west, north, south. To measure that NOAA has established the CORS network — a network of Continuously Operating Reference Stations — high accuracy GPS monitors.
For Relative Sea Level, the movement of the land doesn’t matter particularly (unless one is looking for answers to the “Why?” question). If RSL is rising, then it is rising.
For measuring changes in the actual level of the LOCAL Sea Surface in relation to the center of the Earth one must know if and in what direction the land itself is moving.
I did an analysis of this for NY City in relation to Hurricane Sandy for WUWT some time ago – see here.
There is something odd about the claims NOAA makes on measuring sea levels by satellite — they use instruments accurate to 1″ and arrive at average sea levels claimed accurate to 1 or 2 mms.
@ Kip – But isn’t there so much tidal gauge data that you can do all sorts of statistical techniques to account for land rise, even without GPS data? Like treat local sea level rise as global sea level rise – local land rise + error and then apply conditions such as local land rise over the Earth integrates to zero and is a smoothly varying field in order to estimate global sea level rise.
Reply to -1=e^iπ ==> There is no such thing as Global Sea Level Rise in a sense that would allow such a thing. Satellite measurements show that the trends in absolute sea level rise are not even around the world — as much as we would like to believe in the “bathtub ocean” that does not match the reality of measurement. The sea rises faster in some places than others, there are humps and dips in the oceans.
The NOAA CORS project shows quite simply that the land in some places is subsiding and in other places rising. Generally, for the North East US coastal region places north of Boston or so are rising, and south of Boston or so are subsiding — sinking — getting closer to the center of the Earth. This particular effect has to do with the last melting of the great ice sheets up around the Hudson Bay, as the weight has been lifted, the land is “spring back up” (on a geological time scale). This levers down the area to the south. (obviously simplified).
Without known the motion of the land, one can not tell if the water is rising or the land is sinking, and how much each factor contributes.
If you own sea front property, you don’t care which is which — you only care the the water level is rising in relation to your front porch!
A millimeter is a very small bit — a US penny is 1.5 mm — a US nickle is 2 mm. Global Sea Level Rise is believed to be in the 2mm/yr range long-term, maybe 3 mm/yr over the last ten years or so.
See the latest Jason 3 sea level map HERE. Note that the scale is in CENTImeters — not millimeters — huge humps and dips.
Why do you find it odd that the Jason 2 and 3 maps are scaled in centimeters?
The maps are of the sea surface height anomalies. Centimeters is fine. Your issues are not real concerns.
Ever read the book Limits To Growth? It was a textbook my senior year at Cal in 1972-73. Misunderstood at the time, it was concerned with global populations and food resources
If no globally effective detoxification response of our air, water and soils was under development by 1975, “Overshoot and Collapse” from starvation would become obvious about 2030.
That research, by a group of MIT professors, was updated sometime prior to Fukushima. The Collapse would occur no later than 2024.
Nothing was said about global warming, climate change, pandemics, mass migrations or conflicts between the “Haves” and the “Have Nots” for whatever uncontaminated resources remained; just global starvation from contaminated water and food.
That process have begun. There are signs of it all over the planet, from first born Orca dying from the toxins contained in there mother’s milk, corals dying in Great Barrier Reef, murres dying along the Alaskan coast to the sea life forms in the northern Salish Sea declining from 5,000 to 4 since Fukushima.
The Tipping Point for beginning corrective action was 1975. Whether we drown, starve, or get baked, broiled or fried, we’ve not enough time remaining to adapt to, evolve and survive that which has already begun.
You are lost.
From what I have just read Donald John Trump, is not at all worried about SLR.
http://nypost.com/2016/07/21/donald-trumps-rnc-address-could-mark-the-start-of-an-american-revival/
Will you be, Willard?
WIBBLE!
I had to read it as a freshman at Maryland about the same time period.
Here is a piece of advice. Don’t smoke a bowl before reading, unless your objective is to be entertained buy the ludicrous claims in the book.
How would your characterize our President and the EPA’s actions or lack of action about your concerns?
afonzarelli | July 20, 2016 at 8:49 pm |
“Vuk has a graph down thread that shows that the rate of sea level rise looks an awful lot like the temperature rise “
Association between naturally occuring global events may exist even if the current understanding of such events has no convincing physical explanation for it.
This graph has temperature veariables (global & N. Atlantic) incorporated
http://www.vukcevic.talktalk.net/SeaLevel.gif
(magnetic field change refers to the area of the NE Canada centred on the Hydson Bay)
Squiggly line matching is now what is considered state-of-the-art-cutting-edge-takes-thousands-of-programming-hours-climate-science.
Andrew
There is the strange case of S J Holgate 2007.
https://www.e-education.psu.edu/files/earth540/file/2006GL028492.pdf
“Nine long and nearly continuous sea level records were
chosen from around the world to explore rates of change in
sea level for 1904 – 2003. These records were found to
capture the variability found in a larger number of stations
over the last half century studied previously. Extending the sea level record back over the entire century suggests that
the high variability in the rates of sea level change observed
over the past 20 years were not particularly unusual. The
rate of sea level change was found to be larger in the early
part of last century (2.03 ± 0.35 mm/yr 1904 –1953),
in comparison with the latter part (1.45 ± 0.34 mm/yr
1954 – 2003). The highest decadal rate of rise occurred in
the decade centred on 1980 (5.31 mm/yr) with the lowest
rate of rise occurring in the decade centred on 1964
(1.49 mm/yr). Over the entire century the mean rate of
change was 1.74 ± 0.16 mm/yr. C”
These “wild ideas” came to an abrupt end in 2008. With the help of his friends: Woodworth PL, White NJ, Jevrejeva S, Church JA, Gehrels WR, he manages to arrest himself.
http://onlinelibrary.wiley.com/doi/10.1002/joc.1771/epdf
Science progresses.
nobodys knowledge
Whilst writing a sea level article of mine in 2011 I exchanged a large number of emails with S Holgate on ancient and modern sea level rise. Without wishing to disclose a private conversation I will make a few general comments he said were not private.
He was generally sceptical of models, had concerns about the paucity of data and how it was interpreted. He reckoned that sea levels had been rising for several hundred years and that sea levels would rise further and faster in the warming world we are experiencing than a cooling one. Both thermal expansion and glacier melt were somewhat difficult to interpret by GCM’s.
He thought that if the world continued warming that sea levels would rise faster in the next century than it did in the previous one.
He was of the opinion that sea levels probably rose faster in the first half of the 20th century than the second half but the differences were so small that it could be interpreted either way.
Hardly ‘wild ideas’ which, as the exchanges were in 2011, certainly did not come to an end in 2008.
Personally, I do not like global averages as each ocean basin has different characteristics and issues of land rising or falling. Also everyone is dancing round basically one set of tide gauge data, several of which had moved during their life span whilst others had disappeared.
Generally, temperatures have been rising for some 300 years and it is not unreasonable to expect that there is some relationship with glacier melt and thermal expansion and consequently sea levels have risen also. However they fell during the LIA and had high points around 1600Ad, 1200AD and Roman times.
tonyb
Tonyb
I look for your comments. Any thoughts on Sea level II article from Holecene to Romans to next phase in middle ages and on to modern from the Little Ice age?
The projected CAGC damages are mostly from coastal changes. 1-2* C will not impact much of the world except the Arctic will have space for the millions of climate refugees and the Russions will enjoy warmer winters.
Might also get more trees as the boreal forest move into the tundra.
Scott
Scott
I have lots of information on sea levels and will write them up in due course, although new info constantly presents itself.
I need to finish off my CET reconstruction first covering the 13th century which in itself gives markers on sea level changes.
tonyb
Thank you for the answer. I too look foreward to a continuatin of your sea level article. I must say I liked the idea of Holgate to pick some representative gauge stations and adjust for land rise/fall. The use of models to adjust for GIA give different results. So what is the trouble to use gps data to correct nearby stations? For me it is common sense. Where did Holgate fail? I think the critics that he had too few gauge stations is not trustworthy. It is obvious that the scientist establishment did not like his findings form 2007 and had to debunk them. I would like to know if you have more information on this tonyb
nobody’s knowledge
In writing my sea level article, which involved collecting both very detailed data as well as more general material that needed to be checked, I became aware of two things.
Firstly the sea level community is very small and secondly that there is great competition between many of them. They each have their own version of the truth, with those that support the IPCC view, or one even more alarmist than that, shouting the loudest and trying to diminish the credibility of those with more moderate views
. As a result of all this I would tend to discount the wilder material from such as Rahmstorf who, to my mind. has constructed models of past and future scenario, which are difficult to follow based on the data.
It appears to me that since the rapid rise during the early part of the holocene, that sea levels oscillate around a mean average by some 1 or 2 metres. I can not see the complete stability until recent years that some claim for sea level and temperatures
Hence I believe in the high water stands I have mentioned, but I need more data before I can connect them up properly. As I say, a global average probably has less merit than regional or more local ones, as land changes are such a huge factor
tonyb
After Holgate wrote the 2008 paper, he was the lead author on:
New Data Systems and Products at the Permanent Service for Mean Sea Level
Sea-level rise remains one of the most pressing societal concerns relating to climate change. A significant proportion of the global population, including many of the world’s large cities, are located close to the coast in potentially vulnerable regions such as river deltas. The Permanent Service for Mean Sea Level (PSMSL) continues to evolve and provide global coastal sea-level information and products that help to develop our understanding of sea-level and land motion processes. Its work aids a range of scientific research, not only in long-term change, but also in the measurement and understanding of higher frequency variability such as storm surges and tsunamis. The PSMSL has changed considerably over the past 10 years, and the aim of this paper is to update the community about these changes as well as provide an overview of our continuing work….
The papers based upon PSMSL products clearly show a greater rate of SLR in the 2nd half of the 20th Century than in the first half. The most prominent one being Carling Hay’sProbabilistic reanalysis of twentieth-century sea-level rise.
Which shows a distinctly lower rate of SLR in the 1st half of the 20th century:
http://www.realclimate.org/images//haysl21.jpg
And a 1.2mm pyr rise 1900 – 1990, which means greater acceleration has occurred:
http://www.realclimate.org/images//haysl13.jpg
Such interesting graphs…A recent rate increase…But it seems SLR started steepling around the 1870s…although there’s lots of talk of the post-LIA rise beginning a century before that…
I know, I know…The narrative…Natural variation was doing its up-thing and then AGW jumped into the cockpit and seamlessly stole the controls.
No peeping down or left!
Eyes right!
Physics does not care if you and I are red or blue, or right or left, or green or brown. So you are where you are: wrong.
“So you are where you are: wrong.”
Sez you…
Must keep eyes right and up…must resist temptation to look at naughty bits…must hold to sacred narrative…think only right thoughts…Eyes drifting down and to left of graph…must not look…must not…
Where is Father Kennedy when I need him?
JCH
looks like as Church & White got it right !
http://www.vukcevic.talktalk.net/SLR2.gif
“(2.03 ± 0.35 mm/yr 1904 –1953 … 1.45 ± 0.34 mm/yr 1954 – 2003”
A stark contrast to JimD’s 70-80mm/50 years for both 1900-1950 and 1950-2000!
Where is the acceleration in SLR based on this data? Oh, I get it – negative acceleration is still acceleration. LOL
The most relevant recent estimate is Mörner, 2.2mm/year from 1970-2010
The dGPS tide gauges do not agree with satellite altimetry by a factor of about (3.4/2.2) 1.5x. So which is more correct?
You’re comparing different timespans. From Church & White’s update to 2013, 1970-2010 trend is 2.2mm/yr. 1993-2013 trend is 3.6mm/yr. There is no disagreement if you make a proper comparison.
Thank you Paul. A fact in this vast ocean of FUD is great, but what is needed here is an acceleration of facts.
How deep.
To get you to the sunshine, unfortunately there are a lot of layers of FUD.
I have not noticed.
Paulskio, just returned. The C&W 1993 -2013 metric cannot be relied on for three reasons. 1. Known decadal variability, mentioned several times upthread in comments by others as well as in the post too short to reflect a trend, especially when half the period is during the pause. 2. C&W do not correct for land motion, but does keep changing their sample size and yhus land mix. 3. The estimate does not close for information from the decade 2000-2010. There was less Greenland Ice loss in the 1990s than after 2000; estimates are about 1/10 of post 2000. (NOAA has a Greenland page with annual summaries.)
1. Known decadal variability, mentioned several times upthread in comments by others as well as in the post too short to reflect a trend, especially when half the period is during the pause. …
During the satellite period, the tide gauges are in agreement with the satellites. Your objections miss the mark.
The known decadal variability during most of the satellite coverage was a down trending PDO index, which means La Niña conditions were more prevalent. If anything, that would suppress SLR:
The PDO went positive in 2015 and remains positive:
http://www.carbonbrief.org/wp-content/uploads/2016/06/NOAA-PDO-Index.png
And SLR instantly spiked:
http://sealevel.colorado.edu/files/2016_rel3/sl_ns_global.png
The big drop in sea level in 2011 corresponds to deep dives in the PDO index which were occurring at the same time. PDO plus ENSO is a beast, and the GMSL is just one indicator.
Closure?
It’s easy to understand why they try to close the budget, but closure at this time is not necessary.
Over the years 2002-2014, we find a global mean steric trend of
1.38 (+or-) 0.16 mm/yr, compared to a total trend of 2.74 (+or-) 0.58 mm/yr. …which closes the sea level budget against the altimetry data.
JCH:
90% of the heat has gone into the ocean, it is said. That was said in the neighborhood of the pause. I would think that would increase sea level rise. With the super monster El Nino, slowed sea level rise should be forth coming.
Take your above plot and look at 2011 until now. Big ocean uptake of warmth is suggested.
I’ve been saying for a long time that the steric component was being underestimated. Maybe more will confirm.
As for a slowing SLR rate being in the offing, I don’t think so. Groundwater mining should start progressively adding water. The oceans are reluctant to yield heat when the TOA imbalance is positive. Once energy is in there; it’s staying. (One exception would be volcanic eruptions; TOA goes negative.) There is still plenty of land-based ice to melt.
In the November-December, 2015 issue of The Alcalde, a University of Texas Alumni publication, was an article on Antarctica’s Totten Glacier, and how its melting would raise sea levels.
The article was illustrated by a map of Texas and Louisiana, and what the shoreline would look like at two sea level rises. The caption:
“Long-term sea level rise could put parts of the Gulf Coast underwater. Totten Glacier could rise seas by 10-11 feet, and 197 feet represents the melting of all Antarctic ice.”
The article did state “Not all of Antarctica’s ice is at risk, of course,…”, but that did not deter the editor who decided on the map and caption.
http://alcalde.texasexes.org/underwater/
I would have made it a 10.35 meter line/shading.
Don. My previous guest post here was on Totten and how the acrual findings have been distorted by author’s PR. You might find it interesting.
That would be “Another Antarctic Sea Level Rise False Alarm”, 22 May 2016.
Reblogged this on Climate Collections.
Tide gauges are the only relevant measure for humans regarding rising or falling sealevel, and even more mostly the local. (No one lives in a global sea level).
You could care for others that experience higher rises than average, but you could not do anything about it, at least not in a foreseable future by changing the climate.
The GIA adjustment is only to estimate the amount of water in the oceans, and has very little with the actual observed sea level to do.
I really wonder why these sattellite sealevel measurements dont also measure the hight of the shore.
The alarmed peoble should compare the local rate of rising sea to the average lifetime of a house before they prescribe costly measures..
The reasons AL Gore and Mitt Romney built mansions on the California coast is they understand the impacts of sea level rise on their personal real estate prospects.
Scott
Let’s not forget the President’s new home in Hawaii. Was used in filming the Magnum P.I. tv show.
Perhaps he’s going to have a 10 meter seawall built between the private beach and the main mansion.
Mitt’s:
http://static3.businessinsider.com/image/4e544adcecad04721300002f/in-the-middle-of-the-election-mitt-romney-is-planning-to-seriously-trick-out-his-12-million-beach-house.jpg
Gore’s “beach” house is well up the hillside, and this is claimed to be his view:
http://www.ecorazzi.com/wp-content/uploads/2010/04/gore-motecito.jpg
Who claimed the photo to be his view, Al Gore or Greenpiece?
Well, you could go to maps and learn his house is more than 500 feet above sea level and some 1000 feet from the surf…
Or even better, you could figure out that his houses and his money and his lifestyle have absolutely zippo to do with physics.
Better shot.
Up the hillside but those are likely old terraces from past sea shores.
https://www.google.com/url?sa=t&rct=j&q=&esrc=s&source=web&cd=1&cad=rja&uact=8&ved=0ahUKEwjxkrudxoXOAhWBVT4KHehWA2sQFggcMAA&url=https%3A%2F%2Fwww.heartland.org%2Fpolicy-documents%2Fsea-level-rising-gore-buys-multi-million-dollar-oceanfront-mansion&usg=AFQjCNGoEoqlTt7m1GZ_Et1_G-xQnJkNQw&sig2=Z1Un_hVojXMF41AAVFJAtQ&bvm=bv.127521224,d.dmo
Still, thanks for keeping it observation based and not model driven.
Scott
On the other hand the sea levels in this area go up and down by greater than 2-3 mm per year.
http://gsabulletin.gsapubs.org/content/88/11/1553.abstract
“General, rather uniform tectonic elevation of the entire San Diego coastal area has amounted to 19 to 24 m during the past 80,000 yr for a rate of uplift of 24 to 30 cm per thousand years. Just south of the Rose Canyon fault, the Nestor platform was elevated tectonically by approximately 23 m between 120,000 and 80,000 yr B.P. and another 31 m during the subsequent 80,000 yr to a total of 54 m in 120,000 yr, or 45 cm per thousand years.”
It gets complicated when one uses observations.
Scott
It gets complicated when one uses observations.
Yes or maybe not.
How can Stockholm think of any measures against rising sea level?
http://www.psmsl.org/data/obtaining/stations/78.php
They should be more concerned of too little water in the harbour.
And you know this because of these really horrible climate scientists like Mitrovica. Seriously, a high school kid could do better.
Thanks Svend.
Always a pleasure to see data and observations.
Scott
JHC:
“During the satellite period, the tide gauges are in agreement with the satellites.”
2011 – 2016: 5,557 mm pr year. Total 2,8 cm (Colorado sea level).
Where do I find tide gauges in agreement with that?
Svetlana Jevrejeva is this blog’s darling sea level scientist. Rahmstorf is the evil villain:
Nonlinear trends and multiyear cycles in sea level records
We analyze the Permanent Service for Mean Sea Level (PSMSL) database of sea level time series using a method based on Monte Carlo Singular Spectrum Analysis (MC-SSA). We remove 2–30 year quasi-periodic oscillations and determine the nonlinear long-term trends for 12 large ocean regions. Our global sea level trend estimate of 2.4 ± 1.0 mm/yr for the period from 1993 to 2000 is comparable with the 2.6 ± 0.7 mm/yr sea level rise calculated from TOPEX/Poseidon altimeter measurements. …
Other titles:
Trends and acceleration in global and regional sea levels since 1807. – Jevrejeva et al, 2014
Evidence for the accelerations of sea level on multi-decade and century timescales. Woodworth, P.L.; White, N.J.; Jevrejeva, S.; Holgate, S.J.; Church, J.A.; Gehrels, W.R.. 2009
Recent global sea level acceleration started over 200 years ago? – Jevrejeva et al, 2008
With those mechanisms that are so far clarified for sea level rise, temperature (water expansion with warmer) and melt water addition are dominant.
The temperature aspect has the simpler physics. Essentially, using a coefficient of thermal expansion approach, the sea level changes immediately upon its temperature change. Melt water effects are less tied in time. So when curves are shown here such as the upper graph from JCH | July 21, 2016 at 12:53 pm | , one should be able to infer the dominant mechanism by the presence or absence of a lag when compared with temperature changes over time, ceteris paribus.
From thermal expansion only the rise is about 0.1 meters per Celsius degree change in temperature for the top well-mixed 500 meters at the surface of the oceans. (Some authors think that there is a time lag due to mixing, but I do not think this is correct). It expands as soon as it heats.
If we go conventionally wise and say that Earth temperature changed 1 deg from 1900 to 2000, that should have given a thermal component of 100 mm or about 1mm per year and that component should be in lockstep with the temperature of that convenience-chosen top 500 metres. Ceteris paribus, which it never is.
However, this approach falters because a temperature pulse at the sea surface can go this way or that to colder places, including a slow path to the deeps for some of it. This being the case, there is a memory effect, with the present sea temperature at any point likely reflecting events not know or quantifiable today.
This is especially so when dealing with a huge mass of ocean whose temperature changes are minute and challenging for any instrument to manage. Propaganda invites as an option.
As is the modern way, the harder it is to measure, the more its confidence limits need a boost and the more it has to become settled among the restless.
Put on top of that the almost complete absence of knowledge of changes in the shape of the basins holding that water and it all gets very hazy.
The whole exercise is pointless, because we can do not much about it at acceptable cost and because the unintended consequences of simplistic mitigation thought bubbles will likely come back to bite.
Geoff
late comment
Geoff I agree with mitigation. I like Baltimore and I don’t want to see it turned from the inner harbor into THE harbor. The alarmist say we have scant time to save our cities (NYC, Boston). What about BALTIMORE. I don’t see the USACOE bulldozing 100 foot levees around the pentagon.
I would like to convince those truly interested in fighting climate change to put down their protest signs, pick up a shovel, and start building the earth berms we will need until the population can relocate to higher ground.
For learned reference see “Star Spangled Banner”. Don’t forget to vote.
My son is a resident physician in Baltimore, and we’re thinking about buying him a condo on the harbor.
Rud and Geoff: Or, to put it more concisely, any discussion of rates without confidence intervals isn’t very illuminating. However, for the satellite altimetry era but not the full or half-century, we have data on ocean warming down to 2000 m (especially from ARGO) and the ice-cap melting.
The trickiest aspect of ice-cap melting is the GIA occurring below the ice. The problem is that an ice cap whose altitude hasn’t changed is melting, because the land underneath is rising. However, when considering SLR, we don’t need to worry about this problem, since rising land under ice-caps is off-set by subsistence of the adjacent ocean floor. For SLR, it doesn’t matter if the altitude of ice is dropping at a rate of 2 cm/year and the ground is rising underneath at 1 cm/year or 3 cm/year – the net contribution to SLR is 2 cm/year. Instead, standard practice is to calculate the volume of water added to the ocean after GIA and later then subtract the world-wide volume increase in the ocean basin assuming constant sea level. The world-wide volume increase is simply the volume land that is still rising due to glacial isostatic rebound. We have a good idea of how much land is rising in places that are not covered by ice, but not under it. In the end, one set of assumptions about GIA can be made when calculating ice-cap melting and a different set of assumption made when considering the total volume of ocean basins. It would be far more accurate to not worry about GIA under ice-caps and not include the GIA under ice caps in the change of ocean volume.
The Washington Post is the sort of newspaper where you can expect that most columnists who work there would have voted twice for Obama. So, it’s not a surprise that in the linked article with jumps to other similar articles, the newspaper essentially begs you to vote for Hillary Rodham Clinton in a roundabout way when is says:
Rud and Judith: Does it make any difference if sea level is currently rising at 2 or 3 mm/year? For clarity (in the US), I call it about 1 inch/decade, 3.5 inches by mid-century, and 8.5 inches by the end of the century. The mm/yr is fairly intangible; cm/decade and m/century are far more useful. SLR is a multi-decadal to centennial problem and should be quantified in those terms.
The only thing of real importance is the acceleration in sea level rise. If acceleration were 1 inch/decade/decade, the rate would be 2 inches/decade around 2025, 4.5 inches per decade around 2050, and 8.5 inches per decade around 2100. The total rise would be about 8 inches by 2050 and 40 inches (the scary 1 meter or more) by 2100. Acceleration this large adds about 4 inches to SLR by mid-century and 32 inches by the end of the century. If acceleration is only half as big, then the component added by acceleration is half as big. So the IPCC projections involve accelerations ranging from less than 0.5 inch/decade/decade to worst-case scenarios of 1 inch/decade/decade.
What is the current rate of acceleration? Acceleration apparently isn’t yet quantifiable in the 2+ decade satellite record. In the combined record, acceleration is about 0.025 mm/yr/yr or 2.5 mm/decade/decade or 0.1 inch/decade/decade. So this much acceleration is meaningless.
This tempts me to say to the alarmists: Come back in 2025. SLR isn’t near 2 inches/decade by 2025, we don’t need to worry about 1 m of SLR by the end of the century. If we don’t get there by 2045, the acceleration is pretty trivial.
Unfortunately, it takes a long time to confidently measure the difference between an acceleration of 0.5 and 1.0 inches/decade/decade. And there is no guarantee that future rise will fit a quadratic relationship – though a quadratic fit will look good for a while anytime a linear relationship begins to change.
See: http://nora.nerc.ac.uk/id/eprint/509541
Jorda, G. (2014), Detection time for global and regional sea level trends and accelerations, J. Geophys. Res. Oceans, 119, 7164–7174, doi:10.1002/ 2014JC010005.
Franktoo – the authors say they plan on publishing an update by the end of 2016. Through April of 2016, how many cm have been added to the end of their data – end of 2010?
I await their update… it will be so much fun:
http://www.aviso.altimetry.fr/fileadmin/images/data/Products/indic/msl/MSL_Serie_J2_Global_IB_RWT_GIA_Adjust.png
We know the big dip was caused by an abnormally large amount of rainfall on Australia and South America. We don’t really know yet how much of the spike is ENSO, or perhaps something less reversible.
Franktoo, just returned here. As Javier pointed out in the first comment, whether SLR is 2 or 3 mm is not important. Both rates are trivial, although 2.2 is supported both by the Eemian highstand and closure calculations.
What is important is whether there has been meaningful acceleration since 1950. If so, we shoild expect it to continue with curther warming. Because the CAGW crowd goes 2 then 3 then models 4 then 5 then 6 and comes up with nonsense like Hansen. Now, TG acceleration is slight and within error of estimate. One has to be wary of just looking at the last decade because of natural SLR variation. There is acceleration in the sat data, but it looks like an artifact. And the sat rate does not close either for 1990-2000 or 2000-2010, which makes it suspect.
Third, our revised record indicates that the rate of rise has increased over the last 2 decades (independent of how we estimate the vertical land motion), consistent with other observations of the increased contributions of water and ice from Greenland and West Antarctica. The acceleration is also consistent with recent projections, and larger than the twentieth-century acceleration. However, sea level varies from year to year, as water is exchanged between the land and oceans (for example during the Australian floods in 2011), and as a result the observed increase in the rate of rise over the short satellite record is not yet statistically significant.”
Plot of global sea level since 1993:
https://i2.wp.com/www.cmar.csiro.au/sealevel/images/alt_gmsl_seas_rem_refined.jpg
Rud Istvan,
It would be nice if you used the estimates given in your own citations. From the abstract of Kopp et al. (2009):
When global sea level was close to its current level (≥-10 m), the millennial average rate of global sea level rise is very likely to have exceeded 5.6 m kyr-1 but is unlikely to have exceeded 9.2 m kyr-1.
Obviously the rate of SL change over the 3,000 years would have reduced *after* orbital forcing peaked. Something else to think about: GMST since 1950 has increased about an order of magnitude faster than the peak millennial warming rate leading up to the Eemian interglacial.
On that note, see Mengel et al. (2016) for an interesting semi-empirical method to estimate SLR rate.
Tosh. See Mengel and Levermann (2014) for but one of many papers apparently not within the reach or interest of your self-proclaimed expertise on what is “realistic” and what isn’t.
Surely we haven’t “forgotten” that drift *could* go either way?
Tut. You write in your conclusions: Tide gauges cannot be relied on for short periods, or without vertical land motion corrections.
Elsewhere you complain: One set of three similar papers cherry pick short time frames when satellite SLR was less (2.4, 2.5, 2.4mm/yr, respectively), and throws in higher Antarctic ice loss contributions.
Why is it that you get to cherry-pick two decades of a single metric, but “warmunists” cannot?
Here’s what the thermosteric component estimates are based upon:
https://climexp.knmi.nl/data/itemp2000_global.png
No Paws in sight. Also shows acceleration over the entire interval, as does this [Jevrejeva et al. (2008)]:
https://climexp.knmi.nl/data/igsl_ann.png
brandonrgates:
Hard as may be to believe, accountants sometime get the sign wrong. Let’s hope that’s not the case now.
The first plot shows a trend break around 1998 that continues through the end of the data. The warmth goes into the ocean raising sea levels. 1977 looks flatter. 1977 is what I call a Tsonis synching year. It generally warmed after that. The warmth did generally not go into the oceans. The second plot shows a cool period starting around 1942, another Tsonis synching year with increased sea level rise up until about the early 1970s, occurring before the expected break point. Perhaps Greenland decided it needed some more ice prior to 1977. Warming oceans and all.
Not bad. Now figure out where Tsonis messed up, and then you’ll understand how he made a complete fool of himself by saying the pause could continue until 2030.
stay tuned, we will see the amo flipping cold at some point
I put the slowdown (i.e. pause) starting at 2003… so I’ll bet it lasts to 2033ish
JCH:
If we can say that thermal expansion is the biggest player relying on the minority opinion of Zwally’s recent Antarctica study, the hiatus continues relying also on the first plot above. We’d have to assume many other things being static to do this, such as clouds. The part I like is using the thermal expansion to tie out (balance the books) of the atmosphere.
When it comes mid-century cooling and Girma and all that cycle stuff, I see remarkable agreement between the warming and cooling of the Eastern Pacific and the changes in direction of the GMST – the green and the blue lines – and almost no agreement between the AMO, the red line, and the changes in direction of the GMST.
To me, the relationships starting in 1952 indicate that the mid-century pattern in the GMST may not be seen again for the entirety of the 21st century.
AMO lags CRUTEM4, and CRUTEM4 shows no sign of slowing down.
http://www.woodfortrees.org/plot/esrl-amo/mean:120/mean:240/plot/crutem4vgl/mean:120/mean:240/detrend:0.7/offset:0.4
Ragnaar,
There’s a roughly 60-year cycle in the SL data similar to what we see in GMST and ocean heat content. I know of nothing more esoteric than internal variability required to explain that. Using AMO gives me pretty good fits.
On the Tsonis regime changes, the PDO gives a far better fit on all but one.
http://journals.ametsoc.org/doi/full/10.1175/JCLI-D-15-0508.1
BG, used the whole Kopps paper, not the abstract. The math is correct. As for cherry picking decades. The assertion is SLR has accelerated since 1993. So the most recent 2 decades are where too look for closure. I agree Greenland lost more since 2000. So worse closure before, better after. So used post 2000 data. Even faded it to favor warmunists. The 2005-2010 Argo only thermosteric rise estimate is 1.1, not 1.2.
I did not cherry pick the short sat alt closure periods. Those ridiculous papers did.
Rud,
3,000 years from 0 to +6.6 m RSL does indeed work out to 2.2 mm/yr. The correctness of your math is not in dispute here, the relevance of it is. +6.6 m RSL from today was the *peak* sea level during the Eemian, meaning the interval you’re calculating includes a period of time when the rate of rise was *zero*.
Correct. You instead cherry picked GMST since Teh Paws and ignored OHC over the same interval, which is baffling given the amount of time you spend discussing the thermosteric component of SLR.
Reporting what the entirety of altimetry datasets tell us isn’t ridiculous or cherry picking. In context with longer-running tide gauge data going back to the 19th century (or earlier), SLR acceleration is obvious. Some hefty mental gymnastics are required to not see it.
It’s getting hard to follow all this. Zwally’s It’s snowing in Antarctica, paper cast doubt on whether that was in the game. Putting it on Greenland and a few mountains ranges. Sea level could be mostly about thermal expansion. So an accelerating Sea Level rise suggests a slowing of atmospheric temperatures. A slowing Sea Level rise suggests the oceans giving up their warmth. With salinity changes, there’s Zwally’s paper again. Putting snow on land increases ocean salinity. This stuff is supposed to balance.
With a positive TOA imbalance, the oceans are not going to be giving up much heat.
Maybe we agree that it’s hard to get accelerating thermal expansion and 80s and 90s levels of atmospheric warming at the same time.
They still cycle, so they will mask and exacerbate warming in an alternating pattern.
Ragnaar – it will be very easy to get accelerated warming and progressively expanding ocean water. We’ve already done it, so we will keep doing it. All that is required is additional ACO2, which humanity is quite good at providing. The difference between “the pause that has gone paws up” and the present situation is a tiny redistribution of energy… a sliver.
The oceans are always adsorbing and radiating a huge amount of energy, (heat). There are model outputs that indicate TOA imbalance.
There is not any actual real data records to support that. We must go with real data and not with climate model output that never has matched real data.
When discussing the oceans giving up heat, we’re talking about the persistent energy uptake caused by a persistent positive energy imbalance. There are observations that can be used to confirm the persistence of the positive energy imbalance: Measurements of incoming solar radiation and outgoing LWR. Measurements of ocean heat content (ARGO). Measurements of the GMST.
http://www.nature.com/nclimate/journal/v6/n7/fig_tab/nclimate3043_F1.html
JCH:
I still don’t know where you are on CO2 making it more difficult for the warming oceans to give off their warmth. I’ve copied and pasted something I wrote earlier:
Peter Minnett at RealClimate has an article that has a diagram that says more heat remains in the upper oceans. There is a new temperature gradient across the skin layer. So the balance needs to be restored by emitting less LW photons to the atmosphere. On average and all other things being equal, atmospheric CO2 insulates the atmosphere from ocean warmth.
Say we put insulation in the atmosphere or our attic. The house needs to heat up more to emit the same amount of warmth as before. The oceans need to warm to emit that same amount of warmth as before. And there’s their thermal mass thing to contend with which might as much as a thousand times more than the atmosphere. We’ve insulated the oceans and that makes a lot more sense than insulating the land.
Ragnaar – I personally think Minnett’s theory is correct. According to the theory, the oceans “insulate” the ocean from the atmosphere.
JCH:
Thank you.
About a year ago you started predicting where the PDO was going. I’ve been waiting for that not to work out. So far it is working out. The PDO is still positive.
It goes way back before that… the debates with the Water Chef. He used to say 2 or decades, whatever rubbish he was peddling, and I used draw pictures of past PDO cycles and try to tell the hard-headed angry man “any day now.”
Ragnaar, Zwally may be a bit of an outlier, or not. Read the Climate Audit link in the main post for a very thorough discussion of the Antarctic ice loss controversy. Clearly, there are alarmist papers like Rignot on Amundsen Embayment, and gross PR distortions like what EAIS Totten glacier actually shows. Subjects of two previous guest posts. Big uncertainty monster.
Thanks. I am going to applaud NASA for it’s role with the Zwally paper.
In this study we estimate the annually resolved mass balance of the AIS from a statistically based framework that isolates the different processes driving the elevation changes at any given point. The total mass loss of the AIS is −84 ± 22 Gt yr−1 over 2003–2013, with West Antarctica being the largest contributor with −112 ± 10 Gt yr−1, followed by the Antarctic Peninsula with −28 ± 7Gtyr−1. These losses are partly compensated by a mass gain trend in East Antarctica of 56 ±18 Gt yr−1
There are two issues with this post that should be clarified.
1) The satellite altimetry estimate of 3.4 mm/yr includes a glacial isostatic adjustment (GIA), so the estimate is NOT of sea level rise. It is an estimate of what the sea level rise would have been if there was no glacial isostatic rebound. But there was a rebound, so the estimate is of sea level rise PLUS the effect of that glacial rebound, not of sea level rise.
2) The satellite altimetry measurements are adjusted by a comparison with a set of 64 near real-time tide gauge stations that span the majority of both the T/P and Jason missions. They calculate the difference between an altimetric time series at a tide gauge location and the tide gauge sea level time series, adjusted by estimates of the vertical land motion. The ocean signal largely cancels leaving a times series that is dominated by the altimeter drift. This is described at:
http://sealevel.colorado.edu/content/monitoring-altimeter-drift-using-tide-gauges
KG, True both. But explains neither the satellite/TG discrepancy minus GIA (3.4-0.3= 3.1 not equal to 2.2) (possibly explainable by realizing sat alt is not measuring the same SLR as tide gauges– but then only TG are relevant for CAGW because people live on land), nor the closure problem with sat alt.
Pingback: Weekly Climate and Energy News Roundup #233 | Watts Up With That?
In this work, three acceleration detection techniques are used to demonstrate the robust SLA in the China Seas.
Observed and simulated full-depth ocean heat-content
changes for 1970–2005
Greenhouse-gas emissions have created a plane-
tary energy imbalance that is primarily manifested by in-
creasing ocean heat content (OHC). Updated observational
estimates of full-depth OHC change since 1970 are presented
that account for recent advancements in reducing observa-
tion errors and biases. The full-depth OHC has increased
by …
For the period 1970–2005, our new value is about 15 % larger than the central estimate of Rhein et al. (2013) over the same period, and could have important implications for closure of the sea-level budget.
Many readers have commented on the NASA/GFSC satellite altimetry data:
I downloaded the rather large dataset to examine the trends in more detail:
The curve in the first graph is after filtering the data with a 60-day averaging filter whereas my re-plot is unfiltered. R^2 = 0.95 indicates the linear BFSL is a good fit.
Integrating the normalized deviations about the BFSL (CumSumδGMSL) reveal the intra- and inter-annual trends with a high-degree of fidelity:
Obviously, there have been several inter-annual trends, both positive and negative slopes, since 1992.
Here are the major trends that I have examined:
The nine different trend are listed below;
Calculation of The Slope of Trend Lines
Trend Line End Points (year) Duration (months) cumδGMSL Trend Line Slope
Start End Start End (s.d./month) (mm/month)
A 1993.096 1994.074 11.74 -1.87 15.40 1.5 7.8
B 1994.074 1997.521 41.36 11.74 -28.1 -1.0 -5.1
C 1997.521 1998.336 9.78 -28.1 0.06 2.9 15.3
D 1998.336 2000.677 28.09 0.06 -17.97 -0.6 -3.4
E 2000.677 2006.997 75.84 -17.97 70.79 1.2 6.2
F 2006.997 2011.096 49.19 70.79 4.37 -1.4 -7.2
G 2011.096 2012.345 14.99 4.37 -49.8 -3.6 -19.2
H 2012.02 2015.223 38.44 -49.8 -49.72 0.0 0.0
I 2015.223 2016.092 10.43 -49.72 10.3 5.8 30.6
Average 0.5 2.8
These trends are rather remarkable. Without elaboration, here’s my speculative hypothesis:
1. The combination of tidal forces, ocean currents and atmospheric winds re-distribute the heat contained in the global oceans at various intervals.
2. The ocean currents in the SH are especially important and the massive transport of the Antarctic Circumpolar Current (ACC) is probable the prime mover
This comment is too long already to present my line of reasoning.
Whoops! I attempted to post a *.doc file containing my comments but WordPress didn’t accept my graphs and table. Sorry about that …!
Here’s an update to my August 7th comment adding the missing graphs and table
Ok, hopefully, I’ll do it correctly this time:
One last try, I’m having difficulty with href. Here’s the website that I was attempting to forward: https://www.dropbox.com/home?preview=Climate+Change%2C+etc+comment.docx