
by Anthony Lucas
An alternative perception of sea level rise and climate change.
The Earth’s geological record documents variation in sea level as a standard process in the evolution of our planet. Submerged cities of once flourishing civilisations are indicators of sea level change within the short period of human evolution. The recently discovered remains of the ancient Egyptian cities of Canopus and Herakleion, some eight metres below the Mediterranean off the coast of the Nile delta, provide an insight into the scale of sea level rise over the last few thousand years. They also provide an insight into the future of the American city of New Orleans.
Canopus, Herakleion, New Orleans and Continental Rifts are examples of geological subsidence. Uplift is the opposite process to subsidence. The way these processes are perceived is determined by an observer’s frame of reference which then determines the interpretation of the geological setting.
Rift zones are the product of subsidence generated by continental crustal extension. They are places in the crust which have been extended beyond its capacity to stretch and thin. When the crust can stretch no further, continued crustal extension results in structural failure in the form of faulting, subsidence then occurs along the faults. This is the description of a rift from the frame of reference of an observer viewing the rift from the continental crust, from outside the rift. If a disinterested observer had their frame of reference set within the rift zone, they would report that over geological time the continental crust on either side of the rift was uplifted. The point here being that an observer’s perspective of subsidence or uplift is entirely dependent on a subjective selection of their frame of reference.
Crustal extension in North East Egypt is expressed as the Suez – Cairo faulting system. The Northern extension of the faulting system trends directly towards the Nile Delta. ‘Seismic data, Fig 1, indicates that a large N- to NW – trending extensional basin of Oligocene to late Miocene age lies buried beneath the present day Nile delta fan’ William Bosworth and Ken McClay.2001. This basin is known as the Manzala Rift.
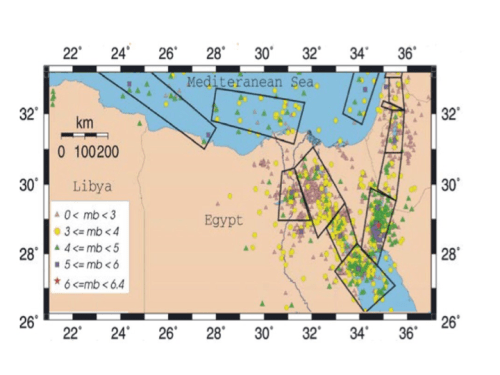
Fig 1:- Seismic activity of North Eastern Egypt from the Red Sea at Suez, through the Cairo -Suez faulting system and the Manzala Rift, to the Nile Delta and on into the Mediterranean via Abu Qir Bay. Dahy, SA. 2012.
Subsidence effects of the Manzala Rift have been observed along the coast of the Nile Delta in the lost Egyptian cities of Canopus & Herakleion, Fig 2. The gradual subsidence of these cities is clearly described by DB Stealy et al., 2004. This description is from the continental crustal frame of reference where the decreased elevation of the lost cities is attributed to, conceived as, a combination of subsidence and sea level rise. DB Stealy provides a practical graphic to illustrate the relative movements, Fig 3,
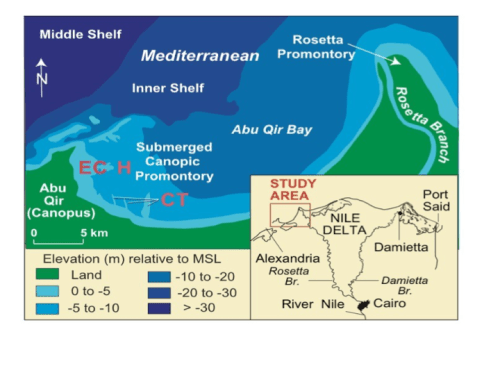
Fig 2:- Location of DB Stealy et al study area in the Abu Qir Bay, on the North Western margin of Nile Delta in Egypt. CT – traces of the relict Canopic branch, EC – Eastern Canopus, H- Herakleion.
The observation of events at Canopus and Herakleion, Fig 3, from the frame of reference within the rift, differs from the crustal frame of reference in three respects. First, the arrow indicating ‘Land subsidence’ is reversed to indicate uplift of the continental Limestone crust.
Secondly, the relative sea level rise becomes absolute sea level rise, although it will be perceived from the crustal frame of reference as virtually no relative sea level rise.
Third, the Holocene strata are represented as gradually lowering, whereas from the rift frame of reference they remain at the site and elevation of deposition. The Holocene strata effectively become the datum against which absolute movement of sea level rise and continental uplift are measured.
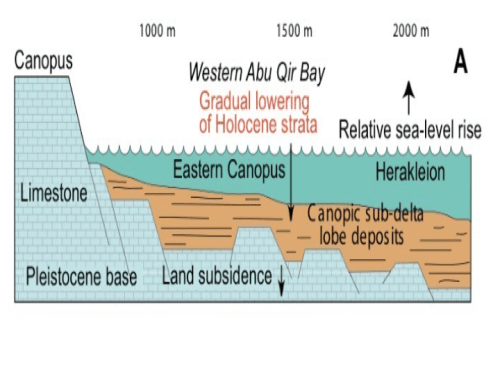
Fig 3: – Graphic from DB Stealy, et al., illustrating relative movement at Canopus. ‘An interpretation of processes that submerged Herakleion and Eastern Canopus to depths of 5 – 7 metres below sea level from ca. 500BC to present’.
Stealy, et al., assess subsidence at Canopus of 8 metres over 2500 years. This equates to an average of 3.2 mm/year, while NASA recently reported satellite measurement of sea level rise as 75mm for 3.4 +/-0.4mm/year. This is a remarkable agreement. Satellites use a dynamic geodetic elliptical frame of reference described at this NOAA, Frequently Ask Questions. ‘Why does the reference frame change for GPS orbits’. This frame of reference makes adjustments to elevation datum points when solid earth processes result in changes to the elevation of datum points.
The conventional explanation of subsidence within a rift is the view from the crustal frame of reference. As the rift opens up the material within the rift sink down into the resulting void under the force of gravity. However when a rift is viewed from the frame of reference within the rift, looking out towards the crust, the origin of the forces generating the rift invokes an alternate tectonic model. The rift is generated by the same extensional forces, but it is the rift itself that is static, while the surrounding crust is uplifted. Instead of gravity causing the rift to subside another force is uplifting the crust. The solid earth process generating the uplifting force is described in this video, as the process of Super Elevation, Fig 4.
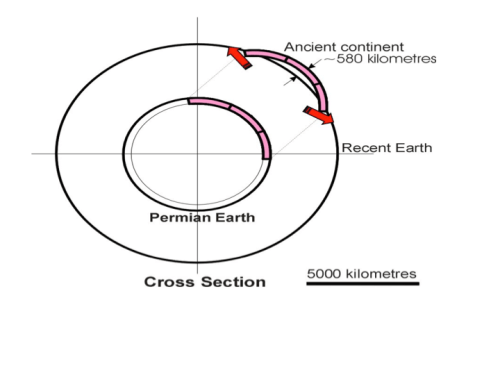
Fig 4:- Super Elevation illustration after Maxlow J, 2012, Expanding Earth video No 5 of 16, illustrating the scale of potential uplift due to Super Elevation on an expanding earth from Permian to the present.
The South African Rift Valley (more accurately described as the East Africa Rift), is a well-known active rift that is easily observable at the earth’s surface. Rifting systems exhibiting similar features to the East Africa Rift are 1), the Europe Cenozoic Rift of the Rhine River, which passes through the Netherlands, as the Lower Rhine Embayment, then extending into the North Sea and 2), the North American Realfoot Rift of the Mississippi River which flows through Mississippi and Louisiana, as the Mississippi Embayment, then onto New Orleans on the Mississippi Delta.
The Mississippi Delta is located on the Southern edge of the North American continental crust and is not subject to uplift from the process of super elevation. It is perceived to subside as the continental crust uplifts and absolute sea level increases. When considered from the frame of reference within the rift, the sediments of the Mississippi Delta become an analogue of the Nile Delta sediments of Canopus Fig 3, and can be thought of as at their location of deposition while the crust is uplifted and sea level rises. Mississippi Delta subsidence was defined by Dokka, et al., 2006 as ‘The average subsidence rate for GPS sites located on the delta is 5.2 +/- 0.9 mm/year relative to the Earth’s center of mass, or 7mm/year relative to mean sea level.’
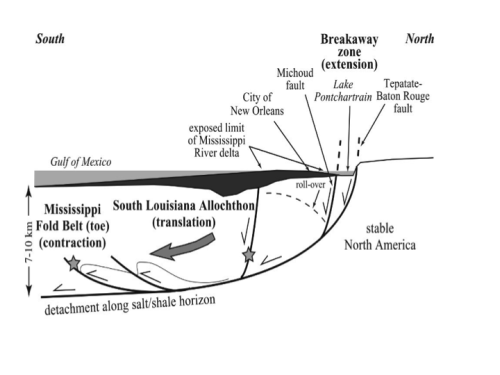
Fig 5:- Location of New Orleans on the sediments of the Mississippi Delta, South of the Michoud fault and the continental North American Crust. Roy K. Dokka et al., 2006 (adapted from Peel, et al., 1995)
The Nile Delta cities of Canopus and Herakleion and the Mississippi Delta city of New Orleans are both built on delta sediments over an actively subsiding rift, at the intersection of the rift and the coastal edge of the continental crust. As the geological setting of the lost cities is almost identical to New Orleans, it is possible to propose Canopus and Herakleion as a model for the future subsidence of New Orleans. To this extent it can be expected that New Orleans will continue subsiding at an average rate of about 3.4 mm/year, so that New Orleans should reasonably be expected to be 8 metres under the Gulf of Mexico in another 2500 years. That is one third of a metre per 100 years.
Delta based relative subsidence can then be used for long term policy planning, infrastructure investment and risk assessment in New Orleans, where the continental crust is uplifting and sea level is rising, encroaching on and inundating the delta. The wider issue is then the climate change debate, which can be framed in a paradigm where sea level rise is natural and ongoing, while the earth’s continental crusts are uplifted by Super Elevation.
JC note: As with all guest posts, please keep your comments civil and relevant. This post was submitted to me via email. While I find the topic interesting, I claim no personal expertise on this topic.

Pingback: Canopus, Herakleion, New Orleans & Continental Rifts – Enjeux énergies et environnement
Thanks for explaining other processes that might appear as sea rise.
The question is not “Does the lea level change?” It sure does, +130 m in 13,000 years. The question is “Why has the sea level been relatively stable for 2,000 years?”
Curious,
Perhaps the shape of the bowl changed as the water rose.
The “Continental Slope” is steeper than the “Continental Shelf” so the water spreads more and seems to rise less. For most of your 13,000 years the water was rising in a bowl with steeper sides.
Curious George,
A litre of water in a flattish bowl, and another litre in a deep, but narrow hole. Adding 10cl of water changes the apparent level of both in vastly different amounts.
My guess about the relatively stable sea levels is that Nature has been adjusting the bowls and holes in such a way as to accidentally balance things out.
Chaos imitating randomness (or maybe vice versa?).
All part of the rich tapestry of life. That’s my excuse for not having a real answer, anyway.
Cheers.
Curious George
Yes, relatively stable in the last 2000 years compared to what occurred prior to that. Even so there are oscillations of sea levels of around 1 or perhaps two metres. We had high water stands around Roman times around 1200 and around 1600Ad. We are approaching another as the ice from the LIA melts-a process that started around 1750 or so.
Land changes enormously complicate all this, so to this day we have places where sea level is rising and others where it is falling or stable
tonyb
Sea level has been relatively stable because the ice that is locked up on Antatrctic, Greenland and the High Mountain Glaciers has been stable. During the Roman and Medieval Warm periods, oceans were warm and thawed and snow fell that put the ice back on land. During the cold periods, like the Little Ice age, oceans were cold and frozen and it did not snow much and the ice melted and went back into the oceans. Now, oceans are thawed and the ice is being moved back to land.
So, are most river valleys the result of rift zones?
And so, most delta cities subject to subsidence?
It does put into perspective changes natural or not which will occur and give pause to consider the relationship of future worlds to present day.
TE
Answers are 1. No. 2. Yes.
Have not looked at all major rivers but a few that I did search for related rifts did return results pointing to known rifts. The rivers are associated with the lower embayment of the rifts as they tend to be the lowest drainage point in the geography. All rivers have valley’s, that does not make them a rifts. But it would be interesting if many of the world major rivers were associated with rifts, especially in countries claiming compensation for AGW sea level rise.
I think any city built on sediments, not just deltas, that do not rest on continental crust will be vulnerable to subsidence. The geological setting needs to be defined in each case, but two other situations worth considering are the States on the East coast of the US which are experiencing subsidence and the San Fransisco Bay areas.
With New Orleans and the continental rift subsiding at 3.4 mm/yr, the expectation is then for the city proper to retreat North along the Mississippi River. Closing off areas for building and rebuilding after the flooding from the hurricane Katrina, segment by segment the Parishes will be first closed and then flooded. City planners can be proactive in easing the population North, and the Federal re-insurance agencies (FEMA), can withdraw funding for the flooded parishes.
This becomes a race issue as the City of New Orleans has become a black Southern city and the financial where-with-all for the closing off of parishes and the moving of people North, will be perceived as discriminatory. Dikes to hold back both the Mississippi River and Lake Pontchartrain will become more expensive and less worthwhile falling victim to the next category 3 or higher hurricane. With nowhere else to go, residents will move North into what is now “redneck” territory. Expect more friction from such a migration.
Eventually, the City of New Orleans will continue to retreat up the Mississippi River, repave a new Bourbon Street and the “Quarter” will continue to supply great jazz music entertainment.
Sadly, any movement of New Orleans cannot resemble a gradual retreat northward and up river, but must be a large step change.
This is because to the north, south, east, and west of Orleans and Jefferson Parishes is mostly water and wetland. Upriver from the Crescent City is actually westward, and even after the river eventually turns northward toward Baton Rouge there is only the narrowest of natural levees for some miles. Meanwhile, above Baton Rouge, it is only man-made structures which hold the Mississippi River in its current banks and prevent it from turning southward to the gulf and abandoning its course past New Orleans.
Travel by major highway to New Orleans from the North, or East, or West and the last 20 miles or so of your trip will be above water or wetland. If the day comes to move the city, it will thus be a move of many miles. The reality will be that New Orleans will be no more.
The problem with Lousiana, is that any attempt to save New Orleans either by moving it, or shoring it up, will mainly serve to make the local polititians very very rich – and the city will sink anyway. So, the logical conclusion must be that in order to save New Orleans we must not only stop SLR, we must reverse it. Any idea how many windmills that’s gonna take?
Temperature cycles and sea level cycles are normal, natural and necessary. We cannot stop temperature cycles and we cannot stop sea level cycle. We can only learn to understand them and the natural causes of them. It is not complicated. It snows more when oceans are warm and thawed and sea level drops, the ice advances and we git cold. It snows less when oceans are cold and frozen, ice melts, ice retreats, sea level rises and it gets warm. They are natural cycles and we did not and cannot cause them.
SciGuy, new orleans in large part was at one point in time swamp land. As the population began expanding out from land near the river the swamps were in filled to what we have today. Hard to say what would actually happen in a worst case scenario. The new orleans metropolitan area only has about a million and a quarter people. A quarter million of that lives across lake ponchartrain in the fastest growing area in large part from population losses from orleans and jefferson. (demographic changes are doing to new orleans that which has happened already in detroit) White flight initially moved the populace west of the city only to have black culture follow in subsequent decades. Now the white flight is from there across the lake. By the time subsidence becomes a problem, i imagine much of the population will be over there. Meanwhile, the french quarter remains among the highest land in the city at six feet above sea level, so it’s not going anywhere any time soon. As long as the quarter and other areas near the river stay high and dry, there will be folks living in new orleans…
Fonz
You are correct, some parts of N.O. were historically above sea level. Even the few blocks around the little house I owned in the late 1970s, out past Tulane University, remained high and dry after Katrina. There even was a graveyard around the corner where people were buried in the ground!
Very much of Orleans Parish would be under water if not leveed and pumped, however. Would the “high and dry” parts have enough economic mass to survive without the rest? One day, maybe not in my lifetime, that might come to test. Certainly, anyone who has the chance should visit and enjoy her while she is still there.
SciGuy, you know i got to wondering a little here… AFAIK, the entire city was above sea level until the ponchartrain levees were built after (and in response to) hurricane betsy. I was wondering whether new orleans’ longevity is ultimately enhanced or diminished by the presence of those levees. Without the levees everything is above sea level, but there is no levee protection. With the levees (and because of them) most everything is below sea level, however everything is now protected by the levees. Which is ultimately better as far as the longevity of the city goes? I’ve never heard that question posed/pondered in the years since katrina. If the core had left everything alone, new orleans would be just like any other coastal community with similar vulnerabilities. With the levees, we are well protected, but we also are well below sea level. Interesting question, as i said, one that i’ve never heard broached. It sounds like you have some “history” here in the city. I’ve been here since ’91. (and, yes, i spent katrina in the dome!) I’d be interested to hear anything that you would have to add here. In answer to your question about the “economic mass of high and dry areas”, i would think that unless the french quarter becomes a little island in the gulf, there will always be reason enough for people to visit here. After katrina, it was that sort of “economic inertia” that made everybody realize that new orleans was indeed coming back. It almost had a life of it’s own regardless of any pronouncements (for or against) coming out of washington…
“AFAIK, the entire city was above sea level until the ponchartrain levees were built after (and in response to) hurricane betsy”
Fonz
I did some work on Corps of Engineers jobs many years ago, but I am by no means an expert in the flood protection systems. I will attempt paint a broad picture.
There were always some natural levees, mostly along the river and some flowing bayous, which were above sea level. But the natives could easily transit what is now Orleans and Jefferson Parishes either north to south or east to west by small watercraft as there were large areas below the natural water level most of the time.
As population expanded, a levee would be built around some desired land, and simple evaporation could stabilize the soils enough to build simple structures if the land originally was slightly above mean water level.
As the city grew, engineers learned to reclaim more land by enclosing an area with levees, then digging ditches with a bottom elevation lower than the desired water table elevation, then pumping water from the ditches up and over the levees until the soil was dried and stable. The drying process can take as long as 5-10 years, during which time the organic soils actually shrink, rendering the reclaimed land lower than it had been in its original state.
Once construction began in a reclaimed area, very little fill was added. Typically, the roadways were depressed and served as temporary catchment for heavy rain showers until the water could flow to the ditches for pumping over the levees. This is why an adjacent sidewalk is called a “banquette” in New Orleans. In a later refinement, the ditches were sometimes covered with a concrete culvert and roadway. Many of the wider boulevards are actually built over such drainage culverts.
The result of this process is that much of Orleans Parish is a cellular patchwork of areas, many well below sea level, protected by levees of varying heights, each served by pumps and “external” canals which mostly carry the pumped water to Lake Pontchartrain.
This system has been under sporadic improvement and expansion for 200 years. Improvements were spurred by a near inundation form Betsy, and I actually did some foundation design for gates which were built as a small part of raising levees. In some ways the system is a marvel of engineering, but it is always subject to the limitations of human endeavor as opposed to the almost infinite capacities of mother nature.
Thanx SciGuy, you’ve got me interested so i’ll have to read up on this to get a better feel for what happened. It would be interesting to see a topographical map circa 1965. Let me ask you this, the (massive) ponchartrain levees were built after betsy, no? If that was the case, land would have butted right up to the lake (with no levees) before betsy? I got most of my info from the times-picayune right after katrina. (it was a GLUT of information in those days that followed) So i imagine that what i learned then was kind of sketchy. Not only because it was from news print, but it was all brand new to me. I really should read up more, because as chance would have it i’m always finding myself in one of these “katrina” discussions…
Levee works had pushed northward to the lakefront by the early 20th century. The levees were greatly improved and the lakefront residential area was developed to a post WW2 plan. My first memories of the area go back to 1967 or so and the area had long been built out by that time. Planning for post-Betsy improvements took place in earnest in the mid 1970s and by the time I moved away in 1983 the greatly improved works around the West End area were almost complete. See here for a page with some photos:
http://www.pontchartrain.net/491301
See the middle of this page for a close-up of the step-like sea wall, circa 1944, just as I remember it in the mid 1970s.
http://www.nww2m.com/2014/10/5000-new-photographs-added-to-the-digital-collections-of-the-national-wwii-museum/
There is a large drainage canal which runs northward and opens to the lake, dividing Orleans Parish from Jefferson Parish to the west. The westernmost coast of Orleans Parish near that canal is called the West End. During Katrina, a levee failure just south of the northern end of the canal led to the flooding of much of the lakefront area.
SciGuy, just did a little reading up… Apparently the entire city was originally above sea level (even the uninhabited marsh land). With the advances in drainage and thus subsequent development toward the lake in the early 1900s came the subsidence. (this from the land drying out and lack of replenishment of sediment) Most all the development between the river and the lake was complete by 1945. By what i was able to gather, much of the present day subsidence had already occurred by the time betsy rolled around. I could find no reference to the advent of the large ponchartrain levees “causing” subsidence. So i stand corrected on that. (i do recall reading about the levee/ subsidence conection in the times-picayune, so perhaps i’ll have to dig deeper to find out if there is anything to it)…
Do we just have half of the picture here focusing on what happens at the delta? Left to itself wouldn’t the entire course of the river be very different? Hasn’t it’s path through south Louisiana changed periodically over time? I seem to recall that but for engineering work, it would follow the course of the Atchafalaya and flowing closer to Morgan City LA. I don’t know, so I’m asking, what might a change in the course of the river do to New Orleans?
before the corp of engineers built barriers to contain the river, any flood could change the river. now every flood that breaks the barriers may change the river. like this year, when the corp of engineers kept the lakes full that were suppose to catch snow runoff and that caused flooding.
You are correct, aplanning and pope.
The Mississippi, Red, Missouri and Tennessee River valleys have been engineered. Besides levees, there are many lakes, plus some large structures above Baton Rouge which apportion flow between the Atchafalaya basin and the Mississippi River, and several other ones between Baton Rouge and N.O. to divert water from the river to the Lake Pontchartrain flood plain if needed.
Here is an irony about the soils in the New Orleans area. While there are some natural sand bars, much of the soil is organic material similar to peat moss. As a result, if you dry the soil it shrinks and the land will subside well below sea level in many areas. If the soil is allowed to flood permanently, it will swell and might expand enough in a few areas to return to an elevation above sea-level. Geography is not easy in the Big Easy.
Marine fossils at altitudes in excess of 6,000 m, oil deposits in excess of 9,000 m, show sea levels have changed a bit over the eons.
No need for global warming or anything similar. Nature at work.
Cheers.
Sounds like we now have confirmation that the rebuilding of New Orleans was at best, never anything more than an unproductive political gesture.
Are you nuts? Suppose the city of new orleans is around for another 100, 500 or even 1000 years? Is that then an “unproductive political gesture”? New Orleans was rebuilt because it was owed it. The core of engineers screwed up and the people there deserved restitution. The longevity of the city is an entirely different matter. You don’t base government action on what may (or may not) happen to new orleans hundreds of years into the future…
The average elevation of the city is below sea level and it’s on the coast–i.e., not a good investment… about like building a bridge to nowhere or like California governor brown, a bullet train to nowhere; but, it is good politics.
It’s NOT “an investment”! It’s what was owed to the people of the city of new orleans because the core of engineers “excuse my frenched” up… This is home to these people and to compare it to a bridge to nowhere is an insult.
I believe MIT’s Dr. Richard Lindzen has also written in a peer reviewed paper that regional plate tectonics may be cause for observed rise in sea levels.
As far as I see this is not about plate tectonics but “expanding earth theory”.
Sure we need this at this point?
Here’s a wee little animation of where the plates have moved over the past 150 million years:
http://www.odsn.de/odsn/services/paleomap/animation.html
Here’s one going 750 million years backwards from now. https://www.youtube.com/watch?v=tObhGzHH2aw (notice of when North and South America joined and notice that is about the same time as the planet cooled rapidly: ~34 and again from 15 million years ago
https://en.wikipedia.org/wiki/Geologic_temperature_record#/media/File:65_Myr_Climate_Change.png
and https://judithcurry.com/2016/07/08/week-in-review-science-edition-48/#comment-796155
Here’s one going 250 million years forward from now: https://www.youtube.com/watch?v=cW6rMzSOmvU
It’s going to be a long time until North and South America separate again – therefore a long time until we can start to get out of the current ice age.
Peter Lang,
And climatologists claim that can only see a hundred years or so into the future!
Was the animation produced using Gavin Schmidt’s computer game “Futurama Fantasy Worlds”?
I love the way the continents magically glue themselves together. Just shows you can get any result you want if you use a computer.
Cheers.
Peter
A link to a far simpler more elegant solution with better music.
http://youtu.be/vqF-vvi5uUA
Cheers
Anthony Lucas
Thanks Anthony,
I like the music and that Australia is properly recognised as the beginning of time. But no date stamp, doesn’t go back 750 million years or forward 250 million years. So, I’ll stick with Scottese :)
Did you see this: https://www.academia.edu/12082909/Some_thoughts_on_Global_Climate_Change_The_Transition_from_Icehouse_to_Hothouse
(I posted a few comments on it on a recent thread here: https://judithcurry.com/2016/07/12/are-energy-budget-climate-sensitivity-values-biased-low/#comment-796768 )
This is interesting and part of my motivation to write. I see highly technical climatological discussions like this which proceed on the assumption of a high level of certainty of the hypotheses on which they rely. In this case it is vitally important to know where the tropics and poles are and which continents are in those positions.
As I have done in this post, testing data across an alternate paradigm will produce a different interpretation. It then becomes a matter of contrasting the various interpretations.
I do not have a highly technical knowledge base in this area of climatology (or any area for that matter), but even I can see areas in this paper which could be debated in an alternate paradigm and reach different conclusions.
I don’t wish to disparage Scottese work, but I have seen other climate work from the AGW perspective that I regarded as complete nonsense and contestable in an alternate paradigm.
That is the reason why I wrote this post.
Cheers
Anthony Lucas
Anthony,
Thank you. If you haven’r come across Scottese’s Paleomap Project before you might find this interesting: http://www.scotese.com/earth.htm
He’s been doing this since about the 1970’s or 1980’s from memory. The Paleomap Project is funded by NASA http://gcmd.nasa.gov/records/PALEOMAP-Serf.html and many of the major universities and institutions interested in geology. It’s well and truly tested and keeps being updated.
Peter
Paleomap style reconstructions are not new to me. First came across them some 35 odd years ago. An expanding earth hypothesis was presented as the alternative even at that time.
Anthony Lucas,
My comments was in response to your two comments:
and
The first comment included a link to a animated picture of the globe with a ball inside of it. The globe moved first backwards then forwards in time to showing only Australia and Americas over about -30 and then +30 million years. It has no time stamps and doesn’t show the whole world. it is a pretty picture but totally useless. The fact you posted this ink suggested you had little knowledge of this. i was being kind.
Your second comment which included “I don’t wish to disparage Scottese work” reinforced that you were not previously aware of the Scotese Paleomap project, how long it has been going, how influential it has been and who has funded it. This work has been going on and leading the way in the visual presentation of historical plate tectonic movements for some 30 or 40 years. Have a look at the references on the Paleomap project to see how long he has been researching and presenting on the subject. Note who sponsors the project. After my suggestions in my previous comment to look at the site I thought you might have taken the time to look through the web site and the NASA stuff and become familiar with it before posting a comment on it. Instead you wrote rather condescending self promoting comments.
As for the first few paragraphs of your comment @ July 18, 2016 at 8:01 am https://judithcurry.com/2016/07/17/canopus-herakleion-new-orleans-continental-rifts/#comment-797568, I haven’t a clue what point you were trying to make. It seems like an irrelevant rant about your opinions. If you want to make a point, I’d suggest you support it with quotes, cite references and include links, and clearly state the point you want to make.
Peter,
You critique of my comment accepted, except the aspect about Scottese.
As I said I find his work interesting and although I might debate some points I admire such a large body of work and the persistence and determination required to sustain a work over such a long period. I expect he is held in high regard by many.
As to your links I followed them all as requested.
As a reciprocal critique of your comment, I make the following points.
Your references to how old the Paleomap project is and it association with the Goddard Space Flight Center are intended suggest this is unchallengeable science. These are know as Appeals to Authority. The length of time a project has ran or who is associated with it has nothing to do with the scientific validity of the subject matter. The science must stand of it’s own volition. This is the lowest form of scientific argument. So I reject that point.
You also point out that NASA is a long term financial sponsor. To suggest that the origin of finance of a scientific project somehow constitutes, in any way shape or form, any kind of validity of the science is frankly bizarre. To follow this path is to contract out a persons capacity for critical independent thinking to the source of finance. And probably only politically correct approved sources. This must be anathema to science. I reject this concept outright.
Note: I am not addressing the science here, just your form of argument.
Regards
Anthony Lucas
Anthony Lucas,
That’s your asserttion. i said no such thing.
However, your comment that your ling was better was your appeal to authority.
I am fully aware of the 10 signs of intellectual dishonesty. You are beginning to display them.
Sorry, There’s no point discussing such pointless matters.. What you are accusing me of is what you are doing yourself. Not a constructive discussion. Let’s just drop it.
Beththeserf
Long ago you said it was not an unreasonable request to ask to turn south america 10 degrees to port so that N ans S america could separate and we could start to get out of this bloody ice age. I realise you didn’t commit to any time by which you would accomplish that, but I didn’t realise you mean sometime in the next 150 million years.
https://www.youtube.com/watch?v=cW6rMzSOmvU
Just goes to show, I must always ask for a date when someone makes a commitment to me. :)
Oh Peter, alack poor serfs find it difficult enuff
tryin’ to gauge the yield of next season’s turnip
crop, let alone predict the shifting of continents.
Mebbe Kevin Trenberth …?
Expanding Earth? Nonsense.
I thought that graphic was odd but probably due to a typo. I stopped watching the linked video when it showed the Permian Earth as half the radius of present Earth. You are right: The only thing expanding was the nonsense.
It get’s worse than that if you go looking for his putative explanations in video 12/14. I’m surprised to see this at Climate Etc.
Reblogged this on TheFlippinTruth.
A factor not mentioned is that heavy coastal construction and water extraction can have a much bigger effect on coastal land subsidence that the slow sinking of a rift area, or the slow increase in sea level. That is the truly man-made sea level rise at certain areas.
Sea level rise is reversible. Once this warm period ends it will turn into sea level decrease.
http://i1039.photobucket.com/albums/a475/Knownuthing/Grinsted2009sealevel2_zpsvjnorrmn.png
Yes, you are right.
It need correcting.
Thank you.
Anthony Lucas
Javier
Other than the first 250 years, Grinsted is entirely a model. It calculates sea level from paleo temperature reconstructions assuming all sea level change is temperature dependent, without any geological references to anchor it in reality.
Sorry, no confidence in the model or its predictions.
Unable to comment on hydrology.
Anthony Lucas
Anthony,
Grinstead et al., 2009 has Svetlana Jevrejeva as one of the authors and she leads one of the foremost groups on sea level changes in the world. One might disagree with her conclusions, but she cannot be waived aside because she is using a model. She probably knows more about sea level changes than anybody here and could write reviews based only on her ample bibliography on the issue.
To me that graph looks correct on what we know about sea level changes of the past 1500 years. It is very possible that global sea level changes of the last few millennia respond mainly to steric changes and ice-water balance that depend on temperature changes.
Anthony
I created a graphic of glacier changes over the last 2000 years and have written an article on sea level changes through the Holocene to Roman times and acquired much data on later movements.
Here is the glacier graphic
https://curryja.files.wordpress.com/2015/11/slide71.png
I estimate sea levels were high in roman times, around 1200 and again around 1600. Glaciers started melting again around 1750 and sea levels started rising sometime later and are rising to this day, greatly complicated by other factors including land movement.
I think the changes are somewhat greater than Grinsted estimates but suspect the overall trends are approximately correct. Of course this is ‘averaged’ and not everywhere conforms to the average.
tonyb
Sea level rise is reversible. Once this warm period ends it will turn into sea level decrease.
That is not how it works. Ocean effect snow falls on land during warm times and sea level drops during the warm times, then the ice advances and causes cold times. Ocean effect snow does not fall on land during cold times and sea level rises and ice melts and retreats and causes another warm time.
They get more ice on land during cold times when it does not snow.
They get ice leaving land during warm times when it is snowing.
The view ice advance and retreat as a result of cooling and warming.
in real life, ice advance and retreat is the cause of cooling and warming and the sea level cycles.
Anthony Lucas, you might want to correct a wrong reference in your article.
It is not DB Stealey et al., 2004 as you have in several places, but J-D Stanley et al., 2004.
I seem to remember DB Stealey as a very obnoxious (at least to me) commenter at WUWT :-)
“I seem to remember DB Stealey as a very obnoxious (at least to me) commenter at WUWT :-)”
Stealey is obnoxious to anyone who deigns to exhibit knowledge on WUWT.
He was a moderator as well as a rabid poster + a liar and a cheat.
Watts recently sacked him – it seems he was too obnoxious even for him.
You can find a thread there specifically on the subject (on which I posted ).
Bail levies or bail out!
I think this thread is a load of ____.
JCH
Well, we obviously need YOU to write on a climate related topic of which you know something, don’t we?
tonyb
JCH, I may regret asking, but what exactly do you find objectionable about the post?
JCH: I think this thread is a load of ____.
With what do you disagree?
JCH,
You wrote –
“I think . . . “
Is this just another foolish Warmist assertion? Have you any peer reviewed evidence published in prestigious journals to back you up?
I thought not!
Cheers.
Pingback: Canopus, Herakleion, New Orleans & Continental Rifts — Climate Etc. | austparagus
I was doing some extensive research on SLR yesterday, thinking about a possible guest post. This longish comment suffices in the alternative.
There are 117 PSMSL tide gauges within 45km of a differential GPS that can correct for land subsidence or uplift irrespective of geological cause. Those are the only TGs that can show ‘true’ SLR. Of those only 70 are long record. Depending on the subset and time frame of these stations used, they show between 2.0 (1950-2012) and 2.2mm/yr (1970-2010) and no meaningful acceleration since about 1930. Reasonably geologically stable Australia dGPS TG is also 2.2. There is no closure problem like with the satellite estimates. 2.0mm/yr SLR ~ 1.2t +0.7m. 1.23t is the most recent peer reviewed estimate of thermosteric rise 1993-2003. Mass increase m is Greenland only since 2000, per PNAS 2010 [other estimates are 0.66-0.71] given reestimated GRACE and Zwally IceSat that Antarctica m is ~0. The thermosteric rise could be as high as 1.6 based just on ARGO since 2005 per NSIDC 2015, in which case 2.2 ~ 1.6t + 0.7m.
My conclusion is that the best guess uncertain estimate for ‘true’ SLR is 2.1=1.4t + 0.7m with no good evidence for meaningful AGW induced acceleration since 1970.
SLR acceleration ‘alarm’ has been manufactured two ways. 1. Use raw tide gauge data uncorrected by dGPS to estimate 2.7-2.8mm/yr tide gauge ‘now’. GRL 2005 said 1.9mm/yr 1925-1992 dGPS corrected. This provides a nice uptick via uncorrected land motion, the subject of this post. 2. Ignore TG data after 1993 and append sat alt while overlooking its closure problem. Provides an even bigger uptick. Both are deceiving.
There have been two attempts to ‘fix’ the closure problem with satellite SLR: NASA 3.2mm/yr, Colorado 3.4mm/yr, both with GIA ~+0.3, both about 1.5x estimates of thermosteric rise plus mass change from ice sheet loss such as those above. (Cazenove’s NCC paper estimated t+m= 2.2mm/yr based on a series of references, but she provided no calculation. The rest of her paper is ridiculous as explained in essay PseudoPrecision.) One used a different model of GIA claiming the correct value is about -1.3 not +0.3! The other claimed the satellite signal processing was wrong because of orbital drift and atmospheric retardation so the correct sat alt value is SLR 2.6mm/yr, with closure achieved by including older (incorrectly high) Antarctic ice mass loss estimates. Both attempts point to fundamental uncertainties in satellite altimetry estimates of SLR.
Bottom line: dGPS long record tide gauges show about 2.1mm/year and little to no acceleration from AGW. This squares nicely with newer estimates of the main SLR components, thermosteric rise t and ice sheet mass loss m. This is about 21 cm/century. That is about the rate of SLR from present SL to the Emmian highstand with temperature ~2C higher than present based on alkenone and C/Mg proxies: ~6.5 meters over about ~3000 years. 650/30= 21.7 cm/century.
SLR alarm is just more warmunist deceptive nonsense.
I don’t think it matters much if it is 2.1 or 3.2 mm/yr as it is such small quantity from a human life perspective. If they have gotten the acceleration wrong (and I think they have), it will be evident in a few years as the disparity grows exponentially.
What is the “closure problem”?
Thought had been clear. The observed SLR should be about equal to its two main contributing components. (1) Thermosteric rise as ocean heat content expands the water column. The estimates vary, and the older preArgo XBT instrument has greater uncertainty. I gave the two most current estimates for the past two decades in the comment. (2) Ice sheet mass loss. This is mainly Greenland, WAIS, and EAIS. No one doubts Greenland is net losing ice mass since 2000 (less in the 1990s). Values depend on the years used and the estimate method (GRACE or mass balance calculated by DMI from annual snow accrual minus summer melt minus iceberg calving. There is a paper listing about 20 such estimates. The range of all estimates covering more than 3 years is 0.55mm/yr sea level equivalent to 0.79. (NASA’s conversion factor is 365 ice equals 1mm SLR.) The four longest periods estimate 0.66, 0.68, 0.71, and 0.74. The comment used 0.7mm/yr. After Antarctic GIA was actually measured by dGPS, the earlier GRACE ice mass loss estimates were sharpely revised down to near zero. McIntyre had a recent post on this. And Zwally 2015 analysis of IceSat says 0 to slight gain (WAIS loss offset by EAIS gain. Hence zero in the comment.
The two other possible SLR contributions are mountain glaciers and extracted groundwater. Both are, by comparison, rounding error given the bigger uncertainties and much smaller quantities. Cazenuve’s NCC paper attemped to explain an apparent recent 5 year sat alt slowdown in SLR by claiming additional groundwater retention in the Amazon, Congo, and interior Australia basins. Her nonsense was dissected in essay Pseudoprecision. The apparent slowdown followed by subsequent speedup is well within the annual instrument drift design spec for Jason-2.
Correction to last comment. NASA’s conversion factor is 365 gigatons ice loss equals 1mm SLR. A Gt is essentially 1km^3 of ice
Thanks for the post and the clarification. It wasn’t too clear for me. A little bit cryptic for the non initiated.
Since Antarctica can contribute or detract depending on the study, and nobody knows the contribution of underground water, and GIA can be any value, I guess there is no much point in thinking that we know the sea level budget.
Judith asked for a guest post, in which I willl be (painfully) pedantically clearer. The delta Gt ice/water is just expansion of ice/water, since ice barely floats. 1 Gt ice ~ 1km^3 water/~1.07 water/ice expansion. In the greater scheme of things, such details are swamped by global measurement error. H/t and also if Judith accepts the longish guest post now in process.
ristvan, good post.
Thanks. Was going to write up as a guest post. Had all the calcs and references summarized by yesterday evening on one sheet of paper.
I’m definitely interested in a guest post on this
…We find that when correcting
for interannual variability, the past decade’s slowdown of the
global mean sea level disappears, leading to a similar rate of
sea-level rise (of 3.3 +/- 0.4 mm yr) during the first and second
decade of the altimetry era. Our results confirm the need for
quantifying and further removing from the climate records the
short-term natural climate variability if one wants to extract
the global warming signal.
JHC. Thanks for the link to the Cazenove paper. It is ridicuoously bad. I illustrates how bad in essay Pseudoprecision. Even did seasonal soil saturation for both Amazon and Congo basins, as well as shoot down the Australian interior excuse in other equally silly papers.
One thing Cazenove said blows her whole thesis. She said in the caption to Fig. 3 that the sum of thermosteric plus ice mass was ~2.2mm/yr. That is consistent with my comment range and the dGPS adjusted tide gauges. It is utterly inconsistent with an SLR of 3.3mm/yr that she tries to defend on grounds of decadal variability in groundwater retention. Walked right into the closure problem without realizing it.
Her 1.1mm/year delta (3.3-2.2) is missing ~401 cubic kilometers of water per year, each year. Roughly one Lake Erie per year. Sort of hard to hide. Bad stats, lacking common sense
Judith, I will start writing it tomorrow. Only effort will be linking all the sources I noted, like U Toronto Pelletier’ conference presentation with the alternative GIA calculation and his rationals.
thx, we look forward to this
I bet “PPs’ Matt is uninterested in checking your work.
Regional favorite in these here parts:
With more than 150 million people living within 1 m of high tide future sea level rise is one of the most damaging aspects of warming climate. The latest Intergovernmental Panel on Climate Change report (AR5 IPCC) noted that a 0.5 m rise in mean sea level will result in a dramatic increase the frequency of high water extremes – by an order of magnitude, or more in some regions. Thus the flood threat to the rapidly growing urban populations and associated infrastructure in coastal areas are major concerns for society. Hence, impact assessment, risk management, adaptation strategy and long-term decision making in coastal areas depend on projections of mean sea level and crucially its low probability, high impact, upper range. With probabilistic approach we produce regional sea level projections taking into account large uncertainties associated with Greenland and Antarctica ice sheets contribution. We calculate the upper limit (as 95%) for regional sea level projections by 2100 with RCP8.5 scenario, suggesting that for the most coastlines upper limit will exceed the global upper limit of 1.8 m. – Jevrejeva 2016
JCH: We calculate the upper limit (as 95%) for regional sea level projections by 2100 with RCP8.5 scenario, suggesting that for the most coastlines upper limit will exceed the global upper limit of 1.8 m. – Jevrejeva 2016
I shall not be around to find out how accurate that turns out to be, but if you post updates, I shall follow them.
ristvan thanks for the info but how about writing it in words that most of us can understand, and explaining the acronyms on first use. What the closure problem is, I can only guess.
Yup. Judith asked, you shall receive. But it is going to take a few days. Simple and clear takes much longer than complex and jargon filled. But I am on it. Will include pictures ( a CE PTA) so there is no doubt. Already on it for two hours today after 5 pm before dinner. It will take a few days to fulfill you wishes for the post. Complicated is easy and fast. Simple and irrefutable is hard and slow. Regards from a young fossil.
ristvan
So right! As Mark Twain noted: “I didn’t have time to write a short letter, so I wrote a long one instead.”
I don’t know how you find the time to communicate on as many complex subjects as you do, but we are lucky that you have the temperament to do so.
Rud,
Even using the 3.4mm/yr sat number I see regularly, we are still only talking 8 fricking inches by end of century. Anyone pushing SLR as a dominant problem needs their head examined.
That is the AGW acceleration issue.
Thermosteric sea level rise is not much of a problem over the time frames societies already deal with as a matter of course. The acceleration debate is important not because it would flood the coastlines but because it is seen as a confirmation test of AGW beliefs. Particularly those that assume warming by mid-century will “lock in” catastrophic polar ice melt (causing eustatic/mass increase SLR).
And even if the rise is 0.5 m to 1 m by 2100, the damage costs is trivial compared with cumulative global GDP over the period: http://link.springer.com/article/10.1007%2Fs11027-010-9220-7
Because infrastructure has a life expectancy of about 50 years and is replaced anyway. And we adapt!
Even using the 3.4mm/yr sat number I see regularly, we are still only talking 8 fricking inches by end of century. Anyone pushing SLR as a dominant problem needs their head examined….
Make certain you include the above argument, Rud.
Here there was all this talk about climate being difficult to predict as it’s complex and chaotic and nonlinear and potentially full of surprises. All it took was sound reason and some basic math skills and all the butterflies are inside the fence. Amazing.
The observed deficit indicates an annual contribution of 0.74 ± 0.14 mm/yr to global mean sea level, which is approximately double the 1992–2011 mean [Shepherd et al., 2012]. Since 2011, ice sheet mass balance has been highly variable in space and time. After the record deficit of 439 ± 62 Gt observed in 2012, which was driven by an exceptionally warm summer, subsequent ice losses have been more moderate. …
JCH,
Are you absolutely sure that it didn’t take unsound reasoning and basic magic skills to conclude CO2 has planet heating properties?
Do you really think that CO2 controls the movement of continents, or the shape and volume of the ocean basins?
Foolish Warmist!
Cheers.
We have two numbers for SLR:
1.7mm/yr – from tidal gauge data
3.4 mm/yr – from sat data
Both are somewhat of a manufactured number to represent global average. But they are what we have. As I understand it, scientists are not exactly sure which is the more accurate number or why they differ. I recall some people trying to use the difference as evidence of accelerating SLR, saying we have gone from a historic average of 1.7 to 3.4. Yet the people responsible for the satellite data say you can’t automatically assume that. As far as I am concerned, I am more than willing to accept the higher number. It’s the conservative approach. And using that number results in a predicted 8 inch increase by the end of this century. Not a scary number. They only way SLR can be escalated into a threat is by throwing in the hypothetical “tipping point” argument. While I would not dismiss the possibility of such an event occurring, it is up to the proponents of this hypothesis to offer more than just their hypothesis. What we get instead is just scary stories based on model projections.
Let me put it another way. I have no plans to sell the condo in Ocean City MD, nor to start investing in beach front property in the Willamette Valley.
https://upload.wikimedia.org/wikipedia/commons/6/65/Trends_in_global_average_absolute_sea_level,_1880-2013.png
Rud,
Interesting comment. I look forward to your post on this. (I agree with Javier about making it easier to read. It’s a bit hard as it reads like a brief note to someone who fully understands all you are talking about).
It sparks the imagination to consider all the sunken cities. Earthquakes, storms, floods, dam building cause a lot. But also subsidence.
I especially like the history of the very persistent Dutch
There must of been an ancient James Hansen.
Those poor citizens of Canopus and Herakleion didn’t listen because they were misled by an ancient Judith Curry.
And people doubt reincarnation.
rebel, suppose you are correct. Much of Florida, with a 2 m sea level rise is at risk of inundation, as is Manhattan and the business district of SF. Downtown LA is safe, situated 15 m above current sea level.
People can move. They always have. Amerindians (first settlers, they didn’t stop in Alaska after crossing the Bering land bridge from Asia, they went down to California, eastward 3000 miles to the Atlantic, south to Tierra de Fuego. Europeans moved from Europe to the New World,not to mention Australia.
Are you saying, ‘We can’t migrate anymore, for the first time in human history, not even fifty miles to escape 7-foot seal level rise?”
How about some woo on this subject of sinking cities? Or is it? While Theosophy has a dubious origin I used some of this guy’s material a number of years ago when I was blogging on a Rockhound website. It generated some interesting correspondence. . As a skeptic who loves to see consensus knowledge challenged just on general principles I found his material worth considering despite some of his more fanciful beliefs.
A couple of quotes from the link at the end: “It has been said that ‘A hypothesis that is appealing for its unity or simplicity acts as a filter, accepting reinforcement with ease but tending to reject evidence that does not seem to fit.’ Some proponents of plate tectonics have admitted that in the late 1960s a bandwagon atmosphere developed, and that data that did not fit into the new plate-tectonics model were not given sufficient consideration,”
“A powerful challenge to this model is posed by seismic tomography, which produces three-dimensional images of the earth’s interior. It shows that the oldest parts of the continents have deep roots extending to depths of 400 to 600 km, and that the asthenosphere is essentially absent beneath them. Seismic research shows that even under the oceans there is no continuous asthenosphere, only disconnected asthenospheric lenses.
The crust and uppermost mantle have a highly complex, irregular structure; they are divided by faults into a mosaic of separate, jostling blocks of different shapes and sizes, and of varying internal structure and strength. N.I. Pavlenkova concludes: ‘This means that the movement of lithospheric plates over long distances, as single rigid bodies, is hardly possible. Moreover, if we take into account the absence of the asthenosphere as a single continuous zone, then this movement seems utterly impossible.’1 Although the concept of thin lithospheric plates moving thousands of kilometers over a global asthenosphere is untenable, most geological textbooks continue to propagate this simplistic model, and fail to give the slightest indication that it faces any problems.”
God Bless heresy.
http://davidpratt.info/sunken.htm#pl
Well, magnetic reversals along the mid Atlantic ridge, motion the past 66 million years of what is now the Reunion hot spot from under India’s Deccan Traps, and actual dGPS tracking of plate movements say he is just wrong. Sky Dragon level wrong.
Alfred Wegener’s theory of continental drift and how it finally came to be accepted 65 years after he had massively proved it 4 different ways (shape fit, geological strata correspondence, fossil correspondence, fossil/climate discordence) was a long, extensively documented example in The Arts of Truth.
Rudd, how do you get the journal papers? Are you paying for them or do you have some other source like the library?
J2, I just pay. Tax deduction from my NC schedule C corp. Not happy about it, but suffering about the last 10 years is lots less than my legal patent fees. IPR Cost is several thousand dollars already per year. Not good. Just is if you want global patent protection.
Rud,
Well said.
Yes, he and James E. Hansen have a lot in common.
Ristvan,
While I don’t subscribe to Mr. Pratt’s theory, I’d estimate that from your response you didn’t read much of what he had to say. Could you point out one specific error for me to chew on?
You could replace Darwin in your “massively proved” assertion about Wegener, and I would point you to the huge volume of recent research showing how many things he apparently got wrong about the dynamics of evolution. Theories are just that and are often fine-tuned and occasionally refuted as knowledge is gathered. I found his point about the bandwagon effect interesting as I was in college in the 60s and was part of the early phase of the tectonic plate theory and its many aspects becoming the “settled science” that I adopted.
That said, Atlantis Mr. Pratt? Woo woo.
It is not only magnetic reversals, but also the most gravity anomaly satellite based measurements which clearly show symmetrical spreading of the ocean floor.
http://www.soest.hawaii.edu/HIGP/Faculty/hey/images/Asdis_Iceland.png
Reykjanes Ridge (off SW Iceland) gravity anomaly.
As it can be seen expansion is not of uniform but cyclical nature, at close examination of the above image at least four cycles of expansion are visible.
correction “also the gravity anomaly confirmed by the most recent satellite based measurements”
The authors did a nice job here, they don’t provide a good baseline for the (pre) historic dates involved.
For the US, some parts coastlines are apparently influenced and some are not – such as southern New York State.
Brian G Valentine,
I believe that parts of the East coast US are subsiding due to the effects of the isostatic rebound occurring in other parts. It’s not always straight forward, with several interrelated factors. Varying rates of continental movement in different places, crustal thickness, unknown fluid flow in the asthenosphere, plus the unknown unknowns, of course.
Guesses piled upon assumptions. Some will doubtless prove to be correct. Which ones? Aye, there’s the rub, as someone once said.
Cheers.
Mike Flynn
Since writing this post I have started thinking of the East coast subsidence as produce by the process of super elevation as described by Maxlow. In this case there is subsidence of the Reelfoot a Rift and related structures from Canada to Louisiana, uplift of the Appalachians and consequent subsidence on the East coast. The uplifting crust is not extending so at either side of the crust, the “toe” of the crust is forced down producing subsidence.
This could go on for a very long time until crustal extension allows the curvature of the crust to be equal to the curvature of the circumference of the earth.
The extent of this effect could be variable along the length of the Appalachians, so that subsidence could be a problem in some places but not in others.
This is how I assume and guess.
Cheers
Anthony Lucas
austsparagus,
First, thanks for your post. Very interesting.
I agree it could be variable, and go on for a very long time. On the other hand, . . .
I wonder whether there is any rebound oscillation, and if chaos operates, would there be the crustal equivalent of oceanic rogue waves. I prefer not to be in the vicinity if this happens.
I’m just assuming that there’s not much I can do to stop crustal movements, so I try not too worry too much!
Having survived floods, bushfires, cyclones, small twisters (wily willys), and not terribly severe earthquakes, I’m content. I take precautions where possible, but Nature has ways of killing me whether I agree or not.
So far so good. I hope it keeps up.
Cheers.
Mike
Thanks for the positive feedback..
I would agree with you if the personal destiny of either you or I were important, but it’s not.
I see understanding crustal movement as important because I see the crustal evolution of our planet and its oceans as the primary drivers of the earth’s climate. In this context I perceive the focus on snow, ice, glaciation and isostatic rebound as overstated factors in the evolution of our planet and its climate.
Having an accurate perspective on these things is important as it takes the nonsense factor out of public / scientific conversation.
Cheers
Anthony Lucas
“The NIPCC review shows that both the claimed satellite altimeter measurement AND the claimed NSW tide gauge figure are contrived. In the former case, by adjustments of the satellite sea-level baseline, and in the latter case by cherry picking a short and atypical length of tide gauge data.
“Copious data, and the arguments of many independent scientists, demonstrate that the rate of sea-level rise on the central NSW coast over the last 100 or so years has been <1mm/yr, and that that rate has recently been DEcelerating.
No amount of computer modelling wizardry can dispel these basic facts.
"Different rates of change in different places
Regarding the different rates of change (both rises and falls) around the Australian coastline, that is due to a combination of dynamic oceanographic and tectonic causes. It is entirely expected, unremarkable and similar to the observed conditions on all other coastlines around the world.
"That rates, and even directions, of change vary so widely around the world from one place to another is precisely why the use of an estimated global average rate of sea-level change to inform coastal management is naive to the point of stupidity."
From a comment at Jennifer Marohasy's site by the late Bob Carter, discussing the insignificant dribble of sea level rise at Fort Denison just off Sydney Opera House from 1886 to 2010.
http://jennifermarohasy.com/2014/10/opera-house-still-above-sea-level-despite-homogenisation/
Terrifying stuff if you are an intertidal limpet colony which hates having to move every few decades…
http://www.psmsl.org/data/obtaining/rlr.monthly.plots/65.png
Just for fun, consider a giant ball of molten rock, cooling slowly. If the density of solid congested or frozen rock is greater than its molten counterpart, it will occupy less volume.
The crust, therefore will have to shrink. However, it also has to remain in contact with the still molten rock below it.
Two things should result. First, the crust will wrinkle, due to shrinkage. Second, enormous additional pressure will be applied to the internal molten rock. This should force some of the fluid rock through any weaknesses in the solid shrinking skin.
I should mention earthquakes are a natural consequence of shrinking and wrinkling. Solid rock tends to snap rather than flow plastically.
It looks as the mid ocean ridges effectively circle the Earth. Observation, although limited, seems to indicate continuous movement of fluid rock emerging through the crust. This might indicate support for what I’m guessing.
It’s all a bit complicated. Why do parts of the crust move – vertically and horizontally – more than others? Are magma plumes real? What is really happening in the cores? Is it possible that localised concentrations of radioactive elements create enough energy variations that convection occurs within the cores?
All very interesting. Many questions, plenty of answers – where they conflict, some must be wrong. The future is still unknowable, so why waste a good worry in advance?
Cheers.
Flat earth Flynn for the Wynn, we cant know the future therefore…..raise taxes on Flynns.. why worry?
Steven Mosher,
What are you talking about? What is a Wynn? Do you believe the earth is flat? I certainly don’t! The next thing you know, you’ll be claiming that CO2 has planet heating properties! Foolish Warmism may have affected your brain.
Are you lapsing into incoherence for some reason, or is this supposed to demonstrate a superior level of intellect?
The world wonders!
Cheers.
Mr. Lucas ==> Very nicely done. Thank you.
Good one Mr Hansen,
Support appreciated
This is really a great approach and a great post. The whole “horst and graben” geological concept is from the crustal perspective. It is all predicated on uplift as the reason for extension, yet some pieces fall while others rise.
Water is self leveling less the perturbing effects of tidal, wind, geological, and climatic/thermal forces. Let the climate warm and the ocean will expand. Let the mid ocean ridges stand tall and there will be continental transgressions.
Rift zones are essentially landward extensions of mid ocean spreading. There is very likely an evolution from early uplift and extension as in the North American Great Basin to “mature” as in the much older Missouri zone where the fundamental uplifting forces have moved and what remains defaults to isostatic loads. This would be New Orleans and possibly the Nile
Delta.
Hydrolized minerals like granite and serpentine “float”.
Great article! I learned a lot. Thank you!! –Paul
It’s devilishly difficult to establish rates of sea-level rise accurately and the uderlying causes unequivocally. While the presentation here may not surmount all such diffulties, it seems almost certain that Canopus will henceforth rise in popularity among homonymic millennials as a given name for newborns.
Earth expansion theory is a crackpot one. Current rate of expansion is measured to be less than 0.2 mm per annum. That’s at most 50 km increase in radius since the Permian, which is negligible, produces 20 km “Super Elevation” instead of 580 km. Anthony, why have you skipped fact checking?
GEOPHYSICAL RESEARCH LETTERS, VOL. 38, L13304, 2011
doi: 10.1029/2011GL047450
Accuracy of the International Terrestrial Reference Frame origin and Earth expansion
X. Wu, X. Collilieux, Z. Altamimi, B. L. A. Vermeersen, R. S. Gross, I. Fukumori
The inability of independent researchers to verify expansion instrumentally is an area of uncertainty. There are other areas of uncertainty as well. Uncertainty of a theory does reflect on its validity, but it is also reflected in the uncertainty of an alternate theory.
Anthony Lucas
Dead right. Previous comments on this thread suggest plate tectonics is not a subject Anthony Lucas has expertise in.
Fixed it for you.