
by phlogiston a.k.a Phil Salmon
If one wishes to gain a “heads-up” as to imminent developments in ENSO and possible beginnings of an el Nino or La Nina event, I would advise turning to the Peruvian anchovy as an important but often overlooked oracle to the oceanography of the anchovy’s home ocean, the Pacific.
The Peruvian anchovy or “anchoveta” is an important fish to the global economy and to the diet of most of us. It is the world’s single largest fishery by landed tonnage, and is a principal component of fishmeal which is a major agricultural feed for farmed fish and animals. One can even order them direct as a pizza ingredient (the “Napoli” pizza for instance). For background, see the Wikipedia.
The anchovy is a filter feeder like a mini-whale, swimming with its mouth agape. This is the key to its huge success in exploiting the massive plankton productivity of the equatorial eastern Pacific off the coast of Peru. It is the archetypal pelagic (free-swimming) filter-feeder.
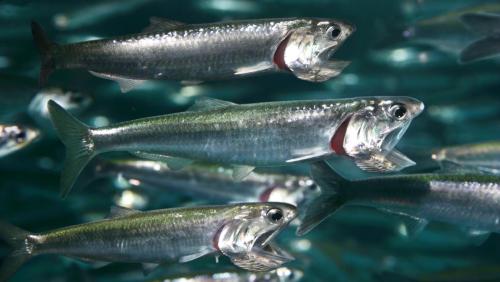
The anchovy (E. ringens) is a pelagic filter-feeder – there are lots of them off the coast of Peru.
Anchovy – the ENSO fish
The Latin classification of the Peruvian anchoveta is Engraulis ringens (Jenyns, 1842). Like almost no other species on earth (certainly not your average Homo) the anchovy has an astonishing and profound instinctive knowledge of the ebb and flow of the El Niño Southern Oscillation – the ENSO. One could indeed reasonably call the anchovy the “ENSO fish”. The migrations, dispersals and gatherings, and year to year biomass peaks and crashes of the anchovy fishery in the eastern Pacific off Peru are tuned with exquisite sensitivity to ENSO itself. In particular it is the Peruvian upwelling, one side of the Bjerknes feedback (the other being the trade winds) which both couple intermittently to provide the bursts of positive feedback that drive El Niño and La Nina episodes. These two systems are characterised by weakening and strengthening respectively of this upwelling.
The first to know of any developments in the dark deep ocean currents way off the Peruvian coast, signifying portentous shifts in the upwelling stemming from the Humboldt current from Antarctica, is Engraulis the anchovy. Long before any clanking fish-imitating Argo floats, before any TAU or TRITON moored bathyscaphes, or satellite imagery, still longer before any armchair climate punditry, the anchovies respond in real time to upwelling changes with variations in the first-feeding survival and size of their juvenile year classes and their spatial distributions. Thus it was inevitably the Peruvian fishermen, heirs of the ocean abundance provided by E. ringens, who were discoverers of what they called El Niño (“the boy” in Spanish), the periodic anomalous warming of the eastern Pacific surface waters. This event is accompanied by a crash in the anchoveta numbers and catches, and typically occurs in December-January, the time of the celebration by the Christian Church of Christmas, the incarnation of the Christ-child.
El Niño is bad for the Peruvian fishermen since it is bad for the anchovy. Why then, one must speculate, did the Peruvians name this cursed event after the divine infant of their religion? Was there a streak of resentment or protest against their Catholic faith and its priests and offices? Or, perhaps, were so many fisherman heard to shout in frustration “Oh Cristo! Su cálida de nuevo!” (Oh Christ! – it’s warm again!) – like skeptical climate bloggers after every uptick in the global temperature anomaly – that the event became named after the blasphemously invoked member of the Holy Trinity.
The baleful influence of El Niño on the anchoveta is related to the transport of nutrients from deep to surface waters which accompanies upwelling, and which fuels the phytoplankton bloom which in turn provides the primary production which nourishes the vast shoals of anchovy which teem off Peru’s coastline and in fishermen’s nets. This is basic first-year marine biology. Primary production, the photosynthetic algal base of the marine food chain, is nutrient limited and thus one talks of blooms, and also of “bloom-and-bust”, as for example with spring sunshine, in temperate waters, the phytoplankton first grow rapidly but then run out of nutrients and die back abruptly (Paul Ehrlich should have been a marine biologist).
This is why coastal regions are the most biologically productive seas where ocean floor topography causes the upwelling essential to bring nutrient rich cooler bottom water up to fertilise the depleted upper layers. The vast expanses of the oceans by contrast have nutrient limited surface water – therefore the strikingly visible transition from green to blue colour of the sea as you move from fertile coastal water to the barren ocean deeps. The world’s most productive seas are in places such as the south west coast of Africa and, biggest of all, the Peruvian west coast of south America, where cold deep water originating in Antarctica and the Humboldt current wells up to sustain the world’s largest fishery, that of Engraulis ringens the anchovy.
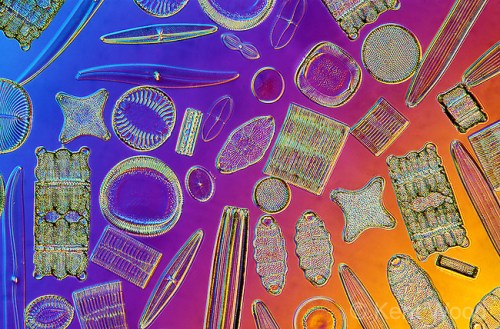
Radial and pennate diatoms as seen under a microscope with diffierential contrast illumination. Specimen preparation by the famous 19 th century Victorian mounting firm, W. H. Watson and Sons, Ltd. England.
Diatoms are protists which have shells sculpted out of silicon oxide. After the living protist has perished the shells remain. These clear shells are comprised of two halves called valves. Diatom shells and their corresponding patterns respond to beautifully and artfully to a variety of colorful microscopic illumination techniques. Many are so intricately detailed that they have long been used as test objects for microscope objectives.
There are two major classes of diatoms: centric and pennate. Centric diatoms have patterns arranged radially, around a central point, known as radial symmetry. Pennate diatoms have bilateral symmetry, left and right matching halves, and are generally needle or boat shaped.
When alive, diatoms are brownish green in color a live almost everywhere, from open waters to quiet shallows. They may live alone or in colonies.
In the mid to late 19th century Victorian era mounters created patterns of them on microscope slides using micro manipulators. Diatoms are a favorite of microscopists for their beauty. Originally they were used for testing the resolving power of objectives. These are highly sought after.
Kingdom: Protists, Phylum: Bacillariophyta
Photomicroscope I on Ektachrome Tungsten 35mm color film, with various illuminations and colors at 40X, 80x on a 4×6 inch print.
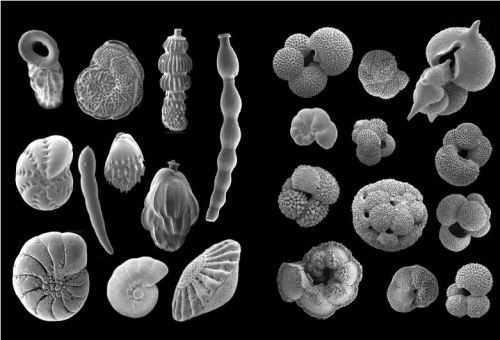
Microscope images of phytoplankton single-celled algae, foundation of the marine food pyramid. They are beautifully sculpted microscopic creatures with exotic names like diatoms (upper) and foraminiferans (lower) as well as and radiolarians, dinoflagellates and coccolithophores.
In the presence of this upwelling, the east equatorial Pacific is cooler than surface waters further west, setting up a temperature and pressure gradient that drives the prevailing pattern of trade winds, the east to west (“easterly”) winds that for millennia have carried intrepid human seafarers from the Americas to populate the Pacific islands. As well as being impelled by this sea surface temperature difference, the trade winds further amplify the eastern Pacific upwelling by dragging the surface water westward, and this reinforcing positive feedback – the Bjerknes feedback – lies at the heart of the El Niño southern oscillation (ENSO).
However, this positive feedback can cut both ways. From time to time, initiated by no-one knows quite what (although hypotheses abound and swarm like the anchovies themselves) Kelvin waves of warm water surge eastward, interrupting the Peruvian upwelling. This warms the east Pacific surface water, reducing the temperature gradient on which the trade winds depend and thus choking them off, resulting in the dreaded “doldrums” – no wind and reduced upwelling off Peru. This slackening part of the Bjerknes feedback is the El Niño event. And in turn, the reduced upwelling is bad news for the anchovy as he has to stay deeper to access life-giving nutrients, and the Peruvian fishermen once more cry “O Cristo – El Niño!”.
El Niño now? What does the anchovy have to say?
So what significance does all this have to the current conditions in the Pacific? For more than a year now, ENSO-watchers have been on the edge of their seats waiting expectantly for El Niño to arrive (I call this “waiting for el Ninot”, theatrically adapted from Waiting for Godot.
But El Niño has stubbornly resisted all entreaties to manifest itself like in the good old days of 1998 and even 2010. Now, again, the Nina3.4 index is rising into what on paper is El Niño territory so that those who feel the need, can proclaim that El Niño is here. But something is missing.
The problem is that the anchovy, the ENSO fish, does not seem to agree that El Niño is here. The latest on the Peruvian anchovy fishery can be found in the following article from the website “Undercurrent News” which gives up to the minute news on fisheries and fish markets around the world [link].
Last year, the abortive El Niño conditions pushed the Peruvian fishery authorities to suspend anchovy fishing due to fears that a developing El Niño could cause a decline in anchovy numbers that would make the fishery susceptible to over-fishing. The Peruvian anchovy fishery is closely managed, in the wake of the famous and spectacular crashes of the fishery in the 1970’s and especially in 1982-83 caused by a combination of a strong El Niño event and poorly managed massive seine-net over-fishing. Despite strengthened fishery management following those crashes, the record-breaking El Niño in 1997-1998 again hit the fishery hard with significant societal impacts for Peru.[link].
So early this year, in the month of January-February when an annually phase-locked El Niño by rights ought to occur, Peruvian fishery ministry survey boats tentatively checked out the anchovy fishery – how many shoals of anchovy were out there, and where? What they found was that in spite of all the feverish talk of El Niño, the anchovy fishery was in surprising rude health. This caused them to cancel a previously considered suspension of the whole fishing season (a relatively frequent occurrence for the anchovy fishermen of Peru) and allow a full quota season to proceed.
 Seine-net industral fishing for anchovy off Peru.
The news as of April 24 was that the fishing fleet was proceeding quite rapidly toward catching the entire season quota of anchoveta. However what is also interesting is what the fish meal market is doing. As mentioned in the introduction, the Peruvian anchovy dominates the global supply of prime fish meal and, as might be expected, China dominates the demand. When there is a discrepancy between what a commodity is expected to do and what it actually does, markets sometimes pause to take stock and see what will happen. Right now, contrary to predictions of the fishery being hit by the long-expected El Niño, the fishery is strong and sustaining high catch volumes. Since this will cause the price to decline, the market is anticipating this and holding back on prime fishmeal orders. In the words of a Peruvian exporter:
“We don’t want to take risks and close at a price now, as we don’t know the development of the fishing season. We hope to finish the fishing season in May, a month earlier than it is supposed to end, as catches are good so far.”
Of course, there is still the expectation of renewed surges of Kelvin waves and the final, long awaited epiphany of El Niño. This is causing uncertainty among those with an interest in the fishery since on the one hand, it is currently in robust health, but on the other, there is this ongoing expectation of el Niño crashing in to spoil the party.
Latest developments in ENSO and the anchovy fishery
This tension or contradiction continues into May between, on one hand, oceanographic conditions of warming in the East Pacific increasingly pointing to el Niño inception, and on the other, continued strong catches of anchovy off Peru indicating that the anchovy shoals are still being sustained by continued upwelling.
This is an interesting scenario since both of these cannot continue – either the building el Niño will choke off the Peruvian upwelling and anchovy numbers – or the upwelling will choke off the el Niño.
The latest ENSO conditions can be seen [here]. Without re-posting the individual figures from this page here (you can see them yourself at the above link) I would summarize the situation as follows:
- SST map shows warming equatorial east Pacific temperatures suggestive of el Niño development [link]
- However trade winds are for now holding up except in the far west Pacific where the winds are reversing to westerly [link]
- The equatorial upper-ocean heat anomaly for 180-100W seems to have peaked already and to be in decline [link]
- The Hovmoller diagrams of surface and subsurface temperature mapped against longitude in the x axis and date in the y axis, show that while at the surface the currently breaking Kelvin wave is at its high temperature peak, at depths of 55-155m the peak is past and temperatures are cooling again [link]
- The BoM Subsurface Pacific Ocean Equatorial Average Temperature and Anomalies at 150 meters, while red-hot in the mid equatorial Pacific, are still mixed at the Peruvian coast [link]
- Finally, the animated “Equatorial Pacific Sea Surface Temperature – 30 Days Including 7 Day Forecast” shows that cold temperatures are building seasonally up the west coast of southern South America, reflecting approaching winter in Antarctica.[link]
The point of this article is not a full analysis of current ENSO conditions. However one can speculate that the normal phase-locking of el Niño to Christmas or just after might be due to coincidence with the Antarctic high summer and a relaxation in the Peruvian upwelling driven by the Humbolt current from the south. Now it is already May and this Antarctic driven upwelling may be strengthening, implying that el Niño has “missed the boat” and will be cut short by this upwelling.
Turning to the anchovy fishery there have been two important recent news articles in Undercurrent News; first from May 6 [link]. This shows, as in April, continuing strong catch volumes of Peruvian anchovy so that the season’s fishery is still on course to land its full quota one month ahead of schedule. Indeed such is the strength of the anchovy landings that the article speculates on long term growth of the fishery as a whole. This is hardly what one expects in el Niño conditions.
Secondly from May 8 [link]. The ambiguous market response to this robust anchovy fishery, also continues. Clearly the big buyers of anchovy in China and elsewhere are being pulled by conflicting signals. On one hand the predictions of anchovy-busting el Niño become more and more shrill. But on the other the landed volumes continue as strong as ever. So for now the buyers are holding back, although there are signs that China could start buying this week.
Note BTW that the latest news of today, May 11: [link] looks downbeat but really refers to events of 2014, especially the cancellation of one entire anchovy season, due to weak el Nino like conditions last year. The fishery by contrast appears to have strengthened in early 2015.
In my view, the current continued strength of the anchovy fishery indicates that upwelling is still strong and yet to be fully interrupted by Kelvin waves and a nascent el Niño. The inception of a proper, full-on el Niño requires not just meteorological conditions or other surface factors, but a simultaneous development in the ocean currents and mixing, linked to the thermohaline ocean circulation, to entrain the Bjerknes feedback to trigger a pause in the upwelling. This could still be balanced between happening or not happening.
So who will win? El Niño, or the anchovy (representing Peruvian upwelling)? The next few weeks should tell us. Right now it seems too close to call.
Conclusion
My conclusion is just this – if we are interested in the ENSO status of the Pacific and what might lie ahead, where better to turn than the wise and all-knowing Engraulis ringens? It’s well worth checking out what’s happening with the Peruvian anchovy fishery before making pronouncements on the current or future status of ENSO.
JC note: The seasonal forecast models are once again very bullish for a strong El Nino by summer. The Nino 1+2 (off the coast of South America) has been a bit slow to catch up with Nino 3+4, but the temperature anomalies are now warm in all of the tropical Pacific Nino regions [link]. While atmospheric westerly winds currently dominate only in the far west Pacific, over the past month westerlies have been more evident across the equatorial Pacific [link].
The forecast for a strong El Nino in summer 2014 went bust (see my El Nino post last year on April 14); what is different this year? Last year at this time, SST warm anomalies were enhanced throughout the whole north Pacific (preventing the Walker circulation from changing). SST anomalies this time around [link] have trended to the canonical pattern (the blob in the North Pacific is diminishing).
From the looks of it, the Pacific seems overall less unusual this year and some sort of El Nino seems likely (although in a month I expect all this will be less ambiguous, and higher confidence in the forecasts initialized June 1). If the El Nino forecast does go bust this year, it will be interesting to assess the wisdom of the anchovies.
Weird things have been going on the Pacific for the past almost two years, so I personally don’t have a lot of confidence in the seasonal forecast models right now particularly on the tail end of the spring predictability barrier. Will be interesting to see how this plays out.
As with all guest posts, please keep your comments relevant and civil.

The Spanish text in this section:
“Or, perhaps, were so many fisherman heard to shout in frustration “Oh Cristo! Su cálida de nuevo!” (Oh Christ! – it’s warm again!c)….”
Should probably read: ¡ay Jesu Cristo, se puso caliente otra vez!
The word Cristo isn’t used alone in this context, we tend to use Jesus. A Peruvian fisherman would skip the letter s and say Jésu Cristo. Se puso means “it turned itself”. De nuevo sounds too emotionless, I think they would use otra vez. Anyway, I tried to use words a fisherman would use. But I skipped the associated cuss words.
Thanks – that quote needed rescuing by a true Spaniard.
Almost lost in Google translation.
The anchovies of Peru are having a red-letter day today:
http://www.ospo.noaa.gov/data/sst/anomaly/2015/anomnight.5.11.2015.gif
JCH
At the surface, yes. Down to 150m its a bit more ambiguous.
ONI is on the way up. Just guessing, but this thing is barely getting started. The anchovies that want out better call Papa Johns and Domino’s real soon.
GISS April anomaly is in at .75C, so we begin the Australian’s El Nino with a 4-month 2015 anomaly of .79C: .11C higher than 2014’s .68C.
2015 could end up over .80C. 1998 was .62C. The pause is going paws up. Just a matter of time. It can still fog a mirror, barely.
A beautiful post. Thank you. I sent the incredible photo of the diatoms to my artistic daughter.
I hope it gives your daughter some ideas. I used to never tire of looking at plankton organisms, they are real works of art. I did tire of towing a plankton net behind a rowing boat – even in my 20s, but it was well worth it afterwards at the microscope.
You can tell a lot about climate change by looking at anchovy and sardines patterns. Rather than decadal, in human terms, it’s generational:
Who better to write about anchovies than a Salmon?
I actually studied marine biology in another many years ago – and got used to being called John West (or was that at school?…)
I just spotted this: 4 questions with David Battisti on El Nino and Climate Variability
http://oceans.mit.edu/featured-stories/4-questions-david-battisti-el-nino-climate-variability
curryja, thanks for the link…but it reads:
“[Double El Niños] are not unheard of, but the last time it stayed warm for nearly two full years was back in the early 80s.”
The 1986/87/88 El Nino was in the latter part of the 80s.
It continues: “A large El Niño event is characterized by exceptionally warm conditions in the tropical Pacific, or by very warm conditions that persist for 18 months or so – about nine months longer than normal. It’s been over 20 years since we’ve seen a very large warm event…”
Over 20 years since the 1997/98 El Nino? Maybe it the new math! I stopped skimming after that.
This post is great–e.g., “if you view the change in global average temperature over the past thirty years as being a superposition of a steady increase due to human-induced forcing and decade-long periods of warm (the 1980’s and 1990’s) and cold (the 2002-2013) anomalies due to natural variability including El Niño, then decade-long periods of very large warming and very weak warming or even weak cooling should be expected. Exactly when these periods end is only obvious in retrospect.”
Likewise,
…if you view the change in global average temperature over the past thirty years as mostly due to natural variation (nominally caused by e.g., solar activity), and therefore showing relatively little effect from a steady increase in the ppm of human-caused CO2 in the atmosphere, then the ’80’s and 90’s warming periods and ’02 to ’13 cold anomalies, together with the weak to little warming and cooling — that we now refer to as the hiatus — is consistent with what we would expect. “Exactly when these periods end is only obvious in retrospect;” and, nothing is happening now or during the last half of the 20th century that has not happened before, with no human-forcing.
Very odd. While definitions vary (BoM defines no El Ninos during the period for Eastern Australia 1926-1940, though the 1930s constitute our driest decade) the last “double” of which I am aware is that co-inciding with Australia’s WWII drought: 1940-1, 1941-2. Mind you, some El Nino’s exist or fail to exist on slim technicalities.
It’s hard to know what the author means when he seems to merge the idea of double El Nino with that of “staying warm for nearly two full years”. Peculiar. Maybe he’s doing that wink-wink-nudge-nudge thing to keep us on edge about climate, or maybe I’m missing something. (With that PDO breaking the 30 year rule and popping up into very positive, this NSW resident is already on edge. Let’s hope El Nino breaks the rules or we’re in for a rough late August and spring. Fortunately, the climate fails to read the literature and tends to break the rules a lot.)
I’m wrong. I checked. There was a “double” El Nino in 1993-4, 1994-5. I have no excuse for forgetting, since conditions in 1993-4 were terrible in my corner of NSW: heat, drought, fire, westerlies and black frosts.
Oddly, ’93-4 is an example of an El Nino which, for much of Australia, was no big deal. But why be surprised? The whopper of 1997-8 didn’t hit the country very hard at all, unlike the feeble El Ninos of a hundred years apart: 1902-3 and 2002-3. Those “weaks” were horrors.
The other “double”, going by BoM, was that of 1913-14, 1914-15. That produced heat and drought in much of Australia which make one lose faith in “quiet sun”. Heat and drought in my region were probably never worse than in 1915.
My theory is that ENSO and sunspots will do what they feel like doing, confounding extrapolation, and we will not go back to the dry 1930s or wet 1970s. We will go forward to the [leave blank] 2020s.
And by 2100 the climate will definitely be [leave blank]. By which time Arctic ice and sea levels will be [leave blank]. Nothing surer.
I can tell by looking out the window in south central Texas. Almost fourteen days of rain in a row. Seven inches forecast for this week. The Little Boy has arrived.
Speaking of “minor” disturbances, Darjeeling experienced 24″ of rain in 36 hours from an unnamed tropical depression making its way north to the Himalayas in October 1968.
Marble Falls, twenty miles away from me as the crow flies, got 19″ in 6 hours in 2007.
http://blogs.wsj.com/numbers/how-much-rain-fell-in-marble-falls-texas-138/
David,
19″ at Marble Falls? How’s that gonna translate to Travis?
Back and forth changes in upwelling of cool, nutrient-rich water along the coast of Peru (and elsewhere) are brought about by similar changes in prevailing winds–not the other way around. “Ocean floor topography” is only an ancillary, not the driving, factor. As delightful as this post may be, it is fundamentally mistaken about ocean dynamics.
john312s
You may be right. We talk about a “coupled atmosphere-ocean system” but most discussion of ENSO is meteorology. I just have this strong feeling that the ocean is not a passive player. I do at least have Bjerknes on my side – his ENSO system was one where east Pacific upwelling actually strengthens the trade winds by increasing the east-west temperature and pressure gradient. I only take an inductive step from this (always a dangerous thing to do) to suggest that oceanic processes driving or reducing upwelling would thus make an impact on the Bjerknes feedback and thus impact on ENSO. According to a nonlinear-chaos paradigm the Bjerknes feedback is the positive feedback that gives life to ENSO as an intermittent nonlinear oscillator.
Test
It’s the Ekman drift of surface waters away from the coast induced by SE trades that produces upwelling off Peru. Bjerknes’ appeal to “feedback” and equatorial “east-west gradients” oversimplifies this, by now well-studied, dynamic. In general, the trades are part of anticyclonic hemispheric gyres centered around quasi-permanent mid-oceanic highs, such as found near the Azores in the Atlantic.
Isaac Held’s recent post was instructive ( and this paper ). Quasi stationary wave patterns seem to describe ENSO events better for me than the ‘tele-connections’ from a warm water pool.
https://www.youtube.com/watch?feature=player_embedded&v=8J4uw0UrTRw
Also that explains why ENSOs rhyme ( whether or not they repeat ):
http://www.columbia.edu/~mhs119/ElNino-LaNina/ElNino+LaNina_maps.gif
This is a very nice and well written article, thank you
Fish movements are an excellent proxy for changing water temperature conditions over the centuries, mirroring the conditions suitable for the success or failure of many species, from anchovies to pilchards, , cod to bowhead whales.
I once wrote an article called ‘fish as a temperature proxy’ which looked at the manner in which the fish species waxed and waned in areas according to whether the water conditions suited them.
This Article was prompted by a uk green organisation claiming that the advent of the pilchard As a common species in British waters demonstrated the wayers were warming due to you know what. Pilchards, also known as sardines are variously described as a cold water and a warm water fish, but in this context the pilchards were the species generally found in the warm seas of the Mediterranean.
Our local fishing port has records stretching back hundreds of years and our fleets had to follow the fish species, cod for example, as far as Labrador and at other times they could be caught and salted locally.
Nearby Plymouth has fish records stretching back to the 11 th century. We have records of bow head whales and their movements stretching to king Alfred’s time when he was visited by emissaries from Iceland.
In this instance the appearance of pilchards in local waters here on the south coast of England which so concerned the green organisation, was not some new phenomenon caused by agw. There has been a pilchard industry here in Devon that has waxed and waned over the centuries as can be seen by this photo of this very ancient Inn on burgh island, scene of many an Agatha Christine murder mystery. She lived locally. I hope to be taking a drink here tomorrow
http://www.google.co.uk/search?q=pilchard+inn+burgh+island&ie=UTF-8&oe=UTF-8&hl=en&client=safari#mlpv=0
Once again, thanks for this article. There is a major paper waiting to be written on ‘fish as a temperature proxy.’ The thought of all the work involved has given me a haddock…
Tonyb
Thanks for your comment – fish as temperature indicators could indeed be looked at more widely. BTW I studied at Plymouth for a year but never discovered Burgh Island or the Pilchard pub, looks worth a visit.
Phil, if you visit, it should out of courtesy adopt pro tem the name Phil Chard.
Oh well. At least they didn’t call it the Pilchard’s Arms ;)
Although they may aim to get people legless.
Unlike treemometers, nothing seems fishy about the anchovy ENSO proxy… Beautiful post. Thanks.
Judy
Thanks so much for posting this. Also I appreciate your comments, plus taking the time to add the individual links to the ENSO bullet points which I omitted through laziness. All much appreciated!
Thank you for your post and participating in the comments! sorry about the timing of the post, given the time zone difference
Pingback: ENSO and the anchovy | Enjeux énergies et environnement
It was interesting to read about the Houghton Lecture on El Nino and climate variability given by David Battisti as a residential scholar at MIT and reported today May 11, 2015.
“During an El Niño event, there is a greater than normal chance for an unusually warm winter in the Pacific Northwest and in the north central US, and for a colder and wetter than normal winter in southern Florida. Alternately, El Niño has little impact on winter weather in New England. It also greatly affects precipitation in Southern California and the southwestern US — El Niño years are reliably wetter than normal, but just how much wetter than normal is very unpredictable.”
I am now enlightened by this U of Washington & MIT Scholar that Southern California is reliably wetter than normal during the present declared El Nino as well as people in the Mid-West have suffered a mild warm winter and their heating bills are a figment of their imaginations. “Climate models tell us…”
According to Battisti, the hiatus is not really a hiatus at all but rather a model foreseeable ebb and flow of natural climate variability upon the inevitable upward ascension of global surface temperatures, which as we all know, are under the control of rising atmospheric CO2.
As MIT is located in Cambridge Massachusetts, within a stone’s throw of Boston and it’s winter’s record snow fall, I would have anticipated that there would be some tempering of certainty in his describing a two year running El Nino and a prediction of a whopper of this summer’s El Nino and heat.
Maybe he was so engrossed in his modeling output, he did not have time to read the newspapers or step outside. Or, he chose to disregard the medications proscribed for conditions when there is a dissociation of scary mad wishes and reality.
Around this time a year ago, I was in Tahiti and 2 weeks later Darwin and I saw and reported windspeed and direction that forecast no El Nino, The current El Nino is declared because…well…it remains in the mind of the beholder. I bring up Tahiti and Darwin again as I am now soliciting funds for a return trip this year so as I can report my direct observations of windspeed and directions. Federal, Big Oil, Big Coal, NGO funds/charities gratefully accepted.
Great article, I like the idea of using nature as the indicator. We’ll see whether it works. Don’t forget all that extra CO2 is feeding the phytoplankton ;)
The SST animation is interesting but a bit too quick to be read properly. I opened it in GIMP and used the layer dialogue to inspect individual frames. Frame 13 is the one I wanted closer look at, it’s when there are a series of dots running accross the equator towards S.Am. That is 25th March, it continues in frame 14: 1st April.
this pattern is something I have found preceds previous El Nino events. I guess this is Kelvin waves.
I suspect that El Nino trigger is tidally driven. I said this time last year that there was a better chance of it happening this year since the perigee moon was very close to coinciding with the equinox. ( Last year it was a bit late ).
The warm ‘anomalies’ seen in the equatorial vertical section graphs, often shown, are caused by warm waters drawn in from N and S which depress the top of the themocline The water is not actually any warmer, it is just a bit lower than usual producing a warm anomaly.
Thus we see max tide raising forces over the equator.
One thing about Kelvin waves : we often hear about “downwelling” Kevlin waves. This is climatological bunk. A Kelvin wave is a surface phenomenon, so as soon as it’s downwelling it is not longer a Kelven wave ( if it ever was to start with ).
The little dots running accross the anim. probably are.
Before indulging in empty speculations, take an introductory course in ocean dynamics.
John321s
If you still don’t get the Bjerknes feedback, you could also read up on dissipative nonequilibrium dynamics and chaotic nonlinear oscillators. And on the roles of positive and negative feedbacks in such systems. Then try again.
Bjerknes primitive notion of “feedback” is far removed from modern ideas on “dissipative nonequilibrium dynamics and chaotic nonlinear oscillators.” Try doing a quantitative explanation of ENSO in those terms and see how far you can get. Simply mouthing impressive sounding phrases won’t cut it among experienced geophysicists.
John, you can call it “primitive” all you like, but I am not the only one who thinks that the Bjerknes feedback drives the nonlinearity of ENSO:
http://lumahai.soest.hawaii.edu/MET/Faculty/jff/2004_02%20Nonlinearity%20and%20Asymmetry%20of%20ENSO.pdf
http://web.yonsei.ac.kr/climate/board/4/20090612072138217_2009-2_TAC_An.pdf
http://yly-mac.gps.caltech.edu/AGU/AGU_2008/Zz_Others/Li_agu08/McPhaden2006.pdf
http://onlinelibrary.wiley.com/doi/10.1029/2005GL022951/pdf
Phil we can all learn from your civil responses to John’s somewhat abusive language. This could be an extremely interesting thread that we all could benefit from greatly if opposite views were presented in a spirit of competitive but friendly challenge. Personality factors get in the way of John’s also-very-illuminating message.
Interesting point about the plankton Greg. I was thinking that the predominance of anchovies and then sardines and back again to anchovies could just be a reflection of the amount of plankton available and its the plankton that bears close watching as a proxy for climate changes.
phlogiston a.k.a Phil Salmon writes: “Finally, the animated ‘Equatorial Pacific Sea Surface Temperature – 30 Days Including 7 Day Forecast’ shows that cold temperatures are building seasonally up the west coast of southern South America, reflecting approaching winter in Antarctica.”
Looking at anomalies, however, we can see that the NINO1+2 SSTa as of last week had risen to 2.3 deg C above normal.
https://bobtisdale.files.wordpress.com/2015/05/nino12-ssta-thru-2015-05-06.png
The most recent Kelvin wave has definitely landed at the west coast of the Americas. We’ll still need more westerly wind bursts for this El Niño to continue to develop. We haven’t had a sizeable one since March.
I should be posting my May ENSO update in a few days.
Cheers.
I’m curious, what connection are you trying to make between El Nino and the “landing” of Kelvin waves at west coast of the Americas?
Bob
Up to now I’ve posted as phlogiston but here I have to use a wordpress account, and i found that I was locked out of the name “phlogiston”. So I’ve had to fess up to my real name.
john321s, my comment related to one of the reasons for the elevated sea surface temperature anomalies in the NINO1+2 region (10S-0, 90W-80W), which is in the extreme eastern tropical Pacific off the coasts of Ecuador and Peru. An equatorial Kelvin wave in the Pacific shifts warmer water from the western tropical Pacific (where it’s relatively warm in absolute terms) to the east (where it’s cooler in absolute terms) along the equator, with much of the anomalies appearing at depths of about 100-150 meters. The warmer-than-normal subsurface waters are then drawn to the surface through upwelling. See the animations here:
http://www.cpc.ncep.noaa.gov/products/analysis_monitoring/enso_update/wkxzteq.shtml
Also see my illustrated introduction to ENSO here:
https://bobtisdale.wordpress.com/2014/01/10/an-illustrated-introduction-to-the-basic-processes-that-drive-el-nino-and-la-nina-events/
Cheers.
Bob Tisdale:
Kelvin waves, like all gravity waves in water, transport only mechanical energy–not matter. Their orbital velocities merely introduce an oscillatory component in to the flow field of currents. You seem unaware of that basic kinematic fact.
Bob Tisdale,
I looked at your site, but I’m a little confused on the mechanism causing denser water to rise from the depths, displacing less dense water in the process.
Solar pond water can reach 90C, but sits happily on the bottom, under much cooler water.
I think you say that warm water somehow piles up, and somehow causes dense cold water to be displaced to the surface. Any water would pile up on the surface, and then spread out, being a liquid, I thought.
I notice that lots of brightly coloured diagrams show things happening that don’t seem realistic. If you could at least explain how less dense water descends through denser water, I’d be grateful.
Thanks.
http://sealevel.jpl.nasa.gov/images/P42106-full.jpg
john321s, maybe you’d prefer NOAA’s explanation:
https://www.climate.gov/news-features/blogs/enso/oceanic-kelvin-waves-next-polar-vortex
Mike Flynn, there’s a relatively simple explanation at the Univ of Washington webpage here:
http://www.atmos.washington.edu/gcg/RTN/Figures/RTN12.html
Cheers.
john321s, PS: As you consider the brief write-up at the NOAA blog I linked for you above, keep in mind that the Cromwell Current (aka equatorial undercurrent) carries waters from the western to the eastern tropical Pacific along the equator.
Cheers.
Bob Tisdale,
Thanks. What causes denser colder water to rise through less dense warmer water? The warm water can hump up all it likes, but it can’t displace denser water beneath it. It doesn’t matter if you add more water to a solar pond, it still won’t sink to the bottom. Nor will the denser water rise to the surface.
NOAA’s explanation is not real good either. Water sloshing in a bathtub? Really?
I ask again, what causes sea water at its maximum density to decide to rise through less dense water, and allow itself to be replaced by less dense water, which will then remain below denser, colder water through some process of which I am unaware?
Sorry, but it’s a basic question. Referring to NOAA bloggers pushing modelling doesn’t provide an answer.
Hope you can help.
Mike Flynn, I’m not sure why you believe “sea water at its maximum density” is rising “THROUGH [my caps] less dense water”. There is continuous upwelling along the equatorial Pacific. Sunlight warms the water as it rises to the surface.
Mike Flynn says: “Referring to NOAA bloggers pushing modelling doesn’t provide an answer.”
Where in the ENSO blog post I linked…
https://www.climate.gov/news-features/blogs/enso/oceanic-kelvin-waves-next-polar-vortex
…do they push modeling?
Bob Tisdale,
“But something happens and you lose. El Niño doesn’t occur. Oh the horror! Does that mean the model is totally useless? After all it forecasted a 90% percent chance of an El Niño and it didn’t happen. You might think that means the model was awful and next time you may not trust your money with such a prediction.
These sorts of bets occur all the time. And probabilistic forecasts (models that tell you there is a certain percentage (%) chance of an outcome) are becoming more popular. An example is FiveThirtyEight’s election and sports predictions.”
You can read more along the same lines. The thrust is trust the models, they will eventually prove to be correct.
But anyway, rather than get into arguments about why you choose to use a blogger to explain what you choose not to answer, I’ll ask again.
What causes denser (colder) water to rise to the surface. You say colder water is ascending to a higher level. As water cools with depth, something is causing the denser water to rise.
Bob Tisdale,
Continuation. Hit the wrong key.
Denser water naturally sinks to the bottom. You say something lifts it to the surface, displacing the less dense water overlaying it.
I just want to know what the motive force is. If you believe a Kelvin wave can shift trillions of tonnes of water thousands of kilometres, what is the power source? How does it overcome normal physics and allow denser water to float to the surface?
You can’t induce convection by heating the surface. The hotter less dense water sits on the bottom. You can’t even induce convection in a solar pond by heating the bottom water to 90C, if you keep the bottom water denser.
So convection doesn’t work. So what is it? Polar cooling doesn’t work either, as a moments reflection shows. You are talking about cooler water displacing warmer water at the surface.
I’m just trying to get a simple answer to a simple question.
Thanks.
Put a big, irregularly shaped stock tank full of water with an atmosphere in outer space and spin it.
JCH,
And the dense matter settles to the bottom, and the less dense floats upon it. A bit like the Earth, really. Gravity, relative density and all that.
You would find this out if you actually did what you suggest.
What are you really trying to say?
If I remember correctly from Oceanography forty years ago, pressure gradients in the atmosphere combined with the Coriolis effect cause persistent wind patterns. Persistent wind patterns drive long term Ocean Currents. Ocean Currents drive upwelling zones. Do I pass?
Apparently not. But don’t worry, you’re not a fish so really don’t have know nothun about water.
Mike Flynn, I provided you a link to the simple answer but you were unwilling to accept it. If you were truly interested in learning what processes cause upwelling along the equatorial Pacific, instead of arguing it, you’d Google it. The link I provided for you earlier provides a nice simple overview.
Regarding the “motive force”, apparently you missed my PS to john321s. It read, As you consider the brief write-up at the NOAA blog I linked for you above, keep in mind that the Cromwell Current (aka equatorial undercurrent) carries waters from the western to the eastern tropical Pacific along the equator.
Mike, regarding equatorial Kelvin waves, maybe a downwelling equatorial Kelvin wave would be better described as a pulse of warm water traveling along the Cromwell Current, where the pulse is initiated by a westerly wind burst.
Bob Tisdale,
The links to supposedly simple explanations are less than useful. If I were truly interested in learning about the causes of cold water upwelling, I’d ask a supposed expert first.
If it turned out that the expert couldn’t provide a simple answer to a simple question, but provided a link to a graphic which appears to demonstrate a physical impossibility, then I might have doubts about the expert’s knowledge.
But I already know (or think I know) what caused the upwelling of the deep currents, and it’s got nothing to do with surface winds.
What I don’t know, and there are competing theories, is what drives the undersea currents, and how. You will be aware that there can be currents overlaying each other, travelling in different directions, and not necessarily being related to each other. Of course, the influence of surface wind appears to be unnoticeable at great depths.
For example, the Cromwell current generally flows underneath the South Trades current, and often in the opposite direction to it. In this case, the surface wind appears to be driving two overlaying currents in two opposite directions simultaneously, if you believe the Cromwell current to be caused by surface winds.
So why does your pulse of warm water inject itself into the denser Cromwell current, rather than the South Trades current which overlays it?
I can’t actually find any consistently reasonable answers, but I find a lot of irrelevancies which don’t stand up to scrutiny.
I’ll leave you alone. You appear to be relying on NOAA. I find many of their supposed facts to be somewhat divorced from reality.
Thanks anyway.
Very interesting thread & good enlightening reading. I noticed as I was reading the article that I was developing a growing craving for anchovy.
Interesting plot:
http://www.mbari.org/news/news_releases/2003/chavez_images/sardine_graph_low.jpg
I think the money knows. The current price of anchovies is in part a reflection of the expected upwelling near Peru. We’ll see who gets it right.
Nice post.
We have something similar, with dragonflies presaging the arrival of the dry season. They are only occasionally wrong, but that’s what happens when you start believing in the predictability of Nature.
In regard to the prediction of El Niño, by Señor Anchoa, or anyone else, I say predict it, and it will come. Never fails! Well, usually, but I’m not certain.
Models say ‘ yes, yes,’
anchovy says ‘no.’
Hi Beth
Prediction is hard, especially about the future ;) H/T Yogi Berra
Say Peter,
Man supposes, naychur disposes ;) H/T bts.
“We have something similar, with dragonflies presaging the arrival of the dry season” – Mike
Except that it doesn’t.
A common enough myth.
Michael,
Maybe you misunderstood. I may have too subtle. They do, except when they don’t. Like global warming due to CO2. It happens, except when it doesn’t.
Whoops. Too quick. May have been too subtle. Sorry.
Michael,
Whilst I agree with you, apparently the Commonwealth Scientific and Industrial Research Organisation, does not.
“Red dragonflies, commonly known as Scarlet Percher dragonflies, or Jarloomboo to the Gooniyandi, announce the start of Moonnggoowarla—the dry season and cold weather time.” – From the official CSIRO website.
Is this more or less mythical than the CSIRO’s “Our measurements across the land, atmosphere and oceans show that warming has continued unabated throughout the past 18 years.”
Another common enough myth, or not?
Mike,
Make up your mind.
Michael,
Why?
Very interesting post. Thank you. There’s something almost noble about studious observation, isn’t there? Odd that it’s a rarity where it ought to be most common.
Here on the midcoast of NSW, interesting warm-sea fish runs, especially mullet; some too early westerlies with clear skies and frost already. I’m thinking a bad spring for bamboo and a bad late winter/early spring fire season after much growth. Fingers crossed that the westerlies subside, otherwise…
Can’t be surprised. Australia was founded during the whopper El Nino/monsoon failure of the early 1790s. Oddly, some insist on being surprised by the big boy, welcoming us to their “new climate” etc. If the climate is new, it’s doing a good job of looking like the old one.
Has anyone considered the the big red blob and no rain or overcast in the SW U.S. allowed for a massive heat vent? With no clouds present the heat could escape into space without any resistance.
Anchovies are so disgusting, I knew El Nino was good for something.
A very interesting article. Thanks, Phil. I note that in the May 6 article that you cite they say “the article speculates on long term growth of the fishery as a whole “. I hope they aren’t making the climate science mistake of interpreting the slope of a cycle as a long term trend.
About the El Nino : We are now I am told in a PDO cooling phase. The last PDO cooling phase was in the 1950s-70s. I understand that El Ninos find it harder to form during this phase. To forecast El Nino now, would it make sense to try working off the 1950s-70s data, ignoring other periods, and then comparing with other forecasts to see what difference it makes? (They may already do this, of course)
Even today, after many years of study by highly intelligent people, the factors are murky enough that coupled ocean-atmospheric models still lack skill to forecast the patterns. And so, in 2015, we find advocates for reducing use of fossil fuels hoping and praying for a warm water blob in the Northern Pacific to intensify or endure so that the average global temperature will trend higher than last year.
https://rclutz.wordpress.com/2015/05/11/dynamic-duo-the-ocean-air-partnership/
Great post, thanks.
Ah, upwelling and anchovies off the coast of Peru. I first studied this in Physical Oceanography at NYU in 1966. Descriptive Oceanography by Picard was one of our text books. Looks like much has changed but not much has change.
I always order extra anchovies on my Ceasar Salad.
Is Picard related to Pilchard? So mnay connections …
A most interesting and thought-provoking article. A few comments.
I spent several seasons fishing anchovies in Monterey Bay, California. Like the Peruvian anchovies, the anchovies here are also affected by the water temperature, but in our case the variations are the result of the Pacific Decadal Oscillation. I agree that the fish are an excellent guide to ocean conditions … if only we can understand them.
Next, the El Nino/La Nina alteration functions as a giant Pacific-wide pump moving hot water from the tropics to the poles. The El Nino is the intake stroke, during which warm water is collected over the eastern Pacific.
Then when the La Nina comes, the renewed tradewinds push the built-up bolus of warm surface water westward, where it splits against the coast and flows towards the North and South Poles.
This is an emergent phenomenon, and it emerges when the heat is building up in the Eastern Pacific. However, during the current 15+ years of no warming, there’s been insufficient buildup of heat to fuel more than minor El Nino/La Nina alterations. I discuss these issues in a post called The Tau of El Nino.
Again, Phil, thanks for a most fascinating post,
w.
Willis, you are mixing Greek with Portuguese there, whereas your blog shows Chinese links – tao not tau.
Great to have your mariner’s perspective. I agree with your take on el Nino-La Nina as a 2-stroke pump sending warm water poleward – I have the impression this transport is slowing in the last few years.
I’d say it’s more of a means of storing solar energy in the OHC then releasing it to the atmosphere.
It’s a case of variable throughput. Larger and more frequent Nino/Ninas : more heat through put ; lesser cycles less throughput , no warming.
The Australian pilchard/sardine, a base fish of the Australian industry, took a hug and sudden hit in 1995 (El Nino) and 1998 (El Nino). The main reason given is disease.
For years after the mid-90s there were theories among our fishermen that the “pillies” were gone for good, affecting other more desired species. (I would rather eat the oily little pillies than the deluxe reef fish for which they are used as bait, but that’s just me.)
It’s interesting that the sardine shocks coincided with El Ninos (strongly neg SOI) in a decade of four declared El Ninos. It’s also interesting that the pillies are now back in swarms.
Maybe it was just herpes that go ’em, but Phil’s article raises interesting possibilities.
Anchovies and hard boiled eggs …
mmm, go together like, well,
anchovies and LA Nina weather.
If you can get fresh anchovy or sardine, patiently fillet and stack in shallow layers between much parsley, garlic, breadcrumb and hard cheese. Bake. (The natural fishy oils will suffice for the cooking.)
On tasting you will entreat the gods to make you all mouth.
I will do it thx moso. Say, I don’t suppose I can use
tinned anchovy?/
No.
mosomoso’s treat sounds divine. Beth the tinned anchovies are too salty for this recipe.
Serfs don’t know nuthin. Acorn meal affects the brane …
not ter menshun the taste buds..
This is a perfect example of why we don’t allow serfs to approach the main house and why we prefer to communicate through our bailiffs. Next they’ll be wanting beeswax candles instead of tallow – or even electricity!
Serfs banned from the big house? Je suis desole!
Back to your original comment mosomoso. Disease? Or was it that the plankton supply had been cut off due to “climate change”?
Peter, the official story is herpes, but why they became so vulnerable in such numbers is unknown to me. Especially in ’95 their corpses were all over the beaches. It was supposed to be the death knell for something or other, proof of man’s greed and exploitation etc…but then all the little fish came back.
It wasn’t just oxygen deprivation due to red weed, froth etc since it took in so much of the continent, including the west. But living in the bush I notice that many species have boom and bust cycles. Every seven years our cicadas are so loud people get ill from the noise. Whale beachings have been known since the beginning of settlement in Sydney. Instead of putting on the latest Goretex fashions and heading down the harbour to save the whales, the Cammeraigal aborigines feasted for days.
OT: “Massive shake in Kathmandu!” – posted on FB three minutes ago by a friend.
It’s being widely reported in Australian media today that our BoM has announced a “substantial” El Nino is officially under way. It makes news here because it’s associated with the likelihood of drought, or worsening drought, depending where you happen to look. Given the great article and discussion here, I found the tone of this quote rather curious;
“This will be quite a substantial event,” said David Jones, head of climate monitoring at the bureau. “It’s not a weak one or a near miss” as in 2014, he said. “This event is perhaps running ahead of where the models had predicted.”
I hope the Anchovies win this one :-)
waz88
I often find seaweed a more reliable weather indicator than the forecasts from the Met Office only some 15 miles away….
Mind you, their forecasts change hourly and can encompass almost every possibility sometimes.
Hmm seems a bit like climate models, if you produce enough of them ONE of them must be nearly right sometimes
tonyb
BOM? ‘It all sounds like sea weed ter me, ter me,’
… or mebbe Lobster Quadrille.
https://ebooks.adelaide.edu.au/c/carroll/lewis/alice/chapter10.html
“This event is perhaps running ahead of where the models had predicted.”
Climate indicators don’t look terrific, but we can all take some comfort in the fact that David Jones and his models are predicting under-predicted tribulations. The man’s capacity to be wrong is little short of stupendous. That said, autumn westerlies and those SSTs aren’t boding well. A bloody aphid could tell that the signs aren’t too flash. David Jones predicting dire things is our main hope of better things.
I could point out that our worst winter conditions around here were in 1895, leading to late winter fires before the killer heat of 1896 (for Eastern Australia as well as Eastern US.) But talk of actual climate and of stuff that actually happened is of interest to few.
Here is the BoM announcement.
The Overview is pretty modest. No beat up, just information and a modest assessment rather than crying “Wolf!”
The BoM model has ONI between 1.5 and 1.9 by summer and fall. Long and hot. The slow ENSO neutral burn that started in 2011 has rendered the pause to all but roadkill, and now it will get its final glaze in a summer barbecue. It’s going to be good eating all the way through the NH autumn.
And oh yeah, 2014 was clearly the warmest year, but not for long. Lol.
Maybe the PDO index will get updated today. Oh what a relief that’s going to be.
Nick, thanks, I couldn’t find that earlier.
This is the report with the interview I was referring to http://www.smh.com.au/environment/weather/bureau-of-meteorology-declares-el-nino-event-in-australia-20150512-ggzdgy.html
(Sorry don’t know how to link on this ipad)
I agree with genghiscunn, the official press release is pretty straight.
The Sydney Morning Herald is a fervent reporter and campaigner for the catastrophic end of AGW, hyping up the warriors and generally taking hard and denigrating lines towards anyone who doesn’t toe the line. But it was the only story I found at the time quoting some specifically in the BOM. Perhaps it’s not so much David Jones quote that had the odd to of such certainty it was going to be large, but the way it was reported.
The report just got amplified on Yahoo News here. It’s never too soon to rely and alarm. Let’s see if they report the “anchovy all clear” if we get through the summer with no catastrophe.
Ron Graf
Interesting – but your Yahoo link isnt working.
In April the PDO index actually dropped to +1.44,
Remember a couple of years back when NZ was poised to have its hottest ever day? Headlines.
Nothing happened, not even close, and NZ’s hottest day is still from 1973 or thereabouts. No headlines. No mention.
So it is with ENSO.
El Nino’s have to come along, often two or three to a decade, and very strong ones have to occur. This fact seems to matter not at all. The needs of the media and the klimatariat must be met. So we get pictures of billowing wildfire smoke, blood red skies and quotes from David Jones. And it’s all vaguely tied in with our failure to “act” and “tackle” etc.
While the indicators are looking grim for my part of the world, when I look back on rainfall and temps for a hundred years and more I can see I have no right to expect continuation of the favourable conditions we enjoyed (here) between 2007 and 2012. Nor is there a reason to hope for good conditions because El Nino is absent. Our years of drought without El Nino, especially in the 1930s, should make that obvious to all (but don’t).
All one can do is watch the more reliable indicators, check short term predictions, sat, radar etc…and ignore all long-term rain forecasts from Jones and the BoM. Why these fail so badly is something I can only put down to models, since no unaided human could be that much of a klutz.
Fascinating and educational post. Thanks for helping me understand the dynamics involved. Thanks, also, to all who provided links and graphs so I could visualize the changes going on in the Pacific.
So, was 2014 an El Nino year?
The Westerly Wind Bursts appeared.
SSTs were anomalously high during the Spring.
Land-Ocean temperature indices were near records.
And the multi-variate enso index did indicate a persistent el nino:
http://www.esrl.noaa.gov/psd/enso/mei/ts.gif
It ( typical El Nino signatures ) just ended in July instead of peaking in winter.
On the other hand,
California and SW US drought continued ( instead of usual Cal rains ).
This shouldn’t be surprising – ENSOs are not identical spatially, neither should they be identical temporally.
ENSO ONI, 2014:
-0.6/-.0.6/-0.5/-0.1/+0.1/+0.1/0.0/0.0/+0.2/+0.5/+0.7/+0.7
Not much of an EL Nino year.
Well, that’s what I’m on about – we look at the equatorial Pacific as an indicator, and we look at winter for a maximum.
But the Pacific anomalies are not the ’cause’ of El Nino but the effect of a wave pattern. There’s indication that the albedo change, particularly over land, is the source of increased ElNino temperatures, so a similar wave pattern may well have been the source of 2014 temperature change, even if the Pacific signature was missing or terminated early.
Last year, EN started early but was already declining by May.
This year, similar event, but starting more typically and still intensifying as of May.
Will it last through the winter?
https://bobtisdale.files.wordpress.com/2015/04/figure-10.png
The Guardian, June 2014
http://www.theguardian.com/environment/2014/jun/11/-sp-el-nino-weather-2014
“How El Niño will change the world’s weather in 2014”
“With a 90% chance of the global weather phenomenon striking this year, impacts both devastating and beneficial will be felt from India to Peru. “
Just one problem. With the blob, this year seems to be setting up as an el nino NORTHERN oscillation. Guessing the anchovies are less happy off California.
Can you see a fundamental reason why a failure of upwelling in the northern hemisphere and attendant warm water could not be the harbinger?
We tend to think of the warm water actually moving in el ninos, but it may just be the form of reaction waves creating upwelling and downwelling as they propagate. The actual molecules staying pretty much where they are.
Interesting way to check would be look at absolute temperature rather than anomaly.
There is one real big difference between El Nino and the red blob: rain!
Has anyone considered that the big red blob was a massive heat vent? With no rain or clouds in SW US heat could escape into space with no resistance.
It certainly functions as a heat vent, at least from the ocean to the atmosphere, as does the warm anomaly when it happens in the southern hemisphere.
Statistically, el ninos cause either floods or droughts, significantly weighted to floods, but ninos are by no means a guarantee of rain for California.
NPR:
The rights of the individual are under attack around the world and right here at home. At no time in our lifetimes has the government been more antagonistic to personal liberty and less tolerant to those who refuse to adopt the official, consensus of opinion, even on matters of science.
I have been predicting a moderate to strong El Nino for 2015-16 since November of last year:
http://astroclimateconnection.blogspot.com.au/2014/11/evidence-that-strong-el-nino-events-are_13.html
with the next two occurring in 2019-20 and 2024-25.
My hypothesis explains the timing of almost all moderate to strong El Nino events since 1870.
“WWB” –i.e., Westerly Wind Bursts (strong west equatorial pacific winds that occur prior to ENSO events)
https://bobtisdale.files.wordpress.com/2015/04/figure-111.png
For those who want a simple explanation [at least as simple as I can make it] as to why I can predict when an El Nino start:
Lunar Tides – instigate Madden Julian Oscillations (MJO’s) that penetrate into the western equatorial Pacific Ocean – these are associated with an increase in westerly wind bursts (and tropical cyclone pairs located on either side of the Equator).
When the cumulative strength of the Pacific Penetrating MJO’s increases this increases the cumulative strength of the WWB’s that set of downwelling Kelvin Waves and decrease the strength of the easterly equatorial trade winds. This flips the Pacific into an El Nino mode.
The resulting type of the El Nino (1. Strong classical El Nino, 2. El Nino Modiki or 3. Weak El Nino) depends upon the state of the energy recharge cycle of the equatorial Pacific Ocean when the cumulative strength of WWB’s increases.
Please remember this is ONLY a simplified explanation.
Ian
The tidal aspect may well play a role in ENSO.
How does it tie in with the strong Dec-Jan phase-locking of el Nino?
philsalmon, Contrary to what most people think, tides are a combination of solar and lunar tides. The solar part of the lunar-solar tides peak in strength at Perihelion (when the Earth is closest to the Sun) which currently occurs around January 3rd.
Variations in the solar part of the lunar-solar tides do not make that much difference if you are looking at the general tides but if you look at the strength of the peak tides then the variation solar component throughout the year makes a significant difference to their overall peak strength.
Please see:
http://astroclimateconnection.blogspot.com.au/2013/12/variations-in-earths-climate-on-decadal.html
Ray, R.D. and Cartwright, D. E., 2007, Times of peak astronomical
tides, Geophys. J. Int. (2007) 168, 999–1004
Reblogged this on I Didn't Ask To Be a Blog and commented:
A paeon of praise to the biggest little fish in the world.
philsalmon:
Not being alone in one’s thinking scarcely qualifies as sound scientific grasp. As expected, An and Jin’s non-linear heating model incorporating Bjerknes’ primitive idea of “feedback” proves pitifully incapable of explaining ENSO observations, let alone providing credible predictions.
Your faith in its scientific value seems as misplaced as your response here to my remark addressed not to you, but to the holder of the cockeyed notion that the ENSO “trigger is tidally driven.” Meanwhile my comment at 6:08pm yesterday, which addresses the mechanism of your topic–upwelling off Peru–goes unnoticed.
Strange technical difficulties in having comments posted AFTER logging in forced me to post here, instead of the intended place below my comment yesterday at 6:15pm.
Could Phil Salmon bring us up to date on the decades old controversy as to the (presumably) ocean oscillation related correlation of high European sardine catches and notable vintages of such coastal climate sensitive wines as port and Sauternes ?
Umm – not exactly, however please download the pdf of the publication by Klyashtorin in the second post by Holmsteinn Jonasson, below.
Pingback: El Niño, se fossi un’alice non mi fiderei | Climatemonitor
The next regime PDO shift from cold to warm is to be expected around 2016.3, according Hale cycles http://www.john-daly.com/theodor/pdotrend.htm. AMO going negative ?http://www.climate4you.com/images/NODC%20NorthAtlanticOceanicHeatContent0-700mSince1979%20With37monthRunningAverage.gif
Sea temp around Reykjavik (Iceland) unusually low ! https://www.facebook.com/photo.php?fbid=10206676888389262&set=p.10206676888389262&type=1&theater
NASA telur hugsanlega um viðsnúning að ræða http://earthobservatory.nasa.gov/IOTD/view.php?id=85532
The PDO index reached 2.51 in January 2015.
I have been watching the PDO closely, it has now dropped to 0.99 according to NOAA (whose values seem to be slightly lower than JISAO). big question is whether this positive excursion is a blip, with return to negative values (which I expect to be the case), or we are transitioning to a predominantly positive period (which i don’t expect is the case, but who knows)
In honour of Leonid Klyashtorin……Remember the Peruvian anchovies?
Gary Sharp of the Salinas, CA ‘Center for Climate/Ocean Resources Study’ has been associated with VNIROV scientist Leonid Klyashtorin in Moscow for years. They met on their common interest of climate regime issues, fishery ecosystem and fisheries consequences, he writes. Remember the Peruvian anchovies? Both scientists are strong proponents of the 60-70 year climate cycles.
Gary introduced the Russian to the US and edited and translated some of his writings. Klyasthtorin came to fame in the climate world in the West when his 2002 book appeared in an English translation in 2007.
The book “Cyclic Climate Changes and Fish Productivity” is available HERE https://dl.dropboxusercontent.com/u/59135553/Klyashtorin&Lyubushin-CC_&_Fish_Productivity.pdf.
Leonid Klyashtronin died of a stroke on February 23rd, after giving his last lecture at the Institute on the 14th. https://dl.dropboxusercontent.com/u/59135553/Klyashtorin-Cyclic%20Climate%20Fluctuat.slides.pdf
Hi Holmsteinn, thanks for this, Klyashtorin’s work figured heavily in the stadium wave. I noted his untimely death somewhere on a previous thread
Holmsteinn
Thanks for this link to the Klyashtorin book – important work ahead of its time .
That was a good post.. Thank you Phil Salmon.
Pingback: Worry again about a huge El Niño (droughts, floods, etc)! Or listen to the pros. | The Fabius Maximus website
Robert Marston Fanney, writing as Robert Scribbler, has begun to re-run his alarmist predictions from last year about a “super El Nino” coming. Although with no visible qualifications, and a terrible track record of predictions, he has a big following.
https://robertscribbler.wordpress.com/2015/05/15/summer-el-nino-on-the-way-long-range-models-are-still-freaking-out/
He mentions the “the so-called Super El Nino Threshold of +1.8 C.”. I see no mention on Google of this. NOAA describes a “strong El Niño” as greater than or equal to 1.5°C, but doesn’t mention a higher level. Has anyone seen other mentions of this, or is he making this up?
Pingback: Choose your facts: learn about the El Niño from journalists or activists | The Fabius Maximus website
Pingback: Weekly Climate and Energy News Roundup #180 | Watts Up With That?