
by Judith Curry
Arguably the most poorly documented aspect of climate models is how they are calibrated, or ‘tuned’
I have raised a number of concerns in my Uncertainty Monster paper and also in previous blog posts. A recent paper from the German climate modeling group at MPI sheds some light on this issue.
Tuning the climate of a global model
Thorsten Mauritsen, Bjorn Stevens, Erich Roeckner, Traute Crueger, Monika Esch, Marco Giorgetta, Helmuth Haak, Johann Jungclaus, Daniel Klocke, Daniela Matei, Uwe Mikolajewicz, Dirk Notz, Robert Pincus, Hauke Schmidt, and Lorenzo Tomassini
Abstract. During a development stage global climate models have their properties adjusted or tuned in various ways to best match the known state of the Earth’s climate system. These desired properties are observables, such as the radiation balance at the top of the atmosphere, the global mean temperature, sea ice, clouds and wind fields. The tuning is typically performed by adjusting uncertain, or even non-observable, parameters related to processes not explicitly represented at the model grid resolution. The practice of climate model tuning has seen an increasing level of attention because key model properties, such as climate sensitivity, have been shown to depend on frequently used tuning parameters. Here we provide insights into how climate model tuning is practically done in the case of closing the radiation balance and adjusting the global mean temperature for the Max Planck Institute Earth System Model (MPIESM). We demonstrate that considerable ambiguity exists in the choice of parameters, and present and compare three alternatively tuned, yet plausible configurations of the climate model. The impacts of parameter tuning on climate sensitivity was less than anticipated.
Published in Journal of Advances in Modeling Earth Systems [link]. Excerpts are provided below that provide some context; interested readers are encouraged to read the entire paper.
Introduction
Although climate models and their configuration are well-documented, the process through which a particular model configuration comes into being is not, and as a result, the process of selecting a model configuration is shrouded in mystery.
Model tuning is not a well-defined term. Often, model calibration or model tuning is associated with the last step of a broader model development cycle, after structural enhancements, improved parameterizations and refined boundary conditions have been implemented, wherein selected parameters are adjusted so as to better match the model results with some targeted features of the climate system . The idea that models need to be harmonized with observations is of course applicable to the model development process as a whole, as parameterizations and grid configurations are usually selected based on their ability to improve the representation of some aspect of the climate system.
The need to tune models became apparent in the early days of coupled climate modeling, when the top of the atmosphere (TOA) radiative imbalance was so large that models would quickly drift away from the observed state. Initially, a practice to input or extract heat and freshwater from the model, by applying flux-corrections, was invented to address this problem . As models gradually improved to a point when flux-corrections were no longer necessary , this practice is now less accepted in the climate modeling community. Instead, the radiation balance is controlled primarily by tuning cloud-related parameters at most climate modeling centers , while others adjust the ocean surface albedo or scale the natural aerosol climatology to achieve radiation balance. Tuning cloud parameters partly masks the deficiencies in the simulated climate, as there is considerable uncertainty in the representation of cloud processes. But just like adding flux-corrections, adjusting cloud parameters involves a process of error compensation, as it is well appreciated that climate models poorly represent clouds and convective processes.
Arguably, the most basic physical property that we expect global climate models to predict is how the global mean surface air temperature varies naturally, and responds to changes in atmospheric composition and solar insolation. We usually focus on temperature anomalies, rather than the absolute temperature that the models produce, and for many purposes this is sufficient.
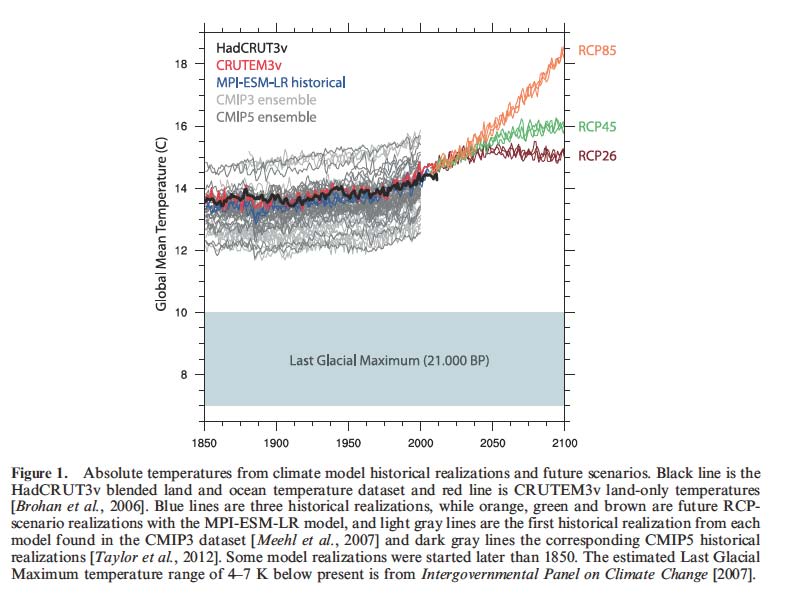
Figure 1 instead shows the absolute temperature evolution from 1850 till present in realizations of the coupled climate models obtained from the CMIP3 and CMIP5 multimodel datasets. There is considerable coherence between the model realizations and the observations; models are generally able to reproduce the observed 20th century warming of about 0.7 K, and details such as the years of cooling following the volcanic eruptions.
Yet, the span between the coldest and the warmest model is almost 3 K, distributed equally far above and below the best observational estimates, while the majority of models are cold-biased. Although the inter-model span is only one percent relative to absolute zero, that argument fails to be reassuring. Relative to the 20th century warming the span is a factor four larger, while it is about the same as our best estimate of the climate response to a doubling of CO2, and about half the difference between the last glacial maximum and present.
To parameterized processes that are non-linearly dependent on the absolute temperature it is a prerequisite that they be exposed to realistic temperatures for them to act as intended. Prime examples are processes involving phase transitions of water: Evaporation and precipitation depend non-linearly on temperature through the Clausius-Clapeyron relation, while snow, sea-ice, tundra and glacier melt are critical to freezing temperatures in certain regions. The models in CMIP3 were frequently criticized for not being able to capture the timing of the observed rapid Arctic sea-ice decline.
While unlikely the only reason, provided that sea ice melt occurs at a specific absolute temperature, this model ensemble behavior seems not too surprising when the majority of models do start out too cold.
In addition to targeting a TOA radiation balance and a global mean temperature, model tuning might strive to address additional objectives, such as a good representation of the atmospheric circulation, tropical variability or sea-ice seasonality. But in all these cases it is usually to be expected that improved performance arises not because uncertain or non-observable parameters match their intrinsic value – although this would clearly be desirable – rather that compensation among model errors is occurring. This raises the question as to whether tuning a model influences model-behavior, and places the burden on the model developers to articulate their tuning goals, as including quantities in model evaluation that were targeted by tuning is of little value. Evaluating models based on their ability to represent the TOA radiation balance usually reflects how closely the models were tuned to that particular target, rather than the models intrinsic qualities.
These issues motivate our present contribution where we both document and reflect on the model tuning that accompanied the preparation of a new version of our model system for participation in CMIP5. As decisions were made, often in the interest of expediency, a nagging question remained unanswered: To what extent did our results depend on the decisions we had just made?
Tuning the Model Climate
Formulating and prioritizing our goals is challenging. To us, a global mean temperature in close absolute agreement with observations is of highest priority because it sets the stage for temperature-dependent processes to act. For this, we target the 1850–1880 observed global mean temperature of about 13.7C. Beyond that, we prioritize having globally averaged TOA shortwave absorption and outgoing longwave radiation in good agreement with satellite observations, along with a representation of important climate variability modes. We would accept a model if the global mean cloud cover is above 60 percent in present-day climate, even if satellite-estimates are generally higher, while the bulk of observational estimates would allow a broader range.
Discussion
Within the foreseeable future climate model tuning will continue to be necessary as the prospects of constraining the relevant unresolved processes with sufficient precision are not good.
Climate model tuning has developed well beyond just controlling global mean temperature drift. Today, we tune several aspects of the models, including the extratropical wind- and pressure fields, sea-ice volume and to some extent cloud-field properties. By doing so we clearly run the risk of building the models’ performance upon compensating errors, and the practice of tuning is partly masking these structural errors. As one continues to evaluate the models, sooner or later these compensating errors will become apparent, but the errors may prove tedious to rectify without jeopardizing other aspects of the model that have been adjusted to them. To aid the longterm development of our model we choose a tuning-strategy with only a small number of parameter changes between different model versions and resolutions, such that it will be easier to identify and understand how the model formulation can be improved.
The model tuning process at our institute is artisanal in character, in that both the adjustment of parameters at each tuning iteration and the evaluation of the resulting candidate models are done by hand, as is done at most other modeling centers. It is, however, at least conceptually possible to automate this process and find optimal sets of parameters with respect to certain targets. When considering model biases that appear on long time-scales (months to years), one option is to use the full model and search through parameter-space seeking areas in which errors are minimized. Alternatively, one can use a relatively small number of model runs to build a statistical model, or emulator, of the error as a function of parameter space to obtain parameter sets that minimize model error. Any such objective tuning algorithm requires a subjective choice of a cost function and this involves weighting trade-offs against one another, which is difficult to do ahead of time.
One of the few tests we can expose climate models to, is whether they are able to represent the observed temperature record from the dawn of industrialization until present. Models are surprisingly skillful in this respect, considering the large range in climate sensitivities among models – an ensemble behavior that has been attributed to a compensation with 20th century anthropogenic forcing: Models that have a high climate sensitivity tend to have a weak total anthropogenic forcing, and vice-versa. A large part of the variability in inter-model spread in 20th century forcing was further found to originate in different aerosol forcings.
It seems unlikely that the anti-correlation between forcing and sensitivity simply happened by chance. Rational explanations are that 1) either modelers somehow changed their climate sensitivities, 2) deliberately chose suitable forcings, or 3) that there exists an intrinsic compensation such that models with strong aerosol forcing also have a high climate sensitivity. Support for the latter is found in studies showing that parametric model tuning can influence the aerosol forcing . Understanding this complex is well beyond our scope, but it seems appropriate to linger for a moment at the question of whether we deliberately changed our model to better agree with the 20th century temperature record.
The MPI-ESM was not tuned to better fit the 20th century. In fact, we only had the capability to run the full 20th Century simulation according to the CMIP5-protocol after the point in time when the model was frozen. Yet, we were in the fortunate situation that the MPI-ESM-LR performed acceptably in this respect, and we did have good reasons to believe this would be the case in advance because the predecessor was capable of doing so. During the development of MPI-ESM-LR we worked under the perception that two of our tuning parameters had an influence on the climate sensitivity, namely the convective cloud entrainment rate and the convective cloud mass flux above the level of nonbuoyancy, so we decided to minimize changes relative to the previous model. The results presented here show that this perception was not correct as these parameters had only small impacts on the climate sensitivity of our model.
Climate models ability to simulate the 20th century temperature increase with fidelity has become something of a show-stopper as a model unable to reproduce the 20th century would probably not see publication, and as such it has effectively lost its purpose as a model quality measure. Most other observational datasets sooner or later meet the same destiny, at least beyond the first time they are applied for model evaluation.
That is not to say that climate models can be readily adapted to fit any dataset, but once aware of the data we will compare with model output and invariably make decisions in the model development on the basis of the results. Rather, our confidence in the results provided by climate models is gained through the development of a fundamental physical understanding of the basic processes that create climate change. More than a century ago it was first realized that increasing the atmospheric CO2 concentration leads to surface warming, and today the underlying physics and feedback mechanisms are reasonably understood (while quantitative uncertainty in climate sensitivity is still large).
JC comment: This paper is indeed a very welcome addition to the climate modeling literature. The existence of this paper highlights the failure of climate modeling groups to adequately document their tuning/calibration and to adequately confront the issues of introducing subjective bias into the models through the tuning process.
Tuning/calibration is unavoidable in a complex nonlinear coupled modeling system. The key is to document the tuning, both the goals and actual calibration process, in the manner in which the German climate modeling group has done.

“The impacts of parameter tuning on climate sensitivity was less than anticipated.”
That’s to be expected. Once the models assume that temperature is driven almost exclusively by CO2 [they do] and their parameters are constrained so that calculated temperature matches observed temperature [they are – it’s called “constrained by observation” – check the IPCC report] , then no matter what you do to the parameters you end up with the same overall result.
It’s not the parameters they need to work on, it’s the underlying assumptions.
I agree!
Anyone interested in a model that gets it right check out this one;
http://judithcurry.com/2011/07/25/loehle-and-scafetta-on-climate-change-attribution/
I wrote to Loehle last week (copied Judith) asking for an update since Loehle & Scafetta 2011 now has 2 more years of data. More importantly 2 more years of data which FITS PERFECTLY to their model’s forecast.
Loehle replied saying the new data does indeed fit perfectly but since the model is decadal he didn’t think updating it after only two years was useful. Judith also replied saying she’d see what the authors were up to these days and possibly generating a new article.
Amazing. Here’s flawless model being widely ignored. Why? Because it finds AGW warming of only 0.06C/decade and orbital mechanics explaining the rest. If L&S 2011 is correct there’s simply no basis whatsoever to be concerned about CO2 emission. And that’s why it’s ignored despite being perfectly predictive.
Not as good as Vaughan Pratt’s one that doesn’t have to add an arbitrary linear trend after 1950 like this to get a fit.
It’s not arbitrary. It’s a residual. Learn how to read.
It’s light years beyond Vaughn Pratt’s AGU poster and unlike Pratt’s garbage it doesn’ leave out the pause but rather predicts it. Pratt uses a 21 year filter which excludes the hard-to-account-for pause because it’s too recent to make it through the filter.
@DS: unlike Pratt’s garbage it doesn’ leave out the pause but rather predicts it.
To the contrary, my poster predicts the pause. If you look at Figure 11 you’ll see three components labeled MUL (multidecadal climate), SOL (correlated with solar phenomena), and DEC (decadal climate). Only MUL is based on models, namely SAW (modeling long-term natural fluctuations) and AGW (modeling the portion correlated with increasing CO2). SOL and DEC are simply the low and high frequency components of the residual after subtracting the modeled portion from HadCRUT3.
The low-frequency part, SOL, shows a strong 20-year-period cycle that turns down between 2000 and 2010 just enough to pretty much cancel the rising portion of MUL This is a sufficiently regular cycle as to have considerable predictive value. It is not part of any model, it is simply what is in HadCRUT3 itself in that spectral band, across more than a century (so it’s not just an endpoint effect).
Even without the data from 2000 onwards it still predicts a pause for the past decade.
@DS: Pratt uses a 21 year filter which excludes the hard-to-account-for pause because it’s too recent to make it through the filter.
Welcome to wavelet-based spectral analysis (as distinct from Fourier analysis, which some people assumed I was doing). The whole point of the 21-year filter is so that the 20-year period does not become part of MUL.
What the 21-year filter accomplishes is to separate HadCRUT3 into a slow-changing multidecadal component (MUL) and faster-changing components containing periods of 20 years and below. Subsequent filters then separate the latter into SOL and DEC (and SOL into HALE + TSI as shown in Figure 9, note in particular the greater regularity of HALE compared to TSI).
MUL + SOL + DEC is exactly HadCRUT3. Contrary to what some seem to believe, my analysis does not hide any part of HadCRUT3. I analyzed the whole thing, with nothing discarded.
The same conclusion obtains even when my 6-parameter SAW model is simplified to a mere 3 parameters. This is because the 3 additional parameters governing sawtooth harmonics 4 and 5 (which are very weak compared to harmonics 2 and 3) are only there to account for very small (order of 10 mK) oscillations slower than 20 years (harmonic 5 is a tad over 30 years). Even when only harmonics 2 and 3 are modeled the 20-year period in SOL is still clearly visible.
One can also drop the “Hansen delay” parameter (i.e. set it to zero) without changing SOL significantly, thereby further simplifying the model to a mere 5 parameters (3 for SAW and 2 for AGW). Neglecting this delay merely reduces the observed climate sensitivity to below 2 C, an effect understood (at least qualitatively) since 1985. This neglect doesn’t seriously change the shape of either MUL or SOL.
There may be alternative analyses of HadCRUT3 into spectral bands that don’t show this 20-year cycle and therefore don’t make this prediction. If so I’d be very interested in seeing them, especially if they can be simplified to 5 parameters.
Try to get the POS published, Pratt. Like Loehle & Scafetta did.
@DS (to Jim D): It (the linear residual in the L&S paper) is not arbitrary. It’s a residual. Learn how to read.
L&S account for the linearity of their residual in
http://judithcurry.com/2011/07/25/loehle-and-scafetta-on-climate-change-attribution/
as follows.
The estimated AGW component matches theory, since the log of an exponential rise in carbon dioxide should give an approximatelinear trend (as in fact the climate models do).
As pointed out by Hofmann, Butler and Tans in 2009, a much better fit to the Keeling curve is obtained when modeled as the sum of a constant base (they picked 280 ppmv) plus an exponentially growing anthropogenic component. We can assume the latter is exp(t) for a suitable choice of time unit t, with t = 0 somewhere in the middle of this century corresponding to 280+280 = 560 ppmv. Using units that make 280 ppmv one unit, temperature should grow as ln(1 + exp(t)).
Right now exp(t) = (400 − 280)/280 = 0.43. It was well below 1 throughout the past century and therefore ln(1 + exp(t)) was well approximated by exp(t) throughout the century (the Taylor series for ln(1+x) starts with x − x^2/2 + …). This is an exponentially growing curve, not the linear one depicted by L&S.
When exp(t) significantly exceeds 1, ln(1 + exp(t)) will start to approximate the linear function t referred to by L&S. This is unlikely to happen before the 22nd century.
Yes, it only asymptotes to linear as the CO2 amount far exceeds 280, which is not true now or in the near future.
SpringyBoy,
Pratt presented this at the AGU. He got eyeballs there and he got eyeballs here. We learn from his explanations. Consider just his simple demolition of the L&S fit by mentioning the ln(1 + exp(t)) adjustment.
That by itself is devastating to L&S’s initial premise that the early rise was natural.
I have more but want to see you dig a deeper hole.
WebHubTelescope: That by itself is devastating to L&S’s initial premise that the early rise was natural.
Don’t be overly dramatic. “Devastating”? Hardly. It was just a different model.
It’s worse than devastating. The duo of L&S also didn’t consider that the underlying trend may have been one of long-term cooling.
Why they assumed that the long-term trend was naturally warming, based on a less than one hundred year period that coincided with the beginning of the oil age is completely dumbfounding.
At least Vaughan Pratt doesn’t make those kind of rookie mistakes. And I really doubt that VP has a political agenda, unlike Loehle. It makes sense that Loehle would bury his analysis in foo.
http://www.nytimes.com/imagepages/2013/04/21/blogs/dotkaufman.html
Very nice, CH. The context is here.
WebHubTelescope: Why they assumed that the long-term trend was naturally warming, based on a less than one hundred year period that coincided with the beginning of the oil age is completely dumbfounding.
The natural trend over the last 100 years is either no change, cooling, or warming, or an oscillation of some sort. They showed that if the natural trend is warming, then the effect of CO2 is slight. If you make different assumptions then you get different results. Vaughan Pratt assumed that the CO2 effect was of a particular size; it’s hardly surprising that he got a different result for the residual (“natural”) trend. Which assumptions are “true” (or at least sufficiently accurate and reliable) can’t be decided on present data.
The only “rookie mistake” is to believe that a good fit of a model to a set of data that has been repeatedly modeled over decades provides a reason to credit the model; all it does is provide a reason to credit the modelers’ ingenuity. 20 years from now we’ll have lots of “out of sample” data with which to test the models, rather than the modelers’ ingenuity. We may not yet know which model(s) is(are) accurate enough, but we’ll at least have some rank orderings of their inaccuracy: cusum, et al.
@MM: Vaughan Pratt assumed that the CO2 effect was of a particular size
Two points. First, it wasn’t an assumption. The panel under Figure 3 says “The remaining three parameters, 2.83 (climate sensitivity), 287 (preindustrial CO2), and 15 (years of Hansen delay), are estimated by a least squares fit of F3(AGW(y)) to F3(DATA – SAW).”
Further analysis has persuaded me that the delay is more like 11 years. Since each additional year of delay adds a tad over 0.04 C to this method of estimating climate sensitivity, a reduction in delay of 4 years lowers my estimate to 2.66 C per doubling of CO2. This dependency implies that prevailing climate sensitivity (as explained at the bottom of that panel) cannot be estimated from observed temperature more accurately than the delay. And since delay is very hard to measure precisely, so is climate sensitivity.
Second, I prefer the term AGW over “CO2 effect.” Our increasing energy consumption clearly emits more CO2, but it also emits aerosols and other greenhouse gases, and the methodology of my poster does nothing to distinguish these. We measure CO2 more carefully than the other emissions, but that merely makes CO2 an excellent proxy for the collective effect of all emissions. We should not infer that CO2 is the sole cause of that part of HadCRUT3 that is well correlated with rising CO2 because the other emissions may also be well correlated. The poster says “Whether SAW describes a single phenomenon or several is an excellent question” but I should also have said this about AGW.
Pratt, in a classic example of
cherry pickingmodel tuning, chose 287ppm for pre-industrial CO2. Now mind you I’m not arguing you can’t find a legitimate source to support that number. I’m saying you can find a range of legitimate choices and the most widely given I believe is 280ppm. What I’m saying is that number gives Pratt the best r-factor vs. other legitimate estimates.This is how model tuning is done, folks. Now imagine many many more such choices in full blown GCMs. There are so many choices you need a super-computer to even begin exploring fudge-factor space.
You really need to know your own party line better. Consensus is agw from CO2 started circa 1950 and before that particulates were negating CO2 because much of the emissions were dirty coal in boilers and furnaces not clean natural gas or highly refined gasoline. It’s a decent argument. It’s a tuning choice in fact. Heck Hansen wants to use it to tune out “the pause” by saying China’s rapid growth in dirty coal plants and US growth in clean natural gas is the perp behind the pause.
I’ve argued both ways on the AGW begins in earnest in latter half of 20th century. I have no preference. It depends on the narrative you want to gin up. I can screw up some part of the consensus either way, buddy.
And look at Pratt stuffing an extra 2% in over the commonly given pre-industrial level (287 vs. 280 ppm) in order to fluff up the sensitivity over whatever period he cherry picked for the curve fitting. HadCRUT3 I think it was.
@Dr. Paul Pukite a.k.a. webhubtelescope a.k.a. @whut
What’s the barrier to entry for an AGU poster? Near as I can tell it’s around $150+tax to rent a table. And it’s only 20 minutes from Berkeley so Pratt didn’t need airfare, rental car, hotel, and if my experience at such events is any guide no money for all you can eat and drink in after-parties (if you like that sort of thing) put on by people trying to sell schit the attendees tend to buy for their work.
Vaughan Pratt: First, it wasn’t an assumption. The panel under Figure 3 says “The remaining three parameters, 2.83 (climate sensitivity), 287 (preindustrial CO2), and 15 (years of Hansen delay), are estimated by a least squares fit of F3(AGW(y)) to F3(DATA – SAW).”
The main point was that you began with different assumptions: for example, the functional form for the regression and the Hansen delay (it isn’t that uncommon in regression to estimate something that doesn’t exist — it’s just another facet of selection of functional form.)
If you read from the top, you’ll see that I objected to WHT’s claim that your model was devastating to another model; it’s nothing more than another model. I applauded your ingenuity and said that the test or comparison of the models will incorporate future data.
Second, I prefer the term AGW over “CO2 effect.”
That contradicts your derivation, which was directed at estimating the CO2 effect. It’s a justifiable preference overall, since AGW can include non-industrial effects like deforestation, UHI, etc. But the great public policy debate is about restricting CO2. Most remedies for deforestation refer to soil conservation and other advantages to reforestation. So I focus on the problem of estimating the CO2 effect. If it should turn out that anthropogenic effects on warming are mostly deforestation and UHI, then the terms of the future discussion alter greatly.
@MM: The main point was that you began with different assumptions: for example, the functional form for the regression and the Hansen delay (it isn’t that uncommon in regression to estimate something that doesn’t exist — it’s just another facet of selection of functional form.)
Yes, exactly. What I was objecting to was your statement that I “assumed that the CO2 effect was of a particular size.” If by “size” you meant “form” then I have no objection, but I would consider this a nonstandard use of “size.”
@MM: That contradicts your derivation, which was directed at estimating the CO2 effect.
If by “effect” you mean “correlation” then again I have no objection. Usually however I think of “effect” as meaning “causal effect.” Nowhere in my poster do I claim any causal effect of CO2. What the poster does is to estimate a relation between CO2 and temperature, more precisely a functional dependence.
Suppose CO2 had exactly zero effect on temperature, which was increasing instead due to some other factor that we discover some time in the future was well correlated with CO2. I can still estimate the relation between CO2 and temperature today, which is all I do in my poster, but I can’t infer causality from that relation because I can’t rule out the possibility that some other factor more or less well correlated with CO2 is causing the rise. Some other line of reasoning is needed to pin the blame on CO2.
If it should turn out that anthropogenic effects on warming are mostly deforestation and UHI, then the terms of the future discussion alter greatly.
We can rule out UHI right away on the ground that global warming is observed at sea as well as on land (whether urban or rural). There are no urban heat islands at sea, nor on Arctic sea ice, hence UHI cannot explain global warming.
Deforestation does not change the “terms of the discussion” at all because it contributes to global warming by raising CO2 and is therefore incorporated into my poster. Plants consume twice as much CO2 via photosynthesis as they emit via respiration, so removing plants has the net effect of raising CO2. Nowhere does my poster distinguish between the various mechanisms by which humans raise CO2.
We can nevertheless quantify the relative magnitudes of industrial emissions of CO2 and the CO2 impact of human-caused deforestation. The Carbon Dioxide Information Analysis Center estimates both, with industrial emissions now up to around 10 gigatonnes of carbon (GtC) a year and deforestation adding a further 1.5 GtC/yr.
Since plants on land consume 120 GtC/yr and emit 60 (see this figure) the net effect of removing all plant life from the land (but leaving microbial life in the soil which does not consume CO2 but only emits it via respiration) would be to add 60 GtC/yr to the atmosphere. It would seem therefore that deforestation is in effect removing around 2.5% of terrestrial plant life per year when measured in this way.
@DS: What I’m saying is that number gives Pratt the best r-factor vs. other legitimate estimates.
I don’t understand this objection. The point of maximizing R2 is to fit the model to the data as closely as possible. R2 (more properly R^2) is the ratio of the variance of the best-fit model to that of the data. It is a theorem about the best fit that the variance of the residual (data minus model) is exactly the variance of the data minus the variance of the model, whence 1 − R2 is exactly the ratio of the variance of the residual to that of the model. It follows that R2 can never exceed 1 (if it does then the model is not the best fit), and equals 1 if and only if the residual has zero variance, namely when the fit is exact.
We don’t have a precise value for preindustrial CO2—the youngest Vostok ice core sample pegged it at 284 ppmv but that was over two thousand years ago. The number 280 is simply a round number and not a precisely measured value. I therefore included preindustrial CO2 as one of the unknown parameters to be determined by least-squares fitting. There is nothing in my formula AGW(y) aimed at favoring a high or low climate sensitivity, so your claim of “cherry picking 287” is unsupportable, it is simply the value that gives the best fit of the model to the data. Setting it to 280 would give a model that does not fit the data as well, which seems to be what you’re proposing.
Vaughan Pratt: Nowhere in my poster do I claim any causal effect of CO2. What the poster does is to estimate a relation between CO2 and temperature, more precisely a functional dependence.
That does even more to undermine WHT’s claim that your model [devastated] another model. It is, as I wrote, just another model. A nice model, as I wrote when you put it up: either the Holy Grail or an insubstantial facsimile. Until it passes the stringent tests posed by out of sample data it does not [devastate] anything.
@MM: That does even more to undermine WHT’s claim
My objection to your use of the term “CO2 effect” in this context has no bearing on WHT’s comparison. This is because neither WHT nor L&S nor I refer anywhere in this context to the effect of CO2. L&S use the term “anthropogenic effect” in their paper, and my use of the term “AGW” serves the same purpose. The term “CO2 effect” was introduced into this discussion only by you, not by WHT or L&S or me.
The kind of analysis performed by L&S can only support a correlation between CO2 and temperature, not a causal effect. The same is true of my poster. Where we differ is in modeling the rise of CO2: L&S assume exponential growth (which hindcasts terribly) whereas I use the model of Hofmann, Butler and Tans, 2009, namely an exponential added to the preindustrial level. This difference bears only on the relationship of CO2 to temperature, with no dependence on any presumption of causality.
Flawed Theory does result in Flawed Models and Flawed Forecasts.
CO2 is a forcing like the sun or volcanoes. Increasing it leads to warming. I think no scientist questions this. As they say at the end, this part was realized a century ago.
I think some do question it and many more will do, if the cooling kicks in. Many things were realized a century (and more) ago and they were rejected.
CO2 is a forcing like the sun or volcanoes
Why don’t you explain the forcing say from volcanic with regard to the mechanisms then? Is a linear response theorem available?
JimD,
I assume you can point at least one teensy weensy actual experiment showing that surrounding an object with CO2 will raise its temperature.
Only joking, I know you can’t. Sorry, I know its bad form to challenge an unarmed person to an intellectual duel
I apologise most deeply.
Live well and prosper,
Mike Flynn.
maksimovich, volcanoes, like aerosols, force by increasing the global albedo leading to cooling. This was observed after Pinatubo. Albedo changes can also be expressed in W/m2 to compare with other forcings. Doubling CO2 gives 3.7 W/m2, adding 1% to solar constant gives 3.4 W/m2, increasing earth’s total albedo from .30 to .31 gives 3.4 W/m2, etc.
ozziostrich, you are just asking for a physics experiment. I am sure any physics lab has the equipment to do this. You need to look at cooling rates when a warm object is or is not surrounded by GHGs. In fact, a good physics problem is to solve this hypothetical situation (pure physics, not climate, note). The cooling rate is reduced by the backradiation from the gas which only emits that when it is a GHG.
All forcings are not equal. It’s silly and naive to compare longwave forcing to shortwave forcing. Matter responds differently to different frequencies of radiation. Very differently in some cases. Critically water is transparent to shortwave and opaque to longwave. Given 70% of the earth’s surface is covered by water it’s uber-ignorant to equate longwave and shortwave forcing.
volcanoes, like aerosols, force by increasing the global albedo leading to cooling. This was observed after Pinatubo
Volcanic aerosols also through fast heterogeneous reactions destroy O3,in the polar regions causing a cooling of the stratosphere and changing the equator pole T gradient,this in turn leads to an enhanced polar vortex,decreased polar advection and enhanced winter surface warming in NH eurasia from a positive AO.
Pinatubo also injected significant water vapour into the tropical stratosphere and increased iron particles precipitation into the SO as observed by a decreased CO2 fraction, and a increased O2 pulse in the SO.
In addition the forcing from acid rain tends to decrease CH4 emission.
This is not a simple linear problem.
Adding 3 W/m2 coming in, or blocking 3 W/m2 from coming out have comparable magnitudes of climate consequences. Which is worse, I don’t know, and can’t tell. They may have different regional effects.
JimD,
I’ve looked at cooling rates from both sides now. Only an idiot would conflate a slower rate of cooling with warming. I assume you are not an idiot.
However, you did state that increasing CO2 leads to warming. Then you talk about cooling rates, when you realise your first statement is nonsensical.
One of us is inconsistent , and it’s not me. Nobody has ever demonstrated that surrounding an object with CO2 will cause a rise in its temperature.
No one.
Anywhere.
Ever.
And no one ever will.
Regardless of your zeal, you have already discovered that you have to change the subject – rate of cooling versus warming – to avoid looking completely foolish.
Over to you.
Live well and prosper,
Mike Flynn.
ozzio, you ask a completely different question from my initial remark and say that I changed the subject to answer it. Should I have ignored it instead? As far as I know, you are one of the people who doesn’t believe that adding more GHGs can keep a surface from cooling as fast. If so, it is a waste of time to go further. In terms of forcing, adding more GHGs keeps the earth from cooling to space as efficiently and it has to warm to compensate the steady incoming solar forcing, but I don’t think I needed to explain that as it is quite obvious.
The guy with his head in the sand was loooking for ” at leastoneteensyweensy actual experiment showing that surrounding an object with CO2 will raiseits temperature.”
That guy should look into the physics of iron smelting in a blast furnace. The atmosphere of the furnace is rich in CO2 and if the process engineers do not account for the radiative properties of the gases properly, then the temperature is off and they can’t optimize the smelting process.
That guy should also look into the physics of a CO2 laser, where the foundation depends on being able to trap thermal energy.
So there you have one empirical experiment which has evolved over time, smelting, and one theoretical, which was proven in the early 1960’s, the IR CO2 laser.
This is understandable that the ostrich is naive about this stuff, as most skeptics are not curious about actual science.
Yes but it’s because CO2 is substantially different in density and thermal conductivity. Its radiative absorption bands make no difference at all to the smelting furnace. I’m sure you know that. So why mislead everyone, Dr. Paul Pukite?
Oh man… and lying for lasers now too?
Nitrogen and helium are used in lasers too. Just off the top of my head. Of course I’m pretty sure by now that the top of my head contains more knowledge than you could ever hope to assimilite. Stopy lying, Dr. Paul Pukite, before someone assembles a list of it all and mails it along to emmployer.
Jim D,
The supposed imbalance at the top of the atmosphere is 0.5W/m2 not the 3W/m2 you seem to think it is. Not that having the right data would make any difference to moron but there it is just in case I’m wrong about morons being bothered by facts.
DS, do you know the difference between an imbalance and forcing? Just curious.
I think you might have confused me with someone who believes that surrounding an object with CO2 can cause a rise in its temperature.
I am not sure why you would think that I don’t accept that incoming sunlight warms the Earth’s surface. Have you perhaps some evidence for this somewhat peculiar stance?
Now it so happens that I agree that surrounding a body with any matter at all, will, of course, reduce the rate of cooling – with the usual provisos about the temperatures involved initially. However, and this would appear to be the crux of our disagreement, a reduction in the rate of cooling is not the same thing as warming.
A body that cools ever so slightly, at an infinitesimally slow rate, so slow that it is impossible to measure with any precision or accuracy, is not warming. It is cooling. The Earth is an example of a body that initially cooled relatively quickly, and is now cooling so slowly that we have to rely on calculations to arrive at a figure of around one millionth of a degree C per annum. Slow but inexorable.
So here’s your mission, JimD, should you choose to accept it : –
Given that the Earth’s surface has cooled from its initial molten condition to its present solid state, and you claim that it has stopped cooling and is now warming, when did this event occur?
Once again, slowing the rate of cooling is not warming. The best insulator commonly available is a Dewar flask, with an R rating of around 2500. It slows the rate of cooling very efficiently by comparison with other insulating materials, eg CO2. Bodies surrounded by this insulation don’t miraculously heat up. They cool.
This might help to explain why surrounding the Earth with CO2 (or anything else for that matter), will not heat it in the slightest.
Live well and prosper,
Mike Flynn
WHT,
Once again, you appear to be confused about the difference between heating and cooling. However, I am not surprised, given your previous statement about the “magical photonics properties of CO2” at an earlier time.
You seem to not understand the difference between chemical reactions involving exothermy, and the physics of surrounding an object with a gas which is inert in this context, ie, the Earth and atmospheric CO2.
You have previously produced the same irrelevant comment about lasers involving the use of CO2. I am not sure what your point is. Suffice it to say that it seems to be a common tactic in the alternate reality of climatology to change the subject when asked a simple question that you cannot answer truthfully without bringing the whole AGW edifice tumbling down around your ears.
So here’s a real experiment for the alternate reality true believer.
1. Place an object on a sealable container – a wide mouthed screwtop jar will do.
2. Fill the jar with CO2 – choose your own method. It’s not very difficult.
3. Observe that your object warms not at all.
I’m sure you will raise a few objections. Reality, after all, is not always accepted graciously. So, do your best to demonstrate that you can increase a body’s temperature by surrounding it with CO2. Maybe you can discover something new.
Live well and prosper,
Mike Flynn.
The parameters are constrained by observed climate variability excluding the warming. So this, perhaps not unreasonable suspicion is built on a non-existent foundation.
Parameter perturbation experiments have been and continue to be carried out, to look at the impact of parameter value choices on climate sensitivity (and other aspects of the climate).
‘Beyond that, we prioritize having globally averaged TOA shortwave absorption and outgoing longwave radiation in good agreement with satellite observations…’
‘In summary, although there is independent evidence for decadal changes in TOA radiative fluxes over the last two decades, the evidence is equivocal. Changes in the planetary and tropical TOA radiative fluxes are consistent with independent global ocean heat-storage data, and are expected to be dominated by changes in cloud radiative forcing. To the extent that they are real, they may simply reflect natural low-frequency variability of the climate system.’ AR4 wg1 3.4.4.1
I doubt that there is much in the way of realistic physics of low-frequency variability. Tuning cloud to satellite observations seems reasonable – but the cause of cloud changes should be recognized.
‘The top-of-atmosphere (TOA) Earth radiation budget (ERB) is determined from the difference between how much energy is absorbed and emitted by the planet. Climate forcing results in an imbalance in the TOA radiation budget that has direct implications for global climate, but the large natural variability in the Earth’s radiation budget due to fluctuations in atmospheric and ocean dynamics complicates this picture.’
http://meteora.ucsd.edu/~jnorris/reprints/Loeb_et_al_ISSI_Surv_Geophys_2012.pdf
” CERES data show that clouds have a net radiative warming influence during La Nin ̃a conditions and a net cooling influence during El Nin ̃o, but the magnitude of the anomalies varies greatly from one ENSO event to another.”
Chief
Are clouds the governor mechanism to keep Earth;s temperature bounded?
“CERES data show that clouds have a…net cooling influence during El Nin ̃o”
OK, that conflicts with the answers I got awhile ago here and at Real Climate for an explanation of why el Ninos have such a dramatic impact on “global average temperature.” I asked why a weather phenomenon that is the result of concentration of heat already in the climate system would cause an increase in the temperature of the system in toto.
I was told by Dr. Curry and the folks at RC that El Ninos cause a real increase in GAT (not a specious one caused by increased concentration of heat within the system) because the increase in clouds that correlate with the el Ninos (from graphs that were posted in answer), cause more heat to be retained.
While by no means definitive, it at least provided a logical mechanism for what would otherwise be merely a spurious rise in mean temp as a result of where the temps are measured. But it seems there is not even agreement on that.
There are a number of interacting mechanisms in a coupled nonlinear system.
‘The global climate system is composed of a number of subsystems – atmosphere, biosphere, cryosphere, hydrosphere and lithosphere – each
of which has distinct characteristic times, from days and weeks to centuries and millennia. Each subsystem, moreover, has its own internal variability, all other things being constant, over a fairly broad range of time scales. These ranges overlap between one subsystem and another. The interactions between the subsystems thus give rise to climate variability on all time scales.’ http://www.atmos.ucla.edu/tcd/PREPRINTS/Math_clim-Taipei-M_Ghil_vf.pdf
Clouds seem to be a factor in recent climate change – associated with changes in sea surface temperature.
Globally –
http://s1114.photobucket.com/user/Chief_Hydrologist/media/cloud_palleandlaken2013_zps3c92a9fc.png.html?sort=3&o=13
In the equatorial Pacific the pattern is very different – SST is positively correlated with cloud with the shift in where cloud forms and where it ends up. It’s complicated.
http://s1114.photobucket.com/user/Chief_Hydrologist/media/PalleSST_cloud_zps4b978cca.png.html?sort=3&o=11
‘Clouds are a critical component of Earth’s climate system. Although satellite-based irradiance measurements are available over approximately the past 30 years, difficulties in measuring clouds means it is unclear how global cloud properties have changed over this period. From the International Satellite Cloud Climatology Project (ISCCP) and
Moderate Resolution Imaging Spectroradiometer (MODIS) datasets we have examined the validity of long-term cloud changes. We find that for both datasets, low-level (>680mb) cloud changes are largely a reflection of higher-level (≤680mb) variations. Linear trends from ISCCP also suggest that the dataset contains considerable features of an artificial origin. Despite this, an examination of ISCCP in relation to the MODIS dataset shows that over the past ten years of overlapping measurements between 60°N–60°S both datasets have been in close agreement (r = 0.63, p = 7×10⁻⁴). Over this time total cloud cover has been relatively stable. Both ISCCP and MODIS datasets show a close correspondence to Sea Surface Temperatures (SST) over the Pacific region, providing a further independent validation of the datasets.’
http://www.benlaken.com/documents/AIP_PL_13.pdf
thanks a ton for the ghil ref
Michael Ghil is a breath of fresh air in a stale debate – as are you Judith.
Chief Hydrologist (July 9, 2013 at 6:57 pm) – Re the last link you gave (Palle and Laken, AIP_PL_13.pdf): Enric Palle is or was involved in the Earthshine project. Some years ago, one of the achievements of this project was to find errors in MODIS which were subsequently corrected. [From memory – I am pretty sure it was MODIS]. So if Palle says that measurements of cloud cover from satellite may still be unreliable “due to the inclusion of artifacts, difficulties in observing low cloud, biases connected to view angles, and calibration issues”, and ” the global low level cloud data is not reliable when derived from irradiance based estimation methods due to the non-cloud penetrating nature of these measurements coupled with view-angle biases”, and “several significant jumps are clearly evident in Figure 2, connected to a shift in mean cloud anomalies. This suggests that spurious changes exist within the ISCCP data […] A calibration artifact origin of these changes appears to be highly likely”, then I would take those statements seriously.
In other words, the satellite cloud data is pretty useless. As Palle and Laken put it in their abstract: ” it is unclear how global cloud properties have changed over this period”.
So your idea that ” Tuning cloud to satellite observations seems reasonable – but the cause of cloud changes should be recognized” is a bit premature when we don’t even know what the cloud changes were.
I believe they might be tuning clouds to get the TOA flux – not tuning to get the cloud cover.
‘A number of studies have suggested that long-term irradiance-based measurements of cloud cover from satellite may be unreliable due to the inclusion of artifacts, difficulties in observing low-cloud, biases connected to view angles, and calibration issues [1, 2, 3, 4]. Using monthly-averaged global satellite records from the International Satellite Cloud Climatology Project (ISCCP [5]) and the MODerate Resolution Imaging spectro radiometer (MODIS [6]) in conjunction with Sea Surface Temperature (SST) data from the National Oceanic and Atmospheric (NOAA) extended and reconstructed SST (ERSST) dataset [7] we have examined the reliability of long-term cloud measurements. The SSTs temperatures are used here, with success over certain regions of the globe, as a proxy and
cross-check for cloud variability.’
Quoting part of the passage doesn’t qualify as good faith. Attributing it to Palle and Laken counts as deliberate misdirection or misunderstanding.
The summary is probably a better indication of what Edward Palle thinks. An it certainly does not suggest that the record is totally useless.
‘SUMMARY
Despite apparent artificial issues in long-term measurements of cloud from ISCCP, and the lack of reliability in low-cloud data from irradiance-based satellite cloud estimates, we find the ISCCP and MODIS datasets to be in close agreement over the past decade globally. In turn, we find these datasets to correspond well to independent observations of SST, suggesting that some particular regions of the globe are not as affected as others by calibration artifacts. This opens the door to the possibility of using SST temperatures as proxy for past cloud variations.’
It gives a measure – however – of what can be directly inferred from the TOA radiant flux record. It comes together in compelling ways.
‘In summary, although there is independent evidence for decadal changes in TOA radiative fluxes over the last two decades, the evidence is equivocal. Changes in the planetary and tropical TOA radiative fluxes are consistent with independent global ocean heat-storage data, and are expected to be dominated by changes in cloud radiative forcing. To the extent that they are real, they may simply reflect natural low-frequency variability of the climate system.’
There is of course low frequency climate variability that influences cloud through changes in ocean and atmosphere circulation. Including the Earthshine Project as another line of evidence for the 1998/2001 climate shift.
‘The top-of-atmosphere (TOA) Earth radiation budget (ERB) is determined from the difference between how much energy is absorbed and emitted by the planet. Climate forcing results in an imbalance in the TOA radiation budget that has direct implications for global climate, but the large natural variability in the Earth’s radiation budget due to fluctuations in atmospheric and ocean dynamics complicates this picture.’ http://meteora.ucsd.edu/~jnorris/reprints/Loeb_et_al_ISSI_Surv_Geophys_2012.pdf
I like Palle and Laken because it integrates both ISCP-FD and CERES.
Loeb et al do the same in LW for ERBS and CERES.
http://s1114.photobucket.com/user/Chief_Hydrologist/media/Loeb2011-Fig1.png.html?sort=3&o=51
That there are problems with cloud data for various reasons has been known and is the rationale for validating with SST. Your intellectually dishonest babbling does nothing to counter the critical and multiple lines of evidence. Climate changes naturally through changes in ocean and atmospheric circulation with cloud radiative feedbacks. Time to get used to it.
I’ve always understood El Nino as change in mixed layer behavior. Weaker trade winds mix less water downward. Heat sequestered in the lower ocean will display as less emission at TOA. There’s no reason to attribute it to clouds. Clouds and ERB are so poorly understood they’re an ad hoc mechanism of convenience.
You have failed to understand ENSO –
http://people.duke.edu/~ts24/ENSO/
Try a little harder.
Your link confirms my understanding. Thanks. Maybe you should check it out closer before posting. Here’s something for you. About a million cartoons showing the same thing…
https://www.google.com/images?sourceid=navclient&ie=UTF-8&rlz=1T4LENN_enUS461US461&q=el+nino+trade+winds
The thermal evolution of ENSO is determined by upwelling in the Humboldt Current. The difference in sea level pressure between cold and warm regions set up pressure differentials across the Pacific resulting in a strengthening of Walker circulation in La Nina. This piles up warm water against Australia and Indonesia.
http://www.lme.noaa.gov/index.php?option=com_content&view=article&id=59:lme13&catid=41:briefs&Itemid=72
‘The theory asserts that the wind-stress anomaly in the central basin and the equatorial SST pattern are strongly coupled. The physical basis for this is as follows. The near-equatorial atmospheric circulation is driven largely through the heating that results from areas of tropical convection (thunderstorm activity). The areas of convection, in turn, are strongly favored over the warmest tropical waters. Since the typical SST pattern features warm waters in the west, and much cooler waters in the east, convection and its associated heating occurs preferentially in the west, driving a thermally direct circulation cell that features rising motion locally in the west, sinking motion further to the east over the cooler waters, and westward low level trade winds in between.
The westward trade winds, however, strongly affect the ocean. First, they induce mean upwelling, as discussed above. But in addition, they act to “pile up” the warm water layer (deepen the equatorial thermocline) toward the west, and shallow it toward the east. In the presence of mean upwelling this contrast is readily transferred to the surface, resulting in SST that is relatively warm in the west, and cool in the east. Herein lies the essential feedback: the westward trade winds tend to reinforce the east-west SST contrast, but at the same time the SST contrast reinforces the winds.
Thus the ocean and atmosphere exhibit a positive feedback, in a mutually reinforcing interaction.’
http://iri.columbia.edu/climate/ENSO/theory/coupled.html
‘During El Niño warm events, the same interactions between the winds and the ocean come into play, but in reverse. The trade winds slacken, tending to reduce upwelling, and reduce the subsurface thermal contrast from west to east. A deepening warm water layer in the east results in warmer water being upwelled to the surface, and thus a surface warming in the east. But with warming in the east, the east-west SST contrast is reduced, convection become more ubiquitous throughout the domain, and the above mentioned circulation cell is largely disrupted, tending to reinforce the slackening of the trade winds. So once again, the oceanic and atmospheric anomalies feed back in a mutually reinforcing way, as an El Niño event amplifies.
The positive feedback effect, by itself, would lead to an instability that would either “lock” the system into a permanent cold (La Niña) state or a warm (El Niño) state. The oscillatory mechanism inherent in the ocean dynamics, by itself, would lead to rather weak oscillations with periods of a few seasons. When the two processes are allowed to operate together, as in the real climate system (according to the theory), for a range of conditions that includes those observed in the tropical Pacific, coupled oscillations with enhanced amplitude and interannual periods (3-5 years) are favored. These heuristic arguments are supported by a number of theoretical and modeling studies that have demonstrated the plausibility of the theory, and provided quantitative results that could be validated against observations.
In recent years, several variants of the above theory have been introduced, in which additional physical mechanisms are introduced. They give a somewhat refined interpretation of the physics introduced in the delayed oscillator theory, but still assign a fundamental importance to both the large-scale ocean dynamics, and the positive feedback mechanism.’
http://iri.columbia.edu/climate/ENSO/theory/elnino.html
Is this what you understand Jarhead the Jabberwock? Or are you content with superficiality as usual?
Here’s one for TOA LW flux and ENSO – I checked my settings and tested it. Should work without needing to sign in.
http://s1114.photobucket.com/user/Chief_Hydrologist/media/Loeb2011-Fig1.png.html?sort=3&o=51
Chief Hydrologist: Is this what you understand Jarhead the Jabberwock?
Up til then you had an interesting sequence of posts. With that, you ruined my day.
‘”Beware the Jabberwock, my son!
The jaws that bite, the claws that catch!
Beware the Jubjub bird, and shun
The frumious Bandersnatch!”
Lewis Carol – Jaberwocky
Chief Hydrologist: Lewis Carol – Jaberwocky
Surely you do not believe that I missed the reference?
@Marler
Hey look on the bright side. At least we know now that reading Lewis Carrol is where Ellison learned to babble so well. Unfortunately he didn’t learn how to stop babbling…
‘Hey look on the bright side. At least we know now that reading Lewis Carrol is where Ellison learned to babble so well. Unfortunately he didn’t learn how to stop babbling…’
I would try concentrating on getting something right before running nonsensically off at the mouth again Jabberwock. Your superficial understanding of ENSO is an utter embarrassment and it echoes much else of your shallow and simplistic narrative.
Now seriously Judith – how close to the wind does this guy have to sail before you delete the unnecessarily juvenile interjections by a bombastic and abusive arsehole whose favourite words seems to be moron and babbling. Delete both comments if you must but do not be so impolite as to leave the juvenile nonsense from Jabberwocky standing. How the hell is this interesting or relevant.
Chief Hydrologist | July 9, 2013 at 6:57 pm said: ” Clouds seem to be a factor in recent climate change ”
Chief, can you remember if there was any clouds before 150y ago?
is it better climate in the center of Australia, where are no clouds; or close to the coast? use your own brains, instead of splattering other conman’s crap.
i know how to get read of the remaining clouds, if that’s going to make you happy…
Science can remember millennia of clouds.
http://s1114.photobucket.com/user/Chief_Hydrologist/media/ENSO11000.gif.html?sort=3&o=127
http://s1114.photobucket.com/user/Chief_Hydrologist/media/Vance2012-AntarticaLawDomeicecoresaltcontent.jpg.html?sort=3&o=68
That is if you have the wit and will to understand rather than merely venting your spleen at me.
Chief Hydrologist | July 10, 2013 at 12:14 am said: ”Science can remember millennia of clouds”
Was it cloudy or sunshine on Christmas 1666 in Brisbane; what your science says? only the truth, nothing but the truth!!! Was St. Peter in a good mood, or angry at that time?
La Nina dominant in the Australian summer? It was cloudy Stefan.
Chief Hydrologist | July 10, 2013 at 12:28 am said: ”La Nina dominant in the Australian summer? It was cloudy Stefan.”
Thanks chief, now i can sleep better; now two of us know what nobody else on the planet knows… thanks a million.
if I have to tell somebody – should i say that you used tarot cards, or crystal ball; which one is more accurate?
‘We emphasize the importance of understanding dragon-kings as being often associated with a neighborhood of what can be called equivalently a phase transition, a bifurcation, a catastrophe (in the sense of Rene Thom), or a tipping point. The presence of a phase transition is crucial to learn how to diagnose in advance the symptoms associated with a coming dragon-king.’
Science Stefan – La Nina in the Brisbane storm season. It is a no-brainer. It is the same way I can predict the probability of drought for the US and flooding for Australia for a decade or so more at least. It is in the way of seeing which way the way is blowing across the Pacific.
Perhaps we could blame Dragon Kings if you really insist.
‘There are four major Dragon Kings, each ruling a sea corresponding to one of the four cardinal directions: the East Sea (corresponding to the East China Sea), the South Sea (corresponding to the South China Sea), the West Sea (sometimes seen as the Indian Ocean and beyond), and the North Sea (sometimes seen as Lake Baikal). They appear in the classical novels Fengshen Bang and Journey to the West.
Because of this association, they are seen as “in charge” of water-related weather phenomenon. In premodern times, many Chinese villages (especially those close to rivers and seas) had temples dedicated to their local “dragon king”. In times of drought or flooding, it was customary for the local gentry and government officials to lead the community in offering sacrifices and conducting other religious rites to appease the dragon, either to ask for rain or a cessation thereof.
We could throw you in the Brisbane River with concrete shoes – but that is hardly a sacrifice.
…which way the wind…
Chief Hydrologist | July 10, 2013 at 1:18 am said: ”…which way the wind…”
in opposite direction than you are facing/ unless your ass is on the front
Chief Hydrologist | July 10, 2013 at 1:15 am said: ”Science Stefan – La Nina in the Brisbane storm season”
chief, when it comes to ”harvesting from thin air” you are a genius!! Is your crystal ball of a good quality, or, made in China? I would love to have a packet of tarot cards and a big earring, same like you, you lucky sod
The obvious – but juvenile reply – is that you wouldn’t know because your head is up yours. But I refuse to descend to your level Stefan. I am after all a serious and sober natural philosopher.
‘Northeast Tasmania, northern Victoria, and eastern parts of South Australia show a La Niña response (that is, a tendency towards wet conditions in La Niña years) similar in strength to the El Niño response (a tendency towards dry conditions in El Niño years). For northern South Australia and northern Queensland, the La Niña response is quite a bit stronger than the El Niño response. In no part of the country is there a consistent tendency towards “below average” rainfall in La Niña years. ‘
http://www.bom.gov.au/climate/enso/ninacomp.shtml
Simple enough – about 4 times the average summer rainfall in La Nina years. But if just want to be a smartarse Stefan – it’s not working.
Sorry – wrong region.
‘Signs of a developing La Niña emerged during autumn 2010 as the Pacific cooled rapidly at the end of the 2009-10 El Niño. By July, La Niña conditions were established and most of Australia experienced significantly higher than average rainfall over the next eight months. Peaking between late 2010 and early 2011, this La Niña event was one of the strongest observed, in a record dating from the late 1800s. Record high rainfall occured across much of northern and eastern Australia during this event, leading to widespread flooding in many regions between September 2010 and February 2011. This event saw Australia experience its wettest September on record, the wettest “dry” season on record in northern and central Australia, and the wettest summer on record in Victoria. Severe Tropical Cyclone Yasi, possibly the strongest cyclone to make landfall in Queensland since the strong La Niña event of 1918, crossed the coast between Cairns and Townsville on the 3rd of February. The calendar year 2010 also ranked as Australia’s second wettest year on record.’
There were strong La Nina from the end of the Medieval Optimum to the beginning of the 20th century. Shown clearly in the Tessa Vance proxy.
Chief Hydrologist | July 10, 2013 at 2:39 am said: ”‘Signs of a developing La Niña emerged during autumn 2010 as the Pacific cooled rapidly at the end of the 2009-10 El Niño ”
chief, i have experienced Yasy, you are spot on – you are the best weather girl; we’ll never change you.
regarding distant past… with a handful of salt may be swolowed
Chief Hydrologist | July 10, 2013 at 2:18 am said: ”The obvious – but juvenile reply”
chief, regarding ”proxy data”… I’m not even agnostic. If is something we don’t know – is not shameful to admit…better than like you and Tony Brown stumbling in a dark and making up things; to feel important…
there are enough known things, guessing is not necessary about what’s irrelevant, it only shows that truth is irrelevant for the proxy consumers…
No Stefan – I am a natural philosopher not a weather girl. See it is a matter of putting the big picture together. As ENSO influences global rainfall variability – it is actually relatively easy to construct accurate proxies.
Here’s a combined proxy – http://iprc.soest.hawaii.edu/newsletters/newsletter_sections/iprc_climate_vol9_2/unified_ENSO_proxy.pdf
But the Law Dome ice core salt content proxy and the red shift in Laguna Pallcacocha in South America is especially interesting because of the length of the record and the purity of the proxy. There are minimal confounding factors – just rainfall or the intensity of the Southern Annular Mode.
So with Tessa Vance at least it is literally more than a grain of salt.
Stefan – it is polite to wait until you get a reply and not multiple post.
As it is – I have explained why ENSO proxies are least problematical. They are a window to the past. The drying of the Sahel starting some 5,000 years ago, the demise of the Minoan Civilisation at about 1350 BC ( http://www.clim-past.net/6/525/2010/cp-6-525-2010.pdf ), the mega droughts and mega floods of the Holocene, the weather in 1666.
Depth Age Red Shift Intensity
39.05 447.82 83
Yep – definitely cloudy in Brisbane.
Sorry – though you said 1566.
Depth Age Red Shift
30 346.92 137
ftp://ftp.ncdc.noaa.gov/pub/data/paleo/paleolimnology/ecuador/pallcacocha_red_intensity.txt
You know the photobucket stuff you post requires people to have a photobucket account and are signed into it, right?
Stefanthedenier,
In the words of the immortal song: –
“And when the wind is blowing from behind,
It blows my mind”
– credits to Big Jim Jehosaphat and Fat Belly Jones.
Maybe someone can reverse the polarity on their crystal ball by the appropriate incantations, and resurrect the numerous parameters of “weather” at a particular location at a particular time.
Or maybe not.
Live well and prosper,
Mike Flynn.
Chief Hydrologist | July 10, 2013 at 3:40 am said: ”The drying of the Sahel starting some 5,000 years ago, the demise of the Minoan Civilisation at about 1350 BC ”
chief, ”The drying of the Sahel” and most of the deserts on the planet are the result of mongrels invented artificially to make fire and learned how to start and use it; but not how to stop it spreading.
Shonky science has used wrong window to look for the real problems – they were searching for interesting crap; instead of the truth… the truth is boring, you know that – reason you are scared from my posts
You can’t tune something based on 13 mistakes in the physics (some of them reciprocal) and get predictive capabilities. Three of them, Sagan’s aerosol optical physics, ‘black body surface emission’ by imaginary ‘back radiation’ and imaginary direct thermalisation GIGO.
Correct the mistakes and you get CO2-AGW near zero (<0.12 K/doubling).
However, it'll take another 3 years before the Marxist (Obama) political money faucet dries up in the US. It's drying up in Germany and the UK as the politicians realise they've been had by this Feynmanian Cargo Cult!
I’ve said for years that the climate modelers were trying to keep their toys on circular tracks on the ceiling.
============
Tsk tsk. How 17th century! Circular orbits? Next you’ll be saying that you always knew Arrhenius wasn’t deluded.
Live well and prosper,
Mike Flynn.
Judith:
I think you need to turn a lot of your inquiry like this into a book that can be widely read. You have critical mass and can speak to both the scientific and nonscientific aspects of the debate–and your own evolution.
Such an effort would be well received by the great middle of the debate.
Judith, of course tuning should be explicitly documented. But I doubt that it will be except under unusual circumstances, as here, where is is said not to have influenced sensitivity as much as thought. My reasons for doubt are simple. The extent of tuning would vividly expose the extent to which the models are otherwise inadequate, and therefore generally unreliable. Especially since after tuning, they still provably get UTrH and clouds wrong, meaning both major ‘blue earth’ feedbacks.
+1
Wow – this has already degenerated into a maelstrom of uniformed opinion.
The models are coupled nonlinear systems. The data is uncertain. After some time – there is no single deterministic solution of the model equations. The future is another country.
‘Prediction of weather and climate are necessarily uncertain: our observations of weather and climate are uncertain, the models into which we assimilate this data and predict the future are uncertain, and external effects such as volcanoes and anthropogenic greenhouse emissions are also uncertain. Fundamentally, therefore, therefore we should think of weather and climate predictions in terms of equations whose basic prognostic variables are probability densities ρ(X,t) where X denotes some climatic variable and t denoted time. In this way, ρ(X,t)dV represents the probability that, at time t, the true value of X lies in some small volume dV of state space.’ (Predicting Weather and Climate – Palmer and Hagedorn eds – 2006)
Palmer has written extensively on probabilistic forecasts – e.g. http://rsta.royalsocietypublishing.org/content/369/1956/4751.short – understand first how models work before pontificating on variations of your favourite theme.
‘Atmospheric and oceanic computational simulation models often successfully depict chaotic space–time patterns, flow phenomena, dynamical balances, and equilibrium distributions that mimic nature. This success is accomplished through necessary but nonunique choices for discrete algorithms, parameterizations, and coupled contributing processes that introduce structural instability into the model. Therefore, we should expect a degree of irreducible imprecision in quantitative correspondences with nature, even with plausibly formulated models and careful calibration (tuning) to several empirical measures. Where precision is an issue (e.g., in a climate forecast), only simulation ensembles made across systematically designed model families allow an estimate of the level of relevant irreducible imprecision.’ http://www.pnas.org/content/104/21/8709.long
A serious discussion involves the proper use of models and their limitations – tuning, couplings and interpretations are on the top of the list in putting models into a proper perspective.
Chief Hydrologist – I’m interested in your comment that “this has already degenerated into a maelstrom of uninformed opinion”. Most of the commentary has come from yourself, and much of the rest is pretty reasonable stuff and/or not expressing an opinion. The thread is also a lot shorter, a lot less heated, and a lot less opinioned than many previous threads on judithcurry.com.
So – I would be interested in your opinion on my first comment (#1 in this page). I would also appreciate clarification of your above statement “A serious discussion involves the proper use of models and their limitations – tuning, couplings and interpretations are on the top of the list…”. I have already addressed tuning, and explained its irrelevance at this stage. I suspect that “couplings and interpretations” are equally irrelevant until the major mechanisms of climate have been identified and included in the models, but I need clarification from you on what precisely you were getting at before I can be sure. TIA.,
‘AOS models are members of the broader class of deterministic chaotic dynamical systems, which provides several expectations about their properties (Fig. 1). In the context of weather prediction, the generic property of sensitive dependence is well understood (4, 5). For a particular model, small differences in initial state (indistinguishable within the sampling uncertainty for atmospheric measurements) amplify with time at an exponential rate until saturating at a magnitude comparable to the range of intrinsic variability.’ http://www.pnas.org/content/104/21/8709.long
So you may have one run of a model to give one answer. Another run with a start point arbitrarily close will give a divergent solution. Hundreds or thousands of such runs may give a probability density function representing the topology of the state space. Unless you understand this and can incorporate it thinking about climate models then we are talking a different language.
What do I think of your comment? And most other comments? I think they represent a different – and incorrect – paradigm. Still thinking linearly about nonlinear systems.
“So you may have one run of a model to give one answer. Another run with a start point arbitrarily close will give a divergent solution. Hundreds or thousands of such runs may give a probability density function representing the topology of the state space.”
Or it may not give a pdf of said topology if there are errors in the model used to explore the space. You could use the same description of models used in evolutionary biology, by the way, which are also flawed and generally useless. The useful models are actuarial. Climatology is actuarial. Epedemiology is actuarial. Climate science and evolutionary biology are narrative rather than actual.
http://rsta.royalsocietypublishing.org/content/369/1956/4751/F2.expansion.html
Admittedly while models are in the development stage – as they will be for some time – there is little chance of definitive probabilistic forecasts.
If at all.
‘Finally, Lorenz’s theory of the atmosphere (and ocean) as a chaotic system raises fundamental, but unanswered questions about how much the uncertainties in climate-change projections can be reduced. In 1969, Lorenz [30] wrote: ‘Perhaps we can visualize the day when all of the relevant physical principles will be perfectly known. It may then still not be possible to express these principles as mathematical equations which can be solved by digital computers. We may believe, for example, that the motion of the unsaturated portion of the atmosphere is governed by the Navier–Stokes equations, but to use these equations properly we should have to describe each turbulent eddy—a task far beyond the capacity of the largest computer. We must therefore express the pertinent statistical properties of turbulent eddies as functions of the larger-scale motions. We do not yet know how to do this, nor have we proven that the desired functions exist’. Thirty years later, this problem remains unsolved, and may possibly be unsolvable.’ http://rsta.royalsocietypublishing.org/content/369/1956/4751.full
Chief Hydrologist – Thanks for your comment, but I think your thinking is just as flawed. If models with tiny differences in initial state diverge heavily, then they are of no use beyond the point of significant divergence, no matter how many hundreds or thousands of runs are done. The point is that the divergence demonstrates that the models do not reasonably represent the major factors affecting climate. You complain of linear thinking yet you subscribe to what I would describe as muddled thinking. It is a simple fact that omissions and bias in the computer models render them seriously useless, as demonstrated by the divergence you mention, and the average value of a large number of uselessnesses is still useless.
Omissions – ocean oscillations and cloud behaviour are a couple of examples.
Bias – inclusion of cloud “feedbacks” yet exclusion of indirect solar effects. [Yes I know that there is no specific accepted indirect solar effect, but then there isn’t any specific accepted cloud feedback, so it’s very much a bias.]
BTW, I think the Palle and Laken paper really does advance knowledge, but it does show that there are still very serious problems – eg. cloud cover still cannot be measured reliably. The use of SSTs to support cloud measurement is interesting. Does it rely on the influence of SSTs (and implicitly ocean oscillations) on cloud cover, or does it rely on the influence of cloud cover on SSTs, or both?
‘In sum, a strategy must recognise what is possible. In climate research and modelling, we should recognise that we are dealing with a coupled non-linear chaotic system, and therefore that the long-term prediction of future climate states is not possible. The most we can expect to achieve is the prediction of the probability distribution of the system’s future possible states by the generation of ensembles of model solutions. This reduces climate change to the discernment of significant differences in the statistics of such ensembles. The generation of such model ensembles will require the dedication of greatly increased computer resources and the application of new methods of model diagnosis. Addressing adequately the statistical nature of climate is computationally intensive, but such statistical information is essential.’ TAR 14.2.2.2
You confuse a probabilistic forecast with deterministic solutions – http://rsta.royalsocietypublishing.org/content/369/1956/4751/F2.expansion.html
The first is all that is possible – the second is not possible at all.
All sorts of things can be measured well enough.
http://visibleearth.nasa.gov/view_cat.php?categoryID=0&p=1
http://www.ospo.noaa.gov/data/sst/anomaly/2013/anomnight.7.8.2013.gif
‘The top-of-atmosphere (TOA) Earth radiation budget (ERB) is determined from the difference between how much energy is absorbed and emitted by the planet. Climate forcing results in an imbalance in the TOA radiation budget that has direct implications for global climate, but the large natural variability in the Earth’s radiation budget due to fluctuations in atmospheric and ocean dynamics complicates this picture.’ http://meteora.ucsd.edu/~jnorris/reprints/Loeb_et_al_ISSI_Surv_Geophys_2012.pdf
http://s1114.photobucket.com/user/Chief_Hydrologist/media/CERES-BAMS-2008-with-trend-lines1.gif.html?sort=3&o=115
Chief Hydrologist – I am now reasonably happy with what you are saying. You still seem more prepared to accept models’ output, but when you say “‘In sum, a strategy must recognise what is possible. In climate research and modelling, we should recognise that we are dealing with a coupled non-linear chaotic system, and therefore that the long-term prediction of future climate states is not possible. The most we can expect to achieve is the prediction of the probability distribution of the system’s future possible states by the generation of ensembles of model solutions.” I am happy to agree. Where we might still disagree is perhaps on the extent to which we have achieved “the prediction of the probability distribution of the system’s future possible states”. I would argue that we are not even close.
I am so pleased that you are happy. But I am afraid you still haven’t quite got it.
The divergent solutions within the limits of feasible inputs means that there are many solutions of any model.
How do they know which is the right solution?
‘The bases for judging are a priori formulation, representing the relevant natural processes and choosing the discrete algorithms, and a posteriori solution behavior.’
A posteriori solution behavior? That’s right – they pull it out if their arses and tuned or not is utterly irrelevant.
There is a different approach that is theoretically an improvement.
http://judithcurry.com/2013/07/09/climate-model-tuning/#comment-342609
Chief Hydrologist – All good. But in light of your ‘a posteriori’ comment, I am now more convinced, if that is possible, that the models are not even remotely ready for tuning yet. And it was your comment “A serious discussion involves the proper use of models and their limitations – tuning, couplings and interpretations are on the top of the list in putting models into a proper perspective.” which I questioned in the first place.
I like your concept of “uniformed” opinions. I never thought of them that way before.
‘Extensive experience over several decades shows that computational atmospheric and oceanic simulation (AOS) models can be devised to plausibly mimic the space–time patterns and system functioning in nature. Such simulations provide fuller depictions than those provided by deductive mathematical analysis and measurement (because of limitations in technique and instrumental-sampling capability, respectively), albeit with less certainty about their truth.
AOS models are widely used for weather, general circulation, and climate, as well as for many more isolated or idealized phenomena: flow instabilities, vortices, internal gravity waves, clouds, turbulence, and biogeochemical and other material processes. However, their solutions are rarely demonstrated to be quantitatively accurate compared with nature. Because AOS models are intended to yield multifaceted depictions of natural regimes, their partial inaccuracies occur even after deliberate tuning of discretionary parameters to force model accuracy in a few particular measures (e.g., radiative balance for the top of the atmosphere; horizontal mass flux in the Antarctic Circumpolar Current).
Weather forecasts have both demonstrable skill and appreciable error (1). Climate predictions for anthropogenic global warming are both broadly credible yet mutually inconsistent at a level of tens of percent in such primary quantities as the expected centennial change in large-scale, surface air temperature or precipitation (2, 3). Slow, steady progress in model formulations continues to expand the range of plausibly simulated behaviors and thus provides an extremely important means for scientific understanding and discovery. Nevertheless, there is a persistent degree of irreproducibility in results among plausibly formulated AOS models. I believe this is best understood as an intrinsic, irreducible level of imprecision in their ability to simulate nature.’ http://www.pnas.org/content/104/21/8709.long
At any rate there seems little in the way of informed opinion – as you know perfectly well Matthew. All models are tuned – there is no such thing as a model that arrives at a solution by first principles. These models are chaotic introducing a whole new level of ‘irreducible imprecision’ requiring new ways of interpretation as the statistics of systematically designed families of perturbed model solutions.
Where used to date – e.g. http://ukclimateprojections.defra.gov.uk/22530 – the perturbed model framework varies the parameters within feasible limits and the runs kept that reproduce the current climate. The runs are then projected forward and probabilities of differing outcomes calculated.
There is a nice little video presentation in the link.
Chief Hydrolist: At any rate there seems little in the way of informed opinion – as you know perfectly well Matthew.
It seems you missed my slight jest aimed at your misspelling of “uninformed”.
Surely you can’t think I missed it. Ignoring it is not the same thing at all.
Chief Hydrologist: Surely you can’t think I missed it.
Yes I do. Your entire subsequent post was a disquisition on the point that there are a lot of uninformed opinions and that I know about them. You did not “ignore” anything.
“Within the foreseeable future climate model tuning will continue to be necessary as the prospects of constraining the relevant unresolved processes with sufficient precision are not good.”
Translation – We don’t know near enough to model the climate, but we will keep tuning our models so their outputs do not become ever more ridiculously divergent from reality.
GaryM – That is precisely the point I made earlier, expressed more colourfully. The process you describe has already been observable for some time: each time the global temperature fails to rise as predicted, they re-tune the models so that their hindsight is perfect. But the underlying assumptions about CO2 remain in the models, so each longer period of observed non-warming gets followed by a predicted period of increased warming, so that the overall picture as coded into the models is still adhered to.
The models have been disagreeing with each other and with observation by so much and for so long now, that we can be absolutely certain that there is something fundamentally wrong with them. Until whatever that is is found and fixed, the idea that the models just need tuning is absurd.
if you really do want the models to work you would need to look at the actual data and see that it always snows more when oceans are warm and wet and that builds ice that will advance later. These simple facts are ignored.
I get an awful big kick out of trying to see what is really meant, ‘uniformed’ or ‘uninformed’.
===============
{sarc:on}
No. Really?
You mean someone coding a model can use statistical uncertainty in physical parameters and formulae to cherry pick with the reasonable bounds of uncertainty in order to get model results that are better fit particular agendas?
{sarc:off}
This is where “Lies, Damn Lies, and Statistics” comes from!
Unbelievable that anyone the least familiar with computational modeling doesn’t know about this. A tweak to the data here, a tweak to a bound there, pretty soon you can tell any story you want. That’s exactly why I call it the AGW narrative. It doesn’t stop with climate models. Economic models, social models, whatever models. If there’s math and uncertainty you can spin it.
Write that down.
Model output is model output. You can make it show anything you want it to show. If you want it to show what really will happen, it is a really lot more difficult. I don’t really think they are trying to do that.
I think it is probably worse than that.
‘Lorenz was able to show that even for a simple set of nonlinear equations (1.1), the evolution of the solution could be changed by minute perturbations to the initial conditions, in other words, beyond a certain forecast lead time, there is no longer a single, deterministic solution and hence all forecasts must be treated as probabilistic.’ http://rsta.royalsocietypublishing.org/content/369/1956/4751.full
So how do they decide which is the right answer?
‘The bases for judging are a priori formulation, representing the relevant natural processes and choosing the discrete algorithms, and a posteriori solution behavior.’ http://www.pnas.org/content/104/21/8709.long
A posteriori solution behavior? That’s right – they pull it out of their arses.
:) :) :)
That’s why they’re called smartar***s
Apologies for the tangent but this is a nice 6min clip worth watching right to the end:
++
Triple Chaos Pendulum
http://www.youtube.com/watch?v=f-acXTWEXZI
++
http://mathforum.org/library/drmath/view/56369.html
We have a highly complex, non-linear climate system that operates chaotically, resulting in a quasi-steady state, but not classic thermodynamic equilibrium, globally. Besides the lack of comprehensive physical insight into the critical processes of near-surface thermalization and moist convective transfer of thermal energy to the atmosphere (and the attendant insolation- reducing process of cloud formation) there is also a lack of credible long-term surface temperature data throughout the watery globe. “Tuning” inadequate deterministic models, no matter how sophisticated they may seem, to replicate deeply flawed time-series cannot realistically be expected to provide useful results for predicting the future of course of surface temperatures. That much should be starkly clear.
We need a Devil’s Advocate series that identifies climate parameters that would be required if CO2 were NOT strong AND/OR cloud formation WAS a real negative feedback mechanism. We could then look to see if this set were reasonably present, and see how the model projections matched observations.
Edison discovered many ways to NOT do something. We need to know what couldn’t work in the non-CO2 narratives and what could.
The IPCC scenarios only separate in 2045, far too late for our current lives. If, as some think, by 2015 global temperatures will be 0.2C lower than today, we will need models to explain how natural, not just a providential compensatory tweak in IPCC narrative can do this.
It seems strange to ask at such a late stage in the CAGW debacle, but where are the computer models for “natural” parameters that reproduce historic temperature changes that DO NOT have high CO2 sensitivity that we can put to the falsification test?
Climate model tuning. I did model tuning since 1963, We called that curve fits. if you give me two or three or more independent parameters, I could reproduce any dependent data. It really does not mater if they have a relationship or not. Sometimes these things are useful and many times they are not.
Can anyone imagine flying on a passenger aircraft the design of which relied upon engineering models that had been only subjected to the same level of rigor to which the various GCM’s have been subjected. If there are any takers, please name me as the beneficiary of your life insurance policy.
Or basing one’s financial planning on an economics model?
It’ll take me a while to assimilate what this paper is describing and how (if) it fits with the work described here:
http://judithcurry.com/2013/06/16/what-are-climate-models-missing/
For the moment though, it seems this latest post discusses a tuning process to match temperature and TOA balance on the assumption that “all else will follow” (praphrased) whereas the previous post showed that “all else does not follow”.
I need to read again. FWIW I note Bjorn Stevens was an author on both.
Bjorn Stevens also has a poster on the Earth Energy Budget that is pretty critical of the status quo.
Figuew 1 shows all models predict rising temperatures after 2000 and none predict a pause. Surely this indicates that all models are blind to the on/off natue of climate change. How do the models correctly apportune heating snd cooling between kinetic and vibrational modes. Obviously the voracious appetite of CO2 for heat makes the vibrational modes of that molecule of supreme importance, yet this is not mentioned in the above. Could it be that all modellers assume that temperature will change in a continuous fashion, as usually happens, rather than steps and stairs as quantum theory shows?
Models can be made to hindcast “the pause” by removing the warming attributed to CO2. There was recent paper by Dessler at TAMU stating as much. The same models then don’t hindcast the two decades preceding the pause correctly.
This is a red flag (like we needed more red flags) that the models are flawed.
Observations of Climate Feedbacks over 2000–10 and Comparisons to
Climate Models*
A. E. DESSLER
http://geotest.tamu.edu/userfiles/216/dessler2013.pdf
Not surprising. The temperature rose 0.5 degrees in those two decades. Hard to explain without CO2. On the other hand, taking them all together, 0.5 degrees over three decades is about the expected effect of CO2. It is just CO2 plus natural oscillations.
0.5C over 3 decades is not an alarming rate. And it all came in virtually stairstep fashion rather than a linear background rate we’d expect from linear increase in CO2.
It’s not at all difficult to duplicate, including the timing, without CO2.
Scafetta did it perfectly, lumps and all.
http://curryja.files.wordpress.com/2011/07/loehlescafettawuwtfigures01_page_32.jpg
DS, your answer denies the possibility natural decadal oscillations of even 0.1 degrees. No one expected a linear increase, except those fooled by Monckton’s graphics that draws a straight IPCC-labeled line from 2000 to 2100 with a gradient of 0.3 C per decade.
Scafetta was able to hindcast/forecast from each half of the data to the other half. His model predicts remarkably better than the IPCC’s GCMs.
With all the “tuning”, will the GCM’s ever rise to that standard?
I would love to see standard sets of tuning parameters published. Then have all the major climate models run the various sets. I bet few models would agree we the others in the same inputs.
A little Eye of Newt here, some frog hairs there, blood of wharf rat in that spot … ahhh … a satisfying climate model we have.
‘Fair is foul and foul is fair
Hover through the fog and filthy air.’
Act one, scene one and yer know what
comes after that serfs. H/t The Bard.
These models have no predictive power. Parameters are arbitrarily adjusted to fit observations. Modelers can adjust the parameters to produce any outcome they want. These models should never be used to forecast because the parameters are just guesses (or wishes) so the output is also a guess (or wish). Garbage in, garbage out.
Yeah, Dr Strangeglove, foul becomes fair alright.
Bts
Knowing nothing about how they built their models (aside from what’s written here), and not assuming bad faith: Still, avoiding data snooping is very difficult. The paper itself says that this model is based on previous models, and all of them had the goal of reproducing 20th century temperatures. That means this model has to pay for any overfitting in earlier models as well. It is the product of generations of tuning.
I remain unconvinced that any of this is possible without overfitting; are we really good enough at the physics to actually track temperatures for a whole century? But here is a simple test: Take the ensemble of models, and compare how they did in backcasting (in-sample error) to how they have done since (out-of-sample error). If the two are (somewhat) similar [out-of-sample error will always be somewhat bigger] then they’ve done a reasonable job. If the models do enormously worse for the forecasting, that is evidence that model building involved overfitting.
My impression is that forecasting has indeed been much worse than backcasting, with nice plots of a jumble of spaghetti clustered around the surface temperature for a hundred years – and then suddenly diverging in all directions, pretty much all too hot. Is that correct?
_If_ indeed the physics is too difficult to forecast correctly for a century at the current level of art, and untuned models would diverge chaotically over that century – well, then, insisting that models match the temperature for the century is a really bad idea, and actually guarantees a bad model. It can only be accomplished by overfitting.
I guess I’d add to my comment that this is a really frustrating setup: You don’t have all that much data (world surface temperatures for a hundred years, unless you try to match smaller geographical regions) for training and validation – and then the test data trickles in one data point per month! Dozens or hundreds of models trying to reproduce a few thousand data points? It’s nuts; you’ll never finish testing. You don’t have enough data, right?
I really think that a better idea would be to take a lot more data, say regional temperatures and precipitation and whatnot, you decide, but give yourself many more variables than just global temperature to reproduce, take a sample of it out and try to reproduce more variables for less time. At least you’d have a lot of new data arriving for testing each year. I know that weather is chaotic, but you are after all claiming that climate is not. Is there nothing short of the whole world’s total energy that you think is non-chaotic? Whatever it is, learn to predict it well.
+1
There seems to be a blind spot about system modeling. In complex system modeling, every modeling run is significant. That each run with slightly different starting parameters generate wildly different results is significant information. That information is that models indicate a wide range of outcomes is possible! It does not matter what the average of multiple modeling runs or even multiple runs from multiple modeling programs might be. What matters is that the very best each model can do at this time is provide a wide range of possible outcome estimations. We cannot even assume anything meaningful can be achieved by taking the average of the very highest and very lowest model run outputs.
The blind spot is not seeing that taking the average of multiple modeling runs does not improve calculation accuracy, it merely provides a more precise number. An improvement in accuracy can be claimed only if the actual numeric characteristic of the noise to be removed by averaging is known and accounted for in the averaging process (or whatever reduction process is used). Assuming the noise is random is just mental laziness.
In the situation we see in climate modeling, the noise is the result of calculation component interactions without clear definitions. In fact, as the paper described above says, calculation constants are iteratively adjusted to center the range of model run outputs on some expected profile.
So, restated, the most important information in model run outputs is not their average, it is the full range of their outputs. That that range is large indicates a lack of accuracy in the calculations. That Earth’s climate is a complex coupled non-linear system is not an excuse for this lack of accuracy. It is still a lack of accuracy – and lack of reliability for use in predicting climate change(s).
Climate models are useful for one purpose: testing assumptions about our understanding of climate processes. At current observed modeling of accuracy, our assumptions seem somewhat short of adequate for the job.
Gary, your assessment of climate modeling is spot on as far as I’m concerned. The first sentence of your last paragraph (“Climate models are useful for one purpose”) was particularly insightful.
I very much hope you can find the time to contribute further to Judith’s blog. There are a lot of non-contributing fence-sitters/lurkers who are reading it merely to sort out the knights from the knaves (to use Ray Smullyan’s metaphor). In my book your one comment here has put you firmly in the knight’s camp.
Vaughan
I also agree, Gary. I would add that there are a priori reasons to believe that models damp the dynamics and are incapable of predicting bifurcations or past climate shifts. The are acknowledged to be incapable of predicting regional climate, polar amplification, and probably even the tropics upper troposphere. This has to do with the well known problem of numerical viscosity. I am concerned that there is little reason to regard GCM’s as any better than simple energy balance methods, but costing millions of times more.
The reason a model ensemble is used is that each individual model is flawed. After all if we had a perfect model we’d only need that one. It is hoped that the models are each uniquely flawed so that in circumstances where a single model screws the pooch a multiplicity of others will not and thus the glaring flaw is averaged out into a minor flaw.
It’s a valid strategy. Instead of a model that is badly wrong infrequently the ensemble output is a little wrong all the time.
Indeed this is what we observe. The CMIP5 ensemble sensitivity pdf which has gotten a lot of attention lately was trained on 1979-1990 data then let run forward. Not surprisingly it was a little wrong and slowly but surely actual earth global average temperature drifted away from the median ensemble prediction. After 22 years of steady drift the actual GAT fell outside the 95% confidence bounds of the ensemble GAT.
This is where your last sentence about models being good for one thing comes into play. Our assumptions were encapsulated into the ensemble and subsequenty tested against reality. We found out our assumptions were flawed and we additionally found out our assumptions were flawed in the direction of too much climate sensitivity.
We don’t know why the models ran too hot and that’s the burning question today.
my climate model is the best / most perfect – BECAUSE ARE no UNCERTAINTIES in it – everything is proven beyond any reasonable doubt: .http://globalwarmingdenier.wordpress.com/climate/
You can manipulate the average of a collection of numbers anyway you want, as often as you wish. This will not not change a single iota, jot, or atom of the data from which you derived your average. None at all.
Climatology (the study of the average of something or other) has achieved precisely nothing of scientific utility in its short life life as a science.
Modelling an “average” of a non linear probably chaotic system such as weather appears to be, is about as much of a completely useless waste of time and effort as it is possible to imagine.
Phrenologists believed that areas of the brain could be enlarged by use, in some cases. Modern FMRI studies support this in some areas.
Climatologists believe that wrapping a body with CO2 will cause its temperature to increase. No study involving the use of any sort of equipment can show this, because it is arrant balderdash.
Doesn’t climatology give us all the perfect excuse to waste lots of time? Some of us even get paid quite handsomely for said time wasting!
Live well and prosper,
Mike Flynn.
Hi ozzieostrich,
good ter see yer
back on CE
and +1 fer
yer commentree
on the disparity
btw climatology
and phrenology.
Ter let yer know ozzie
ostrich, I’m workin’
on a book of poetry
on birds, me illustrated
‘Book of Feathers’.
Yew live well and prosper too.
Beth the serf.
ozzieostrich
In my last article here
http://judithcurry.com/2013/06/26/noticeable-climate-change/
I demonstrated that paleo proxy reconstructions completely missed natural variability which is many times the ‘averaged’ figure the proxies produce.
Without factoring in natural variability in some runs whilst removing co2 in some runs, the climate models have limited utility as they are not reflecting the real world, merely a modelled world
tonyb
No prob, tonyb. After abolishing history the climatariat can cancel reality. Many modelling enthusiasts got their start with dinky toy cars and action figures. They won’t miss reality, which is far too large and untidy for settling the science before the next Cancun or Rio or Kyoto bash. If we waited for reality, the stretch limos would still be waiting at Castrup airport.
Compared to non-Kardashian models, reality is hopelessly cumbersome to work with. Whose idea was it in the first place?
TonyB,
I trust I give no offence. Certainly none is intended.
I am no longer surprised by otherwise apparently rational and intelligent people, highly qualified and well regarded, who apparently believe that climate consists of the average of temperature over a period of time.
Taken to the extreme, the climate over the last four and a half billion years or so has demonstrated global cooling, regardless of the intricate pseudo-mathematical efforts to “prove” otherwise.
Either the Earth’s crust is now solid, and tolerably comfortable, or I am psychotic and delusional. Nobody has yet seriously suggested that the Earth was created cold, and has progressively warmed to its present temperature. So, has the Earth cooled, or warmed, since its creation?
And if it has cooled, in spite of atmospheric concentrations in excess of 95% CO2, at pressures in excess of 100 bar, then the present hysterical infatuation with “greenhouse gases” and their supposed “warming effects” is shown to be the nonsense that it obviously is.
So why do I even bother pointing out the blindingly obvious? I really don’t know. Self aggrandisement, Messiah complex, or maybe something else?
So I will continue to evangelise. The only thing which will shake my unbreakable faith in the unreality of the “greenhouse effect” would be an experiment demonstrating that a body can have its temperature increased by surrounding it with CO2. To date, not one of the followers of Climatology has been able to perform this very basic task.
Rather than entering into pointless arguments about “global temperature” (a more ridiculously ill defined “scientific” term would be hard to find), I suggest that uproarious laughter directed at the proponents of CO2 warming may encourage them to either put up or shut up.
Live well and prosper,
Mike Flynn.
ozzie
I most definitely do NOT believe in a GLOBAL temperature and have said so a number of times. There are zonal, regional and country averages but a global one is pointless and imprecise. However, when discussing comparisons with a composite model such as the paleo you have to use the same imprecise language that they do else there can be no discussion and we can’t point out the flaws.
tonyb
TonyB
We are singing from the same hymn sheet.
I just can’t be bothered descending to the level of the witless who come up with these nonsensical models. Playing their silly game of imprecision allows them to redefine the rules anytime they want.
I find it entertaining to see the lengths to which some of the cultists will go, in order to avoid facing the fact that surrounding a body with CO2 raises its temperature not one whit. And that seems to be the central plank of their teetering wobbly structure.
I really wasn’t challenging you in any way. Sorry if I gave that impression.
Live well and prosper,
Mike Flynn.
http://cliffmass.blogspot.com/2013/07/climate-versus-weather-prediction-do-we.html
“Climate Versus Weather Prediction: Do We Need to Rebalance?”
We know what happens when we run a weather model beyond a few weeks into the future — a wrong forecast.
There are some who make skillful forecasts for months in the future.
NOAA and NASA are not good at that yet, but some others are.
That could easily be turned into years if they get the ice right.
maybe not easy
Not even remotely sensible:
“Arguably, the most basic physical property that we expect global climate models to predict is how the global mean surface air temperature varies naturally, and responds to changes in atmospheric composition and solar insolation. We usually focus on temperature anomalies, rather than the absolute temperature that the models produce, and for many purposes this is sufficient.”
I’m not aware of even a single climate model that’s constrained as it NEEDS to be by the following data:
ftp://ftp.iers.org/products/eop/long-term/c04_08/iau2000/eopc04_08_IAU2000.62-now
The ONLY sensible option is to dismiss all climate models that ignore these data.
—
An easy opportunity to raise cross-disciplinary awareness:
Can anyone point directly to specific climate models that are constrained by the following data?
ftp://ftp.iers.org/products/eop/long-term/c04_08/iau2000/eopc04_08_IAU2000.62-now
(If the response is enduring silence, that will be incisively informative.)
No the only sensible option is to dismiss those models that fail to get the size and number of snow flakes correct.
There is no “model free” science. That means, like it or not, that you cannot do science without a model. However bad you are stuck with GCMs until you supply a replacement. And your replacement must do more than global temp. I’ll allow you to tune to match global temp exactly, and then retest by looking at how well your model captures:
1. regional temps
2. precipitation
3. Ice
4. El Nino frequency
5. sea surface salinity.
So, you can throw away the models on any basis you like. but you won’t be doing science until you provide something that is less worse..
personally I think the models are flawed because they dont have enough vowels in their names: BUY MORE VOWELS!
Reality is actually a model contained in your head if you want to start playing epistemology. Grow up.
Steven Mosher | July 10, 2013 at 11:14 am |
“No the only sensible option is to dismiss those models that fail to get the size and number of snow flakes correct.”
Reductio ad absurdum. Nice. Just what we’ve come to expect from you.
Steven, you write “So, you can throw away the models on any basis you like. but you won’t be doing science until you provide something that is less worse..”
Many decades ago, when I wrote and used models, there was a requirement that we showed that the model results were good enough to solve the problem. Without this, there was no way that the senior members of our organization would allow results to be published and a report to be issued. You may have the best model in the universe, but if it is not good enough to solve the problem at hand, then it is useless for that purpose.
Where the warmists have failed, miserably, is showing that the models they are using are good enough to prove that CAGW is more than a viable hypothesis. And no-one, and I mean no-one, has shown, or even tried to show, that the models are capable of doing this.
Jim Cripwell | July 10, 2013 at 11:31 am |
Steven, you write “So, you can throw away the models on any basis you like. but you won’t be doing science until you provide something that is less worse..”
I don’t read all the dreck that Mosher writes. I must have the bit of the scientific method that says falsification of a hypothesis isn’t science unless it’s accompanied by a new hypothesis… What a maroon. This is what happens when you get someone with a BA (english/philsophy) babbling about math and science.
Steven, arguing that you must provide an alternative model before criticising GCMs is absolutely no different to arguing that Steve McIntyre is not allowed to criticise temperature reconstructions without providing an alternative (and “better”) temperature reconstruction himself. Note this is a claim made I’ve seen by many supporters of Mann, and it is an incorrect claim. Your comment above contains the same fallacious reasoning.
There is no such rule in science. It is quite possible to show a method is flawed without providing an alternative.
@Spence_UK: There is no such rule in science. It is quite possible to show a method is flawed without providing an alternative.
What do methods have to do with the debate here? The question is whether a given hypothesis is flawed. How do you show a hypothesis is flawed without providing a better alternative? More on this at the Wikipedia article Alternative hypothesis.
Some time ago now Tomas Milanovic stopped by CE a few times to warn about inattention to FIELDS.
Gross negligence:
The spotlight on global averages has left flow-governing field GRADIENTS in the shadows.
Paul Vaughan, “Gross negligence:
The spotlight on global averages has left flow-governing field GRADIENTS in the shadows.”
It was not really gross negligence, it was a simplifying assumption, “that the impact of WMGHG forcing would be significantly greater than work/entropy missed in internal transfer”. With a high “sensitivity” to WMGHG, the models would be good enough for government work. Now that models have progressed to this point, it is pretty obvious that natural variability is more important than expected and that internal work/entropy needs to be looked at more closely.
Vaughan Pratt | July 11, 2013 at 1:05 am |
“How do you show a hypothesis is flawed without providing a better alternative?”
By referring to data which falsifies it. Duh.
@Vaughan, no.
Firstly, there are two ways of falsifying models. Models can be shown to be wrong either (1) inductively (e.g. showing an error in the algebra, or showing analytically that the model is in conflict with some law of physics) or (2) deductively (e.g. by comparison of predictions to observations).
If you are talking about hypothesis tests, you are referring to the second form of falsification.
A hypothesis is a test applied to model output. Some people argue that models themselves are a form of hypothesis; this is a cute way of thinking about models, but it isn’t strictly true. The hypothesis is a test under constraints by which it is argued the model outputs are valid or meaningful.
The first test to apply is whether the model is telling you anything beyond a naive baseline. In this test, the null hypothesis is no change, and the alternate hypothesis is what the model predicts. If this test fails, then you cannot distinguish between model output and normal behaviour anyway, then the model is not telling you anything new and can be disposed of by Occam’s razor.
The second test that you can apply (but only after a positive outcome from the first test) is whether the model is distinct from observations. In this case, the model output becomes the null hypothesis and the observations become the alternate hypothesis.
For example, if I produce a model that predicts the average surface temperature above latitude 80 degrees N will be between 350 and 370 Kelvin next Thursday afternoon, you can wait until next Thursday, measure this temperature (also with some uncertainty), and then test whether your measurement falsifies my model. No alternative models needed.
Of course, the hypothesis test needs to be applicable to where the models are argued to have skill. Showing that a GCM fails to predict the time dilation of a satellite in orbit due to relativity is not impressive because GCMs are not designed to calculate that. But that does not mean the model cannot be falsified by a relevant test, even if no other model is on the table.
Sorry, I neglected to say that the point of my reference to the article Alternative hypothesis is that it answers my question “How do you show a hypothesis is flawed without providing a better alternative?” The answer is given by the last sentence, “Modern statistical hypothesis testing accommodates this type of test since the alternative hypothesis can be just the negation of the null hypothesis.” That is, if you’ve shown a hypothesis to be flawed then you have automatically provided a better hypothesis, namely its negation.
Now you might have other criteria for rejecting the negation of a hypothesis as itself a hypothesis, but you cannot object that it is flawed since you’ve just shown that it is not, and being flawed is the only criterion you’ve given for rejecting a hypothesis.
Which raises the question of what other criteria hypotheses, or models, should be judged by besides their flaws. British statistician George E. P. Box had the following to say about this in 1976.
Since all models are wrong the scientist cannot obtain a “correct” one by excessive elaboration. On the contrary following William of Occam he should seek an economical description of natural phenomena. Just as the ability to devise simple but evocative models is the signature of the great scientist so overelaboration and overparameterization is often the mark of mediocrity. (p.792 of this paper)
I take Box’s side on this matter of whether the notion of a “flawed model” is meaningful. That all models are flawed (and I don’t think Box is referring to flaws beyond the skill of the model) makes the notion of a flawed model meaningless. Furthermore while it is reasonable to prefer models that are less flawed quantitatively, I further agree with Box that numerical precision should be balanced against the complexity of the model.
Further on Box writes, Since all models are wrong the scientist must be alert to what is importantly wrong. It is inappropriate to be concerned about mice when there are tigers abroad.
Combining this with his preceding remarks, we could take this to imply that a model may be flawed, yet be a fine model because its simplicity is more important than its flaws.
But surely we can reject a model because it is somehow fatally flawed?
The difficulty I have with that idea is that fatality in flaws is in the eye of the beholder. Those judging it fatally flawed will reject it while others will still consider it in play, its flaws notwithstanding. The example you cite of Michael Mann illustrates this perfectly: people have taken sides on the matter of whether to reject it.
The notion that a model can be flawed is not as simple as you make it out to be.
I agree Vaughan Pratt with most of what you said here, especially the idea that simple models are often better in no small part because they are easier to constrain with data. My problem with the numerical PDE literature is that there is a positive results bias so that if you are not sufficiently skeptical, you will believe the models are better than in fact they are.
Turbulence modeling is a good example. At a recent NASA workshop a turbulence modeler said of our RANS models, they are post-dictive and not predictive. But then the CFDers who build the codes using the turbulence models got up and it was Colorful Fluid Dynamics time. No mention of any of these issues, just the usual perfect results.
I am convinced that this is true of climate models too, after all they solve the same set of equations albeit with much more complex subgrid models but also the grids are relatively quite course implying large numerical viscosity which any CFDer knows will damp the dynamics. This would explain why GCM’s are poor for regional climate or polar amplification for example.
So the question becomes, if the dynamics are strongly damped, are GCM’s much better than simple energy balance models with empirically based feedbacks.
Vaughan, you have really not understood anything I’ve posted.
Firstly, I stated an alternative MODEL (*not* hypothesis) was not required and explained why.
You then talk about alternative HYPOTHESES.
These are not the same thing. A model may have many tests applied to it, so the model-to-hypothesis relationship is one-to-many.
You also come up with “fatally flawed” which is not a term I used and I am not sure what you are arguing against.
I gave two ways in which models may be shown to be wrong, through inductive reasoning and deductive reasoning, neither of which implicitly needs another model to operate. (Yes you do need models for things like measurement error but these are not competing models, merely tools for performing tests).
So I am simply not even sure what your point is. As I originally stated, you do not need an alternative model to falsify a model. Nothing you have written changes (or even addresses) that.
Vaughan, one further point on re-reading your article.
You state people take sides on Mann’s hockey stick. So what? People take sides about whether Elvis is alive and living on the moon. People take sides as to whether homeopathy can cure cancer.
That doesn’t tell us anything about science or the scientific method, it tells us about how individual people lack objectivity.
Still waiting folks — all I see so far is effort wasted tangling-in floods of evasive noise.
Refocusing on the original challenge:
Can anyone point directly to specific climate models that are constrained by the following data, as they NEED to be in order to be consistent with climate nature as climate nature is actually observed?
ftp://ftp.iers.org/products/eop/long-term/c04_08/iau2000/eopc04_08_IAU2000.62-now
Since the length-of-day millisecond changes may be affected by magma movements (see WUWT recently), no, this is not part of climate modeling. Do you think these milliseconds are important for some reason?
@Spence: You state people take sides on Mann’s hockey stick. So what? People take sides about whether Elvis is alive and living on the moon. People take sides as to whether homeopathy can cure cancer
Sorry, I’d underestimated how strongly you feel about those taking Mann’s side. My bad.
Jim D, your comments reveal deep ignorance of tuned aggregate properties of climate & earth orientation data. You might as well argue that 1+1=3.
For one example, if the climate models are getting the evolution of seasonal wind fields right, the models will be able to accurately mimic the decadal volatility clustering of semiannual LOD. Model failure in this case would sharply highlight (essentially in flashing neon warning lights) grossly insufficient attention to temperature GRADIENTS.
My patience with people who ignorantly &/or deceptively deny this has expired.
The insight was first published graphically 16 years ago and it has now been nearly 3 years since it was spelled out more clearly using words for those who need a little more help to understand.
What sensible reason is there to ignore CLEARLY observed circulation manifolds??? None!
If climate discussion participants continue intransigently ignoring the hardest facts, organized religion or some other natural force of equal or greater power may be the only viable means of arresting and correcting corrupt government & university modeling “science”.
I don’t wish to discuss this further, but if someone can provide the link(s) I’ve requested above, that will be valuable and I might be appreciative.
Vaughan, I can see we’re done here, but I’ll explain why.
My comment on Mann’s work was not a criticism of Mann’s work – and if you understood logic you’d realise that. I was employing a reductio ad absurdum device to illustrate why your logic was flawed, i.e. it was a criticism of your logic, not of Mann’s study. It works by applying your reasoning to other cases and showing it leads to absurd conclusions.
If I wanted to criticise Mann’s work, I would most certainly do so in a very different way.
The second problem is following your logic error, you then invoke your own beliefs about my feelings towards others. That’s really interesting. Since telepathy is not possible, second guessing either motives or feelings usually ends up with the individual doing so reinforcing their own bias. It is a very easy path to self-delusion, and something that should be learnt at an early age for anyone trying to understand science.
Your simple logic error doesn’t bother me too much – perhaps my original comment could have been more explicit. But your decision to assess things in the subjective, unknowable, rather than the objectively measurable suggests that continued discussion is a waste of my time – because I’m only interested in the objectively measurable.
Spence_UK, you’re right about it being a waste of time. I’ve had the same sort of experience many times (even with the same person), and in nearly every case, nothing worthwhile came after. People don’t seem to walk back from things like that.
@Spence: if you understood logic you’d realise that. I was employing a reductio ad absurdum device to illustrate why your logic was flawed, i.e. it was a criticism of your logic, not of Mann’s study. It works by applying your reasoning to other cases and showing it leads to absurd conclusions.
First, you were not using reductio ad absurdum, which is a perfectly sound method of proving a proposition, namely by assuming its negation and obtaining a contradiction. What you seem to want to do is to show unsoundness of a line of reasoning by using the same reasoning in circumstances leading to a falsehood. These are different things: the former is sound reasoning while the latter demonstrates unsound reasoning.
Second, what “absurd conclusion” did either of your analogies arrive at? The obvious absurdities were that Elvis is alive and homeopathy cures cancer. Apparently that’s not what you had in mind, but in that case what was your intended absurdity, and in what sense is it an absurdity from the standpoint of logic (as opposed to common sense, experience, belief, etc.)?
Third, how is an analogy that contains an absurdity an analogy unless the original also contains an absurdity?
I don’t mind being accused of illogicality provided the accusation is logical.
@BS: People don’t seem to walk back from things like that.
In fairness to Brandon it should be pointed out that I’ve seen him “walk back” from a point he’d been arguing for a while. If CE were easier to search I’d dig up the link, which was more than a year ago.
Some of the arguments encountered on blogs stem not from one or both sides reasoning illogically but from incompatible premises. In this case Spence’s premise is that a hard line exists between right and wrong models, which is a fundamental tenet of mathematical logic, whereas I worked from Box’s premise that “all models are wrong.”
One should not be surprised that these two premises would lead to different conclusions.
Were Box a logician his would clearly be an untenable position. That he’s a statistician points up a difficulty in insisting on the primacy of logic over statistics.
Vaughan Pratt, your stated definition of reductio ad absurdum is bad, if not wrong. That may have something to do with why it appears you don’t actually understand what you’re talking about. Spence_UK did use reductio ad absurdum, and it did show your position is wrong. Your responses haven’t addressed his arguments, but have instead misrepresented it.
To demonstrate why I say this, we can look at your second and third points. For your second point, you pointed out the “absurdities” in Spence_UK’s examples. You then, without any explanation, hand-waved them away as “apparently” not what he had in mind even though they were exactly what he was talking about. You then asked how analogies could have absurdities in them if the original subject did not have absurdities in it despite the fact the entire purpose of the analogies was to highlight the absurdity in the original subject.
In other words, you first dismissed an entire point from Spence_UK without any justification (other than you are “apparently” right) then begged the question to say you were right, thus his argument couldn’t be right. And all of this happened only after Spence_UK left the conversation. Prior to that, you just responded to his substantive remarks with a comment that contained nothing but backhanded snideness.
I’m happy you sort-of complimented me (though I suspect you don’t know what “walk back” means), but I’d much rather you do simple things like treat people who disagree with you with respect. As it stands, it seems pointless to disagree with you. Your behavior, at least some of the time, makes it impossible for anything to come from such.
Vaughan,
Spence and Brandon are correct that your understanding of reductio ad absurdum is in error. What you described (“…assuming its negation and obtaining a contradiction…”) is reductio ad impossibilem which is regarded only as a specific case of of reductio ad absurdum.
Readers digest version: we tuned the models a long time ago to recreate the past temperatures and now we are tuning the models to recreate other aspects of climate. I would suggest more work on figuring out why they require tuning and less work on figuring out what the ramifications of the results the tuning created will be.
They don’t look at the data and see that it snows when oceans are warm and wet and it don’t snow as much when oceans are cold and frozen. They don’t have the ice right yet.
We visited the glaciers in Alaska. They go down to sea level and extend more or less at sea level. Some of the big ships go really close. This is “SEA LEVEL”. The sea level land very clearly has glaciers that advance and retreat right there. We have been there and did see this. The ice is not different there because it is a little warmer or colder. The ice is different there because the Ice Capacity at the top of the glacier can push ice faster than it melts at the tail or it pushes ice slower than it melts at the tail. This capacity is increased when oceans are warm and does decrease when oceans are frozen. When ice advanced it cools earth. When ice retreats earth is warmed more by the sun because albedo is lower.
The Consensus Climate Clique adds ice volume and ice extent in lockstep phase and then remove ice volume and ice extent in lockstep phase.
THAT IS NOT POSSIBLE. IT MUST SNOW FIRST AND ADVANCE LATER.
THE SNOWFALL MUST STOP FIRST AND THE ADVANCE STOPS AND RETREATS LATER.
THIS IS NOT IN THE THEORY OR IN THE MODELS
IF THEY NEVER GET THE ICE RIGHT, THEY WILL NEVER BUILD A MODEL WITH SKILL IN FORECASTING.
I refer to Smith et al, Science, August 2007. Here the authors discussed in considerable detail, how they tuned their model. They then used the model to forecast what global temperatures would be in 2014. We do not, as yet, have this figure, but it is clear that their model could not predict the future. The Met. Ofice used this prediction on their web site for years. Then, last Christmas, over the holidays, they quietly changed the forecast.
Now when Klotzbach and Grey used their model to forecast the Atlantic hurricane season in December for 20 years, they realized that their forcast has no merit. They analyzed the data, and published a paper as to what they thought was wrong. So far as I have been able to make out, the UK Met. Office has not done this. They have given no reasons as to why the original tuning was wrong, nor what new tuning was done.
I suggest this is one of the reasons why we skeptic/deniers dont trust the models, Or more important, the people who run them.
A physicist, a biochemist, and a climate modeler are out deer-hunting and spot a deer in a clearing.
The physicist carefully takes aim, shoots but misses 5ft to the left.
Then the biochemist takes a shot and misses 5ft to the right.
The climate modeler joyfully jumps into the air and yells
‘We got him!’
Skeptic: there was no deer.
This skeptic would say there is a good reason the climate scientist was not carrying a rifle.
Sad but true.
Doc,
That’s good!
Alternatively:
“The climate modeler adjusts the rifle sites and shoots 10 ft to the right where he projects the deer to be.”
Doc Martyn,
Brilliant.
Not exactly the climate models the OP had in mind:
http://www.fastcoexist.com/1682439/a-better-climate-change-model-built-by-you
Bart,
That’s definitely the way that systems thinkers view the environment. The Ventus project is a semantic web view of available information which can be indexed and reasoned with.
I am ramping up my own semantic web knowledgebase of environmental models at a main site that I call Context/Earth
http://ContextEarth.com
Anyone interested in a model that gets it right check out this one;
http://judithcurry.com/2011/07/25/loehle-and-scafetta-on-climate-change-attribution/
I wrote to Loehle last week (copied Judith) asking for an update since Loehle & Scafetta 2011 now has 2 more years of data. More importantly 2 more years of data which FITS PERFECTLY to their model’s forecast.
Loehle replied saying the new data does indeed fit perfectly but since the model is decadal he didn’t think updating it after only two years was useful. Judith also replied saying she’d see what the authors were up to these days and possibly generating a new article.
Amazing. Here’s flawless model being widely ignored. Why? Because it finds AGW warming of only 0.06C/decade and orbital mechanics explaining the rest. If L&S 2011 is correct there’s simply no basis whatsoever to be concerned about CO2 emission. And that’s why it’s ignored despite being perfectly predictive
Dr Curry,
As a former colleague of Dr Murry Salby, what are your thoughts on his current situation wrt Macquarie University?
I can’t speak for Judy, but having been an MIT professor myself for a decade, if Richard Lindzen were a professor at Macquarie instead of MIT one might picture a bleaker employment future for him.
Not that Richard doesn’t embarrass MIT, but at least their embarrassment isn’t an occasion for them to hit the eject button.
Speakig of embarrassments when are you going to reveal what you found when trying to replicate Woods’ greenhouse experiment using the same materials that Woods used?
http://boole.stanford.edu/WoodExpt/
According to archive.org you wrote the quoted paragraph no later than July 20 2011:
http://web.archive.org/web/20110720050245/http://boole.stanford.edu/WoodExpt/
What exactly qualifies as “due course” in your mind?
C’mon Pratt, tell us all what you found.
Too embarrassed to reply, Vaughan? LOL
Loehle works for a lobbying group within the pulp and paper industry, obviously getting significant funding from Koch Industries.
That of course isn’t a factor since all that matters is the science, and for that his trendology work is subpar.
A classic ad hominum attack so typical of the man who blogs from his mom’s basement and thinks that De Smog is objective. Loehle is an expert on biology and his credentials are pretty impressive. Unlike yours Webby, which is limited to grey literature. So please, try to act your age and leave the teenage stuff in the past. I continue to be amazed that Judith allows this kind of stuff to get past moderation.
“Arguably the most poorly documented aspect of climate models is how they are calibrated, or ‘tuned’”. I’ll argue that the most poorly documented aspect of climate models is the accuracy of their predictions – or, almost equivalent, the errors inherent in models. These errors come from two different sources:
1.Computational errors. I have not seen yet a good discussion of the influence of a 200km grid size on results. Mountains, shorelines, etc. are poorly represented. Thunderstorms, tornadoes, and other phenomena of let’s say 100 km size are poorly represented if at all. Dr. Curry emphasizes the importance of a very precise saturated vapor pressure, but does it really remain constant over a 200 km grid cell?
2. Errors in the underlying physics. There are still uncertainties regarding clouds – nucleation, ice or supercooled liquid, etc. As an example, a 2.5% error in the latent heat of vaporization of water in CAM 5 model is so insignificant that nobody bothers to even discuss it.
I hope to see models producing error bounds for their predictions. To take an ensemble of 15 models and derive “error bounds” from their slowly diverging results is not very scientific. Actually, it is an antithesis of science.
The models miss out the direct heat from the Sun, longwave infrared.
They have excised Herschel in their in their “shortwave in longwave out”, in order to pretend there is no direct radiant heat from our millions of degrees hot Star the Sun so they can use downwelling measurements of longwave infrared and pretend these come from the “atmosphere back radiating from greenhouse gases”.
They have fraudulently attributed all the solar constant to shortwave.
None of these modellers know what they are modelling.
No they don’t miss out on heat from the sun. One of the few reliable facts in this debate is a solar constant which is measured 24/7 by satellites. It’s a point source which makes the measurement easy. Far more error prone is measuring what’s emitted by the earth because it isn’t a point source, it isn’t lit uniformly, and the surface is not only not uniform across but not uniform from one minute, day, month, or year to the next in the same spot.
The solar constant is the measurement of how much the Sun’s heat heats the surface, visible light cannot heat land and water – the models have no weather in their world because they have no direct heat from the Sun.
David – that’s not the point. There is an IR radiation from the sun which never reaches the Earth because CO2 reflects it back, just like it reflects back the IR radiation emitted by the Earth. The point is that the whole IR portion of the sun is only 1% of the insolation energy, and the portion of it in “CO2 windows” is negligible. So Myrrh is technically correct, but the effect is small.
One of the few reliable facts in this debate is a solar constant which is measured 24/7 by satellites.
indeed the fact that the solar constant is not constant, is one of the neat facts that arise ie the annular mode and the Bartol rotation.An interesting constraint in SH summer.
Myrrh,
A body that absorbs visible light will increase its temperature. A non-reflective black body will exhibit the greatest absorptivity, and hence the greatest rise in temperature from a fixed light source.
This supposed non heating by visible light is nonsense, pure and simple.
If climatologists need to go back to belief in the luminiferous ether or caloric to explain what happens to the energy absorbed from visible light by an object, so be it. I am still surprised that people with PhD’s in so-called “scientific” areas, can continue to promote “weird science” as evidenced in some of the rubbish “academic” papers published from time to time.
It’s even more surprising that people in positions of power take any notice of the hucksters.
“The dams will never be full again . . . ”
Whoops. Oh well, the billions wasted in building desalination plants created jobs.
“Snow will be but a memory . . . ”
Whoops. Oh well, we can probably buy back all the snow clearing equipment we sold. The few million we lost can be passed on in increased airport fees.
And so on.
I am not in disagreement with your general sentiments, just in the particular regarding energy absorbed from visible light.
Live well and prosper,
Mike Flynn.
@CG: There is an IR radiation from the sun which never reaches the Earth because CO2 reflects it back, just like it reflects back the IR radiation emitted by the Earth.
The ingenious novelty of this line of reasoning notwithstanding, it has two fatal problems.
1. “The IR radiation emitted by the Earth” is at far-infrared wavelengths representing only a miniscule fraction of the total energy of solar insolation.
2. That tiny amount of insolation is not reflected but merely absorbed, albeit at high altitude. Only actual reflection can be appealed to in this line of reasoning.
More importantly, although near-infrared wavelengths constitute roughly half of the total energy of solar insolation, those relatively short wavelengths are not reflected back but are absorbed at the surface of the Earth.
Vaughan Pratt,
Re your response to Curious George.
CG is right. An instance of reflection that is easily observed is that demonstrated by pictures of the Earth taken from space. The colours indicate the wavelengths which are reflected.
Clouds appear as white, indicating reflection of all visible wavelengths. Satellites routinely reflect all sorts of wavelengths for communication and remote sensing purposes. I am surprised that you appear so ill informed about basic physics.
Possibly you might like to specify the actual wavelengths which cannot be reflected from, say, water, at angles which, according to Fresnel’s equations, result in 100% reflection. I assume you are aware of the phenomenon “total internal reflection” and the physics supporting this. It is utilised in many different areas, not the least of which is transmitting light along optical cables.
Are you really a professor? I’m finding it a bit hard to believe. I can only hope you are not teaching anything related to the nature and behaviour of electromagnetic radiation to students.
Maybe I misunderstood your response to CG. If so, please feel free to correct me.
Live well and prosper,
Mike Flynn.
ozzio, CG thought IR was reflected when it is not. It is hardly scattered at all due to its long wavelength. CG might have meant that CO2 absorbs and emits some IR, but he said ‘reflected’ which is just wrong physics terminology. Word usage is important in science, otherwise it leads to confusion like this.
JimD,
Fair enough point. What’s your rigorous definition of reflection as it relates to a specific electromagnetic wavelength and a specified concentration of CO2 in a standard atmosphere sample?
Your definition needs to be sufficiently inclusive to comply with current knowledge of quantum physics. I note you seem to have explicitly removed any mention of absorption and subsequent re-emission from your definition, so of course your definition cannot include those terms.
I agree with you, word usage is very important.
I await your definition. I can’t agree or disagree with your comment yet, as I probably have a different definition. Yours may well be different to mine.
Live well and prosper,
Mike Flynn.
ozzio, in physics, reflection is a change in direction of the photons without modifying them in any way. Absorption of a photon may or may not be accompanied by emission at the same wavelength, and therefore does not have a traceable photon path like reflection.
JimD,
I am sorry, but your definition is obviously incomplete, and in typical climate-speak encompasses that which may be trivially true, while ignoring that which may be important.
I invite you to reconsider your definition. As it stands, it is logically inconsistent, as well as being incomplete. We both agree about the importance of definitions and meanings. I am surprised you have provided such an inadequate example.
Live well and prosper,
Mike Flynn.
Pratt’s correct. The tiny amount of longwave in sunlight isn’t reflected by CO2. A fraction of it is absorbed and approximately half of that is reemitted in the direction from whence it arrive. That’s not reflection it’s absorption and reemission as Pratt correctly stated and that which I’m clarifying and expanding.
Don’t forget that CO2 has rather narrow LWIR absorption bands and sunlight is continuous blackbody spectrum. Therefore, in the miniscule amount of LWIR emitted by the sun, CO2 only absorbs a small fraction of that because of its narrow absorption bands. Adding insult to injury because it’s absorption and reemission rather than reflection only about half of the LWIR in sunlight captured by CO2 is reemitted outwards while the other half is emitted downward at the earth so the faux reflection is only half of what the absorption bands manage to snag.
Write that down.
ozzio, sorry, which part didn’t you understand, absorption, reflection, emission, perhaps transmission and scattering? These are the usual concepts in radiative transfer. Your own blind acceptance of CG’s wrong statement was woeful, as I think you see now. If you don’t think reflection is a change in direction of photons when they hit a surface, please offer your alternative.
Jim D is also correct.
http://hyperphysics.phy-astr.gsu.edu/hbase/phyopt/reflectcon.html#c1
Note we can, as he described, trace paths for reflected photons based upon arrival angle of incidence.
Absorption and subsequent reemission is an entirely different process. Reemission is not guaranteed and the direction of any reemission is random.
http://hyperphysics.phy-astr.gsu.edu/hbase/mod5.html
You guys want on the cutting edge of reflection in the atmosphere try
this. I became aware of it a couple years ago I guess when Scientific American had an article on a new hypothesis:
.
http://www.scientificamerican.com/article.cfm?id=the-science-of-the-glory
SciAm is paywalled. More info at wikedpedia.
http://en.wikipedia.org/wiki/Glory_(optical_phenomenon)
I wonder how it’s “modeled” in GCMs?
Hahaha. That’s a joke, son.
What I find incredibly hard to take on board is the failure of the otherwise clearly intelligent and skilled to see the glaringly obvious flaw in the models, as Ossieostrich puts it:
“Climatologists believe that wrapping a body with CO2 will cause its temperature to increase. No study involving the use of any sort of equipment can show this, because it is arrant balderdash.”
Or as I put it, show how carbon dioxide in my attic heats my attic floor.
We know from this all the models are junk science, and regardless how good the technical analyses on their other failures to model climate on any time scale, this is still the bottom line. The basic premise has never been shown to be physically possible, and that is testable in a lab.
It was the absurd claims made for carbon dioxide which first got me interested to continue exploring the other AGW claims on the properties and processes of the physical world around us. The next that cropped up was the claim that visible light from the Sun heated the Earth’s surface and no direct radiant heat from the Sun, aka longwave infrared, reached us, and, that the heat we feel from the Sun is the visible light rays.
This is physically impossible. It is physically impossible. It is physically impossible in the real world.
From traditional physics, it is clearly seen that the claims made about the physical properties of matter and energy on which the AGW models are built are contrary to the simple basics about the properties and processes of matter and energy, which are very well known to real science and empirically tested by use in countless applications – for example, glass and film for windows are manufactured to maximise entry of visible light from the Sun while minimising the direct radiant heat from the Sun in order to keep rooms cool, to save on air conditioning costs.
It appears that even this logic disjunct is not enough to stop the flow of excuses for the accuracy of the AGW Greenhouse Effect physics any more than the simple fact of the physical absurdity of the claim that wrapping a trace gas around something raises it temperature, which could be very easily lab tested, but has never been shown to have been tested.
But what is going on here? How can ozzieostrich see the absurdity in the claims made for carbon dioxide and yet not see the absurdity in the AGW claims made for “visible light from the Sun heating the Earth’s surface and no longwave infrared reaching the surface”?
In traditional physics longwave infrared is the wavelength of heat, that is why it is called thermal infrared, or simply in thermodynamics, radiant heat, and, visible light is classed non-thermal, we cannot feel it as heat.
We cannot feel visible light as heat. Nor can we feel the other shortwaves of uv and near infrared as heat. Visible light is simply called light and near infrared is classed in with this as Reflective and not Thermal. And the science discipline of optics and not thermodynamics would be the first port of call to find out more about its real properties and processes. Unless you are a biologist.
Visible light works on the electronic transition level of radiant energy from the Sun meeting matter, not on the bigger whole molecule vibrational level which is the level energy must impact to raise the temperature of matter. Radiant heat however, aka longwave infrared aka thermal infrared aka heat, does impact matter on the vibrational level, which means that it heats up matter, raises its temperature. Heat heats.
This is also amenable to simple lab experiments.. How does visible light as from the Sun, not artificially enhanced with magnifying glasses or by using lasers, heat land and water?
It cannot do this. The electronic transition level is not the level on which matter is heated, and, water is a transparent medium for visible light, it doesn’t get absorbed at all, not even on the electron level, it gets transmitted unchanged.
Visible light is absorbed on the electronic transition level in the atmosphere where the electrons of the molecules of nitrogen and oxygen absorb it and are briefly energised by it, and on returning to ground state emit the same energy they take in. This is how we get our blue sky, in the electronic transition of reflection/scattering.
It takes intense actual physical heating of land and water at the equator to get us our great winds and weather. Unless you can show how visible light can do this you are simply regurgitating brainwashed AGW Greenhouse Effect memes.
How does the AGW GHE justify the lack of direct thermal infrared heat from the Sun? This is where it becomes incontrovertibly obvious the whole thing is a deliberate scam. The two reasons given are so off the wall idiotically absurd that only those who have no traditional science basics or empirical science knowledge could possibly think these rational.
The original, or what Pekka tells me is the CAGW version, is that there is an “invisible barrier like the glass of a greenhouse at TOA preventing longwave infrared from Sun entering”.
Where is this “invisible barrier” – it is unknown in traditional science which since Herschel knows that the great heat we get from the Sun is in the invisible infrared. We know this great heat reaches us from the Sun, it is a physical fact that this is what we feel as heat. There is no “invisible barrier at TOA” preventing this direct heat from the Sun reaching us at the surface.
Now, one would not have thought it possible to outdo the absurdity of claiming there is an “invisible barrier at TOA preventing longwave from the Sun entering”, but Pekka tells me that the AGW have their own explanation for why no longwave infrared comes from the Sun, the CAGW version is deemed silly. Pekka told me that we do not get any direct longwave infrared from the Sun because the Sun produces insignificant amounts of it, and we get insignificant of insignificant.
Now, for those still with traditional physics basics this is just too funny for words, because it is saying that we get no heat from the millions of degrees hot Star which we call the Sun. Absurd really isn’t a strong enough word for this.., but it gets worse, AGW says the Sun is only 6000°C.
How can you possibly think that? That is around the temperature of the Earth’s core and this the great blazing hot STAR which is practically all of the mass our solar system, we know it is millions of degrees hot! It is so huge and powerful that even across the vast distance of 93 million miles it only takes around 8 minutes for it immense heat to reach us..
How this gets explained is further confirmation that this is a deliberate scam, the temperature of the AGW GHE Sun is given as 6000°C, by a “planckian” curve calculated from the thin 300 mile wide atmosphere of visible light around the Sun.
How can people in science not know that the Sun is really millions of degrees hot and this figure makes it a very cold star indeed? It could only have been put into place by brainwashing. The absurdity isn’t noticed because the meme that “it is visible light from the Sun which heats the Earth’s surface” has been put into place through the general education system over a few decades, so people taught this through the now corrupted general education system and having no reason to understand this further in their lives, never question it. No matter how far they go in science fields where this information is not relevant to their practical, empirical, work.
Because this is scam, it cannot be anything else when one appreciates the cleverness of the changes made from real world physics, the next obvious step is to look to see how this real physical knowledge is hidden – what sleights of hand exist to distract from reality to continue pushing the scam?
Well, one I found yesterday a good example of the conman’s art in this as I posted to Vaughan Pratt in the IPCC discussion 3, Skeptical Science has missed out Herschel on giving a history time line of heat from the Sun..: http://judithcurry.com/2013/07/05/ipcc-discussion-thread-3/#comment-342457
And as I have mentioned before, this is a technique used in the AGW GHE scam, for example in taking out the whole of Water Cycle, and taking out rain in the Carbon Cycle – these are simply not mentioned in descriptions. So Herschel is not mentioned in the history time line so Skeptical Science can continue to con that visible light heats land and water of the Earth’s surface, just as Van der Waals is never mentioned in the history of gases, so AGWScienceFiction can continue to pretend that carbon dioxide and nitrogen and oxygen are “ideal gas”, so you don’t notice you don’t actually have an atmosphere at all around your Greenhouse Effect world, only empty space surrounded by an invisible unknown to science container keeping your ideal gas pretend molecules from flying off to the ends of the universe under their own molecular momentum..
Further to Vaughan Pratt’s More importantly, although near-infrared wavelengths constitute roughly half of the total energy of solar insolation, those relatively short wavelengths are not reflected back but are absorbed at the surface of the Earth”.
This is not the AGW claim, which says that is mostly visible and that near infrared makes only 1% of the total, the total being visible and the two shortwaves either side of uv and near infrared; uv a small percentage of that, 8 iirc. I have given some examples of the AGW meme of it being mostly or all visible which is claimed.
Your “roughly half” figure comes from real world physics which gives infrared at around 53%.
I am asking you here to question all these claims. But particularly I am asking you to prove, scientifically and empirically, that the energy budget of the models of “shortwave in longwave out” is fact and not fiction.
Because:
– the reason it is in place is so that AGW/CAGW can pretend that all real world measurements of downwelling longwave infrared come not from the Sun direct, but “from the atmosphere backradiated by greenhouse gases”.
This is proof positive that the “Greenhouse Effect” is a scam to sell AGW and CAGW. That is the only reason you are now repeating the fake fisics meme that we get no direct longwave infrared heat from our millions of degrees hot blazing Star we call the Sun, and that you keep repeating that visible light can heat the land and water of Earth’s surface.
It is clear to anyone who has a basic knowledge of real physics on the properties and processes of energy and matter that the claims made in the AGW Greenhouse Effect as depicted in the cartoons of “shortwave in longwave out” are absurd nonsense.
So let us get back on track here – traditional physics still teaches that the great heat we actually physically feel from the Sun is the invisible infrared, aka thermal infrared. We have known this since Herschel.
We have improved our knowledge since then… We now know that the invisible infrared is divided into thermal and non-thermal, shortwave infrared is not classed as thermal. Because it is not hot. We cannot feel it as heat. Thermal means the electromagnetic wavelength of heat, longwave infrared. Visible light is not thermal. We cannot feel shortwaves.
Please read the NASA’s old page from traditional science, which I posted here: http://judithcurry.com/2013/07/05/ipcc-discussion-thread-3/#comment-341398
Now, bearing in mind everything I have pointed out in this post, you have no excuse to continue claiming that the “Greenhouse Effect” meme of “shortwave in longwave out” is real world physics.
Real traditional physics already falsifies it.
None of these models has any credibility in real physics.
Because you are using the real direct heat from the Sun claiming it is from “backradiation by greenhouse gases” you are using a science fraud.
If you want to argue that the AGW Greenhouse Effect of “shortwave in longwave out” is real, then you must, YOU MUST, prove it.
Or you are not scientists.
JimD,
Now that you have defined reflection in such a way as to preclude CO2 from reflecting radiation, you might care to comment on this : –
“Greenhouse gas
From Wikipedia, the free encyclopedia
Greenhouse gases reflect radiation from the Earth and stop it from being lost into space. This causes the Earth’s temperature to be higher than it would be without greenhouse gases. The name for this is the “greenhouse effect.” ”
You will have to excuse me for approaching this in such a roundabout manner, but to challenge the Wikipedia statement directly would merely have resulted in the usual comments about my presumed lack of knowledge of science.
So is CG justified in using the Warmist definition to make his point, or does CO2 radiation reflection only occur when it bolsters the Warmist position?
Live well and prosper,
Mike Flynn.
@oz: to challenge the Wikipedia statement directly would merely have resulted in the usual comments about my presumed lack of knowledge of science.
Your quote is from the Simple English Wikipedia, which claims to meet the needs of “children and adults who are learning English” and can therefore be expected to sacrifice some precision in language in favor of sticking to basic vocabulary. You’ll find no such statement about greenhouse gases “reflecting” in the regular Wikipedia article on greenhouse gases.
If you find Simple Wikipedia easier to follow, by all means continue to use it, but please don’t misrepresent it as the real McCoy when quoting from it.
ozzio, do you think GHGs reflect IR or do you know some physics? This statement is not using rigorous scientific language for reflection. It is actually two processes, absorption and emission, but not reflection, in technical terms.
Vaughan Pratt,
Cut and paste from Wikipedia : –
“About Wikipedia
This is the front page of the Simple English Wikipedia. Wikipedias are places where people work together to write encyclopedias in different languages. We use Simple English words and grammar here. The Simple English Wikipedia is for everyone! That includes children and adults who are learning English. There are 102,101 articles on the Simple English Wikipedia.”
Wikipedia clearly states ” . . . The Simple English Wikipedia is for everyone. . . “.
This would appear to be at odds with your interpretation. As with most things climatological, Warmists often quote Wikipedia articles which support their claims. It’s hardly my fault if a Warmist Wikipedia editor misses a clanger.
As I have mentioned before, it is probably easier for a Warmist to edit the incorrect article than someone such as myself. Both yourself and Jim D appear to have missed the point. You will note from my comments, particularly my last one to Jim D, that I didn’t state that I agreed with CG, but rather that a Wikipedia article, (albeit one specifically designed to use simple English), backed up his statement.
Am I correct in assuming that no-one in the Warmist camp is prepared to edit the article to correct it?
Live well and prosper,
Mike Flynn.
When i first learned that there are more than 20 models i found it strange that they just do an average of all the models and believe in the result.
I thought that the models would have some differences and were specialized to do certain parts of the climate better than others and especially i believed it would be described.
This post confirms my doubt in the models and the way they are used.
This paper is indeed a very welcome addition to the climate modeling literature. The existence of this paper highlights the failure of climate modeling groups to adequately document their tuning/calibration and to adequately confront the issues of introducing subjective bias into the models through the tuning process.
fwiw, I agree, and I thank you for this post.
Judith,
One of your most interesting and important posts. I hope that you will build upon this point explanation of climate model development. There are some bright climate scientists that think their models are beyond question. Maybe they are right but it is nice to see everything objectively discussed.
Thank you
RealClimate in a post about Alberta tar sands, casually mention the use of a model tuned to yield a 3C sensitivity. So they can pick what the sensitivity will be. Meanwhile Tamino insists models are not curvefitting or tuning, but rather everything we know about the physical world.
@MikeN: Meanwhile Tamino insists models are not curvefitting or tuning, but rather everything we know about the physical world.
Which he seems to believe we now know everything about that is relevant to the main features of global climate. This is by no means an uncommon attitude even among prominent scientists. For example towards the end of the 19th century some physicists held that the main goal of physics was henceforth to refine all the constants to higher precision. Quantum mechanics, relativity, etc. were not on their radar. Likewise Tamino accounts for the Atlantic Multidecadal Oscillation in terms of volcanoes. The possibility of new geophysics providing a better account is off his radar.
Vaughan, You are hitting home run after home run on this thread. Scientists usually like to stick with current theories because its less work and there are egos involved. But really science is about constant questioning and challenging, except that is for climate science, where Real Climate is the ex cathedral organ of orthodoxy. Like St. Thomas Aquinas, every disagreement is responded to in line so no challenge gets to even be stated clearly. As I believe Russell said, St. Thomas knows it all and proves it all with equal certainty, from the most trivial question to the nature of God and Man.
Pingback: how much warming from adding carbon dioxide to the atmosphere is what we - Page 125 - US Message Board - Political Discussion Forum
The Himalayas and nearby peaks have lost no ice in past 10 years, study shows
http://www.guardian.co.uk/environment/2012/feb/08/glaciers-mountains
The world’s greatest snow-capped peaks, which run in a chain from the Himalayas to Tian Shan on the border of China and Kyrgyzstan, have lost no ice over the last decade, new research shows.
The discovery has stunned scientists, who had believed that around 50bn tonnes of meltwater were being shed each year and not being replaced by new snowfall.
The study is the first to survey all the world’s icecaps and glaciers and was made possible by the use of satellite data. Overall, the contribution of melting ice outside the two largest caps – Greenland and Antarctica – is much less than previously estimated, with the lack of ice loss in the Himalayas and the other high peaks of Asia responsible for most of the discrepancy.
Bristol University glaciologist Prof Jonathan Bamber, who was not part of the research team, said: “The very unexpected result was the negligible mass loss from high mountain Asia, which is not significantly different from zero.”
The melting of Himalayan glaciers caused controversy in 2009 when a report from the UN’s Intergovernmental Panel on Climate Change mistakenly stated that they would disappear by 2035, instead of 2350. However, the scientist who led the new work is clear that while greater uncertainty has been discovered in Asia’s highest mountains, the melting of ice caps and glaciers around the world remains a serious concern.
“Our results and those of everyone else show we are losing a huge amount of water into the oceans every year,” said Prof John Wahr of the University of Colorado. “People should be just as worried about the melting of the world’s ice as they were before.”
His team’s study, published in the journal Nature, concludes that between 443-629bn tonnes of meltwater overall are added to the world’s oceans each year. This is raising sea level by about 1.5mm a year, the team reports, in addition to the 2mm a year caused by expansion of the warming ocean.
The scientists are careful to point out that lower-altitude glaciers in the Asian mountain ranges – sometimes dubbed the “third pole” – are definitely melting. Satellite images and reports confirm this. But over the study period from 2003-10 enough ice was added to the peaks to compensate.
It is time to RE-tune the models.
Yep, it snows more when oceans are warm and wet and that is when the ice on earth is replenished.
Sorry, I messed up the coding of a post I made above. But I am going to repost it here because it is directly relevant to the subject of climate model tuning, and I should like all who claim that “shortwave in longwave out” of the models is real world physics to read this, because, as an ordinary oik not involved in any of the science fields I am getting frustrated with all the science discussions about climate which keep skirting the issue that the basic claims have never been shown to be real world physics:
What I find incredibly hard to take on board is the failure of the otherwise clearly intelligent and skilled to see the glaringly obvious flaw in the models, as Ossieostrich puts it:
“Climatologists believe that wrapping a body with CO2 will cause its temperature to increase. No study involving the use of any sort of equipment can show this, because it is arrant balderdash.”
Or as I put it, show how carbon dioxide in my attic heats my attic floor.
We know from this all the models are junk science, and regardless how good the technical analyses on their other failures to model climate on any time scale, this is still the bottom line. The basic premise has never been shown to be physically possible, and that is testable in a lab.
It was the absurd claims made for carbon dioxide which first got me interested to continue exploring the other AGW claims on the properties and processes of the physical world around us. The next that cropped up was the claim that visible light from the Sun heated the Earth’s surface and no direct radiant heat from the Sun, aka longwave infrared, reached us, and, that the heat we feel from the Sun is the visible light rays.
This is physically impossible. It is physically impossible. It is physically impossible in the real world.
From traditional physics, it is clearly seen that the claims made about the physical properties of matter and energy on which the AGW models are built are contrary to the simple basics about the properties and processes of matter and energy, which are very well known to real science and empirically tested by use in countless applications – for example, glass and film for windows are manufactured to maximise entry of visible light from the Sun while minimising the direct radiant heat from the Sun in order to keep rooms cool, to save on air conditioning costs.
It appears that even this logic disjunct is not enough to stop the flow of excuses for the accuracy of the AGW Greenhouse Effect physics any more than the simple fact of the physical absurdity of the claim that wrapping a trace gas around something raises it temperature, which could be very easily lab tested, but has never been shown to have been tested.
But what is going on here? How can ozzieostrich see the absurdity in the claims made for carbon dioxide and yet not see the absurdity in the AGW claims made for “visible light from the Sun heating the Earth’s surface and no longwave infrared from the Sun reaching the surface”?
In traditional physics longwave infrared is the wavelength of heat, that is why it is called thermal infrared, or simply in thermodynamics, radiant heat, and, visible light is classed non-thermal, we cannot feel it as heat.
We cannot feel visible light as heat. Nor can we feel the other shortwaves of uv and near infrared as heat. Visible light is simply called light and near infrared is classed in with this as Reflective and not Thermal. And the science discipline of optics and not thermodynamics would be the first port of call to find out more about its real properties and processes. Unless you are a biologist.
Visible light works on the electronic transition level of radiant energy from the Sun meeting matter, not on the bigger whole molecule vibrational level which is the level energy must impact to raise the temperature of matter. Radiant heat however, aka longwave infrared aka thermal infrared aka heat, does impact matter on the vibrational level, which means that it heats up matter, raises its temperature. Heat heats.
This is also amenable to simple lab experiments.. How does visible light as from the Sun, not artificially enhanced with magnifying glasses or by using lasers, heat land and water?
It cannot do this. The electronic transition level is not the level on which matter is heated, and, water is a transparent medium for visible light, it does not get absorbed at all, not even on the electron level, it gets transmitted through unchanged.
Visible light is absorbed on the electronic transition level in the atmosphere where the electrons of the molecules of nitrogen and oxygen absorb it and are briefly energised by it, and on returning to ground state emit the same energy they take in. This is how we get our blue sky, in the electronic transition of reflection/scattering.
It takes intense actual physical heating of land and water at the equator to get us our great winds and weather. Unless you can show how visible light can do this you are simply regurgitating brainwashed AGW Greenhouse Effect memes.
How does the AGW GHE justify the lack of direct thermal infrared heat from the Sun? This is where it becomes incontrovertibly obvious the whole thing is a deliberate scam. The two reasons given are so off the wall idiotically absurd that only those who have no traditional science basics or empirical science knowledge could possibly think these rational.
The original, or what Pekka tells me is the CAGW version, is that there is an “invisible barrier like the glass of a greenhouse at TOA preventing longwave infrared from Sun entering”.
Where is this “invisible barrier”? It is unknown in traditional science which since Herschel knows that the great heat we get from the Sun is in the invisible infrared.
We know this great invisible longwave infrared heat reaches us from the Sun, it is a physical fact that this is what we feel as heat. There is no “invisible barrier at TOA” preventing this direct longwave infrared heat from the Sun reaching us at the surface.
Now, one would not have thought it possible to outdo the absurdity of claiming there is an “invisible barrier at TOA preventing longwave from the Sun entering”, but Pekka tells me that the AGW have their own explanation for why no longwave infrared comes from the Sun, the CAGW version is deemed silly. Pekka told me that we do not get any direct longwave infrared from the Sun because the Sun produces insignificant amounts of it, and we get insignificant of insignificant.
For those still with traditional physics basics this is just too funny for words, because it is saying that we get no heat from the millions of degrees hot Star which we call the Sun. Absurd really isn’t a strong enough word for this.., but it gets worse, AGW says the Sun is only 6000°C.
How can you possibly think that? That is around the temperature of the Earth’s core and this the great blazing hot STAR which is practically all of the mass our solar system – we know it is millions of degrees hot! It is so huge and powerful that even across the vast distance of 93 million miles it only takes around 8 minutes for its immense heat to reach us..
How this gets explained is further confirmation that this is a deliberate scam, the temperature of the AGW GHE Sun is given as 6000°C, by a “planckian” curve calculated from the thin 300 mile wide atmosphere of visible light around the Sun. Look up the widths of the other layers of atmosphere around the Sun..
How can people in science not know that the Sun is really millions of degrees hot and this figure makes it a very cold star indeed? It could only have been put into place by brainwashing. The absurdity isn’t noticed because the meme “it is visible light from the Sun which heats the Earth’s surface” has been put into place through the general education system over a few decades, so people taught this through the now corrupted general education system and having no reason to understand this further in their lives, never question it. No matter how far they go in science fields where this information is not relevant to their practical, empirical, work.
Because this is a scam, it cannot be anything else when one appreciates the cleverness of the changes made from real world physics, the next obvious step is to look to see how this real physical knowledge is hidden – what sleights of hand exist to distract from reality to continue pushing the scam?
Well, one I found yesterday a good example of the conman’s art in this as I posted to Vaughan Pratt in the IPCC discussion 3. Skeptical Science has missed out Herschel on giving a history time line of heat from the Sun..: http://judithcurry.com/2013/07/05/ipcc-discussion-thread-3/#comment-342457
And as I have mentioned before this is a technique used in the AGW GHE scam, for example in taking out the whole of Water Cycle, and taking out rain in the Carbon Cycle – these are simply not mentioned in descriptions. So Herschel is not mentioned in the history time line so Skeptical Science can continue to con that visible light heats land and water of the Earth’s surface.
Just as Van der Waals is never mentioned in the history of gases, so AGWScienceFiction can continue to pretend that carbon dioxide and nitrogen and oxygen are “ideal gas”, so you don’t notice you don’t actually have an atmosphere at all around your Greenhouse Effect world, only empty space surrounded by an invisible unknown to science container keeping your ideal gas pretend molecules from flying off to the ends of the universe under their own molecular momentum..
Further to Vaughan Pratt’s More importantly, although near-infrared wavelengths constitute roughly half of the total energy of solar insolation, those relatively short wavelengths are not reflected back but are absorbed at the surface of the Earth”.
This is not the AGW claim, which says that is mostly visible and that near infrared makes only 1% of the total, the total being visible and the two shortwaves either side of uv and near infrared; uv a small percentage of that, 8 iirc. I have given some examples of the AGW meme of it being mostly or all visible which is claimed.
Your “roughly half” figure comes from real world physics which gives infrared at around 53%.
I am asking you all here to question these claims. But particularly I am asking you to prove, scientifically and empirically, that the energy budget of the models’ “shortwave in longwave out” is fact and not fiction.
Because:
– the reason it is in place is so that AGW/CAGW can pretend that all real world measurements of downwelling longwave infrared come not from the Sun direct, but “from the atmosphere backradiated by greenhouse gases”.
This is proof positive that the “Greenhouse Effect” is a scam to sell AGW and CAGW. That is the only reason you are now repeating the fake fisics meme that we get no direct longwave infrared heat from our millions of degrees hot blazing Star we call the Sun, and that you keep repeating that visible light from the Sun heats the land and water of Earth’s surface when this is physically impossible.
It is clear to anyone who has a basic knowledge of real physics on the properties and processes of energy and matter that the claims made in the AGW Greenhouse Effect as depicted in the cartoons of “shortwave in longwave out” are absurd nonsense.
So let us get back on track here – traditional physics still teaches that the great heat we actually physically feel from the Sun is the invisible infrared, aka thermal infrared. We have known this from Herschel’s first crude measurements.
We have improved our knowledge since then… We now know that the invisible infrared is divided into thermal and non-thermal, shortwave infrared is not classed as thermal. Because it is not hot. We cannot feel it as heat. Thermal means the electromagnetic wavelength of heat, which is longwave infrared. We feel this as heat. Visible light is not thermal. We cannot feel shortwaves as heat.
Please read the NASA’s old page from traditional science, which I posted here: http://judithcurry.com/2013/07/05/ipcc-discussion-thread-3/#comment-341398
Now, bearing in mind everything I have pointed out in this post, you have no excuse to continue claiming that the “Greenhouse Effect” meme of “shortwave in longwave out” is real world physics.
Real traditional physics already falsifies it.
None of these models has any credibility in real physics.
Because you are using the real direct heat from the Sun claiming it is from “backradiation by greenhouse gases” you are using a science fraud.
If you want to argue that the AGW Greenhouse Effect of “shortwave in longwave out” is real, then you must, YOU MUST, prove it.
Or you are not scientists.
Myrrh,
I can’t seem to nest this reply, but this should work.
Just to clarify a point, we seem to differ on the ability of visible light to produce heat when absorbed by matter. I am not sure what you would accept as authoritative in this regard, but the following might be of assistance to some (I lifted it from a secondary school site, I think. There are obviously much more detailed explanations involving quantum physics, but they be a bit arcane) : –
“Visible Light
Electromagnetic radiation in the visible range is not usually harmful in the intensities that we normally experience it. Visible light does have a heating effect, similar to infrared, but usually this will not cause any changes in our bodies.
When the intensity of light is increased, either with a magnifying glass or created with a laser, then the light can cause objects to burn. Lasers, if they are energetic enough, can burn through tissue. In fact lasers are sometimes used in surgery in the place of other medical instruments.
Laser light can also be particularly hazardous to eyes. The light beam is so narrow and intense that it can easily pass through the pupil of the eye and burn the retina. This causes permanent damage.”
I stress that I agree with you that old Sol floods the Earth with a vast amount of radiation which we perceive as “heat”. Hence, in the tropics, ” . . . Mad dogs and Englishmen go out in the midday sun . . . ”
Me, I seek shade – get away from the heat rays emitted by the Sun, in other words!
Like you, I cannot understand why Warmists continue to live in denial of reality.
I live in the fond hope that reality will triumph, and we all move on to a fresh absurdity seized on by the next crop of lunatics lusting for power, whether explicitly expressed or not.
Live well and prosper,
Mike Flynn.
Why do some of you come back with “magnifying glass” and “lasers”?
How are these any kind of explanation for the natural light from the Sun?
Is there a huge magnifying glass around the Earth?
Does this AGW unknown to traditional science “invisible barrier like the glass of a greenhouse preventing longwave infrared from the Sun entering” not only doing double duty as the unknown to traditional science “invisible container around the Earth” keeping in the unknown to traditional science “ideal gas not subject to gravity in empty space” from zooming off to the ends of the universe, but now is also a magnifying glass burning up everything in its path, or, now another AGW version of the Sun – it’s now “a laser” – we can tell that because it’s sliced right through the Earth in its path..
We cannot feel shortwaves, we cannot feel shortwaves as heat. We cannot feel visible light from the Sun as heat because it is not a thermal energy, it is not hot. The heat that you feel direct from the Sun is longwave infrared, that is why it is called thermal infrared, because this is the electromagnetic wavelength of HEAT.
What don’t you understand about the following?:
Visible light works on the electronic transition level of radiant energy from the Sun meeting matter, not on the bigger whole molecule vibrational level which is the level energy must impact to raise the temperature of matter. Radiant heat however, aka longwave infrared aka thermal infrared aka heat, does impact matter on the vibrational level, which means that it heats up matter, raises its temperature. Heat heats.
These are two completely different ways of energy from the Sun interacting with matter. The electronic transition level is tiny, on the electron level, this is the level on which visible light impacts matter – this is not big enough to move the whole molecule into vibration, which is what it takes to heat up matter.
Rub your hands together. That is mechanical energy moving the whole molecules of your skin into vibration, this is what the much bigger invisible thermal infrared aka longwave infrared direct heat from the Sun does, it moves your molecules into vibration heating them up.
Please read the NASA’s old page from traditional science, which I posted here: http://judithcurry.com/2013/07/05/ipcc-discussion-thread-3/#comment-341398
Which says:
This is still real world physics teaching on the subject, if you can find teachers who haven’t been brainwashed by the AGW fake fisics memes..
Please read more on http://judithcurry.com/2013/06/28/open-thread-weekend-23/#comment-341773 and my posts following.
So I repeat, with added emphasis:
Now, bearing in mind everything I have pointed out in this [these] post[s], you have no excuse to continue claiming that the “Greenhouse Effect” meme of “shortwave in longwave out” is real world physics.
Real traditional physics already falsifies it.
None of these models has any credibility in real physics.
Because you are using the real direct heat from the Sun claiming it is from “backradiation by greenhouse gases” you are using a science fraud.
It is a science fraud to claim that “visible light from the Sun heats the Earth’s surface of land and water and no longwave infrared direct heat from the Sun enters at TOA”.
If you want to argue that the AGW Greenhouse Effect of “shortwave in longwave out” is real, then you must, YOU MUST, prove it.
Or you are not scientists.
We have, with the Marcott infographic, the opportunity to see projects like BEST use a paleotuning approach to climate models, with some eleven millennia almost of data to use to tune, validate and verify output against.
And why do people insist on trying to achieve prediction from climate models? They’re useless for forecasting, and always will be, until we can predict with accuracy such things as volcanoes and earthquakes and coronal mass ejections.
Interesting note, btw, that there’s now an Earthquake Hockey Stick.
http://www.usgs.gov/blogs/features/usgs_top_story/is-the-recent-increase-in-felt-earthquakes-in-the-central-us-natural-or-manmade/
http://www.sciencemag.org/content/341/6142/164.abstract
http://www.usatoday.com/story/news/nation/2013/07/11/injection-induced-earthquakes/2508499/
For Myrrh
Learn something.
http://www.physicsclassroom.com/class/light/u12l2c.cfm
Atoms and molecules contain electrons. It is often useful to think of these electrons as being attached to the atoms by springs. The electrons and their attached springs have a tendency to vibrate at specific frequencies. Similar to a tuning fork or even a musical instrument, the electrons of atoms have a natural frequency at which they tend to vibrate. When a light wave with that same natural frequency impinges upon an atom, then the electrons of that atom will be set into vibrational motion. (This is merely another example of the resonance principle introduced in Unit 11 of The Physics Classroom Tutorial.) If a light wave of a given frequency strikes a material with electrons having the same vibrational frequencies, then those electrons will absorb the energy of the light wave and transform it into vibrational motion. During its vibration, the electrons interact with neighboring atoms in such a manner as to convert its vibrational energy into thermal energy. Subsequently, the light wave with that given frequency is absorbed by the object, never again to be released in the form of light. So the selective absorption of light by a particular material occurs because the selected frequency of the light wave matches the frequency at which electrons in the atoms of that material vibrate. Since different atoms and molecules have different natural frequencies of vibration, they will selectively absorb different frequencies of visible light.
With apologies for the caps, I’m not shouting.., but there are only so many ways of presenting stress here.. And, I already know you know some of this, but I’m putting it in for narrative.
That page has jumbled up electronic transition and molecular vibrational – visible light from the Sun cannot, cannot, cannot, move the whole molecule into vibration which is what it takes to heat up matter. It is not big enough to have any such impact on the whole molecule. The whole molecule has to be vibrated to heat it up.
Rub your hands together, that is mechanical energy moving the whole molecules of your skin into vibration, it takes the bigger heat energy from the Sun not the tiny light energy from the Sun to get such an effect.
Heat and Light from the Sun are the two basic categories from traditional physics, they are not the same thing.
Visible light from the Sun is not a thermal energy, it is not hot, we cannot feel it as heat, we cannot feel it physically heating us up, which we would feel if it was heating us up.
You have to get some sense of perspective here, some rational sense of scale back, because AGWScienceFiction does everything it can to confuse this by various sleight of hand tricks of the magician/con man’s trade. It takes a huge amount of direct heat energy to raise the temperature of water, put a pan of water onto a stove to get some idea of what a powerful energy heat is and how long it takes water to keep absorbing it before it boils.. We got the Industrial Revolution because real scientists first began to understand the actual power of heat to do work.
Radiant heat from the millions of degrees hot STAR we call the Sun is thermal infrared – that is why it is called thermal.
NEAR INFRARED is NOT CALLED THERMAL.
Thermal means “of heat” – longwave infrared is called thermal because it is the electromagnetic wavelength of HEAT. From the Greek thermos, hot.
ALL THE HEAT YOU FEEL FROM THE SUN IS THERMAL INFRARED, LONGWAVE INFRARED, YOU CANNOT FEEL NEAR INFRARED AS HEAT BECAUSE IT IS NOT HOT.
What AGWScienceFiction has done here is claim that “thermal means the heat source, the Sun”, so they say “all electromagnetic energy from the Sun is thermal” – but it is not that meaning in classic real world traditional physics – thermal refers to the actual electromagnetic wave, which is longwave infrared and not shortwave.
We can feel radiated heat because of the effect it has on us, of moving our molecules into vibration. If it is not doing this it is not heat.
You may not like what the NASA page I quoted from tells you here.., but you’re too late in getting it removed… Ric Werme boasts he had some part in getting it taken off the internally linked NASA pages on thermal infrared – I tried to save it on webcite and that worked until it didn’t. It was taken down on the NASA site and disappeared for around a week and couldn’t be found as active anywhere, then it reappeared as it does now. Someone at NASA was determined not to lose the traditional teaching on this..
Heat is matter in vibration, internal kinetic energy, thermal energy – that is what is radiating out from our millions of degrees hot Sun and that is what you feel as Heat. This heat is particles of the Sun in vibration flowing to us. This is the same as the invisible heat flowing to us from a blazing campfire as its particles of matter in great energetic vibration physically travel in straight lines to you. Why you can’t feel it on your back if you are facing the fire and which is more powerful than the dissipated ‘waste’ heat.
This real directional heat from the Sun which is particles in vibration impacts on the molecules of your skin and sets the whole molecule into vibration, which is internal kinetic energy which is heat.
It really is important to grasp first how powerful heat is, and what it is, because the AGW Greenhouse Effect cartoon of KT97 and ilk is ubiqitous in promoting the science fraud that light and not heat from the Sun heats the Earth.
They have a reason for doing this.., to pretend that all real world measurements of heat from the Sun are attributed to their claim that this heat comes not from the Sun but from the atmosphere under TOA backradiated by their version of greenhouse gases.
That is the SCAM. To this end they have to pretend that visible light from the Sun is doing the heating. The real solar constant is a measurement of how much the Sun’s heat energy raises the temperature of surface matter, AGWSF has attributed all of this to their “shortwave in” of their comic cartoon.
Which is why the KT97 and ilk has this strange accounting of getting more heat out from the surface than it gets in – because they subtract visible light en route to the surface, reflection/albedo or whatever they call it, from the misattributed figure of heat energy coming in direct from the Sun which they’ve put at TOA, the solar constant is a measurement of heat energy at the surface. As real heating applied scientists, heating engineers, would use in calculations for buildings and so on.
Remember, since this is climate science, it takes an immense amount of heating of land and water at the equator to get us our huge equator to poles wind system by convection of real gases of air, of nitrogen and oxygen with individual volumes which expand when heated and condense when cooled.
Hot air rises because of this, cold air sinks because of this. Hot air in expanding volumes become lighter than air and rising at the equator convects heat to the cold poles where it gets the heat sucked out of it by the cold and so because they the individual volumes of real gas condense when cold they become heavier under gravity and so sink, flowing back to the equator’s hot expanded lighter low pressure area.
These convection currents are what we call winds, when they are cold and heavy and condensed meaning their individual volumes have shrunk from the cold and are closer together so their weights are in a smaller area, they form areas of high pressure, high because heavier.
Winds flow from high to low. High pressure areas are volumes of real gas colder and more squashed together, heavier, so weighing down more heavily on us, low pressure areas of expanded gases are lighter, taking up more room their weight is spread further. The same volume of liquid water for example takes up 1000 times more room as it does as the real gas water vapour. The real gases oxygen and nitrogen also condense and expand like this.
It takes a lot of heat energy to get our equator to poles winds, visible light from the Sun cannot heat the land and water to give us this effect from real gas molecules. It is essential to get some grasp first on what Heat is to see it isn’t Light. Cook yourself some dinner in a hot dark oven.
Electronic transition is not applicable to radiant heat energy, it is only applicable to the much tinier nervy shortwaves which work on the tiny electron level.
Which is how we get our blue sky – visible light from the Sun is absorbed by the electrons of the molecules of nitrogen and oxygen and this energises the electron briefly, moves it in its orbit but still within the volume of the molecule; visible light is too weak to move that electron out of its orbit entirely, it is not an ionising energy, some uv is.
The electron of the molecule of nitrogen or oxygen in the atmosphere which has absorbed visible light energy always wants to come back to ground state which it does, as it does it emits the same energy it absorbed – this is what happens in reflection/scattering.
Blue visible light being more energetic, moving more quickly in that it is smaller in wavelength with lower peak than the longer visible wavelengths, has more such encounters, so we get our blue sky. The electrons of the whole molecules of nitrogen and oxygen bounce out the nervy blue light and scatter it all around the sky. Think pin ball machine..
More energetic does not mean more powerful, it just means that it is smaller than the longer visible so it is moving more rapidly in the same space of linear direction. Compare with radio waves which are as big as houses and can be several football fields long, and compare with xray or gamma which are even tinier.. Sense of scale helps here.
Visible light is not absorbed by the whole molecules of water, it cannot move the whole molecule into vibration and it does not even get in to play with the electrons of water, but it is transmitted through unchanged.
Water is a transparent medium for visible light so does not absorb it at all but transmits it unchanged, unlike the atmosphere of the heavy volume of real gas air which is opaque to visible…
Heat heats. Heat impacts on the whole molecule of matter.
Neither of these interactions on the electron level, reflection/scattering and transmitting, are heating the whole molecules, neither of these interactions are capable of raising the temperature of the molecules of matter because they do not move the whole molecule into vibration. It takes powerful vibration of molecules to heat them up, this is the internal kinetic energy of vibration which is called heat.
The same heat which is the internal kinetic energy of the Sun’s matter is the same radiated heat energy we feel as heat, transferred by radiation, flowing from the Sun to us and which heats us up by moving our molecules into vibration which is internal kinetic energy which is heat..
AGWScienceFiction has so thoroughly confused LIGHT and HEAT from the Sun that it becoming practically impossible to find clear descriptions of the differences. It has done this first by calling both light and saying that “all electromagnetic energy is the same and all create heat on being absorbed”. If you really think an xray is the same as a radio wave and you don’t know that visible light converts to chemical energy in photosynthesis which is not heat but sugars and into electrical impulses in sight which is not heat but nerve impulses, for example, you’re not going to see through their sleights of hand here..
That page is an example of the science fraud prevalent in this. It has completely jumbled up descriptions by not differentiating heat from light – you’ll have to go further down the page to see what it really happening on the visible light electronic transition scale which interacts with matter only on the electron level and which does not interact with matter on the whole molecule vibrational level ..
My bold and in square brackets. http://www.physicsclassroom.com/class/light/u12l2c.cfm
“Reflection and transmission of light waves occur because the frequencies of the light waves do not match the natural frequencies of vibration of the objects. When light waves of these frequencies strike an object, the electrons in the atoms of the object begin vibrating. But instead of vibrating in resonance at a large amplitude, the electrons vibrate for brief periods of time with small amplitudes of vibration; then the energy is reemitted as a light wave. [As I’ve described above, in scattering]. If the object is transparent, then the vibrations of the electrons are passed on to neighboring atoms through the bulk of the material and reemitted on the opposite side of the object. Such frequencies of light waves are said to be transmitted. If the object is opaque, then the vibrations of the electrons are not passed from atom to atom through the bulk of the material. Rather the electrons of atoms on the material’s surface vibrate for short periods of time and then reemit the energy as a reflected light wave. Such frequencies of light are said to be reflected.”
Note, these do not create heat, the energy itself isn’t thermal, it is light not heat, and so it is non-thermal light being reflected/scattered on being absorbed briefly by the tiny electrons or transmitted when not absorbed by them. Visible light is tiny it does not have the oomph to move the whole molecule into vibrational mode.
You will need to bludgeon your way through the memes to find accurate descriptions because this corruption of physics has been in the education system for some decades now – it is now “official” that “visible light from the Sun heats the Earth’s surface of land and water” – in the encyclopedias and taught at university levels. That is why the leading science bodies are corrupted to promote the AGW fakery, because most of those regurgitating this do not realise they are regurgitating rubbish, some do..
The fundamental problem is that they regard the exact mean surface temp given by the area averaged statistical models as an observation. It is not. The least they could do is tune to the satellite readings after 1978. I suspect their results would be quite different since the sats do not show the 1978-1997 steady warming that the surface statistical models show. In short they are tuning to an artifact not an observation.
Pingback: Spinning the climate model – observation comparison: Part II | Climate Etc.
Pingback: Selection bias in climate model simulations | Climate Etc.