Radiative transfer discussion thread

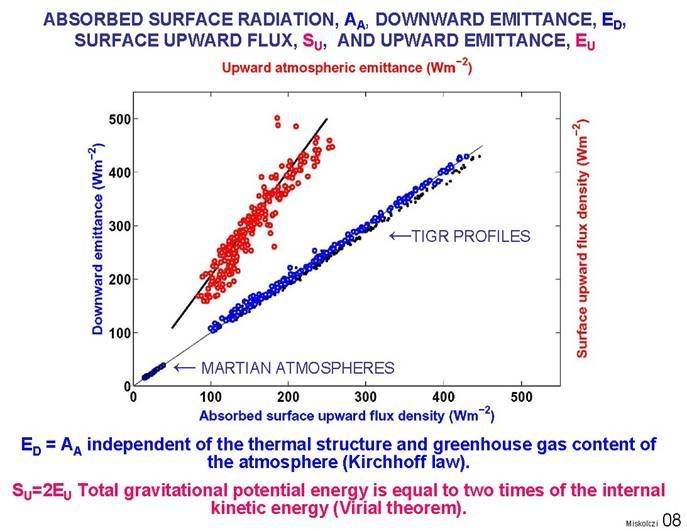
The continuing large traffic on previous threads on the topic of radiative transfer (and increasingly on threads with unrelated topics) has demonstrated the need for a new thread.  Here are some posts to start the new discussion over here:

From Arfur Bryant:

In answer to your question; yes, I suppose I do have a problem believing the radiative transfer models as it appears to me that they are based on an assumption. Even the uchicago site states it assumes a deltaT figure in order to run the program. I have gone back over more threads here, and found some excellent information on the ‘best of greenhouse’ thread, although nothing which answers my question in a quantitative sense. maxwell makes a lot of sense but there are some other inputs – mostly regarding adiabatic lapse rates where I think people are confusing the adiabatic lapse rate with the environmental lapse rate. Either way, I can find no real-world measurement of the contribution of CO2 to the GE. This, to me is absolutely crucial to the debate. If one doesn’t know how much effect CO2 has initially (I take ‘initially’ to be circa 1850), how can one know how much effect an increase is likely to have?

Also, there is a very interesting discussion at the end of the thread Confidence in Radiative Transfer Models,  between Vaughan Pratt, Fred Moolten, Pekka Perilla, Jan Pompe, Jeff Glassman, and others.  Not sure where to pick up this conversation, but here are a few excerpts:

Jeff GlassmanDecember 21, 2010 at 9:11 amReplyEdit


DeWitt Payne 12/21/10 3:51 am,

Where exactly in the HITRAN model or in HAWKS, or elsewhere, are the features you discuss, i.e., line saturation, square root dependence, the Lorentz shape, the CO2 band wings, altitude dependence, linear behavior below 10 ppmv, and logarithmic behavior to at least 1000 ppmv. How is “at least” mechanized or determined?

Previously you were careful to say this information was all in the line-by-line data base, and not in the summing. Now your results depend on the total bandwidth of the application and in the homogeneity of the medium. How is your information stored in the line-by-line data base?

You say the logarithmic function is good “to at least 1000 ppmv and possibly much higher”. That number of 1000 is certainly important because it accounts for IPCC’s essential conjecture about CO2. We need to see the data to be sure your talking about total intensity, I, and not ΔI/ΔC, and that the break doesn’t occur in a lower region, e.g., between about 400 and 600 ppm. What is the standard deviation of the logarithmic fit at 1000 ppmv? Would it be correct to assume you talking about a fit of the logarithmic function to the output of HAWKS or some such calculator? If so, what is the standard deviation of the error between your calculator and the real world, measured absorption? Why do you say, “at least and possibly much higher”? Hasn’t the test been conducted yet?

Where can your data be examined? Or is it to remain secret like the raw data at MLO? Or the temperature data at CRU?


The logarithmic dependence has nothing to do with Beer Lambert. For weakly absorbing lines B-L applies, as the lines become more strongly absorbing (and lines broaden) then the logarithmic regime is entered, even more strongly absorbing and the square root dependence applies. This has been known and used for many years (e.g. by astronomers ) and isn’t peculiar to CO2.

    For a weak isolated line with a broad band source, the response is linear with concentration or mass path. That isn’t B-L either. As the center of the line becomes saturated, the response becomes square root as long as the bandwidth of the radiation is much wider than the line wings. But that’s an isolated line with a Lorentz line shape in a homogeneous medium with constant temperature and pressure. The behavior in the wings of the CO2 band in the atmosphere is complex with contribution from different altitudes with different temperature and pressure resulting in different line widths. Below 10 ppmv, the response becomes linear. Above 10 ppmv, the emission is a logarithmic function of partial pressure up to at least 1000 ppmv and possibly much higher.

    VP: You do realize you’re picking the frequency peak here and not the more usual wavelength peak, right?

    JP: What difference is that supposed to make?

    VP: I don’t understand the question. Are you asking whether the frequency and wavelength peaks are different, or whether the color temperature depends on which one you use?

    JP: I’m not surprised [that you didn’t understand the question]since you obviously didn’t notice the wavelength scale at the top of the plot.

    What I noticed was that the wavenumber scale at the bottom is linear, the wavelength scale at the top is not. Linearizing the latter changes the location of the peak at 270 K from 18.886801383026… microns to 10.73247513517118543… microns, which you may or may not recognize as the more usually given peak for 270 K. (Planck’s law is a mathematical idealization of black body radiation which explains why the frequency and wavelength peaks can be given exactly, taking 270 K to mean 270.000000000… K. Paradoxically this precision is valid even though the universal constants appearing in Planck’s law are only known to a handful of decimal places. In its usual application to stochastic phenomena only the first few digits of these two peak wavelengths are physically significant.)

    Thank you, you’ve answered my original question.

    JP: I’m wondering if you have worked out yet that it’s the brightness temperature rather than colour temperature that gives us the heating potential.

    VP: You may be confusing brightness with heat, they are very different things in general.

    JP: What? Like you confuse energy and heat? Not bloody likely.

    Ah, then you do agree that brightness is not the same as heat. Good, I was worried for a minute you were going to stick to your guns. Though I see you’re still sticking to your guns for energy and heat. Heat is a form of energy. Heat is not a form of brightness, nor is brightness a form of heat, they’re very different things. Heat is much closer to energy than it is to brightness.

    Why don’t you try again when you work out that vectors in general do not have an orthogonal component.

    I knew your physics was above my pay grade (I’d have to be paid a lot more before I could understand it), but I see this is also the case for your mathematics. You’ll have to forgive me but I’m unfamiliar with that branch of linear algebra in which a component of a vector can be orthogonal. Please school me.

    • What I noticed was that the wavenumber scale at the bottom is linear, the wavelength scale at the top is not.

      Hardly surprising given that the one is the reciprocal of the other. So let’s see if we can get on the same page here.

      Linearizing the latter changes the location of the peak at 270 K from 18.886801383026… microns to 10.73247513517118543… microns, which you may or may not recognize as the more usually given peak for 270 K

      I don’t think so. If you linearise one in a chart the other will be nonlinear but the the relationship remains the same. For instance
      1cm-1/530 = .0018.8 = 18.8 micron. This is a measured peak using a Michelson interferometer. You will find that is the ball park for every spectrum obtained that way. The number that you quote is the Wien’s law result 2.9/270 = 10.74 micron. So what is it to be the measured or the computed?

      I think you’ll find if you look into it that Wien’s law only holds for short wavelengths like Raleigh-Jeans for LW.

      Ah, then you do agree that brightness is not the same as heat.

      Brightness like luminance, intensity and are indicators of heatingpotential obviously if put into a EMR field of higher brightness or intensity it will be considered cold and the field hot and heat will flow from the field source to the object.

      You’ll have to forgive me but I’m unfamiliar with that branch of linear algebra in which a component of a vector can be orthogonal.

      Angular momentum and rotational motion has rules where the momentum does not just have orthogonal component but actually is orthogonal to the plane of rotation.

    473 responses to “Radiative transfer discussion thread

    1. Let me make a point I have made over and over again. Radiative forcing can NEVER be measured, so, to me, arguing in this sort of way is rather like discussing how many angels can dance on the head of a pin.

      • Jim Cripwell 12/21/10 10:16 am

        You say, >>Radiative forcing can NEVER be measured, so” etc.

        Why limit your thought to radiative forcing? Most of the climate parameters can never be measured. That includes especially the major parameters of global average surface temperature, and global average Bond albedo or its components. We can measure TSI accurately, but have to estimate a secular global average. This is one of the reasons proxies and estimation techniques find use. These are macroparameters, putting them in the field of thermodynamics. They are convenient fictions. IPCC’s radiative forcing paradigm was and is an attempt to get around the problem of building a thermodynamic model of Earth’s climate, especially one that employs greenhouse gases to show how man is responsible. Scientists invented the greenhouse gas model, and the problem is working it into a model.

        We can model these things, and we can create intermediate, dummy parameters. No rule in science prohibits dummy variables, or requires that any real parameters be included. The acid test as always is whether the models have predictive power for novel things that are measurable, and whether we observe results that fit within the modeled tolerance to validate the models.

        We needn’t quit trying to model climate just because RF can’t be measured, or even because the RF paradigm is a failure. We build thermodynamic models all the time, and with measurable success.

        I am proud to have created a thermodynamic model for airborne electronics that showed that convection was better modeled as dependent on vibration forces than as a constant. That was later confirmed by research, and the effort expanded the usefulness of a whole class of electronics. That was never published, but kept instead as a trade secret for decades.

      • Jim Cripwell said: “Radiative forcing can NEVER be measured”

        This is not true. Technically the “forcing” should be measurable if it exists as defined per AGW/IPCC recipe. The AGW theory asserts that addition of CO2 provides TOA “forcing” that should “lasts for decades”. Therefore, if their construction of adjustments in global atmospheric profiles is correct, the globe should emit about 1.5W/m2 less than it receives (minus reflects). If it lasts for decades and CO2 is still on the rise, this difference should be measurable, it is about 0.5% of in-out fluxes.

        With modern electronic technology the 0.5% does not sound horribly difficult, unless the measuring instrument has difficulties in acquiring the necessary global averages. As you might know, NOAA used to have a satellite program called ERBE:
        http://asd-www.larc.nasa.gov/erbe/ASDerbe.html
        This is exactly the experiment that was supposed to give a definite answer whether our globe is warming or not. The instrument was defined, data storage and processing was defined, etc. There are a bunch of data available online, e.g.:
        http://iridl.ldeo.columbia.edu/SOURCES/.NASA/.ERBE/
        However, I could not find an answer to yours/mine question: does the global imbalance exist, or not? I suspect that the answer was lost in wild variability of TOA fields, and much more focused effort would be required.
        [ as I see from some publications, “uncertainties” are up to +-5% in LW and +-15% in SW, where “nonscanner averages may be somewhat more uncertain because of sampling and the diurnal averaging process”:

        https://ftp.ifm-geomar.de/users/amacke/Vorlesungen/Remote%20Sensing/Chapter%2010%20-%20Radiation-Budget/ERBE-Lit/Barkstrom-BAMS89-ERBE.pdf ]

        It means the technique sucks for it intended purpose. Please somebody (from AGW folks) correct me if I am wrong.

        X-Mas cheers,
        – Al Tekhasski

        • Al Tekasski. I will change my claim to “radiative forcing HAS never been measured”.

        • The two most accurate and useful measures are the ARGO OHC and the CERES FLASHFlux data. With these we can deduce that the OHC splice between XBT and ARGO is in need of attention, and that this has probably been influenced by a similarly bad sea level altimetry splice between JASON/TOPEX/POSEIDON.

          I have a new post up on the issue here:
          http://tallbloke.wordpress.com/2010/12/20/working-out-where-the-energy-goes-part-2-peter-berenyi/

          The conclusion is that Trenberth’s missing heat isnt hiding in the system, and that there has been a drop in the radiative imbalance such that it has gone negative. This leads to another inescapable conclusion, given the decades long co2 residence time (hah!) is that the sun is responsible for more climate change than previously thought and co2 less. Much less. Trenberth’s missing heat is the figment of a failed hypothesis.

          No doubt we will be told 7 years of data is too little. At least it’s data sufficiently accurate to get some worthwhile results with.

        • And how do the data fit with negative forcing and 5 yr. residence time? Inconveniently well?

          ;)

    2. If you are going to get into different radiative forcings, how about including random variation as well. “Noise” can be part of temperature changes if there are random cycles within cycles interacting with each other to produce not only swings in the temps from year to year, but also they could be decade oscillation cycles. Think of the climate system as a ball of Jell-O, that regardless of forcings, if non existed, would sit there vibrating and oscillating. Forcings would then just alter the mean path of that natural random vibration.

      I don’t see any studies on that aspect of the climate. Are there any?

      I’m writing a simple program to demonstrate what I mean, and so far I have been able to replicate the year to year changes in TMax.

    3. I believe it would be helpful, Judy, for you to specify which particular questions remain unanswered. Having gone through the two Greenhouse Effect threads, the one on radiative transfer, as well as many of the others, I believe that the fundamental principles have been well explained and their grounding in basic physics as well as observational data has been documented. Regarding CO2 contributions and the logarithmic relationship, the GRL paper by Myhre et al, the recent JGR paper by Lacis et al, and the theoretical analysis in Pierrehumbert’s “Principles of Planetary Climate” have all been referenced, including the relevance of the CO2 band wings to the logarithmic relationship; that book also addressses some of the discussion in the exchanges cited above, such as strong line and weak line differences and other variables affecting how the radiative transfer codes are developed. I haven’t seen any notable omissions.

      Perhaps most importantly, I think you have anchored the subject well in your Radiative Transfer posting, with its own numerous references –
      Radiative Transfer

      I would commend the several links you provided to observational data confirming predicted radiative fluxes both at the ground level and the TOA. These appear to be the basis for your statement, “Atmospheric radiative transfer models rank among the most robust components of climate model, in terms of having a rigorous theoretical foundation and extensive experimental validation both in the laboratory and from field measurements.”

      I believe that if we start with what is already established, without repeating it, we can then proceed to a useful discussion of what remains unclear or unknown.

      • Fred, you make an excellent suggestion, but I am traveling today and don’t have time to dig into the nearly one thousand comments on the previous thread. I would appreciate if someone can clarify what is remaining to discuss and I will elevate this to the main thread.

      • Fred, I agree that we should soon move onto new areas of discussion. However, by summing up in this way it appears to my casual observer’s eyes that you are attempting to sweep under the carpet the significant areas of disagreement that lie behind those 1000+ comments in the radiative transfer and greenhouse threads. I am no scientist, but there seemed to be some fairly reasoned arguments about the basic science even if the various papers quoted were hotly disputed by both sides. Contrary to the subliminal content of your remarks, I don’t think those areas of disagreement were ever resolved. Your post was a very good try though! :)

        • Rob – I was not suggesting the absence of disagreements in this blog, but rather that there are ample data quoted or linked to in the threads to demonstrate the soundness of the basic principles and quantitative values associated with radiative transfer, as derived from basic physics principles, spectroscopic data and their incorporation into radiative transfer codes, and radiative flux measurements in the field, as Dr. Curry mentioned. For all these reasons, I saw a reiteration of this evidence as unnecessarily repetitive. To expect to settle disagreements in climate science blogs is I believe an unrealistic goal, which is why I referred readers to the original sources. Readers can then make their own independent judgments, and in my view, that would allow us to proceed to areas where the science is less adequately documented.

        • As a defensive gesture for science, as opposed to taking any position even on engineering solutions for mitigation let alone policy decisions, let me take a harder line on RobB’s comment than Fred just has. I’m not a climate scientist myself and this is in no way intended to be taken as a remark by a scientist. Rather it’s merely input to this blog from a reasonably well-informed citizen of this planet extremely concerned about what strikes me on the basis of nothing other than HADCRUT3 record as a serious problem. (I’ll return to that URL below.)

          I will happily field all serious critiques made in good faith. While I regret I won’t be able to field other critiques I may in the less obvious cases be able to say why they didn’t qualify as such.

          The science has been attacked by what I characterized as Orcas in a recent post. Just as ocean Orcas single out a much larger whale and cut it off from its mates, so do these Orcas single out one scientist such as Ben Santer or Michael Mann standing tall above them. Even after Congress has declared the attacked scientist innocent the Orcas continue to maintain that they succeeded in their attack.

          This is a truly vicious fight. The facade of dignity that those like David Hagen pretend to maintain is nothing but that: a facade.

          The insurance companies have made it clear that these Orcas are responsible for the mounting damages they are obliged to pay out out on. This puts the Orcas’ very survival at risk. Is it no wonder then that the Orcas are fighting back on every front to mitigate that risk, even more energetically than the policy makers are working on mitigating the risk from global warming? Is it no wonder that Pat Michaels simply dismisses the insurance companies as immaterial to the science?

          Global warming puts the health of two communities at risk: those responsible for global warming, as their investors sell them short, and those who will increasingly suffer from it as storm damage and ocean acidification increases.

          For the latter to pay attention to the former is like the inhabitants of an occupied country paying attention to the all too predictable propaganda of the occupiers. You must strap yourself to the mast and ignore the reassuring siren calls that everything is safe.

          To paraphrase Stephen Wolfram’s ANKS, this is A New Kind of War, ANKW, science against the vested interests. The tobacco war is to ANKW as World War I was to World War II. The technology of the former was that of the stone age compared to that of the latter. World War II was started on the premise of being World War I done right. Similarly the tobacco war was little more than a practice run for ANKW, whose market cap is orders of magnitude more.

          Those on one side claiming to be on the other would in an ordinary war be counted as spies and shot. Obviously ANKW cannot work that way. Instead I encourage those wishing to shoot spies to do so by simply ignoring them. As with a real gun this is a trigger you will find hard to pull, but you can at least try.

          Identifying the spies is a lot of work, but it is a finite amount when done right. A list of them would save others a lot of work.

          Disclaimer: I am not a climate scientist and I don’t get a penny from anything related to the climate either way. I’m just an amateur interested in the climate and the impact of climate change not just on my descendants but on the whole planet during the coming century. I don’t pay attention to anything in the IPCC reports or the press, I just look at the HADCRUT3 record and see the future spelled out as plain as day.

          The red curve is with 5-year smoothing, which smooths out enough of the very fast swings to make the general longer-term trend visible.

          The green curve is with 20-year smoothing, which removes everything except the two long-term contributors to global temperature, the Atlantic Multidecadal Oscillation or AMO and the global warming signal.

          The blue curve is with 65.5 year smoothing, a figure carefully chosen to surgically remove the 65.5-year AMO cycle leaving just global warming.

          If you further increase the exactly chosen 786-month number in Series 3 to 960, which you can do by entering 960 in the menu for the third series on the right and clicking on Plot Graph, you will notice that part of the AMO is put back in by distorting the global warming signal. This shows that 786 months is not simply aggressive smoothing but is actually surgically removing the 65.5 year AMO signal. More aggressive smoothing does not yield a smoother curve because unlike 65.5 year smoothing it fails to remove the AMO signal.

          In these simple graphs you can see the future of your planet. While it is not obvious how the blue curve extrapolates from this graph, with better software than offered by WoodForTrees it can be seen to land in the year 2100 at 2 °C above today’s temperatures.

          This your future, for those who have some reason to care about it as I do.

        • Quinn the Eskimo

          Most of what you have just said has nothing to do with the topic at hand. It is instead a narrative in which you are cast as the brother in arms of the virtuous heroes of science who are saving the planet and protecting the truth against the gathering forces of darkness. Certainly your intentions are good.

          The bit about the insurance companies is risible. They have funded and promoted bogus claims of extreme events and disasters in order to jack up their premiums, which is not so complicated to understand. Roger Pielke, Jr. has discussed this in detail on his blog. It has been repeatedly demonstrated in multiple peer reviewed articles that there is simply no trend in weather disasters. But this is a cornerstone of the apocalyptic visions on which IPCC, EPA and you rely.

          If we go into the political motivations of those who founded the IPCC and promote hobbling industrial civilization and making gigantic transfer payments to third world kleptocrats, all in order to fix the weather, we will will be way off topic. I will note only in passing that among the ardent proponents of fixing the weather are Hugo Chavez – explicitly to destroy capitalism, Evo Morales – the same, the Unabomber – the same, and those witty folks who made the comedy bit about blowing up children who weren’t on board. These whack jobs and their friends are a bigger threat to human welfare than .7C in 100 years. There is no trend in weather disasters, but your handy Guinness Book gives the numbers killed by the governments of the USSR, PRC and Cambodia. This which helps determine the relative risk of a slightly warmer planet vs. giving unhinged fanatics power to remake the world.

          So yes, people are resisting, and requiring extraordinary proof, but not for the reasons depicted in your narrative.

          Best regards,

        • “In these simple graphs you can see the future of your planet. ”

          Past trends are no guarantee of future performance. Or so my investment manager tells me.

          According to my solar model, we just went over the top of the 300 year curve from the depths of the little ice age.

          Interesting times ahead. Are you a gambling man? Fancy a wager?
          I already have $1000 dollars on the table with another person who thinks temperature will continue to rise.

          Willing to put your money where your mouth is?

        • Although the Wall Street Journal remains steadfastly on the denial side of this campaign, the Economist recently defected to the science side. If the New York Times had ever been on the other side I’m not aware of it. You can read the article TEMPERATURE RISING: A Scientist, His Work and a Climate Reckoning in today’s Times about Charles Keeling and the CO2 laboratory he built on Mauna Loa fresh out of graduate school in the 1950s. This is a long and informative article. Those who, after reading this article, continue to believe the deniers’ siren calls reassuring everyone foolish enough to listen to them are firmly wedded to their cause.

          Those on the denial side insist that the Mauna Loa laboratory was one of the steps in a long-running and massive global conspiracy whose aim is to fleece an unsuspecting public by extracting $47 trillion from their pockets. As conspiracy theories go this one is unprecedented.

          But anything less than a theory on that scale leaves too many questions unanswered. How else can you explain the many scientists, insurance companies, world governments, and reputable media like the Economist and the New York Times who insist that global warming is happening? How could they not all be in cahoots with each other?

          Well, if it’s a conspiracy, it’s unprecedented not only in scale but in how seamlessly the stories told by its participants mesh. One might point to discrepancies, but they are nothing compared to those of the deniers’ stories. The deniers can’t coordinate their stories because they can’t agree on which parts of the science to deny.

          They compensate for their lack of coordination on the science side by putting on a bold front on the denial side. Peter Laux, a locomotive engineman from Australia, has offered “$10,000 (AUS) for a conclusive argument based on empirical facts that increasing atmospheric CO2 from fossil fuel burning drives global climate warming.” While that’s not quite US$10k, it’s still a lot more than the trifling $1K being offered by tallbloke immediately above. Moreover you don’t owe Mr. Laux a penny if your proof is rejected, whereas you owe tallbloke $1000 if you lose your bet on the weather. Betting on the weather is a mug’s game unless you’re betting that January will be colder than July in the Northern Hemisphere. I wouldn’t place a climate bet on anything less than a ten year time frame.

          Even though the AMO will be trending strongly downwards for the next three decades the CO2 is now climbing at 2.1 ppmv per year, as compared to 0.94 ppmv per year in 1960, and in ten years will be rising at over 2.5% per year. The AMO was able to hold down the CO2 warming during the former’s strong downswing during 1940-1970, but it won’t be able to repeat that trick during 2005-2037 as the CO2 now has the AMO’s contribution pinned to its now-unbeatable slope.

          It would be interesting to take a position on Intrade that the average HADCRUT3 temperature for 2015-2020 will be less than that for 2010-2015, payable in 2020, and see what odds it turns up. If Intrade had to charge its standard price of $0.05 instead of the $0.03 it charges for “extreme” positions, namely those under 5 or over 95, I would interpret this as saying something about human gullibility.

        • Dr. Pratt – what will be the contribution to or modification of your proposed warming due to clouds?

        • Jim, the cloud question is a good one, and above my pay grade in the more usual sense (that if I knew for sure how to answer it I ought to be able to get a job in the climate business, as opposed to the last paragraph here). All I can tell you is the little I know from what I can easily read about it and learn by talking with friends in Stanford’s School of Earth Sciences, Department of Civil and Environmental Engineering, and Hopkins Marine Station. (I’m affiliated with the third by virtue of being one of the faculty on a grant to correlate fish populations with velocity and direction of water flow at four sites in Southern Monterey Bay. Stanford has no problem with its retired faculty continuing to do research, in fact they appreciate the free labor!)

          More warming means more water vapor, by a scaled down version of the same mechanism as when you create steam by boiling a saucepan of water. Water vapor is a greenhouse gas and hence raises the temperature. The raised temperature then further increases the rate of evaporation, and so on, one of the positive feedbacks in global warming.

          Before anthropogenic CO2 became significant, that feedback had saturated and the system was more or less in equilibrium, to the extent that nature can ever be said to be in equilibrium. The increasing CO2 knocked this feedback out of equilibrium and the water or hydrological cycle is now rising while it tries to figure out where its new equilibrium point should be.

          But it can’t because we keep increasing the CO2. And because we breed like undersexed guinea pigs, doubling the population in less than a century, we are also increasing the rate at which we increase CO2. The upshot is that for at least a century nature has been playing catch-up with us, with a gap that looks to me like around three decades, essentially constant throughout the whole century.

          But even though it’s always behind, the steadily increasing water vapor means that whatever the no-feedback heating impact of CO2 might be, the water vapor tagging along behind it amplifies the greenhouse effect of CO2. In Estimates of the Global Water Budget and Its Annual Cycle Using Observational and Model Data, Journal of Hydrometeorology, 2007, Trenberth et al write on p. 760, “The strong relationships with sea surface temperatures (SSTs) allow estimates of column water vapor amounts since 1970 to be made and results indicate increases of about 4% over the global oceans, suggesting that water vapor feedback has led to a radiative effect of about 1.5 W m 2 (Fasullo and Sun 2001), comparable to the radiative forcing of carbon dioxide increases (Houghton et al. 2001). This provides direct evidence for strong water vapor feedback in climate change.”

          On to clouds, your question. Among the significant greenhouse gases, water vapor is unique in having a dew point (the temperature-pressure-humidity combination at which it condenses) in the vicinity of prevailing atmospheric conditions. Unlike CO2 it condenses readily at the altitude of clouds, which is where clouds come from. Clouds start out as very tiny water droplets that reflect via Mie scattering, making them very white. Gradually the water droplets collide to form larger droplets. When they reach a certain size absorption dominates over Mie scattering and the clouds change color from white to grey. When the droplets get large enough gravity overcomes the viscosity of air and pulls the droplets down to the ground as precipitation.

          The reflective Mie scattering acts to increase Earth’s albedo, cooling the planet. The absorbing action of the larger droplets acts to heat the clouds, an effect that is stronger on top from the incoming sunlight than below from the earth’s outgoing longwave radiation, OLR. But there’s a double whammy: the clouds are also being heated by the condensation of the water vapor, at the rate of 540 calories per gram of water vapor or 2.26 megajoules per kilogram, three times the energy required to raise 0 °C ice to 100 °C water. However this heating takes place at an altitude having less CO2 above it than the ground, making cloud warming easier to radiate to space than surface warming.

          Yet another effect is the heat pipe created by the hydrological cycle. Just as the heat pipe in your laptop cools its CPU evaporatively and dumps the heat into the enclosure by condensing and then returning to the CPU by the capillary action of a wick, so does evaporating water cool the Earth’s surface, dump the heat into the clouds, and return to the surface as precipitation. This cooling effect is estimated by Trenberth et al at around 80 W/m², vs. less than 70 W/m² of radiative cooling net of back radiation. In other words the hydrological cycle cools Earth’s surface more effectively under today’s conditions than does radiation to space.

          A big balancing act then ensues, and I’m sorry to say I can’t tell you for sure who wins in the end, as I said in the beginning. However my impression from talking to people is that ultimately more water vapor resulting from more CO2 means more warming attributable just to the increased water vapor, the increased albedo of more fluffy white clouds notwithstanding. When you include the contribution of CO2 and its other anthropogenic correlates there is no question: one glance at the blue curve in the graphs I pointed to yesterday shows that, after making careful allowance for the AMO cycle, global warming is steadily increasing, and at a rate that is itself increasing. Moreover the shape of the blue curve, if not its slope, is predictable from elementary considerations. Knowing the shape in advance simplifies fitting while enhancing our confidence that we understand basically what’s going on.

        • Clouds are more complex than that. They need nucleation agents to form, so more or less water vapor does not necessarily mean more or less clouds.

        • Clouds are more complex than that. They need nucleation agents to form, so more or less water vapor does not necessarily mean more or less clouds.

          That doesn’t follow. Let’s for simplicity assume a naive proportionality law. that doubling water vapor doubles clouds. Such a law need not depend on nucleating agents, since whatever rate of condensation obtains for a given level of nucleating agents will double whenever water vapor doubles. If there are no nucleating agents, double nothing is nothing. If there are just a few nucleating agents, double a small amount is still double. If there a lot of nucleating agents, double a large amount is still double. In that simplified model the level of nucleating agents plays no role in the proportionality law.

          If you have a more complex model in mind in which things work differently, that would be interesting to know about.

        • This is about real world cloud formation, not specifically about the proportionality law.

          http://weather.about.com/od/cloudsandprecipitation/f/cloudformation.htm

        • So all else being equal, more nucleation sites –> more cloud formation, fewer sites –> less cloud formation.

        • more nucleation sites –> more cloud formation, fewer sites –> less cloud formation.

          Yes, that was your original point, which I argued was irrelevant. You’re simply ignoring my argument instead of addressing it.

          I hope we’re not working up to a Jan Pompe moment here.

        • Dr. Pratt
          I think a regulating negative feedback should be also added to your scenario of the CO2- water vapour positive feedback.
          Current winter is an example:
          – accumulated heat content from the Russia –Siberia land mass from the last summer/autumn was well above normal.
          – once Arctic was deprived of its insolation, increased temperatures in the sub-polar ring, supply polar vortex with extra energy, greatly increasing tangential velocity of rising vortex, moving in the direction of the energy source (away from north Canada and Greenland).
          – rise in velocity increases radius of polar vortex, the area and volume of warm air drawn in, rises with square law.
          – the heat energy contained in the rising vortex is dissipated by stratospheric radiation greatly overwhelming any CO2 positive feedback.
          – so cooled air mass deprived of its heat content is deposited further south, distributed by the sjet-stream along middle latitude reducing its winter temperatures.
          Hey presto, the global temperatures go down, until the next overheated summer season of the great Euro-Asian land mass.

        • Hey presto, the global temperatures go down, until the next overheated summer season of the great Euro-Asian land mass.

          Thanks, I was wondering why Heathrow was shut down, that might well be the explanation. In fact a lot of London seems to be immobilized. I have a guest (Gordon Plotkin) trying to fly back to Edinburgh through Heathrow tomorrow who prudently switched his flight to Amsterdam, which seems to be less snowed in.

          Negative feedbacks can seem like positive feedbacks when the delay in the feedback loop is half a period of the natural resonance, which is what you’ve got in your theory. In that case you end up with runaway oscillation instead of runaway escalation, a point noted by Liapunov in the early days of control theory. Whereas escalation merely gives rise to extreme temperatures, oscillation gives rise to extreme storms.

          Russia would appear to have tasered London.

          People fail to realize the danger created by a six-month delay in a climate-related feedback. Either zero delay or a 12-month delay would be much healthier.

          greatly overwhelming any CO2 positive feedback.

          Oh certainly. Annual swings dwarf anything CO2 can do by two orders of magnitude. Fortunately each extreme is only for a few months.

        • I think you understood my hypothesis far better than I do. Now I have to think about it, and see why possibly it could may make sense.

        • Now, that gives rise to another idea. If the Liapunov ‘stability’ has an effect, than above type oscillation could give rise to shorter stability periods e.g. roman, medieval and modern warming as well as intermediate ones of the LIA type.

        • Ok, except that the modern warming is a different animal from the earlier ones.

          The difference between the earlier warmings and the present one is at least two orders of magnitude more anthropogenic CO2 than in the earlier ones.

          If anthropogenic CO2 were 1% of its current level, namely about 1 ppmv instead of 110 ppmv, which is around where it would have been during the medieval warming period, we would not have seen the huge rise in temperature from 1970 to 2000. We would of course see fluctuations from natural causes, e.g. volcanic aerosols, but a major volcanic eruption produces at most about 0.04 °C variation, and the effect only lasts a few years.

          Twenty major eruptions during a century can have some impact, but not with the speed and single-mindedness of the 1970-2000 rise we just experienced, instead it tends to wander around at random.

          The Atlantic Multidecadal Oscillation, El Nino events and episodes, and solar cycles can also combine to produce interesting swings, but except for the first these are gone within ten years. Only the AMO and our present massive CO2 emissions have any longterm, i.e. multidecadal, impact.

          The northern magnetic fluctuations you’ve been studying are longterm in that sense, which makes them relevant to global warming at least to the extent that they are harder to remove with a low-pass filter. The earlier warming periods you referred to would appear to be even longer-term phenomena.

          Among these longer-term phenomenon there is only one that is both long term and fast changing, namely recent CO2. It is clear from considerations of population growth and fuel consumption that anthropogenic CO2 has been growing exponentially for over a century, qualifying it as long term. But its exponential nature distinguishes it from all the others in that the rate of change in recent decades is surely unprecedented for this planet.

          What could possibly emit 30 gigatonnes a year of CO2 besides 6.7 billion humans exploiting advanced technology? Perhaps a comet carrying 30 gigatonnes of CO2 hitting Earth, but can one comet even pack that much CO2? And we do it every year, and by 2050 we’ll be at 60 gigatonnes a year.

        • Accept the argument partially.
          Now, before I whish you a merry C’mas, I am going to say, I do not know what the fuss is all about. Best record of real temperatures we have is the CET. I have plotted here seasonal CETs referenced to 1950 (may be wrong choice, but I prefer single year to average records).
          http://www.vukcevic.talktalk.net/CET-D.htm
          If you scan along from 1660 – 2010 (annual line) , on high T side, it is only period of about 12 years from 1996-2008, which looks a bit odd, if it was not for Pinatubo it possibly would have been 18 years. But there is no relentless rise, it all happened in a year or two, whichever option you take, than temperatures plateau, before going back.
          If I wish to concern myself with the future, then I think I would chose the natural resources rather than CO2 feedback, but that is an individual choice not suitable for everyone.
          Talking about the future, in reference to your ‘temperature futures’ trading proposition I will gladly stay out.
          Happy Christmas and New Year.

        • I do not know what the fuss is all about. Best record of real temperatures we have is the CET.

          I’m thrilled that Central England is not suffering from global warming. Now if the rest of us could just figure out how they do that…

          The Gulf Stream perhaps? Or have they been relying on Russia overheating in summer for far longer than we’ve realized? Now there’s an interesting theory to pursue. With London gridlocked by snow this winter and Russia suffering far worse than usual from heat last summer there’s certainly reason to wonder.

          But for understanding modern global warming, HADCRUT3 goes back to 1850 which is surely enough. What does CET going back to 1660 add to our understanding of modern global warming, particularly given the possibility that central England might have unusual climate features not shared with the globe at large?

          If I wish to concern myself with the future, then I think I would chose the natural resources rather than CO2 feedback,

          Even if (a) theory predicted that temperature should rise with increasing CO2, AND (b) observation bears this out with an impressively tight correspondence between predicted and observed temperature after taking the other known influences into account?

          Anyway, Merry Christmas to you too, Milivoje!

        • Regarding temperature futures trading, I only understand the theory, I’ve never actually opened a futures account. So I may have misunderstood some of it.

        • In reflection on your comment, I do not think 1860 is good enough start for the CETs, the reason:
          http://www.vukcevic.talktalk.net/CET-GMF.htm
          period of nearly 150 + years of ‘trading’ (or trending) sideways, so any long term climate consideration has to take this into account.
          Ah yes, Russia; winters there must have been much milder then, in the first two decade of 1700’s Peter the Great was building St. Petersburg (Catherine the Great completed many of palaces during the last three decades ). Currently the average temperatures there are below OC for about 4 months, with Jan & Feb well below -10C. Frozen marshes of the river Neva wouldn’t be ideal place to start a grand new capital.

        • In order for this 6-month-delayed oscillation between cold England and hot Russia to get started we need a trigger. I propose the last half-century of CO2 as the trigger. This is long after Peter and Catherine.

        • …but we may be in agreement there…

        • I live near Helsinki not very far from St. Petersburg. This year the early winter has been exceptionally cold with minimum of -23C three days ago and uninterruptedly well below freezing for more than a month. According to history books and paleorecords, this is the kind of temperatures that were normal, when Peter the Great built St. Petersburg, which happened in the ending phase of the little ice age. The time of Catherine the Great was warmer, perhaps the warmest since the medieval warm period, but then the temperatures fell back down again for a rather cold 19th century.

        • I would disagree, CO2 (or UHI or whatever), is not a trigger, although is there for a free ride . It is one of now ‘revived’ and becoming more fashionable ‘natural oscillations’. Current uplift is due to the same ‘driver’ as plunge in the CETs 1650-1700 and then strong 30-40 year recovery (deceiving Peter the Great) . I finally got an idea how it might work, but may not be an exact science.
          I hope you had good Xmas.

        • CETs plunge 1650-1690, unprecendet rise in temperatures1690-1730.
          http://www.vukcevic.talktalk.net/CET-GMF.htm
          PtG starts building St. P’burg in May 1703.

        • Vukcevic,
          Since there are many theories out there on why little Ice Age occurred.
          Here is one more.
          What would happen if a huge meteor grazed the atmosphere?

        • What would happen if a huge meteor grazed the atmosphere?

          That has to be one of the most sensible things I’ve ever heard from a denier. (And no, for once my tongue is not in my cheek here.)

          A close shave like that might well have left some of the shavings in the atmosphere, blocking off the sun and seriously cooling the planet.

          One would then look for historical accounts of such an incident, as well as a sharp attack/slow decay in the temperature record.

          If the meteor grazed the South Pole back then, it would seem plausible that no one except residents of South America, Australia, New Zealand, and South Africa would have noticed anything strange besides a slightly cooler Northern Hemisphere.

          I realize that the IPCC has only a limited audience here, but I’ll quote from the third report here. (For reasons that this quote from the third report in 2001 should make clear, the fourth report attached too little importance to the MWP and LIA to bother much with them.)

          “Evidence from mountain glaciers does suggest increased glaciation in a number of widely spread regions outside Europe prior to the 20th century, including Alaska, New Zealand and Patagonia. However, the timing of maximum glacial advances in these regions differs considerably, suggesting that they may represent largely independent regional climate changes, not a globally-synchronous increased glaciation. Thus current evidence does not support globally synchronous periods of anomalous cold or warmth over this time frame, and the conventional terms of “Little Ice Age” and “Medieval Warm Period” appear to have limited utility in describing trends in hemispheric or global mean temperature changes in past centuries. With the more widespread proxy data and multi-proxy reconstructions of temperature change now available, the spatial and temporal character of these putative climate epochs can be reassessed. Mann et al. (1998) and Jones et al. (1998) support the idea that the 15th to 19th centuries were the coldest of the millennium over the Northern Hemisphere overall. However, viewed hemispherically, the “Little Ice Age” can only be considered as a modest cooling of the Northern Hemisphere during this period of less than 1°C relative to late 20th century levels (Bradley and Jones, 1993; Jones et al., 1998; Mann et al., 1998; 1999; Crowley and Lowery, 2000)..”

          Which would mean less than 0.5 °C relative to mid-20th century levels.

          Ok, so maybe it was three meteors, one passing over each of Alaska, New Zealand, and Patagonia. Again, who in those areas in the 16th century who was keeping careful records would notice anything amiss? I don’t know about Alaska, but the Spanish Conquistadors would have destroyed any such records in South America as pagan necromancy incompatible with Christianity. Latimer Alder would have approved.

          Or it might just be an unusual run of volcanoes back then. Many major volcanoes went unreported in those days for lack of any i-witnesses with i-Phones to tweet the event to other continents.

          As I’m sure many here would be happy to point out here, science doesn’t know. Joe Lalonde’s theory of the cause of “the” LIA strikes me as about as good as any other. Though not much better, given that the LIA may be more a matter of reification of a non-event than anything capable of being studied scientifically.

          On the other hand, reification is sometimes much underappreciated. The reification of a “mere ball of flaming gas illuminating the world” has played a central role in our thinking for some time now. Pick it up from the sentence “Now the Hogfather was a red dot on the other side of the valley”.

        • Quinn the Eskimo

          Re: Keeping your story straight and human gullibility:

          From the mouth of the IPCC:

          1. The three primary drivers of climate are the sun, clouds and GHGs:

          There are three fundamental ways to change the radiation balance of the Earth: 1) by changing the incoming solar radiation (e.g., by changes in Earth’s orbit or in the Sun itself); 2) by changing the fraction of solar radiation that is reflected (called ‘albedo’; e.g., by changes in cloud cover, atmospheric particles or vegetation); and 3) by altering the longwave radiation from Earth back towards space (e.g., by changing greenhouse gas concentrations). Climate, in turn, responds directly to such changes, as well as indirectly, through a variety of feedback mechanisms.

          AR4 Chapter 1 at 96.

          2.. There is a low level of scientific understanding of the role of the sun (AR4 Chapter 2 at 202) and of clouds (AR4 Chapter 2 at 201) in climate.

          3. Figure 2.4, Radiative Forcing Components, there are 9 listed. The level of scientific understanding is “high” for 2, medium for 1, medium to low for 2, and low for 4. AR 4 Synthesis Report, p.39.

          4. Despite, by its own admission, not knowing much about two of the three primary drivers, or much about several others, IPCC claims it is “very likely,” equating to 90-94% confidence, that “Most of the observed increase in global average temperatures since the mid-20th century is very likely due to the observed increase in anthropogenic GHG concentrations.” AR4, Synthesis Report, p. 39.

          It is not logically possible to be 90-94% confident as to cause, when they don’t understand two out of the three most important forces.

          From the mouth of the IPCC, the attribution analysis is thus shown to be incoherent and irrational.

          But this just doesn’t matter to the IPCC:

          But one must say clearly that we redistribute de facto the world’s wealth by climate policy. Obviously, the owners of coal and oil will not be enthusiastic about this. One has to free oneself from the illusion that international climate policy is environmental policy. This has almost nothing to do with environmental policy anymore, with problems such as deforestation or the ozone hole.

          Ottmar Edenhofer, 14 November 2010 (German version) http://www.nzz.ch/nachrichten/schweiz/klimapolitik_verteilt_das_weltvermoegen_neu_1.8373227.html (English version) http://thegwpf.org/ipcc-news/1877-ipcc-official-climate-policy-is-redistributing-the-worlds-wealth.html

          So, yes, I resist.

        • Quinn the Eskimo

          Forgot to say that Herr Edenhofer is the new Co-Chair of WG III.

        • The science is indeed not settled. But as far as judging whether global warming is underway, what we don’t know is not sufficient to undermine what we do know.

          You might not know whether it’s going to rain this afternoon, but you still might be tempted to leave your umbrella at home if the morning was sunny.

        • Vaughan, who are these “deniers” of which you speak? What is it that you think they deny?

        • ” I wouldn’t place a climate bet on anything less than a ten year time frame.”

          Your on. What are your terms? That the temperature will go up from now for ten years in accordance with GISS model E business as usual scenario?

        • Why bet even odds with me when you can get 50 times better odds betting on Intrade against the proposition that 2019 will be 0.2 °C warmer than 2009? Last trade was 98. At that price if you lose you’re only out $2, if you win you make $98.

          How could you pass up such a deal? If as you indicated you don’t mind losing $1,000 if you lose, then you stand to win $49,000 if you win. Go for it! If you don’t like those odds you must be having very big doubts about what you claim to be so confident about.

        • So Vaughan, I guess you have your money on “Will Global Average Temperatures for 2010-2012 be THE warmest on record?” :)

          The bid/ask spread is a lot tighter for that one. The 0.2 C in ten years has a > 40 dollar spread. Not good.

          http://www.intrade.com/aav2/trading/contractInfo.jsp?conDetailID=706211&z=1293070009021

        • Depends on how they define “global average temperature.” If HADCRUT3 then none of the previous 11 years have been the warmest on record, since 1998 dominates them all. Why would I want to bet on an event that hasn’t happened in 11 years straight?

          (Those are three separate bets, btw, one for each of the years 2010, 2011, and 2012.)

          In any event betting on weather instead of climate is a mug’s game, as I said before. Moreover the downswinging AMO means that even the average of the past 10 years won’t be rising quite as reliably as it did between 1970 and 2005 when the AMO was on the upswing, though I don’t expect the dips to be as frequent as during 1940-1970.

        • Wow! Thanks! I ‘ll have some of that if the money is guaranteed to be there when it’s time to collect. How is that assured?

        • Short answer: Each participant opens an account and puts money in it sufficient to cover their current obligations.

          Long answer: since you have no confidence in this proposition you want to sell it. You therefore need to find a buyer at a price that works for both of you. So you either accept an existing bid (purchase order), in which case the contract is made then, or place an order to sell (your asking price, including whatever limitations you want to place on the order), in which case you have to wait for a buyer to accept your offer.

          Once a contract has been made, the two of you own your respective halves of the proposition, divided at the agreed-on price. So if you sell at 75 (whence he’s buying at 75), at the same time you’re buying the converse proposition from him at 25 (confusingly for some, Intrade words this concept in the language of the stock market). His account therefore must cover 75 while yours must cover 25 (Intrade calls the latter a liability rather than payment for the converse proposition). But since this is a futures market you don’t actually receive your 75 until the contract closes in your favor (in this case in 2019). If you lose the bet then nothing changes since you had committed the money back when you sealed the deal (made the contract).

          Just as in the stock market, you can continue to buy and sell depending on how your perception of the odds stacks up against others’. In particular if you want to get out of your short position you can buy it back, possibly at a loss or gain just as in the stock market. Intrade would then say you had reduced your liability and free up some of your account, i.e. in effect you would be being paid for selling the converse proposition even though Intrade does not use that language in order to make it feel more like the stock market.

        • CO2 is now climbing at 2.1 ppmv per year, as compared to 0.94 ppmv per year in 1960, and in ten years will be rising at over 2.5% per year.

          That’s a typo right? 2.5%/year would be on the order of 10 ppmv/year. I don’t think so. 2.5 ppmv/year in 2020 is the result I get from an exponential extrapolation of MLO data. The various IPCC scenarios (cheap science fiction worthy of the derogatory appellation of sci-fi, IMO) don’t start to diverge until about 2030.

        • Thanks for catching the typo, DeWitt. I did indeed mean 2.5 ppmv. We won’t hit even 1% until 2060 or so.

          The various IPCC scenarios (cheap science fiction worthy of the derogatory appellation of sci-fi, IMO) don’t start to diverge until about 2030.

          I’m betting on the third world increasing their population and fossil fuel consumption during the next half century following a similar exponential curve to what we’ve observed in the past half century as inferrable from the Keeling curve. Going by head count alone they should shorten Hofmann’s 32.5 year figure, but not if you take their GDP into account. They just don’t have the money to buy that much fuel.

          Carbon mitigation is a strong argument against our helping lift the third world to our level of prosperity too quickly. They need to do that on their own in order to prove that they’re as entitled as we are to create havoc with storms and ocean acidification, we shouldn’t entitle them for free.

          Balancing these competing considerations, my best guess is that we’ll still be close to the Hofmann curve in 2050.

        • I’m betting on the third world increasing their population and fossil fuel consumption during the next half century following a similar exponential curve to what we’ve observed in the past half century as inferrable from the Keeling curve.

          If I thought I’d be around, I’d take that bet. There isn’t anywhere near enough fossil fuel remaining for that to happen. If you look at the details of most of the scenarios, the total consumption of fossil fuel is far beyond any rational projection of total supply. Several scenarios actually have petroleum production in 2100 exceeding current production. Even the IEA now admits that conventional petroleum production peaked in 2006 with a plateau expected for the next 20 years or so rather than the exponential decline of a simple logistic curve. You can’t burn it if you can’t produce it.

        • My projection, FWIW, is that decreasing oil supplies will drive up the price of oil until it is economically unattractive compared to alternatives. For ground transport electricity may take over, but this merely shifts the energy burden to the grid. Power stations will continue to use coal, which as we pass peak energy will become lower grade thereby producing more CO2 per joule. But peak energy happens well before peak mass, and power stations will use increasingly more coal for the indefinite future, hence increasingly more CO2. Demand will continue to rise, and with it CO2 emissions.

          But only up to a point. And not because coal is running out.

          Assuming the NIF/LIFE inertial confinement program goes as currently planned, nuclear fusion will kick in at around 2060, or earlier if we’re forced into it by circumstances or policy. At that point CO2 emissions will at long last start to decline, giving nature a chance at last to get caught up, resulting in the CO2 level turning around and going down.

          There will be so many technology innovations in the next half century that speculation about 2100 is pointless. If by 2070 CO2 emissions are way down, we may have to deal with the fact that nature has not only caught up with us but is overtaking us in pulling CO2 down. Conceivably by 2100 we could find CO2 plummeting at an unhealthy rate, as nature draws down vast amounts of CO2 that we’re no longer putting up.

          I suspect we’ll still have enough coal in 2100 that if the need arises we’ll be able to slow down the CO2 decline by burning some of it off. Purely to generate CO2, not energy, mind you, which by then we’ll be getting in cleaner and more efficient ways.

          Wonder if the Heartland Institute would pay me to say that? ;)

          I’d take their money, and then point out that between now and 2100, we may have caused a major mass extinction of hundreds of thousands of species if not millions as the CO2 went flying through the roof at breakneck speed and then came crashing back down at equally breakneck speed if not faster.

          What a neat experiment. If only there were some way one could get revived for three minutes 75 years after dying just to see how it actually turned out. Maybe Craig Venter and Richard Branson could collaborate on that. They’d appreciate the utility of their joint invention as much as anyone.

        • We also have a good bit of nat gas. A little lighter on CO2 if that is your worry.

        • Good point. Heavier’s better if you’re only burning it for the CO2 in 2100, but either way is fine for that purpose.

          I also forgot about the seventy gigatonnes of methane under the Western Siberian Bog, which can be burnt to CO2.

          I guess we’re protected against nature sucking up all our valuable CO2.

        • Yep, we do need to capture that nasty methane in permafrost and in hydrates and burn it to the less potent CO2.

        • Increasing income in the developed world has resulted in a lowering of birth rates, which will eventually cause a net reduction of population if that applies to the rest of the world. Global population is already expected to peak in about 2050 at about 9E09 people. My bet would be sooner and lower, but again, It’s unlikely I’ll be around to collect. IIRC, the F1 scenario has a peak population of 15E09. Then there’s the problem that IPCC uses MEX rather than PPP to determine the size of the current economy. That leads to some ridiculous projections as well.

        • With present exchange rate, the AUD $10k challenge is worth about USD $10,600

      • Fred,

        I am sorry to have missed the first two days of this thread ( due to family reasons), seeing as how I am apparently responsible for Dr Curry starting it! I have a lot of catching up to do, obviously, but I am trying to do just that. However, I will try to address your initial question about unanswered questions. One question is this:
        A Lacis suggests that CO2 is responsible for 20% of the GE. In 1850, 20% was 6.4 deg C of the GE. Presently the GE has increased by 0.8 deg C and 20% of GE is therefore 6.6 C. Even if we assume that all of the warming is due to CO2, the increase is far less than would be expected by the 40% increase in such a major contributor of the GE. I understand the log effect and feedbacks, but those reasons do not explain the very small temperature increase IF CO2 is as important as the cAGW suggests. (If the contribution of CO2 in 1850 was less than 20%, then by how much?)

        I’m shooting this question as I trawl through the thread, so please excuse if an answer has already been given.

        Regards,

        AB

        • You’ve partly answered your own question, and it’s a question you’ve asked before in a variety of different forms,with answers given at that time that you might want to review. Briefly, the logarithmic relationship (such that a 40% increase is only about half a doubling, logarithmically speaking), the long interval required for equilibrium (approached asymptotically over centuries), and the existence of countervailing negative forcings are sufficient to account for the observed changes.

    4. Jeff Glassman,

      You might try to do some research on line-by-line radiative transfer models rather than dismissing them out of hand. You could start here:

      http://www.atmos-chem-phys.org/9/7397/2009/acp-9-7397-2009.pdf

      A line-by-line model is not a difficult concept but it is computationally intensive. You calculate the magnitude of each line in the database for a series of thin layers of the atmosphere and add them all up within each layer. Then you use that data to solve the radiative transfer equation for the altitude and direction of view. You get emission spectra at any altitude in any direction. Simple. When the calculated spectra are compared to observed spectra, the agreement is excellent. The model has been validated.

      So then you vary the CO2 concentration and see how the emission changes as a function of concentration. It turns out to be logarithmic with concentration above about 10 ppmv.

      • DeWitt Payne 12/21/10 12:56 pm,

        Your remarks were asked and answered at least by me in the previous Confidence thread, but at your end they fell on deaf ears.

        Is it your intention to start over? Is it to make Judith Curry’s task on which she has admirably embarked impossible?

        A remark such as “you might try to do some research” is not constructive. You should answer the technical questions put to you, and do so expressly. You can’t escape by dismissing criticisms with fool’s errand.

        Nor is putting words in my mouth constructive. I minimized the importance of radiative transfer, relying on a quote from IPCC, amplified by its modeling errors affecting RT, but I in no way was “dismissing [RT calculations] out of hand.” I neither dismissed them, nor did I write about them “out of hand”. Just as answering technical questions with specificity is necessary, so is quoting or paraphrasing accurately.

        No example is more important than the response to your assertion, “When the calculated spectra are compared to observed spectra, the agreement is excellent.”

        The unanswered question put to you, and similar thinking individuals is, where are the data? We need to see the data and the explicit conclusions drawn from them, including the exact expression for the fit, its tolerances, and its basis for computation. No one outside the AGW movement is going to take your word for what you claim transpired, nor the word of thousands similar persuaded, nor any paraphrasing of research results, even by the author.

        Just to be sure, your conclusion “emission changes as a function of concentration … turns out to be logarithmic”, even restricted as you do to “above about 10 ppmv” is false or meaningless, take your choice. As stated to exhaustion on the previous thread, the real world CO2 absorption must saturate, and the logarithm and the alternative forms you suggested previously, linear and square root, do not saturate.

        And just to make the point again and explicitly, after you suggested that the CO2 absorption was variously linear, square root, and logarithmic (Confidence …, 12/21/10 3:51 am), you ignored my questions put to you (12/21/10 9:11 am) only to escape to this thread to start over. Let me assume that you just overlooked my remarks. Surely I’ve done the same. So please respond here and now.

        And just to help Judith keep her task manageable, and as pointed out previously, IPCC already made the same claim in all critical regards, without references, without data, and without science. That has to be the problem at hand, if any. Another voice doing the same thing adds nothing unless you happen to believe that science is about voting.

        IPCC said that CO2 does not saturate because its radiative forcing is dependent on the logarithm of its concentration. It must saturate, because the RF certainly cannot exceed the total OLR, as an extreme upper bound. Immediately then are the conclusions that (a) the logarithm model needs repair and (b) we need to discover where the atmosphere is today on the repaired saturation curve. The answer that the RF computed by radiative transfer confirms the logarithm dependence is (a) not logical and (b) raises all the gritty questions about RT.

        Science progresses or comes to a halt one brain at a time (Einstein: one would be enough). As I cited in Confidence …, the problem is not in the things we don’t know, but in the things that we know that aren’t true. We might find full agreement that computations with HITRAN data produces a logarithmic dependence in some region. That doesn’t mean that HITRAN actually does so, nor that what those computations actually produce is valid. Most people have seen such things happen more than once: no one bothered to check this or that, just assumed whatever it was to be right or done or true or too costly to check again, and the results vary all the way up to the loss of human life. The question at hand is driven by IPCC’s report.

        So radiative transfer is of marginal importance, for its failures and for its lack of applicability in error ridden models. The results reported by IPCC are impossible, and yet RT proponents come forward to defend IPCC’s results with their theory. If we’re going to worry about RT, the topic at hand, let’s start with the data which yield the logarithm and their source.

        • Sorry Jeff, “do your research” is a very acceptable answer, particularly in your case where your statements are not made in curiosity but in absolute authority and confidence that everything is all bogus. If you don’t understand the subject and are too lazy to dig through the literature/data, then just stop talking about it

        • Two things are clear to me.

          1)Jeff is not lazy.
          2)He has a lot more years of doing hard science under his belt than you have.

          I suggest you drop the high and mighty attitude, because it’s making you look a bit silly.

        • chriscolose 12/21/10 5:35 pm

          You wrote >>”do your research” is a very acceptable answer, …

          To whom? In the context of a dialog? If I were an arbiter and neither the person who said this or his target, I would object. Talk about authoritative! And arrogant, to boot. It doesn’t establish your authority, just your ability to annoy.

          >>particularly in your case where your statements are not made in curiosity…

          You couldn’t have read what you criticize! I have made the same request repeatedly, maybe a dozen times. “Where’s the data?” That is an expression born of curiosity. If you were trained in a scientific field, it wouldn’t bother you.

          >>but in absolute authority and confidence that everything is all bogus.

          I see authoritativeness in your response, Payne’s, Pirilä’s, and others who nakedly declare that RT analysis produces the logarithmic response.

          Do you have an example of me saying anything analogous to “everything is all bogus”? I have shown in detail how the AGW model is fatally flawed. That does not mean that AGW model or anything else is all bogus. I have explained in detail to you and others that IPCC marginalizes RT. I have admitted that a logarithmic function can be fitted to most any convex function in a narrow region, not that it is bogus. I have agreed where asked that Earth has been warming on climate scales, and that the greenhouse effect is real. Those bits of physics just have not been assembled correctly in the GCMs. I do have great confidence in what I say because (a) I have done the research and (2) back up every point with citations, calculations or reasoning. You refuse to follow the example set for you.

          >>If you don’t understand the subject and are too lazy to dig through the literature/data, then just stop talking about it.

          This is arrogant, insulting, wrong, and uttered without a spark of intelligence or justification, even disguised in a hypothetical. It is flaming, and has neither a place nor a legitimacy on a respectable blog. Blogs exist where such commentary is appropriate, where flaming is practice as a political art, but Judith Curry’s is not one. There’s no crying in baseball, and there’s no flaming in science.

          Your comment is utterly without substance or competence. The subject here is radiation, but not what you radiate.

        • Jeff, I should have realised you are more than capable of dealing with Chris Colose’s blether. Sorry for butting in.

        • Jeff– There are several radiative transfer databases (HITRAN is one Myhre takes advantage of) based on measurements of these effects for individual lines in the spectrum and at different temperatures, pressures, and mixtures of gases. See e.g. Rothman et al (2005). Spectroscopists have took the time to validate, cross-check and assemble the available line data into a convenient database. There’s also HITEMP for applications related to a Venus-like atmosphere.

          Other people apparently have no problem reproducing spectral results, and are done so in a number of studies and textbooks, of which Ray Pierrehumbert’s is only an example.

          So, no I do not think “where is the data?!?!” is intrinsically an annoyance, but it becomes one when you keep insisting it is provided when it’s actually there and the references are provided. I don’t know if you expect to be hand-held and spoon fed through the process or what.

        • Actually the FTIR data area available from the DOE ARM data base, http://www.arm.gov. you need to register in some way to get access to the data, but it is available

        • Jeff,

          “This is arrogant, insulting, wrong, and uttered without a spark of intelligence or justification, even disguised in a hypothetical. It is flaming, and has neither a place nor a legitimacy on a respectable blog. Blogs exist where such commentary is appropriate, where flaming is practice as a political art, but Judith Curry’s is not one. There’s no crying in baseball, and there’s no flaming in science.”

          Perhaps it would really be helpful if you were to read what you post while taking a reflective look into a mirror. The simultaneous combination of unmitigated ignorance and arrogance is not particularly conducive to conducting informative dialog. Taking a happy pill before you think about posting a comment may be of help.

          There is an awful lot of good material available on comparisons of radiative transfer modeling results with measurements of spectral radiances that were conducted as part of the Department of Energy Atmospheric Radiation Measurement (ARM) program. One particularly useful paper of interest is that by Turner et al. (2004). Check Google for:

          AMS Journals Online – The QME AERI LBLRTM: A Closure Experiment for Downwelling High Spectral Resolution Infrared Radiance

          AERI is an upward looking spectrometer that measures the downwelling LW spectrum from 500 to 3000 wavenumbers (or, from 3.3 to 19 microns), with a spectral resolution of about 0.5 wavenumbers. Also available at the ARM site near Lamont, Oklahoma, are simultaneous radiosonde, lidar, and microwave measurements to determine the atmospheric structure that corresponds to the AERI spectral radiance measurements.

          A radiative transfer closure experiment is then performed using the HITRAN molecular absorption database and the LBLRTM line-by-line radiative transfer model. The impressive agreement between the measured and modeled spectra shows that we have an excellent (and validated) understanding of how radiative transfer works in the Earth’s atmosphere.

          Be sure to also check some the other references that are listed in the Turner et al. (2004) paper, in particular those by by S. A. Clough (chiefly responsible for the LBLRTM development), and by H. E. Revercomb (chiefly responsible for the design and development of the AERI LW spectrometer).

          If you are interested in examining real data and measurements, be sure to check the ARM webpage that is specifically dedicated to Atmospheric Radiation Measurements (and the analysis and interpretation of these measurements) at:

          http://www.arm.gov/

          On the ARM website, they have Instruments. They have Measurements. They have Data. And, they have hundreds of journal articles, technical reports, and briefer research project summaries that date back some 20 years to the beginning of this impressive and useful program of atmospheric and radiative measurements.

          If you have a real interest in radiative transfer model validation, and the comparison of radiative transfer model results to multiple sets of atmospheric measurements, the ARM program website is the place that will provide you with truly comprehensive information.

        • Brief question from a non-specialist if you have time.

          How do we know that AERI is measuring the LW downwelling from (for example) cloud surfaces rather than the air immediately above it’s sensor?

          Given the extremely short path lengths, how can AERI measure anything ‘far away’?

        • AERI measures LW spectral radiances under all kinds of sky conditions. Just by looking at the spectrum you can tell if it is clear or cloudy. A clear dry atmosphere will show close to zero spectral radiance (it is basically seeing space) within the LW window region. A warmer wetter clear-sky atmosphere will show more pronounced water vapor lines. When clouds move in, AERI sees spectral radiances characteristic of the cloud bottom temperature – the lower the cloud, the higher the spectral radiance that AERI will see in the window region.

        • Thanks Andy. My question still remains though. While I understand that clouds arriving will make a difference to the readings, isn’t AERI actually measuring the LW radiation being emitted by the air molecules immediately adjacent to it’s sensor, rather than anything ‘far away’ like cloud surfaces?

          If this is the case (and logic tells me it is), then the differences AERI sees in LW between clear and cloudy skies will likely be proportional to that change in cloud cover, but not a direct measurement of it.

          I don’t know how much difference this makes to anything, but just thought it might be worth clearing this point up, because I think it is important when it comes to measuring the LW radiation at the ocean-air interface.

        • The sensor looking up only sees near surface air radiation at very opaque wavelengths. Part of any interpretation of how a spectra looks from satellite or ground (or how to think about the greenhouse effect in the context of climate change) is the spectral selectivity of the absorbing gases.

        • fwiw there are also spectral wavelengths which are fully or partially open at which one can sense further up. These include the wings of strong absorptions. Unpacking the structure allows one to figure out composition, temperature and pressure profiles esp if there is some additional info

        • A Lacis 12/22/10 12:37 am

          You come to chrisclose’s defense by not answering the nagging questions. Where I might do the research he recommends is irrelevant and a misdirection. Have you taken a position on the basic questions, those which could be most valuable for an objective AR5? Here’s a beginning list:

          1. Does RT modeling show that the total intensity of radiation through the atmosphere depends on the logarithm of the concentration?

          2. Or does RT modeling produce a result that is approximately logarithmic in a region?

          3. If (1) is yes, where is that published in the public domain?

          4. If (1) is yes, what is the reason for the logarithmic dependence? If it is in the nature of the band wings, how have those band wings been validated?

          5. If (2) is yes, where are the data record and the plot of the output? Where is the goodness of the fit reported?

          Your responses on 12/22/10 would be of no use in AR5.

          Now to specifics. I downloaded Turner, DD, et al., The QME AERI LBLRTM [Quality Measurement Experiment Atmospheric Emitted Radiance Interferometer Line-by-Line Radiative Transfer Model]: … , 11/15/04, which you gave as your source and a starting point.

          Turner, et al., don’t use the words logarithm or concentration. They do say,

          >> Full treatment of the radiative transfer in a global climate model (GCM) [Global Climate [sic] Model] is prohibitively expensive, and thus parameterization is required to account for the radiant energy transport in GCMs. Detailed radiative transfer models that incorporate all of the known physics, such as line-by-line models, are typically used to construct significantly faster radiation models to calculate radiative fluxes in GCMs. The line-by-line model used to build these faster models must be accurate, as even 1% changes in radiation are significant for climate. Footnote, reference deleted, id., p. 2657.

          and

          >>6. Conclusions

          >>The ARM program has fielded an extensive array of instrumentation at its SGP CART site to collect long-term datasets to improve the parameterization of radiation in global climate models. This program was motivated in part by … ARM supported a variety of projects that led to improvements in high spectral resolution radiative transfer, including laboratory spectroscopic studies and field experiments … The laboratory studies led to improvements in the HITRAN spectroscopic database, with the largest changes in the spectral region from 7–20 mm coming in the HITRAN 2000 release. The PROBE and SHEBA experiments led to improvements in both the self-broadened and foreign-broadened portions of the water vapor continuum, which was further modified to incorporate a new continuum model. Figure 13 demonstrates the large improvement in the modeling of high spectral resolution downwelling radiation over the past decade. The two cases are chosen from the new QME for two different water vapor amounts (PWV of 2.0 and 4.0 cm). Note that the pre-ARM results had much larger errors in both the line parameters as well as the underlying continuum as compared to the current state of the art. These improvements in the longwave modeling translate to approximately 4 and 6 W m^-2 in downwelling longwave flux at the surface for the two cases, respectively.

          >>This paper discusses a carefully constructed set of cases … . This QME dataset consists of 230 cases from 1998–2001 covering a range of atmospheric conditions at the SGP site to test and validate radiative transfer models. … there is an outstanding issue related to the need to subtract a brightness temperature offset from the MWR []Microwave radiometer] observations before the PWV [Precipitable water vapor] retrieval is performed, and investigation into the source of this bias is ongoing. …

          >>This dataset, together with the 1994–97 QME dataset, was used to evaluate the LBLRTM, a popular model used by the atmospheric community, and its various components. In particular, our analysis of the QME dataset demonstrated that reducing the water vapor self-broadened continuum in CKD [Clough–Kneizys–Davies] 2.4 by 3%–8% between 750–900 cm^-1, increasing it by 4%–20% from 1100– 1300 cm^-1, and modifying the foreign-broadened continuum across the spectrum resulted in significantly reduced and spectrally smoother observed minus calculated residuals. These multiplicative factors are consistent with those required to obtain the current MT_CKD [Mlawer–Tobin CKD] continuum model from the CKD 2.4 model. It should be stressed that the analyses from this QME together with other corroborating measurements were critical in the development of the MT_CKD model. Utilizing the MT_CKD water vapor continuum model in the LBLRTM improves both the spectral shape and magnitude of the infrared radiance calculations from 600– 1400 cm^-1.

          >>The improvements in the water vapor continuum model and HITRAN database allow downwelling longwave fluxes to be calculated with an accuracy of better than 2 W m^-2. Furthermore, the spectral distribution of the LBLRTM calculated flux is correct, and there is negligible cancellation of errors. The improved spectral accuracy is important for computing the divergence of the net flux in the atmosphere (i.e., cooling rate profiles). … we urge the use of this data in a similar manner for the validation of other radiative transfer models. Id., pp. 2671-2672.

          You claim, seemingly from this: >>The impressive agreement between the measured and modeled spectra shows that we have an excellent (and validated) understanding of how radiative transfer works in the Earth’s atmosphere.

          The words in the document don’t support your conclusions. What IPCC needs for AGW is the total Outgoing Longwave Radiation. The OLR spectrum is quite interesting and informative, but not the needed parameter. The article is about downwelling radiation and atmospheric emitted radiance, when the AGW model needs total OLR from Earth emitted radiance.

          The article refers to parameterization as the method of implementing RT in GCMs, but supplies none. Consequently, it can give no fit of the resulting parameterization to either the model (a first step) or measured OLR. The latter is a necessity for the validation of the RT model you claim.

          Your vagueness of a position coupled with a pointless reference reinforce suspicions about the claims made by the RT community. But surely you won’t take my word for it. Turner, et al. was published in late 2004, over two years before IPCC wrote the following:

          >>The RF from CO2 and that from the other LLGHGs [Long-Lived GreenHouse Gases] have a high level of scientific understanding (Section 2.9, Table 2.11). Note that the uncertainty in RF is almost entirely due to radiative transfer assumptions and not mixing ratio estimates… . AR4, ¶2.3.1, p. 140.

          Turner, et al. stated, above, that the RT results had to be good to within 1%. The uncertainty in CO2 RF is 19.9% (0.33/1.66), and the contribution of CO2 (1.66) to total RF (3.28) is 50.7%. Measured from AR4, Figure 2.20, Level of Scientific Understanding, p. 203. The uncertainty in CO2 RF (0.33) is 10.1% of the total climate RF (3.28). If radiative transfer met its target of 1%, the CO2 RF must have about 10 other error sources, but not including its concentration, almost as large as RT’s contribution.

          Radiative transfer may help IPCC’s estimate of CO2 RF, but that complement earns one back-handed compliment. And IPCC’s thousands of references don’t include your treasured reference. Turner, et al., carefully inserted the GCMs in their 2004 paper, and that should have merited at least an honorable mention in AR4. Did IPCC disqualify them for using the obsolete phrase Global Climate Model instead of Global Circulation Model? Get with the program or perish.

          Your defense is more elaborate than chriscolose’s original position. It is distinguishable, though, because yours is quite helpful. That is because (a) it is, at last, concrete, and (b) it failed. When you refuse to state a definitive position, and refuse to supply meaningful supporting data, you act not as a scientist but as a technician. Unlike chriscolose, you are a senior, published, respected authority on this subject, but you are wasting your coin by joining with the likes of the chriscoloses with his tribal (Judith Curry’s very excellent word) tactics of the movement: vacuous diversions to the library (go “dig”), childish ad hominem attacks (“don’t understand the subject”, “lazy”, “unmitigated ignorance”), and attempts to marginalize genuine, concerned skepticism.

          Don’t Ask, Don’t Tell is alive and well in the climate tribe.

          Just as Turner, et al.’s analysis was worthless to IPCC, your comments are worthless to the dialog here, or to resolving the scientific questions raised by IPCC and the AGW model.

        • Jeff, did you look at all the references in the original post on building confidence in radiative transfer models thread. One of the “parameterized” band models, RRTM, has undergone extensive validation with the AERI

          Mlawer, E.J., S.J. Taubman, P.D. Brown, M.J. Iacono and S.A. Clough: RRTM, a validated correlated-k model for the longwave. J. Geophys. Res., 102, 16,663-16,682, 1997 link (note, the paper is behind paywall).

        • curryja 12/22/10 12:25 pm

          No. That isn’t a reasonable undertaking for anyone other than the advocates of positions supposedly supported in the material. It’s a distraction and a diversion from the scientific challenge to support their work. The burden is on them, not their readers. It was on IPCC in the first instance, and now it falls on those who affirm and amplify IPCC’s position, still unsupported with references or science or data. The more they respond in their evasive fashion, the more convincing they are that the search would not be fruitful. Moreover, little motivation exists to do a literature search for something which is physically impossible, in fact or as an approximation, or to find where the research went wrong.

        • What IPCC needs for AGW is the total Outgoing Longwave Radiation. The OLR spectrum is quite interesting and informative, but not the needed parameter. The article is about downwelling radiation and atmospheric emitted radiance, when the AGW model needs total OLR from Earth emitted radiance.

          I don’t really see a need for this unless someone can convince me that radiation incident on an upward-facing plane follows a different set of physical laws than radiation incident on a downward-facing plane.

        • John N-G 12/22/10 4:41 pm

          You might find one of the three images from DeWitt Payne 12/17/10 8:44 pm on the Confidence thread informative. The one I recommend for you is the middle “here” link of the three, and the image is titled merely Fig. 8.2.

          Back on 12/6/10 8:44 pm on the Confidence thread, you recommended seven infrared GOES images made on 12/1/10. You claimed that these showed that “CO2 is not in saturation in the atmosphere”. I didn’t see your point. The big part of the problem is what is “in saturation”. Looking at your Ch. 1 at 14.7 microns, the radiation appears to be deep into saturation, and on Ch. 2 at 14.4 mu, well into saturation. It’s minor on Ch. 3 at 14.1, and scant after lower bands in Chs. 4-7.

          What we need to know is the total radiation, not some spectral decomposition, and we need to know how it varies with CO2 concentration. We’re looking for saturation as a function of concentration. Your channels are strictly spectrum snapshots at a constant concentration.

        • Jeff,
          I am not a climate scientist, but a physicist by education and large part of my research career. As a physicist I know, that different issues are studied in different ways. Some issues can be answered by direct experiment, which gives an answer to the question posed without any further operations. This is, however, rather an exception than the rule.

          There are far more equally reliable answers that are obtained by combining well understood theory with empirical knowledge obtained through experiments, which give the data needed for the calculations that answer the original question.

          Beer’s law for monochromatic radiation is both verified by very many and accurate laboratory measurements and an easily derived theoretical result, whose derivation assumes only very basic ideas of what radiation is. It was confirmed in both ways more than 100 years ago and an extremely large body of empirical work has confirmed its validity for monochromatic radiation.

          The later empirical work is not published stating that it confirms Beer’s law, because it validity was confirmed already earlier, but even small deviations from Beer’s law would create contradictions in the analysis of these measurements and therefore all this empirical work can be interpreted also as a confirmation of Beer’s law.

          The HITRAN-database is an application of similar ideas. Its content is a combination of theoretical calculations and empirical observations. Its extremely large number of details has been created with theoretical models, but these models have been validated through a very large body of observations. Combining theory and empirical observations, it has been possible to create a database that contains more detailed information than is practical to measure empirically, but still it is empirically validated to a very large level of both accuracy and reliability.

          All these theories and detailed data is reliable by strict standards of research. Its validity has also been tested in numerous ways in the atmosphere as many practical measurements both use this data base and at the same time confirm that it is valid. These measurements are in most cases not related to climate research, but to many other fields of science and practice. It is used in astronomy, in remote sensing and numerous other fields dependent on the transmittance of the atmosphere for different wavelengths. All these applications provide evidence that both the theory and the data of HITRAN are correct.

          Based on this huge volume of evidence, I have no doubt about the validity of Beer’s law for monochromatic radiation, when the concentrations and physical conditions of the intervening atmosphere are known. This proves on the other hand fully and without any doubt that Beer’s law cannot be valid for very wide bands or the whole IR spectrum, when the absorption coefficient varies as much as it has been observed to vary as function of the wavelength.

          In the above I have presented the rationale in the way I see it. I have no interest in trying to prove fully proven facts in additional ways. One proof is sufficient, when it is good, and I have told about more than one good proof already above.

        • I have shown in detail how the AGW model is fatally flawed. That does not mean that AGW model or anything else is all bogus.

          Are you saying that those of us who’ve been using “fatally flawed” as a polite way of saying “all bogus” are now going to have to find some other euphemism for it? Unless you have one I’m going to stick to “fatally flawed” on those occasions when I’m feeling polite.

        • Vaughan Pratt 12/21/10 6:25 pm

          I appreciate your rhetorical, tongue in cheek question about fatally flawed. You’re trying to make nice.

          However, you still owe me a list of my elementary mistakes you proclaimed to Dr. Curry on 12/21/10 at 10:44 pm on the Confidence … thread. Your single item in response was that “people had been telling [me that] all along”. You claimed to her that “he makes elementary mistakes”. You cast this as your observation and generalization, not qualified to the positions of others. Nor did you say that you had determined that this arose from others, that you had done your diligence to investigate the matters, and that you had found them to be true.

          I must assume by your lack of responsiveness that you have no evidence (either).

          And as to the others, they are ganging up to say that I am wrong on absorption saturation because HITRAN demonstrates the logarithmic dependence on CO2, because Beer’s Law has been invalidated, because Beer’s Law applies only to monochrome EM, and so on. Like your “elementary mistakes”, they support none of this with evidence beyond repetition of the is slowly proving to be erroneous scientific positions.

        • chriscolose

          You are one of the authors of the “comment” reply to G&T.
          You continue to say its rubbish but your “comment” failed to prove that any part of their paper was incorrect.
          When challenged to find any fault, all we hear is the’ sound of silence.’
          Yet you offer unsolicited advice to Jeff with a world weary tone.
          Sceptics contend that much of what you accept as ‘taken for granted’ climate science is built on unproven conjectures.

        • Sceptics contend that much of what you accept as ‘taken for granted’ climate science is built on unproven conjectures.

          Did I miss something? I thought that was the definition of a sceptic.

        • I too prefer when my conjecture is proven.

        • There’s a lot of G&T that is correct, but irrelevant. Their relevant conclusions, however, are assertions that they do not support. Just one example of many:

          From section 3.7.2

          Diagrams of the type of Figure 23 are the cornerstones of “climatologic proofs” of the supposed Greenhouse effect in the atmosphere [142]. They are highly suggestive, because they bear some similarity to Kirchhoff rules of electrotechnics, in particular to the node rule describing the conservation of charge [158]. Unfortunately, in the literature on global climatology it is not explained, what the arrows in “radiation balance” diagrams mean physically.
          It is easily verif ed that within the frame of physics they cannot mean anything.
          Climatologic radiation balance diagrams are nonsense, since they
          1. cannot represent radiation intensities, the most natural interpretation of the arrows depicted in Figure 23, as already explained in Section 2.1.2 and Section 2.1.5 ;

          I’ve read Sections 2.1.2 and 2.1.5 and neither contains any explanation of why the arrows cannot represent integrated radiation intensities or energy flows. They are, after all, called energy balance, not radiation balance diagrams. The arrows are not explained because their meaning is obvious in context unless, like G&T, you’re being willfully obtuse.

        • Jeff,

          What exactly are you looking for WRT RTE?

          And what will you accept as evidence, that is, what will it take to convince you that RTE work, are used in everyday engineering, and are really no subject to doubt. they of course can be refined and improved. So what do you require? maybe I can help

        • Steven,
          This is not about how accurate a FORTRAN subroutine can calculate output from input atmospheric profiles. This is about how accurate these inputs are.

          In previous threads it was brought to blog attention that the RTE output can differ by a factor of 4 depending whether it is winter or summer, extratropics or poles, and how far up you apply your integration. See Myhre and Stordal 1997, Figure2. My inquiries were left unsatisfactory answered by professors of climatology. The best they can do is to refer to a highly artificial 4-step construction of Hansen-IPCC of dynamics of atmospheric adjustment, where each step is open to questioning.

          More, as Tomas Milanovic tried to explain, radiation output from average temperature profile is not equal to average of outputs from a collection of local instantaneous soundings. Combining all these “uncertainties” together, it sounds very reasonable to conclude that all this “forcing” deal is GIGO – garbage in-garbage out, unless you have something more substantial so say other than A.Lacis and John N-G already said in other related threads.

        • Sorry my comment is not about fortran, inputs or outputs. What made you think it was?

        • Steven, it is unfortunate that our interaction in webblogs is plagued with mis-communication. I used the term FORTRAN as a collective moniker for a computational procedure, and partly because this language is still predominantly used in scientific computing, and in the GISS-E model in particular. It could be IDL, or Phyton, or else. Why have you been intentionally obtuse here? Maybe you elected this way of responding because you cannot debunk my thesis that it is a nearly arbitrary INPUT to RT algorithms that determines the “uncertainty” in calculated radiative forcing, and not the precision of computational algorithms and precision of HITRAN database with all corrections for pressure broadening and such?

          More, how about the other question I raised, that the main contribution to OLR difference between two concentrations of GH gases is confined to side effects of line broadening, where the optical depth is of the order of 1, and exactly where the Rosseland diffusive approximation does not work? Does not is bother you that you might be using an algorithm that does not work exactly in the area of interest?

        • I don’t see why everyone is picking on Jeff. He’s made it perfectly clear that he thinks everyone on the AGW side is offensive and arrogant.

          I can see only one possible reply to this: to agree with the first (since he’s evidently taken offense) and not with the second (since the only ones agreeing with Jeff are the known spoilers, who have to hunt in packs like Orcas in the hope of not sounding like surfer dudes trying to say something technical about wave mechanics).

          I said as much here.

          If he changes his tune and asks for advice one could take him seriously. Responses to anything else from him will fall on deaf ears and be a waste of time.

        • Hunting in packs?

          Fred Moolten | November 9, 2010 at 5:22 pm | Reply

          Hi Chris – Here are some scattered thoughts on the matter.

          First, I’ve folllowed your career with great admiration since we first encountered each other on MySpace some years ago. Your rational, well-informed, and almost always accurate assessments of climate science (in my opinion) deserve enormous praise and emulation.

          If Fred was any further up Christopher’s bottom you would not be able to see his feet!

    5. Re: the vectors thing – I didn’t see the original discussion leading up to the statements above but my recollection is that vector representation of angular momentum/rotational motion being show as orthogonal to the plane of rotation (and coincident with the axis of rotation) is a choice by convention. This allows for vector mathematics to treat the mechanics in a consistent way. As I understand it, a vector can be resolved into components which are parallel to the axes of an orthogonal frame of reference. If the vector is in fact parallel to, or coincident with, one of the axes of that frame of reference it will not have components on either of the other orthogonal axes. I suspect this is simply a confusion over terminology/convention and that nothing turns on it (no pun intended). If the confusion is mine, I hope somebody else can straighten it out!

      • I suspect this is simply a confusion over terminology/convention and that nothing turns on it (no pun intended).

        Your are right nothing turns on it the discussion was about vertical movement and potential energy.

      • Hi curious. Orthogonality is a binary relation between vectors in a vector space equipped with an inner product. The inner product can be supplied on its own subject to the requirement that it be bilinear, or inferred from a choice of basis for the space in the usual way (sum x_i*y_i over all dimensions i). In the latter case, which is the only one engineers are ever exposed to, the resulting inner product is automatically bilinear (details on request).

        Definition: Two vectors are orthogonal when their inner product vanishes.

        The notion of “component of a vector” is only defined in a vector space when some basis is specified. In that case a component is a scalar. Scalars live in a 1-dimensional vector space, and two vectors in such a space are orthogonal if and only if one of them is zero. The notion of “orthogonality of a component” without reference to some other component is undefined.

        The notion of plane of rotation is defined at all dimensions strictly greater than one. In the case of three dimensions it induces an axis of rotation, but not in any other number of dimensions. Of course we live in three dimensions (ignoring time) and so we’re accustomed to thinking of axis of rotation and plane of rotation as defining the “same thing.”

        The sense in which the former is orthogonal to the latter is that the former is orthogonal to all vectors lying in the latter.

        If that was more confusing than clarifying I’d be happy to try a different approach. Mathematicians are weird that way.

        • I should add that the i-th component of a vector space, besides being a scalar, can also be construed as the corresponding scalar multiple of the i-th unit vector. In that case two components of a vector are orthogonal if and only if they are not the same component, as a corollary of the requirement that for “component” to be defined there must be a basis, from which it follows that there must be an inner product.

        • I believe the basis of the vector space was being discussed. The basis set has to be neither orthogonal nor unit length. For a 2-dimensinal vector space the basis vectors cannot be parallel and must be of a non-zero length. For a 3-dimensional space they can’t be parallel and one can’t be in the plane defined by the other two.

        • Restated: The basis set does not HAVE to be orthogonal and unit length.

        • Yes Jim that makes sense to me and agrees with my understanding.

          Vaughan Pratt – I agree with most of what you say but my understanding disagrees with this:

          //The notion of plane of rotation is defined at all dimensions strictly greater than one. In the case of three dimensions it induces an axis of rotation, but not in any other number of dimensions. Of course we live in three dimensions (ignoring time) and so we’re accustomed to thinking of axis of rotation and plane of rotation as defining the “same thing.”//

          The plane will define a set of possible axes of rotation and likewise the axis will define a set of possible planes of rotation. In both cases an additional point would have to be defined in order to uniquely identify the “same thing”. However, I have an engineer’s persepective so that may be where we differ! :-)

          Jan Pompe – thanks, good to know it was not of consequence.

        • The plane will define a set of possible axes of rotation and likewise the axis will define a set of possible planes of rotation. In both cases an additional point would have to be defined in order to uniquely identify the “same thing”. However, I have an engineer’s persepective so that may be where we differ!

          You raise a good point. But in order for even engineers to describe rotation using a rotation matrix, they must first move the origin to some fixed point of the rotation, otherwise it’s impossible.

          In two dimensions there is just one plane of rotation, and rotation is described by the rotation matrix [[cos t, -sin t],[sin t, cos t]] where t is the angle being rotated through. There is no axis of rotation, only the origin about which the rotation takes place, which is the only fixed point of rotation.

          In three dimensions the axis of rotation is the unique line through the origin orthogonal to every vector in the plane of rotation. It consists of the fixed points of rotation.

          In four dimensions there is a plane orthogonal to the plane of rotation, and rotation leaves every point in the former plane fixed.

          For any n ≥ 2, rotation in n dimensions leaves a subspace of n-2 dimensions fixed.

        • The basis set has to be neither orthogonal nor unit length.

          Are you assuming you have a second basis set, or an inner product?

          If neither then I don’t understand what you mean. How could one basis fail to consist of orthogonal vectors of unit length?

          For a 2-dimensinal vector space the basis vectors cannot be parallel and must be of a non-zero length. For a 3-dimensional space they can’t be parallel and one can’t be in the plane defined by the other two.

          You can roll all these conditions into a single requirement, applicable to any number of dimensions, that the basis vectors be linearly independent. And if you also require them to span the space then you don’t need to say that the basis consists of two vectors in the first case and three in the second, which I presume you’re assuming here.

    6. Alexander Harvey

      A rhetorical radiative question :)

      Has the “rate of increase” in radiative forcing due to GHGs (CO2,CH4,NO2,CFCs, other 15 other gases but not O3) gone up since 1988 or has it gone down?

      According to NOAA data 1979-2009: http://www.esrl.noaa.gov/gmd/aggi/

      It has gone down.

      From around 48mW/m^2 to around 33mW/m^2.

      Now the amount keeps going up but the rate of increase has slowed.

      The next question is how much has the total forcing changed due to GHG + Aerosols + Carbon + etc, all the manmade stuff?

      Sadly I do not know. Not only do I not know the amount of any change, I am not sure of the sign!

      Does anyone have any reliable figures. The NOAA doesn’t give them because:

      “Because we seek an index that is accurate, only the direct forcing has been included. Model-dependent feedbacks, for example, due to water vapor and ozone depletion, are not included. Other spatially heterogeneous, short-lived, climate forcing agents, such as aerosols and tropospheric ozone, have uncertain global magnitudes and also are not included here to maintain accuracy.”

      Well if they don’t know, who does?

      Do you know if total forcings are going up? Are they going down?

      Does anyone know?

      This relates to the sulphate balancing CO2 idea, that practically no net warming results from burning coal and sulphur containing oils.

      Since around 1985 the CFCs and the 15 minor forcings have trended almost flat as has CH4.

      On top of all this the sun may have straight-lined and I have no idea about carbon and whatever else.

      So should we be getting warming or colder?

      I wish I knew.

      Alex

      • Alexander Harvey

        I should have stated that they are yearly rates of increase mW/m^2/Yr

        Alex

      • Alex – It seems highly probable that total net positive forcings are rising, due to increasing CO2 and to a lesser extent, increasing atmospheric methane. The countervaling effect of cooling aerosols does not appear to be rising, or at least not rising at the same rate, although the data here are less precise than for the GHGs. One useful reference is
        Ramanathan and Feng – 2008 – see, for example Fig. 3 for aerosols.

        Industrial aerosols are short lived – weeks to months in the troposphere, and possibly a few years in the stratosphere. Therefore, even if current aerosol emissions were rising to keep pace with GHGs (they don’t appear to be), any stabilization of both would create an enormous persistence imbalance between the short aerosol persistence intervals and centuries to millennial persistence of most excess CO2.

        The other potential negative forcing is solar, which in fact may be moving in a slight downward direction. However, its effects appear to be too small to offset the warming potential of the GHGs if current trends continue. For more on solar forcing, see Solar Influence on Climate

        As to whether we are in fact warming, the assessment depends on timescale. On centennial timescales, we have witnessed a warming trend characterized by numerous short term rises and falls, including those in the past decade. That decade has been the warmest since direct record keeping began in the mid-1800s, and the current year seems destined to be either the warmest within that interval, or rather close to it. As discussed in other comments, another indicator beyond surface air temperatures is ocean heat content. This too exhibits ups and downs, at least in the upper 700 meters as meaasured by the Argo floats, but the overall trend is upward. One indicator is the continued rise in sea levels, as well as an increase in the component of sea level rise (the steric component) attributable to thermal expansion of sea water. Relevant data are found at
        Sea Level Changes

        I’m not sure how directly relevant this last point is to the radiative transfer theme of this thread, but the data are consistent with measured changes in downward radiation at the surface as described in some of Judith Curry’s references cited in her earlier blog effort on this topic.

      • Has the “rate of increase” in radiative forcing due to GHGs (CO2,CH4,NO2,CFCs, other 15 other gases but not O3) gone up since 1988 or has it gone down?

        Would you say the rate of increase in the value of the function x³ is going up or down as x increases?

        Since the first derivative is 3x² and the second 6x, one would be inclined to say it must be going up, since both derivatives increase with increasing x.

        But if you define it as the percent change with increasing x it is going down. Here are the percent changes in x³ relative to (x − 1)³ for each x from 10 to 20:

        x=10: 37.2
        x=11: 33.1
        x=12: 29.8
        x=13: 27.1
        x=14: 24.9
        x=15: 23.0
        x=16: 21.4
        x=17: 19.9
        x=18: 18.7
        x=19: 17.6
        x=20: 16.6

        The same downwards trend in rate of change happens for the fourth and higher powers of x. For the “rate of change” in this sense to remain steady you need an exponentially growing function.

        The concept “rate of change” can be misleading in that respect.

        • Forgot to point out that NOAA ESRL was defining rate of change of AGGI as a ratio of consecutive values, whence one can expect the rate of change listed in the rightmost column of the table you referenced to decline even if the AGGI is growing as a quadratic, cubic, or even quartic function of time.

    7. “In other words, the greenhouse models are all based on simplistic pictures of radiative transfer and their obscure relation to thermodynamics, disregarding the other forms of heat transfer such as thermal conductivity, convection, latent heat exchange et cetera. Some of these simplistic descriptions define a “Perpetuum Mobile Of The 2nd Kind” and are therefore inadmissible as a physical concept. In the speculative discussion around the existence of an atmospheric natural greenhouse effect [6] or the existence of an atmospheric CO2 greenhouse effect it is sometimes stated that the greenhouse effect could modify the temperature profile of the Earth’s atmosphere. This conjecture is related to another popular but incorrect idea communicated by some proponents of the global warming hypothesis, namely the hypothesis that the temperatures of the Venus are due to a greenhouse effect. For instance, in their book “Der Klimawandel. Diagnose, Prognose, Therapie” (Climate Change. Diagnosis, Prognosis, Therapy) “two leading international experts”, Hans-Joachim Schellnhuber and Stefan Rahmstorf, present a “compact and understandable review” of “climate change” to the general public [8]. On page 32 they explicitly refer to the “power” of the “greenhouse effect” on the Venus. The claim of Rahmstorf and Schellhuber is that the high venusian surface temperatures somewhere between 400 and 500 Celsius degrees are due to an atmospheric CO2 greenhouse effect [8]. Of course, they are not. On the one hand, since the venusian atmosphere is opaque to visible light, the central assumption of the greenhouse hypotheses is not obeyed.”

      ~Gerlich and Tscheuschner, On The Barometric Formulas, 9-Mar-2010

      • On the one hand, since the venusian atmosphere is opaque to visible light, the central assumption of the greenhouse hypotheses is not obeyed.

        Yet another thing wrong with G&T. The Venusian or Cytherean atmosphere is not completely opaque to visible light. Available visible light pictures were taken by the Venera 9 lander. The average incident SW flux absorbed at the surface of Venus measured by the Pioneer Venus large probe was 15 W/m2. Given the low net rate of radiative transfer, that’s sufficient to drive greenhouse warming of the surface. We had a long discussion of this at Science of Doom here, here and here.

        • >>It should be noted that nowhere in this balance is there a so-called “greenhouse effect” in which the atmosphere supplies any net radiant energy that is absorbed by the Earth. Under these assumptions for the thermal structure, the flow of radiant energy from both the earth’s surface and its atmosphere is entirely outward toward free space.

          In the presence of clouds covering on the average some 33 % of the Earth’s surface, the “glass plate” atmosphere becomes partially reflective. For that cloudy atmosphere, the radiation from the atmosphere to free space increases to about 106 W/m2 and the radiation lost from the surface to free space is decreased to 153 W/m2. With clouds, the atmosphere now accounts for some 41 % of the total radiant flux lost to free space. The physical effect of that radiant loss from clouds to free space is apparent from the fact that thunderstorm activity tends to maximize after sundown because of radiation from the tops of clouds. That radiation loss results in marked cooling of those cloud tops, which steepens the temperature lapse rate, increasing the instability of the cloudy atmosphere, thus increasing thunderstorm activity. As was the case for the cloudless atmosphere, for the cloudy atmosphere, the so called “greenhouse effect is nowhere to be found in the radiative balance. All the radiant flux is outward toward free space.

          There is only one exception in which one can find a net radiant flux from the atmosphere to the Earth’s surface, and that occurs during atmospheric inversion conditions. But even in the extreme case in which the surface temperature and the atmosphere’s temperature are reversed, the radiant power lost to free space from the atmosphere is a factor of five greater than the power radiated toward the surface from the warmer atmosphere. Inversion conditions are thus the only case in which the so-called “greenhouse effect” can possibly have any form of physical reality. But, of course, that is not how the greenhouse effect is traditionally defined by global warming modelers.<<

          ~ Slaying the Sky Dragon – Death of the Greenhouse Gas Theory

        • No one that I know of has ever said that the greenhouse effect depends on a positive net flow from the atmosphere to the surface. It’s simple heat transfer physics. The simplest model is two infinite parallel planes at two different temperatures T1 and T2 where T1 is greater than T2. The radiant flux between the planes is equal to σ(T1^4-T2^4) where σ is the Stefan-Boltzmann constant 5.6704E-08. Note that I don’t include emissivity. For parallel planes the net transfer does not depend on emissivity as long as it isn’t identically zero. For a given net flow and T2, T1 is fixed. Increase T2 and T1 increases. For a perfectly transparent atmosphere, T2 is 2.72 K, the cosmic microwave background. For our atmosphere, T2eff is ~275 K. The net flux out is fixed by incoming solar flux. The surface temperature must then be higher than 275 K to be able to have net IR radiant flux (or convective heat loss for that matter) from the surface to the atmosphere.

        • The Earthshine project found that the incoming solar energy is also outgoing and that certainly debunks the AGW Weather Underground.

          The AGW True Believers essentially deny basic laws of thermodynamics and that is the pis aller of the falsified global warming alarmist movement in general. Obviously they cannot among actual scientists continue to maintain that CO2 is capable of heating the world. That is why the global warming alarmists are left with the requirement that water vapor provides a positive feedback; it doesn’t but their AGW theory demands that it does, science and reality be damned.

          Something that has been happening on Earth for billions of years by definition is reality, not the global climate models (GCMs), i.e., the toy models of the global warming alarmists. And, for as long as humans have been able to describe reality in words: they have called it ‘nature.’

          For the last couple of decades, a relatively few number of Western scientists have created a fictional world based on GCMs that defy reality. They call it the ‘greenhouse effect,’ which they claim is the physical basis for their claim that “CO2 emissions give rise to anthropogenic [man-made] climate changes.” Real scientists call that science fiction.

          There is only one independent variable. It’s the sun, stupid.
          And, the big actor in Earth’s drama is water, oceans of it. The energy of the sun falls on the oceans and lakes, causing evaporation and resulting in water vapor. The water vapor mops up heat and rises, leaving a cooler Earth behind. As water vapor rises the atmosphere becomes cooler, thinner where it eventually condenses and eventually gives up its heat to the cold emptiness of space as the vapor returns to water, forming clouds or freezing and ultimately falling back to earth as rain, sleet, hail and snow.

          The global warming alarmists cannot change this process. They can only program GCMs depicting runaway global warming by treating water vapor as a contributor to global warming, i.e., a positive feedback by collecting heat like a greenhouse. In actuality, water vapor is a part of a holistic process that results in a negative feedback because the amount of solar energy that is reflected away by clouds.

        • Wagathon, you need to pop over to scienceofdoom and get educated on a few things.

        • You are thinking I need a lesson on convection Derech? I’m not sure if you are quite up to day on these matters and especially advances in capturing mathematically the concept of ‘swirling vortices.’

          We now have two converging explanations that may better help us understand natural phenomena comprising global warming. Key to this understanding are the concepts of a ‘torque’ and the of natural power of ‘swirling vortices’ as these phenomena relate to the role of the atmosphere, the oceans, the Earth’s ‘molten outer core,’ and formation of Earth’s magnetic field on climate change.

          Adriano Mazzarella (2008) criticized the GCM modelers’ reductionist approach because it failed to account for many of the factors comprising a holistic approach to global warming. One of these factors is itself just a part of a larger process that might be described as a single unit comprised of the ‘Earth’s rotation/sea temperature.’ Holistically, however, we see that included in this single unit are changes in atmospheric circulation which act like a torque that can, in and of themselves cause, `the Earth’s rotation to decelerate which, in turn, causes a decrease in sea temperature.’

          Similarly, UCSB researchers (results to be published in the journal Physical Review Letters) ‘filled the laboratory cylinders with water, and heated the water from below and cooled it from above,’ to better understand the dynamics of atmospheric circulation and ‘swirling natural phenomena’ as observed in nature.

          As applied to Earth science, it won’t be long before it can be conclusively shown that Trenbreth is never going to find the global warming that he is looking for no matter how deep within the dark recesses of the ocean he cares to explore or conjecture about. And the the reason is simple: the heat is simply not there.

          No matter how much AGW True Believers may wish otherwise, global cooling is not proof of global warming.

          Soon, the mathematics of the UCSB researchers will reveal that given differences in ocean temperature, for example, especially in a real world example of the Earth rotating on its axis with warm water at the bottom, the cold water on the top will sink. The difference in the temperature, top to bottom, is itself a ‘causal factor’ that drives the flow.

          I think we all knew this already as a simple process of convection. But, let’s hope that the mathematics of it all will make the government science authoritarians stop acting like persecutors of Galileo.

        • OK, you’re off into pseudoscience territory.

        • So, you’re thinking that the swirl of a toilet might be something mystical and beyond human understanding or or do you perhaps believe that some real-world phenomenon simply cannot be represented mathematically by constructing a model?

        • Representing real-world phenomena such as the swirl of a toilet is not impossible with science, it’s just harder than with pseudoscience.

        • Moving into the twenty-first century, I would hope we all would at a minimum acknowledge that use of current GCMs by politicians is an insupportable example of Mann’s inhumanity to man that all scientists must eschew.

        • By their slogans shall ye know them.

        • Ready — Fire! — Aim: after all these years Michael Mann (of Hockey Schtick and CRUgate infamy) with his recent admission that, ‘Yes Virginia the Medieval Warm Period really did exist,’ comes only after the research of about 1,000 scientists makes the continued failure to acknowledge this simple fact an act of supreme denial, exceeds only Mann’s lack of good will toward mankind in failing to admit he lied to the world for years.

          e.g., “At Least 75 Major Temperature Swings in the Last 4,500 Years!’

          http://c3headlines.typepad.com/.a/6a010536b58035970c0120a660d62d970c-pi

    8. We don’t know how much the TSI is at TOA with any degree of certainty, TOA measurement could be as much as 6 W/m2 off, at least according to the NASA SORCE team.
      http://earthobservatory.nasa.gov/Features/SORCE/sorce_05.php

      Trenberth is only looking for 1/2 W/m2, one-tenth the acknowledged potential TOA measurement error.

      • Harrywr2: yes, the 6W/m2 disagreement is a big factor. However, from an instrument of the same kind, the TSI variations are no more than 3W/m2, and they show no significant drift over 11-year solar cycle.

        It seems that the biggest “uncertainty” in incoming part of the balance equation comes from inability to accurately measure the reflected energy, aka “albedo”. This is a highly volatile field, it changes on hourly scale and 50-km spatial weather scale, plus all these problems with incident angles near polar areas, scattering and haze. I would say that this is an arduous task and, as a hardcore skeptics and denier, I wouldn’t trust any number until every piece and every calibration line up perfectly.

        Similar problems hunt the effort to measure OLR, the other part of balance equation.

        Then you have three big and noisy signals, and need to subtract them to get an “imbalance”, which is at 0.2% level . I would say, good luck. Of course, “good statisticians” will try make the best they could to massage data and “hide the decline”.

        • That’s why measuring ocean heat content is important. The ocean integrates any radiative imbalance in real time. Assuming there are no major bugs remaining in the ARGO system, the radiative imbalance since 2005 has been essentially zero.

        • That’s the entire point. Despite of CO2 rising and all theoretical efforts to assign various radiative forcing to all that stuff, there are difficulties in detecting the corresponding heat in the most natural integrator. Now, the oceans are vast, deep, and massive. The data acquisition systems (buoys etc.) are clearly inadequate, so the difficulties are understandable.

          But how about existing smaller and isolated “integrators”, I mean lakes? They have much less mass of water, maybe 1/100 of top layer of oceans. If the radiative forcing exists (for decades, as IPCC says, and of the alleged magnotude), all lakes must be warming like hell, about 1C per year. This amount must be surely detectable, no? Do you know of any data that show if lakes are warming that fast?

        • Other recent studies also show substantial warming of lakes of various sizes –
          lake warming

          Some of the temperature increases are surprisingly high, given that lakes must equilibrate with their surroundings, including the lake bottom, the lake shore, and the ambient air in the region.

        • Still an order of magnitude is missing, isn’t it?

    9. Bryan on December 21, 2010 at 8:47 am wrote

      The K&T figure for back radiation just cannot be justified.

      It’s not the back radiation that is the problem with K&T (and K T&F) it’s the fact that the back radiation is different from the absorbed here is a graphic summarising the findings of this, and this both of which follow on from this the blue labeled axis and blue circles plot the computed absorbed portion of upward radiation vs computed downward radiation. The latter is validated in the last of the three above papers and hereamong other studies not listed.

      • I almost forgot here are some comments on K&T from one of the guys who calibrated the satellite instruments they used.

        • Clouds absorb 100% of upward LW radiation. There is no window for clouds, no forward scattering as there is for visible light. The 40 W/m2 in K&T and KT&F is the 99 W/m2 clear sky emission reduced by 60% because only 40 % of the surface has clear sky. There’s an additional 30 W/m2 from colder than the surface cloud tops directly to space. I think that’s too low, but it might be caused by multiple layers of clouds. Miskolczi ignores clouds.

        • clouds being composed of particulate water radiates almost as a black body and put’s its fair share through the window[s] as well. He doesn’t ignore them but treats as surface it think. When I asked him about it he just said it’s like a cavity nothing more but it reminded me of the time when with a pyrgeometer on heavily overcast day I found downward radiation and upward to be exactly the same (within the precision of the instrument). Nevertheless the optical instruments cannot distinguish between land, ocean an cloud top radiation through the window[s].

        • If you treat the cloud tops as part of the surface than the average temperature of the planet must go down because cloud tops are a lot colder than the surface. τ at the cloud tops is also a lot lower so the average τ for the planet goes down as well. τ from the surface for cloud covered sky is effectively infinite. No matter how you slice it, an average τ of 1.8 for the planet can only be constructed by making fallacious assumptions like ignoring clouds when they are inconvenient to your theory.

      • Jan Pompe |
        Thanks for the leads there’s a fair bit of reading!

    10. I would follow up with Arfur Bryant at the top as follows.
      Can we recognize that MODTRAN gives a good representation of the radiative transfer of the atmospheric profiles you give it?
      You say it has an assumption about deltaT. This is only a pragmatic assumption so that the public can run it easily, and only have to change one parameter, the surface temperature offset, to provide a new sounding. You can also change gases and moisture. A fuller program would allow you to set these properties independently at every level with hundreds of numbers. It is not a limitation of the program, just an ease-of-use decision.

      • Jim D said:
        “Can we recognize that MODTRAN gives a good representation of the radiative transfer of the atmospheric profiles you give it?”

        No, we can’t do such thing. First, MODTRAN uses spectral average of 2cm-1. The actual CO2 spectrum within that range contains high-intensity peaks of less than 0.1cm-1 wide and transparency gaps that absorb only 1/300 of the peaks. Emission height at these peaks and valleys fall on different slopes of temperature profile, such that a change in emission height leads to opposite contribution to change in OLR. When the spectrum is averaged before tracing, this “sensitivity-canceling” effect is lost.

        Second, you cannot change the input sounding profile at will, if you are talking about D.Archer’s web applet. For example, I would love to see the result of change in MODTRAN OLR in case of constant temperature of atmosphere. Have anyone conducted this simple test?

        • The actual CO2 spectrum within that range contains high-intensity peaks of less than 0.1cm-1 wide and transparency gaps that absorb only 1/300 of the peaks.

          Not in the lower atmosphere. The spectrum of CO2 looks a whole lot different at 1 bar total pressure than at 1 mbar. Photobucket seems to be having problems now or I’d post some graphs.

        • At 1b the lines are somewhat broader, true, and peak-to-valley ratio is about 40. More, the average emission height is at about 5-6km, so I would assume it would be more fair to compare things at about 300mb of pressure, would not it? Therefore, I don’t think your refining will make any essential difference to the described effect of flux cancellation, unless you are wiling to invoke the IPCC-Hansen concept of “stratospheric equilibration” first, and assume atmosphere as being isothermal above tropopause. Or stop calculating at tropopause.

        • Not really. The band wings cover a wide range of altitude and pressure. But even at 300 mbar, the lines are so close together that there is substantial overlap even for a 10 cm length cell, much less 10 km. Photobucket is still down.

        • You are looking at the wrong end of the system. Nobody should care what is happening spectroscopically at the bottom of atmosphere because all fluxes will be re-partitioned by convection to meet overall stability criteria and make up the wet-adiabatic lapse rate no matter what. It is a turbulent mess. You should look at relative changes that are happening at the top.

        • The bottom of the atmosphere is very important and everybody should care, what is happening there for the radiation.

          Most of the change in greenhouse effect comes from wavelengths where a significant fraction of radiation from the earth surface gets through the whole atmosphere. This probability is affected most strongly by the low troposphere because most of the total mass of atmosphere is there. The radiation that passes through the whole atmosphere is not at all influenced by the convective fluxes, but it is exactly the change in this part of radiation that is most important for warming.

          The lapse rate is determined by convection, but increased absorption stops radiation from warmer earth surface and lower levels of the atmosphere while each layer emits at the intensity corresponding to the its temperature. Thus the absorption of the lower atmosphere affects also significantly the intensity of radiation at TOA before the temperatures have reached their new equilibrium and the new equilibrium temperatures throughout the whole troposphere.

          Little changes for wavelengths with the strongest absorption but radiative changes in the lower atmosphere get significant as soon as the radiation can pass to a layer of significantly different temperature from its origin let alone passing through the whole atmosphere with a probability not very close to either zero or one.

        • Yes, some of this is bothering me although it’s probably my poor understanding. I have been trying to improve my knowledge of radiative transfer and the associated models so over the course of two hours last night I re-read the whole of the previous thread on radiative transfer and also this one. I also visited SoD and read up on some of the RT theory as presented there. I am nearly onside with the consensus now largely as a result of some of Fred’s comments but also as a consequence of being beaten into submission by the sheer volume of Vaughan’s comments! One area that concerns me is temperature and humidity. At SoD I learned that absorbtion and emissivity is affected by the temperature and humidty at the different layers. If I understood correctly the RTEs are completed using a standard atmosphere – presumably this implies the use of a standard lapse rate. But is this valid? Surely, the real climate is not like that and who is to say what constitutes a standard atmosphere at any particular moment? The lapse rate will be affected by different levels of convection and humidty and conditions will continually vary across the globe. Second, if the same assumptions are then used to calculate the surface forcing (no feedback) then isn’t the problem compounded? Please let me apologise if I have misunderstood. I have no wish to drag the thread backwards although I know I will be put right soon enough! Finally, I would just like to offer the season’s greetings to Judith and the rest of the ‘denizens’. Regards,
          Rob

        • I should just add that I don’t doubt the process/physics of radiative transfer, I am just struggling to see how the radiative forcing at the TOA and the associated heating at the surface can be calculated accurately using such assumptions.

        • Belay that!! My questions have now been answered further down the thread.

        • Rob, the standard atmosphere is often used to illustrate the effects, but the more rigorous studies would take the average effect using hundreds of soundings over the globe and seasons for the CO2 doubling experiment. In GCMs, of course, the RT model is applied to the local sounding as a function of space and time.

        • Jim D 12/25/10 at 11:17 am

          You said, >> the standard atmosphere is often used to illustrate the effects, but the more rigorous studies would take the average effect using hundreds of soundings over the globe and seasons for the CO2 doubling experiment. In GCMs, of course, the RT model is applied to the local sounding as a function of space and time.

          The problem is nonlinear, so the first statement doesn’t hold. If by effects you meant radiative transfer, the average RF is not the RF for the average atmosphere. If by effects you meant climate response, the global average surface temperature (GAST) is unlikely that produced by any average atmosphere. The GCMs are the averaging mechanism by which the effects are calculated through whatever means might be simulated.

          This is the core of a problem with RT. We have no idea what atmospheric model to use that might produce either an average RF or GAST. To make matters worse, the relationship between atmospheric models and GAST are many to one.

        • Here are the calculated spectra (www.spectralcalc.com) for 666-669 cm-1 for CO2 at different total pressures in a 10 cm path length cell at 296 K. The volumetric mixing ratio was adjusted so that the partial pressure of CO2 was 0.38 mbar in all three cases. You can do that sort of thing for free. You can do lots more if you subscribe.

          1 mbar total, 300 mbar total and 1013 mbar total pressure.

        • Sorry about that. A preview function would really be nice . Then one could test links before posting.

        • Just cut’n’paste the link as you have it in yur comment, and test it in another browser window. I do this all the time.

        • OK, maybe MODTRAN is an older example that happens to be easily accessed. How much error do you assign to its total flux numbers? I was talking about Archer’s page, and yes I said you can only change the offset and gross features there. If you actually had MODTRAN yourself , you could do a lot more, as I mentioned.
          Most codes now use the HITRAN database. Is that sufficient? What is your number for the ~3.7 W/m2 CO2 doubling sensitivity? Have comparison studies been done at various resolutions, and how large is the difference compared to possible errors in the soundings themselves, e.g. if CO2 changed by 1 ppm, or T changed by 0.1 C, or H2O by 1%?

        • Jim D, I have not seen any publications on this matter, they all are clear as mud. But we have been there before, at Watts-up:

          http://wattsupwiththat.com/2010/08/06/a-reply-to-vonk-radiative-physics-simplified-ii/#comment-454145

          The “cba” guy said that calculating up to 120km makes the forcing to go down, from 3.7W/m2 to 2.6W/m. I would say that “more research is needed” here, with 1nm spectral resolution or better.

        • Yes, I remember our WUWT conversation that was never resolved due to the lack of convincing data. I remain skeptical that the effect of finer line resolution could make much difference to the 3.7 W/m2 number, otherwise someone would have published something by now. Note that the main change is not at the center of the 15 micron band, but at the edges as CO2 is doubled. This is easily seen with MODTRAN.

        • Jim D, the data were very convincing:
          http://wattsupwiththat.com/2010/08/06/a-reply-to-vonk-radiative-physics-simplified-ii/#comment-455604
          although not official nor properly published. The result shows that when the fine spectrum structure is properly accounted for, the overall integral “forcing” over this band reverses its sign. This effect disappears when the spectrum is band-averaged first. Therefore, MODTRAN (with 2cm-1 bands) completely misses this entire effect, and cannot be possibly right, ever.

        • As pointed out by Fred Moolten below in the Hansen paper he links, we have to distinguish top-of-atmosphere from tropopause. I suspect any modification you have will, if anything, only enhance the tropopause forcing, which is what matters for tropospheric temperature feedbacks. I see that there is an uncertainty of about 10% in that 3.7 W/m2 figure which means the no-feedback response uncertainty may be about 0.1 C. I do not see radiative errors of this magnitude affecting IPCC conclusions much by themselves. Other uncertainties are bigger for sure.

        • SpectralCalc (www.spectralcalc.com) is a high resolution (~0.01 cm-1) line-by-line program. If you subscribe ($25 for 1 month unlimited access) you can do atmospheric radiative transfer calculations. I’ve done that and the results don’t differ significantly from MODTRAN. In terms of surface temperature offset to balance a change in CO2 concentration, the choice of altitude makes very little difference even though the LW upward forcing varies with altitude. In the vicinity of the tropopause, the forcing is nearly constant with altitude as well as having its maximum value. That and the convention of allowing the stratosphere to equilibrate before calculating forcing make the choice of forcing at the tropopause most appropriate.

        • Here’s the change in upward LW emission for CO2 280-560 ppmv, mid-latitude summer as a function of altitude along with the temperature profile from Archer MODTRAN (version 3).

        • The effect reverses in the center of the CO2 band because temperature in the stratosphere increases with altitude. Absorption of LW radiation in the stratosphere is low so you see a peak form in the center of the band as altitude increases. This has nothing to do with the spectral resolution of the calculation and cannot be applied to the rest of the spectrum as those lines aren’t strong enough to emit a significant amount of radiation.

          MODTRAN, US 1976 atmosphere, clear sky 20 km looking up stratospheric ozone scale = 0
          280 ppmv CO2 7.61136 W/m2
          560 ppmv CO2 9.26928 W/m2

          Spectra (1976 US, all other settings default)
          100 km looking down
          20 km looking down
          20 km looking up

          The hash at around 200 cm-1 is stratospheric water vapor, the peak at ~1000 cm-1 is stratospheric ozone. Note the peak in the center of the CO2 band that is visible at 100 km, but not at 20 km. If that is still unconvincing, I’ll spring for a subscription to SpectralCalc and give you the high resolution data.

        • In the specific case of CO2, forcing at the “top of the atmosphere” (for practical purposes referring to high stratospheric altitudes) is less than at the tropopause, primarily because increasing CO2 causes stratospheric cooling. This has only modest effects on the tropopause, where the 3.7 W/m^2 figure is the appropriate one. The reason that forcing at the tropopause is more useful is that it can be translated into surface temperature changes via either a simple approximation based exclusively on established physics principles, or a modeled response that yields a (slightly) different value based on regional and temporal variations. The TOA forcing is much less relevant to surface temperature change.

          For one source, see Table 2 at Hansen et al

        • IPCC defines radiative forcing to be calculated at tropopause after reaching a new equilibrium in the stratosphere. This value cannot differ from the forcing at TOA at the same time, i.e. in the stratospheric equilibrium, because in equilibrium the energy content of the stratosphere does not change.

          The difference is present only before reaching equilibrium in the stratosphere as it is exactly this difference that is bringing the stratosphere to its new equilibrium. In purely radiative calculations this difference is significant.

        • How long does the model take to reach equilibrium?

        • In simulated hours.

        • IIRC, about 3 months or on the order of 2,000 hours.

        • So the temperature would never get that high due to the rotation of the Earth? Or is that just a method to attempt to determine sensitivity?

        • Jim (below),

          The atmosphere above the surface boundary layer doesn’t vary much on a daily basis. Given that the increase in CO2 in reality won’t be a step function but a slow ramp, the stratosphere will always be very close to radiative equilibrium. There are probably multiple time constants for the surface of the planet because the heat capacity of the ocean is so large compared to the radiative imbalance. Then there’s heat transfer between the surface layer and the deeper layers. The estimated values range from about a year for the land surface to decades or longer for the different layers of the world ocean.

        • Pekka – I would describe the definitions of forcings to indicate that a CO2 doubling would result in about a 2.6 W/m^2 imbalance at the TOA, a 3.7 W/m^2 imbalance at the tropopause, and an even greater imbalance at the surface if all energy transfer were radiatiative. In fact, the surface forcing is much less because of convective transport. Forcings need not be the same at different altitudes.

          The 3.7 tropopause figure is, I believe, calculated after the stratospheric temperature is allowed to equilibrate to the CO2 rise, but before tropopause temperature has responded to the forcing, and so the “stratospheric adjustment” is not the final equilibrium temperature change in the stratosphere.

        • How could the forcing be different at the both sides of stratosphere, when the temperature of the stratosphere is not changing. There is very little other energy transfer between troposphere and stratosphere than radiation and no other energy transfer from stratosphere to space.

          If there is a difference in radiative forcing at the top and bottom of the stratosphere, that means that the energy content of the stratosphere is changing by their difference. This is in contradiction with the assumption that the stratosphere had reached its equilibrium. In calculations of radiative forcing the only temperature changes allowed are those that bring the stratosphere to equilibrium. Thus the conclusion is that the radiative forcing must be the same at the bottom and top of the stratosphere, when stratosphere has reached its equilibrium. I cannot see any way around this proof.

        • Forcings identify the flux adjustment needed to restore balance, and will differ if the fluxes required are different at different altitudes. The easiest situation to visualize would be a hypothetical scenario in which all energy transport from the surface is radiative (i.e., there is no convection). In that case, a 3.7 W/m^2 imbalance at a radiating altitude with a temperature of 255 K would require (via Stefan-Boltzmann) a much higher forcing at the surface temperature of 288 K to restore balance, principally because the emitted flux must be much higher to offset back radiation.

          In the stratosphere, the situation is the reverse, because unlike the troposphere, which must warm to restore balance, the stratosphere will restore balance via a mixture of warming (from below) and cooling locally via dissipation of ozone-aborbed heat, so that the net flux change needed is less.

          I believe that one reason this may seem counterintuitive at first is that we often speak of “equilibrium” when we really mean a steady state. A steady state requires net emitted radiative flux to equal net absorbed flux, but the total upward longwave flux need not be the same at every level, and can vary significantly if downward fluxes are very different.

        • If the fluxes are different at two different altitudes, there is an accumulation or loss of energy between those altitudes. That cannot happen without a change in temperature or latent heat. In equilibrium, as meant in the IPCC definition of radiative forcing, such changes are forbidden. Thus under the defining conditions, the heat flux is identical at all levels of stratosphere. The heat fluxes are also almost purely radiative.

          There are altitude dependent differences in the LW heat fluxes, because there are also differences in SW fluxes, which are important in the stratospheric considerations, but the net flux combining SW and LW must be identical at all levels, where the temperature profile is in equilibrium.

          The slower changes of the troposphere do not influence this argument, because the whole idea is based on the assumption that the stratospheric equilibrium is reached at a completely different time scale from troposphere. The implied idealization states that over the defining time scale the stratosphere reaches full equilibrium, but the troposphere does not change at all excepting the changes in CO2 concentration and radiation.

        • Pekka – You may be confusing net flux with the flux adjustment required by a forcing. The latter can differ at different altitudes. See my example above for the larger forcing at the surface than at the radiating altitude when radiative cooling is the main adjustment mechanism.

        • Fred,
          My comments apply to stratosphere, where radiation is the only important form of energy transfer. There the first law of thermodynamics tells that my claims are correct.

          In troposphere the situation is completely different as convection and latent heat are important mechanisms for transferring energy from one layer to another.

        • Forcings will vary within the stratosphere according to altitude. That is because at the top, the net flux is upward only and is equal to the total flux. At lower stratospheric altitudes, the same net flux will involve both upward and downward radiation, and a larger upward flux adjustment will be necessary in response to the forcing to achieve the same upward net flux.

        • Radiative forcing is the net radiative flux and it must be the same at all layers of the stratosphere as long as the temperature of the stratosphere is constant and there are no other significant energy transfer mechanisms within the stratosphere.

        • Pekka said: “My comments apply to stratosphere, where radiation is the only important form of energy transfer.”

          This cannot be true. If true, it would be impossible to get CO2 “well mixed” across stratosphere without other forms of mechanical movement (and therefore some convective transport of tracers). FYI, the characteristic molecular diffusion time of CO2 is about 1 million years for a 25km layer of air.
          Therefore, something must be wrong with the IPCC canonical scripture regarding processes of atmospheric equilibration.

        • Al,
          Vertical motion is very limited in stratosphere due to the positive temperature gradient. Horizontal flows induce some turbulence and thus more vertical mixing than pure diffusion. This is enough for slow adjustment of gas concentrations but far too slow for producing energy flows that would be significant in comparison with radiative heat transfer.

        • Pekka – radiative forcing is not the net radiative flux, but rather the flux adjustment needed to restore a balance. It can exceed the net flux if it engenders a flux in the opposite direction that it must overcome. That is why forcing at the surface can exceed forcing at the tropopause, because increased upward flux from the surface will be met with an increase in downward back radiation. This condition is not met where convection is a major cooling mechanism (e.g., the tropical oceans), but there is no theoretical impediment to a difference in forcings.

        • Al,

          3.7 to 2.6 W/m^2 is what I get for my radiative transfer model using the 1976 std atm and the Hitran database over about 70 um bandwidth. The 3.7 is at 11km, stratopause. Reasons include lower pressure/narrower line widths up there along with some higher temperatures. It’s also based on a doubling from 330ppm of co2 as opposed to a 1750 value.

          quite frankly, I don’t trust the model that high up because it assumes LTE and I don’t think that is a good assumption.

          as a quick aside, playing with Archer’s modtran calculator, I don’t think it does calculations above something like 70km.

          I have been using my model for other purposes that it was designed for but have not had the time or inclination to enhance it to be more suitable for climate study uses.
          Having a really nice clear skies model is not too relevant when one is dealing with mostly cloudy skies.

      • Jim D,

        Sorry I haven’t been on the thread for a couple of days. Seems a lot has been said in that time…

        It appears that others have addressed some of your points but, yes, a ‘pragmatic assumption’ is still an assumption. Also, do the RT models not assume a constant absorption across bandwidths, and a linear lapse rate? Do the GCMs not use an assumed climate sensitivity, among other assumptions?

        As far as I know, no original model prediction from the IPCC has been anywhere near accurate, and yet they all have used RT models as a basis, or am I wrong in this?

        It may be that RT models are more ‘accurate’ than GCMs, but any small error due to an assumption at the beginning of the process will be magnified as more assumptions are added, will it not?

        Regards,

        AB

        • “Also, do the RT models not assume a constant absorption across bandwidths, and a linear lapse rate? Do the GCMs not use an assumed climate sensitivity, among other assumptions?

          As far as I know, no original model prediction from the IPCC has been anywhere near accurate, and yet they all have used RT models as a basis, or am I wrong in this?”

          I wasn’t sure exactly what was meant by your first two questions, but radiative transfer codes derive absorption coefficients from spectroscopic measurements, and apply appropriate adjustments for pressure and temperature broadening – these are not “assumed” values. For use in climate models, a single lapse rate is not employed, but rather rates that vary by location and season, and tested against observations.

          GCMs make no assumptions about climate sensitivity. That value is an output rather than an input to the GCMs.

          The GCM performance on a global long term basis has been reasonably good, athough that depends on one’s perspective. AR4 WG1 and other sources reveal good concordance of modeled and observational data for hindcasts when GHG forcings are incorporated in addition to natural variability, and a lack of concordance when only natural variability is included. These models, although tuned to starting climates, are not retuned to bring them into conformity with observed trends, and so the concordance is a test of model skill. They remain imperfect, more so on short term and regional scales than globally, but the results demonstrate that deviations from a completely accurate representation tend to diminish rather than increase as the model timeframe is increased from years to multiple decades.

        • For use in climate models, a single lapse rate is not employed, but rather rates that vary by location and season, and tested against observations.

          Is the lapse rate at each location not a result of the model resulting from its equations based on knowledge of physics and thus not external input or constraint?

        • Fred,

          You’re quite right abut climate sensitivity, that was a typo on my part. I meant the value of radiative forcing.

          Thank you for your reply. I agree the accuracy of the GCMs is very much dependent on perspective, and I’m not sure that lauding the accuracy of hindcasts is a particularly strong argument, but that’s just my opinion. I daresay that the accuracy of the IPCC scenarios will be better assessed after several more years. IMO we do not appear to be on track for a ‘best estimate’ of 3 deg C by 2100. There is no indication of an acceleration in the warming, which I suspect would be forthcoming if the radiative forcing theory is correct.

          I think you may have missed the question I posed you further up this thread regarding the contribution of CO2 to the greenhouse effect. I’ll try to precis it here:
          If the A Lacis estimate of 20% contribution (by CO2 alone) is accurate, how come the observed increase since 1850 from an increase in CO2 of 40% (appx) is only a portion (what portion is unknown) of 0.8 deg C?

          I have now read quite a bit on this subject, but can’t get an answer to this, which seems to me to be crucial. If 280 ppm in 1850 makes such a large contribution, how can a significant increase to 395 lead to such a small measured increase?

          Intuitively, I feel the radiative forcing theory makes sense until you try to quantify it. I agree there should be some warming effect but it is the size of the ‘some’ that leaves me confused. To attribute such a significant effect from a tiny amount of radiative gas(es) doesn’t make sense. Allocating a larger contribution to water vapour and a smaller one to CO2 would makes sense.

          Regards,

          AB

        • The MODTRAN calculation for constant relative humidity gives a surface temperature offset for 280-390ppmv CO2 change of 0.68 C for the US standard atmosphere, clear sky. The forcing is proportional to the logarithm of the ratio of initial and final CO2. So a 0.7 C change is actually in the ballpark. If you factor out ENSO by using a 786 month (65.5 year) moving average of HADCRUT3 you get something that looks very much like the CO2 concentration curve. Unfortunately, the math of a moving average filter means that the plot ends in 1977 and the delta T is about 0.4 C. Then there’s the probable reduction in forcing from anthropogenic aerosols. Unfortunately, the aerosol data and calculated forcings are not anywhere near as reliable as the ghg data.

        • DeWitt,

          Thank you for that info. So, it appears to me that you are saying the 0.8 C warming since 1850 is due entirely to the increase in CO2 since your calculations – assuming constant relative humidity and no clouds – so closely match the observed data. Is this true? If so, the climate sensitivity would be roughly in the order of under 2 deg C, yes?

          Just out of interest, what will be the doubling from 560 to 1020 ppmv?

        • I responded upthread.

        • Fred,

          Yes, I’ve got that response now, thanks. I know I’ve asked it before but the answer “it’s because of the log effect…” isn’t really enough to explain the difference, is it?

          You’ve stated that the climate sensitivity from CO2 is 1.2 deg C (including regional differences). That’s one heck of a log effect from appx 6.4 deg C at 280 ppmv.

          So, same question as I asked DeWitt, what would be warming from the next doubling? As it would appear to be much less than 1.2 C, what is the problem?

          AB

        • Arfur – The 1.2 C response is in the absence of feedbacks, the absence of negative forcings from other climate phenomena, and after a very long equilibration interval. Please see my earlier answers for other details. There is no inconsistency with observed data.

        • Arfur, the lapse rate assumption is only needed for the idealized no-feedback situation on which there was a whole thread. This is just to give a basic measure with which actual feedbacks can be compared, and convention dictates that the lapse rate is kept constant to make this no-feedback response a well defined quantity.
          As mentioned by JC introducing the first RT thread, the RT model is one of the most certain parts of the physics, and is highly verified by data. If you are looking for causes of errors in IPCC projections, I would say look at other parts of the GCM, like clouds and aerosols, not the RT model.

        • Jim D,

          Ok. Will do. I have thanked you for your help in a post below.

          One point, however. There are unlikely ever to be any linear lapse rates from the surface to the TOA in reality, so allocating one for an idealized situation is probably misleading, even as a comparison. In reality, the environmental lapse rate is hardly linear over any significant vertical extent. The adiabatic lapse rate is compared with the environmental in order to give an idea of the ‘stability’ of the atmosphere (O/T, I know).

          Regards,

          AB

        • Lapse rates are not computed to the TOA – that wouldn’t make sense, because they are roughly linearly positive throughout most of the troposphere, approach zero at the tropopause, and then turn negative in the stratosphere due to the abosrption of solar UV by ozone. For tropospheric forcing estimates, a single linear lapse rate assumption provides a good approximation, yielding a no-feedback temperature rise for doubled CO2 of 1 deg C. Models that incorporate regional and temporal deviations from that assumption yield a slightly higher value of about 1.2 deg C.

          It’s also important not to interpret deviations from a dry adiabat as signifying a highly non-linear lapse rate. Latent heat transport can modify the lapse rate in the direction of a moist adiabat without radical departures from linearity. Some non-linear responses to radiative forcing are also brought back toward linearity by convective adjustments.

        • Fred,

          See me earlier response. Why does your 1.2 deg C estimate differ so much from the IPCC best estimate? It seems that you are quite happy to make approximations with the lapse rate. Maybe I’m under a misunderstanding but why to do you allocate the term ‘negative’ to the tropospheric lapse rate when it cools with altitude? The adiabatic lapse rate is not linear either as it is dependent on water vapour content.

          AB

        • The 1.2 C estimate is in line with the range of values cited by the IPCC and other sources – from 1 C to 1.2 C in the absence of feedbacks.

        • Fred,

          Please cite your IPCC source for 1 C – 1.2 C. Here is my source:
          http://www.ipcc.ch/publications_and_data/ar4/syr/en/mains2-3.html
          Here is a quote from the first paragraph of 2.3:
          [Progress since the TAR enables an assessment that climate sensitivity is likely to be in the range of 2 to 4.5°C with a best estimate of about 3°C, and is very unlikely to be less than 1.5°C.]

          Are you saying that the extra forcings you quoted above are likely to increase the sensitivity? To get the ‘best estimate’ of 3 deg C, that would mean the extra forcings (both positive and negative) would have to amount to a positive 1.8 deg C which is much larger than the original sensitivity!

          And please tell me where the observed data supports the theory and IPCC scenarios.

        • Yes, the IPCC correctly states that current estimates of climate sensitivity to doubled CO2 range from 2 to 4.5 deg C. I don’t believe you will find that I ever stated otherwise. Estimates of sensitivity if feedbacks are ignored are in the 1 to 1.2 C range.

        • Fred,

          Exactly. So, just to be sure, are you therefore saying that the feedbacks are more than the original sensitivity? Hence ALL the feedbacks – both positive and negative – amount to a relatively large positive overall. Yes?

        • That’s correct. It has been discussed and referenced in detail in these various threads. Rather than engage in still further repetition of material you can review for yourself, I would recommend that you read the Soden and Held paper I cited earlier for one informative source on the net positive feedbacks.

        • To answer your other questions, tropospheric lapse rate is defined as positive because the temperature “lapses” (declines) with altitude. If it’s adiabatic, it will be linear, based on the gas laws. Water vapor may change the lapse rate without necessarily rendering it non-adiabatic. In reality, the “lapse rate” feedback, which is negative, tends toward shifting the dry adiabat toward a moist adiabat. However, the actual lapse rate varies depending on latitude and other factors, and may not follow either adiabat strictly.

        • Fred,

          Thanks for explaining why you use the term ‘positive’. I had not heard it referred to as such.

          As for linearity, the adiabatic lapse rate will only be linear when the relative humidity is fixed – which is very rare and usually short-lived. ‘Dry’ air adiabatically cools at 3 deg C/ 1000 ft and saturated air cools at appx 1.5 C / 1000 ft due to latent heat offset. The environmental lapse rate is, again, hardly ever linear. It is the comparison of the two lapse rates that gives rise to the meteorological stability of the atmosphere. This stability changes pretty much all the time, except over certain areas of constant ‘source’ values.

          I appreciate this is slightly O/T but I mention it to point out that talk about adiabatic lapse rate in the climate debate is not terribly relevant, as it requires too much approximation.

        • The moist adiabatic lapse rate will vary depending on humidity (RH), but at any given relative humidity value, it will be linear – Lapse Rates

          RH has been shown to be relatively constant within the free troposphere, and so near linearity is likely in many regions, and probably as a reasonable approximstion globally. Models address variations from this principle.

        • Exactly – again! So there are certain (not many) regions where the RH may be ‘relatively constant’ but only in those regions will the adiabatic lapse rate will be ‘near linear’ but you are happy to make a ‘probable reasonable approximation’ on a global scale. Models therefore address variations on the principle of ‘probable reasonable approximations of at least this one small factor in the climate debate.

          And you wonder why I question the validity of models?

          Add this to your point above about the relatively large part played by feedbacks (which are mostly approximated in models) compared to the no-feedback sensitivity and you might see why some of us are sceptical.

          I note, by the way, that you have not answered my question about the next doubling of CO2 if the log effect argument is continued. You aren’t alone. Nobody else answered it either.

        • Arfur, Can we summarize the argument so far to see which part you are having trouble with?
          1. Doubling CO2 gives a warming of about 1 C with no feedback.
          2. Adding feedback gives 2-4.5 C according to theoretical and modeling estimates.
          3. The majority of this, and some of the uncertainty in the number, is due to the water vapor feedback.

        • Your statement about lapse rates remains incorrect, Arfur. On a global average, linearity is a good approximation, and one can simply differentiate the Stefan-Boltzmann equation in conjunction with the assumption of a single linear lapse rate to yield a “no-feedback” value for CO2 doubling of 1 deg C – no models are involved. The models utilize observational data as inputs in deriving a value of 1.2 deg C, based on variations from the single linear lapse rate assumption. Nevertheless, linearity as a global average for the free troposphere is well supported by observational data. Observational data also verify the constancy of relative humidity throughout most of the troposphere, not merely in “certain regions” – it’s the rule, not the exception. High altitude observed deviations from constancy alter the magnitude of water vapor feedbacks slightly, but the effect of these deviations is small.

        • Fred,

          Firstly, which statement I made about adiabatic lapse rates is incorrect?

          Secondly, you say:
          [“Observational data also verify the constancy of relative humidity throughout most of the troposphere, not merely in “certain regions” – it’s the rule, not the exception.”]

          Please tell me which observational data verifies your assumption that RH is constant throughout the troposphere. As far as I am concerned, that notion is absurd. Other than certain single source regions, RH is never constant throughout the troposphere.

        • Fred,

          And you still haven’t answered the question about the next doubling of CO2 if the log effect argument is continued…

        • Jim D,

          [Arfur, Can we summarize the argument so far to see which part you are having trouble with?
          1. Doubling CO2 gives a warming of about 1 C with no feedback.
          2. Adding feedback gives 2-4.5 C according to theoretical and modeling estimates.
          3. The majority of this, and some of the uncertainty in the number, is due to the water vapor feedback.]

          Not really mate. IF you look at the very top of this thread, you will see that I asked for real-world data on what contribution CO2 made to the GE. This has been pretty much ignored.

          Now to my problem with the feedback issue (although I realise this is a deflection): If you want to assume the no-feedback sensitivity is 1.2 C – that’s fine. If you want to assume the feedback sensitivity is 2-4.5 (3 = best estimate) that’s fine too. However, these are all based on models. In the real world, the temperature increase since 1850 is – wait for it – just 0.8 C in 160 years. This includes ALL feedbacks and ALL forcings, and has been contemporaneous with a 40% increase in CO2 and, from memory, a 65% increase in Methane. Even if you assume (that word again) ALL of the 0.8 rise is due to increases in ghgs, the with-feedback sensitivity will be less than 2 C. The reason normally given for this anomaly is ‘negative forcing of aerosols’. My point is: If the radiative forcing theory is so good, why isn’t the temperature increasing to the extent forecast by the models? Also, why can’t anyone give me an answer to the ‘contribution of CO2’ question at the top of the thread? Also, if the radiative forcing theory is accurate, why is there no acceleration in the temperature rise. And, finally, why is everyone so worried about the cAGW theory when the pro-AGW camp seem to be so sure that the effect is logarithmic? The meagre warming observed so far – I repeat including all feedbacks – is only gong to get progressively weaker if the log effect is true.

          Sorry Jim D, I know you have tried to be balanced about the information you have provided, but the statement I made which Dr Curry has quoted at the top of this thread has simply NOT been addressed, in spite of thousands of words from very clever people since the thread opened.

          Regards, AB

        • I believe your questions have been answered satisfactorily, but I should have clarified my statement about the constancy of relative humidity (RH), which both observations and models show to change little within the free troposphere despite changes in radiative forcing. This does not mean that RH is the same at every altitude. As I mentioned in an earlier response, the lapse rate declines to zero at the tropopause – it’s certaintly not linear there – but at the lower altitudes where forcing most affects changes in outgoing radiation, a global averaging replicates a linear relationship sufficiently so that it can be expressed as a series of mean values that vary with latitude and season. Despite your skepticism, the Soden and Held reference illustrates the point that no-feedback calculations assuming a single, linear lapse rate yield values that do not differ greatly from modeled values incorporating deviations from that assumption in terms of linearity when averaged globally. An earlier example of the results of averaging is at Atmospheric Lapse Rates . This process does not preclude deviations from the average at individual locations.

        • Arfur, you want real-world data to show the effect of CO2, but while there is a lot, it is in the form of measuring the atmosphere’s emission spectrum from space and seeing the CO2 signature at the level expected from AGW theory. Given that the CO2 is there and having the expected effect on the earth’s energy budget, the theory is on a firm foundation of observations, at least for the scientists who understand the implications of these measurements. the gap is in getting the public to understand such measurements and their implications. MODTRAN is a good tool to understand this better. I could also point you to papers that quantify the total greenhouse effect of CO2 at 20 W/m2, but again not meaning much to the average member of the public. What kind of observation would you like to see, or is it just understanding more about the plentiful existing ones?

        • RH has been shown to be relatively constant within the free troposphere

          In Estimates of the Global Water Budget and Its Annual Cycle Using Observational and Model Data, Journal of Hydrometeorology, 2007, Trenberth et al write on p. 760, “The strong relationships with sea surface temperatures (SSTs) allow estimates of column water vapor amounts since 1970 to be made and results indicate increases of about 4% over the global oceans, suggesting that water vapor feedback has led to a radiative effect of about 1.5 W m 2 (Fasullo and Sun 2001), comparable to the radiative forcing of carbon dioxide increases (Houghton et al. 2001). This provides direct evidence for strong water vapor feedback in climate change.”

          In light of this, and given the 0.5 °C of global warming since 1970, is the increase in water vapor needed in order to maintain RH at a constant level equal to the observed 4% increase over that period?

          (If anyone feels that raising a question like this on a blog like this is like trying to trade securities at a flea market, you’ll find no argument from me. And if it seems like a rhetorical question to you, you’re almost certainly not one of the deniers here, who couldn’t calculate their way out of a mosquito net.)

        • This is a really big issue that needs much more attention. this is definitely a topic i want to take up at some point, but i am falling sooooooo far behind in my list of topics.

        • Fred,

          YOu may be surprised to learn that I do not consider my questions have been answered satisfactorily!
          I am glad that you have had a re-think about what you said regarding the ‘RH being constant’ but, if you want to accept that Soden & Held think its a good idea to approximate a constant RH in order to give confirmation that water vapour is the largest feedback, then fine, as long as they also realise it is yet another approximation in a long line of approximations and estimates and assumptions that are made in GCMs in order to provide climate scientists with the wrong answer.

        • Jim D,

          Thank you for engaging with me on this.

          You say:
          [Arfur, you want real-world data to show the effect of CO2, but while there is a lot, it is in the form of measuring the atmosphere’s emission spectrum from space and seeing the CO2 signature at the level expected from AGW theory. Given that the CO2 is there and having the expected effect on the earth’s energy budget, the theory is on a firm foundation of observations, at least for the scientists who understand the implications of these measurements.]

          Yes, I do expect real-world data in order to answer my question at the to of the thread.

          I repeat: so far, no-one on this thread has done so.

          Please allow me to elaborate on the illogicality and you may understand more clearly why I keep asking the question:
          In the absence of real-world data, climate scientists have decided to use whatever method they like (subjective term) in order to demonstrate (not prove) the veracity of the cAGW theory. In the case of A Lacis, the figure for the contribution of CO2 to the GE is 20%. 20% of 32 deg C is 6.4 C. Currently, 20% of the current GE (appx 33 C) is 6.6 C. This is after a 40% increase in CO2. The total increase from 32 to 32.8 deg C (appx figures) had been measured over 160 years. When I ask the question ‘How can you rationalise the relatively small increase in global temperature with such a relatively large increase in CO2?’, the answer I get is usually ‘its due to the log effect’. So my next question is:
          If the initial 280 ppmv CO2 can contribute 6.4 C to the GE in 1850, and the 40% increase can give only another 0.8 C (assuming ALL the warming is due to CO2) and the effect is logarithmic, how are we ever going to get ‘rapid and accelerating global warming’ that is indicated by the cAGW theory as it has been portrayed to the public?
          The warming observed so far is meagre, and a logarithmic effect is only going to progressively reduce the warming if the radiative approach to AGW is correct.

          Jim D. I know I’m just a layman. But I want you to honestly tell me if you think the question is invalid or ‘stupid’. I keep asking but no-one addresses the question that Dr Curry quoted in the OP. If the answer is out there (and not just based on models), then I am politely asking for someone to produce it.

          It’s as simple as that. Thanks.

          Regards,

          AB

        • Arfur – In a different thread, you persisted in asking Vaughan Pratt the same questions multiple times. He answered patiently over the course of multiple exchanges, but finally concluded that “I think you’re just pulling my chain”. I have the same impression here. I and others have responded to your questions accurately, completely, and consistently, and it is hard to believe that your persistence reflects a genuine curiosity. If it does, review our statements for genuine and correct answers. I don’t believe many other individuals, if any, are interested in these exchanges in the middle of a very long thread, so if you have no interest in learning, you are probably wasting both your time and ours. I will be pleased to change my view on this if you can proceed past these repetitions and bring forth some new food for thought reflecting legitimate climate science uncertainties. Otherwise, I will probably refrain from further exchanges on the assumption that no-one will be paying attention.

        • Dr Curry,

          I appreciate you have many posts to catch up on. Please note my post above to Jim D.

          In my opinion, the quote (from me) you used in the OP of this thread has simply not been addressed. I agree with you that this is a big issue and I welcome further posting from you in order to hopefully gain some closure on what I consider to be a core issue in the climate debate.
          I am not a scientist but my question is not simply about science. It is about logic and common sense. As a layman, I believe science should ultimately make sense.

          Thank you for your time. If you feel that I am making a nuisance of myself I will gladly make no further contribution on this thread.

          Regards,

          AB

        • Fred,

          I thank you for your time.

          I wish you all the best.

          AB

        • In my previous reply I meant 20%, not 20 W/m2, in case anyone was wondering where that number came from.

        • Arfur, one aspect of your question is: how can the effect of CO2 be accelerating when it goes as a log of CO2? I know Vaughan Pratt addressed this mathematically on a previous thread, but I will review it again here. In the 1800’s, CO2 was quite flat at 280 ppm. Currently CO2 is increasing exponentially with time away from 280 ppm, with a time-scale of about 33 years to double the difference from 280. Its effect on temperature goes as log (CO2), so we have a function like T goes as log(280+b*exp(t)). As time gets very large this goes towards log(exp(t)) which is linear with time. Currently we are transitioning from flat to this linear function which may eventually have a gradient of 7.5 K/century if CO2 keeps growing exponentially past 2100 (which it won’t). But the point is that the gradient is increasing from the current 0.2 C/decade to maybe 0.35 C/decade by 2050 and 0.6 C/decade by 2100, all this with the log function.

        • Jim,
          When calculating the development of radiative forcing, you must consider at least one feedback explicitly, the increase of temperature that has occurred during the period of increasing GHG concentration. The warming is fast enough comparing to the increase in GHG to move the temperature closer to the balance where all RF is canceled until further GHG emissions lead to further warming than to the original value, where the warming had not even started.

          According to estimates of Fasullo and Trenberth (Fig 4 in Trenberth’s 2009 paper) this negative feedback is presently -2.8 W/m^2, while non-feedback forcing is +1.6, all other feedbacks +2.1 and the total forcing maintaining the present warming +0.9 W/m^2 with an uncertainty of 0.5 w/m^2.

          To conclude: RF increases if the additional warming from increasing GHG and other feedbacks is faster than the negative feedback from the higher temperatures. With an accelerating rate of emissions this is going to happen, but the calculation is more complicated than the one that you gave.

        • Jim D,

          Thank you for clarifying your ’20 W/m2′ quote. If you really have a paper which provides real-world quantification of the contribution made by CO2 to the Ge, then I would love to see it.

          Your reference to Vaughan Pratt’s mathematics does not match my recollection. My recollection is that his use of 1.40 Lb should have given a warming of 1.46 C for a 40% increase in CO2. This is almost double what the observed data tells us, so please excuse me if I don’t accept it as real-world truth.

          Now to your latest post…
          It was my understanding that the ability of CO2 to absorb radiation was under a logarithmic law, not its effect on temperature. For that to be true, the radiative theory would have to be absolutely and measurably correct. But lets assume it is.

          According to your 20% contribution, CO2 was responsible for appx 6.4 C out of 32 C back in 1850. If this is your ‘baseline’ of 280 ppm, then your theory should be able to explain why a 40% increase in that ghg has only amounted to a warming of less than 0.8 C. The Vaughan Pratt lb 1.40 calculation is measurably incorrect. And even then it assumes that ALL of the warming is due to CO2.

          Your explanation of the exponential increase is also not supported by observation. Your comment…

          [” Currently we are transitioning from flat to this linear function which may eventually have a gradient of 7.5 K/century if CO2 keeps growing exponentially past 2100 (which it won’t). But the point is that the gradient is increasing from the current 0.2 C/decade to maybe 0.35 C/decade by 2050 and 0.6 C/decade by 2100, all this with the log function.”]

          …is supposition. The current 0.2 C/dec’? Now the debate turns full circle – you are selecting a short-term period from c1980 to 2000 to give that figure. It entirely depends how you define ‘current’ and you know it. The overall trend since 1850 is 0.05 C/dec, so your prediction of 7.5K/century is, in my opinion, nothing more than speculation based on assumption. There is absolutely NO evidence to suggest the warming will trend at ‘maybe 0.35 C/dec by 2010 and 0.6 C/dec by 2100’.

          The problem is simple. The pro-AGW lobby cannot explain the incompatibility in the expectation of ‘rapid and accelerating’ warming back in the early days with the reasoning of ‘its the log effect’ to explain why the rapid and accelerating warming has not happened. The two are mutually exclusive.

          Regards,

          AB

        • Pekka, yes, I simplified it by not considering the complexity of the lag of the temperature change. I only used 2.5 degrees per doubling instead of a higher number that is associated with the equilibrium temperature, so this lower number accounts for the delay. I did not choose 2.5 at random, but because its gradient fits the last century quite well, especially since 1980.

        • Arfur, the 20% is an example from a paper by Schmidt, Ruedy, Miller and Lacis (JGR, 2010). Perhaps you can find it with Google Scholar. It makes this estimate with a radiative transfer model. 20% isn’t temperature, but longwave energy associated with the GE, which is about 30 of 150 W/m2 total.
          I put the warming at 0.8 C from 1900-2000, of which 0.9 C is CO2, 0.2 C is solar from 1910-40, and -0.3 C is from aerosol haze growth from 1940-1975, but that’s just my accounting. It all fit the 2.5 C per doubling rate that we can extrapolate to a 3.5 C increase between 2000 and 2100.

        • Jim D,

          Thank you.

          As I suspected, you do NOT have any real-world data to support the ‘CO2 gives a 20% contribution to GE’ hypothesis. The 20% is, in fact, an estimate based on a model. This is not real-world data, however you wish to portray it. The pro-AGW lobby come up with an estimate, treat it as fact, then build a prediction based on their assumption. Then, when the actual observed data does not match their prediction, they come up with further assumptions to try to explain the difference. Unfortunately, the tidal wave of ‘consensus science’ always breaks apart when it meets the solid rock of logic.

          Your reference to the Lacis paper is exactly why I asked the question quoted by Dr Curry at the OP to this thread. You really can’t make the statement “CO2 contributes 20% of the GE” and then say “the 20% is not temperature…”. 20% of the greenhouse effect IS a temperature because the Greenhouse effect is portrayed as a temperature figure. If it’s not at least portrayed as temperature, how can you possibly know what effect an increase in CO2 will make on the global temperature (GE)?

          Now to your calculation of 0.8 C. I’m not sure why you would pick 1900 as your start point when the anthropogenic effect starts in 1850 as quoted by the IPCC. Use whatever relevant and available data set you like, the figure is appx 0.8 deg C in 160 years. So, your calculation takes into account the positive factors of CO2 and solar (from a selected period) and the negative factor of aerosols. However, you forget that the 0.8 C rise is inclusive of ALL factors and feedbacks and yet water vapour does nto figure in your calculation. You allocate 0.9 C to CO2 – based on what? For all you know – and Fred spent a long time telling me that water vapour feedback was the main positive feedback (which I agree with, by the way) – the contribution of CO2 to the 0.9 figure is only 0.1 C and the rest is made up of water vapour feedback!

          Finally, you then finish by stating “it all fits with the 2.5 C doubling which we can extrapolate to 3.5 C between 2000 and 2100”. Why can you extrapolate such? Not only does the observed warming not support the initial figure of 2.5, according to the much lauded log effect the warming figure should decrease, not increase, making your predicted figure of 3.5 even less likely! This is just one of the core illogicalities of the radiative approach to the climate debate. You really can’t eat your cake and have it.

          AB

        • Arfur, there is a field of science called physics that provides us with all kinds of things including radiative transfer theory. If you choose not to believe in some chosen aspects of physics I can’t help you. It is real-world measurements of radiative transfer that support these models, and having locally confirmed the models, those models can then be used to predict global effects that we can’t hope to measure globally. So you should be asking for validation of radiative transfer models, not direct validation of 20% CO2 effect that comes from them? The former proves the latter, and the latter can’t be measured without a global three-dimensional radiation network. Thankfully our knowledge of physics makes such measurement redundant and unnecessary.

          Now for the 0.9 C issue. This does, of course include all feedbacks, mostly water vapor. CO2 by itself would produce less than half that with a 40% increase.

        • Jim D,

          There’s no point telling me what I should be asking. I’m asking the questions I want answered. The fact that the question invokes an answer that you [“can’t hope to measure globally”] hasn’t stopped you or any other pro-cAGW proponent from making such predictions and then portraying these predictions as ‘settled science’. The real-world data does not support the predictions.

          As to your 0.9 issue. You stated that 0.9 C warming was due to CO2. I quote: [“I (ie Jim D) put the warming at 0.8 C from 1900-2000, of which 0.9 C is CO2, 0.2 C is solar from 1910-40, and -0.3 C is from aerosol haze growth from 1940-1975, but that’s just my accounting. It all fit the 2.5 C per doubling rate that we can extrapolate to a 3.5 C increase between 2000 and 2100.
          No mention of water vapour and, when I point out this fact, you now decide to include it. Hmm. The dates are actually 1850-2010 (gives 0.8 deg C warming), although its sweet of you to try to reduce the time period to make the warming seem more intense. The 0.8 does include all forcings and feedbacks, which means we are currently falling woefully short of your 3.5 ‘guess based on models’.

          40% of 0.9 is 0.36. Due to the log effect which you pro-cAGW guys keep telling me about, the next 40% will be less than 0.3 C, which means that the no-feedback sensitivity will be even less than the 1 – 1.2 C oft quoted by Fred Moolten.

          Sorry Jim D, the planet just does not support your radiative-theory-based predictions. If this is an example of your ‘physics’ world, you’re welcome to it. I will continue to live in the real world.

          AB

        • Arfur, if you don’t think radiative transfer models have been verified by real-world data, you need to research that first. Maybe you believe in molecules and photons, so I would start there if you want something more fundamental.
          On temperature, my 0.8 degrees comes from GISS which has -0.6 just after 1900 and +0.2 just after 2000.
          The water vapor feedback would not occur without the CO2 forcing, so it is correct to attribute it to CO2. Note that the solar and aerosol effects are also amplified by feedbacks in a similar way, so their relative contributions are the same.
          I explained the log effect before. Basically CO2 is increasing close to exponentially, more than canceling the slow log effect. Did you think CO2 has been increasing linearly?

        • Arfur Bryant

          Jim D,

          The radiative transfer models form the basis of the GCMs. As you have said yourself, the feedbacks are the area where the main areas of uncertainty lie. Any small error in the radiative models will be enlarged by the feedback uncertainty. The real-world data does not agree with the predictions made using the GCMs. If you can’t see this, you need to research it.

          Your 0.8 from GISS is not argued, although your figures (-.06 to +.02) do not match the data here…
          http://data.giss.nasa.gov/gistemp/tabledata/GLB.Ts+dSST.txt
          …however that may be due to a difference in baseline. My point was that the difference between 1850 and 2009 is 0.8 (I use HadCRU which goes back to 1850), which is a larger time period than your 1900-2000. It therefore gives a more comprehensive picture since the IPCC’s start date of anthropogenic warming. IMO, your use of GISS is just cherry-picking.
          You say:
          [“The water vapor feedback would not occur without the CO2 forcing, so it is correct to attribute it to CO2.”]
          Jim D, I can’t believe that you really think that. It is not correct. There would be the no-feedback contribution of CO2 and the with-feedback contribution. It is most disingenuous for you to suggest otherwise. This would then lead to the area of uncertainty in the GCMs.

          Whichever way you look at it, the 0.8 C in 160 years is far smaller than the warming predicted by the IPCC using the GCMs.

          As for CO2. I do not say the increase is linear, but I disagree it is exponential either. Here is the data from Mauna Loa:
          ftp://ftp.cmdl.noaa.gov/ccg/co2/trends/co2_mm_mlo.txt
          The 1958 amount is 315 ppm, and the 2010 amount is 390 ppm. If you plot the graph the line is neither linear or exponential. Try it. Unfortunately for your ‘exponential increase cancels the log effect’ argument, the lack of significant warming – again – does not support such a hypothesis. If the radiative forcing theory was as firm as you contend, the temperature would be warming at a ‘rapid and accelerating’ rate. It is not. Your ‘consensus science’ just doesn’t make sense. Your arguments are becoming more complex, but the real world remains stubbornly intransigent to them.

          AB

        • As I think we’re the only two on this Radiative transfer discussion thread, I’ll continue at the bottom by replying to the main post so that we get the Reply button in a more convenient place. However, I hope we are close to concluding this as it has now run over into another year.

        • Perhaps I should add that my above message refers to the temporal development of radiative forcing and to the related rate of change of temperature. Looking only at the total equilibrium change in temperature, the calculation of Jim D is correct as an approximation good enough for the present argumentation.

        • Jim D,

          I should elaborate that the 1.46 C warming I quoted re Vaughan Pratt was for the consensus 3 C climate sensitivity.

        • Sorry, that should have been ‘why do you NOT allocate the term ‘negative’ to…

          Doh…

        • Arfur, I didn’t want to give the impression that a linear lapse rate is used, just that the lapse rate is taken as the same after adjusting to doubling CO2 as before. That is, you add the same temperature to all layers such that you balance the CO2 effect. Ideally you would not do that in the stratosphere, because in reality it cools, but decoupling the stratosphere makes it a two-body system which is harder to solve without further assumptions.

        • decoupling the stratosphere makes it a two-body system which is harder to solve without further assumptions.

          One thing physicists and marital counselors agree on is that three-body systems are much harder to solve than two.

        • Jim D,
          The problem of defining what “no-feedback” means at the tropopause makes me wonder the value of the whole concept. For me no choice is more natural than another that leads to significantly different results.

          If it would be consistent to assume an equal increase of temperature for the whole atmosphere including stratosphere, that could perhaps be described with some justification as the natural way of defining “no-feedback”, but making a distinction between the troposphere and stratosphere opens new questions concerning their connection at tropopause.

          Should the temperature minimum occur at the same altitude or at the same temperature? Neither is an obvious natural choice, but they cannot both be true at the same time without changing the lapse rate.

          I guess that the common choice is to let the tropopause temperature to rise, but is this natural from basic principles, if the stratosphere is assumed to cool at the same time.

          An increase of 1.2 C in the surface temperature leads to an increase of about 1.6% in the radiation from surface at the wavelengths of the atmospheric window. Thus the direct radiation from the surface to space increases by about 0.6 W/m^2 at wavelengths not affected significantly by the increase of CO2 in the atmosphere. This is only small fraction of 3.7 W/m^2, which means that most of the increase in outgoing LW must originate from troposphere. This in turn implies that somewhat arbitrary choices in defining “no-feedback” have a large influence on the conclusions that concern this artificial concept.

          What happens in the real atmosphere is of course not affected at all on, how we define artificial concepts.

          For radiative forcing the problems related with its artificial nature seem to be much less. Leaving the tropospheric temperatures completely unchanged is a more natural (sic.) artificial concept than any choice possible for “no-feedback sensitivity”.

    11. The point again of this question to Arfur Bryant, is that if people just don’t trust radiative transfer models such as MODTRAN, the climate debate is sidetracked into the areas of spectroscopy, quantum mechanics and thermodynamics, far removed from climate. While this basic, but graduate-level, physics is interesting to explain to people, it seems there is no end to the whys and hows, and I don’t see how to resolve this for everyone. This is why I keep saying let’s start with MODTRAN and such radiative transfer models as a given. They come from an established and independent area of science, and are used in practical applications, not just theoretical, which should be enough.

      • Jim D writes “They come from an established and independent area of science, and are used in practical applications, not just theoretical, which should be enough.”

        Just because radiative transfer models can solve “practical applications”, does NOT mean that they are suitable to estimate change in radiative forcing.

      • And I say don’t start with them as a given. Don’t assume that the Radiative Forcing Theory is correct in a quantitative sense before you start using it to start a snowball rolling down the hill.

        Its a theory. If you can’t allocate a quantity to it accurately, use the measured data to test the theory before you start issuing advice to policymakers.

        AB

        • For this non-climate scientist, but physicist the theory of radiative transfer is a well understood and thoroughly tested theory. The details can always be made more precise, but only at a level that has very little effect on the final results.

          This is a theory that satisfies all requirements that one can demand of a well established physical theory. It is puzzling to me, how this can still be contested so widely.

          Why can the scientist not communicate any better, what is well known and where the uncertainties remain large? Perhaps there are people on both sides of the barricade, who believe it favorable for their cause to keep the arguments at the lowest level, but for me it really does not make sense. For the scientists this allows for avoiding more difficult issues, and for the other side it may feel good to deny every claim by scientists.

        • There was discussion earlier that the models follow the theory well in terms of how accurately the radiative transfer equations are solved.

          Do we have any error estimates, including all coefficients and parameters used, when applying this theory in climate models, and how the output compares with out ability to measure. In my mind we would need to have quite accurate temperature gradient modelled, if we are to calculate the effects of radiative transfer in the atmosphere; isn’t it so, that the intensity of the radiation is related to T [K] in fourth power? Wouldn’t that mean, that being a couple of degrees off, say at the surface, might result in forcing error in the order of projected change due to CO2 increase. (Quick calculation, e.g. 273-275K means 2% difference) Is this correct?

          Also what would be interesting to see, what the error margins are after, say, 10 years of simulation run, and how well to they compare for instance with measured OLR. I do realize that this is very hard, even impossible and also potentially meaningless, but I have found it quite disturbing, that we are not able to give pretty much any error estimates on the model outputs, in which some people seem to put so much trust, even enough to drive global politics.

          Concerning the large-scale experimental validation of these equations, as far as I can tell, the predicted changes so far are in the range of 1…5 Wm-2m. Suspiciously (pun intended), they are not directly measurable given the level of accuracy and limitations of satellite instrumentation; in another words, we are still somewhat unable to measure the changes this theory predicts. Having studied some university-level physics in the past, I have no reason to doubt these equations, but I have some reservations about it’s application in modelling in global and decadal scales, given at least the notion that we must have accurate picture of absolute temperatures – world wide – too. (Which partly brings us to the discussion about initial value sensitivity, but let’s not dig into that.)

        • Your proposal involves much more than radiative transfer calculations. Radiative transfer calculation is done for a fixed atmosphere. It is fixed to be reasonable close to the real atmosphere and it is possible to test, how sensitive the results are to the details of the assumed atmosphere.

          Based on work of Myhre and others, it appears that the resulting radiative forcing is not very sensitive to details as long as the model atmosphere is even remotely realistic. In particular, Myhre concluded that good results can be obtained by performing the analysis at three locations only and weighting them appropriately in estimating the radioative forcing for the whole earth. Certainly one can improve on such simplified calculations and certainly more detailed calculations have been done, but I have understood the results do not change much. Thus the uncertainty of the radiative transfer calculation is much smaller than the uncertainties of the other stages in the estimation of global warming. The uncertainty in radiative forcing may be 10%, the uncertainty of climate sensitivity including feedbacks is more than 50%.

          Calculation of the increase of the heat content of the oceans requires taking into account the changes in the surface temperatures and in the atmosphere over the whole period. Thus the analysis could be done retrospectively, when all these changes are known. Then it is possible to calculate the development of the radiative forcing over this period and check, whether the results are consistent. Such consistency checks can be done when sufficient historical data is available on the heat content and the atmosphere. Reaching sufficient accuracy for this test is not likely in near future.

          Predicting future changes in the heat content cannot be done by radiative transfer models alone, for that full models of the earth system are needed, and any discrepancy between the prediction and reality may be due to any part of this large model.

          Direct satellite measurements of all radiation (reflected and emitted) from the earth is a more direct way of validating the whole model. Any more limited measurement that covers only a part of the spectrum and only at a particular location is also a good empirical way of verifying the accuracy of the calculations for the atmosphere at that particular location.

          Actually specific detailed measurements may be more valuable for the scientists even if they are not as convincing for the lay people as a comprehensive measurement of the total balance would be. It is always possible that the details are wrong, while the sum is correct, but having all details correct guarantees that the sum is also correct.

        • Thanks Pekka for your comprehensive answer. Obviously you’ve had a long career teaching people like me…

          Indeed discussing just one part of the model is not enough to pin down the inherent errors there are. Anyway, I take your value of 10% accuracy (e.g. of OLR) as a valid value, and what else have been discussed here on the empirical side, like the MODTRAN and HITRAN databases, the value seems quite reasonable.

          This is valid of course, I assume, if we have a good measurement of the local condinitions, if we for example take the approach by Myhre et al and select just some, assumable reasonable representative individual points, and average them to cover the entire globe.

          Anyway, my point being, that in order for the radiative calculation part to be able to do its job accurately, we need correct absolute value – or at least the mean of it, and the distribution of it – known? Or am I completely mistaken here; if we consider the ‘radiative forcing’, wouldn’t we make a rather big error, say, if we make e.g. 2K error in estimating the surface temperature, which I believe is the starting point for the calculation? I.e. is the final error introduced by the radiative calculation part alone proportional to fourth power of error in surface temperature? And if we assume linear lapse rate – which I believe is the case here – this error is _not_ averaged out somehow, but rather the opposite.

          Another point I have concerning the picture, that how well the modelled changes in radiative balances in various atmospheric layers, or at least surface/TOA have been confirmed by the satellites? As I’ve learned elsewhere, the current modelled TOA change cannot be detected from the orbit because of technological limits, but I’m ready to stand corrected if I’ve misunderstood what I’ve read.

        • Myhre calculated the additional forcing due to the increased concentration of greenhouse gases. For this it is not necessary to have a full precise calculation of all radiative transfer processes, but only the change in the radiative forcing duo to the additional concentration of greenhouse gases. It is certainly much easier to calculate accurately this change than the full radiative balance. Only for the change can reasonable accuracy be expected from a calculation based on three vertical profiles only.

          These curves calculated by MODTRAN3 demonstrate clearly, how almost all additional radiative forcing comes from a very small part of the whole spectrum. The difference between the blue and green lines is the only thing that needs to be calculated. The picture is for U.S. Standard Atmosphere. Changing the atmospheric profile changes the curves much more than their difference. That is why we can trust the calculations of the radiative forcing.

        • I.e. is the final error introduced by the radiative calculation part alone proportional to fourth power of error in surface temperature?

          There are two types of errors, absolute T+E and relative T(1+e).

          For small absolute errors, (T+E)⁴ − T⁴ ~ 4T³E, which is linear in E.

          For small relative errors, (T*(1+e))⁴/T⁴ − 1 = (1+e)⁴ − 1 ~ 4e³, a relative error which is cubic in e.

          In both cases the error in heat (power) is strictly less than the fourth power of the error in temperature.

        • Pekka, and Jim D,

          Ok, let me ask you this:
          Only 0.04% of the dry atmosphere can absorb and re-radiate at the relevant wavelengths. The other 99.96% plays no part in radiative transfer, and can only be heated by molecular collision. Am I wrong in making this statement?

          Many people have pointed out how accurate the RT models are and, as Jim D points out (sensibly, I think), most of the ensuing uncertainty come from factors used ‘after ‘ the RT models when they are applied to GCMs. Do you know if the climate sensitivity used in the GCMs is as a result of the RT models?
          Further, do the RT models explain how much of the greenhouse effect (GE) is contributed by ghgs? If so, how much contribution was made in 1850 at appx 285 ppmv and how much contribution is made today at appx 395 ppmv? (These figures include all radiative ghgs, not just CO2).

          Cheers,

          AB

        • Arfur,
          Water is the most important greenhouse gas and its average concentration in the atmosphere is about 0.25%, but varies widely from about 0.001% (or 10 ppm) in some polar areas to 5% in some tropical air.

          Radiating molecules are under all tropospheric conditions heated mainly by collisions with other molecules. When a molecule absorbs radiation, this energy is mostly released in a collision to heat the air. The heat maintains the number of exited molecules at a level typical for the temperature and occasionally this excitation leads to emission, but only a small fraction is related directly to a prior absorption. The situation is different in very rare atmosphere, where the time between collisions is long compared to the typical delay from excitation to radiation.

          The well known physics gives reliable results for purely radiative calculations. As soon as other less well known factors enter the calculation, the theory cannot any more give equally accurate and reliable results. The real troposphere is controlled to very large extent by other processes (convection, condensation of moisture, ..). Therefore accurate results can only be obtained to questions, where some assumptions are made concerning these other processes. In radiative transfer calculations, it is assumed that all these other factors are strictly constant.

          The calculation of radiative forcing by CO2 is particularly reliable, because it is also rather insensitive to the detailed description of the tropospheric lapse rate and other details. This insensitivity can be verified through calculations based on different profiles. Therefore a rather good estimate of the radiative forcing can be obtained using only three model profiles out of the infinite number of profiles of the real atmosphere. For the calculation it is also necessary to use empirical data on clouds ets., but all this can be done without loosing basic reliability of the calculation. Due to the many details the final uncertainty is of the order of 10%.

          Attributing the greenhouse effect to different gases cannot be done in a unique way, because the combined effect of two gases is not equal to the sum of the effects obtained taking the gases separately, but less. Anyway it can be said that the increase of CO2-concentration from 285 ppm to 395 ppm corresponds to 47% of the effect of doubling of the CO2-concentration. Taking 47% of 3.7 W/m^2 gives 1.7 W/m^2. This is about 0.7% of all outgoing LW radiation or 4.4% of LW radiation originating at earth surface and escaping to the space unabsorbed. This is CO2 only. Methane and other long-lived greenhouse gases add about 1 W/m^2. (Long-lived is stated to exclude the influence of water, which is considered to be a feedback and is more difficult to estimate.)

          I repeat: All this applies only to the radiative calculation. The real climate sensitivity depends on a multitude of feedbacks, which are not at all as well known. Therefore the uncertainty in climate sensitivity is very large and even the range given by IPCC is often contested in both directions.

        • Pekka,

          Many thanks for your comprehensive response. I must admit I thought the average water vapour content was nearer 1.5 %, but I’ll work with your figure. However, would I be right in thinking that water vapour is, in fact, an addition to the normal 100% ‘dry’ atmosphere. If so, then of the total 100.25%, 99.96% remains unable to either absorb or emit radiation and 0.25% can absorb but cannot emit (H2O) and 0.04% can both absorb and emit. Correct?

          You say: “When a molecule absorbs radiation, this energy is mostly released in a collision to heat the air.”

          Only 0.29% of molecules can do this absorption. By ‘heat the air’ do you mean pass on the energy to other (inert) molecules?

          I would like to try an analogy to get my head around this. Please correct me if I err…

          Let us take a large sports stadium such as the Melbourne Cricket Ground. Capacity 100,000 seats. Although the concentrations of ghgs are by ppm by volume, let us approximate to 10.000 molecules per percentage volume (1 million divided by 100). This means that of the 100,000 spectators, only 40 are able to both hear the tannoy and re-transmit what it says. Another 250 spectators can hear the tannoy but cannot re-transmit the message (mute). The rest are deaf-mute. Let us now pretend the tannoy message was a very funny joke. The only way that 99,710 spectators can even realise something funny has been said is by the 290 people who are shaking with laughter. If they are touching the laughing people, they may well laugh in sympathy – but maybe with less conviction. As most of the ‘water’ spectators are in the lower stand, that is where most of the shaking is done. Back in 1850, the number of emitting spectators was only 28 (probably 29 if you include all the other dry ghgs). Therefore, according to the radiative forcing theory, the addition of 12 spectators (of any type of ghg) has increased the degree of overall shaking by 2.5% (0.8 C). According to the IPCC, doubling the number of emitters to 56 will lead to a ‘best estimate’ increase of 10% (3 C). Trouble is, the more emitters you add the weaker the joke becomes (log effect).

          Analogy over. It appears there is an illogicality in the cAGW theory. On the one hand, we are told that adding more CO2 to the atmosphere will lead to ‘rapid and accelerating’ warming. On the other hand, we are told that the effect of adding more CO2 is going to get less logarithmically. As the warming so far is 0.8 C since 1850 and the overall trend is appx 0.05 C per decade – and not increasing – just how much of problem is an increase in CO2 likely to be?

          Regards,

          AB

        • As the warming so far is 0.8 C since 1850 and the overall trend is appx 0.05 C per decade – and not increasing – just how much of problem is an increase in CO2 likely to be?

          This guy (AB) is like a cracked record. No matter how many times you point out to him that the temperature did not increase linearly between 1850 and now, he continues to insist that it did.

          Either he can’t read, or he can’t think, or as Pekka suggested he is playing games. In any event it fails to add anything to this blog.

          Quit playing your stupid game, AB. Only the deniers here appreciate denier illogic.

        • Vaughan Pratt,

          Stop being silly, Vaughan. Take a look at the OP to this thread. Have a go at answering the question.

          Denier illogic? What a joke. Where did I say that the warming was linear? Read this carefully:
          The total warming since 1850 is 0.8 deg C.
          Do you have a problem with that?
          The only illogic around here is from the so-called scientists who deny that the observed data DOES NOT support the cAGW theory.

          Nice of you to butt in, though.

        • Where did I say that the warming was linear?

          When you wrote “the overall trend is appx 0.05 C per decade.”

          You’ve had it explained to you repeatedly that when you use “trend” you are referring to a linear fit. Your figure of 0.05 °C per decade can only be obtained by fitting a straight line to the graph. That’s what “trend” means.

      • I think it comes down to how much you know the physics behind these models as to much you would trust them, and I realize this is not possible to take on faith. You may have noticed that the majority of those here who understand the RT model physical basis are of the opinion that these are adequate in GCMs, and the GCM uncertainties mostly relate to clouds and aerosol distributions, which come from other parts of the physics and chemistry, rather than radiation physics, which is somewhat a solved problem.

        • JIm D,

          The post above is addressed to Pekka and you but that was an error, it was just meant to be addressed to Pekka.

          Thank you for your time. It does appear to me now that the RT models are more accurate than I had originally thought and it is the factors added later to the GCMs that result in greater uncertainty.

          I am still slightly unclear whether the estimate for climate sensitivity is obtained simply from RT models, or which, if any, other factors are inputted to achieve the result.

          Thanks for your patience.

          AB

        • The no-feedback response is just the RT models. Feedbacks involve mostly the other parts of the GCM dealing with clouds, aerosols, ocean, etc. Most would agree that the larger part of the uncertainty is the actual feedback. The RT model still comes into it, of course, and is still as accurate when clouds, trace gases, and water vapor are given, but these ‘given’ values come from other physics/chemistry components.

    12. In response to Judith’s request I was proposing on this thread’s predecessor to try and pull the main ideas together. However in the meantime it looks like this thread has taken off faster than I’d realized. I’m happy to abandon both that project and that thread and drop back into ordinary commenter mode here, time permitting. I’ll try to be more selective about who I respond to this time around, if you don’t hear back from me please put it down to my lack of familiarity with your area of expertise.

    13. Judith,

      DENSITY OF CO2
      Gas displacement is not even considered. Normal surface gases are being displaced into the higher regions of the atmosphere. The atmosperic cieling will only allow so much bleed off of gases due to the rotation to keep the atmosphere in place. This in turn generates more back pressure against the atmosphere to the planets surface.

      Question,
      If Co2 is absorbing some heat, it must be interfering with the efficiency of transfered energy to the oceans?

    14. Convection, advection, radiative transfer, radiant flux, etc. might be interesting but let’s not use the donkey to push the cart. It is always to think about and try to understand the nature of nature but AGW True Believers can never make their case going down this road. A study of the Earth’s albedo (project “Earthshine”) shows that the amount of reflected sunlight does not vary with increases in greenhouse gases. End of story.

      The “Earthshine” data shows that the Earth’s albedo fell up to 1997 and rose after 2001. What was learned is that climate change is related to albedo, as a result of the change in the amount of energy from the sun that is absorbed by the Earth. For example, fewer clouds means less reflectivity which results in a warmer Earth. And, this happened through about 1998. Conversely, more clouds means greater reflectivity which results in a cooler Earth. And this happened after 1998.

      It is logical to presume that changes in Earth’s albedo are due to increases and decreases in low cloud cover, which in turn is related to the climate change that we have observed during the 20th Century, including the present global cooling. However, we see that climate variability over the same period is not related to changes in atmospheric greenhouse gases.

      Obviously, the amount of `climate forcing’ that may be due to changes in atmospheric greenhouse gases is either overstated or countervailing forces are at work that GCMs simply ignore. GCMs fail to account for changes in the Earth’s albedo. Accordingly, GCMs do not account for the effect that the Earth’s albedo has on the amount of solar energy that is absorbed by the Earth.

      • [Obviously, the amount of `climate forcing’ that may be due to changes in atmospheric greenhouse gases is either overstated or countervailing forces are at work that GCMs simply ignore. GCMs fail to account for changes in the Earth’s albedo. Accordingly, GCMs do not account for the effect that the Earth’s albedo has on the amount of solar energy that is absorbed by the Earth.]

        Precisely. The measured data does not support the cAGW theory without invoking further unproven factors. Surely if a theory is not supported by data then the objective, logical observer would revisit the theory?

        AB

      • Yes, cloud-cover variability and feedbacks are a source of uncertainty. It is notable that the purported decrease in cloud albedo during the 90’s warming is opposite to the negative feedback ideas of Lindzen and Spencer.

      • It is logical to presume that changes in Earth’s albedo are due to increases and decreases in low cloud cover, which in turn is related to the climate change that we have observed during the 20th Century, including the present global cooling. However, we see that climate variability over the same period is not related to changes in atmospheric greenhouse gases.

        Don’t forget that clouds will change the outgoing longwave radiation as well, and the Earthshine data doesn’t tell us anything about those changes. So it is an overreach to conclude that their measured albedo changes are the dominant climate forcing over the recent past, because the inferred cloud changes could have an offsetting affect on the infrared radiation.

        Thanks for mentioning this project, though, it is a very interesting and valuable one that I was otherwise unaware. I think the most up to date published reference is this one, for any others that are interested: dx.doi.org/10.1029/2008JD010734

    15. Phil. Felton 12/23/10 1:39 pm, posting on Confidence … thread, said,

      >>The Beer Law can’t be the answer since we’re dealing with broadband illumination.

      This is a frequently stated but unsupported assumption about the Beer Law, namely that it is a law about monochrome or narrowband light. No one has been able to supply a reference where that conclusion has been developed and validated. In fact, no can has been able to do any more than suggest reading one Petty’s text or the Turner, et al. (2005) paper, and then, accepting the burden that should have been on the person making the claim, I discover that the documents don’t support the claim.

      On another thread, I sketched the derivation of Beer’s Law. It’s quite simple, and I can enlarge on it a bit.

      The theory is that the intensity of EM energy, called light for these purposes, passing through an absorbing gas obeys the law I(n1+n2) = I(n1)*I(n2), where the n_sub_i are the number of molecules, or equivalently, numbers proportional to the concentration of the gas. The gas can be in separate containers, as in the case of two hypothetical atmospheric layers, or in two laboratory gas filters. We can imagine that gas comprises two layers within a single gas filter. Further, the media containing the absorbing gas can also be filled with another, non-absorbing gas, such as O2 and N2 with respect to CO2.

      An equivalent statement is to use transmissivity in place of intensity, so t(n1+n2) = t(n1)*t(n2). Transmissivity is the ratio of output intensity to input intensity. It is also analogous to the complement of the probability of extinction, p, or the probability of no extinction, q. An important consequence of this model for absorption is that the order of the filters, the order of relative extinction is irrelevant. So in probability terms, we can write q(n1+n2) = q(n1)*q(n2) = q(n2)*q(n1).

      Next we observe that these equations are functional equations for which the unique mathematical solution is the exponential. Recognizing that t or p, or the ratio of I over an initial I0, are all less than one, the coefficient of the exponent must be negative. So the we have exp(-k(n1+n2)) = exp(-k(n1))*exp(-k(n2). Thus the fact that absorption is hypothesized to be proportional to the number of molecules along the path creates the exponential form. So this formulation is simply that I/I0 = exp(-kC), where k is a positive constant, in dimensions of the reciprocal concentration, and C is the gas concentration. The ratio of the energy that gets absorbed is 1-exp(-kC). The radiative forcing, RF, is I*(1-exp(-kC)). This hypothesis has advanced to the level of a law, implying that it has been tested in all its implications and its predictions validated by measurements.

      Now consider CO2 being added to other GHGs, G, which are kept constant. The total radiation that gets extinguished is the RF_G + RF_CO2 = RF_G + (I – RF_G)*(1-exp(-kC). The total RF is then of the form RF = a +b*(1-exp(-kC)), where C again is the concentration of CO2.

      The point of all this detail is that nowhere is the assumption made that the outgoing radiation is monochromatic or narrowband. Nothing is assumed or said about the spectrum of the light anywhere along its path.

      Investigators here report that when the outgoing radiation is decomposed into its spectral components, and Beer’s Law applied to the total intensity, that Beer’s Law does no longer holds for that total intensity. This does not imply that Beer’s Law has been invalidated. The investigators are working in a different coordinate system, and working with the differential of the spectrum. That differential is called the spectral density. Because measured spectra have nearly vertical rises (steps), the spectra contain lines (Dirac delta functions). These are modeled as infinite, which is workable assumption in the domain of spectral density. However, that something goes wrong is not surprising when Beer’s Law is applied to an infinite pulse and then reconstructed into a whole, either as the spectrum or the total intensity.

      Differentiating and Dirac delta functions are mathematical ideals. They are essential in spectral analysis. But don’t expect multiplying things both by infinity and zero to yield anything but error. Don’t multiply by infinity (a Delta function) and zero (the differential) inside an integral, because the sum of the parts might not equal the whole. In particular, no justification exists to apply Beer’s Law to line spectra. Beer’s Law is not invalidated because when you applied to the spectral density and them summed it into a whole, the Law no longer held for the whole.

      Someone needs to figure out how to apply Beer’s Law to the spectrum, not the spectral density. Maybe that’s been done, but no one who posts here has shown any awareness of that fact.

      If someone wants to point me to a book or paper where this question is solved with different results, don’t bother. If you want to argue that my little analysis is wrong, layout all the details. Quote from your books or papers completely, down to the page number or better. The reader should not have to do any research for you, or purchase any book or paper, but he should be able in theory and at no cost, to go to your references to see if you’ve quoted then and applied them correctly, and whether the results have been validated by experiment.

      • Your derivation is mathematically the same one that everyone gives, but it applies only to monochromatic radiation. It does not help that you state that you do not make that assumption, as it is hidden in your derivation as well – unless you claim that all wavelengths are absorbed equally strongly.

        All radiation has some wavelength and the wavelength does not change (except through absorption and reemission at a different wavelength). Thus you can follow all your steps without any problem for each wavelength separately. Your probabilities q(n1) and q(n2) depend on the strength of absorption for that particular wavelength. For different wavelengths they are usually different, sometimes very different. Therefore you get different exponentials for different wavelengths and the derivation is valid only for each wavelength separately, not for their summed intensity.

        • Pekka Pirilä 12/23/10 4:48 pm

          The derivation doesn’t use wavelength at all. It is statistical. It is the bulk probability that EM at whatever wavelength bumps into an absorbing molecule.

          You claim the wavelength assumption “is hidden in your derivation”. Is it hidden so well that you can’t find it? If you haven’t found it, how would you its there? If you have found it, please share where it is.

          I don’t “claim that all wavelengths are absorbed equally strongly.” You might convince me that all particles have the same probability of collision and extinction regardless of their wavelength.

          Knowing that all radiation has some wavelength is no help to your argument.

          You say my “probabilities q(n1) and q(n2) depend on the strength of absorption”. I don’t think individual photons have strengths of absorption. They either collide with an absorber or they do not. The probabilities are merely ratios of those that get extinguished to the total.

          The exponentials are functions of the density of absorbing particles. The coefficient is negative because the exponential must be decaying. The coefficient is empirical, but it accounts for the dimensions used for concentration.

          You seem to be trying to make a line-by-line absorption intensity fit the total. For the reasons I have given, that seems to be doomed unless you integrate over the spectrum, as in a Lesbegue-Stieltjes integral, instead of discretely summing by lines, as in a computer, or doing a simple Riemann integration. It’s been a long time since my integration theory training, but I think that is where you are making your error.

          Finally, you declare again that Beer’s Law applies only to monochromatic radiation, but again provide no authority. What is you source for that? It may be what is necessary to believe that radiative transfer is producing correct results, and results that contradict Beer’s Law. But what is needed is a validated analysis, where validated means experimentally demonstrated. And I remind you that what is needed is not validation of the spectral density, but validation of the total intensity.

        • Finally, you declare again that Beer’s Law applies only to monochromatic radiation, but again provide no authority.

          Jeff,

          If you look at the first section of “Radiative Transfer” by S. Chandrasekhar, note that when he derives these equations there are subscripts for frequency. Note that chooses to drop the subscripts on page 9 purely for notational convenience, saying “… it is convenient to suppress the suffixes nu to the various quantities …” You can view this reference at google books – I’m looking at the Dover version right now to get that quote.

          So, yes, there is a frequency dependence to Beer’s law. In your equations, the I, t, and k are all frequency dependent.

        • Aronne 12/24/10 at 12:03 am

          Good. Maybe we’re getting somewhere. When was the Chandrasekhar’s “Radiative Transfer” published? What is Chandrasekhar’s source for limiting his analysis to a single frequency?

          Of course, radiative transfer is a frequency analysis model. Everything done for total, statistical radiation, e.g., the Beer-Lambert Law, has to be redone for the frequency domain. Maybe that’s why radiation transfer theory has to restrict Beer-Lambert. As I have written here previously, no one should expect Beer-Lambert to apply in the frequency domain or to single photons. It should not be applied to the spectral density, so posters here simply claim the HITRAN model doesn’t use the spectral density, and they do so notwithstanding that they use terminology (lines) applicable from the spectral density. Fine. So what does it use? How does the HITRAN database relate to the spectral density.

          You suggest that the parameters in my equations (which, by the way, I can’t recognize) are all frequency dependent. You may not take my derivation and apply frequency subscripts to the variables and then claim that my derivation is frequency dependent. If such a tactic were true, then I could take Chandrasekhar’s work, erase all the subscripts, and then claim that his work is not frequency dependent. You need the assumption or not, according to whether you use it or not.

          You realize of course that by defending what has been repeated here, and perhaps throughout radiative transfer theory, leads to a model in which gas absorption depends on the logarithm of the concentration. That is impossible. The effect must saturate, based on first principles. The logarithm does not saturate. Beer-Lambert provides a model that saturates. If you don’t like it, fine, again. Provide any model you like that saturates. Then using data, show which model fits best.

          Data, data, data, physical reality, data, data.

      • Phil. Felton 12/23/10 at 1:39 pm, in Confidence in radiative transfer models

        You wrote in its entirety,

        >>The Beer Law can’t be the answer since we’re dealing with broadband illumination. When dealing with broadband you have to take the width of the lines into account which depends inter alia on temperature and pressure. The line width is customarily described by the Voigt profile which is a convolution of a Gaussian and Lorentzian. When in optically thin conditions we get a linear dependence on concentration, once no longer optically thin the line center will saturate and the dependence on concentration will be mostly due to the Gaussian ‘wings’ and will flatten off, further increase in concentration will switch to the Lorenzian ‘wings’ and the dependence will increase but will not reach linear. This is the ‘curve of growth’. In the case of the 15 μm band of CO2 there are many lines, some of which will be very strong (near the core) and some very weak (out on the edge of the band), the overall dependence is less than linear and at our atmospheric conditions is conveniently represented as logarithmic. This is the result of saturation, your naive concept of saturation doesn’t happen.

        It’s not enough that the RT results produce about 4 Wm^-2 per CO2 doubling in the band of interest (280 ppm – 560 ppm, a doubling) but worse (from 10 ppm to 1000 ppm), beyond that RT produces about 6.8 Wm^-2 out to about 10,000 ppm. Pierrehumbert, R.T., “Principles of Planetary Science”, 7/7/31, pp. 103-104.

        You may have put your finger on the answer to the question of why radiative transfer calculations produce, even approximately, the physically unrealizable, never-saturating, logarithmic result:

        The Lorenzian tails, which you call wings, have infinite mass and energy. The Lorentz-Lorenz distribution has no mean, no variance, or, more inclusively, no moments. It is a nasty distribution.

        I understand that the Lorenz-Cauchy distribution arises in spectroscopy in the solution of differential equations for forced resonance. This would a positive feedback to the radiant energy. Either it must have (unmentioned) limits placed on it, or be recognized that it assumes that resonant absorbers are energy sources, i.e., that they have infinite source impedance. In real circumstances, the resonant absorbers must lose energy, e.g., cool.

        My speculation is that we could indeed show that Beer’s saturation is occurring, though perhaps in bands, that is, occur piece-wise. What is naïve is the application of a physically impossible distribution, the Lorentz-Cauchy distribution, to eliminate all windows in CO2 absorption, even limited to the 8 – 13 μ band of the OLR.

        That is not to say that Lorentz, like the logarithm, is not a fit in some region. What is naïve is not to complete model and give the domain and the goodness of fit. What is naïve is to accept unqualified, impossible results because they are too good not to be true, for AGW advocates.

        Of course, we know that unqualified, the logarithmic assumption is naïve. The total CO2 RF must saturate. The logarithm goes to infinity. A better upper bound is the outgoing surface radiation. An even better upper bound is the total OLR with no CO2. And a better yet upper would be the total OLR in the bands where CO2 absorbs at all, assuming, contrary to the Lorentz-Cauchy assumption, that CO2 has windows in the 8 to 13 μ band. And we would expect the saturation to be soft, that is, neither sudden nor discontinuous in the slope.

        Can MODTRAN or HAWKS calculate with the Lorentzian effect turned off, or is it embedded permanently in HITRAN?

    16. The point of all this detail is that nowhere is the assumption made that the outgoing radiation is monochromatic or narrowband. Nothing is assumed or said about the spectrum of the light anywhere along its path.

      That is incorrect. In every example from the literature on the derivation of Beer’s Law that has been cited for you, the statement is made that the incident light is monochromatic or narrow compared to the width of the absorption. If the light isn’t monochromatic and the absorbing line is narrow compared to the bandwidth, the extinction is not exponential, but is linear with mass path length. In the intermediate case, the plot of absorbance vs concentration is curved rather than linear. See here for more detail:

      http://terpconnect.umd.edu/~toh/models/BeersLaw.html

      Only theoretical lines have zero width. A zero width line has no absorption. Discussion of the Dirac delta function is irrelevant. All real spectral lines have finite width because they are broadened by, among other possibilities for gases, the Doppler Effect and pressure broadening.

      • DeWitt Payne 12/23/10 4:55 pm

        First, what you claim is not true. My derivation was not for monochromatic or narrowband EM, and according to Pekka Pirilä above, it is the one “everyone gives.”

        And your claim that derivations from the literature have been cited for me is false. You, in particular, have provided none. I need a quotation, complete in itself to make your point, cited by page number or better in a document freely available to the public. You have done none of this.

        You are correct that only theoretical lines have zero width. I don’t agree that a zero width line has no absorption. I don’t even agree that the lines are what absorb. Molecules do that. Lines are an abstract model of the absorption. I would expect that the experimental shape seen in trying to validate the existence of lines is the transform of the sensing aperture, not necessarily by Doppler and pressure broadening.

        Real spectral lines don’t exist. They, like everything else in science, are models of the real world, not a reality in themselves.

        Nothing of what you say is appropriately cited, much less to a validated source,

        • Nothing of what you say is appropriately cited, much less to a validated source

          Umm. Pot, kettle, black. You’ve also conveniently ignored my previous citation of J&uumlaut;rg Waser’s book for the Beer’s Law derivation requiring the assumption of monochromatic radiation. Unless your definition of validated means agrees with you. That would be impossible a little difficult.

        • Should look things up I don’t use often. That’s Jürg Waser.

        • And Grant Petty who you reject ad hominem.

        • DeWitt Payne 12/23/10 6:00 pm

          You need help with the definition of ad hominem (too).

          I searched Petty for several items claimed for his text, finding none, and citing the extent of the searches fully. Beer’s Law is vital and survives in his First Year text, supported by a dozen or two hits, and without any exception that I could find. The logarithmic dependence is not there. That Beer’s Law is for monochrome EM is not there.

          You accuse me of using an ad hominem against Petty, skipping over the honesty and courtesy of any reference. I accused Petty of being an AGW supporter, and in agreement with IPCC and its GCMs. I provided specific evidence for these observations about Petty to chriscolose on 12/19/19 at 9:38 am on the AGU … Part III thread. Of course his entire First Course on Atmospheric Radiation is an introduction to radiation transfer, so as vile as it might to be malign him as a radiation transfer advocate, it is not an empty accusation, but a verified fact. These charges are not ad hominem arguments.

        • DeWitt Payne 12/23/10 5:46 pm

          You wrote, >> You’ve also conveniently ignored my previous citation of J&uumlaut;rg Waser’s book for the Beer’s Law derivation requiring the assumption of monochromatic radiation.

          That is false.

          This was sandwiched between insults:>> Pot, kettle, black. … Unless your definition of validated means agrees with you. That would be impossible a little difficult.

          I responded to your reference to Waser on the Confidence … thread on 12/18/10 at 12:06 pm. I even had a specific question about what Waser had reported, and put that question to you. You failed to answer.

          Demeaning and insulting remarks rationalized by a strategically placed, patently false statement should qualify in anyone’s book as an ad hominem attack.

        • I did reply with a direct quote from the Waser’s text here:

          http://judithcurry.com/2010/12/05/confidence-in-radiative-transfer-models/#comment-22732

          You don’t tell us this citation is from Petty’s introduction to atmospheric radiation (p. 78), and that Petty appears to be both an AGW supporter and a radiative transfer advocate. In that IPCC environment, the investigators NEED Beer’s Law not to apply, so they ASSERT that it is a law about monochromatic radiation. You need an independent citation.

          That’s a classic example of argumentum ad hominem if I ever saw one.

          In section 2.5 page 30 of Petty where the concept of absorption of radiation is introduced he refers to a plane wave “where ν is the frequency in Hz”. That’s monochromatic by definition as it has the frequency, not a range of frequencies.

          Here’s another one from Dr. Rodrigo Caballero’s on line Physical Meteorology Lecture Notes page 115:

          5.8 Extinction and optical path
          Consider a beam of photons all having the same wavelength and direction. Imagine we point the beam perpendicularly at a slab of atmosphere. As the beam passes through the slab, some of the photons will be absorbed and some scattered away from their initial direction. Thus the intensity of the beam will diminish. The general term for attenuation through either absorption, scattering or both together is extinction.
          If the slab is very thin, then the total amount of extinction (i.e. the difference in intensity between outgoing and incoming beams) turns out to be proportional to the amount of matter in the slab and to the intensity itself:
          dI = −Ikaρa ds − Iksρs ds (5.40)
          where I is the radiance of the incoming beam, dI is the difference between incoming and outgoing radiances, ka is the mass absorption coefficient (see Sec. 5.3.4), ρa is the mass density of absorbers, ks is the mass scattering coefficient (Sec. 5.4), ρs is the mass density of scatterers, and ds is the width of the slab. This linear relationship between extinction, mass of absorbers/scatterers, and intensity is called the Beer-Lambert law.

          Since you are the one who seems at odds with generally accepted knowledge, it would behoove you to provide citations backing up your point of view rather than just assert that what you believe is true while rejecting on specious grounds (e.g. I searched the text for a particular combination of words and couldn’t find it or he supports AGW and radiative transfer) all citations to the contrary. In other words, do your own homework.

        • DeWitt Payne 12/23/10 11:52 pm,

          You provide a link to your “direct quote from the Waser’s text here”, providing a link to comment #22732 on the Confidence thread. In my browser, the comments in the threads are no numbered. So I checked the link, found the date and time in the actual thread, and there I find an italicized, indented paragraph from you. I would assume this is a quotation. But from what? On what page?

          You next provide what appears to be a quotation. You don’t reveal that it is from me! Nor do you note that it is from me on 12/17/10 10:05 (lacking comment numbers), on the Confidence thread. Nor do you reveal that it was written in response to a pair of paragraphs from you which I first repeat, complete with the origin, the date and the time of its posting. What you had said was again an unmarked, unidentified paragraph we had to assume was a quotation. I traced it to Petty, First Course, and to page 78. Suddenly its relevance to the AGW argument became apparent because Petty is an AGW supporter, as I stated to you at the time and repeated with citations for chriscolose on 12/19/19 at 9:38 am on the AGU … Part III thread how Petty reveals himself to be a supporter of AGW, IPCC, and GCMs. Five yours before this post from you, I told you the same thing.

          You say “That’s a classic example of argumentum ad hominem if I ever saw one.” That is true, not because anything I had written was an ad hominem but because you apparently never saw one. On 12/23/10 at 8:30 pm, I supplied you an example from your own writing where you created a sandwich of name calling/falsehood/name calling, and explained how that was an ad hominem.

          You provide a 188 word quotation from Caballero’s Lecture Notes, p. 115. On 7/14/07 at 18:24 on another blog, is written,

          >> Rodrigo Caballero’s Physical Meteorology lecture notes on-line were useful, but there wasn’t much on radiative energy transfer …

          That was written by someone named DeWitt. That same DeWitt, same day, same blog, wrote,

          >>I’ve been stumbling around mostly in the dark for quite some time trying to increase my understanding of the physics underlying the structure of the atmosphere and the greenhouse effect. So much of what I read is either so oversimplified that it’s misleading or it’s completely wrong, both from AGW skeptics and proponents. Has no one written a non-trivial, non-polemical synthesis of modern climate theory? There is better information about string theory than there is about climate … .

          That must have been some other DeWitt, one from Tennessee.

          DeWitt Payne on 5/2/10 at 9:45 pm posted the following on climateaudit.org:

          >>I second the recommendation for Caballero’s on line lecture notes. It’s a work in progress and has been expanded considerably since I discovered it a year or two ago. I’m looking forward to his expansion of the section on convection in the planetary boundary layer. Note that there are some peculiarities in how meteorologists treat entropy, but it’s not any worse than the difference between chemists and physicists on thermodynamics where chemists prefer constant pressure and physicists constant volume.

          >>If you want more detail on radiative transfer, I recommend Grant W. Petty, A First Course in Atmospheric Radiation. For more on climate models there’s McGuffie and Henderson-Sellers, A Climate Modelling Primer.

          Hmmm. So Caballero is (a) a work in progress and (b) second to Petty. I read Caballero at the place you cited. I found no reason for the qualification to “the same wavelength”. Do you have any idea why he inserted that restriction? It’s in his sketch of a derivation of the Beer-Lambert law, but he doesn’t use the assumption. Perhaps the single wavelength is necessary in the frequency domain of radiative transfer. It is not required in the statistical domain, which I used in my analysis. Maybe I’ll wait until Caballero’s work is finished and reviewed.

          On 12/17/10 at 4:02 pm, you recommended not just Petty’s First Course but the Amazon “look inside” feature of Petty. Then you whine that

          >>I searched the text for a particular combination of words and couldn’t find it or he supports AGW and radiative transfer …

          What did you expect from the Amazon “look inside” feature? Regardless that you complain now about what you recommended, the “look inside” feature was quite adequate to show that was technicians and amateurs here claimed to be in Petty – invalidation of the Beer-Lambert Law — wasn’t there.

          What is the origin of the narrowband requirement?

          Where are the data validating the total intensity via radiative transfer, which is to say, where are the data validating that the radiative forcing varies as the logarithm of CO2 concentration? The answer, which you and others refuse to answer, has to be the data don’t exist. That is because the dependence is a physical impossibility.

          You accuse me of being “at odds with generally accepted knowledge”. You have no knowledge of what is generally accepted knowledge to be a judge. And naïve, i.e., nonskeptical, parroting of what one thinks is generally accepted knowledge is no part of science. One needs to know this to graduate from radiative transfer technician to scientist.

          Do post again when you find the data.

    17. Jeff Glassman | December 23, 2010 at 3:40 pm | Reply
      Because measured spectra have nearly vertical rises (steps), the spectra contain lines (Dirac delta functions). These are modeled as infinite, which is workable assumption in the domain of spectral density. However, that something goes wrong is not surprising when Beer’s Law is applied to an infinite pulse and then reconstructed into a whole, either as the spectrum or the total intensity.

      As I pointed out in the post you responded to that is not true, line spectra are not delta functions, they have widths which depend on the environment and concentration of the absorber. These lines are described by the Voigt function (also see above).

      Differentiating and Dirac delta functions are mathematical ideals. They are essential in spectral analysis. But don’t expect multiplying things both by infinity and zero to yield anything but error. Don’t multiply by infinity (a Delta function) and zero (the differential) inside an integral, because the sum of the parts might not equal the whole. In particular, no justification exists to apply Beer’s Law to line spectra. Beer’s Law is not invalidated because when you applied to the spectral density and them summed it into a whole, the Law no longer held for the whole.

      This appears to be a figment of your imagination, no-one is doing this.
      Because the line shape is a function of concentration that has to be taken into account as well as the normal (optically thin) Beer law. In the non optically thin regime you can’t apply Beer’s law to the whole line.

      You can read about it here if you like:
      http://www.astro.uvic.ca/~tatum/stellatm/atm11.pdf
      http://www.physics.gla.ac.uk/~siong/teaching/CSM/CSM_lecture9.pdf

      Someone needs to figure out how to apply Beer’s Law to the spectrum, not the spectral density. Maybe that’s been done, but no one who posts here has shown any awareness of that fact.

      No I think you just don’t understand what you’re being told.

      • Phil. Felton 12/23/10 5:14 pm

        First Phil. Felton protests that “line spectra are not delta functions”. I search the thread, and the only one to use the term “line spectra” is Phi. Felton. Phil. Felton doesn’t recognize that the spectrum can be measured directly, and that spectral densities are mathematical derivations from spectra. Spectra is the plural of spectrum and should not be confused with spectral density, if that is what is being done.

        According to what these posters and their sources are saying, HITRAN uses a model, a spectral function of some complex sort, but less defined than either a spectrum or a spectral density. Then the posters speak about whatever is in HITRAN as if it were a validated model. However, they won’t tell us where and how the HITRAN spectral function was validated.

        Phil. Felton says, “In the non optically thin regime you can’t apply Beer’s law to the whole line.” That is a narrow, qualified version of what I said. You can’t apply Beer’s law to lines, or individual spectral density features, optically thick or thin. This is exactly the error that Pekka Pirilä made, applying Beer’s law to spectral features to prove the Beer’s law does not apply to the whole intensity. Beer’s law applies to the whole intensity.

        I wrote, and Phil. Felton repeated, “Beer’s Law is not invalidated because when you applied [it] to the spectral density and summed it into a whole, the Law no longer held for the whole.” To this, Phil. Felton responded , “This appears to be a figment of your imagination, no-one is doing this.” To the contrary, this is what everyone of these radiative transfer technicians is doing: summing the spectral function, whatever they want to call it, into a total radiation to conclude that Beer’s Law does not hold. Until they can supply some references, scientific reasoning, and validating measurements, scientists must assume that Beer’s Law holds. The fact that it appears not to hold as a result of calculating with the HITRAN database must be a result of modeling errors within the calculating routines or the HITRAN database. A law trumps a conjecture. The law survives until investigators can advance the conjecture to a hypothesis, valid the hypothesis through measurements to create a theory, and when that has been done exhaustively for all the implications of the theory, advance a competitive or contradictory Law. None of the HITRAN advocate posters even scratches the surface of the scientific prerogatives.

        Phil. Felton dumps two references on the thread. In some context that might be great, but not without Phil. Felton stating his position completely.

        One reference is Chapter 11, but of what, by whom, and when? It is 20 pages long. Who’s going to search for that to try and guess what Phil. Felton thinks is important? The second reference is Circumstellar matter: Lecture 9, of what? By whom? When? Its charts with no text. It’s about “atoms in stellar atmosphere” and the Doppler effect, two irrelevant features. The second chart has a dangling assumption. Whatever kind of spectral function the writer is talking about is known only in the minds of the pro-HITRAN posters here, but the reference leaps into modulating the line shapes in that spectral function. Lecture 9 is loaded with symbols but no glossary.

        Phil. Felton may have been trying to fill the void of a lack of references, or to impress with souvenirs salted away in the bottom drawer of his desk, but this is not scientific dialog. “Trust us” is not science.

        If Phil. Felton and the others want to be constructive, each needs to state complete thoughts, referenced so the reader can check veracity, accuracy, and assumptions.

    18. Jeff Glassman | December 23, 2010 at 7:57 pm | Reply
      Phil. Felton 12/23/10 5:14 pm

      First Phil. Felton protests that “line spectra are not delta functions”. I search the thread, and the only one to use the term “line spectra” is Phi. Felton. Phil. Felton doesn’t recognize that the spectrum can be measured directly, and that spectral densities are mathematical derivations from spectra. Spectra is the plural of spectrum and should not be confused with spectral density, if that is what is being done.

      Everyone refers to ‘line spectra’, not just me, that is what you’re talking about when you refer to ‘line by line’! The only one confusing ‘spectra’ with ‘spectral density’ appears to be you.

      According to what these posters and their sources are saying, HITRAN uses a model, a spectral function of some complex sort, but less defined than either a spectrum or a spectral density. Then the posters speak about whatever is in HITRAN as if it were a validated model. However, they won’t tell us where and how the HITRAN spectral function was validated.

      HITRAN is an international database of spectra, if you weren’t so lazy you could have Googled it. Here’s a report on it, I hope it’s not too long for you!
      http://www.cfa.harvard.edu/hitran/Download/HITRAN04paper.pdf

      • I also gave him the same link a while back. It didn’t help then either.

      • Phil. Felton 12/21/10 at 9:16 am

        Felton pretends to know what “everyone” says. This is like DeWitt Payne claiming to know what is “generally accepted knowledge”. These two are brilliant. I should abandon skepticism.

        Phil. Felton uses the word line spectra to mean line spectral density. Spectra is the plural of spectrum, and the spectrum contains no lines. Then he accuses me of confusion. These radiative transfer technicians don’t seem to realize that the spectral density is the mathematical differentiation of the spectrum, and that lines are created in the model and differentiation. They talk about the spectral function found in HITRAN, but are unable to describe it to distinguish it from the spectral density. They use radiative transfer vernacular to talk about lines that aren’t lines at all. Nevertheless, they stick with the double misnomer, “line spectra”.

        And he accuses me of being lazy. But it is Phil. Felton who posts a link to a pdf (Rothman, et al., 2005) without telling anyone what he relies on from that source. You say, “I hope it’s not too long for you!” Of course 65 pages is too long when you refuse to reveal what I’m looking for. You have the burden to quote from that source, with page number. Then the readers can go to that source to verify your work.

        Do Rothman, et al. discuss the origin of the band wings that cause logarithmic dependence (the physical impossibility), or do they tell us otherwise how the HITRAN database causes total energy calculations to be logarithmic in gas concentration (the physical impossibility)? Asking someone to find a physically false statement in a 64 page document is a plain wild goose chase. It’s called a fool’s errand named after he who did the sending.

      • Phil. Felton, 12/23/10, 11:57 pm

        Phil. Felton wrote,

        >>The only one confusing ‘spectra’ with ‘spectral density’ appears to be you.

        The confusion is yours.

        For the proper, scientific use of the term spectral density with respect to the CO2 spectrum, see “Implications for Molecular Spectroscopy Inferred from IASI [Infrared Atmospheric Sounder Interferometer] Satellite Spectral Measurements”, Clough, T., et al., presentation at The 10th HITRAN Database Conference, 6/22-24/08, slides 15 and 16, “CO2 Continuum, Symmetrized Power Spectral Density Function”.

        http://www.cfa.harvard.edu/hitran/HITRAN-Conference10/…/T4.1-Clough.ppt

        You could have found this near the citation you accused me of being too lazy to have discovered:

        >>HITRAN is an international database of spectra, if you weren’t so lazy you could have Googled it. Here’s a report on it, I hope it’s not too long for you!

        >>http://www.cfa.harvard.edu/hitran/Download/HITRAN04paper.pdf

        What point were you trying to make, besides that I’m lazy? What my reference says I’ve quoted. What you’re doing is called hip shooting.

    19. Phil. Felton 12/23/10 at 11:57 pm, DeWitt Payne 12/23/10 11:59 pm

      The problem you are not grasping is a prerequisite of science. You need to tell everyone what you think you learned from your references: what is your model, what does it predict, what is its accuracy, has it been validated. Of course, you may derive your model from first principles if you’re able, but if you need references, restate everything essential to your model from those references.

      If I go digging in your references, whether I discover what you think you discovered is a matter of chance. And everyone else who might be willing to do your research for you is liable to come up with a different discovery. You must make a scientific commitment, fully referenced. If your model passes all the sniff tests, you’ll probably make some points. If it doesn’t, then we’ll check your references to see if you cited them accurately, to see if your assumptions match those in your reference, and to see if the referenced models have all been validated.

      You might assume I’m lazy, but you’d miss your guess. It’s not laziness not to go on wild goose chases, e.g., searching for physical impossibilities.

    20. Judith,

      Ocean Density is not considered in reflecting energy as well as the rotation of the planet as the solar energy penetrates.
      Shallow water absorbs more heat due to the material under the water that is actually absorbing the heat.
      Add in the surface salinity changes and you have an ocean cooling.

    21. This came up in another conversation. It is probably a dumb question but I have to ask. I searched here and at the Scripps/UCSD website but found no answers. Please pardon me if this is not the appropriate thread:

      We already know that GHGs cause atmospheric warming, and increased manmade GHGs must cause increased atmospheric warming at some level. How do the actions of mankind (increased manmade GHGs) cause warming of the oceans ? What are the mechanisms exactly? This one has me stumped. Scientific links including observation and measurement of these mechanisms are welcomed.

      Radiative transfer must certainly cause heating of the atmosphere. Our atmosphere is also relatively transparent to the long wave radiation trapped/reflected by GHGs so penetration is approaching 100%. RT heating of the ocean presents some difficult problems though. While direct sunlight will readily penetrate a clear ocean to a depth of 10 meters, absorbing nearly all of its energy, long wave radiation from RT has been tested and shown to penetrate only to a depth of 1mm. Limited long wave penetration along with immediate evaporation at the surface boundary layer suggest that little of this heat energy from RT is absorbed by the oceans. Also the sheer mass of the oceans requires a tremendous amount of heat energy to cause measurable warming when compared to the atmosphere. What am I missing here?

      • IVPO though I hope you get an answer to your valid question, I’m doubtful that you will.

        I’ve been asking the same at every blog at every opportunity that I get. To date, no one has been able to demonstrate how human activity warms the oceans.

        Furthermore, radiation equations (I believe) treat the whole planet as if it wasn’t covered >70% by water, most of it deep. How on earth air above deep water is supposed to warm that water has me stumped and I too would like one of the resident experts to explain it to me.

        p.s. I believe direct sunlight penetrates down to about 100 metres, though less than 3% of the light survives that far down.

        • Baa,
          I believe I may have simply restated your question from an earlier thread. It got me thinking, surely there is a simple answer to this heat transfer. I have been digging in some comprehensive coupled-ocean-atmosphere sources and have yet to find it. Surely the question of RT and conduction of heat energy from atmosphere to the ocean has not been overlooked.

        • I doubt it’s been overlooked. We’ve probably missed something and one of our resident experts like A Lacis or V Pratt will be along to clear things up.
          Though it is christmas so we may have to wait a bit longer.

          Merry christmas mate

        • Actually Fred Moolten cleared it up with his point about turbulence near the surface driving the heat down, with which I agree. (My disagreement with Fred concerns a more minor point that becomes irrelevant with typical levels of surface turbulence.)

          The paper “Improved estimates of upper-ocean warming and
          multi-decadal sea-level rise” by Domingues (at CSIRO in Hobart) et al in Nature June 19 2008 shows a straight black line in Fig. 1a that looks like about 0.1 petawatts averaged over 45 years for the upper 700 m of the ocean. It also looks like it’s getting steeper and may be approaching 0.2 petawatts by now. There’s some evidence of significant warming deeper down but this is harder to measure and hence evaluate. Email me if you have any trouble downloading it.

          As a caveat these are mere measurements, which don’t address the more theoretical questions you’re asking about the underlying transport mechanisms.

        • Thnx V, I’ve downloaded the paper.

          Merry Christmas

        • Merry Xmas to you too, mate.
          -v

        • Addressing your more theoretical questions, I have several theories targeted for different markets. For those uncomfortable with the thought that a mere 0.039% of CO2 could be heating the top kilometer of the ocean at 0.2 petawatts, one alternative is that a scout from Arcturus landed in the Puerto Rico trench in 1960. In order to punch through five miles of water to be able to communicate at a reasonable baud rate with Arcturus it has had to run its transmitter at 200 terawatts (0.2 petawatts). This heated the bottom of the ocean at that rate, with the top showing only 100 terawatts until recently as the heat from below gradually migrated upwards. We’re now seeing the full brunt of this transmitter in the upper ocean.

          Readers of the late Michael Crichton’s Sphere should find this theory much more reasonable than any cockamamie nonsense about a miniscule amount of CO2 being able to heat an entire ocean.

          A collaborative effort between NASA, the CIA, and a crack team of Navy SEALs is currently working on locating this scout. This would have been a no-brainer had it not kept evading them. Arcturans aren’t as dumb as they look.

        • Here is an answer. The ocean temperature is from an equilibrium of all its fluxes, gaining energy from the sun, and losing it via longwave, and heat flux and evaporation. What GHGs do is to reduce the longwave cooling part of the budget, leading to a warmer equilibrium temperature. It is best to think in terms of equilibrium states, though of course other things like currents and overturning circulations distribute the ocean heat too, while not affecting the net energy content.

        • Thankyou

          Do we know what percentage of the cooling budget is longwave?
          Remembering that the ocean cannot emit longwave from below the surface, I would hazard a guess that this % is quite small, but I of course can be wrong.

          Also, once the ocean surface emits longwave, how can GHGs reduce that emission? All that GHGs can do is absorb that emission and then re-emit it. But this re-emission cannot warm the ocean (as it does on land).

        • I would use Trenberth’s global energy budget as guidance, since the surface is mostly ocean, and that shows that nearly 40% of the solar incoming radiation is offset by the longwave cooling. The net global upward longwave flux is about 60 W/m2.

        • I appreciate your effort Jim but that doesn’t compute with my feeble brain.

          The thrust of my (and IVPOs) question is “How on earth air above deep water is supposed to warm that water.”

          Not Trenberths budget nor anything else I’ve seen explains how air heats ocean water.

          What does “nearly 40% of the solar incoming radiation is offset by the longwave cooling.” mean? Do you mean longwave emitted by the ocean surface? And that’s supposed to be 40% if incoming solar SW?

          There is no way ocean cooling is via 40% long wave emission. If that was the case, oceans would cool a lot more overnight, but they don’t.

          I’ll try and clarify my position.

          Over land, surface absorbs SW and emits this back up as LW, which is in turn absorbed by GHGs and re-emitted (50%) back to the ground. This is what warms the ground.

          Over the oceans, SW is absorbed. The air mass above is warmed (the mechanism is not important here), the GHGs in this air mass emit LW back towards the ocean (50%) but this LW CANNOT warm the ocean as it does the ground.

          So how is AGW suppose to warm the oceans?

        • Have you read the Science of Doom series Does Back-Radiation “Heat” the Ocean?

          http://scienceofdoom.com/2010/10/06/does-back-radiation-heat-the-ocean-part-one/

          http://scienceofdoom.com/2010/10/23/does-back-radiation-heat-the-ocean-part-two/

          http://scienceofdoom.com/2010/12/05/does-back-radiation-heat-the-ocean-part-three/

          It goes into great detail about the mechanics of heat transfer from the ocean to the atmosphere. But the principal is the same as for the greenhouse effect for the land surface. Back radiation doesn’t penetrate the land surface either. Nor does incident solar radiation. The surface temperature has to increase to a level that is higher than the atmosphere above it in order to get net heat flow by convection and radiation from the surface upward. Increase the Teff of the atmosphere and the surface temperature must go up too.

        • Thankyou DWP and others.
          No I hadn’t read those and I will asap, ’tis being christmas and all.
          Merry Christmas to you all.

        • Baa Humbug,

          Not sure if it will help, but you might like to read this also:
          http://pielkeclimatesci.wordpress.com/2009/05/05/have-changes-in-ocean-heat-falsified-the-global-warming-hypothesis-a-guest-weblog-by-william-dipuccio/

          Season’s greetings,

          AB

        • This is a very good article, exactly what I was getting at in my post on CO2 no feedback sensitivity. Given this analysis, how can we make any sense at all of the equation ΔTs = λRF, which relates a change in surface temperature to a change in radiative forcing at the top of the atmosphere?

        • The error in the TOA measurement is at least 3 times the cliamed signal from co2.

          Ocean heat content makes a better measure. This is what I’ve been saying for as long as Pielke. But I have gone further by pointing the way to an understanding of the solar input to OHC. As a privateer with no reputation to lose, I can afford to speculate freely, unlike Pielke Sr.

          http://tallbloke.wordpress.com/2010/07/21/nailing-the-solar-activity-global-temperature-divergence-lie/

        • A comment on ocean heat content is warranted, because as noted above, it is a useful metric for evaluating warming trends. Like surface temperature over the past hundred years, ocean heat content (OHC) during the decades of measurement has trended upward but with short term bumps and dips. One of the better means of assessing OHC is through the rise in sea level. This rise reflects increases in ocean mass due to melting of land ice that then flows into the ocean (the so-called “eustatic” rise). It also reflects a rise due to thermal expansion of sea water (the so-called “steric” sea level change). Both eustatic and steric sea levels have trended upward long term, again with short term ups and downs.

          For data on these phenomena, a good source is
          Sea Level – see both the “time series” and “steric changes” plots.

          For steric data since 2003, see
          Leuliette GRL 2009 . This paper shows a continuation of steric sea level rise after 2003, but interrupted by the 2007-2008 La Nina, demonstrating a concordance between OHC and surface temperatures for that cooling interval. The U. Colorado data show that total sea level has risen significantly since then, and although it’s possible that all that rise reflects a rather substantial increase in ice melting, a shared eustatic/steric contribution is more plausible.

        • A comment on my above comment.
          The Leuliette paper suggested the correlation between the 2007-2008 La Nina and the slight decline in steric sea level. In considering that possibility, I’m inclined to attribute the decline not to the La Nina but to the 2006-2007 El Nino. It was the latter that should have permitted a transfer of heat from the warmed ocean surface to the atmosphere. It will be interesting to learn how steric sea level and OHC have trended since 2008. We know that total sea level has risen.

        • Thnx Arfur, I’ve saved it to my trusty USB key and will get to it as with the others as soon as I can.

          Currently mopping out my granny flat flooded due to global warming streaming down relentlessly from the skys for the past week :)

        • Thank you all for the thoughtful responses to my questions, and excellent links. Allow me to summarize my current understanding:

          For the purposes of discussion, net heat transfer is always from the ocean to the atmosphere, and from the atmosphere to the darkness of space. Increased GHGs, water vapor, and clouds cause trapping/reflecting of LW radiation in the atmosphere which does cause direct heating of the ocean skin. The net effect of this is a reduction of heat transfer from the ocean to the atmosphere and rising ocean temps. Does that summarize current understanding of the processes?

          It seems that while satellite and surface temp records are interesting, the real story of climate change lies in the ocean heat where 80-90% of our heat is stored. It also raises questions as to whether climate sensitivity is uniform or perhaps variable based on the source (sunlight, volcanic aerosols, GHGs etc.) .

        • Your qualitative description is correct. At this level it should not be controversial, although there is always somebody, who will object.

          Estimates numbers can be found from Trenberth, Fasullo and Kiehl: Earth’s global energy budget, Table 2b.

          They conclude that the numbers are still uncertain by several W/m^2, but their numbers should give the right general picture of what happens.

          Each square meter of oceans absorbs 168 W solar radiation, radiates 401 W LW radiation, receives 343 W LW from atmosphere (net LW flux is 57 W). Thus the net effect of all radiation is 111 W/m^2. Evaporation takes 97 W/m^2 and convection of sensible heat 12 W/m^2.

          Taking the very uncertain decimals in the calculation, KT&F get a net flux of 1.3 W/m^2 heating the oceans, but the data is far too inaccurate for the meaningful calculation of this number. Other attempts have given such values as +9.7 and -17.9. This illustrates the uncertainty, although the present knowledge may be a little more accurate.

        • Is a cloudy night warmer than a clear night? CO2 has that effect to a lesser but sustained extent. Imagine the ocean under a permanent thin fog (that is also completely transparent to light) restricting its cooling to space. Eventually it will be warmer than had that fog not been there. It is important to realize that it is not a warming effect, but a slight reduction in a net longwave cooling effect that is there anyway, something like clouds do at night.

        • So as not to be misunderstood, I should emphasize that I agree with Jim D and DeWitt Payne that atmospheric back radiation has a net effect on the ocean that is best described as a “reduction in cooling”, since the net flux is from the ocean surface into the atmosphere. That said, on the level of individual events, that reduction in cooling is attributable to the heating effect brought about when an infrared (IR) photon is absorbed by a molecule of liquid water, followed by thermal excitation of neighboring molecules. Simply put, this is a heating event. The back radiation does nothing to reduce the upward flow of IR photons from the sea surface into the atmosphere, and so it does not inhibit cooling directly, but reduces it by bringing the level of heating closer to the level of cooling. As pointed out above, this process is similar to land-based warming, although in the case of the oceans (particularly in the tropics), latent heat transport via evaporation and convection plays a major role, thereby diminishing the relative importance of radiative cooling.

        • Further details: the ocean skin temperature is very slightly cooler than the temperature of the water molecules directly below, indicative of the net outward flow of heat from the ocean. However, heating of the skin layer by IR photons is incapable of reversing this under ordinary ocean conditions, because turbulent mixing by waves, wind, plus convective mixing rapidly distributes the heat downward within the ocean mixed layer. This phenomenon, rather than the ability of IR photons to escape absorption within the skin layer, is responsible for heat transport to greater depths in the mixed layer (and ultimately into the deep ocean as well). Without the mixing, it is likely that evaporative cooling, which is already an important component of heat escape in the tropics, would play an even larger role.

        • Without the mixing, it is likely that evaporative cooling, which is already an important component of heat escape in the tropics, would play an even larger role.

          An even larger role in what? Evaporation of a kg of water vapor removes 2.26 MJ of heat from the ocean, whether or not there’s mixing.

          What turbulence at the surface can achieve is more evaporation, in two ways:

          1. Increases the surface area. Doubling the surface area should roughly double the rate of evaporation, assuming there’s a breeze. No connection with mixing.

          2. Increases the surface temperature, thereby enhancing evaporation, by bringing up warmer water from a few cm below the surface. Arguably connected with the effect of mixing you have in mind, but permits a more accurate calculation of the effect, namely in terms of rate of evaporation as a function of temperature of the water skin and humidity of the air (partial pressure of water vapor).

        • Vaughan – without mixing, heating of the skin layer would raise its temperature substantially, enhancing evaporation. That is why the mixing reduces evaporative cooling – it prevents the skin layer from heating up. Note that while mixing of the water has that effect, turbulent mixing of the overlying air would enhance evaporation.

        • Here’s a question for you, Fred, to which I don’t know the answer. With still air at 20 °C above still water at 10 °C, which effect dominates: warming of the water skin by the air, or cooling of it by evaporation?

          Evaporating 1 kg of water removes 2.26 MJ of heat from the skin. In order for warming to dominate cooling, the warmer air would have to transfer more than 2.26 MJ of heat to the water before 1 kg of water had evaporated. Conceivable I suppose, although I have a hard time visualizing it.

        • Vaughan – I know we’re discussing unrealistically hypothetical scenarios, but in your scenario, the warmer air would raise the water temperature, and as a consequence of the higher temperature, the rate of evaporation would increase, mitigating but not reversing the warming effect (you can’t cool water by warming it). The heat removal on a per kg H2O basis wouldn’t change, but more kg would evaporate.

          My conjecture earlier is that if the only downward means for surface heat to dissipate is via conduction, which is very inefficient, the skin temperature will increase more than if heat had been removed by mixing, and so upward heat dissipation by all mechanisms, including both radiation and evaporation, would increase.

          I think you made a good point about increased surface area. In the tropical oceans, the skin temperature and the temperature of the overlying air are typically quite similar, I believe (although this varies diurnally and via other factors as well) and relative humidity is close to 100 percent. I’m guessing that the only efficient mechanisms for increasing evaporation are faster dissipation of local increases in humidity and higher temperatures at the air-sea interface, but perhaps a larger evaporative surface would be equally or more important, as you suggest.

        • in your scenario, the warmer air would raise the water temperature, and as a consequence of the higher temperature, the rate of evaporation would increase, mitigating but not reversing the warming effect

          Thanks, Fred. I’ll take your word for it now, since as I said I didn’t know the answer, though you have me intrigued enough to want to do the experiment (or the math) just to convince myself you’re right.

          (you can’t cool water by warming it).

          Ok, let’s try another scenario then. Water at a uniform 95 °C, air at 96 °C. According to you the water skin is going to be warmed by the warmer air.

          My worry about this scenario is that evaporation is now happening at a terrific rate compared to when the water was 10 °C. Yet the temperature difference is now down to a mere 1 °C.

          So you’re telling me that even with this far higher rate of evaporation, and this far lower elevation of air temperature above water temperature, that I still “can’t cool water by warming it.” Is that because the 1 °C extra is completely suppressing evaporation?

          You ok with that, Fred? Everyone else ok with it?

          It’s Christmas in the two Eastern US time zones and everywhere east from there to the date line. Merry Christmas and a specularly radiant Rudolph’s nose to all!

        • My conjecture earlier is that if the only downward means for surface heat to dissipate is via conduction, which is very inefficient, the skin temperature will increase more than if heat had been removed by mixing, and so upward heat dissipation by all mechanisms, including both radiation and evaporation, would increase.

          I’ll buy that if it turns out that even with the 95-96 water-air boundary the warmer air warms the cooler water. If it doesn’t then we need to revisit this.

          Plot the breakeven point where air neither warms nor cools the water at the boundary, with the x-axis from 0 to 100 being the water temperature and the y-axis from 0 to 100 being the air temperature, both in degrees celsius. According to you the plot should be the diagonal y = x.

          I would expect evaporation to push this line up, with the distance from the diagonal increasing with increasing water temperature. Exactly where this curve punches through the horizontal line y = 100 is an interesting question.

          Surely this curve has been plotted before. This could have been been done even before Beer’s law was discovered by Pierre Bouguer in 1729 (if not earlier). With what we know today about evaporation and the conductivity of air and water, this should be a routine homework problem for a freshman thermodynamics class.

        • Returning to the question on what happens, when water is at 10 C and air 20 C.

          Whether the water cools or warms depends on the moisture of the air. As long as the dew point of air is lower than the temperature of the water, it is possible that the water cools further. (This is the idea of the wet thermometer used to determine the dew point and from that the moisture.)

          Over longer periods the flow of air is important in maintaining the moisture of the air lower than that corresponding to the dew point equal to the temperature of the water.

        • Whether the water cools or warms depends on the moisture of the air.

          Excellent point. Although I didn’t say, the graph I was asking about was for dry air. The graph for moist air should be lower, depending on the humidity. However it should never drop below the diagonal y = x, yes?

          In general the breakeven point, as the air temperature where there is no air-water heat exchange, would be a function of two parameters, temperature of the water and humidity of the air.

        • Over longer periods the flow of air is important in maintaining the moisture of the air lower than that corresponding to the dew point equal to the temperature of the water.

          Right, that was the breeze I was talking about.

        • It is called friction and the transfer of energy.

        • Vaughan,
          To be more precise: In a very thin boundary layer the temperature of air is always very closely the same as the skin temperature of water and the relative humidity is 100%. How strong is the gradient of temperature and humidity depends on mixing processes: convection, advection and related turbulence. When mixing is strong the boundary layer is very thin and gradients large in this layer, which leads to more efficient cooling of the water, when relative humidity is less than 100% in air close to the surface but outside the boundary layer.

          Half of energy of solar radiation penetrates sea water to a depth of perhaps 15-20 m. This means that without mixing the water would be warmer at these depths than at surface. This leads to a mixing of the top layers of the ocean even without any advective turbulences. The temperature is essentially constant through this layer. Turbulent advection leads to further mixing with lower layers, which cools the surface layer in most cases. Thus there is both a warming effect from the radiation that penetrates sea water and a cooling effect from mixing with deeper layers.

          In arctic waters the surface is often colder than lower layers. The salinity and prevailing winds plays also a big role in the resulting large scale dynamics, which brings warmer surface water to arctic areas and colder deep water towards the equator.

        • Pekka and Vaughan – I’m inclined to stick with my conclusion that you can’t cool water by heating it. A wet bulb thermometer does not contradict this principle. It demonstrates that evaporation can remove heat from water, but not that if you apply heat to water, the water temperature will go down.

          I believe that a couple of ingenious thought experiments could be designed to show that the alleged cooling violates the Second Law and/or the Maxwell-Boltzmann distribution, but in fact, you can do a real world experiment instead. Fill a pan with about 3-4 cm of water in a low-humidity room, insert a thermometer into the water, and then apply a strong heat source. For the atmosphere, an analogy would be a heat lamp shining on the water (with the thermometer shielded), but as long as the water is kept mixed for uniform temperature, the source is irrelevant, and it would be simpler to put the pan on the stove and turn on the burner.

          Observe the thermometer to see whether the water gets colder (your prediction) or warmer (my prediction).

        • Certainly you cannot cool water by heating it, but equally certainly you can cool it with air of a higher temperature but lower dew point. In this case both the water and the air cool as energy goes from sensible heat to latent heat.

        • you can cool it with air of a higher temperature but lower dew point.

          Is “lower dew point” more than just a roundabout way of saying “less than 100% humidity”?

        • The sentence is not as it should be.

          I meant to say that cooling is not possible to a temperature below the dew point, which is synonymous to wet temperature and is the temperature where the saturation humidity is equal to the absolute humidity of the air flowing near the surface.

        • …and the air sufficiently near the surface would presumably be 100% humidity.

        • In a very thin layer the temperature of the air would be the almost the same than that of the water and humidity near 100%, but both values have often large gradients which transfer moisture away from the surface by diffusion and move sensible heat by conduction. Convection and advection are important beyond this first and very thin boundary layer. There the temperature may already be different and humidity well below 100%.

        • Agreed. Perhaps there’s a better question waiting to be formulated.

    22. Judith,

      I tried to respond to a post by Vaughan Pratt on the Confidence … thread on this continuation thread. I clicked on Reply to myself at the top of the document, and posted the response. I didn’t realize that clicking that reply took me back to the Confidence … thread, so I wound up posting in the wrong place.

      Maybe that could be fixed so that the Reply button on the seed topics at the top open a reply on the new thread.

    23. (The following was accidentally posted on the Confidence … thread. I repost it here because of its importance to the subject.)

      Vaughan Pratt 12/24/10 at 1:49 am, posting on Confidence … thread.

      Quoting me, you wrote,

      >>>> Presumably, these investigators are equating the real world of gas absorption and their HITRAN based models of it.

      >>How are these different? I thought we’d dealt with that already.

      Muy excellent question.

      I don’t know what you might have thought, but the real world and scientific models are quite different. Physicists rather routinely make the mistake of confusing the two. Here is a list of things found in models but not found in the real world:

      Parameters, values, numbers, coordinate systems, rates, ratios, density, scales, units, equations, graphs, infinity, infinitesimal, categories, taxonomies, dimensions, weights, measures, standards, thermometers, meter sticks, clocks, calendars, uncertainty, mathematics, logic, language.

      The real world, whether from space or from a sample in the laboratory, provides a limited range of signals for our senses and our instruments. Science builds models from these intercepted signals, using things from the list, which you will note are all man made, and makes predictions using things from the list, with tolerance bands. The validation comes from real world measurements not used in forming the model that fit the predictions within the stated tolerance.

      So what is needed here are HITRAN predictions validated by real world measurements, and more particularly, what we’re looking for is how the total intensity of radiation after gas filtration depends on gas concentration. This is not a question about the spectral density of the filtered radiation, nor how well the modeled spectral density fits a measured or derived real world spectral density.

      The difference between the real and models contains the essence of science. The model tracks the real world as is known by data – measurements, observations quantified and compared to standards, also known as facts. When predictions have proven accurate, we have validation in basic science and closure in technology.

      When a scientist begins to believe his models are the real world, he begins to rely on model runs as if they were real world experiments.

      We have a number of posters here who are relying on the output of calculations with HITRAN as validation. They find models or analysis validating models and analyses. IPCC regards GCMs producing similar results as validation, or toy models validating AOGCMs. By reliance on this method, these investigators are not dealing with science.

      • (Reposting my reply to Jeff here for completeness.)

        So what is needed here are HITRAN predictions validated by real world measurements,

        How would this differ from the current HITRAN database? Extra columns? Someone’s stamp of approval affirming that they’d validated the database using real world measurements? Something else?

        and more particularly, what we’re looking for is how the total intensity of radiation after gas filtration depends on gas concentration

        You may be underestimating the complexity of that dependence. Here are some of the more important factors.

        1. Dependence of line widths on (total) pressure on account of pressure broadening. (This dependence btw invalidates Beer’s law for monochromatic radiation because the absorption coefficients of the constituent GHGs decrease with decreasing pressure [at least off the center of the line].)

        2. Direction of the radiation. (Photons going straight up encounter the fewest opportunities for capture before reaching space; the probability of capture increases with increasing angle from the vertical.)

        3. Variations in lapse rate and tropopause altitude as a function of latitude and season. (Lapse rate and tropopause altitude are significantly less at the poles than the equator.)

        There is no one uniform dependence on mixing ratio. Determining the goodness of fit of the logarithmic dependence of surface temperature on CO2 level to actual total dependence is an extremely complex thing to estimate.

        Note that one never measures anything in the real world exactly. The best one can ever do is estimate it to within whatever your direct measuring and indirect calculating tools permit.

        Indirect calculation as a supplement to direct measurement is useful when it makes the estimate more accurate than the direct measurement. For complex things like dependence of surface temperature on GHG mixing ratios, good estimates depend crucially on supplementing measurement with calculation.

      • Let us break this out a bit.

        First HITRAN, GEISHA and all of the other spectroscopic databases are DATABASES. That is they are collections of observational results from experiments, usually IR absorption experiments, put into a common format, so to say that HITRAN has not been validated by experiment is simply not to recognize what it is. Links to the original data are provided by the HITRAN team (often in regular publications in the Journal of Molecular Spectroscopy or Applied Optics after the HITRAN conference). The statement

        So what is needed here are HITRAN predictions validated by real world measurements, and more particularly, what we’re looking for is how the total intensity of radiation after gas filtration depends on gas concentration.

        calling for an “experimental” verification of HITRAN, which is a collection of experimental data, is either a total lack of understanding of what HITRAN is or a purposeful effort to mislead. You choose.

        • Most of the data in HITRAN does not come from experiments but from quantum mechanical calculations of the molecular properties. By this I do not mean that I would not have as much trust in these physical theories and models. Very many results of these models have been verified by experiments, but the models produce the data of the database much more efficiently and also more accurately than detailed experiments could produce in practice.

          The HITRAN FAQ describes the origin of the data as follows:

          The parameters in HITRAN are sometimes direct observations, but often calculated. These calculations are the result of various quantum-mechanical solutions. The goal of HITRAN is to have a theoretically self-consistent set of parameters, while at the same time attempting to maximize the accuracy. References for the source are included for the most important parameters on each line of the database.

        • Pekka,
          Does the theory or experiment continue past the molecule?
          What is the disruption to the surface past the molecule that used to absorb heat?
          These experiments do not go far enough in understanding that more than one source of energy is involved.

          How much science do you think is corrupted by bad theories for our overall knowledge base?
          Many people working in science know of mistakes made but is covered up for the correct outcome?

          Even for proper temperature measurements, we should be recording the atmosphere and the ground penetration of solar energy for actual temperature differences going through different gases building up.
          This would be able to tell if more energy is being held in the atmosphere or allowed to penetrate the planet surface.

        • Joe,
          On the microscopic physics level all the theories needed to understand the processes of the atmosphere and oceans are well known, reliable and also accurate. Many effects can be understood very well based on these physical theories of statistical thermodynamics, fluid mechanics, electromagnetic radiation and quantum-mechanics. This physical knowledge explains qualitatively also macroscopic processes that are too complicated for full physical calculations. Thus there is a good general understanding of all important processes that occur in the oceans and the atmosphere, but there are also very many things that cannot be calculated now. Some of them may remain too complicated to calculate forever.

          All significant forms of energy are certainly known and so are the mechanisms for their transport and conversion to other forms.

          All major difficulties of more comprehensive calculation are due to two reasons. Solving the Navier-Stokes equation turns out to be extremely difficult as the turbulence is a chaotic process and the boundary conditions are also very complicated in particular in the oceans. The other difficult process is the condensation of water, which does not happen immediately, when relative humidity exceeds 100%, but with significant and difficult-to-handle delays.

          Building an accurate and reliable GCM remains a major problem, but on a smaller scale the transfer of energy is much better known, when the actual status of the atmosphere and oceans is given on the basis of observations.

        • Pekka,
          One area NEVER explored or mentioned is planetary rotation and solar rotation.
          Energy is particles and on a rotating sphere generate another energy of centrifugal force. This makes the whole area of science far more complex. Without centrifugal force, there would be no motion. Just gases and chemicals plastered to the planet surface due to atmospheric pressure and electro-magnetics. This CAN be mechanically reproduced.

          Also too excluding rotation has made the other areas of physics incorrect as now another force HAS to be included to understand how and what this planet has achieved through it’s history.
          Current physics cannot stand-up to history and the planetary changes before physics was even considered. The LAWS disintegrate when motion is slowed, like this planet.

        • Rotation is taken into account where it matters, but these discussions have not gone so far into the details. It is very important in the large scale motions of air and water. These are important due to their advective effects. The total energy of winds, e.g., is quite large and the energies of jet streams are a significant factor of all wind energy. The jet streams are one example of processes that are influenced by the rotation.

          The rotation is also the source of tidal energy, but it is pretty small compared to other flows of energy.

        • Pekka,
          Newton’s Laws of motion created 300 years ago was studied from Picco’s rotating table and still papers were published to the 1980’s on this tables rotational properties.
          This understanding and the Laws that were generated from this does not show what is happening at the molecular scale.
          Giving a fan energy to rotate then stopping this energy, the inertia will still rotate until molecular friction from the air stops it. Where is the stored energy that keeps this motion going until it finally stops? How is this energy stored? What is this energy?
          Pekka, are you willing to be shown a whole different world of motion that has a big effect on understanding planetary science?

        • Joe,
          Your description seems to refer to the dissipation of kinetic energy through turbulence to heat. Turbulence cannot be calculated in detail, but the thermodynamics related to the dissipation is well understood.

          It is amazing, how little heat results from violent macroscopic movements. The explanation is in the typical speeds of gas molecules in thermal motion. The typical speed of a nitrogen molecule at 15C is 400-500 m/s. Almost all macroscopic motion is very slow in comparison and the kinetic energy is proportional to the square of the speed.

        • Pekka,
          Turbulance probably could be measured if you knew the density volume of air in that space to the rotational speed and the time frame it took for the object to stop rotating. You also would have to have and accurate weight of the object as well and the material would all have to be the same as different materials have different densities.
          The kinetic energy you refer to on a mascopic scale stores energy by changing it’s density. A centrifuge separates molecules by the density of material in rotation.

        • The missing word here is vortex, as with a plane’s contrails, which can be quite long-lasting. Smoke rings are another stable form of vortex. I would guess they move because the outside has more surface, and hence more traction on the adjoining stationary air, than the inside.

          That the smoke stays with the ring shows that there is relatively little air exchange between the ring and its environment. Furthermore there is very little sign of turbulence at the sliding interface. Hence the angular momentum of the rotation can be assumed to be being dissipated very slowly by what little turbulence there is.

          By symmetry the center of rotation is a circle; it’s a nice question what the radius R of that circle is relative to the radius r of the geometric center (the mean of the inner and outer radii). One might imagine that R = r, but since air is effectively incompressible in this situation (no pressure to compress with), and since the total momentum of the molecules should equal that of the moving ring, R should be larger than r.

          What’s the “different world of motion?”

        • Eli Rabett 12/25/10 5:34 am,

          You may not realize that you are joining a thread in progress. Your claim about HITRAN being a database was already urged by DeWitt Payne. He went further to claim that the method of calculating with HITRAN didn’t matter: “you could even write your own line-by-line program”.

          Of course, it does matter. GCMs make calculation with radiative transfer codes (AR4, Ch. 10 Executive Summary, p. 751) or parameterizations of radiative transfer equations (AR4, ¶10.2.1.5 Implications for Range in Climate Response, p. 759. However, a survey of a dozen GCMs showed a total longwave forcing between 2.99 and 4.23 Wm^-2, which is 3.61 Wm^-2 with a peak-to-peak variability of 34.4%. AR4, ¶10.2.1.3, Table 10.2, p. 758.

          If, for the sake of argument, Payne were correct, then the dependence of CO2 radiative forcing on the logarithm of concentration would be a consequence of the information in the database. Two questions arise: why, and has the result been validated? Validated meaning scientific validation: model predictions satisfied by measurements, in situ or in the laboratory.

          IPCC asserts that CO2 does not saturate because, referring to the band around 15 micron, of “the band’s wings. It is because of these effects of partial saturation that the radiative forcing is not proportional to the increase in the carbon dioxide concentration but shows a logarithmic dependence. Every further doubling adds an additional 4 Wm^-2 to the radiative forcing.” TAR ¶1.2.3 Extreme Events
          , p. 93. IPCC provides no citations, no analysis, and no data in support of the existence of the band wings.

          So the question reduces to have the band wings, for example around 15 micron, been validated? Andy Lacis thinks they have and haven’t:

          >>Radiative transfer is based directly on laboratory measurement results, and as such, has been tested, verified, and validated countless times. … [¶] Current technology measurement capabilities are not adequate to measure directly the radiative forcing of the GHG increases. A Lacis 12/9/10 10:49 on Confidence … thread.

          Petty shows the band wings around 675 cm^-1. Petty, G.W., “A First Course in Atmospheric Radiation”, 2nd Ed., 2006, Figure 9.10(b), p. 271. Pierrehumbert, a TAR contributing author, shows the same diagram, saying that the results are “synthesized” and have been “supplemented by theoretical calculations” [sic]. Pierrehumbert, R.T., Principles of Planetary Climate, 7/31/07, Figure 4.7, caption, p. 105. The assumption is that Pierrehumbert meant that the calculations were real, but based on a model that was actually less than a scientific theory, that is, not validated.

          Despite repeated challenges in these threads, no one has been able to produce empirical evidence for the logarithmic assumption, either directly by total transmissivity across the full IR band of interest, or by measurements of the band wings. Your statement that HITRAN and other data bases are “collections of observational results from experiments” is not true. Your statement “to say that HITRAN has not been validated by experiment is simply not to recognize what it is” is false.

          IPCC’s AGW theory hinges on the logarithmic assumption. As shown in these threads, the notion that a constant 3.7 Wm^-2, for example, for each doubling of CO2 concentration is identically the same as the logarithmic assumption. That assumption is at best a hypothesis, having not been validated, and limits what can be claimed for the AGW model. Posters here seem to rely on calculations with HITRAN as evidence, but that is a bootstrap that does no more than point to the location of the hole in the story.

          Posters urge skeptics (i.e., scientists) to study the history and structure of the HITRAN database. First, the burden is on those making claims to bring forth the evidence. No one else should have to search for it, or for what those posters mistakenly took to be evidence. Secondly, why don’t calculations with the HITRAN database produce consistent results? Surely the answer must be that the calculations also depend on a number of other assumptions, especially about the structure of the atmosphere, and the quest for an atmospheric model out of the infinity of possibilities that will produce a useful global average surface temperature. Until we can answer the questions about band wings and total transmissivity, the logarithmic dependence in models might be arising from assumptions about the structure of the atmosphere and not of CO2.

          Thirdly, the importance of radiative transfer in this application is no greater than the importance of radiative forcing, which is given by IPCC’s climate sensitivity parameter, λ. IPCC puts ¶lambda; at 0.5 ºC/Wm^-2. However IPCC incorrectly estimates that number with GCMs run open loop with respect to cloudiness and cloud albedo (we have to specify cloud albedo because IPCC uses the term to mean specific cloud albedo, that is, albedo per unit area). IPCC’s value for the climate sensitivity parameter appears to be too large by a factor between 7 and 10. Just as the greenhouse effect is mitigated by cloud albedo negative feedback, radiative forcing and radiative transfer are mitigated.

          When the absorption model is validated, it might be that the CO2 radiative forcing is logarithmic in the gas concentration between 280, say, and 1000 ppm with an accuracy of x Wm^-2, one sigma. It cannot be logarithmic in the gas concentration unqualified. And it cannot be assigned an accuracy without empirical evidence.

          I am not, as you claim, calling for experimental, with or without the quotation marks, verification of HITRAN. I am calling for those who, like you, claim HITRAN has been validated to reveal that validation for band wings or transmissivity, and while we wait, everyone should recognize the hypothetical nature of radiative transfer.

        • HITRAN is not a line by line program. HITRAN is an INPUT to a line by line program. FWIW.

    24. Vaughan Pratt 12/24/10 at 4:57 pm, posting on Confidence … thread.

      You:>>>>So what is needed here are HITRAN predictions validated by real world measurements,

      >>How would this differ from the current HITRAN database? Extra columns? Someone’s stamp of approval affirming that they’d validated the database using real world measurements? Something else?

      I have never seen a model published or reported with its validation. Sometimes, and sorry to say rarely, a model is published with its raw data, and when that is done, it’s a blessing. We have a mechanism for the latter. Data points are marked with symbols and the model with lines for graphs, and with tables and equations for text. How would it differ? Well, we have no validating data for HITRAN. No one has been able to point to predictions confirmed with measurements, either in the total absorbed EM or in the band wings. I’m not saying it doesn’t exist, but if it does, I want to examine it. If it doesn’t exist, the world needs to know that the HITRAN database is no more than a hypothesis. The form of the validating data would be in a published paper.

      You say, >>>>and more particularly, what we’re looking for is how the total intensity of radiation after gas filtration depends on gas concentration

      >>You may be underestimating the complexity of that dependence. Here are some of the more important factors.

      The problem, as you point out, is horribly complex — from the standpoint of applying radiative transfer. Not so from the standpoint of climate. What climate needs is a model for the global average surface temperature. The climate requirement is not at all for the structure of the atmosphere, e.g., lapse rates for pressure, gas concentration, temperature, humidity, cloud cover, gas absorption parameters. In fact, the description of the atmosphere is not unique for a specific surface temperature.

      If those internal parameters can be used in a larger model that predicts climate, SCORE. If those parameters do not produce a validated prediction of temperature, they are extraneous and should be discarded under the Principle of Parsimony (Occam’s Razor). The radiative transfer specialists pretend to have something useful (or at least salable). The fact that their task may be tortuous or in its infancy evokes no sympathy. It marks a place for academic study, but has no contribution to make to an eager climate modeler. Climate models will simply go on without radiative transfer.

      As I indicated before, radiative transfer links to climate by a couple of linearizing parameters which themselves IPCC grossly overestimates for its catastrophe prediction. These are the slope of the conjectured logarithmic dependence, 3.7 Wm^-2 per doubled CO2 concentration, and the climate sensitivity parameter, λ = 0.5ºC/Wm^-2. The first mistake arises from the unsupportable assumption that the dependence is logarithmic, and the second arises because IPCC models run open loop with respect to cloud albedo. Using reasonable estimates for these numbers, the importance of CO2 radiative forcing, and hence of radiative transfer, dwindles to negligible with respect to a first order estimate of climate.

      You say, >>Note that one never measures anything in the real world exactly. The best one can ever do is estimate it to within whatever your direct measuring and indirect calculating tools permit.

      In fact that every measurement has an error is axiomatic in science. Your analysis suggests creating ever more accurate measurements might be a goal, but that is not what science demands for validation. To validate a model, the model needs to make a non-trivial prediction, complete with tolerances. Then by experiment, measurements of the prediction which fit inside the tolerance bands, taking into account measurement errors, are confirming measurements. Sometimes a single measurement or demonstration is sufficient, as in a volcanic eruption, sometimes a large set of measurements are needed for reduction to statistics and elimination of flukes and false positives, as in temperature readings.

      You say, >>Indirect calculation as a supplement to direct measurement is useful when it makes the estimate more accurate than the direct measurement.

      That seems to be smearing model predictions and validating measurements into some joint estimate. These are two separate things that need to remain distinct.

      • VP: Indirect calculation as a supplement to direct measurement is useful when it makes the estimate more accurate than the direct measurement.

        JG: That seems to be smearing model predictions and validating measurements into some joint estimate. These are two separate things that need to remain distinct.

        Only to those who suspect the model. For example when one ship fires shells at another, the splashes of the misses tells the gunner how to change the aim. But if two friendly observer ships each make four synchronized observations of the shell’s position in flight and triangulate these to come up with four 3D in-flight positions, one can then uniquely fit a parabola to these, predict where the shell will land, and adjust accordingly before the predicted splash actually happens. This technique permits a greater rate of fire.

        (This is using only the fact that four points determine a parabola. Using the position of the firing ship, the verticality of the axis of the parabola, and the time of the in-flight positions relative to the time of firing, only one point is needed.)

        This is an example of combining measurements (the four 3D positions) and a model of shell flight (a parabola) to estimate where the splash will be before it happens. As long as the estimate is off by significantly less than the radius of the intended target this is a useful technique.

        If you don’t trust the parabola model of ballistic trajectories then you should as you say maintain the distinction between model predictions and validating measurements.

        In your case it would be a question of whether the information in the HITRAN database meets its specifications. If it does then there is no reason not to use it to estimate values. If it does not then we could discuss the ways in which it fails to meet its specifications.

      • The first mistake arises from the unsupportable assumption that the dependence is logarithmic,

        Ok, I understand your unwillingness to accept people’s arguments for why it should be considered logarithmic. That said, do you have any reason to suppose it follows some other law than logarithmic? If so then what law do you suggest?

        When I look at the HADCRUT3 data, I am unable to find a better fit to the observed temperature increase than that given by the logarithmic law. No other dependence of temperature on CO2 that I’m aware of gives as good a fit. Hence empirically at least, surface temperature appears to me to rise logarithmically with CO2 level. This entails no reference to HITRAN data, spectral lines, etc., only CO2 level as measured at Mauna Loa and global temperature as given by the HADCRUT3 data since 1850. I was very surprised to see the law borne out so accurately.

        If you have a different law to suggest I’ll be happy to see whether it fits the HADCRUT3 data even better than the logarithmic law. Always a possibility, since there are some tiny discrepancies, albeit of a rather local nature.

        • Well Vaughn, when data has been “adjusted” to a higher trend, it WILL make the underlying drivers “appear” different than what they actually are. Try cleaning up the data and you may find some reality that is consistent and understandable.

        • Try cleaning up the data and you may find some reality that is consistent and understandable.

          If that’s what you found then please don’t keep us in suspense.

        • What I found??

          HAHAHAHAHAHA

        • Vaughan, regarding your “only CO2 level as measured at Mauna Loa and global temperature as given by the HADCRUT3 data since 1850.” Mauna Loa does not go back to 1850, so are you using something else, or not going back to 1850?

          Regarding the great fit, Howard Hayden makes an interesting argument. Given that CO2 is only one of many supposed forcing and feedback agents we should not expect this good a fit. Hence the fit is a puzzle that needs to be explained, not merely observed. Hayden argues that this fit is evidence that the CO2 levels are driven by SST’s, which have a really good fit using certain data. If he is correct then CO2 levels are not due to human emissions and the A in AGW falls.

        • Mauna Loa does not go back to 1850, so are you using something else, or not going back to 1850?

          Excellent question. The raised-exponential shape of the Hofmann formula 280+2^((y-1790)/32.5) ppmv is a good fit to the Keeling curve over 1958-now. Hofmann’s rationale for the choice of raised-exponential as the function to fit is not however based on the quality of fit (since cubics can be made to fit about as well) so much as on the exponential growth of population composed with that of technology. It is therefore reasonable to extrapolate it backwards.

          Normally one would expect a 100-year extrapolation to drift, but in this case our best estimate of 280 ppmv for pre-industrial CO2 means that the curve can’t drift very far from actuality before returning to its expected value in the 18th century. Furthermore after taking the binary log of Hofmann’s curve with 65.5 year smoothing and then multiplying that by 1.88 (the estimated climate sensitivity in °C per doubling of CO2), the resulting curve, shown in blue here, fits the HADCRUT3 record (shown in red) with a goodness of fit of r² = 0.0021 when similarly smoothed to 65.5 years.

          This fit is achieved with very little processing. First the data (HADCRUT3) and model (binary log of the Hofmann law) are centered on their respective means in preparation for a least squares fit. Both are then smoothed with a moving average window of 65.5 years to eliminate the AMO and all faster processes from the data while distorting the model in the same way. This loses 65.5*12 = 786 months from the 1930 months of data yielding two 1144-point curves d for data and m for model. Treating d and m as 1144-dimensional vectors, we seek a scalar s so as to make the residue r = d − sm orthogonal to (i.e. independent of) m, that is, (d − sm).m = 0. But (d − sm).m = d.m − sm.m, which vanishes when s = (d.m)/(m.m) (this is the idea behind Gram-Schmidt orthogonalization). The actual values in this case are d.m = 9.407 and m.m = 4.992, whence climate sensitivity s = 9.407/4.992 = 1.88 °C/doubling of CO2. We then add back the mean of the original HADCRUT3 data (which was -0.2125) to both d and sm to move them down to agree with where WoodForTrees shows the smoothed data.

          This is a clear-cut and well-defined procedure for calculating instantaneous climate sensitivity (as distinct from the IPCC’s notions of transient climate response which postulates a delay of 20 years, corresponding to sliding the model m 20 years to the right of d before fitting, which is quite reasonable though 30 years would be more realistic, and equilibrium climate sensitivity, which is the eventual response of a step-function increase in CO2, which is completely unrealistic). It is also completely transparent: all the math is shown above, and if you know how to center data (just subtract the mean), compute moving averages (just sum the nearest 786 values and divide each sum by 786) and dot products (x.y = sum x_i*y_i over i) then you can check the whole thing yourself, nothing is hidden here. This is surely the most transparent, DIY way of computing climate sensitivity there could be, while neatly disposing of the considerable noise in the signal.

          Given that CO2 is only one of many supposed forcing and feedback agents we should not expect this good a fit.

          Regarding forcing, the last table here shows CO2 forcing to be 60-65% of the total. Furthermore all the forcing agents appear to be growing at similar rates, whence the rate of growth of CO2 can be taken as a reasonable proxy for the whole ensemble. On that basis we should actually expect a good fit.

          Regarding feedbacks, these were in equilibrium before CO2 came along, whence the distance they need to move to find a new equilibrium should be correlated with CO2. So those too should not harm the fit to a great degree. Water vapor in particular appears to have increased some 4% since the 1970s, which may have been caused by the warming caused by the CO2, see the fifth paragraph of my earlier post on clouds.

      • Second,

        The statement

        We have a mechanism for the latter. Data points are marked with symbols and the model with lines for graphs, and with tables and equations for text. How would it differ? Well, we have no validating data for HITRAN.

        Packs more incorrect information into three sentences than Eli would have thought possible.

        First the trivial, the density of points needed to describe the data, both from the experiments and the DATABASE is so high, that you cannot meaningfully mark the points by symbols.

        Second, as pointed out in a comment, not too far above, the DATA is in the DATABASE, where do you think it comes from? So what you are asking for, a validation of the line lists in the data base as opposed to that from the original report is inane.

        Third, a brief comment on what one finds in HITRAN and spectroscopy papers. First, there is a report on the experiment, often accompanied by a list of observed lines, although increasingly this goes into supplementary materials. Second, the authors develop a description of the nuclear motions and the coupling between electronic, spin, and vibration by building a function called a Hamiltonian involving free parameters. The Hamiltonian is applied to appropriate wavefunctions to generate a spectrum which is matched to the observations by adjusting the parameters. In practice the accuracy and precision is astounding.

        Let us see where this gets you. Well you could look at the HITRAN report in JQRST from 2004. Take a look at Fig. 2 p 154 comparing observed and calculated spectra from Linda Brown’s work.

        • Eli, your reference is not quite impressive as you would think. Looking at Fig.2, you could notice that the fit is either at peaks (no wonder, the whole HITRAN is just a fit table), or where the sample is totally transparent (what a big deal). Incidentally, all areas related to line wings are off by 2-4%. If I understand correctly, these “gray” areas are exactly where the effect of concentration CHANGE comes from. I understand that Lorenzian and Voigt shapes are topics from deep past of spectroscopy, and your recent deep excitement with Hamiltonians, but could you please produce an article that would show how the spectral wings are reproduced across all pressures and temperatures found in atmosphere? You know, if a sample tube has 3% error in most important areas, and authors kind of forgot to tell where the errors come from and forgot to supply line-resolved illustrations, what could be a result many-many tubes lined up across the atmosphere? Please forgive me for this skeptical inquiry.

        • Eli Rabett 12/25/10 6:26 am,

          You say, >>>> We have a mechanism for the latter. Data points are marked with symbols and the model with lines for graphs, and with tables and equations for text. How would it differ? Well, we have no validating data for HITRAN.

          >>Packs more incorrect information into three sentences than Eli would have thought possible.

          The purpose of the dialogue is to train the Elis, to expand their thinking, and in particular, their critical and constructive thinking.

          >>First the trivial, the density of points needed to describe the data, both from the experiments and the DATABASE is so high, that you cannot meaningfully mark the points by symbols.

          You overlook the alternative given above: tables and equations.

          You were too anxious to criticize.

        • Richard S Courtney

          Jeff Glassman:

          You say;
          “The purpose of the dialogue is to train the Elis, to expand their thinking, and in particular, their critical and constructive thinking.”

          Some things are not possible in this universe. So, with respect, I suggest that there is no purpose in wasting time and effort attempting to achieve them.

          Richard

    25. Wow, this same discussion goes on over and over again in blog after blog, without any resolution. I think Judith says it all in her post when she says:

      “Either way, I can find no real-world measurement of the contribution of CO2 to the GE. This, to me is absolutely crucial to the debate. If one doesn’t know how much effect CO2 has initially (I take ‘initially’ to be circa 1850), how can one know how much effect an increase is likely to have?”

      In real science, empirical evidence is the final “proof.” Y’all can argue forever about backradiation, Tyndall, HITRAN, etc., etc., and it simply won’t matter. We need some empirical evidence. AND: it seems to me that, SO FAR, the extant empirical evidence indicates that CO2 has no significant effect at all. The record for last 15 years sustains the skepticism. Even after all NASA’s efforts to rig the data!

      • What data did NASA “rig”? And what’s important about the last 15 years?

      • “Either way, I can find no real-world measurement of the contribution of CO2 to the GE. This, to me is absolutely crucial to the debate. If one doesn’t know how much effect CO2 has initially (I take ‘initially’ to be circa 1850), how can one know how much effect an increase is likely to have?”

        JAE, my take: the quote is from Arfur Bryant, not curryja.

    26. OK, my bad, it was Arfur. I hope JC agrees. I sure do.

      D….64: you must be new to this stuff. Check out the “Watts up with that” blog and search for NASA temperature data posts. You will (1) be absolutely gobsmacked at how a famous governmental agency is trying to deceive the public (in which case you are really trying to learn something), or (2) willing to ignore the posts, or not even read them, signifying that you are a liberal-leaning sheep who is willing to be sheared “for the good of the kids,” or something like that!

      • Hmmm, one of the most respected scientific institutions in the world or some random blog? I remember when little kids dreamed of being someone at NASA. Then they grow up, read some guy slander them, and decide they are deceiving everyone. Pure craziness.

        The good news is you don’t have to take my word for it, or NASA’s, or think of this post as ad hom. You can actually learn for yourself; NASA makes their code freely available, and with plenty of literature to describe their methodology. Watts on the other hand still does not even know elementary statistics (hint: when you compare different datasets that report in anomalies you need to compare them on the same baseline)

        • I also continue to hear all of this glorifying of “empirical evidence!” yet apparently spectra from space, back radiation, documentation of the spectral features of CO2 at atmospheric conditions does not apply. Pray tell, what to such people is “empirical evidence?”

      • So many words, JAE, so little said, and most of that utter nonsense.

      • You will (1) be absolutely gobsmacked at how a famous governmental agency is trying to deceive the public (in which case you are really trying to learn something), or (2) willing to ignore the posts, or not even read them, signifying that you are a liberal-leaning sheep

        I think JAE underestimates the scope of this conspiracy, which started out very small more than a century ago but has been picking up steam in recent years. Most of the world seems to be caught up in it at this point. Things are playing out very much like in Ionesco’s Rhinoceros where gradually more and more people turn into rhinoceroses. Eventually only the hero Bérenger remains unchanged, initially through sheer willpower but in the end finding himself unable to turn into a rhinoceros even if he had wanted to.

        Like many I had very little willpower to resist the climate movement, and became a climate rhinoceros early on. Some of those who have successfully resisted can be seen here: JAE, Latimer Alder, Bryan, Joe Lalonde, Jan Pompe, and so on.

        Presumably their willpower enabled them to resist in the beginning, but now it is no longer clear whether they need willpower. Even if they change their mind later on and decide, whether for financial or other reasons, that the time has come to join the climate conspiracy, they may find themselves unable to bring themselves to do so. For them getting on the conspiracy bandwagon may be as hard as it is for others to get on the water wagon or the smoke-free wagon. Quitting is not always a simple matter of snapping out of it.

        The point of the conspiracy is of course financial: the conspirators plan to extract money from the non-conspirators. As is well known we conspirators have our eye on the $47 trillion in the pockets of the non-conspirators.

        But this conspiracy is too good to be true. If we conspirators outnumber the non-conspirators, there isn’t going to be much to divide among us once we’ve picked the non-conspirators’ pockets. Especially if your average non-conspirator is not in the upper half of the economic spectrum.

        I think the non-conspirators are going to have to ascribe some other motive than financial to us conspirators. Like health, for example. The surgeon-general has this interesting theory that too much drinking and smoking is unhealthy. Likewise we climate conspirators have this interesting theory that too much CO2 in the atmosphere is unhealthy for the planet’s inhabitants. We’re health nuts. Not a hard motive to understand.

        That second-hand smoke and excess CO2 are hazardous is just a theory. And I’m just another rhinoceros.

    27. An image springs to mind of a room full of people, all holding signs, some reading “P” and some “not P.” There seems to be a high correlation between those with their eyes closed and those heard complaining “You are not looking at my sign.”

      • All traditional logic habitually assumes that precise symbols are being employed. It is therefore not applicable to this terrestrial life,but only to the imagined celestial one.The law of the excluded middle (A or not-A)is true when precise symbols are employed, but it is not true when symbols are vague (fuzzy), as in fact all symbols are.

        Bertrand Russell. 1923

    28. chriscolose:

      “. You can actually learn for yourself; NASA makes their code freely available, and with plenty of literature to describe their methodology. Watts on the other hand still does not even know elementary statistics (hint: when you compare different datasets that report in anomalies you need to compare them on the same baseline)”

      Just YES. They have actually provided the rope that hangs them. It’s hillarious.

      AND:

      “I also continue to hear all of this glorifying of “empirical evidence!” yet apparently spectra from space, back radiation, documentation of the spectral features of CO2 at atmospheric conditions does not apply. Pray tell, what to such people is “empirical evidence?”

      LOL, you must be a liberal (emphasis on “liberal”–or is it “progressive?”) arts major. Maybe a “political scientist?” Whatever, your comment suggests you have NO grasp of the physical science!

      Hint: the empirical evidence SIMPLY consists of real measurements (data) that confirms all of that theory of which you speak! Like, for example, increasing temperatures with increasing CO2 over the last 15 years.

      Read “Einstein” by Walter Isaacson for some clues.

    29. D…64: Please explain.

    30. D…64

      You are obviously an idiot or a troll. Nice talking to you :)

      • My original estimation was right on target. Go sleep it off.

      • Actually I am an Atmospheric & Oceanic sciences student, as well as a physics student. I have also maintained an interest in climate physics independent of the formal classroom at the level of the refereed literature, academic conferences, etc for many years now. While I don’t claim to have phD level expertise in some specific sub-field, I’m pretty familiar with what I talk about.

        That said, you made a number of unjustified claims about one of the most prestigious institutions in the world on the whim of a conspiracy theory that you mended together in your mind off of reading Anthony Watts blog. I have told you that Watts simply doesn’t know how to even look at data to form an opinion on the matter, and I haven’t been convinced he is interested in any honest, scientific discourse either. His website repeatedly posts pseudo-scientific hogwash (like Venus is hot because of pressure, not the greenhouse effect), cherry-picked information, and simply erronenous analyses on a week-by-week basis. This is not a matter of opinion. If you say X temperature data set registered a warming of 0.5 degrees, and Y and Z recorded 0.3 degrees warming, therefore X is “alarmist” or whatever, you should actually make sure X, Y, and X are being measured relative to the same zero mark. It’s not rocket science and yet Watts refuses to acknowledge that even this escapes his grasp.

        As for ’empirical evidence,’ I’m not saying anything extraordinary. We would all love empirical evidence for everything. Astrophysicsts would love empirical evidence for what happens in the interior of stars, but in fact stellar atmospheres are generally very opaque so light from the interior (aside from neutrinos) doesn’t get out and reliance must be made on theory, indirect observational evidence, etc. Geologists would love ’empirical evidence’ for much of what they study, yet many things in the deep past must be inferred from fossils, rock strata, etc. Crime investigators would love direct camera footage with unambiguous quality, but sometimes they have to settle for DNA, fingerprints, etc. Even for modern measurements where we have ’empirical evidence’ there are many difficult data issues (such as changes to instrumentation over time, sampling over a large region with a few points, etc). Of course, if you don’t like the empirical evidence you could also simply assert that the people putting it together are all deceiving you, just like those who photographed us landing on the moon.

        So while ’empirical evidence’ seems like some sort of gold standard, it is but one way scientists go about finding out about reality. It also needs to be defined. What is empirical evidence for plate tectonics? Some think that fossils of the same type of organisms on two different continents, or paleomagnetic evidence that a rock now at 60 North was once at 10 North, constitutes such evidence.

        In climate science, we don’t have a separate exact replica lab Earth, one where industrialization took place, and one where everything is kept to normal at year 1700 lifestyles. Even if we did and the industrialized Earth showed warming relative to the other Earth, there are people that would still assert it is chaotic variability or bad data. They could be reasonable claims, so when you want evidence and you set up a full-proof wall of denial it’s going to be hard to convince.

        We have very strong theoretical reasons to suspect CO2 contributes to the terrestrial greenhouse effect, and by extension, can contribute to warming if its concentration increases. To some, perhaps more physics-oriented folks, this alone would be strong evidence that the CO2-temperature connection is not mere correlation. We can see upwelling or downwelling spectra seeing CO2 lines, so there’s really no room for debate concerning its role as an IR absorber in our atmosphere.

        Some people are still not convinced by this. That’s reasonable. They want to see some fingerprints. Maybe a cooling stratosphere, maybe changing in the emission spectrum. They’re happening to. Some people just don’t like that. Maybe bad data. How about looking into Earth’s distant past? The paleoclimate/geologic community is unanimous on the strong role of CO2 over geologic time, and there’s an insane amount of literature on this. It’s not the only thing that matters, but it generally always does matter, either as a forcing or as a carbon cycle feedback which then acts to further modulate the climate change. Some people don’t like all of this though. They build some of the most complex models in the world, which can take years to run a reasonable simulation with radiation, fluid dynamics, ocean properties, etc. In doing so, they always seem to find that modeled warming as a function of CO2 (and other factors) agrees well with observations. We can also model the response to Pinatubo for example, or many first-order aspects of past climate changes. These broad are not overly very sensitive to choices made; for example adding or removing a lake in Wisconsin to the model, or running a model with no deep ocean, or using different cloud parametrization schemes or different solar sensitivities never negates CO2 warming. Some people still don’t like this though. Any model is all crap, they say. Fine. We can also look directly at other key mechanisms they propose, for example if they say “it’s the sun” we can put a satellite in orbit to measure the irradiance from the sun, or apply the same type of fingerprinting techniques above to this hypothesis. So far, no has come up with another mechanism that has any good explanatory and predictive power.

        So, you still may not be convinced. I’m sure philosophers and lawyers have all sorts of nerdy discussions about reasonable doubt. These are all interesting questions, and it’s a reason I chose to be a student in the field instead of poking jabs at those who do the work. I’d suggest others do the same, or at least take classes, read some textbooks, etc to become better informed and possibly contribute to the advance of the science. What is clear to me is Anthony Watts is not engaged in this process.

        • Why are you taking stabs at Anthony Watts here???

          You say:

          “We have very strong theoretical reasons to suspect CO2 contributes to the terrestrial greenhouse effect, and by extension, can contribute to warming if its concentration increases. To some, perhaps more physics-oriented folks, this alone would be strong evidence that the CO2-temperature connection is not mere correlation. We can see upwelling or downwelling spectra seeing CO2 lines, so there’s really no room for debate concerning its role as an IR absorber in our atmosphere.”

          Yes, and the operative phrase is “reasons to suspect.” That’s a very, very long way from any demonstration or proof. One of the problems with “climate science” is that there is not even enough empirical evidence to move the AGW concept from an hypothesis to a theory, let alone support for a theory. In fact, even the hypothesis of AGW is not falsifiable, which makes it COMPLETELY UNSCIENTIFIC!! It is comically ironic that many who practice “climate science” are mocking their very own discipline, by attributing EVERY PROBLEM ON EARTH to AGW and “climate change.” If the weather turns hot, it’s AGW. If it turns cold, it’s AGW (see today’s NYT, e.g.). If there’s a drought, it’s AGW. If there’s more malaria, it’s AGW. See here for the complete list: http://www.numberwatch.co.uk/warmlist.htm

          How can you falsify a hypothesis that includes all happenings? This just ain’t science; it’s religion.

        • randomengineer

          Dude.

          You’re talking to an expert, a guy who is willing to spend time trying to share what he knows. It wouldn’t hurt you to actually listen to people who know more about something than you do rather than yell at them. If you do this then you’ll have a much better idea of what they think rather than some assumptions re what they think. If your goal is to defeat the guy who you presume is an enemy, you can’t do this with mere volume. Learn what he knows so you can determine what (if any) weak points there are. Is this really that hard to figure out?

          Oh, and showing some basic g**damn human respect works wonders too.

        • LOL. What a wonderful example of hypocrisy. Don’t you see it? You must be a “progressive.”

          BTW, you also made the logical error of “arguing from authority.” But it doesn’t matter this time. I have earned the “right” to comment about this “expert’s” opinion about the scientific method, since I have a PhD. While my degree was in organic chemistry (carbohydrate chem., to be more specific), I do understand a lot about science in general. And there is one helluva lot of pseudoscience in “climate science.”

    31. DeWitt Payne 12/24/10 5:25 pm Confidence … thread wrote

      Quoting me, >>>> So what is needed here are HITRAN predictions validated by real world measurements, and more particularly, what we’re looking for is how the total intensity of radiation after gas filtration depends on gas concentration. This is not a question about the spectral density of the filtered radiation, nor how well the modeled spectral density fits a measured or derived real world spectral density.

      >>The total intensity of radiation is simply the integral of the spectrum over the frequency or wavelength range of interest. For atmospheric IR radiation that would be 4-50 μm or 20-2500 cm^-1. If the calculated spectrum matches the observed spectrum then the integrals will match as well.

      DeWitt Payne is confused about what could be his field. He is confused about spectral density and spectrum. Phil. Felton persisted in a similar confusion (on this new Radiative transfer discussion thread). See Phil. Felton 12/23/10 at 5:14 pm, my response following at 7:57 pm, and his rebuttal at 11:57 pm.

      On 12/22/10 at 11:28, DeWitt Payne provided three links to “calculated spectra” from SpectralCalc, a subscription service (for anything very useful). Only two of these links work, but regardless they are graphs of “transmittance” by “wavenumber (cm^-1), comprising bands or lines that hang like curtains below a constant value of 1. http://i165.photobucket.com/albums/u43/gplracerx/1mbartotalpressure.png . This not a spectrum, and these are not spectra. Here’s an example of a transmittance spectrum. http://www.wtheiss.com/docs/direct_df/trans_spectrum.htm . It is monotone increasing to the left (right if re-graphed in frequency), as it must be, and for this sample shows a total transmittance of about 0.92. A transmittance spectrum is the transmittance spectral density integrated from DC to the variable frequency. Conversely, the transmittance spectral density is the differential of the transmittance spectrum. One poster seems to object to differentiation, while the other relies on integration.

      On 12/23/10, DeWitt Payne provided three links to “Spectra”, images attributed to MODTRAN. They can be reproduced for free, thanks to David Archer, at http://geoflop.uchicago.edu/forecast/docs/Projects/modtran.orig.html . These graphs have ordinates labeled “Intensity W/(m2 wavenumber)”. The ordinate is a double density! It is a power density, being Watts divided by area (m2 standing for meter squared), and then divided again by wavenumber. The area under a segment of the curve is intensity in Wm^-2. The intensity spectrum, in Wm^-2, would be integral of the spectral density from DC to a variable frequency. When the variable frequency is the upper limit of the band, the intensity is the total radiation. The spectrum is monotonically increasing to the right, and ends at the total radiation. The integral of the spectrum is not the total intensity, and has no useful meaning.

      When DeWitt Payne says, “If the calculated spectrum matches the observed spectrum then the integrals will match as well”, above, he is talking about the total intensity of radiation from integrating over the entire band of interest. This comes from integrating the spectral density, not the spectrum. If two spectra have the same value on the right (in frequency), then the total radiation is the same. If the calculated spectrum matches the observed spectrum at all frequencies, then the calculated and observed spectral densities will match, and the total intensity will match. If the spectral densities match, then the spectra will match within a constant of integration. On the other hand, if the total intensities match, the pair of spectra can each be wildly different, and similarly for the pair of spectral densities.

      The question that needs to be answered is how the total intensity varies with CO2 concentration. Having the observed and calculated total radiation match at a point doesn’t answer the question. DeWitt Payne wrote about varying CO2 concentration on 12/23/10 at 3:14 pm, but didn’t do his integration. He needs to do that integration for varying CO2 to discover the calculated dependence, presumably reproducing the logarithm dependence, and testing the limitations of his calculator. The validation needed is not a match of calculated and observed at a single point, but all along the curve created by varying gas concentration.

      The scientific method has language as its foundation, and it requires precision in its use. Regularly we see technicians mixing scientific models with the real world. We lose track of the times when probability density and probability distribution, units and dimensions, parameters and parameter values, or climate and weather are confused. Sloppy language can turn a useful dialog into useless twitter, flaming, and logical fallacy. Undisciplined dialog is not going to answer questions about confidence in radiative transfer, or much of anything dealing with climate or science.

      Years ago, I was following a ready mix concrete truck down a highway when a pickup truck in front of it pulled onto the right shoulder, and immediately attempted a U-turn in front of the truck. The truck t-boned the pickup, pealing its tires off their rims. The pickup driver got out and said, “I had my blinker on!” The truck driver said, “It didn’t do you much good, did it?”

      Now DeWitt Payne say, >>Try reading Chapter 31 in Vol. I of The Feynman Lectures on Physics. page 31-2:

      >>>>Now all the oscillations in the wave must have the same frequency

      Is that all Feynman had to say? What wave? Was he talking about atmospheric CO2 absorption? Is that all that DeWitt Payne could find important in this reference? Is it just one of his favorite tomes, or is he trying to impress us that he reads Feynman? Who would want to dig up a copy of Feynman just to see if that sentence is there? Once before, DeWitt Payne wrote,

      >>I also gave him the same link a while back. It didn’t help then either. 12/23/10 at 11:57 pm.

      Throwing out references is just turning your blinker on. It isn’t going to do anyone much good. References are not putty for the reader to fill in the cracks in your sketchy thought processes. They are for checking the accuracy, applicability, and validity of your claims.

    32. Bryan 12/26/10 at 11:34 am commenting on the Confidence … thread

      Bryan said, >>If we have no reason to doubt the accuracy of the direct measuring device then the direct measurement will always trump the model prediction.

      Is Brian’s Conjecture true in any sense anywhere in the universe?

      Probability: the Buffon Needle model says that a needle of length x dropped randomly n times on a plane ruled with parallel lines k units apart will come to rest crossing a line 2xn/(kπ) times. Bryan runs an experiment 10 times, and measures a different ratio. He thinks the model trumped.

      Economics: Monetary models forecast high inflation proportional to the on-going expansion of the money supply. CPI measurements show no inflation. Bryan confirms: no inflation, the model is a bust.

      Geology: A geologist predicted the North American Plate was separating from the Eurasian Plate at 2.5 cm/yr. In the last year the separation measured 50% higher. Brian applies his conjecture, and scraps plate tectonics.

      Climate: A scientist 25 years ago predicted the climate would reach a tipping point in 10 years. He makes the same prediction today. We make minute by minute measurements, and its not detectable. What does Brian’s Conjecture tell us?

      There’s no crying in baseball, and there is no trumping in science. For every measurement, science requires quantification of its accuracy. Moreover, an axiom of science is that noise accompanies every measurement. Doubt is a subjective concept for belief systems. Science is the objective branch of knowledge, in which belief plays no role.

      Science is about models of the real world. These models must make significant predictions, which, like measurements, include accuracy or tolerance bands. Fresh measurements that lie within the prediction tolerances are confirming, those that don’t fit, contradicting. The rest is statistics. Scientific models are the embodiment of Cause & Effect, which is a manmade concept that in general exists only as an axiom.

      Real World ↔ Measurements ↔ Predictions ↔ Cause & Effect

      • randomengineer

        Dr Glassman,

        Would you mind summarising your point re HITRAN please?

        Your posts are long and sometimes meander. I’m not following the objection.

    33. I give up.

      “Never argue with a fool, onlookers might not be able to tell the difference.”

      Mark Twain (possibly)

    34. The trouble with settled science is that when it suggests your preferred idea is correct then you tend to believe it but when it suggests your preferred idea is wrong then you can so easily find an excuse to reject it.

      So a warming sea should be a net CO2 source but that’s not convenient so it has been decided that the sea is a net sink instead. Thus it isn’t that difficult for a climate scientist to accept that nature can behave in a contradictory manner to what overly-simplified science predicts. The only spur they need for this wholesale reversal of accepted science is initial prejudice.

      Ultimately therefore the only useful point in this entire thread was about ocean heat content measurements since 2003 because that’s the real world talking back to us. Those Argos buoys were supposed to provide the cast iron proof of AGW and yet they said the exact opposite. This lack of ocean warming adds to the non-cooling stratosphere since 1995, the lack of any positive H2O feedback in the tropical troposphere, the lack of warming in the radiosonde data and Lindzens latest discoveries about outgoing radiation.

      To this overwhelming empirical evidence we can add the effective invalidation of those oversold models thanks to the reality of zero warming since 1998 being blamed on the “natural variation” that was supposed to have been dwarfed by CO2 heating since 1985 or so.

      The establishment response to all this reality seems to be twofold; a) the instruments are wrong – yes all of them, and all in the same sense, and b) the heat is hiding somewhere, or is masked by something.

      In a more healthy scientific environment all this evidence would have the scientific world finally accepting that AGW just isn’t there and so the effect of that 2% additional CO2 to the natural flux is, after all, negligible. Alas some folk have wasted their entire careers on this false positive so they understandably find it difficult to let go.

    35. DeWitt: That was NOT a graceful exit. Has your bluff been called?

    36. JAE,

      Since killfile doesn’t work here, I’ll say this once more. You are in my burn-BEFORE-reading file. Jeff Glassman is now the most recent addition to that file. At some point you just have to concede that you’re not getting anywhere and give up.

    37. Jan Pompe,

      On the other RT thread you said the following:

      I think you’ll find if you look into it that Wien’s law only holds for short wavelengths like Ra[y]leigh-Jeans for LW.

      That is completely incorrect. Wien’s Law works when radiance is calculated per unit wavelength for all wavelengths. It doesn’t work for radiance per cm-1 or frequency whether plotted vs wavelength or cm-1.

      The exact numerical location of the peak of the distribution depends on whether the distribution is considered per-mode-number, per-unit-frequency, or per-unit-wavelength, since the power law in front of F is different for the different forms.

      You could read the Wikipedia article. It’s more or less correct.

      http://en.wikipedia.org/wiki/Wien%27s_displacement_law

      • Strictly speaking Wien’s Law has different forms for frequency and wavelength and the value of the peak for frequency is not, if simply converted to wavelength, the same as the value for the peak for wavelength. For T in Kelvin and ν in cm-1, Wien’s Law takes the form:

        ν = 1.961*T

        For wavelength in nm it’s:

        λ = 2.898E6/T

        So for 300 K, ν = 588 cm-1 =1701 nm and λ = 9660 nm = 1035 cm-1

        Simple.

      • Conceded, but not really relevant in the original context:

        For radiant heat it fails whenever the cooler object is at some distance from the hotter one and is radiating a large amount of sufficiently narrow-band radiant heat focused in a sufficiently narrow beam at the hotter object, which is radiating diffusely as a black body

        It’s not the temperature of a distant object (however you determine it) that determines whether or not it will warm or allow to cool an object in it’s EMR field but the intensity of that field the object is in that determines it.

        • Jan,
          As I read Vaughan’s original message that you quote, it appears to be erroneous.

          Wien’s displacement law is of little value in these considerations, if of any value at all. The relevant issue is the strength of emission at each wavelength contributing and that is always given by emissivity and Planck’s law. (Wien’s displacement law tells at which wavelength or frequency the maximum of Plack’s curve is located for a fixed temperature, but that is quite irrelevant as we are here more interested in the temperature dependence of Planck’s law than the wavelength dependence).

          Radiative energy transfer between two bodies occurs only at wavelengths where both participating bodies have a non-zero emissivity. At this particular wavelength the net transfer is always from the hotter body to the colder one, because the Planck’s law is monotonically increasing at all fixed wavelengths.

          The fact that the wavelength may be at the maximum of Planck’s curve for the colder body and well beyond the maximum for the hotter body does not change the fact that the value given by Planck’s law is always higher for the hotter body.

          The radiative gross energy flow from body A to body B at a fixed wavelength is a product of emissivities of both bodies at that wavelength, geometric factors and the value of Planck’s law for that wavelength and the temperature of A. For the opposite gross energy flow all other factors are identical, only the value given by Planck’s law changes to reflect the temperature of B. Therefore the net flow is always from the hotter body to the cooler. This is true for each wavelength separately and therefore also to the integral over all wavelengths.

    38. Everyone interested in this subject should read this essay on WUWT:

      http://wattsupwiththat.com/2010/12/28/simple-physics-in-reality-my-feather-blew-up-into-a-tree/#more-30345

      Radiation is probably a small part of the “equation.”

    39. as this is my first post on this site, good day to you all, especially those i’ve encountered elsewhere, like jae 7 dewitt p, etc.

      to answer a question posed earlier, the lorentz spectral line shape is what is discussed in the details for implementing Hitran. As I recall, the Voight curve is a bit more accurate but much harder to implement. Consequently, in my Hitran RT model, I used lorentz.

      one must bear in mind that details about spectral absorption in the atmosphere is interesting, it is also only valid for clear skies – which make up less the 50% of the global coverage at any one time. To make matters even more interesting, cloud cover provides both a positive and negative consequence and is chaotic.

      The joys of precise OLWR and solar constant for incoming SW simply go out the window when clouds get involved.

    40. continued from above at Jan 1 10:24am
      Arfur, from 1850 to 1900, CO2 changed by about 10 ppm, which now takes only five years to accomplish. I think this is representative of an exponential growth. It is expected to easily exceed 800 ppm by 2100 if no measures are taken to slow the growth.
      Yes, GISS is different from your data, but neither can claim to be better for 1900. I go with GISS because it attempts to be global.
      I don’t understand your statement about feedback. Let’s just agree that the no-feedback CO2 part is nearly 0.4 C, and the with-feedback one is 0.9 C. I showed above that using a conservative 2.5 C per doubling, and a well-fitting 33-year doubling rate for the CO2 difference from 280, you get 3.5 C warmer by 2100 compared with 2000. It is just mathematics. You can argue with the 2.5 or 33 years, but they fit the data in the last century well enough allowing for solar and aerosol influences as I mentioned.

      • Arfur Bryant

        Jim D,

        Thanks for bringing our debate to a new ‘nest’. It was getting cumbersome and I totally take your point about it running over into another year! :)

        I am sure we are getting toward the discussion’s close, my forum friend. Whilst we may continue to disagree, I thank you for your input and maturity.
        Just a few points, though, to clarify.

        Where do you get your data to support your claim that CO2 only increased by 10 ppm between 1850 and 1900? If you are, as I suspect, comparing ice core proxy data from 1850 to 1900 with the Mauna Loa data from 1958 to present, I fear you are not making a true comparison. Comparing ice core data from 1850 to the latest year possible would be a more valid method of deciding whether or not the CO2 increase has been exponential. I am sure you are aware that chemical measurements of CO2 (Beck 2008) are widely different from the ice core proxies. This is not to say which is more accurate , but I feel there is enough uncertainty for your assertion to be severely questionable. I am also interested to hear how you come to the conclusion that CO2 will ‘easily exceed 800 ppm by 2100’. You can’t be serious, surely?

        I agree neither dataset (GISS or HadCRUt) can claim to be more accurate for 1900. We could probably debate the vagaries of GISS ad nauseam for ever to no avail. However the fact remains that the 0.8 or 0.9 C warming is what we have to go on – from either dataset.

        I’m afraid I can’t agree with your request to agree with each other on the feedback/no-feedback issue. Why? Because the with-feedback figure of 0.8 (or 0.9) deg C is not necessarily due to CO2 alone, even counting the feedbacks. In order to assume this, you have to deny any or all other possible warming factors – both natural and anthropogenic. I repeat – the 0.8 C includes ALL factors and feedbacks, not just CO2 feedbacks.

        Further, would you lease explain your assertion that there is a 33-year doubling of CO2 above the 280 level? Again, we are just not on track to achieve a 3.5 C warming between 2000 and 2100, so this again appears to be speculation on your part.

        By the way, I note that I , and several others, have tried to engage with A Lacis on the subject of CO2 contribution to the Greenhouse Effect on the ‘Sociology of Scientists discussion thread’ – but without any answer from him. I would obviously like to get an answer from the source but, in the hope that I will, I do appreciate your time on this thread.

        Regards and all the best for 2011.

        Arfur

        • The available data on CO2 in the atmosphere is hardly capable of telling much about changes in CO2 concentration in the 19th or early 20th century. There is, however better knowledge on the use of fossil fuels. Encyclopedia Britannica of 1911 listed major coal producers in 1905. From those numbers it can be concluded that the CO2 emissions from fossil fuels were in 1905 a little less than 10% of their present rate. Three largest producers US, UK and Germany dominated the production, the production elsewhere was very limited in comparison. So was also the production of oil.

          The use of coal had increased rather rapidly in the 19th century. Based on this fact and the level in 1905, 10 ppm increase is likely to be of the right order of magnitude, although this estimate is certainly very crude.

        • Arfur Bryant

          Pekka,

          I agree with you. Actually, the ‘roughly 10 ppm between 1850 and 1900’ agrees with Beck’s measurements as well. However, the difference is that Beck’s showed a large increase around 1940. It is this section that causes uncertainty in Jim D’s statement that CO2 is increasing exponentially.

          AB

        • My reply went to the bottom, see later.

    41. cba,

      The Voight spectral line shape (with its pressure and temperature dependence) is necessary to get the correct absorption for HITRAN line-by-line results in the stratosphere.

      The presence of scattering and absorption by clouds and aerosols does make the radiative calculations a bit more complicated, but cloud and aerosol radiative effects can be included with good accuracy. Mie scattering is an exact theory for determining the scattering and absorption properties of spherical particles (water clouds and most aerosols). At thermal wavelengths, clouds are strongly absorbing and exhibit spectrally continuous absorption that is easily included in the radiative transfer calculations. Neglecting scattering at thermal wavelengths produces an error of roughly 1% in the outgoing LW flux, for which a correction can be readily incorporated.

      Solar radiation is dominated by scattering processes (which are strongly dependent on solar geometry) due to clouds, aerosols, and Rayleigh scattering. Accurate methodology (utilizing plane parallel geometry) is available to calculate the multiple scattering effects of clouds, aerosols, and gaseous absorption under all atmospheric conditions.

      The radiative effects of clouds, aerosols, Rayleigh scattering, the surface albedo, and absorption by atmospheric gases (H2O, CO2, CH4, N2O, CFCs, O3, O2, NO2, SO2), are included to calculate both the SW and LW fluxes and radiative heating and cooling rates. In particular, it is important in climate modeling applications, particularly for clouds, that the SW and LW radiative transfer calculation be done self-consistently in terms of cloud optical depth, particle size, cloud height, and heterogeneity properties.

      In summary, the radiative effects of the atmospheric constituents are (or can be) accurately calculated in climate GCMs. The challenging part is for the GCMs to calculate cloud (including optical depth, particle size, water/ice phase, height), water vapor, and aerosol distributions that are accurate representations of real world behavior.

      • Andy,
        thanks for your comment. I have not tried to implement the voight profile as I have limited resources in both computing power and time and it isn’t necessary for the real application. Same thing with the scattering. The last time I tried to run a MIE (separate from my radiative model) the time estimate was indicating 8 hrs for the program to complete the calculations so I had to abort it.

        I’m afraid I have to disagree on the modelling though. While some of the pieces can be readily done, like mie scattering for spheres or line absorption/emission characteristics for a molecule, there is too much unknown for parameters and too many external variables that get involved. mie is quite dependent upon sphere size and just what is going to affect the size of the droplets is going to have massive effects and I don’t think we have a really good handle on precisely how the size is affected and by what.

        Cloud cover is a major factor in overall albedo. Note I’m simplifying by lumping other atmospheric effects in there. The cover fraction has both a positive and negative effect although it is strongly negative. Change the droplet size and you’ve changed the reflectivity of the cloud without modifying the cloud cover fraction.

        As for surface albedo, from my ‘back of the envelope’ calcs it contributes about 10% of the total albedo. (As opposed to the Trenberth cartoon with its almost 30%).

    42. Dr. Lacis,

      You make a number of unsupported statements, in fact all of them. It is quite easy to claim certainty, but the certitude you exude is exactly the problem with climate science. As Kevin Trenberth says “We cannot explain the lack of warming at present and it is a travesty we cannot.” (a paraphrase)

      If all of your statements were true, all of the mysteries would be solved. The fact is, your theory is a house of cards and it has fallen. We know much less about climate than you claim. 1998 is still the warmest year on record which can only mean that natural variability is much greater than your theory permits. If observations do not match the theory, the theory is wrong. Your job is to find out where it is wrong.

    43. We know much less about climate than you claim.

      This would make sense coming from someone who knows more about climate science than Andy Lacis. Ron Cram’s nihilistic “your theory is a house of cards and it has fallen” provides a point of calibration on the sense in which he knows better than Andy about these things.

      It would be interesting to understand in what respects Ron Cram is different from the conservatives that trashed Joseph Priestley’s laboratory (where he discovered oxygen) and home in 1791, forcing him to flee to the US. One senses similar sentiments and frustrations.

      More generally, setting aside the differences in disputed subject matter, what are the differences and similarities between today’s heated climate debates and the intense hatred that ripened in the late 1780s between Birmingham’s conservative rioters and its religious Dissenters?

      One difference is that today’s conservatives are not burning down people’s laboratories and houses, instead they visualize them as houses of cards falling down. The Internet performs a valuable function in allowing people to work out their frustrations by visualizing and verbalizing their responses instead of actualizing them, with the satisfaction that in this Second Life they can find some denizens whom they can cause mental if not physical anguish, and others with whom they can hook up virtually. And all this without society’s disapprobation (though perhaps with a little Ludditish smirking behind backs).

      One similarity is that today’s conservatives are just as convinced as were Birmingham’s two centuries ago that they have time and common sense on their side, they have the force of right to take property including private correspondence, they have the moral upper ground, they are more intelligent than those foolish climate scientists, and above all, they have a voice and a conscience that the massively intrusive AGW conspiracy cannot silence.

      Such a mindset is not to be argued with.

      • Vaughn,
        Your post is a fine example of “how NOT to engage in fruitful blogospheric discussion.” In the post “Blogospheric New Year’s Resolutions,” Dr. Curry provided a link. See http://www.searchlores.org/schopeng.htm You are carrying my comments beyond their natural limits.

        Nothing I said is at all similar to an attack on Dr. Lacis’s laboratory. It was rather an attack on his unsupported arguments. If you find fault with my argument, point out the error – but claiming I am a violent nutcase will not win you any points among people who want a civilized debate.

        My viewpoint that Lacis’s theory is a house of cards fallen down rests more on Climategate and the fact Hal Lewis, a former warmer, is not a skeptic.

        If Dr. Lacis feels his theory still has validity, he is welcome to come and support his statements. If he chooses not to, it will have more to do with his available time or the lack of supporting evidence than it will my ability to reason.

        • I hate typos. Of course, I meant to type that Hal Lewis is NOW a skeptic. Hal’s change in viewpoint seems to have been prompted both by Climategate and by the fact 1998 is still the warmest year on record.

        • Of course, I meant to type that Hal Lewis is NOW a skeptic.

          Just to clarify, I’d been assuming that in my 2:54 am answer.

          Hal’s change in viewpoint seems to have been prompted both by Climategate and by the fact 1998 is still the warmest year on record.

          Both of those tend to weaken your rationale, the second because NASA GISS puts both 2010 and 2005 ahead of 1998 and the first because you gave Climategate and Hal Lewis as two separate reasons when it’s clear they’re not independent since like you Lewis is basing his scientific position on Climategate.

          To conclude that global warming is not happening from emails stolen from one out of a large number of climate research institutions is a pretty extreme case of grasping at straws. One cannot draw scientific conclusions from insults lobbed by scientists at each other, nor from interpretations of statements that on closer examination are established to be misunderstandings.

          Continuing to insist that the interpretations are as originally claimed in the face of overwhelming evidence to the contrary is a minority position not commensurate with accepted scientific practice.

        • Talking about weak arguments:
          Giss is of course still the outlier in making 2005 &nd 2010 hotter, the other four recognised datasets do not show this. Giss apparently gets a different answer by extrapolating across the Arctic areas for which there is no actual data. You may regard that as acceptable, alas most other scientists don’t. Of course all 3 years were el nino years and the differences are well within the error margins anyway; it is the trend, or lack of it, that counts. Of course you knew all that. This lack of an expected recent trend is of course most easily found in the sea surface temps where all other things really are equal, for once.

          Your second argument is the familiar strawman argument of assuming warming by itself, and for which there is indeed ample evidence, is somehow evidence of manmade warming. The “stolen” emails of course revealed that even the hockey stick makers always believed that the medeival warm period was always actually as warm there, as skeptics had always said it was, and which all later (skeptic-improved) work has demonstrated.

          Also, please read the emails concerned rather than the perception that someone else gave you. The total lack of scientific integrity revealed by these leaked (not stolen) emails is what concerns independent scientists, not the flaming and backbiting. Neither is CRU representative of a small backwater establishment; these were lead authors of the IPCC reports discussing how to bury, ignore and delete data and scientific papers which opposed their opinion.

          As to what might challenge climate scientists; Trenberth said it all in one collection of emails. The pause in warming was totally unexpected, and saying it is just natural variation not only contradicts the IPCC previous arguments and all the model-based attribution studies, they really have to tell us, as Trenberth correctly wrote, what actually causes that natural variation. Otherwise one might gather the impression that they just make things up as they go along and that really they don’t have a clue. This is not helped by the recent efforts to blame cold weather on CO2 warming rather than the jetstream blocking. That, at the very least, should make everyone raise their eyebrow a little.

        • My viewpoint that Lacis’s theory is a house of cards fallen down rests more on Climategate and the fact Hal Lewis, a former warmer, is not a skeptic.

          If those are your strongest arguments against AGW then it doesn’t sound like climate science has much to fear from climate sceptics.

          If you’d produced proof that CO2 was not increasing, or that increasing CO2 can’t increase the temperature significantly, climate science might have more to worry about.

        • If Dr. Lacis feels his theory still has validity, he is welcome to come and support his statements.

          If you’re referring to the theory of anthropogenic global warming, that can be considered Andy Lacis’s theory only to the same extent that quantum mechanics can be considered Stephen Hawking’s theory. You might choose to debate quantum mechanics with Hawking, but it would not be correct when doing so to attribute it to him.

    44. OT, but

      “(though perhaps with a little Ludditish smirking behind backs).”

      I wonder which modern world views – conservative or liberal – are more aligned to the driving principles of the Luddites in 1812.

      Opinions on this point would be quite revealing.

        • Just finished a cursory reading of his manifesto. He seems to despise both left and right. Conservatives are total fools. Leftist are dangerous and self-loathing.

      • “I wonder which modern world views – conservative or liberal – are more aligned to the driving principles of the Luddites in 1812.”

        Aggressive resistance to alternative energy sources to fossil fuels, and electric or hybrid vehicles, as vocally demonstrated by popular US conservative talk show host, Rush Limbaugh, is a good marker.

        “A major issue nobody is talking about, littering the landscape with rusting wind farm junk that continues to kill birds and leak fluids, among other problems.”
        — Rush Limbaugh quoting an article in American Thinker on his radio show

        Another interesting and recent quote…

        “As we saw that thing bubbling out, blossoming out – all that energy, every minute of every hour of every day of every week – that was tremendous to me. That we could deliver that kind of energy out there – even on an explosion.”
        — Ralph Hall (R-TX), incoming chair of the House Science and Technology Committee, on the BP oil disaster

        A bit creepy, if you ask me, especially when you consider Limbaugh’s call for climate scientists to be “drawn and quartered”.

        • A bit creepy, if you ask me, especially when you consider Limbaugh’s call for climate scientists to be “drawn and quartered”.

          With 6.7 billion people on the planet, it only takes one fruitcake to heed that sort of call to arms.

          If freedom of speech does not extend to yelling “Fire” in a crowded theatre, why should it extend to calls to execute us scientists? Are scientists so useless to society as to be denied the rights accorded to ordinary theatre-goers?

          Limbaugh should thank God every night that he does not live in a dictatorship run by a capricious scientist.

    45. The A2 scenario dataset, which was researched to drive the GCMs with CO2 from the 1800’s through 2100, has values that barely grow by more that 10 ppm in the first 50 years (1869-1919), and ends at 828 in 2100. The A2 scenario is the pessimistic business-as-usual scenario, but we are tracking it quite well currently, and I don’t see a reason to be more optimistic yet.
      The 33 years is for doubling the difference from 280. For example, 2000 may be at 370, which is 280+90, so 33 years later in 2033 it would be 280+180=460, etc. (where 180 = 2*90); 33 years earlier you get 280+45=325. It turns out to be an easy-to-calculate good fit.
      The 33-year curve fits the A2 scenario quite well through the 20th century, and exceeds it towards 2100 finally reaching 1000 ppm. Other proposed functions like Hoffmann’s mentioned by Vaughan Pratt are close. All fit the Keeling curve since that started.
      I have said yes, the 0.8 includes maybe 0.2 solar, -0.3 aerosols, 0.9 CO2 with all their feedbacks. The CO2 part is on track to reach 3.5 by 2100. It is weighted very much towards the end. on my numbers, the 1st degree above the 2000 value is in 2041, the 2nd in 2067, and the 3rd in 2089. The CO2 effect has barely started at the moment.

      • This reply was intended for Arfur. Also Happy New Year.

      • Arfur Bryant

        Jim D,

        See also my reply to Pekka above referring to the 10 ppm between 1850 and 1900.

        Your arguments appear to be based solely on models. What information was inputted into the IPCC A2 simulation? If it was ice proxy data, my earlier point stands. 828 ppm by 2100 is, frankly, ridiculous. The planet is most certainly NOT tracking the A2 scenario accurately, and I see no reason to be pessimistic yet!

        Now to your 33 years doubling from 280 ppm…
        Are you basing this on your assumption that CO2 is rising exponentially? Why choose 33 years? It took 150 years to climb the 90 ppm from 280 to 370. Backtracking the decades from Nov 2010, we find that (Nov)
        1960 to 1970 = 9 ppm
        1970 to 1980 = 14 ppm
        1980 to 1990 = 15 ppm
        1990 to 2000 = 16 ppm
        2000 to 2010 = 19 ppm

        This is hardly exponential! The decadal rate would have to be at least double the last decade to reach your target. Even allowing for some slight acceleration, it will take far longer than 2033 to reach 460. IMO, your assumptions are clouding your judgement. The expected CO2 acceleration you speak of is pure speculation and certainly NOT supported by real-world data. I repeat, the figures don’t add up.

        [“The CO2 effect has barely started at the moment.”] More speculation, my friend. Is there some teleological reason why some of the CO2 has so far decided not to interact?:)

        • Arfur, my 33-year curve gives 9, 11, 14, 17, and 20 ppm for those decades which is quite a good fit. Also you might notice that the rate more than doubled in those 40 years you listed which defeats your point. There are many sources plotting CO2 for the period prior to Keeling. Search for “CO2 graph” with Google, for example. They all look exponential. Yes, extrapolating a curve that fits the 20th century through the 21st is an assumption. It is not at all clear that the fossil fuel usage in China and India will grow as much as Europe and North America did in the last century, but their per capita usage is currently still less than 20% that of the US, and their populations are many times the US, with coal being plentiful even if oil runs out. We have only used 10% of available fossil fuel carbon, so it is no stretch to say we could get to 1000 ppm some time within a century given these number.
          Beck’s measurement for the 1940’s is dubious if taken as a global average. Even if something outgassed that much CO2, nothing can absorb it that fast to remove 100 ppm in ten years.

        • Jim D,

          Your 33 year curve? Why not use official sources?
          Why google ‘CO2 graph’ when I can get the official data? Go to this noaa site and view the graph that does not look exponential and is based on official data:

          http://www.esrl.noaa.gov/gmd/ccgg/trends/#mlo_full

          You can view it as a curve or you can see a table down the left hand site which gives the annual mean growth for Mauna Loa with an estimated uncertainty of 0.11 ppm/yr. Like I said, the ‘curve’ looks neither linear or exponential – maybe more cubic? Only time will tell. If you don’t like that data, the Mauna Loa data is also here (again):

          ftp://ftp.cmdl.noaa.gov/ccg/co2/trends/co2_mm_mlo.txt

          These figures do not ‘as closely’ agree with your 9, 11, 14, 17, 20, although the 9 and 20 are reasonably correct. At our level of understanding, small differences can be magnified. The Nov decade trend is 9, 13, 16, 15, 20 (all rounded) and the Jan decade trend (just for fun) is 9, 13, 16, 15, 19. These do not support an exponential form.

          Whilst I grant you the rate has doubled in 4 decades, this does not defeat my point. My point was against your contention of doubling the difference since 280 ppm. A continuance of this Mauna Loa rate of increase will still give a lower figure than your estimate of 460 by 2033.
          However the point remains that the temperature ‘curve’ does not match the CO2 curve, as suggested by the cAGW theory.

          I daresay the ‘China and India’ factor may well increase the CO2 in a more accelerative sense but that does not mean the temperature will follow. You are still speculating. There is nothing wrong with speculation as long as it is not delivered as fact, especially scientific fact.

          I only mentioned Beck as an indication of the possible levels of uncertainty in the model predictions against measurements. I’m not sure one can confidently dismiss his work so quickly.

    46. I point to those curves because they extend back before Mauna Loa and give a truer sense of the exponential nature of the CO2 growth. My curve happens to fit those back through 1900. Yes you can extrapolate Mauna Loa linearly, but this is not expected to be what will happen. If it doubled its rate within the last 40 years, it is expected to do that again for the next 40 at least. Given this gradient growth rate, even a log temperature dependence accelerates, as I showed. The current rate of 0.5 C in 30 years is very consistent with how it should be increasing at this point on its way to the 3.5 C increase over the next 100 years. It might tail off before 2100 if the exponential CO2 curve is not followed, but that curve is where the debate is, because the temperature response just depends on that. For example, if it is 800 ppm by 2100 instead of 1000 ppm, the temperature increase might be 3.0 C. Fossil fuel mitigation might be able to do even more, but no one is acting on it yet.

      • Response is to AB 12:16pm.

      • Arfur Bryant

        Jim D,

        You are still speculating from assumptions.

        First, you say your curves (where are they again?) “give a truer sense of the exponential nature of the CO2 growth.” You assume an exponential growth and you assume therefore that your speculation is ‘truer’.

        Second, I did not extrapolate linearly. I even said Mauna Loa data was ‘somewhere between linear and exponential’. If the next 40 years follows a similar pattern to the last 40, we would see that, by 2033, the CO2 ppm would be less than 460, which would falsify your ’33 year curve’. I am not going to estimate a number because I would be doing what you are doing, and assuming I am correct. I would prefer to stick to the facts. Only time will tell. The point – again – is that the CO2 and temperature are not correlated. So,

        Third, your use of 0.5 C in 30 years is inaccurate. UAH. RSS, HadCRUt3, NCDC and GISS datasets ALL give an increase of about 0.3 C in the last 30 years. GISS is the largest at about .37 C. These figures are a 3-year running average. To argue a greater warming might serve to strengthen your case but it is misleading. The overall trend since 1850 is only 0.05 C per decade. The trend from 1850 is currently lower than it was in the late 1870s. We’ve been round this buoy before. Your statement…
        “The current rate of 0.5 C in 30 years is very consistent with how it should be increasing at this point on its way to the 3.5 C increase over the next 100 years.”
        … is again subjective. “How it should be…?” Only if you assume the cAGW correlation of CO2 with temperature. The 2010 El Nino year has not ‘beaten’ 1998, in spite of continuing CO2 rise. In a previous post, you stated “the effect of CO2 has really started yet…” (or something like that). I, for one, am still waiting. At some point the pro-AGW lobbyists are going to have to admit the warming is not as ‘rapid and accelerating’ as was predicted. CO2 may continue to rise globally – I have no doubt it will – but the ‘correlation’ with temperature is far from proven.

        I repeat, you are speculating from an assumption. The planet seems to be refuting your assumptions.

        • To get some picture of what to expect, I made the following model.

          From Carbon Dioxide Information Analysis Center http://cdiac.ornl.gov/, I took the Fossil-Fuel CO2 Emissions 1751-2007.

          For the persistence of CO2 in the atmosphere I used the four exponential decay parametrization of Maier-Reimer & Hasselmann from 1987.

          From this data and model I calculated the CO2 remaining in the atmosphere from all emissions since 1751. The result fits amazingly well the Mauna Loa data, when a slightly high initial concentration of 287 ppm is used. Amazingly well, because many other factors like deforestation are not taken into account. The increase in the CO2-concentration follows reasonably well an exponential starting from 1780, but there is a clear slowdown around 1920.

          The rate of increase in CO2-concentration is now about 2.4 ppm/yr. It was 1.2 ppm/yr in 1969. What happens in the future depends naturally on assumptions on the future emissions. As I have the model in Excel, my first choice was a linear increase at the same rate than from 2006 to 2007. This to a doubling of emissions from 2003 to 2050. With this emission scenario, the rate of increase will be 3.5 ppm/yr in 2050 and the concentration in 2033 happens to be 456 ppm or in agreement with Arfur’s limit of less than 460 ppm.

          The scenario is not based on anything deeper than what I told, but it confirms that a slower than exponential growth is a very reasonable expectation. With an exponential growth in emissions a faster growth in the CO2 concentration is also expected and it could be near exponential. All this is, however, pure speculation.

        • Pekka, you are choosing a gradient that varies linearly with time, which is a quadratic function of time. Over short periods quadratics can be made to fit exponentials, but that function won’t work as you go backwards to 1900. I would choose an exponential as a single function to fit the whole period. However, going forwards we don’t know if it will remain exponential or go more quadratic, so I am not saying it is wrong, just pointing out the difference.

        • Jim,
          Concerning history, my model is fully driven by emission data and a formula for persistence of CO2 in the atmosphere. It is not linear, quadratic or exponential. Choosing the y-axis as logarithmic, I checked visually, how close the result was to exponential. It was evident that it was not very far from it, but that the coefficient was larger in 19th century than after 1920, which is the timing of strongest curvature.

          Concerning future emissions that drive the model as historical emissions drove the historical part (and influence also the future), I made the least effort choice of dragging by mouse, which produced the linear increase in future emissions. The strength of this increase appear as reasonable as any other simple choice. Therefore I reported its consequences.

          The whole idea of my exercise was to present an extrapolation, which is realistic for the future emissions and which creates a time series for CO2 concentration which is certainly not very far from reality assuming the emissions that I assumed. The persistence model that I used is definitely not precise for this kind of purpose, but it is still close enough to reality to give essentially correct results.

        • Pekka Pirilä 1/3/11 at 3:10 pm,

          You put us in suspense when you wrote on the Climate Feedbacks thread, ” Humanity has reached the power to influence the earth system significantly” (4:49 am) and “For me it is certain that human societies influence climate” (10:09 am). Perhaps your conviction arose from your calculations using “the four [five, actually] exponential decay parametrization of Maier-Reimer & Hasselmann from 1987.” Why didn’t you refer to the later, up-dated, four decaying exponential expression from IPCC? AR4, Table 2.14, p. 213. IPCC attributes its formula to the Bern Carbon Cycle Model, which adapted the Maier-Reimer and Hasselmann, 1987, model. Bruckner, T., et al., “Climate System Modeling in the Framework of the Tolerable Windows Approach: the ICLIPS Comate Model”, Climate Change 56, 2003, p. 122.

          The Maier-Reimer & Hasselmann reference is science for sale. However an online paper by Harvey, L.D.D., “A guide to global warming potentials (GWPs)”, provides the decaying exponential equation in two forms, along with the coefficients, from Maier-Reimer & Hasselmann (1985). The equation from both sources, in a format for these comments, is

          C_sub_C(t) = sum(A_sub_i X exp (-t/τ_sub_i)

          The five or four sets of parameters, {(A_sub_i, τ_sub_i)}, &tau_sub_i in years, are similar: {(0.131, ∞), (0.201, 362.9), (0.321, 73.6), (0.249, 17.3), and (0.098, 1.9)} for Maier-Reimer, et al., and {(0.217, ∞), (0.259, 172.9), (0.338, 18.51), and (0.186, 1.186)} for IPCC. The A_sub_i represent the fraction of a slug of CO2 added to the atmosphere subject to each of five or four sequestering processes. Note that the sum of the A_sub_i in each case is 100%.

          This equation is invalid, incorporating several violations of physics.

          The objective of the equation is to show how anthropogenic CO2 (ACO2) persists in the atmosphere. The various time constants relate to process in the ocean, the longest being the sequestration of CO2 in CaCO3, a process variously cited as requiring hundreds or thousands of years, to as much as 35,000 years (AR4 Contributing Author David Archer, The fate of fossil fuel CO2 in geologic time, 1/7/05, p. 16). This critical climate conjecture is that the surface layer of the ocean is in equilibrium, consequently the oceanic sequestration processes must make room for the uptake of ACO2. Of course, the surface layer is never in equilibrium. So, while the stoichiometric chemical equations remain, as always, valid, the equilibrium coefficients are not applicable. The equilibrium molecular ratios in the surface layer are not constrained.

          The atmosphere is not a buffer reservoir holding excess ACO2. It is not a buffer against the laws of dissolution as Revelle & Suess speculated in 1957 and IPCC adapted in 2007. Instead, the surface layer is a buffer for excess CO2 awaiting the chemical reactions, and allowing Henry’s Law to proceed apace, essentially instantaneous on climate or even weather scales. The surface layer is a buffer reservoir, an accumulator holding excess CO2 in the carbon cycle. The four/five decaying exponential model does not work.

          Another problem with the equations is that they imply that atmosphere divides into four or five partitions, one unique to each of the processes. Physically this might require different tankage for, or pipe lines to, the processes. Instead, the most rapid decay at 1.186 years (previously 1.9 years), without a separate, exclusive reservoir, would exhaust the entire atmospheric reservoir. This is not a bad model, and is fully in keeping with application of IPCC’s own Mean Residence Time formula (AR4, Glossary, p. 948), a formula IPCC never used in the main body of TAR or AR4.

          Another problem with the equations is the implication that processes affect ACO2 and natural CO2 differently. IPCC does not subject the massive flows of CO2 (90 GtC oceanic vs. 6 GtC for ACO2) in the natural carbon cycle to buffering in the atmosphere. However, the species differ only in their isotopic mixes, and when ACO2 is added to the atmosphere, it creates yet other, dynamic isotopic mixes. The algebraic ratio of the dissolution of 12CO2:13CO2:14CO2 has no solution to make only ACO2 accumulate slowly in the atmosphere.

          CO2 does not accumulate in the atmosphere. The build-up apparent in the MLO data is a dynamic response primarily to the climate, and not to human activity. IPCC attempted to refute this result by proclaiming that “fingerprints” of human activity were evident in the commensurate atmospheric O2 depletion and in the lightening of the isotopic ratio of 13C/12C in the atmosphere. These two results IPCC demonstrated by graphical trickery. AR4, Figure 2.3, p. 138. For a complete discussion, see SGW, III. Fingerprints. http://www.rocketscientistsjournal.com.

        • Jeff,
          The model is a parameterization that has been found to agree well with the results of their actual model. The parameterization is definitely wrong when applied to extremely long periods, but the actual model is more correct in this respect. Of course their ocean circulation model and carbon transfer equations are neither precise.

          Furthermore I have stated repeatedly that the model is not even supposed to apply accurately to the use that have put it in.

          In spite of all these reservations, the parameterization is likely to describe reasonable well, how fast CO2 is going to be removed from the atmosphere. My curve is not science, but I believe that it is a reasonable description of what is going to happen for the atmospheric CO2 concentration if the emissions grow in the future either linearly or exponentially at the rates given in the figure. It is not meant to have any deeper value.

          The future will be different, possibly very different, but I would be very surprised, if the main reason for the difference would not be in different emission rates.

          Your extreme claims concerning the factors determining CO2 concentrations are just your claims without any value for me.

        • Pekka Pirilä 1/9/11 at 12:35 pm,

          When you write,

          >>Your extreme claims concerning the factors determining CO2 concentrations are just your claims without any value for me.

          the words “extreme” and “for me” reduce a scientific discussion to the subjective. You present yourself here as a physicist, and that gives you a professionally duty to answer technical questions arising from your scientific pronouncements.

          You have stated your conviction that humans are having an effect on climate, and won’t or can’t tell us specifically how you came to that conclusion. It appears to have arisen from your application of a formula to justify the “persistence of CO2 in the atmosphere”, and applied it only to “emissions since 1751”, undoubtedly a reference to human emissions in the industrial era. Above, at 3:10 pm. Even IPCC admits that without an accumulation of ACO2 in the atmosphere, the AGW model fails.

          So now you consider extreme questioning why you didn’t apply the same formula to the on-going natural CO2 emissions, which from the ocean alone are 15 times as great as today’s human emissions.

          You consider extreme asking what in your model prevents the process with the fastest time constant (1.9 or 1.186 years) from exceeding its formula limit (9.8% or 18.6%, respectively) and simply drawing down all but a negligible amount of atmospheric CO2.

          Now you consider extreme asking for an explanation of how and why your model relies on the assumption of surface layer equilibrium for the uptake of atmospheric CO2, the assumption by which that uptake is paced by deep ocean processes.

          When you refuse to engage in scientific discussion about your position, you are exploiting your training as a physicist to beguile. You would be treating Anthropogenic Global Warming as a dogma, a belief system, and not as a scientific model. In that regard, you would be correct. The public just needs to be alerted to that approach.

        • As a physicist I believe in many physical principles. They have been verified so thoroughly by empirical observation of very many types. Based on this knowledge very many technical devices have been constructed and found to behave as expected.

          In issues related to climate, several things are direct consequences of most solid physical knowledge. I have full confidence in these aspects of climate knowledge. The basics of CO2 accumulation is nothing more than calculating inventories and using some empirical observations to fix parameters needed in quantifying these considerations. The parameterization that I have used has been confirmed to be reasonably close to reality. It is not accurate, but its is with very high certainty not seriously wrong.

          There are many other issues in climate science that are not at all as well justified by solid scientific knowledge, but still quite uncertain or determined only with large uncertainties.

          The concentration of CO2 in the atmosphere is one of the easy things, which is understood well and can be calculated with fair accuracy, when the emissions are known or postulated. My model is not nearly the best science can produce, but good enough for illustrative purposes.

        • Pekka Pirilä 1/10/11 at 12:44 pm,

          When you write,

          >>My model is not nearly the best science can produce, but good enough for illustrative purposes.

          what exactly are you trying to illustrate? For example: (1) That a slug of CO2 inserted into the atmosphere decays according to your formula? (2) That you can calculate the atmospheric CO2 concentration applying your formula to ACO2 emissions? (3) That natural CO2 emissions don’t contribute to the CO2 concentration? Or (4) That modern average surface temperature increases are due to CO2 increases?

          You say, >>The basics of CO2 accumulation is nothing more than calculating inventories and using some empirical observations to fix parameters needed in quantifying these considerations.

          One of the first to make empirical observations was Arrhenius. He wrote,

          >> Thus if the quantity of carbonic acid increases in geometric progression, the augmentation of the temperature will increase nearly in arithmetic progression. Arrhenius, S., “On the influence of Carbonic Acid in the Air upon the Temperature of the Ground,” Phil. Mag. & J. of Science, April, 1896, p. 267.

          So Arrhenius, by observing that T(kC) = T(C) + α, a functional equation for the logarithm, was in 1896 likely the first to urge a dependence on the logarithm of CO2 concentration. But that’s only the tip of the iceberg, so to speak. He was also claiming empirical evidence that CO2 was a cause and Temperature an effect, Joseph Fourier’s 1824 Greenhouse effect.

          This was background for IPCC to write,

          >>We know that the greenhouse effect works in practice for several reasons. Firstly [a speculation about Earth’s temperature absent GHGs] [¶] Secondly, [GHG effect comparing Earth to Venus and Mars, and] [¶] Thirdly, measurements from ice cores going back 160,000 years show that the Earth’s temperature closely paralleled the amount of carbon dioxide and methane in the atmosphere (see Figure 2) Although we do not know the details of cause and effect, calculations indicate that changes in these greenhouse gases were part, but not all, of the reason for the large (5-7°C) global temperature swings between ice ages and interglacial periods. FAR, Climate Change, 1990, p. xiv.

          Thus for a century, the standard climatology model, the conventional wisdom, had CO2 the cause and global temperature the effect. An increase in CO2, from then unknown sources, in part caused a temperature increase. But within the next decade came disappointment reaching all the way back to Arrhenius:

          >>From a detailed study of the last three glacial terminations in the Vostok ice core, Fischer et al. (1999) conclude that CO2 increases started 600 ± 400 years after the Antarctic warming. TAR, ¶2.4 How Rapidly did Climate Change in the Distant Past? ¶2.4.1 Background, p. 137.

          Cause may not precede effect. That offends the transcending scientific principle of causality, a principle climatology is not free to ignore. But now observations at Vostok covering almost half a million years and over four paleo cycles show CO2 cycling peak-to-peak 116.5 ppm, lagging peak-to-peak Temperature cycles of 12.62 ºC by a millennium.

          So instead of showing scientific skepticism about the greenhouse effect, IPCC climatologists said, OK, CO2 did not cause the observed rise in Temperature, but amplified it. TAR, ¶¶3.3.2, 3.3.4, p. 203. They used slight of hand to shift the problem from modeling rising temperatures to modeling the initiation of interglacial warm epochs.

          At the same time, climatology was discovering that the observed CO2 increases were not sufficient even as an amplifier, but that CO2 itself needed an amplifier. This is seen from the following:

          >>In contrast, recent decadal temperature changes are not consistent with the model’s internal climate variability alone, nor with any combination of internal variability and naturally forced signals, even allowing for the possibility of unknown processes amplifying the response to natural forcing. TAR, ¶12.4.3.3 Space-time studies, p. 723.

          >>An important example of a positive feedback is the water vapour feedback in which the amount of water vapour in the atmosphere increases as the Earth warms. This increase in turn may amplify the warming because water vapour is a strong greenhouse gas. TAR, ¶1.2.2 Natural Variability of Climate, p. 91.

          “May”, the possibility, turned into “must”, the imperative, elsewhere:

          >>Water vapour feedback continues to be the most consistently important feedback accounting for the large warming predicted by general circulation models [GCMs] in response to a doubling of CO2. Water vapour feedback acting alone approximately doubles the warming from what it would be for fixed water vapour. Furthermore, water vapour feedback acts to amplify other feedbacks in models, such as cloud feedback and ice albedo feedback. Citations deleted, TAR, 7.2.1.1 Water vapour feedback, p. 425.

          In summary to this point, CO2 no longer initiates global warming, and by itself, is insufficient to amplify it. Why didn’t IPCC say that the Milankovitch cycle, or some even better fitting event, initiate the glacial recovery, which was then amplified by water vapor? IPCC casts CO2 as a nothing but a catalyst in the reaction. Nevertheless, IPCC persists in urging ACO2 as not just the cause of AGW, but the sole cause.

          This lack of causality breaks the chain of the AGW conjecture. ACO2 emissions connect to atmospheric CO2 concentration by the “airborne fraction”. The latter is connected to Radiative Forcing by Radiative Transfer, the subject of this thread. And the latter is connected to Global Average Surface Temperature by the climate sensitivity parameter, λ or, alternatively, its reciprocal, α. None of these connecting processes is well-managed, including your calculation, which relates to the airborne fraction.

          But notice that another problem lies half-buried in the history. CO2 once from an unknown source and a cause of warming, now lags temperature. The implication is unavoidable. CO2 is, as it always was, correlated with temperature, but a lagging response. This strongly suggests that the observed CO2 increase is caused by natural emissions brought, on by global warming due ultimately to some other cause. So where in the GCMs and Reports does IPCC account for that natural, peak-to-peak increase of 116.5 ppm? Where in your calculating is the natural CO2 increase?

          This missing CO2 is just one hole in the accounting of atmospheric CO2. Here’s another:

          >>Ice core studies on Greenland ice indicate that during the last glaciation CO2 concentration shifts of the order of 50 ppmv may have occurred within less than 100 years, parallel to abrupt, drastic climatic events (temperature changes of the order of 5°C). These rapid CO2 changes have not yet been identified in ice cores from Antarctica (possibly due to long occlusion times, therefore, it is not yet clear if they are real or represent artefacts in the ice record. Citations deleted, FAR, ¶1.2.3 Long-Term Atmospheric Carbon Dioxide Variations, p. 11.

          The reference to “long occlusion times” is the firn closure phenomenon, which makes the ice core records mechanical low pass filters. They will not be able to detect certain transient effects, and they should not match the nearly instantaneous, modern instrument records. Conclusions about the modern atmospheric CO2 level are not correct if compared to unrectified ice core records.

          IPCC again says,

          >>There is some (not fully clear) evidence from ice cores that rapid changes of CO2, ca. 50 ppmv within about a century, occurred during and at the end of the ice age. FAR, ¶1.2.8 Conclusions, p. 18.

          The first paragraph (¶1.2.3) is identifying CO2 surges not seen in the Vostok record, and opens the door to the reason why ice core records do not match one another or the modern instrument records. The second paragraph (¶1.2.8) puts one of those surges at the end of one of the ice ages. These observations seem to have inexplicably vanished in subsequent IPCC Reports.

          These latter events are not unlike the MLO record. As of 12/31/04, MLO showed a peak-to-peak increase of 67.29 ppm (“on the order of 50 ppm”) in 45.92 years (“less than 100 years”). Is that in the scope of “ca. 50 ppm” in a century, and, if need be, taking into account on-going natural and anthropogenic processes?

          So the evidence includes CO2 rising after warming, and MLO-like surges of CO2 appearing in just Greenland ice cores.

          Your conclusion that

          >> The concentration of CO2 in the atmosphere is one of the easy things, which is understood well and can be calculated with fair accuracy, when the emissions are known or postulated. My model is not nearly the best science can produce, but good enough for illustrative purposes.

          Your calculation of atmospheric CO2 is simplistic. Not only did you, a physicist, rely on a formula that violates applicable and elementary physics, but declared the matter to be “understood”, when it has a history of being misunderstood and remains today, like your calculation, full of loose ends and confused.

          The problem of the disentangling the AGW fraud needs people with scientific training, and the acumen or literacy to engage in scientific argument, which you pointedly refuse to do. What you have illustrated is how the subjective, in your case your admitted belief in human caused climate change, distorts objectivity.

        • The curves are a mathematical fit to data defined by those two numbers, 33 years doubling the CO2 difference from 280, and 2.5 C per doubling of CO2. Anyone can generate these on a spreadsheet. I used an anchor point of 370 ppm at 2000. It fits both exponential CO2 growth and the expected log response functions. What other function could I use for temperature? That log function is the assumption derived from radiative transfer theory that you yourself started with in your questions.

          Also, despite your protestations, I think all the IPCC scenarios are near 460 ppm by 2033 and only diverge after that. I don’t know what they base it on, but I base mine on that, as I am no expert in predicting that, and I don’t know any other sources for that than the IPCC literature.

          I get 0.5 C in 30 years, by taking the gradient of the 11-year smoothed UAH data, so while the gradient of 0.167 C per decade is correct, and it is based on 30 years of data, it only strictly applies to the middle 20 (1985-2005) because of the running average removing the ends.

        • Arfur Bryant

          JIm D,

          I repeat, you are speculating based on assumptions.

          You, and others, are assuming that the proxy data from ice cores prior to c1960 is as accurate and comparable to the Mauna Loa data. You are comparing two entirely different sets of data recording and assuming they are as one.

          Next, you assume the correlation between CO2 and temperature is as predicted by the IPCC. You state:

          [“The curves are a mathematical fit to data defined by those two numbers, 33 years doubling the CO2 difference from 280, and 2.5 C per doubling of CO2.”]

          Although I note you have chosen a slightly lower climate sensitivity figure than the IPCC ‘best estimate’ of 3 C per doubling.

          Further, you state:

          [“I get 0.5 C in 30 years, by taking the gradient of the 11-year smoothed UAH data, so while the gradient of 0.167 C per decade is correct, and it is based on 30 years of data, it only strictly applies to the middle 20 (1985-2005) because of the running average removing the ends.”]

          0.5 C in 30 years? According to UAH the 3-year and 11-year smoothed warming is about 0.3 C per 30 years. According to HadCRUt the overall warming in 160 years is 0.8 C. The temperature curve does not match the CO2 curve. The overall trend since 1850 (the IPCC’s start of AGW date) is a mere 0.06 C per decade. The highest overall trend was in the late 1870s (0.17 C per dec). Yet you say the ‘current’ trend of 0.167 C per decade is “correct” based on a fraction of the data available! Why do you persist in using anything other than the official data? The only trend worth discussing is the overall trend. If the temperature really is increasing exponentially, the overall trend will have to start showing an increase. A line drawn from the origin to any point along the x-axis on an exponential curve will show an increase. This is patently NOT happening wrt temperature. Whilst I repeat that, IMO, the CO2 curve lies somewhere between linear and exponential, the temperature curve is nowhere near exponential. The correlation does not exist. This is observed fact.

        • 11-year smoothed UAH has a distinct gradient that is more like 0.167 C per decade than the 0.1 you mention. I don’t know how you get that from those numbers. Maybe you are not looking at their lower troposphere trend. GISS and CRU also gives these kinds of numbers at the surface.
          You keep talking about speculating and assumptions. These are best fits to existing data that are carried forwards and that also happen to agree with AGW models and known science.
          You are speculating that the CO2 data are wrong, if not assuming that, are you not? Unfortunately science does not support any mechanism for rapid global CO2 decreases, so I prefer my assumption of slow variation which does fit science at least.

        • Arfur Bryant

          Jim D,

          Before I discuss your figures, here are some facts for you:

          1. The planet (insofar as it can be measured…) has warmed 0.8 deg C in 160 years.
          2. The Measured CO2 has increased by 110 ppm since the proxy-data assumption of 280 in year 1850. (I will ‘assume’ that figure is correct for the sake of argument.)
          3. That gives an overall warming trend of 0.5 deg C per decade. (Not smoothed.)

          Lets try to nail your figures, shall we?

          You have stated that you use a 33-year ‘doubling of the difference of CO2 since the 280 ppm level’.
          You have also stated you use a warming trend of 0.167 C per decade based on the UAH lower trop data since 1979.
          You also state that you expect to see 1000 ppm by the year 2100 – you mentioned 460 by year 2033… So, am I correct in saying you expect to see the 560 ppm (a doubling from 280) by about year 2050? Please advise if this is incorrect.

          Lets compare this with your trend:
          At 0.167 C per decade, 2050 will show a temperature anomaly of just a further 0.83 C, making the total warming for a doubling of CO2 to be 1.63 deg C – well short of the IPCC best estimate of 3 C. And, don’t forget, this assumes that all of the warming is due to CO2.

          What’s my point?

          Using short-term trends to enforce your argument is fraught with problems. You can’t have the cake of a high climate sensitivity without eating the cake of ‘correlation with [exponential] CO2’. Your figures don’t match the current data. If you make statements like “CO2 will be at 800 (or 1000) ppm by 2100”, you must find the temperature rise to match the date of reaching 560 ppm. If you want to assume a correlation between CO2 and temperature, then come up with figures that ‘prove’ that correlation. Even using a 2.5 C sensitivity, your trend of 0.167 C pd will take over 100 years.

          Yes, I may be ‘speculating’ that the ice-core data is in error but I am not predicting based on the assumption that it is. My problem with that data is with those who use it in conjunction with the Mauna Loa data without due regard for uncertainty.

        • In answer to AB.
          1000 ppm by 2100 is just a continuation of the exponential that may or may not happen. I view that as an upper limit, and the IPCC values over 800 ppm as also possible.
          I get 560 ppm by 2055, at which time the temperature increases by 1.3 more degrees than 2010, so maybe 2.1 overall if you are saying 2010 is at 0.8 C. Obviously I have been saying all along that the trend will continue to increase above the current value.
          You have to remember the IPCC 2-4.5 C for doubling is an equilibrium state which would take a few decades to reach after the doubling stopped, so it is not surprising that 2.1 C is at the small end of that, because the effect should be lagged, and my formula accounts crudely for that.
          This is not to be confused with the IPCC 2100 values that are around 3 C also. My formula would get about 4 C with the possibly ambitious 1000 ppm CO2.
          Finally I note that there are various ways of calculating the trend of UAH. Pekka comes up with a strong case for 0.14 C/decade. I can make a visual case for 0.167 by plotting the fit to the 11-year smoothed UAH, but this value also comes from my fitting formula and smoothed GISS surface temperature.

        • Arfur Bryant

          Jim D,
          You state:

          [“I get 560 ppm by 2055, at which time the temperature increases by 1.3 more degrees than 2010, so maybe 2.1 overall if you are saying 2010 is at 0.8 C.”]

          Where do you get 1.3 from? Using your trend of 0.167 per decade will only give a further 0.75 C by 2055. This means that the overall anomaly by then would be 0.8 C + 0.75 C = 1.55 C. This is much less than either the IPCC best estimate of 3 C or your estimate of 2.5 C.

          Your argument about the trend increasing…

          [“Obviously I have been saying all along that the trend will continue to increase above the current value.]”

          … is specious. There is no inclination of the trend increasing. Due to the ‘plateauing’ of temperature in the last 12 years, any upcoming 30 year trend is going to decrease, rather than increase. And, as I have pointed out many times, the overall trend of 0.5 C per decade since 1850 is also decreasing and is nowhere near the 0.167 figure.

          Further, your statement…

          [“You have to remember the IPCC 2-4.5 C for doubling is an equilibrium state which would take a few decades to reach after the doubling stopped, so it is not surprising that 2.1 C is at the small end of that, because the effect should be lagged, and my formula accounts crudely for that.”]

          … is also, IMO, specious. There is absolutely no real-world data to support this statement. If there was ‘lag’ in the heating, we would be seeing some if it by now. The ‘lag’ would be counteracting any natural variation which, according to many warmists, is the reason why we haven’t seen the expected accelerating warming by now.

          I repeat, your affinity for basing your argument on assumption fails against logic and actual data. Because you insist on speculating (predicting) based on your assumptions, you can’t explain why the ‘exponential’ rise in CO2 ppm is not mirrored by observed temperature without invoking further assumptions (in this case, lag).

          If you want to use Pekka’s 0.14 C per decade trend, that’s fine – I agree it makes more sense – but it still only makes your 560 doubling by 2055 further away from the IPCC (or your) sensitivity figure! I don’t agree with you that the 11-year smoothed fit gives 0.167 for UAH. See:

          http://woodfortrees.org/plot/uah/from:1980/to:2010/trend:132

          This gives a 1.3 C per decade trend. So Pekka is much closer. I don’t think y our visual case is accurate enough for a subject of this importance. However, I again suggest that using 30-year trends is simply not good enough to get an overall picture.

        • AB, I say that the trend is expected to increase because it is related to CO2, and it follows. Maybe it didn’t in the last few years because of the solar minimum. That is why I don’t trust short trends as representative of climate.
          I am surprised you don’t expect a lag, and you should read more about thermal inertia. The ocean doesn’t heat up very quickly, and the time scale may be decades because the heating goes into a deep layer. The main evidence for this lag is that the land areas are warming faster than the oceans.
          On your graph, I agree with the right end of the line, but the left end can only be obtained by ignoring the gradient in the 90’s, and just choosing the warm anomaly in the early years. I suspect this trend only uses the two end points rather than fitting the whole line.

        • if there was ‘lag’ in the heating, we would be seeing some if it by now. The ‘lag’ would be counteracting any natural variation which, according to many warmists… – AB

          Arfur, I curious as to how you describe, or quantify, what you think we should be seeing.

        • Arfur Bryant

          Jim D,

          OK, you say…

          [“AB, I say that the trend is expected to increase because it is related to CO2, and it follows. Maybe it didn’t in the last few years because of the solar minimum. That is why I don’t trust short trends as representative of climate.”]

          … and yet you have so far been content to use the UAH data to try to prove your point. I agree short-term trends can be misleading. That is why I use the overall trend since 1850 to argue my point. This gives an overall warming trend of 0.05 C per decade. This trend is currently decreasing and is far lower then the overall trend in the late 1870s. Of course there will be short-term periods when the rate is higher and periods when the rate is lower – or even negative over short term – but it is the overall trend that is important.

          I also note that you have abandoned the 0.167 C trend as it cannot possibly match up with your estimation of the ‘exponential’ rise in CO2. I repeat your estimate of doubling by 2055 will not produce your ‘predicted’ sensitivity rise of 3 (IPCC) or 2.5 (you) C. You say…

          [” I am surprised you don’t expect a lag, and you should read more about thermal inertia. The ocean doesn’t heat up very quickly, and the time scale may be decades because the heating goes into a deep layer. The main evidence for this lag is that the land areas are warming faster than the oceans.”]

          … expressing surprise at my stance. Yet again you are speculating based on an assumption. Please show me any evidence which quantifies your argument of ‘thermal lag’. The land area data (HadCRU) shows a warming of 0.8 C in 160 years (smoothed 0.3 C in the last 30 years) whereas the same source gives a sea temperature rise of – wait for it – about 0.8 C in 160 years and a – wait for it again – smoothed rise of 0.3 C in the last 30 years. (37 month smoothings.) In fact, the latest ARGO data (very short term, I know) indicates a slight cooling in the last 7 years or so since it started.

          This is why I don’t accept the ‘thermal lag’ argument. There is no evidence! In 160 years, the ‘lag’ theory should have produces some indication of its presence, don’t you think? Again, one would have to assume it’s existence in order to explain the lack of atmospheric warming ‘predicted’ by the cAGW theory.

        • Arfur Bryant

          JCH,

          Thats the point. I don’t ‘expect’ anything. I am only interested in facts and evidence (and not from models, either). It is the ‘expectation’ that (maybe) you and Jim D appear to have regarding the radiative theory that lead to my assertion that you are speculating (predicting) based on assumptions. I also realise that deflecting the discussion may help to avoid answering the question I was quoted as posing at the top of this thread…
          If the answer to that question is now ‘thermal inertia’ then some evidence (facts) would be appreciated.

        • Arfur Bryant,
          I try to use UAH as I think it is the only one the contrarians believe. If you use GISS you get actual surface station measurements contributing, and that does confirm 0.5 C since 1980. That one also shows the northern hemisphere warming faster than the southern, likely due to the ocean fraction difference (60% versus 80%). So I am quite sure of this 0.5 C in 30 years and the ocean lag which is more marked recently as the temperatures rises faster, and should continue to become more obvious with time as it accelerates.

        • Arfur Bryant

          Jim D,

          This is actually my second response to your post above. Not sure why the other one didn’t ‘take’ but I thought it had. I’ll precis it again:

          “[I try to use UAH as I think it is the only one the contrarians believe. If you use GISS you get actual surface station measurements contributing, and that does confirm 0.5 C since 1980.”]

          You see, I think you used UAH because it would get your message across. Unfortunately it didn’t. So, now you want to use GISS data instead! Fine. It still doesn’t add up. The GISS data linked below will give a rise of not 0.5 C but 0.38 C between 1980 and 2009. That’s thirty years to the last whole year of data.

          “[…also shows the northern hemisphere warming faster than the southern, likely due to the ocean fraction difference (60% versus 80%). “]

          Now that really is speculation based on assumption! This is not evidence for ‘thermal inertial lag’. Not by a long shot.

          “[…the ocean lag which is more marked recently as the temperatures rises faster, and should continue to become more obvious with time as it accelerates.”]

          Where is the real-world evidence to support this hypothesis? What ‘temperatures rise faster’? What ‘acceleration’?

          Jim D,

          We’ve had a mature and (I hope you agree) respectful ding-dong discussion which is now becoming more and more removed from the original question. I think it’s probably time to draw a close – would you agree?

          Regards,

          AB

        • Arfur Bryant

          Sorry, here’s the link I promised:

          http://data.giss.nasa.gov/gistemp/tabledata/GLB.Ts+dSST.txt

          AB

        • Arfur, I agree this discussion is going nowhere, and we are now confined to the margin for the second time, so it is a good place to end it. To help this, I won’t give any parting shots, tempting though it is not to leave your remarks alone. The radiative transfer model points I have made stand, and I have been consistent on those throughout. I also stand by my interpretation of the data.

        • Arfur,
          Concerning the observed rate of increase, I do not think that the satellites give the right value. I believe that their difference compared to HADCRUT3 is their weakness, not in HADCRUT3. The may be correct for what they measure, but that is not global surface temperature.

          For the estimate of the trend in the data, there are arguments in both directions. One argument to lower the estimate comes from the work of Tsonis and Swanson discussed in another thread. Swanson’s writing at RealClimate includes an interesting picture, where he presents his linear fit to the data without recent climate shift. That line is almost exactly 0.1 C/decade – and Swanson does not admit of being a skeptic.

          Getting the real trend out of data influenced by long oscillations or less regular shifts, is really difficult. I have little doubt about the existence of a warming trend caused by CO2 emissions, but determining the rate is another matter.

        • Arfur Bryant

          Pekka,

          Thanks for that. I tend to agree with you about satellite v HadCRUt. This is why I use HadCRUt in my repetition of ” 0.8 C in 160 years”. Only time will tell if the satellite data is representative.

          As for Swanson, I will read that post after this weekend as I am moving house, but it sounds interesting. However, I’d be interested to see what data he uses to come up with 1.0 C trend. I make it 0.05 C per decade since 1850 using the ‘long’ term HadCRUt data.

          As to the correlation… I always answer ‘yes’ to the question “Do I think increasing CO2 will have a warming effect on global temperature?” It is the ‘consensus’ magnitude of that effect which gives me the greatest concern. Evidence and logic argue against a significant contribution, although I agree a lesser contribution seems highly probable. I sense we pretty much agree again here.

        • Jim,
          To get a feeling on, what could really be expected about the increase of CO2-concentration, I continued my simple model to 2100 with two different emission scenarios and the using the same four-exponential persistence model through the whole period. This neglects all other influences, including the fact that seawater will not take CO2 as effectively at higher concentrations due to changes in the balance between CO2, HCO3- and CO3– (or related changes in pH).

          Anyway, I believe that the curves presented in

          http://www.pirila.fi/energy/kuvat/CO2-increase.pdf

          give a reasonable picture on what would follow from two emission scenarios. I do not consider the higher one realistic. In it the emissions grow by a factor of 2.27 to 2050 and 6.31 to 2100. Even the lower linear growth may exceed realistic possibilities of producing fossil fuels. The Chinese and Indians might wish to have all that energy, but producing it will not be easy.