

by Judith Curry
A new paper on sea level variations over the past two millennia is receiving substantial attention.
Climate related sea-level variations over the past two millennia
Andrew C. Kemp, Benjamin P. Horton, Jeffrey P. Donnelly, Michael E. Mann,
Martin Vermeer, and Stefan Rahmstorf
We present new sea-level reconstructions for the past 2100 y based on salt-marsh sedimentary sequences from the US Atlantic coast. The data from North Carolina reveal four phases of persistent sea-level change after correction for glacial isostatic adjustment. Sea level was stable from at least BC 100 until AD 950. Sea level then increased for 400 y at a rate of 0.6 mm/y, followed by a further period of stable, or slightly falling, sea level that persisted until the late 19th century. Since then, sea level has risen at an average rate of 2.1 mm/y, representing the steepest century-scale increase of the past two millennia. This rate was initiated between AD 1865 and 1892. Using an extended semiempirical modeling approach, we show that these sea-level changes are consistent with global temperature for at least the past millennium.
The full PNAS paper is available here [link].
Coauthor Stefan Rahmstorf has post on this paper over at RealClimate. The paper is generating some controversy, notably AMac’s comment that the disputed Tiljander proxies were included in the paleo temperature analysis used in the paper. Spiegel online (translated by GWPF) has an article entitled “New Sea Level Study Divides Climate Researchers.” The main points raised are:
They see a major problem of the new study in the fact that it is ultimately based only on the finding from the coast of North Carolina. That could be too limited for a statement regarding global developments. “This study is therefore not suitable at all to make predictions,” says Jens Schröter from the Alfred Wegener Institute for Polar and Marine Research.
Rahmstorf and his colleagues concede that local sea-level fluctuations may differ from the global average. Nevertheless, the scientists expect that their data show broadly the changes in global sea level. Schroeter, however, argues that over a period of more than 2000 years the influences of continental drift and the so-called isostatic rebound will be felt. This is a consequence of the last ice age: with the disappearance of the glaciers, the land masses were liberated of such a large load that they still perform a rocking movement. In Scotland, some areas were lifted by up to 60 centimeters during the last century, while parts of southern England and the French Channel coast sank by the same amount.
The new sea-level reconstruction study also differs significantly from previous studies. In a study published in 2008, a team led by Michael Mann, who is also one of the co-authors of the current study, calculated a much steeper sea-level rise for the past few centuries. For the year 500 AD, the estimated sea level was calculated to be nearly one and a half meters below the new value. Rahmstorf himself had also published studies on the historical development of sea levels in 2007 and 2009, which also deviate significantly from the new calculation.
Mojib Latif from the Leibniz Institute of Marine Sciences (IFM-GEOMAR) refers to the observation period of roughly 2000 years as “a strength of the study.” But the long-term natural fluctuations in sea level are still poorly understood: “What happened to sea level fluctuations during periods of 300 to 400 years is highly controversial.”
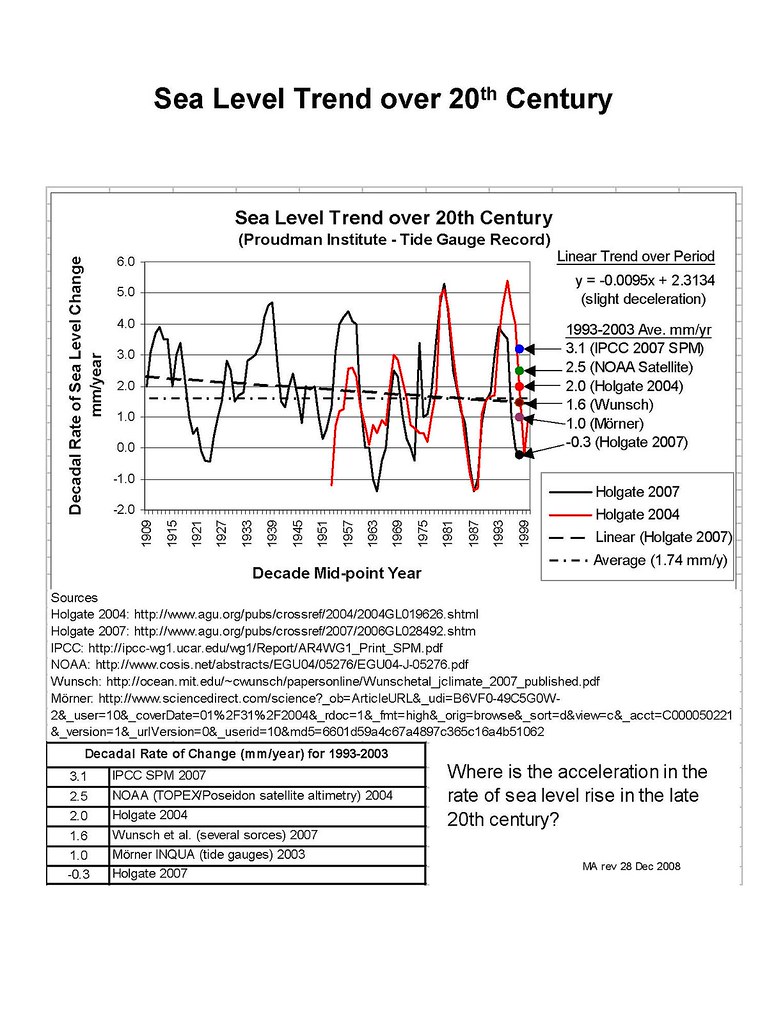
My main criticism of the paper is related to the use of the simple model that relates global average sea level rise to global average surface temperature. Several months ago, Bart Verheggan had a good post on this topic. Jeff Masters has a must read post on global sea level variations. Tonyb sent me a link to this summary diagram of different global sea level rise reconstructions for the 20th century. Tonyb also provides a link to an analysis of global sea level rise by David Burton. Tonyb also has a 2010 post at WUWT that examines the provenance of the IPCC AR4 analysis of sea level rise.
After looking at all this, I have a hard time finding much empirical rationale for a relationship between global average surface temperature and global sea level that makes sense over the range of sea level for the past several thousand years.