

by Rud Istvan
Sea level tipping points are a popular CAGW/media theory, easily suggested by images of calving icebergs and summer meltwater rushing down Greenland moulins. But they are alarmist precautionary mitigation fantasies rather than remotely possible future scenarios on multi-centennial time scales.
The core tenet of catastrophic anthropogenic global warming (CAGW) is that rising CO2 will raise temperatures and result in various catastrophes. IPCC, UNFCC and now the US NCA have argued this requires immediate drastic collective mitigation. Nature has not co-operated. Temperatures stopped rising (the pause), extreme weather did not increase (IPCC SREX), Australian drought turned to flood, Tuvalu has not disappeared, and polar bears thrive. So AR5 WG2 finally said adaptation might be a better response.
About the only urgent immediate mitigation rationale left is the precautionary principle: take expensive actions as just in case ‘insurance’. Precautions against some ‘tipping point’ beyond which the world is rapidly, disastrously, and irreversibly affected, which point at any cost we therefore dare not risk passing. No price is too high to pay to avoid a catastrophic tipping point according to this precautionary principle. Bad economics piled onto bad science.
One of the most marketed tipping points is sea level rise (SLR). The problem with ‘sudden’ SLR is that it did not happen in the Eemian interglacial. But that does not say it might not with CAGW added to this one, the Holocene.
There are only three ice bodies with enough water to cause a potentially rapid and large sea level rise. These are the Greenland, East Antarctic, and West Antarctic Ice Sheets. Since Antarctica as a whole may (inconveniently for CAGW) be accumulating ice [i], Greenland has been the ‘tipping point’ most frequently mentioned by official agencies [ii] and by the MSM. [iii]
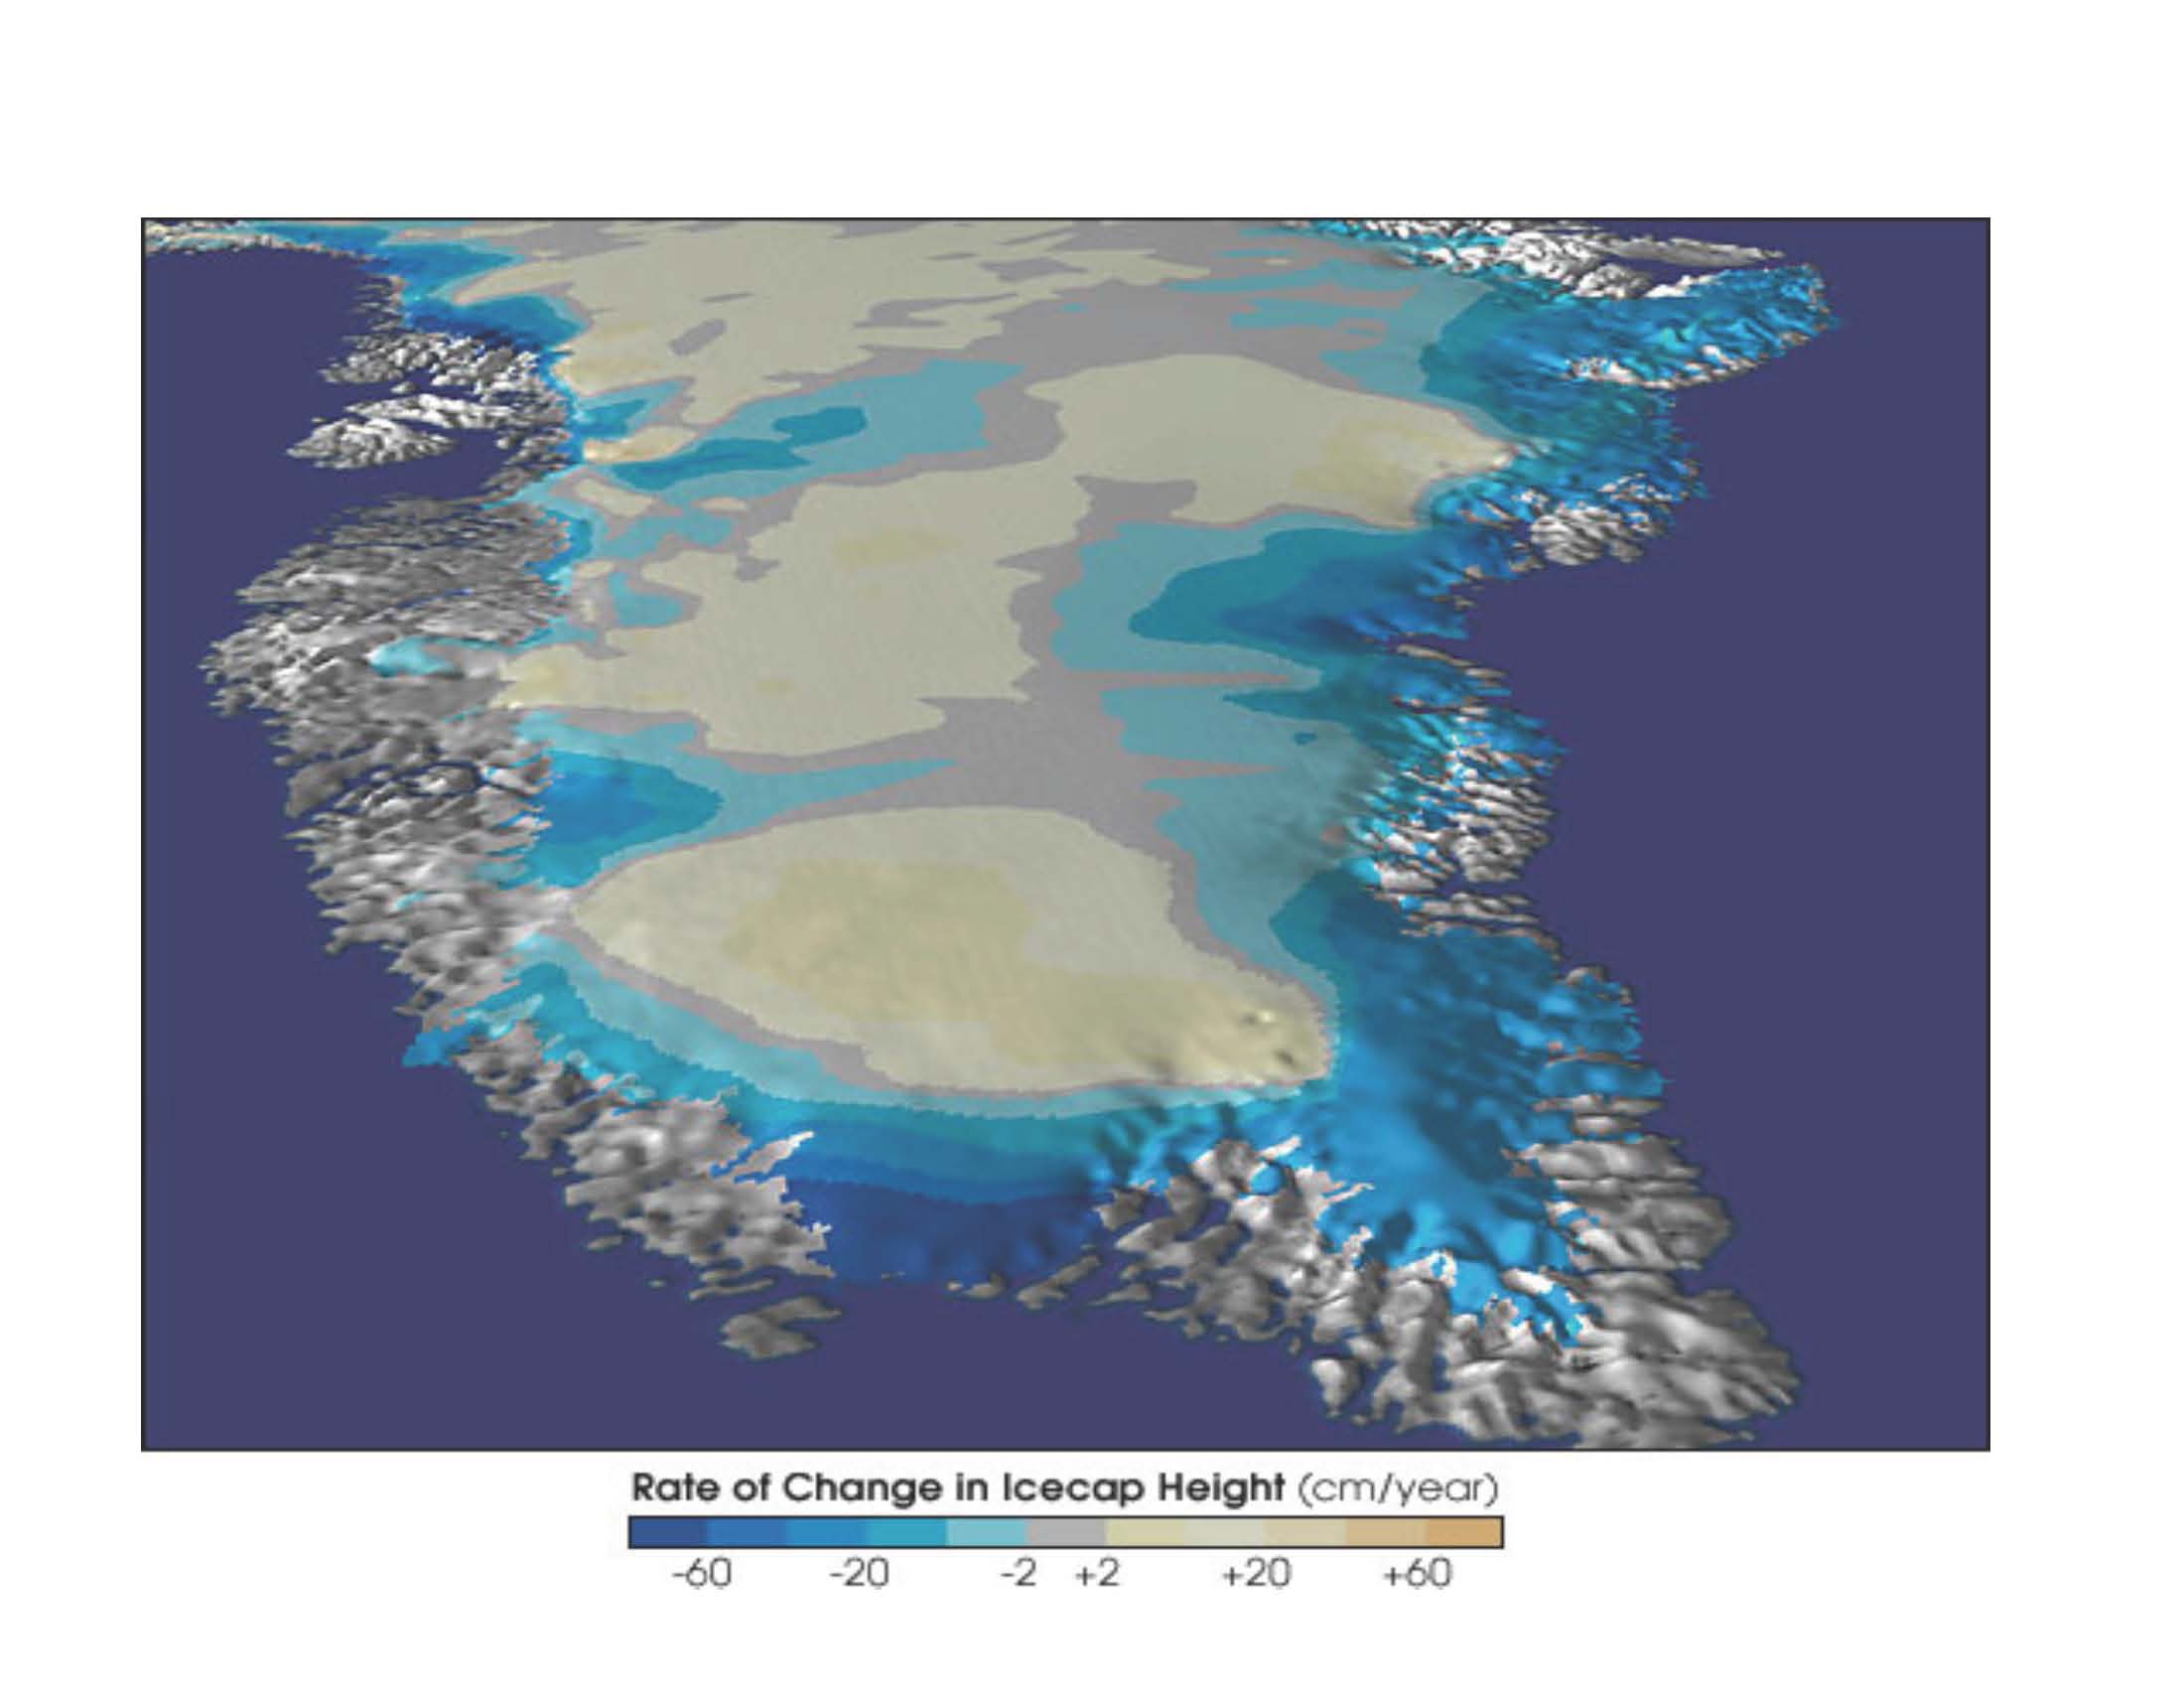
There is no doubt that Greenland is losing ice mass, and at a recently increased rate. This has been measured in different ways (ice melt boundary, gravity (GRACE), iceberg calving… The ‘consensus’ is about 170- 200 Gt per year recently, but about 100Gtpy over satellite era Arctic cycles since the estimated loss was only about 7Gtpy in the 1990s.[iv] Winter snow accumulation is as important to net ice mass balance as the summer melt.
The observed mass loss should be put into perspective. According to the Byrd Polar Research Center the Greenland Ice Sheet comprises 2.62-2.93 E+6 km3. That is a total mass of about 2.67E+18Kg (uncertainty on volume, and uncertainty on density—firn, moulins, entrained air). A gigaton is E+12Kg. Greenland is estimated to be losing about E+14Kg per year averaged over two decades. At that rate, it would take about (2.67 E+18kg mass/E+14kg average annual mass loss) 27000 years to melt/sluff. Even the recent accelerated rate (if continued) would take over 14000 years.[v] That is longer than it took the great Laurentide Ice Sheet to disappear at the end of the last ice age. If Greenland ever did melt it would raise sea level by 6.7 meters. Even at the faster melt rate this would be (670 cm/140 centuries) 4.8 cm/century of sea– an additional 0.5mm/yr—more adaptation than mitigation.
It is unlikely that Greenland will melt. NEEM showed northwest Greenland was +5-8°C above the present for about 7 millennia during the Eemian. True, more ice melted there then than has up to now in the Holocene. The NEEM site cored ‘only’ 2537 meters of ice. At end of the Eemian the NEEM location ice was about 130 meters lower—‘only’ ≈2400 meters thick.
The only way a centennial or even millennial Greenland tipping point would be possible is if much of its ice ‘slid off’. It is true that the outer ice sheet edges are glaciers creeping seaward and sluffing—calving icebergs like the one that sank the Titanic in 1912 (before AGW). But it is not true that most of the Greenland ice sheet could ever creep off, since the underlying bedrock is bowl shaped. The most graphic 3D visualization is from Bamber, University of Bristol.
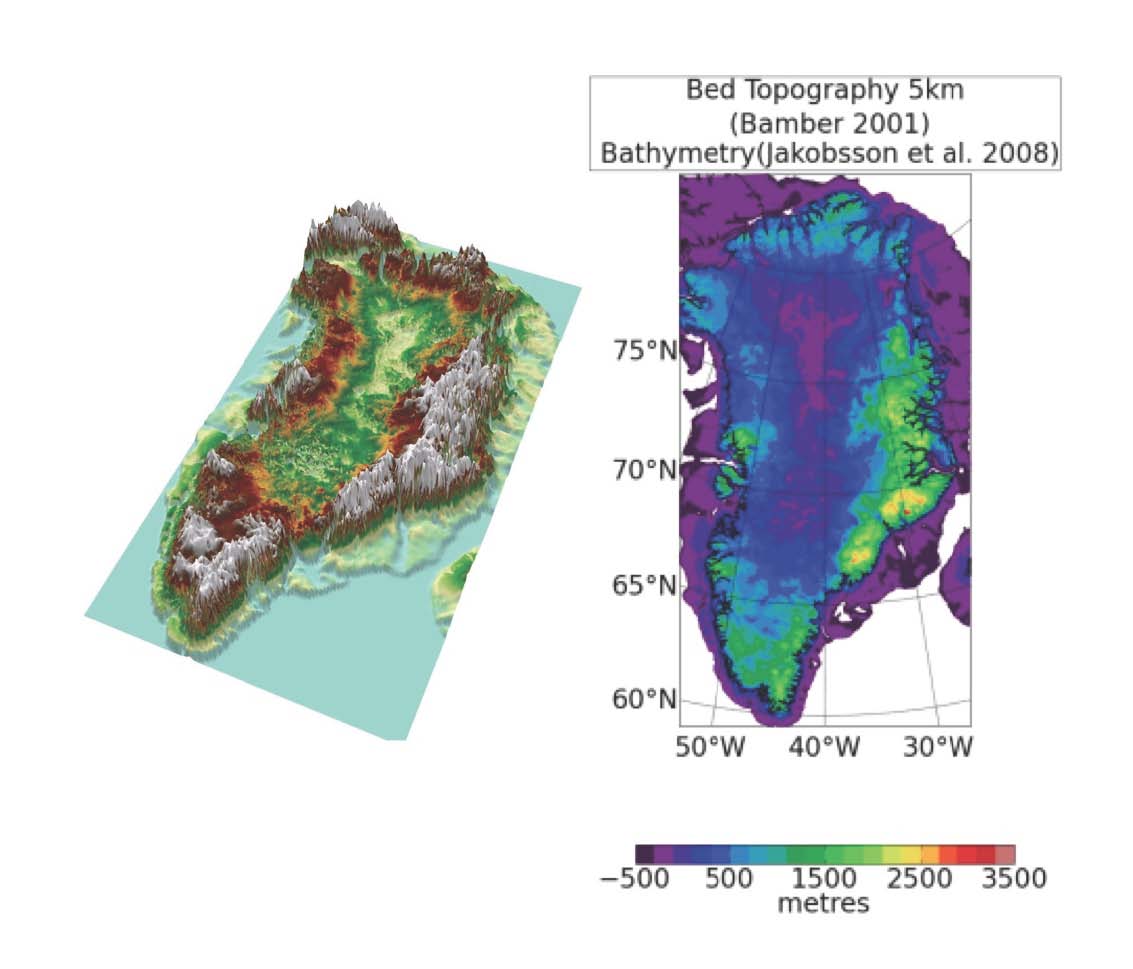
The thickest ice is over the deepest part of a bedrock bowl 1000-2500 meters deep, e.g. at the NEEM site. It is not going anywhere anytime soon. That ‘bowl’ interior is where the Greenland Sheet has been accumulating even as the edges sluff/melt. Creep decline becomes increasingly self-limited by underlying geology.
Greenland losing all its ice is geophysically impossible on millennial time scales, since it has to melt. Not something to worry about at all on centennial time scales, even as an implausible black swan or dragon king.
With Greenland geologically debunked as a possible SLR tipping point, attention turned to Antarctica. Whether Antarctica in total is gaining or losing ice is a matter of dispute between NASA and NOAA. Current NOAA ice loss is:
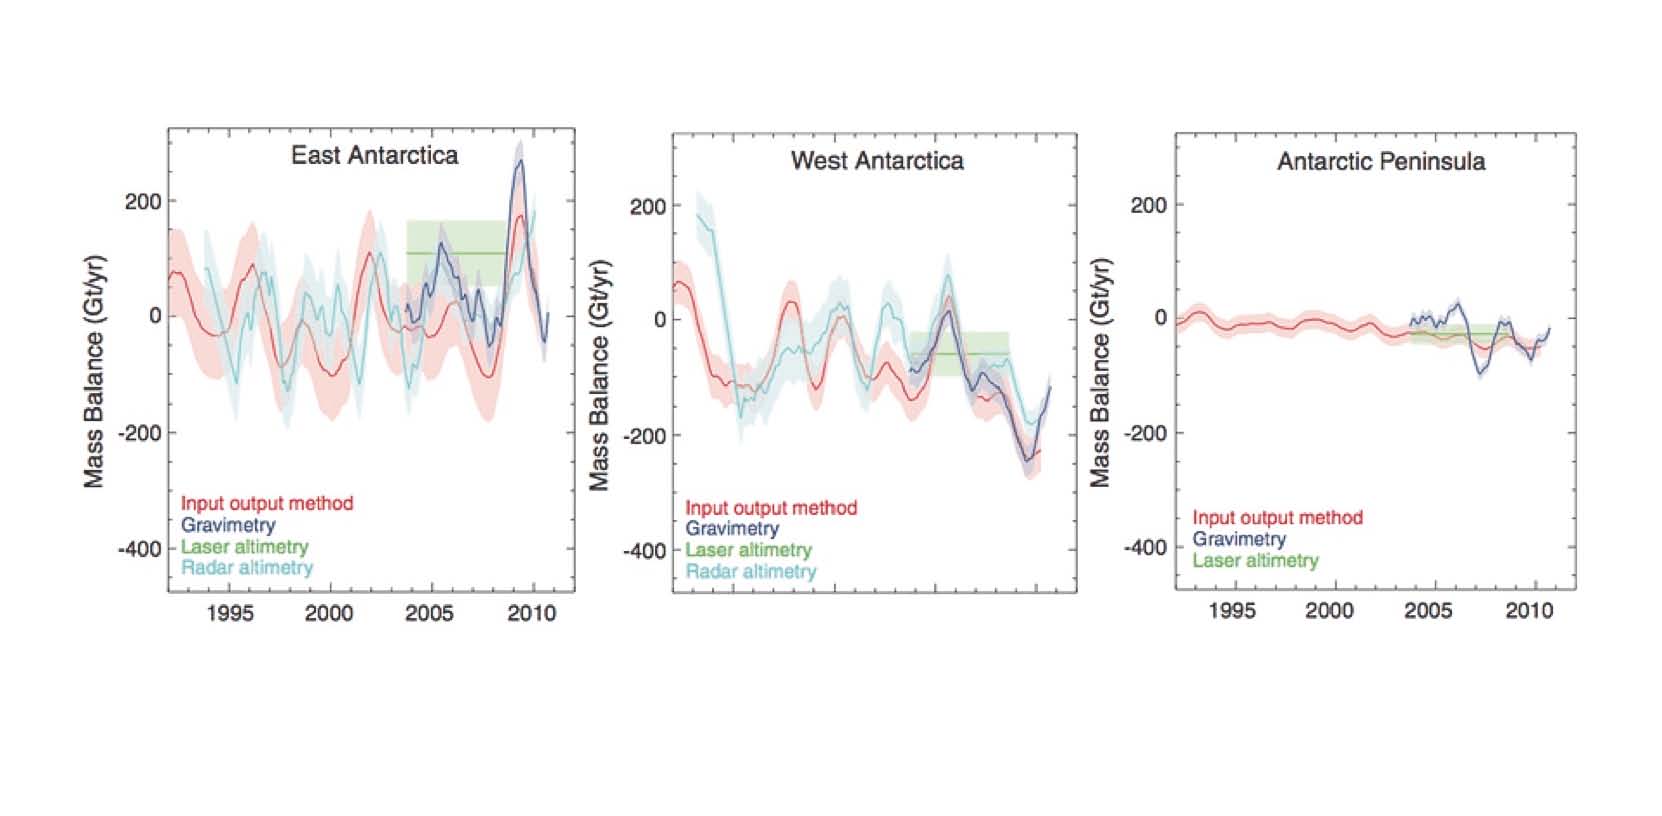
WAIS losing, EAIS gaining, the Peninsula about even. So any tipping point has to be sought in West Antarctica (WAIS). The general WAIS slope is from the Transarctic Mountain divide down to the sea, although some is anchored by the Executive Committee and Ellsworth mountain ranges.
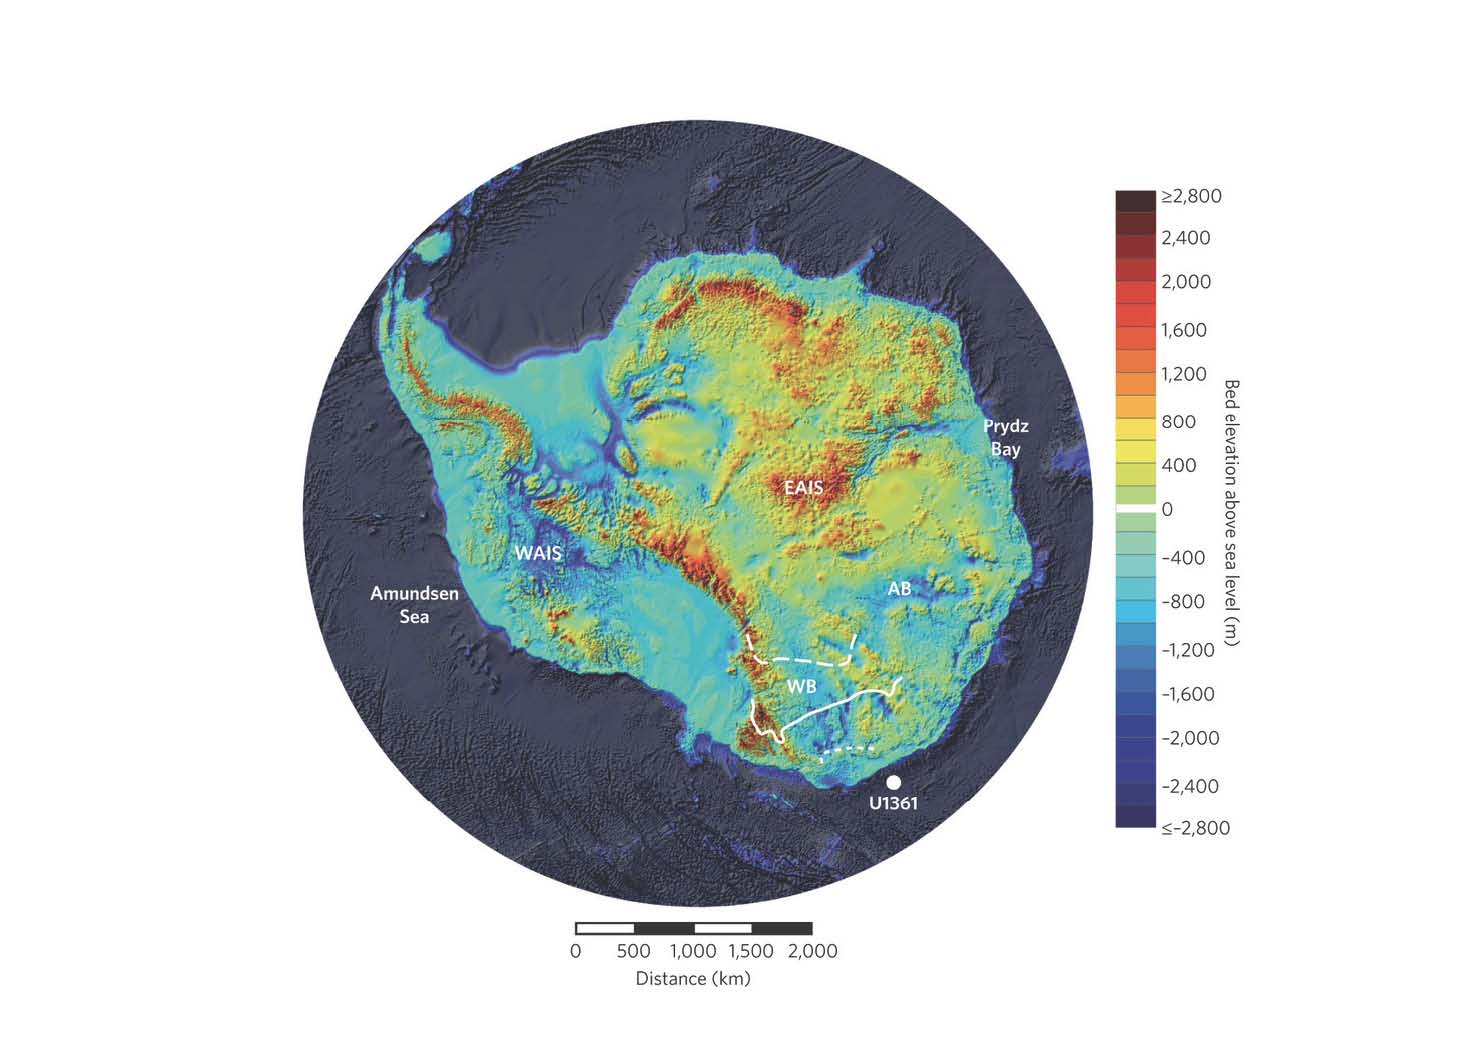
Potential WAIS instability has been the subject of much scientific scrutiny. The original concerns were the large below sea level grounded portions of the Ronne (which is not part of WAIS but is still mostly in the Western half of Antarctica) and Ross ice shelves. (Floating shelf ice cannot further raise sea levels.) These have the largest volumes of ice creeping toward the sea. Like Greenland, much of the rest (and most of EAIS) is land anchored by underlying bedrock topology. On an annual basis fresh snow still replenishes most of the lost edge mass inland at higher WAIS elevations. It is the net mass balance along these seaward sloping WAIS ice sheet edges that might constitute sufficiently large tipping points.
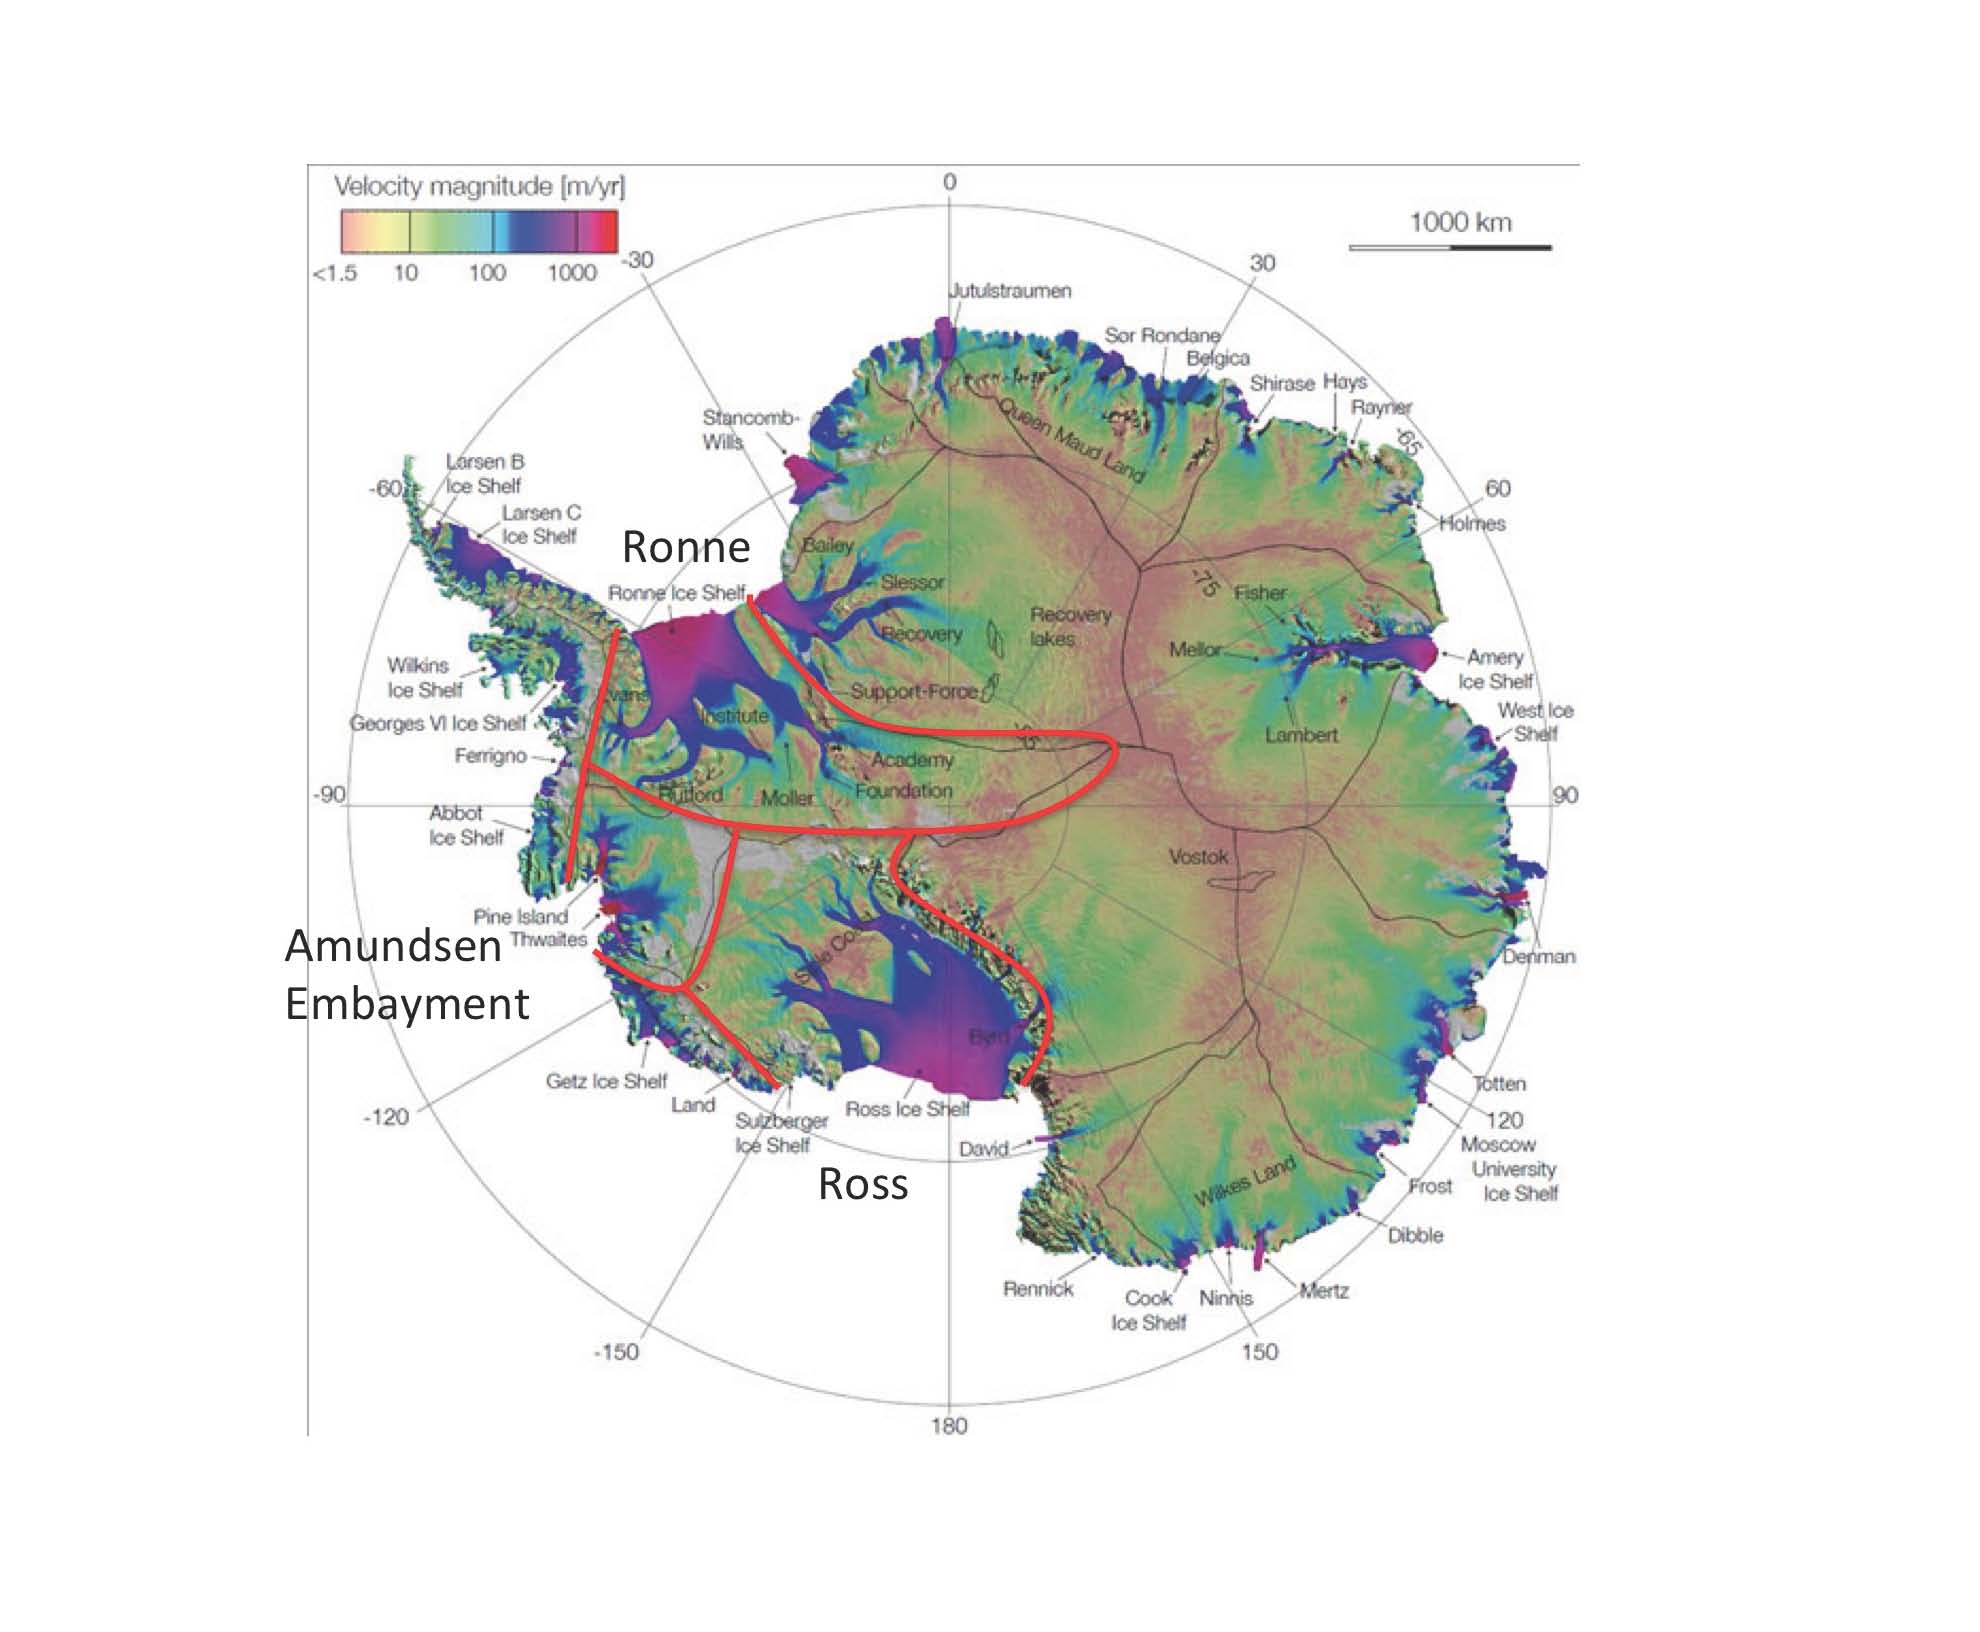
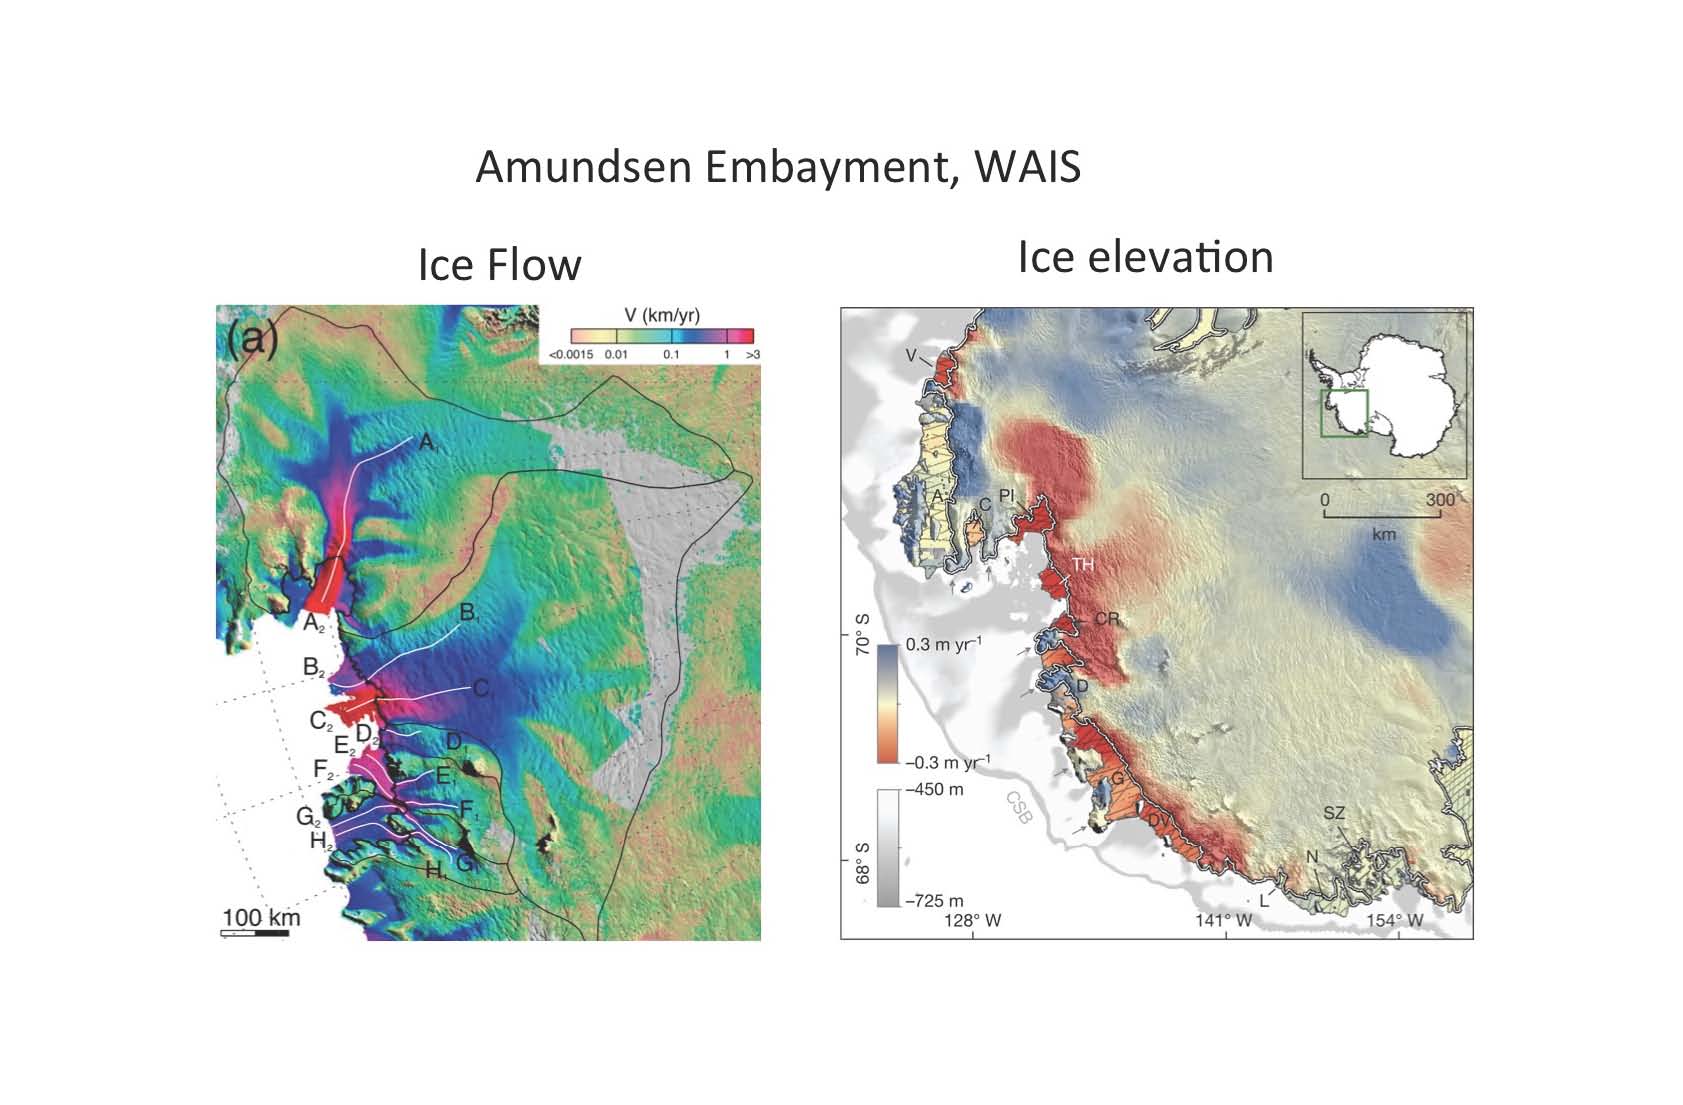
So 2014 attention turned to the only other possibility, the Amundsen Embayment, which is indisputably losing ice at an accelerating rate. Abetted by additional NASA PR and author interviews (Rignot of NASA JPL “Already gone into irreversible retreat, past the point of no return”), MSM alarmist headlines were, well, alarming. Reuters reported worldwide: “West Antarctic Glaciers in irreversible thaw: rising seas” CNN said: “Ice melt in part of Antarctica ‘appears unstoppable’, NASA says”
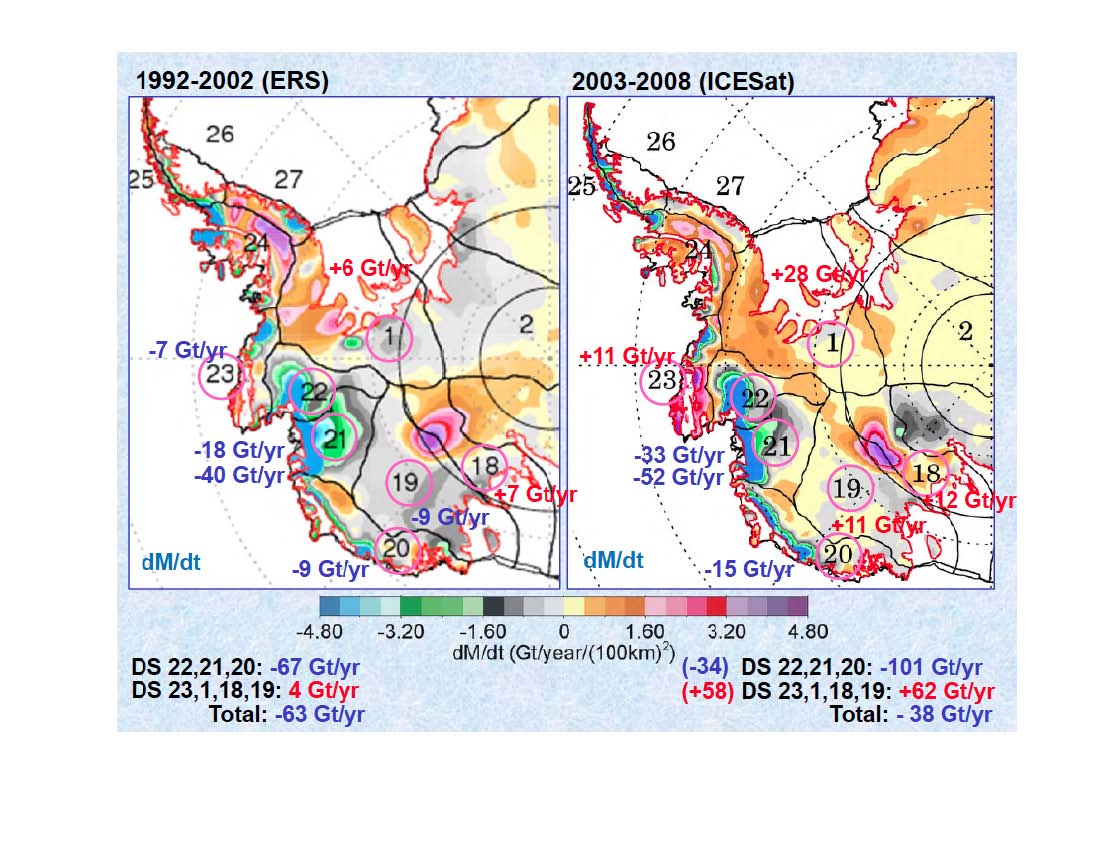
The MSM did not read these new papers carefully or in context (if at all). The first paper found Pine Island (22) plus Thwaites (21) plus the four lesser Amundsen Embayment glaciers are discharging ice more rapidly than all of Greenland (together ±330Gtyr). That is surprisingly 3-4x higher than any previous estimate, for example those also from NASA in 2011 shown above. The second paper used computer models of Thwaites (21) bottom melting to conclude it could become unstable in 200 to 900 years. If so, the computer models suggested 1mm/yr of additional SLR thereafter. Not ‘in coming decades’ as Reuters said and NASA PR implied.
There is a deeper comprehension problem in this new NASA sponsored version of a SLR tipping point. The NASA NEWS about these papers says the Embayment region contains enough ice to raise global sea level by 4 feet (1.2 meters). That is true for the entire catchment basin of about 360,000 km2. [ix]For 1.2 meters of SLR, the entire catchment would have to become entirely ice free. That is highly unlikely. The interior portions are not flowing much toward the sea according to the first paper itself, and are also still accumulating ice. [x], [xi]
Sea level tipping points are a popular CAGW/media theory, easily suggested by images of calving icebergs and summer meltwater rushing down Greenland moulins. But they are alarmist precautionary mitigation fantasies rather than remotely possible future scenarios on multi-centennial time scales.
AR5 WG2 had it right that the best response to SLR is adaptation. Major coastal cities like New Orleans (3-10mm/yr), Jakarta (6-22mm/yr), and Bangkok (10-28mm/yr) are already subsiding at much faster rates than sea levels are or will foreseeably be rising.
JC note: This is a guest post, submitted via email. As with all guest posts, keep your comments relevant and civil.