

by Judith Curry
Evidence reported by the IPCC AR5 weakens the case for anthropogenic factors dominating climate change in the 20th and early 21st centuries.
The IPCC assessment reports have expressed increasingly confident consensus views of the importance of anthropogenic influence on the global climate over the past 60 years, as reflected by these statements from the Summary for Policy Makers (SPM):
- AR4 (2007): “Most of the observed increase in global average temperatures since the mid-20th century is very likely (>90% confidence) due to the observed increase in anthropogenic greenhouse gases.” (SPM AR4)
- AR5 (2013) SPM: “It is extremely likely (>95% confidence) that human influence has been the dominant cause of the observed warming since the mid-20th century .” (SPM AR5)
This increase in confidence in the main conclusions in the AR5 SPM seems unwarranted based on the text, figures and analyses in the main WG1 Report, and also in comparison with the conclusions from the AR4. Several key elements of the report point to a weakening of the case for attributing the warming of human influences:
- Lack of warming since 1998 and growing discrepancies with climate model projections
- Evidence of decreased climate sensitivity to increases in CO2
- Evidence that sea level rise in 1920-1950 is of the same magnitude as in 1993-2012
- Increasing Antarctic sea ice extent
- Low confidence in attributing extreme weather events to anthropogenic global warming
Recent hiatus in surface warming and discrepancies with climate models
The IPCC AR5 notes the lack of warming since 1998:
[T]he rate of warming over the past 15 years (1998–2012) [is] 0.05 [–0.05 to +0.15] °C per decade)which is smaller than the rate calculated since 1951 (1951–2012) [of] 0.12 [0.08 to 0.14] °C per decade.
The significance of this hiatus in warming since 1998 is in context of comparison with climate model projections. The IPCC AR4 stated:
For the next two decades, a warming of about 0.2°C per decade is projected for a range of SRES emission scenarios. (AR4 SPM)
For the IPCC AR5, CMIP5 has produced a multi-model dataset that includes long-term simulations of twentieth-century climate and projections for the twenty-first century and beyond. The IPCC summarizes near-term projections of global mean surface temperature anomalies in Figure 1. Figure 1 shows that observations particularly since 2005 are on the low end of the envelope that contains 90% of the climate model simulations. Observations in 2011-2012 are below the 5-95% envelope of the CMIP5 simulations. The trend in the model simulations is substantially larger than the observed trend over the past 15 years.

In terms of projections for the period 2012-2035, the CMIP5 5-95% trend range is 0.11°C–0.41°C per decade. The IPCC then cites expert judgment as the rationale for lowering the estimates (indicated by the red hatching):
However, the implied rates of warming over the period from 1986–2005 to 2016–2035 are lower as a result of the hiatus: 0.10°C–0.23°C per decade, suggesting the AR4 assessment was near the upper end of current expectations for this specific time interval.
This lowering of the trend relative to the results from the raw CMIP5 model simulations was done based on expert judgment that some models are too sensitive to anthropogenic forcing.
Regarding the hiatus, the IPCC concludes that:
the hiatus is attributable, in roughly equal measure, to a decline in the rate of increase in effective radiative forcing (ERF) and a cooling contribution from internal variability (expert judgment, medium confidence). The decline in the rate of increase in ERF is primarily attributed to natural (solar and volcanic) forcing but there is low confidence in quantifying the role of forcing trend in causing the hiatus, because of uncertainty in the magnitude of the volcanic forcing trend and low confidence in the aerosol forcing trend.
In summary:
- After expecting an increase of 0.2oC per decade in the early decades of the 21st century from the AR4 statements, the rate of warming over the past 15 years is only ~0.05C.
- The IPCC AR5 bases its projection for the period 2016-2036 of 0.10 to 0.23oC per decade on expert judgment, rather than on the climate model results
- The IPCC does not have a convincing or confident explanation for the hiatus in warming.
Equilibrium sensitivity of climate to doubled CO2 concentrations
The equilibrium climate sensitivity (ECS) quantifies the response of the climate system to constant radiative forcing on multi-century time scales. ECS is defined as the change in global mean surface temperature at equilibrium that is caused by a doubling of the atmospheric CO2 concentration.
The IPCC AR4 conclusion on climate sensitivity is stated as:
“The equilibrium climate sensitivity. . . is likely to be in the range 2oC to 4.5oC with a best estimate of about 3oC and is very unlikely to be less than 1.5oC. Values higher than 4.5oC cannot be excluded. .”
The IPCC AR5 conclusion on climate sensitivity is stated as:
Equilibrium climate sensitivity is likely in the range 1.5°C to 4.5°C (high confidence), extremely unlikely less than 1°C (high confidence), and very unlikely greater than 6°C (medium confidence)
It is significant that the AR5 does not cite a best estimate, whereas the AR4 cites a best estimate of 3oC. The stated reason for not including a best estimate in the AR5 is the substantial discrepancy between observation-based estimates of ECS (lower), versus estimates from climate models (higher). Figure 1 of Box 12.2 in the AR5 WG1 report shows that 11 out of 19 observational-based studies of ECS show values below 1.5oC in their ranges of ECS probability distribution.
Hence the AR5 reflects greater uncertainty and a tendency towards lower values of the ECS than the AR4.
Sea level rise
In the AR5 SPM, the following statements are made regarding sea level rise:
Proxy and instrumental sea level data indicate a transition in the late 19th to the early 20th century from relatively low mean rates of rise over the previous two millennia to higher rates of rise (high confidence). It is likely that the rate of global mean sea level rise has continued to increase since the early 20th century.
It is very likely that the mean rate of global averaged sea level rise was 1.7 [1.5 to 1.9] mm yr–1 between 1901 and 2010, 2.0 [1.7 to 2.3] mm yr–1 between 1971 and 2010 and 3.2 [2.8 to 3.6] mm yr–1 between 1993 and 2010. It is likely that similarly high rates occurred between 1920 and 1950.
It is very likely that there is a substantial contribution from anthropogenic forcings to the global mean sea level rise since the 1970s.
The rate of global mean sea level as portrayed in AR5 is shown in Figure 2 below.
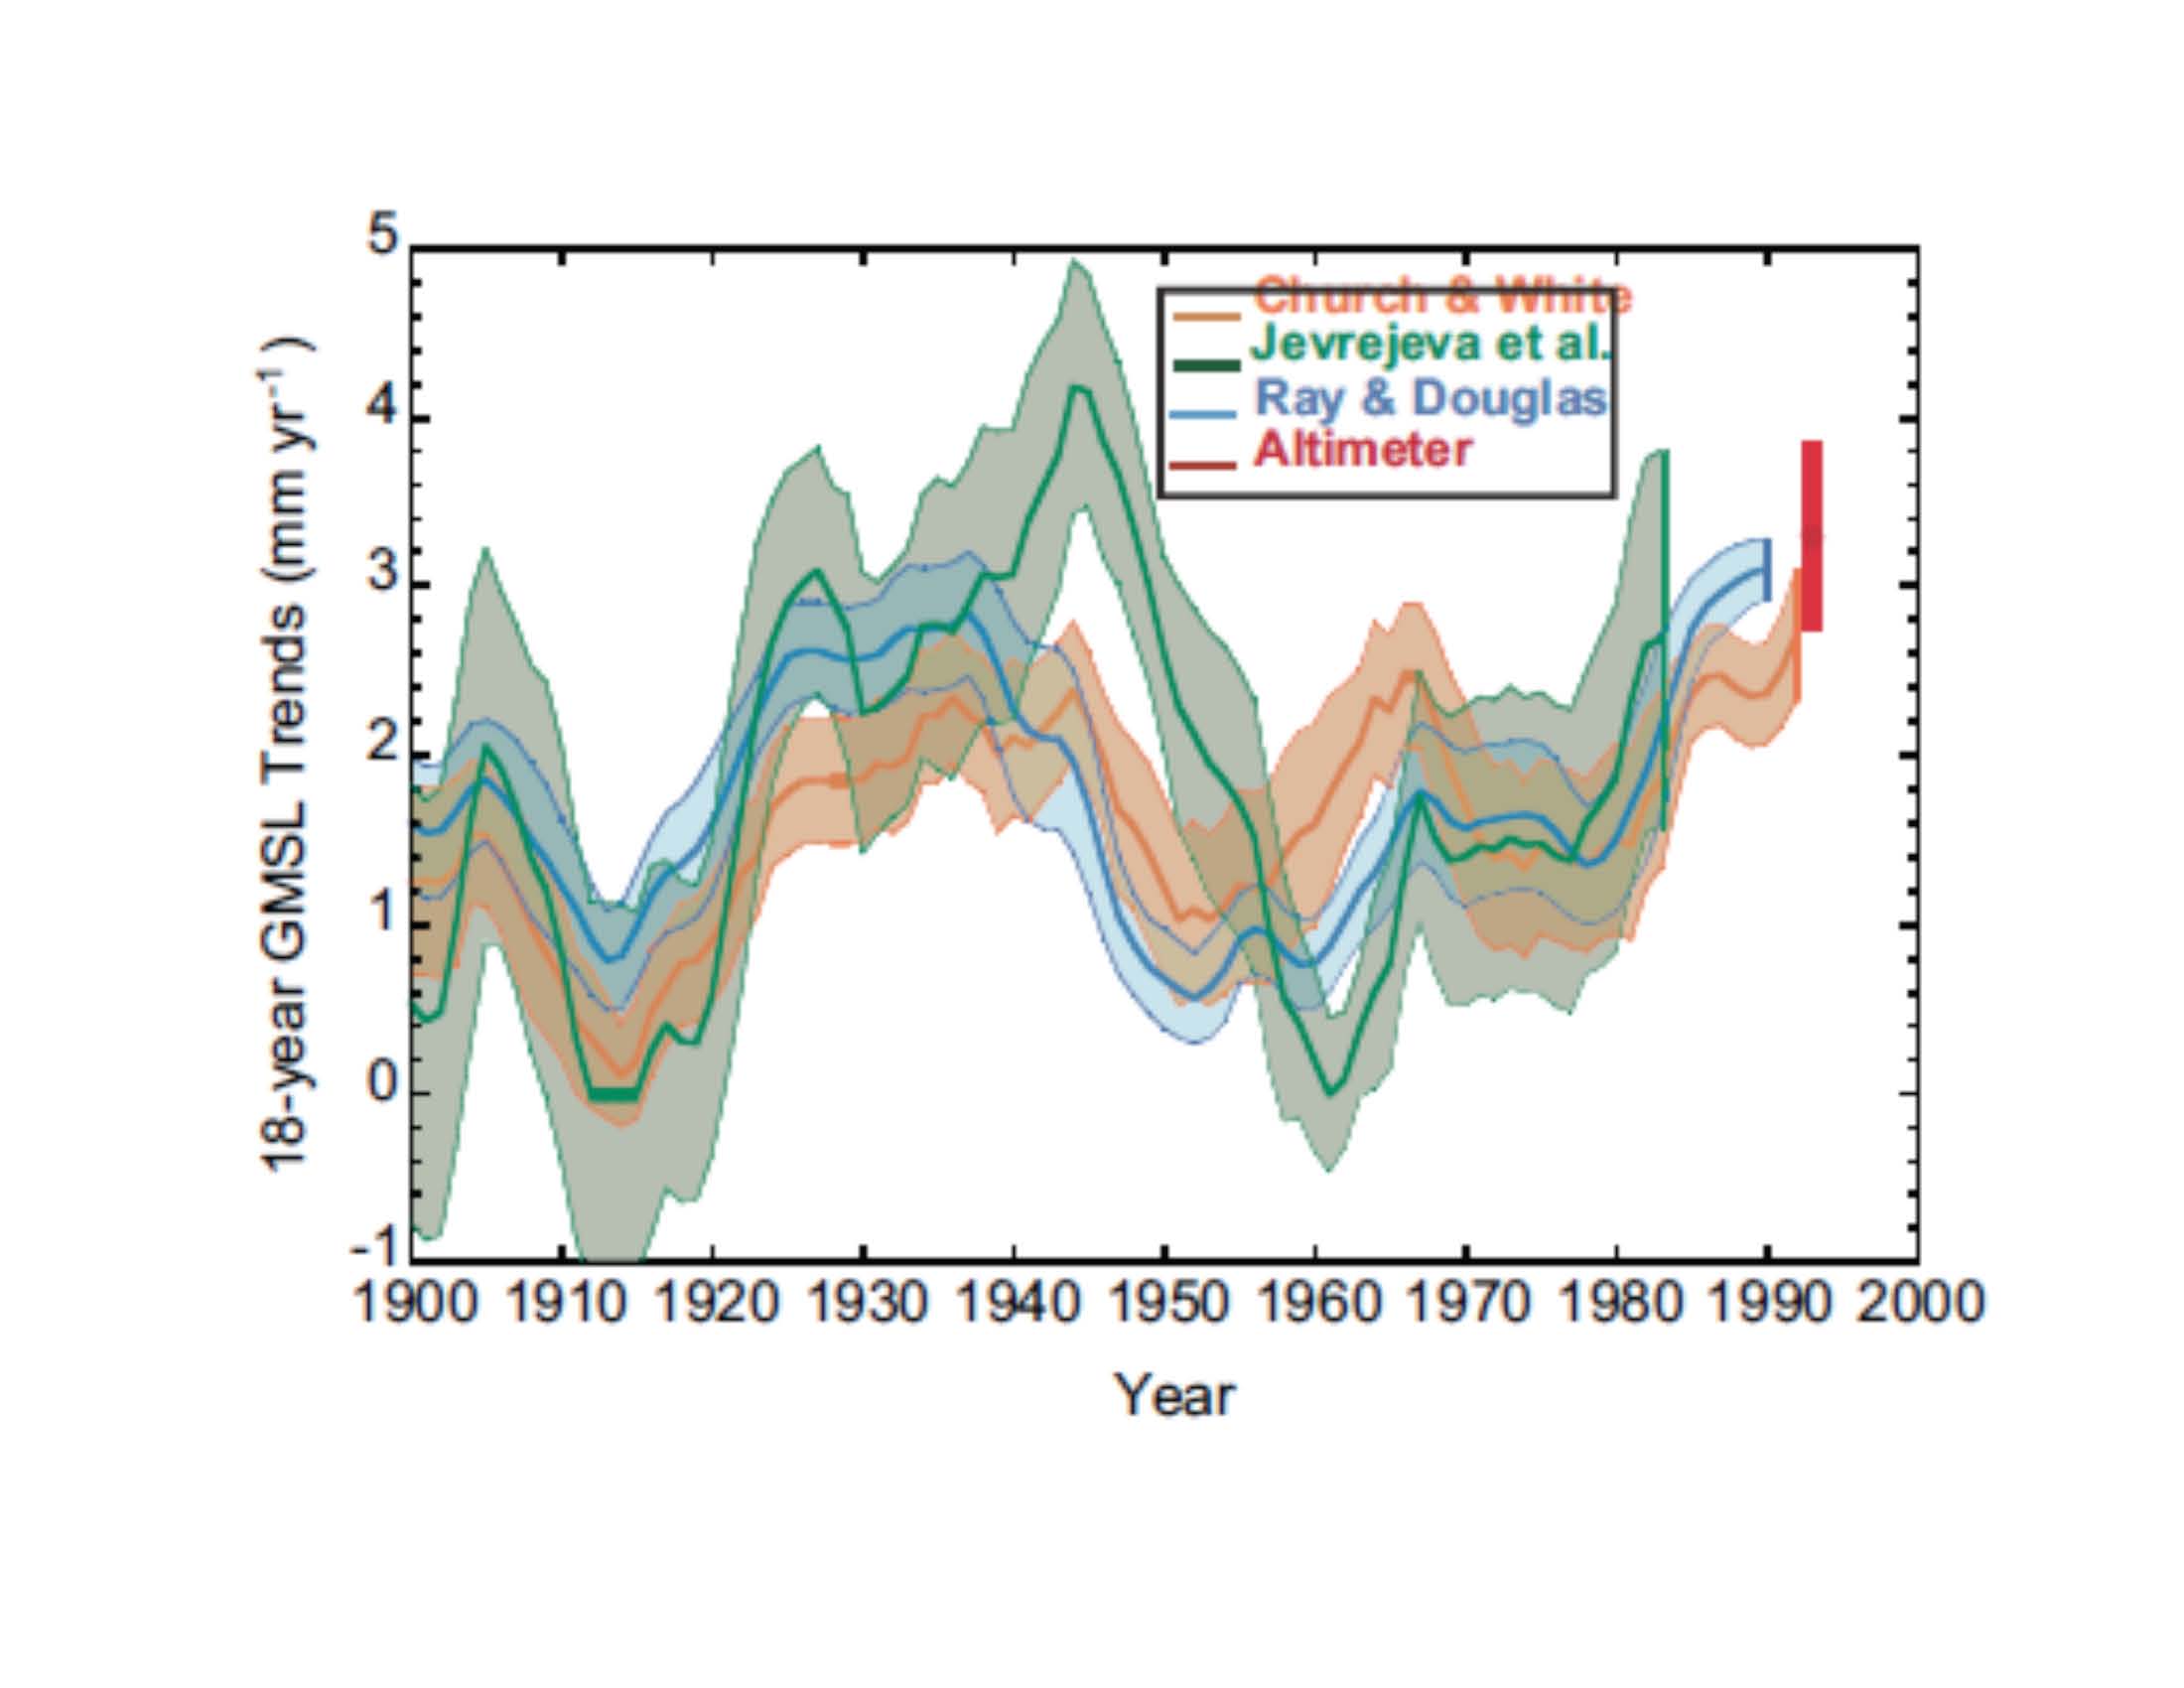
It is seen that the rate of rise during 1930-1950 was comparable to, if not larger than, the value in recent years. This IPCC’s analysis does not support an acceleration in the rate of sea level rise in the latter 20th century, and hence the data does not support the IPCC’s conclusion of a substantial contribution from anthropogenic forcings to the global mean sea level rise since the 1970s.
Sea ice
The IPCC AR5 reports the following trends in sea ice:
Continuing the trends reported in AR4, the annual Arctic sea ice extent decreased over the period 1979–2012: the rate of this decrease was very likely between 3.5 and 4.1% per decade.
It is very likely that the annual Antarctic sea ice extent increased at a rate of between 1.2 and 1.8% per decade between 1979 and 2012.
Chapter 10 on Attribution states:
Anthropogenic forcings are very likely to have contributed to Arctic sea ice loss since 1979. There is low confidence in the scientific understanding of the observed increase in Antarctic sea ice extent since 1979, due to the incomplete and competing scientific explanations for the causes of change and low confidence in estimates of internal variability.
Arctic temperature anomalies in the 1930s were apparently as large as those in the 1990s and 2000s.There is still considerable discussion of the ultimate causes of the warm temperature anomalies that occurred in the Arctic in the 1920s and 1930s.
The increase in Antarctic sea ice is not understood and is not simulated correctly by climate models. The Arctic temperature anomalies in the 1930’s were as large as the recent temperature anomalies. Hence confident statements about attribution of the Arctic sea ice decline since 1979 do not seem to be supported by understanding, in spite of the simulations by climate models that reproduce the decline.
Extreme events
The AR5 is less confident than the AR4 in terms of increasing heat waves, drought, and tropical cyclone intensity.
The AR5 is less confident of an increase in heat waves than the AR4, and finds no evidence of increased heat waves in the U.S.:
AR4: Widespread changes in extreme temperatures have been observed over the last 50 years. Cold days, cold nights and frost have become less frequent, while hot days, hot nights, and heat waves have become more frequent
AR5: It is very likely that the numbers of cold days and nights have decreased and the numbers of warm days and nights have increased globally since about 1950. There is only medium confidence that the length and frequency of warm spells, including heat waves, has increased since the middle of the 20th century mostly due to lack of data or studies in Africa and South America. However, it is likely that heat wave frequency has increased during this period in large parts of Europe, Asia and Australia.
The AR5 finds that AR4 conclusions regarding increasing trends in drought were probably overstated, and that drought has likely decreased in central North America:
Confidence is low for a global-scale observed trend in drought or dryness (lack of rainfall) since the middle of the 20th century, due to lack of direct observations, methodological uncertainties and geographical inconsistencies in the trends. Based on updated studies, AR4 conclusions regarding global increasing trends in drought since the 1970s were probably overstated. However, this masks important regional changes: the frequency and intensity of drought has likely increased in the Mediterranean and West Africa and likely decreased in central North America and north-west Australia since 1950.
On tropical cyclones, the AR5 is less confident than the AR4 of increases in intense tropical cyclone activity:
AR4: There is observational evidence for an increase of intense tropical cyclone activity in the North Atlantic since about 1970, correlated with increases of tropical sea surface temperatures. There are also suggestions of increased intense tropical cyclone activity in some other regions where concerns over data quality are greater.
AR5: Confidence remains low for long-term (centennial) changes in tropical cyclone activity, after accounting for past changes in observing capabilities. However, it is virtually certain that the frequency and intensity of the strongest tropical cyclones in the North Atlantic has increased since the 1970s.
- the AR5 WG1 text not supporting the SPM conclusions
- the AR5 pulling back relative to the AR4