

by Judith Curry
Motivated by the paper by Cowtan and Way, this post examines uncertainties in the recent variability of Arctic temperatures.
This post considers two papers that compare reanalyses with surface based observations in the Arctic. For background on reanalyses, see this previous post reanalyses.org.
On the possibilities to use atmospheric reanalyses to evaluate the warming structure in the Arctic
C. E. Chung, H. Cha, T. Vihma, P. Räisänen, and D. Decremer
Abstract. There has been growing interest in the vertical structure of the recent Arctic warming. We investigated temperatures at the surface, 925, 700, 500 and 300 hPa levels in the Arctic (north of 70 N) using observations and four reanalyses: ERA-Interim, CFSR, MERRA and NCEP II. For the period 1979–2011, the layers at 500 hPa and below show a warming trend in all seasons in all the chosen reanalyses and observations. Restricting the analysis to the 1998–2011 period, however, all the reanalyses show a cooling trend in the Arctic-mean 500 hPa temperature in autumn, and this also applies to both observations and the reanalyses when restricting the analysis to the locations with available IGRA radiosoundings. During this period, the surface observations mainly representing land areas surrounding the Arctic Ocean reveal no summertime trend, in contrast with the reanalyses whether restricted to the locations of the available surface observations or not.
In evaluating the reanalyses with observations, we find that the reanalyses agree better with each other at the available IGRA sounding locations than for the Arctic average, perhaps because the sounding observations were assimilated into reanalyses. Conversely, using the reanalysis data only from locations matching available surface (air) temperature observations does not improve the agreement between the reanalyses. At 925 hPa, CFSR deviates from the other three reanalyses, especially in summer after 2000, and it also deviates more from the IGRA radiosoundings than the other reanalyses do. The CFSR error in summer T925 is due mainly to underestimations in the Canadian-Atlantic sector between 120W and 0. The other reanalyses also have negative biases in this longitude band.
Published in Atm. Chem. Phys. (2013), [link] to full manuscript.
The paper considers the three most recent reanalysis products since 1979: ERA Interim (ECMWF), CFSR (NOAA), and MERRA (NASA). Surface temperatures from the reanalyses are compared with GISTEMP, as described below:
To evaluate the surface air temperature in the reanalyses, we use the Goddard Institute for Space Studies (GISS) analysis of global surface temperature change , referred to here as “GISTEMP”. GISTEMP integrates in situ surface air temperature measurements over land- and ship-based and satellite-derived SST measurements. The SST measurements are, however, only used over year-round ice-free areas. The GISTEMP version we use here is a gridded monthly mean data set with a 250 km smoothing. The use of a smoothing distance of 250 km instead of 1200 km (the default of GISTEMP) avoids the uncertainty related to the extrapolation of temperature measurements made at Arctic observation sites to large distances over the open ocean or sea ice, thereby providing a more robust point of comparison for the reanalyses. On the other hand, a consequence of the 250 km smoothing distance is that it leaves a large amount of data gaps. The GISTEMP data we use are defined only for a fraction of the Arctic area (on average, 27% from 1979 to 2011), mainly limited to the vicinity of the observation sites on the land and permanently ice-free parts of the Barents Sea and Greenland Sea (see Fig. 11).
JC comment: The bolded text directly addresses concerns that I had about the Cowtan and Way analyses of Central Arctic surface temperatures.
The main figure of interest to me is Figure 2 (double click to enlarge):
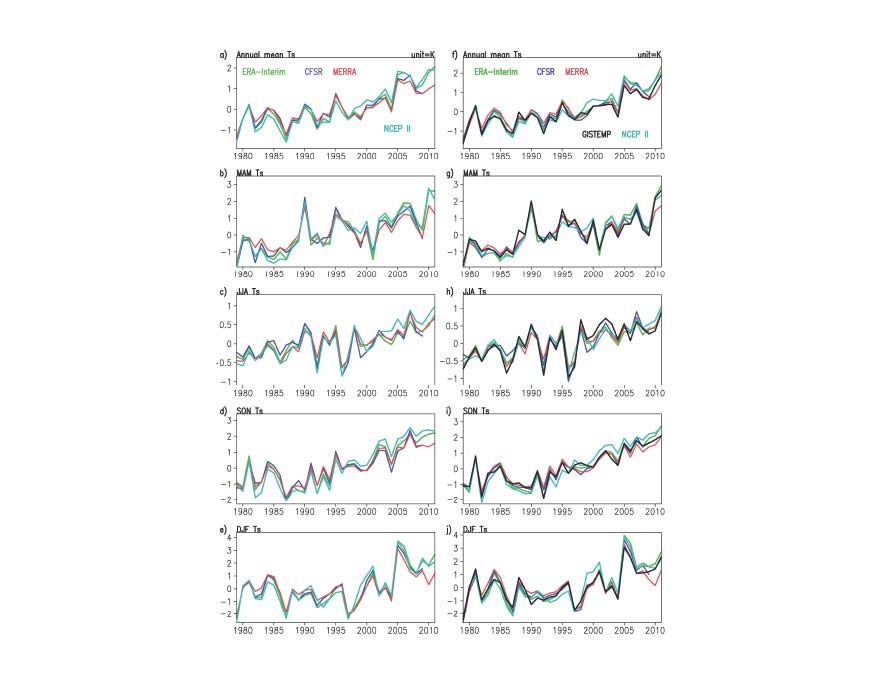
Fig. 2. 70–90 N average Ts anomalies relative to 1979–2009 climatology from four reanalyses and GISTEMP. On the left, the true 70–90 N average is shown. On the right, the average is calculated using only those reanalysis data that correspond to the available GISTEMP data in location and time. Note that Ts refers to surface air temperature (SAT) for the reanalyses, and to a combination of SAT over land and SST over ocean for GISTEMP.
The things that strike me about Figure 2 are:
- The the left column and the right column show the same general interannual variability and trend, indicating that using only the locations where there are observations does a fairly good job for the entire region from 70-90N.
- Comparing Figure 2a with Figure 4b from Cowtan and Way shows large differences (although Fig 4b is only for a small patch in the Central Arctic Ocean). A comparison of CW for 70-90N with Fig 2a from Chung et al. is needed.
- The 2005 warming emphasized by Cowtan and Way (and earlier by Hansen) appears to be associated with a large spike in winter (DJF) of 2005, and does not appear in the other seasons. From cryosphere today plot, 2005 appears as a year with an unusually low annual cycle of sea ice extent. I don’t recall reading anything about this, worth looking into.
- Most of the overall trend is associated with the jump in 2005; since 2005 (the period of the main sea ice loss), there was a decrease in SAT until about 2008, and then an increase; the last few years show substantial disagreement between MERRA and the other two reanalyses.
Vertical structure of recent Arctic warming from observed data and reanalysis products
Vladimir Alekseev, Igor Esau, Igor Polyakov, Sarah Byam, Svetlana Sorokina
Abstract. Spatiotemporal patterns of recent (1979–2008) air temperature trends are evaluated using three reanalysis datasets and radiosonde data. Our analysis demonstrates large discrepancies between the reanalysis datasets, possibly due to differences in the data assimilation procedures as well as sparseness and inhomogeneity of high-latitude observations. We test the robustness of arctic tropospheric warming based on the ERA-40 dataset. ERA-40 Arctic atmosphere temperatures tend to be closer to the observed ones in terms of root mean square error compared to other reanalysis products used in the article. However, changes in the ERA-40 data assimilation procedure produce unphysical jumps in atmospheric temperatures, which may be the likely reason for the elevated tropospheric warming trend in 1979–2002. NCEP/NCAR Reanalysis data show that the near-surface upward temperature trend over the same period is greater than the tropospheric trend, which is consistent with direct radiosonde observations and inconsistent with ERA-40 results. A change of sign in the winter temperature trend from negative to positive in the late 1980s is documented in the upper troposphere/lower stratosphere with a maximum over the Canadian Arctic, based on radiosonde data. This change from cooling to warming tendency is associated with weakening of the stratospheric polar vortex and shift of its center toward the Siberian coast and possibly can be explained by the changes in the dynamics of the Arctic Oscillation. This temporal pattern is consistent with multi-decadal variations of key arctic climate parameters like, for example, surface air temperature and oceanic freshwater content. Elucidating the mechanisms behind these changes will be critical to understanding the complex nature of high-latitude variability and its impact on global climate change.
Published in Climatic Change, 2011, [link] to full manuscript
Section 2 on data provides a very useful explanation of available surface observations in the Arctic, reanalyses, and their limitations.
IMO the most interesting section is 5 Lower Stratospheric Temperature Trends.
See Figure 10 for maps of seasonal surface air temperature trends from reanalyses and from the IABP/POLES surface observations.
From the Conclusions, I find this paragraph to be particularly insightful:
This pattern of temporal changes may be associated with multi-decadal fluctuations on time scales of 50–80 years, which are known to be exceptionally strong in the Arctic and North Atlantic. Polyakov et al. (2008) demonstrated a strikingly coherent pattern of long-term variations of the key arctic climate parameters and strong coupling of longterm changes in the Arctic climate system with those at lower latitudes. Remarkably coherent low-frequency variations are expressed by the arctic SAT, Arctic Ocean fresh water content and intermediate Atlantic Water core temperature, fast-ice thickness, and North Atlantic sea surface temperature. For example, associated with this variability, the arctic SAT record shows two warmer periods in the 1930–40s and in recent decades, and two colder periods early in the 20th century and in the 1960–70s. The observed stratospheric air temperature variations are consistent with this pattern. The long-term changes in the upper troposphere/ lower stratosphere seem to occur together with changes at the surface, including the extent of Eurasian snow cover and sea ice. Elucidating the mechanisms behind these relationships will be critical to our understanding of the complex nature of low-frequency variability found in the Arctic and at lower latitudes, and its impact on climate change.
JC comments: These two papers provide additional background on the available data sets for Arctic Ocean surface temperatures. In addition to the surface buoys and the reanalysis data sets, there are also field observations from a number of experiments over the past several decades. So there is some information; the challenge is to usefully evaluate the information that is available, and assess the uncertainties.
Both papers raise interesting issues regarding the Arctic atmosphere, identifying a shift circa 1998. Piecing together the coupled variability of the Arctic atmosphere, sea ice and ocean is a substantial challenge, particularly in view of Alexeev et al.’s concluding statement:
Elucidating the mechanisms behind these relationships will be critical to our understanding of the complex nature of low-frequency variability found in the Arctic and at lower latitudes, and its impact on climate change.