

by Steven Mosher
Some updates from the Berkeley Earth Surface Temperature project.
A short time ago, Berkeley Earth completed a major upgrade to its website at http://berkeleyearth.org/. The upgrade included a few new sections, improved navigation for looking up stations, new memos, new datasets and of course links to follow us on social media. I’ll briefly cover some of these changes, and in light of Judith’s post So what is the best available scientific evidence anyways, I’ll spend more time on the new datasets.
The new sections include some work in progress. Most notable here is the beginning of the work we are doing on GCM comparisons to observations. Start here and explore. As this is work-in-progress, I’ll answer some general questions as best I can.
New memos are listed here, and the two highlights in my mind are the work that Zeke Hausfather recently posted [link] , and Dr. Muller’s memo on methane leakage [link] .
With 39000 stations in the database, finding what you want can sometimes be difficult. We’ve improved the interface for finding stations and now you can search by name and latitude/longitude [link], or you can use a clickable map [link].
The improvements to the dataset include some substantial changes. We are now in a position to provide monthly updates somewhat automatically. Since the process requires generating well over 100K new graphics every update, this can take a while after the close of a month, but going forward the data should be more current than it has been in the past.
In addition, we’ve made a few important processing changes since publication. Recently we added an additional 2000 stations. We’ve also improved the “breakpoint” code as a result of an exercise conducted for the last AGU [see poster] where we conducted a double-blind test of our method against synthetic data. Finally, we’ve improved the estimation and removal of seasonality in the kriging process. The net result of these improvements doesn’t change any of our conclusions in a material way, although there are some changes in the early record, all within the rather wide uncertainty bounds for pre 1850 records.
We’ve also added a dataset that many have asked for: station records after “scalpeling” or “breakpoint adjusted data.” Now, you can examine a station record before breakpoint analysis and after, viewing the graphics here; you can download the data here. .
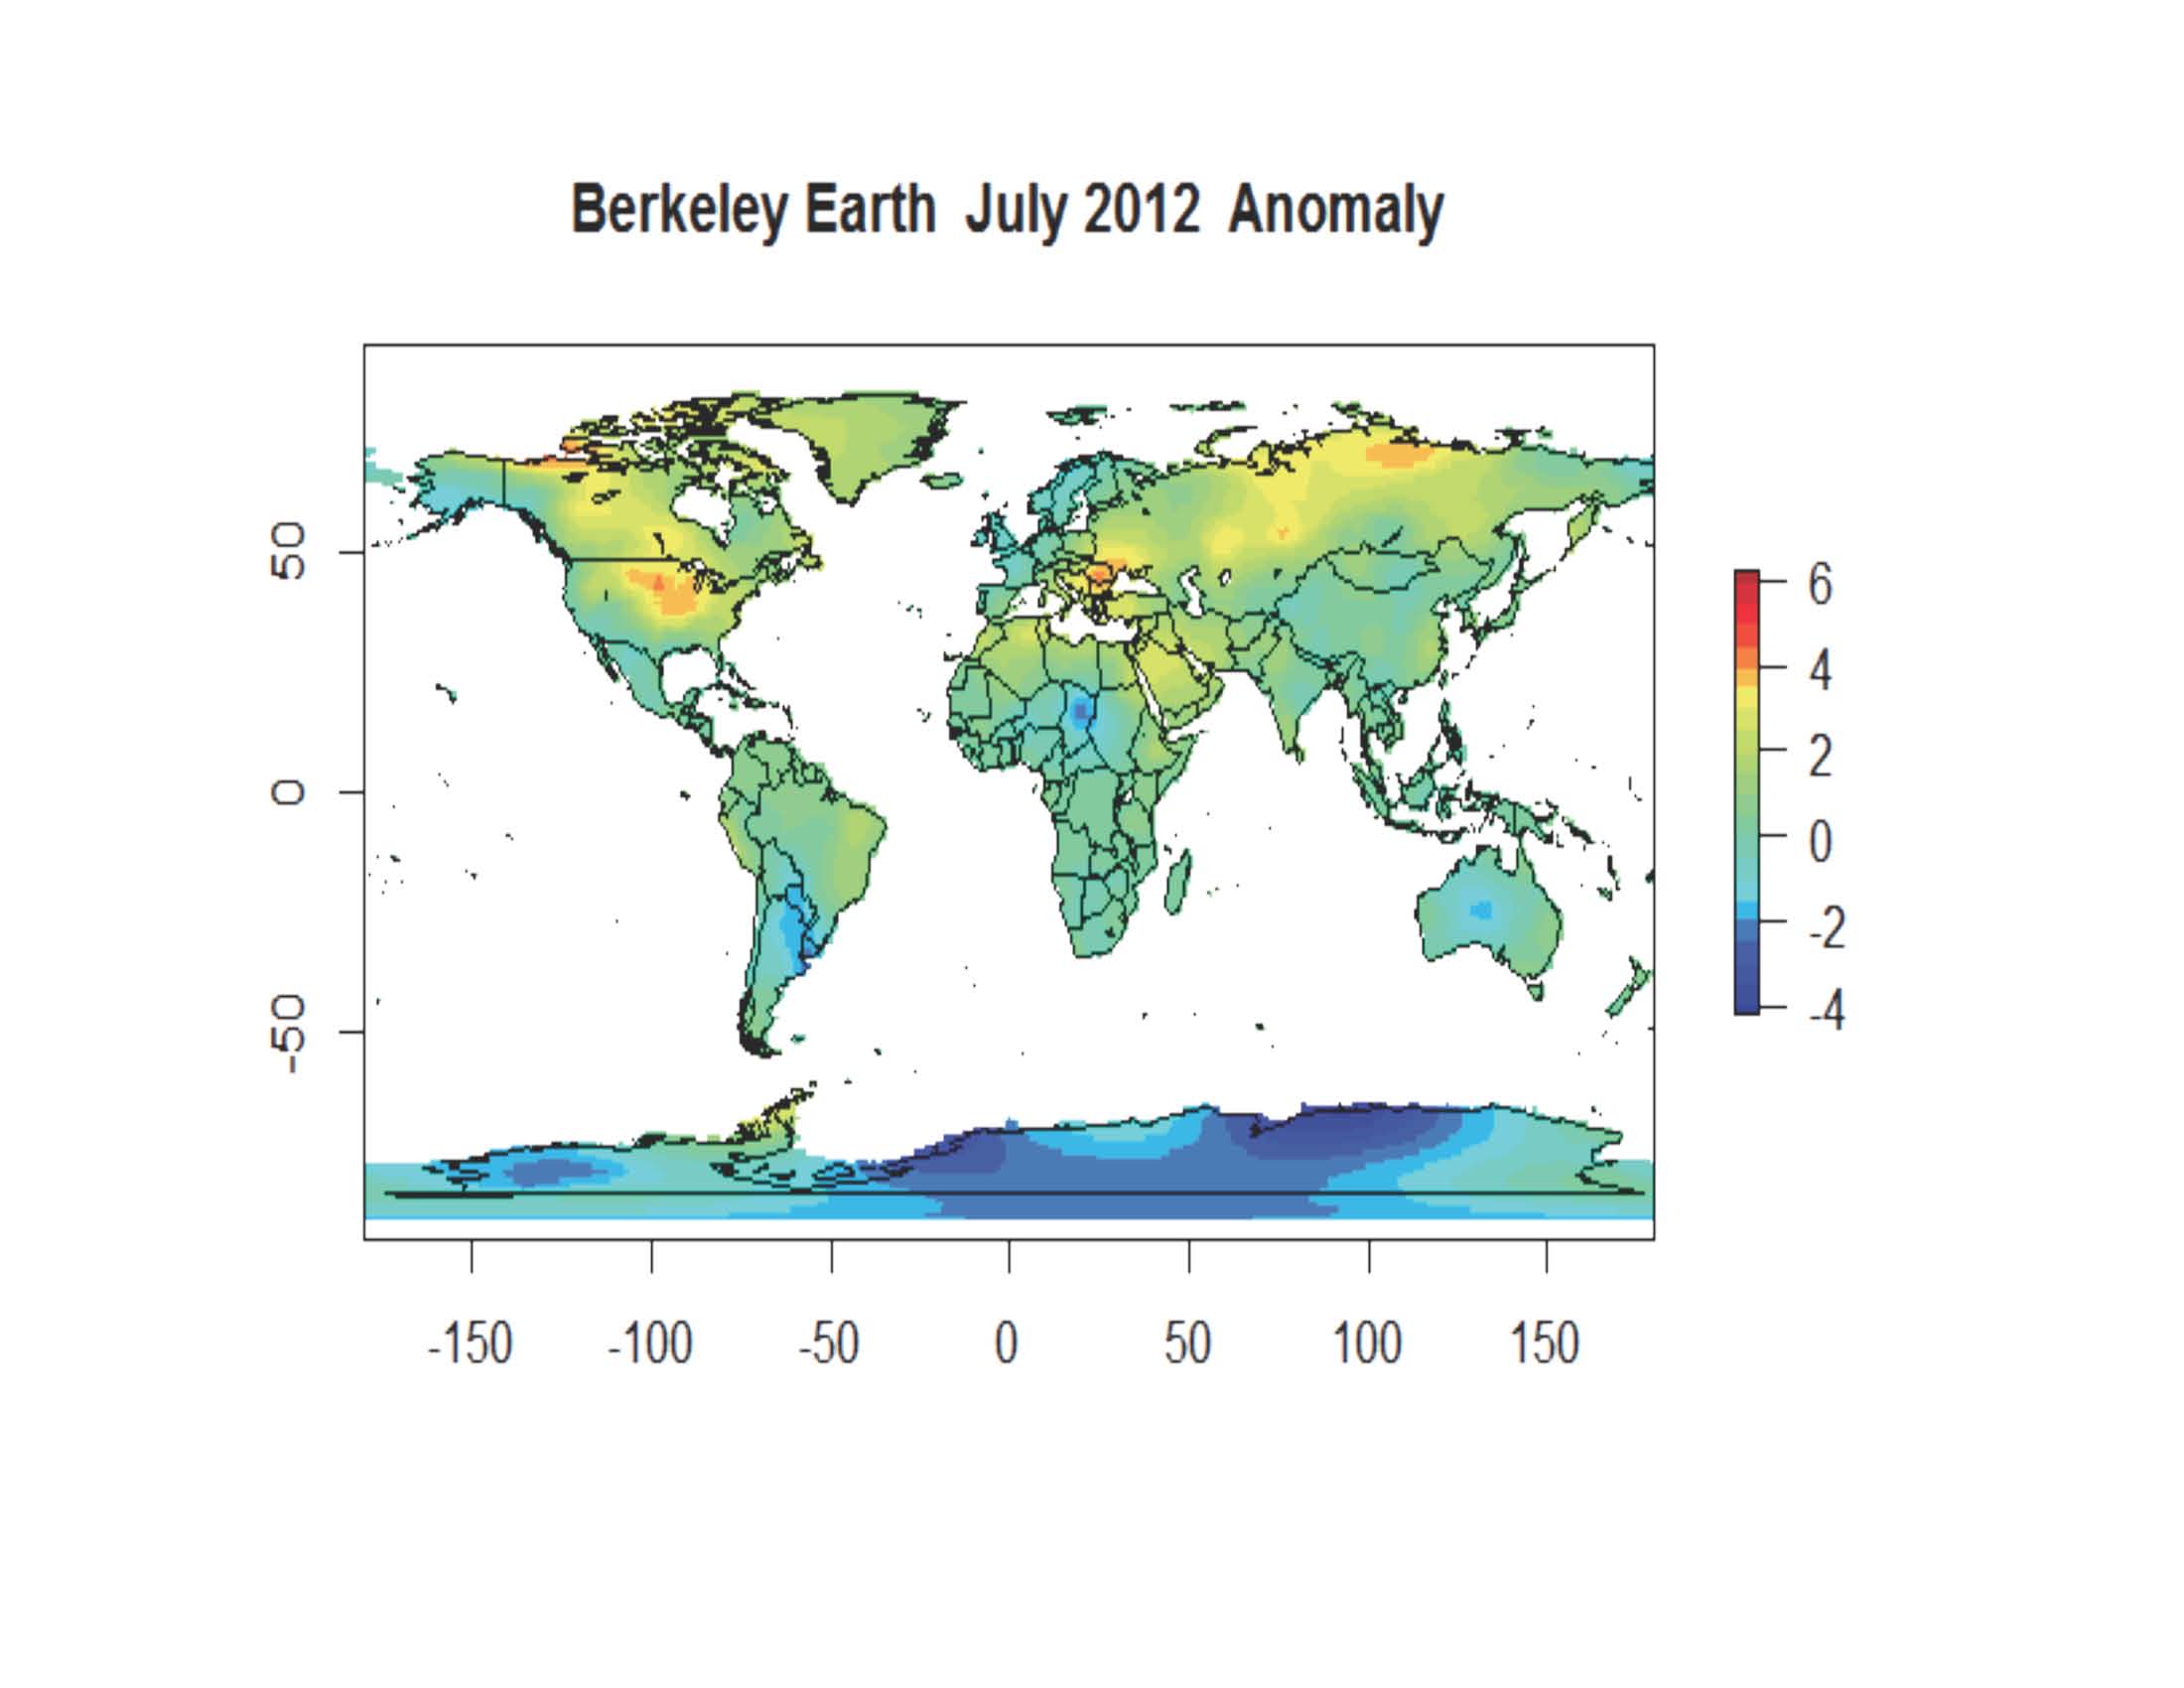
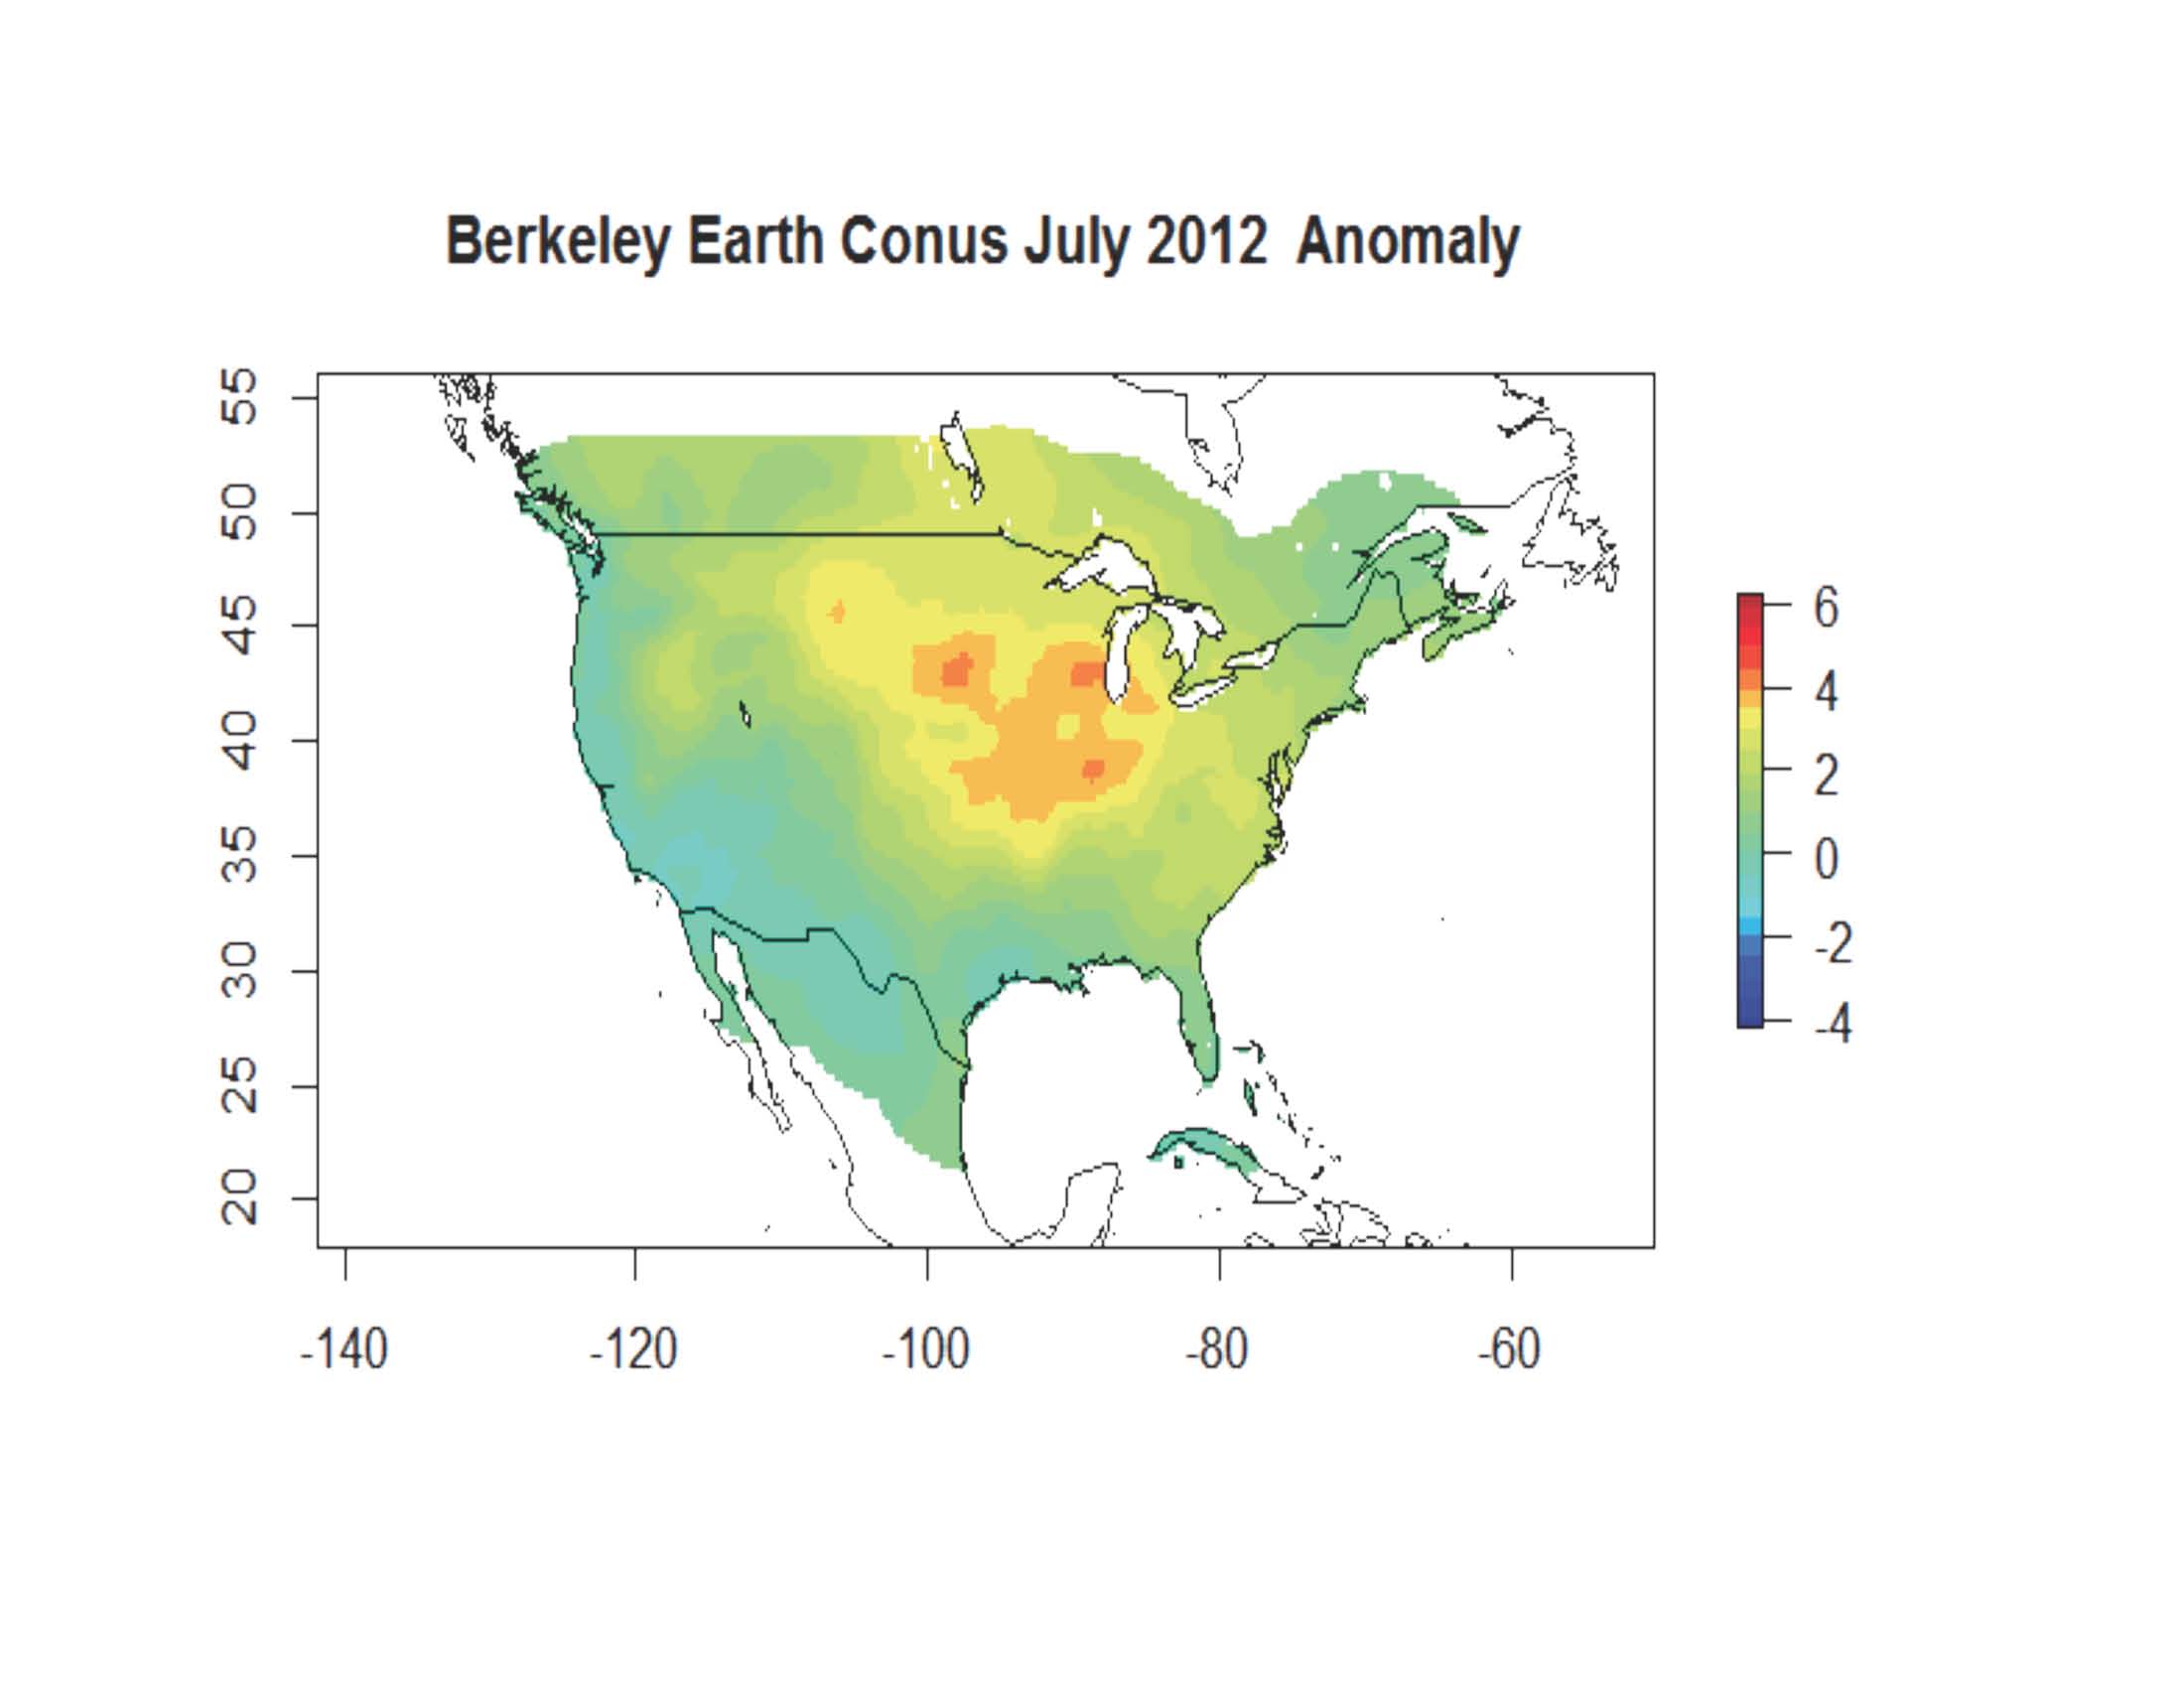
The most notable improvement comes in the addition of gridded data. Currently we have 1 degree gridded fields for the entire globe posted on the data page, and we will have .25 degree grids for CONUS and Europe. The latter will be posted shortly as we’ve just begun to explore them.
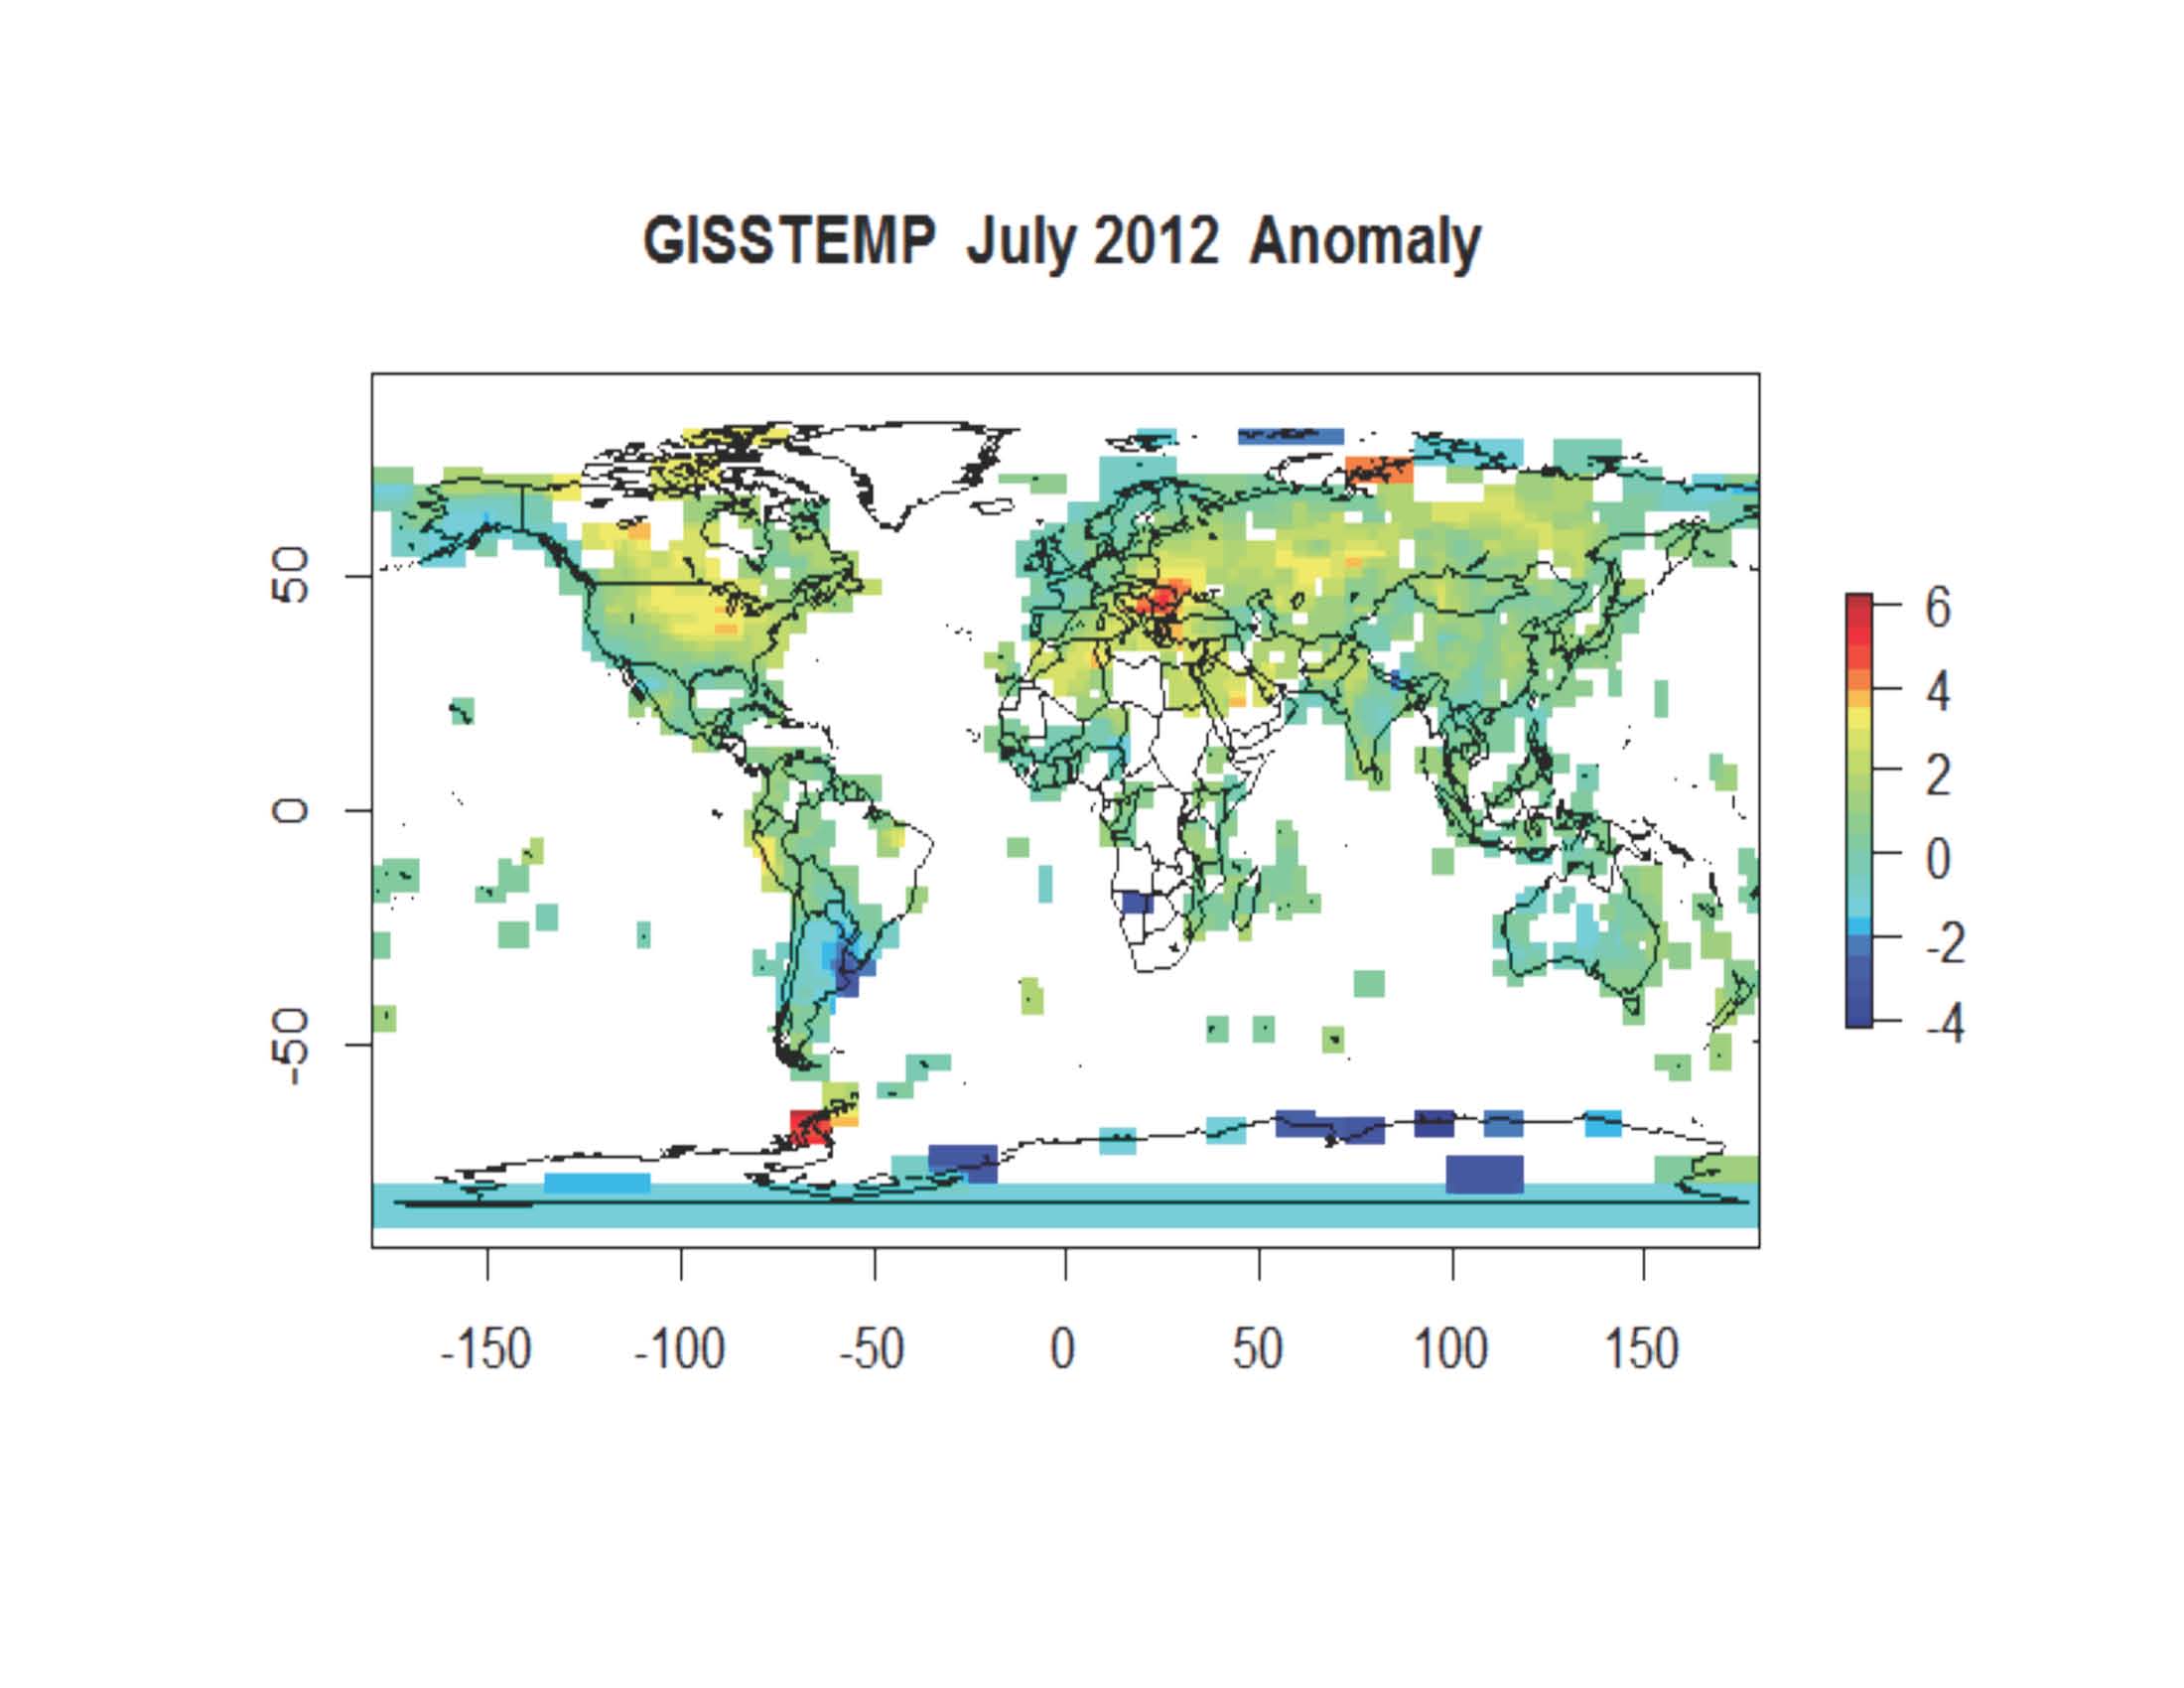
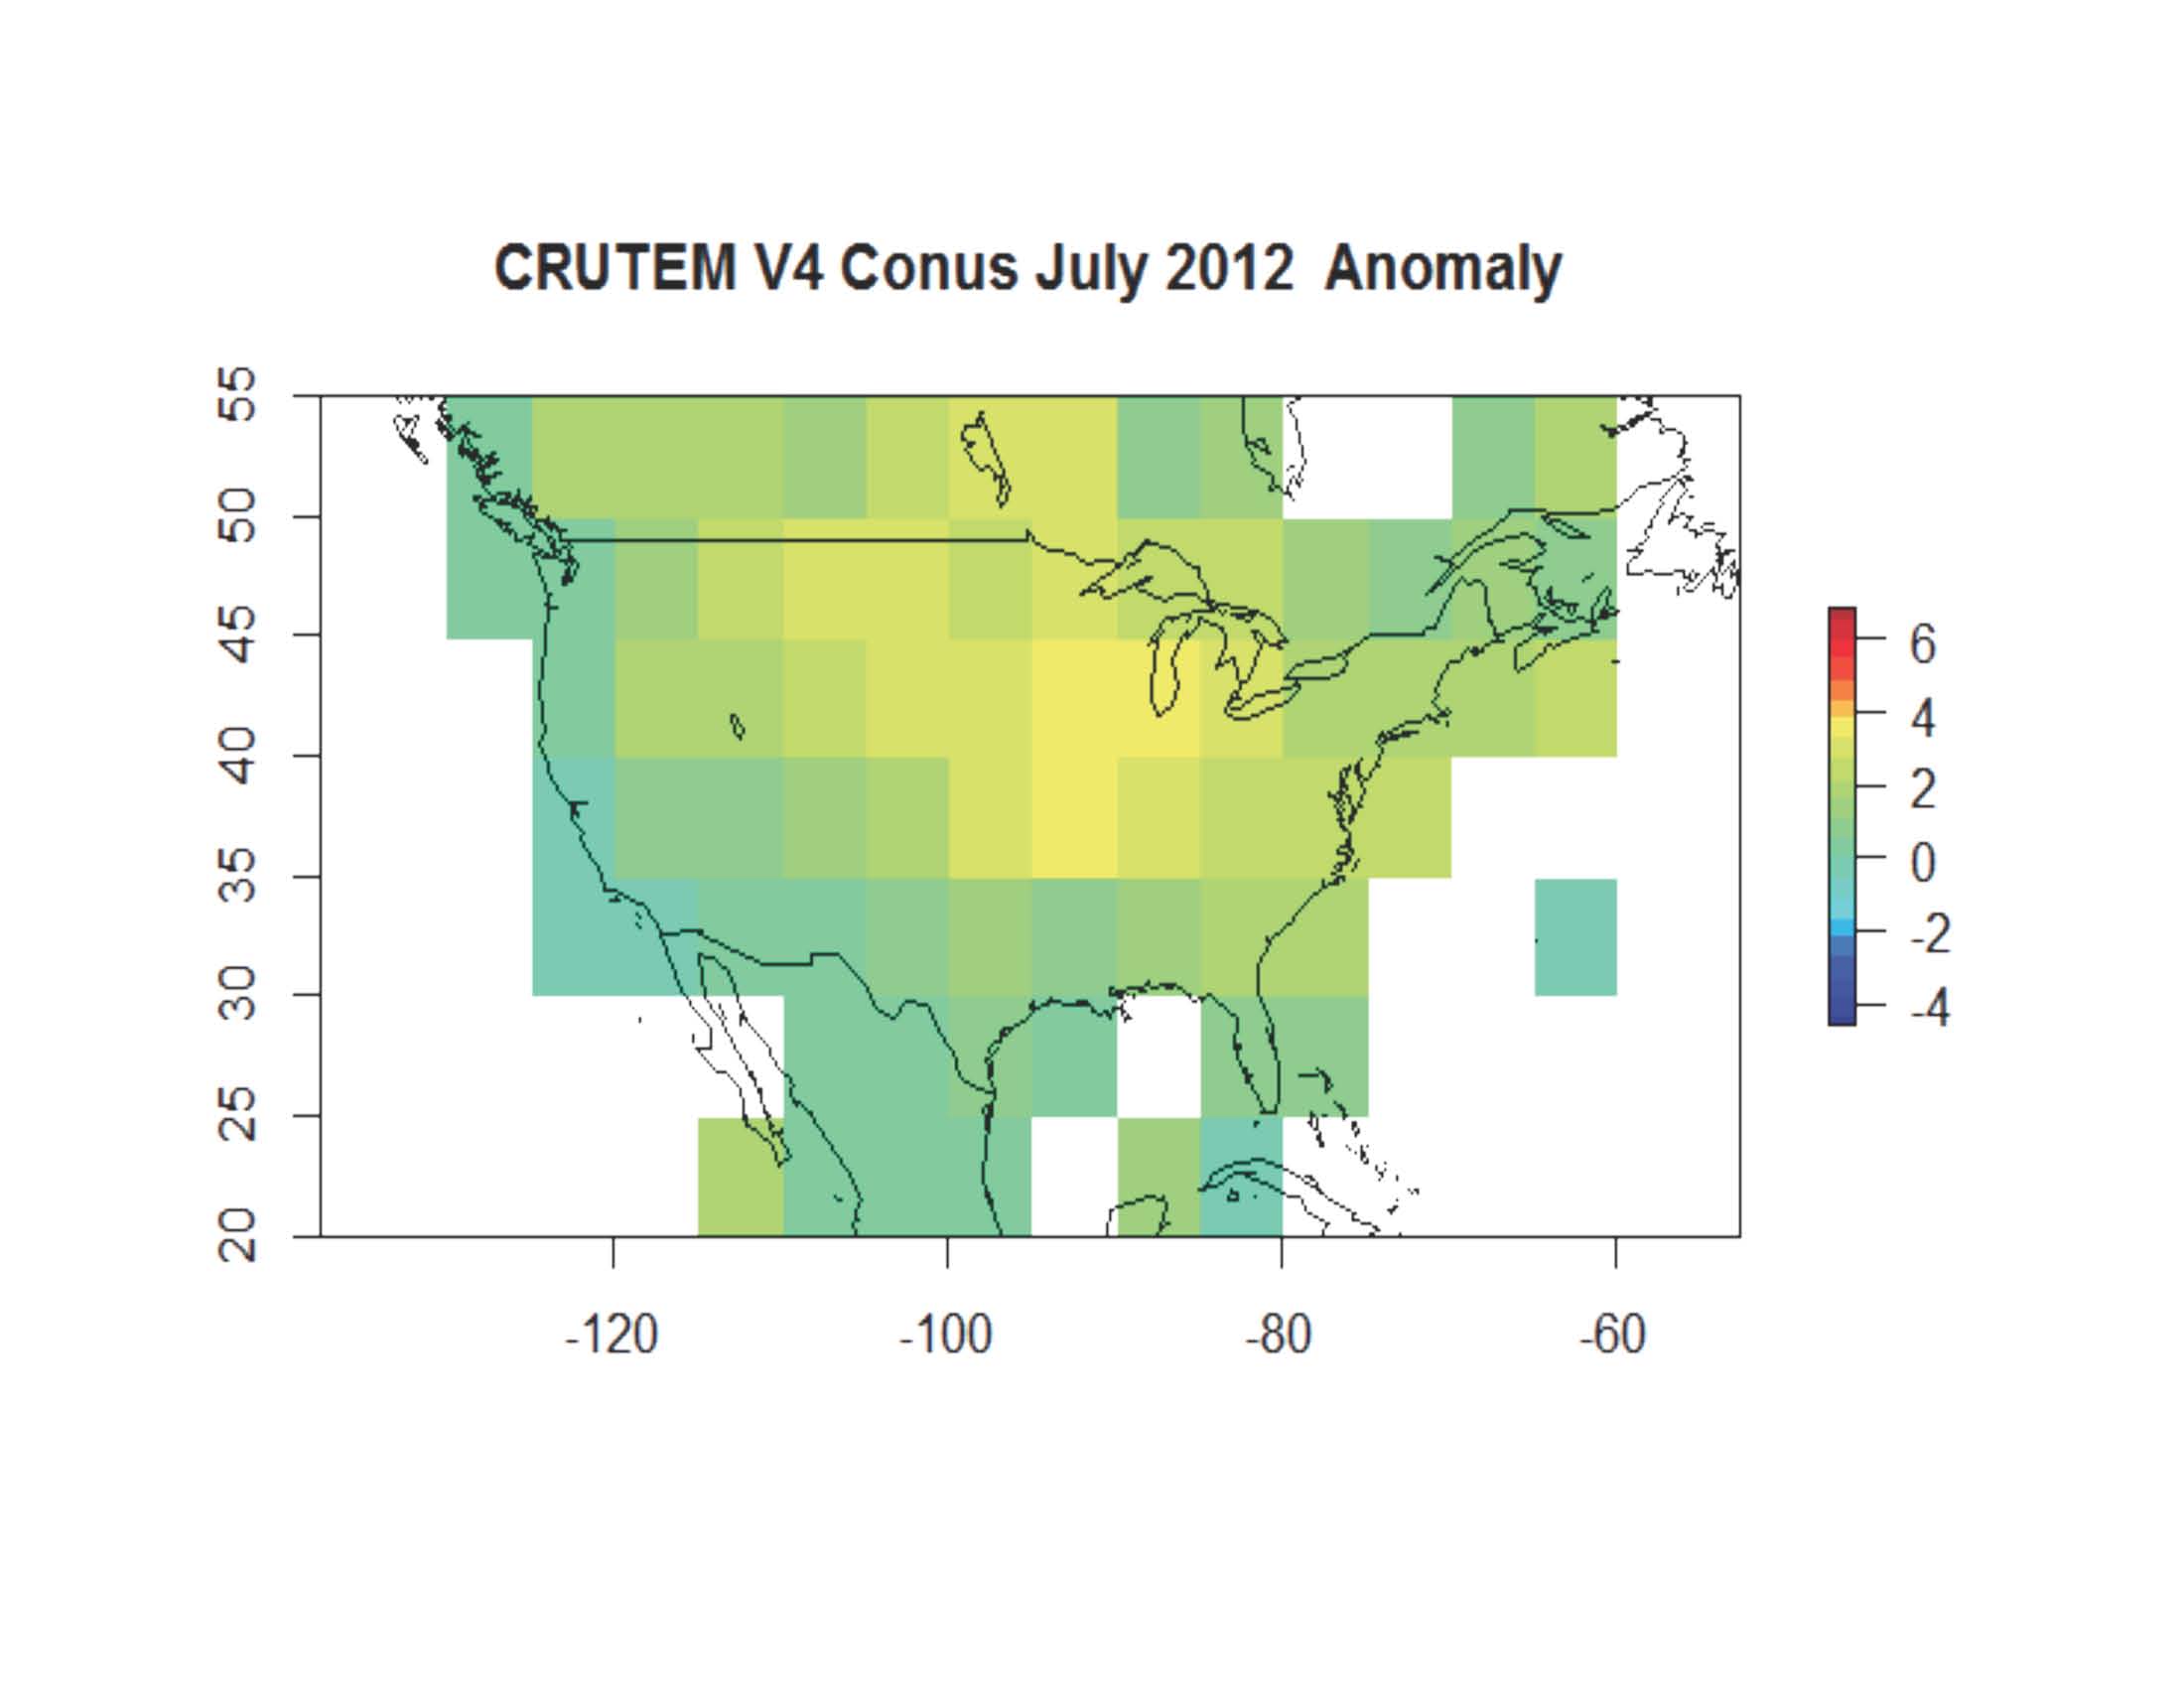
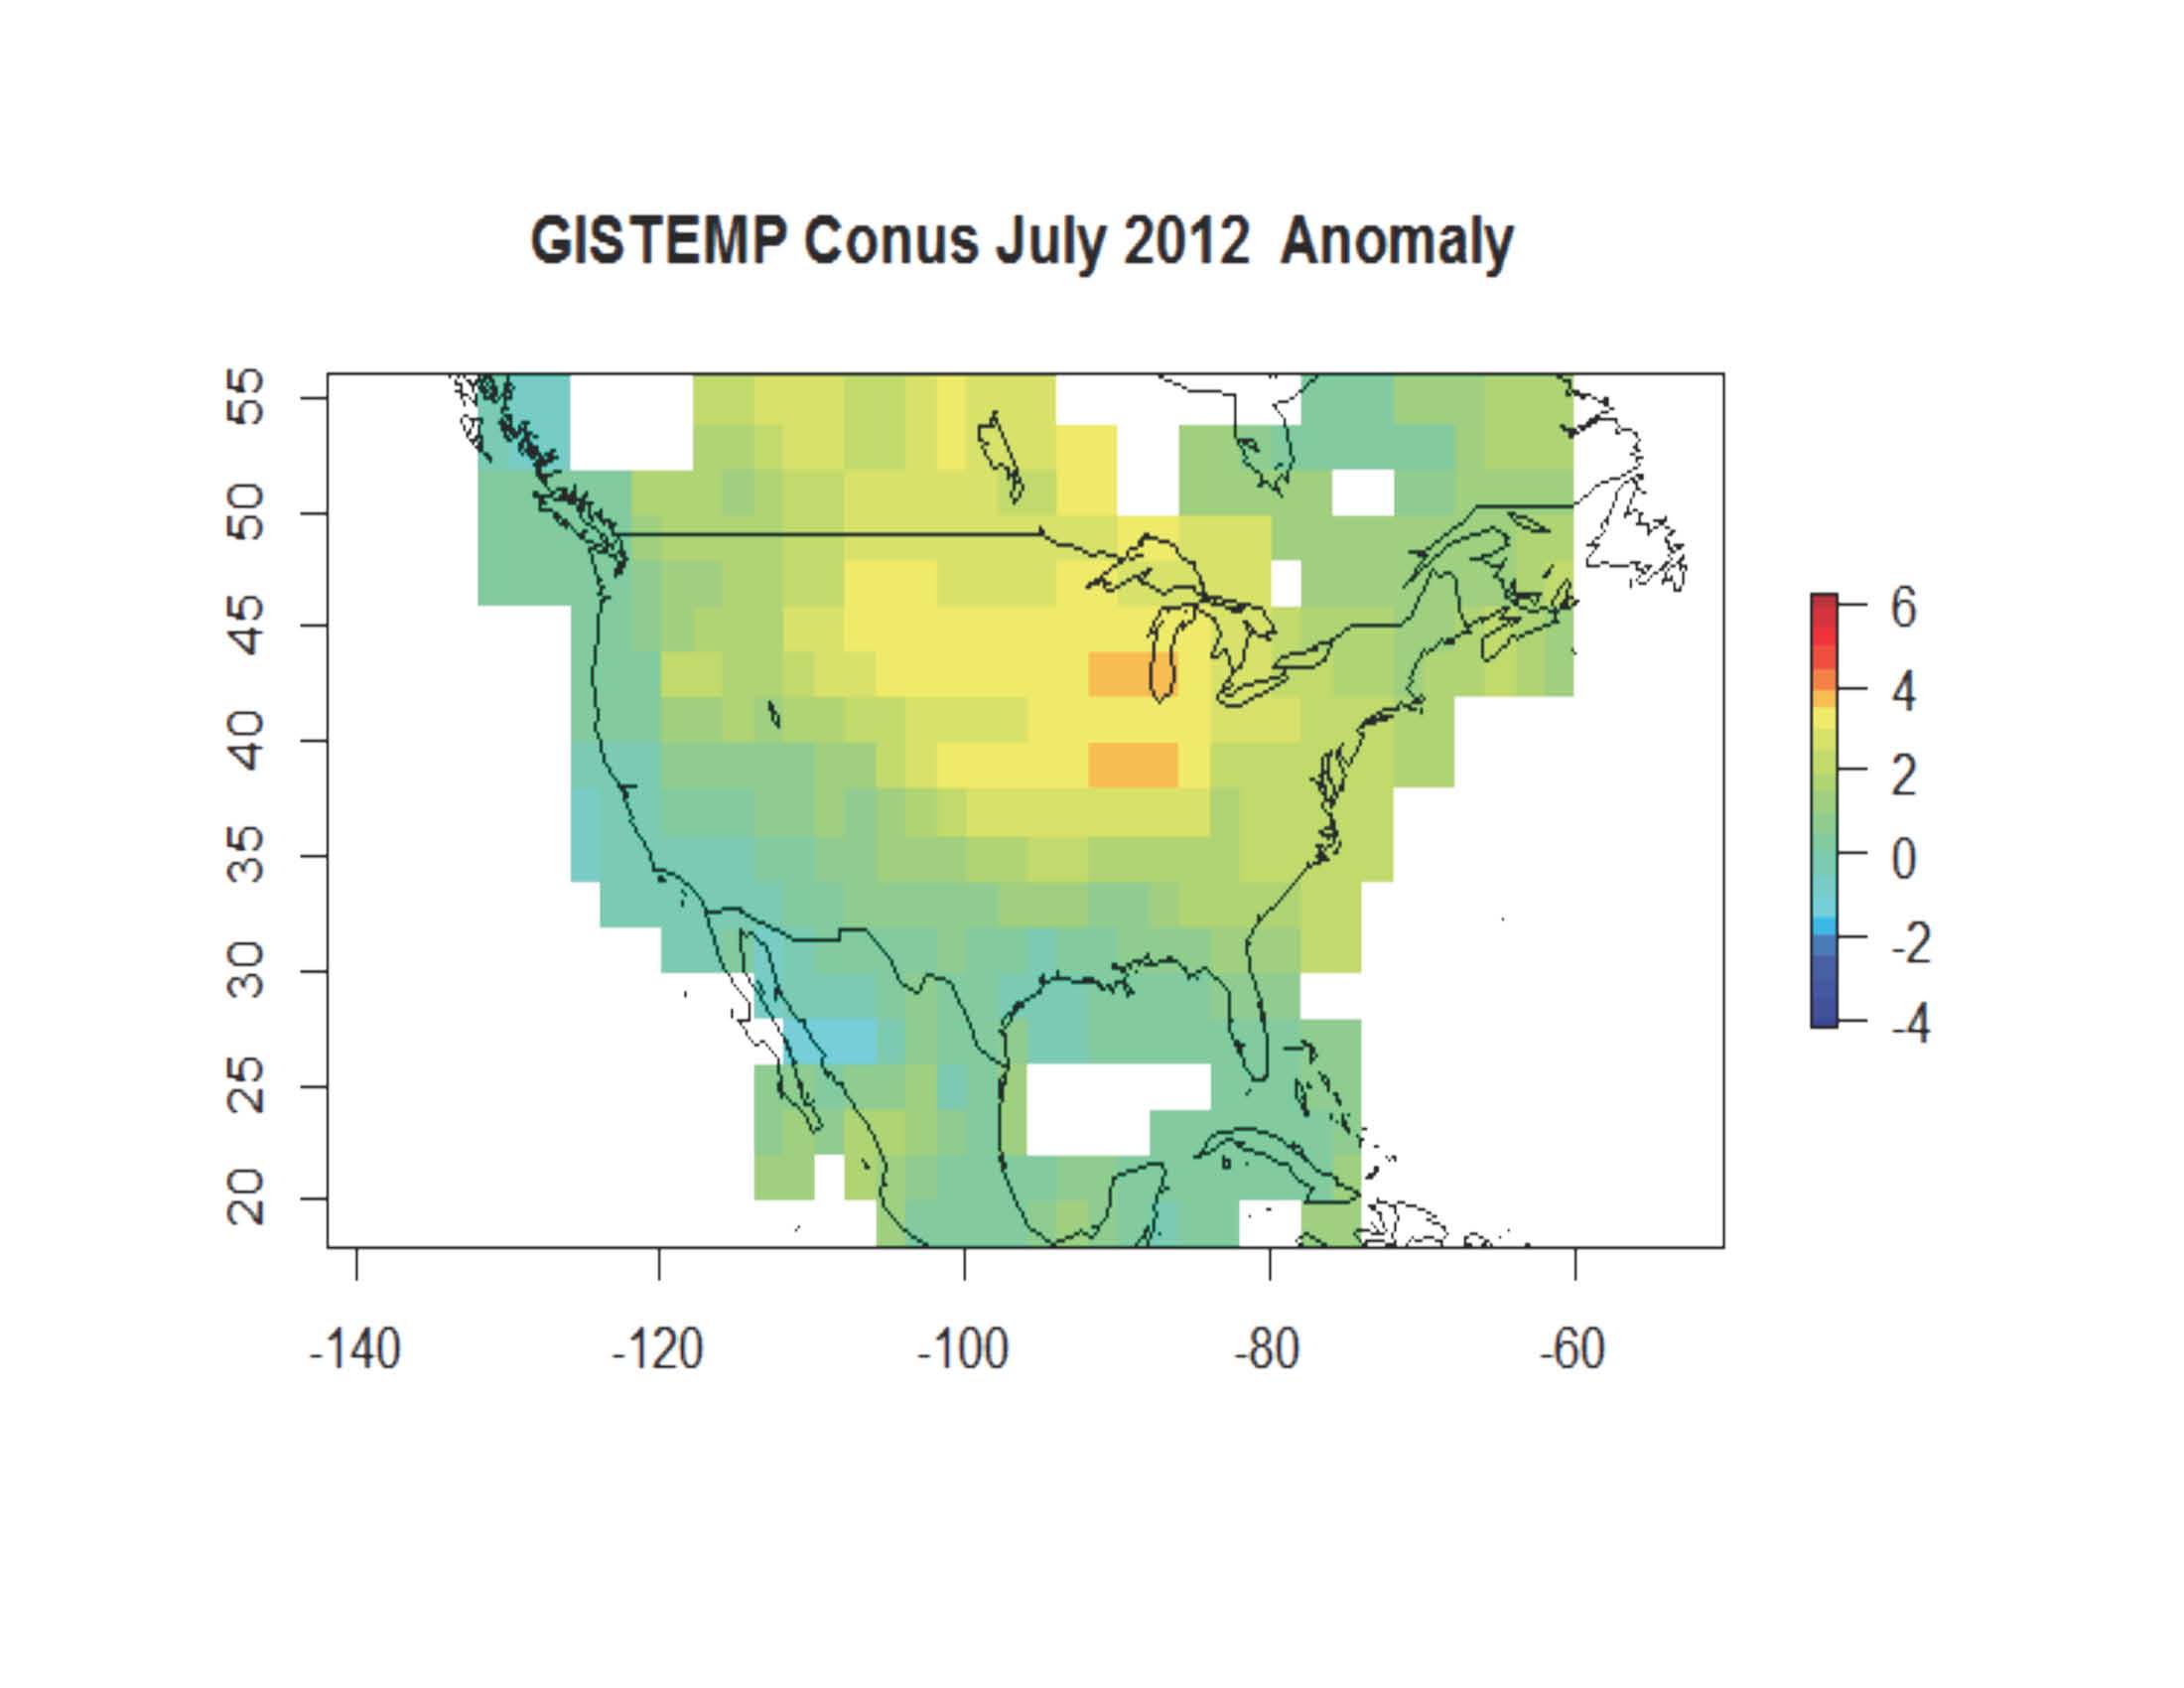
I’ll give you a sense of what the gridded data looks like by doing some quick comparisons with CRUTEM and GISSTEMP with 250km smoothing:

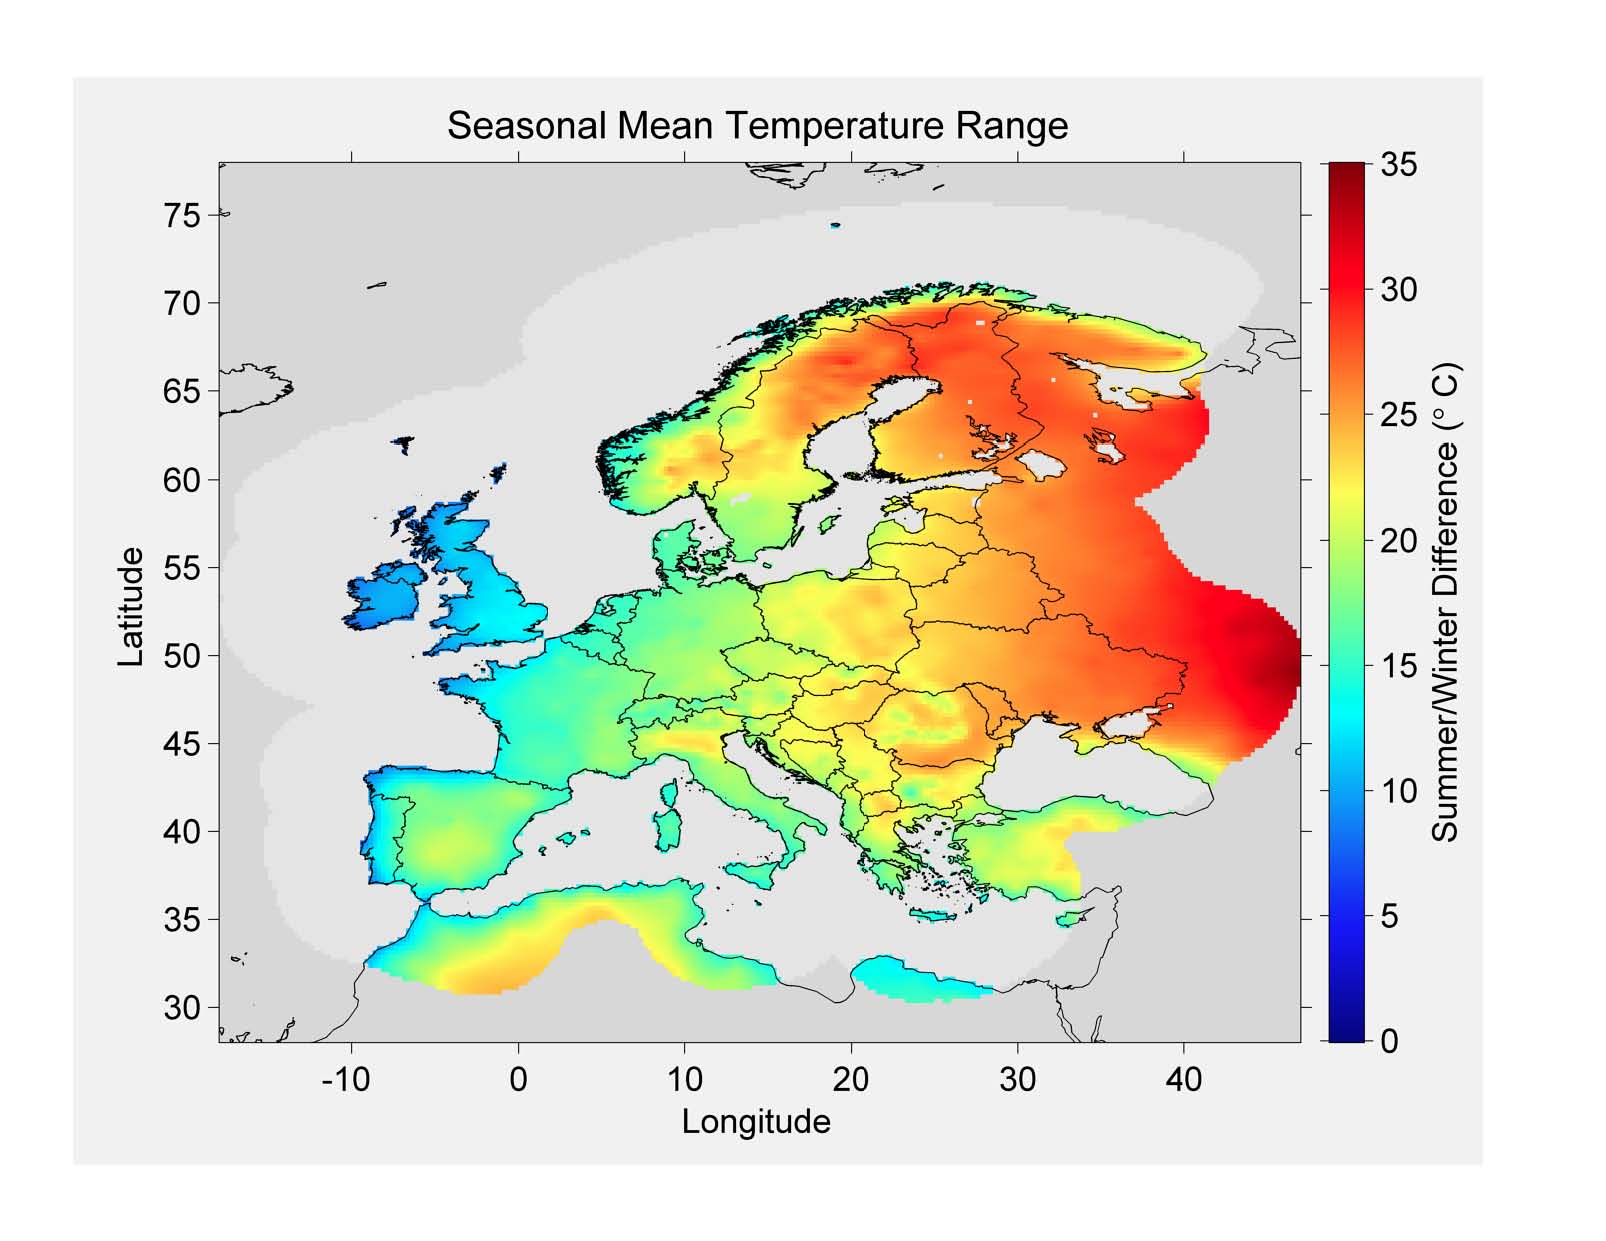
In addition to CONUS, we also have solved the field for Europe at this resolution. Below I show an example of the kind of detail we can extract:
If you have any questions or comments, please do let us know at: steve@berkeleyearth.org.
JC comment: This is a guest post, one of a series on the Berkeley Earth Surface Temperature project that has been contribute by Steve Mosher. Please keep your comments relevant and civil.