

by Patrick Brown
How we interpret the current slow-down in the rate of global warming depends very much on the length of the ‘leash’ in the true climate system (i.e., how large internal variability is).
Some have claimed that despite a continual increase in global atmospheric CO2concentrations, the global average temperature has not increased in 16 years. This logic is used to advocate the idea that increases in greenhouse gasses do not cause global warming. The purpose of this article is to explain the science behind global temperature change and to discuss the implications that a long ‘warming pause’ might have on our understanding of the climate system
First, it’s important to note that it’s difficult to say if we are really experiencing a pause in global warming. It is true that if you fit a linear trend to the monthly global temperature progression from say, 2001-2012, you get a negative slope. However, if you fit a linear trend from 1975-2000 and then extend the trend through 2012 it is not obvious that recent temperatures have diverged significantly from the previous trend (Fig. 1). Nevertheless, the rate of warming has slowed in the 2000s relative to the 1990s. This article investigates why this might be the case.

Fig. 1 – Monthly global temperatures progression from 1975-2012
What Causes Global Temperature Change?
Before we delve into the specifics of recent temperature variation, we will cover some background on how the earth’s temperature changes in the first place.
Temperature is a measure of energy; therefore the most important factor influencing the mean temperature of the earth is the energy balance at the top of the atmosphere. The earth receives all of its energy from the sun, and reflects a certain amount of that energy into outer space. If more energy enters the climate system than leaves, the result will be an increase in global temperature. This particular cause of temperature variation is an example of an external forcing, and is usually called an “external radiative forcing”. Let’s break this phrase down:
External – Refers to the notion that the cause of temperature change is coming from something exogenous or external to the ocean-atmosphere system.
Radiative – Refers to the fact the change in temperature is being caused by a change in the net radiation balance at the top of the atmosphere.
Forcing – Refers to the notion that the climate is being forced to move in a direction of either warming or cooling by the aforementioned external cause.
The most well-known example of an external radiative forcing is the increase ofgreenhouse gasses produced from burning fossil fuels. Greenhouse gasses inhibit the earth’s ability to release energy to space, therefore, all else being equal, increases in greenhouse gasses cause a buildup of energy within the climate system and result in global warming.
Global temperature can also change due to “internally generated variability”; also known as “unforced variability”. This type of variability is due to the ocean-atmosphere system essentially changing itself through its own chaotic motion. The most well-known mode of unforced variability is called the El-Niño Southern Oscillation (often referred to as the El-Niño, La-Niña cycle). During La-Niña years, heat is buried in the deep Pacific Ocean more readily and thus the global mean temperature at the earth’s surface is a bit lower than it would be otherwise. During El-Niño years, this buried heat is released back to the surface and the global mean temperature tends to be a little warmer than it would be otherwise. In this situation, global mean temperature at the earth’s surface is changing because energy is being moved around the climate system (into and out of the deep ocean) not because there is a net change in the total amount of energy in the system.
However, unforced variability can also change the total amount of energy in the earth system by changing constituents of the surface or atmosphere that interact with the amount of solar energy coming in, or the amount of infrared energy leaving the earth (Herweijer et al., 2005). For example, if some internally generated change in an ocean circulation caused more heat to be distributed to polar latitudes; this could cause sea ice to melt. This melting sea ice would cause less solar energy to be reflected back to space (ice is much more reflective than open ocean) and thus this would increase the total amount of energy in the climate system.
One analogy that could be used to describe the interplay between externally forcedvariability (like increasing greenhouse gasses) and internally generated unforcedvariability (like El-Niño/La-Niña) is that of a man walking a dog (Fig. 2). In this analogy the movement of the man represents the externally forced variability and the movement of the dog, relative to the man, represents unforced variability. The man moves in a rather determinist, predictable path while the dog moves in a more random unpredictable path. Many with engineering backgrounds will recognize this as a signal-to-noise issue. Notice that the dog can only wander a certain distance away from the man before the leash pulls it back toward the general direction of the man. Because of this, the path of the dog ends up being the sum of the path of the man plus the movement of the dog. Analogously, the temperature progression that we can observe is the externally forced component of temperature change plus the internal unforced component of temperature change.

Fig. 2 – Man walking dog analogy for global surface temperature variation (full animation here). The Path of the man represents the component of temperature change that is externally forced. The path of the dog represents the actual observed temperature change which is a result of the addition of the externally forced (path of man) and the internal unforced (movement of dog) components of temperature change.
Notice that if the leash is short, the path of the dog will closely match the path of the man. However, if the leash is long, the path of the man is difficult to infer from the path of the dog.
Knowing how long the leash is in the true climate system is of critical importance for understanding decade-to-decade climate changes of the past and predicting climate change in the near future. For example, the temperature rose in decadal steps in the 20thcentury. It warmed relatively consistently from the 1910s to the 1940s, temperatures were steady from the 1940s to the 1970s, after which they rose from the 1970s to the end of the century and they have not risen much since. If the leash in the true climate system is very short (Fig. 3a), we must explain global temperature changes with changes in external radiative forcings (the path of the man) and for a given future greenhouse gas emissions scenario, we have a pretty narrow range in which temperature can progress. If the leash is long, however (Fig. 3b), then we do not need to evoke external radiative forcings as the cause of the decade-to-decade changes in temperature of the 20thcentury as that particular shape could be the random outcome of internally generated unforced variability (the movement of the dog). Additionally, this would mean that the temperature projections for a given amount of greenhouse gas emissions would be relatively uncertain.


Fig 3. Example of a short leash (a) and long leash (b) climate system. In these plots the length of the leash is represented by the width of the region between the red lines.
It is very important to notice that the length of the leash does not effect where the man will ultimately end up. It only effects how difficult it is to infer the path of the man from the path of the dog. We know from the fundamental physics of the greenhouse effect(known about for over 150 years) that the path of the man will continue on an upward trajectory as humans continue to increase greenhouse gas concentrations in the atmosphere. (where the man is ultimately headed depends on a metric called climate sensitivity).
The length of the leash, however, has vast implications for how we should interpret short-term (~10-30 year) pauses/accelerations in global warming. If the leash is very short than we know that a pause in global warming must have to do with a change in the direction of the man. Under this scenario, it would be possible to interpret a pause in warming as pointing to something fundamental about how the climate system reacts to external radiative forcings. Namely, if the leash is short and temperatures remain flat in spite of increases in external forcings (e.g., greenhouse gas concentrations), then the climate system may be less sensitive to external radiative forcings than we previously thought. If the leash is long, however, the man could be moving up in a constant trajectory but his path is simply masked by the dog moving in the opposite direction.
The Case for the Short-Leash Climate
Traditionally, many climate scientists have favored the short leash view of climate, seeking to explain decade-to-decade changes in temperature with external radiative forcings. As mentioned above, consistent warming was observed from the 1910s to the 1940s, steady or slightly cooling temperatures were seen from the 1940s to the 1970s and warming recommenced from the 1970s to at least the 2000s. It has been suggested that early twentieth century warming was at least partially attributable to an increase in energy produced by the sun (Stott et al., 2000, Stott et al., 2006). Additionally, the mid-century pause in warming has been attributed to increased concentrations of human-made aerosols (Stott et al., 2000, Stott et al., 2006, Meehl et al., 2004, Wild et a., 2009) while the late century acceleration in warming has been proposed to be due mostly to increases in greenhouse gasses in the atmosphere (e.g., Hansen et al., 2005). This short leash view of climate is best exemplified by Fig. 4.


Fig. 4 – Example of how temperature changes over the 20th century can be explained with a short leash model of climate (from Hansen, 2005, 2011). A) Progression of individual components of external radiative forcings. B) Progression of the total external radiative forcings (path of the man). C) Comparison of the observed temperature progression with that calculated from five different runs of a climate model that incorporated the external radiative forcings shown in B.
So does Fig. 4 prove that the leash in the true climate is short? Not necessarily. The radiative forcings produced from human-made aerosols (blue line in Fig. 4a) are actually extremely uncertain (as can be seen by their large error bar). If slightly different values had been chosen for this component, then the match between the climate model runs and observed temperature in Fig. 4c would not be nearly as good. This leaves open the possibility of a long leash climate system.
The Case for the Long-Leash Climate
Along with El-Niño/La-Niña, two other important ocean circulations that are essentiallyunforced are the Atlantic Multidecadal Oscillation (AMO) and the Pacific Decadal Oscillation (PDO) (Fig 5). It is already well established that El-Niño can effect global mean surface temperature on the year-to-year time scale (e.g., Neelin, 1998). But it has only recently been suggested that decade-to-decade ocean circulations like the AMO and PDO also can affect global mean surface temperature in a similar way (e.g., DelSole et al., 2011, Swanson et al., 2009, Meehl et al., 2013). If this is the case, then the leash might be much longer than previously thought.
Fig. 5 shows the global mean monthly surface temperature from 1900 to 2011 along with the AMO index and PDO index. The AMO, in particular, seems to mimic the decade-to-decade variability in the surface temperature.

Fig. 5 – Monthly time series of global surface temperature (top panel), the AMO index (middle panel) and the PDO index (bottom panel).
If we assume that the AMO and PDO can affect global surface temperatures in a similar way in which El-Niño/La-Niña do, then we can use a statistical technique called multiple linear regression to remove the influence of the AMO and PDO from the surface temperature record (similar analysis was performed by Zhou and Tung, 2013). The results of this are shown in Fig. 6.

Fig. 6 – Comparison between the observed surface temperature (black) and the surface temperature that would have occurred without the influence of the AMO and PDO (blue). The smoothed blue line can be thought of as an estimate of the temperature progression resulting from external radiative forcings alone (i.e., the path of the man).
Fig. 6 illustrates an estimate of the path of the man (thick blue line) and the path of the dog (black line). If we assume that the AMO and PDO can influence global temperature then we see that they account for most of the decade-to-decade variability in the rate of warming over the past 112 years. Times when the observed temperature was moving up faster than the externally forced temperature change (1900s to 1940s and 1970s to 2000s) were times when unforced internal variability was amplifying warming (the dog was on a steeper trajectory upwards than the man). On the other hand, times when the observed temperature was moving up slower than the externally forced temperature (1940s to 1970s) were times when unforced variability reduced the rate of global warming (the dog was moving downwards while the man was moving upwards). Notice that under this interpretation the rate of human-induced global warming over the past few decades has been cut approximately in half (similar conclusions have been reached by DelSole et al., 2011, Wu et al., 2011 and Toung and Zhou, 2013 among others). This is in contrast to the short leash view of Fig. 4 in which virtually 100% of warming over the past few decades has been due to external radiative forcings from human activities.
Does Fig. 6 prove that the leash is long, and that the true underlying rate of global warming is relatively slow? Not necessarily. The fundamental problem with analyses such as the one above (and in Zhou and Tung, 2013) is that the statistical method assumes that the AMO/PDO could cause global temperature change, yet that global temperature change could not cause variation of the AMO or PDO. This assumption is almost certainly violated because the AMO and PDO themselves are measures of temperature variability. Therefore, it is difficult to separate any temperature change that might be influencing the AMO or PDO from temperature change that they might be influencing.
When Will the Warming Recommence?
As mentioned previously, the fundamental physics of the greenhouse effect are beyond any reasonable doubt and therefore we expect warming to recommence in the future as we continue to emit greenhouse gasses. But when will the warming recommence? The answer to that question seems to rest heavily on the length of the leash in the true climate system.
If the leash is short, as is implied in Fig. 4, then we should expect warming to recommence in the very near future. This is because, in the short leash view, the linear trend from 1975 to the 2000s has been thought of as representative of the trend caused by external radiative forcings (Santer et al., 2011). Under this view, we should not expect temperatures to fall very much outside the shaded confidence interval in Fig. 7 (the size of the confidence interval equals approximately the length of the leash). Since we are currently approaching the lower limit of that confidence interval, we would expect temperatures to progress back up towards the long-term trend within a year or two.

Fig. 7 – Observed temperature progression from 1975-2012 with the trend and confidence interval associated with the 1975-2000 data extended to the year 2050.
If the leash is long, however, and the externally forced component of temperature change is in fact moving in a manner similar to the blue line in Fig. 5, then temperatures may not increase significantly for decades to come (Fig. 8). This would not necessarily mean that we expect any less warming from increases in greenhouse gasses in the long run but it would suggest that long-term temperature increases would be slower than previously suspected.
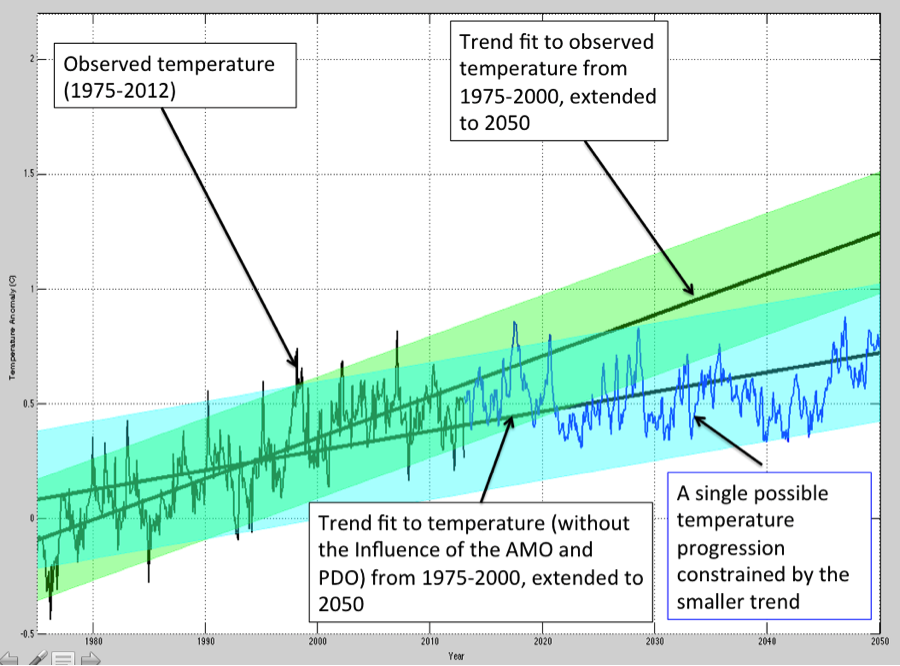
Fig. 8 – Illustration of a possible trajectory of temperature progression under the long leash scenario compared to that expected if the trend from 1975-2000 remained constant
In sum, how we interpret the current slow-down in the rate of global warming depends very much on the length of the leash in the true climate system (i.e., how large internal variability is). If the leash is short than we should expect warming to recommence quickly in conjunction with continued emissions of greenhouse gasses but if the leash is long, the future is much less certain. This is an area of active research and improved models and observation systems are helping to understand the issue. Hopefully, science can zero in on the leash length soon so that the public and policy makers have the best possible information to work with.
Biosketch: Patrick Brown is a PhD student in Earth and Ocean Sciences at Duke University.
JC comments: I received this post from Patrick via email. I like the dog-on-a-leash analogy. I applaud Patrick’s efforts in communication and engagement with the public on the topic of climate change, definitely something I would like to see more of in the new generation of climate scientists.
Moderation note: This is a guest post; comments will be moderated for relevance and civility.