

by Tony Brown
Climate changes. How often? In what direction? What is actually meant by ‘climate change?’ Is the current definition useful?
To address these questions, we examine Central England temperature (CET) dating to 1659 maintained by the Met Office, and also the author’s own reconstruction of CET to 1538 that uses thousands of observational weather references, and place them both into greater context with information from the wider world. We then examine ‘noticeable’ periods of climate change within the period from 1538 to the present day that would likely substantially affect humanity and nature for good or bad. This analysis suggests that modern climate is less volatile, and temperature extremes less severe, than in the past.
Here is CET back to 1538; the portion prior to 1659 is my own reconstruction.

Figure 1-reconstructed CET 1538 to 1659, instrumental records from 1659 to current date [link]
How this reconstruction was compiled and how it compares with those made by Dr Michael Mann and Hubert Lamb is detailed in this article ‘The long slow thaw?’
Why use CET? As the worlds’ oldest and most scrutinised instrumental temperature record it usefully covers much of the ‘Little Ice Age’ when the most extensive recent glacial advances in the Holocene began, whilst numerous contemporary records make it possible to examine earlier periods in British climatic history. (See note 1 for a correct definition of the LIA by Dr Mann). Also, many scientists believe that CET, being calculated from a number of widely spread locations, in combination with the geographical location of Britain, is demonstrated to be a reasonable -but by no means perfect- proxy for global temperatures, and more notably that of the Northern Hemisphere. See Section Six of ‘The long slow thaw?’ for references to those scientists.
This historic correlation with the wider world can be seen in this comparison with BEST global. [link]
Climate reconstructions
The ups and downs of our annual weather can be seen clearly by eye in figure 1, but what exactly constitutes ‘climate’? In meteorological terms it is thirty consecutive years of averaged weather, which may or may not depict a trend showing a ‘change’ from what had become the ‘normal’ over a set 30 year period, currently 1961-1990. ‘Anomalies’ are deviations from the ‘normal’ period. Any comparisons of models or actual temperature records will therefore depend on whatever ‘normal’ period they are being compared to.
Thirty years to establish a climate state seems a long time, as within that period there may be notable shifts to a number of different prevailing patterns of cold/warmth/wet or drought that, on a human scale affects agriculture and horticulture by impacting on what crops may be grown successfully, may affect the tourism season, may cause a consumer to use more or less energy in their home, and also impact on nature by affecting the populations of wild life and vegetation. So in practical terms, when we consider ‘climate change’ it may be useful to consider periods other than thirty years. To do that we need to have adequate records that can accurately plot those ‘noticeable’ periods shorter than 30 years.
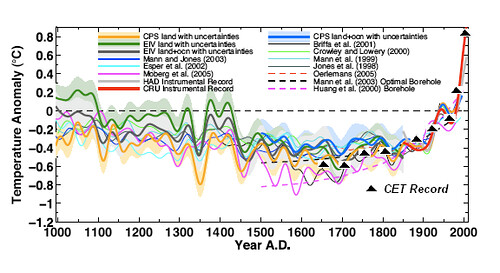
The set of modelled hemispheric temperature anomalies to the 10th century depicted below are derived from a variety of proxies including boreholes and tree rings with instrumental CET-from a third party-apparently plotted at approx. 40 year intervals.

Figure 2-Global and Northern Hemisphere temperature reconstructions [link]
The ensemble from 2004 from Real Climate [link] also shows a range of climate models, Five of the models here were also present in the figure 2 ensemble. (clicking on the image in the link below will show the authors of the various models)
The newer models in figure 2, such as Moberg at al 2005 (Northern Hemisphere) show somewhat greater variability than many of the other models. Moberg et al also fail to show the hockey stick by terminating the study prior to the modern uptick derived from the incorporation of the instrumental temperature record. A critique of Moberg’s paper is given in the link above.
Comparing models and CET
In CET, the plotting of annual temperatures allows a close focus on the often astonishing yearly variation. CET is arguably more indicative of actual climate variability than climate model simulations and imprecise proxies (such as tree rings) which reflect greater spans of time and larger uncertainties on dating and spatial coverage.
Such proxy reconstructions give the impression of more constancy in climate by implicit or explicit averaging and smoothing of the coarse data. Of course plotting accurate instrumental or observational records becomes progressively less feasible as it is taken further back in time. Where it is possible to derive them with some worthwhile degree of accuracy-perhaps to the 11th or 12th century for some individual countries in Europe – they are likely to be of more practical use in helping our understanding of climate and natural variability than modelling of novel proxies which provide the broadest of broad brushes in producing a composite global or Northern hemisphere representation. Proxy reconstructions are not designed to pick up the fine grain of short term ‘noticeable’ climate change with their resultant substantial peaks and troughs, and consequently may provide an artificial picture of a presumed limited scale of natural variability in the past that may have prompted this statement by the Met Office that was present on their web site until 2012 [link]:
“Before the twentieth century, when man-made greenhouse gas emissions really took off, there was an underlying stability to global climate. The temperature varied from year to year, or decade to decade, but stayed within a certain range and averaged out to an approximately steady level.”
Examination of climate over the last 500 years using historic and instrumental records
In order to see what the climate’ has been doing over the last 500 years and to try to determine ‘noticeable’ periods of climate change i.e. which may affect humanity and nature, the CET data has been divided into 10 and 50 year segments.
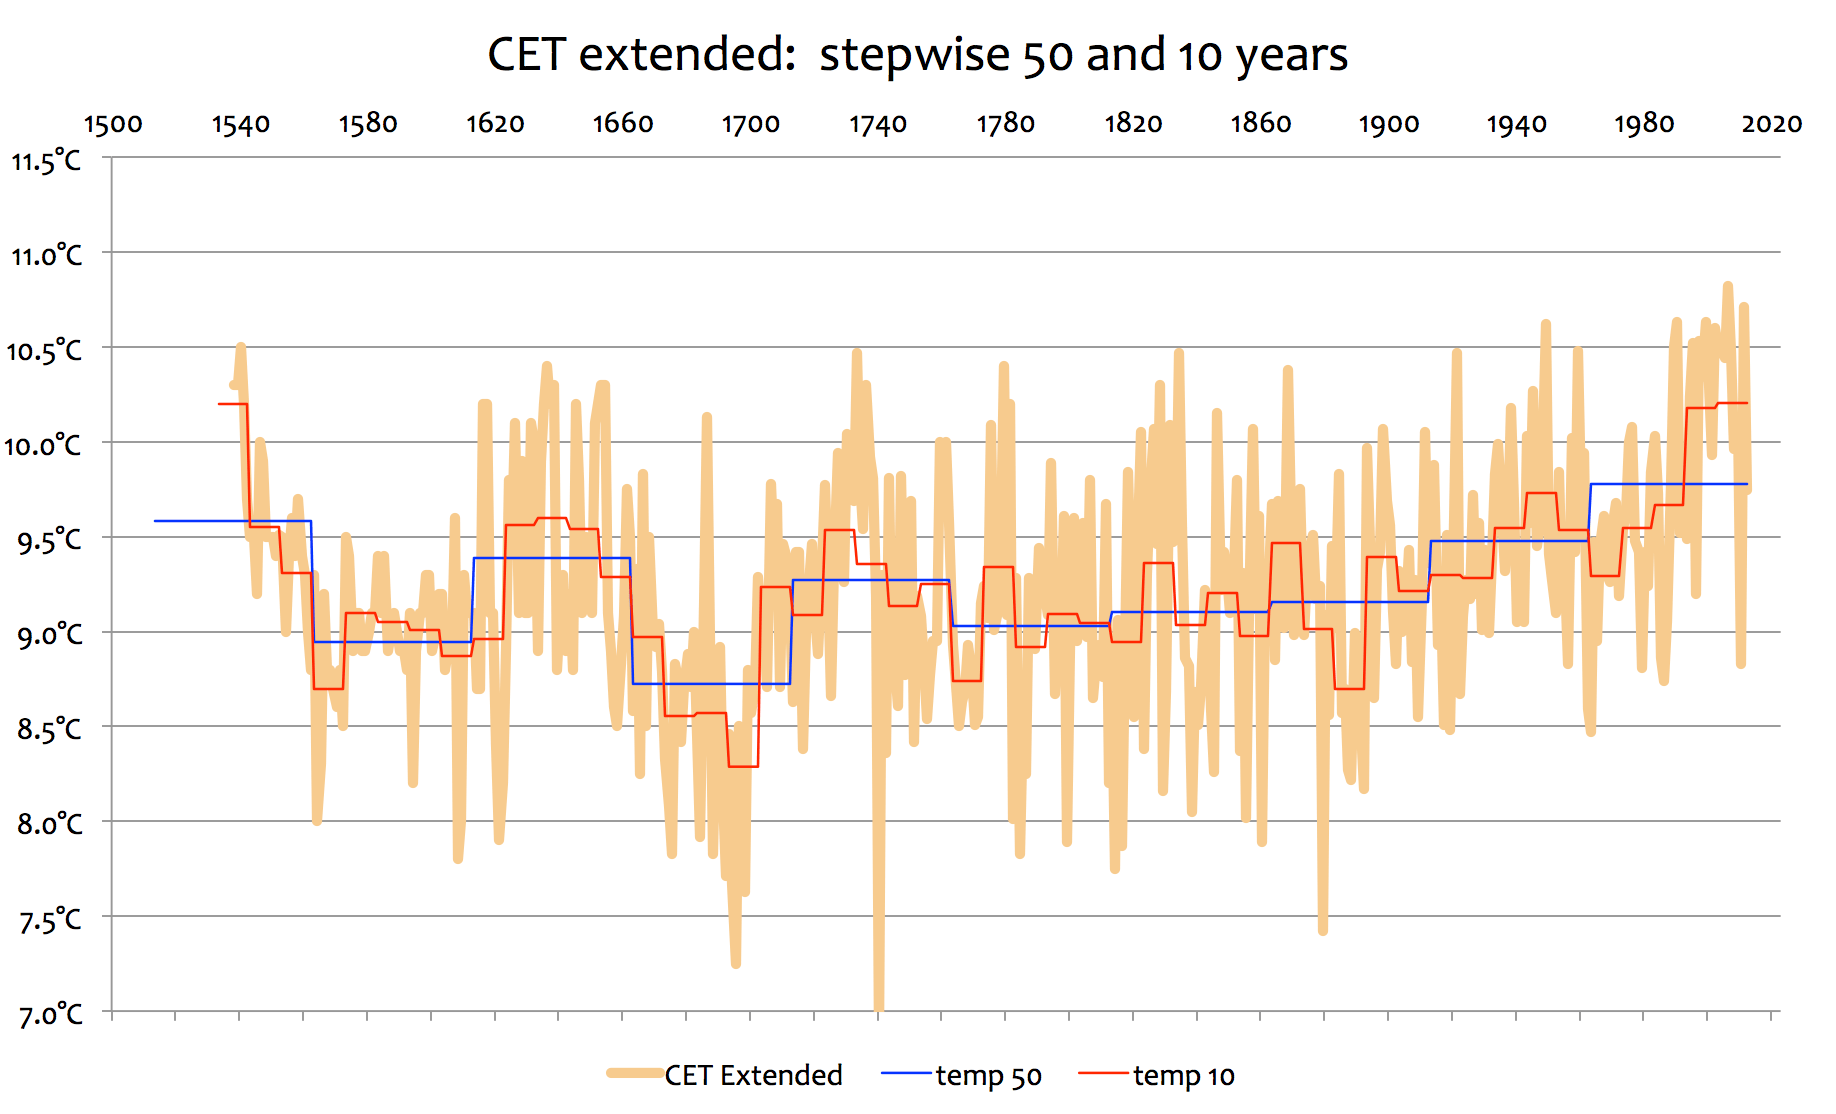
Figure 3a; CET by decadal and fifty year periods from start of each decade

Figure3b: CET by decadal and fifty year periods from middle of each decade
Note: for the purposes of this analysis the data in figure 3a will be used
So what periods of temperature increase or reduction constitutes a ‘noticeable’ change in the climate?
To provide a benchmark we may usefully look at the 1930’s when a farmer from Buchan in Scotland wrote to his local newspaper;
“1934 has opened true to the modern tradition of open, snowless winters. The long ago winters are no precedent for our modern samples. During the last decade, during several Januarys the lark has heralded spring up in the lift from the middle to the end of the month. Not full fledged songs but preliminary bars in an effort to adapt to our climatic change.”
It then goes on to say:
“It is unwise to assume that the modern winters have displaced the old indefinitely” and also “Our modern winters have induced an altered agricultural regime”
This warming was very wide spread from the 1920’s to the 1940’s and included the ‘dust bowl’ years in America, retreat of glaciers and the warming of the arctic to levels that approached, but probably did not reach, modern levels, as was noted in this previous Climate Etc. article.
The CET data for the period indicate a distinct climate shift of some 0.35 degrees centigrade on a 50 year basis, but rather more on a decadal basis, so that well documented era can usefully be our benchmark for temperature comparisons, whilst demonstrating the usefulness of a decadal time scale in determining a change in the climate that is ‘noticeable’ and has an impact on humans and nature.
Stepping back in time demonstrates further the utility of examining decadal-rather than 30 or 50 year periods- in accurately identifying ‘noticeable’ changes in our climate that some other proxies -utilising longer time scales- may fail to fully pick up. For example, we can see that the period around 1880 showed some astonishing variations according to our criteria, reaching a peak around 1865 before a cold decade set in from 1880, some 0.5 degrees cooler than the peak, before signalling the start of further warming that then became part of the 1920-1940 period noted above. However it falls within a 100 year period of apparent climate stability well observed in figures 2 and 3 above.
Demonstrating the usefulness of CET as a possible proxy for the wider world we can pick up the change in Canada from this intriguing reference from the records of the Canadian Horticulturist monthly of 1880 (page 7) which in hindsight was over optimistic. [link]
“I do not know whether or not the climate of Ontario is really becoming permanently milder than formerly, but I do know that for the past 18 years or 20 years we have not experienced the same degree of cold as the seven years preceding.”
Here again we can see that, as with the farmer in Scotland, so the horticulturist noted the change as it affected what could be grown. The cold decade was also noted in ‘The Long Winter’ by Laura Ingalls Wilder
Similarly, whilst the extent of the 1820 changes may be too short to be fully noted in the coarser scales of some non-instrumental proxy records, or in the 50 year segment, in the decadal scale it clearly stands out as a period of increasing warmth, followed by a substantial drop then a recovery. The notable warmth manifested itself in a melting arctic (not to modern levels) as discussed here.
A remarkable deterioration prior to this, around 1810, was noted by Hubert Lamb, in ‘Climate, History and the Modern World’, who remarked: “Indeed, the descriptions of ‘old-fashioned’ winters for which Charles Dickens became famous in his books may owe something to the fact – exceptional for London – that of the first nine Christmases of his life, between 1812 and 1820, six were white with either frost or snow.”
Lamb also points out that the decade from 1810 to 1819 was the coldest in England since the 1690’s.
Although 1740 to 1830 appears to be a a period of relative stability according to the 50 year records, many warm and cold decadal periods can be noted. Prior to this however we had an interesting and substantial ‘hump’ peaking around 1730 that terminated the coldest period of the Little Ice age with an abrupt rise in temperature over several decades of some 1.9C unequalled in the record before or since.
The following, condensed from the records of the Hudson Bay Company, demonstrate that climate change is not a new phenomenon, and was not restricted to Europe and that, as with many periods of warmth, temperatures were amplified in the arctic;
“Over the fifteen years between 1720 and 1735, the first snowfall of the year moved from the first week of September to the last.
The warm period can also be seen here in this record of Stockholm’s temperatures [link]

The growing warmth of the early part of the 18th Century was noted here by Hubert Lamb on page 12 and 13 of this study [link]:
“The remarkable turn of the climate of Europe towards greater warmth from soon after the beginning of the eighteenth century and affecting all seasons of the year in the 1730′s seems to have produced little comment at the time, though by then the temperatures were being observed with thermometers and entered into regularly maintained observation books in a number of places.”
Reginald Jeffery observed in his book ‘Was it Wet or was it fine,’ “By 1708 the middle aged would say; where are our old winters?”
The coldest period of the LIA-around 1660 to 1700- is so well documented that its reality does not need recounting here, so this highly ‘noticeable’ climate change- with its precipitate temperature drop being well noted in decadal CET- can be passed over in order to be able to concentrate on the peaks that presaged it. A full definition of the likely extent of the Little Ice age as popularly understood is given under note 2.
At this stage we step beyond instrumental records to my own reconstruction, described in great detail in ‘The long slow thaw?’ as regards the substantial warmth noted around the turn of the 16th century, which by the middle of that century had shown a notable downturn to the early part of the 17TH century, then a rise in temperature that commenced around 1610 and lasted until around 1650-with another notable peak around 1630. These two ‘reconstructed ‘rises were of some surprise to me and includes a number of periods that qualify as ‘noticeable’ climate change as I noted here in ‘The long slow thaw?’
“Lamb gathered together a variety of forms of evidence in his reconstruction. The schematic of composite graphs seen in figure 16 and 17 -when compared to the reconstruction to 1538- seems to confirm with other research that Lamb’s view of climate history was broadly correct. The main caveats we would place is that our own 1538 reconstruction seems to indicate slightly warmer humps around 1550 and 1630 than Lamb notes. This needs to be checked as it was unexpected’
By providing additional material –and from a wider area- to that contained in the original article, we can validate both these unexpected warm humps-each representing considerable climate change which frame a much colder Little Ice Age interlude well covered in the literature. This is noted in Appendix one in this paper, but briefly we can reference Moberg et al 2005, Professor Pfister, Professor Brian Fagan, Professor Hubert Lamb, Professor Philip Jones, Dr Michael Mann and Sir Francis Bacon.
What of today?
Those of us living through the 1960’s and early 70’s in Britain may think of it as a cold period . Indeed the cool windy wet weather of the early sixties is what first encouraged my family to holiday abroad and in retrospect they were right. However, the substantial temperature change during this period is not quite enough to meet the benchmark of ‘noticeable’ climate change. This allows the point to be made that temperature is not always the sole matrix to use when considering ‘climate change’ as more or less sun, wind, or precipitation, may not show up in the temperature record but may nevertheless impact substantially on life.
The benchmark definition of ‘noticeable’ climate change certainly applies however to the period from 1985 to 2000 (most clearly seen in figure 1) when the temperature increased by 0.8C and was followed immediately by what appears to be another period of ‘noticeable’ climate change in the opposite direction, not fully seen yet in the decadal record but visible in figure 1) -This has brought the annual anomaly back to the level of the 1730’s (but still relatively warm for Britain.)Curiously the first year of the record 1659 and also 2010 both ‘enjoyed’ exactly the same anomaly. This recent downwards turn in temperature can be testified to by the difficulty in growing a variety of crops and vegetables that flourished just a few years ago, so again the horticultural aspect seems a reliable indicator of climate change. Of course we can not yet know how long this reversal will last.
Looking at the complete CET instrumental record we can note that the anomaly difference on a decadal basis in this temperate country ranges from around -1.3C several decades after its instrumental start in 1659 to around plus 0.8c around the year 2000 (i.e. total variability of some 2.1 degrees C). Over its 350 year instrumental course, it has swung wildly between these extremes seen at either end of the record, encompassing decadal figures ranging from -0.7C to plus 0.45C along the way (figure 3) These extremes are not replicated in figure 2, whose results are unrecognisable when compared to the actual CET temperature statistics. This aspect shall be covered under the section entitled ‘Global temperature reconstructions using paleoclimate proxies-fit for purpose?’
‘Noticeable’ climate change-facts and figures
So using the criteria of ‘noticeable’ climate change that would affect humanity and nature, that can be reasonably validated against the benchmark of the 1920-40 period by such records as instrumental and crop, or observations, and as being of a duration of at least one decade, we have some 15 decadal episodes of ‘noticeable’ climate change, (up and down) between1538 and 2012. As far as ‘hidden’ ones go, where the averaged instrumental record shows nothing that reaches our benchmark but the end result does, we have two identified to date; the 1960/70’s and the mid 1800’s where the winters became noticeably milder as noted by Noah Webster of Dictionary fame.
It can be determined also that out of some 47 decades in the extended record to 1538, there were only two episodes of two consecutive decadal periods (i.e. each of 20 years) where the temperature remained essentiallythe same. It has gone down 21 times by various decadal amounts ranging from small to ‘noticeable’, and up 25 times using the same criteria. In fact climate change is the ‘norm’ rather than the unusual.
Perhaps even more remarkable is that despite these climate oscillations, temperatures on a decadal basis remain bounded within the tight limits noted of -1.3 to 0.8C so giving a remarkable constancy of around 2 degrees C throughout the near 500 year record. Whether these bounds remain as the MWP is examined in Part two of ‘The long slow thaw?’, or will remain so in the future, remains to be seen.
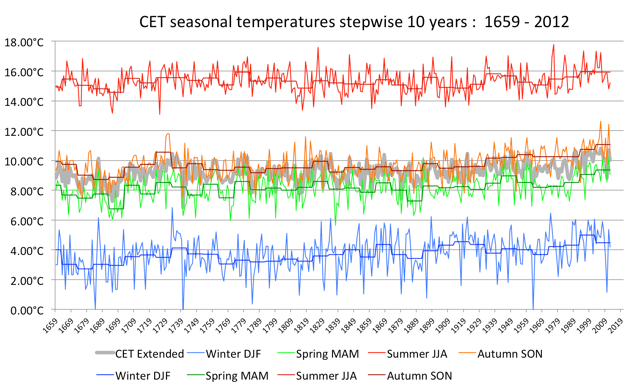
However, we can say with certainty that climate changes constantly up and down and that ‘noticeable’ climate change is rather frequent throughout the record. The seasons also broadly reflect the 2C boundaries, with Winter decadal temperature ranging from 2.8 to 5C, Spring 6.8 to 9.3C, Autumn 9 to 11.2C; however, Summer shows a much smaller decadal range between 14.8 to 16C, which brings the overall average seasonal range back to the overall 2 degree C boundary. The seasonal CET to 1659 is shown below.
Climate variability- Modern and Ancient
Shaun Lovejoy wrote a thought provoking technical article carried in Climate Etc in January 2013 concerning climate variability, global climate models and the possible advantages of considering ‘macroweather’ developed using ‘fluctuation analysis.’ [link]
Shaun comments; “… most of the long term variability of both the data and the models are due to the anthropogenic forcings that are sufficiently strong that they dominate the natural variability.“ and “…. if further research confirms our conclusions, it would mean that anthropogenic induced warming is the most important factor in explaining the variability since 1850.”
Examining the much longer records in detail enables us to examine this claim.
We can clearly see from history that there were very large swings succinctly described in Professor Brian Fagan’s book ‘The Little Ice Age’: “There was never a monolithic deep freeze rather a climatic see saw that swung constantly back and forwards in volatile and sometimes disastrous shifts. There were arctic winters, blazing summers, serious droughts, torrential rain years, often bountiful harvests and long periods of mild winters and warm summers. Cycles of excessive cold and unusual rainfall could last a decade, a few years, or just a single season. The pendulum of climate change rarely paused for more than a generation.”
This suggests great variability in the past, not only on the decadal basis but in individual years and the seasons within those years. This possibly explains the greater incidence of extreme weather events of all types noted in the historic records compared to today, especially the prolonged periods of heavy rain leading to flooding. Curiously, drought also featured prominently, perhaps indicating the see-saw effect of natural climate change in past centuries noted in the passage above. The detailed observational records also pick up long periods of ‘similar’ weather, such as many weeks of rain or long periods of drought, which might indicate the jet stream being in a favourable or unfavourable position, or a blocking high etc. This is an area of current interest to the climate science community which the historic record might be able to throw some light on.
The variability, extremes, volatility and extent of anomaly changes shown in the instrumental and reconstructed data are at complete variance with the paleo models in figure 2) with Moberg et al 2005 being the most notable partial exception. Why should this be? The paleo record is clearly showing a constancy in climate with a variability from 1500 to 1920 centred on around the minus 0.3 to 0.5C anomaly mark, for the core models. Yet the instrumental and historic record demonstrates much greater variability, albeit within relatively narrow overall decadal boundaries.
Global temperature reconstructions using paleoclimate proxies-fit for purpose?
An examination of the reconstructed CET from 1538 (figure 3) shows that from the centre point of 1750 the decadal variability of around 2 degrees centigrade maximum remains the same throughout the record. However, within each half of the record there is great decadal variability, up and down within that range, with the greatest volatility clearly in the earlier half of the record, with the dip and recovery around 1690 and similar features during the early part of the 16th century and the start of the 17th century.
Curiously, this variability cannot be seen at all in the core paleo reconstructions (figure 2) which appear surprisingly stable, with no greater variance than around 0.2 to 0.4C.degrees throughout the period 1500 to 1920 (by which time the instrumental record is utilised) . However, when stepping back to observe the relative coarseness of the fifty year record in CET (the red line) the shortcoming of the paleo reconstructions can be clearly seen as the coarser CET 50 year ‘paleo’ records also exhibit the similar (but slightly larger) characteristics of limited variability that the proxy reconstructions do. (This is with the obvious exceptions of the considerable perturbations around 1690).
This effect is shown in Figure 4 below. Horizontal red lines are CET 50 year ‘paleo’ Horizontal blue lines decadal. Vertical brown lines annual temperature.
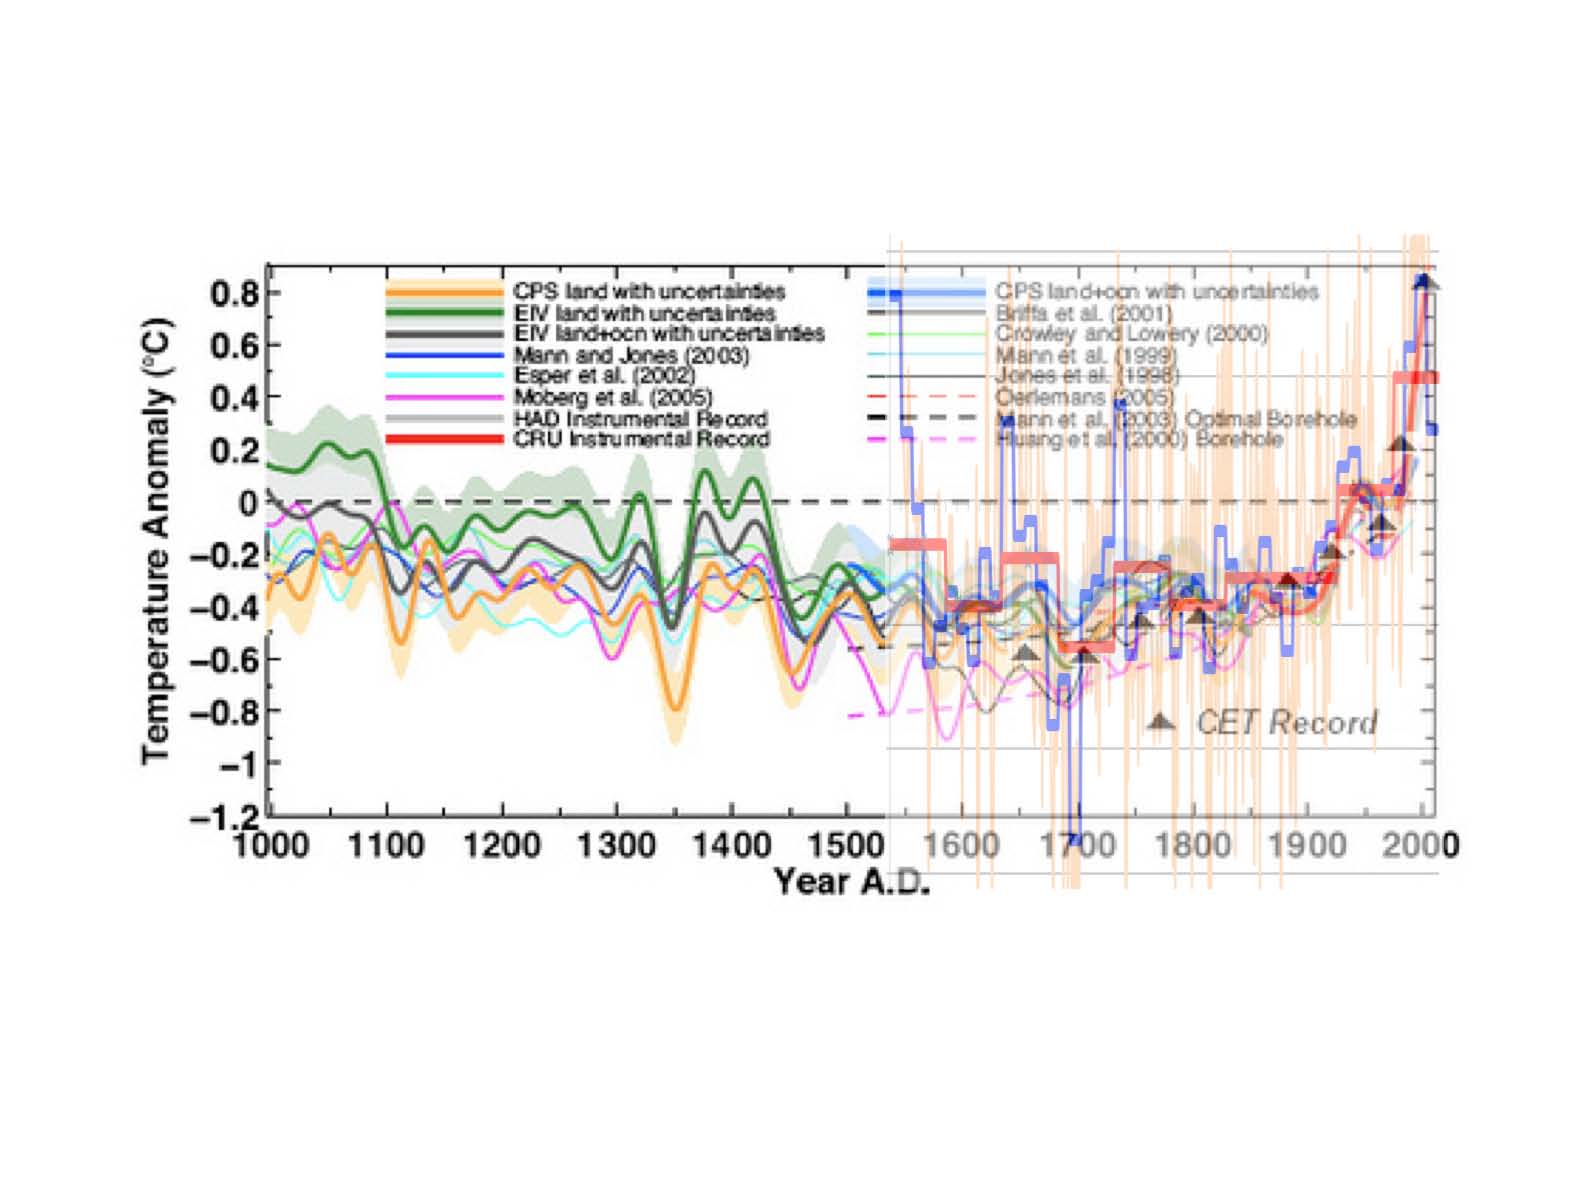
Note; This graph is set to the ‘norm’ of 1961 to 1990 to match that of the paleo reconstruction and has a start date of the beginning of each decade. The colder period at the very end of the record straddles two decades, the last of which has obviously not yet been concluded and may yet change its character. The recent cooling trend can be seen in figure 1.
Note: the paleo reconstructions in the earlier part of the record that coincide with CET ‘paleo appear to run a little cool.
The coarser 50 year time scale noted in figure 4 appears to have completely masked the decadal variability of up to 2C through the record which is up to ten times larger than the paleo reconstructions using proxies.
Comparison of the paleo reconstructions and CET instrumental data shows that the paleo reconstructions miss the great warming centred on 1730 the recovery around 1830 from the coldest decade (1810) since the depths of the LIA in 1690, and the final bursts of the LIA in 1840 and 1890. Looking further back, the paleo reconstructions also do not replicate the considerable drop to the depths of the LIA around 1690, the (reconstructed) warmth around 1630, the period of well documented cold at the beginning of the 17th century and the sharp (reconstructed) rise around 1540 to something apparently approaching the temperatures at the end of the 20th century.
From this data, it can be seen that the limited anomaly temperature range observed in the paleo reconstructions appear to be a reasonable representation of the 50 year CET instrumental experience. However, it can also be seen that the paleo reconstructions display substantially less variability and range than can be observed in the real world CET decadal instrumental anomalies.
The end result of this is that the incorporation of a somewhat volatile instrumental record (from 1900) on to the end of a somewhat static paleo reconstruction, has substantially altered the context of the paleo reconstruction. Each type of data represents a completely different range of anomalies and the end result consequently displays an ‘apples and oranges’ syndrome.
We can see this exhibited in the 50 year and decadal data from CET (figure 4) a single country record without the noise introduced by tens of thousands of global records. From this we can note that as the instrumental record anomalies display much more volatility and extremes than the paleo reconstruction anomalies, this will inevitably lead to the sharp changes in ‘noticeable’ climate change seen throughout the instrumental record. As a consequence, a very pronounced ‘hockey stick’ can be seen in the instrumental record at times, not only around 1900, but a substantially steeper one around the 1730 period and somewhat lesser ones around 1830, and also 1540 and 1630 during the reconstructed CET record. Climate may appear to be relatively stable in the longer term, but certainly isn’t in the shorter one and Paleo reconstructions appear unable to capture this real world variability and the temperature ranges it represents
Conclusions
*By any criteria, climate change is frequent, indeed the ‘norm’. Variability of our climate on a decadal basis is considerable.
*These decadal episodes of variability are no more pronounced in the present than they were in the past -indeed the volatility appears greater in the past as can be seen in the sharp drops, then recovery, during the LIA episodes.
*However, there are tight boundaries, with the frequent oscillations currently on a slightly rising trend from the start of the instrumental temperature record in 1659, albeit with a sharp reversal in the last 7 or 8 years.
*There are some hints of a similar rise to broadly equivalent modern levels around 1540 in the reconstructed CET.
*Rising temperatures reflect the relative dearth of ‘old fashioned’ winters in the second half of the record, as well as changes in other seasons, within their boundaries. Summers have the tightest boundaries, appreciably lower than the other seasons.
*Bearing in mind the accommodation with nature that humans need to make with even relatively short periods of ‘different to normal’ weather, perhaps it might be more useful for the authorities to consider ‘noticeable’ climate change as covering decadal rather than 30 year periods
*Paleoclimate reconstructions capture quite well moderate long term variability of 50 years and more but fail to pick up the much more variable decadal variability
* Paleoclimate reconstructions stretching far back in time using proxies that don’t capture the fine grain of the annual natural variability- can be somewhat inaccurate representations of what has actually historically occurred in the real physical world.
* As paleoclimate reconstructions are measured against global instrumental temperature records commencing 1880 they do not find any ’ hockey stick’ effects seen in older temperature records
*When instrumental records are not available, the historic record of the past millennium is likely to be a valuable aid to the development of paleoclimate reconstructions using proxies.
[link notes] to notes, references, appendix
JC comment: This post is one of a series of posts by Tony Brown that interprets the historical climate record. This is a guest post; please keep your comments relevant and civil.