

by DocMartyn
My forecast is that temperatures will remain flat until 2040.
The pre-industrial level of CO2 has been estimated at 280 ppm, present levels are near 390 ppm and 560 ppm represents an anthropogenic doubling of CO2. Climate sensitivity is typically quoted as the temperature rise that will result from 2x[CO2], that is what the average temperature will rise from the pre-Industrial temperature when atmospheric CO2 reaches 560 ppm.
A priori, the calculation of climate sensitivity should be trivial. The ability of CO2 to absorb infra-red radiation is a function of the logarithm of its concentration and therefore one could make a plot of Log[CO2] vs. temperature and from the slope estimate the climate sensitivity directly. However, there are two factors that restrict this approach:
- although we have reasonable temperature reconstructions stretching back as far as 1880, we only have one continuous dataset of atmospheric CO2, initiated by Keeling in the 1950’s.
- the global temperature is quite wobbly, with short term noise and possible longer term cyclic changes occurring.
We can make an estimate of climate sensitivity using a fraction of the Keeling curve and the modern temperature anomaly recorded with electronic instruments. Earlier I did this using the 30 year period of 1982-2012.


Using a simple direct graphical method we get a value of 2.4 for climate sensitivity. This facile method was criticized for the lack of hindcasting and for ‘hidden heat’ in the system.
To overcome the poverty of hindcasting and to aid forecasting, I decided to improve the length of the study period. Firstly I attempted to come up with an estimate of past atmospheric [CO2] levels, by examining the relationship between the estimates of anthropogenic carbon released into the atmosphere (Marland & Andres) and the Keeling curve (Keeling & Tans), Figure 1.

Figure 1 shows the 1969-2012 Keeling CO2 curve and the historic and modern estimates of anthropogenic carbon produced by Marland&Andres. The red points are the actual levels of CO2 measured by Keeling and co-workers and the blue represents my estimate based in the estimates of total man-made CO2 sources.
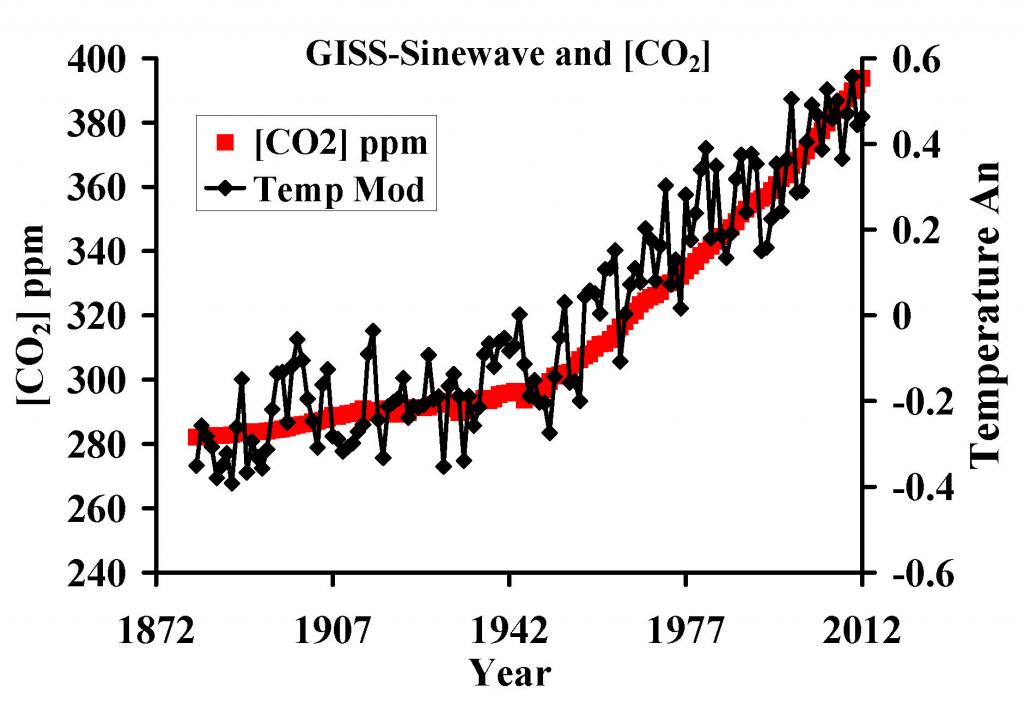
The estimated and measured atmospheric CO2 and GISS temperature from 1880 and 2012 is shown in Figure 2.
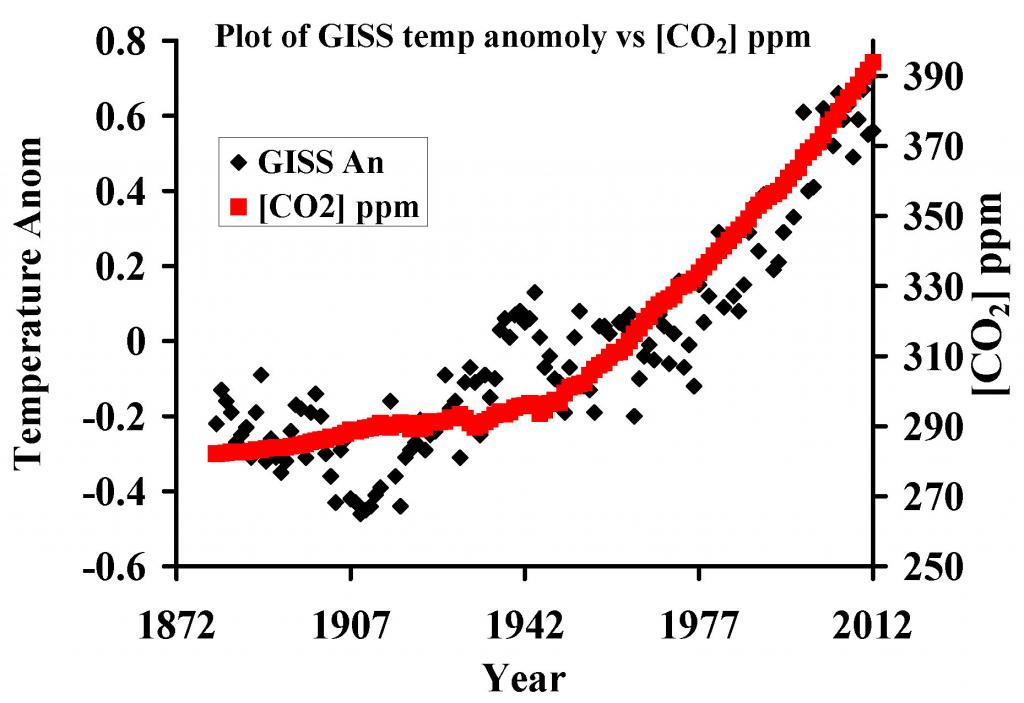
Then [CO2] is plotted against the GISS global temperature anomaly, which is shown Figure 3.
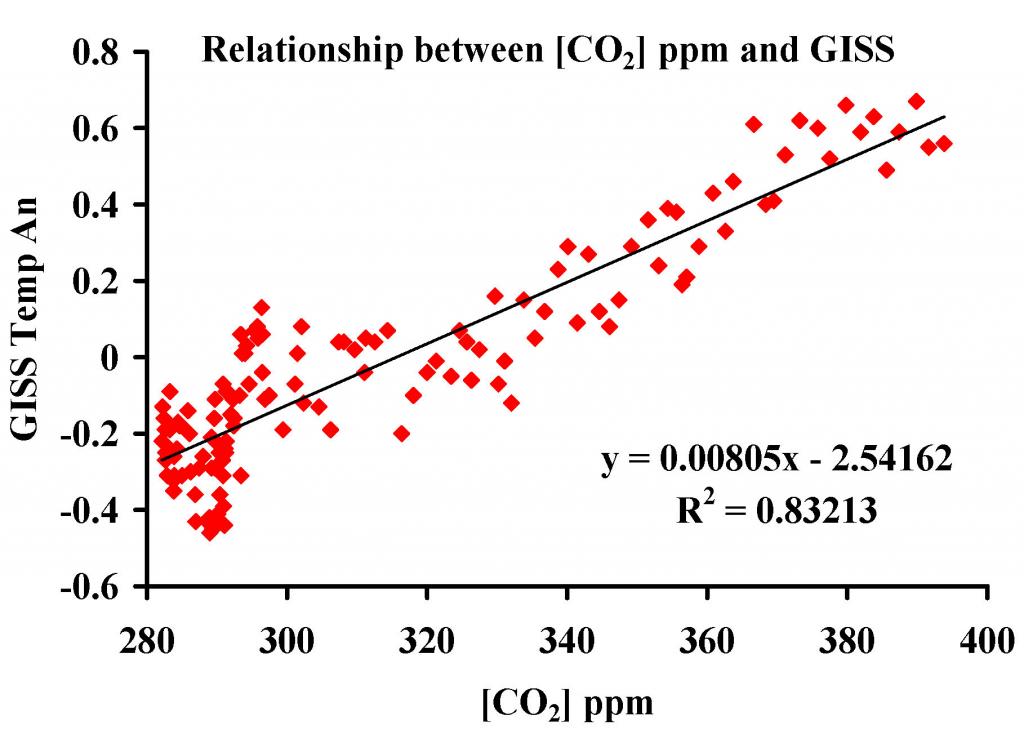
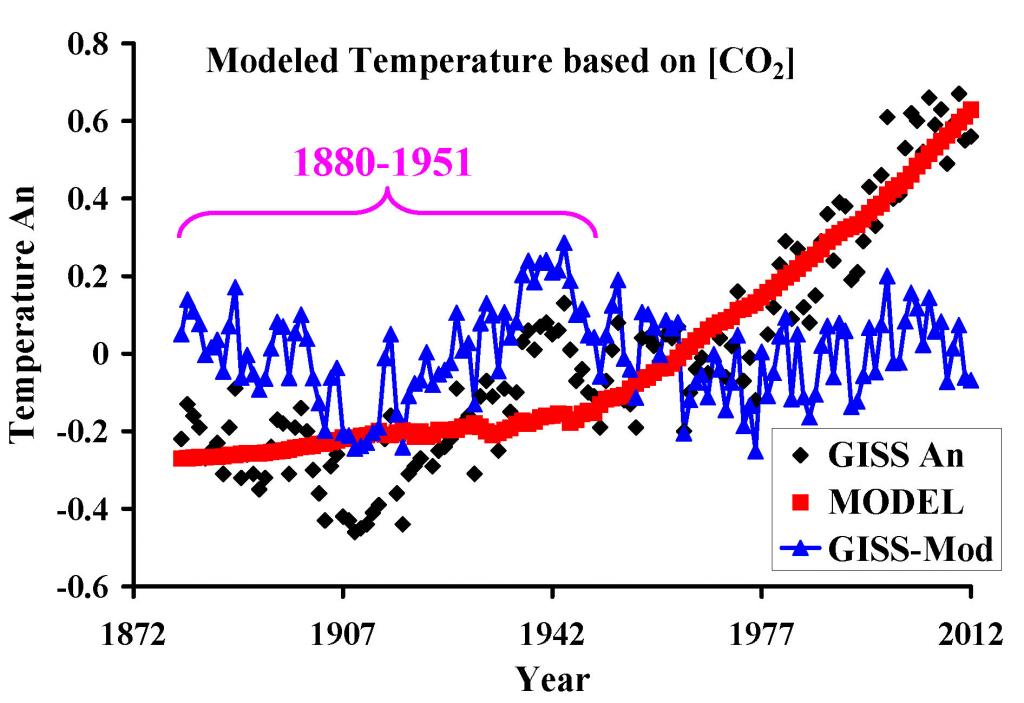
From Figure 3, the red line represents what the temperature would have been if 100% of the temperature change was due to CO2. The black points are the temperature anomaly estimates of GISS. Thus, we can plot the residuals, in blue, from the curve, real minus model, shown in Figure 4.
The nature of the residuals in the years 1880-1951 appears to be cyclic, and is shown fitted to a sine wave, with peaks/troughs 63 years apart (+/- 0.14 degrees), Figure 5.
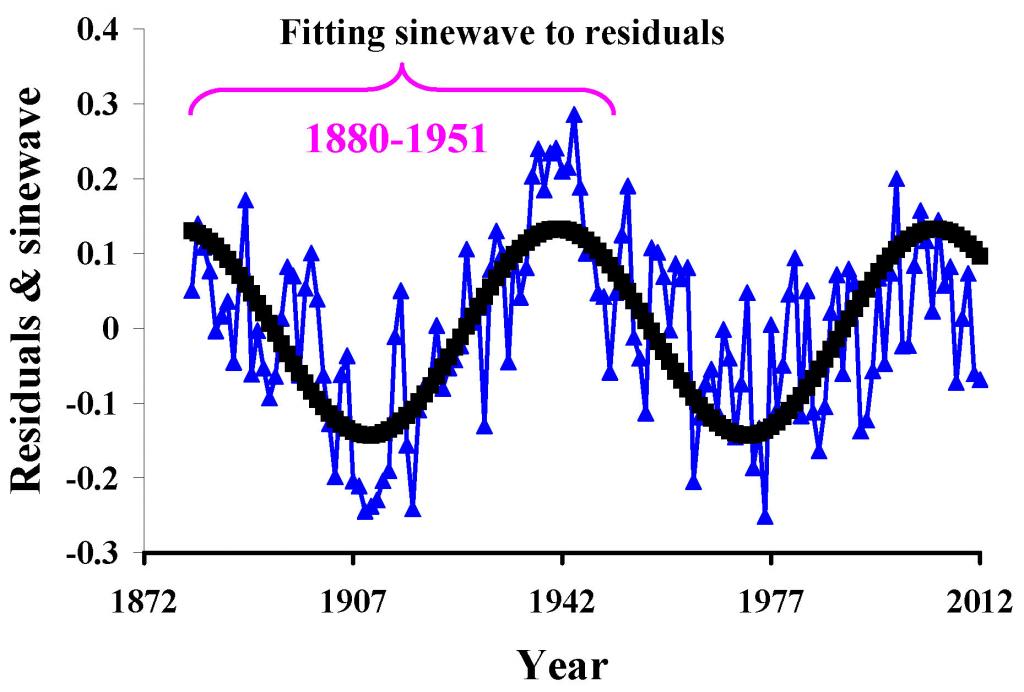
What is nice is that the sine-wave generated based on the 1880-1951 fits the 1951-2012 very nicely. We can take out the sine-wave from the GISS data and see how the Earths temperature would have been if this, possibly mythical, cyclic hording and then thermalization of heat is removed. When plotted with CO2 the line shapes are rather close, Figure 6
With this, possibly mythical, cycle removed we can now plot the logarithm of estimated CO2 vs. estimated temperature, and directly calculate climate sensitivity, Figure 7.
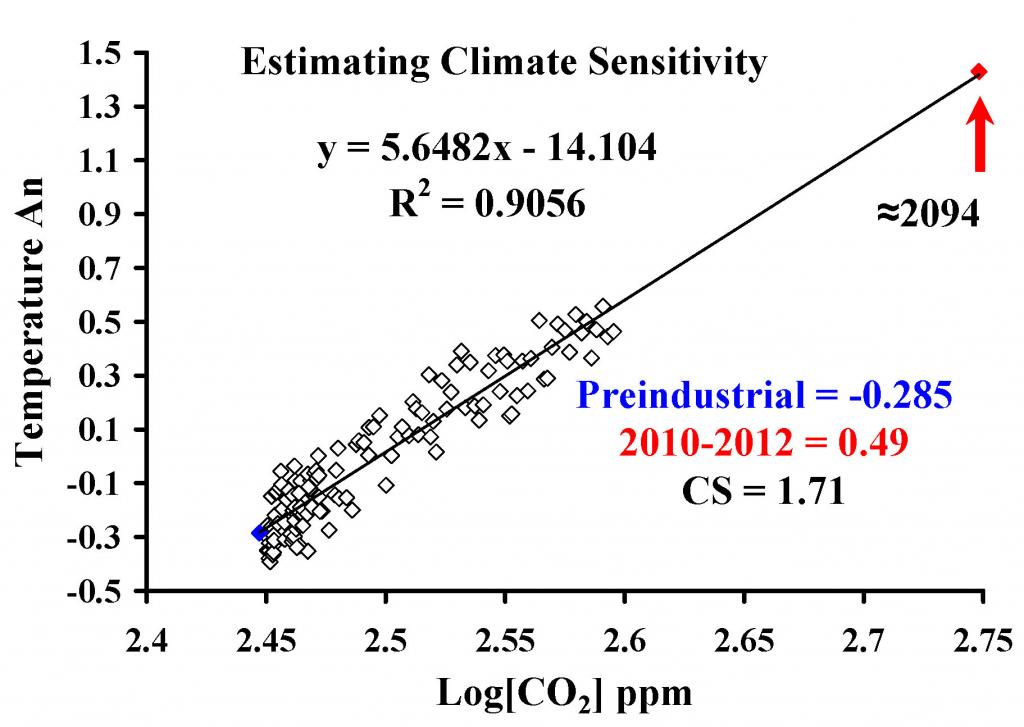
The climate sensitivity comes in at about 1.7 degrees, with 0.78 of this rise already observed. This will happen in about 2094. However, the temperature in 2094 need not represent the pre-industrial temperature plus 1.7 degrees, because of the heat oscillator. We can both hindcast and forecast based on the climate sensitivity and the sine-wave we identified, Figure 8.
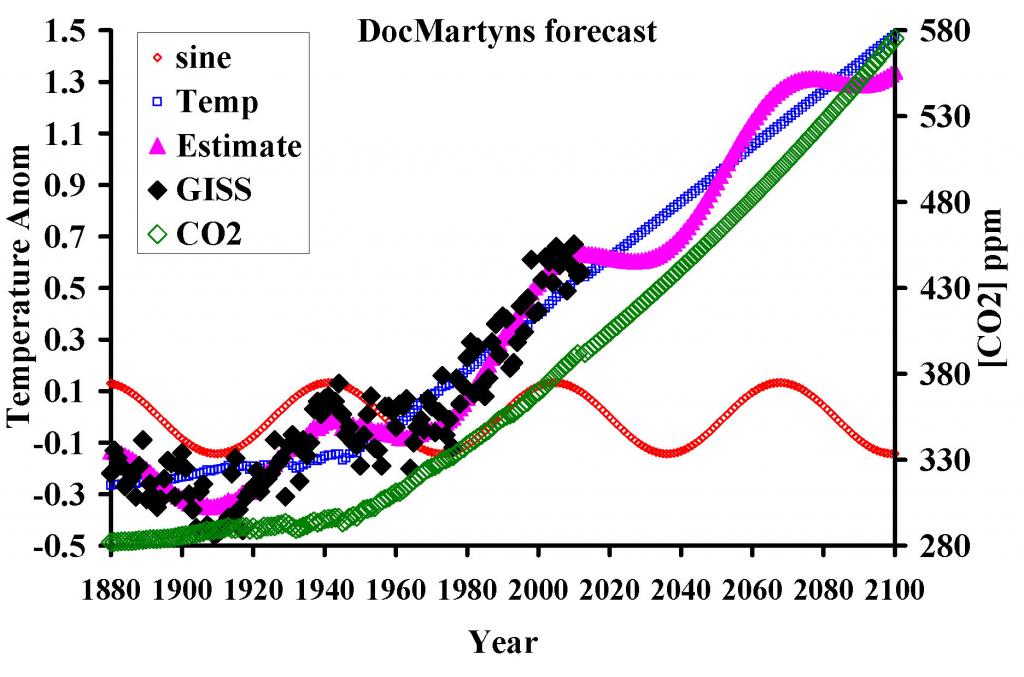
In Figure 8 the green line is the estimate of atmospheric CO2. The blue line is the estimate of the rise in temperature caused by CO2, using a climate sensitivity of 1.7. The red line is the cyclical component. The purple line is my hindcast and forecast of temperature, based only on a cyclic component and atmospheric CO2. The black diamonds are the GISS data points and these match the model almost perfectly.
My forecast, based on graphology and making no attempt to base the cyclic component on any know physical process, is that temperatures will remain flat until 2040.
JC note: This is an unsolicited post that I received via email. This is a guest post that reflects only the opinions of DocMartyn. Please keep your comments relevant and civil.