

by Rud Istvan and Brandon Shollenberger
Comments on the previous Climate Etc post on Maggio and Cacciola’s paper, When will oil, natural gas, and coal peak? motivated an analysis of the World Energy Outlook produced annually by the International Energy Agency (IEA).
IEA is an autonomous Paris based organization sponsored by 28 OECD countries that was formed in response to the 1973/4 Arab oil embargo. Over time its charter has expanded from a focus on energy security to include economic development (“eliminate energy poverty”), environmental awareness (“options for tackling climate change”), and world engagement (“solutions to shared energy and environmental concerns”).
IEA puts out an annual World Energy Outlook (WEO) for all energy, not just oil. “The WEO projections are used by the public and private sector as a framework on which they can base their policy- making, planning and investment decisions and to identify what needs to be done to arrive at a supportable and sustainable energy future …”
IEA also conducts original research. WEO 2008 reported a study of the largest sample of conventional oil fields ever done (according to them). The sample was 798 fields, including all supergiants (>5 Bbbl reserves), virtually all giants (>500Mbbl), and most major fields (>100 Mbbl). These fields comprised over ¾ of world conventional oil reserves and over 2/3 of oil production in 2007 (94% of world production comes from fewer than 1500 ≥major fields).
“The findings of a detailed field-by-field analysis of the historical production trends of 800 fields, set out in Part B of this Outlook, indicate that observed decline rates (the observable fall in production) are likely to accelerate in the long term in each major world region.”
Uh oh, especially since the production weighted annual decline in the sample was already 5.1% per year. Like the Red Queen in Through the Looking Glass, IEA pointed out the oil industry has to run harder and harder just to stand in place on capacity, since the low hanging fruit has already been picked. [1]
Decline in existing capacity happens despite reserve growth in discovered fields. Prudhoe Bay is an example. Reserves grew 40% over 30 years, yet Prudhoe production declined after only 15. This makes geophysical sense. Reserve growth occurs as the margins of the main field are developed, and as enhanced oil recovery (EOR) methods squeeze out the last drop.

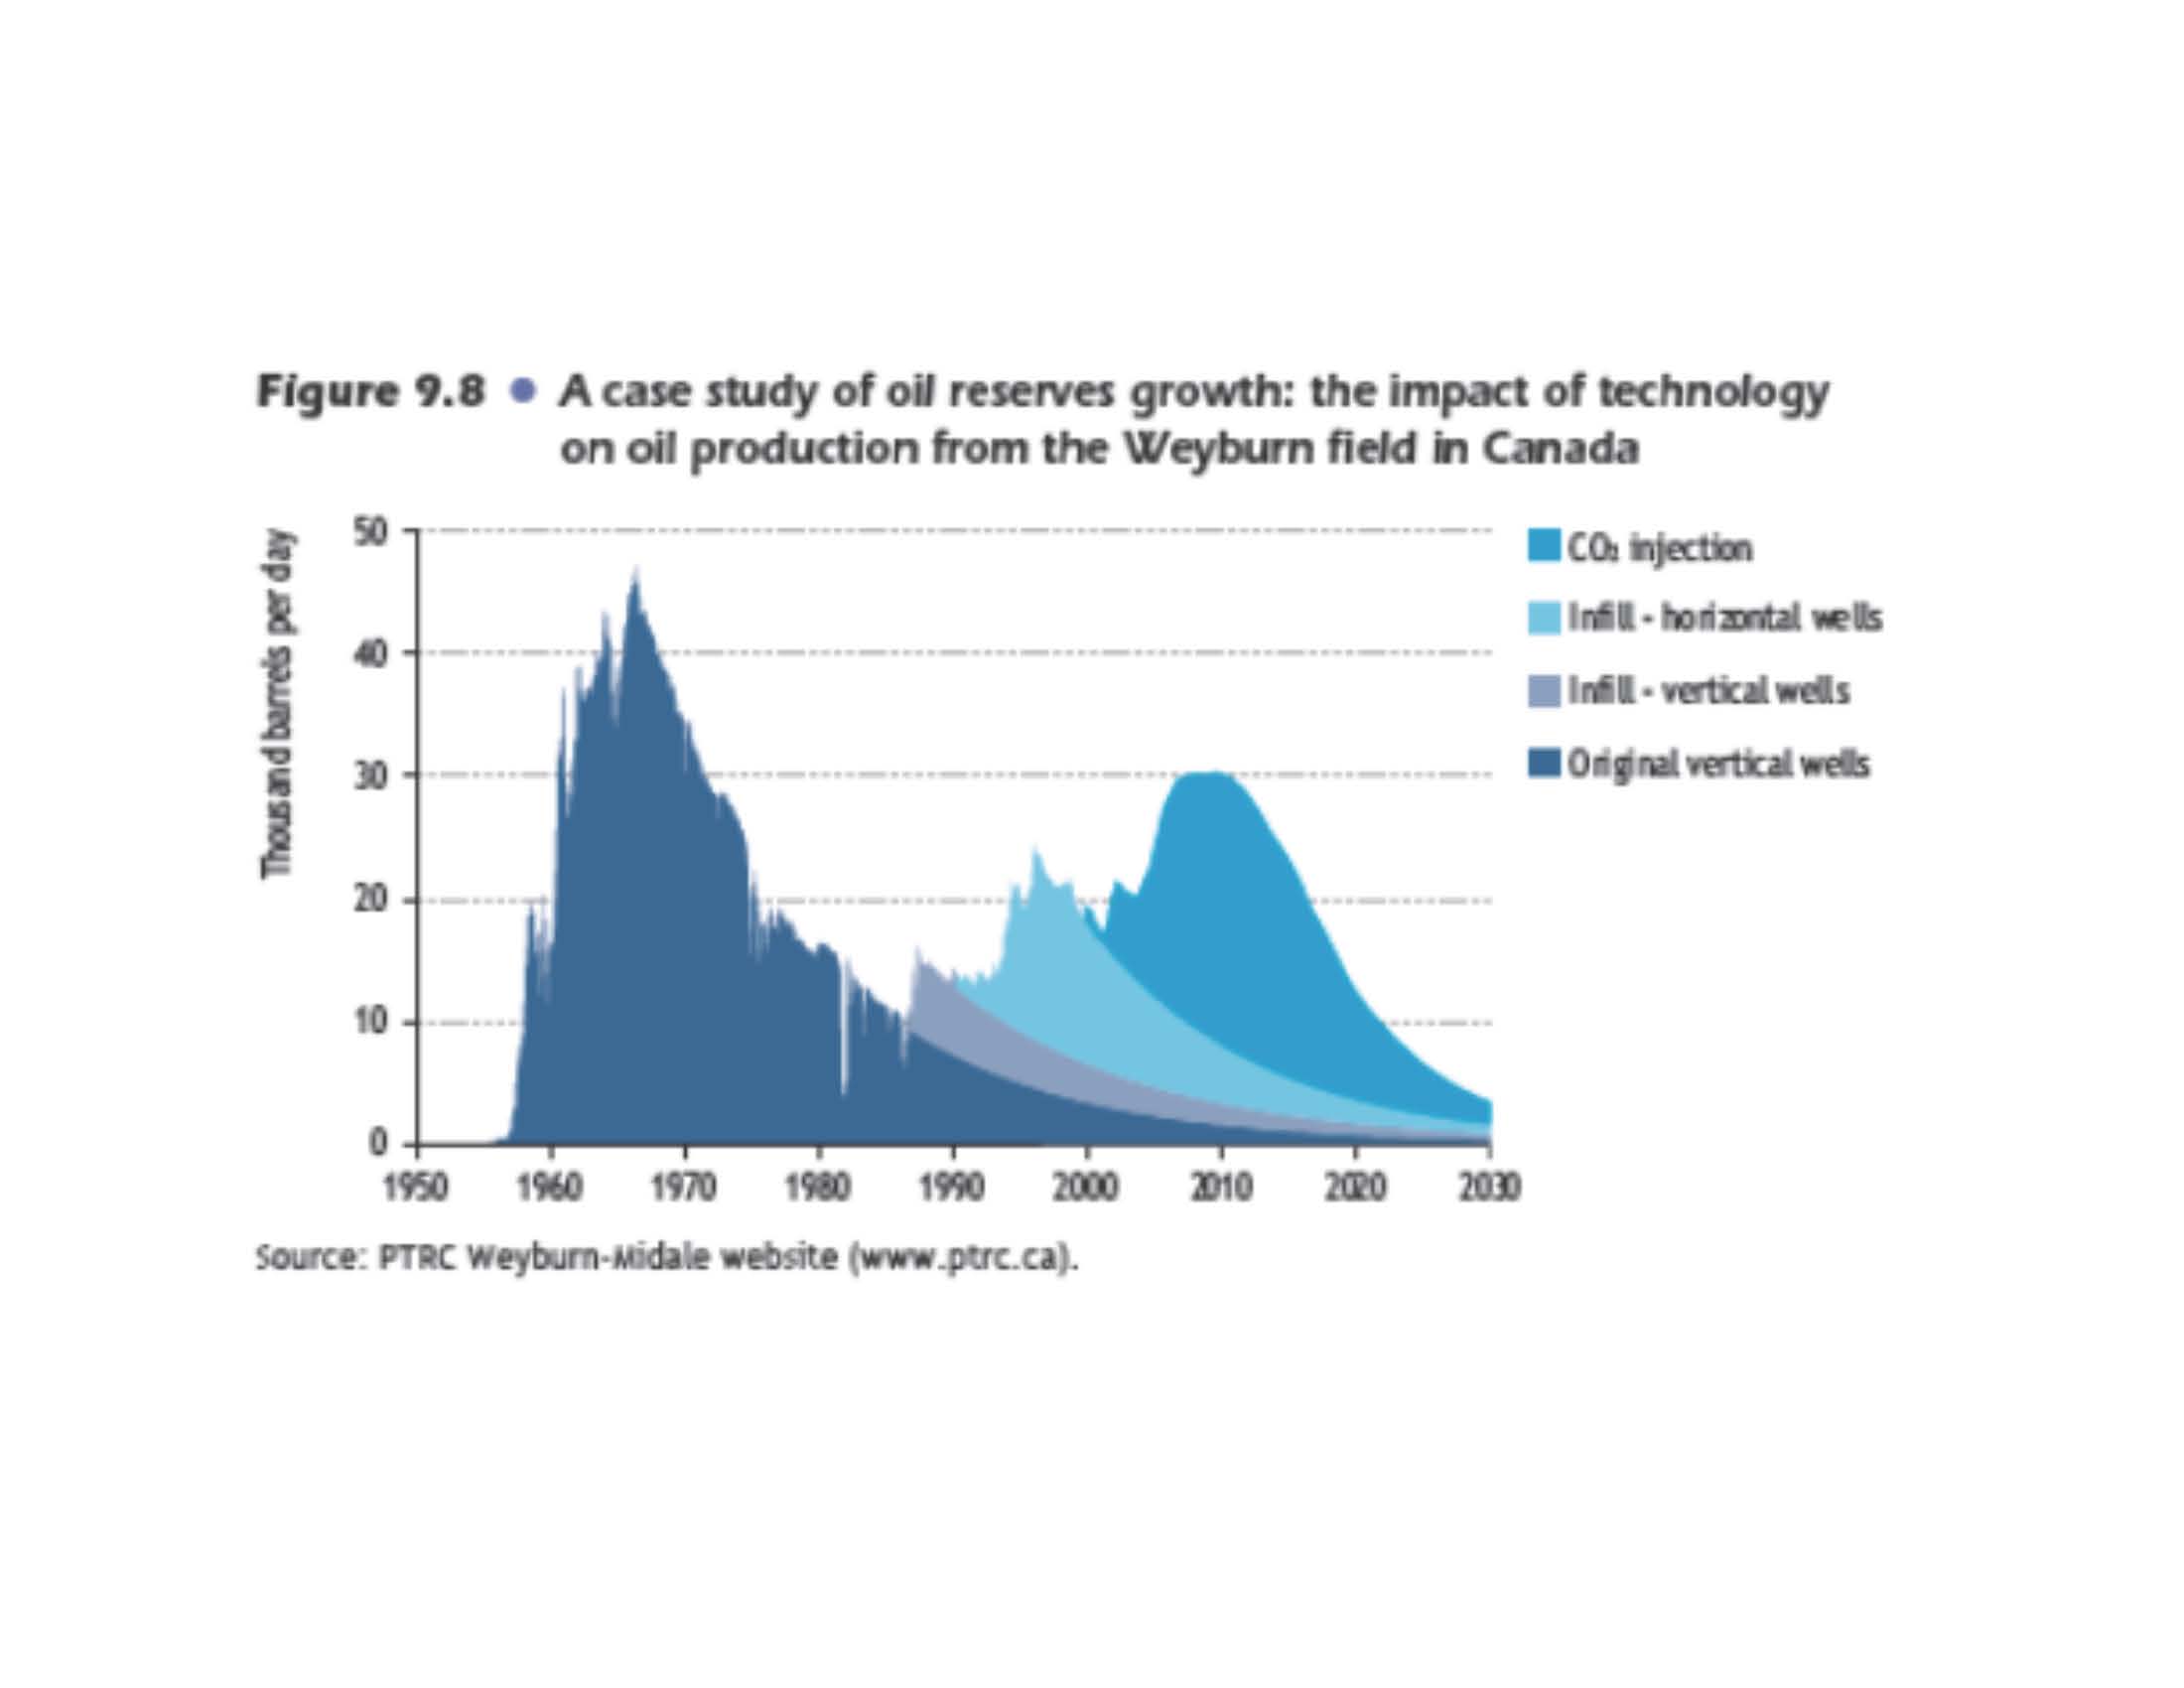
There are numerous drop squeezing EOR methods, which have been used for many years. Water flood of Ghawar began in 1964. Steam flood of Kern River began in 1965. CO2 injection into Permian basin fields began about 1980. MRC infill of Wayburn began about 1990. WEO 2008 provided an example for a typical heavy crude in a typical carbonate reservoir.
The ‘last drop squeezed’ is declining. WEO 2008 said its sample’s median production weighted recovery factor was only 35%. (The USGS uses 34%, IHS uses 36%.) This has to do with the geophysical viscosity, porosity, and permeability of oil fields. It is only 27% in a larger sample including many smaller fields. Future recovery factors will decline along with the larger producing fields.

Yet IEA WEO 2010 was quite sanguine about future oil prices over the next two and a half decades. (In sharp contrast to the IMF, whose recent working paper WP/12/109 forecasts oil at $200/bbl with declining post peak capacity by 2020.) [2] The IEA price projection is only a little above inflation (unless climate change policies sharply limit CO2 to 450ppm by ‘forcibly’ suppressing demand).
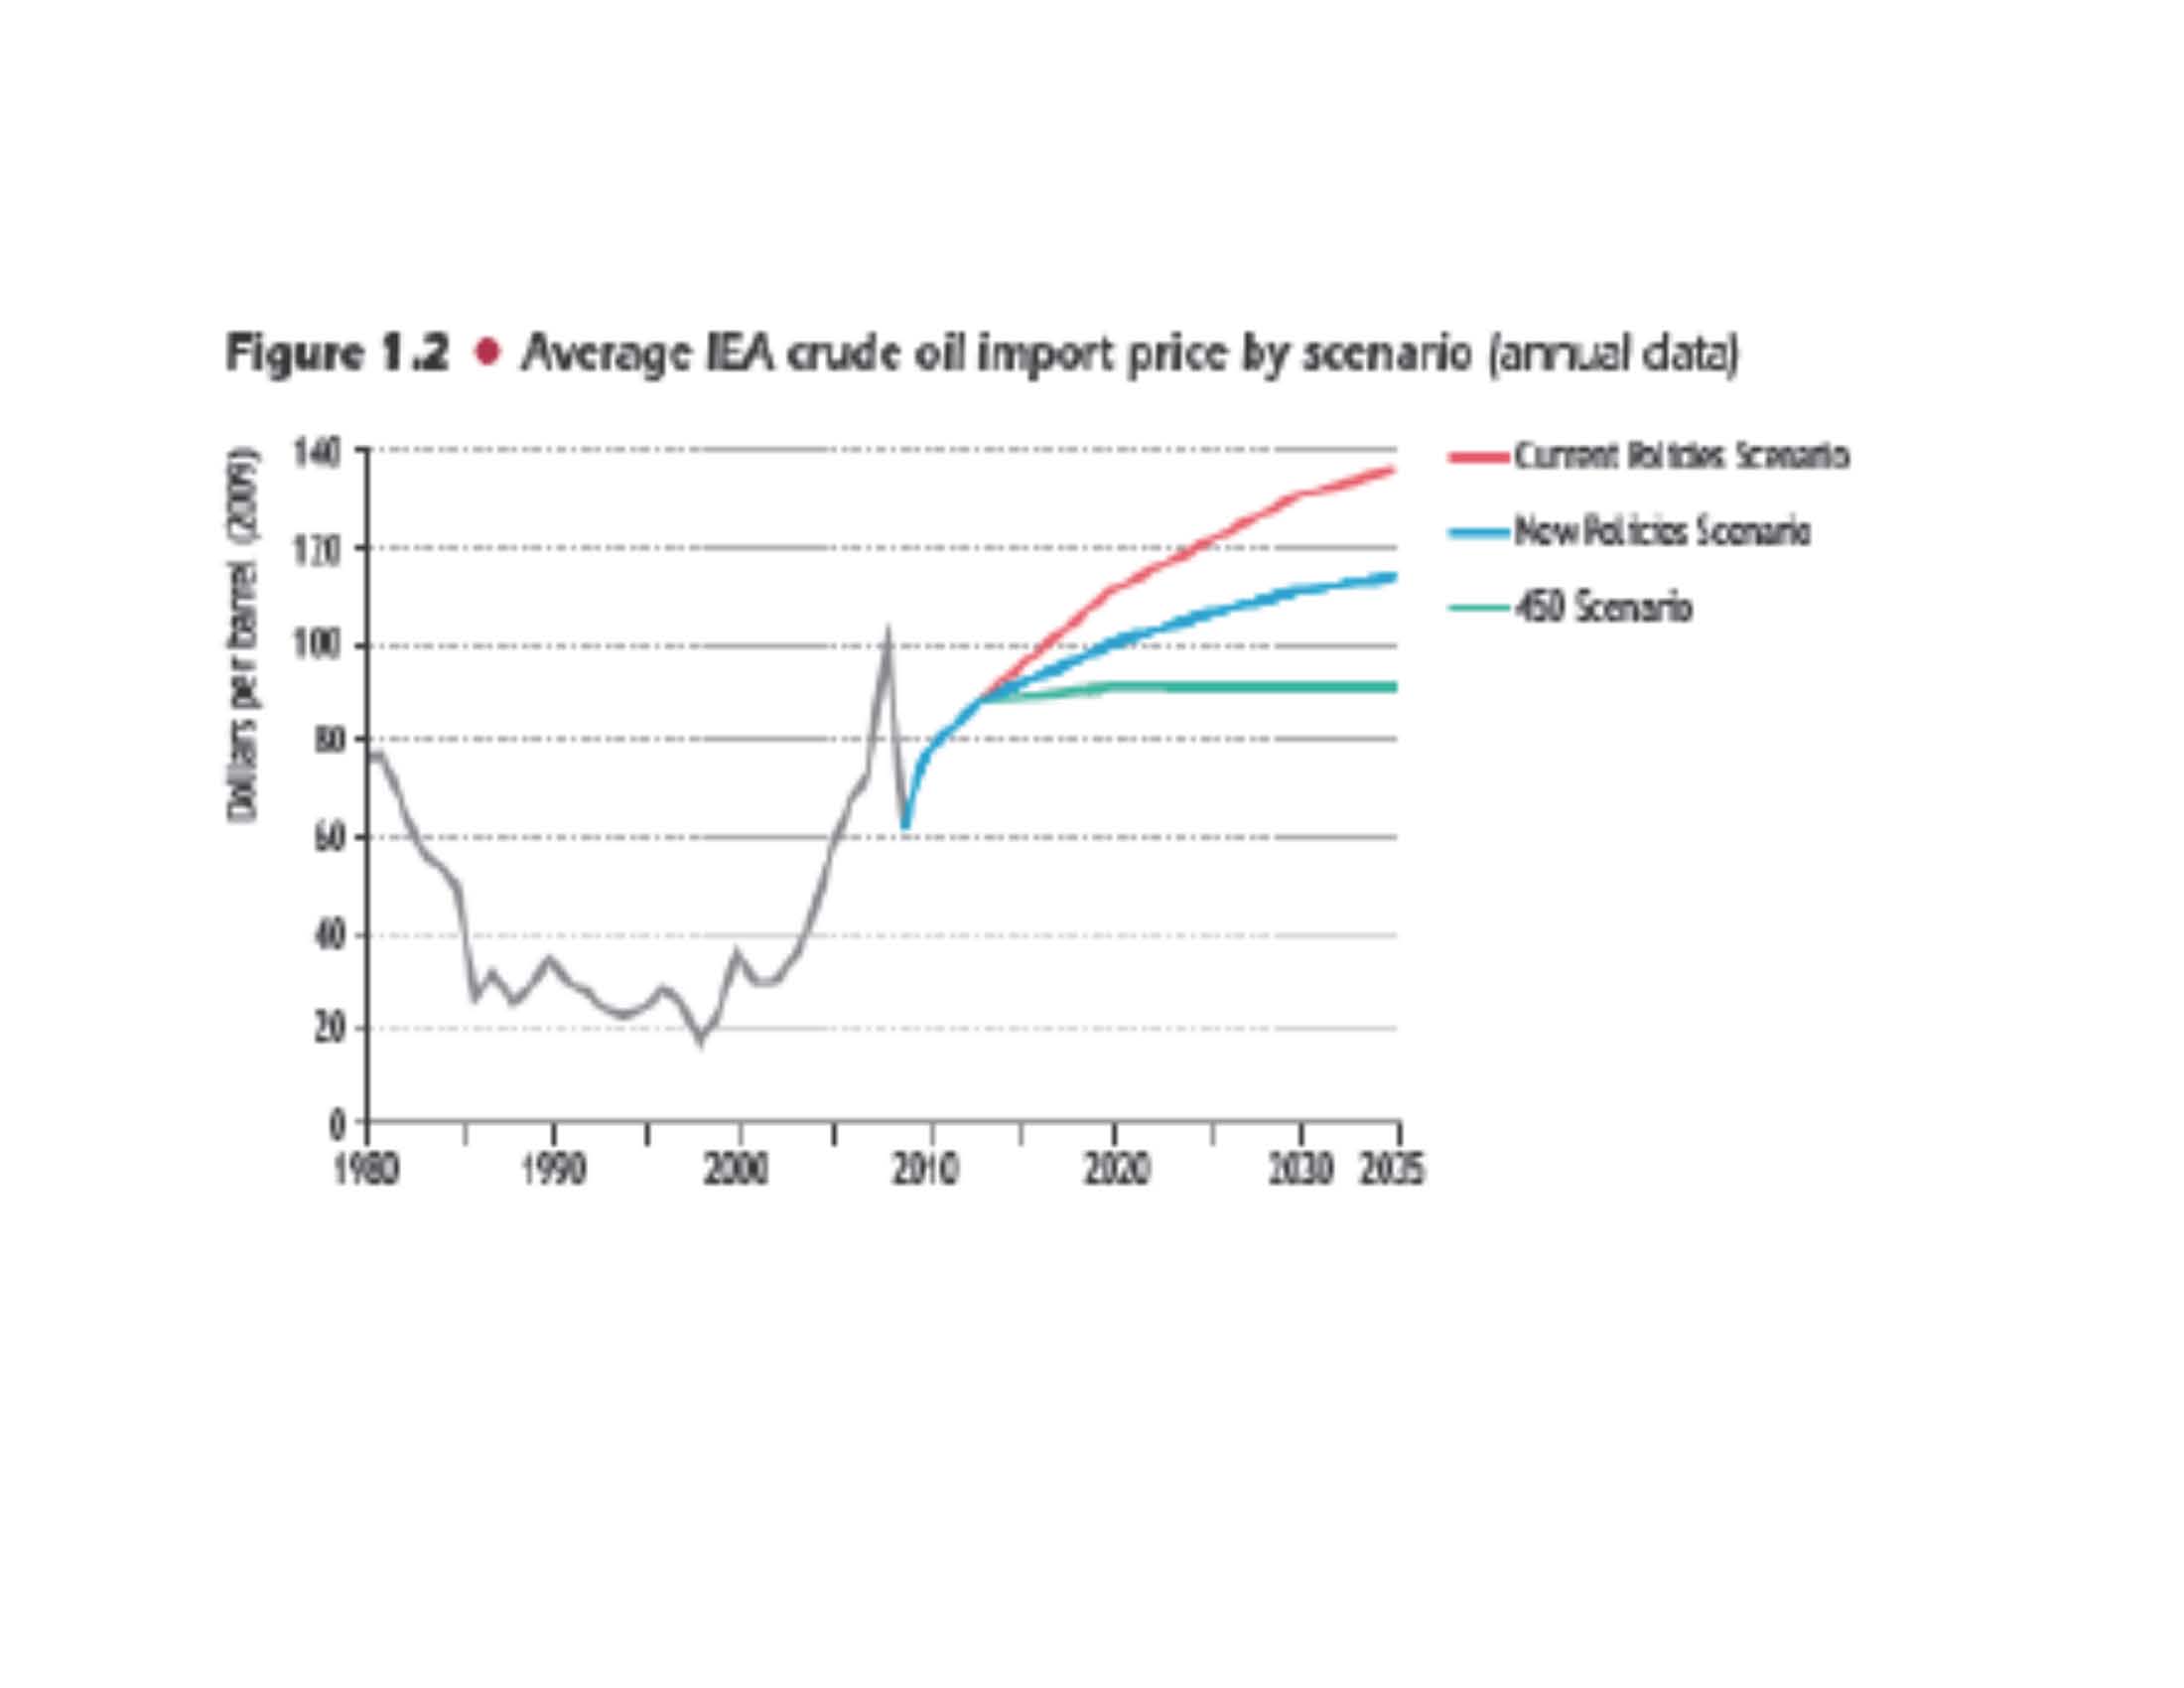
This is because WEO 2010 projected world oil production would keep pace with demand through 2035. This optimistic projection is about as factually sound as IPCC AR4’s climate sensitivity estimates. It contains more glaring inconsistencies than AR4 WG3 section 9.6 on ECS.
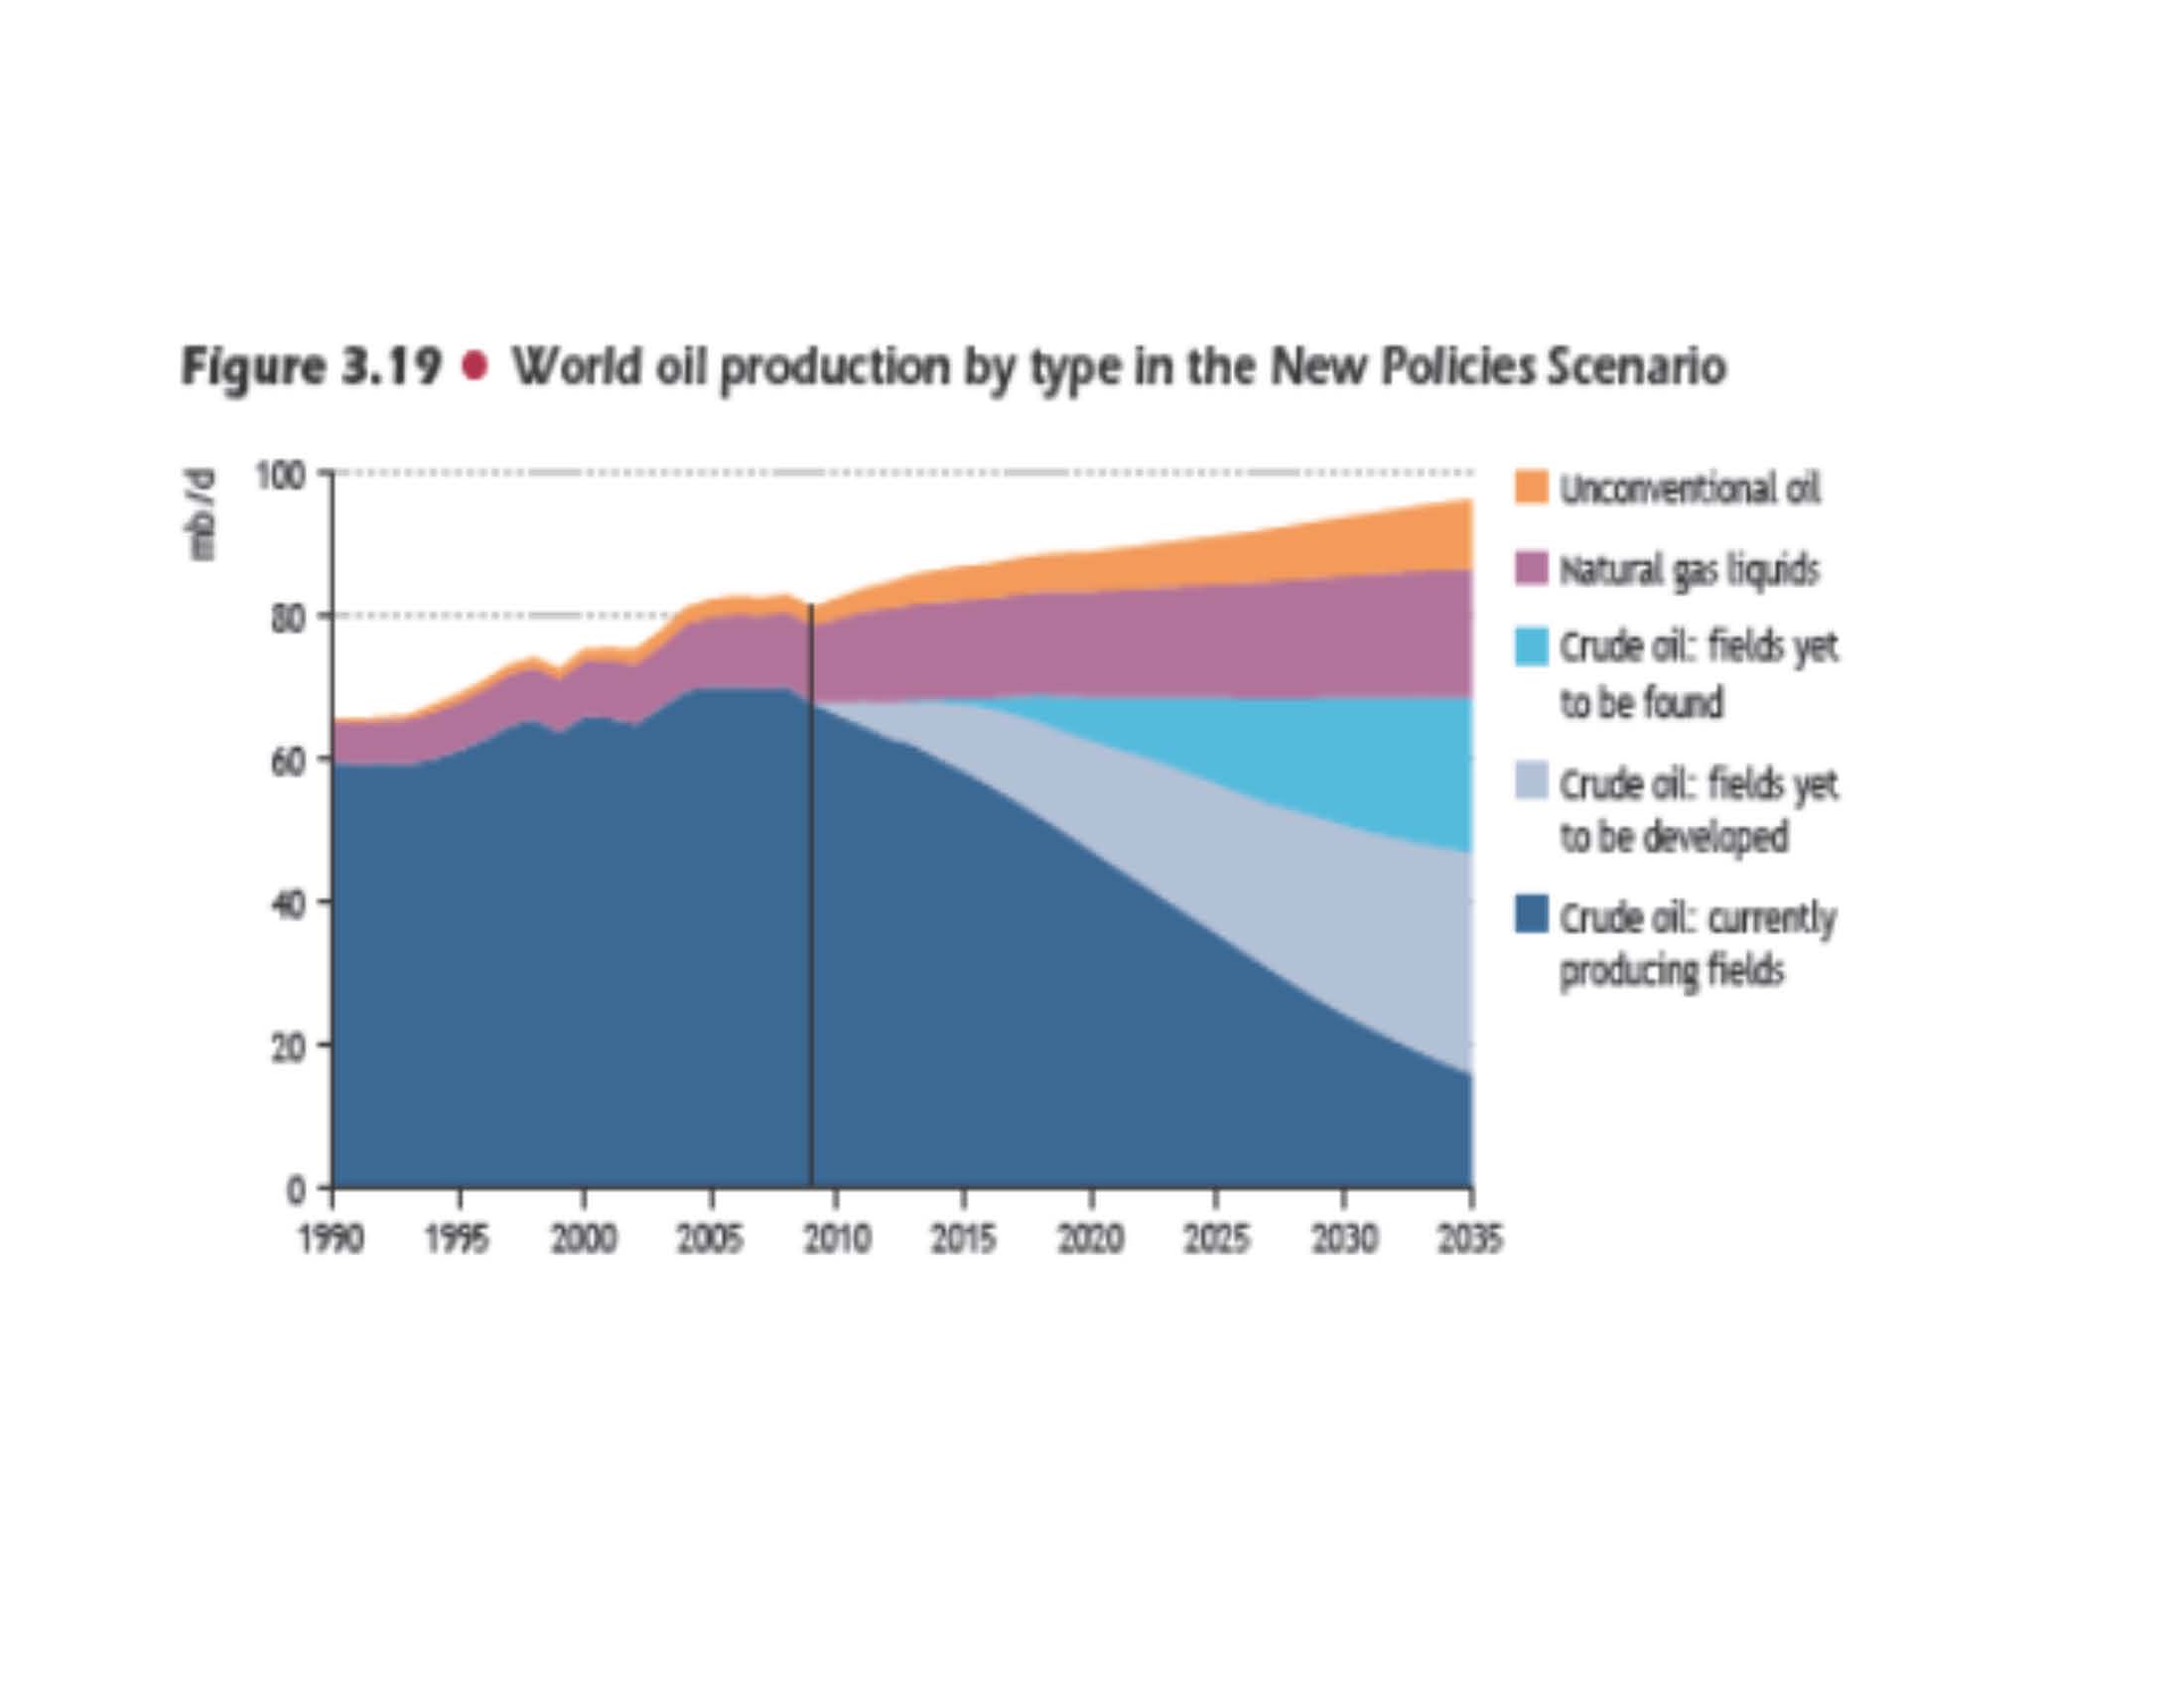
The figure predicts more than half of projected conventional capacity replacement is from fields already discovered but yet to be developed. This projection is based on the IEA inventory of discovered fields not yet in production (pp. 257-8): “Output from new conventional oilfields, not yet in production, makes the biggest contribution to compensating for this loss of capacity… The 257 billion barrels of yet-to-be-developed conventional oil reserves are distributed in 1,874 fields, 971 of which are onshore and 903 offshore” The average field from WEO 2008 table 11.2 was 103Mbbl for non-OPEC, and 203Mbbl for OPEC, both barely major. Since there are only 38 giants in this inventory, many of the other discovered but undeveloped fields are not even majors. They are minors.
Oil companies do not spend large sums discovering a field only to leave it sit fallow–except for some good reason. There are many minor isolated discoveries where adding production infrastructure isn’t economic at current oil prices. This has happened, for example, in Africa and in offshore. Since projected IEA prices don’t rise significantly above inflation, these numerous minor fields would still not be brought into production by 2035.
There are certainly major discoveries that await infrastructure construction to begin production. Prudhoe Bay waited 4 years for the Alaska pipeline. The 8 non-OPEC situations can be enumerated, and amounted to about 60% of the non-OPEC inventory. Supergiant Kashagan with 13 Bbbl was discovered in 2000. It has waited nearly 12 years for construction of the Kazakhstan-China pipeline at a cost (estimates vary wildly) between $46 and $116 billion. It comes fully on line during 2013, with planned maximum capacity reaching 1.5 mbpd in 2014 (and with planned abandonment after 2040). Similar to Prudhoe Bay. The other non-OPEC major discoveries awaiting full production in 2008 were the seven Brazilian deepwater subsalt fields found 2007/8 in the Santos and Campos basins. These fields include three supergiants (Sugar Loaf has 33 Bbbl TRR), and were all together about 62Bbbl TRR (Technically Recoverable Reserves). Since then, 26 FPSOs have been built and placed to produce about 3mbpd in 2013. 14 more are to be added by the end of 2014. These Brazilian fields will be on ‘full’ production at an estimated 4.5 mbpd by 2017. A Brazilian FPSO (Floating Production Storage Offload Vessel) is a really big, really expensive production platform/storage tank.
And then there is OPEC. OPEC stockpiles discoveries in order not to overproduce and lower the price of oil. OPEC’s share of the IEA inventory was 133Bbbl, about half. WEO 2008 (pp.273-274) gives a lot of seemingly comforting facts (pp. 273-274):
“There are more than 100 [major] onshore fields awaiting development, each holding more than 100 million barrels and with combined reserves of more than 50 billion barrels. The bulk of them are in just three countries: Saudi Arabia, Iran and Iraq. Two-thirds of those reserves are concentrated in about 30 giant fields (each holding more than 500 million barrels), including Sharar, Niban, Jaladi, Dhib and Lugfah fields in Saudi Arabia, Halfayah, Hamrin, Tuba and Ratawi fields in Iraq, and Hosseinieh, Kuskh and Kuh-I-Mand fields in Iran.”
Uh oh. 70% of the discovered/unproduced OPEC fields are only major/minor since 2/3 of their reserves are in just 30 giants.
Saudi Arabia is the most important producer. According to p. 274:
“Five major onshore projects, Khurais, Khursaniyah, Hawiyah, Shaybah and Nuayyim, which collectively hold 13 billion barrels of reserves, are all in the final phases of development and are projected to provide a total gross capacity addition of close to 3 mb/d by 2015.”
That means about 13mbpd of Saudi capacity. About confirming a 2011 wikileaked diplomatic cable that said,
“Aramco can reach 12 million b/d within the next 10 years, it will be unable to meet the goal of 12.5 million b/d by 2009. The former EVP added that sustaining 12 million b/d output will only be possible for a limited period of time, and even then, only with a massive investment program. According to al-Husseini, the crux of the issue is twofold. First, it is possible that Saudi reserves are not as bountiful as sometimes described and the timeline for their production not as unrestrained as Aramco executives and energy optimists would like to portray.” [3]
In Iraq, Halfayah (a 4.1 Bbbl giant) went into 2012 production with ultimate potential of 535kbpd. Hamrin went in production in 2003 (an IEA error) and is being expanded to 60kbpd. Tuba was producing 50kbpd by yearend 2011. Ratawi is a supergiant near Basrah with up to 10 Bbbl TRR. It was fast tracked to 250kbpd in 2012. Mismanaged Iraq produced 3.4mbpd in 2010. Iraq itself projects 5mbpd by 2015. The IEA projected 6.1mbpd by 2020. Iraq’s presently discovered but undeveloped future capacity is at most (6.1-3.4) 2.7mbpd.
In Iran, the Hosseinieh and Kuskh fields were discovered in 2000 and 2002. China bought a 20% production interest in 2004 when production was already 300kbpd—another IEA error. Kuh-i-Mand production began in 2008. Iran peaked in 1976 at 6.6mbpd. 2008 production was 3.9mbpd. 2010 was 3.7mbpd. Iran’s oil ministry forecast further decline to 2.7mbpd in 2015. [4] Additional Iranian capacity from existing discovered/undeveloped fields is a fiction.
This enumerates [1.5 (Kashagan)+4.5 (Brazil deepwater)+ 3 (Saudi Arabia maybe, 2 more likely)+ 2.7 (Iraq)+ 0 (Iran)] at most 11.7 mbpd by 2020, with little or no net additional capacity thereafter from 2010 discovered/undeveloped fields. That is only a third of the IEA fiction.
Another way to estimate discovered/undeveloped future capacity is the production to TRR ratio. The world has discovered about 2300 Bbbl of TRR. Production of crude has steadily ramped to a bit over 70mbpd per the IEA figure, or about 26Bbbl/year. That is (26/[2300-257]) about 1.3% of producing TRR per year. Alternatively, Ghawar at its 1981 peak was 5.7mbpd. Ghawar TRR (after reserve growth) originally held (65 produced plus 71 remaining in 2010) 136Bbbl TRR. The peak annual production rate from the world’s greatest oil field was (5.7*365/136000) 1.5% of backdated TRR. Annual production from 257 Bbbl of discovered/undeveloped reserves would at most ever be (257*0.015) 11mbpd, about the enumerated estimate.
The figure’s other salvation is capacity from new discoveries yet to be found. Undoubtedly some significant ones remain, for example in Brazil’s deepwater Santos basin. Others will surely come from the Arctic. Russia discovered giant Sevastyanov (1.2 Bbbl)in eastern Siberia in 2010. In 2012, Russia announced five more giant discoveries above the Arctic circle in the Yamal region (of paleoclimate hockey stick infamey). The largest, Russkoe, has about 2.25 Bbbl TRR. But even with 4 supergiants and 4 giants, the 2000-2009 average discovery was minor.
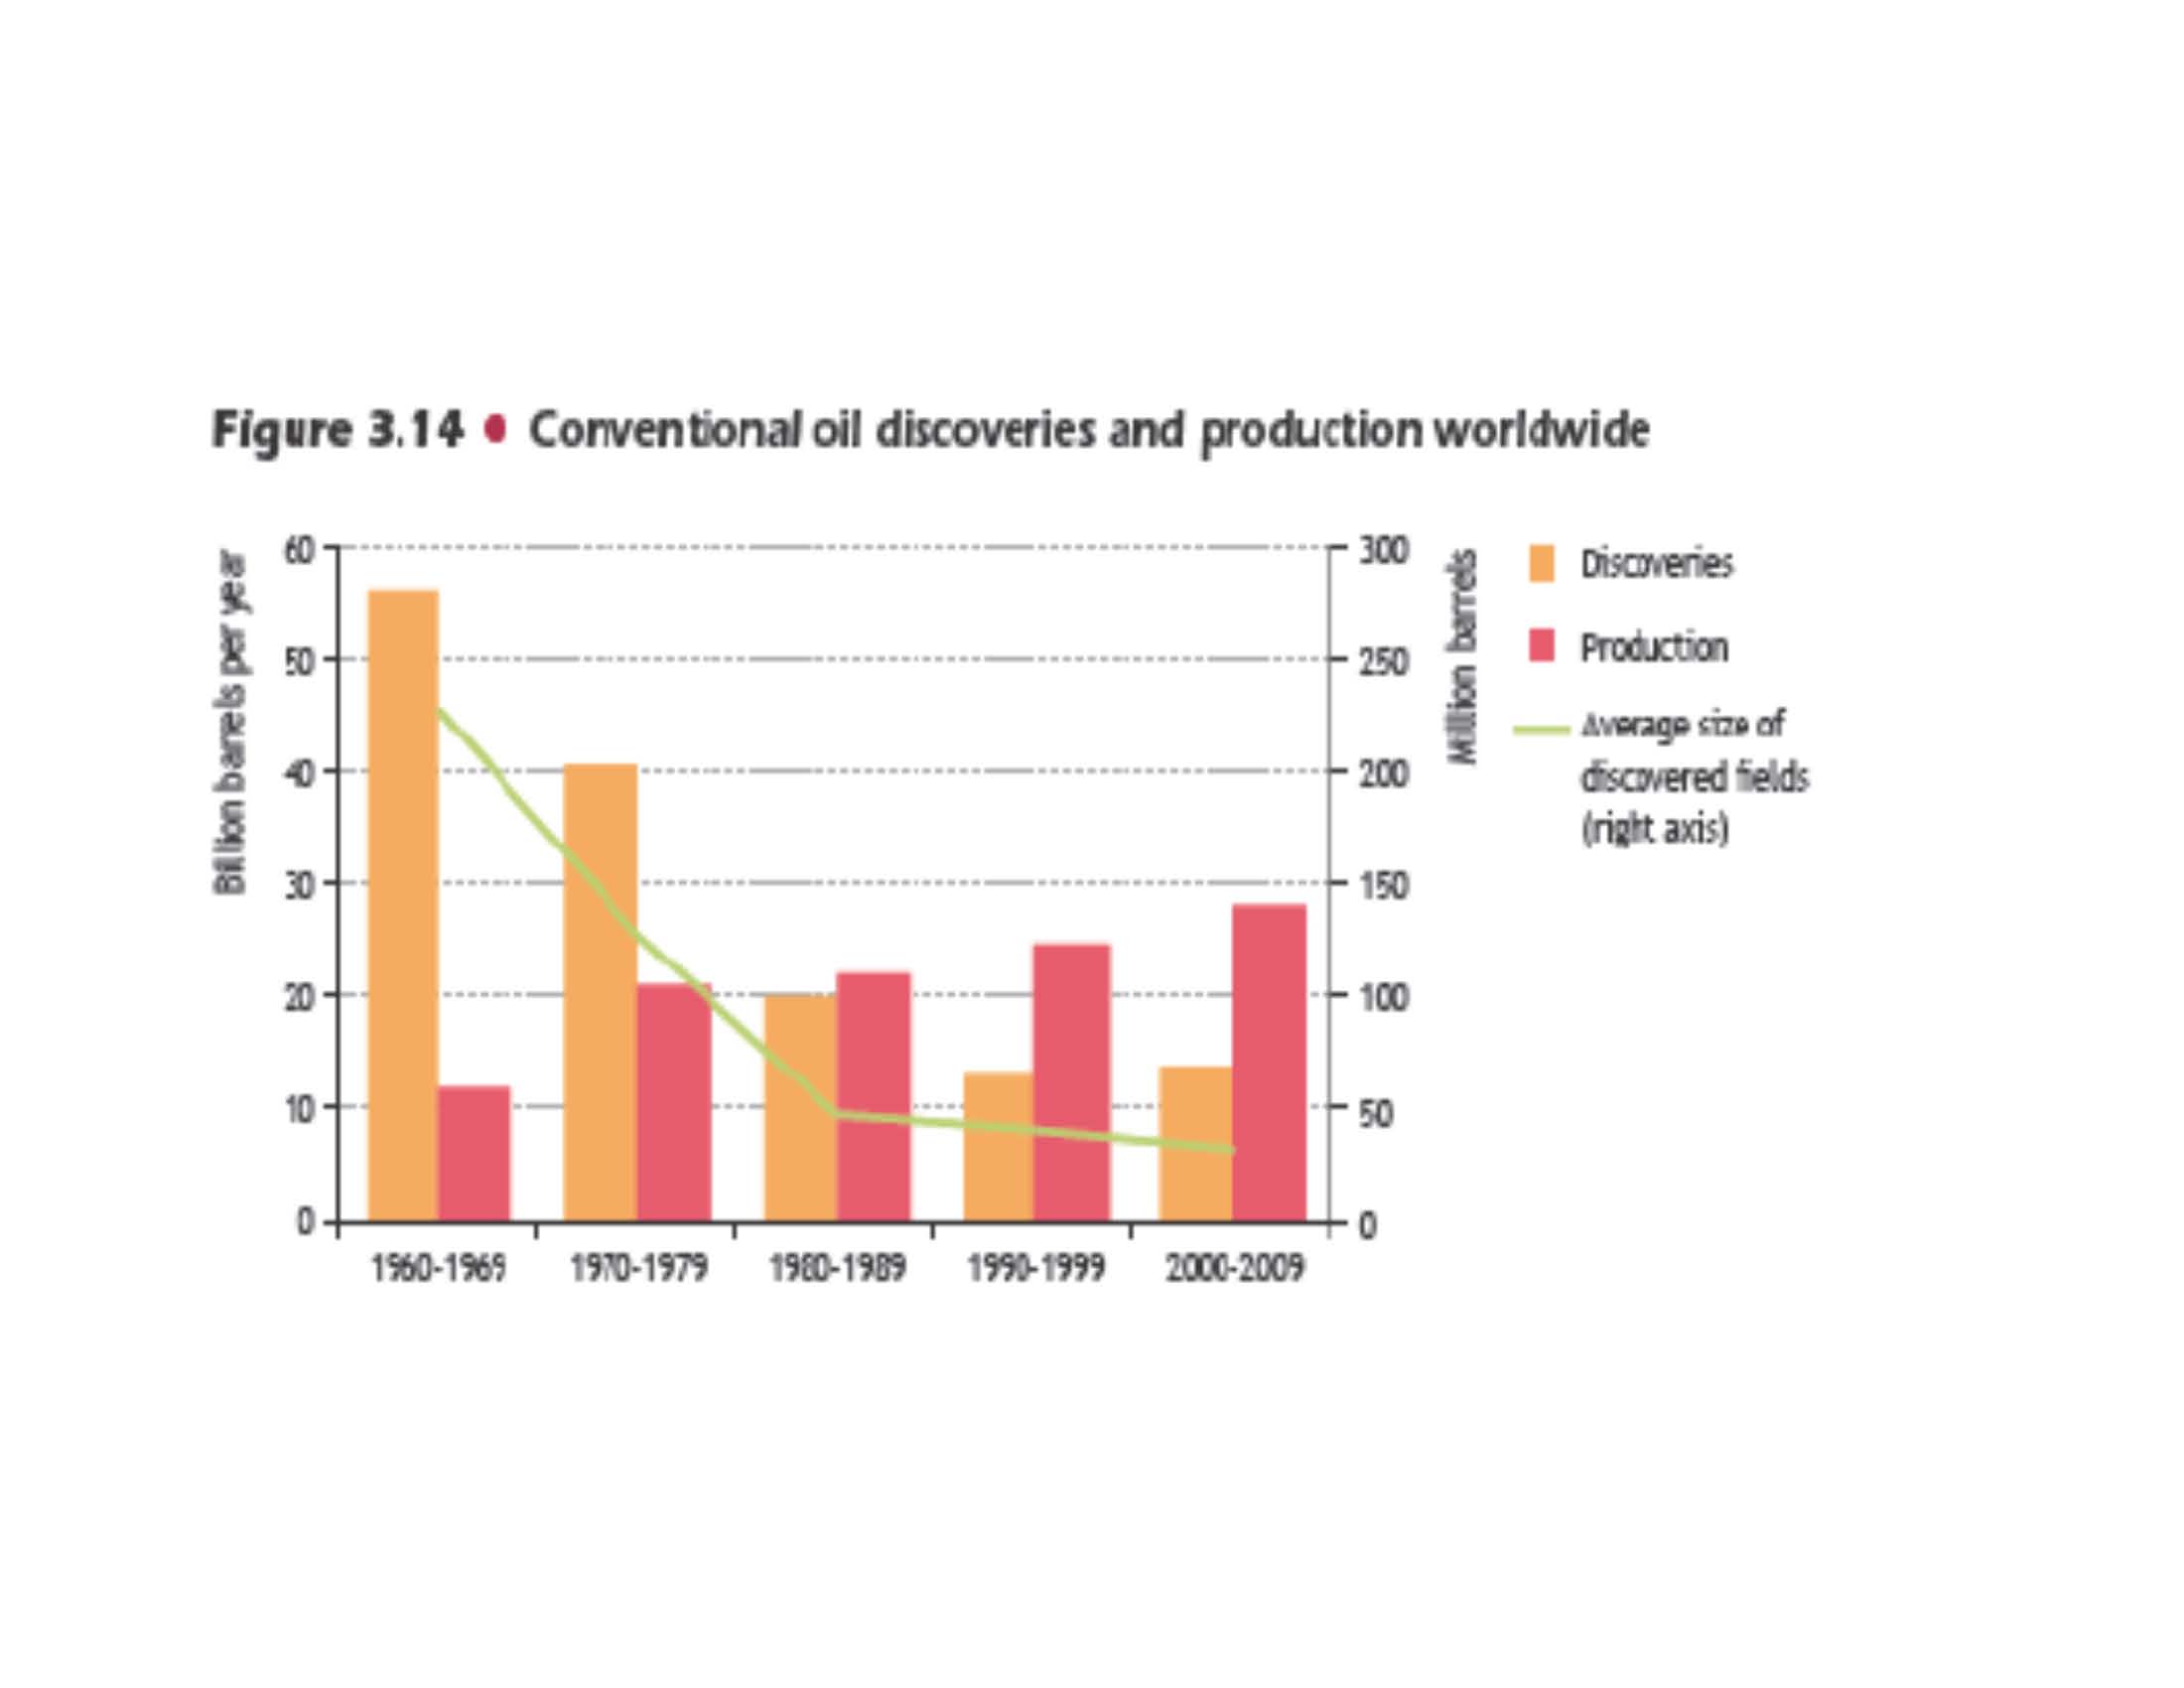
Production has outpaced discovery for three decades, and the gap has steadily increased. Figure 3.19 implies that the quantity to be discovered by 2035 will significantly exceed the past three decades, since those did not prevent existing production decline by 2008. This defies the facts of IEA’s own figure 3.14. The yet to be found miracle is worse than fiction. It is directly contradicted by IEA’s own figures in the same report.
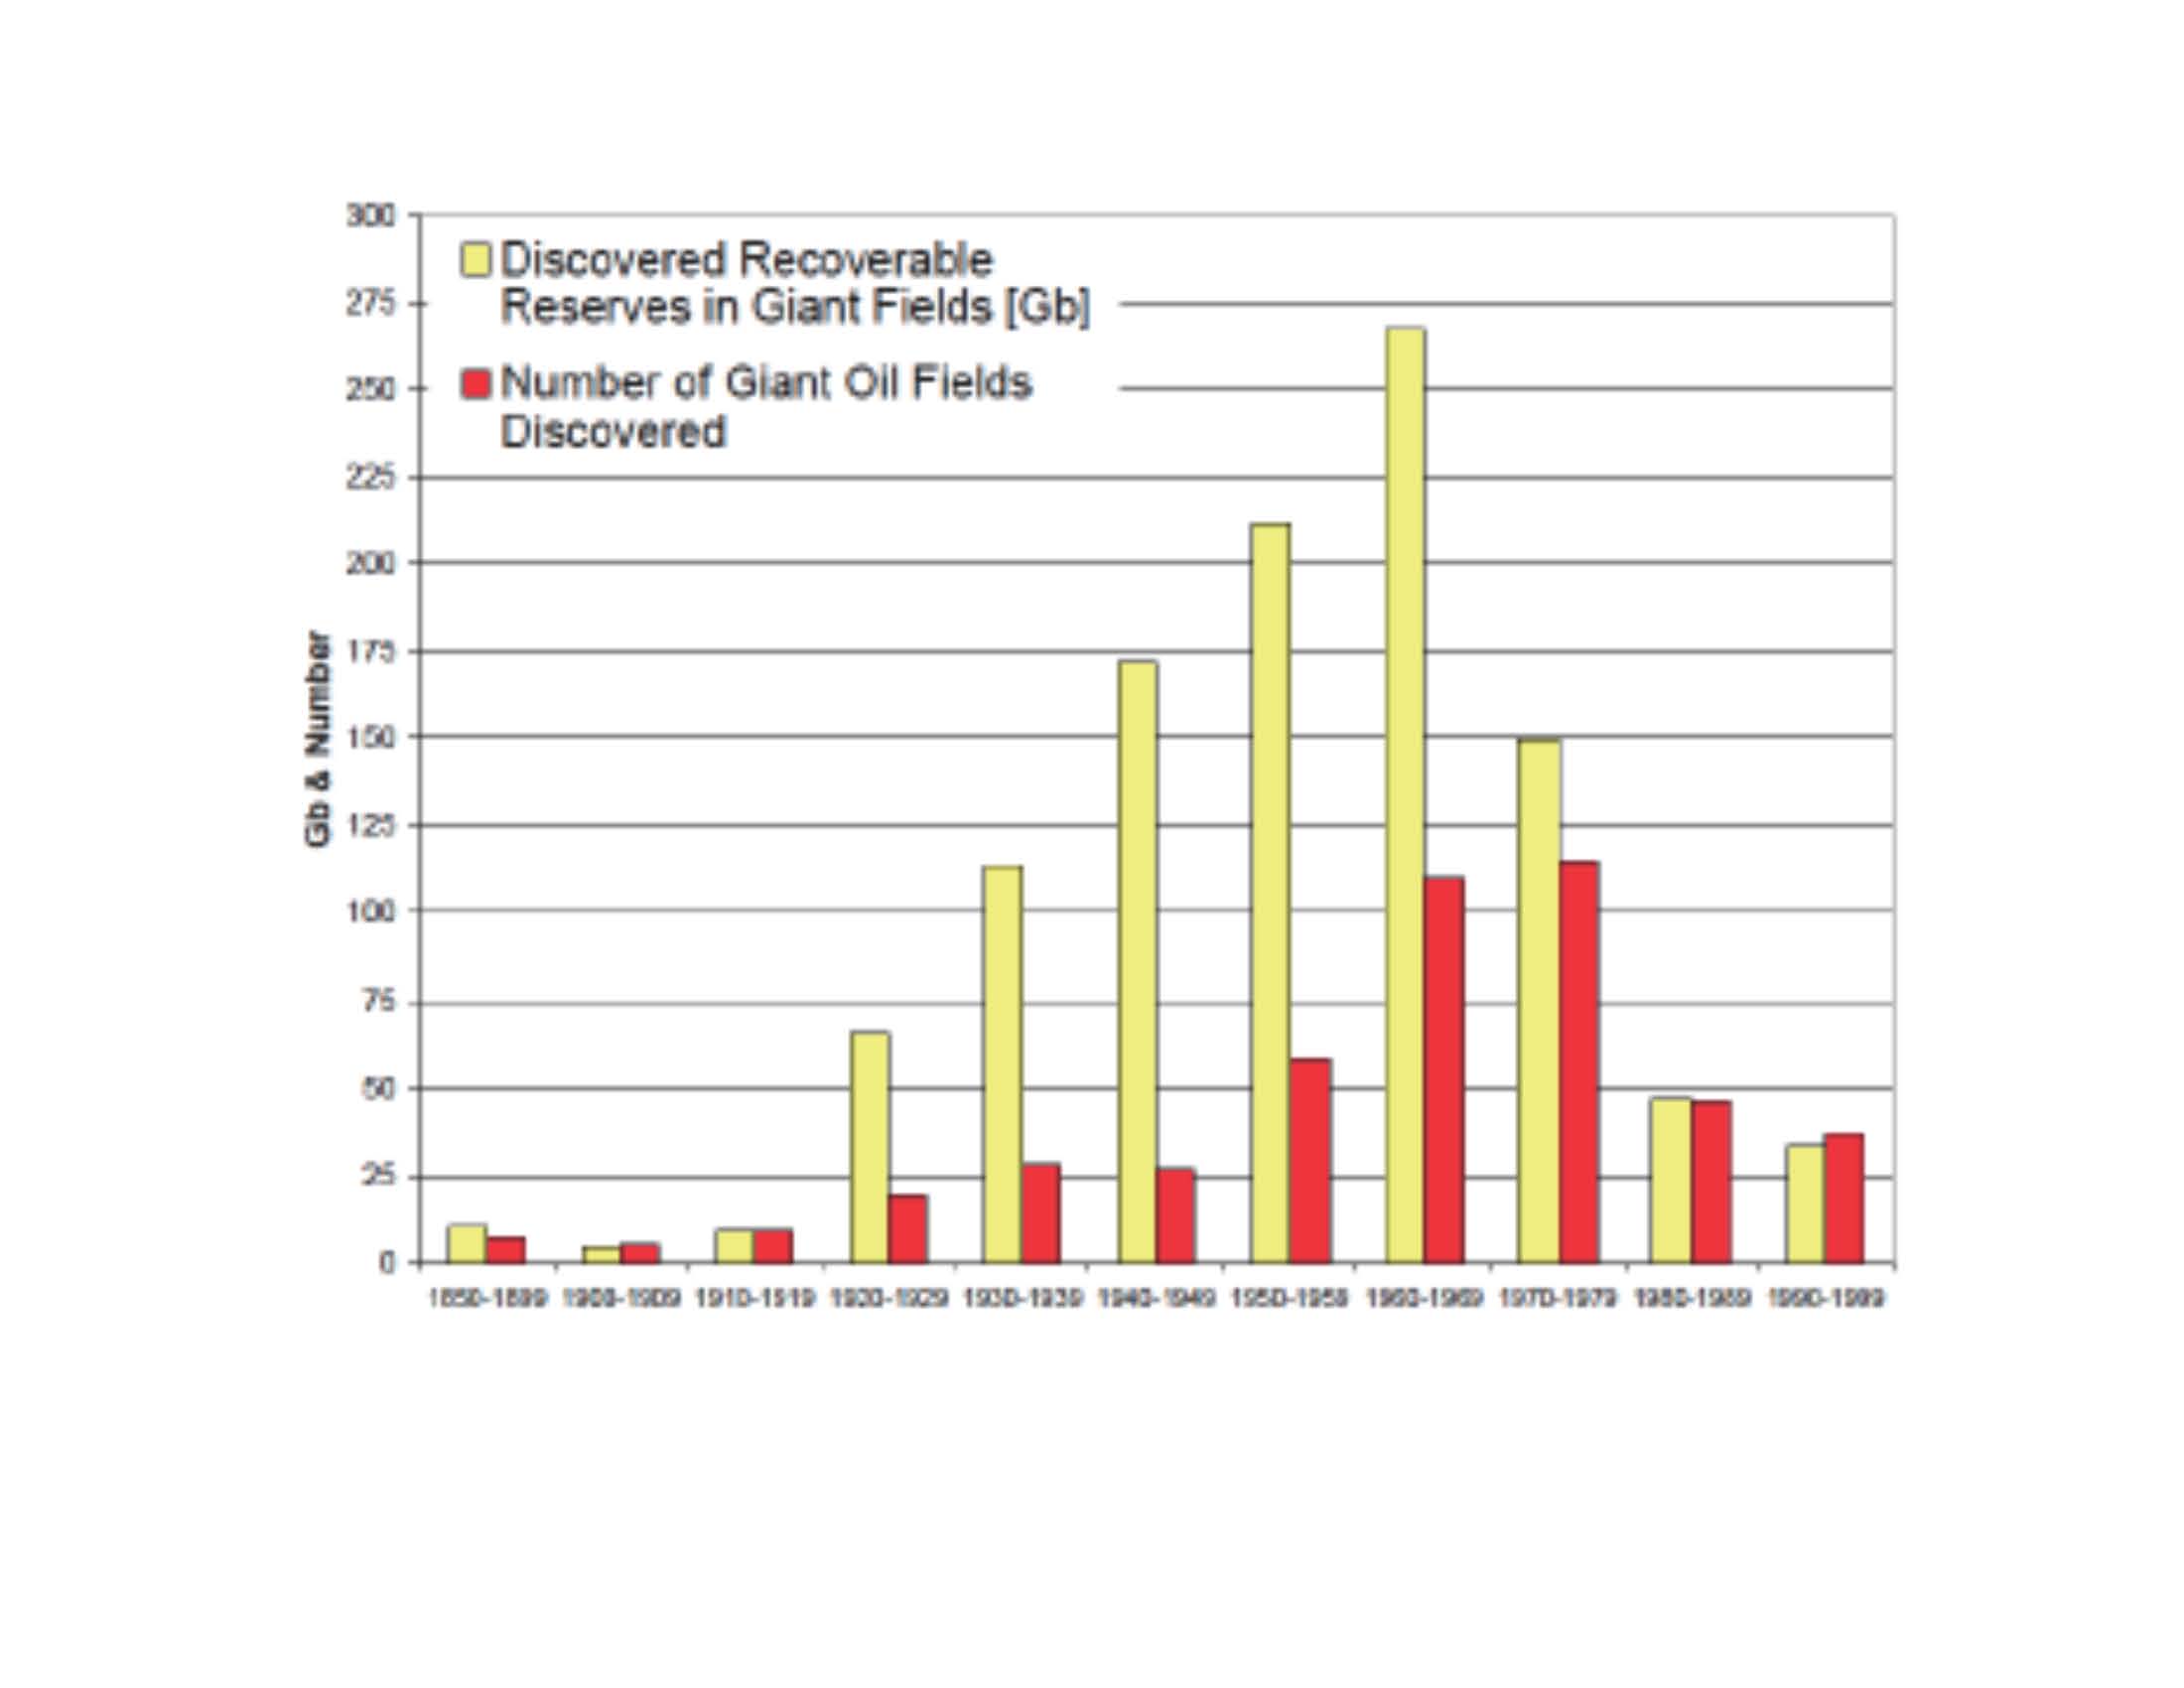
What was really going on with WEO 2010 figure 3.19? A politicized adverse reaction to WEO 2008 figure 9.4, which just summarized historical reserves and production facts that collide with IEA agendas.
FIG
Given production significantly greater than discoveries, and declining discovered quantities with increasing production, the peak can not be far away. Extrapolation suggests around 2020. The IEA’s chief economist Dr. Fatih Birol gave an interview to the UK’s Guardian [5] concerning WEO 2008 during which he explicitly confirmed this:
“In terms of the global picture, assuming that OPEC will invest in a timely manner, global conventional oil can still continue, but we still expect that it will come around 2020 to a plateau [6] as well, which is, of course, not good news from a global oil supply point of view.”
This got much attention. For example, The Economist ran a story captioned:
THE IEA PUTS A DATE ON PEAK OIL PRODUCTION.[7]
For which the IEA caught hell in 2009. And then got ‘religion’ in 2010. The 2008 scientifically based indirect peak oil projection was disappeared, replaced by comforting fictions in a prettily colored figure.
Whoever wrote the WEO 2010 peak oil box (pp.125-6) courageously summarized the fundamental conundrum despite figure 3.19’s fictions:
“But if governments do nothing or little more than at present, then demand will continue to increase, the economic burden of oil use will grow, vulnerability to supply disruptions will increase and the global environment will suffer serious damage. The peak in oil production will come then not as an invited guest, but as the spectre at the feast.”
Serious damage to the global environment from oil consumption is debatable. But it sure looks like peak oil will be the spectre at the feast.
[1] Fredrik Robelius, Giant Oil Fields, PhD thesis (2007), Uppsala University Department of Earth Sciences.
[2] Benes et. al., The Future of Oil: Geology versus Technology, IMF working paper WP/12/109 released May 2012
[4] Tehran Times 9/25/12 quoting Deputy Oil Minister Mohsen Khojasteh-Mehr. 12 new fields have been discovered since 2010. Total capacity could be 5.6mbpd by 2015 if these are developed at a cost of $32 billion. This depends on a resolution to the present nuclear sanctions. 1.3mbpd would be from ‘shared’ offshore fields in the Gulf. Iranian territorial production would be 4.3mbpd. Either way, it is still well below the past peak.
[5] Guardian’s Monbiot The online 12 minute video clip concerning this interview is rewarding.
[6] WEO 2008 (p. 235) makes a subtle distinction between post peak and post plateau. Plateau is defined as post peak, up to a 15% absolute decline. Post plateau production is less than 85% of peak. Plateau fields declined 1.4% annually. Post plateau fields declined up to 6.7% annually. The overall production weighted average annual decline was 5.1%, so most large fields are post plateau. See WEO 2008 table 10.11. This confusing distinction ‘hides the decline’ in a post peak ‘plateau’ with a downward slope.
JC comment: This post is a guest post that was stimulated by Rud Istvan’s previous post on Maggio and Cacciola’s paper, When will oil, natural gas, and coal peak?