
by Judith Curry
Introduction and context for a new Climate Etc. series on sea level rise.
I have several clients that are interested in the issue of sea level rise, from a range of perspectives (insurance, engineers, city and regional planning, liability). I am preparing a comprehensive assessment of the topic, with a focus on sea level rise in the U.S. I will be posting draft chapters on the blog for you to critique. I am also hoping that crowdsourcing will help me identify additional resources and information.
I’m envisioning the following outline, with each chapter comprising a separate blog post:
- Introduction and context
- Global sea level rise – observations and causes
- US coastal sea level rise – observations and causes
- 21st century predictions of global sea level rise
- Regional, decadal projections
- Hurricanes and storm surge
Introduction
The popular discourse on the threat of sea level rise includes these recent, dire statements:
“That’s the big thing – sea-level rise – the planet could become ungovernable.” – Dr. James Hansen, former Director, NASA GISS [link]
“We’re talking about literally giving up on our coastal cities of the world and moving inland.” – Dr. Michael Mann, Penn State [link]
Substantial sea level rise that happens quickly, or over a year, is difficult and costly to address. Sea level rise near the end of the century that affects a tiny percentage of the land area of a country, even with a large percentage of population living there today, can be a relatively minor problem if it is managed appropriately.
So, exactly what is the magnitude of the problem that we are facing with regards to sea level rise?
At issue:
- the rate of global sea level rise – how much will sea level rise?
- natural versus anthropogenic causes of sea level rise – what proportion of the sea level rise can policies potentially prevent?
- the role of land use in local sea level rise – what land use policies can ameliorate the situation?
This chapter provides an overall context for understanding the magnitudes of sea level rise that are being discussed with regards to anthropogenic global warming.
Sea level rise assessments
To put the alarming statements by Jim Hansen and Michael Mann about future sea level rise into context, first consider the conclusions regarding sea level rise from the IPCC Assessment Reports.
First Assessment Report (1990):
Under the IPCC Business As Usual emissions scenario, an average rate of global mean sea level rise of about 6cm per decade over the next century (with an uncertainty range of 3 – 10cm per decade). The predicted rise is about 20cm in global mean sea level by 2030, and 65cm by the end of the next century.
Second Assessment Report (1995):
Over the last 100 years global sea level has risen by about 10 to 25 cm, based on analyses of tide gauge records.
For IS92a, the sea level rise by 2100 is 49 cm. Also taking account of the ranges in the estimate of climate sensitivity and ice melt parameters, and the full set of IS92 emission scenarios, the models project an increase in global mean sea level of between 13 and 94 cm.
Third Assessment Report (2001):
Tide gauge data show that global average sea level rose between 0.1 and 0.2 metres [10 and 20 cm] during the 20th century.
Furthermore, it is very likely that the 20th century warming has contributed significantly to the observed sea level rise, through thermal expansion of sea water and widespread loss of land ice. Within present uncertainties, observations and models are both consistent with a lack of significant acceleration of sea level rise during the 20th century.
Global mean sea level is projected to rise by 0.09 to 0.88 metres [9 to 88 cm] between 1990 and 2100, for the full range of SRES scenarios.
Fourth Assessment Report (2007):
Global average sea level rose at an average rate of 1.8 [1.3 to 2.3] mm per year over 1961 to 2003. The rate was faster over 1993 to 2003: about 3.1 [2.4 to 3.8] mm per year. There is high confidence that the rate of observed sea level rise increased from the 19th to the 20th century. The total 20th-century rise is estimated to be 0.17 [0.12 to 0.22] m.
The global average rate of sea level rise measured by TOPEX/Poseidon satellite altimetry during 1993 to 2003 is 3.1 ± 0.7 mm yr–1. Whether the faster rate for 1993 to 2003 compared to 1961 to 2003 reflects decadal variability or an increase in the longer-term trend is unclear. The tide gauge record indicates that faster rates similar to that observed in 1993 to 2003 have occurred in other decades since 1950.
Projections for global sea level rise for the period 2090-2099 range from 0.18 to 0.59 m, across all emissions scenarios.
Fifth Assessment Report (2013):
The rate of sea level rise since the mid-19th century has been larger than the mean rate during the previous two millennia (high confidence). Over the period 1901–2010, global mean sea level rose by 0.19 [0.17 to 0.21] m [17 to 21 cm].
It is very likely that the mean rate of global averaged sea level rise was 1.7 [1.5 to 1.9] mm yr– 1 between 1901 and 2010, 2.0 [1.7 to 2.3] mm yr–1 between 1971 and 2010 and 3.2 [2.8 to 3.6] mm yr–1 between 1993 and 2010. Tide-gauge and satellite altimeter data are consistent regarding the higher rate of the latter period. It is likely that similarly high rates occurred between 1920 and 1950.
It is very likely that there is a substantial anthropogenic contribution to the global mean sea level rise since the 1970s.
Global mean sea level will continue to rise during the 21st century. Under all RCP scenarios the rate of sea level rise will very likely exceed that observed during 1971–2010 due to increased ocean warming and increased loss of mass from glaciers and ice sheets.
Global mean sea level rise for 2081−2100 relative to 1986–2005 will likely be in the ranges of 0.26 to 0.55 m for RCP2.6, 0.32 to 0.63 m for RCP4.5, 0.33 to 0.63 m for RCP6.0, and 0.45 to 0.82 m for RCP8.5 (medium confidence).
Based on current understanding, only the collapse of marine-based sectors of the Antarctic ice sheet, if initiated, could cause global mean sea level to rise substantially above the likely range during the 21st century. However, there is medium confidence that this additional contribution would not exceed several tenths of a meter of sea level rise during the 21st century.
NOAA Technical Report on Sea Level Rise Scenarios (2017)
A recent NOAA Technical Report has developed sea level rise scenarios for the United States. The Report considered 6 sea level rise scenarios from 0.3 m to 2.5 m by 2100. Excluding the unrealistic RCP8.5 emissions scenario, the probability of exceeding a 1 m sea level rise is 3% or less.
Causes of sea level variability and change
The IPCC Assessment Reports have been fairly consistent with predictions of likely sea level rise of ~ 1-2 feet by 2100, caused by anthropogenic global warming.
To put a 1-2 foot increase in global sea level by 2100 into context, consider the following natural variations in sea level:
- The typical tidal range in the open ocean is about 0.6 meters (2 feet). Coastal tidal ranges vary from 0 to over 11 meters (38 feet). [link]
- Storm surges from hurricanes or intense midlatitude storms can reach 30 ft [link]
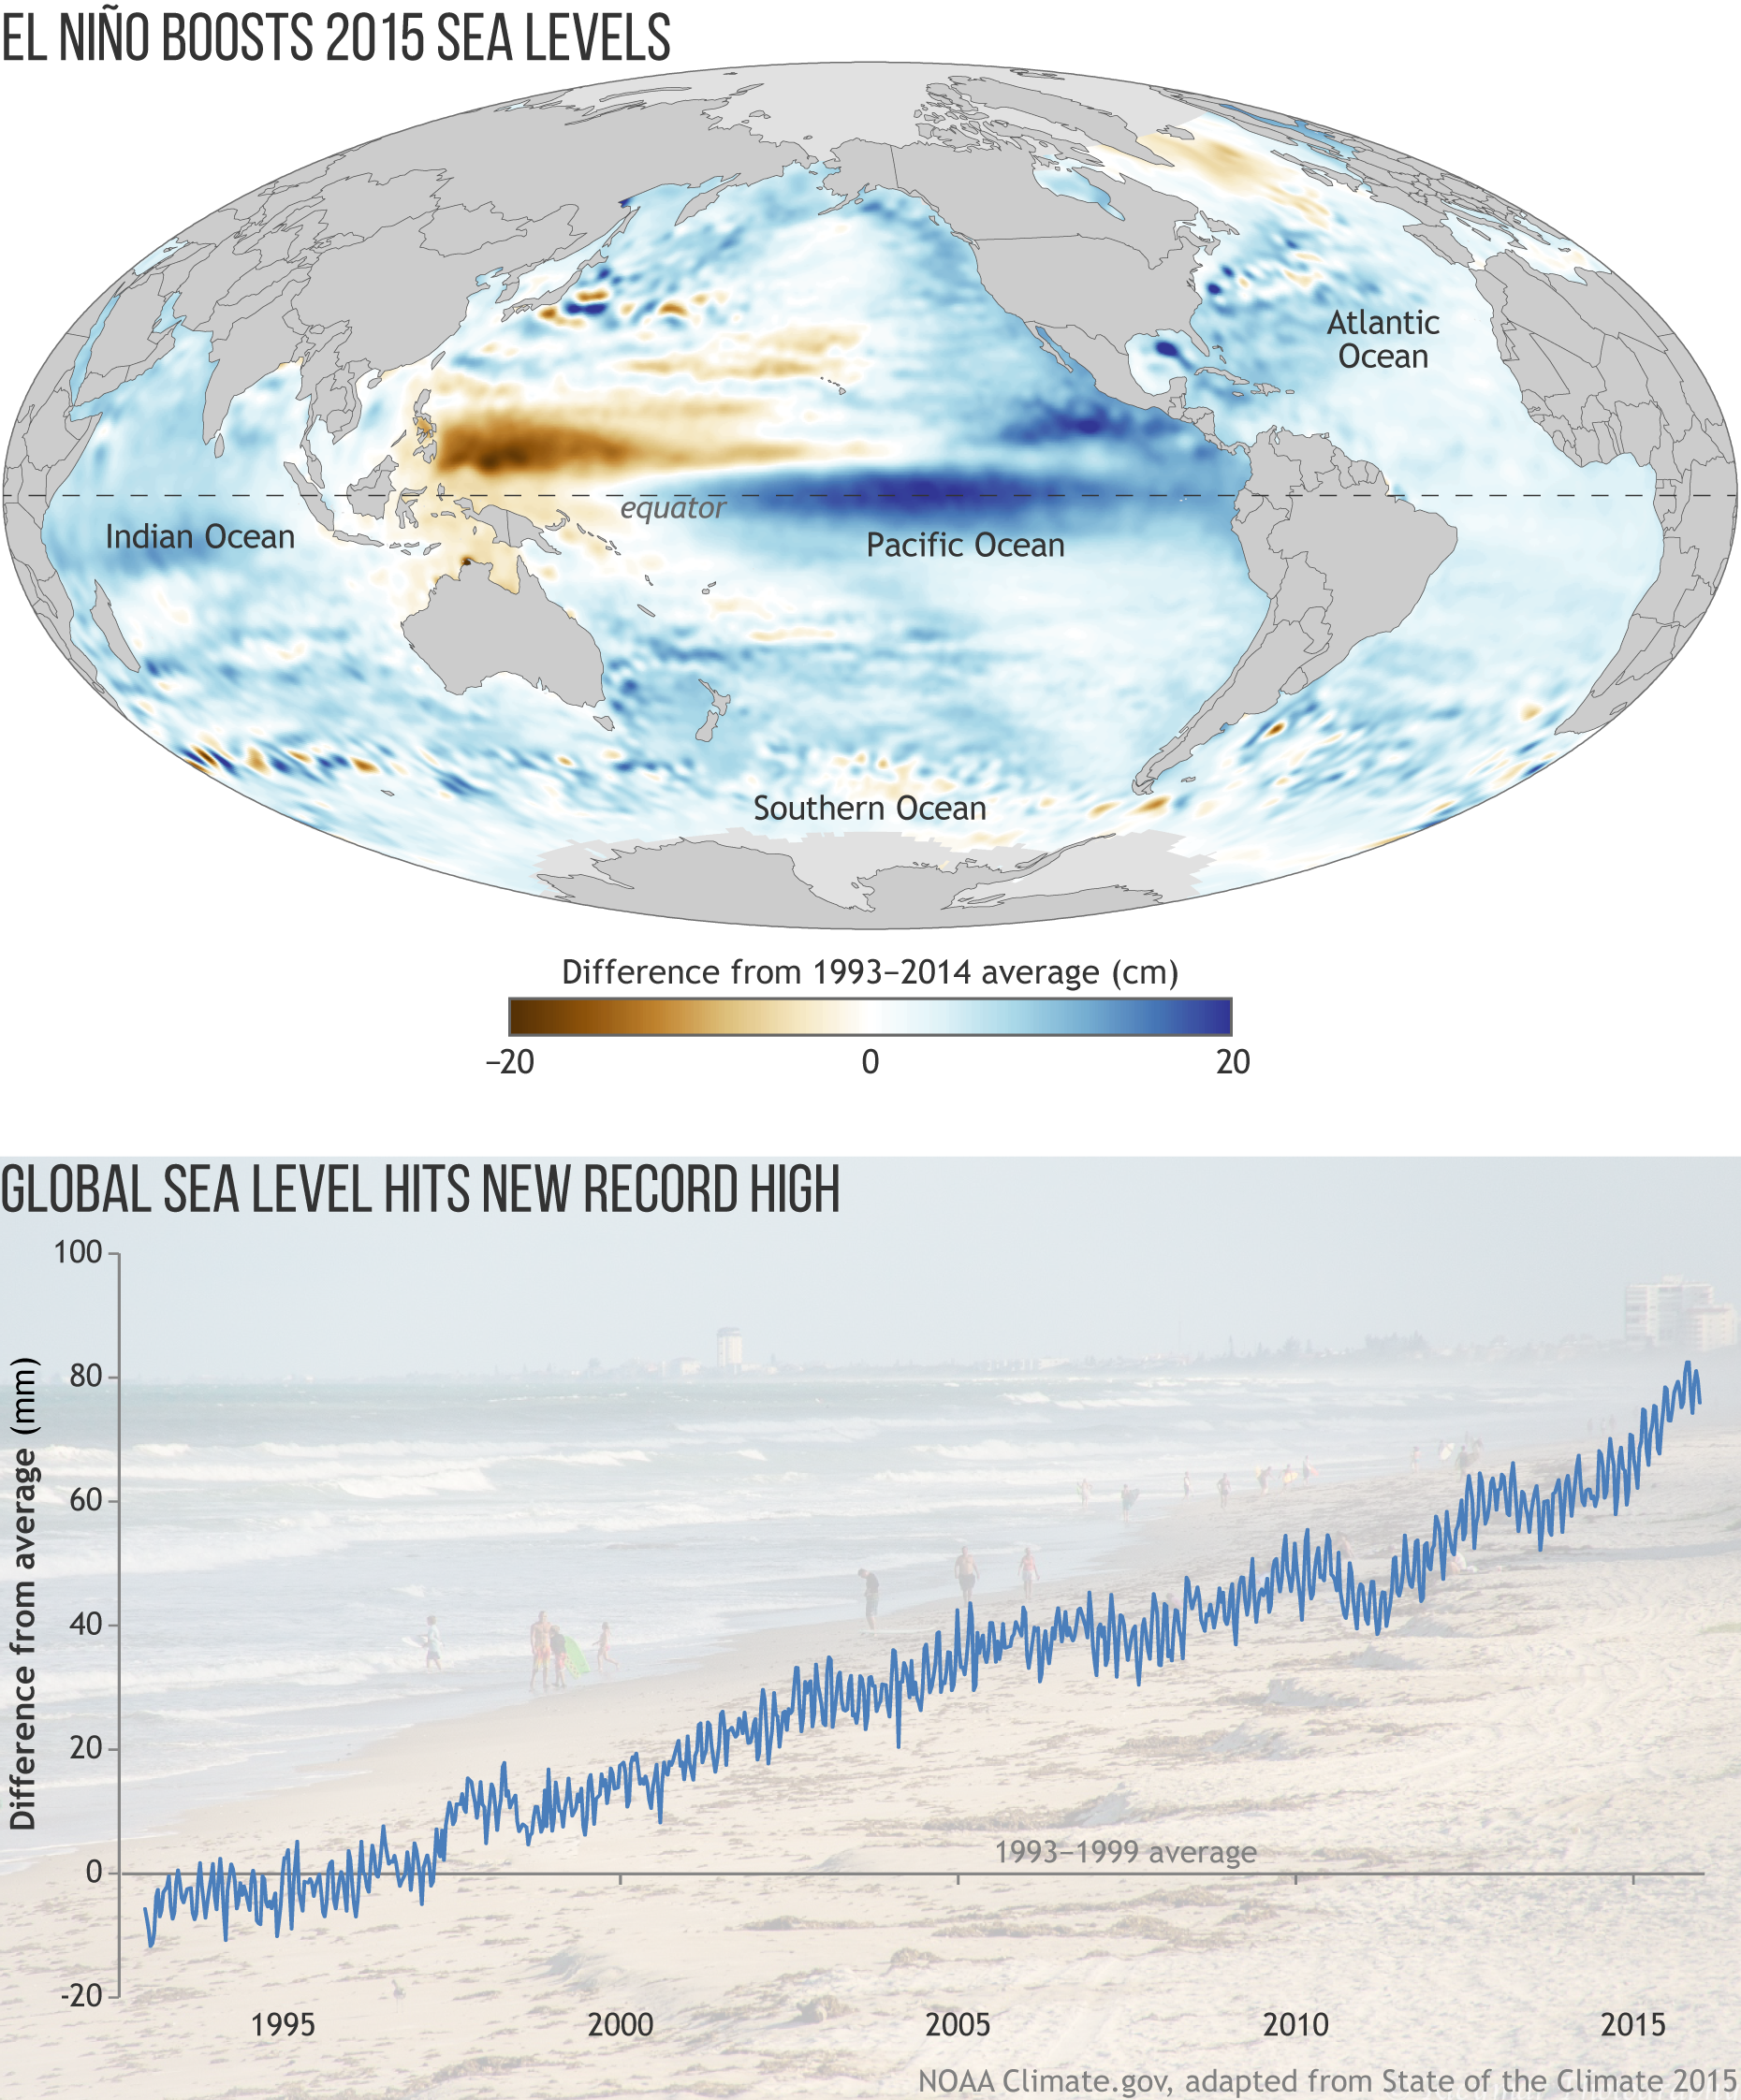
- Regional variability in sea level associated with large-scale ocean circulations, with magnitude +/- 20 cm since 1993. [link]
- Geologic subsidence – tectonic subsidence in the wetland regions of Texas, Louisiana, Mississippi and Alabama is the major component of local sea level rise in regions without local petroleum extraction. [link]
In terms of local sea level rise, land use practices can contribute substantially to local sea level rise:
- Local sea level rise in Texas, Louisiana and regions of the Mid-Atlantic coast far exceed the global average rate of sea level rise, by a factor of 2 or 3 [link]
- Groundwater extraction and petroleum extraction – regions in Houston have sunk as much as 10 feet since 1920 [link]
- Reduced sediment flow in rivers from levees build to reduce flooding – Louisiana has lost substantial land mass from river engineering, contributing to local sea level rise [link]
Even if it is assumed that 100% of the recent global sea level rise is caused by anthropogenic sea level rise (an assumption that will be examined in Part II), local sea level rise can be dominated by ocean circulation patterns, land use practices and astronomical tides.
The coupling of the sea level rise problem and its solutions with anthropogenic global warming and emissions reductions is unfortunate. Even if one accepts the IPCC and NOAA predictions of 21st century sea level rise, emissions reductions will have little or no impact on the course of sea level rise this century (Part IV).
And in many locations, even if were somehow successful at reducing/eliminating the component of sea level rise associated with anthropogenic global warming, this would address only a small fraction of local sea level rise in many of the most vulnerable locations.
The focus on emissions reductions as some sort of solution to sea level rise (apart from any determination of cause) is distracting from developing better land use policies and coastal engineering practices.
Stay tuned for Part II: Global sea level rise – observations and causes
JC note: I look forward to your comments and would appreciate any constructive suggestions and particularly good reference material (the blog post is loosely referenced at this point).


Reblogged this on ClimateTheTruth.com.
Dr Curry: in the past I had to work on the design basis for coastal structures and we focused on storm surge and potential risks from having more open water (could be a problem in the Arctic), melting permafrost causing land loss, etc. In a few cases we were concerned with periodic high tides getting worse over time, but the key risk always came down to storm surges plus storm waves, which can theoretically get worse if regional wind patterns shift.
This isn’t my specialty, I only had to sort out the expert advice and make sure we were prepared to deal with future problems in a high cost environment.
Agreed this is problem in arctic due to coastal destruction from increased wave action (independent of global sea level rise)
fernandoleanme and Judith ==> When I last looked at this problem with an Alaskan site, I found that the town was built on a gravel bar in a river delta open to the sea on one side. Even under unchanged climate and sea level conditions the town site could only have been considered “temporary” on the decadal and century scale. Warm winters lessened sea shore ice which normally protected the sea edge of the town from winter storm surge and waves. Warm winters and springs allowed snow melt waters to increasingly erode river edges normally frozen.
A complex problem for a poorly chosen site.
Kim Hansen: Unfortunately the typical response is to lobby Washington to pay $200 million to build sea defenses on sinking land, and they seem to get it.
I was watching an old German TV documentary about Tarawa a few days ago, it was sad to see how the natives have been destroying the shoreline, on top of the destruction caused by the Japanese in WWII as they hardened the island to withstand a US invasion. The place is a poster for habitat destruction and overpopulation, but the documentary focused on blaming sea level rise. I pulled up the satellite data for that pacific sector and sea level oscillates, but it barely rises. But their government is very focused on blaming sea level rise for what is clearly a tragedy of war, destruction, overpopulation, enviromental degradation, and neglect.
An historical perspective is always useful. Mankind has always lived by the sea. How much sea level rise has mankind had to cope with since the last Glacial Maximum?
In past inter glacials sea levels must have risen. What emprical evidence is there indicating how much more rise we should expect before we reach stability then slow lowering as we progress to the next Glacial Maximum.
It would much more interesting to address the more important issue as it relates to the planet’s oceans; the changing chemistry of the of the water. Any rise or fall in absolute sea level will be a minor side effect of climate change if the chemical balance of the oceans reaches a tipping point. Depleted oxygen levels, toxic algae, exploding jellyfish populations are a threat to the entire biosphere and will be much harder to deal with than relocating a few million humans.
http://science.sciencemag.org/content/359/6371/eaam7240
So what’s the scientific definition of sea level again?
Andrew
Bottom line, sea level is rising and the rate appears to have increased but there is significant uncertainty regarding predicting future rates and thus sea level estimates for the next 50-100 years are problematic. If the rate of sea level rise would double, for example, over the next century from the current satellite estimates, we would expect a total sea level rise of roughly about 1.2-1.4 ft. by 2100.
Fred Pickhardt
One of the water level rise consequences I have seen, and with a 150+ years of records, has been observed in the Great Lakes. Within a very short time (22 yrs), the recorded minimum (1964) and maximum (1986) GL levels suggested to me that models and predictions of water levels made by the Army Corps of Engineers (ACE) (Detroit District) have been consistently wrong. The stated 1% refreshing of GL water does not seem to apply because it is model based. GL watershed precipitation, including rain and snowfall are the dominant determinants of GL water levels. Ice cover, which has been thought to be paramount in reducing evaporation has not been the major driver as some U of Mich (Overpeck) and ACE publications state. The 2015-2016 winter was “mild” with very little ice cover. The water level of the GL for 2017 was between one to three feet (depending on which GL selected) above the water level for 2016 which itself was 1 foot above chart datum. The projected GL water levels for 2018 are being modeled and projected to be at least 6 inches to 1 1/2 feet above the 2017 values. Right now we in the Great Lakes Region have very cold Arctic weather and ice cover for all of the GL is running about 2 to 4 weeks ahead of October projections and the historic ice cover for the Great Lakes.
Now to my point: land and sea precipitation is important to quantify as it relates to sea level rise. I am sure that thermal expansion and glacier melting are very influential for sea level. However, if one observes river flows into the oceans, these rivers are likely another source of sea level rise that are modeled and not measured.
References about land surface water contribution to sea level rise usually reference the IPCC, and those references mostly referencing model runs and intoning CO2 causation of surface air heating.
“A deeper understanding of sea level rise” June 20, 2016 Phys. Org.
I remember an extensive report on sea level rise prepared by the gwpf. There is a detailed study of sea level along the Dutch coast as well, unfortunately in Dutch.
I always found it interesting that we are currently 120 meters higher than we were 20,000 years ago. Looking at the average over that 20,000 years, it is 6 mm per year – which is about twice the current rate. So the current rate of around 3 mm per year is really not unnatural or out of the ordinary at all. It puts the current SLR into perspective (I think).
Sea level rise since the LGM has been far from linear.
https://geosciencebigpicture.files.wordpress.com/2018/01/post-glacial_sea_level.png
That meltwater pulse A is suspiciously close to the rise of Clovis culture in North America. We need to develop very high frequency seismic tools to look at the sea floor in about 110 to 120 meters water depth. It must be full of good sites.
Pluvial lake edges are plumb full of sites. It’s a lot easier than scuba.
“Global mean sea level rise for 2081−2100 relative to 1986–2005 will likely be in the ranges of… …0.32 to 0.63 m for RCP4.5, 0.33 to 0.63 m for RCP6.0…”
This is the path I took above, about 2.3 inches per decade. Middle of the road. Something versus nothing. Value in many cases with planning and implementation. Something to be able to say that, we did something.
Wrong units for “Projections for global sea level rise for the period 2090-2099 range from 0.18 to 0.59 cm, across all emissions scenarios.” ? Shouldn’t that be 0.18 to 0.59m? I wouldn’t worry too much about a 0.59 increase!
thx for spotting that!
Its about 3mm/year 30mm/decade = 3cm = 0,03 m. ( 0.018 to 0.059m) Your one decimal place too high. Its only 3 cm per decade, not 30 cm. That would be really alarming!
correction: Its the “projection” for the future 2090 to 2099. I am not sure that it will turn into reality!
Policymakers options:
Add renewable energy using solar and GHG reducing transportation options. Reduce GHG emissions using most options available to the governmental entity or company.
Go out and build a seawall when applicable. Look at local area and on onsite precipitation run-off problems. Reinforce building resiliency for extreme weather possibilities.
The 2nd set of responses above seem more defensible as delivering value to those closest to the entity.
In my paper on Pacific Island climate change (
http://www.searchanddiscovery.com/pdfz/documents/2016/70217klein/ndx_klein.pdf.html(
I listed the following causes of sea level changes in Guam
1). Tectonic Uplift – Crustal Density contrast; isostasy 2). Hydro-isostasy due to adding water to oceans from melting glaciers. 3). Thermal subsidence (crustal cooling). 4). Glacial melting. (NEW FINDING: Significant Greenland ice melting due to thermal hot spot) 5). 60- Multi-Decadal Cycles (Gervais, 2016) – Gleissberg Cycle (?)
Guam is in a tectonically active area of the Mariana Trench complex and in any evaluation of global sea level, tectonics must be factored in. I’m sure you know this but the IPCC seems to down play it.
Guam is in a tectonically active area of the Mariana Trench complex and in any evaluation of global sea level, tectonics must be factored in. I’m sure you know this but the IPCC seems to down play it.
George Devries Klein, PhD PG, FGSA
Dr. Klein – what’s this about “thermal subsidence”? Is this peculiar to Guam or is it a global phenomenon? What is the approximate impact on slr?
Forgive my ignorance but this is new to me.
When the earth’s crust cools, crustal density increases, and the crust subsides (sinks). It is a common phenomenon in mid-ocean ridges, areas of high crustal heat flow, and volcanic areas.
George Devries Klein, PhD, PG, FGSA
OK thanks.
Judith
For sea levels to have been ‘ rising for millennia’ seems to deny the idea of warm periods and cold periods, during which water is locked up in such periods as the little ice age or melts and expands in such periods as the MWP. This broadly coincides with the advance and retreat of glaciers that have been well documented in such books as ‘ times of feast times of famine.’
This variation has also been documented in a number of graphs, several of which I referenced in the extended version of my article ‘ historic variations in sea levels’
This information relates to Britain and Europe during Roman times onwards, but includes medieval castles with sea entrances now high and dry due to sea level changes, not land height changes. This latter aspect often being of far greater importance than any sea level change due to more water in the system or thermal expansion.
Various people recorded the jump in sea levels around the 12th century and this is recorded in Dutch material also.
Perhaps the US is different, but sea level rises and falls, there is, as far as I can determine, no monotonic rise that justifies the comment ‘has been rising for millennia’ who are you citing for that?
None of this is to deny the need for adequate defences to be built. Look to the past to prepare for the future. sea level is generally rising, as has happened in the past and storms will get worse, as has happened in the past.
What is different this time round is that there are many more people living round the coast than in the past, who will demand that their family and their property is protected.
People will build in the most stupid of places. There needs to be much firmer legislation to prevent this, or at the least they should not expect to be protected out of the public purse.
Tonyb
Tonyb
stay tuned for Part II. But basically, there has been overall sea level rise (not monotonic) for > 10,000 years
Judith
But that’s not really what you said in the piece.
. There has undoubtedly been a substantial rue since the start of the Holocene when lots of ice melted, but, as would be expected, it fluctuates according to any long established climate regime. So in those last few millennia it has gone up and down.
Tonyb
agreed, i changed the text to clarify. Actually this whole issue is topic of Part II, I’ll think further about what to say in that sentence.
Maybe for >10,000 years, but isn’t it a bit misleading, since the Holocene temperature maximum was about 8 ka BP and sea levels reached their maximum ~7 ka BP. There is evidence that those peak sea levels were ~2 m higher than the present-day sea level. This sea level decrease since then was of course not monotonic.
https://wattsupwiththat.files.wordpress.com/2011/01/compton-2001-holocene-sea-levels.jpg
More evidence in this blog post:
http://notrickszone.com/2017/02/06/35-scientific-papers-global-sea-levels-were-1-2-meters-higher-than-now-for-most-of-the-last-7000-years/#sthash.v0aiaYP4.dpbs
Agreed. Sea levels have been going up and down during the Holocene following climate cycles.
https://i.imgur.com/RxOpnB5.png
This is Grinstead et al., 2009 reconstruction. I left the IPCC projection and took out the much more alarming projection by the authors.
The Holocene highstand is a well known feature at many places. It is another clear demonstration that the Holocene Climate Optimum was warmer than now.
Javier
Yes, that is one of the two graphs I used in my own article on historic sea level variations several years ago.
The notion of temperature fluctuation and associated manifestations such as sea level changes together with changes in sea ice and glaciers, needs to underpin any narrative about historic climate. Otherwise people end up with the notion that todays conditions are unprecedented in the Holocene
Tonyb
Tony,
At the core of the issue is the fact that, as far as we know, CO₂ levels are currently very unusual for the Late Pleistocene, about twice the average, while temperatures, sea levels, and ice are within Holocene variability range.
The only conclusion that can be extracted from these facts is that CO₂ is not a primary climate driver. That so many scientists maintain the opposite is astounding.
Javier
nicely put.
There are many people in the climate coach but it appears that co2 is merely one of the passengers and not one of the drivers. He has a very good agent however and has a very loud voice and a flamboyant personality and therefore appears more important than he really is.
It helps that many important people want to believe in his pre eminence as it suits their green ideology
Tonyb
This is Grinstead et al., 2009 reconstruction. I left the IPCC projection and took out the much more alarming projection by the authors.
Which indicates that you really don’t understand the paper or that sea level curve. It isn’t based on observations relating to sea level. It’s based on an NH surface temperature reconstruction and a temperature-sea level relational model calibrated to respective 20th Century records.
Both the past reconstruction and future projection in the paper are based on that model using the same parameters. If you reject their future projection in favour of the IPCC one (which doesn’t fit that relational model), that necessarily implies different parameters and an entirely different reconstruction of past sea level.
Kopp et al. 2016 uses actual sea level proxy data for the past few thousand years, and indicates considerably smaller (about 20% f the magnitude between peak and trough) variability. Consequently, their relational temperature-sea level model produces less sea level rise by 2100.
Past temperatures are reconstructed. Future temperatures are imagined.
There is a difference.
Missed link for Kopp et al. 2016.
Past temperatures are reconstructed. Future temperatures are imagined.
Recent NH anomalies are 1ºC warmer than the peak of the past two thousand years in the Moberg 2005 reconstruction they used. Even with no further warming, the parameters used for that sea level reconstruction would produce a rise up to about the 0.8m mark on that graph by 2100.
“Recent NH anomalies are 1ºC warmer than the peak of the past two thousand years in the Moberg 2005 reconstruction they used.”
Comparing proxy temperature reconstructions to instrumental temperatures is a mistake and a possible source of major errors. No guarantee that what they measure is even related.
Javier,
Comparing proxy temperature reconstructions to instrumental temperatures is a mistake and a possible source of major errors. No guarantee that what they measure is even related.
Which means that sea level reconstruction you’ve cited should be worthless in your mind since it explicitly involves an assumption that the proxy temperature is exactly equivalent to instrumental temperatures.
No. It is a sea level reconstruction, with the value of any reconstruction, i.e. tentative. We more or less know what sea level has been doing for the past couple of centuries thanks to tide gauges. That part is non controversial, the only question being the uncertainty.
Tonyb, there is an effective way to discourage people from building in the most unwise of places and as you have already pointed out it’s through legislation. People need access (roads, bridges, etc) to the areas they build/develop.
Both parties seem to be highly interested in a national infrastructure bill. A good comprehensive bill that promotes a sharp turn towards adaptation would accomplish this. Full and matching federal funds need to be awarded in a way that increasingly (over years) decline for public access into areas likely to be problematic fifty years into the future. Any further access into or within those areas should become an increasing state/local/private burden.
The same kind of pointed attention needs to take place in the federal flood insurance program. Perhaps owners/developers need to start paying a little (or a lot) more for the risks they take and expose the rest of us to financially.
Something of this magnitude would have to be phased in over many years to be acceptable, but it would send a clear message to buyers/developers/etc of what is to come. I would guess that the most vocal alarmists in the legislature, who cry for trillions for mitigation, would push back the hardest. I’ll refrain from calling names.
Phillip
Claim #4: Sea Levels Are Rising
Response to Claim #4: When haven’t sea levels been increasing? Sea levels have been increasing since the end of the last ice age, and the rate of change is near the lowest in the past 15,000 years. A rising sea level is evidence that we are no longer in an ice age, not that we have produced too much CO2. If the global temperatures were, in fact, increasing at an increasing rate, glaciers would be melting at an increasing rate, and sea levels would be increasing at an increasing rate. They aren’t. There is no evidence that sea level rate of change has been accelerating. Even if sea levels are accelerating, and temperatures are accelerating, that still doesn’t mean CO2 is the cause. There are plenty of periods in world history when temperatures and sea levels have accelerated without CO2 being the driver.
https://co2islife.wordpress.com/2018/01/13/how-do-you-know-a-climate-alarmist-is-lying-their-lips-are-moving/
May I suggest to write a chapter dedicated to sea level measurements, either by tide gauges or by satellite altimetry, to the calibration process and to (sea level) data treatment, corrections and uncertainties.
Frankly speaking, I have significant doubts about the validity of satellites’ measurements.
Altimeters measuring sea level are orbiting in LEO, at about 1340 km altitude (cf. Jason 1 / 2 / 3), while measuring the level of a sea surface that is constantly fluctuating (waves, swell, tides, gravity…) at all scales of time and space, with amplitudes that may reach 20 or even 30 meters.
Indeed, detecting a 3mm/year useful signal into those fluctuation is much more than a tour de force…
Looking at data corrections applied to ENVISAT measurements, showing a limited sea level rise of about 2mm/year between 2004 and 2010, then a significant sea level drop down to 2004 level between 2010 and mid-2011, in contradicting Jason 1 and 2 measurements, one may also question the validity of calibration and data post treatment processes.
Good point, this is something i need to dig into a bit more
Kip Hansen wrote a good essay in WUWT about Steven Nerem’s approach. https://wattsupwiththat.com/2018/01/09/sea-level-rise-and-fall-part-4-getting-a-rise-out-of-nothing
I do not understand. Are you questioning the processing procedures of the analysis or are you questioning the technical ability of satellites to measure the height of the earth’s surface? The accuracy of satellite measurements (altimeters) has increased over the years. And there is cross-calibration of satellite measurements as well. The only good thing about tidal gauges is that there is a longer record.
As with other climate studies, It is a challenge to combine long term local measurements with short term global measurements into one story.
As a kid I made a joke, that isn’t it amazing that the sea exactly comes up to the shoreline, without gaps or overlap.
Like many of my ancient jokes (another: women’s history month, funny then because women had the same history as men), they’re overwhelmed by some new moral or scientific meme.
On sea levels and tides, one idea I liked was that tides are actually just long-wavelength water waves, and affected like waves by the nature of the bottom when it starts getting shallow.
Long wavelength water waves, in deep water, have a (phase) velocity that increases like the square root of the wavelength so can match earth rotation.
There was some street flooding in and around Boston during the big Nor’easter that hit last week. A lot of warmists argued that the flooding was evidence of sea level rise and climate change. In fact it was caused by hitting during an extremely high tide caused by a full moon, and the waters quickly receeded after the storm left.
IPCC on expected Antarctic contributions to SLR:
https://static.skepticalscience.com/pics/1_2014-08-12_21-16-26.jpg
Negative.
As has been mentioned earlier, I think an accurate historical perspective (evidence) of the past 50,000 years (to include our early Holocene) would go a long way in building interest from alarmists and skeptics in addressing the problem from a factual perspective (what has happened) rather than a mindless modeling game (what answer do we want to make happen). I would guess that much evidence is available in our Gulf region because so much activity/exploration has taken place there in the past several hundred years. Ben Raines (an environmental writer) might be a good starting point here in Alabama. Ben has worked with research people from LSU, William Patterson University, and U of Southern Mississippi on a bald cypress forest discovered 10 miles south of Gulf Shores, AL in 60 feet of water. He’s also working with the Alabama Legislature in getting the area protected. I have to believe that similar evidence is available (even with a coral twist) in the Florida’s Keys. The Gulf is small/regional but maybe an excellent starting point for gathering evidence and maybe reaching conclusions that can be extrapolated to other basins in the world.
Phillip
Getting over this historic context is vital. We have a whole generation that look at graphs from 1880 or later and see bas8cally a rise but they do not know they are often merely part of a series of rises and falls throughout the Holocene.
Also, local conditions are often not the same as global ones, concentrating on global averages disguises the many nuances exhibited locally.
Tonyb
Parish,
I agree!
Re coastal tide ranges:
Recommend putting in the full range mentioned by NOAA:
Where is the highest tide?
i.e. 53.5 ft in Bay of Fudy, and 40 ft near Anchorage!
Re Adaptation vs Mitigation
Recommend including a section on adaptation.
e.g. hurricane shelters and storm warning in Bangladesh. Reduced deaths from up to 500,000 due to the 170 Bhola cyclone.
History of Storm Surges
Needham, H. F., Keim, B. D., & Sathiaraj, D. (2015) A review of tropical cyclone-generated storm surges: Global data sources, observations, and impacts Reviews of Geophysics, 53(2), 545-591.
DOI: 10.1002/2014RG000477
http://onlinelibrary.wiley.com/doi/10.1002/2014RG000477/full
History of Dutch dikes
e.g. with differing reliability depending on the value of what they protect.
Deep uncertainties in sea-level rise and storm surge projections: Implications for coastal flood risk management
Perry C. Oddo, Ben S. Lee, Gregory G. Garner, Vivek Srikrishnan, Patrick M. Reed, Chris
E. Forest, and Klaus Keller https://arxiv.org/ftp/arxiv/papers/1705/1705.10585.pdf
Bos, F., & Zwaneveld, P. Cost-Benefit Analysis for Flood Risk Management and Water Governance in the Netherlands: An Overview of One Century. CPB Netherland Bureau For Economic Policy Analysis, MPRA Paper No. 80933, August 2017 https://mpra.ub.uni-muenchen.de/80933/1/MPRA_paper_80933.pdf
thx good links
Eustasy, isostacy, sea level rise/fall, and causes
Glaciation/interglacial warming, CO2, and/or Solar cycles?
Major issues are causes of sea level rise/fall rates. e.g. models of eustacy (“worldwide change of sea level as contrasted with local diastrophic uplift or subsidence of the land”) vs isostacy (glacial rebound following glaciation / melting) vs local sinking/rising from glaciation/interglacial warming, CO2, and/or solar variations, and their causes.
For filling out the full range of evidence and an alternative sea level model, see Nils-Axel Morner, Department Head, Paleogeophysics and Geodynamics Institute | POG, Uppsala 1991-2005.
e.g.,
Our Oceans-Our Future: New Evidence-based Sea Level Records from
the Fiji Islands for the Last 500 years Indicating Rotational Eustasy and
Absence of a Present Rise in Sea Level
Mörner, Nils-Axel, Int J Earth Environ Sci 2017, 2: 137 https://doi.org/10.15344/2456-351X/2017/137
https://www.graphyonline.com/archives/IJEES/2017/IJEES-137/article.pdf
Mörner, N.-A., 2017. Coastal morphology and sea-level changes in Goa, India during the last 500 years. Journal of Coastal Research: Volume 33, Issue 2: 421-434. 2017 https://doi.org/10.2112/JCOASTRES-D-16A-00015.1
PDF
ABSTRACT
Further ref at: Scholar NA Morner sea level
Glacial Isostatic Adjustment (GIA) Jet Propulsion Lab, NASA
A, G., J. Wahr, and S. Zhong (2013) “Computations of the viscoelastic response of a 3-D compressible Earth to surface loading: an application to Glacial Isostatic Adjustment in Antarctica and Canada”, Geophys. J. Int., 192, 557–572, doi: 10.1093/gji/ggs030.
Sea level seems to me, a layman, like the slowest moving component in achieving climate equilibrium. The Earth is ten millennia out of a glacial and sea levels are still changing due to thermal expansion and ice sheets melting. This despite a cooling trend over the last three millennia, if the Greenland ice cores are accurate. It’s a sobering thought and I have to agree with warmists that human warming contributions may take futher millennia to work through the system.
Here’s an odd bit: a joule at 2000 meters below sea level causes more sea level rise than a joule at 200 meters below sea level.
As the water at the 2000 level warms up to achieve that 1 joule would not the water above the 2000 level warm as well – expectantly adding to the SLR?
Im referring to the impact of one joule on a volume of water. When the surface is warming, there’s a net transfer of joules from the surface to the bottom. This means that if the surface temperature is constant and energy is slowly transferring into the water column all the way to the sea floor, the ocean will keep expanding and sea level will continue rising. Conversely, during periods of long term cooling the energy removed from deep water as it cools slightly will shrink it, dropping sea level. This means a surface temperature trend isn’t going to have an exact and instantaneous effect on the world ocean. I visualize this as a series of superimposed transients which we are unable to model because we don’t include geothermal heat flow and the way it turns over the water column over mid ocean ridges and other hot spots.
I think Science of Doom has done much of the job in some of his posts on Impact:
Sea Level Rise 1, Sea Level 2 – Uncertainty, Sea Level 3 – USA, Sea Level 4 – Sinking Megacities, and Sea Level Rise 5 – Bangladesh.
This basically resumes it all.
https://i.imgur.com/mZvIuUA.png
The rise in sea level predates IPCC calculated anthropogenic forcing, and shows no clear response to it. Rising sea levels that show little to no acceleration, in sharp contrast to predictions. Reducing our emissions will not significantly affect sea level rate of increase, because increasing them didn’t.
“Rising sea levels that show little to no acceleration, in sharp contrast to predictions. ”
Citation please.
See the fasullo paper on the university of Colorado sea level pages that I quote below
Tonyb
“Global mean sea level rise estimated from satellite altimetry provides a strong constraint on climate variability and change and is expected to accelerate as the rates of both ocean warming and cryospheric mass loss increase over time. In stark contrast to this expectation however, current altimeter products show the rate of sea level rise to have decreased from the first to second decades of the altimeter era.”
Fasullo, J. T., Nerem, R. S., & Hamlington, B. (2016). Is the detection of accelerated sea level rise imminent?. Scientific reports, 6, 31245.
” current altimeter products show the rate of sea level rise to have decreased from the first to second decades of the altimeter era.””
I said a citation to justify your ” in sharp contrast to predictions. ” please.
IOW what were the IPCC predictions.
It says there:
In stark contrast to this expectation
Reading problem?
Javier is being economical with the actualite.
Full abstract:
My bold.
Climate science is long on opinions and short on evidence. Is it really a science or should go with Psychology and Economics?
We are enjoying a lull on strong volcanic eruptions. It might not last. Does climate change increase the risk of volcanic eruptions? I haven’t heard that one yet, but the next eruption could bring it.
“In stark contrast to this expectation
Reading problem?
No a misapprehension about what “this expectation” actually was.
How about what model EXPECTATIONS actually were eh?
For your delectation.
http://www.realclimate.org/images//IPCC_AR5_13.7ab.png
Javier:
I say in words of one syllable.
Show me where the IPCC projected an “acceleration” within the current and recent time-frame.
A graph please.
Just go to any AR report and grab it to post here.
Thanks.
When you show me where did I say the predictions I was talking about were by IPCC. You made that up. I am sure you can look up IPCC predictions by yourself.
“When you show me where did I say the predictions I was talking about were by IPCC.”
Thank you.
Then the “predictions” you talk off are not consensus science.
Just like Wadham’s “the entire remaining summer Arctic ice cover may collapse in the near future.”, and Viner’s “our children will not know snow”.
A strawman with which you “contrarians” use to cast doubt on the consensus.
Javier:
And would you like to link us to the personage and his/her paper that had this “expectation” that sea-level should have accelerated by now.
Thank you again.
I already did, Tony. Fasullo and Nerem from NCAR and University of Colorado.
Javier:
OK it seems you got the quote from this paper.
My apologies, I thought it as straight out of your head.
https://www.nature.com/articles/srep31245
Abstract:
“Global mean sea level rise estimated from satellite altimetry provides a strong constraint on climate variability and change and is expected to accelerate as the rates of both ocean warming and cryospheric mass loss increase over time. In stark contrast to this expectation however, current altimeter products show the rate of sea level rise to have decreased from the first to second decades of the altimeter era. Here, a combined analysis of altimeter data and specially designed climate model simulations shows the 1991 eruption of Mt Pinatubo to likely have masked the acceleration that would have otherwise occurred. This masking arose largely from a recovery in ocean heat content through the mid to late 1990 s subsequent to major heat content reductions in the years following the eruption. A consequence of this finding is that barring another major volcanic eruption, a detectable acceleration is likely to emerge from the noise of internal climate variability in the coming decade.”
All that is fair enough.
And as VTG pointed out the attribution lies with Pinatubo.
However they do not say who has the “expectation” of acceleration currently. I would presume the IPCC, but I say again I cannot find that in any of the IPCC literature.
So my query must pass to them.
Hay et al: …Here we revisit estimates of twentieth-century GMSL rise using probabil- istic techniques9,10 and find a rate of GMSL rise from 1901 to 1990 of 1.2 6 0.2 millimetres per year (90% confidence interval). … In their paper, they show a rate of SLR at 1993 of about 1.8 mm per year.
Later: Nerem’s team calculated that the rate of sea-level rise increased from around 1.8 millimetres per year in 1993 to roughly 3.9 millimetres per year today as a result of global warming. In addition to the satellite calibration error, his analysis also takes into account other factors that have influenced sea-level rise in the last several decades, such as the eruption of Mount Pinatubo in the Philippines in 1991 and the recent El Niño weather pattern.
1900 to 1990 – 1.2 mm per year
1993 – 1.8 mm per year
1993 to present – 3.29 mm per year
last 20 years – 3.33 mm per year
last 10 years – 4.24 mm per year
last 5 years – 4.56 mm per year
“What is left is natural variability, that is what sea level appears to be responding to.”
Javier:
I’m still waiting for you you to show me where the IPCC projected an acceleration in sea-level rise currently.
Re: “The rise in sea level predates IPCC calculated anthropogenic forcing, and shows no clear response to it. Rising sea levels that show little to no acceleration, in sharp contrast to predictions. Reducing our emissions will not significantly affect sea level rate of increase, because increasing them didn’t.”
You messed up badly for a number of reasons. For example, the relevant response here is to warming. And the rate of anthropogenic, CO2-induced warming effect has been fairly linear for over a century, not exponential. You didn’t account for this in your comparisons.
Furthermore, though there has been a long-term, CO2-induced warming effect, CO2 is not the only factor affecting temperature. Man-made aerosols play a role, as does the AMO (though that one is bit more controversial), volcanic aerosols, changes in TSI, etc. So despite over a century of a CO2-induced warming effect, these other factors helped mitigate this warming effect from about the 1940s to 1970s, resulting in slight global cooling. Your comparison does not take these factors into account, so your comparison is flawed.
Also, please don’t pretend that man-made CO2 has to be the only factor influencing warming-induced sea level rise, in order for it to be the predominant factor affecting warming-induced sea level rise over recent decades.
A few sources for those curious about the impact of humans and CO2 on sea level rise:
“Internal variability versus anthropogenic forcing on sea level and its components”
“Carbon choices determine US cities committed to futures below sea level”
“Relationship between sea level and climate forcing by CO2 on geological timescales”
Further sources here showing sea level rise acceleration, anthropogenic contributions to sea level rise, projections of future sea level rise, etc:
https://judithcurry.com/2018/01/16/sea-level-rise-acceleration-or-not-part-i-introduction/#comment-864643
https://judithcurry.com/2018/01/16/sea-level-rise-acceleration-or-not-part-i-introduction/#comment-864645
You are the one that doesn’t get it. Total anthropogenic forcing takes into account all positive and negative anthropogenic factors and is measured in W/m².
What is left is natural variability, that is what sea level appears to be responding to.
Re: “Total anthropogenic forcing takes into account all positive and negative anthropogenic factors and is measured in W/m².”
Which does nothing to address the points I made. Once again:
1) You didn’t account for the relevant parameter here, which is warming.
2) You didn’t account for the influence of non-anthropogenic factors on warming.
3) You implicitly assumed that sea level rise must respond only to anthropogenic factors, in order for anthropogenic factors to be the predominant cause of recent sea level rise. That assumption of your’s makes no sense. Sea level rise is tied to warming and non-anthropogenic factors can influence the rate of warming, even if anthropogenic factors are the dominant cause of recent warming.
Re: “What is left is natural variability, that is what sea level appears to be responding to.”
A bare (and false) assertion from you that depends on you willfully ignoring the published evidence. Some of this evidence has been cited for your repeatedly. Let me know when you can actually address it:
https://judithcurry.com/2018/01/16/sea-level-rise-acceleration-or-not-part-i-introduction/#comment-864643
Warming might be the relevant factor, but we don’t know the relative contributions by the different natural and anthropogenic components to warming, so saying that warming causes sea level rise doesn’t give us much information.
Nobody can account for the influence of anthropogenic or natural factors on warming. We don’t know how much warming is natural and how much is not. Whoever says he knows is lying.
We calculate radiative forcing from the anthropogenic contribution (GHGs and aerosols). Sea level rise shows no relation to that. Ergo either decreasing emissions will have little effect on sea level rise, or our calculations are incorrect, or both.
I don’t implicitly assume anything. Anthropogenic radiative forcing exploded after 1950. Sea level rise showed little, if any, effect. End of story.
Re: “Warming might be the relevant factor, but we don’t know the relative contributions by the different natural and anthropogenic components to warming, so saying that warming causes sea level rise doesn’t give us much information.”
Nope.
1) Even with a low sensitivity value, increased CO2 would still have caused most of the recent global warming. You would need a very low climate sensitivity estimate [below the range supported by the evidence], in order for humans not to have caused most of the recent global warming. Basically, you’d need an ECS of less than ~1.1K. For example, Monckton et al.’s garbage paper still ended up with humans causing most of the warming, despite their low climate sensitivity value (DOI: 10.1007/s11434-014-0699-2, page 130).
2) In addition to estimates of climate sensitivity, there are other lines of evidence showing that anthropogenic activity (predominately increased CO2) caused most of the recent global warming; this provides further credence for the >=95% certainty on the attribution point. Theses lines of evidence include:
– Post-1950s stratospheric cooling
– Post-1950s mesospheric cooling
– Post-1950s thermospheric cooling
– Horizontal/regional distribution of warming and the temporal pattern of warming [DOI: 10.1175/BAMS-D-11-00191.1, pages 1683 and 1684]
– Exclusion of other likely causal factors, such as the Sun [ex: solar-induced warming causes warming of the stratosphere, mesosphere, and thermosphere, yet scientists observed cooling in these layers].
The two aforementioned points have been well-supported in dozens of scientific papers authored by dozens of scientists.
“Nobody can account for the influence of anthropogenic or natural factors on warming. We don’t know how much warming is natural and how much is not. Whoever says he knows is lying.”
You’ve been repeatedly cited evidence showing that you’re wrong, and people have explained to you why you’re wrong (ex: you failing to convert the exponential change in CO2 into a near-linear CO2-induced warming trend).
Your only response is to ignore the evidence, re-assert your position, and accuse (at least) hundreds of scientists of lying, as per the evidence-based consensus discussed in sources such as:
“Earth Scientists Views on Climate Change”
http://www.pewinternet.org/2015/07/23/elaborating-on-the-views-of-aaas-scientists-issue-by-issue/
Figures 88 (v043) and 2 (v007) of: “The Bray and von Storch 5th International Survey of Climate Scientists 2015/2016”
https://www.hzg.de/imperia/md/content/hzg/zentrale_einrichtungen/bibliothek/berichte/hzg_reports_2016/hzg_report_2016_2.pdf
Table 1: “Consensus on consensus: a synthesis of consensus estimates on human-caused global warming”
“Does it matter if the consensus on anthropogenic global warming is 97% or 99.99%?”
Page 49 of: “Models, manifestation and attribution of climate change”
Congratulations on your denialism and cascade logic:
“No private individual has the time or the expertise to examine the original research literature on each topic, so it is important to have some guidelines for deciding which theories are plausible enough to merit serious examination.
One valuable guideline is to look for cascade logic in conspiracy arguments (Susstein & Vermeule, 2008). This occurs when defenders of one conspiracy theory find it necessary to implicate more and more people whose failure to discover or reveal the conspiracy can only be explained by their alleged complicity.”
http://embor.embopress.org/content/11/7/493
“It is, however, important not to confuse denialism with genuine scepticism, which is essential for scientific progress. Sceptics are willing to change their minds when confronted with new evidence; deniers are not.”
http://www.bmj.com/content/341/bmj.c6950.full
Surveys in Geophysics has a significant set of review articles following the International Space Science Institute (ISSI) Workshop .
https://link.springer.com/search/page/4?facet-content-type=Article&facet-journal-id=10712&sortOrder=newestFirst
A number of issues arise,
An objective (2020) for precision in ssl for 20cm
Natural variation needs to be understood.
Lots of infilling (problematic in poorly sampled areas where little pressure data is available Southern ocean etc)
looks good, but don’t want to pay for it (can’t find a copy online)
Acceleration in and of itself is not evidence of anthropogenic cause
https://ssrn.com/abstract=3023248
All because the snow is falling, Lake Mead may rise over 70 feet in 2018. According to the Mono Lake Committee, that lake also is rising–e.g.,
[blockquote]With a deep snowpack fueling runoff that is forecast at. 206% of average, Mono Lake is expected to rise over three feet between April 2017 and March 2018. That is a lot of water, especially when you recall that Mono Lake is almost twice the size of San Francisco. The lake typically rises a bit during winter; this year it rose an impressive 1.2 feet prior to April, largely due to precipitation on the lake and lower-elevation rainfall…[/blockquote]
The people of Earth need fresh water and we all need to be more concerned about having more of it, even it takes more energy to make it or having to listen to the fearmongering of Leftist opinion-makers like Obama and Kerry who claim respectively that, “no challenge – poses a greater threat to future generations than climate change,” and, that global warming is, “perhaps the world’s most fearsome weapon of mass destruction.”
There is a strong AMO signal in the global rate of rise, which has pronounced implications for regional sea level changes, and glacier loss/growth rates. I’d expect a slower sea level rise rate from the mid 2030’s during the next cold AMO phase.
http://www.pnas.org/content/114/23/5946.figures-only
It actually the PDO. The AMO is a poodle and lacks the size to influence the direction of global mean sea level. Takes a big dog to do that.
Western tropical Pacific multidecadal variability forced by the Atlantic multidecadal oscillation
https://www.nature.com/articles/ncomms15998
https://bobtisdale.files.wordpress.com/2015/05/figure-32.png
That’s all rather Eurocentric.
“That’s all rather Eurocentric”
I thought that was the U.S. west coast?
Some time last year (or the year before), I found a website that had satellite photos from recently, alongside photos taken ~10 years or so ago. The main purpose of the site was to show how towns, cities & such expand and intrude into undeveloped areas. One of the pairs was of a seacoast (western Africa, I think). The two photos showed no discernable rise in sea level. It would have been apparent, as the slope of the land into the sea, is rather small (so a small rise would go far inland).
On the other hand, I can’t explain the “sinking islands” (other than to suggest that the islands are in fact sinking, rather than the ocean rising).
Oddly the article had no graphs of sea level. This is one.
https://robertscribbler.files.wordpress.com/2015/11/sea-level-rise-hansen.gif
Maybe you can show this and explain how it isn’t accelerating even though it looks like it is.
Jim D
Test ALL things.
Have you looked into the actual data and the noise in the data?
Sea Level Rise Accelerating? Not.
Why did you not include the DECLINE in sea level from 1810 to 1860?
Who’s afraid of sea level acceleration?
https://wattsupwiththat.files.wordpress.com/2017/07/clip_image00211.png
See the references above that Nills-Axel Morner finds NO significant sea level rise over 500 years.
Our Oceans-Our Future: New Evidence-based Sea Level Records from
the Fiji Islands for the Last 500 years Indicating Rotational Eustasy and
Absence of a Present Rise in Sea Level, Mörner, Nils-Axel, Int J Earth Environ Sci 2017, 2: 137 https://doi.org/10.15344/2456-351X/2017/137
https://www.graphyonline.com/archives/IJEES/2017/IJEES-137/article.pdf
Mörner, N.-A., 2017. Coastal morphology and sea-level changes in Goa, India during the last 500 years. Journal of Coastal Research: Volume 33, Issue 2: 421-434. 2017 https://doi.org/10.2112/JCOASTRES-D-16A-00015.1
Rather than rates in particular short periods, I would use times to rise certain amounts. For example MSL rose 7-8 cm in 1900-1950 and again in 1950-2000, but has already risen 7-8 cm in the last 25 years which is twice the rate and is on pace for at least 15 cm in the 50 years from 2000-2050. Call it by its name – an acceleration.
Check out Andy May’s deconstruction of this graph.
Is that some kind of expert or just a blog person?
Prolific blog commenter Jim D asks, “Is that some kind of expert or just a blog person?” Irony meter goes to 11.
It was a random blog person, while when I quote people, they are experts. See the difference?
By definition or is it causal?
That has to be one of the silliest graphs out JD and you should know that. It is comparing apples with oranges. The easiest proof is why didn’t the tidal data extend past 1993? Could it be that the tidal shows no change as it doesn’t have an isostacy adjustment?
See below for tidal data beyond 1993. It doesn’t do what you want it to, and more than confirms the satellite acceleration. I am fairly sure Judith won’t post that graph in her summary either. What do you think?
Jim D, this is probably why she won’t be including that graph:
“The key issue is whether the sea level rise during the past 50 years reflect an acceleration in sea level rise. The IPCC figure 3.14 suggests that there is no acceleration, given the large rates of sea level rise in the first half of the 20th century. Until we have an understanding of variations in decadal and multi-decadal sea level rise, we can’t make a convincing argument as to acceleration.”
A simple search turned this up. As much time as you spend here, not sure why you don’t have a better understanding of her positions.
On the other hand, just looking at the rise rate in the last 30 years being twice as much as the 20th century average, you see a de facto acceleration. It depends what you take as evidence or even definition of an acceleration, I guess. Maybe you call it a speed-up instead? Also, given the trends of the continental glaciers, an acceleration is easily explained.
IPCC figure 3.14:
http://www.climatechange2013.org/images/figures/WGI_AR5_Fig3-14.jpg
It’s no longer any good. The high rate is junk.
http://www.realclimate.org/images//haysl21.jpg
https://i.imgur.com/m4q1weu.png
Jevrejeva’s rate has criticized, and nobody else has arrived at anything even remotely close to it since then. They peak at just over 2 mm per year around 1940, which is around 1/2 the current 10-year rate: 4.54 mm year.
Unlike you JCH, I actually got all the records from the two sites and did an LMS on them at various intervals. I could not match the data given that way to what the PSMCL short time interval trends say. Try it on the short Tuvalu set. Here it is: http://www.psmsl.org/data/obtaining/rlr.monthly.data/1839.rlrdata
Then do it for 1986-2015 (data actually goes later than that) for Marseille, taking out the data they say is suspect.
Come back when you can match the short term trend numbers you posted.
There seem to be at least two kinds of “sea level”, only one of which might prove “dangerous” (in the words of the UNFCCC treaty)
Local mean sea level (LMSL) refers to average attitude relative to adjacent land and is measured by tide gauges. Eustatic sea level (ESL) refers to the notional mean of all the oceans relative to a geoid and is measured by satellite altimetry.
Some marry LMSL and ESL in hockey-stick-style graphs, to hide the lack of incline in the former post 1993. Can your series please clarify the alleged 1993 doubling of SLR?
agreed that this is a key issue
JCH
Looking at the NOAA 50 year trend graph tells us why so many papers have identified a 60 year Oscillation and unless the entire period is considered no longer term trend can be reliable. Looking at rates since 1985 is just a repeat of the previous trend beginning in 1925.
You already got the oscillation in the satellite era. The trend dropped for a few years, and then shot back up. It’s just the way it is. The AMO never packed a punch, and now the great hope of Koolers is exposed.
There’s plot for that too, but I don’t think it helps your cause to show it.
https://www.yaleclimateconnections.org/wp-content/uploads/2016/04/0416_Antarctic_1A.png
Very good JD. You have put up two graphs showing the tidal and satellite data and they are significantly different? Which is the “correct” one. And why haven’t you put the only graph that matters up, the sea level relative to land without adjustments?. This is the only one that matters as it will dictate the response to flooding.
The skeptics prefer tidal and that is rising faster. Both accelerate, so there is no dispute there, Satellite is the most objective measure of the actual amount of water regardless of what the local coastlines are doing, but the skeptics are having none of that, of course. Ask them why, not me.
If you read Jevrejeva, who seems to be the current data analyst for tidal sea level data, almost all the acceleration is the GIA, that is, it is not shown in the tidal data. To quote her ” The new reconstruction suggests a linear trend of 1.9 ± 0.3 mm·yr− 1 during the 20th century, with 1.8 ± 0.5 mm·yr− 1 since 1970. ” That is a fair bit different to the slope on your graph.
Though no doubt, you can go onto something like the PMSL website and show us how long term trends like Battery Park or Fort Dennison are accelerating. Remember to quote people like Feynman “It doesn’t matter how beautiful your theory is, it doesn’t matter how smart you are. If it doesn’t agree with experiment, it’s wrong.” Now why isn’t Fort Dennison accelerating?
What is your estimated rate or total rise from 1990-now? I think there is a lot of agreement that the 20th century was in the range 1-2 mm/yr, with about 15 cm total. The estimated rise since 1990 is 7-8 cm, already half the 20th century rise in a quarter of the time. Current rates are approaching 4 mm/yr and this is because of Greenland.
Jevrejeva is not current. Current is 1.1 to 1.2 mm per year; much less than prior work. One reason, Mitrovica and his team, and they are solid, solved Munk’s enigma. What was that? The rise people were deriving for the 20th century made no sense. It never made sense. That is what Munk was saying. That is why, when Hay 2015 first came out and was include in the science review here, I said it made sense.
JCH
PSMSL thinks Jervejeva is current, http://www.psmsl.org/products/reconstructions/jevrejevaetal2014.php
I note Mitrovica 2015 seems to mainly discuss the GIA trends.
And JD, your estimated rise is GIA and other adjustments which are irrelevant to flood risk. The steric component is still less than 2mm/ year. How are you getting on with the acceleration at long history sites? Or are you just going to pretend that their inconvenient data is irrelevant, like you normally do?
I still have not seen your estimate for a rise since 1990. For all I know you agree it exceeds at least 7 cm, and if not you are going to show some data to that effect. Everything I have seen supports my number.
No Jim, I asked first so I get precedence. You show me acceleration in the tidal data from Fort Dennison and I will give you my estimate.
I showed tide gauge data before, and here is another one. Say why you don’t believe it. When you use tide gauge data, you need a lot of samples, otherwise you get local coastal effects, and one station is of no use at all.
https://data.giss.nasa.gov/gistemp/graphs/graph_data/Global_Mean_Estimates_based_on_Land_and_Ocean_Data/graph.png
oops, this one
https://www.epa.gov/sites/production/files/styles/large/public/2016-07/sea-level-figure1-2016.png
Compared to the individual reconstructions, the bias-corrected simulations agree best with the Hay et al. (2015) reconstruction, explaining 92% of the observed change (Table 5).
Because our approach is different from that of ref. 6,
{6. Hay CC, Morrow E, Kopp RE, Mitrovica JX (2015) Probabilistic reanalysis of twentieth-century sea-level rise. Nature 517:481–484.}
our results provide an independent confirmation of their suggestion of a relatively slow prealtimetry rate of GMSL rise. Our constraint of 1.1 ± 0.3 mm·y−1 (P > 0.99) during this period, in turn, explains the majority of the observed differences between individual reconstructions and recently modeled contribu- tions to GMSL rise from the CMIP5 ensemble between the 1930s and 1970s, thus increasing our confidence in process-based models that are an indispensable tool for future projections (9).
That’s your problem Jim – you say its local effects, but all of the long term tidal records across the globe show about 1.5-1.8mm a year average and no acceleration. Surely they all can’t be just happen to have exactly the same counteracting effect.
Even for you, that is beyond the bounds of credibility.
I showed you a graph that included tide gauges up to the present and you haven’t denied its correctness. So far, you haven’t shown anything about the average since 1990, and you keep talking about an out of date 20th century average. You are not very good at diverting, or you are not understanding what “since 1990” actually means.
JD
No change in rate or acceleration here
https://tidesandcurrents.noaa.gov/sltrends/sltrends_station.shtml?stnid=8518750
or here
https://tidesandcurrents.noaa.gov/sltrends/sltrends_global_station.htm?stnid=680-140
or here
https://tidesandcurrents.noaa.gov/sltrends/sltrends_global_station.htm?stnid=230-051
or even her
https://tidesandcurrents.noaa.gov/sltrends/sltrends_station.shtml?stnid=9447130
I could go on but there is probably a block on the number of links allowed in a post.
None of your graphs actually match these. They do not show any acceleration post 1990. Why? They might have an all bells and whistles model but it doesn’t match the field data – or are there special circumstances why all the tide gauges don’t actually match the model?
The way you can tell that these are not representative of global trends is that they vary by a factor of four. To do a global trend correctly you have to map them all and even then you only have coastlines. The graphs I showed that use tide gauges have to account for all spatial variations because sea level doesn’t rise uniformly, and some stations are no good at all because of coastal effects. Satellites get around these difficulties.
https://sealevel.nasa.gov/understanding-sea-level/observations/sea-level
Your off attacking straw men again Jim. I never said they were representative of an overall trend. I said they had no sign of acceleration since 1990. I note you can’t even acknowledge that, the sign of a true cultist.
In the real world data, trumps models, especially those with GIA adjustments.
http://21sci-tech.com/Articles_2011/Winter-2010/Morner.pdf
The rise rate in the 20th century was significantly less than an inch per decade, and since 1990, it has been significantly more than one inch per decade. This type of rate is easily measurable. If Morner doesn’t believe sea levels have been rising since 1990 (or even 1950!), he is in a minority of one (plus you, I suppose). How much do you believe his Figure 1? This makes him look like a crank. Tide gauges and satellite independently show recent rates of 3+ mm/yr.
The 30-year trend at the New York Battery is 4.54 mm per decade.
The 30-year trend at Marseille is 3.53 mm per year.
I notice you have gone to ad homs as well rather than admit you can’t counter it. You are forgetting Jenrejeva who also says the acceleration is in the GIA. Both of them have a lot more qualifications and publication record than either you or your stablemate JCH. And I note Munk 2002 also said there are issues “raditional estimates of the combined (steric plus eustatic) sea level rise (in the range 1.5–2 mm/y) are much too high [the Cabanes et al. (16) view]; “. I note you are really into giving statements without sources despite the host requesting that.
A blogger tried to replicate Church and White and found that they had mysterious adjustments as well.
http://euanmearns.com/how-much-have-sea-levels-really-risen/
And JCH, where is your proof of those rates? The NOAA or PMSL databases do not show that – or are you still in fairy land believing Mitrovica is the answer, whatever the question? Or is just cherry picking your start and finish dates at extremes over a very short time interval to show what you want it to?
Morner only refers to his own work as correct. This is a tell-tale sign of a crank. He is dismissing all the evidence of increased recent melting of glaciers or that warming oceans should also cause the sea level to rise faster more recently too. It turns out that the ocean heat content and water budget of glaciers explain the acceleration, and he does not account for the existence of either effect. Grade: Incomplete.
NY Battery is per year.
https://tidesandcurrents.noaa.gov/sltrends/global_50yr.htm?stnid=230-051
JCH, NOAA says the 50 year trend for Marseille is a lot lower than your fiction. In fact the 50 trend is lower than it was several decades ago. Go back to strummin’ that gee-tar. You might be better than pulling out numbers from where the sun don’t shine.
https://i.imgur.com/wB3WYUE.png
Jim D
If someone wants to accept your version of reality or that of Mörner, I think all they have to do is read his vast experience. Or do you want to go Mano a Mano with him on background? Of course you could pull out the usual Huffington Post trick and attack him personally in trying to discredit him. You know, that he still uses Brylcreem in his hair, or some other disqualifying attribute.
You also believe Morner with no doubts? Warming and glacier melting are accelerating, and Morner won’t acknowledge those facts either. You decide to believe Morner over 100 other scientists who actually have the data and understand it. I go with the majority publishing in actual journals rather than Morner. What is your estimated sea-level rise since 1990? What is Morner’s, in fact?
Pretty Picture JCH but where is it from?
JCH
Call up the Director of NOAA and tell him to get his data base straightened out. And while you’re at it, give CU a call and tell them we’re tired of waiting for the update of their 12/11/16 graph.
I have no idea why they have no updated. It does not matter. AVISO is updated to September 9, 2017.
My hunch would be NOAA has exactly the same data, and the exact same result.
If it is AVISO it has got GIA added as they say in their text PSMSL has the actual sea level rise for Marseille as 1.27mm/ year. NOAA have it as 1.25mm.
The easiest proof that AVISO data manipulations are garbage is look at one of their hot spots off the coast of NSW 1993 to May 2017 is greater than 10mm a year. Fort Dennison does not show that at all. Why the difference?
It’s not AVISO. It’s the tide gauge at that location.
The tide gauges at New South Wales with 30 years of data range from 1.x mm to 3.x mm. I don’t see any at 4 and above. Why is a gauge on a little rock in a harbor different? Call them up and ask them. The Australian government is still open.
ENSO and the PDO and the rate of Pacific sea level rise:
https://i.imgur.com/WEPiyPy.png
It would help if you could read JCH. The data for those stations is GIA corrected. That means it isn’t the actual values. The host makes a comment about it up thread
The actual data for Sydney harbour with 150 years of data is 0.56mm/yr. The AVISO shows just a short distance off the coast is >10mm/ year for over 25 years. That is a massive hill of water forming and the tide gauges aren’t picking it up. I wonder why that is?
It isn’t much use bothering the government of NSW (who have enough problems currently keeping the lights on because they have shut down coal burning stations) to inform them that some anonymous blogger lacks comprehension skills.
If you think both NOAA and PSMSL have got their data wrong, you tell them. I am certain they will be very receptive once they know your vast knowledge and publication record.
Sorry – spelling mistake. Sydney is 0.65mm/yr
The Australian BoM do a long term sea level monitoring programme in the Pacific – you know all those islands that are flooding. Guess what? – they aren’t. A place like Tuvalu has seen no sea level rise in 24 years.
http://www.bom.gov.au/ntc/IDO70056/IDO70056SLI.shtml
Another place that doesn’t match the AVISO data
Morner thinks the global average is like Tuvalu, but you showed that at least several stations have risen since 1950, which is rather contrary to what Morner would expect. Do you believe your tide gauges or Morner on those? Also with warming, wouldn’t it be physically impossible for the expansion not to cause a sea-level rise, or is warming (or expansion) another thing Morner doesn’t believe in?
NOAA has a data source:
https://i.imgur.com/Q6gluN3.png
Tide gauge for Tuvalu:
https://i.imgur.com/2CjE6Oy.png
That Tuvalu data from AVISO just confirms that it is all adjustment.
Again, that is tide gauge on an island nation. AVISO has no involvement with it or its result. It’s from the PSMSL.
JCH you are correct that the data is from PSMSL but their rate is junk. It isn’t LMS but some very unusual maths – they apparently made the change in late 2015. It is also different to their later long term trends.
http://www.psmsl.org/products/trends/trends.txt
For Tuvalu, they have only had data since April 1993. Here is the data
http://www.psmsl.org/data/obtaining/rlr.monthly.plots/1839_high.png
It shows the very big influence of the 1998 El Nino and an annual cycle. Doing LMS on the entire data set gives a rate of 3.57mm/year because of the 1998 spike. If one does it on the data since Jan 2000, it is 0.6mm a year.
For Marseille, there is an obvious long cycle wave of about 60-70 years that even Blind Freddie can see
http://www.psmsl.org/data/obtaining/rlr.monthly.plots/61_high.png
If one takes a very short period, then you can have all manner of trends away from the long term of 1.3mm a year. If one takes all the data since the turning point Jan 2010, then the sea level has dropped 6mm a year.
You posted the NOAA tides and current graph for the entire record of the tide gauge at Marseille: 1.25 mm per yr.
I responded that the 30-year trend for that gauge is 3.53 mm per year.
The kid responded with the usual – I’m making it up:
JCH, NOAA says the 50 year trend for Marseille is a lot lower than your fiction.
So I spent the time to take the 30-year picture of the PSMSL graphic for that tide gauge:
https://i.imgur.com/wB3WYUE.png
So let’s test the calculations at PSMSL against the calculations at NOAA tides and currents.
PSMSL trend is 1.27 mm per yr; NOAA Tides and Currents is 1.25 mm per yr:
https://i.imgur.com/iFtkSft.png
50-year trend at Marseille:
https://i.imgur.com/X5k6prB.png
About 1/2 of their 30-year trend.
There is also a major problem in doing a short term linear analysis on a cyclic pattern. Take a standard one cycle sine wave. Do any linear analysis on it and it will come out with negative slope. Start at 180° go for full cycle and the slope will be positive yet it is the same series. It demonstrates is that you don’t use linear analysis for a cycle unless it is over at least several cycles.
“one should be cautious about computations of acceleration in sea level records unless they are longer than two cycles of the oscillation or at least account for the possibility of a 60-year oscillation in their model. This especially applies to interpretation of acceleration in GMSL using only the 20-year record of from satellite altimetry and to evaluations of short records of mean sea level from individual gauges.”
This is from Chambers et al 2012. It addresses any attempts at drawing inferences from a period shorter than 2 cycles of the possible oscillations at play. Others have suggested needing up to 100 years before reaching conclusions about acceleration in the rate of rise.
Resettling in the Ganges/Brahamputra Delta – Bay of Bengal
The issues cyclone storm surge and of sea level rise are greatest in the Bay of Bengal where Bangladesh’s growing population and effort to resettle Rohingya refugees is pushing them onto newly formed low lying islands.
E.g., Bangladesh moves ahead with plan to relocate 100,000 Rohingya …
http://www.cnn.com/2017/12/06/asia/rohingya-bangladesh-myanmar-intl/index.html
Where is Thengar Char?
There the sea level factors we think we may understand; but there is one that we clearly don’t understand: ENSO.
https://geosciencebigpicture.files.wordpress.com/2015/08/nino-sea-level.png
From a strictly thermodynamic point of view, ENSO has absolutely no right to raise sea level. The trade winds pile up warm water against Indonesia and this warm water is mechanically forced to depth. This should actually raise sea level during Ninas; but it doesn’t.
Then some mysterious combination of flagging trades, QBO, and the up and downwelling effects of Rossby and Kelvin waves sloshing back and forth across the Pacific; suddenly releases this mechanically submerged warm water eastward across the Pacific ocean surface. We call this a Nino. It should actually lower sea level, but it doesn’t.
Thermodynamically, ENSO should be inversely correlated with sea level, but it is strongly positively correlated.
Mesuspects the waves (Rossby and Kelvin) be doing it.
The Eastern Pacific is big. It is a large surface area, and the ENSO tongue is a large portion of the earth’s equator. Evaporation.
Evaporation causes sea level to rise?
Where it does and does not rain could cause it to fluctuate.
Don’t confuse you not understanding something with it being understood by no-one.
Chambers et al. 2017 (full pdf link) evaluates the sea level budget in terms of mass and thermosteric components. There is actually a relatively small positive correlation between ENSO and thermosteric SLR. This can be explained through a change in the global average net feedback strength due to the longitudinal pattern of temperature in the tropical Pacific. Stronger positive feedbacks during El Nino, weaker during La Nina.
However, the larger factor is the mass change associated with ENSO, which appears to be caused by change in land-sea water exchange primarily through change in rainfall patterns.
Thanks for the links. Forgive me if “net feedback strength” absorbed in the less than human hair thickness of the warmer ocean surface does not impress. If we are going to say Ninas rain more over land and Ninos more over ocean, and there is more rainfall during Ninos; decreased surface salinity could account for the “steric” component.
The mass balance makes sense, but bear in mind that the error bars approach the variance, and the Grace/Argo correlation is dismal outside of the ENSO interval.
Grace Argo Ocean Mass Boening et al 2011
The FUND integrated assessment model is by far the most detailed and advanced. It shows the economic impacts of emissions by 7 impact components and 16 regions. The Sea Level Rise impact component is one of the smallest. Using an ECS of 3 °C for a doubling of CO2 and a 5% discount rate, the FUND3.9 Julia program show impacts from 2018 as a percentage of GDP on a global basis is -0.0094% of GDP, which is insignificant. The only impact component that is smaller is severe weather (storms and hurricanes), which is -0.0034% of GDP. For comparison, the agricultural impact is +0.329% of GDP. The + sign means the impact is beneficial.
Using a (too low) discount rate of 3%, the sea level rise impact at ECS = 3 °C, is -0.015% of GDP. The agriculture impact is +0.234% of GDP.
However, a more realistic ESC is 1.0 °C. Nic Lewis calculated a best estimate of ESC of 1.45 °C based on empirical measurements, but he falsely assumed that all of the warming since 1860 was due to greenhouse gas emissions. Correcting that estimate for the millennium warming cycle, ie, the temperature recovery from the Little Ice Age, and the urban heat island effect gives an ECS best estimate of 1.0 °C. Using this estimate and a 5% discount rate, the FUND model shows that the sea level rise impact is only -0.0049% of GDP. That can be compared to the agriculture impact of +0.461% of GDP, and the sum of all global impacts is +0.353% of GDP. These figures show that CO2 emissions are a wonderful by-product of fossil fuel use. The ECS = 1 °C calculation is at https://www.friendsofscience.org/index.php?id=2330
Excellent comment. Well said, and thanks for posting this information.
Just to be clear however, I doubt the ECS=1.0 C estimate. Since it is not my area of expertise, I am inclined to accept Nic Lewis’s conclusions that the best estimate is probably in the range 1.65 to 2.0 C, based on about 15 recent published papers on estimates from empirical data.
Correction – Nic Lewis said ECS is most likely 1.6-2.0 °C, based on recent estimates from empirical data. See his comment here:
https://judithcurry.com/2017/04/18/how-inconstant-are-climate-feedbacks-and-does-it-matter/#comment-846504
Genuine question Peter: even though you acknowledge a lack of expertise in the area, you choose to follow one particular expert whose views are right at one extreme of the field. Why?
Even IPCC recognises the models are running too hot. When models and empirical evidence do not agree, I’ll accept the evidence. What’s your reason for believing the models?
Peter, there’s a wide range of ECS from a diverse range of methodologies, hence the 1.5-4.5 range. I, like you, am no expert in this and i wouldn’t claim to favour one study over any other.
To say, as you do, that you *don’t* have expertise, but *do* favour one methodology over others, seems to sit rather uncomfortably.
I’d say the same if you were advocating ECS=4 on the basis of paleo, for instance.
In the section someone recommended on how to measure sea level, Please address how the thousands of years before present sea levels are measured in data also and uncertainties. Seeing charts from 1880 on or just charts from the satellite era on wont give perspective of long term fluctuations.
You might consider an executive summary added to the TOC. I tend to like details but if intended for general public (like me) or elected officials they will get tired of reading to the end to see conclusions and possibly get confused by too many numbers.
Judith
This article has been on the university of Colorado sea level pages for a year
http://sealevel.colorado.edu/content/new-group-publication-detection-accelerated-sea-level-rise-imminent-fasullo-et-al
It demonstrates that the expected sea level rise has not yet actually occurred and tries to explain why not. For some reason the university has not updated it’s graph to include 2017. I would have expected a rise, so perhaps they might be worth contacting to get an update.
In the UK the aptly named professor duck, who I have previously quoted, is an expert on geologic subsidence, by far the single biggest factor in the UK for sea level changes and the met office and environment agency work together on sea level.
The latter is responsible for physically assessing actual rises and then building the appropriate flood defence measures on rivers and coasts.
I was on the flood defence committee of the latter organisation for some nine years.
The Kyoto agreement compels them to add in a factor for sea level rise. They are somewhat more pragmatic though and assess local conditions.
Local conditions are often somewhat different to global conditions . As you know, in some places sea levels are actually falling and that I believe includes some parts of America.
As you say, there is a complex interaction which is one of the reasons I dislike ‘global’ averages as they hide local nuances and we live our lives locally, not globally.
Have you managed to get hold of any historic local sea level tables as they might be revealing?
Tonyb
Science keeps moving.
https://media.nature.com/m685/nature-assets/nclimate/journal/v7/n7/images/nclimate3325-f4.jpg
That many of the areas of the world with high ranges of tides are in the areas of Alaska, Canada, and northern Europe has created a misconception that the range of tide increases with increasing latitude (as one moves farther from the equator and closer to the poles). This is incorrect.
Increased tidal ranges in these areas are created by the positions and configurations of the continents in the northern hemisphere. In the higher latitudes of the northern hemisphere, the continents of North America, Europe, and Asia are pressed closer together. This “constriction” of the oceans creates the effect of a higher range of tides.
In the higher latitudes of the southern hemisphere, in the southern tips of South America, southern Africa, Australia, and Antarctica, tidal ranges are not increased. In these areas the continents are not pressed closely together, there is not a “constriction” of the oceans, and the tidal ranges are not increased.
If you only consider a few locations, this may seem to be true; but it is not the case. Literally hundreds of locations in the extreme north and south latitudes have small tidal ranges, and a number of stations closer to the equator have large tidal ranges. For example, Korea is at roughly the same latitude as most of the U.S. coast. Numerous stations in Korea have a tidal range of more than 20 feet, most of the U.S. coast has a tidal range of 3-6 feet. A number of locations very near the equator which have a tidal range of 15-17 feet.
“The typical tidal range in the open ocean is about 0.6 meters (2 feet). Coastal tidal ranges vary from 0 to over 11 meters (38 feet). The range of tides increases with distance from the equator. [link]”
–
This comment seems wrong to me , Judith.
I used to live in Darwin and the sea there can go out for nearly 2 miles before coming in. We had huge tide rises at the Darwin Stokes Hill wharf.
We had a fish trap that was easily covered at 6 foot of height by a standard sea after it came in. At king tides it would come up another 6 foot with no problems and breach the beach.
–
My limited understanding (Southern Hemisphere) was that the tides would be higher at the equator, being closer to the gravitational pull than to the poles on the sun/moon side and being pulled away more by inertia on the side furthest away from the sun/moon.
According to this statement the highest tide stress would be at the North Pole yet the ice does not buckle and break with these supposed high tides.
Critique of IPCC framing and confidence limits:
https://www.glaciology.net/2014/ar5-sea-level-rise-uncertainty-communication-failure/
95% confidence limit estimate of 180cm at 2100:
https://www.glaciology.net/publication/2014-10-23-upper-limit-for-sea-level-projections-by-2100/
Evaluation of acceleration in the signal:
https://tamino.wordpress.com/2017/07/25/sea-level-rise-has-accelerated/
The thing is even accepting your assumption these results are predicated on RCP8.5 that is itself very unlikely. By the time you add a 95% confidence limit on top of that you are at very low levels of likelihood, say 2 in a 1000, and occurring in 80+ years’ time with plenty of warning.
There are bigger risks out there to worry about.
You have to consider two different methods to evaluate sea levels-tidal gauges, that has been used for a long time, and satellites, in use for a short period of time.
Tidal gauges show less rise in sea levels. They even show how rises have been varying during different periods-and show no acceleration!
“Even if it is assumed that 100% of the recent global sea level rise is caused by anthropogenic sea level rise (an assumption that will be examined in Part II), local sea level rise can be dominated by ocean circulation patterns, land use practices and astronomical tides.”
One can assume anything for amusement, but the fact is that global sea level has been rising for several thousand years and this natural rise shows no sign of ceasing. Nothing that the human species can currently do will halt or slow this process. It has been suggested that humans have caused an increase in the rate of sea level rise, but it is doubtful whether this human influence (which may well be real) can yet be distinguished from natural fluctuations in the rate.
As you are aware there are major local variations from the global pattern, with coastal land in some regions sinking faster than the average and in other regions being uplifted with respect to mean sea level. Local sea level change, which is what really matters, is more directly and more effectively estimated from tide gauge records than from satellites.
What is certain is that people will have to adapt according to local circumstances.
“What is certain is that people will have to adapt according to local circumstances.”
Important point. Downtown NYC is an accident waiting to happen – in fact it did happen during Sandy. And it will happen again.
Scientific American had a story describing some slr hotspots in the Gulf coast area. https://www.scientificamerican.com/article/sea-level-rise-is-speeding-up-in-parts-of-the-southeastern-u-s/
They fail to mention subsidence as a cause, but it highlights the fact that some coastal urban area are in considerable peril. This will impact millions of people, and is inevitable considering that we have tens of millions living in these areas.
Can any review of SLR be complete without an agreed figure for SLR per degree C change; or at least a discussion about why this figure, which has properties similar to a physical “constant”, seldom is used in publications or discussions?
It’s absence invokes oblique, non-physics expressions of the worldly condition. Geoff.
“We’re talking about literally giving up on our coastal cities of the world and moving inland.” – Dr. Michael Mann, Penn State [link]
…even with a large percentage of population living there today, can be a relatively minor problem if it is managed appropriately.
But the euphemistic ‘managed appropriately’ in many cases does actually mean giving up coastal cities and moving inland, so you would seem to be agreeing with Mann’s assessment here.
—————————————–
Excluding the unrealistic RCP8.5 emissions scenario, the probability of exceeding a 1 m sea level rise is 3% or less.
Given the importance of this exclusion, you’d need some very strong evidence to justify it. None is provided here. To date, observed GHG concentrations are overall (some lower, some higher) tracking closely with RCP8.5, significantly above the other scenarios.
Even if one accepts the IPCC and NOAA predictions of 21st century sea level rise, emissions reductions will have little or no impact on the course of sea level rise this century (Part IV).
The IPCC medium confidence, likely numbers are plainly laid out for different emissions scenarios. If we arbitrarily limit our time horizon to 2100 a significant amount of sea level rise is essentially unavoidable even with severe emission cuts. The likely RCP8.5 range is about 50% higher than for RCP2.6. I guess you could argue that is a relatively small impact given the huge difference in emissions. However, looking just to the first few decades beyond 2100 the divergence increases rapidly.
Potential sea level rise outside the likely range is heavily asymmetric towards higher amounts due to plausible ice sheet collapses. And the risk of rapid ice sheet losses increases substantially under higher emissions scenarios. For example, DeConto and Pollard (2016) suggest an Antarctic contribution of 1.05m by 2100 under RCP8.5 but only 0.11m under RCP2.6. Even more importantly, they suggest multi-metre rises in the 22nd Century even under moderate mitigation scenarios, whereas the strong mitigation RCP2.6 scenario produces only a very small rise in their model.
———————————————
The focus on emissions reductions as some sort of solution to sea level rise (apart from any determination of cause) is distracting from developing better land use policies and coastal engineering practices.
Evidence required for this assertion. It’s not clear why there would be any overlap at all between people involved with local coastal engineering and people involved with national and international policies on emissions.
Reblogged this on pdx transport.
[youtube https://www.youtube.com/watch?v=63sM0uX3QGs&w=640&h=360%5D
As always in science, if you want to understand what’s going on, then it’s best to start with the peer-reviewed scientific literature, not some blogpost.
Sea level rise results from melting land ice and thermal expansion of water. Warming causes thermal expansion and land ice melt. Thus, one would expect warming to increase the rate of sea level rise. And that’s the case. For example:
“Global sea level linked to global temperature”
“Temperature-driven global sea-level variability in the Common Era”
In the 20th century to the 21st century, global warming occurred from the ~1900s to ~1940s, then slight cooling (or temperature stagnation) from ~1940s to the ~1970s, and then global warming from the ~1970s onwards. For example, see:
“Estimating changes in global temperature since the pre-industrial period”
“A reassessment of temperature variations and trends from global reanalyses and monthly surface climatological datasets”
“Deducing Multidecadal Anthropogenic Global Warming Trends Using Multiple Regression Analysis”
“Early onset of industrial-era warming across the oceans and continents”
Given the aforementioned points, one would expect the rate of sea level rise to change in response to global warming patterns of the 20th century, with greater sea level rise in the late 20th century as compared to the mid-20th century. That’s clearly shown in:
Table 2 of “Twentieth-century global-mean sea level rise: Is the whole greater than the sum of the parts?”
Figure 3: “Considerations for estimating the 20th century trend in global mean sea level”
Figure 1B: “Reassessment of 20th century global mean sea level rise”
“Recent global sea level acceleration started over 200 years ago?”
“Trends and acceleration in global and regional sea levels since 1807”
“A 20th century acceleration in global sea-level rise”
“Sea-level rise from the late 19th to the early 21st century”
“An anomalous recent acceleration of global sea level rise”
“Probabilistic reanalysis of twentieth-century sea-level rise”
Other papers confirm the increased post-1990 rate of sea level rise shown in some of the above papers; this increased post-1990 rate is greater than the rate during the mid-20th century. The other papers also show that sea level rise acceleration post-1990, predominately due to increased land ice melt:
“Trends and acceleration in global and regional sea levels since 1807”
“Evaluation of the global mean sea level budget between 1993 and 2014”
“Considerations for estimating the 20th century trend in global mean sea level”
“New estimate of the current rate of sea level rise from a sea level budget approach”
“Reassessment of 20th century global mean sea level rise”
“The increasing rate of global mean sea-level rise during 1993–2014”
“Unabated global mean sea-level rise over the satellite altimeter era”
“An increase in the rate of global mean sea level rise since 2010”
Now the question becomes how much humans contributed to this sea level rise and sea level rise acceleration. The following papers that reveal the anthropogenic component of recent sea level rise:
A: “Internal variability versus anthropogenic forcing on sea level and its components”
B: “The rate of sea-level rise”
C: “Quantifying anthropogenic and natural contributions to thermosteric sea level rise”
D: “Detection and attribution of global mean thermosteric sea level change”
E: “Long-term sea level trends: Natural or anthropogenic?”
F: “Anthropogenic forcing dominates sea level rise since 1850”
G: “Anthropogenic forcing dominates global mean sea-level rise since 1970”
H: “Detecting anthropogenic footprints in sea level rise”
I: “Model estimates of sea-level change due to anthropogenic impacts on terrestrial water storage”
J: “Is anthropogenic sea level fingerprint already detectable in the Pacific Ocean?”
K: “Uncovering an anthropogenic sea-level rise signal in the Pacific Ocean”
Paper A surveys much of the relevant scientific literature, reviewing the scientific evidence that shows that most of the sea level rise since the 20th century is anthropogenic.
Papers B, C, D, E, F, and G note that most of the sea level rise is anthropogenic.
Paper H notes that >45% of the sea level rise is due to humans (this paper is looking to set a minimum value for the anthropogenic component, not show what the precise contribution actually is).
Paper I notes that human usage of terrestrial water (which does not account for all the ways in which anthropogenic climate change can result in sea level rise; for example, it does not account for thermal expansion of water) accounted for about 42% of the sea level rise.
Paper J notes that the anthropogenic effect on sea level rise in one region of the world (the Pacific Ocean) over one period of time (1993-2013) is too small to detect at a statistically significant level due to factors such as:
a) small sample size (only 20 years),
b) the effect of control variables (such as the IPO),
c) limitations of satellite altimetry measurement, the technique being used to measure sea level in paper H.
Paper K offers a contrasting account of paper J, noting that part of the Pacific sea level rise is anthropogenic.
And the following paper shows that sea level rise is tied to CO2 levels on geological time-scales:
“Relationship between sea level and climate forcing by CO2 on geological timescales”
Can you please provide links to the papers you refer to (or at least authors, journal etc). Thx
Re: “Can you please provide links to the papers you refer to (or at least authors, journal etc). Thx”
I gave the title of each paper, which should be enough to locate them on Google Scholar (https://scholar.google.com/schhp?hl=en&as_sdt=0,21).
But if you want links, then here are a few links for some of the initial papers I mentioned on sea level rise:
Table 2 of “Twentieth-century global-mean sea level rise: Is the whole greater than the sum of the parts?”
http://journals.ametsoc.org/doi/full/10.1175/JCLI-D-12-00319.1
Figure 3: “Considerations for estimating the 20th century trend in global mean sea level”
http://onlinelibrary.wiley.com/doi/10.1002/2015GL064177/full
Figure 1B: “Reassessment of 20th century global mean sea level rise”
http://www.pnas.org/content/early/2017/05/16/1616007114.full
“Recent global sea level acceleration started over 200 years ago?”
http://onlinelibrary.wiley.com/doi/10.1029/2008GL033611/full
“Trends and acceleration in global and regional sea levels since 1807”
https://debris.glaciology.net/wp-content/uploads/2016/03/jevrejeva-gloplacha13-virtual-station-recon-w-gia.pdf
“A 20th century acceleration in global sea-level rise”
http://onlinelibrary.wiley.com/doi/10.1029/2005GL024826/full
“Sea-level rise from the late 19th to the early 21st century”
https://link.springer.com/article/10.1007/s10712-011-9119-1
“An anomalous recent acceleration of global sea level rise”
http://journals.ametsoc.org/doi/full/10.1175/2009JCLI2985.1
“Probabilistic reanalysis of twentieth-century sea-level rise”
https://ecirtam.net/autoblogs/autoblogs/philippescoffoninet_6ee536a51b605afeea0fff826daca8eb3e69f70a/media/0fc4ccc3.niveau-marin-20C3A8me-siC3A8cle.pdf
Consistent with the aforementioned sea level rise acceleration, a number of articles have projected global sea level rise of around 1m or more by 2100, based on past estimates of sea level rise (in response to warming) and based on melting of land ice (with thermal expansion):
“A semi-empirical approach to projecting future sea-level rise”
“Testing the robustness of semi-empirical sea level projections”
“Kinematic constraints on glacier contributions to 21st-century sea-level rise”
“Contribution of Antarctica to past and future sea level rise”
“Global sea level rise scenarios for the United States National Climate Assessment”
“Reconstructing sea level from paleo and projected temperatures 200 to 2100AD”
“Global sea level linked to global temperature”
“Upper limit for sea level projections by 2100”
Furthermore, some areas of the globe experience more accelerated sea level rise than other regions of the globe. For instance:
“Hotspot of accelerated sea-level rise on the Atlantic coast of North America”
And sea level rise will have various economic, environmental, etc. impacts. These impacts can be mitigated by a number of human actions that limit global warming, including limiting greenhouse gas emissions. For example, see:
“Carbon choices determine US cities committed to futures below sea level”
“Economic impacts of climate change in Europe: sea-level rise”
“Future flood losses in major coastal cities”
“Forecasting the effects of accelerated sea-level rise on tidal marsh ecosystem services”
“Coral islands defy sea-level rise over the past century: Records from a central Pacific atoll”
Simply put, give up using Jevrejeva’s way too high rate of SLR from ~1920 to ~1945.
Sea level rise results from melting land ice and thermal expansion of water. Warming causes thermal expansion and land ice melt. Thus, one would expect warming to increase the rate of sea level rise.
–
Sea level rise results from melting land ice that reaches the sea and thermal expansion of sea water. (Note fresh water actually shrinks on warming from freezing point to 4 C.).
Warming is known to both increase snowfall and rainfall.
See Greenland mass increase last year which would have caused a drop in the sea level.
Diito the Antarctic which has had increasing ice accordinding to latest GRACE analysis 2 years ago.
Ditto the Australian floods of several years ago.
So one could expect warming to decrease the rate of sea level rise.
Best to give all the facts, not just one side, surely?
February 2016 – 7.98 cm
September 2017 – 8.04 cm
Re: “Warming is known to both increase snowfall and rainfall.
See Greenland mass increase last year which would have caused a drop in the sea level.”
Ice losses outweigh increases from precipitation. See:
“Latest claim: The Greenland ice sheet is growing”
https://www.youtube.com/watch?v=bEieWJghRNY&t=1s
And please don’t waste my time by misrepresenting the DMI. I’m tired of denialists doing that. The DMI clearly says:
“The calving loss is greater than the gain from surface mass balance, and Greenland is losing mass at about 200 Gt/yr”
https://www.dmi.dk/en/groenland/maalinger/greenland-ice-sheet-surface-mass-budget/
That’s consistent with other research on longer term trends in Greenland ice, and how these trends contribute to sea level rise. For example:
“A high-resolution record of Greenland mass balance”
“Antarctica, Greenland and Gulf of Alaska land-ice evolution from an iterated GRACE global mascon solution”
“Greenland and Antarctica ice sheet mass changes and effects on global sea level”
NASA has a nice layman’s level page on this as well:
https://climate.nasa.gov/vital-signs/land-ice/
Re: “Diito the Antarctic which has had increasing ice accordinding to latest GRACE analysis 2 years ago.”
Be careful that you don’t engage in endpoint bias, where you act as if shorter-term fluctuations (that aren’t statistically significant) rebut statistically significant, longer-term trends:
“Unusually cold winters, a slowing in upward global temperatures, or an increase in Arctic sea ice extent are often falsely cast as here-and-now disconfirmation of the scientific consensus on climate change. Such conclusions are examples of *“end point bias,”* the well documented psychological tendency to interpret a recent short-term fluctuation as a reversal of a long-term trend.”
http://www.tandfonline.com/doi/full/10.1080/17524032.2016.1241814?scroll=top&needAccess=true
It’s funny to see denialists (a.k.a. fake “skeptics”) engage in that sort of endpoint bias. For example:
http://rationalwiki.org/wiki/File:ArcticEscalator2012_med.gif
Anyway, if you’re like other denialists, then your claim on Antarctic ice is probably based on the following NASA press release about the following Antarctic ice study:
https://climate.nasa.gov/news/2361/study-mass-gains-of-antarctic-ice-sheet-greater-than-losses/
“Mass gains of the Antarctic ice sheet exceed losses”
The study in question is an outlier; the study’s results contradict numerous other papers that show decreasing Antarctic ice levels. There have also been questions raised about the study’s results and methods. And NASA acknowledges that Antarctic ice is decreasing:
https://climate.nasa.gov/vital-signs/land-ice/
Some background on this (especially figure 1 of the first paper):
“Comment on ‘Mass gains of the Antarctic ice sheet exceed losses’ by H. J. Zwally and others”
“Comment on Zwally and others (2015)-Mass gains of the Antarctic ice sheet exceed losses”
“Spatial and temporal Antarctic Ice Sheet mass trends, glacio-isostatic adjustment, and surface processes from a joint inversion of satellite altimeter, gravity, and GPS data”
“A data-driven approach for assessing ice-sheet mass balance in space and time”
“Greenland and Antarctica ice sheet mass changes and effects on global sea level”
“A comparison of Antarctic ice sheet surface mass balance from atmospheric climate models and in situ observations”
“Ditto the Australian floods of several years ago.”
How is that relevant to what I said on sea level rise across the globe? Australia is not the globe.
“So one could expect warming to decrease the rate of sea level rise.
Best to give all the facts, not just one side, surely?”
No, you’d actually expect warming to increase the rate of sea level rise, for the reasons I already explained: melting of land ice and thermal expansion of water. And as I showed you, these factors outweigh decreases from precipitation.
Your position depends, ironically, on ignoring facts, whether willfully or not. I’ve given you some further material to read above. I suggest that you go inform yourself, before jumping to whatever conclusion you find ideologically-convenient.
“Your position depends, ironically, on ignoring facts, whether willfully or not.”
It is amazing how perceptive one can be about others while remaining blissfully ignorant of the same flaws when you choose to perpetuate them.
Calling out other people for doing exactly what you are doing is a height of hypocrisy.
–
For instance.
“please don’t waste my time by misrepresenting the DMI. I’m tired of denialists doing that”.
My factual comment being
“Greenland mass increase last year which would have caused a drop in the sea level.”
DMI says,
The surface mass balance is calculated over a year from September 1st to August 31st (the end of the melt season)
For the 2016-17 SMB year, which ended yesterday, the ice sheet had gained 544bn tonnes of ice, compared to an average for 1981-2010 of 368bn tonnes.
The ablation season [which started late] therefore ended roughly a week earlier than has been usual over the last couple of decades.
the Greenland ice sheet has seen a small positive change in ice for this year, The unusual year is mainly down to heavy snow and rain in winter and a relatively short and intermittent summer melt season.
The SMB for 2016-17 is the fifth highest in the 37-year record.
–
All DMI facts.
Conclusion, last year Greenland contributed to a drop in sea level.
You and DMI wish to arm wave about other facts, go ahead but my comment is true.
–
“Ditto the Antarctic which has had increasing ice according to latest GRACE analysis 2 years ago.”
Be careful that you don’t engage in endpoint bias, where you act as if shorter-term fluctuations (that aren’t statistically significant) rebut statistically significant, longer-term trends:
More hypocrisy. It’s funny to see warmists (a.k.a. true believers) engage in that sort of endpoint bias. Take this example off topic.
Longer term sea ice in Antarctica has been increasing , except for a recent short term fluctuation.
Then consider this
https://climate.nasa.gov/news/2361/study-mass-gains-of-antarctic-ice-sheet-greater-than-losses/
“Mass gains of the Antarctic ice sheet exceed losses”
For thousands of years and recently.
The study in question is not an outlier; It is the latest comprehensive in depth recent study.
It shows that fake news has been deployed in a grand scale.
“Ditto the Australian floods of several years ago.”
How is that relevant to what I said on sea level rise across the globe? Australia is not the globe.”
–
Well I’ll be danged.
–
“So much rain fell on Australia in 2010 and 2011 that the global sea-level not only stopped rising, but actually dropped measurably, according to a new study
The first two years of this decade saw a unique combination of three atmospheric patterns come together over the Indian and Pacific oceans, causing about 300 millimetres more rain than average to fall over the Australian continent. Australia’s unusual soils and topography prevented the majority of this precipitation from running off into the ocean, leading to a halt in the long-term trend of rising sea levels.
To conduct the research, a team of scientists led by John Fasullo of the US National Center for Atmospheric Research in Boulder, Colorado, combined data from three sources: NASA’s GRACE satellites, which make detailed measurements of Earth’s gravitational field, enabling scientists to monitor changes in the mass of continents; the Argo global array of 3,000 free-drifting floats, which measure the temperature and salinity of the upper layers of the oceans; and satellite-based altimeters that are continuously calibrated against a network of tide gauges.
The results showed that the mass in Australia and, to a lesser extent, South America began to increase in 2010 as the continents experienced heavy and persistent rain. At the same time, sea levels began to drop, eventually lowering by about seven millimetres.
This story was published in the October 2013 edition of Geographical Magazine”
–
Does that help?
You know with the biases and all??
Thanks to all for your very interesting comments. PLEASE provide links to any figures you show or papers/blog posts that you refer to. I would like to follow up on some of these, but have no idea how to find the original source. Thanks.
http://onlinelibrary.wiley.com/doi/10.1002/2015JC010716/full
This link to Visser et al 2015, is a paper that has identified 30 (Thirty) statistical and mathematical methods in developing trend models in various published papers on SLR. They show that use of various methods can result in contradictory inferences using the same data..
The authors acknowledge that no consensus has been reached as to how a possible acceleration could be separated from intrinsic climate variability. They also point out some authors have found a lack of acceleration.
Visser et al believe much of the misunderstandings/controversies are due to mathematical or statistical characteristics of the models applied.
The fact that the authors have identified 30 separate methods employed in various SLR papers begs for climate science to develop best practices in creating trend models. Otherwise they could be subject to criticisms for shopping around until one of the methods creates the answers they were seeking all along.
cerescokid: http://onlinelibrary.wiley.com/doi/10.1002/2015JC010716/full
Thank you for the link. The paper includes a reference to a textbook on the subject.
It’s hollow if you do not follow the citations.
By one of the authors, Sönke Dangendorf, of the paper to which you linked:
Reassessment of 20th century global mean sea level rise
And that is not the only one. Hay’s 1.2 mm per decade between 1900 and 1990 is looking better and better, as is her ~1.8 mm per year at ~1993. All of which points to an obvious acceleration in SLR.
JCH
The point of the link was not specifically whether there is acceleration or lack there of. It was a survey of the various mathematical and statistical methods in developing trend models. I knew the other citations. I was looking at the systemic vulnerabilities. If the science is to improve then they need to some sweeping reforms in how they practice it.
You missed the overall. But I’ll give you a pass. Tomorrow to the beaches.
No reforms are needed or called for at all, and no better system has been put forth.
JCH
That’s what cerescokid meant by trawling through the 30 to find the one that you want. You illustrate his point perfectly.
Utter nonsense.
Subsidence is not sea level rise, true? Shouldn’t we be clear on that? It can be measured, no?
Yes, we have made that point a number of times. Depending on geographical location the land can be static or can be rising or falling either due to tectonic activity or by glacial action. The amount of land change can often be greater than increased water in the system or thermal expansion.
These land changes are often all very local in effect therefore it is pointless to apply any theoretical global average.
.
I think if Judith was providing work to a specific client I would personally start with land changes as the first factor. As she remarked in the article such things as oil extraction can also make a big difference
Tonyb
It is not caused bythermosteric rise plus melting ice sheets, but looks like SLR locally and must be accounted for in planning.
bits
bits
Early in my efforts to research the SLR issue,I realized every time I read about significant local problems I could look up scientific studies about subsidence in that community and invariably there were papers citing a history of subsidence, often at rates multiples of GMSLR.
Judith ==> First brush — you must include “65 cm [25.6 inches]” type notations for US audiences/readers. Manager types are not likely to have rapid mental conversion ability.
Judith ==> For Chapter 1, I suggest a clear paragraph stating the differences between Local Relative SLR and Global SLR making the point that for localities (cities, counties, States) ,ONLY Local Relative SLR matters for their planning. Global SLR may be entirely irrelevant in areas of rapid or major subsidence or regions experiencing sea surface height increases out of proportion to Global SLR.
While my efforts have not been technical, I make several good points in my WUWT series on SLR. (They at least make interesting reading and provide a number of useful links).
Thx, this will be covered in part II
Judith ==> Good, I look forward to your comprehensive report.
Judith, a good reference is Kopp et. al., Probabalistic assessment of sea level during last interglacial stage, Nature 462: 863-867 (2009). The Eemian was 1-2C warmer than present at the equator, and up to 8C warmer in Greenland, for thousands of years. The Eemian highstand was ~6.6 meters higher than present sea level, and took ~30 centuries to reach. That is 22cm/century, about the present rate. (See my guest post on sea level rise, acceleratiin, and closure for data and sources.)
The only two papers as of ye2014 claiming sudden Eemian rise are deeply flawed, with one even comprising academic misconduct. See my guest post and longer essay of same name in ebook Blowing Smoke for details.
The data says there is nothing about sea level to be concerned about except locally
Oops. Title ofpost and essay is By Land or by Sea.
Missing above is discussion of ground water extraction contribution to sea level rise.
The 2010 paper indicated roughly a third of observed SLR was due to ground water extraction:
http://onlinelibrary.wiley.com/doi/10.1029/2010GL044571/full
A subsequent paper attributed more to past dam impoundment but was also mindful of accelerating ground water use.
And dams only reduce groundwater contribution during impoundment.
Once dams are full, they become positive sources to SLR due to evaporation, silt accumulation, and withdrawals.
Globally, dam building has all but ceased:
https://62e528761d0685343e1c-f3d1b99a743ffa4142d9d7f1978d9686.ssl.cf2.rackcdn.com/files/62677/area14mp/zj779n6b-1414099797.png
https://www.uq.edu.au/news/article/2014/10/dam-hard-water-storage-historic-headache-australia
Ground water will contribute a larger and large rate of SLR as the century continues. And it’s difficult to argue that humans should not have access to fresh water.
TE
Thanks for reminding us of that paper. I seem to recall that a significant proportion of ground water was new , to the system, in as much it had been pumped up from underground and therefore didn’t appear in any other calculation
Tonyb
Yes, estimates are for continuing increases of extraction:
http://staging.unep.org/dewa/assessments/ecosystems/water/vitalwater/images/09-wateruse-sectorM.jpg
though, presumably, peak population and more efficient agriculture could reverse this.
Also, it could be that dams in the US are a net positive, both because they are past peak capacity and impoundment, but also, there appears to be a trend of removing them:
https://thefisheriesblog.files.wordpress.com/2016/03/cdam_g1.jpg
TE, I dont think very highly of that paper. There are three reasons.
1. If groundwater extraction is 1/3 of SLR, then it is ~0.7-1mm/year. But CORS corrected (diff GPS) tide gauge rate is 2.2mm, and that reaches closure with two separate estimates of thermosteric rise plus ice sheet mass loss. See my guest post on SLR, acceleration, and closure for details and references. There is no closure if you also add to thermosteric rise and ice sheet mass loss that groundwater estimate.
2. With few exceptions ( north central India, the Ogallala in US), goundwater is replenished annually by precipitation—well levels dont fall, with a few exceptions like Miami’s Biscayne acquifer.
3.Those few places where goundwater is clearly depleting simply cannot provide enough water for the mooted 1/3 of SLR.
Judith
Further up the thread we were having a discussion about the vital importance of taking into account local changes in land height, whether it is sinking or rising or static, irrespective of what the water levels itself are doing.
In my previous article I cited this map from Durham university which illustrated these changes around the coast of Britain. Even in a small country such as ours the land is falling in some places and rising in others, primarily due to glacial action
.http://www.geosociety.org/gsatoday/archive/19/9/pdf/i1052-5173-19-9-52.pdf
Presumably something similar must exist for the states? It’s a very good place to start with looking at the whole picture and with your comments about changes due to oil extraction, I am sure some of the figures for local land changes would be startling and much greater than the individual component of increased water in the system or thermal expansion.
Tonyb
~1 meter of ground water extraction contribution to subsidence in Vietnam:
http://iopscience.iop.org/article/10.1088/1748-9326/9/8/084010
To remind yourself that coastal flooding is nothing new, has always happened, and even when global temperatures were thought to have been lower, look at
Wiki’s List of Settlements Lost to Floods in the Netherlands.
Also, Wiki’s list of Underwater Ruins
You’ll find many claims of global warming at work, but they’re nearly always followed immediately with a geologic explanation which may well be the primary cause, tarnished with confirmation bias.
Also worth a look, the list of Sunken Cities
Though technically correct, the use of the word astronomical in the article may cause confusion. The common usage of the word meaning is something very large, rather than just associated with the stars and planets.
In the Nordic area the sea-level is declining. The land is still rising after the last ice age. When sea level is declining here, it must also rise elsewhere. …and even small changes in the tectonic plate movement must have an impact too.
Given that it has yet to be determined that humans are causing discernible global warming, I have to wonder how attribution of sea level rise is possible. http://www.cfact.org/2018/01/02/no-co2-warming-for-the-last-40-years/
“What passes for science includes opinion, arguments-from-authority, dramatic press releases, and fuzzy notions of consensus generated by preselected groups. This is not science.” John Christy, Sept. 20, 2012
Sea level by satellite don’t match tide gauges, don’t capture their spatial variability, have issues in the coastal zone, have – apparently – calibration problems and the record is far too short to make definitive claims.
The other question to ask is what caused very modest sea level rise – nothing beyond the capacity of coastal engineering – in the 20th century. The ability of engineered structures and emergency responses to such things is determined – btw – by the state of regional economies.
Robert Ellison: “The ability of engineered structures and emergency responses to such things is determined – btw – by the state of regional economies.”
If I understand you correctly you are saying that if you take care of your economy then your economy will take care of everything else. I look forward to the day when an IPCC report contains this single statement in its ‘Summary for Policymakers’.
The ability of engineered structures and emergency responses to (cope with) such things is determined – btw – by the state of regional economies.
Economic development is the key to environmental conservation as well. environment in that.
The overarching question concerning sea level rise is:
Why should we care?
The answer can only be given in the specific because there is no more reason to object to rising seas in the abstract than there is to approve of it in the abstract.
The best example I’ve found of clear thinking about how to develop strategies for dealing with the uncertainties that inevitably arise when moving from the abstract to the specific is contained in the UK Climate Projections report of 2009 on London. The takeaway message is that successful adaptation in the face of uncertainty will require, above all else, the understanding that adaptation is a continuous process – namely, a continuous watching brief and continuous review in order to stay within the envelope of safety. Where we don’t know the answer in advance, our primary focus should be on building a capacity for flexibility.
http://ukclimateprojections.metoffice.gov.uk/media.jsp?mediaid=87898&filetype=pdf
“Groundwater extraction and petroleum extraction – regions in Houston have sunk as much as 10 feet since 1920”
Florida’s coastal sea level rise gets a lot of press, but its land subsidence problem is rarely mentioned in context to sea rise in the media, even though it’s well known by scientists and engineers. The states substrate is made up of highly erosive salts, gypsum and limestone, thus its propensity for sinkholes. The Everglades Agricultural Area has sunk many feet over the decades, caused by water drainage of the soil from terra forming and aquifer depletion. Large areas of cement/asphalt on coasts, the weight of huge cities.
Reference:
“In the 1930s, a study was conducted at UF/IFAS EREC to relate the rate of subsidence to the depth to water table (Neller 1944). Based on all of these studies, Stephens and Johnson (1951) concluded that the subsidence rate would be one foot per decade assuming that the water table is maintained at an 18–24 inch depth. The resulting subsidence rate was calculated to be 1.2 inches/year, and this estimate was later substantiated by Shih et al., 1978 by monitoring the transect lines. Shih et al. (1998) measured surface elevation along the subsidence lines following a 19-year lapse in measurement, and concluded that the subsidence rate during this period averaged 0.57 inches/ year. This rate was significantly lower than the 1.2 inches/ year calculated by Stephens and Johnson (1951), and Shih et al. (1998) speculated that maintenance of higher water tables after 1978 was one of the major reasons for the observed reduction in the subsidence rate.” http://edis.ifas.ufl.edu/pdffiles/SS/SS52300.pdf
Maintenance of water tables, and the growth of sugarcane are a couple of the reasons for a slower rate of subsidence in parts of Florida after 1998. But .57 inches of subsidence yearly is still significant for a state barely above sea level.
“subsidence problem is rarely mentioned ….”
That is not an accident. If they were mentioned, people would start thinking about the issue. Then they would start asking questions. Then the light bulbs might go blink. The last thing the complicit MSM want is to have anyone thinking about AGW. It can become pretty messy. We can all name several things that aren’t mentioned in conjunction with the usual horror stories.
Yes indeed, ceresco, it’s unbelievable the amount of disinformation, and misinformation, under the guise of an AGW education, that’s leveraged by the media to brainwash citizens. Scientists like Mann fan the flames with statements like these: “We’re talking about literally giving up on our coastal cities of the world and moving inland.” Evidence suggests that most CAGW activists are under the strain of prolonged hyperventilation stresses, ironically needing a cool blast of CO2 to balance the bags of hot O2 delivering unfettered drunken delusion to the brain.
Progressive leaders have been using disinformation leveraged with a willing media for decades to manipulate the public. Look at one contemporary influential leaders partial resume, Angela Merkel’s, as one example: a PhD in physics (who stated 400ppm CO2 is poison), a press secretary, a political activist, a student of Marxism (a perestroikaist with an ecological leaning), an environmental activist, in her early career a head of the FDJ’s local department for Agitation and Propaganda at the Academy of Science, the Institute of Physical Chemistry in Berlin, Adlershof. It’s no wonder why she got along so well with Obama as they strutted the world stage promoting globalism, which frankly is simply another form of tribal nationalism on steroids.
oh mercy, the subsidence. Lol. Historic Galveston, the shining point of light ahead of sunken Harris county.
JCH – what is your point? Are you denying that subsidence is a major part of slr in the Gulf area, and that it’s almost always neglected in msm coverage, and even in publications which purport to be about science?
Read https://www.scientificamerican.com/article/sea-level-rise-is-speeding-up-in-parts-of-the-southeastern-u-s/. This is a perfect example. There’s not a single mention of subsidence. Rather we get the default go-to reasons for slr being anthropogenic factors.
“Sea level rise near the end of the century that affects a tiny percentage of the land area of a country,…”
Should that be “Sea level rise over the course of a century that affects a tiny percentage of the land area of a country,…” ?
The audience for the report is important. Politicians both local and national are in general scientificaly illiterate and incapable of knowing what questions to ask or if the answers are correct or not.
These decisionmakers are risk averse and conservative and will be led by similar minded bureaucrats and scientific advisers. Simplified graphics and examples are an important component that can’t be underestimated if the message is to have effect. Dr Christie’s recent analyses of the IPCC attempt to bury information with graphics that were almost impossible understand by redrawing and thus illucidating the message was a great example to follow, simplicity is the key for the unscientific to understand complex science.
Be sure to distinguish change in sea level and RATE of change of sea level. Sometimes I read too quickly and miss the crucial term “rate”. Maybe metric units in bold face. (Ok, if you must, include “feet” and “inches”)
What is Sea Level? minutephysics. 3.26 minutes of fun 2,881,667 views
Well worth everyone here having a read.
Basically it is almost impossible to give an actual definition of an actual sea level.
GPS definition uses very complicated maths.
Reconciling it with actual tide gauges is very tricky.
–
Not to say we cannot pick points out and have a try, just to be reminded that extrapolation is fraught with difficulty.
–
So Judith can do a great job with local data for local areas.
It is possible to do large scale models but realise that they are models only, not the actual reality.
–
Insofar as isostatic glacial rebound and both subsidence, mentioned a lot and uplifting, rarely considered are concerned the effects of sea level rise are actually locally important, not a general concern.
Angech – Glacial rebound and subsidence not a general concern? I beg to differ. If you rely at all on tide gauges these factors are of paramount concern. If you rely on satellite data then the measurement issues are the concern. From what I’ve read the satellite data is a mess, and those who promote it claim accuracy to the millimeter, which is absurd.
Can you cite some sources? What do you read?
Can you cite some sources? No thanks. I’m a layman whose read a lot about the subject, but I don’t write down links or citations. I don’t approach this in a scholarly manner (I did take Physics in college) and I’m not technically literate, but I can understand plain english explanations. That makes me entitled to an opinion, I think. You can take it for what you think it’s worth – probably not much.
I see that interglacial sea levels sometimes are used as an argument for projected sealevels. Eemian sea level 6 – 9 m higher than today, and sea level 400000 years ago ca 10 m higher. This shows that some of the Greenland ice and a bit of Antarctica can melt. But during these interglacials the CO2 level was about 300 ppm, so I think the CO2 level had very little to do with the sea level rise. What science tells us is that more CO2 in the air will cool Antarctica by higher temperature inversion, and that it is possible the same will happen with the higher altitudes of Greenland. So it is possible that more than a meter sea level rise cannot happen for the first thousand years.
From the discussion at SoD, impacts-vii-sea-level-2-uncertainty
How increasing CO2 leads to an increased negative greenhouse effect in Antarctica. Authors Holger Schmithüsen, Justus Notholt, Gert König-Langlo, Peter Lemke, Thomas Jung, 2015. http://onlinelibrary.wiley.com/doi/10.1002/2015GL066749/full
About temperature inversion: “The intensity maximum in the CO2 band above Antarctica has been observed in satellite spectra [Thomas and Stamnes, 1999, Figure 1.2c], but its implication for the climate has not been discussed so far.”
“However, if the surface is colder than the atmosphere, the sign of the second term in equation (1) is negative. Consequently, the system loses more energy to space due to the presence of greenhouse gases.”
“This implies that increasing CO2 causes the emission maximum in the TOA spectra to increase slightly, which instantaneously enhances the LW cooling in this region, strengthening the cooling of the planet.”
“This observation is consistent with the finding that in the interior of the Antarctic continent the surface is often colder than the stratosphere; therefore, the emission from the stratospheric CO2 is higher than the emission from the surface.”
And even over Antarctica climate models have systematic bias: “This suggests that current GCMs tend to overestimate the surface temperature at South Pole, due to their difficulties in describing the strong temperature inversion in the boundary layer. Therefore, GCMs might underestimate a cooling effect from increased CO2, due to a bias in the surface temperature.”
So what about the inversion over Greenland plateau then?
The mean annual temperature of the interior is −57 °C (−70.6 °F).And with more CO2 in the air it will be even colder.
So, Ricarda Winkelmann, Anders Levermann, Andy Ridgwell and Ken Caldeira: “Antarctica is projected to become almost ice-free”. Were you sleeping during the basic course in climatology, when it was about temperature inversion? It has been known at least for 50 years that surface is colder than the overlaying atmosphere over Antarctis. Or: Where did you get the idea that ice melt at – 57 deg C?
From: “A reassessment of temperature variations and trends from global reanalyses and monthly surface climatological datasets.” 2016.
Authors: A. J. Simmons, P. Berrisford, D. P. Dee, H. Hersbach, S. Hirahara, J.-N. Thépaut.
“Direct observational data on surface air temperature are sparse for the Antarctic, but none of the datasets examined provides evidence of net warming south of 60°S since 1979, a period during which sea-ice extent increased a little.”
And that is a bigger area than the continent. Reminds me of the cold katabatic winds coming from the high regions of Antarctica and blowing north to 60S latitude.
So where is the Antarctica contribution to sea level rise.
The radiative cooling over Antarctica result in a wind pattern that has global effects, as it spread the cold air over vast areas. This is the katabatic winds. “Below 60°S winds are largely katabatic, this is a result of cold air forming over the pole and falling (as cold air is heavier). The pole is on a high plateau 3,000m (10,000ft), so the cold air falls down the slope getting faster as it goes. By the time it gets to the coast, the earth’s rotation (Coriolis force) makes the wind westerly.” These winds seldom reach teperatures over freezing until they reach the ocean.
There is a very useful analysis of Antarctic climate in an article of David Brockett, 2005, “Antarctic katabatic winds”. And ends with some words about climate models. “Mesoscale (spatial scale of about 10 – 1000 km) analysis of catabatic winds is a scale not resoved by current climate models”. Another systematic bias?
http://www.anta.canterbury.ac.nz/documents/GCAS_7/Brockett_D_Lit.Review
No Surface Cooling over Antarctica from the Negative Greenhouse Effect Associated with Instantaneous Quadrupling of CO2 Concentrations
Looks like a model is used as proof against observations. We know that models don`t get Antarctica right. Should they then get quadrupled CO2 over Antarctica right?
Mount Chimborazo in Ecuador — an inactive volcano located in the Andes — has an altitude of only 6,310 meters (20,703 feet), which makes it far shorter than Mt. Everest. It’s not even the highest above sea level in the Andes. However, because Chimborazo sits just one degree south of the equator, its apex rises the farthest, at about 21 million feet or 3,967 miles — making it the “world’s highest point from Earth’s center.” Everest, on the other hand, is 28 degrees north latitude, nearly one-third of the way to the pole and as far as peaks measured from Earth’s center go, Mt. Everest doesn’t even make it in the top 20.
–
The sea at the equator is 13 miles higher than the sea at the poles (further away from the centre of the earth.
The sea is dragged up by the gravity of land masses hence the level is up to 2 metres lower in the deep oceans than at shore edges.
Hence the sea is not level, varies due to gravitational effects and varies immensely with channels, currents, prevailing winds, temperature and amount that falls on land as rain in heavy rain years.
Measuring it accurately is like trying to catch fish with your hands.
And you know these things because of whom? The same people who know how to measure it. Like Mitrovica, who will not even speak with skeptics because of the vapid things they say.
Vapid?
At least you do not dispute these true facts.
Sea level definition is a can of worms.
Those claiming to measure it accurately are fooling themselves when extending from the local to the general.
Erosion alone makes measurement at non human sites impossible.
At sites where ports and breakwaters are constructed constant reinforcement of the coastline keeps it relatively stable, and the tide measuring devices but at what cost?
Claiming 10 feet of subsidence is obviously ridiculous.
Where are these 10 foot underwater cities?
If not 10 foot under how can one say the sea has risen 10 feet?
If they have put 10 feet of filling in for the subsidence then ergo it is no longer 10 foot under.
It has had 10 foot of human uplift.
Going from tide gauge based estimates of SLR to satellite based estimates is just another hockey stick. If the two differ it probably just shows that the tide gauge statistical model is wrong. Of course the satellite model is also not terribly reliable.
In fact tide gauge estimates are the ultimate convenience sample, only taken on the edge of the seas, where other factors are most prominent.
I keep looking at the Earth’s spin rate, which must drop is polar melting raises the sea level. So far, not a single published paper from the astronomical community on any slowing down of the spin rate.
Not hat we know that there is any, but given that polar icecap melting would lower the elevation of the water mass, from land to sea level. I would think that the spin rate might increase.
I think W Munk in his enigma aricle has this theme. And perhaps Mitrovica.
“Abstract
In 2002, Munk defined an important enigma of 20th century global mean sea-level (GMSL) rise that has yet to be resolved. First, he listed three canonical observations related to Earth’s rotation [(i) the slowing of Earth’s rotation rate over the last three millennia inferred from ancient eclipse observations, and changes in the (ii) amplitude and (iii) orientation of Earth’s rotation vector over the last century estimated from geodetic and astronomic measurements] and argued that they could all be fit by a model of ongoing glacial isostatic adjustment (GIA) associated with the last ice age. Second, he demonstrated that prevailing estimates of the 20th century GMSL rise (~1.5 to 2.0 mm/year), after correction for the maximum signal from ocean thermal expansion, implied mass flux from ice sheets and glaciers at a level that would grossly misfit the residual GIA-corrected observations of Earth’s rotation. We demonstrate that the combination of lower estimates of the 20th century GMSL rise (up to 1990) improved modeling of the GIA process and that the correction of the eclipse record for a signal due to angular momentum exchange between the fluid outer core and the mantle reconciles all three Earth rotation observations. This resolution adds confidence to recent estimates of individual contributions to 20th century sea-level change and to projections of GMSL rise to the end of the 21st century based on them.”
Reconciling past changes in Earth’s rotation with 20th century global sea-level rise: Resolving Munk’s enigma
Jerry X. Mitrovica1,*, Carling C. Hay1,2, Eric Morrow2, Robert E. Kopp2,3, Mathieu Dumberry4,5 and Sabine Stanley6
http://advances.sciencemag.org/content/1/11/e1500679.full
George Turner.
I think this is science.
You can examine Length of Day data. This is measured very accurately. If it changes by one second, a leap second is added. More leap seconds were added in the first years of the atomic clock and less leap seconds have been added in recent years. This means spin rate of earth has increased over the past 40 years. Ice on land is closer to the spin axis and water around the equator is further from the spin axis. Earth should be slowing down if oceans are rising, this is not happening. I believe ice on land on Greenland, Antarctic and the heads of glaciers has increased over the past 40 years and that oceans have dropped some over that time. The measurement of ocean level is very difficult. LOD is very precise.
Judith,
Would you consider adding a chapter addressing the likely efficacy of various policies that have been proposed to prevent/reduce sea level rise caused by man made climate change? Your client audience is probably as interested in policy alternatives as well as technical details.
While I understand your reluctance to advocate policies, I think you could provide a discussion of what might work vs. what can’t work.
I came across this essay today by Joel Kotkin on Houston and Hurricane Harvey, that isn’t directly related to sea level rise, but is an excellent argument for urban planners to build resilience to address future climate change and weather disasters.
https://www.city-journal.org/html/doing-houston-wrong-15604.html
Mark
I commented to Judith on practically the first few minutes of this thread that one of the big problems with mitigating flooding is that the authorities continue to allow building in the most absurd and vulnerable places, so your article is timely.
A few examples in Britain where modern building has been permitted
“water street’ ‘flood lane’ ‘cliff road’ ‘ beach road etc etc.
We know where flooding or subsidence is likely to occur but they are often in desirable locations such as next to the sea, or next to a river or on top of a cliff that will provide nice views
Do people then have to face the consequences of their action? Not usually, insurance is subsidised or the emergency services will bail them out.
It is not even good enough to say developers must provide protection as a housing estate on a flood plain that is protected from flooding will merely push the water elsewhere on to existing homes that never previously had a problem.
There needs to be a moratorium on building in stupid places or proper protection needs to be provided by the developer that does not affect other properties or to ensure people do not receive subsidised insurance rates
Preferably all three
Tonyb
Here in America we have this thing called private property, such that people can often build where they want to and assume the risks thereof, as do buyers. It is a form of freedom.
“Here in America we have this thing called private property, such that people can often build where they want to and assume the risks thereof, as do buyers. It is a form of freedom.”
And yet as Tony rightly points out, they do not assume all the risks thereof given artificially low insurance rates in places like south Florida. There was some pressure a few years back to make insurance rates commensurate with risk, but Congress as is its custom, caved.
P.G.
David Wojick – Of course we have private property in the U.S. But like all other rights and privileges, private property is not absolute. Think about eminent domain, zoning, wetlands development regulations and the like, all of which impose limitations in the name of the common good and the public interest.
That’s all climatereason is talking about. The public has a legitimate interest in where private development occurs, and in most cases it’s a matter of enforcing laws already on the books.
Let’s also remember that we got our legal system from the Brits – developed and honed over many centuries. It’s not perfect of course, but it’s a reflection of the imperfect human beings who created it.
good suggestion. Many of the cities (including San Francisco bay region) have comprehensive adaptation plans for sea level rise. It would be good to collect these and summarize best practices.
The respective contributions of the private owners and local governments (and the land use planners) is critical to getting the best outcomes in the face of sea level rise risks.
In the first instance it is the private property owner that faces the risks, and unless there have laws and practices built up that socialise the costs there are strong reasons to prefer the market to help manage that risk.
To explain, there are perverse incentives on a regulator to manage for the worst (eg provide for resilience) because these don’t face the costs of over regulation. This creates high largely hidden costs to the community.
Sea level rise is a bit different from most other risks we face in as much as it is progressive, we get heaps of warning that it’s coming. That means that the techniques for managing the risk are different.
Also the basic science from the IPCC is steeped in the narrow use of scenarios and that is what the regulator ends up with. Making it worse rather than just seeing the scenarios as providing a basis for posing the question “What would we do if?” they are instead used as projections of the future that we need to regulate today to avoid that future (misguided precaution).
In fact the IPCC develops its sea level rise projection from GCMs that the IPCC assumes are essentially driven by the RCP. Therefore if the likelihood of any RCP can be assessed it translates into likelihoods for the consequent projection/scenario.
Modern risk management can use this information and Real Options for example to start to look at how best to respond. I should say I’ve yet to meet a land use planner that has been taught these techniques, but perhaps that comes from living in a backwater of the south pacific.
So back to the property owner, they need to be well informed of the risks and not be able to pass these off, but under those circumstances they have the best incentives to think about when their land might become unusable (more probably through loss of infrastructure than actually slipping into the sea), and what they wish to do about it, and how they want to go about maximizing the amenity value they see in it, in the face of all the uncertainty.
The big issue for the owners is to understand that this class of land mightn’t not exist in perpetuity (they already understand this about the improvements). I’d just note the problem is much more tractable if you start at the sharp end.
The trick with the regulation is to work out a process that allows this to all occur, protecting the wider community interest while stopping regulators imposing their view of the risks on everyone.
Assume the idea of the time value of money has merit. Assume a piece of land 2 feet above high tide worth $500,000. That it will be gone in the future is not a loss of $500,000 today. Some value will be derived over its remaining life.
The point is that is what the market will do (adjusting for risk) so as land gets closer to its demise so the value will progressively decline (and development will naturally be curtailed).
If you do the sums on 60cms (2 feet) you’ll find there will be very little loss of value today due to sea level rise if comparing a property at risk to one not at risk. A 16% chance of a demise in 80 years and enjoyment up to then doesn’t make for much of a discount.
Just to make the costs of regulation clear, if a regulator decided that the upper limit of RCP8.5 will be used to declare you are in a no development, no infrastructure maintenance zone today, you will immediately face a significant drop in value.
Since the history of the eventual forming of the IPCC indicates that the requested science was not used by the IPCC to conclude that humans are the only cause of any climate change – that the science of climate change was agreed to show such and only such – that this in its self is sufficient to mistrust climate science by anyone’s logic? Are we all agreeing to ignore a “secret contract” levied by the IPCC? That arguing any of the IPCC supported science is ourselves playing along with this ploy?
I do hope that the (much-hyped) issue of global sea-level rise and putative recent acceleration will be examined seriously here as a geophysical problem and not be subjected to summary number-crunching by inept blog lions who naively think that simple detrending of highly different tide-gauge records alleviates all issues of establishing a common datum-level.
A good place to acquire deeper understanding of the complexity of oceanographic issues is Walter Munk’s classic paper on the enigma of sea level: http://www.jstor.org/stable/3058703
So Mitrovica and his team, the ones who solved Munk’s Enigma, do not understand Munk and sea level?
It’s JCH who doesn’t understand that I point to Munk (2002) for the introduction to, not necessarily the final word on, the subject.
Nobody understands. It’s so hard. Munk is on film. He said it was obvious there is an acceleration sea level rise.
Mitrovica and his team solved the enigma. They are up to every single issue the measurement of SLR presents. Munk discussed 20th century SLR in the 1.5 to 2.0 mm per year range, which was way too high.
They have taken Munk’s ball and moved it way down the field.
Reconciling past changes in Earth’s rotation with 20th century global sea-level rise: Resolving Munk’s enigma
Hay and Mitrovica: 1900 to 1990 – 1.2 mm per year
Hay and Mitrovica: 1993 – ~1.8 mm per year
Satellite era: 1993 to present – 3.29 mm per year
last 10 years – 4.24 mm per year
last 5 years – 4.54 mm per year
highest rate of SLR in the first half of the 20th century: ~2.2 mm per year
JCH
“highest rate of SLR in the first half of the 20th century: ~2.2 mm per year”
If you shall compare this should be for a 10 year period.
What measurements do you use? Reference please.
http://www.realclimate.org/images//haysl13.jpg
in order from least to most:
Hay – 2015
Wenzel – 2010
Church – 2011
Ray -2011
Church – 2006
Jevrejeva – 2008
Higher 20-century rates = older studies, and there is stuff out there that heavily criticizes the Jevrejeva method. I doubt she would agree her number should be sold to clients, or anybody else, as the headline about rates before 1960.
The newest 20th-century rate is 1.1 mm per year, virtually the same as Hay 2015. Mitrovica is a coauthor on Hay. He’s formidable on sea level. The Mitrovica team is pretty solid.
http://www.realclimate.org/images//haysl21.jpg
Displays of academic bibliographic endeavor are a poor substitute for mature, critical scientific thinking. Comparing decadal- with centennial-scale “trends” in a process that contains important decadal-scale oscillations is not an example of analytically robust science. And what evidence we have for recent global acceleration–a high-pass derivative of strongly variable SLR–comes primarily from ambitious satellite observations, not from tide-gauge records
As long as the magnitude of SLR remains in the 0-3mm/yr range, we’re looking at practically negligible variability, whose provably correct physical attribution remains largely obscured by measurement uncertainties.
You are not a better critical thinker than Mitrovica. Get real.
It’s not with Mitrovica that I argue here, but with an agenda-driven blog commenter who plainly doesn’t grasp what’s being said and on what scientific grounds.
Nobody understands. It never gets old.
I’ve taken my initial pre-Super Bowl walkthrough along this South Carolina beach. The water levels look the same as they did in the 1960s, and in the 1970s, and in the 1980s, and in the 1990s, and in the 2000s,……except for the houses. The houses along the shore are now mansions, 5 times as large and 50 times as expensive.
Where is the runaway SLR? Some of the greatest minds in climate science predicted 30 years ago that Manhattan would be underwater by now. But Lady Liberty doesn’t even have her stilettos moistened. And here in The Low Country, where one would expect the first signs of catastrophic sea level rise, they are not yet sleeping with the fishes.
In a couple of decades people are going to start asking questions.
It’s not old at all. The newest example of gross lack of scientific understanding is the notion that it’s only acceleration that is evident in his presented graph–which shows small, persistently oscillating rates of change of sea level. See: http://www.realclimate.org/images//haysl21.jpg
The first person to link to that graph on CC Etc. was me, years ago. To refute the notion that rates of SLR in the first half of the 20th century were similar to today’s rates.
Looks like it’s going to take a decade for that to sink in.
As for the oscillation, I’ve already stated that I think it was caused by the PDO. Usually when people start talking about 60-year oscillations, they’re talking about the AMO and the miracle cooling that is right around the corner.
What apparently will never sink in is that acceleration, being the time-derivative of the ROC, has patently alternated between positive and negative values throughout the shown time-frame. In fact, it is close to zero for the latest portion (ca. 2005) of the graph. Moreover, the oscillating ROC values themselves are by no means materially different now than they were on the same phase of the previous cycle. To attribute that irregular, multi-decadal oscillation to the PDO without establishing strong coherence and proper phase relationship via cross-spectrum analysis is to engage in bald speculation–the frequent hallmark of pretentious junk science.
If the oscillation is ENSO-PDO, which is what I think it is, then the rates, which end just after 2000 on th graph, would dip a bit for the years called the warming hiatus, and then spike to higher levels.
Which is exactly what has happened, and it will have been you who did not know what youth did not understand. The current 10-year average is 4.26 mm per year: completely off the graph.
Satellite data, which manifest the highest short-term rates of sea-level rise (but also great measurement uncertainties) belie your extravagant claims: the current rate is only 3.2 mm/year (https://climate.nasa.gov/vital-signs/sea-level/). And the fact that in making causal attributions you rely upon purely qualitative aspects of such short-term manifestations, instead of rigorous signal analysis, exposes grave lack of scientific bona fides.
One thing I have hardly seen referenced is the lunar orbits effect on tidal variations. We seem to have had a lot of ‘super moons’ recently as the lunar orbit is a little closer to earth at times. The lunar orbit certainly isn’t static and it is the single largest contributor to changing sea levels on short and long time scales.
Judith
Sea level studies:
Global Sea Level ‘Acceleration’ Just 0.002 mm/year² (link to 9 papers)
http://notrickszone.com/2017/10/30/reality-vs-theory-scientists-affirm-recent-lack-of-any-detectable-acceleration-in-sea-level-rise/#sthash.kVyp2mI7.QWWZTeJp.dpbs
Robust Natural Variability Affirmed In Global Sea Level Rise Rates – No Correlation With CO2 Forcing (link to 7 papers)
http://notrickszone.com/2017/05/25/robust-natural-variability-affirmed-in-global-sea-level-rise-rates-no-correlation-with-co2-forcing/#sthash.1E2WuKzm.dpbs
I have a question. Everyone knows that if you fill a bathtub to the top and get in it overflows.
Then what impact do millions of ships and boats have on sea level rise?
A drop in the ocean.
That can be taken two ways, one up and one down.
OHC, I think, high as heck, and not a drop in the ocean:
https://i.imgur.com/r7EmDNv.png
There is also some suggestion that historic groundwater depletions may also be contributing to sea levels: http://www.waterworld.com/articles/wwi/print/volume-25/issue-5/groundwater-development-flow-modeling/groundwater-depletion-linked-to-rising.html
https://twitter.com/MJIBrown/status/954115178534117376
Just an editing note: This item in your list of natural variations in sea level:
“Regional variability in sea level associated with large-scale ocean circulations, with magnitude +/- 20 cm since 1993.”
doesn’t make sense to me, it’s like it’s missing a verb or something.
A couple of years ago I constructed a global sea level series from scratch using data from 382 raw tide gauge records. It shows about four inches of relative sea level rise since 1900:
http://euanmearns.com/how-much-have-sea-levels-really-risen/
Are there significant numbers of water molecules or ions escaping into space? And, conversely, is there a constant rain of water molecules from small comets entering the atmosphere?
Bit of information here, particularly in the comments how the sea level acceleration was going from tide gauges to satellite
https://climateaudit.org/2009/08/21/nasa-sea-level-update/
And here is the Munk paper
http://www.pnas.org/content/99/10/6550.full.pdf
With the interesting discussion
This paper does little toward solving the problems of the historical rise in sea level. In looking for causes, I have applied what Edward Bullard (31) has called the “Sherlock Holmes procedure” of eliminating one suspect after another. The procedure has left us without any good suspect (it is a matter of attribution, not of error bars), but I am reluctant to accept large error bars as definitive evidence for dismissing the traditional estimates of 1.5–2 mm/y for the 20th century sea level rise.
Thermal expansion was the candidate of choice at the time of the first IPCC review. This choice has been almost foreclosed as a major factor by the recent compilations of Levitus and by recent model calculations that account for the incremental ocean heat storage as a consequence of greenhouse warming. The computed steric rise is too little, too late, and too linear.
The rotational evidence, although convoluted, appears to rule out a large eustatic contribution from melting on Antarctica and Greenland, assuming that the measured J̇2 is representative of the 20th century. However, an enhanced contribution from glacial melting and other midlatitude sources is NOT ruled out by the rotational evidence.
Cabanes et al. (16) have demonstrated that the historical estimates of ζ̇ (here taken at 18 cm/cy) are severely biased by a concentration of tide stations in areas of recent warming, and that global estimates have to be radically revised downward. It remains to be demonstrated whether this bias extends to the traditional estimates for the rise in sea level on a century time scale.
“Second Assessment Report (1995): the last 100 years global sea level has risen by about 10 to 25 cm, based on analyses of tide gauge records.
Fourth Assessment Report (2007):Global average sea level rose at an average rate of 1.8 [1.3 to 2.3] mm per year over 1961 to 2003.The global average rate of sea level rise measured by TOPEX/Poseidon satellite altimetry during 1993 to 2003 is 3.1 ± 0.7 mm
Fifth Assessment Report (2013):It is very likely that the mean rate of global averaged sea level rise was 1.7 [1.5 to 1.9] mm yr– 1 between 1901 and 2010, 2.0 [1.7 to 2.3] mm yr–1 between 1971 and 2010 and 3.2 [2.8 to 3.6] mm yr–1 between 1993 and 2010. Tide-gauge and satellite altimeter data are consistent regarding the higher rate of the latter period.”
–
What does Global Sea Level rise mean?
Basically it is referring to a larger volume of liquid water in the interconnected basins of the earth.
Which perchance must rise in height everywhere except where the basin changes shape.
–
Isostatic rebound, subsidence [multi causation], elevation are problems only for the tide gauge stations. Local places like Norway rising out of the sea will naturally have a drop in measured level even when the overall amount is rising if the isostatic rebound is greater than the rise.
Vice versa for those with subsidence.
Everything is very local and important for local planning but too complicated to put together to judge global warming.
–
The Satellite altimetry should be independent of such problems because they are measuring the height of the water at all times. This makes the addition of Isostatic rebound to satellite records wrong.*
–
* While the two measurements are said to be matched this is obviously not a simple matter of setting the satellite and the shore to the same readings.
The shore levels can move up and down the sea levels must be fixed in reference to the rest of the water levels adjacent to it.
–
Take home message the two types of measurement are totally different in their implementation and message. Only the satellite system is relevant to a true discussion of increasing volume or sea level rise in reference to global warming.
It in turn is extremely sensitive to the parameters put into it including estimates of the varying gravity field and satellite drift and life expectancy and measuring technology. It is not accurate enough to give a true estimate for such an important argument though it should not be ignored.
–
*This makes the addition of Isostatic rebound to satellite records wrong.*
Does anyone else feel this is true?
The satellites automatically adjust for gravity changes, measure the height of the water and have a basin volume to work from. There should be no need to calculate an adjustment for something that is already previously done by the satellites to get their estimate in the first place.
It is double dipping.
You seem to be quoting from some confused source. What is it?
Trying to put the topic where I can understand it.
There are 2 ways of measuring sea level rise mentioned by the IPCC and Judith but they are not compatible.
One is with tide gauges.
Fraught with problems because the base to which they are attached is not at a stable level.
Also not at the same distance from the equator due to the earths shape [fatter in the middle].
Also not at the same gravity both at depth and laterally
[See Tamino “Glaciers are melting so fast that the total mass on land areas is decreasing … the mass of all that water leaves the land and ends up in the ocean. That means the gravity from that ice is no longer pulling the sea closer with its gravity” and “Of course land-based tide gauges require correction for the rise and fall of land itself, vertical land movement (VLM), and they used two methods to do so. One is based on a model of Glacial Isostatic Adjustment (GIA model based), another uses GPS estimates (GPS based).”]
They are not evenly spread which causes the same problems as temperature stations.
When measuring a height at a location a concatenation of waves arriving together can give a falsely high reading [see novel “the seventh wave”]
The other is by satellites with GPS etc.
Now they have got it pretty good [sorry about the terrible English].
But the problem with having a halfway accurate level at the top is what to do with estimating the depth underneath.
Not so easy.
Someone has to make an estimate of the size of the basins and the volume of water contained therein. The moon and the sun distort the levels twice a day [Not once a day as Attenborough said talking about coral reef exposure on TV just now, and he is supposed to be an expert!].
Trade winds heap up the water on Asian shores dropping the levels off the Americas.
Still we get a figure.
We have a surface area.
We have a time base.
So we can estimate a true GSL, just not very reliably.
This is the one for AGW. It is not the one that most people and planners can relate to.
What we know was learned by scientists: Munk, Mitrovica, Peltier, Nerem, Church, Hay, etc.: many others.
You spill out stuff you could not possibly know without them, and then you imply they don’t know how to do what they know how to do. There just has to be something wrong. It’s funny.
angech
You’re on the right track. The top notch SLR experts readily admit to the complexities and uncertainties in trying to establish reliable data and trends. As any good scientist will admit, there are a lot more variables that need greater study. The dynamics of the ocean basins, atmospheric and oceanic circulation, and sub-seafloor contributions are just a few areas that need much more research. It’s the MSM and political hacks who think they’ve aced the exam.
Scientists do not need an environment where they are persistently impugned in order for them to do what they do. They have been doing quite nicely without you two.
Like the inference there must be something nefarious behind the fact the CU’s graph has not been updated in an unusually long time. Or double dipping, which is a description associated with financial fraud.
It’s the MSM and political hacks who think they’ve aced the exam.
https://tamino.files.wordpress.com/2011/10/q74.jpg
https://tamino.files.wordpress.com/2011/10/q54.jpg
jch
without trying to make any sort of point, have you any idea why the Uni of Colorado have not updated their sea level graphs for 2017 yet?
It is the only way we can get like for like references to compare with previous years
tonyb
Where did I impugn a scientist? I was paying a compliment to top notch scientists who freely admit to the complexity of the issue. I’ve read many papers where they address these challenges. I was denigrating the MSM who almost never explain the full depth of the scientific knowledge associated with the subject matter they are covering. And how can anyone not denigrate political hacks.
I don’t know why. I would expect their update would be very similar to the AVISO graph.
Australians through October 2017, 3.4 mm per yr;
https://i.imgur.com/GL6Du6k.png
JCh
Thanks for the graph. It appears to show that the sea level towards the end of 2017 was the same as at the start of 2016?
Tonyb
Yes, it continues to show sea level remains stubbornly well above the trend line, which means 5, 10, 15, and maybe even 20-year rates re far above the satellite-era trend of 3.4 mm per yr.
Jch
But you are replying to something I never wrote.
It appears that the sea level height towards the end f 2017 was about the same as it was at the beginning of 2016 I.e there has been something of a sea level rise hiatus, according to this source for nearly two years.
Without introducing a veritable herd of squirrels, would you agree?
Tonyb
tonyb, your so-called “hiatus” is also very unexceptional in that record usually ending in rapid rises to make up for them in keeping the overall trend.
Jimd
That may be so, but it doesn’t get away from the fact that over the last two years, there has been a hiatus not a rise. The sharp rise you expect, at present, is mere speculation
Tonyb
I don’t expect a sharp rise every year, just a mean rise over the long term which is what is happening. There is a similar argument over expectations with global temperature. Climate change is multi-decadal. Compare sea level now with a few decades ago, same with temperature. Wiggles don’t do anything to climate change when it is so fast.
Jimd
Again, that may be so. All I merely observed is that, against expectation, that there appears to have been a near two year sea level rise hiatus.
Tonyb
That would only be if your expectation was a new record sea level every year, which is no-one’s that I know of. It seems to happen every three years or so.
against expectation
When an El Nino ends, as it did around May of 2016, the expectation would be for sea level to drop like a rock:
https://tamino.files.wordpress.com/2012/11/sl_mei.png
It did not drop like a rock. Instead it is doing a glide. it is hilarious that skeptics are giddy about this “hiatus” as, if it continues to the next El Niño, it means there has likely been a regime change.
So it is behaving against expectations, just not the ones you appear to think exist.
“Without introducing a veritable herd of squirrels, would you agree? Tonyb”. Thanks for the image.
Perhaps a good time to ask the community what is the right collective name for a group of squirrels ?
“scientists: Munk, Mitrovica, Peltier, Nerem, Church, Hay, etc.: many others.You spill out stuff you could not possibly know without them,”
Good to know I am using science.
“then you imply they don’t know how to do what they know how to do.”
Not at all.
It’s complicated.
That’s all.
Open to interpretation.
” Scientists do not need an environment where they are persistently impugned in order for them to do what they do.”
I agree with you.
What were they doing again?
Science. No problems.
Political Agendering?
They impugn themselves. No one needs me to do it for them.
JCH | January 21, 2018 at 2:46 pm “When an El Nino ends, as it did around May of 2016, the expectation would be for sea level to drop like a rock:”
–
Science.
There is a lag period JCH, possibly for 5 months, possibly longer.
Your comment is unscientific and worse you know it.
You know about lag effects.
Like ice continuing to grow after the shortest day or melt after the longest day.
But no. To prove a point you ignore the science.
Sea level cannot drop like a rock. It certainly would be expected to increase when an El Nino ends for at least 5 months and then slowly drop.
Science.
Not politics.
Jch
Drop like a rock? Giddy?
There are other things affecting sea level change, of which thermal expansion is merely one.
Let’s wait for the CU update as then we can see historic context and like for like records.
Tonyb
When the 15-16 El Niño ended GMSL should have very quickly dropped like a rock below the trend line. Look at the MEI relationship. It did not do that, and you guys are celebrating like there is some sort of potential victory here. I’m sorry, this is hilarious. SL staying stubbornly high is no different than the SAT staying stubbornly high. It indicates something in the systems has changed. One thing, there’s the lack of trade wind strength. No oomph on the equator.
A sea level rise hiatus. Oh boy, the skeptics playground is open again.
Satellite to earth, the CU update will look almost exactly like AVISO and NASA and CSIRO. In a sense, it’s already out.
Jch
who on earth is ‘celebrating?’
It is interesting there has been a short hiatus. There are many things affecting sea level change and it only becomes of more than passing interest if the hiatus lasted a little longer, by which time the explanations, as with the fasullo paper, will no doubt be discussed at length.
Tonyb
As long as it stays above the trend line, the satellite-era trend will increase. With latest update, it clicked up. Work since the Fasullo paper has changed the first 5 years of the satellite era data, so Fasullo’s argument is based onboard data. The satellite-era acceleration issue is all but over.
And, the current La Niña is getting clobbered by warm water from below and weak trade winds. PDO moving up. Snow on Greenland is down. Should be a great year for SLR.
What is the cost associated with the previous 100 year, 15cm odd rise? Where are the signs of it? How much will the Florida McMansions have depreciated over the next 80 years, anyway? And how many storm surges will they have withstood? They’re not even quality constructions in many cases.
This Biloxi, Mississippi house, originally built in 1848, was the post-war home of Jefferson Davis, the commander in chief of my murderous Confederate ancestors, was damaged by the Hurricane Katrina storm surge. It’s sits out in a large yard on Beach Blvd.
http://www.photosfromkatrina.com/images/B-Biloxi-JeffDavis2.jpg
That house was probably on somebody’s list for destruction anyway. The hit squad to cleanse our history has been at it demanding dismantling any statues related to the Confederacy or slaveholders, so I don’t know why this house should be spared.. Hey, if it somehow makes them feel better, why not? But, when they want name changes for all the towns and streets named Washington, Jefferson, Madison, Monroe, Jackson and dozens more that is going to be expensive.
FEMA paid 14 million to fix the place up, which included a new Presidential Library.
Then the social warriors will be out to tear down a new $14 million affront to their sense of justice.
Icon smashing
history shredding
can be costly
in many ways.
JCH – What’s your point? As you know, whatever slr there’s been in Biloxi was dwarfed as the Mississippi coast was hit by a 28 foot storm surge. The coastal areas of 3 counties were simply inundated. The floods extended for miles inland.
Sea level is so simple, no?
ossqss.
Thank you so very much.
This is the cartoon that explains how difficult it all is.
Fantastic.
Worth watching 3 times at least for this discussion. I think Judith and JCH already know all about it but for anyone wanting an easy introduction.
Priceless.
It is interesting that the debate is on centemeters decades from now, but our dedicated subject matter experts can only predict to a meter today. Just sayin…..
Substance hath essence.
Form adds whatness to thatness,
Aristotle sayeth…
Pingback: Weekly Climate and Energy News Roundup #300 | Watts Up With That?
Pingback: Weekly Climate and Energy News Roundup #300 |
The “stasis” story is starving. OHC has rebounded like presto.
https://i.imgur.com/clyJW3y.png
More data, trend now 3.3 mm per yr
https://i.imgur.com/tDqaSC1.png
Pingback: Sea level rise acceleration (or not): Part II – The geological record | Climate Etc.
Pingback: Sea level rise acceleration (or not): Part I – Introduction – The Word Merchant
Pingback: Latest Data Show NO SEA LEVEL RISE ACCELERATION Since 1993…Coasts: Less Than 2 Millimeters Annually!
Pingback: Latest Data Show NO SEA LEVEL RISE ACCELERATION Since 1993 | Principia Scientific International