
by Javier
Insights into the debate on whether the Holocene will be long or short.
Summary: Milankovitch Theory on the effects of Earth’s orbital variations on insolation remains the most popular explanation for the glacial cycle since the early 1970’s. According to its defenders, the main determinant of a glacial period termination is high 65° N summer insolation, and a 100 kyr cycle in eccentricity induces a non-linear response that determines the pacing of interglacials. Based on this theory some authors propose that the current interglacial is going to be a very long one due to a favorable evolution of 65° N summer insolation. Available evidence, however, supports that the pacing of interglacials is determined by obliquity, that the 100 kyr spacing of interglacials is not real, and that the orbital configuration and thermal evolution of the Holocene does not significantly depart from the average interglacial of the past 800,000 years, so there is no orbital support for a long Holocene.
Introduction
An understanding of past climate changes helps to put current global warming or “climate change” into perspective. Failure to account for past abrupt climate changes leaves us with a sample size of one warming and can cause a statistical type I error. When the village boy cried wolf, he was proposing an alternative hypothesis to the villagers. The null hypothesis was that there was no wolf. When the villagers accepted the boy’s hypothesis with a sample size of one and not enough evidence, they committed a type I error, a false positive. Given the risk of committing such an error with climate change, it is important to study the climate of the past.
Since there is only one reality and unlimited hypotheses to explain it, whenever confronted with a new claim, it is reasonable to think that the null hypothesis is it is not true. Adopting that reasonable position means being skeptical by default. That doesn’t make one very popular in the village, but makes one right most of the time.
Since extraordinary claims require extraordinary evidence, we raise the bar for evidence and lower the chance of rejecting the null hypothesis. In this way we reduce the chance of committing a type I error (reject the null hypothesis when it is true). The study of past climate changes is therefore of great importance in the study of the present global warming. A priori we should be skeptical about claims that “this time is different”, not because it is false, but because every time is different. Every interglacial period is different, but that does not mean that common explanations cannot be found, even if different factors were contributing in different ways to each of them. After all, science is a lot more about finding common elements to different observations than finding specific explanations to each observation.
In this series of articles, entitled “Nature Unbound: Climate Changes of the Recent Past” I am going to examine significant climate changes that have taken place since humankind evolved. In the first article we will review the glacial cycle. The second article will focus on the abrupt changes, known as Dansgaard-Oeschger events, that occurred in the last glacial period. We will place a special emphasis on the 50 -15 kyr BP (thousands of years before 1950) period. Future articles in the series will examine some evidence on the millennial cycles of the Holocene and some speculation about the future. I hope that in the process we can learn enough about climate change to add some perspective into the present one.
To set the stage we must know that the Earth has spent 90% of its time during the past million years in the coldest 1% of the temperatures seen in the past 500 million years. The Earth is locked in a very cold stage known as the Quaternary Ice Age. The reasons for this are unknown. An ice age is defined as any period when there are extensive ice sheets over vast land regions, as we see now. Since the last four ice ages have taken place roughly 150 million years apart, some scientists favor an astronomical explanation (changes in the Sun, the orbit of the Earth, or passage of the solar system through the galactic plane), while others prefer a terrestrial explanation (changes in the continental distribution, or concentration of greenhouse gases).
So, we don’t know why the Earth is in an ice age, but at least we think we know why 10% of the time the Earth gets a brief respite from predominantly glacial conditions and enters a milder condition known as an interglacial.
The glacial cycle. Milankovitch Theory.
The currently favored theory on glacial-interglacial climate change was first proposed in 1864 by James Croll, a self-educated janitor at the Andersonian College in Scotland, which goes to show that anybody can do science. He was offered a position in 1867, corresponded with Charles Lyell and Charles Darwin, and was awarded an honorary degree. But scientific knowledge at the time and his own limitations in mathematics and astronomy led to the final rejection of the theory. Croll wrongly concluded that orbital eccentricity and lack of winter insolation were responsible for glacial periods, and although he was the first to propose a positive ice-albedo feedback as a mechanism, his model called for asynchronous glaciations at the poles and timings for glaciations that were not supported by the then available (but incorrect) evidence.
The Serbian genius Milutin Milankovitch was, in 1920, the first to undertake the work of calculating the intricacies of the Earth insolation at different latitudes due to orbital variations in a time without computers, and he immediately identified summer insolation as a key factor to explain the drastic climate changes of the past. His theory was not accepted until 1970, when geological evidence was found on multiple glacial-interglacial cycles, although their timing (100 kyr) was a bit off relative to Milankovitch Theory. Proper dating of glaciations during the past 2.6 million years showed that for the most part they have taken place at intervals of 41,000 years, a period more akin to orbital insolation forcing.
Milankovitch Theory is very well known, so there is no point in going over it with much detail. Suffice to say that there are three types of orbital changes that affect Earth’s insolation over the long term (figure
Eccentricity: If the Solar system was only composed of the Sun and the Earth, Earth’s elliptical orbit would always have the same eccentricity, but as the movements of the other planets, specially the closest giants Jupiter and Saturn, introduce gravitational perturbations, the Earth’s orbit slightly changes its eccentricity. The eccentricity changes with a major beat of 413,000 years and two minor beats of 95,000 and 125,000 years. The changes in eccentricity are the only orbital changes that alter the amount of solar energy that the Earth receives as they change its distance from the Sun. Since the Earth’s orbit is always quite circular (eccentricity varies from 0.005 to 0.06) the change in insolation between Perihelion and Aphelion (now at January and July) is small, currently about 6.4% (0.016 eccentricity). The changes in eccentricity also produce a shortening and lengthening of the seasons as the Earth speeds at Perihelion and slows at Aphelion. Currently the northern Hemisphere winter (at perihelion) is 4.6 days shorter than southern Hemisphere winter (at aphelion). The important thing to remember in terms of climatic change is that due to the length of its main cycle, and the low eccentricity of Earth’s orbit, the eccentricity cycle results in an exceedingly small forcing. Or in other words, the insolation changes due to eccentricity are very small by themselves. It is only through its effect on precession and obliquity that eccentricity becomes relevant.
Obliquity: This cycle is given by the changes in the inclination of Earth’s axis, or axial tilt, with respect to Earth’s orbital plane. The axial tilt varies between 22.1° and 24.3° over the course of a cycle that takes 41,000 years. Currently the tilt is 23.44° and decreasing. The change in tilt changes the distribution of the solar energy between the seasons and through latitudes. The higher the obliquity, the more insolation in the poles during the summer and the less insolation in the poles during the winter and in the tropical areas all year. High obliquity promotes interglacials while lower obliquity is associated with glacial periods. While obliquity does not change the amount of insolation the Earth receives, it does change the amount of insolation each latitude receives and the change is large at high latitudes.
Precession: There are two precessional movements. The axial precession is the Earth’s slow wobble as it spins on its axis due to the gravitational pull on its equator by other solar bodies. The Earth’s axis then describes a circle against the fixed stars in 26,000 years, so if it is now pointing to Polaris, 13,000 years ago it was pointing to Vega. The orbital (or apsidal or elliptical) precession is the slow rotation of the elliptical orbit around the focus of the ellipse closest to the Sun in a period of 113,000 years. The combined precession (of the equinoxes) displaces progressively the seasons around the year and around the orbit, so that if now northern Hemisphere winter takes place at perihelion (perigee closest to the Sun), in about 11,500 years it will be taking place at aphelion (apogee farthest from the Sun). Precession is therefore modulated by eccentricity as the precession angle would be irrelevant at zero eccentricity (circular orbit). It is important to note that precession doesn’t change the amount of insolation that the Earth receives or the amount of insolation that each latitude receives during the year. Whatever insolation precession gives to one season, it takes it back from the other seasons, thus precession is an important contributor to summer insolation and to the insolation latitudinal gradient. The interaction of the various components of precession produce cycles at 19, 22 and 24 kyr with a mean period of roughly 23,000 years. Since the northern hemisphere summer now takes place at aphelion, we are at a minimum, in the precessional cycle, from the point of view of summer insolation at 65°N.
 Figure 1. Changes in Earth’s orbit as the basis for Milankovitch theory. The orbital eccentricity variation (green) produces changes in the shape of the Earth’s orbit with periods of 413 kyr and 100 kyr. Axial tilt (blue) changes with obliquity periods of 41 kyr. The orbital precession (orange) rotates the orbit around one of the elliptical foci, while the axial precession (yellow) wobbles the Earth. Both together produce an average period of 23 kyr. Source: Cyril Langlois
As currently viewed by followers of Milankovitch Theory, glacial inception takes place when the summer insolation at 65°N allows more ice to survive the summer every year. This starts the buildup of the Laurentide, Fennoscandian and Siberian ice sheets. This process is fueled by ice-albedo and other feedbacks and progressively cools the Earth with a simultaneous drop in sea level. The glacial period survives several cycles of increased 65°N summer insolation and progressively gets colder and sea level lowers. The next eccentricity cycle, between 95 and 125 kyr later, induces a non-linear response on precession such that the next rise in 65°N summer insolation triggers a glacial termination. This is a much faster process than glaciation as is helped by feedback effects such as a reduction in ice-albedo or a buildup of greenhouse gases.
Glacial cycles are a tough nut to model with current climate models which are built using Holocene conditions. The discussions between Milankovitch defenders are about the fashionable role of CO2 in glacial termination (Shakun et al., 2012), about a three stage model with interglacial, mild glacial and full glacial conditions (Paillard, 1998), or about a sea-ice switch to explain why other peaks in 65°N summer insolation fail to get the world out of a glacial until the eccentricity cycle kicks in 100 kyr later (Gildor and Tziperman, 2000).
Problems with Milankovitch Theory
The current theory explaining glaciations through summer insolation at 65°N, paced by the 100 kyr eccentricity cycle is supported by the scientific consensus and is presented in textbooks. But, it has some important holes that challenge its validity.
The most important one is the 100 kyr problem. Until about 1 million years ago glaciations were taking place at 41 kyr intervals, pointing to obliquity as the main factor. But since about that time glaciations have taken place at 100 kyr intervals (figure 2). When this was discovered the problem was that the Milankovitch Theory did not reserve any special place for the eccentricity cycle, since its effect is minimal. So Hays, Imbrie, and Shackleton in their 1976 article proposed that the eccentricity was playing its role in a non-linear way. The problem is compounded because the main cycle of eccentricity is 413 kyr and that cycle is even less apparent in the record so we are left with the conclusion that eccentricity produces a multiplicative effect during its minor cycles, yet no important effect in its major cycle. Maslin and Ridgwell (2005) call it “the eccentricity myth.” In addition, the change from early-Pleistocene 41 kyr glaciations to late-Pleistocene 100 kyr glaciations was achieved without any change in insolation, so Milankovitch Theory is at odds to explain it.

Figure 2. The Mid-Pleistocene Transition. Two different proxies for temperature, the alkenone UK’37 in marine sediments (red), and δ18O isotope in benthic cores (blue), show the progressive cooling of the Earth through the Pliocene. At the early- Pleistocene glaciations start to take place at 41 kyr intervals. As the cooling progresses, this interval lengthens to 100 kyr in what is called the Mid-Pleistocene Transition or Revolution. Source: K.T. Lawrence, et al. 2006.
The 100 kyr problem is best illustrated in figure 3 where we compare the Milankovitch Theory, through the decomposition of the insolation into its components: eccentricity, obliquity and precession (figure 3 A); with evidence from temperature proxy records (figure 3 B), through frequency analysis to reveal their main cyclic components. Note that you rarely see eccentricity plotted at its true comparative forcing. The disparity is so evident that the current consensus glacial cycle hypothesis cannot be right.

Figure 3. The 100 kyr problem. Milankovitch theory, in its current consensus form, runs into problems explaining the disparity between predictions and observations. A. The calculation of 65°N summer insolation shows that the predicted range of 105 W/m2 is mainly due to the contribution of precession, followed by obliquity with a similar magnitude. The contribution from eccentricity is however very small. B. When the spectra of the temperature proxies is analyzed, the main band is a 100 kyr band, followed in intensity by a 41 kyr band, while the 23 and 19 kyr bands are barely detectable. So, the strongest contributor gives the weakest signal, while the strongest signal comes at a frequency of what should be a negligible contributor. Source: J. Imbrie et al. 1993. Modified.
Second in importance is the causality problem, exemplified in “the stage 5 problem.” Marine Isotope Stage 5 is used here as an alternative name for the previous interglacial, also known as Eemian in North America. According to insolation, the Eemian or MIS 5 should have started at the earliest 135 kyr BP, however data from crystals in a Nevada cave named Devils Hole in 1992 indicate that by that date glacial termination was essentially finished (Winograd et al., 1992; Ludwig et al., 1992; Glacial termination is defined as the midpoint in sea level between glacial and interglacial). A great controversy erupted over that data in the literature and has not abated since. But Devils Hole data is not alone, as similar data has been uncovered from coral reefs in the Bahamas (Gallup et al. 2002), Barbados and Papua New Guinea, and from Iberian-margin sediments and Italian cave speleothems (Drysdale et al. 2009), and all of it indicates that termination was essentially completed by 135 kyr BP. A date when 65°N summer insolation was still below the levels of 70% of the previous 100 kyr (figure 4). Additional data indicates that MIS 5 may not be the only glacial termination where the effect appears to precede the cause. MIS 15c shows the same situation. The problem is further complicated because summer insolation has been used as a defining criterion to date the start and end of glaciations in sediments in the official UN sponsored SPECMAP series. This results in circular reasoning since computed insolation is assumed to pace the glaciations and terminations and has been used to date them. Figure 4. The causality problem. The arrow marks when the effect has taken place before the theoretic cause. According to Milankovitch theory, glacial termination II, leading to MI Stage 5 or the Eemian interglacial, could not have commenced earlier than 135 kyr ago (vertical grey dotted line) due to lack of solar forcing. However, data from Devils hole cave (thin grey line) indicates a much earlier start since deglaciation was already well under way at 140 kyr ago. SPECMAC series data (thick black line) is of no help since it was set to match 65°N summer insolation so the middle of each rise is set at maximum insolation (grey vertical bars). Data from Barbados coral reefs (Green and yellow) supports the early start as sample NU-1471 indicates that by 136 kyr ago, according to sea levels, termination II was already 80% complete. The 65°N summer insolation is in orange. Obliquity is in blue. Obliquity cycle started 10 kyr earlier, at 150 kyr ago. Source: C.D. Gallup et al. 2002. Obliquity added.
A third issue is that glacial cycles are symmetric between the hemispheres, as both are warming or cooling simultaneously, whereas the seasonal precession forcing (and 65°N summer insolation) is anti-symmetric. That is when one hemisphere warms, the other cools.
A fourth problem that is seldom discussed is the 41 kyr problem (Raymo and Nisancioglu, 2003). If Milankovitch Theory struggles to explain the glacial cycle in the last 0.8 million years, it has no less problems to explain it between 3-0.8 million years ago. During that period temperatures and global ice volume varied almost exclusively at the 41 kyr obliquity period, while high-latitude summer insolation is always dominated by precession. Raymo and Nisancioglu (2003) argue that these earlier interglacials cannot be understood within the current framework of the Mylankovitch Hypothesis.
Evidence that the pacing of interglacials does not follow a 100 kyr cycle
The claim that interglacials follow a 100 kyr cycle is surprising. According to the LR04 marine sediment core or EPICA Dome C Antarctic ice core no single interglacial of the past 800,000 years starts 100,000 years after the previous one (table 1). It is also difficult to understand how a 100 kyr cycle hypothesis can be supported based upon 11 interglacials within the last 800 kyr that have an average spacing of 72.7 kyr, very far from 100.
Table I. Interglacials of the past 800,000 years. Interglacial start date was determined directly from EPICA Dome C temperature data from δDeuterium isotopic changes. Temporal distance between interglacials was calculated between start times. Average distance is 72.7 kyr, while most frequent distance is close to 82 kyr.

To clarify this issue, I have plotted the interglacial start date versus distance from previous interglacial, following Euan Mearns (The Alpine Journal, in press; personal communication). The result is given in figure 5. The data strongly indicates that the spacing of interglacials tends to fall on multiples of the 41,000 year obliquity cycle. There are two anomalous interglacials, MIS 11 was unusually long, and MIS 7e was unusually short. If their deviation is due to an early start in the first case and a late start in
the second, then the distance to the next interglacial might be affected simply by the change in start date. Correcting for the start date, the length of the two interglacials places every cycle in the graph close to the obliquity lines.

Figure 5. The 100 kyr Myth. Plot of Interglacial start date versus distance to the previous interglacial. The spacing of interglacials shows a strong tendency to fall into multiples of obliquity spacing (red bands). Even the anomalous interglacials MIS 11 and MIS 7e (stars) can be explained by their abnormal length. If their length transgressions were accounted for, every dot would be near the red bands. Bottom: EPICA Dome C temperature plot. Grey continuous line, obliquity. Grey dotted line, eccentricity.
Another observation is the presence of two interglacials separated by only one obliquity cycle (41 kyr) at times of very high eccentricity (figure 5). This suggests the existence of a repeating pattern following the 413 kyr eccentricity cycle where the length of a unit is given by the distance between MIS 15a and MIS 7c, 365,000 years, or nine obliquity cycles, during which five interglacials take place, four of them separated by 82 kyr and one by 41 kyr. The average spacing of interglacials would then be 73 kyr, very close to the average value of 72.7 kyr for the entire series. Interglacials would take place every 1.8 obliquity cycles, although the cycle is irregular, as the existence of short and long interglacials and the past glacial period lasting three obliquity cycles show.
Evidence that obliquity and not insolation sets the pacing of interglacials
The evidence that obliquity sets the pace of interglacials is so abundant and clear; I am very surprised by the general failure to recognize it, even by scientists and people that have looked at the data in detail. Since Milankovitch proposed that the pace of interglacials was set by changes in insolation forcing caused by orbital variations, the belief in the climatic effect of summer insolation variations at 65°N is deeply ingrained. It is questioned by few, and reminds us of other hypotheses that are taken as fact without solid evidence. Let’s review the evidence in favor of obliquity:
a) Glacial cycles were indeed governed by the 41 kyr obliquity cycle for most of the Quaternary Ice Age prior to the mid-Pleistocene transition (figures 2 and 6), and the 23 kyr and 100 kyr cycles werenowhere to be seen in that period. The simplest “Occam’s razor” explanation is that obliquity does the job.
b) Throughout the Pleistocene, Earth has been cooling down progressively (figure 2). The cooling of the planet reached a point at around 5 million years ago when some interglacials started to be affected and did not reach what we consider interglacial temperatures, so we do not consider them to be interglacials and do not assign them numbers in the MIS sequence (figure 6, asterisks). However, the Mid-Pleistocene Transition did not involve any change in insolation, or orbital cycles, so proponents of the 100 kyr-Insolation Milankovitch Hypothesis are at odds to explain how an obliquity cycle turned into an eccentricity cycle.
 Figure 6. Pleistocene temperature proxy record. δ18O isotopic record from LR04 stack of 53 benthic cores from all over the world shows that from about 1.5 million years ago some interglacials continued reaching the previous average temperature (red line), while others show a decreasing trend in interglacial average temperature (blue line), and are not considered interglacials. Periods of higher temperature more recent than MIS 23 that did not reach interglacial levels are usually not assigned an MIS number (asterisks). Source: Lisiecky and Raymo, 2005.
The most interesting question is not why some obliquity induced periods of warming fail to reach what we consider interglacial temperatures, but why some still manage to reach them given the cooling of the planet.
c) Although precessional changes greatly affect the amount of insolation during a three-month period, that change is quickly averaged over the following three months, leaving total annual radiation unchanged. By contrast obliquity changes add a significant amount of warming at high latitudes year after year over a period of thousands of years and can have an enormous cumulative effect (figure 7). The temperature proxy record clearly shows temperatures decreasing during periods of low obliquity (yellow at mid-latitudes in figure 7), and increasing during periods of high obliquity (blue at mid-latitudes in figure 7).
 Figure 7. Annual insolation changes at high latitudes and the symmetry problem. Changes in annual insolation by latitude and time are shown in a colored scale. They are essentially due to changes in obliquity (blue sinusoidal curve), since changes in insolation by precession are averaged between seasons within the same year. The high latitude persistent changes in insolation last for thousands of years and correspond quite well to changes of temperature in Antarctica, shown as a blue line overlay. Glacial-interglacial cycles show symmetric temperature responses in both hemispheres. As we can see Antarctic temperatures respond with warming despite 65°N summer insolation increases corresponding to 65°S summer insolation decreases. Source: Steve Carson. The science of Doom.
d) Summer insolation is dominated by the 23 kyr precession cycle. When a frequency analysis is performed on both the insolation calculated data and on temperature proxy data only a very small response from temperatures to insolation is detected (figure 8). The only consistent response between both insolation and temperature data is given by Not only is there no significant signal for a 23 kyr cycle in the data, but if 65°N summer insolation is so important it becomes difficult to explain why it sometimes has a huge effect on temperatures and at other times it has almost no effect.
 Figure 8. Disparity between calculations from Milankovitch theory and data from observations. A Gabor transform is a windowed time-frequency Fourier analysis. When applied to the 65°N summer insolation calculations from the orbit of the Earth during the last 800 kyr it shows the main contributors to that signal thought to be responsible for glacial terminations. The main contributor is the 23 kyr period, followed by the 18 kyr period, both from precession cycles, followed by the less intense 41 kyr period from obliquity cycles. When the same analysis is performed over the temperature data from observations (Epica Dome C ice core record), we can see that the temperature of the Earth barely responds to precession, as the band at 23 kyr is very tenuous. Instead we see obliquity bands at 41 and 83 kyr (double harmonic) and the prominent band at 100 kyr, that cannot be the eccentricity, since it is missing what should be an even stronger band at 413 kyr. Source: John Baez.
e) When six interglacials of the past 800 kyr that display a similar duration, plus the Holocene, are aligned by temperature, their obliquity graphs also align (figure 9). The change in obliquity and temperatures is in phase with a delay. However, the same is not true for their insolation pattern, that displays more variability (figure 10). This variability underscores that for MIS 7c, MIS 5, and MIS 15c insolation could not have driven glacial terminatio In the first interglacial insolation was too early and the last two it was too late (see the stage 5 problem above).

Figure 9. Interglacial alignment with obliquity. Interglacials MIS 1, 5, 7c, 9, 15a, 15c, and 19 were aligned by temperature. Their obliquities also display a significant degree of synchronization. Obliquity bottoms 20 to 15,000 years before the start of the interglacial. The warming in Antarctica starts about 10,000 years later, and proceeds so fast that interglacial average temperatures are reached by the time obliquity peaks about 19,000 years after it started rising. The interglacial comes to an end with a delay of about 5,000 years over the falling obliquity. Sources: EPICA Dome C, Jouzel, J., et al. 2007. Astronomical data, Laskar, J., et al. 2004.

Figure 10. Interglacial alignment with 65° N summer insolation. Same as figure 9 for northern summer insolation. Although insolation also has a tendency to align indicating that interglacials cannot take place if insolation is working in the opposite direction, the spread is clearly higher in this case. Insolation for MIS 7c came too early and for MIS 15c and MIS 5 too late to be held responsible for driving interglacial warming.
f) Average duration of MIS 5, 7c, 9, 15a, 15c, and 19 interglacials measured at the -3° C anomaly in the EPICA data is ~ 18,000 years. Average duration of the up swing of the obliquity cycle at 23.5° is ~18,000 years. Average duration of the northern summer insolation cycle at 500 W/m2 is ~ 11,000 years.
Interglacials tend to last the same as the obliquity cycle but shifted 4-6,000 years due to the Earth’s thermal inertia. It is the same reason that makes the yearly temperature cycle follow the seasonal insolation cycle with about a 1.5 month delay.
Evidence from interglacial pacing, temperature response to obliquity, temperature-obliquity alignment, and interglacial average duration clearly indicates that, in general, interglacials respond primarily to the obliquity cycle as they have always done and still do. Despite a general consensus ignoring what the data clearly indicates, some authors have realized this fact and are proposing hypotheses where obliquity is responsible for the glacial cycle (figure 11. Huybers and Wunch, 2005; Huybers, 2007; Liu et al., 2008).
 Figure 11. A simple stochastic model of glacial-interglacial cycles based on obliquity. Huybers and Wunch, 2005, could not statistically reject the null hypothesis that glacial terminations are not caused by precession or eccentricity, but rejected that they were not caused by obliquity. They developed a model based only on obliquity that reproduced the pacing observed. Left, A run of the model. Right, frequency histogram of the glacial duration of multiple runs of the model showing the duration of the past 6 glacial periods as black triangles. Source: Huybers and Wunch, 2005.
The hypothesis that obliquity drives the glacial cycle solves most of the problems of Milankovitch Theory. The 100 kyr problem is solved because there is no 100 kyr cycle, just a 41 kyr cycle that skips one or two beats. And it solves the 41 kyr problem for similar reasons. It solves the causality problem because now glacial terminations usually start at the bottom of the obliquity cycle and therefore MIS 5 termination is well underway at 135 kyr BP when 65°N summer insolation is still too low. It also solves the lack of asymmetry in the polar response, as the obliquity cycle is symmetrical in both poles.
Interglacial determination in the Late Pleistocene
Knowing that obliquity is the main factor in enabling and pacing interglacials also in the Late Pleistocene, we can analyze the data to see which other factors contribute to determine when an interglacial should start. Interglacials take place after a period of increasing obliquity, and there have been 24 such windows of opportunity during the past million years, producing 13 interglacials and 11 obliquity cycles without an interglacial. Figure 12 shows those windows of opportunity (numbers on top) with red bars for the successful ones and blue bars for the unsuccessful. Two factors can be identified as being important. The first one is 65°N summer insolation above 520 W/m2 at the second half of the opportunity window (above the red line, red and green circles in the insolation panel of figure 12), and the second one is temperatures at or below those equivalent to 4.55 ‰ δ18O or above at the first half of the opportunity window (below the blue line, red circles in the temperature panel of figure 12).
When temperatures are high at the start of the window of opportunity and insolation does not reach 520 W/m2 towards the end, the interglacial does not take place despite increasing obliquity. When one of the conditions is right but the other is not, the best prediction is given by the low temperature condition, as most of the time a low enough temperature at the start of the rising obliquity drives an interglacial even if insolation is not high towards the end of the rising obliquity. High insolation at the end of the obliquity window alone does not result in an interglacial unless it is extremely high, above 550 W/m2, and this only happens when eccentricity is very high, 200, 600 and 1000 kyr ago (green circles and green numbers in figure 12). This is the likely reason why interglacials have a reduced spacing of one obliquity cycle (41 kyr) at times of peak eccentricity, as in the case of MIS 15a/MIS 15c and MIS 7c/MIS 7e.
 Figure 12. A simple model of interglacial determination based on obliquity, insolation, and temperatures. Top, A window of opportunity takes place every time obliquity increases, marked with a colored bar, red when an interglacial results and blue when not. Middle, Insolation is proposed to promote interglacial conditions when above the red dashed line at 520 Wm2, during the second half of the window (red circles), or directly result in an interglacial when above the green dashed line at 550 W/m2(green circles). Bottom, Low temperatures are proposed to promote interglacial conditions when below the blue dashed line at 4.55 ‰ δ18O during the first half of the obliquity window (red circles). Numbers on top are periods of increasing obliquity with red numbers indicating an interglacial produced by favorable conditions (red circles), blue numbers indicate an interglacial was not produced due to unfavorable conditions (blue circles), and green numbers indicate interglacials produced by very high insolation despite unfavorable temperatures (green circles). MIS 13 (window 13) cannot be explained by this model, thus the question mark.
MIS 13 cannot be explained in terms of insolation and initial temperature conditions like the rest of interglacials. It is a very atypical interglacial. Temperatures were very high at the start of the obliquity increase, so instead of a rapid warming driven by strong feedbacks, its warming is progressive and relatively slow. It does not align with the rest due to its unusual temperature profile, complicating our analysis. It looks like a failed interglacial with a big temperature spike towards the end.
The low temperature factor at the start of the obliquity increase is clearly a proxy for strong feedback factors that operate more strongly when temperatures are very low. Among the known factors are:
- – Reduction of ice-albedo
- – Increased melting of ice
- – Rising sea levels
- – Increase in dust
- – Increase in greenhouse gases
The effect of the temperature decrease during a glacial period prior to the next obliquity cycle has the effect of pulling a spring. The stronger it is pulled, the stronger and faster it will go in the opposite direction when released. This spring acts as a negative feedback to further cooling, and its existence could be inferred from the narrow thermal regulation of the planet during at least the past 560 million years. It is what allows interglacials to take place during this very cold period of the planet, as otherwise for the last 1.5 million years the planet would have been locked in a permanent glacial period only interrupted by interglacials every 400 kyr, at the peak of eccentricity. It is possible that there wouldn’t be humans in that planet as conditions are already too close to CO2 starvation for plants during glacial maxima. Only the arrival of the occasional interglacial prevents further cooling.
When obliquity starts rising during a glacial period it starts moving energy little by little from tropical to polar areas. Its effects on global average temperatures are not noticeable for many thousands of years. If the planet is very cold, with a great portion of the water in huge ice sheets over continents and continental shelves then powerful feedbacks will start. Temperatures will rise after about ten thousand years of increasing energy transfer to higher latitudes and warming will accelerate. It is at about this time when rising precessional insolation during the summer in the northern hemisphere will start contributing to the undergoing melting of the northern ice sheets. The contribution of feedback factors and northern summer insolation is what allows the Earth, every 1.8 obliquity cycles, to overcome the cold inertia of the planet. It is an additive process where obliquity sets the pace, and is helped by feedback factors and northern summer insolation. If one of these two is strong enough the other might be dispensed. The result is that every interglacial is different. It is the response to forces that assemble and come apart at different times and with different intensities.
An interglacial therefore can be predicted by knowing the temperature at the beginning of the obliquity cycle increase and the insolation conditions during the second half of the obliquity increase. As temperatures usually require more than one obliquity cycle to get low enough, that is the likely reason that interglacial spacing is close to two obliquity cycles. It is very unlikely therefore that a new interglacial will take place in 30,000 years, and more probable that it will take place in 70,000 years. In fact, an interglacial should have started 50,000 years ago, and we should not be in an interglacial now, but despite low enough temperatures (figure 12 number 2), insolation was very low at the time and started decreasing when obliquity was still rising.
Interglacials of atypical duration and the likely length of the Holocene
Six interglacials out of the past ten during the last 800 kyr display a very similar temperature profile in EPICA Antarctic records (MIS 5, 7c, 9, 15a, 15c, 19). They show a fast increase in temperatures for 5-7,000 years, followed by a temperature stabilization for about 5,000 more years, and then a slow temperature decline that accelerates with time for the next 10-12,000 years during which they lose two thirds or more of the temperature gained from the glacial maximum at the interglacial start. During the period of high temperatures (above -2° C anomaly), that lasts about 15,000 years, each interglacial presents a different temperature profile, highlighting interglacial uniqueness.
After aligning them, I have averaged the temperatures and obliquity of those six interglacials, and the insolation profile of five of them. MIS 7c presents a very deviant insolation profile that would significantly alter the average of the rest, so it was not included. The result is an average interglacial that we can compare to the two interglacials that display a very different duration, the short interglacial MIS 7e 244 kyr ago, and the long interglacial MIS 11 425 kyr ago (figure 13).

Figure 13. Comparison of atypical interglacials to the average interglacial. An average interglacial (grey curve and 1σ grey bands) was constructed from interglacials MIS 5, 7c, 9, 15a, 15c and 19, after aligning them at the specified date for each of them. The obliquity for all of them (grey sinusoid continuous line) and the insolation curves at 65° N 21st June for all but MIS 7c (grey dotted line) were also averaged. MIS 7e temperature, obliquity and insolation data are similarly plotted in blue, and MIS 11 in red. Sources: EPICA Dome C, Jouzel, J., et al. 2007. Astronomical data, Laskar, J., et al. 2004.
MIS 7e started very late in the obliquity cycle because most of the time when obliquity was increasing, northern summer insolation was decreasing (figure 13). Under normal circumstances MIS 7e would have been a cycle without interglacial, however 250 kyr ago eccentricity was very high and rising quickly (figure 5), and when at the obliquity maximum, insolation started to increase strongly, temperatures responded triggering a delayed interglacial. But as soon as insolation peaked 242 kyr ago, the simultaneous falling of obliquity and insolation could not sustain the interglacial. MIS 7e started late because it was triggered by the insolation cycle due to high precession, but ended on schedule for the obliquity cycle and became a shortened interglacial.
MIS 11 was also started by precessional insolation before obliquity had a chance to increase, becoming an early interglacial (figure 13). But the reason is not the same as MIS 7e, as precession was actually very low 430 kyr ago. If the relatively small increase in insolation provided the signal for glacial termination, the strength of MIS 11 early warming appears to have been provided by very strong feedback factors, as temperatures before MIS 11 appear to have been extremely low, the second lowest in the entire 5 million year LR04 benthic stack proxy (figure 12). MIS 11 became such long interglacial because it increased temperatures in three steps. The first step triggered by rising insolation and strong feedback response ended early when insolation peaked 244 kyr ago. But then rising obliquity provided the impetus for a second warming period, as insolation did not decrease much, that ended 235 kyr ago when obliquity peaked. Then a third warming step took place caused by a second insolation peak 226 kyr ago. The three warming steps responsible for the extraordinary duration of MIS 11 are clearly detected in the temperature record (see figures 5 and 13) and give MIS 11 the opposite temperature profile to most interglacials since it evolves from lower to higher temperatures. It is the interglacial with highest temperatures for the longest time despite occurring at a time of low eccentricity. Given the high increase in energy and the normal thermal inertia of the planet, its decline was also a very long one, despite being more pronounced than the average decline (figure 13).
Since both MIS 7e and MIS 11 were atypical interglacials and the product of very special circumstances, it is clear that scientists claiming that MIS 11 is a good analogy for the Holocene have not carefully examined the data, and are trying to make a rule out of an exception. Alignment of MIS 1 with the average interglacial shows that the Holocene is just another average interglacial (figure 14). The Holocene temperature profile is within one standard deviation of the average. Its obliquity profile exactly matches the average obliquity profile, and its insolation profile is slightly ahead of the average, but well within the variability for this parameter. The characteristics of the Holocene are a colder starting point because the glacial period that preceded it was the longest on record and the presence of the Younger Dryas, a hiccup in the fast warming phase of unknown origin. Although I recently proposed that a low in the ~ 2400 yr Bray solar cycle at a sensitive time might have contributed to it (Javier, 2016). Its colder start, slightly earlier increase in northern summer insolation, and the Younger Dryas explain why the Holocene has not been as warm as the Eemian.

Figure 14. Holocene comparison to the average interglacial. The average interglacial described in figure 13 (grey curve and 1σ grey bands) and the average obliquity (grey sinusoid continuous line) and insolation at 65°N on 21 June (grey dotted line) are compared to Holocene temperature (smoothed, black curve), obliquity (black sinusoid continuous line), and insolation (black dotted line).
The conclusions drawn by comparing the Holocene to the average interglacial are the same as those obtained by comparing it to its closest astronomical analog, MIS 19 (Pol et al., 2010; Tzedakis et al., 2012). MIS 19 was an interglacial that was at the same “Milankovitch point” as our Holocene interglacial 777 kyr ago. It has an almost identical astronomical signature (figure 15), with the same low eccentricity and the same coincident peaks of precession and obliquity. The comparison suggests that the descent into the next glacial should start in about 1,500 years (Tzedakis et al., 2012). Notice also the natural warming events, known as AIM (Antarctic Isotope Maxima), that took place on a millennial scale.

Figure 15. Detailed comparison of the Holocene and MIS 19. a) δD (‰) temperature proxy of Holocene (red); b) MIS 19 δD (‰) mean signal (black). In panels a) and b) the thin dashed horizontal lines correspond to the present-day (last millennium average) δD levels; e) Eccentricity (dashed, right axis) and North Hemispheric 21 June insolation (solid, left axis); f) Climatic precession parameter (dashed, right axis), inverted, and finally obliquity (°, solid, left axis). AIM, Antarctic Isotope Maxima, a warm event. ACR Antarctic Cold Reversal. Source: Pol, K. et al., 2010.
Once the present short warming interval ends, the Holocene should continue its temperature descent and an increase in northern summer insolation in the next several thousands of years should not significantly alter this decline as it has not done so in the past (figure 10). To my knowledge no decaying interglacial has been revived this late in the obliquity cycle regardless of the amount of northern summer insolation. Therefore, there is no astronomical reason to expect that the Holocene should be a long interglacial, and humankind must wait for another obliquity cycle, probably the one after next, in 70,000 years, to have another chance at being scared by global warming.
Role of obliquity in the glacial cycle
Most scientific authors publishing on the glacial cycle have focused on local conditions to try to explain it. Insolation, albedo changes, and dust deposition are supposed to act maximally at a certain latitude at the edge of the ice sheet. Solving the glacial cycle however may require out of the box thinking. Raymo and Nisancioglu (2003) have proposed a “gradient hypothesis” to explain the role of obliquity during the Early Pleistocene. Orbital data indicates that the insolation gradient also changes in anti-phase with obliquity (figure 16). The insolation gradient is largely responsible for the equato-polar thermal gradient, that is widely believed to be the engine that drives heat and humidity transport from the equator to the poles through oceanic currents and the atmospheric circulation. Figure 16. Obliquity comparison to the insolation gradient. Insolation gradient curve (red) is the difference in summer half- year insolation between 25° and 70°N insolation. Minima in insolation gradient correspond to maximum obliquity (black). Source: M. E. Raymo & K. Nisancioglu, 2003.
The gradient hypothesis proposes that as obliquity and polar insolation increase, the insolation gradient decreases (figure 16). This would have the double effect of keeping more heat in the planet from being lost at the poles through radiation, and reducing the moisture poleward transport that feeds the ice sheets. The opposite effect would take place when obliquity decreases at the end of an interglacial. Within this hypothesis the tropics, with their huge thermal and moisture capacity, become principal agents in the formation and waning of ice sheets orchestrated by obliquity changes, while local factors like latitudinal insolation, albedo, and dust are important secondary players that sometimes become decisive.
Raymo and Nisancioglu (2003) have failed to extend their hypothesis to the Late Pleistocene, but there is no reason why the mechanisms involved should have changed at the Mid-Pleistocene Transition.
Role of CO2 in the glacial cycle
As evidence shows, authors that predict an unusually long interglacial continuing for 20 to 50 kyr longer (Loutre and Berger, 2000), based on 65°N summer insolation are mistaken. Astronomical data does not support a long interglacial. MIS 11 is the only example of a long interglacial in the Late Pleistocene (last 800 kyr), and has a unique astronomical configuration as shown above (figure 13).
Other authors however propose a long interglacial of 500 kyr (Archer and Ganopolski, 2005), tempered in a later article to just 100 kyr (Ganopolski et al., 2016), based on CO2 levels. The difference of half an order of magnitude in their calculations attests to the level of uncertainty in their estimates. Tomorrow may well be a date for the next glacial inception, as it is within their uncertainty bounds. But, the first thing they must do is to demonstrate that CO2 plays a significant role in the glacial cycle.
CO2 is no doubt one of the several feedbacks that must act on the glacial cycle, as CO2 levels increase with the warming of glacial terminations and decrease with the cooling of glacial inceptions. However, we must remember that CO2 is a positive feedback as it acts in the direction of the change in temperatures. The glacial cycle is clearly dominated by negative feedbacks that constrain temperature variations and as we have seen warming is faster with a colder starting temperature. This effect is clearly illustrated in figure 12 where the biggest warming responses belong to the coldest starting points, instead of being proportional to the amount of insolation increase.
Regarding CO2, we are confronted by an interesting paradox. We know from ice core measurements that glacial termination I (the closest to us 15 kyr ago) involved a change in CO2 atmospheric concentrations from 190 ppm to 265 ppm, an increase of 75 ppm. Concurrently the temperature increased globally by an estimated 4-5°C (von Deimling et al., 2006; Annan and Hargreaves 2013). The defenders of CO2 as a main factor in climate change have developed the hypothesis that CO2 was largely responsible for the warming at the end of glacial periods once the astronomical signal initiated the warming. But if CO2 carried out most of the warming, that means that at the very least more than 2°C of the warming was caused by the increase in CO2.
A simple calculation tells us that the rise from 190 to 265 ppm is 48% of a doubling of the temperature effect. This is true because we are dealing with a logarithmic scale, (ln(265)- ln(190))/(ln(190×2)-ln(190))=0.48). So 48% of a doubling produced at least 2°C of warming between 15-10 kyr ago. The rise from preindustrial to current levels of CO2 (280 to 400 ppm, or 120 ppm) constitutes 51% of a doubling of the temperature effect. That is (ln(400)-ln(280))/(ln(280×2)-ln(280))=0.51. Yet, if CO2 is responsible for 100% of modern warming, why has it produced only a 0.8°C increase (HadCRUT4 1850-2014)? Something is not right. 15 kyr ago half a doubling of CO2 would have resulted in at least half of 4-5°C of global warming, but now it produces only 0.8°C of warming? Therefore, if our knowledge of past CO2 levels is correct, and the hypothesis that CO2 was responsible for most of the warming at glacial termination is correct, 15 kyr ago CO2 was three times more potent than now.
There is no way to reconcile the disparity that was already noticed by the late Marcel Leroux in his 2005 book “Global Warming – Myth or Reality?: The Erring Ways of Climatology.” So either we accept, based on current data, that CO2 had a very minor role during the Ice Age, responsible for, at most, one sixth of the warming at terminations, and therefore conclude that CO2 is not the important climate factor that many think, or we start thinking, based on ice core data, that in the last 60 years the world has plunged into a precipitous fall into glacial conditions but the severe cooling is being prevented by our timely production of CO2.
Some might prefer to ignore the available evidence and declare that the current CO2 increase is going to be as potent as the increase 15 kyr ago. They might claim that the warming effect of CO2 will occur in the next few centuries and therefore our current levels of CO2 are going to produce no less than 1.7°C of warming (i.e. an equilibrium climate sensitivity of ~ 5). There is no evidence to support this belief. In fact, there is ample evidence against it:
– The continued removal of anthropogenic CO2 via increasingly robust carbon sinks. The more we produce, the more is removed from the atmosphere. An increasing removal rate works against a hypothesized high warming commitment from current CO2 levels.
– The lack of evidence for a climate sensitivity as high as 5. Most experimentally deduced values for equilibrium climate sensitivity are between 1.5 and 2.5, less than half of the rate required for the claimed role of CO2 in deglaciation.
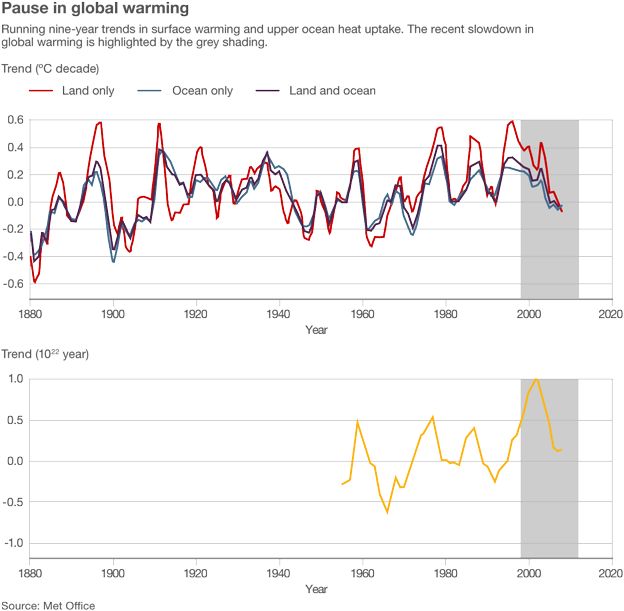
– The lack of a significant increase in the rate of warming during the last century. If we had actually increased the committed warming significantly, the rate of warming should have increased proportionally, but that is not what has been observed (figure 17).
 Figure 17. Measure of the rate of warming. Despite a great increase in the amount of CO2 released by humankind to the atmosphere since the 1950s, the rate of warming does not show much of an increase for the past 120 years. This is quite strong evidence that there cannot be a lot of committed warming accumulating every year for the past seven decades, as its cumulative effect is not noticeable in the rate of warming. Source: UK Met Office through the BBC.
– The existence of long periods (decades) with little or no warming should be highly unlikely if we had actually accumulated a huge amount of committed warming.
The only reasonable way to reconcile the disparity in CO2 increases and temperature increases between glacial termination I and the current warming is to conclude that CO2 had a minor role in glacial termination. Further, it is reasonable to expect it will have a minor role in the next glacial inception. The greenhouse theory of paleoclimatology suffers an important blow, along with our confidence that high CO2 levels can protect humankind from glacial inception.
Conclusions
1) Obliquity is the main factor driving the glacial-interglacial cycle. Precession, eccentricity and 65°N summer insolation play a secondary role. There is no 100 kyr cycle. Milankovitch Theory is incorrect.
2) The current pacing of interglacial periods is the consequence of the Earth being in a very cold state that prevents almost half of obliquity cycles from successfully emerging from glacial conditions. The rate for the past million years has been 72.7 kyr/interglacial, or 1.8 obliquity cycles between interglacials. This can be generally described as one interglacial every two obliquity cycles except when close to the 413 kyr eccentricity peaks, when interglacials take place at every obliquity cycle.
3) Glacial terminations require, in addition to rising obliquity, the existence of very strong feedback factors manifested as very low glacial maximum temperatures. High northern summer insolation at the second half of the rising obliquity period is a positive factor, and if high enough during eccentricity peaks can drive the termination process.
4) CO2 can only produce a minor effect in glacial terminations since the measured change in concentration (roughly a third of a doubling which represents half of the warming effect of a doubling) is too small to account for any important contribution to the large observed temperature changes.
5) Since the precession cycle has bottomed and the obliquity cycle is half way down we should expect the next glacial inception to take place within the next two millennia.
Acknowledgements. I thank Andy May for reading the manuscript and improving its English, and Euan Mearns for providing a figure from a publication in press that was the basis for figure 5.
Bibliography. Link to [references].
Methods and Data. Link to [methods-data]
Moderation note: As with all guest posts, please keep your comments civil and relevant.

The simplest “Occam’s razor” explanation is that obliquity does the job.
The simplest “Occam’s razor” explanation is that it snows more when oceans are warm and thawed and the ice builds and advances and causes cold. It snows less when oceans are cold and frozen and the ice depletes and retreats and allows warm. The ice cycles do most likely resonate with Milankovitch cycles, giving the appearance that Milankovitch is more important than the ice extent cycles. Ice extent is always more in coldest times, ice extent is always less in warmest times. That is a cause and not a result. Look at the ice core data from Antarctic. It always snows more in warm times and it always gets cold afterwards. It does not ever snow more after it gets cold first.
If it snows more when the oceans are warm, and less when cool, and the temperature of the oceans depends on obliquity, then the ice is a consequence, not a cause. You seem not to have read the part about the insolation gradient being set by obliquity, and probably driving humidity transport in the article above.
Javier
Thank you for another extensive overview.
I think that the Milankovic cycles are only the trigger for start of an ice age, while principal driver is not the change in insolation but the geological evolution of the North Atlantic region.
Transition from 40 to 100 Ky periodicity is due to the progressive global cooling going back to 3My or more. The lower peak of the global temperatures reduced the oceanic precipitation and consequently longer period of time required for the N. Canadian ‘trampoline’ to be sufficiently loaded.
Hi Vukcevic.
Milankovic Theory states that the glacial cycle is due to high latitude northern summer insolation. As this is not the case, the theory is incorrect. There is no 100 Ky periodicity. The most reasonable explanation for the transition from 41 to 73 Ky is as you say and showed in figures 2 and 6, the cooling of the planet.
You mention Shakun’s 2012 paper on CO2 and termination. It is simply a statistical hash. His proxies do not show what he asserts because they disagree with each other about onset and termination timing. By many millennia. There is a simple decomposition showing this in essay Cause and Effect in ebook Blowing Smoke. Therefore I agree that whatever triggers deglaciation onset, it isn’t CO2.
> Therefore I agree that whatever triggers deglaciation onset, it isn’t CO2.
Shakun et al (2012) agree with you as well, Rud:
How very interesting.
Interesting indeed. So let’s go to the other end of the cycle and observe that interglacial terminations always begin at the maximum level of Henry’s Law produced CO2.
Obliquity sends more energy to the poles, but at seasonality modulated by precession. Send more energy to the poles in winter and the difference is not enough to melt ice, it may even foster more snow.
There definitely is a seesaw effect, for whatever reason.
Ultimately Occam insists that whatever sends the planet into episodes of ice at the poles should have some relation to the fibrillations that occur within the episodes. Milankovitch cannot explain these macro episodes.
If we can imagine a Nimbus satellite measuring the earth’s radiation to space during the descent into the current macro glacial episode, it would have seen more or less radiation? More if you are a Carbon groupie, less if you are a physicist.
Radiation is light. The energy of light is proportional to frequency and the square of amplitude. 41 kyr =more energy, less amplitude; 100kyr =less energy, more amplitude. We may be seeing the planet’s quanta…
The article is now published in The Alpine Journal.
This one:
http://www.alpinejournal.org.uk/
?
Willard
Your link went to an archive of the journal finishing in 2014
I suspect it is the 2016 version but it appears we will need to pay for it
http://www.cordee.co.uk/Alpine-Journal-2016-det-10-55-55-14386.html
It looks an interesting journal. I have several books on mountaineering and exploration in the alps and arctic dating to the 1800’s which have numerous interesting articles and observations.
Tonyb
The one that Tonyb linked to, yes. Unfortunately I’m just too busy right now with other things to join in here. Suffice to say I think Milankovitch is a bit of a red herring. Reinforced by reading Clive’s latest.
Eccentricity changes only affect seasonal insolation. If you average solar insolation over a full year then you find it has no effect whatsoever. It is always the same independent of how large eccentricity gets. This is a consequence of Kepler’s third law.
That is true when considering the insolation of a whole relative year at a given eccentricity, but not when considering the insolation of one eccentricity to a different eccentricity on absolute time. If Mercury changes its eccentricity to that of a comet, it won’t be getting the same insolation per absolute unit of time as it is getting now. You may argue that the insolation will be the same over a new much longer year, but Mercury will be frozen nonetheless.
I think there is more merit to this, not deserving the handwaving. It’s exactly the topic of Huybers 2006
https://dash.harvard.edu/bitstream/handle/1/3382981/Huybers_EarlyPleistoceneSummer.pdf?sequence=1
to which I already linked in my previous. It demonstrates (not it speculates) that the effect of Keplers third law is that eccentricity and precession tend to cancel each other over a total accumulation of summer insolation, making the obliquity the primary solar forcing variable.
This is exactly what we see in the LR04 benthic stack before 1Ma, making the 100ka cycle of the last million year even more awkward leading to the idea that the 100ka cycle is not a climate cycle.
A planet on an elliptical orbit moves fast when close to the Sun, slow when away from the Sun. So it spends more time away from the Sun.
Javier, did you mean to say 150 thousand years apart,…? Paragraph 5 of the introduction.
150 million years apart is correct. We are talking about Ice Ages, not Glacial Periods. The distinction is clear for geologists, not so much for common people. The current Ice Age is already 3 million years long and probably a few more in the future.
Thank you.
A speculation about deglaciation onset. We know from morraines and kettle lakes in northern Illinois and southest Wisconsin that the maximum Laurentide extent was at onset. That means the oceans were at their minimum depth some 130 meters lower than today. This has the potential to significantly change ocean circulation. For example, theMalacca and Sundra Straits would be dry land changing Pacific circulation. Doggerland connected UK to Europe. Bering Strait was a land bridge from Asia. Japan was connected to Korea because Korean Strait was dry land. Denmark is connected to Sweden since the Orsund is dry land. And so on. It is possible that at some max glaciation/min sea level, ocean circulation and weather patterns are forced to change sufficiently that snow accumulation stops and summer melting begins, no different than on the Antarctic Penninsula past 50 years. This would be accelerated by the dust/albedo hypothesis previously presented here.
> A speculation about deglaciation onset.
Be sure to not miss your speculation about Shakun et al (2012), Rud. It’s a doosy.
> We know from morraines and kettle lakes in northern Illinois and southest Wisconsin that the maximum Laurentide extent was at onset. That means the oceans were at their minimum depth some 130 meters lower than today. This has the potential to significantly change ocean circulation.
Something else that could change ocean circulation is freshwater intrusion from all that melting ice. And wouldn’t you know it, Shakun and Co. have some thoughts along those lines as well:
Twice now this paper shares some similar thinking with you. Not so bad for a “statistical hash”, innit. Go for the hat trick, and maybe we can rule out broken clock syndrome.
BG, Shakun’s paper was one of several discussed in the essay that tried to erase the temp/CO2 lags in ice core records, thus directionally supporting ‘CO2 caused Holocene warming’. He claimed those lags did not exist in seafloor proxies. His statisitcs were a hash, and his main conclusion muddled wrong. It remains so, and all your insults here cannot change that fact. Read the essay which shows how the hash was made. Cut the ad homs if you want to be taken seriously.
> BG, Shakun’s paper was one of several discussed in the essay that tried to erase the temp/CO2 lags in ice core records, thus directionally supporting ‘CO2 caused Holocene warming’.
Once again from the paper itself, Rud:
> Cut the ad homs if you want to be taken seriously.
Learn how to read if you want me to take you seriously, Mr. Academic Misconduct. I bolded the important bit this time to help you figure it out.
Brandon
I don’t want to get involved in your tiff with Rud as I find this subject highly speculative.
However the title of The paper, the summary immediately under it and the words ‘ alternatively’ that lie beneath the section you quoted all make it appear that the authors believe the title of their own paper. It says towards the end
‘Our global temperature stack and transient modelling point to CO2 as a key mechanism of global warming during the last deglaciation. Furthermore, our results support an interhemispheric seesawing of heat related to AMOC variability and suggest that these internal heat redistributions explain the lead of Antarctic temperature over CO2 while global temperature was in phase with or slightly lagged CO2.’
One of the problems I have found during my own research ( this subject is far too speculative to be of real interest to me) is how often you have to sometimes read a modern paper before you can understand what point the authors are making and indeed they appear to be making contradictory claims at times. This is a confusing and poorly wrItten paper and I will wait for you and rud to finish your duel over it before I decide what it is really saying
The heyday of well written and clear science papers seems to have ended around 30 Years or so ago, coincidentally probably as the computer became commonplace
Tonyb
> I don’t want to get involved in your tiff with Rud as I find this subject highly speculative.
Best to not get between me and his goal on the same pitch then, Tonyb.
> This is a confusing and poorly wrItten paper and I will wait for you and rud to finish your duel over it before I decide what it is really saying
Some duel. His original statement in this thread, “whatever triggers deglaciation onset, it isn’t CO2” is almost exactly what Shakun et al. themselves concluded:
No advanced degrees or acute interest should be required to correctly parse the equivalence of those two plain English statements, no matter how poorly written one thinks either may be.
I can’t NOT hit the back of the net with the goal that wide open.
Hi Brandon
From Real Climate
‘Skeptics, CO2 lags, and all that…
Not surprisingly, several people don’t like this paper because it reaffirms that CO2 is important for climate. The criticisms have ranged from the absurd (water vapor is still not 95% of the greenhouse effect, particularly in a glacial world where one expects a drier atmosphere) to somewhat more technical sounding (like criticizing the way they did the weighting of their proxy records, though the results aren’t too sensitive to their averaging method). There’s also been confusion in how the results of Shakun et al. fit in with previous results that identified a lag between CO2 and Antarctic temperatures (e.g., Caillon et al., 2003).
Unlike the claims of some that these authors are trying to get rid of the “lag,” Shakun et al. fully support the notion that Antarctic temperature change did in fact precede the CO2 increase. This is not surprising since we fully expect the carbon cycle to respond to radical alterations to the climate. Moreover, there is no mechanism that would force CO2 to change on its own (in preferred cycles) without any previous alterations to the climate. Instead, Shakun et al. show that while CO2 lagged Antarctic temperatures, they led the major changes in the global average temperature (including many regions in the Northern Hemisphere and tropics).’
Confusion? Surely not?
You are quite right about Antarctic temperatures (as I said above) but Co2 is fingered as the cause of the major changes in the global average temperature. Perhaps the players are still wandering around in front of the open net pondering precisely where to put the ball? Or perhaps its 1-1 to both sides.
Shame Rud hasn’t returned as yet, but I note that Don Easterbrook and Willis are wondering around in midfield, both of whom had plenty to say on this aspect of the subject.
Me? As I said previously its all highly speculative and unproven and no doubt -like food experts-someone else will be along shortly to tell us something different.
tonyb
> Confusion? Surely not?
Truly it is not. It’s actually quite simple. The paper says: “CO2 did not initiate deglacial warming”. Rud said: “whatever triggers deglaciation onset, it isn’t CO2”.
My argument is that those two plain English phrases are in agreement. Whether either of those statements are true, false, speculative, unproven, poorly written, etc. is not relevant to my argument. Neither is anything that Skeptical Science wrote, “statistical hash” or any other red herring distractions.
Razzle dazzle really doesn’t impress me, Tonyb. YMMV.
“the maximum Laurentide extent was at onset”
Precisely, the crust of the N. Canadian ‘trampoline’ was at its maximum strain too, only a bit of extra stress from the first available Milankovic cycle was required to get far N. Atlantic fracture going and spewing magma huge volumes of magma.
Volcanic ash deposits from the Iceland’s, greatly increased volcanic activity would initiate melt of the ice blockage in the shallow next door Denmark Strait. Once the strait is even partially opened it would enable (followed by rapid increase) inflow of the warm equatorial waters into depleted Arctic Ocean.
Insolation via warmer air can’t explain rapid ice melting (the high ice albedo is still there) only the warm equatorial waters could bring the required heat energy to do the work.
J. Maclennan et all 2002
“Temporal variation in the eruption rate and lava composition in the rift zones of Iceland is associated with deglaciation. Average eruption rates after ~ 12 kyr BP, were up to 100 times higher than those from both the glacial period and recent. This peak in volcanic activity finished less than 2 kyr after the end of deglaciation.”
http://a-sceptical-mind.com/wp-content/uploads/2009/12/Climate-Optimum-1024×429.jpg
Tectonics ended the last Ice Age
http://www.vukcevic.talktalk.net/IIAV.gif
Ristvan, I am a layman, I understand your point of current changes at those (huge) different sea levels, does salinity have any effect on warm/cool temperature levels of those changing basins as well?, thanks.
Probably yes, but how much? I just have not researched the matter sufficiently. It is salinity at the surface that matters most for thermohaline circulation because of brine exudation from forming sea ice. Depths should be and are saltier. Saltier means more aggressive circulation. On the other hand, lower sea level by 130 meters given an average ocean depth of over 2000 meters cannot change salinity very much if well mixed. Dunno.
Shakun et al 2012 is a sophisticated smoke-and-mirrrors conjuring trick with the sole purpose from the outset of manufacturing a false CO2-driving-temperature conclusion. Here’s how he did it:
– Holocene warming started ~20kya around Antarctica in the southern oceans. The NH Bollling-Allerod warming in the NH started much later, ~15 kya.
– CO2 started outgassing from the SH oceans with the SH warming 20kya.
– Shakun collected about 50 “proxies” of the Holocene including some biological ones (pollen, midges) that are so weak they scarcely resolve the Holocene itself, let alone the BA and YD. Mixing these liberally with the more reliable isotope proxies gave the desired result – a profoundly blurred vague lump of a Holocene reconstruction. In particular the BA and the YD were more or less obliterated by this blurring by false proxies.
– Putting the curve of CO2, outgassing from the earlier-warming SH, against the massively blurred Holocene temperature blob-reconstruction, allowed the spurious conclusion that CO2 was leading temperatures.
– Shakun’s wordplay was clever. He wove the Antarctic and bipolar seesawing into the narrative while concealing the fact that the apparent lag of temperature after CO2 in the NH was an artefact of comparing primarily NH temperatures with CO2 largely originating from the earlier-warming SH oceans.
– As a skilled conjurer Shakun drew attention away from where the real action was happening.
Javier here is what is behind glacial and inter- glacial cycles
It starts in the big picture with Milankovich Cycles but in conjunction with two key parameters which is the land /ocean arrangements and the mean elevation of the land masses combined with the strength of the earth’s magnetic field.
One has to take into account those two factors when evaluating how much of an impact Milankovitch Cycles will have on the climate.
In addition the state of the climate how far it is or close to the threshold of glacial versus inter- glacial conditions has to be applied to all of the above and probably the moon has a role to some degree in this big climate picture puzzle.
Next and very important is the solar activity itself which will be superimposed upon the former and how extreme it is and how long in duration is the extreme solar condition.
Note- it is not just the change in primary solar conditions that are important but rather the secondary effects which are able to drive the terrestrial items which influence the climate to either a colder or warmer mode, if solar conditions are extreme enough/long enough in duration.
Those terrestrial items ranging from volcanic activity , global snow and cloud coverage, surface ocean temperatures and sea ice coverage along with atmospheric circulation and oceanic current changes. .
When all of these factors combine or phase in a certain way they change the climate but by how much depending on how far the initial state of the climate is from the glacial /inter-glacial climate intersection. The closer the climate being to this intersection the less dramatic the changes that will be needed by all of the items I have mentioned in the above to bring about a given dramatic climatic change.
A very interesting and informative piece. Thanks.
.
There are a number of other objections to Milankovitch cycles as the cause of ice ages. Before accepting correlation of M-cycles with global temp, take a look at how those correlations were made–they are self-proving–involving squeezing and expanding curves for deep sea cores and M-cycles until they match, then claiming that because they then match, the correlations must be correct!
Synchronous glaciations in both hemisphere argue against M-cycles but are large unexplained and ignored. Many D/O abrupt climate reversals (the most prominent being the Younger Dryas) argue even more strongly that full-glacial climate changes take place much more rapidly than M-cycles can account for. These facts seemed to invalidate M-cycles as the cause of glaciations and interglaciations, but are now ignored by many.
Recent isotope studies appear to point more logically to a solar cause.
As Kuhn pointed out, Don, when a paradigm is in place, anomalies are ignored. I call this “paradigm protection” and it sounds like what you are describing for M-theory, which I too have always doubted. So far as I know no mechanism has yet been found to transfer slow M-cycles to rapidly occurring glaciations and interglaciations.
In addition to a solar cause, glaciations and interglaciations may just be a large scale chaotic oscillation, with no discernible cause.
The descent into a Glacial period is actually a very slow phenomenon. As figure 14 shows, the drop in temperatures takes upward of 30,000 years, and is usually not completed when the next obliquity cycle interrupts the descent. The glacial cycle has little to do with chaos. Must be those powerful attractors.
Javier: How is it that you know that the glacial cycle has little to do with chaos?
Javier: How do you know the global temperature and its rate of change a million years ago?
David,
The interglacials come on schedule like the trains to a station. To a casual observer the arrival of the trains may look like a chaotical process.
David,
Obviously I don’t. It is an inference based on proxies, so we know that as much as we can trust the proxies are reflecting something related to the reality.
> As Kuhn pointed out, Don, when a paradigm is in place, anomalies are ignored.
For example:
I’ll let you find who wrote that and where, DavidW.
The problem is that the proxies are not reflecting something related to the reality (of global temperature, glaciation, etc.). Proxies are not thermometers and even if they were one cannot determine global average temperature from a few thermometers. So we do not know that these events are as regular as you claim. The uncertainties are enormous and yet we find a bunch of graphs drawn with fine lines. This is simply pure speculation claiming to be facts.
Popcorn futures are looking good today.
If we cannot trust proxies, how do you know that glaciations and interglaciations occurred rapidly?
I was right. [wipes tears from eyes]
Javier
Fantastic article btw, brightened up what was otherwise a bad day.
Remember that chaotic oscillations can be periodically forced – note the large literature on periodically forced BZ reactor systems for instance.
So periodicity in no way excludes chaos, the heartbeat is a chaotic phenomenon in terms of fibril propagation but is strongly forced by internally generated periodicity (big literature on that too). Departures from the heart ‘s internally generated chaotic periodicity are seriously bad news (time for a defibrillator – a strong external forcing).
There are strongly forced (eg heartbeat) and weakly forced (eg Milankovich) nonlinear oscillators. My guess is that the mid Pleistocene revolution (or “transition”) represents a change from strongly forced (obliquity) to a weakly forced (obliquity plus precession plus maybe eccentricity) nonlinear oscillator.
This paradigm is still consistent with the facts and analysis in your article.
Another published example of a very complex oscillatory system under multiple weak nonlinear forcings is an estuary or inlet under resonant tidal forcings via a narrow inlet. Papers like those are full of very scary maths but I tend to just look at the pictures.
DE, Younger Dryas has a pretty convincing explanation supported by several lines of geological evidence: abrupt meltwater Lake Aggasiz breach of St Lawrence ice dams, with large meltwater pulse into North Atlantic shutting down thermohaline ciculation. We know the pulse occured from rock scours and the debris fan off the St. Lawrence mouth. Less clear why that explanation leads to the equally abrupt end of the event.
So Younger Dryas is a special case, not like the other abrupt events?
I am fascinated by the fact that the Eemian too had a Younger Dryas event !
http://clivebest.com/blog/wp-content/uploads/2016/10/Anglian-Paleo-compare.png
Sorry that should have read ‘Anglian’ ! I can’t remember MIS numbers ;-(
Clive,
That MIS 11 had a temperature inflection doesn’t mean that it had a Younger Dryas. Figure 13 above shows that the drop in temperatures in the case of MIS 11 coincided with a fall in insolation, while that was not the case in the Younger Dryas, when insolation was rising.
As far as I know, the Younger Dryas is a unique feature, so it requires a unique explanation.
I think you are pushing it there. The minimum in 65N insolation occurred 40,000 years later. MIS 11 (Anglian) was the deepest glaciation the earth ever experienced. Ice sheets spread further south and diverted the Thames from the Wash down to its current basin. Most gravel pits were formed then.
DW, seems so. I have hunted for plausible DO event explanations without success. YD was a one off.
Clive,
The first temperature peak of MIS 11 took place 425 kyr BP, coinciding with a peak of insolation of 502 W/m2 at 426 kyr BP. The drop in temperatures that you say is analogous to the Younger Dryas took place amid a decrease in insolation of about 7 W/m2 in 6,000 years. It is not much, but it goes in the opposite direction of the Younger Dryas, that took place while insolation was increasing.
It is not unreasonable to think that MIS 11 deglaciation faltered when insolation turned backwards at 425 kyr BP. It regained momentum later due to increasing obliquity.
Orbital changes can explain MIS 11, but not Younger Dryas.
David Wojick | October 24, 2016 at 3:24 pm |
So Younger Dryas is a special case, not like the other abrupt events?
I don’t think so – the Bolling-Allerod, the spike just before the YD, is just another D-O event like the other twenty or so during the last glacial interval. I call these “micro-interglacials. They all have the same cause – the positive salinity driven nonlinear instability of the AMOC. What terminates these AMOC driven warming excursions is Greenland melt (or some other local big melt). Not just at the YD, but every time.
BTW it is the B-A that is the real phenomenon, not the YD which is just the interval between the final micro-interglacial and the Holocene.
Javier your English has always been just fine.
“The most interesting question is not why some obliquity induced periods of warming fail to reach what we consider interglacial temperatures, but why some still manage to reach them given the cooling of the planet.”
Jovian cycles changing solar output levels.
https://wattsupwiththat.files.wordpress.com/2012/10/cp-8-1473-2012.pdf
A good study on duration of inter- glacial periods.
There actually is evidence of a 400k Eccentricity cycle superimposed on the obliquity signal before 3 million years ago !
http://clivebest.com/blog/wp-content/uploads/2011/10/fig3.png
Yes, I already saw that figure at your blog. It certainly appears that interglacials have a tendency to be slightly warmer according to the eccentricity long cycle, although the data is far from clear. That would not be surprising.
Javier,
This is a great article by the way! However are you sure this is right:
Surely it is 5k years before the peak in obliquity (not the minimum).
This could be a language issue.
What I mean is that obliquity started rising at 150 kyr BP while insolation started rising at 140 kyr BP. Devil’s cave data indicates that termination was already underway at 140 kyr BP and essentially finished by 135 kyr BP. This is too early to have been driven by insolation, but the right timing for obliquity.
> Yet, if CO2 is responsible for 100% of modern warming, why has it produced only a 0.8°C increase (HadCRUT4 1850-2014)? Something is not right.
Indeed, Javier. It might help to account for thermal lag due to the time it takes the deep oceans to equilibrate; two to three millennia is a good ballpark estimate. If you don’t wish to be kept waiting for several thousand years to find out, you could take note of Stephens et al. (2012), they estimate a TOA imbalance of 0.6±0.4 W/m^2. Assuming climate sensitivity parameter of 0.8 °C W^-1 m^2, that gives between 0.2 and 0.8 °C additional expected *surface* warming even if CO2 stabilized tomorrow.
Another potential issue is this calculation:
> A simple calculation tells us that the rise from 190 to 265 ppm is 48% of a doubling of the temperature effect. This is true because we are dealing with a logarithmic scale, (ln(265)- ln(190))/(ln(190×2)-ln(190))=0.48). So 48% of a doubling produced at least 2°C of warming between 15-10 kyr ago.
Here’s how I’d do it: 5.35 * ln(265/190) * 0.8 = 1.4°C
Compare the pre-industrial to modern scenario: 5.35 * ln(400/280) * 0.8 = 1.5°C
… which is in line with the upper bound of 1.6°C derived from Stephens and friends using the same assumptions.
So yeah …
> Therefore, if our knowledge of past CO2 levels is correct, and the hypothesis that CO2 was responsible for most of the warming at glacial termination is correct, 15 kyr ago CO2 was three times more potent than now.
… something is definitely not right here. Perhaps a citation showing how you derived your maths would help sort this out.
The deep oceans weren’t all that much cooler; they can never cool, at their very coldest, below the freezing point of ocean water. What warms is more the ocean surface and the slope of the thermocline. Ya, warming down the thermocline takes time, but not so much as would a big change in the bottom water temperature.
brandonrgates,
The equilibration of the oceans and expected warming calculations are based on assumptions and therefore likely to be incorrect.
The simple calculation that I presented is a basic logarithmic calculation that is true for as long as temperature response to CO2 is believed to be a logarithmic function. Unlike your calculations it does not contain any other assumption. If temperatures respond in a logarithmic fashion to changes in CO2, then changes in CO2 cannot explain simultaneously glacial termination and current warming. One or both is mostly not due to CO2 changes.
Could the aberrations of MIS 7e and MIS 11 be explained by unique circumstances unrelated to obliquity, precession, or eccentricity such as unusual/unpredictable geological or astronomical events such as super volcanoes or close approaches or collisions?
MIS 11 lacks a proper explanation except for the hypothesized very strong feedback from very cold conditions. MIS 7e is clearly an issue of insolation and obliquity first working against each other and then coming together for a shorter interval. I don’t know of any evidence of super volcanoes or collisions.
Yellowstone has erupted three times in the last 2.1 million years, the most recent was 630,000 BP
Javier is on the correct path that is for sure.
Enjoyed this article very much.
Looking forward to my second read.
It is interesting how human timecentric climate science seems to be.
I expect the “CO2 is the one true faith” monitors to show up soon.
Steel thyself.
By coincidence I have also been looking at latitude gradients in summer insolation and have found an interesting effect. If you calculate the differential change in solar energy with latitude then the ending of all interglacials always coincide with minimum gradient. Small gradients imply less polar/tropical energy exchange. The next minimum is in 7000 years time !
http://clivebest.com/blog/?p=7368
I look forward to read it as soon as time permits. You know I am a usual reader and commenter at your blog.
We hope to unravel the mystery of the 65th parallel north over the next 25,000 years although it could take 50,000 to 100,000 years. Meanwhile, let’s continue upending Western civilization anyway and replace the thousands of points of light with mind-numbing centralized secular socialist government planning.
First, Javier, thanks for a most interesting article.
I find a curious contradiction in your work. You first say:
OK, your claim is that there is no 100 kyr cycle … then you go on to say:
In other words, you’re saying that the strongest cycle inherent in the EPICA Dome C data is 100 kyr cycle …
I’m not clear how you can hold two such opposing viewpoints.
Thanks,
w.
Hi Willis,
I know this has to be shocking, but not every peak that comes out of a frequency analysis constitutes a cycle. I don’t know the reason why the 100 kyr frequency band comes so strongly in every analysis, but it does. I guess frequency analysis can have artifacts. However a proper analysis looking at every interglacial start date, shows that they are paced at an average of 73 kyr which agrees with the fact that there are 11 interglacials in 800 kyr. One cannot derive a 100 kyr cycle with so many interglacials in that time unless one starts cheating and deciding what is an interglacial and what not and considering that 2 interglacials are one peak, to fit the hypothesis.
Frequency analysis can have artifacts .. well, it does have artifacts, that’s if you are referring to a classic Fourier transform. To do it right, you need data from all times from minus-infinity to a plus-infinity. Succintly summed up by a general: An explosion, what a beauty, it contains all the best melodies of the world.
The proper way to do a frequency analysis for time-limited data fortunately exists, it is called a wavelet transform. Unfortunately, it opens a new can of worms – you have a considerable freedom how to do it.
Javier | October 24, 2016 at 3:26 pm | Reply
Sorry, not news to me, not shocking at all. I deal with it all the time. However, there is widespread agreement that the ~100-kyr peak shown in any Fourier analysis is real and significant.
I use several methods to determine if a cycle is an artifact. First, I look to see if it occurs in the first and last half of a dataset. Then I see how many cycles we can see. If it is less than four, I get very nervous.
Then I actually graph the cycle itself. In this case, my Fourier analysis puts the peak cycle at about 98,000 years. So I simply determine the best-fit for a cycle of that length. Here is the result:
https://dl.dropboxusercontent.com/u/96723180/EPICA%20Temperature%20Anomaly.jpg
As you can see, the troughs of the 98,000-year cycle line up quite well with the troughs of the ice age temperatures …
And that is why people say there is a 100-kyr cycle in the ice ages … because the cycle actually exists, persists over time, and has done so for a number of cycles.
w.
Willis,
Thank you for your clarity. is there an explanation for why there appears to be a trend of declining temperatures of the troughs? And also there declining trend is continuing to deeper and for longer after each of the last few troughs?
It also appears the troughs are lasting longer.
And the current interglacial has lasted much longer than any other.
[As an aside can we be grateful for humanity’s intervention to delay the start of the decline towards the next deep trough?]
Do you have any comment on whether the location of the tectonics playing a role? See pages 6-8 here: https://www.geo.umass.edu/climate/papers2/deconto_tectonics&climate.pdf
The planet cooled rapidly about 35 Ma and 10 Ma ago (the latter when North and South America joined). That’s when permanent ice sheets started at the South Pole (see solid blue bar in middle section of Figure 6.1 here: https://www.ipcc.ch/publications_and_data/ar4/wg1/en/ch6s6-3.html ).
This is only the second time in 540 million years the planet has been this cold.
https://html2-f.scribdassets.com/9mhexie60w4ho2f2/images/1-9fa3d55a6c.jpg
The cycles of ice ages and sea level rises and falls that have prevailed during the Pleistocene Ice Age are similar to those that occurred during the Carboniferous ice age: http://www.geocraft.com/WVFossils/Carboniferous_climate.html
Can the planet get out of the current ice age until the plates north and south of the tropics separate to allow circulation of ocean currents in low to mid latitudes, and circulation of cold ocean currents around Antarctica is blocked again (as it was before Australia and South America separated from Antarctica)?
I have nothing to say about the mathematical analysis, but the result does not match the empirical evidence. That is the most important test and you don’t do it properly.
Both eccentricity and obliquity can and in fact do have an effect on temperatures, so that boosts the mathematical significance of both. However if we have to decide which one dominates the glacial cycle and spaces interglacials we have to examine both as I do here:
http://i1039.photobucket.com/albums/a475/Knownuthing/Spacing2_zpsnmwsen4m.png
The black curve is EPICA temperature, the blue curve is obliquity, and the red curve is eccentricity normalized. The distances are slightly irregular both in obliquity and eccentricity. I hope you see the problem. Out of 9 peaks eccentricity runs into very serious problems in 4. Three interglacials fall outside the peak (red stars), and two interglacials fall inside one peak (red dots). And even when the interglacials MIS 17 and 19 fall inside a peak, they are showing an obliquity distance (blue bar). So that leaves you only with the distance between MIS 13 and 11 to support your case. And both can hardly be described as typical interglacials.
Obliquity offers a much better match to empirical evidence. There are no doubt some irregularities, but the norm is that when temperatures rise, they almost always follow the obliquity curve with a slight lag of 5-10,000 years.
So despite all your tests, the 100 kyr cycle fails the only one that matters, the comparison of the resulting cycle to the empirical evidence.
I understand that the 100 kyr periodicity does come out of the data. The belief in a 100 kyr cycle for the past 45 years has to have a basis. However this is one of those cases were the evidence leads to the wrong conclusion if not properly considered.
Please note that the question of the prospective length of the Holocene as informed by the Devils Hole record (and other issues such as the challenge to Milankovitch Theory as well as a more recent and relevant list of DH publications than just the 1992 paper the author refers to ) was discussed in “Devils Hole, Nevada—A Primer”: U.S. Geological Survey Fact Sheet 2012–3021, by J.M.Landwehr and I.J.Winograd. It is available online at
http://pubs.usgs.gov/fs/2012/3021.
Quote:
What does Devils Hole reveal about how long we can expect the present interglaciation to last?
No one knows for sure how long the present interglacial will last. Any estimate depends on several factors: the paleoclimatic archive and proxy record(s) utilized; the degree to which these records reflect global conditions; the theory invoked; and current potential climatic influences, such as anthropogenically generated greenhouse gases. The Devils Hole δ18O record indicates that the last four interglaciations each lasted over ~20,000 years, with the warmest portion being a relatively stable period of 10,000 to 15,000 years duration (Winograd and others, 1997). The most recent portion of the Devils Hole record suggests — as do SST records off California — that the warmest portion of the current interglaciation began by 17,000 years before present (Winograd and others, 2006). From these data one might infer that in the absence of any mitigating conditions, such as anthropogenically induced climate warming, the onset of a period of global cooling is imminent or even overdue on a geologic time scale (Ruddiman, 2007). However, some researchers have suggested that the current interglaciation might continue for tens of thousands of years (Berger and Loutre, 2002).
Hi Jurate,
Thank you for the updated reference on Devils Hole. I will read it.
I also think that the evidence shows that the Holocene interglacial should be reaching within the next two millennia the end of its expected span.
“The null hypothesis was that there was no wolf. When the villagers accepted the boy’s hypothesis with a sample size of one and not enough evidence, they committed a type I error, a false positive.”
And they lived happily ever after. Well, not quite. The story goes that they subsequently committed a type II error, with fatal results.
Thanks, Nick. Indeed, a cautionary tale …
w.
Nick Stokes,
Maybe GHE alarmists can’t even get a fairy story details correct.
“At last Peter learnt his lesson, that if you always tell lies, people will eventually stop believing you; and then when you’re telling the truth for a change, when you really need them to believe you, they won’t.”
Peter, it seems, was an attention seeking alarmist mischief maker. His real life counterpart might be a certain balding bearded bumbling buffoon, spreading unwarranted alarm. Scientists might like to consider the moral of the fable.
In any case, in the story, only some sheep died. If the villagers had any sense, they feasted well, after giving Peter a good beating, for being such an obnoxious, annoying, time-wasting little sh*t.
But anyway, Nick, this is just a fairy tale. It’s not actually true, just like the GHE is just a fable.
You may choose to believe that fairy tales are fact. Less gullible people have a good laugh at the story, but realise it’s just a story.
Cheers.
Yes Nick,
It is a good example for students to remember what a type I and type II errors are. Both are to be avoided, although false negatives have worse repercussions in medicine, as in the tale.
Some of the Alpine Journal charts: Click to get a very big version.
I’m a geologist, and so have picked the peaks and troughs by hand / eye and then located them on my spread sheet.
http://www.euanmearns.com/wp-content/uploads/2016/10/LR04bigraph.png
When did North and South America join?
https://www.wired.com/2016/05/geology-breaking-apart-americas-came-together/
http://www.euanmearns.com/wp-content/uploads/2016/10/maxima.png
The Himalayas (the Tibetian mountain group) is growing 4-5 mm a year (going by the elevation trend for Everest).
1.2 million years ago Everest would have been 4.8 to 6.0 kilometers lower.
The terminus of for example the Khumbu Glacier is at 4.9 km. The source of the glacier is at 7.6 km.
1.2 million years ago Khumbu glacier in theory wouldn’t have existed.
If most of the Himalayan 30,000 km2 of glacier (17% of mountain area) in the near tropics is a recent development that would explain the cooling.
The white glaciers reflect much more shortwave than the low lands, in addition to preventing the incoming short wave absorption by the lower atmosphere (since the mountains displace the lower atmosphere).
Everest summit averages -19 °C in the summer.
I doubt you’re allowing for erosion here. Given the relationship between height and erosion, I’d expect we’d get a sort of pseudo-equilibrium between uplift and erosion, with actual altitude gain happening at a much lower rate.
I doubt you’re allowing for erosion here.
http://pweb.jps.net/~prichins/everest.htm
http://www.extremescience.com/everest.htm
They’ve also determined that the Himalayan Mountains are still growing higher, at a rate of about 2.4 in/6.1cm per year.
http://www.wisegeek.com/is-mount-everest-still-growing.htm
A common estimate for its rate of growth is about 0.16 inches (4 mm) per year.
https://www.mountainguides.com/pdf/Everest.pdf
GPS research suggests that plate tectonics is causing Everest to grow
3-5mm and move 27mm northeast annually.
I’m not sure a GPS unit erodes much.
One of our main observations / conclusions was that the duration of glaciations is driven by the 41 Ka obliquity cycle or multiples thereof. But there are obviously other interfering factors. The 100 Ka cycle does not exist.
http://www.euanmearns.com/wp-content/uploads/2016/10/41000.png
If the mechanism of glaciations is not clear, why not consider the possible role of tides – which match very precisely the pattern of obliquity? During glaciations, North Atlantic tides were twice as high as today and pelagic dissipation three times as strong, and ‘these feedbacks dwarf the astronomic forcing’ of Milankevitch, according to Munk, W. and B. Bills (2007) J. Phys. Oceanogr. 37, 135-147. See also Keeling, C.D. and T. Whorf (2000) PNAS 97, 3814-3819, for effect of tides on sea surface temperature at shorter periodicity.
I am familiar with Keeling and Whorf’s works on tides and their 1823 yr cooling cycle. I will be talking about glacial tides in the next article in the series. I will look up Munk, W. and B. Bills (2007), thanks.
Obliquity plays a role here as well.
http://clivebest.com/blog/?p=7300
Javier
Here is a bunch of relevant citations. If you want a short text on the topic, contact me at longhurst.alan@mac.com. Nice post, v. helpful. Thanks. Alan
Pettersen, O. (1913) Svenska Hydrog.-Biol. Komm. Skrifter.
Pettersen, O. (1930) The tidal force. Geogr. Ann. 12, 261-322
Loder, J.W. and C. Garrett (1978) J. Geophys. Res. 83, 1967-1970.
Ffield, A. & A.L. Gordon (1996) J. Phys. Res. 26, 1924-1937
Balling, R.C. and R.S. Ceveny (1995) Science 267, 1481-1483
McKinnell, S.M. & W.R. Crawford (2007) JGR 112, doi.10.1029/2006JC003671
Yndestad, H. (2003) J. Mar. Sci. 60, 1251-1264
Keeling, CD and TP Wharf (1997) Proc. Nat. Acad, Sci. USA 94, 8321-8328
Keeling, C.D. Ann. Rev. Energy Env 23, 25-82.
Munk, W. et al. (2002) J. Climate 15, 370-385.
Munk. W. and K. Wuntsch (2010) Deep-Sea Res. I, 45 1977-2010
Thank you Alan
Another unknown is the assumption that the sun has this very narrow range of variability. Even as recent as the Maunder solar irradiance was off around some .3% who is to say that solar variability in the past has had other Maunder type minimum events with maybe solar irradiance off by even more then it was during the rather recent Maunder and who knows how long the duration of these past events might have been.
This hypothesis is based mostly on observed data – that is to say, on approximately 150 years of data. As an example, it rained yesterday. It is raining today. I conclude it will be raining forever.
Along those lines is how weak might the solar wind have been in the past maybe consistently around 275/km/sec which would be significant.
What I am getting at this assumption that our star is so steady in energy output is a stupid unproven assumption and the recent Maunder Minimum sheds light to this argument, along with other stars which show much greater variability.
To refine your Devil’s Hole Discussion:
Orbital control of western North America
atmospheric circulation and climate over two
glacial cycles
Matthew S. Lachniet, Rhawn F. Denniston, Yemane Asmerom & Victor J. Polyak
DOI: 10.1038/ncomms4805
Received 9 Dec 2013 | Accepted 4 Apr 2014 | Published 2 May 2014
“In contrast, the paleoclimatic evolution
of mid-latitude continental regions is less well understood
because few records have sufficient dating control, duration,
and temporal resolution to compare with orbital-scale climate
variations. In particular, the Devils Hole, Nevada, calcite d18O
record4 has led to interpretations that western North America
(Fig. 1) responded asynchronously with Northern Hemisphere
summer insolation, calling into question the applicability of
Milankovitch forcing to explain paleoclimate there.”
“A major advance in the study of Great Basin paleoclimate was
achieved with the Devils Hole oxygen isotopic (d18O) record14–16
of subaqueous calcite lining the walls of an open fault zone
within the regional groundwater aquifer, and allowed the first
continuous paleoclimate record that could be radiometrically
dated beyond the reach of radiocarbon (50 ka). Devils Hole
thereby provided a test of the nature and timing of previous
glacials/interglacials between 500 to 4 ka (refs 4,14). However, the
Devils Hole record presented a paradox because it appeared to
show deglacial warming that preceded orbital forcing14 and global
ice volume terminations2 by thousands of years. The origin of this
asynchrony has been debated for several decades17–23. Although
the Devils Hole d18O time series is still cited as a challenge to
Milankovitch forcing24, one attempt to reconcile Devils Hole
and orbital theory involved reconstructions of sea surface
temperatures along the western margin of North America
associated with fluctuations in the strength of the California
Current21. Here, SST increases also preceded global ice volume
terminations, likely driven by interactions between near-coastal
waters and North American ice-sheet extent, thus apparently
removing Devils Hole as a fundamental challenge to
Milankovitch theory20,21, but it also now leaves the question of
climate forcing open.”
“Moreover, the early
warming events observed in the Devils Hole and California
margin records are anomalous relative to other terrestrial
paleoclimate data8,23 that suggest Great Basin paleoclimate
varied coherently with global ice ages. In particular, speleothem
records from Pinnacle23 and Lehman Caves25, Nevada, indicated
glacial and deglacial timings that were consistent with
Milankovitch forcing, thus calling again into question the
nature of Devils Hole calcite as a record of Great Basin
climate22,26. However, these stalagmite time series were short
(B5,000 years), and no other long-term Great Basin vadose zone
speleothem records were previously available to corroborate their
timing or that of Devils Hole.”
“An understanding of past climate changes helps to put current global warming or “climate change” into perspective. Failure to account for past abrupt climate changes leaves us with a sample size of one warming and can cause a statistical type I error. When the village boy cried wolf, he was proposing an alternative hypothesis to the villagers. The null hypothesis was that there was no wolf. When the villagers accepted the boy’s hypothesis with a sample size of one and not enough evidence, they committed a type I error, a false positive. Given the risk of committing such an error with climate change, it is important to study the climate of the past.”
Fundamentally wrong.
1. Science is not statistics.
2. NHT is only a tool that can be used in highly controlled circumstances.
3. there is no proper QUANTIFIABLE “null” when it comes to climate change.
But more fundamentally. There is no fact, no observation, no calculation
no theory, no insight from paleo that will change what we know from physics and current observations
A) C02 is a GHG. we knew this before the study of the past, and it will survive any inquiry or blog post .. and it will survive any pseudo understading of the difference between controlled hypothesis testing under frequentist assumptions and actual science.
B) Man is dumping c02 into the atmosphere. No study of the past. No reading of tea leaves, diaries, ice cores, rocks, twigs, clam shells, mud, will change this.
C) Adding C02 will create a planet warmer than it would be otherwise. If there are natural cycles, and not just pseudo wiggles, this warming will add to the wiggles, it will not subtract from the wiggles.
Since adding c02 will create a planet warmer than it would be otherwise, warmer than it would have been had we not emitted c02, the only question of interest is ‘how much warmer” and what can we do do about it.
Do you people have some institution or program that teaches you to recite this stuff verbatim? Because that is the exact same response I get from people who have no education and no experience with climate science, or science in general.
You can’t quantify co2’s contribution to climate change, but you expect others to the quantify a null hypothesis regarding climate.
Hypocrisy is the hallmark of the post-modern “scientists.”
I didn’t get the impression Mosher expects “others to quantify a null hypothesis” but rather why bring up NHT if you can’t do it, and science is more than NHT.
“expect others to the quantify a null hypothesis regarding climate.”
The first record I have of anybody mentioning a null hypothesis was an email sent out by Willis ( to Judith and a few of us ). Since then it has been regular fair for skeptics to crow “we havent rejected the null”
Each time I ask them to QUANTIFY this NULL that hasnt been rejected.
You know H=0 or H>0 or whatever null they are choosing
They cant do it. They can put a number to their supposition that all the change we see is natural.
Huh?
The GCMs are modeling a “coupled non-linear chaotic dynamical system” very badly at such low temporal and spacial resolution that they are functioning as noise generators.
The only deterministic part of future simulations are incorrect GHG future levels in PPM and some GHG forcing algorithms implementing GHG forcing levels that are basically wishful thinking.
If you apply an increasing DC bias (with an exponential trend) to the output of a noise generator you have replicated the GCM future climate runs.
Doesn’t mean it is real or accurate.
There was some increasing downwelling in a decade of observations – but much less than the commonly claimed forcing.
For 5 million years CO2 has reacted to temperature rather than controlled temperature. Humans are now doing an experiment to see if the inverse is true. We will see how much within 20 years.
> We will see how much within 20 years.
Oddly enough that’s the perennial estimate for how far away working fusion power is (the range is 10 to 30).
Real science would have at least given limits on the time it was going to take, but unfortunately after four decades of funding, the high energy physics community has been unable to improve on their original estimate of between one and three decades.
No flying cars yet either.
This is a scandal, Clive. A scandal I say!
In other breaking news, zero multiplied by anything between plus and minus infinity is still zero. I have no idea why how that might be policy relevant, but give me a couple of decades and I might be able to give you an estimate on how long it will take me to figure it out.
The analogy is not quite right. The physics of Fusion has been known for 85 years. The hard bit is magnetic confinement. The physics of that is Magneto-Hydrodynamics (MHD) and that is hard. That is probably the equivalent of a GCM. Yet a lot of progress has been made over the last 30 years so that it is now know what configurations will work and which don’t.
GCMs have got a lot more complex but why have they not got more accurate? How can different models give such wildly different results?
“For 5 million years CO2 has reacted to temperature rather than controlled temperature. ”
More assertions.
For 5 million years CO2 has both reacted to temperature and controlled temperature.
Only the TINY TINY clive mind thinks it is either or
How can different models give such wildly different results?
Well, two different models that are bad and bad are likely to be wrong in different ways. Two models that are bad and worse will give different results.
The obvious answer is that instead of two different good models which accurately and precisely model the system’s behavior, and therefore have similar results, we have a bad/bad or bad/worse situation.
Hello Steven,
“For 5 million years CO2 has both reacted to temperature and controlled temperature.”
It can’t do both. CO2 is a feedback that enhances temperature change, as is H2O, but it certainly didn’t control it. The cold arid conditions of the LGM suppressed both CO2 and H2O, and vast areas of northern vegetation was wiped out. As orbital changes warmed the planet both H2O and CO2 played a supporting role. So also did life.
We know the speed of light. Maxwell Equations 1861
We know Hubble’s constant – but its not a fundamental anyway
We know the solution to solar neutrino problem – neutrinos have mass
We don’t know the value of climate sensitivity.
That means we don’t really know what will happen to the climate
Likewise we don’t know when the next asteroid will hit the earth, or a nearby supernova will explode, or Putin would finally get so pissed off he launch a nuclear attack.
> The analogy is not quite right.
That’s because it’s an analogy, Clive. Here’s another one: In much the same way that models are always wrong, sometimes analogies are useful.
I can make the argument without modelling it by an analogy. Some systems are difficult to figure out. I know of no universal standard for how long it *should* take to figure out a particular aspect of a sufficiently large and complex system as an entire freaking planet. Indeed, that kind of omniscient thinking implies that we wouldn’t be needing to do science in the first place.
Your scandal argument is ridiculous nonsense. However, I thank you for your concerns.
Steven,
There is no evidence that CO2 drove the abrupt climate changes of the past, and there is evidence that suggests it didn’t. As there is no evidence that CO2 is driving the current climate change, perhaps it isn’t.
There is evidence that CO2 drove the abrupt climate changes of the past, and there is no evidence that suggests it didn’t. As there is evidence that CO2 is driving the current climate change”
“As there is evidence that CO2 is driving the current climate change”
Inductive inference, the last refuge of warmists and muddled thinkers. It is warming, thus it must be CO2.
That is the same kind of simplistic thinking that prompted millions of Americans to believe Clinton raising taxes caused a balanced budget. He raised taxes and the budget was balanced. Correlation jumps to causation without stopping at GO. This is the prevalent view in spite of the fact that revenue from the tax increase accounted for only 8% of the additional revenue and the budget could have been balanced without any tax increase.
CO2 could be driving current climate change. Internal variability could also be. So could solar. The contribution from CO2 could also be imperceptible from zero. As could the other factors. Without the extensive literature referencing previous warming periods and the research into solar being in its infancy, pure logic should lead one to exhaust all other possibilities before jumping to the conclusion that pins it on CO2.
It might even be the unknown unknown player to be named at a later date, like in 2200, at the same time that human beings advance their scientific knowledge to match their hubris.
I have been reading quite a few articles and I haven’t seen any that presented such evidence. What I have read was always based on assumptions that were not supported by empirical evidence. Castles in the air.
What this series of articles shows is that the abrupt climate changes of the past had many different causes and lots of feedbacks. And CO2 is not between the causes, it is just one of many feedbacks.
> Inductive inference, the last refuge of warmists and muddled thinkers.
Pretense of omniscience, the mother of all special pleadings. I’ll do you one better: Popper is rolling over in his grave. Laughing.
“Pretense of omniscience, the mother of all special pleadings.”
You should know, as your schtick is entirely dependent on exactly that.
The notion that inferences drawn from mere laboratory comprehension of CO2 physics and current in situ temperature observations are totally incontrovertible is a stunningly naïve assessment of the reliability of “climate science.” It manifest the mind set of an ad man, not any qualified scientist.
C. Is not true. No real thermodynamic process is reversible. It is possible that adding CO2 could cause net cooling, e.g. via increased cloud cover. It is not where I would put my money but it is plausible.
Steven Mosher
Please advise when we can expect this warming to take effect in a meaning and noticable way, other than those recent very slight temperature increases due to El Nino etc.
Is the warming immediate, should we have expected some sort of moticable increase in temperatures in the areas of high emittance such as Asia / China, or is it delayed. If so how long. Does it suddenly accunulate this heat at a critical point due to density and we are all cooked, sort of like a highway to hell. Is it the extra CO2 as it enters the surface of the ocean that is going to cause the warming.
Regions that I have investigated such as the two areas in Russia in January and February mentioned in the UAH report, warmed due to atmospheric transport. A simple look at the historical wind patterns and this years are a dead giveaway.
Please give at least a clue, you seem to know. As a modeller surely you must know these answers. The rest of the modellers seem not to know either.
Yours truely
Mosher,
But more fundamentally. There is no fact, no observation, no calculation
no theory, no insight from paleo that will change what we know from physics and current observations
So you think we should trust your models over insights from paleo evidence do you?
That’s not science.
I’ll try that again
Mosher,
So you think we should trust your models over insights from paleo evidence do you?
That’s not science.
1. I dont trust models
2. PALEO DEPENDS ON MODELS
2. PALEO DEPENDS ON MODELS
Wrong!!!. Only in the world of modellers
What models generated the empirical data used to draw this:
https://html2-f.scribdassets.com/9mhexie60w4ho2f2/images/1-9fa3d55a6c.jpg
And this:
https://i0.wp.com/s3-eu-west-1.amazonaws.com/rankia/images/valoraciones/0017/7202/Temp_Fanerozoico.png?zoom=2
?
> What models generated the empirical data used to draw this:
lol, Peter, you really are lost at sea here. What are empirical proxy data mapped to a temperature metric, turned into an anomaly … all of which is then integrated to a global average if NOT a model? Not even satellites can save your bacon here:
http://2.bp.blogspot.com/-hq08FYLhzUU/VptNB8_N8KI/AAAAAAAAAjc/5YjhBFXH1BQ/s1600/xht86.jpg
So is good old fashioned in situ empirical data derived from thermometers modelling writ large.
How’s your hunt for the damage function going, by the way? Every time you argue that we can’t make rational policy decisions without one, you are arguing that we can’t make rational decisions without … [drumroll] … a model.
I couldn’t make this up.
How many thermometer reading have you referring to before the Holocece back to 500 Ma, dummy?
What models are you referring to that the geologists used to work out the climate changes over the this period before the 1950’s, dummy? (for some basic background, read Principles of Physical Geology by Arthur Holmes, (first published 1946), 2nd Edition, Chapter XXI, Ice Ages, pp667-740.
Read
“I couldn’t make this up.”
But you do, Gates, big style.
Every time you post.
“Since adding c02 will create a planet warmer than it would be otherwise”
More unsubstantiated tripe.
The planet is not a laboratory experiment where all conditions except one can be held constant and a single parameter varied in a controlled manner, which is the ONLY situation where such a statement might be justifiable.
> The planet is not a laboratory experiment where all conditions except one can be held constant and a single parameter varied in a controlled manner which is the ONLY situation where such a statement might be justifiable.
Neither is the human body, catweazle666. Yet we know from non-laboratory controlled experience that trace amounts of cyanide will kill it.
Let’s put your definition to an even more direct test. Solar output increases 2%. Is it justifiable to assume that the most likely planetary response would be warming? Or are the sundiddit crowd full of tripe?
Blimey Gates, if you set fire to a strawman as big as that, you probably really would get global warming.
Aside from the utter lack of that silly analogy (CO2 is essential to life and part of the cycle, whereas cyanide isn’t) it utterly lacks originality, and has been debunked on innumerable previous occasions.
As for your silly sun analogy, there is a massive difference between an evident direct radiative heating effect and a conjectural highly indirect reduction in rate of cooling, but I doubt you possess the necessary grasp of thermodynamics to comprehend a concept as complex as that.
You’re really not very good at this, are you?
brandonrgates,
The original comment was that adding CO2 will make the planet warmer than it would be otherwise.
This is a GHE cultist trying to pretend that adding CO2 will result in heating. He knows this is complete nonsense, so tries to fool people by pretending that a fall in temperature is really heating. Of course, it isn’t!
Insulating boiling water doesn’t cause it’s temperature to rise. It still cools. This applies to the Earth as well. In fact, because the atmosphere reduces the amount of insolation reaching the surface by some 30%, the surface is cooler than it otherwise would be. During the day, of course. Check temperatures on the Moon if you want to see how high temperatures can get in full sunlight, rather than the reduced amount that reaches the Earth.
At night, the Earth’s surface remains warmer, but cools nevertheless.
GHE cultists just can’t help demonstrating their bizarre conviction that CO2 has magical heating properties, even though it makes precisely no difference to anything at all.
The IPCC states that future climate states are not predictable. Deny all you wish, but that’s the fact.
As to trying to divert and confuse, by changing the subject – yes, its quite possible that increasing the amount of energy absorbed by an object would cause a rise in temperature. This is your great gotcha? You obviously refuse to accept this in respect of the Moon, but wave it around like a triumphal banner in another context!
Talk about bringing a wet noodle to a gunfight!
No GHE. No additional heating due to CO2, or any GHG at all. As a matter of fact the hottest places on Earth have the least GHGs in the world – the arid tropical deserts.
Passionate belief won’t make inconvenient facts go away. Demanding a relaxation of science for your odd beliefs doesn’t advance your cause much, does it?
Cheers.
CO2 is a greenhouse gas and Man is dumping it in the atmosphere. Adding it to the atmosphere will warm the planet. However, real science should give limits answer as to what climate sensitivity is. Unfortunately despite 30 years of funding the climate science community has been unable to improve on a value of 1.5 – 4.5C
This is a scandal.
Agreed!
talk to Einstein, Feynman, Hubbel, and heck even Galileo.
Some numbers are hard to pin down.
but never fear.. policy makers will choose a number
because
THEY get to CHOOSE
not you
“They get to choose”
Appeal to authority.
I guess they also know where we live?
ptolemy2: “I guess they also know where we live?”
Knowing the type in question, I have no doubt they know where our children live too, and where they go to school.
This is a scandal.
Lawyers don’t ask a question if they don’t want (or suspect they won’t like) the answer,
This is the scientific equivalent.
If it was beneficial to global warming theory to have a accurate and precise answer we would have had an accurate and precise answer long ago.
“This is a scandal.”
too funny.
1. Check how long it took to nail down the speed of light.
2. Check out the Hubble constant
3. Check out the long debate over solar Neutrinos.
tiny Clive Mind wants his science and he wants it NOW!!
Sorry.
The range is 1.5 to 4.5
Politicians advised by experts will DECIDE what value they want to use
to make Policy
They will not consult you.
good thing that
Steven Mosher,
Demands, demands!
Deny, divert, confuse – again and again.
Check this, read that.
Anything to avoid providing any scientific basis for the supposed GHE. No falsifiable hypothesis, no experimental support, rather the opposite.
In view of the IPCC admission that prediction of future climate states is not possible, why the persistent obsession with trying to convince people that a GHE exists?
What’s the point? But keep trying. Maybe you can convince people that slowing the rate of cooling (warmer than it otherwise would be) results in heating (as in “Hottest year EVAH!”).
Go for it! Maybe you can convince the rest of the world that the non-existent exists!
Cheers.
The original 1.5°C to 4.5°C estimate came from the 1979 Charney report.
http://web.atmos.ucla.edu/~brianpm/download/charney_report.pdf
So it is in fact 36 years.
And we are expected to believe the mainstream “climate scientists”” assertion that “the science is settled”…
Heh!
> And we are expected to believe the mainstream “climate scientists”” assertion that “the science is settled”…
It’s funny … I was thinking of you when I responded to Mr Pile, catweazle666. Now I know why:
A few hours later, my comment disappeared from the live page. Apparently somebody wasn’t interested in exploring the similarities between the late GCC and mainstream scientific thinking on the existence of an enhanced greenhouse effect. Interesting, however beside my main point.
Like you, I think “the science is settled” is a wrongheaded and thoroughly ridiculous slogan. But let’s not pretend that there isn’t a difference between a scientific consensus on the existence of an effect and uncertainty of its magnitude. Nor let us pretend that climate scientists don’t understand that difference. To pretend such things might be construed as a lack of Integrity.
“It’s funny … I was thinking of you when I responded to Mr Pile, catweazle666. Now I know why”
It’s because I’ve got under your skin, sunshine.
https://wattsupwiththat.files.wordpress.com/2009/02/insolation-at-65-north.jpg
It is sort of crazy to say that the current temperatures could get warmer than the Eemian when the Eemian had more than 50 W/m2 higher insolation.
But temperatures do not depend on insolation. Current 65°N summer insolation is only 480 W/m2, when the average for the past million years is 494 W/m2. We are clearly not below average temperatures for the Ice Age.
CO2 increases caused by man are miniscule and do not add up to a hill of beans when it comes to climatic impacts.
In addition the natural processes of earth govern co2 as is evidenced in the fact that co2 concentrations always follow the temperature.
In addition the entire GHG effect which is more dependent upon water vapor is driven by the climate rather then the other way around.
As the climate cools the GHG effect will lessen.
Re: “The only reasonable way to reconcile the disparity in CO2 increases and temperature increases between glacial termination I and the current warming is to conclude that CO2 had a minor role in glacial termination”
Yes, and it has a minor role in recent temperature trends. My analysis of the published global energy budget data reveals internal patterns and constrained energy balance terms, leading to a conclusion that the whole flux structure is strongly regulated by the incoming solar flux.
More details in the introductory sections of my webpage
http://globalenergybudget.com/Easy1.html
http://globalenergybudget.com/Medium-v2.html
and in the Summary:
http://globalenergybudget.com/#Summary
The gradient hypothesis proposes that as obliquity and polar insolation increase, the insolation gradient decreases (figure 16). This would have the double effect of keeping more heat in the planet from being lost at the poles through radiation, and reducing the moisture poleward transport that feeds the ice sheets
I think this is not correct as far as the effects on glaciation. I think a weaker temperature gradient between the equator and the poles is needed to at least start glaciation, which means a -AO or meridional atmospheric circulation pattern, against the back drop of lower global temperatures overall. This being due to cooler summers but not winters.
In other words less obliquity would cause cooler polar summers helping maintain snow cover but this would only apply to summer while the winters with less obliquity would be warmer in the Arctic regions especially in relation to lower latitudes. This in turn would create at least in winter a more meridional atmospheric circulation which would serve to bring moisture up from the lower latitudes to higher latitudes and promote more snowfall and thus more snow cover. Yes these latitudes would be warmer due to a more meridional atmospheric circulation but that would not matter because temperatures during the winter season would still be far below freezing.
Then this added snow coverage itself would promote more cooling in the summer in addition to the lessening obliquity. Yes the temperature gradient overall would gradually be increasing between the equator and poles but doing so in response to a greater snow coverage in the higher latitudes which can’t really get going unless the atmospheric circulation pattern at least during the winter is more meridional in nature.
A zonal atmospheric circulation +AO is not gong to result in the needed moisture to be brought up from the lower to the higher latitudes to promote enough of an increase in snowfall to create greater snow coverage.
So in order to get a glacial period underway a warmish Arctic is needed not a colder Arctic, and this is in relationship to the lower latitudes. This being needed during the winter season ,the cooler arctic summers then helping the increase winter snow coverage to maintain itself.
It really is not so much the amount of temperature cooling that counts but rather the total area that stays below freezing which matters that can increase even if the global temperature in that area does not decrease per say. Why? because again in winter the entire area is below freezing and it does not matter if it 10 degrees below freezing or 15 degrees below freezing only that the area us below freezing.
One last point a meridional atmospheric circulation pattern would promote greater cloud coverage as opposed to a zonal atmospheric circulation pattern which would promote lower global temperatures on balance overall.
Prolonged minimum solar conditions promote a meridional atmospheric circulation pattern in the N.H, and that is in evidence once again during the solar lull of 2008-2010.
Land /ocean arrangements ,the earth geo magnetic field strength ,solar primary and secondary effects have to be superimposed upon the Milankovitch Cycles to get the resultant climate.
The weak geo magnetic field and solar weak magnetic field necessary to promote a global cool down.
The geo magnetic field’s role being overlooked, which at a minimum compounds given solar activity and it’s secondary effects.
Thanks Javier for another highly informative article. Your thoughts on the 41K cycle and how they interact with other forcing events to trigger terminations etc makes sense.
My thoughts are that the Sun plays no role in the glacial/interglacial process and just plods along in its narrow band of Maunder type lows and Roman Warming type highs. It has done so for billions of years and is likely to continue for several billion years.
The sun does play a role . Wrong.
Geoff,
I agree that the scale of the changes involved in the glacial cycle far exceeds the known variability of the Sun.
As well as the geo magnetic field . You want to make it simple it is not simple.
In addition on rear occasions but they do happen cosmic impact events probably have played a role along with mega volcanic events. It just is not that simple.
Their is is also a school of evidence that very low solar activity might have triggered the YD.
http://www.sciencedirect.com/science/article/pii/S1040618200000604
Javier,
Very nice post. Very interesting. The Southern Hemisphere might have been a little different form the North –
“That triggered other climate mechanisms, such as changes in winds, which allowed the Southern Hemisphere to continue to warm. So while temperatures took a nosedive in the north, they must have been warm enough to melt the ice age glaciers in New Zealand.”
Mind you, apparently the Australian continent is lurching roughly NW at about 7 cm per annum. Even over a relatively short million years, this is likely to have affected weather and climate patterns a fair bit. And as to the rest of the continents, who can say where they were?
Marine fossils are found 6000 meters above present sea levels, and at depths well below present sea levels.
Add to this the apparent jelly like wobbles that the molten part >99% of the Earth experiences, and the apparent counter rotation of the outer and inner cores, the constantly moving lithosphere, aquasphere, and atmosphere, and you have food for thought. The supposed GHE might pale into insignificance!
Toss in chaotic redistribution of energy and matter within the system, and I figure that assuming the future will be much the same as the recent past (barring unforeseen changes, of course) might be a rational position.
Who knows?
Keep up the good work. I look forward to more.
Cheers.
Javier
It takes me a while to visualize in my mind all the moving pieces in this puzzle of glaciation and deglaciation guided by the Milankovitch cycles. There is the sun and moon, the rock planets and gas giants along with climate conditions on earth that seem to influence a rate of change from on glacial state to another.
The big picture in my head says that glaciation and deglaciation occurs from large forces behaving through gravitational forcing. The periodicity reflects orbits of the planetary system that have been captured by our star. All well and good.
And then, there is abrupt climate change. Within short, by geological times we go from hot to cold and back to hot and then cold even when we are in a prolonged cooling or warming period.
As I have to “sleep” on an idea before becoming comfortable with asking a more erudite question, and, It usually takes multiple nights for me to eventually formulate a coherent question, and, usually the topic at hand frequently moves on in those lapsed days, and, I sometimes feel silly asking a question on a thread that has long since passed, I nevertheless hope that my today’s question: what causes abrupt climate change within the context of the Milankovitch cycle and its permutations? has some in sight that you can provide.
Regards.
Dear Dr Curry
I am in moderation; hence, I look to myself as having done and/or said something forbidden. Of course, you are the final arbiter.
RiHo08,
This article concerns with the glacial cycle, and is already too long for a post. The glacial cycle can be considered abrupt only in geological times. The warming phase is the most abrupt, and usually takes 5,000 years or more. Over that period, a rise of 120 meters in sea level spreads as about an inch per year. The temperature rises on average 1°C per millennium. Over a human life the sea level rise would be noticeable, but the temperature rise would not. Obviously periods of cooling and faster warming would alternate as we see in the recent past. The people at the time did not know that the world was becoming warmer and was coming out of a glacial period.
As the glaciation takes place at roughly 1/6 of the speed as deglaciation, humans of the future will not feel that the world is going into a glacial period. They will just have climate change, and unless good records are kept for very long, they’ll just experience periods of warming and cooling as always.
Javier their are many documented periods when the temperatures have changed far more then 1c per century
Of course, like D-O events or the 8.2 kyr event, but they return to what they were over the course of a few centuries,
Javier,
Great followup to your last article/post. Looking forward to the next parts.
I do have to admit, my mind is slightly blown.
Need to reread it a few times (it is very well organized and explained, just a lot for my feeble mind to encompass : )
Thanks,
GeoffW
Javier
An excellent post.
Javier,
I haven’t had time to read all you have written, but love the parts I’ve read already. Hope to get time this weekend to read all of it. Thanks!
Here are the global annual mean fluxes for the time period 2000 – 2012. All the details in the website.
http://globalenergybudget.com/Flux-table-Intro.jpg
… and here is the corresponding global energy budget diagram:
http://globalenergybudget.com/Earths_global_energy_budget.jpg
Steven Mosher | October 24, 2016 at 5:10 pm | Reply
Dang, you were doing so well with A) and B) … the problem is that we have virtually no evidence for C) … and the failure of the models makes C) even more unlikely.
w.
Furthermore, and most importantly, we have virtually no evidence that warming, if it did occur, would be more harmful than beneficial. This is the real Achilles heal in the Alarmist’s argument.
There might be a link between tectonics and climate even shorter time scale as shown here
http://www.vukcevic.talktalk.net/NAII.gif
but providing a suitable mechanism is a far more demanding task
Of course the above might be just a coincidence, or the apparent correlation may not be statistically significant, in either case one doesn’t have to bother with the matter of a ‘mechanism’.
Re:
“CO2 is a GHG” – yes.
“Adding CO2 will create a planet warmer than it would be otherwise” – no.
CO2 change does not play a role in determining the annual global mean energy flow system. In our water-abundant planet, greenhouse factors, cloudiness and albedo have predetermined values by the energetic structure. The fluxes are integer multiples of a unit flux (actually, of LWCRE, longwave cloud effect, in the all-sky mean, as shown above in my table and diagram); cloud area fraction is connected to the all-sky transfer function (planetary LW emissivity) as ep = beta = 3/5; shortwave reflectivity is constrained at albedo = 1 – sin 45° = 0.293. The greenhouse effect sits at its prescribed g = 3/5 value very precisely, as it is required by the structure. The all-sky surface energy balance equation is E(SRF, all) = 2OLR(all) + LWCRE, unequivocally connected to the fluxes at TOA, and independent of the atmospheric CO2-content. The clear-sky surface energy balance equation is E(SRF, clear) = 2OLR(clear), reproducing the LW-opaque closed-shell geometry.
http://users.clas.ufl.edu/rrusso/gly6932/Steffensen_etal_Science08.pdf
The abrupt climate change issue especially from 20000 to 10000 years puts a big dent in all aspects of the various parts of the Milankovitch Theory has to offer.
These climate changes are far to fast and massive and can not be possibly tied into Milankovitch Cycles. This puts a big ? mark on this article which is great and makes sense but something is missing in the climate puzzle and the historical climatic data once again shows this to be the case.
This article shows slow gradual change from glacial to inter- glacial and yet the ice core evidence show otherwise.
As I have said Milankovitch Cycles yes they bring the climate to a gradual warming or cooling trend over 1000 of years but there are many factors at play that are superimposed upon these slow very slow climate changing cycles that wind up causing the climate to change very abruptly.
So this article is good but falls short as to why the climate changes so abruptly.
Vuk you are on to something in your previous post showing a tie in of the climate to the Arctic Geomagnetic Field.
As I have said the geo magnetic field of the earth is being ignored even more then solar variability when it comes to why/how the climate may change.
To my little understanding a fluid system under an increasing temperature gradient organizes its flow system to transport the maximum of heat. So a higher gradient might induce a switch to a more efficient configuration resp. heat transport which might actually reduce the gradient somewhat again (and the opposite for a reduction in gradient).
So I found the gradient hypothesis very interesting.
Thus an increase in greenhouse gases could actually lead to lower temperatures. At least one would expect a slightly negative feedback.???
My expectation would be that an increase in GHGs would not increase global temperatures uniformly. They should act maximally when the air is cold and has less water vapor, which means they should warm more higher latitudes over lower latitudes, increase winter temperatures rather than summer temperatures, and increase night minimal temperatures rather than day maximal temperatures. This prediction fits the observations.
The result is that GHGs would act to reduce the gradient of temperatures. This has a series of predictions, between them that extreme weather events should decrease in frequency. This also fits the observations. Another prediction is that the warming rate should not be affected much, but the cooling rate should decrease. Figure 17 above shows evidence of that.
If this is true, then the increase in atmospheric CO2 is not dangerous, but actually beneficial for a long list of reasons. Quite shocking.
Javier, you say: “My expectation would be that an increase in GHGs would not increase global temperatures uniformly.” – It might be surprising but my expectation is that an increase in GHGs would not increase global temperatures at all and please do NOT stop reading here because I think I know what I am talking about: there are patterns in the global energy budget; they can be seen in the published data sets, just go look and try, there are definite integer internal ratios and relationships, there are connections between the total cloud amount and the LW planetary emissivity, there are constraints on the atmospheric LW transparency (clouds are not LW-transparent, only the cloudless part plays here), there are strict energetic connections between the surface and TOA energy budgets (our water-abundant planet does not depend on atmospheric trace-gas composition, but only on the geometry), and even there is a ‘surprising’ constraint and symmetry in the shortwave reflectivity (described by Graeme Stephens and colleagues in their 2015 albedo paper), where, I say, the albedo is stuck at 1 – sin 45° . Please have a look, at least into the ‘Easy’ introductory section here:
http://globalenergybudget.com/
I’ll have a look, Miklós.
A most interesting post.
Just one caveat — obliquity is part of the Milankovitch cycles. So, if this post is true, it’s still a Milankovitch “forcing” — just not the particular cycle (precession) usually cited to mostly cause glacial/interglacial changes.
That’s a definition issue. Milankovitch did not discover the orbital variations. His theory clearly states that the glacial cycle is determined by northern high latitude summer insolation. The different orbital variations affect that forcing in different ways, but the 23 kyr cycle dominates.
The present article shows that the evidence does not support that insolation is the main determinant of the glacial cycle, but the obliquity cycle. Milankovitch theory is therefore incorrect and insolation forcing at northern high latitudes is not determining the glacial cycle.
the detailed sequence of
events obtained here for the most recent warming events
suggests that the classical bipolar seesaw concept (31)
involving the ocean thermohaline circulation reorganisation
must include the role of abrupt atmospheric circulation
changes from the tropics to the high northern latitude in the
onset of abrupt warmings seen in the North Atlantic region
From the article I just sent which to my way of thinking suggest that solar variability changes the ozone distributions in the atmosphere which lead to the atmospheric circulation under going major changes which then translate to the climate.
This notion that solar variability itself is limited to .1% is absurd and even more absurd is the defiance that changes in solar activity which drives the climate system of the earth would not lead to profound changes in the climate system of the earth.
The earth’s magnetic field always moderating solar changes and enhancing them when weak.
Ever since I became interested in “global warming” and the role taken by the IPCC, leading to the Kyoto agreement and all the rest blunderings in the green issue of CO2, I have felt that Milankovitch is interesting but hardly the answer to the variable climate that Earth has endured through its lifetime.
Already at a very early stage I became aware of the work being conducted by the Danish Scientists. Eigil Friis-Christensen and Knud Lassen wrote a paper in 1991: An Indicator of Solar Activity Closely Associated with Climate. Science vol 254, pp 698-700. The work was later taken up by their colleague, Henrik Svensmark and his cloud theory. Together with Nigel Calder they even wrote in 2007 an eye opening book “The Chilling Stars – A new Theory of Climate Change. Svensmark was often ridiculed for his view, but he persisted. His theory was later tested at CERN under the leadership of Jasper Kirkby.
To make the story short, I recommend that you people should at least watch the recent documentary film : https://www.youtube.com/watch?v=ANMTPF1blpQ on The Cloud Mystery explaining the current status of Svensmarks cosmic cloud theory and also the views of e.g. Nir Shaviv on the role he provides to the fact that our solar system moves through the spiral arms of our galaxy.
The idea that the present line of glaciations began some 3.5 million years ago with the final closure of the Panama Isthmus (currently being heavily debated) that might have somehow been instrumental in the change leading to the beginning of the glaciations.
The idea that CO2 would be a driver of climate is thus only wishful thinking by the green movement and the political elite trying to quench the thirst for cheap energy by the people trying to survive on our crowded planet.
Boris
Greeting to finland.
It is good to hear from you.
Many of us here are very familiar with svensmark, I have the book ‘the chilling stars’ here on my bookshelf.
My iPad does not support that version of you tube but I shall look at the documentary on my lap top tomorrow
Tonyb
Tony, I have always seen a big problem with the Cosmic Ray.Cloud connection. We do know that the changes in Cosmic Rays are due to variations in the Geomagnetic field of the Earth by a factor of ten over solar variability. A simple look at IntCal shows the magnitude of this problem:
https://wattsupwiththat.files.wordpress.com/2016/10/intcal13-calibration-regular.jpg
Even the Laschamps event does not register in the climate record.
How does the theory get around this problem?
Hi Tony,
Its funny how some people just discard the views of Svensmark, Shaviv and Veizer and instead believe in CO2 or Milankovich, etc.
Such people should then also provide an answer to why ice ages started some 3 million years ago, and also explain all the other abrupt changes (e.g. Younger Dryas etc).
In my view it should be clear to anybody that clouds are extremely effective regulators of temperature. Thus, the main driver should be strongly connected to cloud formation. Cosmic radiation from supernova explosions is a very good candidate. This connection was also established by the Cloud experiment at CERN, although the director viciously attacked Jasper Kirkby. Anyhow, check newest: http://home.cern/about/updates/2016/05/cloud-shows-pr=e-industrial-skies-cloudier-we-thought
Javier
I think lots of theories have lots of problems with them, which is why they remain theories.
There are probably 50 passengers in the climate change coach. I don’t think we know all their names yet, or where they are seated, how large each is and how many periodically come together in order to change the direction of the coach. Are cosmic rays one of the passengers? I dunno.
As to whether there is just ONE driver, or a variety of different ones at times….?
I think we need to know an awful lot more about the number and importance of climate factors-and how they interact-before anyone can claim to understand how the climate works. We are a long way from that situation.
(liked your article BTW)
tonyb
Re cloud formation – This reply goes to Boris, but also to Tonyb and Javier below. My contribution to the discussion here might be the observation that, according to the current NASA CERES data sets, the annual total single-layer IR-opaque cloud area fraction is strongly connected to the planetary emissivity, and both have a closely regulated value at 3/5. (Total cloud cover is about 0.605, and the longwave planetary emissivity is 0.6005, far within the observational error.) A lot of internal flux relationships follow from here. I do think that this is a general law which determines the surface energy budget both in the cloudy and in the cloud-free areas. Together they give a highly constrained annual global mean all-sky energy flow structure, and I must think that these physical determinations are valid under glacial conditions and interglacial transitions as well. Evidently, the size and time-scale of fluctuations (‘vibrations’) around these steady-state positions is unknown, but I don’t think that cloud formation is externally determined (i.e, by cosmic rays). I think that CERES data show evidence that in our water-abundant planet these factors (transfer function, greenhouse function, cloud area fraction, clear- and all-sky LW transparency) are pretty well predetermined by the ‘geometric’ conditions. –
Add, further, those ‘surprising’ regulations and symmetries in the planetary shortwave reflectivity found by Graeme Stephens, Peter Webster and colleagues in their 2015 albedo-paper, which, I say, leads to the strongly constrained albedo value of 1 – sin 45°, and I again must say that this value might only be perturbated to fluctuate around, but not to shift away, from this equilibrium position.
Tony, Javier, Mr Winterhalter
Science tends to look at a linear dependence of the absolute values. Nature events evolve and to know why may be so, we have to go back to initial conditions (see Kip Hansen’s articles) but that is not possible since there are no data or even proxies going that far back.
Far more ‘profitable’ approach is to look into periodic changes (annual, decadal or whatever) of two variables and than look for a presence of lack of any correlation.
Regarding Svensmark, magnetic field an dclimate:
during last few hundred years the Earth’s magnetic field has changed by about 15%. Linear dependency (if there is any) of temperatures would mean up to 40 degree K, which would be a nonsense.
However a 20 or 30 year ‘delta’ produces reasonable correlation.
http://www.vukcevic.talktalk.net/CT.gif
Could you please inform me, due to my ignorance regarding what the two graphs actually tell. Is it that the changes in Earth’s magnetic field correlate well with Loehle’s temperature curve?
“Is it that the changes in Earth’s magnetic field correlate well with Loehle’s temperature curve?”
Yes, that is what data shows.
Boris
I have now had the opportunity to view the video, which at only 5 minutes long is short and informative.
I am bemused as to why it was thought pre industrial times were less cloudy than today, there is nothing in the 1000 year British climate records that I study that suggest this. We can go even further back than this in quoting the Roman Tacitus writing about Britain;
‘Their sky is obscured by continual rain and cloud. Severity of cold is unknown.’
If pushed, I would hesitantly say that many periods of the pre industrial past were substantially wetter and milder than today, because of frequent cloud and rain, but that is conjecture.
Cloud is of course crucial to overall temperatures. in the northern hemisphere. A cloudless sunny day in summer will be much hotter generally than a cloudy day. similarly a clear night in winter will generally be very much colder than a cloudy night. Whether clouds have a net negative or a net positive or neutral effect on temperatures is surely one of the biggest unresolved problems in determining their overall impact on temperatures.
Potentially the cloud conundrum it is of enormous importance and I hope that more results come from Cern and other experiments.
tonyb
Boris
In saying 5 minutes, I was of course talking about the second video link. I am working my way through the 52 minute first video in 15 minute segments. It is much less succinct than the second one. Was it produced originally as a tv programme?
tonyb
“Is it that the changes in Earth’s magnetic field correlate well with Loehle’s temperature curve?”
yes, that is what data shows.
Boris
I have now viewed the first video. At 52 minutes I felt it was too long and had too much ‘padding’ of views of clouds and crowd scenes. I note it is Danish and was first aired on Danish television in 2008, so that explains its format and tone.
https://en.wikipedia.org/wiki/The_Cloud_Mystery
The film could be given a new lease of life by incorporating new material and being edited to 30 minutes.
I am not sure I am convinced that clouds have a cosmic flavour to them and think that the reply from Miklos is as good an explanation as any.
Clouds are of immense importance but more work using the latest research needs to be done for the cosmic theory to emerge as a key factor
tonyb
Very nice write up of the earths orbit changes, but in trying to link the earths climate to this, specifically glacial terminations, I think you are barking up the wrong tree old boy. Just not enough energy in these insolation changes, you see. Milankovitch, insolation etc – they are all red herrings. There is just as much negative correlation as there is positive. Doesnt work old boy.
Small tip – calculate how much energy needs to be added to the worlds oceans to change global temperature by 10 degrees, over the short period of a glacial termination. Then ask yourself where that could come from. Tip 2 – you need to be looking in…. not out.
“you need to be looking in…. not out”
That is true when things get really bad – like 20,000 years ago. CO2 levels plummet as colder oceans absorb more CO2, rainfall falls, and vegetation struggles and dies, turning soil to dust.
10,000 years of dust deposits seed the ice sheets for a rapid melt back at the next obliquity maximum.
I was suggesting that the rapid transition out if a glacial period into an interglacial cannot be explained by orbital changes . There is simply too much of an energy change requirement in too short a time. Heating the oceans to level that enables a 10 degree global temperature shift requires enormous energy injection. Apart from the inconsistencies discussed in the article, orbital variations also have a very small net energy change ( looking at the earth as a whole). Additionally the shape of the temperature profile graph is not correct for an energy change to a new (interglacial) equilibrium – it should be curved, not straight up.
The natural equilibrium temperature is that of a glaciated earth – about 8 degrees lower than today. The reason we have periodic interglacials is due to episodic large scale mid ocean ridge magmatism. Nothing to do with orbital change.
Good thoughts Imran
None of you are able to address abrupt climate change. Enough said.
Awww, Salvatore!
Abrupt climate change (or massive change over a shorter period, such as the Younger Dryas event), could be a signature of chaos at work.
I can’t be sure it is, but I can’t be sure it isn’t, either.
Chaotic processes have unpredictability built in. Averaging what has already happened provides no benefit. Even averaging randomness – say a series of coin tosses, tells you nothing useful about the next toss! Chaos is much, much, less amenable to prediction.
Chaos rules! Explains everything, predicts nothing! Grand, ain’t it?
Cheers.
Yes Mike .
Large scale episodic mid ocean ridge magmatism.
Javier, great work and presentations along with very interesting and thought provoking ideas. They seem very plausible to me, but I suspect there are still many major unsolved pieces of the very complex and chaotic climate puzzle. I also suspect it will take hundreds or perhaps even thousands of years for humans to better master this puzzle. If you are correct, our descendants will likely be scrambling within a few thousand years or sooner to try to find ways prevent or mitigate the gradual onset of next glacial period. The paleoclimate evidence suggests it is not a matter of if, but when.
Thank you for an excellent all-round review of the matter on the history of the earth. It has provided me the best overall assessment to date.
I have come to this from an altogether different avenue. An earlier interest has led me to ancient structures that turned out to be calendars. These functioned by following the sunrise on the horizon throughout the year. The solstice to solstice movement is structurally limited to 36degrees, at latitude 35.8N. That indicates an obliquity of around 14.5deg – way out from the ~22-~24. That has implications. Dates are between 5k to 2.2ky bce. Repeated major seismic destruction is also evident.
Other material I find corroborates such finding proxy-wise. It seems the holocene max was very eventful, in a way as other historical evidence tends to say.
The listed site below shows several plans.
cr
For the record I don’t know for sure why and how the climate changes and why abrupt climate changes happen , so I am not separating myself from everyone.
I have thoughts as I have expressed and will once again
Nevertheless I am frustrated because every theory every thought including my own can be shown to be deficient to one degree or another.
We have so many potential good thoughts but if one is really honest they all do not stand the test of time 100%, in other words exceptions can always be found no matter how tight or reasonable the theory may be.
Nevertheless , I keep coming back to these items to explain the climate puzzle which is I agree in the very big picture Milankovitch Cycles and Land Ocean arrangements are very important but they do not explain the abrupt climatic changes superimposed upon the gradual climatic trends.
I still think and I know I have very little fanfare here is that primary solar variability is greater then we think as evidenced by the Maunder Minimum.
I also think there have been periods of solar variability that have exceeded the Maunder Minimum in the historical past . That aside even from the depths of the Maunder Minimum to present the solar maximum of the last century it looks like solar irradiance increased by some .3 or .4%. Which is much greater then the .1% we constantly hear.
I think the secondary effects even from slight changes in solar variability play even a bigger role especially when it come to changes in UV light and cosmic rays and their impacts upon the climate.
Lastly the geo magnetic field as VUK has been pointing out has a role in all of this.
For my two cents to sum it up I think it is Milankovitch Cycles ,Land /Ocean arrangements control the climate in the big picture, while primary and even more importantly secondary solar effects moderated by the strength of the geo magnetic field are vital in the small climatic picture which are able to bring about abrupt climatic changes by driving the terrestrial items that control the climate to threshold values which cause a complete flip or reorganization of the climate system.
I think this is the best explanation but again I am not 100% sure and I know it will be shown by others that it falls short as everyone does with every single climatic proposal that is put out there.
This is why I hope this prolonged minimum solar period just might start to clear things up one way or the other.
Our planet is caught up between a large moon and an
accelerating Sun. When the sun loses acceleration, the
earth’s iron core loses a considerable amount of its wobble.
Our magnetic field then weakens and the earth can no
longer retain its heat.
visit Weathercycles.wordpess
” Fibonacci and climate “
This is from an article Miklos Zagoni which I could not disagree more with.
This is the line mainstream wants us to believe.
“The Earth’s climate is broadly regulated by three fundamental parameters: the total solar irradiance, the planetary albedo and the planetary emissivity. Observations from series of different satellites during the last three decades indicate that these three quantities are generally very stable. The total solar irradiation of some 1,361 W/m2 varies within 1 W/m2 during the 11-year solar cycle. The albedo is close to 29 % with minute changes from year to year. The only exception to the overall stability is a minor decrease in the planetary emissivity (the ratio between the radiation to space and the radiation from the surface of the Earth). This is a consequence of the increase in atmospheric greenhouse gas amounts making the atmosphere gradually more opaque to long-wave terrestrial radiation. As a consequence, radiation processes are slightly out of balance as less heat is leaving the Earth in the form of thermal radiation than the amount of heat from the incoming solar radiation.”
Lennart Bengtsson:
Foreword to the Special Issue on Observing and Modeling Earth’s Energy Flows
Surveys in Geophysics, 2012
I agree that Bengtson’s (if it is his text?) is naturally wrong. A few years ago he was, however, strongly criticized by the IPCC establishment of his sceptical views.
I also have the impression (logical feeling) that despite the atmospheric window allowing IR to escape during clear sky conditions, much of the excess heat from Earth is radiated out by greenhouse gas molecules especially at higher altitudes. Thus more CO2 in the upper atmosphere would also enhance heat to be emitted to space
Thank you, Salvatore; this citation from Bengtsson is the starting point, and my whole webpage is about to falsify it in every detail.
Boris: yes; please read my webpage, and you will see how the system – including the mechanism you describe – maintains a steady state.
I see I though you had embraced it.
http://phys.org/news/2016-10-planet-ice-age-years.html?utm_source=menu&utm_medium=link&utm_campaign=item-menu
From the article Tony sent which I could not disagree with more. More of that mainstream false line.
CO2 has nothing to do with the start or ending of Ice Ages. It follows the temperature does not lead.
This suggests that extra carbon dioxide was being pulled from the atmosphere and into the oceans at this time, subsequently lowering the temperature on Earth and enabling vast ice sheets to engulf the Northern Hemisphere.
After 45 years of believing in the insolation pacing of interglacials and a nonexistent 100 kyr cycle, the inertia will continue pushing the mistaken theory for a long time even when the data does not support it.
It is a good example of how scientists sometimes build a wrongful consensus, and it might take a generation or more to correct it.
Javier,
The most common belief is that the earth’s eccentricity
will increase so much that the incoming light will no longer
be sufficient to warm the planet. We know that the earth’s
eccentric orbit expands and contracts to an 100,000 year
cycle. This is the heart and soul of Milankovic theory.
But . . this widely accepted view of the Milankovic theory is
completely backwards. Obliquity, axial precession and an
expanding eccentric orbit are all motions that amplify
magnetic field production. And . . a strong magnetic field
is what helps us to retain our stored up heat.
It is when the sun and gas giants lose their eccentricity that
the entire solar system regresses to non-eccentric orbits and
and a solar-system-wide loss of magnetic field production.
This theory makes so much more sense.
Please visit Weathercycles.wordpress
” Fibonacci and climate “
Could be a typical hen and egg dilemma – which came first? However, in this case, first came the cold (my view says that it happened due to increasing cloud cover induced by increasing galactic cosmic radiation (GCR) á la Svensmark). Oceans cooled because of cloud screening the Sun which induced absorption of CO2. When GCR bombardment decreased, cloud cover decreased, the oceans warmed and thus part of the dissolved CO2 was expelled (typical Vichy bottle reaction as any physics student should know)
Boris,
“CO2 has nothing to do with the start or ending of Ice Ages. It follows the temperature does not lead.”
If you say so Salvatore.
I’m sure the Nobel awards committee are evaluating your case as we speak.
However, CO2 can and does both lead and follow.
It is a feed back in a warming climate as you say. But it is a GHG, and as such it attenuates LWIR to space. That’s empirical science my friend and not up for argument.
Would you care to explain to the folks how the Earth become 33C warmer with it than otherwise, if not.
And please no Cotton-like pseudo-physics.
Tell us Tony Banton, how did BHO get the Nobel Peace Prize, did the committee have another off day?
Please note that the 2007 Nobel award to the IPCC and to A.Gore was the PEACE prize. According to the Nobel Committee’s web site http://nobelpeaceprize.org/en_GB/about_peaceprize/
” the Peace Prize is to go to whoever “shall have done the most or the best work for fraternity between nations, for the abolition or reduction of standing armies and for the holding and promotion of peace congresses”. ” NOTE there is not a word about SCIENCE for its award. Rather, it is given for “fraternity”, not for scientific merit. It is silly to challenge a technical question/answer ‘s truth (i.e. CO2 lead/lag during glacial cycles) on the basis of its relevance to receiving a PEACE prize.
“CO2 has nothing to do with the start or ending of Ice Ages. It follows the temperature does not lead.”
If you say so Salvatore.
I’m sure the Nobel awards committee are evaluating your case as we speak.
However, CO2 can and does both lead and follow.
It is a feed back in a warming climate as you say. But it is a GHG, and as such it attenuates LWIR to space. That’s empirical science my friend and not up for argument.
Would you care to explain to the folks how the Earth become 33C warmer with it than otherwise, if not.
And please no Co**on-like pseudo-physics.
I do say so and my thoughts make much more sense then CO2 concentration changes as the cause which controls the climate and further the historical climatic record proves this to be the case.
CO2 ALWAYS FOLLOWS THE TEMPERATUERE
This strongly suggest that the entire GHG effect which I do not deny is real ,but how strong it may or may not be is tied to the climate.
In other words as the climate cools or warms the GHG effect varies. Presently the climate and other environmental factors are allowing the GHG effect to bring the global temperatures of the earth to 33c higher then if no GHG effect was present under the given climate conditions.
This GHG EFFECT changes as the climate changes and as the climate cools, the amounts overall of CO2 and more importantly water vapor will decline which in turn will cause the given GHG effect to lessen.
This is why at times when the earth is in an Ice Ag the CO2 concentrations lessen but more importantly then the absolute lessening the CO2 concentration amounts ALWAYS follow the climate never the other way around.
Those are the facts if you do not accept it so be it.
CO2 has never led a temperature change according to the historical climatic record.
Tony,
Even if Salvatore’s argument was incorrect, still CO2 would have little to do with the start or ending of Ice Ages. The changes in CO2 are just too small. We have done the experiment. We have put in the atmosphere in 50 years the amount of CO2 that the planet puts in the atmosphere in 5000 years during a deglaciation. The amount of warming obtained is insufficient by at least a factor of 6. The committed warming argument is not credible given the arguments presented in the article above.
“The amount of warming obtained is insufficient by at least a factor of 6. The committed warming argument is not credible given the arguments presented in the article above.”
Javier:
Well I know it’s common here to state black is white but FYI the Earth’s GMT has gone up around 1C with a 1.4x rise in CO2 – now that would seem to me to be “sufficient”.
Given that the IPCC reckons on between 1.5 and 4.5C for ECS.
The 1C is a TCR.
So less than halfway there and 1C up without feedbacks (other than H2O).
So it’s not going to be well OVER 1.5C?
It’s on course to be at the upper end of the range my friend.
Tony Banton: “It’s on course to be at the upper end of the range my friend.”
No it isn’t, not even close.
As is becoming increasingly evident to everyone except the ‘True Believers’, of course.
Salvatore del Prete | October 27, 2016 at 10:04 am |
CO2 has never led a temperature change according to the historical climatic record.
Science doesn’t say that it has Salvatore.
But it CAN …. Because it is a GHG.
Put it there in excess and it WILL.
The one thing I am 100% sure of when it comes to the climate is AGW theory is a scam and CO2 in no way governs the vast climatic system of the earth.
Yes Salvatore again; my website, and my paper referred to offers a coherent picture of that; if you wish, just look at the Conclusions – Consequences – Summary at the end of my page:
http://globalenergybudget.com/
re: geomagnetic data request
:MAILER-D “this account has been disabled or discontinued”.
The ETH data no longer available on line.
NOAA data: http://www.ngdc.noaa.gov/geomag-web/#igrfwmm
to Vukcevic
Your mention of Earth’s magnetic field correlating with Loehle’s global temperature is Ok. However, Svensmark’s theory is based on solar activity influencing the amount of galactic cosmic radiation reaching the earth’s atmosphere and thus the formation of cloud cover and especially low level clouds.
I am not entirely not convinced.
– Svensmark’s effect is real, but minuscule in same way the CO2 is. Do a simple calculation: take number of energetic neutrons/cm2/day hitting the atmosphere and compare to number of water molecules in column of 1cm2 cross section and height of an average cloud.
– Secular variation of the Earth’s magnetic field doesn’t change temperature; it is an indication of global tectonics movements. Sun provides energy, globally oceans absorb, store, redistribute and release the energy, and since oceans’ temperature is stratified, any tectonic interference with it would move global temperatures up or down.
I am still very fond of Svensmark’s, Shaviv’s and others’ findings on the probable role of GCRs and solar activity on Earth’s climate.
I just watched an other lecture by Svensmark: https://www.youtube.com/watch?v=EgA8zSSC0zI (34 min) and also one by Shaviv: https://www.youtube.com/watch?v=k385CraNIyY (28 min) at the same German EIKE conference in 2014.
My understanding of complicated solar and galactic processes is limited, but even so I fail to see any grave errors in their presentations. Although as Svensmark points out continuously that correlation is not automatically proof of causation, the graphs etc he and Shaviv present are diffivult to just shrug off.
There is nothing wrong with basis of Svensmark theory, Problem is in quantity not quality, just there isn’t sufficient volume of energetic neutrons getting down to the lower altitudes to create extra clouds coverage to change the global albedo for the required temperature change. Winters’ night extra clouds also reduce cooling.
“Svensmark’s theory is based on solar activity influencing the amount of galactic cosmic radiation reaching the earth’s atmosphere and thus the formation of cloud cover and especially low level clouds.”
Which is anti-correlated with solar TSI.
Meaning that a weaker Sun means more CR’s and therefore more low clouds …. which should mean cooling (low clouds cool and high clouds warm overall).
Solar TSI has been waning overall for ~50 years.
So why have temperatures risen?
I note that experimental results show that cloud aerosols formed via CR’s are too small by far to initiate condensation.
Because TONY the sun has been in a very active mode on balance for the last 50 years. Also the geo magnetic field has to be taken into consideration, something you all do not seem to recognize.
In regards to the geo magnetic field it is not only the overall strength of the file but the location of the north and south magnetic poles.
Once Dalton type minimum conditions occur then we will see and if you paid attention to what I suggested I said galactic cosmic ray counts would have to be sustained above 6500 units in order to have an impact on global cloud coverage which has only happened in the 2008-2010 period of time not long enough in duration. Going forward this looks to be changing.
http://www.spaceupdate.com/activities/EU07_temp_vs_co2.pdf
CO2 FOLLOWS THE TEMPERATURE AS PRESENTED BY THE DATA.
http://www.bing.com/search?q=ICECORE+DATA+CO2+VERSU+TEMP&form=PRHPR1&src=IE11TR&pc=EUPP_HRTS
MORE DATA
TONY READ THIS
http://icecap.us/index.php/go/joes-blog/carbon_dioxide_in_not_the_primary_cause_of_global_warming_the_future_can_no/
or:
http://www.woodfortrees.org/plot/esrl-co2/from:1979/mean:12/derivative/plot/uah/from:1959/scale:0.22/offset:0.14
I said in my above post that, yes, Co2 follows temperature in the record …. Which of course it would unless we know of an event that released massive amounts of it (massive volcanic or meteor strike). You will even find that the current temperature rise follows temp – because the natural carbon cycle vastly exceeds the effect of the additional yearly anthro CO2 input, never mind thermal inertia. Never-the-less, as I said (empirical remember), CO2 is a GHG, and as such it induces warming of the climate system. Up 40% since pre-industrial. And also how does the Earth get to be 33C hotter than it’s GB temp would have it. No, it’s not pressure and no it’s not water (because it would precipitate out to ice/snow if there were not non-condensing GHG’s present).
http://cyber.scihub.bz/MTAuMTEyNi9zY2llbmNlLjExOTA2NTM=/lacis2010.pdf
Salvatore: Sorry Mr McRae is not science and a post on a blog that does not link to a paper (in a reputable journal … Not the Co**on type) certainly not.
Look at Lacis et Al 2010 – that’s science.
Again how do you propose that the Earth is warmer than it should be at this distance from it (~33C) were it not for non-condensing GHG’s?
I don’t know who conjectured the 15 C (as norm) nor where the 33 C come from, but in my view what keeps our planet fit for life is the rather intriguing properties of water and its three phases, which e.g. has been by Willis Eschenbach called the water thermostat. I am convinced that the switching between water, ice and vapour answers all questions dealing with Earth’s climate. Our planet is at a very suitable distance from the Sun to allow life as we know it.
Just think, what would happen or what would Earth’s surface temperature be if we would lack water and other greenhouse gases. The nitrogen atmosphere would during daytime warm up due to conduction following molecular contact with the surface warmed by the Sun. Furthermore, the heterogeneous land surface would not warm the air (mainly nitrogen) uniformly causing updrafts and downdrafts (winds). During night time the surface would cool due to direct emission of longwave infrared radiation to space. But what would happen with the warm and mainly nitrogen atmosphere not capable of emitting heat to space, but gaining heat again during daytime; what would the temperature of the air be???
“I don’t know who conjectured the 15 C (as norm) nor where the 33 C come from”
Translation….
“I’m ignorant, therefore listen to me”
Tony the reputable journals you subscribe to are all in on the scam which you just do not get.
I explained that the given GHG effect is dependent up the climate and environmental factors and it is this which determines the GHG effect not the other way around which of course destroys AGW theory thus denial to this line of reasoning will keep appearing in ALL mainstream climatic journals along with everything else which runs counter to their scam..
Mainstream will do and say anything to give credence to AGW theory no matter how contradictory this theory is to the historical climatic data record, and AGW theory does not square with the historical climatic data not even close..
http://cyber.sci-hub.bz/MTAuMTEyNi9zY2llbmNlLjExOTA2NTM=/lacis2010.pdf
Your link was a bit tricky because it reverted to Russian language, but anyhow, I managed to open it. However, the article itself is very questionable, with e.g. Gavin Schmidt as one of the authors, i.e. an IPCC convert. and thus based on the IPCC doctrine of the CO2 culprit.
For those not managing the link the following is the abstract:
Atmospheric CO2: Principal Control Knob Governing Earth’s Temperature
Andrew A. Lacis, Gavin A. Schmidt, David Rind, Reto A. Ruedy
Ample physical evidence shows that carbon dioxide (CO2) is the single most important climate-relevant greenhouse gas in Earth’s atmosphere. This is because CO2, like ozone, N2O, CH4, and chlorofluorocarbons, does not condense and precipitate from the atmosphere at current climate temperatures, whereas water vapor can and does. Noncondensing greenhouse gases, which account for 25% of the total terrestrial greenhouse effect, thus serve to provide the stable temperature structure that sustains the current levels of atmospheric water vapor and clouds via feedback processes that account for the remaining 75% of the greenhouse effect. Without the radiative forcing supplied by CO2 and the other noncondensing greenhouse gases, the terrestrial greenhouse would collapse, plunging the global climate into an icebound Earth state.
“Tony the reputable journals you subscribe to are all in on the scam which you just do not get.”
OK Salvatore. Conversation ended.
That says more of you than anything.
The whole of the world’s experts in climate science are wrong/liars/ scammers/socialists whatever.
While you know more than them.
Of course you do.
No answer on the 33c thing.
Try common-sense.
Do a mind experiment and take away the atmosphere’s non-condensing GHG’s, leaves essentially WV and methane (which decays to H2O and water in ~12 yrs). How would water stay, well water, when it varies so much in the atmosphere. There is land/deserts. It would soon become like Antarctica.
Tyndal and Arrenhius et al weren’t stupid (or in on a scam) Salvatore. No one has discovered that the Emperor is naked these last 150 years, and you certainly haven’t either.
The observations fit the calculations, and have done all that time.
https://www.aip.org/history/climate/co2.htm
“I don’t know who conjectured the 15 C (as norm) nor where the 33 C come from, but in my view what keeps our planet fit for life is the rather intriguing properties of water and its three phases, which e.g. has been by Willis Eschenbach called the water thermostat”
Boris:
Willis is wrong on many things.
Here’s where 33C comes from (though this site makes it 34C)…..
http://scied.ucar.edu/planetary-energy-balance-temperature-calculate
It’s simply what the temperature of the Earth’s surface should be with 0.7x 1361×1/4 W/m2 being absorbed and what it actually is.
We know there is an imbalance also because satellites measure the imbalance at TOA.
Tony Banton
I agree that Willis’s views are not always the same as mine, but I wanted to give him credit for launching the idea of the water thermostat, i.e. that the three phases of water are responsible for the climate we have and have had through countless millennia that have been conducive for the life we know.
Regarding the thermal balance or imbalance of our planet, and the way the 33C has been calculated, etc. our planet is much too heterogeneous to allow averaging the way it has been done. As Marcel Leroux pointed out more than a decade ago, Earth does not have an average climate nor can it have an average temperature (does not make sense) and hence there is continuous imbalance between incoming and outgoing energy which various processes involving H20 tend to keep the conditions within suitable bounds.
“Tony the reputable journals you subscribe to are all in on the scam which you just do not get.”
OK Salvatore. Conversation ended.
That says more of you than anything.
The whole of the world’s experts in climate scince are wrong/liars/ scammers/socialists whatever.
While you know more than them.
Of course you do.
Silly me.
No answer on the 33c thing.
Try common-sense. Do a mind experiment and take away the atmosphere’s non-condensing GHG’s, leaves essentially WV and methane (which decays to H2O and CO2 in ~12 yrs). How would water stay, well water, when it varies so much in the atmosphere. There is land/deserts. It would soon become like Antarctica.
Tyndal and Arrenhius et al weren’t stupid (or in on a scam) Salvatore. No one has discovered that the Emperor is naked these last 150 years, and you certainly haven’t either.
The observations fit the calculations, and have done all that time.
https://www.aip.org/history/climate/co2.htm
“I don’t know who conjectured the 15 C (as norm) nor where the 33 C come from, but in my view what keeps our planet fit for life is the rather intriguing properties of water and its three phases, which e.g. has been by Willis Eschenbach called the water thermostat”
Boris:
Willis is wrong on many things.
Here’s where 33C comes from (though this site makes it 34C) (see next post)
It’s simply what the temperature of the Earth’s surface should be with 0.7x 1361×1/4 W/m2 being absorbed and what it actually is.
We know there is an imbalance also because satellites measure the imbalance at TOA.
Tony the future data like the past data will show this theory AGW is wrong.
One last thing Tony you are in denial of the data as is the whole fraudulent AGW movement.
“One last thing Tony you are in denial of the data as is the whole fraudulent AGW movement.”
The only thing I am in denial of Salvatore is the pseudo- science on display here and in other *contrarian* blogs.
I am not in denial of the real science.
Nor do I resort to “fraud” as a get-out for denying blatant observation.
In a sane world that accusation is ridiculous.
Why Curry puts up with it I do not know.
I’d be surprised, nay shocked if she agreed with it.
Mind, Watts doesn’t agree with it – yet lets such be posted on his blog.
Spencer has recently booted out 3 of them.
Mind 2 were rather nasty.
You are not.
I thank you for that.
http://scied.ucar.edu/planetary-energy-balance-temperature-calculate
2 links a no-no it seems.
I agree with all of that. The GHG effect could have been stronger then due to environmental factors, which is my point. Example more volcanic activity.
I say if the climate cools the GHG effect will lessen as has been the case at least since PLEISTOCENE times.
We shall see.
http://hockeyschtick.blogspot.com/2013/06/climate-scientist-dr-murry-salby.html
As usual different takes Tony. I happen to be with his take on this subject others see it differently.
. Tony that is what makes a ballgame and if we all agreed at best it would be very boring.
As I keep saying time will tell.
This write-up has brought to the fore in my mind a question I have been asking for some time now. “What establishes the implied assertion in all material I have seen so far, that obliquity is fixed for long eons and cycles strictly between ~22.1 and ~24.3deg?” This site, and another good one by the name of “Science of Doom” (link https://scienceofdoom.com/2014/01/30/ghosts-of-climates-past-fourteen-concepts-hd-data/ ) never consider that question. As said in my earlier post I have found evidence that obliquity changed beyond the lower limit for a time in the Holocene. It also varied repeatedly.
Allowing for such possibility I see problems, and possible answers, to questions raised here. If obliquity decreases below 22.1deg, and substantially, distribution of solar insolation would change too. The signature of the obliquity in the proxies may then also disappear, possibly leaving the eccentricity signature evident/predominant (why a change from 41k to 100k). Then also, where the mean value of the obliquity is ‘parked’ seems to be an unknown.
Some answers may be evident in the Holocene, on smaller timescales, by correlating various sources of data to ‘man-made’ evidence. Some are here (at this link: @melitamegalithic ). My intention in this link was to acquire better dates. However understanding obliquity is an essential – I seek an answer.
cr
” Secular variation of the Earth’s magnetic field doesn’t change temperature; it is an indication of global tectonics movements. ”
. . . . . . . . . . . . . . . . . . . . . . . . . . . . . . . . Vukcevic
The earth’s magnetic field is an indication of global tectonics
movements because the earth’s iron core rotates independent
of the tectonic plates. This rotation is involved in both magnetic
field production and tectonic movement. When the dynamo shuts
down there is a slow-down in magnetic field production and tectonic
movement.
During an inter-glacial there is a balance between incoming and
outgoing energy. But this is not the norm. During a glacial period,
there are 90,000 years when the earth is incapable of retaining
its stored heat. The only plausible explanation for this is a 90,000
year loss of magnetic field strength.
Since we get most of our energy from the sun, this must be a
solar-system-wide loss of magnetic field strength that is behind
this glaciation. And . . . during an inter-glacial, the acceleration
of the sun must be responsible for keeping our dynamo at maximum
production.
Javier,
Are you not being too hard on Milankovitch? His work of co-ordinating the planet’s orbital processes from the data which was known at the time was truly amazing. That you pointed out that “The changes in eccentricity also produce a shortening and lengthening of the seasons as the Earth speeds at Perihelion and slows at Aphelion” is commendable as many have not recognised its significance or dismissed it. As eccentricity increases, its phasing with precessional affects the coincidence of NH summer with perihelion or aphelion and any melting of winter snowfall.
No mention was made of Loraine Lisiecki’s 2010 paper, “Links between eccentricity forcing and the 100,000-year glacial cycle,” [Nature Geoscience, 3, 349-352], available from her web site: http://lorraine-lisiecki.com/, another view on the subject. Her supplementary information to the paper [doi:10.1038/NGEO828 or ngeo828-s1.pdf ] has in informative graph of temperature and eccentricity over the last 1.2 My, with only periods of eccentricity greater than 0.0365 (8 out of 13 peaks) having a significant effect.
Another unsolved issue is why temperatures rise rapidly from a deep glaciation to inter-glacial levels. One factor mentioned is the high levels of dust in the atmosphere which raises the emissivity of snow and ice to cause rapid melting. Also, some changes to ocean circulations has been mentioned, but what may have been more significant, is that the Antarctic circumpolar ocean current may have ceased, by closure of Magellan Straight by ice, giving rise to significant southern ocean warming. Reactivation of the circumpolar current may have had a connection to the Younger Dryas cooling. A query to Lorraine Lisiecki a few months back as to whether her data threw any light on this produce no response. Some one may be able to check this out.
Your Figure 2 from K. T. Lawrence, et al, 2006, showed a gradual cooling over the last 4 Myr. One explanation may be that the sun’s effective output is diminishing slightly over time, bearing in mind that it appears to have small cyclic fluctuations of output, or the earth may be slowly increasing its distance from the sun under the uneven gravitational pull of the large gas planets. Another unknown for research.
PRCGOARD: “One explanation may be that the sun’s effective output is diminishing slightly over time, bearing in mind that it appears to have small cyclic fluctuations of output, or the earth may be slowly increasing its distance from the sun under the uneven gravitational pull of the large gas planets. Another unknown for research.”
I return to my previous question: Why did glaciations begin some 3 million years ago and even with a change in cycle length. I don’t see how Milancovich can explain this.
I do not understand why Svensmark’s and Shaviv’s cosmic radiation cloud theory is not acceptable. They state that our solar system moving through the galactic arms with variable supernova activity is an excellent explanation.
Variations in GCR intensity influencing cloud cover is at least one acceptable process that explains glaciations. If you want, so why not include the Milancovich cycles as a process regulating details in the actual glacial cycles and their variability in intensity.
1. Ir is a basic assumption by almost everyone that the sun’s output is gradually increasing (G-type star life cycle).
2. This is why there are various attempts to explain warming in the past.
3. The current climate is dominated by geography. The Himalayas, Greenland, and the Antarctic reject significant radiation into space. The Antarctic circumpolar current (the isolation of Antarctica) is why it has an ice sheet. Once Antarctica separated from South America and Australia the ice ages started.
Milankovitch has little to do with the ice ages, except that when the cycle turns really warm we have a temporary interglacial. The average solar output + the unusual amount of SW radiation rejected to space results in ice age conditions on average.
Boris: “Why did glaciations begin some 3 million years ago” — Milankovitch does not have to explain this. Gradual cooling, as in Figure 2 above, continued until glaciation started. Volcanic or geological events may have contributed, but I am not aware of documentation with sufficient resolution.
“Why Svensmark’s and Shaviv’s cosmic radiation cloud theory is not acceptable”: Some do not want to, as it upset’s their pet beliefs.
To PA (below): The has been warming in recent centenaries but eventually the sun is predicted to cool to a white dwarf.
I’s been warming for 5 billion years.
I will become a red giant and scorch Earth before it starts to cool.
~5 billion years in the future.
Don’t wait up! :)
prcgoard,
I am not trying to diminish Milankovitch’s contribution. Simply, his theory that the glacial cycle is due to changes in summer insolation at northern high latitudes is not supported by the data. This happens all the time. The huge majority of hypotheses are wrong and that does not detract from the scientists that propose them.
I only cite a few of the articles that I have read on the issue, mainly to support some of the main points. Citations in a blog post are in general a waste of time, as hardly anybody will take the effort to look out any. Regarding Lisiecki’s 2010 paper, I read it and I disagree with it. As there is no 100 kyr cycle, trying to justify that precession had an effect in the Early Pleistocene and the opposite in the Late Pleistocene is an exercise in fitting the data to the model. I find the idea that lower 100-kyr power of eccentricity results in stronger 100-kyr responses, as she claims in the supplementary material, illogical and incomprehensible.
Regarding Ice Ages, this article concerns itself only with climate variability in the 10,000-100,000 years scale, that is mainly due to orbital variability. The scale of millions of years to which Ice Ages belong, responds to different causes that are mainly speculative at this time.
Pingback: Weekly Climate and Energy News Roundup #246 | Watts Up With That?
Greetings from Big Mango (BKK)- One reply said interglacials don’t last past obliquity of 23.5, and beginning with the Wolf Minimum at 1275 AD, obliquity = 23.54. Several more minimums follow, with cold spells. The next solar cycle is expected to be another minimum. I expect starting 2020 we start stairstepping down to a glacial phase.
Regards. sandy … Minister of Futures
Hi Willis. Mabe the 98000 cycle is due to core sample being compressed by weight of ice.
sandy … Minister of Future
Javier,
I believe we are closing in on the 100ky cycle problem. What if it is not a climate signal? Could it be something else? You bet it can.
I don’t see the refs but is “Huybers 2007” possibly Huybers 2006? https://dash.harvard.edu/bitstream/handle/1/3382981/Huybers_EarlyPleistoceneSummer.pdf?sequence=1
This holds key information that is buried under the table. Check out MIS-3. Maybe that JC will post my thoughts about these things in a few weeks, although I’m still not ready with the quest.
leftturnandre,
Yes, Huybers 2006 is also a very interesting reference. The concept of summer energy is another possible explanation of why obliquity rules the glacial cycle.
Pingback: Interglacial Comparisons | Climate Concerns
Reblogged this on Climate Collections.