
by Nic Lewis
Was early onset industrial-era warming anthropogenic, as Abram et al. claim?
Introduction
A recent PAGES 2k Consortium paper in Nature,[1] Abram et al., claims human-induced, greenhouse gas driven warming commenced circa 180 years ago. The paper has been attracting some media attention[2]. The study uses a change-point analysis method, SiZer, to assess when the most recent significant and sustained warming trend commenced. Commendably, the lead author has provided the data and Matlab code used in the study, including the SiZer code.[3]
Their post-1500 AD proxy-based regional reconstructions are the PAGES2K reconstructions, which have been discussed and criticized on many occasions at ClimateAudit, with the Gergis et al 2016 Australian reconstruction substituted for the withdrawn version. I won’t comment on the validity of the post-1500 AD proxy-based regional reconstructions on which the observational side of their study is based – Steve McIntyre is much better placed than me to do so.
However, analysis of those reconstructions can only provide evidence as to when sustained warming started, not as to whether the cause was natural or anthropogenic. In this post, I will examine and question the paper’s conclusions about the early onset of warming detected in the study being attributable to the small increase in greenhouse gas emissions during the start of the Industrial Age.
The authors’ claim that the start of anthropogenic warming can be dated to the 1830s is based on model simulations of climate change from 1500 AD on.[4] A simple reality check points to that claim that the early warming was anthropogenic is likely to be wrong: this claim flies in the face of the best estimates of the evolution of radiative forcing. According to the IPCC 5th Assessment [Working Group I] Report (AR5) estimates, the change in total effective radiative forcing from preindustrial (which the IPCC takes as 1750) to 1840 was –0.01 W/m2, or +0.01 W/m2 if changes only in anthropogenic forcings, and not solar and volcanic forcings, are included. Although the increase in forcing from all greenhouse gases (including ozone) is estimated to be +0.20 W/m2 by 1840, that forcing is estimated to be almost entirely cancelled out by negative forcing, primarily from anthropogenic aerosols and partly from land use change increasing planetary albedo.[5] Total anthropogenic forcing did not reach +0.20 W/m2 until 1890; in 1870 it was still under +0.10 W/m2.
It is not credible that a negligible increase of 0.01 W/m2 would have had any measurable effect on ocean or land temperatures globally; it is doubtful that an increase of 0.1 W/m2 would do so. Even a change of 0.20 W/m2 would have affected global mean surface temperature (GMST) by less than 0.1°C. Moreover, anthropogenic aerosol and land use change forcing was concentrated in the Northern hemisphere extratropics and the tropics, with little in the Southern extratropics, which would suggest that the onset of positive net anthropogenic forcing (and hence anthropogenic warming) in the tropics and Northern hemisphere extratropics would have been delayed until circa 1870. Yet it is in those regions that Abrams et al. find the earliest onset of anthropogenic warming.
It is possible that AR5 best estimates overstate the strength of anthropogenic aerosol forcing, with the result that total anthropogenic forcing became positive enough to have a measurable impact on temperatures at an earlier date than if those estimates were correct. However, if so, that is good news. It would imply that climate sensitivity – both transient and equilibrium – is lower than current best estimates based on AR5 forcing values suggest, since the observed warming over the industrial era would then have been produced by a larger increase in forcing.
The influence of volcanism on the diagnosed early onset dates of warming
How, then, are Abram et al.’s results to be explained? The study’s change point analysis, whilst interesting, seems to me an unsuitable method of detecting the onset of anthropogenic warming. One would expect to find a change of slope in global temperature somewhere – depending on natural internal climate variability – around the late 1830s. Although anthropogenic forcing did not become significant until much later in the 19th century, there was a big change in average volcanic forcing at that time. Over the industrial period (taken as 1750–2015) as a whole, on the AR5 best estimate basis volcanic forcing averaged –0.4 W/m2. Whilst it averaged close to that level during the last four decades of the 18th century, during the first four decades of the 19th century there was heavy volcanic activity,[6] with (according to IPCC AR5 estimates) forcing averaging –1.0 W/m2. By contrast, volcanic forcing over the next four decades was small, averaging only –0.1 W/m2. The resulting +0.9 W/m2, change in average forcing is several times larger than the total change in anthropogenic forcing over the whole of the 19th century.
I would expect that pattern of forcing to produce, on a decadal mean basis, a depressed GMST level from circa 1800 to the late 1830s followed by a recovery. In the 1880s, when volcanic activity was again high (Krakatau), one might expect an interruption in the upward movement. However, Atlantic multidecadal variability is thought to have commenced an extended upswing during the 1830s, peaking in the late 1800s.[7] This upswing itself have produced a warming trend during that period, particularly over the Northern hemisphere. Multicentennial internal climate variability might also have had a role. Moreover, by the late 1800s anthropogenic forcing had become non-negligible at 0.25 W/m2 per AR5, so would have produced a weak warming trend, although not a strong enough one to counter the effects of Atlantic – and maybe Pacific – multidecadal variability becoming negative during the first two decades of the 20th century.
Warming from the late 1830s to the late 19th century due to recovery from the heavy volcanism earlier in the century and the upswing in Atlantic multidecadal variability would have been superimposed on a slow trend of recovery in surface temperature from the Little Ice Age (LIA), as the ocean interior warmed after the end of the particularly cold four hundred year period from (according to the paper) AD 1400–1800 – a process with a similarly long timescale. The resulting temporal pattern fits the global reconstructions of surface air and sea temperature trends shown in their Figure 1c and 1d, and would account for a change point being found in the 1830s or 1840s. But it does not at all imply that anthropogenic forcing had any measurable influence before the late 1800s. The change of GMST slope circa the late 1830s, and the rise in GMST from then until the late 1800s, was likely almost entirely due to natural factors.
Abram et al. claim that diagnosis using SiZer is little affected by temporary cooling episodes, such as those produced by heavy volcanic activity. This claim is based on the results of analyses of noisy synthetic temperature time series in which gradual warming commences at a known time. They show that a decade-long downwards excursion in temperature starting 25 or 50 years before the actual warming commencement date brings forward the diagnosed warming commencement date by only five to twenty years (Extended Data Figure 3a). However, heavy volcanic activity extended over the first four decades of the 19th century, not for a single decade. Also, the assumed AR(1) annual temperature time series autocorrelation of 0.1 looks light, certainly for sea surface temperatures, where the instrumental record suggests a figure of 0.4 or so would be more realistic. Moreover, their assumed ratio of 100-yr trend to 2σ noise of 1:0.5 looks optimistic to me. In the light of these factors, it seems plausible that the cooling produced by heavy volcanism during 1800–1839 might have brought forward the diagnosed second quarter of the 19th century warming commencement dates by up to several decades from when they would otherwise have been diagnosed.
Abram et al.’s evidence for early warming being anthropogenic
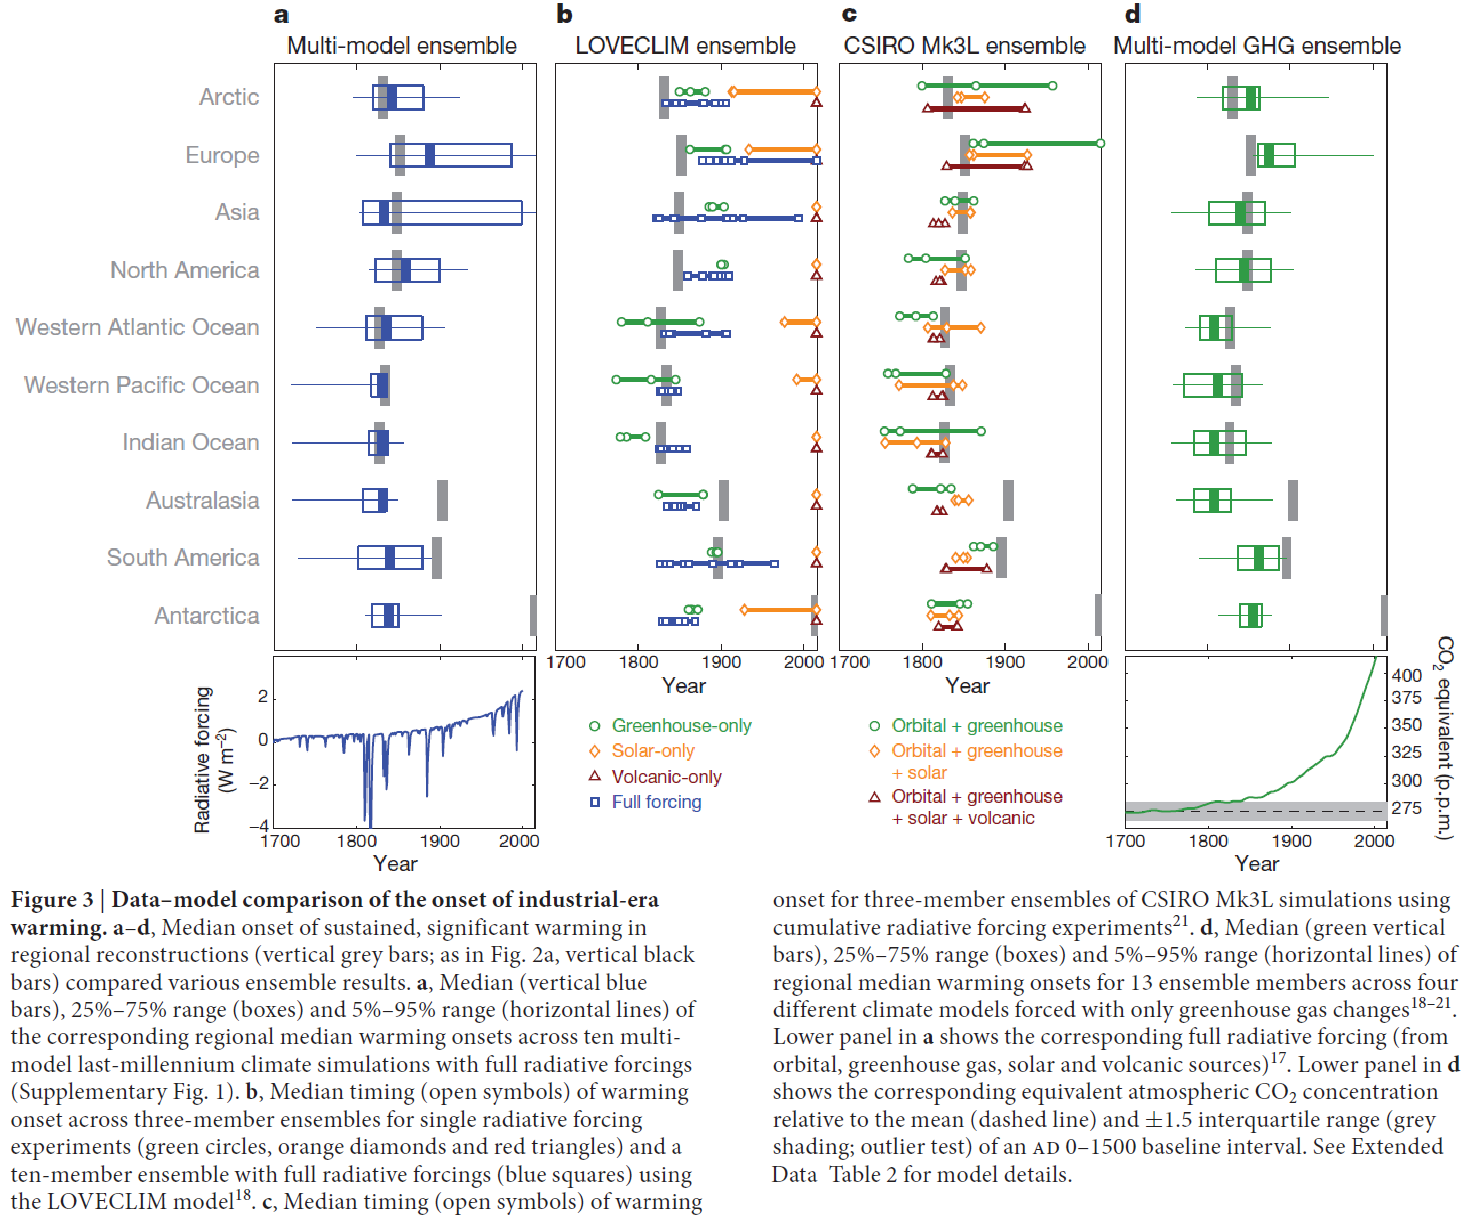
The paper’s conclusions about an anthropogenic origin of the early warming onset are based on evidence summarised in their Figure 3, reproduced here as Figure 1.
https://climateaudit.files.wordpress.com/2016/08/fig1_abram2016_fig3.png
Figure 1. Reproduction of Figure 3 of Abram et al. 2016
I will discuss each source of evidence separately, in the reverse order from where it appears in their Figure 3.
Evidence in Abrams et al. Figure 3d
The paper’s authors comment that:
“Naturally forced climate cooling may have helped to set the stage for the widespread onset of industrial-era warming in the tropical oceans and over Northern Hemisphere landmasses during the mid-nineteenth century.”
which is very true, but then go on to say:
“Simulations suggest that recovery from volcanic cooling is not an essential requirement for reproducing the mid-nineteenth-century onset of industrial-era warming. Multi-model experiments forced with only greenhouse gases capture regional onsets for sustained industrial-era warming that are consistent with the tropical ocean and Northern Hemisphere continental reconstructions (Fig 3d).”
However, this is irrelevant. It is unsurprising that model simulations forced only with greenhouse gases, as used in their Figure 3d, produce sustained warming from quite early in the industrial period. But in fact the historical forcing that produced the warming was the net sum of greenhouse gas (GHG) forcing and other forcings, which were mainly negative. As I stated, the AR5 best estimate of the sum total of historical forcings is almost zero in 1840, and only rises slowly thereafter. On a rolling 5-year average basis, estimated global total forcing doesn’t exceed 0.1 W/m2 – enough to produce, within a decade, a very small warming of 0.02 to 0.05°C – until 1901. However, GHG forcing reaches a more material level of 0.2 W/m2 in the mid-1840s – at which point total anthropogenic forcing is only 0.05 W/m2.
Evidence in Abrams et al. Figure 3c
The only anthropogenic forcing included in CSIRO-Mk3L simulations used here is from GHG. Various combinations of natural forcings were employed in addition. Accordingly, the same objections – regarding the omission of negative non-GHG anthropogenic forcing – apply here as to the Figure 3d evidence.
Evidence in Abrams et al. Figure 3b
The LOVECLIM simulations used here are stated to include “Full forcing” ones as well as GHG-only, solar only and volcanic only forcing simulations. However, Full forcing includes only GHG, land use change, solar and volcanic forcing. It does not include aerosol forcing, the dominant anthropogenic negative forcing. Accordingly, essentially the same objections apply here as to the Figure 3c and 3d evidence, albeit with slightly less force since the minor negative land use change forcing was included. Perhaps reflecting land use change forcing, in the Northern hemisphere the diagnosed warming commencement dates with Full forcing are generally several decades later than those found using the PAGES 2k reconstruction and the multimodel ensemble used for Figure 3a.
Evidence in Abrams et al. Figure 3a
This is really the crux of the evidence supplied by Abrams et al. as to an anthropogenic cause of early onset warming. The regional warming onset dates from simulations given in their Table 1, which they claim are reasonably consistent with the dates they derive from their proxy reconstructions, are based entirely on the multimodel last-millennium climate simulations to which their Figure 3a relates. They claim that these simulations, by ten models, employed full radiative forcings, both natural and anthropogenic. However, this statement appears to be incorrect.
The simulations used cover 850–2005 AD in two parts: 1000 year CMIP5 last-millennium (past1000) simulations with forcings that are consistent with the PMIP3 protocol, extended by CMIP5 historical period simulations covering 1850–2005. There are two problems with using this data.
First, the forcings PMIP3 specifies for use in last-millennium climate simulations excludes anthropogenic aerosols.[8] That will result in anthropogenic forcing, and warming, reaching a non-negligible level at a much earlier point in the industrial period than if all anthropogenic forcings were included at AR5 best estimate values. For about half the ensemble of ten (nine in practice) models used, it appears that the last-millennium climate simulations were continued to 2005 using the same set of PMIP3 forcings, producing a quasi-historical period simulation covering 1859–2005.
Secondly, it appears that for the remainder of the ensemble of models, the main CMIP5 historical period (1850–2005) model simulations, rather than continuations of the past1000 simulations, were used to extent the past1000 PMIP3-protocol simulations. That is important since, like the past1000 simulations, the main CMIP5 historical runs were initialised by branching off from preindustrial control runs. The ocean will be substantially cooler at the end of the past1000 simulations, following the long cold 1400–1840 period, than when the historical simulations were branched off the preindustrial control simulations (which generally do not have any volcanic forcing). As a result of this discontinuity, for such models there would be an immediate jump in temperatures (ignoring any influence of internal variability) between 1849 and 1850. Allowing for a 5–20 year early bias of the SiZer change point date in the presence of a burst of previous negative forcing (Extended Data Figure 3a), such as caused by the heavy volcanism over the first four decades of the 19th century, such jumps could account for finding warming onset dates in the 1830s.
Although the inclusion of negative anthropogenic aerosol forcing in the main CMIP5 historical simulations would result in them warming at a slightly slower rate after the initial jump in 1850 than if PMIP3-protocol forcings were included, the growth in negative anthropogenic aerosol forcing between preindustrial and 1850 is, unlike the rise in GHG, generally ignored in the CMIP5 historical simulations, so aerosol forcing would start from a zero base in 1850 and so have a negligible effect over the following few decades. Moreover, two of the models involved only included direct aerosol forcing – which per AR5 accounts for only about half total aerosol forcing– in their main CMIP5 historical simulations.
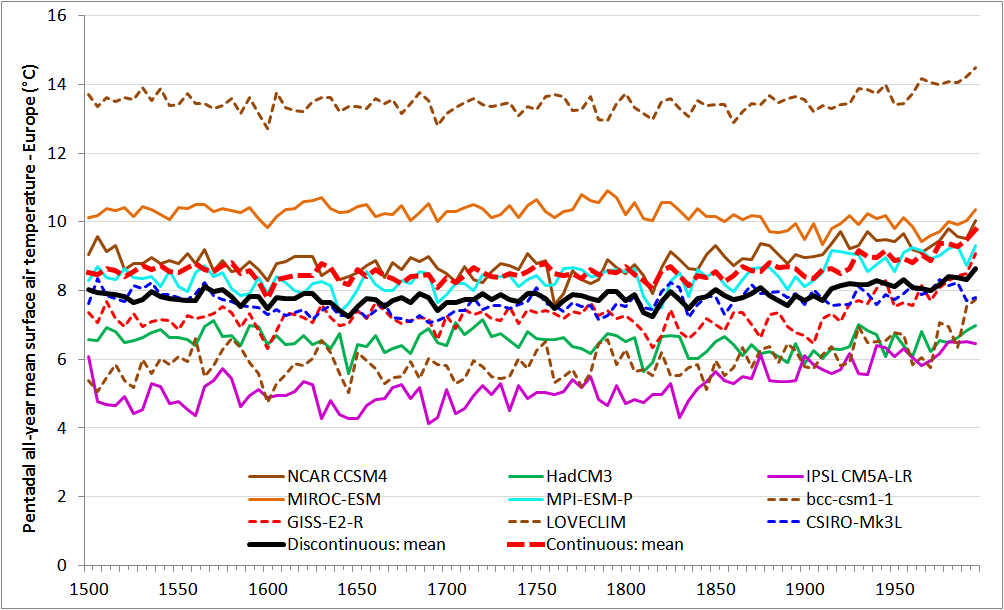
To illustrate my point, I accessed the data used and extracted the model simulated temperatures for Europe, one of the regions that has a diagnosed mid-19th century warming onset from the proxy-based reconstructions, with onset diagnosed later in the 19th century from the multi-model reconstructions. Figure 2 shows the various time series, averaged pentadally in order to reduce annual climate noise.
https://climateaudit.files.wordpress.com/2016/08/fig2_multimodel-ensemble-pentadal-europe-sat.png
Figure 2: Multimodel simulated surface temperature in Europe (pentads starting in year shown)
Results from the four models that appear to have generated simulations over 1850–2005 by continuing the last millennium simulations are shown by dashed lines; the thick red line shows their mean. None of these models included anthropogenic aerosol forcing. Results from the five models that appear to have generated simulations over 1850–2005 by branching from the (warmer) preindustrial control simulation are shown by solid lines; the thick black line shows their mean.[9]
Although difficult to see in the figure, the mean of the discontinuous models shows a jump from the 1840-49 average to the 1850–55 average temperature, of 0.23°C. By contrast, the mean for the continuous models shows an increase of only 0.05°C. I have chosen these periods as they are the longest ones straddling the start of 1850 transition from the last millennium simulations to the 1850–2005 ones that are unaffected by contemporaneous or very recent volcanic activity. Repeating the exercise for temperatures in Asia and North America, where the warming onsets dates diagnosed from the simulations straddled the 1840s, showed a mean excess for the discontinuous models, in the difference between the mean 1840-49 and 1850–55 averages, of 0.17°C, similar to that for Europe.[10] The much larger increase for the discontinuous models between the mean temperatures for these periods very much supports my argument that their historical simulations started from a warmer state than their past1000 simulations ended in.
Conclusions
It appears that the claim in Abrams et al. that the diagnosed early onset – about 180 years ago in some regions – of industrial-era warming is of anthropogenic origin is based on inappropriate evidence that does not substantiate that claim, which is very likely incorrect. Most of the evidence given for the anthropogenic origin claim, which is entirely model-simulation based, ignores the industrial era increase in aerosol forcing, the dominant negative (cooling) anthropogenic forcing; the remaining evidence appears to be invalidated by a simulation discontinuity in 1850. The only evidence provided that includes even the post 1850 increase in anthropogenic aerosol forcing – half of the Figure 3a multi-model ensemble simulations – is affected by the simulations from 1850 on being started with the ocean significantly warmer than it was in 1849.
Recovery from the heavy volcanism earlier in the century and an upswing in Atlantic multidecadal variability, superimposed on a slow trend of recovery in surface temperature from the LIA as the ocean interior warmed after the end of the particularly cold four hundred year period from AD 1400–1800, appears adequate to account for warming from the late 1830s to the final quarter of the 19th century. It is unlikely that anthropogenic forcing, estimated to be very low until the 1870s, played any part in warming before then. The heavy volcanism in the first four decades of the 19th century likely caused the warming onset dates diagnosed from the proxy data, at least, to be up to several decades earlier than they would have been in its absence.
Ironically, should the study’s finding of anthropogenic warming starting as early as circa the 1830s be correct, it would imply that anthropogenic aerosol forcing is weaker than estimated in IPCC AR5, and therefore that observational estimates of climate sensitivity (both transient and equilibrium) based on AR5 forcing values need to be revised downwards. That is because total anthropogenic forcing would only have become positive enough to have had any measurable impact on temperatures in the 1830s if AR5 best estimates significantly overstate the strength of anthropogenic aerosol forcing.
Correction:
Nerilie Abram helpfully advises me that the HadCM3 1850–2005 simulation was in fact a continuation of its last millennium simulation; this was not evident from the details given in the paper’s Extended Data Table 2. In addition, she says that a mean offset was applied to the historical portion of the MIROC-ESM simulation to avoid an artificial jump in this dataset. This does not seem to have been mentioned in the main text, Extended Data or Supplementary Information, and I do not know the amount of the offset. However, it now seems inappropriate to treat this model as belonging in the discontinuous category (although it is not entirely clear whether it can properly be categorised as continuous). The classifications of HadCM3 and MIROC-ESM in Figure 2 are accordingly incorrect, as are the heavy lines showing means for each category, which should be ignored.
With these two models categorised as continuous, the discontinuous category models show on average a 0.19°C jump in Europe, relative to the change for continuous models, from the 1840-49 mean to the 1850–55 mean temperature, similar to that previously derived. I have now calculated the median increase across all seven land regions for each set of models (continuous and discontinuous simulation ones). With HadCM3 and MIROC-ESM categorised as continuous, the overall median increase is 0.30°C higher for the discontinuous models than for the continuous models; this difference was almost the same, at 0.31°C, when they were treated as discontinuous models. Although the proportion of discontinuous models is now smaller, the problem with aerosol forcing being either ignored, either entirely or save as to its increase from its level in 1850 (possibly from the 1820s for HadCM3) remains.
Endnotes:
[1] Abram NJ et al. (2016) Early onset of industrial-era warming across the oceans and continents. Nature, doi:10.1038/nature19082. In archive FAQ_&_supporting_docs.zip available at https://cloudstor.aarnet.edu.au/plus/index.php/s/4pQheVzMddCXwJN
[2] Around the 1830s in the tropical oceans and the Arctic, and around the 1840s in North America, Asia and Europe.
[3] http://www.ncdc.noaa.gov/paleo/study/20083
[4] The past1000 CMIP5/PMIP3 simulations used commence in 800 AD, and are extended from 1849 to 2005, but Abram et al only use the 1500–1999 AD portion.
[5] Per AR5 best estimates, total aerosol forcing was over four times as strong as land use change forcing (which was also negative) throughout the 1800s.
[6] Very high volcanic forcing of –1.0 W/m2 in the decade to 1810 was followed by extremely high forcing of –2.1 W/m2 in the next decade due to the eruption of Tambora in 1815, which balanced out with the volcano-free 1820s, and forcing again very high at –1.1 W/m2 in the fourth decade due to the 1835 Cosiguina eruption.
[7] Delworth, T. L., and M. Mann (2000), Observed and simulated multidecadal variability in the Northern Hemisphere, Clim. Dyn., 16, 661–676, doi:10.1007/s003820000075. ( A smoothed version shown in Figure 2(d) of Chylek P et al. (2011) GRL 38, L13704, doi:10.1029/2011GL047501.)
[8] PMIP3 also excludes other anthropogenic non-greenhouse gas forcings other than land use change.
[9] The tenth model, Fgoals-s2, did not generate the requisite surface air temperature data.
[10] The average across the three regions of differences in mean 1840-49 and 1850–55 temperatures based on taking multi-model medians rather than means is even larger, at 0.28°C.
Moderation note: As with all guest posts, please keep your comments civil and relevant.

The spotlight is now on clouds and cosmic rays. But, do we know what the sun will do? For example weather.com talks about the winter of 2016/17 as follows:
No, Wagathon, scientists have ignored strong experimental evidence that cosmic rays from the Sun’s pulsar core induce nucleation of water vapor into charged clouds that produce rain, lightening and thunder.
In addition the cooling effects of clouds caused by dust, sea-salt spray and tiny man-made aerosol particles (pollution), experimental findings show, even absent pollution, that cosmic rays have even greater particle-inducing, cloud-making, cooling effects.
(Jasper Kirkby, et al., Ion-induced nucleation of pure biogenic particles, Nature-2016)
When using before and after the 1830s as a time period to infer possible causes of climate change, solar activity seems very likely…
https://upload.wikimedia.org/wikipedia/commons/2/28/Sunspot_Numbers.png?
If one accepts the Abram et al paper at face value, or Mann’s hockey stick paper for that matter, then don’t they describe an impossible to escape prognosis for warming and the incompatibility of the human race with mother nature if we advance beyond hunter gatherers? If our world is so sensitive that 180 years ago we were able to initiate AGW by simply existing in context to the cultures and technologies of the time then obviously the only path to stop ever increasing warming would be to eliminate most population and most industry in order to reverse CO2 emissions to circa 1830 levels, or earlier, and become hunter gatherers again in the process. Yea, I see that happening. Although the EU currently is seeing its death toll exceed its birth rate so maybe there’s hope that there’s an equally dramatic bell curve relative to human population. I’d use the words preposterous or insane but why stop there.
“the incompatibility of the human race with mother nature”
This is the religious underpinning that demands theological proof for the sin of industrialization.
Words count, even in science.
“Anthropogenic’ is a fake word.
Auto-correct tells me so every time I type it.
https://s9.postimg.org/607bgwy4f/Captura_de_pantalla_1398.png
h/t John Maurice Herron
Off topic
Thank you for the h/t Glenn, but this was a group effort.
Climatereason, opluso, catweazle666, brandonrgates, and beththeserf got together to give me a tutorial on adding links and images to the comment replies. I only web searched the image.
I think it says a lot of the spirit here at Climate Etc. Thanks JC.
So continue to disagree. I’m still learning.
I guess we need nuclear power. After all, we do know we will run out of fossil fuels.
No, it was not anthropogenic.
thank you very much. My initial response was a lot less eloquent.
As in crappy data (Pages2K) and mix and match models can provide useful scientific insight.
Or not.
Looks like another instance of an answer in search of a research protocol. “Hey look! We knew this to be true and now we just proved it.”.
The paleoproxies of Pages2k have neither the temperature nor the temporal resolution to make this paper credible. Many of them also have very significant technical problems that McIntyre has exposed, most recently Gergis for Austalia ‘data torture’. Models per se have little credibility, especially regionally. It is well known GCMs don’t downscale well no matter what methods are used. And especially not with such minute forcings. Therefore neither part of the paper’s figure 3 is credible. GIGO.
The last Thames ice fair was 1814. So by 1820, the historical evidence suggests the onset of emergence from the LIA. That it coincides with the Industrial revolution is just that, a coincidence. Even according to alarmist IPCC AR4, there was simply not enough AGW to discrimate a supposed anthropogenic signal from purely natural background anywhere before 1950. AR4 SPM figure 4. Each continent, all land, oceans, global. The flip side of their anthropogenic attribution argument, which itself also now fails because of the pause/model discrepancy in CMIP5.
…which itself also now fails because of the pause/model discrepancy in CMIP5.
Hysterical.
“Hysterical.”
How about ‘Unicorns’? Has more panache.
Andrew
No. Cold hard logic. The IPCC AR4 argument was that CMIP3 models without anthropogenic forcings reproduced observed temps up to ~1950 but not after, while only models with anthropogenic forcings reproduced observations thereafter. CMIP5 ensemble from 1979 is now higher than both satellite and balloon observation by 2.5x globally, and by 4x for the tropical troposphere, despite 26 years of the total 37 comparison period being in the tuned hindcast portion. Which simply means the anthropogenic forcing attribution fails by the same logic used to create it in AR4 SPM figure 4 and accompanying text. IPCC cannot have it both ways.
ristvan,
Sure they can. Perhaps the visuals and a bit of numeracy will help:
AR4 WGI Figure 9.5:
https://www.ipcc.ch/publications_and_data/ar4/wg1/en/fig/figure-9-5.jpeg
AR5 WGI Figure 10.1:
http://www.climatechange2013.org/images/figures/WGI_AR5_Fig10-1.jpg
Without anthro forcings, CMIP5 runs about 0.6 C below post-Paws observations. With anthro forcings, CMIP5 runs about 0.2 C above post-Paws observations. The standard deviation of the annual residuals over the 1861-2005 anthro-forced historical runs is 0.12.
You’re trying to tell us a post-Paws discrepancy inside two standard deviations of the hindcast error is as significant as the five standard deviation error when Teh Modulz don’t include anthropogenic forcings.
The mind boggles.
Albedo unknown, assumed constant. Sure.
Assume something else. do your analysis. then defend your assumption.
That is just fundamental analysis technique when you have unknowns.
notice:
Physical laws?.. Ok.. I assume they will always hold
There are always assumptions that something doesnt change..
Always assumptions ( ie foundationalist Epistemology is busted )
The key is.. what happens when you change the assumption, AND can you propose a test or data that supports one assumption over another.?
merely pointing out the assumptions is a stupid pet trick, because there are always and will always be assumptions. The key is what other assumptions can you propose, test, and investigate.. or rule out
Again, pretty basic stuff for working with sparse data.
Come on Mosher, the wheel has been invented.
Scientific method:
“In general we look for a new law by the following process. First we guess it. Then we compute the consequences of the guess to see what would be implied if this law that we guessed is right. Then we compare the result of the computation to nature, with experiment or experience, compare it directly with observation, to see if it works. If it disagrees with experiment it is wrong. In that simple statement is the key to science.”
– Richard Feynman
Inductivism:
“Assume something else. do your analysis. then defend your assumption. That is just fundamental analysis technique when you have unknowns.”
– Steven Mosher
Fundamental analysis Mosher?
Right. If you believe mathterbation is good fundamental science.
Science or Fiction,
Who needs the scientific method when one has the unicorn method?
“to see if it works. If it disagrees with experiment it is wrong. In that simple statement is the key to science.”
– Richard Feynman”
The funny thing is HE DIDNT DO THIS….
when faced with the solar neutrino problem the observations disagreed with the theory..
HE KEPT BOTH
Einstein as well.
You guys think that scientists objectively describ what they do.
they dont. they describe an IDEAL that they never actually practice
“That is just fundamental analysis technique when you have unknowns.”
You mean when you have ‘Unicorns’, don’t you?
Andrew
Dude skeptics are the ones who need Unicorns
“http://joannenova.com.au/2014/06/big-news-part-iv-a-huge-leap-understanding-the-mysterious-11-year-solar-delay/”
“But the mystery force might be electrical, or work through UV, or be something else entirely. Nonetheless, it was a leap to finally connect so many studies.”
Dude,
You just appealed to the unknown. You need a better explanation.
Andrew
Steve Mosher,
Please tell me what makes someone a ‘skeptic’…. ’cause I sure don’t think Nic Lewis invokes unicorns. Nor do I.
The AMO is a unicorn with a name…
“Please tell me what makes someone a ‘skeptic’…. ’cause I sure don’t think Nic Lewis invokes unicorns. Nor do I.”
Did I say you were a skeptic?
I’d say you are not.
Its a simple test really. think.
“The AMO is a unicorn with a name…”
Yup.
and once they name it, we can see that it doesnt cause a secular increase in temperature.
AMO does not explain why we have warming from 1850 to today.
neither does El nino, or GCRs, or any thing they can name
Because the MINUTE they name it, we can look and see..
Nope, nothing there..
Must be something else
I know unicorns
“that forcing is estimated to be almost entirely cancelled out by negative forcing, primarily from anthropogenic aerosols and partly from land use change increasing planetary albedo”
Volcanic aerosols warm the stratosphere, so why wouldn’t low altitude sulphur aerosols warm the surface like black carbon aerosols do?
Because they reflect solar radiation. Stratospheric (volcanic) aerosols also do so, and likewise cool the surface.
Stratospheric volcanic aerosols also absorb solar radiation and warm the stratosphere.
“Stratospheric volcanic aerosols also absorb solar radiation and warm the stratosphere.”
Yes, SO2 both reflects more and absorbs more while transmitting less.
( r + a + t = 1 )
So you warm the stratosphere and also reduce shortwave to the surface.
There’s some increase of downward LW into the troposphere from the stratosphere, but that increase in energy is not as much as the decrease of SW into the troposphere.
Further, with a warmer stratosphere, more LW is radiated downward to the troposphere, but also upward to space. So the stratosphere has a net increase in energy, but the troposphere and the atmosphere as a whole experience a net decrease in energy from volcanoes.
Powerful analysis of Abram et al. Lewis perhaps goes astray when he argues for a rival hypothesis.
…and an upswing in Atlantic multidecadal variability, superimposed on a slow trend of recovery in surface temperature from the LIA as the ocean interior warmed after the end of the particularly cold four hundred year period from AD 1400–1800, appears adequate to account for warming from the late 1830s to the final quarter of the 19th century. …
WAG.
Thank you Nic for this analysis of yet another evidence-lite claim that humans have been warming the planet for a lot longer than is generally accepted. We’ve been here before.
http://science.nbcnews.com/_news/2013/04/22/17864735-global-warming-study-suggests-human-causes-dating-back-to-1800s?lite
Why does there seem to be this obsession with pushing back the date of the human influence on the climate? Perhaps it lends more credibility to ongoing attempts to define a new geological epoch, the Anthropocene. It certainly takes the emphasis away from natural post little Ice Age warming (ref. the long term trend and the superimposed multidecadal cycles) in favour of anthropogenic warming. The Industrial Revolution, virtually from day one, then becomes the main driver of climate change and natural internal and external forcings of climate change since 1830 get conveniently sidelined.
Why does there seem to be this obsession with pushing back the date of the human influence on the climate?
Maybe because there is no room for warming by natural causes in the theory propounded by United Nations climate panel IPCC:
https://www.ipcc.ch/report/graphics/images/Assessment%20Reports/AR5%20-%20WG1/SPM/FigSPM-05.jpg
Ref: IPCC; WGI; AR5; Summary for policymakers; FigSPM-05
IPCC seem to believe that humans pulled the earth out of the little ice age (ending around 1750) – 200 years before we really started to emit CO2.
And there are no proper measurements of the influencing variables (Other than CO2) hypothesized by IPCC – pure inductivism.
Reblogged this on The Ratliff Notepad.
CET shows virtually no warming from 1830 to 1930.
CET is not the planet.
Yamal is not the planet.
the arctic is not the planet
Tree rings and ice cores are not instrumental records. Intelligent use of CET could help correct errors in global reconstructions.
too funny…Like Mann you believe in teleconnections
How else did Hurrell reconstruct the NAO back to 1659.
Or rather:
Luterbacher, J., Xoplaki, E., Dietrich, D., Jones, P.D., Davies, T.D.,
Portis, D., Gonzalez-Rouco, J.F., von Storch, H., Gyalistras, D., Casty,
C., and Wanner, H., 2002. Extending North Atlantic Oscillation
Reconstructions Back to 1500. Atmos. Sci. Lett., doi:10.1006/asle.2001.0044.
Surprisingly, CET does turn out to be a useful proxy for global temperature.
http://www.climate-lab-book.ac.uk/2015/what-have-global-temperatures-ever-done-for-us/
Jamie
It is not surprising at all, as we have been pointing it out for years. Mosh has also said on numerous occasions that CET is a reasonable proxy, with certain caveats
Tonyb
“Surprisingly, CET does turn out to be a useful proxy for global temperature.”
Yes, its most useful in demonstrating the following logic
If you trust CET.. you are constrained in claims you can make about the global record being
A) A Hoax
B) Inaccurate
etc
Note too.. that Objections about correlations over long distances also
become constrained
Note too that Objections about too few samples also become constrained
Not too that objections about INFILLING and extrapolation Also
become constrained.
In short IF you accept CET.. almost all of the skeptical objections to GMST are busted
“In short IF you accept CET.. almost all of the skeptical objections to GMST are busted.”
‘Accepting’ and ‘trusting’ CET is not quite the same as accepting that it is a useful proxy for GMST over multidecadal timescales. The link I provided was with reference to one GMST dataset – Hadcrut 4.3. The switch from version 3 to version 4 – which resulted in 1998 no longer being the warmest year – was largely irrelevant with respect to CET being a useful proxy, i.e. CET was a useful proxy for GMST before Hadcrut was upgraded to version4, and remained so afterwards; at least Hubert Lamb seemed to think so (might have been an even earlier version of Hadcrut when he made the claim). So logically, one can question recent adjustments to the global surface temperature record whilst still maintaining that CET is a useful proxy. Another example: questioning the scientific validity of NOAA’s ‘pausebuster’ adjustments is not mutually incompatible with a belief that CET is a useful proxy for GMST over multidecadal timescales. Of course, sceptics claiming that GMST is a complete hoax or is vastly at odds with reality are somewhat constrained by a simultaneous belief in the ‘surprising’ CET-GMST teleconnection, but I imagine this group must be a tiny minority.
A proxy is useful until it’s not useful. The paper shows an example of both with respect to CET. But even when it appears useful, it may be just serendipity. Is there any mechanism which would explain why a little patch of England is a good proxy for the globe? Answer: there is nothing that explains it. Bet on serendipity. The CET and the AMO are a lot alike… lol.
JCH
Amongst those who think CET is a useful proxy for a global (or at least NH) temperature (with various caveats) are The Met Office, The Dutch Met Office, Hubert Lamb, Mosh (when he doesn’t backtrack and Ed Hawkins, amongst others.
from Ed Hawkins
http://www.climate-lab-book.ac.uk/2015/what-have-global-temperatures-ever-done-for-us/
“Consider central England – an area which occupies just 0.005% of the planet’s surface. For this region, the year-to-year variability in annual temperatures is much larger than for a global average (Figure 1) – this is obviously because such small areas are sensitive to fluctuations in the weather, and these fluctuations are spatially averaged in a global mean.
But, note that the familiar features of the global temperature record are clearly visible by eye in the central England record too, just overlaid by the large annual fluctuations. When averaging over multi-decadal timescales, the correlation between the global and local timeseries is r = 0.96. In this instance, averaging over time is similar to averaging over space (also see animation in Figure 2).”
Within this is a link to their new paper which usefully uses both CET and BEST ‘What does global mean temperature tell us about local climate?’
‘Another example is provided by figure 1, which shows a comparison between changes in GMST since 1850 and changes in annual mean temperature and summer precipitation in central England. On interannual timescales temperatures in central England show much greater variability and are not closely related to variations in GMST. By contrast, on multi-decadal timescales there is evidence of common behaviour, with a correlation coefficient of 0.96 between the two time series. Such a high correlation is quite surprising considering that central England represents just 0.005% of the Earth’s surface area.’
http://rsta.royalsocietypublishing.org/content/373/2054/20140426
tonyb
The paper clearly states the CET is both good and bad, depending on the question being asked.
There is no physical reason for why it is good that is a better reason than mere happenstance.
Your graphs showed a pronounced downturn in trend for the CET in the 21st century. So like I said, that’s why it’s called serendipity.
This other bit of your quote is also noteworthy, since it shows that Hawkins were looking more “what does knowledge of past and future GMST tell us about local climate” than the other way around:
UK temperatures have the reverse phase relationship to solar cycles that the AMO has:
https://snag.gy/MTnui.jpg
What a silly proposition that anthropogenic warming got us out of the LIA. Temperature recovery started when the Maunder minimum ended, but there was a cold relapse due to volcanic activity in the early 19th century.
In every cooling event of the Holocene, the 8.2 kyr event, the 5.2 kyr event, the 2.8 kyr event, and the LIA, once temperatures reached a bottom, there was a natural warming recovery, simply because of the end of the cooling conditions. Analysis shows that this natural recovery can take from 200 to 400 years after solar activity returns to normal.
Both GHG and aerosol forcings are greatly overestimated, while solar forcing is underestimated. Also the time involved in reverting a long and profound cooling is pretty much ignored.
The adaptations that farmers developed for the harsh conditions during the LIA in the 18th century that gave rise to the Agricultural Revolution in the Low Countries and England increased field productivity, and population, and released workers, lowering wages, creating the conditions for the Industrial Revolution. It was no coincidence that the Industrial Revolution took place just after LIA. Cultural advance has often been the result of the profound crises brought by climate change in the past.
Agriculture expanded to Europe at the rhythm of cold events, to the Aegean and Balkans at the 8.2 kyr event. To central Europe at the 7.7 kyr event. The Chalcolithic to Early Bronze transition in Europe at the 5.2 kyr event. The Late Bronze to Early Iron transition at the 3.2/2.8 kyr events.
See for example:
Weninger, B. et al. (2009) “The impact of rapid climate change on prehistoric societies during the Holocene in the eastern Mediterranean.” Documenta Praehistorica 36: 7-59.
“I would expect that pattern of forcing to produce, on a decadal mean basis, a depressed GMST level from circa 1800 to the late 1830s followed by a recovery. ”
http://berkeleyearth.lbl.gov/auto/Regional/TAVG/Figures/global-land-TAVG-Trend.pdf
more or less..
lots of uncertainty..
Rather unlikely early 1800’s temperatures with the dense series of El Nino events 1806-1821:
https://sites.google.com/site/medievalwarmperiod/Home/historic-el-nino-events
Oh jesus.. Tell me you didnt cite that Book of anecdotes..
too funny
Data man.. bring your data…
The negative NAO values corroborate it. It is definitely the norm for negative NAO/AO to increase through solar minima, so naturally El Nino episodes and conditions would also increase.
data big boy
data and code.
Why don’t you grow up and cut out the cowboy dramatics. Surely you know where to source NAO data for the period.
” a depressed GMST level from circa 1800 to the late 1830s “
Based on what?
Steve Mosher,
Yes, lots of uncertainty, but still, the graphic you linked to seems to indicate warming started in the late 1800’s or near 1900, not 1830.
The WfT data may not be correct as I don’t think it has ever updated since the BEST roll out, but …
” a depressed GMST level from circa 1800 to the late 1830s “
Why does it make a difference if the planet is warming because of non-human causes or human causes? Are the results of warming different? Are the remedies/actions in fact that much different (at least, at this point in time)?
It seems there are two ideas here, one being if it is human induced warming there is some moral judgement associated with that.
And if it is human induced, the solutions available are different, but I’m not so certain of that either.
The answer is yes and yes. If the warming is due entirely or mostly to human GHG emissions then they are likely to be dangerous in the long term and the proposed solution is to reduce them significantly which is a problem since the alternatives are not that good.
But if the warming is mostly or greatly a natural effect, then it is unlikely to become dangerous and human GHG emissions are of no great concern and we should be focusing on all the rest of the gazillion problems that our civilization is bringing to the planet.
“If natural, we have to adapt.”
Determine how to safely dump aerosols into the atmosphere. No need to suffer. However, that assumes there will be suffering should temperatures rise. As opposed to benefits.
Interesting comment. If natural, we have to adapt. If anthropogenic, we could adapt but warmunists argue modeled catastrophes demand mitigation instead. The whole renewables industry that sprang up around mitigation subsidies now provides momentum to that view.
The problem with mitigation is threefold: renewables are intermittent and there is no general grid storage solution; developing countries won’t curtail growth (India and China); the prophesied harbingers of future catastrophes have not materialized. Except for the now rapidly cooling 2015 El Nino blip, no warming this century. SLR not accelerating. Arctic ice has not disappeared. CO2 fertilization effect has Earth greening. And finally the ‘climate science’ gets palpably dodgier, as here.
edbarber:
I posted this:
https://judithcurry.com/2016/09/01/assessing-the-causes-of-early-industrial-era-warming/#comment-808341
that was supposed to show up here.
It makes all the difference. Ask a warmist.
To assume the Abram et al paper is correct would mean policy becomes moot. Oh, there would be much pain to suffer through to be sure, but even warmists should embrace the future of Florida becoming a shallow ocean because it’s impossible to mitigate the perceived problem by reverting to an 18th century carbon footprint without draconian measures (unless you consider massive population reduction acceptable through, uh, means), adding many layers of imposed misery on top of the inevitable outcome and consequences of rising oceans. Why not instead rejoice at the ongoing greening of the planet and stop fretting about something we can’t do anything about. Only the greenies would entertain becoming hunter gatherers again, the rest of us would rather fish for red snapper off the coast of Oklahoma and shed a tear Mardi Gras had to be moved inland.
Of course if the papers are not accurate it’s a win win for everyone.
I like many parts of you adaptation outline. Draconian measures, not so much. The devil would be in the details. People need time to prepare. The time to shift those in vulnerable locations isn’t when you are collecting the survivors by boat. Example. DoD has been conducting a Base Consolidation and Relocation Program. The Pentagon plans thoroughly. 50,000 additional staff were assigned to Fort Meade. They had lots of space because it had been President Eisenhower’s favorite stomping ground. Nine 18 hole golf courses with some army guys there as the excuse. In the five years it has been progressing, the once tree covered rolling hills out my window are now littered with McMansions and Town Houses (from the low $400). A catastrophic sea level rise of 100 feet puts all that under water (my house is on a hill 387 feet above MSL). Don’t get me wrong, I’d like nothing more than to see NSA turn into a marina. Right now I have to drag my boat 20 miles to the Bay. Two miles to the new marina. NSA doing its spying elsewhere. No terrorist alert signs blinking across the highway taking the family up the road to DQ for an ice cream. Sweeping with a broad brush would be nice but those folks are now my neighbors and I would rather not see them fleeing to FEMA trailer camps out in Fredrick County eating MRE’s, Wisconsin block cheese and waiting for the ice and water trucks to arrive while they figure out where their lives go from there. Stop Global Warming, ha! A sensible plan that people can use to prepare for an uncertain future. The Doom Merchants can choke on their CO2 for all I care It’s my neighbors I worry about. Think Globally, Act Locally, fine. I’m with you and I ask what’s the plan.
Anecdotal, yes. Citation, Washington Post. Data, DoD BCRP. Hand me my hat for using the word Catastrophe, been there, done that.
Keep your thoughts coming jungletrunks, like I keep saying, I’m here to learn.
Like I said, I agree with all your points, and may I say I like the up side of sea level rise aspect. You won’t have to shed a tear over Mardi Gras moving inland. It’s the coast that will move inland. You can see from my rant above I also share your distrust of warmists who emphasize the down side and only offer vague plans on how the rest of us get from now to then. You sure got me thinking. Thanks.
I appreciate the reply, Herron.
Part of my post was obviously a bit flippant and sarcastic. I tend to get that way when I detect anything either lacking common sense or deserving of a sneer. I do believe mitigation based on a premise that anthropogenic CO2 levels must be driven down to 18th century levels is preposterous. There’s no path for present civilization to adjust to those levels with the global population we have without draconian measures; with exception of a revolutionary near-term advancement of sequestration technology. Long-term, anything is possible. I have always believed that the evolution of technology, probably within the course of 50 years or so, will make this whole AGW debate moot; something to look back on with a smile, equating to the sailing off the edge of the planet myth of yesteryear.
Climate change moves slower than human advancement of technology. Humans only first took to the air about 100 years ago, look at all the advancements since then. One would have to be completely void of vision to believe we won’t evolve myriad technologies in the next 50 years, inclusive of alternative energy solutions that are both cost effective and that scale up efficiently to replace current technology. Not believing these things is as preposterous as believing we need to revert to an 18th century carbon footprint; to those I would say they need to get off the back of their unicorn and feel the ground under their feet again, it helps with mental vertigo I’ve been told.
My sense is that if the leftards weren’t so anti-nuke, they would just nuke us all to save the planet.
If, in the future, sequestration stops us from sailing off the edge of the planet, then AGW was not a myth. No surprise there… because it most definitely is not a myth.
Now you see the power of exponential advancement of technology, JHC, it makes warmists panic and concerns, feigned or otherwise, moot. A win win for everyone.
Jim, your observation was in back of my mind when I was referring to population reduction through, um, means. Too, not just the concern of radiation, but think about how much CO2 nukes would release. There must be a more efficient path that has the appearance of being humanitarian. Give them time to think.
My sense is that if the leftards weren’t so anti-nuke, they would just nuke us all to save the planet….
It’s a big world… that includes some scary simple solutions people… like Trump. So heading for 9 billion, all the Generals and leaders in the world begin to realize that killing… take a number… say 5 billion people, is a simple solution.
All they have to do is kill… low tech… cheap… afterwards, smell subsides; big growth economy; happy survivors.
Catharsis. jungletrunks, I too share your confidence in technological advancement. No silver bullet, no one size fits all solution can address the many issues combined in this puzzle. Those advances will likely come from technologists working multiple angles. More technology has come from Bell Laboratories than from Gallaudet University. jim2 points out that it is the politics that matters. Unicorns jousting in ivory towers don’t worry me, the circling sharks do. ( SiFi channel has a Sharknado marathon on for Labor Day weekend.) jungletrunks, you stay flippant and sarcastic. I’ll work on not being so cynical. Oh, and please call me John. My colleges at the office used to call me “that g@d d@mned Herron” I’m retired now and much more mellow.
JCH,
Right.
It’s Trump who is the cold-blooded warmonger, not Clinton.
Hillary Clinton “We Came, We Saw, He Died” (Gaddafi)
https://www.youtube.com/watch?v=FmIRYvJQeHM
Sharknado alert. Chainsaws everyone.
https://doodleordie.s3.amazonaws.com/i/8GEIhD1pe/5ixPXRDYT.png
(did I get this right?)
John Maurice Herron,
So why do you believe the CAGW faithful want to crucify humanity on a cross of CAGW?
Hi Glenn. To be fair it was edbarbar’s question that precipitated this. He tried to phrase it as an either/ or when I saw about 15 questions and could parse it into about 60 really. He got plenty of opinions, you’ll have to ask him if he got any answers. jungletrunks made a reasonable comment but it had ‘draconian’ ( a hot button for me) in it and I vented. Going back I realized that I had not made it clear I was venting with him, not at him. Collateral damage in what brandonrgates called the blogwars. Which brings me to your question. “So why do you believe the CAGW faithful want to crucify humanity on a cross of CAGW?” I don’t. Winston Churchill said “Anyone under thirty who isn’t Liberal has no heart, anyone over thirty who isn’t conservative has no brain”. We protested back in my day against the War in Vietnam. The tear gas, the baby blue riot helmets, we knew how to protest. No safe spaces, no offensive words cop outs. I remember a ludicrous press statement from the time that became famous. “We had to destroy the village in order to save it”. More recently is the quote “It takes a Global village”. edbarbar raised the question of moral judgement. Does the Global village have to be destroyed in order to be saved? The only ones who push that are the sharks. Sorry to be so long winded. Back to you edbarbar.
Yeah, I’ll close with it seems to me knowing the root cause of the warming is important, and knowing what can be done about it is important. Whether it is man or nature (isn’t man a part of nature?) isn’t that important.
It doesn’t tell us whether it is dangerous. Given how smoothed the view of past temperatures are, who knows whether the rate of increase is unprecedented.
It doesn’t tell us what we can do about it (I have kids: I can’t even get them to go to bed on time; imagine forcing behavioral changes on 6 billion people).
The morality play in my view is counter-productive. The most obvious loser is the public, with lawyers and bureaucrats the winners. Apply RICO? Give me a break. Consensus sanctions? It’s bad for science.
Even, suppose CO2 is the global thermostat. The recent article by the guy claiming it is natural CO2 on account of recent warming was interesting. Human CO2 production rates today are double what they were a few decades ago, yet the rate of increase of CO2 in the atmosphere remains about the same.
So, first, find the root causes. Second, determine what the options are (aerosols are there if warming really is dangerous). Third, assess whether it’s dangerous or not.
I think attribution is important only insofar as they lead to progress on the three.
Some of you her may remember a graphic in my recent article ‘ the intermittent little ice age’ the title is self explanatory as to what it shows. It covers CET with my reconstruction from 1538 to 1660
https://curryja.files.wordpress.com/2015/02/slide4.png
It bears considerable resemblance to bore hole data ( second graphic down )
http://www.earth.lsa.umich.edu/climate/core.html
Whilst the period from 1400 to 1850 was often cold it was often very hot too.
It is a mistake to characterise the entire period as one long cold p
Epoch. The period around 1730 was only fractions of a degree cooler than today according to hibert lamb and phil jones.
That around 1540 had one of the most notable heatwaves of the millennium some decades in the 1400’s were remarkably warm. We do of course rightly remember the intensely cold periods But that is not the whole story.
The idea that human influence could have had an impact from 1830 is surely nonsensical. If we could noticeably influence it at that time, then surely, as an industrial society in huge need of energy, food etc, we can not live on this planet without drastically altering it.
Tonyb
skeptics will be along to criticize the false precision
I baited my hook, threw it in the lake and here you are. :)
I claim nothing more than lambs maxim about reconstructions that ‘we can understand the (temperature) tendency but not the precision.’
The shape is approximately right. CET operates within quite tight bounds and it is perfectly possible to approximate any notable events, either hot or cold’ through resarch of the many fine records we have, as well as building on the work of numerous other researchers through the centuries
Tonyb
Tony you may CLAIM nothing more than “tendency” BUT you plot
precise values..
And those values get used to see or compute trends
I merely note that ZERO skeptics will come along to ask… How did he plot that point at 8.01?
But Mosh, in order to show the ‘general tendency’ is precisely why I created other ways to express data that covered a broader criteria. For example here, used in one of my recent articles
https://curryja.files.wordpress.com/2015/02/slide2.png
Tonyb
You still dont get it tony
those lines START and STOP at precise locations on the chart.
And yet no skeptic comes along to question the precision…
Plus your grouping on those charts is a failure as I showed using K means clustering.
How did Tony plot that point at 8.01?
Mosh
I put my point of view on Nic’;s paper by highlighting some of my own work that is relevant. I knew you would be along to comment on it. That’s all that was meant. I had assumed that from there you would carry out a serious discussion of Nics paper.
tonyb
> I put my point of view on Nic’;s paper by highlighting some of my own work that is relevant.
Which point of view, and relevant to which part of Nic’s paper, again?
> It covers CET with my reconstruction from 1538 to 1660.
Ye olde splicing devil!
Tonyb has done the work and put it out for critique. And he did not use Mike’s Nature trick; he noted the distinction clearly. Nothing devilish at all.
> he noted the distinction clearly.
You mean, splicing, Sir Rud?
I don’t see any “distinction” on the graph.
It’s a continuation not a splicing , I.e apples and apples.
The graphic was from an article
https://judithcurry.com/2015/02/19/the-intermittent-little-ice-age/
In it I very clearly say what is my reconstruction and what isn’t . When reproducing the single graph here I very clearly said what is mine.
Now, the topic is Nic’s article so it would be very interesting to hear your critique of that article
Tonyb
> apples and apples
Then the CET stations may be your Worcester Pearmains and the historic observations and records your Blenheim Oranges, TonyB.
Tony?
is that Just CET or is there ANOTHER STATION spliced in with
no indication of this splicing in the chart?
too funny
‘I baited my hook, threw it in the lake and here you are. :)
But Now, you want to “move on” to Nic’s paper..
History tells us that the worst two periods of the LIA were in the 14th century -> “The 14th Century Crisis”, between 1315 and 1380, and in the 17th century -> “The General Crisis of the 17th Century”, between 1620 and 1720. When you look at sufficient climate proxies you see that a lot of them agree with History. Essentially the presence of the black plague in Europe coincided with the LIA, from 1347 to about 1750. The final bang was the late 18th-early 19th century cooling from volcanic activity. This was the Old Regime Crisis with the French Revolution and Revolutionary and Napoleonic wars.
The coldest decade of the millennium took place in the 1430’s. But it was a very dry period which to some extent made it less bad because there were no late spring floods.
While CET only exemplifies one of the regions in the paper, interesting that it shows the approximate ~1830-1840 trend ‘change point’ quite vividly. Strengthens the notion that the SiZer software found something in the paleoproxies despite all their resolution problems. I had previously thought this dubious. But as Nic points out, the attribution to the Industrial Revolution is still beyond ludicrous.
AR4 SPM fig.4 asserted it was not possible to detect an unambiguous anthropogenic signal before 1950. That is half correct; it is not possible to unambiguously do so after 1950 either. (1) the ~1920-1945 rise is statistically indistinguishable from ~1975-2000 rise. (2) the pause since 2000 despite ~35% of all increasing CO2 since 1958 having been added in that 16 year interval.
is CET settled?
http://www.climate-uk.com/page5.html
Mosh
The data you reference is maintained sporadically by someone who was formerly a well known meteorologist over here.
I have had precisely this discussion about the current relationship with the older record with David Parker who, as you know created the 1772 version.
As you also know allowance is made for UHI and consequently stations change as they become urbanised. Ring wood for example was retired for good reasons.
these changes are noted in peer reviewed papers which receive very wide publicity and comment. Personally I think urbanisation affected a number of stations and not enough adjustment was made.
Tim currently runs the data base. He adjusted the series recently when Vuk found a mistake. CET is a good indicator of the historic evolution of the Wider climate as you have remarked on a number of occasions.
http://www.metoffice.gov.uk/hadobs/hadcet/contact.html
Tonyb
is it settled?
Hi Steven
No.
Nothing that human mind may consider, in its current stage of development, is certain for certain.
As I quoted elsewhere, Bertrand Russell said:
“One of the painful things about our time is that those who feel certainty are stupid ….”
Mind you he was brought up by his grandmother.
edbarber:
Say there’s a background of justice. If it’s warming for non-human caused reasons, no crime has been committed. If we are causing it, then justice should be obtained from us. The ‘us’ can be directed at ExxonMobil, the developed nations and perhaps capitalism. But that might be just a misdirect away from users of gasoline to suppliers of the same. We are trying to find harms committed. Justice has been a common theme for decades in other areas. Social justice, income inequality justice, health care justice. It’s weather justice. Sensitivity studies, the consensus on what they are, under weather justice, greatly effect dollar values of weather restitution. So it may be a question of how guilty we are and how much money do we have pay? Can we get probation if we plant trees, farm organically or buy a wind turbine? If we try hard not to appear guilty, can they find someone else to take money from?
Did I say, they will just find another reason?
Here’s a PAGES2K plot:
http://www.realclimate.org/images//Marcott_PAGES2k.png
Detection according to the paper was in the 1830s. It was said that the change in W/m2 just wasn’t enough. A small change in CO2 has a suggested way of being detectible. Notice in the plot a 5 dot V starting in the late 1700s. This V may coincide with variable sensitivity. The variable lasting for long enough to turn the trend upwards. The V may indicate synchronization and jumps to a number of attractors. It might be simply an umpires call, but CO2 was in the vicinity. One problem with my idea is synchronization seemingly lasting almost 100 years. But there may have been multiple synchronizations instead. The V looks to me like high sensitivity to all changes at the quite material trend breakpoint. For those without a scorecard, this variable sensitivity is Ghil’s idea written about on this blog before.
Well, according a paper claiming to rewrite the history of volcanic forcing, there was a crap load of 2 to 12 times Pinatubo eruptions from around 1225 to 1816. It is almost like “average” volcanic forcing was 2 to 4 times greater during “pre-industrial” than it was during industrial. Having less than average volcanic forcing would be almost like a positive forcing I would think. Maybe these were human induced volcanoes?
http://www.nature.com/nclimate/journal/v4/n8/extref/nclimate2293-s1.pdf
Any plot using Marcott is automatically discredited, since he provably commited academic misconduct in his infamous Science paper. Posted here the evidence in 2013,
Here I show a few other plots indicating an about 1800 to 1900 V shape that I mentioned above:
https://chaosaccounting.wordpress.com/2016/09/01/1800-to-1900-climate-synchronization/
It doesn’t show up in everything of course. When we are dealing with the low forcing values of the past, that might be a good place to find synchonization and variable sensitivity.
You don’t really know what forcing values you have in the past other than a rough estimate of CO2. Any starting point you pick you are assuming that is “normal” AOD, glacial extent, land use practice etc. Also depending on the averaging used, the peaks and valleys don’t line up at the same point. For example, Marcott has roughly a 120 year averaging which would delay the valley by 30 to 50 years. They use some ~400 year reconstructions that would delay an event by 100 to 150 years.
The mass of the oceans would delay the maximum response to volcanic forcing by 8 years or longer depending on the strength of the forcing. Maximum response would include change in ocean heat capacity which is a better indication of energy imbalance. If the oceans are recovering from some past event, it would look like a change in forcing.
That though “has been done to death” so we have to wait until that mistake is unavoidable for the show to get on the road again.
In any case, Rosenthal et al. have the intermediate water temperature valley at ~1650 and show an oscillating recovery.
http://www.ldeo.columbia.edu/~blinsley/Dr._B._K_Linsley/Indonesia_&_Pacific_Intermediate_Water_files/Rosenthal.Linsley.Oppo%202013%20Pac.Ocean.Heat.pdf
captdallas:
I see your point which I think is a resolution problem.
Maybe not synchronization but soot:
“Overlooked in climate projections until recently, carbon black is a powerful warming agent. The soot, scientists speculate, came from giant wildfires that likely occurred in Australia and South America. So much soot could have raised temperatures. Preliminary tests also showed that soot levels dropped during the cooler centuries after the Middle Ages, a period known as the Little Ice Age.”
http://www.wsj.com/articles/SB10001424052748704655004575114010457906340
More than soot on icesheets, there is soot on snow at lower latitudes changing albedo values. During Spring there can be high shortwave incoming with snow on the ground. I suppose if there were large areas of fire in the past, that would be synchronization.
I believe we have a few things going on here.
1. Trying to synchronize events in paleo has a lot of issues. If all the reconstructions have the same frequency resolution, you can better estimate event timing.
2. Volcanic events should provide a time stamp of sorts and when you have a volcanic event that is about 10 times stronger than Pinatubo, a decent paleo reconstruction should pick it up.
3. Soot or black carbon is more likely to happen naturally during colder. dryer periods and would have more impact when there is greater snow/ice field area. Pretty nonlinear.
4. What are you looking for, “sensitivity” or energy imbalance?
From 1229 to 1285 there was the equivalent of 14.7 Pinatubos in 56 years, versus 2 over the past 56 years. I would bet you had some serious wild fires during 1229 to 1285. The volcanoes would have a greater impact on ocean heat capacity, but the soot a greater impact on snow melt. So “surface” temperature could be fairly uniform but energy imbalance hugely negative. “Sensitivity” is pretty meaningless without knowing both.
In case you are wondering, from 600 to 1000 there was very little volcanic activity. If you are looking for some reference metric, I would go with oceans and volcanoes which means Marcott’s multiproxy hits the circular file along with the treemometers.
captdallas:
Your point 1. I realized after I posted we were looking heavily smoothed plots for the most part. Not like a sharp current day El Nino spike. I suppose when we think of synchronization we might limit that to a year or two in length like an El Nino. Something I read years ago about scale not mattering has me considering why not a century long synchronization? Exiting a glacial period gives a long time of most things synching to say, Warm it up.
Your point 3. Elevating soot on the global warming totem pole is going to give the system more memory. We have a lot of fuel, or we don’t have a lot of fuel. A tree that just decays in a lush forest no soot. Fire trap forest, soot, which should bring warmth and rain in the long run. With a fire trap, you get reverse sequestration by putting the Carbon in the air also bringing warmth and rain.
Your point 4. I suppose I am looking at sensitivity indicated by patterns. Your Oppo 2009 SST plot seems to show organization staring in about 1700 with four valleys and three peaks.
Patterns are fun. I gravitated to Oppo though because their reconstruction agrees with the current rate of ocean heat uptake and generally indicated response to volcanic forcing. However, volcanic forcing history keeps getting re-written and aerosol forcing keeps changing etc. etc.
The recovery pattern in Oppo appears to be a weakly dampened oscillation related to ocean basins attempting to somewhat equalize, so there is no reason to believe the pattern will continue. The red line and deviation range from the 600 to 1000 mean should be what we can expect as “normal” until another big volcano or two, at least in the tropics. We will have to wait and see how many new and improved versions of GMST we have until then. Most of the chaos appears to be operator error. I still think Climate Science needs a hard arsed project manager.
Amazing. During the European Industrial Revolution, people start burning large amounts of coal, producing large amounts of heat, and large amounts of CO2.
Thermometers demonstrate more heat continuously being produced. Higher temperatures ensue.
This hypothesis can be experimentally verified of course.
Warming as a result of increased heat. Not as a result of CO2.
Seems logical to me.
Cheers.
You haven’t bothered to calculate how much extra heat is produced from burning all that coal, have you.
C’mon, run a sanity check on your idea.
C’mon, run a sanity check on your idea.
Well, maybe some unicorn added additional insulation to the sky, thus stopping the loss of all waste heat?
The more significant feature of the long-term temperature record is the unprecedented rise at the end.
https://www.theguardian.com/environment/2016/aug/30/nasa-climate-change-warning-earth-temperature-warming
The more ignorant you are about paleoclimatology, the more unprecedented everything looks to you.
Warming events could be a feature of late interglacials. They have been detected at the Late-Eemian/Early-Weichselian transition:
Boettger, T., et al. (2009) “Instability of climate and vegetation dynamics in Central and Eastern Europe during the final stage of the Last Interglacial (Eemian, Mikulino) and Early Glaciation.” Quaternary International 207, 1, 137-144.
And at the end of the MIS19 interglacial, the closest astronomical analog to the Holocene, the warming events manifested as Antarctic Isotope Maxima:
Pol, K. et al. (2010) “New MIS 19 EPICA Dome C high resolution deuterium data: Hints for a problematic preservation of climate variability at sub-millennial scale in the “oldest ice”.” Earth & Planet Sci Lett 298, 95-103.
http://i1039.photobucket.com/albums/a475/Knownuthing/Figure%209_zpsl52xhrtm.png
No doubt those temperature bumps, that were accompanied by CO2 and CH4 bumps, looked very unprecedented at the time, but the logic of interglacial-glacial transition imposed itself in the end.
The forcing change causing interglacials is slow compared to what we are doing today, so it is like an accelerated rise in comparison. We also saw sea levels rise 3-4 m per century at the beginning of this interglacial, so we know what can happen under forcing changes. We can learn a lot from paleoclimate.
The pause-busting Science Express paper by Karl et. al. August, 2015 completely altered the temperature records to show there was “no hiatus at al.” NOAA has refused to be open and transparent in disclosing (permitted by law) FOIA requests for communications with key US government / EPA to determine how / why this work was done and whether government was involved in any way, possibly influencing the outcome to fit an administration agenda. Why? There is nothing to hide, right. No one can argue that climate change is a political and policy issue now. Debating about the last few months of temperature records will not answer the question, The data over the next five years should provide clarity amidst all this noise.
Karl et. al. adjustments to NASA GISS land + ocean temperature record:
http://imageshack.com/a/img923/9008/mc75dT.jpg
Maybe the reason NOAA balked at kneeling down to a thug with a fantasy is he was attempting intimidate their scientists… because the man is a thug with a fantasy. The house Republicans have done a sheer blizzard of bad investigations, with the deep snow being multiple 100s of thousands of emails that we had to pay somebody reread… a complete and total waste of taxpayer money… fed by their conspiratorial delusions.
Bring on the NOAA whistle blowers and the negative phase of the AMO and the stadium wave and the hiatus restoring 2016-2017 La Niña and the Iris and the clouds and the return of the Kimikaze. Pray… kneel down and pray at the abco2 altar.
“Thug with a fantasy?”
“Attempting to intimidate scientists?”
“Fed by their conspiratorial delusions?”
Why don’t you tell us about it, JCH?
Maybe you can use Mosher’s unicorn method to explain it all.
People get to fight back. Exxon/NOAA have all sorts of rights in a court action… most of which disappear in front of a congressional committee… which brings out the thug in some congressmen.
And it is just plain laughable how wrong you are on Mosher’s unicorns.
Maybe you can quote a billion lines of text and get your mind right.
JCH,
NOAA. That’s a great government agency you’re circling the wagons around:
JCH said:
Right. You’ve made it pretty clear on these threads that you prefer ignorance, or at least evidence that is meticulously sifted and cherry picked so that it confirms your preconceptions.
So.. because you don’t like a piece of science, you go after the scientists’ emails, rather than actually looking at the methodology of the work?
That ain’t science, it’s just harassment. A scientist would look at the work and its methodology to see if it’s sound. You judge a piece of work by its quality, nothing else.
Keep your eye on the ball.
Hi all, sorry I’m late to the party. My etch-a-sketch was acting up.
Danley Wolf. You are annoyed at NOAA dragging it’s feet on the FOIA request. OK. I retired from NOAA (NOS COOPS) after thirty years there. We insiders called it NOAA (No Organization At All). Why attribute to malice what can be explained by incompetence? I see where Karl has fled to AAAS ( as I recall) in a new job. The FOIA request went to NESDIS and those guys can’t find the information so are buying time. A common ploy.
JCH. Thanks for thinking NOAA has a collective spine. I was there for thirty years and never saw one. NOAA does a lot of good works and has a lot of smart, dedicated people and I’m proud to have been a part. (We the unwilling, led by the incompetent, doing the unnecessary, for the ungrateful, have done so much for so long with so little, that we are now capable of doing the impossible with nothing).Please add NOAA to your list of unsung heroes. Oh and politicians are sharks not thugs. Keep laughing.
Glenn Stehle. I agree that NOAA is a great agency. I still proudly wear my organizational ball cap and windbreaker when grocery shopping. The BP spill was a disaster. NOAA is not a disaster agency per se. As part the executive branch, when the White House says jump, ~ two million people ask “how high” on the way up. It doesn’t mean they get it right, is that malice? (I read your link) The USGS said “the White House made us do it” no spine there? Lehr said the Plume team did its best but was castigated anyway. The figure pointing continues. I share your annoyance with politicians (one breed of shark) and agree that individuals must be held accountable for their actions. “Just following orders” may be a reason, but it is not an excuse.
Benjamin Winchester. I agree, Scientists are people too and don’t like harassment any more than the rest of us. (The scientist is a frail sort. He wields neither sword nor pistol. So he must be handled gently. For his balls are made of crystal). But Danley Wolf’s comment was about politics. Of course the Congressional committee (politicians/sharks) will throw a scientist under the bus in a heartbeat. To them the science is just an excuse to get at other politicians (sharks). You are right, that’s not science. But sharks don’t care. Some guy in a lab coat with a theory, the agw faithful, the heretics, the unicorns, other sharks, the “Truth” are all canon fodder. Try not to be “blinded by science” when it comes to Sharknado.
Thanks for letting me share my opinions.
> Thanks for letting me share my opinions.
They don’t have much choice, John Maurice.
Thanks for it.
I’d rather say “Just following orders” is an excuse, not a reason.
Hi Willard. Sorry I was off on the new thread and didn’t see your note until I refreshed the page. This was DW’s comment and cross talk seems like cutting in. But you did raise three points to my comments so it’s only polite to respond. I know the blog accepts the opinions, that doesn’t mean the guys have to read them. The orders thing was more like a ‘Nuremberg’ allusion. McNutt (then Director of USGS) gets heat and points her finger at the Leader (another Germany thing, too much time watching AHC on cable). You decide. Our Man from Mexico, is that Glenn? He couldn’t justify Mexico following Napoleonic Code as opposed to English Common Law. A self-inflicted wound. He may not even get it. So not only do you make me ‘Internet Famous’ I get a ‘nom de blog’, I’m flattered, really I am. But you’re slipping, my real name? I would have suggested Moe (a nickname for Maurice) like in the ‘Three Stooges’. Fewer letters to type and way more annoying. Makes me sound like woo, woo, woo, yuk, yuk, yuk stupid. John Maurice, I always thought it made me sound French.
John Maurice,
I know you were referring to the Nuremberg defense – that’s why I told you it was more an excuse than a valid reason.
Yes, Our Man from Mexico is GlennS. It’s a wink toward Our Man in Boston. It alludes to his correspondent-type communications here. It’s also in retaliation to so much personal abuse he deserves a nickname like that.
So for now you’re still John Maurice for me. I can call you Jean-Maurice if you want to sound Frenchier.
Pingback: 1800 to 1900 Climate Synchronization | Accountable Chaos
Volcanic activity fits well with global temperature
http://berkeleyearth.org/wp-content/uploads/2015/02/decadal-with-forcing-small.png
https://images.sciencedaily.com/2012/07/120730142509_1_900x600.jpg
More or Less.
Looking at the uncertainty 1850 and early should give folks some pause (gave us pause ) basically you are down to stations in europe and the US
and so it’s hard to hang your hat on the those numbers ( especially the adjutments since the number of stations is small )
Still it is what it is.
To see if the data hung together we compared it to GCMs.. and I think a couple of proxy series.. and then wanted to see how it tracked volcanos..
hence that chart.
Steven Mosher | September 1, 2016 at 11:26 pm |
“To see if the data hung together we compared it to GCMs”
Rant on my part.
Too sad.
Always doing this.
Using models again to see if data is right??
The models should come from data, not the other way round.
If the models disagree, change the models.
It’s not that you just don’t want to get it.
You just don’t just don’t get it.
He’s right; you’re wrong.
OT
“The 2m Temperature (T2M) is a diagnosed variable (rather than a prognositc variable). T2M is calculated as a function of the surface radiating temperature, the lowest model atmosphere layer temperature, wind and roughness length. Over a melting surface T2M will be influenced by the latent heat sink. The +80N Figures show that in the CFS model, T2m over sea ice areas rarely goes above 2C and there is very little interannual variability from mid-June to mid-August due to the melt.
In the NOAA model T2M is a purely forecast variable, while in ECMWF it is an analyzed field (meaning that observations are assimilated into the field). However, over the Arctic Ocean (particularly regions above 80N), observations are sparse (and not all buoy data is used). The T2M analysis at ECMWF is an optimal interpolation with an approximate e-folding distance of 420km. The ECMWF background and observation errors are set to 1.5K and 2K respectively, meaning that adjustment is not dramatic and the model diagnosed background field is actually given more weight than the observations (remembering that the model represents a grid-box area while observations are at points).
In short, for T2M, the ECMWF data will be somewhat (rather marginally) influenced by observed data, for example from the Nth Pole Observatory. See the ECMWF data assimilation documentation for more details.
The +80N T2M images on this site are similar to those shown by the Danish Meteorological Institute (DMI) except that I use the NOAA model (vs. ECMWF) and area weighting is applied. All points at 80N and higher are used in the average (including land points, as with DMI).
The NOAA model T2M is heavily influenced by the latent heat sink during the melt. NOAA models have previously had noted issues over snow/ice.”
Latent heat sink and release is highly regulated on the global scale:
http://globalenergybudget.com/#D3
Regional and seasonal changes are constrained to keep the annual mean.
Steven
“The ECMWF background and observation errors are set to 1.5K and 2K respectively, meaning that adjustment is not dramatic and the model diagnosed background field is actually given more weight than the observations (remembering that the model represents a grid-box area while observations are at points).”
In fact, I think the weights are inversely proportional to the squares of the assigned errors, so the model values are weighted nearly twice as highly as observational values. Two questions re ECMWF:
1) Do the T2M point observations not affect updating of the future model state, rather than just being used with the model background field in an optimal interpolation analysis? And if so, can you say how they do so?
2) If they do affect the model state, and that affect is repeated every model time step, would that drag the model field considerably towards one in agreement with the observations?
I looked at this in relation to the ECMWF ORAS4 ocean reanalysis Balmaseda et al 2013), where over much of the depth range the model field is given a weighting of the order of 1000 times that of the observations. I wasn’t sure whether that meant the observations had a negligible effect in the long term as well as in the short term, or whether they would gradually drag the model state to one more compatible with the observations – and if so how one could establish the equilibrium outcome where the point observations and the model “hands off” state both stayed constant but different.
Nic
The main point here is that the surface energy budget (in the annual global mean) is unequivocally predetermined by, constrained to, the energy flows at the top of the atmosphere.
In the clear-sky part,
E(SRF, clear) = 2OLR(all) + 2 LWCRE = 2OLR(clear),
in the all-sky part,
E(SRF, all) = 2OLR(all) + LWCRE.
It is there in the more recent CERES EBAF Ed2.7, Ed 2.8 data, it is there in the latest published energy budget diagram of G. Stephens; within less than 1 W/m2.
Albedo and cloud cover – these are the regulators. Anything else are only internal ‘vibrations’ (natural oscillations etc.) around the prescribed energetic state.
Here are the data:
http://globalenergybudget.com/#CERES
niclewis said:
“Model values?”
Is that what is known as “scientific evidence,” as opposed to empirical evidence?
There was some discussion on this topic — Just what is “scientific evidence”? — on the last thread:
Empiricists would undoubtedly label it ‘turtles all the way down.’
https://transversalinflections.files.wordpress.com/2011/06/turtles-all-the-way-down.png
Very unstable, turtles should get bigger as they go down, it is out of perspective
Assessing the causes?
http://globalenergybudget.com/#Warming
From your link –
“Very approximately, the flow of the incoming solar radiative energy . . . ”
In other words, we can’t actually measure it, so our wild guess is as good as anyone else’s.
And Nature proceeds. The Earth continues to cool. Burning stuff creates enough heat that the cooling Earth is of little practical relevance.
Cheers.
I’ve heard about this new paper on our perfectly alarmist public radio last week. According to my prior little own dive into data and time series analysis problems this sounded completely ridiculous.
Now it turns out it’s some model based stuff. Even more ridiculous. Great if you can produce the data you analyse by yourself.
Thanks for this one.
Force a climate model with GHGs and you do not get selective warming of the N Hemisphere. Force it by turning up the AMOC and you do. If you think climate models are better than chicken guts then you have to argue the warming was from a change in ocean heat transport. The models say GHG forcing should slow the AMOC. The models say the warming was not due to GHGs.
somewhat misleading discussion on the CET / Global temperature association further up the thread.
For those who do understand that larger the area smaller short term variability (due to averaging) and vice-versa, the CET is as good proxy for the global temperature as one can get.
http://www.vukcevic.talktalk.net/CETGNH.gif
If you disagree you can always change the data.
Divergence…
Just because you are able to remember…
3.14159265…
does not make it more useful, at some point you must cut the hole.
Already done!!! Where have you been??
Scott
Is methane accounted for in the forcings?
Apparently Asian populations nearly more than doubled from 1700 to 1820 with continuing steady increase through to the end of century.
https://en.wikipedia.org/wiki/World_population_estimates#By_world_region
Looks like an increase in methane from 750.8 to 990.23 ppb from 1800 to 1920. Probably coincident with land use changes that might have had additional effects.
Yes, probably all human sourced methane. I am sure the changes in plant communities and increased insolation of northern latitudes had nothing to do with it.
Ironically, that is right about the time Coleogyne ramosissima moved up 150 meters in elevation. That’s pretty impressive for a plant with no legs eh?
The same population chart shows the collapse of population in South and Central America from 1500 and 1600 with probable reforestation and reduction in agriculture. It did not recover until 19th century.
Also, reduction of aerosols with land clearing.
Those are all a bunch of real good guesses too, James. Steven, even suggests that it may be true.
If you ever wanted to confirm the suggestibility of mankind?
http://heatst.com/world/fear-of-clowns-is-suddenly-sweeping-the-world/
Blame this all on, Mr. Larry David.
James. Your comment about changes in land use dredged up a question I’ve long had about land use ‘practices’ having a local impact. I know this is a Climate vs. Zone thing. To over simplify my point, my misses likes picture puzzles. I’ve noticed that the pieces go together and you get a big picture. Alone they don’t look like much. Conversely, you can start with a big picture and chop it into smaller pieces.
The point about use and practices is that both change in time and space. Abrams et al have the big picture and that’s fine but to neglect the changes of land use practices over time and space may not be as helpful as we might like. The big question is where do we go from here? I just hope we’re not putting the wrong lid on the pieces box.
I am not at sure the aerosols from trees are adequately accounted for.
http://thescienceexplorer.com/nature/discovery-trees-release-aerosols-alters-climate-change-predictions
You can link temporally the Medieval Warm Period to the rise of the Central American and South American civilizations that probably removed a lot of trees and the Little Ice Age to the regrowth of the trees that occurred when the civilizations collapsed due to disease.
You’re not having methane fun until you contemplate the extent of the demise of wild ruminant populations, like in North America.
https://www.nps.gov/features/yell/slidefile/mammals/bison/Images/02246.jpg
Did cows pop calves as fast lead exited rifles?
If there were as many wind turbines as there are rifles and shotguns maybe there would be no Avian species left to shoot?
DAN POST BELOW.
Sunspot number time-integral plus net of all ocean cycles plus effect of water vapor increase provides a 98% match to measurements 1895-2015 as shown at http://globalclimatedrivers2.blogspot.com which also shows a graph of water vapor (as Total Precipitable Water (TPW)) vs. time since it has been measured by satellite (1988). The graph was constructed using numerical data by NASA/RSS (link provided).
Increasing water vapor increases the probability of heavy rain and flooding.
Switching from coal to natural gas increases water vapor.
MY REPLY,
Exactly DAN, but these people will not accept data that runs counter to what they believe which in this case is AGW.
They are in denial and are basing all of their rants on this current warmth which is nothing more then the latest spike of warmth in global temperatures which have been going on since the Holocene Optimum came to an end around 8500 years ago.
Which I might add despite this spike and all the other previous spikes the overall trend in global temperatures since the Holocene Optimum has been a slow gradual downward trend.
This warmth which is in the process of ending by the way, is in no way unique or different from previous spikes of warmth.
The reason for the warmth is mainly extreme high solar activity which the data Dan has provided clearly shows.
Then again if the data does not support what you wish for ignore it which is what the AGW crowd does over an over again.
Worse yet when one views this current warm spell against past warm spells as shown by the historical climatic record this warm spell is a nothing event.
The magnitude of this warm spell being weak ,rate of temperature increase being weak and duration being weak when viewed against past periods of warmth.
Simple analyses [22] indicate that either an increase of approximately 186 meters in average cloud altitude or a decrease of average albedo from 0.3 to the very slightly reduced value of 0.2928 would account for all of the 20th century increase in AGT of 0.74 K. Because the cloud effects work together and part of the temperature change is due to ocean oscillation (low in 1901, 0.2114 higher in 2000), substantially less cloud change would suffice.
FROM THE ARTICLE DAN SENT IN THE PREVIOUS POST.
My point which is if prolonged solar activity changes the terrestrial items which determine albedo, cooling will be in the offing.
Assessing the causes of early industrial-era warming.
“Here in the U.S. we’ve had 8 once-in-500-years weather events in the last 12 months. Without the climate change that has *already* accumulated, that wouldn’t have happened.”
We seem to lack metrics other than dubious temperature records to determine if warming has occurred and is caused by human activity.
I have seen the above reputable comment made which gives a separate way of working out and confirming AGW at ant point of time in history. If accurate it may be one of the smoking guns we are looking for.
Simply put can we work out how many one in 500 year weather events occurred annually before 1830 and whether the incidence started to increase in the 1830’s to that of modern times. If so the hypothesis of Abrams et al can be validated.
Pingback: Weekly Climate and Energy News Roundup #239 | Watts Up With That?