
by Judith Curry
Estimates of the rate of sea level rise are diverging.
For background on the topic of sea level rise, see these previous posts:
- Slowing sea level rise
- PDO, ENSO and sea level rise
- 20th century mean global sea level rise
- Sea level rise discussion thread
New PNAS papers
The current buzz surrounding sea level rise is associated with two papers just published in PNAS:
Temperature driven global sea level variability in the Common Era by Kopp et al. of Rutgers University, published in PNAS.
Future sea level rise constrained by observations and long-term commitment by Mengel et al., published in PNAS
From the phys.org summary:
Global sea level rose faster in the 20th century than in any of the 27 previous centuries, according to a Rutgers University-led study published today.
Moreover, without global warming, global sea level would have risen by less than half the observed 20th century increase and might even have fallen.
Instead, global sea level rose by about 14 centimeters, or 5.5 inches, from 1900 to 2000. That’s a substantial increase, especially for vulnerable, low-lying coastal areas. “The 20th century rise was extraordinary in the context of the last three millennia – and the rise over the last two decades has been even faster,” said Robert Kopp, the lead author.
The study used a new statistical approach developed over the last two and a half years by Kopp, his postdoctoral associates Carling Hay and Eric Morrow, and Jerry Mitrovica, a professor at Harvard University.
Notably, the study found that global sea level declined by about 8 centimeters [3 inches] from 1000 to 1400, a period when the planet cooled by about 0.2 degrees Celsius [0.4 degrees Fahrenheit].
A statistical analysis can only be as good as the data it’s built upon. For this study, a team led by Andrew Kemp compiled a new database of geological sea-level indicators from marshes, coral atolls and archaeological sites that spanned the last 3,000 years.
The database included records from 24 locations around the world. The analysis also tapped 66 tide-gauge records from the last 300 years.
Kopp’s collaborators Klaus Bittermann and Stefan Rahmstorf at the Potsdam Institute for Climate Impact Research in Germany used the study’s global sea-level reconstruction to calculate how temperatures relate to the rate of sea-level change. Based on this relationship, the study found that, without global warming, 20th century global sea-level change would very likely have been between a decrease of 3 centimeters [1.2 inches] and a rise of 7 centimeters [2.8 inches].
A companion report finds that, without the global warming-induced component of sea-level rise, more than half of the 8,000 coastal nuisance floods observed at studied U.S. tide gauge sites since 1950 would not have occurred.
Stefan Rahmstorf has a RealClimate post discussing the new papers.
Additional media reports:
- NYTimes: Seas are rising at fastest rate in last 28 centuries
- SciAm: New data reveal stunning sea level rise
An interesting angle from the NYTimes article:
One of the authors of the new paper, Dr. Rahmstorf, had previously published estimates suggesting the sea could rise as much as five or six feet by 2100. But with the improved calculations from the new paper, his latest upper estimate is three to four feet.
That means Dr. Rahmstorf’s forecast is now more consistent with calculations issued in 2013 by the Intergovernmental Panel on Climate Change, a United Nations body that periodically reviews and summarizes climate research. That body found that continued high emissions might produce a rise in the sea of 1.7 to 3.2 feet over the 21st century.
Roger Pielke Jr tweets: Sans spin: Climate scientist known for being wrong admits error, reduces estimate of sea level rise by 50%. IPCC was right
NASA
Last August, NASA issued two new press releases: Warming Seas, Melting Ice Sheets and NASA Science Zeros in on Ocean Rise. How Much? How Soon? It seems that these press releases were triggered by a new interdisciplinary Sea Level Change Team. Excerpts:
For thousands of years, sea level has remained relatively stable and human communities have settled along the planet’s coastlines. But now Earth’s seas are rising. Globally, sea level has risen about eight inches since the beginning of the 20th century and more than two inches in the last 20 years alone.
All signs suggest that this rise is accelerating.
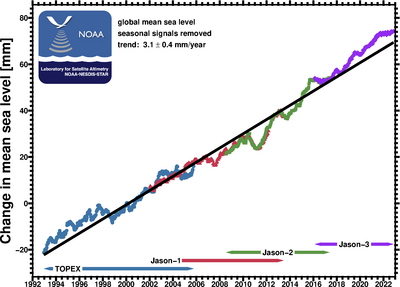
NASA has been recording the height of the ocean surface from space since 1992. That year, NASA and the French space agency, CNES, launched the first of a series of spaceborne altimeters that have been making continuous measurements ever since. The first instrument, Topex/Poseidon, and its successors, Jason-1 and -2, have recorded about 2.9 inches (7.4 centimeters) of rise in sea level averaged over the globe.
Ok, some simple arithmetic. 7.4 cm over a period of 23 years equals 3.2 mm/yr. No surprise – this is the number cited by the AR5 for satellite based sea level rise estimates.
“Given what we know now about how the ocean expands as it warms and how ice sheets and glaciers are adding water to the seas, it’s pretty certain we are locked into at least 3 feet of sea level rise, and probably more,” said Steve Nerem of the University of Colorado, Boulder, and lead of the Sea Level Change Team. “But we don’t know whether it will happen within a century or somewhat longer.”
Here is the last sea level rise plot from the NASA altimeters:
http://www.star.nesdis.noaa.gov/sod/lsa/SeaLevelRise/slr/slr_sla_gbl_free_txj1j2_90_400.png
IPCC AR5
I don’t really see anything new here, but the new PNAS papers and the NASA press release serve to highlight an issue that has been nagging me.
The IPCC AR5 includes the following figure of sea level rise over the last century (Figure 3.14)
https://judithcurry.com/wp-content/uploads/2014/01/sea-level.jpg
Figure 3.14 18-year trends of global mean sea level rise estimated at 1-year intervals. The time is the start date of the 18-year period, and the shading represents the 90% confidence. The estimate from satellite altimetry is also given, with the 90% confidence given as an error bar. [AR5 WGI Figure 3.14]
Global sea level has been rising for the past several thousand years, owing to the retreat of glaciers from the last ice age. The key issue is whether the rate of sea level rise is accelerating owing to anthropogenic global warming. It is seen from the figure above that the rate of sea level rise during 1930-1950 was comparable to, if not larger than, the value in recent years. The challenges to determining global sea level rise, particularly over the past 100 or 1000 years, are substantial.
Somehow, the IPCC AR5 drew this conclusion, in context of Figure 3.14:
“Since the early 1970’s, glacier mass loss and ocean thermal expansion from warming together explain about 75% of the observed global sea level rise (high confidence)”
Go figure.
Other recent papers
Other recent papers that I’ve collected on the topic:
Modeling sea-level change using errors-in-variable integrated Gaussian processes, by Cahill et al. (published in Journal of Applied Statistics)
“Our analysis of the global tide-gauge record shows that the rate of GMSL rise increased (accelerated) continuously from 1.13 mm/yr in 1880 AD to 1.92 mm/yr in 2009 AD.” While Cahill et all find an acceleration in sea level rise over the past century, their inferred rate of current sea level rise (< 2 mm/yr) is significantly lower than the value of 3.2 mm/yr derived from satellite altimetry measurements.
Robust reef growth in Indian Ocean kept up with sea level rise > 20X faster in past [link] …
New paper shows sea levels dropped along west coast of North & South America from 1993-2013 [link] …
Coastal planning should be based on proven sea level data, by Parker and Ollier
Highlights:
- The network of tide gauges provides the only information of value for costal planning.
- The worldwide naïve average of sea level is +0.24 mm/year with no acceleration.
- The climate models have crucial flaws making them useless.
- Planning schemes must only reflect the proven local and global historical data.
JC reflections
So, what to make of all this?
Sea level rise is the main ‘danger’ from human caused climate change (any increase in extreme weather events is hypothesized rather demonstrated using historical data, with possible exception of heat waves in a few regions).
At a presentation that I made earlier this year to CEOs of small electric cooperatives, one participant was surprised by what I had to say about sea level rise – he hadn’t realized that there had been sea level rise prior to 1950. I.e., like ‘climate change’, all sea level rise has been sold as caused by humans.
Sea level has overall been rising for thousands of years; however, as the Kopp et al. paper points out, there have been century scale periods of lowering sea level in the recent millennia. It is not clear from my cursory reading as to whether meaningful decadal and multi-decadal variations in sea level can be discerned from their data.
The key issue is whether the sea level rise during the past 50 years reflect an acceleration in sea level rise. The IPCC figure 3.14 suggests that there is no acceleration, given the large rates of sea level rise in the first half of the 20th century. Until we have an understanding of variations in decadal and multi-decadal sea level rise, we can’t make a convincing argument as to acceleration.
With regards to coastal planning, I absolutely agree with the paper linked to above. Locations where sea level rise is a problem invariably have rates of sea level rise that are much greater than even the altimeter values of 3.2 mm/yr are caused by local geologic processes, land use, and or coastal/river engineering. Global values of sea level rise have essentially no use in coastal planning; rather they seem mainly relevant in terms of motivating ‘action’ on carbon mitigation policy.
Sea level will continue to rise, no matter what we do about CO2 emissions. We need creative solutions – one of my favorites remains the garbage solution.

Reblogged this on Climate Collections and commented:
A change in rate with respect to time is an acceleration and exhibits an inflection point. With regard to sea levels and rates of rise, there is no inflection point, ergo, no acceleration.
Yes. The warmunist claim is not the rate of rise, but rather acceration in that rate. It is not evident in either reasonably geostationary long duration tide guages, nor in the satellite altimetry. SLR is a failed warmunist prediction.
The Kopp paper is very suspect, but its warmunistPR confounds century SLR rates with AGW associated acceleration after ~1975.
The Rahmstorf paper combines of models (GCM and statistical) to re-estimate AGW SLR. It is actually a climb down from his previous 1 meter plus. But still more than twice what observation from good long record tide guages presently projects.
‘Kopp’s collaborator’ Stefan Rahmsorf… hmm … ref,
Steve McIntyre, Reducto ad mannium, 25/03/2015.
‘Rahmstorf and Mann’s results are not based on proxies
for Atlantic current velocity, but on a network consisting
of contaminated Tiljander sediments (upside-down or not),
Graybill’s stripbark bristlecone chronologies, Briffa MXD
series truncated to hide-the-decline and hundreds of
nondescript tree ring series statistically indistinguishable
from white noise. In other words, they used the same
much-criticized proxy network as Mann et al 2008-9. It’s
hard to understand why anyone would seriously believe
(let alone publish in peer reviewed literature) that
Atlantic ocean currents could be reconstructed by such
dreck, but Rahmstorf et al 2015 stands as evidence to
the contrary.’
Hifast,
Best retake calculus
Say sea level = x squared
x is time
The first derivative = 2*x which is increasing with time or accelerating at a constant rate or the second derivative acceleration = 2 and is constant.
no inflection point
BD, maybe you should. Rate of change is first derivative of time change function f(x sub t). Acceleration is second derivative rate of change in rate of change. Graphed traditionally by a showing a nonlinear simple rate of change curve. If that rate of change curve is linear, tehn there is no change in the rate of change. As both reasonably geostationary tide guages and sat alt both show. Warmunist fail.
You also flunk basic calculus understanding. Please go get some remedial education rather than displaying your biased ignorance here.
“If that rate of change curve is linear, tehn there is no change in the rate of change”
The rate of change of the function y=x squared is y’=2x, which is linear, but not constant.
Acceleration is a constant rate of change in the rate of change.
Get yourself to a basic calculus text, stat!
Or better yet, go for a drive in an automobile and punch it.
Hifast,
Isn’t this the inflection point that the authors of the Kopp paper are claiming?
The red arrows are mine. I put them in to indicate the change in inflection.
It is from the post published on the Real Climate blog (see link above in JC’s post) and is written by one of the authors of the Kopp study.
Shouldn’t the debate be about:
1) Whether one believes the empirical data presented, and
2) If one does believe the empirical data, what caused the sudden rise in the rate of sea level increase in the 20th century?
A lot of the debates on this forum resemble the 13th- through 16th-century debates between the scholastics and the nominalists, which Erasmus called “higher lunacy,” or the intramural conflicts between the scholastics which have been characterised as being fought over “how many angels can dance on the head of a pin?”
http://imgur.com/daDpUlG
Thanks for a rational comment without the usual ad homs between warmists and skeptics. I like your chart. As a skeptic’s skeptic I’m always looking for evidence that will change my opinion. Evidence and reason beat word-based arguments every time.
Hockey Stick rev. 2.0
These guys don’t give up do they? LOL
“The key issue is whether the sea level rise during the past 50 years reflect an acceleration in sea level rise. The IPCC figure 3.14 suggests that there is no acceleration, given the large rates of sea level rise in the first half of the 20th century. Until we have an understanding of variations in decadal and multi-decadal sea level rise, we can’t make a convincing argument as to acceleration.” JC
If that is true then there is no need for further comment on the issue – time to move on.
jevrejeva 2014 fig.8
http://climategrog.files.wordpress.com/2014/05/jevrejeva_2014_fig8.png
paper : http://nora.nerc.ac.uk/504181/
Jevrejeva is by far one of the most credible workers in this field IMO. By no means a “climate sceptic”, she does a good honest attempt at getting the best from tide gauge data. My major criticism is not providing enough information to readily reproduce and validate her methods ( and rather misleading statements about “acceleration” in the abstract and conclusions of the paper) .
Another Jevrejeva graph, accel from 1850-1880, pretty steady since, slightly slowing. Certainly no AGW signal.
http://climategrog.files.wordpress.com/2014/04/jevrejavegmsl.png
http://www.realclimate.org/images//haysl21.jpg
http://www.realclimate.org/images//haysl13.jpg
Excellent summary, thank you Judith.
One issue that may be relevant. If you consider very long term data (Exxon/Hallam curves) current sea level conditions are near to historical lows. Isn’t it likely to rise long term?
The Rutgers paper from Kopp is paywalled. The Phys.org article on it is available, as is the abstract. Phys.org quotes Kopp as saying the new 28 century proxy reconstruction comes from fieldwork at 24 sites including coral reefs, saltwater marshes, and archeological sites. The results were produced using “new statistical methods”. A red flag. New statistical methods produce a SLR hockey stick. The last time we saw this movie, it was Mann’s new statistical methods (centered PCA plus the Nature trick to ‘hide the decline’ producing a temperature hockey stick. We should defer to McIntyre on the statistics.
But there is something deeply troubling about Kopps new work independent of statistical methodology. Phys.org quotes him as saying his new paleoclimate recomstruction shows how sensitive SLR rise is to temperature. They found the period 1000-1400 had a marked slowdown in SLR associated with a 0.2C decline in global temps. 1. It is beyond credulity that paleoproxies from 24 sites can estimate temperature to 0.2C. 2. The time interval corresponds with the MWP in which there was warming shown by historical (e.g. Alpine tree lines, glacial retreat in Alaska…), archeological (e.g. Vikings in Greenland), and physical evidence (e.g. ikaite formation on the Antarctic penninsula). Mann wrongly erased the MWP. Kopp went further and inverted it. Doesn’t pass common sense peer review.
Suspect the paper’sproxies and the statistics are gravely flawed.
At long duration (100-150 year) reasonably geostationary (from geology and/or differential GPS) tide guages, of which there are globally 60-80 in the NOAA inventory, there has been no change in the rate of SLR in from a century to a century and a half. There is simply no anthropogenic signal.
ristvan,
(1) “The Rutgers paper from Kopp is paywalled.”
It was open for me: http://www.pnas.org/content/early/2016/02/17/1517056113.full.pdf
(2) “It is beyond credulity that paleoproxies from 24 sites can estimate temperature to 0.2C.”
That was my reaction as well. How much of this precision in Kopp is credible for such distant periods in the past, especially given the limitations in the data that they mention?
(3) Both PNAS papers rely on the speculative and unlikely assumptions of RCP8.5 to generate their high-end forecasts of sea level rise.
One key assumption ofRCP8.5 is that coal will become the dominant fuel of the late 21st century. Perhaps so, but coal production has hit hard times in the here and now.
.
So presumably that leave many that do NOT have sub-centennial temporal resolution and/or decimeter-scale vertical resolution.
So how the hell can those results give a meaningful indication when compared to change over the 20th c. : they have neither the temporal not the height resolution to do so.
Adding a muddy mix of disparate proxies does not improve that situation, it probably makes it worse. So they have 2,900 year of fudgy mix of low resolution data that would not tell them even if there was comparable sea level change in millennial record.
Someone familiar with Mathlab ought to plot up some of these proxies.
Editor, thanks for that link. I was searching as soon as this hit, and found nothing. Now will dive into the 24 new proxy sites and the new statistics although in the end think SM at Climate Audit will do a better stats job. Will post downstream maybe tomorrow.
Well, you got me. Worse than I imagined. Relied on many previous debunked Marcott proxies. Not 24 new ones. Yup, RCP 8.5 is totally unrealistic. And res is low, a known Marcott problem. And so on.
Ristvan,
If I got this right, both papers’ forecasts were in the consensus range.
I do not see why the fuss, except as today’s fear barrage.
That’s correct, Fabius- minus the spin, all Pielke is saying is the IPCC is right. albeit its less pessimistic scenarios yield ~half-centimeter a year rises in geoidally averaged sea level, which is the current reality.
Russell,
Thanks for the confirmation!
That’s correct, Fabius- minus the spin, all Pielke is saying is the IPCC is right. albeit its less pessimistic scenarios yield ~half-centimeter a year rises in geoidally averaged sea level, which is the current reality.
If by half-centimeter, you mean 0.29 centimeters ( see above trend for the period satellite measurements ), then you are correct.
But attributing that to strictly to ‘global warming’ would indicate powers of omniscience that are typical of religious movements.
The tide gauge data, such as it is, indicates there was a background rate before any of the 20th century warming.
Further, one would expect acceleration because of the acceleration of ground water use net of dam capture.
Further increases in contributions may lie in the increasingly developed land surface area which sheds as runoff some water which would other wise seep to aquafiers.
Known by anyone taking high school ~ before 1990. So clearly, alarmists’ use of the word acceleration is a rhetorical cattle prod to nudge or in this case scare people. Similar (but different) to calling someone a flat earther and evoking the phrase “right minded or thinking people will agree (with me) that implying anyone who disagrees is a stupid ox not worthy of expressing an opinion.
Given that the EPA’s rules to regulate the CO2 emissions from existing power plants were recently stayed by the Supreme Court and are pending before the DC District court, I fully expect many headlines about the horrible impacts of global warming for the next several years. The EPA’s rules go way beyond what is legal. Environmentalists know these rules will only survive judicial review if the judges ruling on them are scared. Hence, lots of alarmist pseudoscience.
The judges are more concerned with the large legal issues. It is the research funding Executive Agencies, especially NSF and DOE, that are pumping this scary stuff out. The funding, research and publication cycle is far too long to be responding to the CPP legal drama.
“Sea level has overall been rising for thousands of years”
Sea level rose about 1 meter in the 5000 years before the industrial era, an average of 0.2 mm/yr:
https://en.wikipedia.org/wiki/Past_sea_level#/media/File:Post-Glacial_Sea_Level.png
Current rate of rise is now 17 times that. And accelerating.
You are comparing an average over 5000y to an average over 150y.
Temperatures can change 15C in a few hours but have averaged 0.7C over the last century. Such comparisons have no meaning.
“And accelerating.” According to who?
You are comparing local temperature change of 15C in a few hours to a global change of 0.7 C over a century, at least Appell is comparing the same thing over different time periods, so he’s way ahead of you.
I can’t remember when Colorado’s sea level trend changed from 3.2 to 3.3, but I’m watching for the change to 3.4, because that will be an evidence in favor of acceleration.
http://sealevel.colorado.edu/
It was not long ago. A month or so, roughly.
Their data ends before the end of 2015. Imagine the number after December, January and February are in the pie.
Nobody, that matters, says it’s not accelerating, including Jevrejeva. The Jevrejeva rate number is an outlier, and she used a weighting others have criticized.
3.2mm ; 3.3mm or 3.4 mm. So what?
Why don’t you point out what that gets us by the end of the century?
Nobody, that matters, says it’s not accelerating
Chart indicates deceleration.
El Nino’s get you very excited, but it appears to be ending:
http://www.star.nesdis.noaa.gov/sod/lsa/SeaLevelRise/slr/slr_sla_gbl_free_txj1j2_90_400.png
TE – hilarious. You picked the most out-of-date graph. A couple of months ago the others showed the hook, but subsequent updates blew the hook to kingdom come.
Why don’t you point out what that gets us by the end of the century?
Okay, get in a circle and take your 3.4 times 84…
A couple of months ago the others showed the hook, but subsequent updates blew the hook to kingdom come.
Erroneously so?
Awful lot of blue shades:
http://www.ospo.noaa.gov/data/sst/anomaly/2016/anomnight.2.22.2016.gif
Say goodbye to El Nino
Do you honestly think it would bother me if an El Nino ends?
It not like it’s the first one to do that. LMAO.
ENSOs obviously influence little wriggles in the SLR chart, just don’t get too excited when they come and go.
That’s the strong radiative restoring effect in action, which is why natural internal variations in the global mean surface temperature are short-lived even when they are large.
The hook was likely caused by the relaxation in the PDO. And then the ONI numbers shot up and the hook disappeared and was replaced with an upward trend. None of the graphs is updated to the end of 2015, which will send the trend higher when it is updated to the end, and the first two months of 2016 will send the trend even higher, and, since 2016 is likely to be another warmest year, or close to it…
There are lots of EL Nino events along this series, and so many of them look like 15-16:
http://www.aviso.altimetry.fr/fileadmin/images/data/Products/indic/msl/MSL_Serie_MERGED_Global_IB_RWT_GIA_Adjust.png
ENSOs obviously influence little wriggles in the SLR chart, just don’t get too excited when they come and go.
Oh wise one, you men just like the PAUSE?
bobd: thanks for that comment. It gave me the idea to looking at it like compound interest, a 2% interest rate compounded annually seems to fit from now back to 1980. Extending that out to 2100 gives us another 2.4-feet. This assumes a smooth accrual rather than a long-term average interest rate.
Because of weather noise, we will need at least another 25-years of data before we can judge if the interest rate is accelerating, assuming we don’t have a catastrophic ice sheet failure, then it won’t take a climate scientist to tell you how far up the surge goes (with apologies to Bob Dylan).
A 3% compound rate from now gets us to 4-feet in 2100
A 4% compound rate from now gets us to 7-feet in 2100
Assuming we are at 3.3mm/yr now, at 2% interest, we will be at 4.4mm/yr in 15-years. At the 4% compound rate (SLR disaster), we will be at 5.9mm/yr. So 15-years from now, we will likely be able to determine if we will be heading towards disaster with major adaptation/abandonment or if we are at just the nasty problem stage with significant adaptation.
That chart appears to end in November.
Do you have one that is up to date?
None of them, as I have said, is updated to the end of 2015, so AVISO still has to add December.
A month ago this one had the hook; no it’s gone, and… it used to be 4.24mm pyr, and now, well, you guys are losing:
http://www.aviso.altimetry.fr/fileadmin/images/data/Products/indic/msl/MSL_Serie_J2_Global_IB_RWT_GIA_Adjust.png
JCH: Do you honestly think it would bother me if an El Nino ends?
What bothers you is not what is at issue. What is the implication of recent global ocean cooling to recent global sea level rise? It looks like TE’s point about recent non-accleration (in the positive direction) in sea level rise is reasonable.
This one:
https://i1.wp.com/www.aviso.altimetry.fr/fileadmin/images/data/Products/indic/msl/MSL_Serie_J2_Global_IB_RWT_GIA_Adjust.png
appears to only go through October – any thing more recent?
“Temperatures can change 15C in a few hours but have averaged 0.7C over the last century.”
No, the global mean temperature can’t change 15 C in a few hours.
“And accelerating.” According to who?
Several papers. When I fit the AVISO sea level data to a 2nd-order polynomial, I find an acceleration of 0.024 mm/yr2. The acceleration itself is also changing rapidly — 5 years ago it was -0.043 mm/yr2.
Those papers:
“A 20th century acceleration in global sea-level rise,” John A. Church and Neil J. White, Geophysical Research Letters, v. 33, L01602, doi:10.1029/2005GL024826, 2006GRL (2006).
http://onlinelibrary.wiley.com/doi/10.1029/2005GL024826
“Global and regional sea level change during the 20th century,” Manfred Wenzel and Jens Schröter, JGR-Oceans, (7 Nov 2014) doi:10.1002/2014JC009900.
http://onlinelibrary.wiley.com/doi/10.1002/2014JC009900/abstract?campaign=woletoc
“Sea-Level Rise from the Late 19th to the Early 21st Century,” John A. Church and Neil J. White, Surveys in Geophysics, September 2011, Volume 32, Issue 4-5, pp 585-602, doi: 10.1007/s10712-011-9119-1.
http://link.springer.com/article/10.1007%2Fs10712-011-9119-1
matthewrmarler wrote:
“What is the implication of recent global ocean cooling to recent global sea level rise?”
What recent global ocean cooling? It certainly doesn’t appear in these data:
http://www.nodc.noaa.gov/OC5/3M_HEAT_CONTENT/basin_data.html
These satellite charts keeping getting used for sea level rise claims.
They should be corrected.
The GIA adjustment is 0.3 mm, it is claimed it could be as high as 0.4 mm.
This implies a 0.6 mm upward land movement.
Net total change is more than 0.9 cm (remember the 0.3 is lowball). 0.3 mm/y explicitly added GIA and 0.6 mm/y ignored land rise.
So. 3.3 mm/y is really 2.4 mm/y or less.
The satellite estimate assumptions should be examined for other fallacies to bring the satellite estimate in-line with more rational estimates of sea level rise.
The sinking of the bottom of the ocean is irrelevant to measuring where the top surface surface is. The pre-satellite measures ignored the bottom of the ocean and they would have been laughed out of town if they tried to include it as an adjustment. We didn’t care about the bottom of the ocean when measuring sea level rise with tidal gauges and still don’t.
The satellite people should be laughed out of town until they get their act together.
There is a three-pronged destructive paradox in play, here; the political pressure is to overestimate the rate, the scientific error is to either overestimate or underestimate, and the social danger is in overestimating the rate, for the money wasted preventing exaggerated heating, and for the danger in missing a sign of future cooling, perhaps dramatic.
The danger of climate temperature change is all to the downside, but our attention has been distracted to the warm side. A recipe for error, at whatever oven setting.
=============
The clanging, clashing, perhaps clinching, can be twain; the political pressure and the social danger are at desperate odds.
===========================
The early settlers walked to Tasmania. Their route is now under about 50m of water.
Specify
redbbs,
Tasmania – an island off the coast of Australia
walking – a form of transportation where one moves by placing one foot in front of the other.
50m – a distance or depth
water – that wet stuff you find in the ocean (which happens to separate Tasmania from Australian mainland).
And of course David “knows” this because of his trusty sea level rise gauge which magically reads into the past.
I know this because of the papers cited above, and the data:
AVISO sea level: ftp://ftp.aviso.oceanobs.com/pub/oceano/AVISO/indicators/msl/MSL_Serie_MERGED_Global_IB_RWT_GIA_Adjust.txt
CU sea level: http://sealevel.colorado.edu
Why believe David Appell and NOAA when PA | February 24, 2016 at 9:13 am | tells us :
“These satellite charts … should be corrected…
The satellite estimate assumptions should be examined for other fallacies to bring the satellite estimate in-line with more rational estimates of sea level rise.”
Scientists at Liberty University and CFACT agree that constant adjustment of the gravitational constant is the best way to keep squirrelly comuntardista warmists like the Oceanographer of the Navy from denying Genesis 9 :11 “Never again will there be a flood that destroys the earth.”
Sea level satellites good, temperature satellites bad. Beasts of Climate.
====================
You base your conclusion on what study?
Sea level was 5 – 7 meters higher in the last (Eemian) interglacial. In fact in all the previous interglacials sea level reached 5 – 7 meters higher. Why should the current one (Holocene) be any different?
All Interglacials? Wrong!
Why should Holocene be different? Uh, because all interglacials are different and unique. This isn’t a simple computer built by a frat-boy in a dorm room, it’s a man-sized problem so you should keep a cork in it while the grownups are talking.
http://d29qn7q9z0j1p6.cloudfront.net/content/roypta/371/2001/20120294/F2.large.jpg
Turbulent Eddie wrote:
“Chart indicates deceleration.”
You’ll have to prove that. Because both the AVISO data and the University of Colorado’s show a positive acceleration even over just the satellite era.
You’ll have to prove that. Because both the AVISO data and the University of Colorado’s show a positive acceleration even over just the satellite era.
Context: sea levels have been falling as El Nino has subsided.
The TOPEX/Jason1/Jason2 trend is 2.9mm/year.
The tide gauge data, such as it is, indicates that the background rate is not zero.
Further, groundwater use is accelerating – one would expect sea level rise to accelerate as a result.
Further still, humans build lots of impermeable surfaces. That means that some rainfall that would otherwise seep into groundwater is now running off into the oceans instead.
Sea level is rising, but not very much and exaggerating it represents confirming the bias of expectation.
JCH wrote:
“None of the graphs is updated to the end of 2015.”
The AVISO data now extends to 12/4/15.
Entry page:
http://www.aviso.altimetry.fr/en/data/products/ocean-indicators-products/actualitesindicateurs-des-oceansniveau-moyen-des-mersindexhtml.html
David, that shows SLR accelerating to 5mm/year over the last 5-years
And it is going to show negative sea level rise for the next three years.
By 2020 the net sea level for the 10s will be 33 mm/decade.
Perhaps, PA. That is very likely possible. However, when you measure the peak to peak and trough to trough slopes, you will still show a higher rate than 15-years ago.
I bet 100 thousand Venezuela Bolivars sea level will drop sometime during the next 24 months.
ristvan… peer review in climate science now is essentially a rubber stamp of anything that suggest man-made global warming is behind any problem on earth. None of us will be around at the end of this century to see what the sea level actually is then, but my guess is that my children’s children’s children will be playing on the same beaches, in the same spots, that I did when I was a kid back in the 50’s.
So it’s still safe for me to go to Avila beach in California and not have to worry that I’ll get swamped?
I recently visited the same beaches I swam at forty years ago. While I’m sure there is some SLR, it was kinda reassuring to see the same beach houses, piers and pylons, just about the same as I recalled from my youth. It’s a trip everyone should make.
DA, I agree. Only pal review can explain PNAS publication of a paper that not just erases, but cools the MWP. Especially after McIntyre eviscerated both Mann’s proxies and his statistics.
Own a place directly on the beach in Fort Lauderdale since 2000, and expect some day my grandkids can inherit it still dry. Voting on warmunism with my feet, so to speak.
Yes, at first look this seems to be MSL version of Mann’s hockey stick. One big plus is that they provide full source code for their method which deserves acknowledgement.
Even without digging through it , we see the usual problems. Grafting incompatible data: recent tide gauges and sparse proxy data on to the same line of a graph. Proxy mangling. Throw enough proxies into a bucket and stir is good way to reduce the variability.
To then start making comments about comparative variability in different periods from different kinds of data is without merit, worse it is very misleading. This is the Marcott game all over again.
Sure looks like it. I did a detailed Marcott scientific misconduct dissection in a previous guest post here a couple of years ago. Your turn.
The lunatics are in control of the insane asylum so to speak? Dave, if amazes how confident you guys are in making such broad generalizations. Let’s just throw uncertainty out the door in this case.
The lack of acceleration both in sea level rise and temperature rise after the tremendous amount of CO2 emissions of the last decades is a very strong argument against a high climate sensitivity. Simply said the climate is not responding very much to all the CO2 we have produced.
The local sea level is the only important measure relative to local planning.
Could somebody explain why some says that thermal expansion would not affect coastal areas, because the depth is low. Ole Humlum has mentioned it as others have, but i can’t see how that could be right.
Modern self-proclaimed Western climate scientists with their fixation on the twin myths of the single-mechanism causation (CO2 produced by humanity) – and, uniformitarianism – the idea that an accurate average temperature of the globe can be determined by adding up the disparate thermometer readings from a multiplicity of grids comprising the world and then feeding this data into mathematical climate models – have turned the information age into the regression age. Dr. Tim Ball says the computer models only, “created an illusion of possible resolution, with the claim that the only limit was computer size and power.
Poor Daniel Botkin. Time has passed him by. January 2016 was Earth’s warmest year on record.
I did not know January was a year. In any case the only reliable records say 2015 was not that warm. Botkin is right.
“I did not know January was a year.”
Climate Science doesn’t really need words to mean things people understand.
It’s kind of like Global being local. And Climate being weather.
Post Definitional Science. Ask Mosher about it.
Andrew
That’s classic ! Just about sums up the public perception of “the science”.
He meant month… everybody makes mistakes. And the January record is not likely to survive more than 29 days.
“Even though our activities are adding carbon dioxide rapidly to the atmosphere,” says Botkin, “it seems to be having no effect right now on Earth’s average surface and lower atmosphere temperature.”
And max makes more of them than most.
So cut him some slack. Better yet, ignore him.
My mistake. Of course January is a month, not a year. But Daniel Botkin errs if Waggie is correct in quoting him as saying “Earth’s surface temperature has not changed for the past 19 years, and 16-26 years for the lower atmosphere … ” Obviously, temperature changes every year. If, however, he meant average annual temperature in 2015 is the same as it was in 1996, or temperature was the same in January 1997 and January 2016, which metric is he using?
We did. You lose.
ristvan, I don’t know what “we did” means, but I do know none of your “we’s” have attempted to answer my question about which metric Daniel Botkin is using.
SLR is posed as a danger, but even then it is questionable.
A 1 meter rise today would be catastrophic because present individuals and present property would be at risk.
A 1 meter rise over the next 300 years would be irrelevant because no individual lives for 300 years – individuals will change to whatever conditions exist.
New York, Miami, and many other places will be irrelevant in 300 years, a net benefit of rising atmospheric CO2. Well, I don’t know about that.
Crap , look at what has happened in human history in the last 300y. We will not even recognise society , even if it still exists by then.
Why the hell are worrying about a few feet of sea level rise.
If this was a real problem we would not need to project uncertain trends hundreds or years beyond the data to make it sound like a problem.
irrelevant in 300 years? – let’s see – “the median age of an owner-occupied home in the United States was 35 years old as of the 2011 survey” – yes you are right: irrelevant in 300 years.
http://eyeonhousing.org/2014/02/the-age-of-the-housing-stock-by-state/
The oldest median age is District of Columbia, at 61 years. Still irrelevant against 300 years. And the article goes on to point out that “The age of the housing stock is an important metric as older homes are less energy-efficient than new construction and will require remodeling or replacement in the years ahead.“. If houses need remodelling or replacing after just a few decades, it’s pretty pointless looking 300 years ahead and worrying about housing. The median house will be replaced maybe 5 times in that period, for all sorts of reasons other than sea level. Houses will come and go as industries come and go, as people come and go. Detroit, for example, had a population of 1,849,568 in 1950. In 2000 it was down to 951,270, and I suspect it is even lower now. That represents an awful lot of houses that aren’t needed any more. Nothing to do with sea level.
Max, my accidental permenant legal residence is Fort Lauderdale. Next county over from Miami. Not stupid enough to have built on neap tide flood plains like small parts of Miami Beach. Venice Italy might well be irrelavant in another 300 years. Heck, it has been sinking for 600 already. Miami, think not. All those condo skyscrapers post Andrew have massive foundations sunk into ~30 meter down coral ‘bedrock’. Geophysically about stationary. And NOBODY builds ground level only 0.5 meters above mean high tide. In fact, in Fort Lauderdale, you have to build ground floor above predicted hurricane storm surge. Like several feet up.
Like Auberge, down the street about a half mile, where footings are presently being placed, the first phase is sold out, and the minimum price for an on the beach ocean view one bedroom condo is over $1.5 million. Average sold price per unit now over $2 million and in shocking Miami territory. Google the project. People voting wallets say you are wrong.
Looks like some climate contrarians here couldn’t care less about historical preservation. I guess that’s consistent with them not caring in general about what happens after they expire, and could explain their lack of concern about man-made climate change. Attacks on climate science, however, suggest selfish motivation gnaws at the conscience.
max10k,
My ancestors 300 years ago were farmers in Northamptonshire, leading a life that today we would class as grinding poverty – although for their day they were doing OK. It saddens me that anyone really thinks that they should have been concerning themselves with my future welfare and standard of living.
Jonathan, if it saddens you to think your ancestors should have been concerning themselves with your future welfare, stop thinking about it.
Whether they should have been concerned or not, it’s doubtful they were. Back in those days, people didn’t think much beyond the weekend.
I’m glad to see you have knowledge of your ancestors. I think they would have been pleased to know that after 300 years someone was thinking about them.
From max:
“Looks like some climate contrarians here couldn’t care less about historical preservation.”
That smell is max once again pulling nonsense out hind end. Building and zoning codes max, learn about them. They are what control historic preservation.
One of my brothers has a house on the beach in SC. Built in the 1930’s. He is very limited in how much remodeling he can do by local ordinances. Over a certain level the new code requirements for height of structure above ground level come into play. He would have to tear the entire house down and rebuild. Which is what is happening every day. Has nothing to do with one’s view on climate change.
Historical preservation in its broadest sense, including preventing sea rise that would destroy treasured architecture.
max,
My undergrad degree is in history. It’s my first love. You don’t have to take my word, but
1) there are far more pressing issues impacting our historical heritage than sea level rise.
2) worrying about preservation 300 years from now seems to fall under the “Useful as tits on a bull” category.
Looks like some climate contrarians here couldn’t care less about historical preservation.
It that all you’ve got now?
Historical preservation of junk is not wise.
I live in an old home. But this probably wasn’t a wise purchase because, as economist Robert Shiller identified, homes lose value, and at some point, it costs more to replace and repair than a new home. That’s the reason, as some here pointed out, that the average age of a US home is 35 years.
JC: “Sea level has overall been rising for thousands of years”
It makes sense that glacial retreat has caused sea level rise. But as I understand it, the temperature of the current interglacial peaked perhaps 8000 years ago, and that would (other things being equal) lead to a fall in sea level. Why do you think that the first effect is larger than the second?
Harold, you seem to be making unstated assumptions about how long this kind of thing takes to reach equilibrium. Ice several km thick all over Antarctica which remains solidly below zero today.
How long do you think it will take finish melting and adjust to the current interglacial conditions.
I don’t have a definitive answer but you seem to be thinking that thousands of years is a long time and assuming ice will have adjusted. I don’t think glaciologists would agree with you. West Antarctic ice sheet is still adapting.
Greg –
Not making assumptions, I’m asking because it’s not obvious (to me, at least) the magnitude and time constants of these effects. Presumably some folks have investigated and have some handle on the quantitative aspects.
But as I understand it, the temperature of the current interglacial peaked perhaps 8000 years ago, and that would (other things being equal) lead to a fall in sea level. Why do you think that the first effect is larger than the second?
Well, the insolation that shone on the Arctic peaked about 10,000 years ago, but remember that the total global average insolation has remained more or less constant ( within the constraints of unknown albedo ).
So the Arctic insolation peaked about 10,000 years ago, but the latitude of peak insolation anomaly slid continuously southward past the equator to the Southern hemisphere ( which now receives about 6% more insolation than the Northern Hemisphere which used to receive more ). The Southern Hemisphere, containing more ocean, probably absorbs more.
So it may not have been surface temperature that led to thermal expansion so much as absorption of sunshine.
I did find this chart looking for one to exhibit insolation:
http://theinconvenientskeptic.com/wp-content/uploads/2013/01/140ky-RSL-Insol.png
TE: Are we looking at the same graph? Because the SLR response to Insolation during the Holocene does not correlate like it did in the past. This graph and your correlation is causation conclusion indicates that civilization is out performing insolation WRT SLR.
Thanks, Eddie!
HG:
It looks to me like the sea level curve went off track around 5000 BP.
Perhaps the pyramids were built using internal combustion slaves?
Nope, just the Holocene; the preceding downtrend was glaciated.
==========
That chart is ridiculous. What is its provenance?
opluso: get with the program. landuse is a first order forcing and external combustion was employed during the oldener days of civilization.
A little clarification. That’s calculated change in insolation at top of atmosphere at 65N in July from Berger & Loutre 1991. I don’t think it’s necessarily what reaches the surface. Keep in mind January would be getting the polar (pun intended) opposite change in insolation so total absorption by the ocean doesn’t change. The chart isn’t ridiculous but the idea that the amount of heat absorbed by the ocean each year changes is incorrect so that’s not a factor.
HG:
For which you have no “oldener” data so you might want to find a new program to get with. Even today the IPCC is unsure whether the sign is negative or positive for landuse changes.
Climate change related to the collapse of continental ice sheets contributed far more to the rise of civilization than vice versa.
Opluso, pull your head out of the clouds and back down to this sub-thread. We are discussing TE’s plot that implies SLR and insolation are highly correlated.
The question still remains, why is SLR in the Holocene responding so differently than the Eemian and other failed interglacial periods within the last glacial period as shown on TE’s chart?
We still haven’t heard from TE perhaps because he can’t defend his own post.
HG:
Rather obviously, I was responding to your comment that:
I assume you were not being facetious when you asserted that “civilization” thousands of years ago exerted sufficient influence over sea level to alter the expected inflection point. Yet you have offered no support (beyond the pre-existing discovery of fire) for this extraordinary claim.
You further suggest that TE cannot explain the divergence. Yet he did hypothesize that increased insolation in the Southern Hemisphere led to global sea level rise despite the lessened insolation on the NH’s larger land mass. That seems at least as plausible to me as the suggestion that Bronze Age advances created a tipping point for sea level.
Horst it’s not responding because insolation isn’t a direct cause. Insolation is a pacemaker for glaciation and glaciation lowers sea level.
The disconnect in the Holocene is because the Holocene deglaciation was interrupted by an event called the Younger Dryas. It was basically an ice dam bursting in North America between the Great Lakes and the Atlantic ocean which produced a sudden, huge input of fresh water. That in turn stalled the positive-feedback meltdown of the Greenland Ice Sheet. Took the wind out of its sails. GIS was spared and sea level rise halted about 5-7 meters short (the amount of water landlocked in GIS) of the peak in most or all the preceding interglacials. Evidently GIS has to completely melt and sea level rise before glaciars regain the upper hand in the northern hemisphere.
That’s a popular hypothesis but probably doesn’t quite qualify for a consensus beyond the Younger Dryas taking the wind out of the Holocene glacial melt.
DS:
The Younger Dryas and freshwater pulses (such as the Lake Agassiz event) were important climatic events. However, the Younger Dryas ended about 11,500 years ago and Lake Agassiz drained over 8000 years ago.
https://www.ncdc.noaa.gov/paleo/abrupt/images/data4-climate-changes-lg.gif
Thus, one still needs to explain why the climate system shifted from the “expected” return to glaciation to the unprecedented ~5000+ year upward trend in sea level that continues today.
Perhaps it was all due to a shift in the thermohaline circulation. Perhaps it was driven by changes in insolation (reinforced by albedo changes in the NH). Perhaps some combination of those, and other, factors. The least likely paleo-driver, IMO, would be HG’s civilization reference.
Harold. Good question actually. Measuring sea level is quite difficult. Except for the past century and a little longer in a very few places, past sea level estimates are pretty approximate. There is strong evidence that sea levels rose dramatically after the continental ice sheets started to melt about 20000 years ago and continued to rise for many thousands of years. There’s some spotty, but plausible, evidence that sea levels during the previous interglacial 100,000 years ago (give or take) peaked five or more meters above present. Other than that almost all you read here and elsewhere includes an uncomfortable amount of speculation.
The lag. Melting would continue even past the temperature peak, because temp would still be well above that when the ice accumulated, through the 100K glaciation.
=========
The end of melting and the end of sea level rise is already well past the final turn into glaciation.
We need to worry a lot if sea level stops rising. We need to worry less but still some if sea level rise decelerates. I don’t understand that we can see all this and not look at it correctly, that we haven’t much wiggle room left before the slip off the warm ledge upon which we now dwell.
===================
ENSO events certainly stick out in the TOPEX/Jason data.
And the downtick at the end seems to have preceded the downtick in MEI.
Does SLR indicate ENSOs better than other indices?
Or maybe doincident.
http://appinsys.com/globalwarming/ENSO_files/image041.jpg
Interesting, what is the source of that graph?
It looks like it is ‘detrended’ sea level, even though that is not shown in the legend.
From http://appinsys.com/globalwarming/ENSO.htm :
“The following figure superimposes the sea level data for La Libertad from the figure above (changed to green) on the multivariate ENSO Index plot shown previously. This shows a strong correlation between the ENSO and sea level variation.”
Figure sources are given by hovering over the image (source info shows somewhere on your browser. This one is at: “https://i0.wp.com/appinsys.com/globalwarming/ENSO_files/image041.jpg?zoom=2(red xxxx)”; (red xxxx) added so the image does not download here).
Image info also given by “right clicking” on image and selecting “inspect element”.
Ho hum, just another paper produced by a cabal whose proxy reach exceeds its bona fide grasp by at least an order of magnitude. And they call this “climate science!”
Philosophical question of the day:
If Climate Science doesn’t excrete scary graphs in the treemometer proxy sites, does anyone hear it?
Andrew
Depends on if a “faurt” is associated with the “excreting”. Some of the “scary graphs” may have been stored where the sun don’t shine so they don’t “record” the sunspot info. Corn-cob suppositories, anyone? Oh, that is past history and we “know” that “passed” history has nothing to do with the future. I, for one, do believe that where and what that past history is indicates mucho about what we can expect in the future – actual and written!
Oh my, 5.5 inches! We’re all going to die. Except, didn’t I read the the tidal range in Anchorage Alaska, every day, is 12 meters? Even in the open ocean the tidal range, every day, is two feet. Some perspective would be nice.
The Leclercq et al study found that there has been a slowing of glacier retreat after 1950. So where’s the impact from their so called CAGW?
http://hockeyschtick.blogspot.com.au/2014/04/new-paper-finds-worldwide-glacier.html
The SL on OZ’s east coast was at least 1.5 metres higher just 4,000 years ago. That’s after the Holocene climate optimum, but today SLR is just 0.65 mm yr at Sydney and 0.09mm yr at Brisbane. That’s about 2.2 inches and 0.36 inches by 2100. Big deal.
I get the impression from the paper that their sampling is very biased towards eastern North American and Western European sites. Geological these are what are known tectonically as Passive Margins. Minimal western Pacific data would sample means areas known as Active Margins were ignored and the results maybe different. A correction for hydro-isostasy seems to be missing too.
Beware the Tsunami
What’s all the fuss over a few inches/feet sea level rise compared to a really good splash?
Local natural events have caused substantial higher water!
The 365 AD Crete earthquake/tsunami devastated the Mediterranean.
Historical Tsunamis
World’s Tallest Tsunami
A tsunami with a record run-up height of 1720 feet occurred in in Lituya Bay, Alaska
Big splash coming
The predicted future asteroid ocean impact tsunami is the one to really prepare for.
Seeing that coming will be the real cause for concern
Are we ready / preparing for that?!
“One of the authors of the new paper, Dr. Rahmstorf, had previously published estimates suggesting the sea could rise as much as five or six feet by 2100. But with the improved calculations from the new paper, his latest upper estimate is three to four feet.”
“Three to four feet” is closer to the range of plausible than “five or six”, but almost certainly is still way too high; this paper is absolutely typical of the garbage Rhamstorf passes off as ‘science’.
The trend in satellite altimeter data shows zero evidence for acceleration since 1993. If you account for the influence of ENSO (changing rainfall distribution over land), the satellite trend has only a very small deviation from a straight line since 1993…. and once again, zero evidence of acceleration. Even the ‘measured’ satellite rate (~3.3 mm/year) is inflated 10% by accounting for continuing glacial rebound, with an estimated influence of -0.3 mm/year. The actual measured rate of rise against a geologically stable seafloor (that is, distant from where the ice sheets were) is ~3 mm/year. 3 mm per year amounts to a bit under 10 inches over the 84 years until 2100. Reaching even 3 feet of rise (forget about 4 feet!) over that 84 years means an *average* rate of 10.9 mm per year, which is only possible if there is rapid and pretty much continuous acceleration in rate of rise of ~0.188 mm/yr/yr. That acceleration would lead to a year 2100 rate of almost 19 mm/yr…. which is some 20-25% *faster* than the rate of sea level rise in the 9000 years of widespread deglaciation leading up to the Holocene. 19 mm per year is just not going to happen.
Rahmstorf and his cabal are, as usual, way wrong about sea level rise. And we will know that for sure when the rate of rise has not increased by 1.88 mm/yr (5.18 mm/year) by 2026. But don’t worry, long before then Rahmstorf et al will ‘revise’ their projections of sea level doom, so that their predicted doom always is just beyond where it can be discredited by measured reality. Scoundrels.
Rahm don’t give a dahm,
Of this sdorf, there’s been enorf.
=====================
The science of global warming is simple: if a sea level rise of a few inches over a 100 years is not frightening, then you change the number to a couple feet in 100 years. Just keep changing the numbers until you achieve the desired effect –e.g., 20 inches over the last 20 years and over 3 feet in no time at all…
Or take a lesson from Joseph Stalin, and put the people you disagree with politically with in jail…. or worse. Just like the RICO 20 worms already suggested to worm-in-chief Obama.
Make all the skeptics buy beach houses. I like that.
Or just give them to us. I’m willing to live in one, to prove my beliefs are sincere.
angech,
At government subsidized prices.
Sign me up.
Apparently our CinC (climate worrier in chief) feels confident enough to buy a new beach front home in Hawaii.
I wonder why they selected the last 3,000 years as their base. It is reasonably well documented that the sea level rose about 130 m during the last 13,000 years.
The sea level has risen 7 cm in the last 25 years which is double the 20th century rate of 14 cm from 1900-2000, so yes, the rate has doubled. Next question.
So next you take 3.4 times 84?
Want to explain how 8 to 9 inches is worrisome?
> Want to explain how 8 to 9 inches is worrisome?
If your house or levee or factory is only a few inches above peak storm surge and if it is sinking a bit because of tectonic forces and if your town is happily pumping drinking water out from under it 20 or 22 cm of sea level rise might take on some importance. Regretably, way too much infrastructure is built way too close to sea level. A situation that is demonstrated anew every year.
don k,
Engineers figured out a solution to that problem a long time ago.
Called a sea wall.
In fact we are not just building close to sea level, we have been reclaiming land from the sea for some time. Wouldn’t be doing it if there wasn’t some benefit.
Try looking at the last 23 years, where there is the best and most consistent data…. no acceleration. Next idiotic conclusion.
Whatever you do, don’t fool yourself.
Don’t have to fool ourselves JCH. We have you.
JCH,
If anyone is fooling themselves (or worse, trying to fool others) it’s the loony green cabal at the Potsdam Inst, where Rahmstorf resides as lead loon. Try reading Rahmstorf’s several crazy papers projecting sea level increases of 1-2 meters by 2100 without giggling. They (and he) are ridiculous, and disconnected from science. Even the IPCC ignored his tripe in AR5; ought to tell you something.
OK , let’s actually do the calculation that has been invoked but not concluded several times already:
3.4 *8 4 = 285.6 MILLIMETERS
That’s less than one foot.
Hey Jim, you’re trying to pull the cosine warming crap on us again.
We had that one out a couple of weeks ago when you tired it on with temperatures.
http://climategrog.files.wordpress.com/2013/04/warming-cosine.pnghttps://climategrog.wordpress.com/warming-cosine/
There is fairly strong 60y periodicity in MSL , we are at the high point of that cycle around Y2K, so of course if you take the last 25y upward section and compare to a longer period you will get a greater slope. That NOT proof of acceleration.
You know this is bogus from our last discussion so now you are just being wilfully misleading.
Funny how alarmists always need to resort to lying and distortion to make their case.
Hey, my graphs disappeared, try again.
http://climategrog.files.wordpress.com/2013/04/warming-cosine.png
You’ve lost. The last time the “60!!!” year cycle caused an actual cooling; as in, a good old fashioned, prolonged downward trend, was at the end of the 19th century.
That is why the 20th century was a pronounced acceleration of SLR over what happened before.
The mid-century cooling was aborted.
And your graph is a complete joke. You actually took 3.4 times 84. Are you kidding me? If you believe in 60-year cycles, why would you do that? by 2100, if you’re right, it would be largely washed out. You’re not right. You’re just bullchitting. And Svetlana would tell you the same thing.
Once again, the question in the post was whether sea-level rise has accelerated. The answer is, of course, yes if you count the rate in the last 25 years being double the average rate of the 20th century.
Repeating silly nonsense doesn’t make any less nonsensical.
http://www.coolgeography.co.uk/GCSE/AQA/Coastal%20Zone/Sea%20level%20rise/Sea%20level%20rise.gif
I just give the numbers that everyone agrees with for the last 25 years (7 cm) and 20th century (14 cm) and compare them. Deny what you like. It doesn’t affect the raw numbers.
JCH: That projection is pretty optimistic, what is the source?
Jim D & JCH
Nils-Axle Morner has some of the most impressive credentials of any SLR expert and has been a global leader in his field for several decades. He says there is no acceleration in rates. That is good enough for me.
Just like EF Hutton, When Morner talks, people listen.
cKid: If appeals to authority always works for you, then you must be a big supporter of the RealKlimate experts with tippy-top credentials, experience and more importantly, exalted positions at the pinnacle of government and academia.
Somehow, the IPCC AR5 drew this conclusion, in context of Figure 3.14:
“Since the early 1970’s, glacier mass loss and ocean thermal expansion from warming together explain about 75% of the observed global sea level rise (high confidence)”
Go figure.
Not sure how you’ve concluded that this statement was made in the context of Figure 3.14. The statement is from the SPM, in a section referencing Chapter 13 (not Chapter 3, where that graph is found) and figure 13.3 specifically. Figure 3.14 is not shown or referenced in the SPM.
I also can’t see why Figure 3.14 would hold much relevance for that IPCC statement.
Scientists at NASA’s Jet Propulsion Laboratory figured this out by measuring changes in Earth’s gravity with twin satellites orbiting the Earth in tandem. Over the past decade, thirsty continents have slowed the rate of sea level rise by about 20%, or about 1 millimeter per year, according to the study published in Science. ~LA Times
Don’t you just love interglacials? If only we could keep the sea levels steady…
Why must everything have a downside? “Thousands of years” (to borrow the razor-precise language of the interdisciplinary Sea Level Change Team) ago one could just walk from Melbourne to Tasmania. But the cold weather would have made the whole thing into a gruelling tramp.
I vote we have balmy times but with Younger Dryas sea levels. Playing cricket on Dogger Bank is only fun in nice weather.
As likely the least scientifically educated here some things that caught my eye. Koop uses “semiempirical” evidence on which to base this work. So I looked that up: “partly empirical; especially : involving assumptions, approximations, or generalizations designed to simplify calculation or to yield a result in accord with observation.” Additionally enjoyed the choice of wording that:” Semiempirical modeling indicates that, without global warming, GSL in the 20th century very likely would have risen by between −3 cm and +7 cm, rather than the ∼14 cm observed.” Risen -3cm? How about choosing the word ‘changed’?
We know tidal gauge records are adjustable (see Hay). Now this is no indication that those adjustments are wrong, just variable.
In discussions with another who asked “So models suck?” {sarcastically}(discussing this: http://onlinelibrary.wiley.com/doi/10.1002/2015GL067189/abstract?utm_source=Daily+Carbon+Briefing&utm_campaign=48b659ab46-cb_daily&utm_medium=email&utm_term=0_876aab4fd7-48b659ab46-303449629”
I stated no, they don’t suck. It’s just we involve a process we don’t understand, add on a probability/likelyhood (inherently an imperfection) and plug it in to a model in an attempt to replicate a phenomena. Then we change the inputs of the process(es) and the probabilities and rerun them over and over again in creation of an ‘ensemble’. Potentially one of these runs might hit the mark, but the others can at best create the error bars.
What might I be missing?
So is sea level rise accelerating due to AGW? Well what caused the 49% not attributed to AGW ‘semiemperically’?
Oh this damned drought… our children will never know mud again!!!
The tidal gauges adjusted long before CC Hay… probably before she was even born.
JCH,
Great. You’ve had your say w/r/t tidal gauges, adjustments & Hay. So, can you now tell me about the missing attribution of the 49%?
Lol… the natural upward half of the PDO ~1915 to ~1940, and the unnatural natural way most of it never went away.
Emperical vs. semiemperical. Makes more sense to me. Now there seems to be blocks with which to build (and extrapolate).
That’s a substantial increase, especially for vulnerable, low-lying coastal areas.
This is called bathos in lit. crit.
I am glad that you linked to RealClimate.
Interested in the adjustments for isostatic rebound
As any ice sheet melts, sea levels along coastlines as much as 1,500 miles (2,000 kilometers) away will fall as seawater escapes from the reduced gravitational pull and the crust lifts. The escaping seawater flows clear across the equator: the melting of Antarctica affects the U.S. East and West coasts,
yet
Oct. 31, 2015 NASA Study: Mass Gains of Antarctic Ice Sheet Greater than Losses Antarctic Peninsula
A new NASA study says that Antarctica is overall accumulating ice.
According to the new analysis of satellite data, the Antarctic ice sheet showed a net gain of 112 billion tons of ice a year from 1992 to 2001. That net gain slowed to 82 billion tons of ice per year between 2003 and 2008.
The extra snowfall that began 10,000 years ago has been enough to outweigh the losses from fast-flowing glaciers in other parts of the continent and reduce global sea level rise.
To my naive mind the idea of adjustments for rebound is scientific rubbish anyway.
If the weight of the ice sheets lessen on one part of the land mass and the water flows elsewhere the land [mantle] that uplifts will have to be compensated exactly and equally by a fall in the mantle elsewhere at the same time. TM angech.
Hence there is no need for an artificial 10% adjustment to sea level heights
This makes all the good doctors studies 10% less serious for starters.
GAIA ‘correction’ is irrelevant if we are concerned about coastal sea levels and real peoples lives. Since no one has measure the depth of the ocean basins to check , it is totally hypothetical as well.
Colorado U. now only provide GAIA [sic] ‘corrected’ data since they are playing politics and not science. What they call mean sea level is now some phantom sea level floating above the waves.
They also only provide data with an inv. barometer adjustment. Now if that makes ANY difference to the global mean there is a problem, so there is no point in providing global mean with IB, but that’s all you get. This also means that you can’t compare it to non IB, which is probably why the don’t give both any more.
Angech: To my naive mind the idea of adjustments for rebound is scientific rubbish anyway.
Not completely There are Pleistocene marine deposits well above current sea levels in Ontario, Quebec, and parts of New York and New England. What happened of course is that the ice shields pushed the underlying rock down. Then the ice melted and the Atlantic flooded the coastal New England, the St Lawrence and Champlain valleys. The the land bounced back up. Trouble is that in parts of Canada, New England, Scandanavia, etc the land is still bouncing which means that tidal gauge readings in those areas are “misleading” (i.e. “wrong”).
What is very likely a valid question is whether the GIA adjustments used in climate science are in any way related to actual (post)glacial isostacy.
As for the CU GIA adjustments to Sea Level rise. All those do is cause me to question the sanity/judgment of the staff at Boulder. If you want to compute ocean volume change, fine. But do NOT call the resulting number “sea level change” because that term is preoccupied by the thing measured by tidal gauges.
The Cosquer cave entrance in the Med near Cassis France is 115 feet below sea level. The cave paintings inside were made when the entrance was above sea level. The sand dunes at Pinehurst NC giving a classic links style course at Pinehurst Number 2 are at 500 feet above sea level. The maximum potential rise to sea level given current water levels ( baring future comet deposits) is 230 feet. So current variation in recent warming or stable conditions is suspect for long term prognostication. What might the rate of change do if the earth goes into a cooling spell again here shortly?
“Roman Empire and Medieval port cities are now miles from the Mediterranean, because sea levels actually fell during the Little Ice Age.” ~Robert Endlich
Dr. H.H. Lamb Climate, History, and the Modern World
The most rapid phases [of sea level rise] were between 8000 and 5000 BC, and … the rise of general water level was effectively over by about 2000 BC, when it may have stood a metre or two higher than today … [T]he most rapid post-glacial rise of mean sea level averag[ed] between one and five metres per century.
The water level may have dropped by 2 metres or more between 2000 and 500 BC. What does seem certain is that there was a tendency for world sea level to rise progressively during the time of the Roman Empire, finally reaching a high stand around 400 AD comparable with, or slightly above, present.
The slow rise of world sea level, amounting in all probably to one metre or less, that seems to have been going on over the warmer centuries in Roman times, not only submerged the earlier harbour installations in the Mediterranean, but by 400 AD produced a notable incursion of the sea from the Wash into the English fenland, and maintained estuaries and inlets that were navigable by small craft on the continental shore of the North Sea from Flanders to Jutland.
The existence of pre-Norman conquest salterns – saltpans over which the tide washed and from which salt-saturated sand was taken – outside the later sea dykes on the Lincolnshire coast may point to a period of slightly lowered sea level between the late Roman and the medieval high water periods. There is other evidence to suggest this between the seventh and tenth centuries.
But many later saltpans are known in the area, also on the sea-banks, standing up to 3 metre above the present mean sea level
Close study by Sylvia Hallam, over many years of the history of human settlement near the coast of the Wash in eastern England has indicated that sea level was rising from some centuries before up to a maximum attained in the last century BC. There was then some recession of the water until about 200 AD, followed by a major high stand and incursion of the sea around 300 – 400 AD. Sea level was again rather lower in the 7th and 8th centuries, but seems to have been again high in the late 13th to 15th centuries.
Our survey of the European scene during the warmer centuries of the Middle Ages would not be complete without mention of the things that suggest a higher stand of the sea level, which may have been rising globally during that warm time as glaciers melted – and particularly in the area around the southern North Sea where the land-sinking due to the folding of the Earth’s crust in that basin was presumably going on then as now.
Kenneth
A couple of years ago I wrote a long article on sea levels through Roman Times. However the several graphs I used took us to modern times. The two graphs are towards the foot of the pdf link
https://curryja.files.wordpress.com/2011/07/document.pdf
Yes, we can see several high water stands in Roman Times and during the MWP period. There were several lower periods caused by the Dark ages cold period and the LIA.
I tend to think now that the oscillations are substantially larger than shown on the graphs but it gets confused by land rising or falling substantially and also that we have this baffling desire to create ‘averages.’
To this day, some places in the world have substantially falling sea levels whilst in others it is rising substantially yet we average it all out to create some pointless figure which relates to hardly anywhere.
Sea levels have been rising for hundreds of years and glaciers have been melting for hundreds of years and temperatures have been rising for hundreds of years as our climate does what it has always done, change.
tonyb
OT, but very recent, and climate related.
Bill Gates on Getting Billionaires Behind Clean Energy
http://www.marketplace.org/2016/02/22/world/bill-gates
Notice that while he gives lip service to clean energy his main point is affordable energy?
Bill Gates is not stoopid. Jury is still out on you Max.
When I posted the link to the Gates interview, it didn’t occur to me a reader could misinterpret it as badly as you have. Unlike the climate risk deniers who hang out here, Gates knows cheap but dirty won’t cut it in our changing world. Your “lip service” remark is an insult to this great man. Shame on you.
Max,
Learn to read numbnuts. How many times does he mention renewables as they exist today not cutting it? Yes, he wants to see mankind develop clean sources of energy that are as cheap or cheaper than coal or liquid fossil fuels. The point that stands out in his interview is affordability.
Gates gets it. You cannot lift 3 billion people out of poverty without cheap energy. Clean is important, but it does not trump affordable.
timg56, it stood out to you because you wanted it to stand out. Either that are you fell in and out of a coma while trying to read the article. Try looking at the title.
Max,
You do a great job of imitating a 16 year old who comments in between popping his zits. Headlines are written by someone other than the reporter, with the sole objective of grabbing people’s attention. Any correlation between the headline and the contents of the story is mostly accidental.
Try counting the number of times he refers to cost verses clean.
From the interview:
Gates: Right, that’s why I don’t think the solution is making energy more expensive, because only rich countries can afford that solution. We need to take the billions of people in the world who are so poor, they have no energy access, no light at night, no refrigeration…we need to make energy so inexpensive that they can the transport, fertilizer, all these services we take for granted.
Gates: And I’d like to be even cheaper than coal is today. The cheaper we can make energy, the better that is for people in poverty.
Gates: Well, liquids, like gasoline, are magical. The energy density is over 10 times the best battery. And it sits there in a tank, the tanks are very inexpensive. It’s actually the best energy store we have today, is gasoline. If we can turn the sun into gasoline, it automatically is available all the time and it uses the infrastructure that’s already there.
BTW – you do realize that turning sunshine into gasoline doesn’t eliminate CO2 emissions, right?
timg56, we know how to get inexpensive energy, and we know how to get clean energy. The challenge is getting inexpensive energy that is clean. It’s clear to me that was what Gates was talking about. I don’t recall him saying the important thing is cheaper energy no matter how dirty or clean energy no matter how expensive.
Alright max,
I will rephrase my original comment.
“Gates gives lip service to clean energy in its current form.” And that is being positive, as he basically trashes it.
Nowhere have I tried to portray Gate’s comments as arguing for cheaper no matter how dirty. The key point he is trying to make is the critical importance of cost. If it isn’t cheap, cheaper than coal, than it is not a viable solution, no matter how “clean” it is.
He is talking about revolutionary technical breakthroughs, although he apparently is smart enough to think nuclear is part of the solution. (He doesn’t mention it in the interview, but he is invested in nuclear R&D.) The flip side of the coin he is discussing is that until we have cheap clean energy, we still have to provide cheap energy to the billions without it.
I don’t know where you stand, but I consider it immoral to condemn billions of people – most likely several generations worth – to poverty because Earth Justice loons and latte sipping NPR and Sierra Club members think a pristine planet – one where they still get to sip their lattes – trumps the needs of real people.
Nuclear power is clean but the initial cost is high. Hopefully, advancements in technology will lower cost and reduce the fear of nuclear. I doubt the public can be convinced reducing cost by loosening safety regulations is a good idea.
While I am sympathetic with the desire of developing nations to improve the lives of their citizens and grow their economies, I have concerns about their progress being at our expense environmentally, economically, politically, militarily, and otherwise. You and Gates may be less concerned.
I also do not believe it’s right to try to impose our culture on countries through foreign aid. This causes resentment. Foreign aid should buy friendship, not hate.
Max,
this last comment actually sounds like a thoughtful one.
I’ll pass on the nuclear part so as not to get into a discussion on either cost or safety of commercial nuclear generation, other than to say there is no other industry of field of endeavor in the US with a better safety record. That is primarily the result of good engineering, not regulatory oversight.
Regarding this: “While I am sympathetic with the desire of developing nations to improve the lives of their citizens and grow their economies, I have concerns about their progress being at our expense environmentally, economically, politically, militarily, and otherwise. ”
In this instance I do not want to sound dismissive, but that is a rather simplistic and naïve viewpoint. For one, none of the people you refer to care about your concerns. They are acting in their own best interests, just as we do. Do you really think anyone is capable of freezing progress? And if we are to act on your concerns we basically would be telling all those people “Hey, you live in a third world country – tough luck. Learn to live in poverty.”
The last paragraph doesn’t seem germane to the topic. If by our culture you are referring to a modern, industrialized society, well that isn’t exactly a cultural aspect.
I’ll be succinct. Why think we know what’s best for developing nations? Instead, why not let developing nations tell us what they need. If it’s consistent with what we need, help them. If not, don’t. This way we avoid ethnocentric conflicts.
Essentially talking about Vaclav Smil, Gates is pretty much accepting the Left’s love affair with ‘renewables’ is childish while agreeing with Michael Crichton –e.g., that global warming alarmism is fear of the future based on current ignorance. “Who would have guessed in 1980 that during the next three decades the best return on federal investment in energy innovation would come not from work on nuclear reactors or photovoltaic cells but from work on horizontal drilling and hydraulic fracturing (“fracking”) of shale deposits ~Vaclav Smil
Waggie, is the first sentence Gate’s thinking or someone’s idea of Gate’s thinking, and if the later, whose idea?
Vaclav Smil is not as enthusiastic about fracking as the quote may have led you to believe. Here’s a link to a recent article by him
http://spectrum.ieee.org/energy/fossil-fuels/its-too-soon-to-judge-shale-gas
Fracking is a far more expensive way of extracting oil and gas than conventional drilling, and production from fracked wells declines more rapidly. Fracking also is more damaging to the environment, which is why some localities oppose it. Unless the price of oil rises back above $60 a barrel, I don’t think we will see any significant increase in fracking.
The success of fracking is why oil is cheap — American energy independence brought about by free enterprise capitalism put its thumb in the eye of the oil-producing cartel of mostly autocratic dictators.
Fracking is not a success when an operator can’t recover costs and make a profit. Oil is cheap because it can be produced at a cost of $10 a barrel by conventional wells in the Middle East and many domestic operators of fracked wells must sell their oil to meet debt obligations rather than leave it in the ground until the market price recovers.
Fracking unlocks valuable shale gas energy from oil shale reserves right here in America, powering our lives, fueling our economy, and securing our future.
But, Leftists never want what’s good for America; but, facts are facts: NG is a cleaner fuel than ME oil because you’re burning more hydrogen and less carbon. Greenies would love it if it came from China instead of the good ole USA.
Well, Waggie, this left-of-center, greenie, capitalist wants what’s good for him, as any red-blooded patriotic American should. You seem to want what’s good for the masses. When did you become a Communist?
…when the 47% coughed up Hillary like a hoary hairball on America.
Max: Thanks. The most interesting point Bill makes that holds back energy sector venture capital investment is the long timeline from concept to application, which is about 30-years. This is also 10-years beyond patent protection. The ROI picture needs to be turned upside down to effectively decarbonize.
Horst, yes, that was an interesting point. I hadn’t thought about the timeline from concept to application being so long.
Interestingly, the average of these Alaskan coast tide gauges (NOAA) is -5.84 mm/yr.
http://tidesandcurrents.noaa.gov/sltrends/sltrends_states.htm?gid=1240
Ketchikan: -0.30 millimeters/year from 1919 to 2014
Sitka: -2.27 millimeters/year from 1924 to 2014
Juneau: -13.16 millimeters/year from 1936 to 2014
Skagway: -17.59 millimeters/year from 1944 to 2014
Yakutat: -14.35 millimeter/year from 1988 to 2014
Cordova: -0.26 millimeters/year from 1988 to 2014
Valdez: -8.98 millimeters/year from 1988 to 2014
Seward: -2.66 millimeters/year from 1964 to 2014
Seldovia: -10.24 millimeters/year from 1964 to 2014
Anchorage: -0.61 millimeters/year from 1972 to 2014
Kodiak Island: -10.77 millimeters/year from 1975 to 2014
Sand Point: 0.68 millimeters/year from 1972 to 2014
Adak Island: -2.96 millimeters/year from 1957 to 2014
Unalaska: -5.26 millimeters/year from 1957 to 2014
Prudhoe Bay: 1.20 millimeters/year from 1990 to 2014
Well, if the Satellite jockeys GIA adjustment for the bottom falling out of the ocean (0.3 mm/Y) is correct , this isn’t possible without the land rising 0.6 mm/Y.
So the first thing to do when looking at satellite sea level is subtract 0.9 (IE 3.3 mm/y is really 2.4 mm/y) because the satellite guys are clueless about what sea level means and how to measure it.
Satellite temperatures are useless because there are adjustments. Satellite sea levels are perfect because there are adjustments.
Nothing to see here. Move along.
Sea levels and temperature may both be measured by satellite, but in spite of that the two measurements are still a case of apples and oranges.
Sea level rises are not the sole provenance of changes in water and ice but must also consider tectonic changes in the Earth’s mantle. IMO there would varying rates of SL changes around the globe with many rises in some areas being offset by just as many falls in other areas.
Well, I did the math on length of day. Counter estimates are welcome
A 1 meter steric change in sea level (thicker ocean same mass) causes a 5820E27 kg m2 change in MOI and a 6.259E-006 second change in LOD.
A 1 meter Antarctic Ice Sheet melt change in sea level (thicker ocean more mass) causes a 1.0057E31 kg m2 change in MOI and a 0.0108 second change in LOD, and takes around 368,000 GT of ice melt.
From what is an admittedly cursory analysis, the LOD is fairly insensitive to steric sea level rise but is strongly affected by net change in the mass balance of the tropics. Antarctic melting/growth drives the LOD like a thermostat unless countered by other ocean mass change sources. Claims the Antarctic ice sheet is melting given claims of other sources of ocean mass increase should be regarded with disbelief.
http://www.pog.nu/01research/sea_level_research.htm
The combined satellite altimetry data indicate a mean rise in the order of 1.0 mm/yr from 1986 to 1996 (Fig. 7-5-4; Shum et al., 1999).
There is no reason the Shum et. al. methodology could not be applied to the TOPEX/JASON era to double check their work.
That’s a good point, cross-checking different sorts of data always provides a good sanity check with all these error prone datasets.
Especially if it is something like LOD which is not controlled by political activists and is less likely to be rigged or “homogenised”.
Wind raises the center of gravity of the sea more than anything else.
The crust of the earth does spin at a different rate than the core of the earth. If you used the inertia of the whole earth in your calculations, they are way wrong. The inertia of the crust and the increased ocean must be used. Changing the spin rate of the crust is much easier than changing the spin rate of the core. 6.259E-006 second change in LOD. You are way wrong.
According to Epica Dome C ice core data (Antarctica), CO2 levels declined very slightly from 268 ppm 10,458 years ago to 264 ppm 9,399 years ago, but during this period, sea levels rose at rates of 1.4 to 4.8 meters per century (between 10,473 and 9,411 years ago) according to the paper below. Sea level high stand was also 8+ meters higher during that time. What caused that rapid sea level rise rate, since CO2 levels declined?
http://www.sciencedirect.com/science/article/pii/S0921818115301867
The field data show rapid increases in rates of relative sea level rise of 12–48 mm/yr between 10,473 (or 9678) and 9411 cal yr BP in the Vestfold Hills and of 8.8 mm/yr between 8882 and 8563 cal yr BP in the Larsemann Hills. The relative sea-level high stands of ≥ 8.8 m from 9411 to after 7564 cal yr BP (Vestfold Hills) and ≥ 8 m at 8563 and 7066 cal yr BP (Larsemann Hills) are over-predicted by some of the glacial isostatic adjustment models considered here, suggesting that assumptions relating to the magnitude and timing of regional ice loss since the Last Glacial Maximum may need revising. In the Vestfold Hills and Rauer Islands the final deglacial sea-level rise was almost exactly cancelled out by local rebound between 9411 and 5967 cal yr BP and this was followed by a near exponential decay in relative sea-level.
Seeing Rahmstorf’s name among the list of authors, even down at number 10, doesn’t do much to convince me that the Kopp et al paper is worth spending much time on.
What depths he might sink to …
sea-
changes
full
fathoms
five
at
least.
He
has
shown
on
other
occasions
that
credibility
once
lost
is
lost
for
ever.
Yes Ramsdorf is a total alarmist, not a scientist.
This paper is a fine example Eschenback’s law: the merit of a paper is inversely proportional to the number of listed authors.
While I realize the post was half in jest, I think one of the several hundred authors of the LIGO gravitational waves paper might disagree!
Kopp ignores observational evidence. More “proxy magic” imo.
More bogus science
Since 2/3 of the world’s oceans are in the southern
hemisphere and Australia is a geographically stable
coastline, ( excepting Freemantle and Adelaide where
a subsidence factor, ) Oz is a good place to measure
rate of sea rise. From Darwin clockwise to Albany,
11 out of 27 tidal gauges record sea level falls and the
remainder significantly less than IPCC rates or Koppian
proxy estimates.
http://morningmail.org/isle-of-the-dead/
And John Daly covered this thoroughly with his Isle of
the dead water mark post.
JCH | February 23, 2016 at 7:38 pm |
So once again you are rejoicing and rubbing your hands together because you think that some climate variable is getting worse and that it’s going to be real environmental catastrophe.
And you pretend to be concerned about climate ?
Like most eco-loons, you want a climate catastrophe to happen, you don’t want it not to happen.
JCH is just another commenter who is placing too much store on short term and sketchy data.
stock not store. Sorry.
You’re very wrong. I placed no stock on the pause/hiatus.
And:
http://www.realclimate.org/images//KoppGSL-with-projections-1024×434.jpg
‘stock on’, ‘store in’, both work.
Carry on, with your good work.
=======================
There is no problem so there can be no catastrophes. I hear it all the time.
Anyway, on the hook, I was wrong. The NOAA graph – they’re great guys at NOAA; they charged right along with my father’s leathernecks into hot enemy lead on Iwo Jima – is updated into 2016. The last two data points appear to have caused the hook. My bet is the hook is gone with the next data points as February is a burner from Hades. We’ll see.
2015.9538 54.29
2015.9796 55.07
2016.0081 51.92
2016.0354 54
2016.0624 59.9
2016.0896 55.71
2016.1143 53.31
Now, some wise person, tell me about the next La Nina, which possibly will be the warmest La Nina in the instrument record. I wanna hear about that kool mind changer.
Understanding how global sea level changes with time is a wicked problem. The number of unknown, even unknowable, variables is enormous. The Atlantic Ocean is spreading as the Pacific narrows. Some lands rise and pivot from isostatic rebound. Other land falls due to erosion and land use changes. Even the tides and oscillating currents constantly change the coastal properties. Those who believe that the impact on sea level from the burning of carbon and hydrocarbons can somehow be teased out of all these and other causes are living in an illusion. Those that believe that sea level will no longer change if we stop burning these fuels are just plane ignorant. Sea level will continue to change at different rates at different places for as long as there is a global ocean. We are certainly capable of adapting to these changes.
As we approach 2100, there will be limited fossil fuels. How do you construct an adaptation for an illusion with bulldozers and cranes and earth movers that are running out of diesel?
I have great confidence in human ingenuity, and I don’t believe we will ever run out of carbon based fuels. We might even find ways to convert atmospheric carbon dioxide back into a convenient hydrocarbon fuel using some form of nuclear energy among many other possibilities. Those who believe we will run out of carbon are living another kind of illusion. All the carbon ever burned is still right here on our amazing planet.
I’m not able to predict how cranes and bulldozers will operate in 2100, but I’m sure they will work even more efficiently than they do in 2016.
Sort of like mules do… only there ain’t enough pasture.
Do you really, honestly think that the energy sources we use will not change at all in 75 years?
In 1800 there was next to no steam power. Watt’s patented 10 hp engine had yet to change the face of the planet even though it existed. Almost all energy sources were natural–whale blubber, oil, wax, etc. The first chemical battery, pitiful as it was, was only introduced that year. The discovery of oxygen (“dephlogisticated air”) was a mere 26 years old. The chemical law of conservation of mass was less than 15 years old. The wave theory of light was not invented yet. Nor had atoms.
In 1900, X-rays were 5 years old. The Wright brothers were on the verge of the discovery of powered flight. Henry Ford had yet to popularize the assembly line method of production. Einstein had yet to change the face of physics with relativity. For that matter, electrons were only 3 years old!
The first powered flight was in 1903, the might of the aircraft carrier shown by the 40s, the first man on the moon less than 30 years later. The first computer in 1940s, and toda I hold in my hand as a phone more computing power than the entire world of 1900. Or 1950 for that matter.
The world has changed so drastically than it is barely recognizeable. In 75 years, do you really think we will be running out of gasoline due to having not progressed any farther in our energy usage??? That is ridiculous.
This isn’t to say that climate isn’t a concern. Or should not be preserved, or studied, or anything else. However your statement about not being able to find diesel for bulldozers is shortsighted and really rather silly. Why should we still use diesel and has as our primary sources of energy? The natural trajectory of discovery and progress makes that extremely doubtful.
“Sea level will continue to rise, no matter what we do about CO2 emissions. ”
Go figure.
The 60-year cycle calculation, you know, 30 up and 30 down, is 3.4mm times 84. So the down to 2100 is 0 times 0.
Yabbut the 1000 year warm/cold cycles aren’t adding up to zero. Each warm period (Minoan, Roman, Medieval, and Modern) are cooler than the previous.
http://www.seafriends.org.nz/issues/global/gisp2-apica.gif
JCH.
“The 60-year cycle calculation, you know, 30 up and 30 down, is 3.4mm times 84. So the down to 2100 is 0 times 0.”
Ummm, what!
Got a reference?
David Springer.
It takes a brave person to present a temperature proxy from one part of Greenland as a global mean temperature curve.
And what is the red bit tacked on the end – is that global or just Greenland?
Sanity check.
It is nakedly unscientific to quote sea level changes as due to factors like thermal expansion and conversion of land ice to ocean water, when virtually nothing is measured in the deeper 50% of the world’ oceans.
It is easy to postulate further mechanisms with credible guesses about magnitude such as dewatering and compaction of sedimentary piles, volume changes caused by ocean basin geography changes, dissolution of minerals comprising ocean bottoms, erratic heating associated with sea floor spreading, underwater volcanism, changes in rate of buildup of biogenic sediments …
Next to nothing is measured.
Would you teach a school class about measuring water volume while using a leaky can to hold it?
Geoff Sherrington.
“Next to nothing is measured.”
You are presenting an “argument from ignorance”. That is a logical fallacy.
Not to mention it is also a silly argument. Plenty is measured, and the physical laws are applied.
It was stated that according to Kopp:
“global sea level declined by about 8 centimeters [3 inches] from 1000 to 1400, a period when the planet cooled by about 0.2 degrees Celsius”
Yet Karl just “discovered” that for more than a generation our modern SST measurements were 0.12°C in error. If we cannot trust modern measurements such that we suddenly must adjust them by 0.12°C then I have a hard time believing that estimates of global temperature from 1000-1400 AD can be guesstimated within 0.2°C.
This passus strucked me:
“To assess the anthropogenic contribution to GSL rise, we consider two hypothetical global mean temperature scenarios without anthropogenic warming. In scenario 1, the gradual temperature decline from 500 CE to 1800 CE is taken as rep- resentative of Earth’s long-term, late Holocene cooling (2), and, in 1900 CE, temperature returns to a linear trend fit to 500–1800 CE. In scenario 2, we assume that 20th century temperature stabilizes at its 500–1800 CE mean”
All this flooding in US that could have been avoided comes from the assumption that there have been no natural warming after 1800, is this science or politics?
We should hope it’s just mad politics, for if man has done the heavy lifting of warming, we can’t keep it up much longer.
===============
Wouldn’t Archimedes say, hey…..what’s the volume of the ocean “bathtub” been doing over the past several hundred years? And what about the thousands of big ships floating in it (displacing water, i.e. raising sea level ), megatons of garbage/plastic that’s been dumped….competing for space with the water…..and aren’t mountains still eroding and sending tons and billions of cubic yards of silt into the oceans? Is the ocean floor itself undergoing geologic warpage…..i.e. changing it’s volume? What’s the displacement volume of all the fish and mammals in the oceans….and how has that changed over time?
Yawn… Houston & Dean 2011 say small decelerations between 1930-2010. I haven’t seen anything refuting their conclusion.
Neither have I. It’s as if they are invisible. Then there are other papers that have found no acceleration the rate. No challenges to discredit their findings either.
So far just promises of the apocalypse. Promises, promises.
JoNova pointed out when talking about claims of an ‘unprecedented’ sea level rise compared to the ‘ancient past’ that sea levels began rising long before coal fired power stations in the 1800s. If looking for a cause and effect based on increases in atmospheric CO2, modern times can only be confounding because the rate of sea level rise has slowed ‘over the last 50 years,’ not accelerated, ‘when most man-made CO2 was produced.’ Moreover, what the rate of rise during modern times surely must have been at least in ‘some measure’ caused solar activity which truly was unprecedented, something we know and appreciate a lot more compared to our relative ignorance about what the seas may or many not have been doing 6 to 10 thousand years ago.
Notably, the study found that global sea level declined by about 8 centimeters [3 inches] from 1000 to 1400, a period when the planet cooled by about 0.2 degrees Celsius [0.4 degrees Fahrenheit].
The database included records from 24 locations around the world. The analysis also tapped 66 tide-gauge records from the last 300 years.
Sea level increases in cold times because oceans are frozen and it is snowing less. It gets warm because ice on land is depleting. Sea level drops in warm times because oceans are thawed and snowfall is much higher. Sea level dropped during the Medieval warm period. Sea level increased in the little ice age and while we came out of the little ice age until recently. Sea Level is not rising now and has not since the 1970’s.
Leap seconds corrections would have increased if sea level rose, but leap seconds decreased.
Reblogged this on Floating-voter.
What is the definition of sea level rise? Why is there no specified datum point from which it is measured? Are the commentators actually trying to discuss Volume of water in oceans? How could that be realistically measured?
There are too many questions that should be resolved before anyone gets excited or tries taking steps to avoid another warmist myth.
On further reflection Volume is also the incorrect unit for this hypothetical problem. The most likely unit to lead to a conclusion that a change is occurring is Mass (of the oceans). Any of the warmist scientists out there disagree?
Any of the settled scientists have an experimental technique that could measure mass of an ocean?
Why did my eyes roll heavenwards when I read about the new statistical methods?
I have looked on sea level trends since 1750.
Ed Caryl had a very good description of what is shown by tide gauge data since 1800. (NoTricksZone April 2014) It is called Mean Sea Level (MSL), which is corrected for Post Glacial Rebound (GSR PGR).
And Physical geographer F.J.P.M. Kwaad has written a paper: Sea level change in the Middle Ages and the Little Ice Age (2012?)
What I found was this.
1750 – 1810 : 0,1000 mm pr year 0,6cm (after graph for Amsterdam half tide levels)
1811 – 1860 : 0,4142 mm pr year 2,1cm (Caryl)
1861 – 1890 : 0,9133 mm pr year 2,7cm (Caryl)
1891 – 1920 : 2,1949 mm pr year 6,6cm (caryl)
1921 – 1950 : 1,9615 mm pr year 5,9cm (Caryl)
1951 – 1980 : 0.7133 mm pr year 2,1cm (Caryl)
1981 – 2013 : 2,2624 mm pr year 7,5cm (Caryl)
Some very interesting differences in trends that I have not seen discussed. What kind of natural variations?
Sea level rise 1750 to 2013: 27,5cm
Amsterdam 1800 – 1930: 14 cm (Caryl: 13.4cm) Support the assumption that Amstrdam tide gauge is fairly representative.
These measurements show a sea level increase the last 260 years. In contrast to air temperatures they can show a much more steady ocean warming and ice melting. What is most surprising is the great uptake of energy in the climate system between 1891 and 1920.
“Houston, we have a problem…..”
I don’t know how many here realize this, but the Holocene Epoch turned 11,719 (+/-99) years old this year. ( http://epic.awi.de/12532/1/Ras2005a.pdf ). And that’s the problem.
You see, only one post Mid Pleistocene Transition (MPT) interglacial has lasted longer than about half a precession cycle (MIS-11). The precession cycle varies between 19-23kyrs and we are the 23kyr part now, making 11,500 half…..
Of course, it is inevitable that someone will put forth Loutre and Berger’s early 2000’s 2D model of intermediate complexity prognosticating a 50kyr interglacial ahead. That was soon put to rest by Lisiecki and Raymo (2005) (and many others), the operative quote being:
“Recent research has focused on MIS 11 as a possible analog for the present interglacial [e.g., Loutre and Berger, 2003; EPICA community members, 2004] because both occur during times of low eccentricity. The LR04 age model establishes that MIS 11 spans two precession cycles, with 18O values below 3.6 o/oo for 20 kyr, from 398-418 ka. In comparison, stages 9 and 5 remained below 3.6 o/oo for 13 and 12 kyr, respectively, and the Holocene interglacial has lasted 11 kyr so far. In the LR04 age model, the average LSR of 29 sites is the same from 398-418 ka as from 250-650 ka; consequently, stage 11 is unlikely to be artificially stretched. However, the June 21 insolation minimum at 65N during MIS 11 is only 489 W/m2, much less pronounced than the present minimum of 474 W/m2. In addition, current insolation values are not predicted to return to the high values of late MIS 11 for another 65 kyr. We propose that this effectively precludes a ‘double precession-cycle’ interglacial [e.g., Raymo, 1997] in the Holocene without human influence.”
http://large.stanford.edu/publications/coal/references/docs/Lisiecki_Raymo_2005_Pal.pdf
And then there’s that pesky “human influence” part:
“The possible explanation as to why we are still in an interglacial relates to the early anthropogenic hypothesis of Ruddiman (2003, 2005). According to that hypothesis, the anomalous increase of CO2 and CH4 concentrations in the atmosphere as observed in mid- to late Holocene ice-cores results from anthropogenic deforestation and rice irrigation, which started in the early Neolithic at 8000 and 5000 yr BP, respectively. Ruddiman proposes that these early human greenhouse gas emissions prevented the inception of an overdue glacial that otherwise would have already started.”
conclude Muller and Pross (2007) http://folk.uib.no/abo007/share/papers/eemian_and_lgi/mueller_pross07.qsr.pdf
Adding that together, and performing some tunneling electron(ic) analysis of the literature, we are confronted with this:
“Rapid changes in sea level and associated destabilization of climate at the turbulent close of the last interglacial maximum appear to be recorded directly in the geomorphology, stratigraphy,and sedimentary structures of carbonate platform islands in the Bahamas. Considered together, the observations presented here suggest a rapid rise, short crest, and rapid fall of sea level at the close of 5e. From 132 to 118 ka sea level stayed near +2 m, as evidenced by maximum fossil coral elevation. A rapid rise from this level to +6 m cut bioerosive notches during a stable interval of no more than a few hundred years. Then, at about 118 ka, a rapid fall of sea level abandoned the notches, stranded reef corals, and bared loose, lagoon-floor ooids to littoral and then eolian remobilization before sea level passed beyond bank margin depths. Deteriorating climate accompanied the rapid sea-level fall from the 5e maximum, as evidenced by features in the dunes formed from high winds, torrential rains, and/or large storm waves.”
Rapid sea-level changes at the close of the last interglacial (substage 5e) recorded in Bahamian island geology
A. Conrad Neumann and Paul J. Hearty
https://www.researchgate.net/profile/Paul_Hearty/publication/249518169_Rapid_sea-level_changes_at_the_close_of_the_last_interglacial_%28substage_5e%29_recorded_in_Bahamian_island_geology/links/0c96051c6e66749912000000.pdf
and from the lead author we have this:
“We find a 95% probability that global sea level peaked at least 6.6m higher than today during the last interglacial; it is likely (67% probability) to have exceeded 8.0m but is unlikely (33% probability) to have exceeded 9.4 m. When global sea level was close to its current level (≥-10 m), the millennial average rate of global sea level rise is very likely to have exceeded 5.6m/kyr but is unlikely to have exceeded 9.2m/kyr”
Probabilistic assessment of sea level during the last interglacial stage
Robert E. Kopp, Frederik J. Simons, Jerry X. Mitrovica, Adam C. Maloof & Michael Oppenheimer
http://www.nature.com/doifinder/10.1038/nature08686
And, of course, this:
“The two-stage melting scenario inferred from our analysis of sea-level records from Western Australia suggests the ice sheets may have many interglacial steady states with inherent tipping points that can lead to rapid ice sheet collapse and transitions between states. In this regard, our inferred rise in ESL near the end of MIS 5e is twice the estimate of a ~3m jump based on geological data from the Yucatan24. Moreover, our inference that peak ESL reached ~9m higher than present during MIS 5e is at the upper bound of two other recent inferences. Furthermore, recently published data from the North Greenland Eemian (NEEM) ice core record show a maximum 2m eustatic component from the Greenland Ice Sheet during MIS 5e (ref. 26), this would suggest a greater eustatic contribution from the West Antarctic and possibly East Antarctic ice sheets at this time.”
Ice sheet collapse following a prolonged period of stable sea level during the last interglacial
Michael J. O’Leary, Paul J. Hearty, William G. Thompson, Maureen E. Raymo, Jerry X. Mitrovica
and Jody M.Webster
http://academiccommons.columbia.edu/download/fedora_content/download/ac:169812/CONTENT/O_Learyetal_NatGeo_2013.pdf
and more problematically, we have this:
“This conservative way of assessing uncertainty in the rates of sea-level rise yields the very minimum estimates for the rates of MIS-5e sea-level rise, being 1.3, 1.0 and 0.6 m per century. We thus infer a full potential range for the rates of rise between 2.5 and 0.6 m per century. We also note that sea-level lowering events reveal a remarkably consistent rate between -1.3 and -1.8 (-0.7 to -0.9) m per century (values in brackets refer to a doubled MIS-5e duration).”
High rates of sea-level rise during the last interglacial period
E. J. Rohling , K. Grant, Ch. Hemleben , M. Siddall , B. A. A. Hoogakker , M. Bolshaw & M. Kucera
Nature Geoscience 1, 38 – 42 (2008)
http://www.nature.com/ngeo/journal/v1/n1/full/ngeo.2007.28.html
And then, disturbingly, we have this:
“Investigating the processes that led to the end of the last interglacial period is relevant for understanding how our ongoing interglacial will end, which has been a matter of much debate…..
“The onset of the LEAP occurred within less than two decades, demonstrating the existence of a sharp threshold, which must be near 416 Wm2, which is the 65oN July insolation for 118 kyr BP (ref. 9). This value is only slightly below today’s value of 428 Wm2. Insolation will remain at this level slightly above the [glacial] inception for the next 4,000 years before it then increases again.”
http://www.particle-analysis.info/LEAP_Nature__Sirocko+Seelos.pdf
METHODS:
In evaluating the above, I employed a new, experimental, and potentially diabolical analytical technique known as “Rubbing more than one neuron together”. By incorporating hypocritic matheMANNics into near-infinite do-loop ALGOREithms a phased corruption is sometimes possible between the polished and un-polished turd.
OUTPUT:
Initial output (friction resulting from close encounters of two neurons) suggests that there is little observational support for an extended interglacial “in the Holocene without human influence”.
Additional output indicates that we should have already been undergoing the astonishingly rapid onset of glacial inception (known in geologic slang as the “climatic madhouse”) were it not for “human influence”.
Introduction of a 3rd neuron into the cranial testbed immediately became unstable. Until quantum reversal was employed, logical comparisons between prognosticated anthropogenic induced sea level rises could not be assimilated, mathematically, when numerically compared with what actually did occur at the end of the last interglacial. This was corrected by matheMANNically removing the 3rd neuron from the datasets. It was then possible to see that a projected +0.6 meter AGW sea level rise was over a magnitude greater than an actual +6 – +9 meter rise at the end-Eemian.
By convention, this 3rd neurotic result is now favored for publication.
Whereas one neuron can be of value (see Einstein et al, 20th century), the rubbing of 2 neurons together can be better than their sum. Addition of a 3rd neuron makes it a committee.
But it is that 4th neuron that upsets the applecart. These results suggest that ALGOREithms themselves become highly unstable if a 4th neuron rubs up against at least 3 other neurons!
The 8086 processor we ran these simulations on would lock-up when processing proceeded to anything resembling a logical conclusion. While sifting through the reams of dot-matrix printed output before the processor crapped-out, we were surprised at the oft-repeated suggestion that removing anthropogenic greenhouse gas emissions might actually remove the only known speedbump to glacial inception, and the climatic madhouse that that is.
Periodically, but at a much lower frequency, our 4D model of simplistic complexity would chuck-out things like “perhaps, if we are right, we might want to consider doing nothing at all about AGW emissions for at least ‘the next 4,000 years before it (insolation) then increases again'”.
eND oUTPUT………
We, meaning I, am now soliciting funding to obtain an 80286 based computer, hopefully with an 80287 matheMANNics coprocessor ,with which we can further corruption of the late H. sapien mind.
We now return you to your regularly scheduled propaganda
Is there a documented explanation for the claim of rising sea levels in the face of evidence posted more than a decade ago that it may actually be falling?
See: http://john-daly.com/ for an illustration of the evidence.
How sea level change at some local spots tell us nothing of sea level rise. Ed Caryl had a very good description of what is shown by tide gauge data since 1800. (NoTricksZone April 2014) It is called Mean Sea Level (MSL), which is corrected for Post Glacial Rebound (GSR PGR). There is also a lot of other evidence, like satelite measurements. I think you should follow those who do a serous job finding out from all data. What is really interesting is that there are much natural variation in sea level change since 1750, when the measurements began. When socalled climate scientists claim that there has been no natural variation in global warming since 1950, the tide gauges tell another story.
Well, it is 3.2 mm/year after GIA (Glacial Isostatic Adjustment) applied. The thing is volume of ocean basins is increasing due to ongoing isostatic adjustment even after many thousands of years following LGM (the Last Glacial Maximum). This rate is estimated to be about a hundred cubic kilometers annually. I do not know what data support this claim or how is it calculated and I could find neither a decent dataset nor algorithmic description online. Could someone provide a pointer?
Anyway, if volume of sea water were constant, sea level would decrease at a rate of 0.3 mm/yr according to this claim, for volume of the upper 0.3 mm of oceans is about a hundred cubic kilometers.
Therefore people add this number to rate of sea level rise calculated using satellite measurements. It is very disturbing, because it is not an actual sea level rise but change in ocean water volume, which is measured in cubic kilometers, not in millimeters.
Now, that. Three feet in 84 years would require an average rate of sea level rise of 11 mm/yr in that period, which is 3.8 times more than satellite measured rate of rise since 1992, so it can’t happen without substantial acceleration. Still, no acceleration whatsoever is seen in multi decadal satellite data. Why?
And then, there’s this other thing. Satellites can only measure sea level relative to their orbit, best case. But this orbit changes all the time, mostly decays due to variable upper atmospheric drag. So orbital decay should also be measured relative to a global frame of reference. Unfortunately I can’t find data online about it either.
However, there is another way to calibrate satellite measured sea level data. Sea level is measured at coastal sites for many decades, in some cases even centuries. These sites are called tide gauges. They can only measure sea level relative to their coastal location of course, not relative to a global frame of reference. It is an issue, because coastal regions have their own vertical movement, which can vary widely between sites, due to isostatic adjustment or groundwater depletion or whatever. This rate can also vary over time. In tectonically active regions elevation sometimes changes abruptly after quakes, even by several feet.
So. Tide gauge data can only be used to calibrate satellite measured sea levels, if vertical movement history of tide gauge sites relative to a global frame of reference is also available. Recently it can be calculated using data streams obtained from GPS receivers attached to the tide gauge housing itself. Unfortunately I could only find tantalizing references online, no actual data at all. A pointer, again, would be welcome.
So. As I am not in a position to check claims due to lack of published datasets online, I am not inclined to attribute much weight to this 2.9 mm/yr thing either. Utter lack of acceleration is somewhat more believable, because rate of vertical land movement only changes slowly over time at most coastal sites.
BP:
In case you haven’t checked the Joint Archive for Sea Level for data sources, try this link for starters: http://ilikai.soest.hawaii.edu/uhslc/jasl.html
Historical satellite data only covers, at best, the period from the mid-1970s and relies upon a changing series of gradually degrading orbits and instruments. It has been dependent upon budgetary constraints as well as technical ones. For example, TOPEX/Poseidon was designed to work for up to 5 years but was utilized for at least 12.
The latest satellite launch was the Jason-3 this January.
http://sealevel.jpl.nasa.gov/missions/jason3/
This target accuracy should be compared, IMO, to satellite capabilities in estimating wave heights. For Jason-2 data:
http://www.ospo.noaa.gov/Products/ocean/ssheight.html
Satellite data does not cover near-shore or ice-covered areas. Actual satellite data must be adjusted for tidal forces, orbital oblateness, gravitational anomalies, wave-top scatter, local weather/wind conditions, etc. After all of the various approximations are applied, a great deal of fancy maths produce a single average increase for the entire globe.
As I sarcastically noted upthread, satellite-derived temperatures are useless because there are adjustments. Satellite-derived sea levels are perfect because there are adjustments.
Kent
Global sea level rose faster in the 20th century than in any of the 27 previous centuries
Including the period up to 1970, during which time the models say any AGW would be negligible ?
From Real Climate. S Rahmstorff.
“This week, a paper will appear in the Proceedings of the National Academy of Sciences (PNAS) with the first global statistical analysis of numerous individual studies of the history of sea level over the last 2500 years (Kopp et al. 2016 – I am one of the authors). Such data on past sea level changes before the start of tide gauge measurements can be obtained from drill cores in coastal sediments. By now there are enough local data curves from different parts of the world to create a global sea level curve.”
For the last 250 years: Why use proxies, when there are measurements? They use proxy data after the start of tide gauge measurements, and the results don`t fit very well.
I just posted this at RealClimate:
They don’t have a good history of approving hard questions in the comments and the moderation of course gives them all the time they want to formulate a response so it doesn’t appear unanswered for even a short length of time – the approval and rebuttal then appear in the same instant so that the audience has the official response before they have time to think up an original response.
I also left this in response to Rahmstorf’s ridiculous mewling (enclosed in quotation marks”):
Unsurprisingly my comments at RealClimate have been dismissed in moderation.
As I said they don’t answer hard questions.
RealClimate: Credibility = zero.
“RealClimate: Credibility = zero”
Nothing new under the Mr. Angry Supernova Sun With Craters and Flares banner at RC.
Climate Stasis.
Andrew
RC, despite its slowdown over the last few years, is by far the best climate blog. Like an old library, it has stacks, and they are full of information.
JCH: RC, despite its slowdown over the last few years, is by far the best climate blog. Like an old library, it has stacks, and they are full of information.
RC is worth reading regularly, and I post there occasionally. It is not better than ClimateEtc, and certainly not “by far the best”. It is like an old, old library Both ClimateEtc and WUWT put up higher numbers of new published research.
For those asking about tidal qauges calibrated with geodetic vertical stability, there is the SEAFRAME network in South Pacific.
The South Pacific Sea Level and Climate Monitoring Project developed as an Australian response to concerns raised by members of the South Pacific Forum countries over the potential impacts of the Greenhouse Effect on climate and sea levels in the region. In 1991, the National Tidal Facility (NTF) of the Flinders University of South Australia was awarded the contract to undertake the management of the project.
Eleven monitoring stations were established in the Cook Islands, Fiji, Kiribati, Marshall Islands, Nauru, Papua New Guinea, Solomon Islands, Tonga, Tuvalu, Vanuatu, and Western Samoa, to provide a wide coverage across the Pacific Basin. Each of theses SEA Level Fine Resolution Acoustic Measuring Equipment (SEAFRAME) stations in the Pacific region are continuously monitoring the Sea Level, Wind Speed and Direction, Wind Gust, Air and Water Temperatures and Atmospheric Pressure.
In addition to its system of tide gauge facilities, the Pacific Sea-Level Monitoring Network also includes a network of earth monitoring stations for geodetic observations, implemented and maintained by Geoscience Australia. The earth monitoring installations provide Global Navigation Satellite System (GNSS) measurements to allow absolute determination of the vertical height of the tide gauges that measure sea level.
Data is here:
http://www.bom.gov.au/pacific/projects/pslm/
Those poor Islanders. Doomed by the rapidly accelerating sea level rise…
Marshall Islands:
http://www.bom.gov.au/ntc/IDO70052/IDO70052SLI.pdf
Vanuatu:
http://www.bom.gov.au/ntc/IDO70059/IDO70059SLI.pdf
At least the Cook Islands appear to have a recent increase, if not an acceleration.
http://www.bom.gov.au/ntc/IDO70051/IDO70051SLI.pdf
Yes, opluso. While PSLM is a good initiative, it is only two decades of data to work with, and less at some islands. The highest rate they found at Tonga, and it doesn’t look definitive:
http://www.bom.gov.au/ntc/IDO70053/IDO70053SLI.pdf
Interestingly, this is part of the Pacific that shows the most “sea level rise” during the satellite era.
Oh Acceleration, Acceleration! Wherefore art thou, Acceleration?
http://sealevel.colorado.edu/content/map-sea-level-trends
To the east of Australia? During WW2 my Dad got to watch the land divers on one of those islands.
And the acceleration is there. 2.6mm… now over 4mm, and could remain over 3.75mm once the current spike relaxes.
JCH
No matter how much you lie about global sea level rise, the truth remains the same. It has been rising globally for centuries. How much it changes locally depends more often on changes in land height than on actual changes in sea level.
You’re ridiculous.
JCH:
I’d like to know how you found “acceleration” (or even a trend) in the data for those islands, as opposed to the heavily adjusted satellite altimeter estimates.
I’d also like to know how someone could be crazy enough to bungee jump, but that’s another topic.
GMSL has accelerated. I was not looking at the islands. It would not matter.
http://www.aviso.altimetry.fr/fileadmin/images/data/Products/indic/msl/MSL_Map_J2_Global_IB_RWT_NoGIA_Adjust.png
https://i.imgur.com/W9j5LUc.png
What they have done is identify the difference between an El Nino and a La Nina.
The exact interval selected smacks of cherry picking.
In about a year a rerun of that chart will be much less impressive. A rerun in two years would lead to speculation on where the hole in the ocean is and how to plug it.
Yes, they are so skilled at picking cherries, the got a rocket and launched a new satellite in anticipation of the 2015-2016 Super El Nino cherry.
If you are right in your guess of a multi-year La Nina, there will be no hole… just this again:
http://www.aviso.altimetry.fr/fileadmin/images/data/Products/indic/msl/MSL_Map_MERGED_Global_IB_RWT_NoGIA_Adjust_2015.png
Try this one:
http://www.aviso.altimetry.fr/fileadmin/images/data/Products/indic/msl/MSL_Map_MERGED_Global_IB_RWT_NoGIA_Adjust.png
The island graphs suggest that for a large swath of the inhabited western Pacific (ground zero for scary red map colors), there has been little discernible trend in sea level over the past couple of decades. Yet your final map effort suggests those islands should have graphed a steady range of 5 to 10 mm of sea level increase per year.
Is there a better explanation than assuming islands possess a magical sea level-repelling power?
For now, I’ll go with scientists are not necessarily good with crayons:
http://static1.squarespace.com/static/5511fc7ce4b0a3782aa9418b/t/5536a193e4b04567e5824d04/1429643668996/crayon-art.jpg
Look at Guadacanal. where my father received 5 campaign stars, four on a warship and one in air combat. It says sea level in Metres; mean is green. So what is a good start number for the mean. I’m going with .600 meters. It should peak around 2008. I’m guessing .725 meters. What do you think?
http://www.bom.gov.au/ntc/IDO70061/IDO70061SLI.pdf
JCH
You continually write complete bologna about global sea level. Changes at specific locations are meaningless until you account for changes in local land height.
I think you know this so why do you write such BS
You’re probably right that the Australians have never heard of that. Get on an airplane immediately and get over there and explain it to those CSIRO/BOM noodle heads before they’re all fired.
I hope something measurable happens and soon. I live on an island and on the waterfront. I would love to be able to advertise my home as having a boat mooring at my bottom gate. The local Council, who know about these things, recently increased the notional Mean Sea Level below which floors in structures cannot be built by another 400mm. I would like to include this in sale posters as an inducement to boat owners to look at my property.
My boat only draws 450 mm. I have been unable to bring it closer to the back gate over the last 15 years. Is there a reader out there who could venture a guess how much longer must I wait?
You’re lucky. There’s some states where it is illegal to consider sea-level changes in planning (Republican ones, needless to say).
jimd
can you provide alink or name some of the states? thanks
tonyb
North Carolina coastal counties and Florida for two. I think it is even illegal to mention climate change in the Florida state house. Perhaps this information is old, because it was from a couple of years back, but I mentioned it on this blog when it was in the news. It is interesting to look into again to see if they have moved on.
jimd
florida appear to have strengthened the law requiring sea level changes to be taken into account in planning
https://www.flseagrant.org/news/2015/06/new-law-includes-sea-level-rise-in-coastal-planning/
you haven’t been reading huffpo again have you?
lets see if the Carolinas have their heads in the sand. isn’t that the place that sends wood chips to our drax power station?
tonyb
What I remember about Florida is a video of some state house proceeding where they were trying very hard not to say climate change in some context. It made the internet because of how humorous it was.
jimd
seems the Carolinas are revising their policy in july 2016
http://www.homelandsecuritynewswire.com/dr20150106-n-c-panel-releases-muchanticipated-draft-of-sealevel-rise-forecast
the previous position seems to have been taken for political reasons not because the science wasn’t believed. it seems the powerful property developers saw their lucrative sea front developments being affected by new laws.
tonyb
Yes, it was political, as it always is. Distrust of science has nothing to do with these disputes about sea level or emissions. It starts from the answer they want financially and works backwards.
tonyb, I note that linked report on N Carolina sea rise is concerned with land subsiding.
Here is a video showing 21st century sea level rise projections vs. tide gauge data…
https://climatesanity.wordpress.com/2016/02/28/sea-level-projections-vs-tide-gauge-data/
‘Tomorrow and tomorrow and tomorrow
Creeps in this petty pace from day to day,’
…Thus tidal sea-gauge-rates and satellites
Find land, sea-swallowed in one century,’
Be nothing to dismay, no Hansen-indication
of a Noah-flood-repeating-inundation.
H/t “The Tempest.’
Golly, that’s a tough engineering challenge. How can we possibly protect ourselves from something that changes by 3mm/year?