
by Greg Goodman
On the deceleration in the decline of the Arctic sea ice.
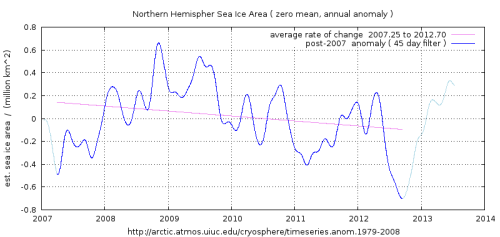
The variation in the magnitude of the annual cycle in arctic sea ice area has increased notably since the minimum of 2007. This means that using a unique annual cycle fitted to all the data leaves a strong residual (or “anomaly”) in post-2007 years. This makes it difficult or impossible to visualise how the data has evolved during that period. This leads to the need to develop an adaptive method to evaluate the typical annual cycle, in order to render the inter-annual variations more intelligible.
Before attempting to asses any longer term averages or fit linear “trends” to the data it is also necessary to identify any repetitive variations of a similar time-scale to that of the fitting period, in order to avoid spurious results.
Method
Short-term anomalies: adapting calculations to decadal variability.
Adaptation can be achieved by identifying different periods in the data that have different degrees of variability and calculating the average annual variation for each period.
Details of how the average seasonal profile for each segment was calculated are shown in the appendix.

Figure 1. The post-2007 interval. (click to enlarge)
The data was split into separate periods that were identified by their different patterns of variation. For example, the period from 1997 to 2007 has a notably more regular annual cycle (leading to smaller variation in the anomalies). The earlier periods have larger inter-annual variations, similar to those of the most recent segment.
An approximately periodic variation was noted in the data, in the rough form of a rectified sine wave. In order to avoid corrupting the average slope calculations by spanning from a peak to a trough in this pattern, a mathematical sine function was adjusted manually to approximate the period and magnitude shown in the data. It was noted that, despite the break of this pattern in the early 2000’s, the phase of this pattern did not alter in the post-2007 section. However, there was a notable drop in level ( about 0.5×10^6 km^2 ). Labels indicate the timing of several notable climate events which may account for some of the deviations from the observed cyclic pattern. These are included for ease of reference without necessarily implying a particular interpretation or causation.

Figure 2. Identifying periods for analysis
The early period (pre-1988) was also separated out since it was derived from a notably different instrument on a satellite with a much longer global coverage. It is mostly from Nimbus 7 mission which was in an orbit with a 6 day global coverage flight path. Somehow this data was processed to produce into a 2 day interval time-series, although documentation of the processing method seems light.
Later data, initially from the US defence meteorology platforms starts in 1988 and had total polar coverage twice per day,producing daily time-series.
In order to maintain the correct relationship between the different segments, the mean value for each segment from the constant term of the harmonic model used to derive the seasonal variations, was retained. The anomaly time-series was reconstructed by adding the deviations from the harmonic model to the mean, for each segment in turn. The calculated anomalies were extended beyond the base period at each end, so as to provide an overlap to determine suitable points for splicing the separate records together. A light low-pass filter was applied to the residual ‘anomalies’ to remove high frequency detail and improve visibility.
The result of this processing can be compared to the anomaly graph provided at the source of this data. The extent of the lines showing mean rates of change indicate the periods of the data used. These were chosen to be an integral number of cycles of the repetitive, circa five year pattern.

Figure 3. Showing composite adaptive anomaly

Figure 4. Showing Cryosphere Today anomaly derived with single seasonal cycle
Discussion
The average slope for each segment is shown and clearly indicate the decrease in ice area was accelerating from the beginning of the era of the satellite observations until 2007. The derived values suggest this was a roughly parabolic acceleration. This was a cause for legitimate concern around 2007 and there was much speculation as to what this implied for the future development of arctic ice coverage. Many scientists have suggested “ice free” summers by 2013 or shortly thereafter.
The rate of ice loss since 2007 is very close to that of the 1990s but is clearly less pronounced than it was from 1997 to 2007, a segment of the data which in itself shows a clear downward curvature, indicating accelerating ice loss.
Since some studies estimate that much of the ice is now thinner, younger ice of only 1 or 2 years of age, recent conditions should be a more sensitive indicator of change. Clearly the predicted positive feedbacks, run-away melting and catastrophic collapse of Arctic sheet are not in evidence. The marked deceleration since 2007 indicates that either the principal driver of the melting has abated or there is a strongly negative regional feedback operating to counteract it.
The 2013 summer minimum is around 3.58 million km^2. Recent average rate of change is -0.043 million km^2 per year.
While it is pointless to suggest any one set of conditions will be maintained in an ever varying climate system, with the current magnitude of the annual variation and the average rate of change shown in the most recent period, it would take 83 years to reach ice free conditions at the summer minimum.
Some have preferred to redefine “ice free” to mean less than 1 millions km^2 sea ice remaining at the summer minimum. On that basis the “ice free” summer figure reduces to 61 years.
Conclusion
In order to extract and interpret inter-decadal changes in NH sea ice coverage, it is essential to characterise and remove short-term variation. The described adaptive method allows a clearer picture of the post 2007 period to be gained. It shows that what could be interpreted as a parabolic acceleration in the preceding part of the satellite record is no longer continuing and is replaced by a decelerating change in ice area. At the time of this analysis, the current decadal rate of change is about -430,000 km^2 per decade, against an annual average of around 8.7 million and a summer minimum of around 3.6 million km^2.
Whether the recent deceleration will continue or revert to earlier acceleration is beyond current understanding and prediction capabilities. However, it is clear that it would require a radical change for either an ice free ( or an less than one million km^2 ) arctic summer minimum to occur in the coming years.
Unfortunately data of this quality covers a relatively short period of climate history. This means it is difficult to conclude much except that the earlier areal acceleration has changed to a deceleration, with the current rate of decline being about half that of the 1997-2007 period. This is clearly at odds with the suggestion that the region is dominated by a positive feedback.
It is also informative to put this in the context of the lesser, but opposite, tendency of increasing sea ice coverage around Antarctica over the same period.

Figure 5. Showing changes in Arctic and Antarctic sea ice coverage
Figure 3. Showing composite adaptive anomaly
Appendix: approximating the typical seasonal cycle
Spectral analysis of the daily ice area data shows many harmonics of the annual variation, the amplitude generally diminishing with frequency. Such harmonics can be used to reconstruct a good approximation of the asymmetric annual cycle.
Here the typical cycle of seasonal variation for the period was estimated by fitting a constant plus 7 harmonic model to the data ( the 7th being about 52 days ). The residual difference between the data and this model was then taken as the anomaly for the segment and low-pass filtered to remove 45 day (8th harmonic) and shorter variations.
This reveals an initial recovery from the 2007 minimum and a later drift downwards to a new minimum in 2012. By the time of the annual minimum for 2013, another strong recovery seems to have started.
This repetitive pattern, which was identified in the full record, is used to define trough-to-trough or peak-to-peak periods over which to calculate the average rate of change for each segment of the data. This was done by fitting a linear model to the unfiltered anomaly data ( using a non-linear least squares technique).
Supplementary Information
The fitted average rate of change for the respective periods, in chronological order ( million km^2 per year )
-0.020

-0.047

-0.088

-0.043
The cosine amplitude, half the total annual variation, of the fundamental of the harmonic model for successive data segments ( million km^2 )
pre 1988 -4.43

1988-1997 -4.47

1997-2007 -4.62

post 2007 -5.14
Mathematical approximation of repetitive pattern used to determine sampling intervals, shown in figure 2.
cosine period 11.16 years ( 5.58 year repetition )

cosine amplitude 0.75 x 10^6 km^2
Resources
Data source: http://arctic.atmos.uiuc.edu/cryosphere/timeseries.anom.1979-2008
(data downloaded 16th Sept 2013)
A extensive list of official sources both arctic and antarctic sea ice data can be found here:
Biosketch: The author has a graduate degree in applied physics,
professional experience in spectroscopy, electronics and software
engineering, including 3-D computer modelling of scattering of e-m
radiation in the Earth’s atmosphere.
JC note: I received this post via email from Greg Goodman. Greg has previously published at Climate Etc. On the adjustments to the HadSST3 data set. This is a technical post, please keep your comments relevant and civil.

Title should be “Inter-decadal Variation in Northern Hemisphere sea ice since 1979.”
My orginal title was : On identifying inter-decadal variation in Northern Hemisphere sea ice
I told Judith she could use her editorial judgement on how she presented it.
The article is about a method to extract the information that is usually masked by the residual of the increased annual variation.
I am always happy to read about curve-fitting. Here you identify “regime changes” about every 8 years. It will be interesting to see what model extrapolation fits best over the next 8 – 20 years.
Nowadays, with current computing technology, including software and the heritage of data analysis, if you can see something in the data you can come up with a model that fits it well. Piecewise polynomials (linear here, splines more generally, and others) can model almost any observed data.
This is not to criticize you as a person, but the result can not be claimed to be a reliable model of an underlying process.
With four parameters I can fit an elephant, and with five I can make him wiggle his trunk. ~Jon von Neumann
Overused quote, but if you must use it:
How many parameters are in the climate models? An order of magnitude more than 5 …and they still don’t look anything like an elephant.
Sucks to be a climate modeler.
https://www.google.com/search?q=%22with+four+parameters+i+can+fit+an+elephant%22+site%3Ajudithcurry.com&btnG=Search&rlz=1T4LENN_enUS461US461
I only get 5 hits on this blog for the von Neuman quote. I’d say it’s underused not overused.
EVERY time it gets brought up TO HARASS unpaid volunteer exploration, we can point to the MASSIVE amounts of government-funneled taxpayer-money spent for MANY decades to produce MULTIparameter mainstream climate models THAT LOOK NOTHING WHATSOEVER LIKE AN ELEPHANT.
“With four parameters I can fit an elephant, and with five I can make him wiggle his trunk. ~Jon von Neumann”
Proves that government & university climate modeling community = u$ele$$ly ma$$ive MULTIparameter white elephant (too sacred to do any real work)
How many parameters are in the climate models?
Lots,but the real problem is the sensitivity not to ecs etc,but to the actual parameters eg Ghil 2008.(also known as error)
The GCM results of temperature increase over the coming
100 years have stubbornly resisted any narrowing of the range
of estimates, with results for Ts in 2100 as low as 1.4 K or as
high as 5.8 K, according to the Third Assessment Report. The
hope in the research leading up to the AR4 was that a set of
suitably defined “better GCMs” would exhibit a narrower range
of year-2100 estimates, but this does not seem to have been the
case.
The difficulty in narrowing the range of estimates for
either equilibrium sensitivity of climate or for end-of-thecentury
temperatures is clearly connected to the complexity
of the climate system, the multiplicity and nonlinearity of
the processes and feedbacks it contains, and the obstacles
to a faithful representation of these processes and feedbacks
in GCMs. The practice of the science and engineering of
GCMs over several decades has amply demonstrated that any
addition or change in the model’s “parametrizations” – i.e., of
the representation of subgrid-scale processes in terms of the
model’s explicit, large-scale variables – may result in noticeable
changes in the model solutions’ behavior.
This was prior to AR4,nothing has changed since,climate sensitivity is still irreducible and random.
The fella was talking about the two-tailed beast he’d seen at the circus in town, which swished flying pests away with one tail and with the other stuffed food into his “Oh, I can’t tell you what he stuffed food into!”
=========================
ONE parameter:
http://judithcurry.com/2013/09/13/open-thread-weekend-32/#comment-379942
How about you show a better way? You always come around p*ssing negativity, but you never show a better way. Destructive behavior is easy. Constructive? Dare you to try.
Paul Vaughan: How about you show a better way?
On present evidence, I think that the future is unpredictable. I have modeled some of the TAO/TRITON data and presented my results at the Joint Statistical Meetings in San Diego in 2012. The effect that I was trying to estimate is too small to be detected in the data: namely, the effect of amount of morning downwelling IR on the timing and extent of subsequent cloud cover.
The data fit today by Greg Goodman have been well-studied and given many models. Anything I do would have the same essential problem: it’s post-hoc and totally unreliable.
My interpretation of your regular attitude:
“don’t do anything — don’t explore — don’t even bother looking at the data — if you dare, people will rudely p*ss negativity all over you.”
unhelpful & rude
Physician heal thyself. Is that overused too?
Paul Vaughan: “don’t do anything — don’t explore — don’t even bother looking at the data — if you dare, people will rudely p*ss negativity all over you.”
I regularly praise the modeling effort before critiquing it. I wrote of Vaughan Pratt’s model that he might have found “the Holyu Grail”. As I wrote of this model, we’ll find out in the future how good it really is.
Scientific knowledge is what remains after all of the conjectures have been scrutinized and the poor ones eliminated. The scientific enterprise is as much like sculpture as construction. Or as much like Darwinian Evolution than intelligent design, despite the immense amount of intelligence invested in it, I did not make that up: many people have written so.
When Prof Curry posted the energy flow diagram of Graeme Stephens I wrote out some conjectures of how a doubling of CO2 would affect those energy transfers. Those conjectures of mine were equally criticized by readers here. My TAO/TRITON modeling was an attempt to estimate the effect of increased CO2 (and associated increase in downwelling IR) on one of those processes: H2O vaporization from the surface of the ocean. The effect, if it exists, is too slight to be estimated from the extant data.
“If you can’t stand the heat, get out of the kitchen.” Harry Truman
OK, Paul Vaughn and Matthew R. Marler are gonna explain it all to us in their joint paper.
================
What mainstreamers unjustifiably assume about the physics is not consistent with the observed choreography, so perhaps what’s needed is rhythmic intervention.
So what does he mean, Matthew? I’m about half serious, here. I think Paul is on to something, and Matthew’s explanations make about as much sense as anyone’s here, to me. Help me, Rhondas.
===========================
Kim: So what does he mean, Matthew?
I don’t know. I’ll consult the BBs.
http://wattsupwiththat.com/2013/09/16/what-people-will-read-and-see-with-the-ipccs-lead-off-illustration-from-the-ar5-spm/#comment-1419204
Wish they all could be like Bob Tisdale.
=================
Tisdale is not helping the “pausers” by twice showing that the decadal averages still keep increasing. What was he thinking?
Be less concerned with halpo and the paws; observe to understand.
===============
I observe the last three decades steadily rising. What do you see?
The Chef just showed it again, for the not quite first time, clouds change sign from the girl child to the boy one. Dragons in the western sky, playing, playang.
================
ENSO mirage blurs perception. Specifically, the implicit (probably darkly unconscious in many cases) assumption of spatiotemporal uniformity fails simple diagnostics. Due to insufficient attention to due diagnostics, flawed conceptualization foolishly pools across disparate categories. This leads to paradoxical (in the statistical sense) misinterpretation.
“Dear Lady
Can you hear the wind blow?
And did you know?
Your stairway lies
on the whisperin’ wind.” — Led Zeppelin -$tairway to Heaven
So… not the time to look for a Northwest Passage or you might end up like Franklin’s lost expedition?
Am I the only one who objects to fitting the data to a straight line when there is clearly so much going on that it would be a minor miracle if the net effect was linear?
No, I also object to fitting a straight line. That’s why I identify significant non straight line variations to avoid going peak to trough, as explained in the method section. Then I don’t fit “a” straight line I fit four. It’s a kind of low pass filter.
If I’d fitted a function like a 100y sine or a quadratic I’d inserting assumptions about the nature of the system. The separate lines do not impose anything on the inter-decadal variaitons.
I leave that up to the eye of the beholder.
Eyeballing fig1 suggests to me an arc, not a st line. I wonder if something is waxing &waning while hidden in the max & mins ?
Greg Goodman, why not choose (1) ice-volume rather than ice-area, and (2) spiral rather than linear graphics?
The resulting graphics conveys far more climate-change information, far more clearly, in far less space
Edward Tufte!
Because we have detailed OBSERVATIONAL DATA for ice area.
“PIOMAS data” is not data, it’s model output. A common point of confusion in this field.
Fan is a troll, dude.
Please don’t feed the trolls.
essentially the reason why Hansen looks at air temp and people critcicized Pielke Sr. for suggesting that we look at OHC
LIL … Streetlight Effect!
You seem to have your favourite model of a streetlight. Hope it helps you find your keys.
I find observations more convincing.
Greg Goodman, aren’t PIOMAS errors (of order ±10^3 km^3) negligibly small compared to the observed spiraling ice-loss?
What is your rational/scientific grounds for rejecting the (low-noise) PIOMAS ice-loss data?
Just take a look at their dress code for the future…
http://www.dailymail.co.uk/femail/article-2421271/London-Fashion-Week-Vivienne-Westwood-attempts-eco-fashion-help-Lily-Cole.html
observe how their flowing data wraps about each models elusive form as they each take turns walking the catwalk, like an…
Once itwas globull warming, then er …climate change
or … gasp, climate disrupshun.
Once it was ice extent and then er …piomass data …
plus ca change, fan oh fan.
bts
“Climate iffyness”
“Deep doo-doo climate trouble”
“I never saw a climate I really liked”
“Climate suspiciously seems, I dunno, kinda funny”
“I never saw a climate I really liked”
I don’t care to belong to any Climate that will have me
“I don’t care to belong to any Climate that will have me”
Never give a climate an even break.
Good link TonyB. This is the appropriate timescale for the estimation of the bounds of natural variability, pity that the grainy resolution of paleodata doesn’t show the spikes very clearly in this graph.
Climate is hard to predict, especially future climate.
==================
Climate climacteric cometh and soon!
Date, but not data, provided on request.
… or should that be ‘climactic?’
Great spiral, but why don’t you update it to reflect this year’s data?
“Danger Will Robinson, Danger!” FOMD is a troll and can be counted on to evoke his god, James Hansen, any moment now.
http://youtu.be/REvmhBO99I4
Hansen notes: “Temperature is now near the upper end of its range during the Holocene, the interglacial period now more than 10,000 years long, which is the climate that civilization is adapted to.”
Iolwot
Wiki needs to be updated then to take into account the hot news from Hansen.
http://en.wikipedia.org/wiki/File:Holocene_Temperature_Variations.png
I am still waiting for his reply as to why the earth should have been warming for the last 3/400 years yet everyone remains under the impression it is recent. (see small graph inset into main one)
tonyb
In science, there is no substantial difference between doesn’t read and can’t read, eh TonyB?
The Arctic seems a little warmer than it has been for a while.
http://www.nytimes.com/imagepages/2013/04/21/blogs/dotkaufman.html
Doesn’t seem likely to last.
Sorry, nested my response to TonyB’s link in the thread immediately above.
It does rather look as though the ice has been on a downward slope of a sinusoid with a period of ~60 years.
If so, the trend line should become positive in the next 10 years or so. Time will tell!
That is one possibility , though I’d say from the shape,60y is too short. At a guess more like 100y if it is really of that form. OTOH may be it is rectified sine like the circa 5.5y pattern. What is commonly refered to as “60y cycle” may be a rectified 120, for example.
It really is too soon to make any such speculation.
I see the main point of the data we have so far as being the end of what could reasonably have been read as parabolic acceleration until 2007. The last six years seems to draw a line under the idea of run-away melting.
An explanation for the apparent 5.5y pattern would be interesting to look into.
Ok, so it may decelerate at some point. The volume may stabilize as the ice right next to Greenland will be the last to go. But right now, anyone can use their eyes and see the decline of area and of volume in the Arctic sea ice.
More interesting to me is whether Goodman still believes in his theory that the atmospheric increase in CO2 is due to temperature increase.
That bizarre theory demonstrates what happens when the time series analysis is done incorrectly.
Will Goodman walk that one back?
Arctic temperatures are at ~20 C below freezing point of water for 6 months out of the year. The decrease in sea ice max. extent (area) is ~ 2.5% per decade. Do you expect arctic temperatures to increase by 15 C or more year round? Alert me when you have evidence of this.
WebHubTelescope: More interesting to me is whether Goodman still believes in his theory that the atmospheric increase in CO2 is due to temperature increase.
As you undoubtedly know, Murry Salby makes the case in his textbook and his lectures. The case is based on studying the rates of change of CO2 and temperature in relation to the mean values of CO2 and temp. If there is an evidence-based disputation of that evidence-based argument, perhaps you could provide a link. I have not found one yet.
Anybody who disputes the standard explanation of the increase in CO2 concentration must tell where the CO2 that humans have released has gone. As long as nobody has been able to offer anything even remotely plausible, we have only one logically valid explanation. Salby has not presented anything like that.
Besides that you know enough about statistics to understand that Salby’s evidence is worse than full of holes. It’s nothing but a big hole. Causes of a trend cannot be determined by looking at variability in detrended data.
obviously Pekka, it’s been absorbed in cold ocean areas. the extra CO2 in the atmosphere meanwhile is outgassing from warm ocean areas. the mass balance is [annual increase in ppm CO2 in the atmosphere]*[mass of the atmosphere]. QED.
Could be cold ocean biome.
=====================
Got that one thanks to the fish.
===============
billc,
So your explanation is that oceans are the source of the increase of atmospheric CO2 while they absorb more CO2 than emit.
What’s the evidence for that?
It’s an unknown unknown how the biome and the carbon cycle in the warmer and cooler oceans interact.
====================
Better, ‘there are unknown unknowns in how the…’
====================
Pekka, what do you mean where has the anthro CO2 gone? It goes into the carbon cycle, which means some into terrestrial systems and some into ocean systems. Pretty much all of it is gone in 5 years or so. This is well known. The cause of the rise is a very different issue. The primary evidence for a non-anthro cause is a close correlation between SST’s and the CO2 rise.
On the other hand we certainly do not know how much CO2 the ocean emits, most especially not where or how much it changes year to year in any given region. Nor how much is taken in. For example, how much CO2 did the Gulf of Mexico exchange last year? How much out and how much in? We have no global monitoring system and no proper set of measurements. Claims to know these things globally are unfounded speculations.
Pekka Pirila: Besides that you know enough about statistics to understand that Salby’s evidence is worse than full of holes.
. If you could link to a detailed critique, I would appreciate it.
MattSatt, ” If you could link to a detailed critique, I would appreciate it.”
The university ate his homework
This is one of those issues that has been understood so long that research has switched decades ago from the overall picture to details. Papers continue to be published on the details of the carbon cycle. Some of them study terrestial biosystems and storage of carbon in soil, others study the oceans in further detail. There remain uncertainties in the quantitative details, but they are not close to the level of changing the overall picture.
Look for papers on the carbon cycle to learn more. I add a few more points below.
The annual variability is significant, according to the research it’s mainly due to variability in the land ecosystems, most importantly tropical forests. They cannot, however, accumulate much carbon, because there’s little carbon in the soil of rainforests. This variability was misused by Salby when he just added together the years of increasing atmospheric concentration forgetting that the intervening years cancel the effect.
The relationship between the amount of dissolved inorganic carbon in surface ocean and atmospheric concentration is fairly well known. The temperature dependence of that might explain an increase of a few ppm (less than 10) as a reaction of the warming of oceans. Any larger increase in atmospheric CO2 concentration leads to CO2 flux from atmosphere to ocean. Thus oceans can act only as a sink, when CO2 concentration has increased more than 10 ppm and the oceans have not warmed more than they have.
All kind of explanations can be presented when individual years are considered, but over decades the releases from burning fossil fuels have been so large that there are really no alternatives for the simple and straightforward explanation: About half of that has remained in the atmosphere so far, while most of the rest has gone into the oceans and a smaller part in soil and terrestial ecosystems.
Pekka didn’t get the memo. The CO2 that humans have released has gone the same way as the missing heat. It’s tucked away in the cold abysses of the oceans. Transported down there the same way the missing heat got there. A hop, skip and a jump. What’s good for the goose…
There’s one very essential difference: The atmospheric CO2 concentration increases smoothly with some seasonal variability and a little interannual variability around the smooth trend. Based on that it has been possible to develop semi-empirical models that produce rather accurate projections for the atmospheric CO2-concetrations for given emission scenarios for several decades to the future.
What exactly happens for the CO2 that doesn’t stay in the atmosphere is not as well known, but that becomes really important only in the very long term considerations.
The situation is certainly much better than it is for any other projections related to the future changes in climate, only when periods considered extend to centuries may the persistence of carbon in the atmosphere become one of the major sources of uncertainty.
I was just joshin you, Pekka. Your preferred explanation on the source of rising atmospheric CO2 is most plausible. Now please tell us how the missing heat skips it merry way down to the frigid depths. I am sincerely interested to know your opinion.
“As you undoubtedly know, Murry Salby makes the case in his textbook and his lectures. ”
The more compelling argument to me is the isotope ratio one – the consensus says “see this averaged isotope ratio matches perfectly with estimates of human emissions, QED, we done it”, Salby says “look at the high frequency (non averaged) data, and this argument falls apart”. And indeed it does appear to. I haven’t seen an argument that this is something done incorrectly etc, or some alternative explanation for this data – instead, all I have seen is people citing the average and saying “it’s obvious” – oddly enough, some of the same people complain about cherry-picking temperature data.
Don, you might have missed it, but Pekka has spoken about it and isn’t rock solid sure about the missing heat. He’s been critical of the research. This is one of the reasons I read Pekka carefully; an alarmist with scientific integrity.
Once he realizes we can’t warm the Earth dangerously, he’ll be a marvelous advocate for temperate policy.
==========================
I gotta question, Pekka; how does the sawtooth pattern come most importantly from tropical forests if it is reflecting a Northern Hemisphere phenomenon? Maybe there is just that much more land in the North, and the tropical forests in both tropics balance out.
===========
“Now please tell us how the missing heat skips it merry way down to the frigid depths.”
pff not that crap again. Are you saying the depths cannot heat up?
C’mon lolwot, that’s an SkS caliber response. He said how, not can. Mebbe he’s from Missouri and wants to be shown the data marking the voyage deep.
As would we all. It would be nice to have some in reserve for the end of the Holocene.
==============
If there’s no how there can be no can.
kim,
Yeah, I asked Pekka because I respect his opinion. Don’t recall seeing him comment on the missing heat story.
lolly,
You are a useless little twit. Now get back to your squalid little laboratory and try to animate some more strawmen.
I was wondering what they’d done with the real lolwot and up he jumps at 8:27 Post Meridion.
==============
Don you’ve had months to google your question about how does heat get into the depths.
That you haven’t done so suggests you simply enjoy asking the question.
I wonder why.
> Now please tell us how the missing heat skips it merry way down to the frigid depths.
A synchronous dance, some confidence with your word, and a little bit of mischievous danger might help.
I know how heat can get into the depths, lolly. I am asking a reasonable and intelligent person-not you- how the alleged “missing” heat could hop skip and jump into the abysses, without leaving any freaking footprints on the way down. If someone-obviously not you-has a reasonably plausible explanation, then I would ask why the allegedly unnatural heat of the last half of the last century could not have been a regurgitation of missing heat sequestered in the ocean depths at some earlier time. Try to dress your strawmen better. They are very shabby.
Don Monfort,
I have actually made some comments on the missing heat problem stating essentially that I don’t think that it has been resolved. Numbers that can been determined with sufficient accuracy cannot tell what’s going on. The recent Lyman and Johnson paper concludes that the estimates of the rate of increase of OHC are highly dependent on methodological choices when extended back to periods of seriously lacking global coverage. (I don’t know enough about the issues involved to judge, whether Lyman and Johnson are right.)
For depths 700-2000 m only ARGO has provided sufficient coverage. The period of ARGO data is too short for good determination of the rate of increase of OHC. In addition there has been too little time for sorting out all issues related to using ARGO data. (From the annual averages from ARGO measurements the rate of 0-2000 m OHC increase is 0.63±0.29 10^22 J/year. based on the error bars for the annual averages given at http://www.nodc.noaa.gov/OC5/3M_HEAT_CONTENT/index1.html . I’m not sure, whether the error bars can properly be taken to represent independent errors for each year.)
The earlier data from 0-700 m appears consistent with a longer lasting trend similar to the recent ARGO data for 0-2000m, but cannot confirm that.
The amount of OHC increase from depths greater than 2000m is very badly known. My conclusion is that the oceans may take have taken all the heat they have been claimed to have taken, but that has not been confirmed by the measurements. The best estimates are a bit low for that, but the uncertainties large enough for consistency.
Thanks, Pekka. You are a gentleman and a scholar.
@Don Monfort…
Several speculative explanations:
– There is a strong flow of cold water into the depths at each pole. Relatively small changes to the rate or average temperature of the water in this flow might produce an average warming in the depths.
– Large, “mesoscale” eddies can potentially produce turbulent forced convection that mixes warmer surface into the depths, carrying heat with it. These eddies are of roughly the same size scale as large tropical cyclones, so changes to the nature and average tracks of such storms could potentially change the balance of heat flow into, and out of, the depths. I would expect the largest vertical mixing to take place in regions where the bottom has a substantial relief, such as the Western Pacific and Caribbean (see here). Changes to the rate of vertical mixing could plausibly result from changes to tropical storm activity in these areas. They could also result from changes to the depth of the thermocline in these areas, especially in the Western Pacific. (IIRC the ENSO is associated with substantial changes to the thermocline depth.)
– Much of the CO2 in the atmosphere is fixed by marine algae, and much of the resulting reduced carbon sinks into the depths, where it is oxidized. This oxidation produces heat. Changes to the amount of sinking carbon, and/or the pattern of oxidation depth, could produce changes to the balance of heat flow into, and out of, the depths.
I haven’t actually calculated the relative orders of magnitude of these mechanisms, and couldn’t find such calculations in a quick search, so they much remain speculative, although the first obviously has the potential to be large enough. Note that all three mechanisms are independent of the actual rate of temperature decline, so could not necessarily be expected to leave “any freaking footprints on the way down” (although they could).
IMO the most immediate question WRT the apparent increased heat in the depths is to look much more closely at the “reanalysis” products that are purported to show it. There may be some way to localize the increased temperatures, which might provide clues to the mechanism.
AFAIK the majority of upward heat flow from the depths is concentrated in the upwellings along the western tropical/sub-tropical continental margins. Greater heat in the depths would presumably be expressed as slightly warmer waters in these currents. I suppose this could result in greater evaporation, and perhaps a higher inversion. If the higher inversion has a follow-on effect on the inversion following the trade winds east, it could perhaps result in higher temperatures, and greater evaporation, in much of the marine tropics, which in turn could carry heat to the land. So could a reduction in the downwards flow of heat over the entire ocean surface, due to increased heat in the depths. I’m fairly skeptical any of this would be large enough to influence GAT to even the extent observed, although I don’t see how it can be ruled out.
Thanks, AK. So the missing heat is still missing. Right?
@Don Monfort…
Some combination of “missing” and “artifact of bad expectations/analysis”. There may have been some higher flow into the deep ocean, and it’s not completely impossible it’s connected with the “pause”. Only somebody coming at the problem with preconceptions that there’s “certainly” an energy imbalance could regard the probability as greater than “not completely impossible“. IMO.
WebHubTelescope and Pekka Pirila: Here is a blog item on the oceans as a source of CO2. There is a link to the published abstract and a link to the full prepublication paper.
http://hockeyschtick.blogspot.com/2013/09/new-paper-finds-oceans-are-net-source.html
According to their estimate, the oceans release much more CO2 into the atmosphere than does the human combustion of fossil fuels.
Prof Curry: the paper might make a good discussion piece.
Where would all the carbon go when the anthropogenic releases are so large and oceans would be a net source?
Not everything that you may find from internet is credible.
Pekka Pirila: Not everything that you may find from internet is credible.
That’s why I downloaded the paper. I recommend everyone to read the published abstract and download the paper.
the blog links to other papers on sources of CO2.
Good question. It applies to the roughly half of the volume of CO2 released since the beginning of the Industrial Revolution even in the “consensus” position.
Contrary to popular myth, the carbon cycle is very poorly understood, and the assumption that the increase in atmospheric pCO2 is due to fossil carbon emissions is totally unsupported except for the apparent rough correlation of pCO2 with fossil emissions – a correlation that Salby is questioning in the data.
Sorry: “the roughly half of the volume of CO2 released since the beginning of the Industrial Revolution ” that isn’t represented by increase in atmospheric pCO2 …
Matthew and Pekka
According to the CDIAC and WEC, humans emitted around 30 GtCO2 per year over the past several years.
Yet only around half of this ended up in the atmosphere, with the rest being absorbed by the biosphere, oceans, soils, lithosphere, etc.
Most assumptions are that the oceans are net absorbers (“ocean acidification” premise).
The cited paper shows that the ocean is not gaining CO2, but rather a net source of CO2, so there is no net “ocean acidification”.
The cited paper shows a figure with the sub-heading:
IOW, the ocean contributes 0.5 Petagrams CO2 per year (= 0.5 GtCO2/Year) to the atmosphere.
This is relatively small compared to human CO2 emissions.
But the real question is, “if the ocean is a net contributor to atmospheric CO2 rather than a net absorber, where is the ‘missing CO2’ going?”
Inasmuch as this percentage has increased since Mauna Loa measurements started, by around 1% per decade, something appears to be happening that is correlated to the atmospheric concentration.
http://farm9.staticflickr.com/8344/8200196434_ebb7559913_b.jpg
Is it going to increased plant growth, as some people have estimated?
If so, will this percentage (and resulting plant growth) continue to increase, as atmospheric CO2 increases?
Or is it leaving Earth entirely?
I’m afraid we do not have answers to these questions.
Max
I wrote my comment as reaction to the title of the referring page. The paper itself tells that their estimate of net efflux for the direct exchange between the ocean and atmosphereconcerned a pre-industrial simulation is 0.5. Furthermore they had an influx of 0.8 from rivers leading to a net influx of 0.3 when everything is included.
In this case the error was made by the referring web page, while the paper itself didn’t present any support for that.
I guess this is just a typical example of totally erroneous contributions to the blogosphere.
AK,
It’s true that the carbon cycle is not well understood in the sense that there remain major uncertainties. They are, however, of the order of 10% of the anthropogenic releases, not at a level that could change the overall picture.
The uncertainties are much more important when the long term persistence of additional carbon in the atmosphere is concerned, not the first few decades that determine largely the present concentration.
‘Gross fluxes generally have uncertainties of more than ±20% …’ AR4 7.3.1.1
The uncertainties are in other words greater than anthropogenic emissions. Much greater in some cases evidently.
There have been – it seems – substantial increases in respiration in soil and in tropical vegetation carbon flux. It is temperature related and total some 75% of anthropogenic emissions. Where is all the extra carbon going? Is this an open question?
I suspect that there is much greater natural volatility in atmospheric carbon content than the ice cores suggest.
http://s1114.photobucket.com/user/Chief_Hydrologist/media/Steinthorsdottir_CO2_stomata_2013_zps0180f088.png.html?sort=3&o=12
http://www.academia.edu/2949675/Stomatal_proxy_record_of_CO2_concentrations_from_the_last_termination_suggests_an_important_role_for_CO2_at_climate_change_transitions
The calculated pCO2 levels in Steinthorsdottir et al. are, AFAIK, totally inconsistent with the usual picture provided by ice cores. This works together with Salby’s effort to deprecate the ice core data, suggesting that there’s been much more variability during the last 10-20Ky than is usually assumed. This, in turn, suggests that the so-called “climate sensitivity” is a fantasy: a myth without a referent.
This is something that deserves a careful look, as it may destroy the entire CO2-based “global warming” prardigm.
Yeah sure, why would I even remotely want to trust anything some blog called “hockeyshctick” says.
Lets have an actual expert, a qualified scientist, preferably in the field of the study to communicate what it says. cowboys on some blog who by and large are going to misinterpret and misunderstand according to their biases.
As far as I am concerned nothing has happened here.
This belief that excess CO2 is NOT caused by man, is the “jump the shark” point at which one can only conclude that the deniers on this comment board are insane.
Bring this topic up and you can smoke them out.
The skeptics are not actually skeptics but are gullible fools that can be swayed by the incorrect analysis of people such as Salby and Ole Humlun and others.
To me, it has never been about how correct Hansen with respect to the physics, it is about how wrong the supposedly scientifically astute deniers can demonstrate to us time and time again.
@w
hnut…No science at all, just slimeball rhetorical tricks.
Pekka said, “Furthermore they had an influx of 0.8 from rivers leading to a net influx of 0.3 when everything is included.”
Charberlin’s erosion CO2 scrubbing process was considered I presume.
We tire of the BS, AK.
Go get an expert to discuss these papers. Stop pretending your blogs are able to competently understand what the papers say.
@WNUT…
Getting sort of desperate are you? I’d certainly like to know for sure whether Salby’s got something so I know whether to waste my time pushing biomethane and strategies based on it. Accusations of insanity and stranding him in Europe by canceling a non-refundable ticket aren’t science, what they do is suggest that defenders of the paradigm don’t have any valid response.
The truth is that the denialists can not resist from asserting that EVERYTHING that climate scientists discover from their research is wrong.
They assert that excess CO2 is not anthropogenic.
They assert that burning of fossil fuels, by itself, is all that can cause warming.
It follows that they will assert that CO2 is also a cooling gas and they will assert that it has no GHG properties.
All these assertions get piled on top of each other, and is it any wonder that the deniers get the reputation as kooks?
It is the same piling on that goes into kooks that believe in UFOs and the paranormal. They feel absolutely no shame in stringing together preposterous lines of evidence, because they can always find people that will marvel at their work.
@WNUT…
More slimeball rhetorical tricks.
Webster, “The truth is that the denialists can not resist from asserting that EVERYTHING that climate scientists discover from their research is wrong.”
It is or they would not include the , “More research is required” blurb. Estimates can be refined and errors in estimates can tend to cascade. Climate science just had the problem of two camps that got merged in a “consensus” building process instead of a competitive race for the truth process. Where have you been during all this?
Webby
I think you are missing the point here.
No one in his right mind denies that humans are emitting around 30 GtCO2 per year.
Nor would anyone deny that atmospheric CO2 is increasing at an average rate of around half this amount.
So it is evident that human CO2 emissions are contributing to the net increase in atmospheric CO2.
But the unanswered question is, “where is the missing CO2 going?”
The “consensus crowd” (you included?) seem to believe that it is going principally into the ocean, causing a gradual reduction of the pH (so-called “ocean acidification” hypothesis).
Yet there appears to be evidence suggesting that the ocean is a net emitter of CO2, rather than an absorber, so it must be going somewhere else.
Another bothersome and unexplained fact is that the percentage of the CO2 emitted by humans, which “remains” in the atmosphere is slowly decreasing, by around 1%-point per decade, since Mauna Loa measurements started.
There have been suggestions that the biosphere (photosynthesis) may be where a good part is going, and that this process is increasing as atmospheric CO2 levels are rising (plants love it!) and average temperature is also increasing slowly.
This could explain the gradual decrease in the %-age of the CO2 released by humans, which “remains” in the atmosphere.
The facts on the ground are in direct conflict with the IPCC claim (AR4 WG1 SPM, p. 13) that
As we see, the “fraction of anthropogenic carbon dioxide that remains in the atmosphere” has decreased since 1959 (rather than increased), even though there has been a modest global warming over the same period – so something else is happening, which IPCC is apparently not aware of.
It also raises questions concerning the validity of IPCC’s “climate-carbon cycle coupling” hypothesis, whereby a warmer ocean will emit more CO2, resulting in an increase in the atmospheric concentration (and more GH warming) some day in the distant future.
IPCC projects that “climate-carbon cycle feedback increases the corresponding global average warming at 2100 by more than 1ºC.”
It also cites this hypothetical “feedback” as the basis for reducing cumulative CO2 emissions to stabilize atmospheric concentrations (AR4 WG1 SPM, p.16).
IPCC presents all sorts of imaginary hypotheses and hobgoblins for the future, but skirts around the real question:
Where is the missing CO2 going and why is the “fraction of anthopogenic [CO2] emissions that remains in the atmosphere” decreasing with global warming, rather than increasing?
Any ideas, Webby?
Max
Here’s a thought – you might try reading the paper numbnut.
Max – we should also remember the large uncertainties there are in these estimates. The question of where the carbon is going is of interest for long term biogeochemical cyclers like you and me.
But it hardly changes the basic fact of large and exponentially growing emissions.
But I do get so bored with the space cadets – so little understanding and so loud a whine. Empty vessels and all that.
“Yet there appears to be evidence suggesting that the ocean is a net emitter of CO2, rather than an absorber, so it must be going somewhere else.”
Appearances can be deceptive.
I’ll tell you what’s happening. You know, the far most likely explanation for all this: The paper under discussion simply doesn’t say what skeptics are claiming. Skeptics are reading a paper that goes over their heads through denial tinted goggles and fashioning phantom meanings that just so happen to align with their agendas.
Put simply, the blog “hockeysthick” is simply not a reliable source for reporting complex studies such as this. So no there is no “evidence suggesting” anything here. There’s just some unreliable interpretations at a blog.
Pekka Pirilä,
I see I have been misspelling your name. I apologize.
lolwot: Put simply, the blog “hockeysthick” is simply not a reliable source for reporting complex studies such as this.
Hence the necessity for reading the published abstract and the paper.
As a rank ordering, “hockeyshtick” is more reliable than you are.
WebHubTelescope: The skeptics are not actually skeptics but are gullible fools that can be swayed by the incorrect analysis of people such as Salby and Ole Humlun and others.
I look forward to a detailed refutation of Salby.
Matthew R Marler writes:
“Hence the necessity for reading the published abstract and the paper.”
There is no necessity. Unless you are a fan of uncovering the errors made by hockeyschtick.com there’s no point reading any particular paper cited by that blog.
Well, Since everyone is interested in CO2 and how heat gets into the deep ocean without “forcing”, here is a paper that tries to model some of that.
http://journals.ametsoc.org/doi/pdf/10.1175/jcli3984.1
Of course it focuses on the red haired stepchild of climate change, that southern ocean, but it might be of interest.
lolwot said:
+10.
To top that off, not one of these guys could solve a diffusion equation if their life depended on it.
They would rather summon fairies and quote Feynman than dig into the books and study concepts such as statistical mechanics.
lolwot:
“Skeptics are reading a paper that goes over their heads through denial tinted goggles and fashioning phantom meanings that just so happen to align with their agendas.”
You wouldn’t be talking about me? Lol, good one.
It had a picture in it though, what’s with the SH oceans?
If “hockeyshtick” has less than 100% “credibility”, let’s say:
hockeyshtick: 50%
webby: 10% (he at least talks like he understands basic physics, even if he has swallowed the IPCC CAGW pitch, hook, line and sinker)
lolwot: 5% (look for the occasional but rare “nugget”)
fan: 0% (total loss, including emoticons)
Max
Chief
Agree with you.
The atmosphere is gaining somewhere around 15 GtCO2 per year.
Humans are emitting somewhere around 30 GtCO2 per year, so this input definitely has an impact on the overall balance and on the net increase in the atmosphere, no matter how much larger the overall carbon cycle may be.
But the unanswered questions are:
– where is the “missing” half of the human emissions going?
– why has this fraction increased by around 1%-point per decade since Mauna Loa started in 1959?
– will it continue to increase as atmospheric concentration increases, and if so, why?
– what is the long-term temperature impact of the increasing atmospheric CO2?
– what role have plants and soil played in sequestering the added CO2?
– what is the long term impact on vegetation and human crop yields of the increasing atmospheric CO2?
– can we expect a beneficial “re-greening” of deserts as a result of higher CO2 concentrations?
– etc.
IPCC obviously does not have the answers to these questions.
It even erroneously ASS-U-MEs (and claims) that a slightly warmer world will mean that a larger fraction of the human emission will remain in the atmosphere, even though the facts on the ground have shown just the opposite since 1959 – oops!
And IPCC conjures up the “climate-cycle carbon coupling feedback” hobgoblin, which supposedly will add 1 degree C warming by 2100 all by itself – ouch!
So, yes, there are still many unanswered questions – and a bunch of silly assumptions – out there.
Max
I don’t think there’s much value in looking at the 2nd derivative based on so short a period.
That may be a valid point. But since 97% of the planet seems convinced that there is “accelerated melting” …. death spiral etc. , we are rather obliged to look at the data and see whether it supports such claims, even provisionally.
Nice comeback.
The death spiral concerns summer minimum, not the full year. To test a death spiral you need to test the trend in summer minimums over time. You have run trends over the entire annual data (including winter) which cannot do that.
Greg Goodman: But since 97% of the planet seems convinced that there is “accelerated melting” …. death spiral etc. , we are rather obliged to look at the data and see whether it supports such claims, even provisionally.
Just so.
The “death spiral” and such claims were based on a short-term apparent deviation from a 25+ year trend. Six years on, Greg Goodman’s modeling shows that the earlier alarmism was unsupported by subsequent data and analysis.
David in Cal: I don’t think there’s much value in looking at the 2nd derivative based on so short a period.
A few years ago (I am sorry that I have lost the details), someone fit a second order polynomial to the data through about 2007 and concluded that the summer Arctic Sea ice loss was accelerating. This was accompanied by one of those death spiral warnings and the prediction (“which might be conservative”) that the Arctic would be ice free in the summer of 2013. Some cruel curmudgeon argued that extrapolation of polynomials was extremely unreliable, even though the coefficient of the quadratic terms was statistically significant.
The alarmists have turned this game of extrapolating short records into a national pastime. There don’t seem to be any rules except “The other side isn’t allowed to do that!”
oops “quadratic term”
It snows more when oceans are warm and wet.
It snows less when oceans are cold and frozen.
Actual data shows that temperature and sea level goes up and down in phase with these changes.
This post is nothing but a lot of mindless numerology. It is no better than an Elliott Wave Theorist who thinks they can discern future market trends based on some patterns they believe they see in the data. That isn’t science, and this isn’t either.
I would hope that someone holds you accountable for your predictions, but I doubt anyone believes you enough to even keep track of them.
“This post is nothing but a lot of mindless numerology. It is no better than an Elliott Wave Theorist who thinks they can discern future market trends based on some patterns they believe they see in the data.”
If you think you have figured out THE trend, yes, it is a waste of time. If you consider that it is A possible trend, then it is not completely mindless. The stock markets, weather, climate and other chaotic “systems” do tend to have recurrent patterns that you can’t count on but you can’t exclude either.
You seem to be having trouble keeping track already, there is no prediction here. That makes your comment “mindless”.
Nice try.
In fact, there are several predictions — “61 years,” “83 years,” and more. You don’t even take you analysis seriously enough to decide on one, which means I shouldn’t take this post at all seriously. = waste of time.
Your reading comprehension skills seem to be holding you back David. Please don’t feel you need to waste any more of your time trying.
Well David, on this subject I would tend to agree with you.
At the beginning of most years of teaching science, I would use a quote from Mark Twain that began with a long and preposterous prologue and the following short conclusion.
‘There is something fascinating about Science, once gets a wholesale return of conjecture from a very small investment of fact’.
The long term, quite vague, history of the Arctic along with a relatively short period of widely variable facts allows for very little concretely accurate analysis.
That reply was to David’s first writing, not his second!
—-and then not all of his first.— I agree with the fact that what was done was about as much as could be done
So you don’t believe you know what the future trend will be because it’s just numerology?
Hahaha… it’s numerology when the forecast doesn’t fit your ideology and it’s science when it does. Is that about how it works?
The ‘models’ all get polar heating wrong, with ice melting more rapidly in the North and ice accumulating in the South, than the models predict.
Yet Appell is a cheerleader for the models and hates that someone would put forward an analysis, not prediction, but an analysis of a complex phenomena.
How odd.
David Appell: I would hope that someone holds you accountable for your predictions, but I doubt anyone believes you enough to even keep track of them.
It will be interesting to see what happens during the next 8 years. But I repeat myself.
David,
If so, then what would you call the various studies which statistically slice and dice a very small number of proxy samples to give a profile of temperatures over the last 2,ooo years?
We won’t talk about models.
Greg – I appreciate your analysis, and it probably deduces about as much as is possible from the limited data, but I think David in Cal hits the nail on the head: it’s too short a period. What I would like to see is a few cycles, to see if this volatility is normal at cycle minima. How long is a cycle? We don’t even know that yet, but the temperature record would suggest about 60 years. And of course, there would be longer ones too.
” I appreciate your analysis, and it probably deduces about as much as is possible from the limited data”.
Thank you. I think it does extract some new information since the usual anomaly processing masks what has happened since 2007.
http://climategrog.wordpress.com/?attachment_id=215
Both N. Atlantic SST and ACE (hurricanes) show circa 60 repetition. Though those too seem to be more of a half sine than a full harmonic cycle. Perhaps some thought should be give to what that suggests about these hemispherical scope data and what it implies about causation.
“The 2013 summer minimum is around 3.58 million km^2. Recent average rate of change is -0.043 million km^2 per year.
While it is pointless to suggest any one set of conditions will be maintained in an ever varying climate system, with the current magnitude of the annual variation and the average rate of change shown in the most recent period, it would take 83 years to reach ice free conditions at the summer minimum.”
That method greatly overestimates the time to ice free. Apply it to 2004 for example. The 2004 minimum was 4 million km^2. At a rate of change of -0.043 million km^2 per year we wouldn’t expect a minimum to breach 2.5 million km^2 for 34 years right?
But we breached that in 2012. Just 8 years after 2004.
The reason is that ice loss isn’t following a steady trend of -0.043 million km^2, from year to year it can jump far below that. I suspect for the same reasons we’ll reach ice free long before 83 years.
Yes … once more around the Arctic Ice-Loss Death Spiral (TM) will be plenty.
It takes some mighty heavy-duty quibbling to pretend otherwise!
“The reason is that ice loss isn’t following a steady trend of -0.043 million km^2”
Which is exactly what I showed. I extracted a series of four values each of which varied by a factor of two from the previous one.
Which part of “While it is pointless to suggest any one set of conditions will be maintained in an ever varying climate system” did you get stuck on?
Clearly it is ice volume that is being lost, if you want to regard it as a calorimeter. It’s just that area data is the only data of a useful quality we have to work with.
Also area is the crucial variable for feedbacks, both +/ve and -/ve , so it’s worth studying. If it had continued doubling the rate of change since 2007 then ice free summers in the near future would not too outrageous to suggest.
When it starts to decelerate we need to be prepared to reassess in the light of new data.
I’m not aware of anyone so far having detected this. Though with a thousand new papers a week of whatever, I may have missed it.
I am not criticizing the post, I am just saying the estimates are high end, according to the figures you give an ice free state (0 sq km) is more likely to be 30 years away than 80.
lolwot
According to your (oversimplified) reasoning, we should reach an “ice-free” Arctic summer ” long before 83 years”, even though the linear trend line since 1979 would point to 83 years before “zero” ice (1 million square km) is reached.
The flaw is that you ASS-U-ME that the rate of decrease seen over the period since around 1979 will continue, albeit in fits and spurts.
Yet there is absolutely no reason why this declining trend should not reverse itself, as it apparently did in the 1940’s.
If the current “pause” in global (an Arctic) warming continues for another two or three decades, the decline in Arctic sea ice could well do the same.
Right?
Max
Greg Goodman:
I like the idea of variability of the data to divide it up as in your figure 3. Its
3 sections many show the users that the middle section is more predictable, followed by a section of less predictability. I think the increased variability is more apparent in your figure 4.
Figure 4 is the classic, single “average” cycle. The _annual_ variability is only marginally greater as you can see in the numbers in the appendix.
pre 1988 -4.43
1988-1997 -4.47
1997-2007 -4.62
post 2007 -5.14
I used the observation of different variability to help subtract the changeable annual cycle.
The point is, that once this is accounted for there is still less inter-annual variability in 1997-2007 period.
I don’t know whether this is what could be referred to as a “regime change” or just the result of destructive interference of competing cycles that are found in a spectral analysis of arctic sea ice data.
http://climategrog.wordpress.com/?attachment_id=216
Yes I think we should consider a regime change that seems to have effected the global temperatures, arguably a more difficult task.
Thanks.
The problem I have with this sort of analysis of Arctic sea ice is that where the ice is located is probably more important than what the total area is. Not only that, but the actual locations and times of melt during the spring and early summer interact with the continental snow-packs to produce influences on the evolution of the jet-stream and polar front that, IMO, are probably more important than the total area, or volume, of the sea ice.
The entire process is interrelated, between snow/ice, sunlit lowlands, sunlit highlands, and water. I don’t know how much actual research has been done into the patterns of snowmelt and retreating Arctic ice, but I strongly suspect that variations in location have a greater effect on the evolution of the spring/summer weather patterns than actual extent. And vice versa.
I couldn’t find year-on-year images of snowmelt with a quick search, but as an example of what I’m talking about, this NOAA page shows differences between the locations of minimum sea ice for September 2007-2008. Note especially how in 2007 it extended south along the east coast of Greenland while in 2008 it barely came down the coast at all.
I strongly suspect that differences in local influences on the evolution of frontal systems are much more important than the difference in minimum area.
Good points. Is the geographical variation part of the reason for the 5.5 year pattern ? Worth looking at.
The whole system is interlinked. One of the most surprising teleconnections I’ve come across is between AO and the Keeling MLO CO2 record.
http://climategrog.wordpress.com/?attachment_id=259
The correlation between the two during the recent period of relatively stable SST is quite remarkable. This suggests that the CO2 sink in the Arctic may be a major factor in determining how much atmospheric CO2 is absorbed globally.
If mainstream climate science had not been to fixated with the CO2 + random noise paradigm for the last 30 years, I’m sure we could have got a lot further in our understanding.
My working assumption is that much carbon is rapidly fixed at the sea surface, and then falls as particulate organic carbon into the depths. It is oxidized all the way down, with a small fraction ending up being mineralized.
It would be nice to know how much chlorophyll varies during the cycles in the Atlantic and Pacific.
I wonder what patterns would show up if you charted maximum/minimum extent in each of a number of directions rather than just total? Wouldn’t surprise me if something just jumped out at you. (Wouldn’t surprise me if it didn’t, either, but IMO it’s worth looking at.)
@DocMartyn…
AFAIK most of that won’t contribute to atmospheric CO2, but will remain in the water it’s deposited into until that water returns to the surface. Subject to long-term slow flows.
Hmm I’ve just realized what Greg has done.
You can’t take a trend of the annual anomaly and then apply that to the summer minimum. The rate of decline in summer minimum is much faster than other times of the year. See:
http://www.woodfortrees.org/plot/nsidc-seaice-n/from:1980.6/every:12/plot/nsidc-seaice-n
That rate of decline is going to hit zero far sooner than 61 years, let alone 83.
Interesting.
This year, assuming that the ice is at its minumum is way above the trend by at least 3SD, This may of course be a random fluctuation.
It’s easy to extrapolate trends – the question is whether the decline in linear.
Unfortunately Gregs post does not address that question as it includes winter data.
No, Greg’s does not use the post 2013 because it is part of the next 5.5y period and would artificially raise the end of the data and give a spuriously low rate of change.
Odd, I thought you were a fan if tipping points. I would think it very hard to make predictions of ice in an irregular sea/land area like the Arctic.
Here is an example of using trends in the summer minimum:
http://4.bp.blogspot.com/-JoADz54R26Y/UEXjy5cHpMI/AAAAAAAADOw/KTCv7rik6YQ/s400/Screen+shot+2012-09-04+at+7.19.10+AM.png
That’s good example of mindlessly (or perhaps intentionally) ignoring things like the repetitive pattern that did take account of in order to avoid that sort of spurious result.
Thanks for plotting it.
With the surface temperature record he is all ‘what pause’, plot from the mid-70’s and here he likes something quite different.
The repetitive pattern makes no difference to plotting the trend in decline of summer minimum.
“The rate of decline in summer minimum is much faster than other times of the year”
So we can agree that this is pretty useless metric for everyone to be obsessing about. Great for hand-waving alarmism and political scaremongering but taking one data point per year and ignoring the other 364 is not very informative or scientific.
We have >30 years worth of _daily_ data available. If we want to gain some understanding of mechanism and causation we had better start using some of out considerable skills in systems analysis on all the data.
“That rate of decline is going to hit zero far sooner than 61 years, let alone 83.”
We do not have a longer enough record to make even vague guesses about how it will be varying in ten years let alone 60. What the data does tell us so far is that it is not a simple one direction run away process.
As I noted in the text, either the major driver has abated or there are negative feedbacks at work (may be both). Since temperature would seem to be obvious factor and we totally failed predicting that, make huge assumptions about the distant future is nothing but pure speculation.
Since surface temps have been static for the last 17 years it’s not too surprising that rate of change of ice is easing. There will be something of the order of a 10 to 15 phase lag so don’t expect it start ramping down again any time soon.
That should be pretty good news, though some seem rather disappointed when it does melt. Curious.
“So we can agree that this is pretty useless metric for everyone to be obsessing about. Great for hand-waving alarmism and political scaremongering but taking one data point per year and ignoring the other 364 is not very informative or scientific.”
Yet you profess to be calculating the rate of decline towards an ice free state. When, other than at a specific time of year, are you expecting ice free state to be reached?
It’s a fact that Arctic ice is declining faster in summer than in winter.
By including winter data you are underestimating the rate of decline of Arctic ice towards ice free state.
Lolwot needs to go away and learn some statistics. Until there is a better understanding of natural variability over millenia we have no workable PDF’s for the parameters in which we are interested and hence no statistical bounds for inferring confidence levels.
It’s interesting you mention “statistical bounds” and confidence levels Peter Davies. That was going to be my next point concerning Greg’s assertions about deceleration.
and you have certainly already made the very same point to everyone who has “asserted” acceleration or death spirals or ice free summers. N’est pas?
I didn’t need to, Tamino has shown the acceleration in September sea ice decline is statistically significant (as of 6 months ago)
http://tamino.wordpress.com/2013/03/12/arctic-sea-ice-loss-part-1/
Here is is an article for readers who are interested in the correct analysis of time series data and who do not have any particular agenda.
http://www.oxford-man.ox.ac.uk/sites/default/files/events/Piet%20de%20Jong.pdf
Thanks for your post Greg. You are far more objective wrt to the data than some others whose names shall remain nameless.
Thanks, it’s gratifying that some can recognise that. I actually thought the last segment looked a lot flatter before I managed to remove the residual cycle and see what was going on. But it bugged me it was so unclear just squinting at it.
The post 2007 recovery was obvious but I did not expect see such a strong decline from 2010-2012.
The bug surprise was the half sine pattern. I’d seen suggestions of 5.4 y period in spectral analysis but was expecting something roughly harmonic not rectified 11.16y.
I’ve no idea what that is about but such a characteristic form and the regularity in phase, suggests a celestial origin not some internal oscillation.
But finding something you don’t expect is what makes it worth looking.
Thanks for the link, Looks interesting.
The half rectified sine is a poor fit and has no physical explanation for it. Therefore at this point I think it has about as much significance as a sidewalk stain that looks like Jesus.
The clear inference from the above (if anyone doubted it) is that the N hemisphere provides the planet’s main heat forcing function. This makes it more important to have accurate knowledge in climate models of the N to S transport delay. Can we consider this to be a slowly varying constant or should it be an unknown function of some variable?. Above all we should abandon the notion of well mixed atmospheric gases. We would expect (wouldn’t we) that the transport delay beyween N and S in their atmospheres would be far less than in their oceans, but on the other hsnd, far more heat is transferred in the oceans. I womder how the climate modellers handle this?
I did want to go into this in the article but one interesting thing I noted is that Antarctic variation is very similar to the Arctic over the last few years , except that it _leads_ NH by about 1.5 years.
ie it is not opposite. Both are showing strong increase and SH is leading. There is good correlation in the short term detail too , not just the general trend.
That’s another story but since you mentioned it.
“Yet you profess to be calculating the rate of decline towards an ice free state. ” No I ‘profess’ that such an exercise is pointless.
I do not expect change to be linear. My analysis shows that it isn’t. My point was that if it was pointing to ice free summer conditions in few years we may reasonably ask if that was likely happen. It is not. I was quite explicitly NOT making predictions about 60 -80 year time.
You calculated a date for an ice free state!
You did it incorrectly. You included winter data in the trend.
It’s that simple, you overestimated. I don’t care if you believed your figures of 61 and 83 years based on linear extrapolation, the fact is the calculation was flawed.
To calculate the based on linear extrapolation you need to extrapolate the trend in summer minima, not the trend across the entire year.
It’s an order of magnitude sanity check to see whether is points to 8 to years or 60 to 80.
Are you saying winter trends are an order of magnitude greater?
Actually it would make more sense to use all the data to derive the increase in the annual variation and the annual mean rate of change than to work with 1 data point out 365 and ignore the rest.
The point was that ice free in the next few years is about an order of magnitude faster rate of change, and is unrealistic.
The obsession with the annual minimum is a political convenience, not science.
You don’t throw out 99.7% of the available data and then go OMG, it worse than we thought.
Use September average rather than the annual daily minimum if you must. But if you are going to estimate how long until minimum at least use summer data! Don’t include winter data!
That’s like calculating a trend across global population when the question is when will the population of Belgium reach 12 million.
“The obsession with the annual minimum is a political convenience, not science.”
It’s science. The annual minimum is by definition going to be the point in the year when the Arctic first breaches the ice free threshold and that’s a very important milestone in a very significant climate change.
No, it’s a very important _political_ milestone. Like busting through 400 ppmv of CO2.
It is not a milestone in the physics of the Arctic.
You seem unable to distinguish the two.
There’s a big scientific difference between an Arctic free of ice in summer and one covered over in ice.
The point at which the Arctic reaches ice free state is a milestone between those two states.
Your desire to deny this seems to be the real influence of politics.
lolwot, “There’s a big scientific difference between an Arctic free of ice in summer and one covered over in ice.”
Is there? Did anybody remember to get the Arctic sea ice cores so we could date them? I think there is an FOIA in someone’s future. We need to free the sea ice paleo data!
“That’s like calculating a trend across global population when the question is when will the population of Belgium reach 12 million.” Exactly, when thinking of minima and its projections, it makes sense to confine the statistics to minima of the past, otherwise you are looking at a less interesting statistic that convolutes changes in winter volume over time too, which is a complete red herring for the problem at hand.
lolwot
use this.
https://sites.google.com/site/arctischepinguin/home/piomas
Which raises the questions; why the hell are we interested in the population of Belgium as an indicator of the state the global population and what is the significance when it passes the “milestone” of 12 megabelgies.
Why are we throwing out 99.7% of the data to focalise on Sept min as an indicator of climate?
The only reason is because it’s more dramatic.
Then ice free Arctic becomes ice free summer, becomes ice free one day in the summer becomes less than 1 million km^2 one day in the summer.
And OMG, if and when that “milestone” threshold is breached …. Arctic climate will continue to vary much the same as it did the day before and the day after.
It’s no more a “threshold” than 400 ppmv. It is psychological, human threshold, nothing more.
Politics, not science.
lolwot or use this
http://iwantsomeproof.com/extimg/sia_monthly_average_with_trend.png
here is the clue, when the summer ice falls below 1M, they will argue that thats not ice free.
when its ice free they will argue that it has no impact
when it has an impact they will argue that its happened before
when you show that its unprecedented they will blame unicorns.
when you ask them to produce unicorns they will argue that its not
the skeptics job to prove anything.
Or more “I want some proof.”
https://ixquick-proxy.com/do/spg/proxy?ep=4b777463637a675541525557436c7754453267556553674a616b424150463839456a5256496b464964774950495364474352344246466f50485741554b79314a506b3863426930454d6e41424f6867635443737447775a394b69672b4b486f79585359624e5830484f4664524f31686c574355484d673556634149474d48704b43785a65416c7050434373574e694d48616b35564f42497046694a4f4a426c444a6734564a5352464252555745315148486e4d534b6963444a56424a6267382b42795944503046485a6b5555614478644541734351775968586e777859584970503070564c52466b45446b634e4242454c67414f4f48456249676759456c424653516748495451624a5664434a41736e466949574e4135416341735363475a765167345642304542526e5a4f496e4e574c78455866416479464751584e683457595146564e32644d55686b5841414657486e7355&epile=4q6n41784q7n41354q5463774q6p38314r7935725n586o3q&edata=c99fe700ce75d060177c45e4e22bfcaa&ek=536q4r68565651705n4874785n6n5667653035335245427654434q6853474n4o64315n7n55337768&ekdata=e3b16bad0dba1a22a0056ca84d2ab166
Or, something shorter:
https://sites.google.com/site/pettitclimategraphs/pettit-climate-graphs
https://twitter.com/jim_pettit
JP is quite the progressive.
http://www.dailykos.com/user/Neapolitan
The Arctic Death Sprial
[youtube http://www.youtube.com/watch?v=apCtY4RmjN4?feature=player_embedded&w=640&h=360%5D
OK, the Arctic Death SPIRAL:
The winter Arctic sea ice area is rather limited by the continents, so it will vary less. For example, see here. This is why its variation would be slower, if you think about it.
http://www.treehugger.com/natural-sciences/nasa-confirms-dramatic-thinning-of-arctic-sea-ice-multi-year-ice-area-the-size-of-alaska-lost.html
Jim D:
I like this view of the Arctic Death Spiral:
http://s3.amazonaws.com/dk-production/images/5960/large/sia_2.png?1347455252
It looks like one lobe of a Lorenz attractor, but running backwards.
“Why are we throwing out 99.7% of the data to focalise on Sept min as an indicator of climate?”
1. Nobody is throwing out the other data
2. There is a testable scientific hypothesis about the importance of summer ice extent as it relates to atmospheric flow patterns
3. There is a testable hypothesis about the relationship between temperature gradiant and the structure of hadley/ferrel cells
So its not seen as an indicator of climate, although it is a information rich metric.
Goodman is right lollytwat. Your very use of the word “milestone” for zero summertime Arctic sea ice implies a project goal not a significant point in a natural process. Arctic sea ice loss is not a project you incipient turd.
In predicting the advent of the ice free in summer state, it would be correct to at least eliminate the winter ice area data because that area is constrained by the land masses and thus is not as great as it would be otherwise. So including it biases your prediction in the long direction.
And if you are saying ice-free in a few years is unrealistic, you are making a prediction.
Using PIOMAS and CT sea ice area to get an estimate of ice thickness and then linearly extrapolating gives and ice free arctic in summer by 2022.
In some situations it is ok to treat a transport delay like like an inertial delay, but probably not in climate science. The transient waveforms are quite different. The densest water will move to the depths of the oceans but may be trapped in valleys on the ocean’s floor, so very difficult to model, even if you could predict the swirling currants
It’s weird how we argue over sea level rise and Arctic ice fluctuations as if they were recent developments. Sea levels decided to do their rising thing over two hundred years ago, and rose most quickly before the 1870s. Arctic ice has been reported as going up and down like Berlusconi’s trousers since navigation made reportage possible. And that’s without discussing those naughty bumps in the hockey stick handle. 97% of me is 97% certain that this is 97% empty scientism.
How did navigation affect the possibility to report on Berlusconi’s trousers? I’m sure they’ve been going up and down just as much in the certain periods in the past except that we did not have sufficient monitoring in place for the frequency to be correctly recorded.
However, I there is little doubt that events of the last two decades have very likely (>90% confidence) been mostly (>50%) due to increasing anthropogenic emissions of CO2 , and perhaps the invention of via9ra ;)
At last some, er, hard science.
You know, Greg, when I look back on Australia’s history of drought, heat, flood etc – starting with our very first decade and that horror monsoon failure which was felt in Sydney in the early 1790s – I’m just amazed at the extremes achieved by climate without the help of CO2. These modern extremes are just a bunch of steroid cheats, if you ask me.
Could someone explain to me again why we need Arctic ice?
Because Santa Claus lives on the Russian side of the Arctic. If there isn’t enough ice then he won’t be able to drive Rudolph and his sled across the North Pole to deliver the Christmas presents.
Shouldn’t that be Santa Klaus?
Komrade Klaus?
You mean the reindeer can’t fly?
The “skeptics” need it to hang around and are starting to get desperate imagining all the newspaper articles it would generate. I feel sorry for them clinging onto the ledge like this.
“…why we need Arctic ice?”
It’s a symbol?
I am guessing it does matter. And we live in interesting times. But let’s remember China is now using the shipping lanes up there a bit.
Why do we need you?
It seems you don’t understand the science.
And since you don’t understand the science, you rationalize that the outcomes won’t be so bad, or actually may be positive!
The sad case of the but-boys.
ABCDEFGHIJKLMNO
Anything But Carbon Dioxide Except For Generating Heat In Just Key Locations Mankind Needs Optimally
Here is an update on Ice-Out records for Minnesota lakes including this year:
http://contextearth.com/2013/09/15/ice-out/
WebHubTelescope:
Ice out dates in Minnesota are obviously occurring earlier over the long term. I’d assume we are planting corn earlier too. My concern has been the Gulf continuing to push money North in the form of rainfall.
I suppose I do rationalize. I don’t really believe the CO2 trajectory is going to slow by much partly from a lack of world political resolve. I suppose you know about are our Ethanol plants? I rationalize there too. They might not make a lot of sense, but people wanted them so we got them, and the silver medal in that case is higher corn prices and some benefit to our rural communities. I am not a farmer by definition, but in spirit I am.
I think you are right about Anything But Carbon. Land use, farming practices, methane, soot. You’ve never seen so many former conservatives now talking like hippies, so that a victory.
Webster, See those Minnesota Ice out dates are just further evidence that the northern guys are at fault. Ice out dates in south Florida have not changed one bit. We can set the carbon tax base rate at $1 per ton increasing by $1 per degree of latitude, that would put you in the $45-$49 Carbon Tax bracket. A small price to pay to save the world.
Cappy,
You don’t even realize that Miami has likely not seen a 100F day in 100 years. Yes, this moderation is due to the proximity of the ocean. That is part of the science that your contrarian viewpoint can’t seem to reconcile.
Ice out is just temperature related – so probably occurred as early in the 1930’s. Webby doesn’t know it because there isn’t much data going back that far – and he doesn’t take decadal temperature variability into account.
The ice-out data looks like it may also give us some clues but it’s not going to tell us much if you can’t do more draw a straight line through it. That can only tell that climate warmed over the 20th century. Hardly a discovery at this stage.
The multi-plot graph was too small to see anything properly but it did look like the top right-hand graph showed a change of direction in recent years.
May be we need to get beyond straight lines.
Seriously bad characterisation of the data Greg – http://www.health.state.mn.us/divs/climatechange/images/mntempchart.jpg
Thank you. From that chart, it could be as much as a 3 degree warming over the same historical time span, which would substantiate the earlier ice-out data.
If it is too small, click on the image — you know, the usual drill.
This year had a very late ice-out, but the previous year was very early, especially in the north.
There is a trend buried in the noise, and this is observed in everything from Arctic sea-ice to freezing of northern fresh-water lakes.
It is all substantiating data pointing to global warming.
Webster, “You don’t even realize that Miami has likely not seen a 100F day in 100 years. ”
Miami no, but inland a little bit where they drained the ‘glades, it gets hot. It gets a lot hotter at the airport, luckily no one with money lives near the airport.
Webster, some scientist did a neat study of plants in south Florida. They concluded that CO2 concentrations cause the plants to use less water. Remarkable. Lucky for those plants since draining the ‘glades reduced the water. Now there is pretty convincing evidence that CO2 drives men to drain swamps and build airports.
WEBSTER! It is worse than we thought! OMG! The mid-latitude land is driving the ocean warming. What we gonna do?
https://lh5.googleusercontent.com/-JZ1E549-YFM/UjhkK_GdzMI/AAAAAAAAJiU/r4HSwGXcJKE/s912/ersst%252030N60N%2520land%2520with%2520NH%2520ocean%25202.3%2520multi.png
You didn’t notice decadal variability?
Such as in the Arctic, Alaska, the US lower 48, etc?
e.g. http://s1114.photobucket.com/user/Chief_Hydrologist/media/arctictemps_zps395995c2.png.html?sort=3&o=4
They have to argue about Arctic ice minimums. Their CAGW drowned polar bear scam got outed. Their hockey stick splintered. Their hot spot…isn’t. Their disappearing glaciers…aren’t. Their dying Amazon…lives. And even theircrowning jewel, their reported “global average temperature” trends, the products of their very own models, built with all their assumptions regarding warming, and constantly adjusted to cool the past and warm the present, aren’t even cooperating. For 15 freakin’ years! What’s a warmist to do?
If Arctic ice rebounds longer term, count on the argument being redirected to whatever new weather phenomenon will support scary headlines.
Those are the old wooden hockey sticks. The new technology is carbon fiber and those blades don’t break. Wish I had those when I was a kid.
See PAGES 2K, Marcott, et al.
Mann probably wishes he’d used one too.
Foolishly his was made from Bristlecone Pine.
“See PAGES 2K, Marcott, et al.”
Would that be the Marcott who later admitted that the hockey stick in their press release was not backed by their paper? That Marcott?
Always presuming that recent warming is anthropogenic – http://s1114.photobucket.com/user/Chief_Hydrologist/media/arctictemps_zps395995c2.png.html?sort=3&o=3 – and not natural variability.
e.g. – http://s1114.photobucket.com/user/Chief_Hydrologist/media/cloud_palleandlaken2013_zps3c92a9fc.png.html?sort=3&o=23
Science is canvassing the potential for a temperature hiatus for decades more. It seems more likely than not.
”by 2013, there will be no ice left in Arctic ocean” Al Gore
http://globalwarmingdenier.wordpress.com/midi-ice-age-can-be-avoided/
All of this arctic ice just goes to show you the power of the polar bear lobby.
http://www.drroyspencer.com/global-warming-background-articles/the-pacific-decadal-oscillation/
I had wondered if it wasn’t the PDO shift that was affecting the Arctic Ice? Spencer doesn’t say so, but he talks about some related things at the above. He also has a 70-90 degrees map that looks like it may fit.
I am guessing it’s warmer in the North Pacific as Equatorial heat is being sent there as I understand it.
It’s likely AGW.
The Pacific Decadal Variation – ENSO, the PDO, the Pacific gyres, winds, clouds currents all change – adds to global temperatures in the warm phase and reduces temperature in the cool phase.
e.g. – http://s1114.photobucket.com/user/Chief_Hydrologist/media/PDO_zps89a7b4c1.jpg.html?sort=3&o=40
The global variability in temperatures is amplified in higher northern latitudes.
http://s1114.photobucket.com/user/Chief_Hydrologist/media/arctictemps_zps395995c2.png.html?sort=3&o=4
They drives temperatures in the US strongly.
http://blogs-images.forbes.com/patrickmichaels/files/2013/01/US_temps_fig2.jpg
In hydrology – the same patterns emerge for the same reason. Means and variances shift in decadal patterns – which is the the reason why stratified stochastic analysis is recommended. The failure to do this leads to misleading results – as with webby’s ice out.
‘Reflecting the similarity of spatial pattern between PDO and ENSO, air-temperature anomalies due to PDO are generally similar to those connected to ENSO (Mantua et al. 1997). In association with PDO, wintertime temperature over Alaska and western Canada and the Pacific Northwest are higher, and temperature in Mexico and the southeastern US is reduced (Mantua and Hare, 2002). Minobe (2002) reported that the pentadecadal variability of PDO is observed in mid-latitude western North America in spring, but not in winter. Consistently, Cayan et al. (2001) showed that spring came earlier since the late 1970s in western United States (US), based on the blooming of lilac and honeysuckle bushes and the timing of snowmelt-runoff pulses.’ http://www.cgd.ucar.edu/cas/cdeser/Docs/jclim_minobe-pdv.pdf
‘The 1976 Pacific climate shift is examined, and its manifestations and significance in Alaskan climatology during the last half-century are demonstrated. The Pacific Decadal Oscillation index shifted in 1976 from
dominantly negative values for the 25-yr time period 1951–75 to dominantly positive values for the period 1977–2001. Mean annual and seasonal temperatures for the positive phase were up to 3.1°C higher than for the negative phase. Likewise, mean cloudiness, wind speeds, and precipitation amounts increased, while mean sea level pressure and geopotential heights decreased. The pressure decrease resulted in a deepening of the Aleutian low in winter and spring. The intensification of the Aleutian low increased the advection of relatively warm and moist air to Alaska and storminess over the state during winter and spring. The regime shift is also examined for its effect on the long-term temperature trends throughout the state. The trends that have shown climatic warming are strongly biased by the sudden shift in 1976 from the cooler
regime to a warmer regime. When analyzing the total time period from 1951 to 2001, warming is observed; however, the 25-yr period trend analyses before 1976 (1951–75) and thereafter (1977–2001) both display
cooling, with a few exceptions. In this paper, emphasis is placed on the importance of taking into account the sudden changes that result from abrupt climatic shifts, persistent regimes, and the possibility of cyclic
oscillations, such as the PDO, in the analysis of long-term climate change in Alaska.’ http://journals.ametsoc.org/doi/pdf/10.1175/JCLI3532.1
Arctic sea ice MUST increase in the next twenty years =>
http://www.woodfortrees.org/plot/hadcrut4gl/compress:12/detrend:0.76/plot/hadcrut4gl/trend/detrend:0.76
Steven Mosher | September 17, 2013 at 1:39 am |
“Why are we throwing out 99.7% of the data to focalise on Sept min as an indicator of climate?”
1. Nobody is throwing out the other data
2. There is a testable scientific hypothesis about the importance of summer ice extent as it relates to atmospheric flow patterns
3. There is a testable hypothesis about the relationship between temperature gradiant and the structure of hadley/ferrel cells
So its not seen as an indicator of climate, although it is a information rich metric.
====
Hi Steven. I know you are capable of intelligent analysis to please try.
1. If we only chose to look at one day per year that is exactly what we are doing.
2. If you mean 3 months of summer that’s a different question entirely, don’t use that to justify focalising on one day per year.
3. See 2.
If your “it” is one day per year it is not “information rich” because it is less than 0.3% of the available data. If this magically distils the information carried in the rest of the data we need to see that demonstrated.
“So its not seen as an indicator of climate”
Well that is exactly how it is often presented. If it is not an indicator of climate and is not seen as one why do we ever even mention it?
You say it’s not a climate indicator at the same time you say it’s “information rich” . That appears to be a total contradiction. Maybe you need to define “it” more clearly. You seem to be confounding “summer ice exent” which clearly is important, with the one day per year minimum.
Are you agreeing that the September minimum is not a useful indicator of climate?
Greg,
Where sea ice extends at the annual minimum is not related simply to what happened on that particular day. It is the final result of the whole melt season. Try plotting annual minima against September averages or even JAS averages – the difference in trend is very small and co-variance is also strong. So there is a clear case of redundancy here: knowing the extent on just this one day can accurately be used to represent the entire melt season, making it a useful indicator of Arctic climate.
@Jim Petit.
https://sites.google.com/site/pettitclimategraphs/sea-ice-area#asiads
That is a more objective rendition of the “death spiral “. Not quite dead yet.
https://sites.google.com/site/pettitclimategraphs/global-temperatures#uahsbtglawt
That is a good demonstration of the futility of extrapolating arbitrary mathematical models.
Here’s another example.
https://sites.google.com/site/pettitclimategraphs/sea-ice-area#asiama
https://sites.google.com/site/pettitclimategraphs/sea-ice-area#asiaalbp
It may be interesting to see how 2013 fits into your bar graph. Though you really should at indicate what your fitted curves are. Why you think they are a suitable model for the data would be bonus ;)
Are you going to provide confidence intervals for your trends?
Shouldn’t you have done that before concluding a deceleration?
Steven Mosher | September 16, 2013 at 10:10 pm |
lolwot or use this
http://iwantsomeproof.com/extimg/sia_monthly_average_with_trend.png
Mosh’, Jim produces some nice graphs but graphs are just pictures until you explain how you derived them . Since you have chosen to endorse this one you presumably think it tells up something so may be you could comment.
1. How does the supposedly “exponential trend” change sign? exp(x)>0 , how does it produce both +ve and -ve trends?
2. why is this a suitable model for the data?
3. why should we attribute any meaning to extrapolation of an arbitrary mathematical fn beyond the range of the data?
4. why are trends of the other months omitted?
5. what happens when you hindcast these functions (whatever they really are)? Is the hindcast physically meaningful, what does this tell us about forward extrapolation?
Perhaps Jim Petit could help on some of those questions too.
Greg
I don’t know if you saw my article on widespread Arctic ice melt between 1920 and 1950?
http://judithcurry.com/2013/04/10/historic-variations-in-arctic-sea-ice-part-ii-1920-1950/
It was part of a much longer piece with numerous references.
Basically we had some very high temperatures and very low ice levels at times through that period.
The efforts of the climatologists at the University of East Anglia that predated CRU who created the modern ice record did not take into account many factors when calculating ice extent.
That included accounting for Russian Ice levels-due to lack of scientific cooperation during that period -and also that the ice records of the time finished in August not September. It was mentioned several times in the records how the Northern sea route was closed in August but had opened up in September.
I suspect your focus is strictly on the modern era but I didn’t know if you had extrapolated further back and seen whether there was any tie up in any of your curves/lines between the melting of ice in the 1920/40 period, its subsequent return (but presumably weakened) around 1950 and its gradual strengthening until some time in the 1970’s?
tonyb
tony b: “I suspect your focus is strictly on the modern era but I didn’t know if you had extrapolated further back. ”
No extrapolation at all. Just seeing what we can extract for the detailed data we have for the satellite period.
In view of the magnitude of change on the inter-decadal scale, the length of the record is totally inadequate for extrapolation. All it does tell us is that there is a change of sign in the second derivative and it’s not a simple run-away melting trend.
That adds some ground truth to all the hand-waving and hyperventilation.
Jaxa have already started to “correct” the data:
http://rankexploits.com/musings/2013/september-nsidc-prediction/#comment-119346
“In view of the magnitude of change on the inter-decadal scale, the length of the record is totally inadequate for extrapolation. All it does tell us is that there is a change of sign in the second derivative and it’s not a simple run-away melting trend.”
You reported a 1997-2007 slope of -0.086 million sqkm per year
and a post 2007 slope of -0.044 million sqkm per year
From this you concluded there’s been a deceleration.
Where are your confidence intervals for these trends? Please provide them so that I can check your claim of deceleration is not spurious.
Final set of parameters Asymptotic Standard Error
======================= ==========================
m_1997_2007 = -0.0876954 +/- 0.001149 (1.31%)
cl_1997_2007 = 8.90061 +/- 0.01087 (0.1221%)
Final set of parameters Asymptotic Standard Error
======================= ==========================
m_post2007 = -0.0427986 +/- 0.00377 (8.808%)
cl_post2007 = 8.91292 +/- 0.006259 (0.07023%)
Why have your numbers changed?
In the image you print that the post 2007 trend is -0.044, now you say -0.0428.
Can you please provide the data for your figure 3 so that I can check the trend myself? Your claim that the confidence within +-0.004 seems a little unbelievable given the short time period and the variability in the data.
What the trend do you get since 2006 and 2008 respectively? If your CI is so tight then presumably the trend doesn’t change much with a slightly different start and end point…
Now go and ask CryoToday, in the same strident fashion, for error bars on their ice area data .
I can’t even get a reply out of them.
CryoToday aren’t making bold claims about acceleration and deceleration. You are.
What on earth has that to do with a major academic institution supplying an uncertainty figure with their data?
No point in asking JAXA, they clearly state they done even have an error estimation for their data.
Greg, thank you for your interesting analysis.
Have you done the same work with the Antarctica ?
Do we observe a slowing in the growth rate of the seaice extent in Antarctica since 2007 ?
The simetricity of Artic / Antartic evolution is amazing.
I had a brief look but time is limited and I wanted to get the article published. You can see the Antarctic data in figure 5 , it has not eased off recently. Rather it would appear to be increasing more rapidly.
The Sea Ice Mirror:
http://idata.over-blog.com/1/23/41/67/000Ledossier2013/Sea-ice-Mirror.png
That is a reasonable-yet-unanswered question lolwot!
Another reasonable-yet-unanswered question is “Why focus upon ice-area measures, when ice-volume measures are lower-noise, more thoroughly validated, more directly driven by energy, and more nearly global in character?”
Absent rational answers to these reasonable-yet-unanswered questions, Climate Etc readers have ample reason to regard Greg Goodman’s analysis as faux-rational post-hoc ideological self-justification that in consequence of cherry-picking and cycle-seeking mainly reflects motivated numeracy rather than strongly integrative climate-science.
Aren’t these reasonable concerns, Greg Goodman?
Remark Working with coauthors might help you to appreciate these points!
Meanwhile, the ice-loss spiral continues unabated. Yikes.
Well, fan, they are answered; read better. And hmmm, Arctic ice volume increased this year. Well whaddya know?
============================
And I believe ice volume didn’t increase after the ’07 melt. Double hmmm, hmmm.
==========
Yes, Kim, he seems to be in the same reading group as David Appel.
Kim, are you sure arctic ice volume didn’t increase after the 2007 minimum?
http://psc.apl.washington.edu/wordpress/wp-content/uploads/schweiger/ice_volume/BPIOMASIceVolumeAnomalyCurrentV2.png?%3C?php%20echo%20time%28%29%20?
But then again, if Kim says it’s cooling and Kim says ice volume didn’t increase, then who should we believe?
Thanks, Bob, that’s why I carefully said ‘I believe’. My other source was harder to interpret and I did it wrong. This looks more reliable; PIOMAS after all. And it blows one speculative marker for me, so that’s useful.
=============
Greg
Seems you have a once in a life time offer by Fan to work with you as a co author. Mosh and Brandon; Greg and Fan. Whoever will be the next pairing?
tonyb
Heh, kim and willard, once he learns to audit objectively.
=============
Speaking of which, are you still going to be the mediator?
fan,
RE “That is a reasonable-yet-unanswered question lolwot!”
To give credit where credit is due, you are probably best positioned to recognize that, as leaving reasonable questions unanswered is something you excel at.
http://scienceprogress.org/wp-content/uploads/2011/05/ArcticSeaIceDecline_591.gif
Unlabelled, unattributed graph of unexplained models fitted to unknown data. Very impressive. Still , pretty scary stuff, huh?
It’s Neven’s graph!
Top-quality citizen-science, eh Greg Goodman?
Fan
I compiled a huge amount of scientific and ‘anecdotal’ material detailing the arctic melt of 1920-1940 and offered to work with Neven to try to work out the likely real arctic ice extent that took into account a lot of knowledge unavailable to the pre CRU researchers in the 1970’s.
Unfortunately he was too busy.
Fan and Greg. Mosh and Brandon Tonyb and Neven. What wonderful citizen science pairings eh?
tonyb
Fan
Actually it seems to be ‘FrankD’s’ graph not Nevens.
tonyb
Regrettably “the plural of ‘anecdote’ is not ‘evidence’,” eh TonyB?
Fan
You inexplicably missed out the full sentence. I said
‘I compiled a huge amount of SCIENTIFIC and ‘anecdotal’ material detailing the arctic melt of 1920-1940….’
One type of material very often supports (or complements) the other so BOTH are desirable (but not always possible)
tonyb
TonyB, your anecdote-heavy style of analysis is excusable because the before-1940 scientific data is sparse — albeit exceedingly valuable! — while the number of historical anecdotes is unbounded … but Greg Goodman’s analysis of the modern era of Arctic climate-change lacks that excuse!
Fan
Thanks for your interesting link. Hopefully we might have learned more about the Arctic since its publication in 1997, but its still worthwhile.
I referenced some 50 Scientific papers in my article. It was the second golden age of scientific arctic exploration and climatology, the first being that of William Scoresby who, as you know, was authorised by the Royal Society to seek out the causes of polar melt in the 1820’s. Scoresby is buried not 10 miles from my home..
A victim of the next polar upheaval -as exemplified by the Titanic- used to own the grand house just below mine which is now a hotel.
Lots of science lots of anecdotes. Tying them up to become greater than its individual parts is the interesting thing.
How’s your co authorship with Greg going?
tonyb
So who’s “Neven”? In fact on your link it’s not even Neven , it’s some FrankD who sent it to Neven.
So how does that stop it being a crap graph for all the reasons I cited.
Who is Neven? Ask “Old Leatherneck”! Neven is the universally admired and respected person whom we all want to be like!
Note that none of the Warmists ever talk about the Satellite data prior to 1979.
Says it all really. Nothing at all wrong with spending $trillions ‘combating’ a non-existent danger, as long as it raises taxes.
It is great logic isn’t it? Just because they got the cause wrong doesn’t mean they got anything else wrong. They got the right answers for the wrong reasons.
I think they can have a new motto, “We are not bad scientists, we just do bad science.”
It’s amazingly callous and authoritarian, all in one. Who could ask for anything more.
==================
Read the whole thing: http://www.telegraph.co.uk/earth/environment/climatechange/10313261/EU-policy-on-climate-change-is-right-even-if-science-was-wrong-says-commissioner.html
Basically, they bought into the Malthusian fantasy and tried to use AGW as the excuse to “take action,” probably because the Malthusians have such a lousy track record that relying on it politically would have been disastrous.
Now they found gas in Europe, France proved nuclear works, Germany Spain Portugal and England proved wind and solar don’t work and AGW is in trouble. So the political response to AR5 will be interesting.
Oh, and now it’s important to remember what this meant for Copenhagen- Europe was demanding carbon taxes/fees to combat “resource depletion” at precisely the moment that the US was discovering that its resources were actually vast. Ooops.
Now is my way clear, now is the meaning plain:
Temptation shall not come in this kind again.
The last temptation is the greatest treason:
To do the right deed for the wrong reason.
-Eliot, now dedicated to Connie. Only, when the lights fade and we shiver this Winter, we will question whether it was “the right deed”.
Hedegaard’s comment is reminiscent of a similar assertion by former US Senator Tim Wirth at Rio de Janeiro UN climate conference in 1992, relatively early in the great CAGW scare:
former US Senator Tim Wirth on “we’ve got to ride the global warming issue”
FLASHBACK: According to the 1993 book Science under Siege by Michael Fumento, former US Senator Timothy Wirth, (D-Colo) said that “We’ve got to ride the global warming issue. Even if the theory of global warming is wrong, we will be doing the right thing – in terms of economic policy and environmental policy..”
Shiphil, Words to inspire. I thank Dog every day for the likes of Tim Wirth. I would never be able to think so abstractly on my own.
Hmm reminiscent of another US senator Jim Inhofe:
“I was actually on your side of this issue when I was chairing that committee and I first heard about this. I thought it must be true until I found out what it cost.”
lolwot,
I don’t endorse the Inhofe statement either (if it is accurate), but there is a fundamental asymmetry in how the left/right divide (crude and oversimplified as it is) can sometimes affect this issue:
one guy says: “don’t look critically at the science/facts, our progressive Cause is so noble and good”
another guys says: “I started going along with this until the vast costs and ever-increasing central control made me look harder at what’s behind it”
The first is a paradigm case of “noble cause corruption.” The second is a critical view born of experience, still motivated reasoning but (can be) wisdom based in reasoning about experience.
Speaking of overheated alarmist rhetoric, here’s a Labour MP in the UK who proclaims to a cabinet minister that CO2 is [emphasis added]. “the greatest threat to our planet’s existence” (an exact quotation provided in her own letter):
http://blogs.spectator.co.uk/coffeehouse/2013/09/luciana-berger-lambasts-ed-davey-over-inaccuracies-in-his-conference-speech/
Sounds like Liberal thought to me.
Fairly Liberal…
http://www.gregpalast.com/larry-summers-and-the-secret-end-game-memo/#more-8455
end game.
As climate is relate to statistical evaluation: all these analysis dealing with decadal trends are, in my opinion, useless. The minimum number of samples for statistical significance is 30. So any NHSI analysis should account at least for 30 years.
The variation of sea ice should be then deduced from a comparison between periods (e.g. 1951-1980 vs. 1981-2010).
If anyone do not agree with my approach, please justify why not.
Your question has a simple answer, Antonio! The observed annual-to-decadal fluctuations in global measures of energy-balance are sufficiently small that secular global warming trends are resolved with large signal-to-noise ratio.
That is the common-sense reason why “the strongest available climate-change science” (in Judith Curry’s phrase) systematically focuses upon global-scale energy-balance measures, whereas slogan-shouting denialists prefer to cherry-pick among local climate fluctuations and/or anecdotes.
Simple Summary We’ll know that global warming is over when the seas stop rising. Whereas the curious incident of the [climate change] dog-in-the-night is the decadal reversals in global-scale energy balance have not been observed.
It is a pleasure to answer your excellent question, Antonio!
Fan
Are you claiming that prior changes in sea level were all caused by a warming planet?
LOL … that’s why paleoclimatogists study millennial-timescale Milankovitch dynamics!
That is a fascinating question, Rob Starkey!
‘Climate forcing results in an imbalance in the TOA radiation budget that has direct implications for global climate, but the large natural variability in the Earth’s radiation budget due to fluctuations in atmospheric and ocean dynamics complicates this picture.’
http://meteora.ucsd.edu/~jnorris/reprints/Loeb_et_al_ISSI_Surv_Geophys_2012.pdf
Yet somehow the truth always seems to evade FOMBS. Why would that be?
“The minimum number of samples for statistical significance is 30. So any NHSI analysis should account at least for 30 years.”
wrong.
1. there is no such thing as statistical significance. when you perform a statistical test ( say an estimation) you can generate a confidence value.
Traditionally people designate 95% as ‘significant’ but in some fields
much higher values are required and others lower values are considered.
there is nothing in logic, stats, or science which DICTATES 95%.
2. 30 samples in most cases is considered “large”. But in many applications
we work with smaller samples, and we have tools for working with these datasets. In general the N you want is related to the VARIANCE of the data.
with small variance you can have good power with small N.
In short, back to stats 101 for you
http://en.wikipedia.org/wiki/Sample_size_determination
and the historical document that stands under Students-T
note the sample sizes
http://www.york.ac.uk/depts/maths/histstat/student.pdf
Thanks Steven Mosher for your answer.
Let me explain what I said about statistical significance (only by setting n>30):
(a) if a random event is repeated (e.g. yearly), it will follow some kind of distribution.
(b) in nature, random events follow a normal distribution.
(c) the central limit theorem can relate binomial and normal distribution iff n>30 (with n: # of samples).
(d) the minimum number of samples of these NHSI analysis (and other climatic analysis), that allow to apply the central limit theorem is 30.
(e) statistical significance is usually related to p-value and to the type I error rate (false positive error rate).
(f) if climatic analysis want to fulfill with statistical requirements, they must increase from 10-20 to 30 years; because then they will be capable of applying the central theorem limit.
And Steven, about your comment:
(i) Professional scientist can use the distribution known as “t-Student” (the appropiate for small sampling) and they can use many complex statistical software packages.
(ii) But samples taking from 10 to 20 years, might not follow the central theorem limit and then: the statistical evaluation obtained could be useless.
I am writting an essay on this issue so discussion on this subject is wellcomed (everyone is invited except trolls).
NIC shows another, smaller, increase yesterday, so it’s looking like the minimum was reached on Sept. 14 in the NIC estimates.
Arctic Min Date >8/10ths Marg Zone M.sq Km
14/09/2013 4.84 0.67 5.51
21/09/2012 3.28 0.92 4.20
20/09/2011 4.30 0.97 5.27
22/09/2010 4.75 0.91 5.66
21/09/2009 4.58 1.27 5.84
23/09/2008 4.16 0.77 4.93
18/09/2007 3.60 1.01 4.61
A remarkable recovery, especially in the packed ice extent and the early date.
Global warming alarmism is code for the Left’s willingness to condemn the Third World to a cribbed existence of mind-numbing privation.
It is a War on the Poor, an astonishingly ignoble cause.
==================
“While I could give a multitude of reasons for leaving my studies, some more concrete, others more abstract, the essential motivation stems from my personal conclusion that I’ve lost faith in today’s academia as being something that brings a positive benefit to the world/societies we live in. Rather, I’m starting to think of it as a big money vacuum that takes in grants and spits out nebulous results, fueled by people whose main concerns are not to advance knowledge and to effect positive change, though they may talk of such things, but to build their CVs and to propel/maintain their careers… Academia: It’s Not Science, It’s Business.” ~Anon (Resignation Letter to École Polytechnique Fédérale de Lausanne, published Sept. 9, 3013)
It’s control over the poor.
As if you or kim give a stuff about the poor.
Heh, the poor do.
===========
lolwot, Iez carez deeply fer the poor, I iz one.
Poverty rates started to collapse towards the end of the 20th century largely because developing-country growth accelerated, from an average annual rate of 4.3% in 1960-2000 to 6% in 2000-10. Around two-thirds of poverty reduction within a country comes from growth. Greater equality also helps, contributing the other third…
China…is responsible for three-quarters of the achievement. Its economy has been growing so fast that, even though inequality is rising fast, extreme poverty is disappearing. China pulled 680m people out of misery in 1981-2010, and reduced its extreme-poverty rate from 84% in 1980 to 10% now.
[…]
The world now knows how to reduce poverty. A lot of targeted policies—basic social safety nets and cash-transfer schemes, such as Brazil’s Bolsa Família—help…But the biggest poverty-reduction measure of all is liberalising markets to let poor people get richer.
See, Toward the End of Poverty
But does anyone care for the crying crocodiles?
Ah kinda reckon efn yew aint pore yet, yew shonuff will be pore aftur them revenoors start kollektin thet car-boon tax.
How many times have you went to Kenya and delivered books and school supplies to the poor natives that live in rural Kenya lolwot?
“As if you or kim give a stuff about the poor.”
Always a reassuring pleasure to drop in randomly and once again find lollywot, or Josh, or the always tender hearted telescope demonstrating the very best in human nature.
“Projection” lolly. Look it up.
Libertarian homeless shelter
10 years, 50 years, or 80 years…are all essentially equivalent from a long-term geological perspective in terms of seeing an ice-free summer Arctic. The adjectives to describe this change is simple- extremely rapid and virtually instantaneous. The speed of the decline to ice-free will be dictated by both natural variabilty and feedbacks- none of which can modelled accurately. It is all happening very rapidly, with changes in the Arctic involving far more than just the cryosphere. Finally, though there is littlle doubt that natural variability plays a role in the acceleration or deceleration of the decline, the anthropogenic component seems quite clear. We are likely headed for a Pliocene-like climate for the Arctic in the coming centuries– a very rapid change by any metric. To me, the more interesting question is whether this will turn out to be a bad or good thing overall for the majority of species impacted.
While “the anthropogenic component seems quite clear” to you, to a scientist, about the only conclusion we can draw from that is you do not blame global warming on aliens.
Mr. Wagathon,
There is not one expert in the field who would disagree that there is at least some anthropogenic fingerprint on the changes being seen in the Arctic. Only the degree of natural variabilty separates their opinions, and in that, the other issue is how much anthropogenic factors may be modulating natural variability. Particular interest and intense research is focused in the modulation of the AMO by anthropogenic factors including both aerosols and GH gases.
Outside of the Urban Heat Island effect, you are spouting pure bullcrap. Natural variability can explain all of the climate change we see. To deny that is and abdication of science, preferring instead a life of superstition and ignorance.
He would be thunderstruck if the Arctic bulked up again, as it seems to have done repetitively, persistently, hemi&semi&demimillenially. He’s already jaundiced in his Southern eye.
===================
Two sides of a coin,
Attribution/sensitiv;
Will it be to warm?
Will it be to cool?
Flip it in the atmosphere;
Pray for Nature rules.
==============
“seems”
That’s the nature of illusion.
Andrew
Mr. Bad Andrew,
“Seems” is the appropriate response of a true skeptic, as every “truth” is held as provisional.
“Seems” is the appropriate response of a true skeptic”
I’ve found it’s largely the response of idiots.
Andrew
Who will seam up the unseemly rent in climate science.
============
Mr. Bad Andrew,
It is the “idiots” who are 100% sure they are right. Also know as true believers and their kin-folk…the true unbelievers.
I don’t know enough to believe anything for sure, but it seems we’re cooling, for how long even kim doesn’t know, but likely for 20-250 years.
=======================
Hey, kim, yer’ve omitted citing confidence levels.
A serf worried about the crop.
Gates, pfttt!
http://redneckphysics.blogspot.com/2013/09/omg-it-is-worse-than-we-thought.html
R. Gates
You state that
There are two basic errors in that statement.
It is true that if the decrease of Arctic sea ice extent continued at the rate observed since 1979, we would see a sea ice extent of 1 million square km (defined by NSIDC as “zero”) in around 80+ years, roughly by the end of this century.
1. But many alarmists have been predicting a late summer “ice-free” Arctic by 2013,2020 or 2030 – not 2100. (BIG difference).
2. This all ASS-U-MEs that the rate of decline since 1979 will continue indefinitely, whereas we all know that the ice went through a similar cycle of decline (lasting about 30 years) in the 1920s to 1940s, before starting to grow to the levels observed for the first time by satellites in 1979. (BIG and very wobbly ASS-umption)
Max
RG,
Your skepticism regarding impact is appreciated. I would expect to see both negative and positive impacts, but have no idea which we will see more of and what the net result might be.
Mr. Timg56,
No one does. There will certainly be winners and losers.
The temperature rise after the LIA was net beneficial, as will be the rise from AnthroGHGs, if we get it.
===================
“The United States has the largest amount of arable land of any nation, and climate change has only made it better.”
http://www.usatoday.com/story/news/nation/2013/09/17/climate-change-agriculture-crops/2784561/
Kind of makes me feel Patriotic.
There’s a cool map with a slider at the link, showing where the cornbelt has gone.
I see Renville County is growing corn until the cows come home.
Finally, though there is littlle doubt that natural variability plays a role in the acceleration or deceleration of the decline, the anthropogenic component seems quite clear. We are likely headed for a Pliocene-like climate for the Arctic in the coming centuries
If there is little doubt that natural variability is a player(GHG such as Co2 being less then present and T was higher) what was the role of the Antarctic and the SO during the concomitant SH cooling ?
http://www.pnas.org/content/109/17/6423
Those shifty westerlies.
Indeed.
http://www.clim-past.net/7/1123/2011/cp-7-1123-2011.html
Maks, there is a growing list most with links to GFDL.
Instead of continuing to waste $250 Billion a year on climate change to support the Left’s ruction of the culture and the economy, “the reasonable and moral policy would be to foster economic growth and well being in order that societies be better able to deal with climate change regardless of its origin.”
… quote by Richard Lindzen
Interesting running battle re the various individual trees.
The temperature/sea ice/glaciers/ocean heat content/number of drowned polar bears/ad infinitum are going up; see my super-scientific graph!
No they aren’t! They are going down; see my even more super-scientifical graph of the same data!
Absolutely not! I have double mathematically graphed the data and have found that they are going nowhere, neither up nor down!
We have taken the raw data and adjusted it appropriately to prove what we predicted when we wrote our grant proposal! Whatever that was.
Since there is not much apparent argument that the climate we have, right now, with 400ppm atmospheric CO2, is well within the bounds of climate excursions over the last few thousand years, my question as an outsider is ‘Where are the data that show what portion of the observed variations over the last hundred years or so is driven by anthropogenic CO2, that the consequences of the anthropogenic subset of climate variations are so severe that they justify worldwide governmental action to ameliorate them, or that the policies suggested (so far) will in fact accomplish the advertised climate changes?’.
Since the argument on this thread seems to be about variations in Arctic sea ice, where is the actual DATA, with the +/-100 km^2 accuracy and resolution reportedly achieved by satellites since around 1979, for the sea ice extent over the last 500 years or so and the daily variations in same so that I, as a layman, can compare it with modern precision data and make some sort of judgement as to whether there is anything to get excited about.
While we are at it, since people reportedly transited the Northwest Passage several times in the past when anthropogenic CO2 was NOT plausibly a problem, explain to me again why should I care if they could do it next summer or 10–or 20 or 50–years from now and why that fact would justify shutting down anthropogenic CO2, which climate experts seem to be advocating.
Bob Ludwick
Yes, but I might settle for 100,000 sq. km accuracy and resolution over the last 500 years, mebbe even a million. Are we there yet, tony?
=======================
Oops! Sorry, Kim. +/- 100,000 km^2 is what I actually INTENDED to write, before you corrected me so gently.
So I just add proofreading to the seemingly endless list of tasks that I am not so hot at.
But the above touches peripherally on another facet of ‘climate science’ that, maybe unjustifiably, sets my ‘Danger Will Robinson, Danger!’ flag: the fact that Climate Science press releases routinely report the ‘AnnualTemperature of the Earth for Year X’ with hundredths of a degree precision, usually followed by a breathless announcement that the data proves that Year X was the warmest year of the last century–or millennium, or Holocene–by .035 degree, or some other such patent nonsense. I remember one such release by NASA a few years ago (which I quoted on this web site in another post awhile back, but am not going to bother looking up again) which cited the ‘Temperature of the Earth’ for the previous year with thousandth of a degree precision and announced that it had beaten the previous record by a couple of hundredths of a degree.
As far as I know, which is admittedly not very far, there is not even an agreed upon definition of the ‘Annual Temperature of the Earth (TOE)’ across the climate science community, nor is there an agreed upon procedure by which it is measured and reported. Nor does there seem to be an internationally accepted set of standards by which the data acquisition system which purportedly measures the TOE with such amazing precision is calibrated and maintained.
But, regardless of my misgivings and the vagaries of actual, real-world data, Authentic Climate Scientists appear to be going to the mats in defense of the Prime Axiom of Climate Science, and the government clearly intends to back them up. With force, if necessary. Doubt my force prediction? Try bucking the EPA when they start closing down your business or confiscating your car (cars, not yet, but soon) for emitting an excess of that deadly poison: CO2.
Bob
I bet Bob gets confused about fertility rate too.
How can a woman give birth to 2.52 children? How can they measure fertility to the precision of a hundredth of a child!
lolwot
As usual you fell flat on your nose with another silly analogy (or should I refer to it as an ANAL-ogy?)
You can count the number of births per mother in a given sample very accurately. All mothers and children are counted. The number changes as new mothers and children come into the equation.
We are unable to measure the “globally and annually averaged land and sea surface or lower tropospheric temperature” with that kind of accuracy.
It’s a bit better than a WAG, but only a bit better (as I’m sure you are aware).
Max
Oh yeah sure, today it’s a wag. Tomorrow you will be claiming it’s highly accurate enough to show there’s a pause in warming.
Such hypocrites.
Accurate enough to call it “slight cooling”
That right Max?
We used to call that talking out of both sides of their mouths.
kim
In order to estimate an extent, first we all have to agree what is ice and what is water and what is water resting on ice (did you ever see the explanation from Julienne Stroeve)
Then I reckon we can get to an accuracy of 1 million sq km back 500 years. The result wouldn’t look anything like Kinnard et als graphic. Please send research funds.
tonyb
Great t; in the top ten fastest live action grant proposals. The utility, the utility.
=========
On Friday, September 6th, the American Tradition Institute (ATI), a non-profit public policy organization, along with counsel from the Free Market Environmental Law Clinic (FMELC), filed a lawsuit seeking to compel the University of Arizona (U of A) to produce public records relating to what the London Telegraph’s Christopher Booker called “the worst scientific scandal of our generation”. These records are emails relating to the notorious global warming “Hockey Stick”, and the group that made it famous, the Intergovernmental Panel on Climate Change (IPCC). IPCC is presently in the news for its latest in a running series of proclamations of looming climate catastrophe, and a now ritual proclamation of even greater certainty that economic activity is to blame.
“The public are increasingly aware that they have funded the effort to impose an all-pain, no-gain energy-scarcity agenda on them, from activists in federal bureaucracies and the green pressure groups they love, down to activists ensconced in state universities,’” says Chris Horner, ATI Senior Fellow, FMELC attorney and author of The Liberal War On Transparency, who managed the initial request and productions. “As such, we continue to seek copies of records the public paid for, to help bring about the oft-promised, yet rarely voluntary governmental transparency. Too often public institutions require that we engage in protracted battles under open records laws to allow the public a glimpse at the enormous apparatus they are underwriting,” he added.
Good point, maybe we should put in an FOIA request for all Judith Curry’s emails. You know for transparency.
Maybe… GM. They’re taking our money now, right?
Transparency, now there’s a word that ain’t in the vocabulary
of the progressive, gate-keepin’, data-manipulatin’, pal-peer-
reviewin’, big -spendin’, ($$$) hockey-team or the I-P-C-C. )
b-t-s
Wots your fobie with Dr.Curry?
It is interesting to consider the annual loss of ice extent from March Max to September Min. Using the NIC data, the average difference Max-Min over the last seven years is 10.69 M Sq. Km.
But this mean hides a dumbell distribution. There are 3 high years (2007, 2008, 2012), all over 11 M averaging 11.40 M extent loss. The other 4 (including 2013) are all more than 1M lower in extent loss, averaging 10.15 M for the yearly Max-Min.
It seems normal in recent years for the Arctic to fluctuate more than 1M in ice extent up and down.
I would think that the annual loss of ice extent would depend on the temperature both above (the air) and below (the ocean) the ice. Being pretty much a layman, have there been any studies done of the correlation between the amount of ice melt from max to min extent, and the prevailing temperatures in/around the Arctic during those times. I would think during “hot” years where the average temperature during melt season is larger than multi-year averages for the same time of year, the amount of max-min would be larger than in “cold” years.
Very roughly of course since other factors would be at work, but that’s my intuition of what the data should show.
Yes, Michael, those appear to be 2 important factors. Dr. J Curry provides this list:
The following factors impact the sea ice fate during the melt season:
* Thickness and compactness of sea ice at the beginning of the melt season: ice that starts out thinner is more easily melted away. Further, first year ice has different optical and thermodynamic characteristics than multi-year ice.
* Transport of ice through the Fram Strait (between Greenland and Europe), which depends on a combination of atmospheric and ocean circulation patterns
* Weather patterns that act to either break up or consolidate the ice
* Radiative forcing (which is dominated by the cloud patterns)
* Melting from below by warm ocean currents.
* Melting from above by warm atmospheric temperatures.
* Geographic distribution of the sea ice, which depends on a combination of all of the above.
http://judithcurry.com/2012/09/16/reflections-on-the-arctic-sea-ice-minimum-part-i/#more-9790
Thank you Ron. I did flip back through Dr. Curry’s blog but missed that one (there is a lot of material here – and that’s a good thing!) I will read that blog post that you linked in detail as my next step. And in turn, that blog post has a number of other linked papers which I can look at.
It’s complicated, of course, but one interesting observation is that 2007, 2008 and 2012 all had abnormal wind patterns.
“Both winter and summer winds are important for September SIE. However, it is notable that recent large losses of September sea ice in 2005, 2007 and 2008 could not have been well predicted without including the summer index.”
http://wwwoa.ees.hokudai.ac.jp/people/yamazaki/papers/Ogi-etal-GRL2010.pdf
And of course, 2012 was marked by an unusual late August storm
“In the years since 2007, the pattern of ice loss has varied, but a tongue of older ice in the East Siberian Sea has persisted through the summer. This tongue was particularly evident in 2010 and 2011. In 2012 that tongue of ice mostly melted away, aided by the August storm, and ice retreated.
significantly around the entire perimeter of the ice pack.”
http://www.arctic.noaa.gov/reportcard/sea_ice.html
There was much talk in 2007 and 2012 that the notable minima were ‘only’ because of the storms. I’ve seen similar claims this year that it’s only a less dramatic minimum because of winds preventing ice from dispersing.
Everyone finds a freind in the wind.
Maybe these atmospheric effects are the origin of the repetitive pattern I’ve noted.
Earlier this year I found the following relationship between Arctic Osc. Index and the length of the melting period.
http://climategrog.wordpress.com/?attachment_id=226
Thanks Gary. About your chart on freezing and melting seasons, I’m missing something. It appears that in one year, both seasons can be longer than half the year (example 2007). How can that be?
Upon further thought, maybe I understand. For an annual max, the freezing season begins in the previous year, so both seasons can exceed half a year.
But what are we to take from comparing, say, 2007, where both seasons were longer, yet the minimum was a record low, and 2012, the new record low extent, where both seasons are shorter. I see the correlation with AO, but what is the relation of length of season to max and min ice extent?
Good question. Glad you’re paying attention ;)
It’s because they are not simply complementary values( f= 1-m ) . Melting is Mar-Sept of same year; freezing is Sept-Mar of the _next_ year.
Unless sucessive max or mins fall on exactly the same calendar date, the sum will not be exactly one year.
A longer freezing will lead to a shorter next melting etc. but they can shift around each other. Obvious they all add up to eventually and cannot drift to be more or less than a round number of years.
OK you got there before I could type the answer.
That plot is about AO vs melting season. How melting seasons accumulate to affect ice area / volume or whatever is another storey.
AO seems quite important, it even correlates with atm CO2 at Mauna Loa which amazed me. Probably says something about arctic sink of CO2 playing globally significant role.
PS , perhaps more significantly says something about the role of atm pressure is CO2 sequestration, which implicates SST via the temp dependency of Henry’s Law “constant”.
which is turn explains the observed correlations between CO2 and temp that many try to ridicule. It’s not the only factor in atm CO2 but neither is it negligible.
On another note, all of the hottest years also translate to a larger spike at Mauna Loa. The years 2007, 2012, 2010, 2002, 2005, and the biggest of all 1998 show the biggest ML co2 gains. Do the ‘hot’ years mean less co2 being taken in by normal sinks? That looks like it is showing that natural processes are the ‘main driver’ of co2 increase in the atmosphere. The year 1977 is the kickoff year for larger yearly increases at ML. The difference from 1998 to 1999 is co2-2.93 and co2-0.93, respectively. What a difference a year can make. The same amount of anthropogenic co2 was emitted into the air, yet the gain is radically different.
Hard to find actual numbers from Cyrosat2 mission other than massive raw data dumps. They seem to work mainly by press release to Amos as the BBC.
http://www.bbc.co.uk/news/science-environment-23964372
This volume measurement has been used play down the increase in extent / area this year. It is interesting to note the Cryosat data only covers the previous three years (not yet 2013) which as my analysis shows were the decline part of the persistent 5y pattern.
It will be interesting to see Cryosat volume estimations later this year.
If anyone is aware of a source of processed data (ie total ice volume) from Cryosat2 please post a link.
It seems that N. Atlantic SST may largely account for the decadal scale variaiton in arctic ice cover.
http://climategrog.wordpress.com/?attachment_id=521
This is a provisional evaluation using manually fitted parameters.
A quick test shows that Atlantic 20N-70N SST is a better match than ex-tropical N.Pacific or more restricted 55N-75N Atlantic SST.
Hmm.
chicken , egg or common cause ?
It would be very surprising if N. Atlantic SST and Arctic ice cover didn’t correlate. By the way, N. Atlantic SST correlates very well with global (and other like SST, land, NH, SH…) temperature indices.
http://www.woodfortrees.org/plot/hadsst3sh/detrend:0.71/plot/hadsst3sh/detrend:0.71/trend/plot/esrl-amo
It would be very surprising if AMO did not correlate with detrended N.Alt SST. WTF do you think AMO is?
Yes, that would be even more surprising. :)
My point is that AMO is just a manifestation of a global multidecadal oscillation. You can see the same oscillation everywhere. The long term trend is part of the oscillation.
Greg Goodman: that’s exactly the kind of high level (ie, 1 factor) driver analysis I was thinking of.
Although it can’t (by construction) be that precise – thus the multi-year smoothing you’ve applied would be needed, and perhaps I don’t have an appreciation for the “wind and stuff” that could be secondary factors, I would think that the overall sea temperature in the arctic region would slowly integrate into the amount of ice forming/melting.
It’s not a “smoothing” that I’m doing although integration does have low-pass filter characteristics.
The impulse response for the linear model indicated is a decaying exponential:
x0 : exp(-t/tau)
Because this is not symmetrical about zero it introduces a lag (roughly equal to the value of tau) as well as damping high freq. changes.
I need to set up a regression to fit it optimally but by manual adjustment it’s between 8 and 10 years.
“The long term trend is part of the oscillation.”
That is the point I was trying to make by integrating the SST and comparing to ice cover. Everyone likes to get in a lather about run away, accelerating melting. “Unprecedented in our times” , “since records began” etc.
As you say , It’s just part of a cycle. Many scientists , who are not so stupid are being deliberately misleading with this crap.
Its blow out on “the pause” so they’re trying to make mileage out of the arctic since it’s got about an 8 year lag. That give them another five years or so of spin before that becomes untenable as well.
This is getting close to criminal negligence.
BTW it needs a more rigorous regression but the 8 year time constant is useful information.
It means the ice is not likely to melt much more and will now start its own ‘pause’. I’d expected it would take decades to settle.
Civil negligence, huge damages, large class. The class may turn into voters sooner than litigants.
===================
Thanks Greg, for the explanation.
It does seem to me that the issue is what causes variation in ice extent loss. In that context, one needs to look at variations in the Max preceding the Min, i.e. I would want to associate the freezing season for a year with the max for that year.
BTW Sunshine hours posted a dataset for Arctic Max and Min since 1979. I found virtually no correlation between length of melt season and amount of ice loss. (I take your point that the single date of minimum can be perturbed by local weather, and thus not the best measure.)
http://sunshinehours.wordpress.com/2013/09/18/arctic-sea-ice-extent-stats-for-2013-so-far/#comment-3521
“I take your point that the single date of minimum can be perturbed by local weather, and thus not the best measure.”
I think that is the key point. Everyone focuses on the individual day of min/man which is ridiculous as means of assessing length of the melting season by detection of the turning points. You are at the bottom of a curve that is near flat (by definition you are looking for the turning point). The slightest error or perturbation will have a huge effect on the date and we are looking for a signal that of the order of a few days at most.
I recognised the need to filter out short-term variations and examined several different lengths of filter to find out what was needed to get results that were consistent.
Also everyone looks only at the melting period because they obsesses about the melting. Why not evaluate freezing period. It’s an equally relevant measurement.
Once the analysis is done with a bit of thought it starts to make more sense.
How this would relate to ice extent is another matter but probably it would need to be a cumulative integral of melting-freezing period or something because it does not depend upon just one year.
It does not surprise me that Sunshine found no correlation. His signal is drowned out by noise and he’s not looking at the right variables.
for the 3 years that CryoSat data is available, has anyone compared the monthly (say) correlation between sea ice *volume* and sea ice *extent*. Curious whether the 3 years of volume data can be extrapolated back to 1979 (when satellite extent data is available) – which would require a justification that either the depth stays fairly constant, or scales with extent. A comparison at a fine time scale between volume and extent would help to know whether ice depth is a function of extent.
Despite all the press it’s been getting the Cryosat2 data a closely guarded secret. All I have found is youtube vids and a couple of fuzzy graphs with 7 dots per year that cover six months each time.
This does not agree very well with PIOMAS , despite the tweeking, so seem to be being rather cagey about releasing numbers anyone can work with.
Just pretty PowerPoint slides and animations.
Your advice does the best for me. TY!
Pingback: The WUWT Hotsheet for Friday, Sept 20th, 2013 | Watts Up With That?
Interesting diagram having to do with sea ice, maybe What is it that it actually does?
http://seaice.alaska.edu/gi/observatories/barrow_sealevel/brw2012/BRW_MBS12_currTprof.png
Full article here:
http://seaice.alaska.edu/gi/observatories/barrow_sealevel
With an explanation of the chart.
I think the diagram is showing that the sea ice is insulating the Winter Arctic Ocean from losing so much energy.
But I also think there’s more going on. “Towards summer the ice acts as a heat sink with the coldest temperature registered inside the ice rather than in the air.”
Which would be the opposite of what it does in the Winter. So it seems to put cold where we can’t see it in the Winter and gives it back in the Summer.
So we seem to heading to more volatility and less insulation.
So question is does sea ice insulate up there in a significant amount?
I also found this small piece:
“Early Holocene summer sea ice limits were substantially smaller than their 20th century average, and the flow of Atlantic water into the Arctic Ocean was substantially greater. As summer solar energy decreased in the second half of the Holocene, glaciers reestablished or advanced, sea ice expanded, and the flow of warm Atlantic water into the Arctic Ocean diminished.”
from Temperature and precipitation history of the Arctic
Miller et al. 2010. Quarternary Science Reviews 29:1679-1715
Maybe things have turned up North with the sea ice, but if not it seems a deeper into the Arctic circulation might set itself up.
Rust never sleeps and Ocean heat is always trying to escape.
“I think the diagram is showing that the sea ice is insulating the Winter Arctic Ocean from losing so much energy.”
That effect will be present all year round but is masked by the solar input in the summer. Heat loss due to Plank radiation and evaporation increase with greater exposed water area. This is an all year negative feedback with respect to ice loss.
Despite not being so easily noticeable in the summer, this is when the effect will be greatest due to more open water.
Greg Goodman:
I suspect the Earth is trying to throw off more energy. It’s been said the polar regions are the most sensitive, so I might look there. To see Mother Nature doing what she does quite well, maintain a nice place for us.
But I am not sure about the insulating sea ice?
With the albedo up North, on its best day, the Sun comes in at an angle of about 23 degrees at the North pole. A month before or after the Solstice, it’s not lined up as well to received SW. I wonder if the importance of the albedo up there is overstated?
The importance of albedo is -stated. Albedo does not just mean white. The reflection of solar is muted for the reasons you state. The opposite albedo effect , which is LW infra-red emission is there all year round and does not depend upon the angle of the sun.
I just don’t see this discussed at all.
Dear Judith
I would encourage you to get in touch with the National Snow and Ice Data Center. The arctic ice record goes much farther back than 1979, pretty much all the way to 1962.
We recovered the Nimbus 1, II, and III High resolution radiometer data for them and the Advanced Video Camera System (AVCS) images from Nimbus have been found.
This is a global map from the HRIR images from a single Day in September of 1966 from Nimbus II. I have found Pacific Typhoon track data and overlaid that on the HRIR data and they are spot on.
http://www.panoramio.com/photo/86712068
Here is another one from the Nimbus AVCS Camera.
http://www.panoramio.com/photo/96646945
Judith this information is out there to reconstruct Arctic ice much farther back than 1979….
Dennis
Did you see my article here.?
http://judithcurry.com/2013/04/10/historic-variations-in-arctic-sea-ice-part-ii-1920-1950/
We can probably get back to the 1920’s with some worthwhile degree of accuracy but its a big project. There is an official group supposed to be tasked with reviewing ice levels to 1870 that I note in the article.
The existing ice extent for the period 11920-1940 is not very accurate.
tonyb
Pingback: Data corruption by running mean ‘smoothers’ | Climate Etc.