
by Rud Istvan
One of the catastrophes associated with anthropogenic global warming (CAGW) is a rising sea. Is the projected rise and rate unprecedented? Will it be catastrophic?
This essay is adapted from a much longer illustrated essay just drafted for a forthcoming (somewhen) ebook on climate and energy. It practices ‘the arts of truth’ in some previous posts here, and as in that previous ebook.
There is no doubt that melting ice during interglacial periods causes mean sea level (MSL) to rise dramatically. This has been measured in coastal sediment cores all over the world. For our present Holocene interglacial, the rise was about 120 meters, mostly over about 6000 years. It slowed dramatically (but did not stop) about 8000 years ago. Much of the melt water came from the Northern Hemisphere’s great Laurentide, Scandinavian, and Siberian ice sheets, which disappeared. (JC note: paragraph edited to fix an error, as per an email from Rud and comments in the text).
MSL during the last interglacial, the Eemian (MIS 5e), peaked twice above present MSL. The first peak was at least 6.6 meters higher, and the second was least 4 meters higher, with temperatures that naturally peaked at least 3°C higher. All without any AGW help. The first Eemian rise above present MSL took about 3 millennia (22cm/century), and the first refreeze about back to it took about 4 millennia (16.5cm/century). Typical maximum melt/freeze rates, it seems.
An equivalent rate of rise may have begun again. 20th century MSL rise is estimated to have been 17cm. The IPCC projected another ±30cm by 2100 if the worst AGW scenarios occur (IPCC AR4 WG1 FAQ 5.1). That isn’t unprecedented, isn’t much, isn’t fast, so isn’t catastrophic. Even if correct, it argues for adaptation rather than mitigation.
Sure enough, just in time for the upcoming IPCC AR5 SPM, evidence for catastrophic sea level change has been discovered. As the NYT duly noted, “Babies being born now could live to see the early stages of a global calamity.”
The NYT also said, “If you are the mayor of Miami or a beach town in New Jersey, you may be asking yourself: exactly how long is all this going to take to play out?” Since I live directly on the Atlantic in Fort Lauderdale, that was a really good question. Could not take it rhetorically. So my answer follows.
The Nature Geosciences article is paywalled. Essential bits are extracted below in accordance with US fair use doctrine. The authors present paleocoral evidence that the second Eemian rise was abrupt (≈17 feet in >>1000 years, or >>45cm/century) at ≈119.5kya along the Western Australia (WA) coast around Perth. This could only have come from a collapse of potentially unstable WAIS, with possible Greenland contributions. As NYT noted, puts the C into CAGW.
Australia is not geologically stable despite being in the middle of the Indo-Australian plate. It has experienced many strong earthquakes (≥Richter 6) over recorded history. Those ‘tectonics’ cause uplift and subsidence relative to MSL. For example, the US’ famous New Madrid earthquakes of 1811-1812 occurred thousands of km from any continental plate edge. The New Madrid event caused subsidence of 6 meters in an area 5kmx30km (Tennessee Reelfoot Lake), and uplift averaging 3 meters in an area 50kmx23km (Arkansas Lake County uplift). There are nine known active fault zones ‘near’ the WA coast from south of Perth to Cape Range, along which all of the paper’s 28 paleocoral sample sites are located. The 1968 Meckering quake east of Perth (away from the WA coast) caused a 1.5 meter uplift visible across highways and railroads. That alone suggests a paleodata MSL problem in WA.
So the authors carefully established a tectonic MSL baseline at ≈119 kya in their Figure 1 for their entire surveyed coastline. (There is some uncertainty in the radiometric dates, as Figure 3 below shows.) Indeed, one site (Cape Cuvier at the southern end of Quobba Ridge) evidenced about a meter of tectonic uplift. So that datum was excluded. This site was also carefully labeled, and also excluded in the paper’s key Figure 3 analysis. Careful scientific work, it seems.

This Western Australia MSL baseline was ‘roughly level’ after GIA corrections. (Really?) The authors concluded fossil coral outcrops had not been affected by tectonics, except at Cape Cuvier. They restated this essential fact in their interview PR:
“But after mapping and surveying the Last Interglacial fossil shorelines from Augusta to Exmouth, my team and I were able to show that these ancient shorelines outcropped at similar elevations along this entire length of coastline and therefore have not been affected by tectonic movement.” Sort of true except at one place.
So the abrupt sea level rise beginning ≈119.5kya shown by crucial Figure 3 Relative Sea Level Curve for Western Australia could only be attributed to ‘sudden’ ice sheet collapse. The 30-year old unstable WAIS disintegration hypothesis was proven. Dangerous tipping points ahead! Be worried, Miami!
Except the data in SI2 say it aint so. The logic is faulty to the point of arguable deception, and NatGeo peer review did not catch some obvious issues. 11 of 19 late highstand corals in crucial Figure 3 were above the pre 119kya MSL baseline. Some others were well below. Odd. Especially given a supposedly stable coastline. Figure 3 also suggests a sudden MSL fall, which could only come from a freeze. Odder. WAIS might suddenly collapse, but it surely cannot suddenly uncollapse. Freezing should take several millennia.
SI2 enables matching each graphed ‘late highstand’ paleocoral sample to its site, in order to understand Figure 3. That is a bit tedious, and something the peer reviewers undoubtedly did not do. Here are some, plotted on a copy of Figure 3. Most of the late highstand corals were identified as genus Acroporae. The blue line is roughly prior MSL, ‘anchored at Red Bluff’ (the only hint of truth in the paper itself about this figure) by the lower reef platform coral genus Favlidae. Painstaking GIA corrections (bars/vertical arrows) are immaterial, since Figure 1 showed them all about equal in magnitude. Horizontal lines show estimated radiometric date uncertainty. More careful science, it seems.
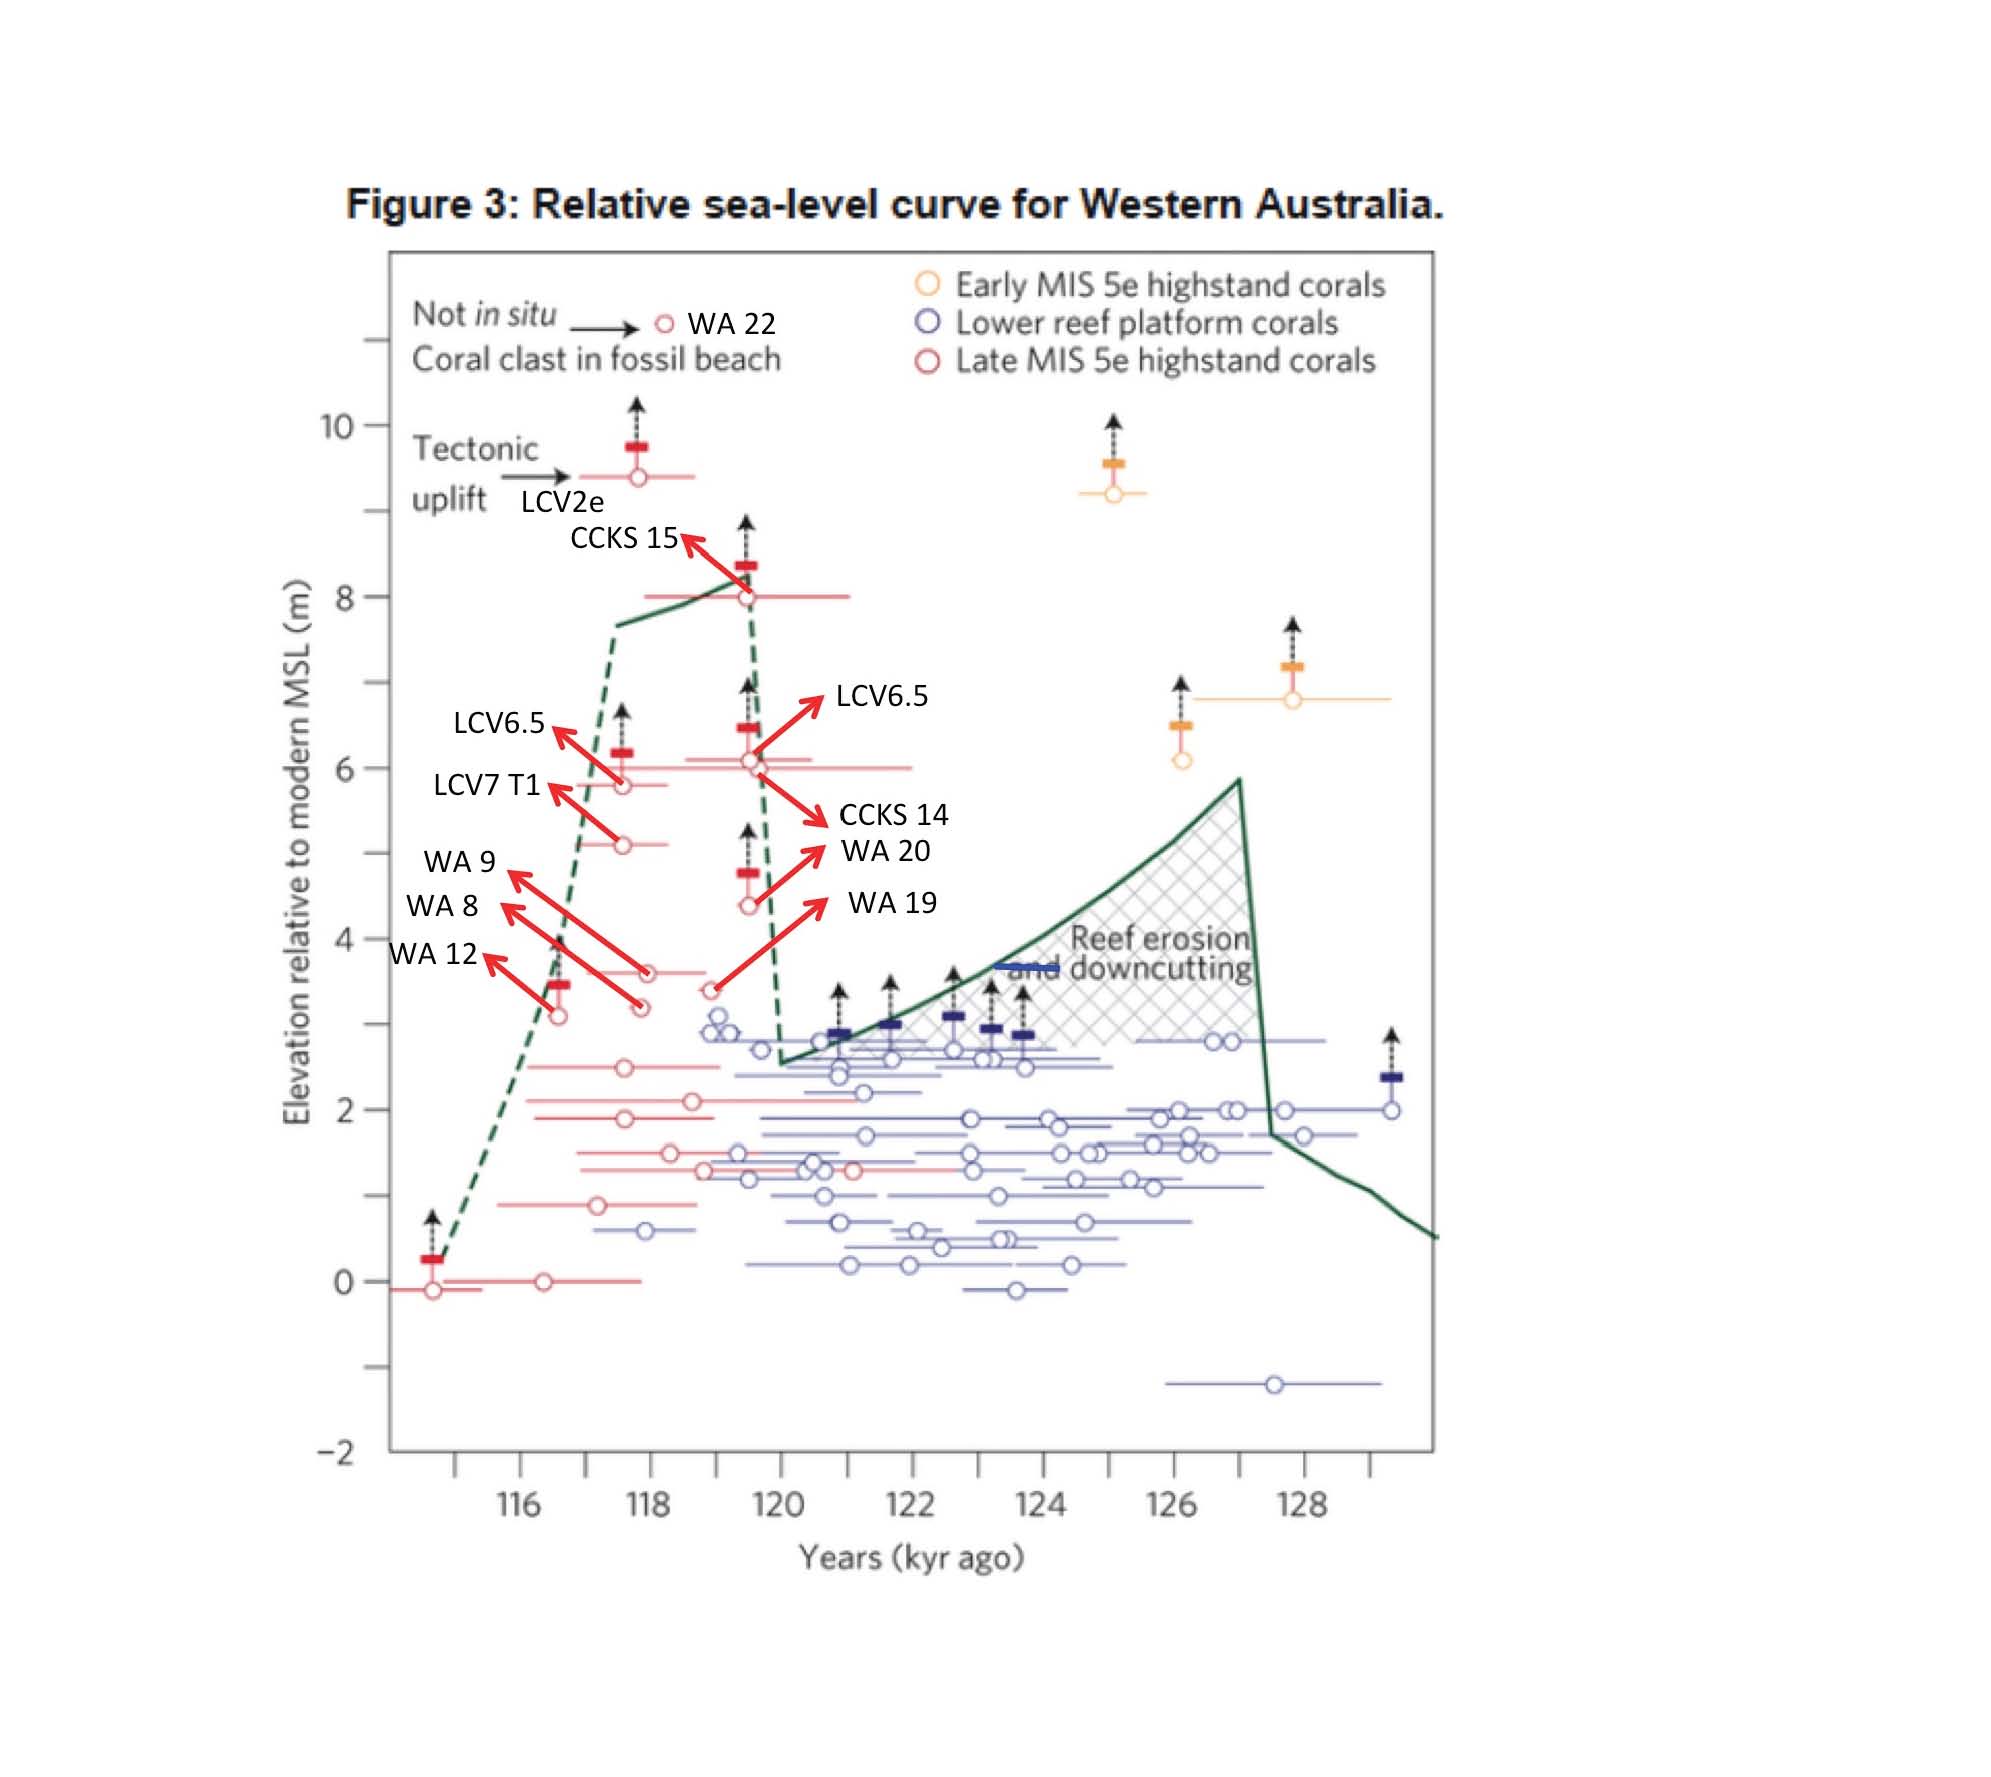
Every red dot above the prior MSL is from a Quobba Ridge site. (Drawing a sea level line around a few possibly uplifted samples is potentially misleading.) But so are the seven same age red dots below MSL. And so is every other dot. Figure 3 isn’t the surveyed Western Australia coastline of its caption or of Figure 1. It’s only Quobba Ridge. This is easily verified without checking each datum by the summary SI2 tab 4 of all 28 site stratigraphies. SI2 is not paywalled. A single New Madrid like ‘event’ in the vicinity sometime between then and now could suffice—and at least one did, at the Cape Cuvier site of Figure 1.
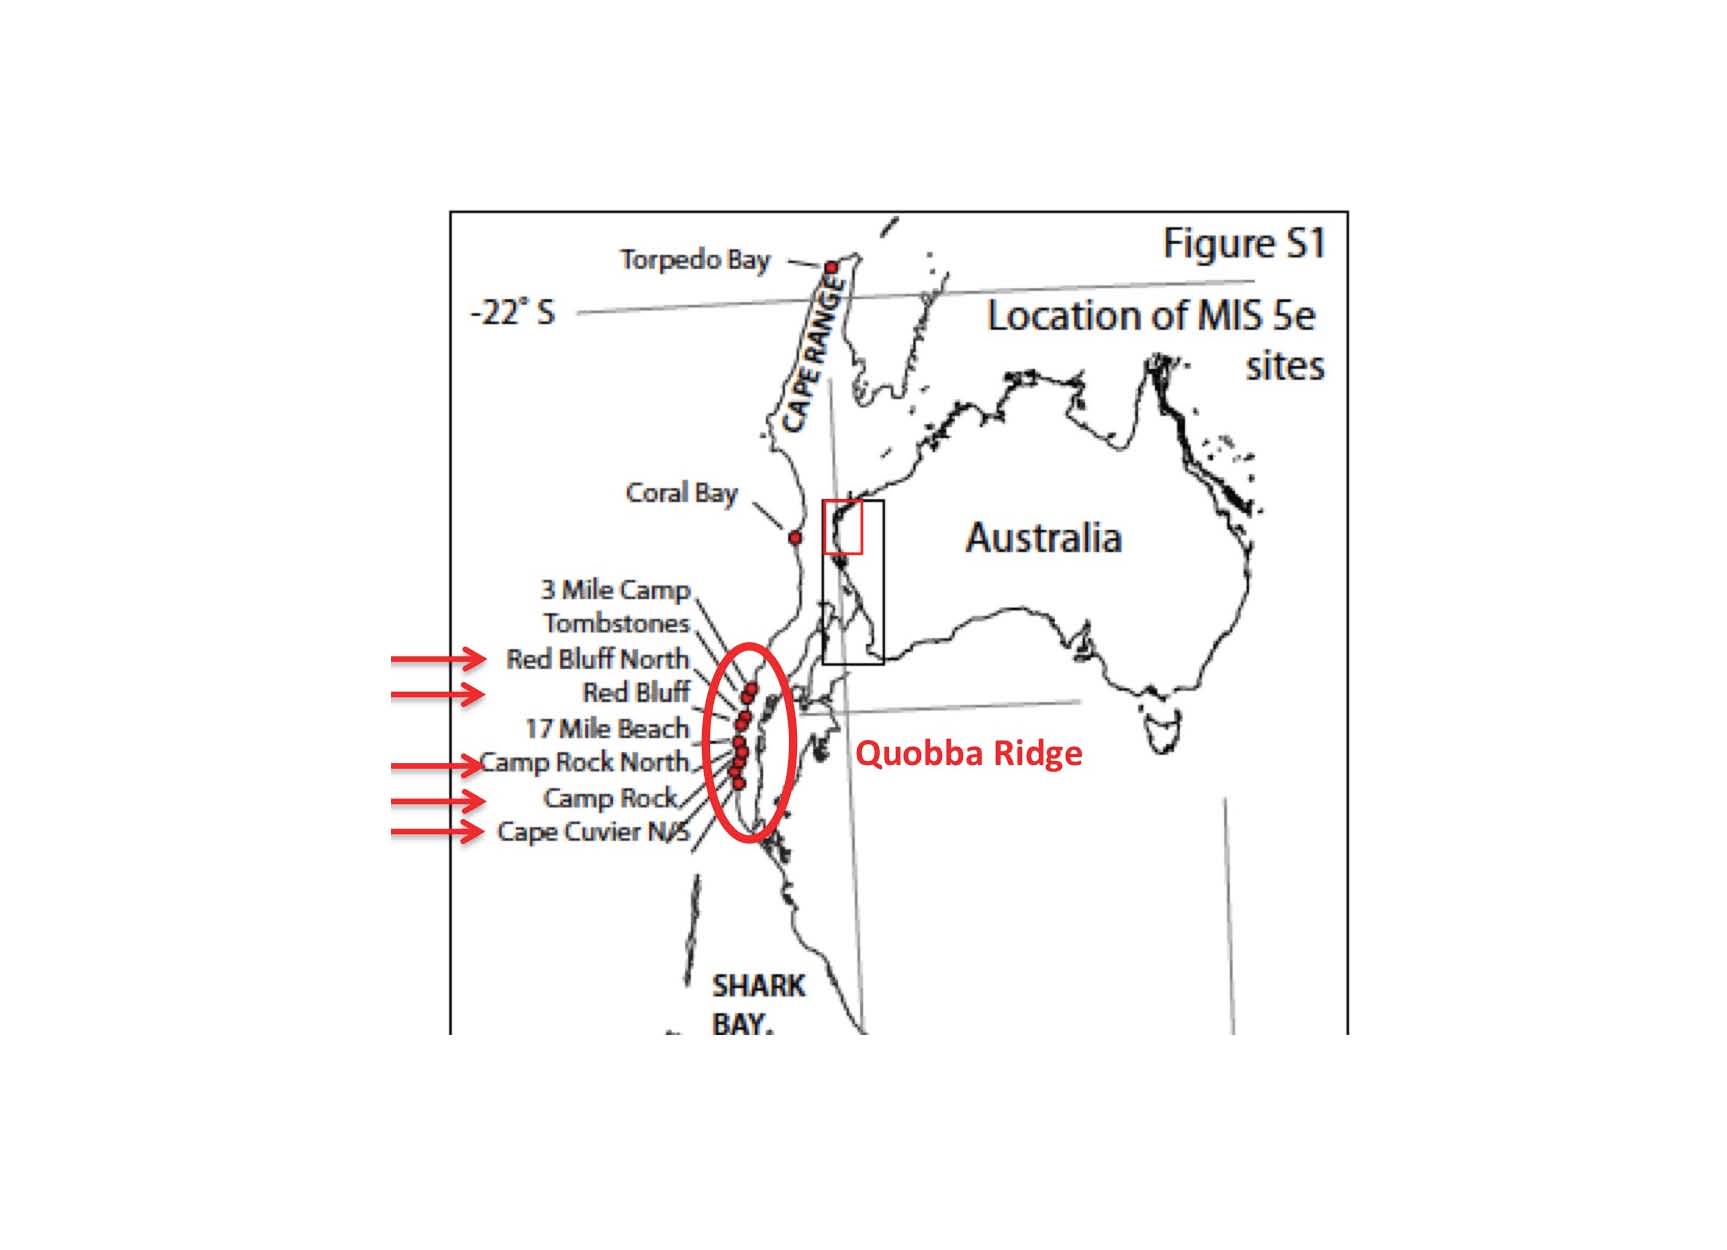 By the way, Quobba Ridge is in one of Western Australia’s 9 known active tectonic zones today. The Geoscience Australia epicenter map (linked above) records 2 significant quakes exactly on the Quobba Ridge coastline itself.
Sadly for the Nature Geoscience title, Ice Sheet Collapse… during the last Interglacial, none of the other new WA-U samples from elsewhere (SI2 tab 3) show this sudden extreme rise and fall. Nor do any of the archived ‘Dutton’ samples (SI2 tab 2). The rest of the WA coastline disproves the ice sheet collapse thesis. It only shows the generally accepted Eemian double rise and fall above present MSL at ‘normal’ rates of melt and freeze.
Science got Marcotted (two previous posts) by revised coretop dating. Nature Geoscience just got O’Learyed (this post) by a gross disconnect between a figure and its title. Destruction of trust in science by the CAGW hockey stick gang continues.
JC comment: Rud Istvan is author of the following books:
Rud has also posted previously at Climate Etc.:
- Playing hockey – blowing the whistle
- Lets play hockey – again
- IEA facts and fictions
- Another hockey stick
- What climate sensitivity says about the IPCC process
- The Government-Climate Complex
- NRC’s artless untruths on climate change and food security
Editorial note: This version is changed slightly from the original, to fix an error and to make other edits to improve the presentation.

It’s peer reviewed Climate Science, so it must be true.
Lest anyone has forgotten, or relaxed enough for their panties to unw I wanted to remind everyone that Rud is a former Fortune 500 senior VP.
That has the makings of a smear. Your point? Please have the courtesy and explain.
ice sheet is not going to collapse – lots of worries for NOTHING
Children, the sandpit is yours, get busy
I don’t understand, the article mentions ‘WAIS’, but also “Western Australia’. I understand WAIS to be West Antarctic Ice Sheet, having nothing to do with Australia. And, in their book ‘The White Planet’, Jouzel, Lorius and Raynaud describe ice cores from several Antarctic sites and all have records going back more than 250,000 years. There was no huge movement of WAIS over that time.
IF Eemian sea level peaked at 6.6 and 4 meters with temperature only 3C higher than now, isn’t that cause to consider ‘catastrophic’ AGW, a possibility, with all major glaciers melting, possibly Greenland included (but NOT Antarctica)??
Walter Carlson | September 1, 2013 at 7:46 pm said: ”And, in their book ‘The White Planet’, Jouzel, Lorius and Raynaud describe ice cores from several Antarctic sites and all have records going back more than 250,000 years.”
Hi Walter, there is no that much old ice on Antarctic or Greenland. Ice constantly melts from below, by the geothermal heat and new ice is created by ”freeze-drying” the moisture from the air.
They see that is no rain or snow there, and presume that is all that old ice, WRONG! up to 2m of ice is melted from below every calendar year and similar amount is created by freeze drying the moisture from the air that is crystallized in a form of blizzards, similar way as the old fridges used to build up ice without any rainfall or snowfall in the kitchen; just by opening the door and moist air. Antarctic & Greenland don’t have doors, they are open for business every minute in the year . Cheers
stefanthedenier…you said:”… up to 2m of ice is melted from below every calendar year and similar amount is created by freeze drying the moisture from the air that is crystallized in a form of blizzards, similar way as the old fridges used to build up ice without any rainfall or snowfall in the kitchen; just by opening the door and moist air. Antarctic & Greenland don’t have doors, they are open for business every minute in the year . Cheers”
From what you said, I conclude that a) you have absolutely no idea what goes on in these continental ice sheets, and b) you make up baloney as you go along. Why do you write such crap??
Seems observed increaseing and future acceleration in sea level rise is a big concern in Hawaii :
http://phys.org/news/2013-08-sea-level-shoreline-retreat-hawaii.html
Thanks, R.Gates. Very interesting that the rates of sea level rise on the two islands are dependent on different rates of subsidence of land, which seems to be based upon distance from the active volcanic hot spot.
I’m concerned in general about people living on top of active volcanoes with nowhere to go because they’re stuck on little islands in the middle of a vast ocean.
Don’t see the concern. Hawaii is not a group of tropical coral atolls that are just a few feet above sea level. They are the tops of mountains, and have elevations of thousands of feet to work with. The people there can easily adjust to sea level rises of 35 CM per century, and probably much more if necessary.
You seen how much development there is in Hawaii as close as practical to sea level? It’s a lot.
Yup, I’ve seen it. Leads me to believe they would know how to build up higher as needed. That they’ve *chosen* to build near the ocean doesn’t mean they can’t choose to build elsewhere down the road.
“Australia is not geologically stable despite being in the middle of the Indo-Australian plate. It has experienced many strong earthquakes (≥Richter 6) over recorded history” – RI
It is pretty stable – mostly pretty minor stuff <2
Define "many"?? A handful? I'd say it's something like one a decade, over the entire continent. In WA the SW is the most active area.
Pretty stable over recorded history (xhundred years) could be pretty unstable over x000 years. Time perspective art of truth.
Stability is a function of time? Given enough time, nothing will happen?
Get outta here !
Max OK, check the linked recorded Oz history chart. Then (imaginatively) multiply by x~510. Then check back with conclusions rather then opinions.
Rud, I believe age is a function of time, but I don’t believe stability is. But perhaps I misunderstand you, and you aren’t saying it is.
Max_OK:
Given enough time, everything will happen.
Raggnar, I like what you say better than “given enough time, nothing will happen.
While it’s hard to imagine change happening without the passing of time, time usually doesn’t explain what drives change, except in the case of aging.
Max_OK | August 31, 2013 at 1:34 am |
Stability is a function of time? Given enough time, nothing will happen?
Get outta here
Perverse.
Obviously stability can only be understood as a relative term, not an absolute one. How much variation, how long did it take, compared to other examples ?
Anything could mean anything over whatever.
Church Norris Art of Truth.
Ragnaar | August 31, 2013 at 2:10 am |
“Given enough time, everything will happen.”
Everything which is possible, no matter how improbable, will happen given enough time. The impossible won’t happen regardless of how much time passes. So basically we have to wair forever plus one day for climate alarmists to smarten up. Get it? Hahahaha I kill me sometimes.
.
> Everything which is possible, no matter how improbable, will happen given enough time.
Nietzsche stole that one from Chuck Norris.
That’s why God’s now dead.
willard (@nevaudit) | August 31, 2013 at 3:51 pm |
“Nietzsche stole that one from Chuck Norris. That’s why God’s now dead.”
Poor confused child. Chuck Norris IS God and that’s why Nietzsche is dead.
Given enough time, we’re all going to die….
Will scientists still need a watch in eternity?
Too stable, actually.
http://www.cosmosmagazine.com/news/australia-overdue-volcanic-eruption/
Oklahoma was under the sea in the Late Cambrian Period, which was a lot earlier than the Holocene Rud Istvan is talking about, but it wasn’t a result of melting ice. Oklahoma could use more water (not the salty kind), but doesn’t need more CO2 and heat.
You are not alone; Max.
I think he could be. Has anyone actually determined if there are more of his particular species roaming the planet? If that’s too disturbing for you to contemplate then I offer my apology in advance for bringing it up.
The IPCC assumed the ice-sheet melt rate or collapse would not accelerate by 2100 because they didn’t know how to predict it. This can be regarded as a conservative estimate at best. There is a lot of uncertainty in their number and it all goes on the up side.
Jim D
Not really, Jim.
Check Nils-Axel Mörner, who believes IPCC SL projections are on the high side.
Max
No-one that matters takes morner seriously
Not in the morning, at least.
Infinitely more seriously than anyone takes lolwot. Any finite number divided by zero …
@Jim D
The IPCC assumed the ice-sheet melt rate or collapse would not accelerate by 2100 because they didn’t know how to predict it. This can be regarded as a conservative estimate at best. There is a lot of uncertainty in their number and it all goes on the up side
Because … Jim D says so?
The Florida Keys are an exposed ancient coral reef. I have stood on dry ground where the top of the coral was roughly 8 or 9 feet above my head. At some point, water covered these reefs otherwise the coral would not have grown.
I grew up in Florida — arriving there in 1955. It was a beautiful state; exotic, tropical, and even wild within six miles of the southeastern coast (Hollywood/Ft. Lauderdale). At the time, Hollywood had a population of about 20,000. The barrier islands were endless and wonderful beaches and mangrove and dry land (at high tide) filled with hundreds of species (by my youthful and uneducated count). Now they are landfills supporting concrete monstrosities thirty or forty or more stories high obscuring the view of the wonderful Atlantic Ocean pretty much from Palm Beach to Key West.
I would cherish a 20 or 30 foot sea level rise to allow this beautiful land to revert back to its original geography where the corals could grown again (I know, I know . . . CO2 is an acid). But seriously, bring it on. Let the denizens move back to Pittsburg, Peoria or Portland. Ok by me.
Of course, this ain’t gonna happen cause the ocean is not going to rise that far. And if it did, they would just turn South Florida into Waterworld and charge an admission fee. Unless the climate goes south. Then the highrises could be converted to ski lifts/chalets.
No, I have not been drinking. Happy LD to all.
IP, nice rant. We have lost a great deal of nature. You must be a fan of Carl Hiassen.
It’s not a rant John. It’s a lament. If you had known the beautiful Florida I once knew you would understand what has been lost to development, population, the Army Corps of Engineers and government “planning”. That once gorgeous and absolutely unique tropical (sub-tropical, really) wonderland is gone forever. Mores the pity. I weep for what has been lost. Let the oceans cover it and let nature begin anew.
Suggest you read Everglades: River of Grass by M.S. Douglas for further insight.
Regards.
A major cliff slump in the Azores would send a tsunami that would scour the whole sandbank called Florida.
ssssh!
Thanks for this post Rud. As a Western Australian living near Perth, I tend to think that earthquake activity has only a minor effect on the sandy coastline strip from Mandurah to Northwest Cape. The heavier clay based country around Meckering still shows scars of the big quake of 1968.
The evidence of drastic sea level changes occurring around the Western Australian coastline, where the Swan River estuary is tidal for about 20 kilometres inland, the Peel estuary, and the Brockman River estuary around Malloy Island, all show no evidence of any large increase in sea levels.
But over 120 centuries? Can you be sure?
Nothing is certain Rud. The following extract seems to indicate a gentle SL lowering of up to 2 metres over the past 1000 years on the WA coast. (with local variations)
“The three most complete records of mid to late Holocene sealevel change in Western Australia are from swash zone facies
(Searle and Woods, 1986), tubeworm deposits (Baker et al., 2005)
and coral pavements (Collins et al., 2006) (Fig. 7). The swash zone
facies and coral pavements are interpreted to represent a smooth
sea-level fall from þ2.0 to 2.5 m to present levels after
1000 cal. yr BP (Searle and Woods, 1986; Collins et al., 2006).”
https://research.jcu.edu.au/research/tropwater/resources/Lewis%20et%20al.%202013%20Post%20glacial%20sea%20level%20change.pdf
Peter, sure. And such a lowering ( tectonic subsidence) over such a geologic short time span is a real problem for the coastline stability asserted in the paper. QED.
Rud,
Er, no it’s not.
They are referring to sea-level, not coastline stability, and it notes the ‘tectonically stable’ nature of the Australian coastline.
And fter reading the Nature Geosciences article, it’s not clear to me that you know what you are talking about.
Quoting the ABSTRACT and following the logical structure of the paper might have helped.
> Nothing is certain Rud.
Except deaths and taxes.
Only taxes willard.
Willard, really?
But no, not even.
Rud got quite exercised over Fig 3.
“SI2 enables matching each graphed ‘late highstand’ paleocoral sample to its site, in order to understand Figure 3. That is a bit tedious, and something the peer reviewers undoubtedly did not do…
Figure 3 isn’t the surveyed Western Australia coastline of its caption or of Figure 1. It’s only Quobba Ridge. This is easily verified without checking each datum by the summary SI2 tab 4 of all 28 site stratigraphies”.
It was even more easily verified by……reading the description under the graph;
“..a predicted relative sea-level curve at Red Bluff,…”
The Arts of Truth??
More art than truth here, I’m afraid.
Nothing new for you Michael.
Even if it did not help Sir, it might have helped readers, Michael
Extending the scope of fiscal hells, Tom
Earth and water
Tumble over;
Tectony,
Gaia’s lover.
========
An anglicization
of Chtohnos:
http://www.metahistory.org/dynamyth/TreeNymphs2.php
Rud: 120 m of SLR over 6 millennia is 20 m per millennium or 2 meters per century. Your mention of +/-20 cm/century is confusing. (Eye-balling the graphs, the main rise was closer to 100 m over 7 millennia, or 1.5 m/century.)
Looking at evidence for historic sea level at one site is a risky. Sea level is a global phenomena. According to one review I read (and can’t find again), records from different places don’t line up well and pulses of melt water aren’t found at all locations. This reflects the uncertainty in the available evidence. Alarmists can pick and chose among the records from various sites, but the global composite record is the most informative one.
Frank, please recheck your unit conversions. Easy way is to use Google. Hard way is to use common sense. Both compute the same result which is just math when you keep careful track of zeros.
I don’t get it. Your numbers clearly work out to 2 meters/century, just as Frank says. Since you didn’t provide ref’s for your numbers, I went looking and found Smith et al. (2011), which is not paywalled.
This paper describes the sea level rises at the end of the last glaciation, with numbers roughly equivalent to yours:
Going on from there, it describes a proposed process for rapid sea level rise:
While the evidence from the Eemian described in the paper under review may be as defective as you suggest, the historical evidence for rapid rises during this interglacial appears to be solid.
The apparently erroneous figure of “±20cm/century” gives a highly misleading impression. Is it supposed to be the error margin in “about 120 meters, mostly over about 6000 years“? Even so, I find it misleading relative to the variations in sea level rise implied in Smith et al. (2011). Perhaps you could provide a reference to your source for this number.
Smith et al. (2011)The early Holocene sea level rise by D.E. Smith, S. Harrison, C.R. Firth, J.T. Jordan Quaternary Science Reviews Volume 30, Issues 15–16, July 2011, Pages 1846–1860
Rud.
You’ve been to fortune 500 media training.
You’ve made a order of magnitude error.
Time for some crisis management
Rud: I was able to do unit conversions long before Google existed and common sense was (and still is) extremely useful. However, out of curiosity, I did put (120 m) / (6000 yr) into Google’s unit converter and did get 2 m / century.
I don’t understand is why there is a +/- symbol in front of and parenthesis around 20 cm/century. This makes it look like uncertainty. If you are really trying to say that the rate was 2.0 +/- 0.2 m/century (200 +/- 20 cm/century), the normal convention is to use the same units for the central value and its uncertainty. However, symbols like +/-, >, and < sometimes get mis-interpreted by word processors as one pastes text from one document to another.
Steven Mosher | August 31, 2013 at 12:00 pm |
You’ve been to fortune 500 media training.
You’ve made a order of magnitude error.
Time for some crisis management
Damn your eyes, Mosher. You beat me to the punchline. Cherish this rare moment.
David,
I found it funny that people argued about Rud’d media training.
Now we will see if his company got their money’s worth.
Or perhaps he will re write the piece with help from Brandon and seal his fate.
I’m amazed how often I see people drop my name on this site when I have no connection to what’s being discussed. It makes me wonder how often I don’t notice it. Personally, I’d think you guys would have better things to do.
Oh well. Stay classy.
Frank is quite right. 120m over 6,000 years is indeed 2m per century, and not 20cm. There are 60 centuries in 6 millennia, aren’t there?
• Frank’s arithmetic is entirely correct Thank you Frank!
• Rud Istvan’s arithmetic is just plain wrong> Please post a timely correction Rud Istvan!
Absent a timely correction of your post’s erroneous computations, folks may infer that your cognition is indifferent to rational critiques, and that in consequence of this indifference, your essay is just another example …… of ideology-driven …… denialist …… nutjobbery, …… eh Rud Istvan?
Observation the denialst “spin-rate” is increasing even faster than the sea-level!
AFOMD,
Then you do declare that Pachauri’s non admitting of error and THEN cashing in on the Himalayan glaciers nonsense, after the error was exposed, was… uncriminal? Yes.
Frank, my understanding is that coming from the depths of the last ice age, sea levels have risen about 380 feet or so, consistent with the 120 of SLR, worldwide, due mostly to the melting of the huge ice packs over Canada, Scandanavia, and parts of Russia (had to be some thermal expansion as well, and contributions from other icefields).
Yes, it is certainly true that different seacoasts experienced different amounts of actual SLR. When the huge ice sheets melted, the lands where they once were “rebounded” upward. Canada near Hudson’s Bay is still uplifting, a little, which causes the mid-Atlantic near NYC to actually be falling about 6 inches per century, even if there were no change in the SLR for other reasons. (Think of putting your finger on a balloon – that is the ice field — when you release your finger, where your finger had been now rises back, but on the “rim,” the balloon now falls.) Norway is rebounding faster than Canada. There are parts of Norway now about 60 feet above sea level which 6,000 years ago were at sea level. Waters have risen since then, but the Norwegian land masses have risen more quickly.
Does the plus minus 20 cm per century reflect the uncertainties due to different landforms rising or falling in an absolute sense?
Chicken Little has been working overtime
Destruction of trust in science by the CAGW hockey stick gang continues.
SHAME ON THEM.
It is in human nature.
It is in Human Nature.
Rud Istvan
Another bogus doomsday report based on goofy “science”.
Thanks for exposing it.
Question: Will ICC be foolish (or desperate) enough to cite this study as evidence of much more rapid future SL rise than previously assumed?
Max
@Manacker Max
Question: Will the IPCC be foolish (or desperate) enough to cite this study as evidence of much more rapid future SL rise than previously assumed?
Well, desperation begets exaggeration, and if the customer won’t buy the snake oil, they’ll need to make bigger claims about it. (The desperation stemming from being the realistic fear that very-hard-to-undo political commitment and action needs to be locked in, in case the Pause just keeps on keepin’ on).
And of course a sea-level rise hockey-stick situation offers salvation for the ‘science’, by saying of the missing heat, that “the oceans ate it”,
‘It has been known since Rhodes Fairbridge’s first attempt to establish a global pattern of Holocene sea-level change by combining evidence from Western Australia and from sites in the northern hemisphere that the details of sea-level history since the Last Glacial Maximum vary considerably across the globe. The Australian region is relatively stable tectonically and is situated in the far-field of former ice sheets. It therefore preserves important records of post-glacial sea levels that are less complicated by neo-
tectonics or glacio-isostatic adjustments. Accordingly, the relative sea-level record of this region is dominantly one of glacio-eustatic (ice equivalent) sea-level changes. The broader Australasian region has provided critical information on the nature of post-glacial sea level, including the termination of the Last Glacial Maximum when sea level was approximately 125 m lower than present around 21,000-19,000 years BP, and insights into meltwater pulse 1A between 14,600 and 14,300 cal.yrBP. Although most parts of the Australian continent reveals a high degree of tectonic stability, research conducted since the 1970s has shown that the timing and elevation of a Holocene highstand varies systematically around its margin.
This is attributed primarily to variations in the timing of the response of the ocean basins and shallow continental shelves to the increased ocean volumes following ice-melt, including a process known as ocean siphoning (i.e. glacio-hydro-isostatic adjustment processes).’ https://research.jcu.edu.au/research/tropwater/resources/Lewis%20et%20al.%202013%20Post%20glacial%20sea%20level%20change.pdf
None of the results are at all unexpected – and I have problems with blog science hatchet jobs.
Chief, this looks like another of those complex situations don’t it? Since both the land and oceans are floating on a bigger ocean of magma, rebound in the NH could lead to subsistence in the SH. Kinda like the floating islands that seem to rise with sea level rise. I have even heard that the whole surface can migrate around a bit. Damn complex puzzle it is.
Chief, the authors spent half the paper on ocean siphoning GIA and such. But almost none on the little tectonic problems at Quobba Rdge. Heh?
Read and weep.
Rud,
You made an obvious factor or ten error in rate of rise. You should acknowledge that error and fix it. Rapid rates of rise during glacial/interglacial transitions is clear and well known. Those rates are unlikely over the next couple of centuries, but significant rates (30 to 60 cm per century) do seem supported by estimates of ocean warming and land supported ice melt. You need to do your homework more carefully.
Correct.
• Make a scientific mistake? It happens.
• Don’t catch it? Poor technique.
• Refuse to acknowledge it? Violates scientific norms.
• Decline to fix it? Denialism pure and simple.
• Become angry/defensive? Nutjobbery.
These are ordinary scientific norms, eh Rud Istvan?
Still waiting for these standards to be applied by climate science to 15 years of Mann-iac mistakes, poor technique, refusal to acknowledge, decline to fix, and angry/defensive behavior. So Mann is an example of “nutjobbery”?? Your word, FOMD.
Perhaps this will increase your understanding, skiphil!
Today’s Best Available Science affirms: Mann’s 15-year-old hockey stick is real.
Unsurprisingly, because “Nature cannot be fooled”, eh Skiphil?
Fan
I can’t believe you are defending the hockey stick. It bears no relation to the actual climate experienced by humanity during the last thousand years as it is a coarse sieve of 50 year paleo information that allows the annual and decadal variability recorded in instrumental records, which is up to ten times greater than the 50 year smoothed figure, to slip through.
http://wattsupwiththat.com/2013/08/16/historic-variations-in-temperature-number-four-the-hockey-stick/
There is a larger hockey stick in the record at around 1690 . The reason for the uptick at the end is that they have swapped a smoothed low resolution paleo figure for a much higher resolution instrumental record up to ten times greater.
None of this is to deny that temperatures have been rising for some 350 years.
Tonyb
In fairness to motivated alarmists like FOMD, the whole concept of errors being acknowledged and corrected is as foreign as if it came from Mars.
That is just not the way most establishment climate ‘scientists’ work. All they understand is : decide on a conclusion, scratch around for supporting evidence, and, most importantly, STICK TO YOUR GUNS NO MATTER WHAT (above we see eg FOMD sticking to the hockey stick, of all things).
That’s why we like them to visit here – it means they get to see a touch of science at work for once, something outside their precommitted advocacy worldview.
What the Climate alarmists said in 1997
El Nino here to stay
Scientists are warning that global warming could make the El Nino a permanent feature of the world’s weather system.
El Nino events normally occur roughly every 5 years, and last for between 12 and 18 months. However unpublished scientific research now suggests that the complex weather systems could occur every 3 years, making them a dominant weather pattern and in effect, almost permanent.
http://news.bbc.co.uk/2/hi/science/nature/25433.stm
Indeed, and Phil & Mike.
Nice swing…
There’s so little joy in Mudville, now,
Mighty ‘Larum has whiffed, Wow!
=========================
Perhaps, but is Gavin honest?
And others have said the opposite:
http://www.sciencemag.org/content/307/5717/1948.full.pdf
The data would tend to support permanent La Niña like conditions in the Pacific, with the additional energy from GH forcing being advected to other parts of the system.
Good find, Girma.
Unpublished you say, lots of weasel words in a newspaper article.
One link away says El Ninos are hard to predict
http://news.bbc.co.uk/2/hi/special_report/el_nino/23334.stm
El Nino here to stay wrote: “El Nino here to stay.”
http://news.bbc.co.uk/2/hi/science/nature/25433.stm – November 1997
Also from the story: “Incas sacrificed 80 people to stop El Nino…”
We are obviously smarter than the Incas…
I am sorry. It was not El Nino here to stay, it was Girma.
Bad luck about the missed punch line Ragnaar it would have been a mastery of the gentle art of irony.
Rud,
That 20 cm/century sea rise 8,000 years ago is mostly from melting of glaciers. The 17 cm sea rise last century is mostly from thermal expansion of seawater. The thermal energy needed to expand water by one cubic meter is 150x greater than thermal energy needed to melt one cubic meter of ice. There is a lot more heat in the ocean now than ever before.
This is a double-edge sword. It confirms global warming but indicates the ocean is taking the heat instead of atmosphere. If the ocean gives off its heat to the atmosphere, air temperature will rise faster than currently observed.
@Dr. Strangelove
The thermal energy needed to expand water by one cubic meter is 150x greater than thermal energy needed to melt one cubic meter of ice.
Expand how much water by one cubic meter? The combined oceans?
There is a lot more heat in the ocean now than ever before.
What measurements is this based on?
Evaporation from ocean heating would have a cooling effect on the atmosphere rather than a heating effect with more precipitation resulting from this as Alex Pope keeps telling us.
And Lindzen before him, too.
Cyclomanic creatures drawn out of the woodwork.
H/t Jack Eddy via Leif, the Sol Guard.
=================
You don’t really read what I wrote with understanding. Evaporation of Water and IR from Water and Land and Water Vapor and Water Drops in Clouds and Reflection from Clouds does set an upper limit for earth temperature that is higher than modern temperature. Look at the temperature for the past 600 million years. We have not got that warm during the last 800 thousand years. It snows too much to get that warm. The Polar Ice Cycle developed and changed the temperature bounds. During the last Major Warming, the Younger Dryas event dumped land locked melted ice water into the polar oceans and caused a thousand or two years of cooling and then the warming resumed. This event mutated the Polar Ice Cycle. Now warm water always flows through the Arctic and small, well bounded temperature changes can melt and freeze Polar Sea Ice and turn Snowfall On for cooling and Off for warming and this has kept earth temperature tightly bounded for ten thousand years and this will continue. This current warm period is at or near the peak and like Warm periods before, enough snow will fall to reverse sea level rise and reverse temperature rise.
For 800 thousand years, Much of Greenland’s ice had to melt to get liquid water into the Arctic to turn on the Snow Monster. Then it had to snow much more to drain the Arctic to turn off The Snow Monster. That is why we had Major Ice Ages.
Now, only small warming and small cooling can turn a much smaller Snow Monster On and Off. IR cooling provides most of the cooling for Earth and it was in place before the Polar Ice Cycle developed. The Albedo changes due to ice advancing and retreating keep the temperature in narrow bounds. Just like the AC in a house. Small amounts of energy can keep the temperature tightly bounded.
Compare now and then. Now we have a Polar Ice Cycle and tight temperature bounds. Before we had no Polar Ice Cycle and the temperature bounds were much wider. The only major factor that is different is the Polar Ice Cycle.
Actually, Evaporation cools the Water, Not the Air.
The cool water cools the Air.
Indeed, and blankets do not warm.
The majority of the warmth the sun deposits in the ocean well below the surface leaves as latent of heat of vaporization. This is neutral so far as air temperature is concerned which is why it’s called insensible heat. Condensation causes the heat to become sensible again and that mechanism is, for the most part, how the atmosphere is warmed.
Electric blankets warm. The rest do not. They are a barrier to heat transfer and the barrier works in both directions so a blanket both warms and cools depending on your perspective. Write that down.
Feeble.
Enfeebled.
Alex, I don’t disagree with the general thrust of your theory. However, the underlying principle of all evaporative coolers that I have ever come into contact with works to cool the air, not the water contained in the evaporator.
@herman
“This current warm period is at or near the peak and like Warm periods before, enough snow will fall to reverse sea level rise and reverse temperature rise.”
For this to happen, we will have major glaciation. Are you saying the next ‘ice age’ is just around the corner? Possible mechanism for this is halting of the ocean’s ‘conveyor belt’ when enough glaciers have melted.
@docmartyn
“could it not be a downward movement of the Earths crust in the deep Oceans or some other geological phenomena?”
Because sea level is measured in geologically stable locations worldwide to eliminate these factors.
@dagfinn
“Don’t you have to consider groundwater depletion as a cause of recent sea level rise?”
Groundwater depletion accounts for one-quarter of observed sea level rise of 3 mm/yr. Still faster than 2 mm/yr average 8,000 years ago.
Dr. Strangelove | August 31, 2013 at 4:20 am | Reply
“There is a lot more heat in the ocean now than ever before.”
Not even close to true.
The atmosphere can’t take the heat. At least not very much of it. The ocean has thousands of times the heat capacity of the atmosphere. The atmosphere is far more conduit than container in other words.
“The 17 cm sea rise last century is mostly from thermal expansion of seawater”
How do we know?
Seriously, could it not be a downward movement of the Earths crust in the deep Oceans or some other geological phenomena?
unicorns. I tell you its unicorns
Dr. Strangelove
Let’s do a quick reality check on what you just wrote.
First, some data:
The total ocean has a volume of around 1.3 billion cubic kilometers, and a surface area at the top of around 363 million square km.
At the upper ocean’s current average temperature, a warming of 5ºC would result in a density reduction (or a thermal expansion) of around 0.075%.
Most of the total volume of ocean is found below the thermocline in the deep ocean, where the temperature is between 3 and 4ºC. This part of the ocean was arguably not much colder 8,000 years ago than it is today.
If the upper 25% warmed by 5 ºC on average this would result in thermal expansion of ~244,000 cubic km. Taken over today’s total surface area of the ocean of 363 million square km, that’s a SL rise of ~670 mm from thermal expansion.
At the last glacial maximum, ~ 26 million square kilometers of the earth was covered by ice.
During the last glacial maximum, the sea level was estimated to be about 120 meters lower than it is today. At that time, glaciers covered almost one-third of the land. Average global temperature is estimated to have been around 6ºC colder than today.
During the Eemian warm optimum, 125,000 years ago, the seas were estimated to be about 5.5 meters higher than they are today and glaciers were much smaller than today.
Now to your comment:
Yes. Sea level is estimated to have risen around 20 meters in the last 8,000 years, while temperature rose by around 6ºC. Thermal expansion of the ocean could have caused no more than one meter SL rise, so most had to come from melting glaciers.
During the Eemian warm optimum, 125,000 years ago, SL was estimated to be about 5.5 meters higher and glaciers were much smaller than today.
Probably so, but let’s check. We know with fair certainty that the amount of water released from glacial retreat was not sufficient to have caused the observed 170 mm SL rise by itself. Estimates put the glacial melt at around 16,000 cubic km, which could have caused SL to rise by an estimated ~ 45 mm. SST rose by 0.7ºC. If a quarter of the total ocean volume warmed by an average of 0.7ºC, this could have resulted in a SL rise from thermal expansion of another ~120 mm (or around three-fourths of the observed rise).
Hmmm. That’s a strange statement. If you mean that it takes more thermal energy to cause a one meter SL rise from thermal expansion than it would take to melt enough glaciers to achieve that, this could be true, but I’ll let someone else do a reality check on that.
This is a purely speculative statement. There are no reliable measurements to confirm it, certainly not prior to ARGO in 2003.
After applying some corrections to the initial results, ARGO measurements of the upper ocean tell us that it has warmed by around 1.4*10^22 Joules or 0.015ºC over the past decade.
However, it has been much warmer than today in earlier geological periods.
There’s the Eemian warm optimum, around 125,000 years ago (above). And Wiki, for example, tells us:
So there obviously isn’t ” a lot more heat in the ocean now than ever before”.
Pure speculation again. The 0.015ºC increase in upper ocean temperature recorded by ARGO over the past decade is unlikely to miraculously jump out of the ocean to increase the ambient surface air temperature perceptibly. Even Trenberth concedes that this is not likely to occur. It’s an imaginary hobgoblin.
At least that’s what the data that are out there tell me.
Max
“At the upper ocean’s current average temperature, a warming of 5ºC would result in a density reduction (or a thermal expansion) of around 0.075%”
Where did you get 5 C? When did the ocean warm by 5 C?
“This part of the ocean was arguably not much colder 8,000 years ago than it is today.”
How did you know this? Did you measure it with thermometer 8,000 years ago?
“125,000 years ago, the seas were estimated to be about 5.5 meters higher than they are today and glaciers were much smaller than today.”
Maybe because earth was in interglacial period then. As it is now, what’s the point?
“If you mean that it takes more thermal energy to cause a one meter SL rise from thermal expansion than it would take to melt enough glaciers to achieve that, this could be true, but I’ll let someone else do a reality check on that.”
That’s what I mean. Do the math. It’s elementary physics.
“There are no reliable measurements to confirm it, certainly not prior to ARGO in 2003.”
The sea is a gigantic natural thermometer more reliable than ARGO which can only measure temperature at shallow depths. Thermal expansion of seawater is the same principle used in mercury thermometers but using liquid mercury instead of seawater.
“However, it has been much warmer than today in earlier geological periods.”
Let me rephrase it for your satisfaction. The sea is warmer today than in last 100,000 years.
“The 0.015ºC increase in upper ocean temperature recorded by ARGO over the past decade is unlikely to miraculously jump out of the ocean to increase the ambient surface air temperature perceptibly. Even Trenberth concedes that this is not likely to occur. ”
The ocean has been heating for over 100 years now and not just the upper part which is the only part ARGO can measure. And the 0.015 C increase in ocean temperature is enough to raise air temperature by 15 C. And Trenberth did say the missing heat will likely come back in the following decades. Not that I believe him.
I suggest you look at the data again and study the physics instead of imagining hobgoblins.
Not following all the details, just one question. Don’t you have to consider groundwater depletion as a cause of recent sea level rise?
Dr. Strangelove
Let me address your points:
– As to the global warming since the last Ice Age, I simply used the generally accepted estimate of 6C and ASS-U-MEd that the ocean only warmed by 5C. If you have a better estimate, let’s hear it.
– The lower ocean does not seem to change temperature much over time. If it got much colder than it is today it would be at its freezing point. If you have a better estimate, let’s hear it.
– Yes. It was warmer and SL was higher 125,000 years ago. Agreed?
– Thanks for clarifying your statement. I’ll take your word for your estimate.
– Using “thermal expansion” of the ocean as an indicator of temperature rise, as you suggest, requires that we have reliable SL measurements for the entire ocean. Do we?
– OK. You’ve reworded “ever” to “the last 100,000 years”. Makes more sense now.
– Yeah. Thanks for advice on studying “the physics”. Same goes for you.
Max
max
You cannot just ASS-U-MEd the ocean warmed by 5 C because the atmosphere warmed by 6 C. Most of the ocean below 700 m is not tightly coupled with the atmosphere. The better estimate of ocean warming is sea level rise due to thermal expansion.
The ocean temperature does not need to change much compared to atmosphere because the heat capacity of the former is 1,000x greater than the latter. The heat to increase ocean temperature by 0.01 C is equivalent to 10 C increase in air temperature.
Yes we have relatively reliable SL measurements. Better than proxies such as tree rings and ice cores which are regional. You need huge volumes of melted glaciers to raise sea level. You won’t miss disappearing city-sized blocks of ice. You can tell if it’s due to glaciers or thermal expansion.
I’ve studied the physics in the last 3 years and submitted a paper to Journal of Geophysical Research of AGU. After you studied the physics, you won’t be too critical.
Dr. Strangelove
No. I’m not at all “critical” of anything you have written about causes of SL rise since the last Ice Age – in fact, my “back-of-the-envelope” estimates confirm pretty much what you wrote.
And I agree with your obvious statement that the heat required to cause a temp rise in the ocean would result in more than one thousand times this temp rise in the atmosphere.
So if we really have “missing heat” going into the deep ocean I’m not going to worry too much about it. First of all, we really can’t measure it and second, the temperature rise would be so infinitesimal that it would hardly be able to cause us much harm in the future.
That’s the imaginary “hobgoblin” I was talking about – you can’t bring it to life with “physics” – just with a vivid imagination. Sorry ’bout that.
Max
Max
The thermohaline circulation and the North Atlantic drift are not vivid imaginations. They are driven by the laws of physics, not hobgoblins.
Dr. Strangelove
No one says that they are.
But your hobgoblin of an infinitesimal temperature rise of the ocean miraculously jumping out some day in the future to fry us all IS.
But we’ve beaten this horse to death.
Max
Max
“But your hobgoblin of an infinitesimal temperature rise of the ocean miraculously jumping out some day in the future to fry us all IS.”
Your infinitesimal temperature rise is measurable and enormous in terms of thermal energy in joules. Your miraculous jumping isn’t supernatural but basic physics of heat transfer. To fry us all is your hobgoblin. Nobody is suggesting global climate will reach 40 C, which is too cool to fry anything.
@ Strangelove
No major glaciations. More like the Little Ice Age that followed the Medieval Warm Period.
The timing of the Roman Warm Period and the cold period that followed and the Medieval Warm Period and the Little Ice Age and the current warm period is the cycle we are in and the cycle we will stay in with similar timing.
@ Strangelove, you wrote:
Let me rephrase it for your satisfaction. The sea is warmer today than in last 100,000 years.
The oceans have been this warm, multiple times, over the most recent past eleven thousand years, including the Roman and Medieval Warm Periods.
I’ve long thought the meaning of Steig’s stealthy smearing of time and space has been to evoke fear of ice sheet collapse.
Similarly, the resistance to admit that the Greenland snowcone sits in a sturdy cup. Radar saw, and so do they.
===============
Yes a bowl, 50 meters of lip to you, doesn’t bolster your argument.
http://commons.wikimedia.org/wiki/File:Topographic_map_of_Greenland_bedrock.jpg
Sometimes it’s hard to deal with the science
Bob Droege
Kim’s right. You’ve got gravity working against you.
Like you write, “sometimes it’s hard to deal with the science.”
Fuggidaboudit.
Max
Manacker,
You didn’t realize that I was actually agreeing with Kim. Greenland is bowl-shaped, however how is gravity going to affect a 3 km thick sheet of ice going over a lip only 50 meters high?
We know already that it is going to melt, the only question is how much and how fast.
And if yours and Kim’s theories are correct, how come scientists haven’t sub-glacial lakes like Lake Vostok?
Apparently because the melt water leaks out to the sea rather than being held in some bowl shaped structure.
http://www.latimes.com/science/sciencenow/la-sci-sn-greenland-canyon-20130830,0,5451102.story
Yes, the water leaks out. The point is that the ice sheet won’t catastrophically slide suddenly into the sea.
==================
The other question is whether there is an actual physical mechanism for “ice sheet collapse”. From what I’ve seen that experts on ice sheets have said, there isn’t. Correct me if I’m wrong.
Or perhaps “collapse” is just the drama queen version of “melting faster than usual”?
The request for proposals required inclusion of human fear, a prerequisite for guilt. Just played, an icy Joker from the sleeve.
===============
Rud, have you contacted the authors of the study to ask them any of these questions?
> Even if correct, it argues for adaptation rather than mitigation.
Facts do not argue, Sir Rud does.
Selecting facts helps.
Using “it argues” helps too.
The Art of Truth is tough.
Monks always advised against it.
Try Love instead.
This tart of Ruth is tender,
Berried with love and butter.
=================
From precedented to adaptation,
The path is paved with artful truthiness.
Feeble.
Here’s a first place in the NYT article where uncertainty is expressed:
Merchants of uncertainty might appreciate the emphasis.
“Figure 3 also suggests a sudden MSL fall, which could only come from a freeze. Odder. WAIS might suddenly collapse, but it surely cannot suddenly uncollapse. Freezing should take several millennia.”
It did. The graph shows 4 meters decrease over 1000 years. That’s 40cm a century. At that rate it would take about 30,000 years for sea level to drop to glacial levels. On what basis have you decided that rate is too fast?
Correct.
Rud Istvan, your essay’s multiple instances of inattention to quantitative accuracy are disquieting.
Lolwot’s criticism is entirely correct, isn’t it?
Just follow the slope like lolwot. Lines are equal to a suggestive thought forever if he has the time.
And then the tub was filled again.
http://en.wikipedia.org/wiki/Dry_Falls
How loud is it lolwot?
Question: if our current rate of sea level rise (26 cm to 2100) is ~ at the average (22 cm/century) seen earlier under much warmer conditions, why should we worry about an accelerated rate under cooler conditions?
What cooler conditions? With ocean heat content at very high levels and going higher still and more mass being added from melting Greenland and Antarctic ice, there is only higher and higher faster for sea level.
R. Gates : With ocean heat content at very high levels and going higher
A vague assumption, to save cagw.
Captain
You did a pretty good calculation as to how many centuries it would take the oceans to warm by one degree c.
Can you do the same and calculate what stretch of water is being serviced by each Argo buoy?
3600 buoys in a system with an average depth of 4000 metres in a water body that covers 70 percent of the globe seems very minimal
TonyB
Hardly a vague assumption. Thousands of measurements from all over the planet’s oceans.
Really? All over huh?
Fair warning Gates. You may find the following facts disturbing.
The average depth of the global ocean is 4000 meters. ARGO buoys dive to a maximum depth of 2000 meters. Moreover, ARGO buoys do not dive beneath ice.
See if you can connect the dots well enough to arrive at the conclusion that ARGO fails to measure OHC in over half the ocean’s volume. What’s happening below 2000 meters and below the ice, Gates?
A deafening hush falls over the peanut gallery as they realize that ARGO misses more ocean than it measures, fercrisakes.
Big Dave knows when to extrapolate.
Extrapolating Big Dave gives Chuck Norris.
You don’t have measure the whole ocean, just a statistically representative sample, usually a thousand random samples will do and just how many Argo floats are there?
It’s all 28 F under the ice, been there done that.
A random sample of thousand is hardly enough. That would leave an uncertainty in the average temperature of perhaps 0.2C (standard deviation).
A sample that’s known to be more representative of the whole ocean is needed, and I’m sure that ARGO floats have a better coverage than a random sample would have.
The question is: How representative the floats are for the measurements of the temperature changes? That must be discussed somewhere in the ARGO related material, but I couldn’t find such information when I tried a while ago.
Pekka, “How representative the floats are for the measurements of the temperature changes? That must be discussed somewhere in the ARGO related material, but I couldn’t find such information when I tried a while ago.”
The biggest problem I have seen is the pressure transducers drifting, which was a major issue. That is something that can be correct for after the fact, though there would be plenty of noise made about it. The temperature range is right in the sweet spot between 30C and -2C, as long as they are standardized, the anomaly should be much better than surface temperature record.
The error in the temperature may be much smaller than for surface temperatures, but then the changes in the average temperatures are so small that a very good accuracy is needed for meaningful comparisons.
My impression is that getting the technology working has just taken some time, but covering all relevant parts of the ocean in a representative way may be more difficult.
An essential complication is due to the fact that the floats move, another from the fact that temperature gradients do also move.
It’s easy to calculate the accuracy for a fully random coverage, but much more difficult for a coverage that’s more optimal for accurate measurements. This is the question on which I tried to find some information.
Captain
Ended up in the wrong place
http://judithcurry.com/2013/08/30/ice-sheet-collapse/#comment-372629
Tonyb
Pekka, “It’s easy to calculate the accuracy for a fully random coverage, but much more difficult for a coverage that’s more optimal for accurate measurements. This is the question on which I tried to find some information.”
That I haven’t seen. I suspect that the pressure transducer error/correction set things back a good bit.
tonyb, No, that is not something I would want to get into. ARGO does have thermal mass working for it and as long as the depths recorded are accurate, the results should be fantastic. I have checked that regional temperatures by zone against regional SST and they seem to be at least as reliable as global land surface temperature, which is not a wild endorsement, but as long as you remember there is an error range, very useful. It also gives me a reason to limit SST and SAT to the 60N-60S range which happens to be in the wheelhouse of UAH and RSS. :)
Tonyb, 3600 ARGO floats, if evenly spaced, would have an average separation of 350 km.
Jimd
Is that an averaged figure? That is to say 350 km spacing by 4000 metres deep?
Captain. Thanks for replying. Last year I took the trouble to take my own SST measurements. The temperatures varied by 5 degree c over a three hundred yard square and was highly dependent on depth.
Tonyb
Each float covers its whole column.
tonyb, “Captain. Thanks for replying. Last year I took the trouble to take my own SST measurements. The temperatures varied by 5 degree c over a three hundred yard square and was highly dependent on depth.
Tonyb
That is a big temperature break like you would see near a coast. “Globally” My biggest concern is near the polar convergence zones. There you have those big temperature breaks and currents that can cause a lot of issues in the whole depth column. ARGO can limit the regions they use or adjust for big temperature breaks to improve overall accuracy. There is a lot to it which I would rather stay out of.
Doing my comparisons I used all the depth ranges with surface temperature normalized to the full SST (Reynold’s) standard deviation. Compared with the listed uncertainty, the ARGO regional data, not the reanalyzed data by Trenberth and company, performed better than I expected and it also compare well with both UAH and RSS inverted stratosphere. That is about as intense as me and my laptop want to go.
Of what accuracy and confidence levels though?
The over 3600 ARGO floats sampling all over the global oceans have a very high degree of accuracy at a very high level of confidence. Hardly, as you incorrectly asserted, a “vague assumption”.
As robust a measurements of ocean heat, as there is for the atmospheric equivalent ?
There are of course more land stations, but the coverage by ARGO buoys gives us far more than a “vague assumption” about the trend of ocean heat content.
Just a trend then ? Or a robust idea of total (down to the bottom) ocean heat content, matching the required “missing” heat ?
Monk,
I suggest you go to scholar.google.com and do some research on your own. Ocean heat content measurements and estimates is worth your time to research, and I’ve posted a lot here about it.
So that’s a NO then; not robust enough for *you* to say “robust”.
Monk,
You went from “vague assertions” to robust as a criteria because you wanted that as a final conclusion. You can’t see it as your mind is closed by whatever denialist cool-aid you are drinking.
I asked if you had anything better than vague assumptions. Put another another way, are they robust?
So no, the problem here is rather that the alarmist truebeliever kool-aid you drink and peddle, seems to have an additional effect of making you ratty at the first sign of insufficient cagw credulousness on the part of others.
Go away and read xyz until you agree with me, seems to be your motto.
You are clearly motivated to only ever “prove” cagw, regardless of the facts.
Odd that I’ve never once tried to prove CAGW. You are utterly hopeless Monk.
You are correct, Monk. ARGO measures the temperature of less than half the global ocean. ARGO dives to a maximum of 2000 meters while the average depth of the global ocean is 4000 meters. That’s 50% it misses. ARGO does not dive under sea ice. That makes it more than 50% it misses.
Gates should write that down but of course he won’t because that would require objectivity i.e. a fair and balanced view.
“Odd that I’ve never once tried to prove CAGW. You are utterly hopeless Monk.”
Oh please, it’s all you ever do, in a devious sotto voce style.
You are an outright liar Gates.
It’s religious conviction. He’s concerned about the ‘carrying capacity’ of the Earth.
========
To summarize this Gates cagw prevarication then :
In principle at least it does seem possible that the “missing” heat specified in the models, of the correct amount to explain the Pause, may indeed have gone to the deep oceans. But Gates (nor anyone else?) has no comprehensive measurements and calculations of the deep oceans to back this up in anything like a robust fashion.
This, however, has not stopped him suggesting otherwise.
So in common with the professional alarmist establishment, his problem isn’t that he lacks vast knowledge and understanding of the climate system – it’s that he lacks integrity.
It’s on this point that Pekka distinguished himself. But they both have the same disease, fear and guilt. It’s imposed by narrative and is unsustainable; it’s not natural.
==========
R. Gates aka Skeptical Warmist | August 30, 2013 at 11:03 pm | Reply
Seems observed increasing and future acceleration in sea level rise is a big concern in Hawaii :
Mr Gates, Hawaii is formed from volcanic mountains arising out of the sea. I believe the island is still going higher, naturally. Faster than the sea rise,
the big concern in Hawaii is the loss of beach sand and the cost of importing it from the 51st state, Australia
angech Gates, relative sea level is rising faster around the big island than the other islands. I guess that is why it is relative. Anyway, the Hilo tide station indicates a rise of 1 foot per century while the Honolulu tide station indicates a rise of half a foot per century. Luckily, Honolulu has more positive land use changes, so it is less impacted by the Human Carbon Volcano than Hilo which has a large number of CO2 belching cattle.
Here is a paragraph from the link that R.Gates helpfully provided:
“The variation in long-term relative SLR rates along the Hawaii archipelago is due, in large part, to variations in island subsidence with distance from actively growing Hawaii Island and/or variations in upper ocean water masses.”
Chief Hydrologist | August 31, 2013 at 3:27 am | Reply
None of the results are at all unexpected – and I have problems with blog science hatchet jobs.
I love blog science hatchet jobs
Judith, it seems that Rud’s assertion should be easily verifiable. He is saying that contrary to the headline and thesis of the article, e.g. that there was a reasonably rapid 17 foot rise on the entire West Australian coast, this rise was found ONLY at the geologically active Quobba Ridge. Rud says:
“Sadly for the Nature Geoscience title, Ice Sheet Collapse… during the last Interglacial, none of the other new WA-U samples from elsewhere (SI2 tab 3) show this sudden extreme rise and fall.”
This isn’t my field, but I wonder if someone who is competent at interpreting this type of evidence could go back into the article and verify that what Rud says is the case, and let us know.
Because if what he says is true, I’m more shocked than I was by the Hockey Schtick. It is one thing for a young, aggressive assistant Prof. to make his name, early in the game, with a fake hockey stick. But this late in the game, just before the IPCC report, just in time to be included….if Rud is right, there seems to be no end to the tricks supposedly reputable scientists will play. Perhaps not just on us, but on themselves?
So I would like to see someone else read the article and let us know if Rud has interpreted correctly.
> if Rud is right, there seems to be no end […]
The truth is out there, John.
Even if Sir Rud is wrong, there seems to be no end either.
With a sufficiently “motivate” “skeptic,” there is an endless supply of “tricks.”
If you get my drift.
You mean like Mike’s Nature trick?
https://www.google.com/images?rlz=1T4LENN_enUS461US461&q=mike's+nature+trick&hl=en&sa=X&oi=image_result_group&ei=XjkiUqGrBvLTsAT2rIGwBA&ved=0CDIQsAQ
“If” you “get” my “drift”.
I would like to take this opportunity to thank you for showing us all the proper technique in abuse an ellipsis, by the way. It must have taken years of dedicated imbecility to hone that talent. :-)
Don’t forget Peter & Lew.
John, you can access SI2 yourself. It is not paywalled. Just an excel spreadsheet. Tab 4 stratigraphy gives the game away. Check column S for the inferred beach levels, for example. Check column O for the hightop corals. Check column F of tab three for all the MSL data on the entire WA-U series. Eyeball scan is enough. There is nothing that high except at QR. For the Dutton data tab 2, it is column I or J. Harder to interpret because two sets of dates are given using two methods. Dutton’s flavidae show the QR tectonics clearer than the WA-U samples.
regards
Rud, I can do that. But I would rather have someone more expert than me do it. I don’t doubt what you say, it seems quite right. But if by chance there were something wrong, a subtlety of some sort, I probably wouldn’t catch it. That is why I would like someone expert in seismology or plate tectonics look at it and report back.
There are tons of studies of recent tectonic warping of Australia, which is besides the point. This type of sea level change should be seen all over the world, not just in one isolated corner.
http://www.drquigs.com/wp-content/uploads/2012/10/quigley-et-al-gsl1.pdf
http://www.academia.edu/1118274/A_Tectonic_Influence_on_Seafloor_Stability_along_Australias_North_West_Shelf
http://arxiv.org/abs/1307.1741
Howard, the end of the Conclusions section of the last of the three papers you cite says this:
“…Modelled uplift rates reached 25 m Myr-1 from ~ 10 Ma. This river profile analysis suggests the influences of mantle convective processes on shorter (< 500 km) spatial and temporal wavelengths. The mechanism driving this uplift remains unclear. We propose the recent uplift of south Western Australia may be the result of edge driven convection at the trailing edge of a fast moving plate, supported by observations of hitherto enigmatic observations of young seamounts and volcanism in the offshore Houtman/Abrolhos subbasin. Geodynamic modelling could be used to test this hypothesis in the future."
Certainly seems that there has been significant uplift in SW Australia.
I would still be most interested in knowing whether all of the effects the authors attribute to changes along the entire SW coast were in fact observed only at one geologically active place. That is the key point of Rud's critique.
John:
The secondary take-away is that the tectonic warping of Australia is not well quantified, therefore the shoreline paper is arm-waving. I don’t need to look at the supplemental spreadsheets available at no extra charge nor do I need to read Rud’s grade-school level understanding of geology to figure that out.
The main point is that this type of inferred rapid, catastrophic sea level rise from a continental-size land-ice slide into the ocean would be seen all over the world, not just in Australia.
Aside from Rud Istvan’s various above-mentioned errors in elementary arithmetic (which inexplicably remain uncorrected and unacknowledged), his essay also omits to cite the extensive paleoclimate literature that relates to fast sea-level rise.
Climate Etc readers who prefer not to rely upon Rud Istvan’s dubiously eccentric assessments of “best available climate-change science” may prefer the evidence presented in (the free article) Overpeck et al. Paleoclimatic Evidence for Future Ice-Sheet Instability and Rapid Sea-Level Rise (Science, 2006).
Meanwhile, please work more carefully, Rud Istvan!
“So on this windy sea of land, the Fiend Walked up and down alone bent on his prey.” ~John Milton
So Rud’s a lawyer and MBA who’s bad at math. Par for the course.
Judith,
Do yourself a big favor and don’t have Rud guest post again unless he explicitly acknowledges and corrects the factor-of-ten error in his calculated glacial/interglacial rate of sea level rise. The entire thrust of his post (20 cm per century is some kind of historical maximum) is clearly wrong. No correction just means he is nuts, and so has no business posting here… or anywhere else. It is your blog of course, but honestly, this sort of thing is way beyond the pale, and has no place on a blog that focuses on science.
I’m sure Sir will issue his mea culpa.
That’s what they teach in communication classes for Fortune N top execs.
You all are right. The maximum Holocene rate is 2 meters per century. My bad. Apologizes for that error.
The peak from present MSL to Eemian peak in Kopps 2009 paper (linked) is calculated correctly at around 20 cm/century melt and 16.5cm/century freeze. This is only the peak above present MSL. I went and double checked this afternoon.
As for the problem in O’Leary et. al. the game is given away by tab 4 to SI2, stratigraphy. Not only are the hightop corals from Quobba Ridge (column O) but the inferred paleobeach there is meters higher than at the other sampled locations (column S). SI2 is not paywalled, and is available directly from the link provided for anyone who wishes to check the rest the post for themselves, given the doubts you may have.
I stand by the gist of the post, and its rather harsh conclusions. I have communicated with Nature Geoscience about the matter, just as I did with Science concerning Marcott. No response in either case.
OK, all the high horses: Back in the Barn.
===========
Give them their moment in the sun before they are put out to pasture.
After you, horses behind.
…or sent to the dog-food and glue factories…
sic transit Gloria.
Heh, luv ya, stevef, but can’t tell if you missed an apostrof or not.
Rud,
Glad you had the good sense to admit the obvious error (though it took much too long). Now that we all agree 20 cm per century is in no way a historical limit, perhaps we can move on to more substantive issues. The current rate of rise over the last 20+ years is about 30 cm per century. Based on that 20 years, does it seem to you that 30 cm per century (or more) is at least plausible? I have spent a fair amount of time looking at this subject, and it is clear that claims of multiple meters per century are wildly wrong (Stefan Rahmstorf, James Hansen and their many friends are the absolute worst for nutty sea level projections), but any thoughtful analysis shows that rates of rise in the 30-60 cm per century range are well within the expected range, and indeed, quite likely. While that rate of rise is unlikely to be catastrophic, it does present substantial challenges for many low-lying areas, especially if we consider the next 200 years or so.
The correct response to people who practice wild-eyed scare mongering, using impossible rates of rise of sea level, is NOT to make equally preposterous claims of very slow future rise. The correct response is presentation of careful and realistic estimates of future rise. As I said before, you need to be much more careful with your homework.
Of course, Ol’ Horse,
But where’s the force
To halt the gorge;
IPCC’s borscht?
=========
You made your point, so how about giving it as rest.
Steve, it having been Labor day weekend in the US I have not spent a lot of time on line the last 48 hours. Sunday Dinner is cooking, so…
30cm/century is not impossible. There is no way we have sufficient resolution from the Eemian. 1 meter (Rahmstorff, Greenland, 2010?), or 5 meters (Hansen 2011) rise from here in a century are plainly impossible during an interglacial. Just no evidence.
As for 30cm/century (your number, not mine) read the first book. It gave ‘official’ population and sea level estimates. Or visit cresis.ku.edu/data/ sea-level-rise-maps to see US tax dollars at work on this issue. A problem for some, sure. An existential threat to mankind? No way.
Now, for places like Bangkok (sinking faster than sea level is rising, like New Orleans was) there are issues–which have nothing to do with CAGW. Not my fault they built on the Chada Praya estuary, then proceeded to go up while pumping subterranean wash water out.
As to careful about homework, I try to be. And correct mistakes when found. Even when immaterial to the case at hand. As here, albeit perhaps belatedly for your taste due to the holiday I have been trying to enjoy. As has Judith.
Regards
“I stand by the gist of the post, and its rather harsh conclusions” – Rud
Whuch is what? Not much.
On a paper you still haven’t read?
There was an unnecessary and conveniently timed false alarum somewhere on a long ago forgotten coastline, and I can hear it all the way over here.
===============
Dang, ‘far away on a long ago, forgotten coastline’.
============
Or is it ‘far off’. I’ve forgotten.
==========
Have to mention GRACE if we are going to talk about ice sheets
Greenland and Antarctica are both melting
http://www.nasa.gov/mission_pages/Grace/multimedia/chart20121129.html
http://www.nasa.gov/mission_pages/Grace/news/grace20121129.html
Bob, this is true. The question is at what rate. There is a lot of data in addition to Grace. And Grace only supports something like half the present rise (the rest presumably being either uncertainty or ocean thermal expansion. Grace does not support any collapse hypothesis, and cannot from first principles.
Rud,
You can see the charted data, the question being the best fit. Doesn’t look linear to me, in fact someone has bracketed the acceleration. The rate is doubling between every 5 years and every 10 years, which supports greater than 1 meter sea level rise by the year 2100.
First principles, can you explain how that prevents the collapse of the Greenland Ice Sheet.
And some of the present rise is from melting glaciers.
Wow. Rud’s communicated with the editors at Science and Nature Geoscience and they haven’t replied? That’s a shocker.
Actually it is, when the communications concern issues that could merit correction or retraction based on the Supplementary Information accompanying the papers themselves–itself a rather newly practiced habit in climate science.
Have you any countervailing facts saying my SI observations are somehow incorrect? If so, I would ask you provide it so further corrections to my post can be made by myself and Dr. Curry.
Or are you just saying such august journals should never pay attention to errors brought to their attention in a factual, specific, and respectful way?
Yep – you have to buy indulgences from the Climate Priests in order to obtain an audience with them. If you are lucky, they will exorcise the CO2 demon from your person for a small extra charge.
‘The +5-m estimate from WA has its basis in LIG fossil reefs that outcrop discontinuously along some 1300 km of coastline at the same elevation,
whereas it has not been independently established that the few closely spaced localities in the granitic Seychelles are indeed tectonically stable
(11). We attribute part of the discrepancy in our maximum-elevation estimates from WA and the Seychelles to an underestimation in WA. The
highest corals we surveyed there (+3.5 m) are planed off, implying that sea level may have easily reached +4.0 m (RSL), which translates
to a +5.5 m ESL.’
http://ssi.ucsd.edu/scc/images/Dutton%20Lambeck%20LIG%20SL%20Science%2012.pdf
Stability of the old and cold rock of the west Australian coastline is a standard assumption emerging from decades of work. Although there are tectonically driven processes at work – there is little evidence of Quaternary relief generation in the south west and central Western Australia.
e.g. http://www.drquigs.com/wp-content/uploads/2012/10/quigley-et-al-gsl1.pdf
Although I did learn that Australia is the fastest moving continent on Earth.
So we a science that is consistent – assumptions that seem fairly safe – and episodes of relatively rapid sea level rise and fall in the past.
Seems we have some typical ‘climate skepticism’ here.
Rud’s claims;
– gets SL rates of change wrong by orders of magnitude
– makes a big deal of finding the location of sites for Fig. 3……but fails to notice the figure explicity states the site location.
– makes some claims about the site results, but it’s not clear what point he thinks he’s making.
What’s left;
– impugning motive; “Sure enough, just in time for the upcoming IPCC AR5 SPM, evidence for catastrophic sea level change has been discovered”
– pure speculation about possibe tectonic uplift/subsidence in the Quobba region samples. The authors are fully aware of the issue, have looked at it, found an area with evidence of tectonic effect and excluded that sample. Rud’s argument seems to be that they might have missed some others. Evidence presented to support this contention -ZILC
After all this, Rud says;
“I stand by the gist of the post, and its rather harsh conclusions”.
Classic ‘skepticism’.
Judith’s BS detector may have been temporarily out of order.
She tends to turn it off when reading “skeptics”
Hey, what happended to my ‘H”!!
ZILCH.
Michael, please, it’s pretty hard to believe there’s any impugning of motives going on around here.
============
Michael complains
– impugning motive; “Sure enough, just in time for the upcoming IPCC AR5 SPM, evidence for catastrophic sea level change has been discovered”
The IPCC is a a political body, financed by and serving the cause of politics. So of course it is going to do whatever it can to advance CAGW, its constitutional raison d’etre.
Referring to an established motive is not impugning it. Michael presumably would urge us to politely swallow the blatant lie that the IPCC has bona-fide science motives.
Classic climate ‘science’ at work here, ie advocacy masquerading as science. Giving a low/political motive a high-sounding name (the opposite of impugning a motive, if there’s a word for that).
Geez, can you guys get anything right?
The IPCC hasn’t discovered anything here – it’s a scientific paper published in a journal. If anything has been discovered, it’s by the authors of the paper.
And “…just in time…” – no, this paper misses the cut-off dates for AR5.
Geez Michael, can’t you grasp anything ?
The “science” in the journals the IPPC, a political body, surveys, is also produced by other political and politically-funded bodies. It’s government shills all the way down. (Who aren’t above hiding data, faking hockey sticks, etc etc).
So of course they say there is CAGW – that’s what serves a politicizing agenda, and hence the interests of political institutions.
Sorry, my bad.
Please continue your political, conspiratorial ranting without any unwanted intrusions from reality.
Ah, the clapped-out old “conspiracy” strawman being used again, a sure sign of desperation by Michael.
In his “‘reality”, an organization or person working to advance its own interests is involved in a “conspiracy”. Just as man taking a job has a “conspiracy” to earn money, since this will benefit him, governments producing climate reports that will benefit themselves can only happen if there is a “conspiracy”.
Staggering nonsense.
Now, if governments produced reports that said CAGW was NOT a threat, THAT would be evidence of a conspiracy – some secret machinations happening behind the scenes of government climate science, seeking to find the truth rather than make government bigger. Does Michael perhaps know of some significant outbreak of integrity and objectivity in climate science somewhere ?
Oh, and I almost forgot – playing fast and loose with submission deadlines – for the benefit of politically correct / consensus papers – is another well-known IPCC trick.
Australia is often claimed to be very tectonically stabile but the level of the MIS 5e sea level varies widely across the continent. However there are two areas where this level is stable over a long stretch of coast, that is consequently considered to be extra stable: West Austalia and the Gawler Craton. Unfortunately the level is 6 meters in West Australia and 2 meters on the Gawler Craton.
For some reason the Gawler craton is never mentioned by Climate scientists.
Another point that has seemingly been missed. The Nature paper proposes that the sea-level dropped by 8 meters in 1500 years at the end of the MIS5e. This means that the entire WAIS, and then some, is supposed to have re-formed in that time. As Rud noted an ice-cap can’t uncollapse.
8 meters in 1500 years just is 5.3mm per year. There is no reason why this can’t be caused by global ice sheet growth (not just growth of the WAIS) in conjunction with the the steric component of sea level change.
Let me rephrase my earlier question. What does the title of this post mean? Does the word “collapse” have a physical meaning, or is it just a name for relatively rapid melting (how rapid) whatever the cause?
In other words, does anyone know what we’re talking about?
Dagfinn, the NYT gives your answer. Unlike Greenland or EAIS, WAIS slopes from the transact arctic maintains to the sea. It slides off. A portion of it is already resting in sea floor rather than land. Bot it it not floating. The notion is that is that large portions collapse into the sea itself. They hypothesis was first floated (pun intended) by Mercier in Nature about 30 years ago. Folks have been looking for evidence that his has happened. I did not cite the other two papers where this was claimed (but do in the draft book essay). The Bahamian paper is suspect due to storms; the Ycatan paper is inc ontisten with the new WA paper (timing and height) and suffers from the same tectonic instability problem.
Thanks.
Sorry about typos on iPad (corrections sometimes aren’t.) I was trying to be on vacation this weekend, and only just got to a laptop briefly.
Transact arctic= transantarctic. Bot=but. Ycatan=Yucatan. inc ontisten= is inconsistent. All corrections now duly noted.
My main point about this paper remains uncontested by all the above, including those who asserted I did not read it when I posted two figures from it under the fair use doctrine despite copyright. Shows the level of belief/debate.
Pingback: Weekly Climate and Energy News Roundup | Watts Up With That?
i would not worry about it rud,you made the correction.i am more worried about the people on this thread placing faith in GRACE measurements of sea level,and ocean temps measured by argo.both of which suggest the recorded figures are outwith the capability of the intsrument carrying out the measurement.
suppose these guys have to have faith in something.
Pingback: Australia the plate-tectonic trampoline? | Musings on Quantitative Palaeoecology
If you argue that tectonic activity at 119ka BP displaced the land by 6m, you need a second bout of tectonic activity after stage 5e to raise the land again so that the early stage 5e shoreline is ~flat.
One massive intra-plate tectonic event is unlikely (it would need to be much larger than the New Madrid event). To have a second event that reverses the effects of the first event is implausible. The first event would have release all the stress, how could stress with the opposite sense have accumulated (and not overshot)?
Pingback: When bad news is good | Climate Etc.
Pingback: Shell game | Climate Etc.
Buenos dias, os ha dicho alguien que vuestro sito web puede ser adictiva ? estoy preocupada, desde que os recibo no puedo parar de mirar todas vuestras sugerencias y estoy muy feliz cuando recibo uno más, sois lo mejor en español, me encata vuestra presentación y el curre que hay detrás. Un beso y abrazos, MUCHAS GRACIAS POR VUESTRO TRABAJO, nos alegrais la vida.
Saludos
Pingback: Video: Oldest Ice Sheet Could Reveal 1.5 Million Years Of Climate Change
Pingback: Sea level rise tipping points | Climate Etc.
Pingback: AGW? | TheFlippinTruth