
by X Anonymous
According to the IPCC, “climate variability refers to variations in the mean state and other statistics (such as standard deviations, the occurrence of extremes, etc.) of the climate on all spatial and temporal scales beyond that of individual weather events. Variability may be due to natural internal processes within the climate system (internal variability), or to variations in natural or anthropogenic external forcing (external variability).”
Known examples of internally generated variability include ENSO, AMO, and the PDO. An example of Internal variability which exists on a longer time scale is Thermohaline Circulation. There are many other examples of internal variability, especially when we include instances where the line between internal and external phenomena is blurred, and when the Earth’s climate system state has changed (e.g. Heinrich events during the last glacial period).
Is there a difference between ‘climate change’ and ‘climate variability’? Time is the key. Even though the interglacial cycles or “Ice Ages” are some of greatest ‘climate changes’ known, and are described as the change between two ‘long term’ climate states, they are cyclical. What sets these glacial cycles apart from other examples of ‘variability’ is the hundreds of thousands of years of evolution through time, and apparent external forcing. Therefore, when we hear about ‘internal variability’ in the context of attribution, ENSO, the AMO, and other short term ‘noise’ are often referred to, since the longer time scale variability is unlikely to have much impact (as impossible as that is to prove).

Therefore, it is fair and reasonable to assume these short term influences on the climate are short term. It’s a zero sum game when it comes to the IPCC’s use of internal variability. As the figure above illustrates, internal variability is the slave and external forcing is the master. All internal variability can do is move energy around. There is no significant net change in energy consistent with the laws of thermodynamics, where energy cannot be created nor destroyed. The climate must be forced to change in the long term; internal variability is unforced and does not cause long term temperature trends.
Historical data and observations are used to estimate internal variability. Since the observable patterns of variability cannot explain long term temperature trends, external forcing is needed to provide a physical explanation. And since the external forcing generally doesn’t have much impact on its own, a positive (water vapor) feedback, consistent with atmospheric physics, is evoked to explain the discrepancy.
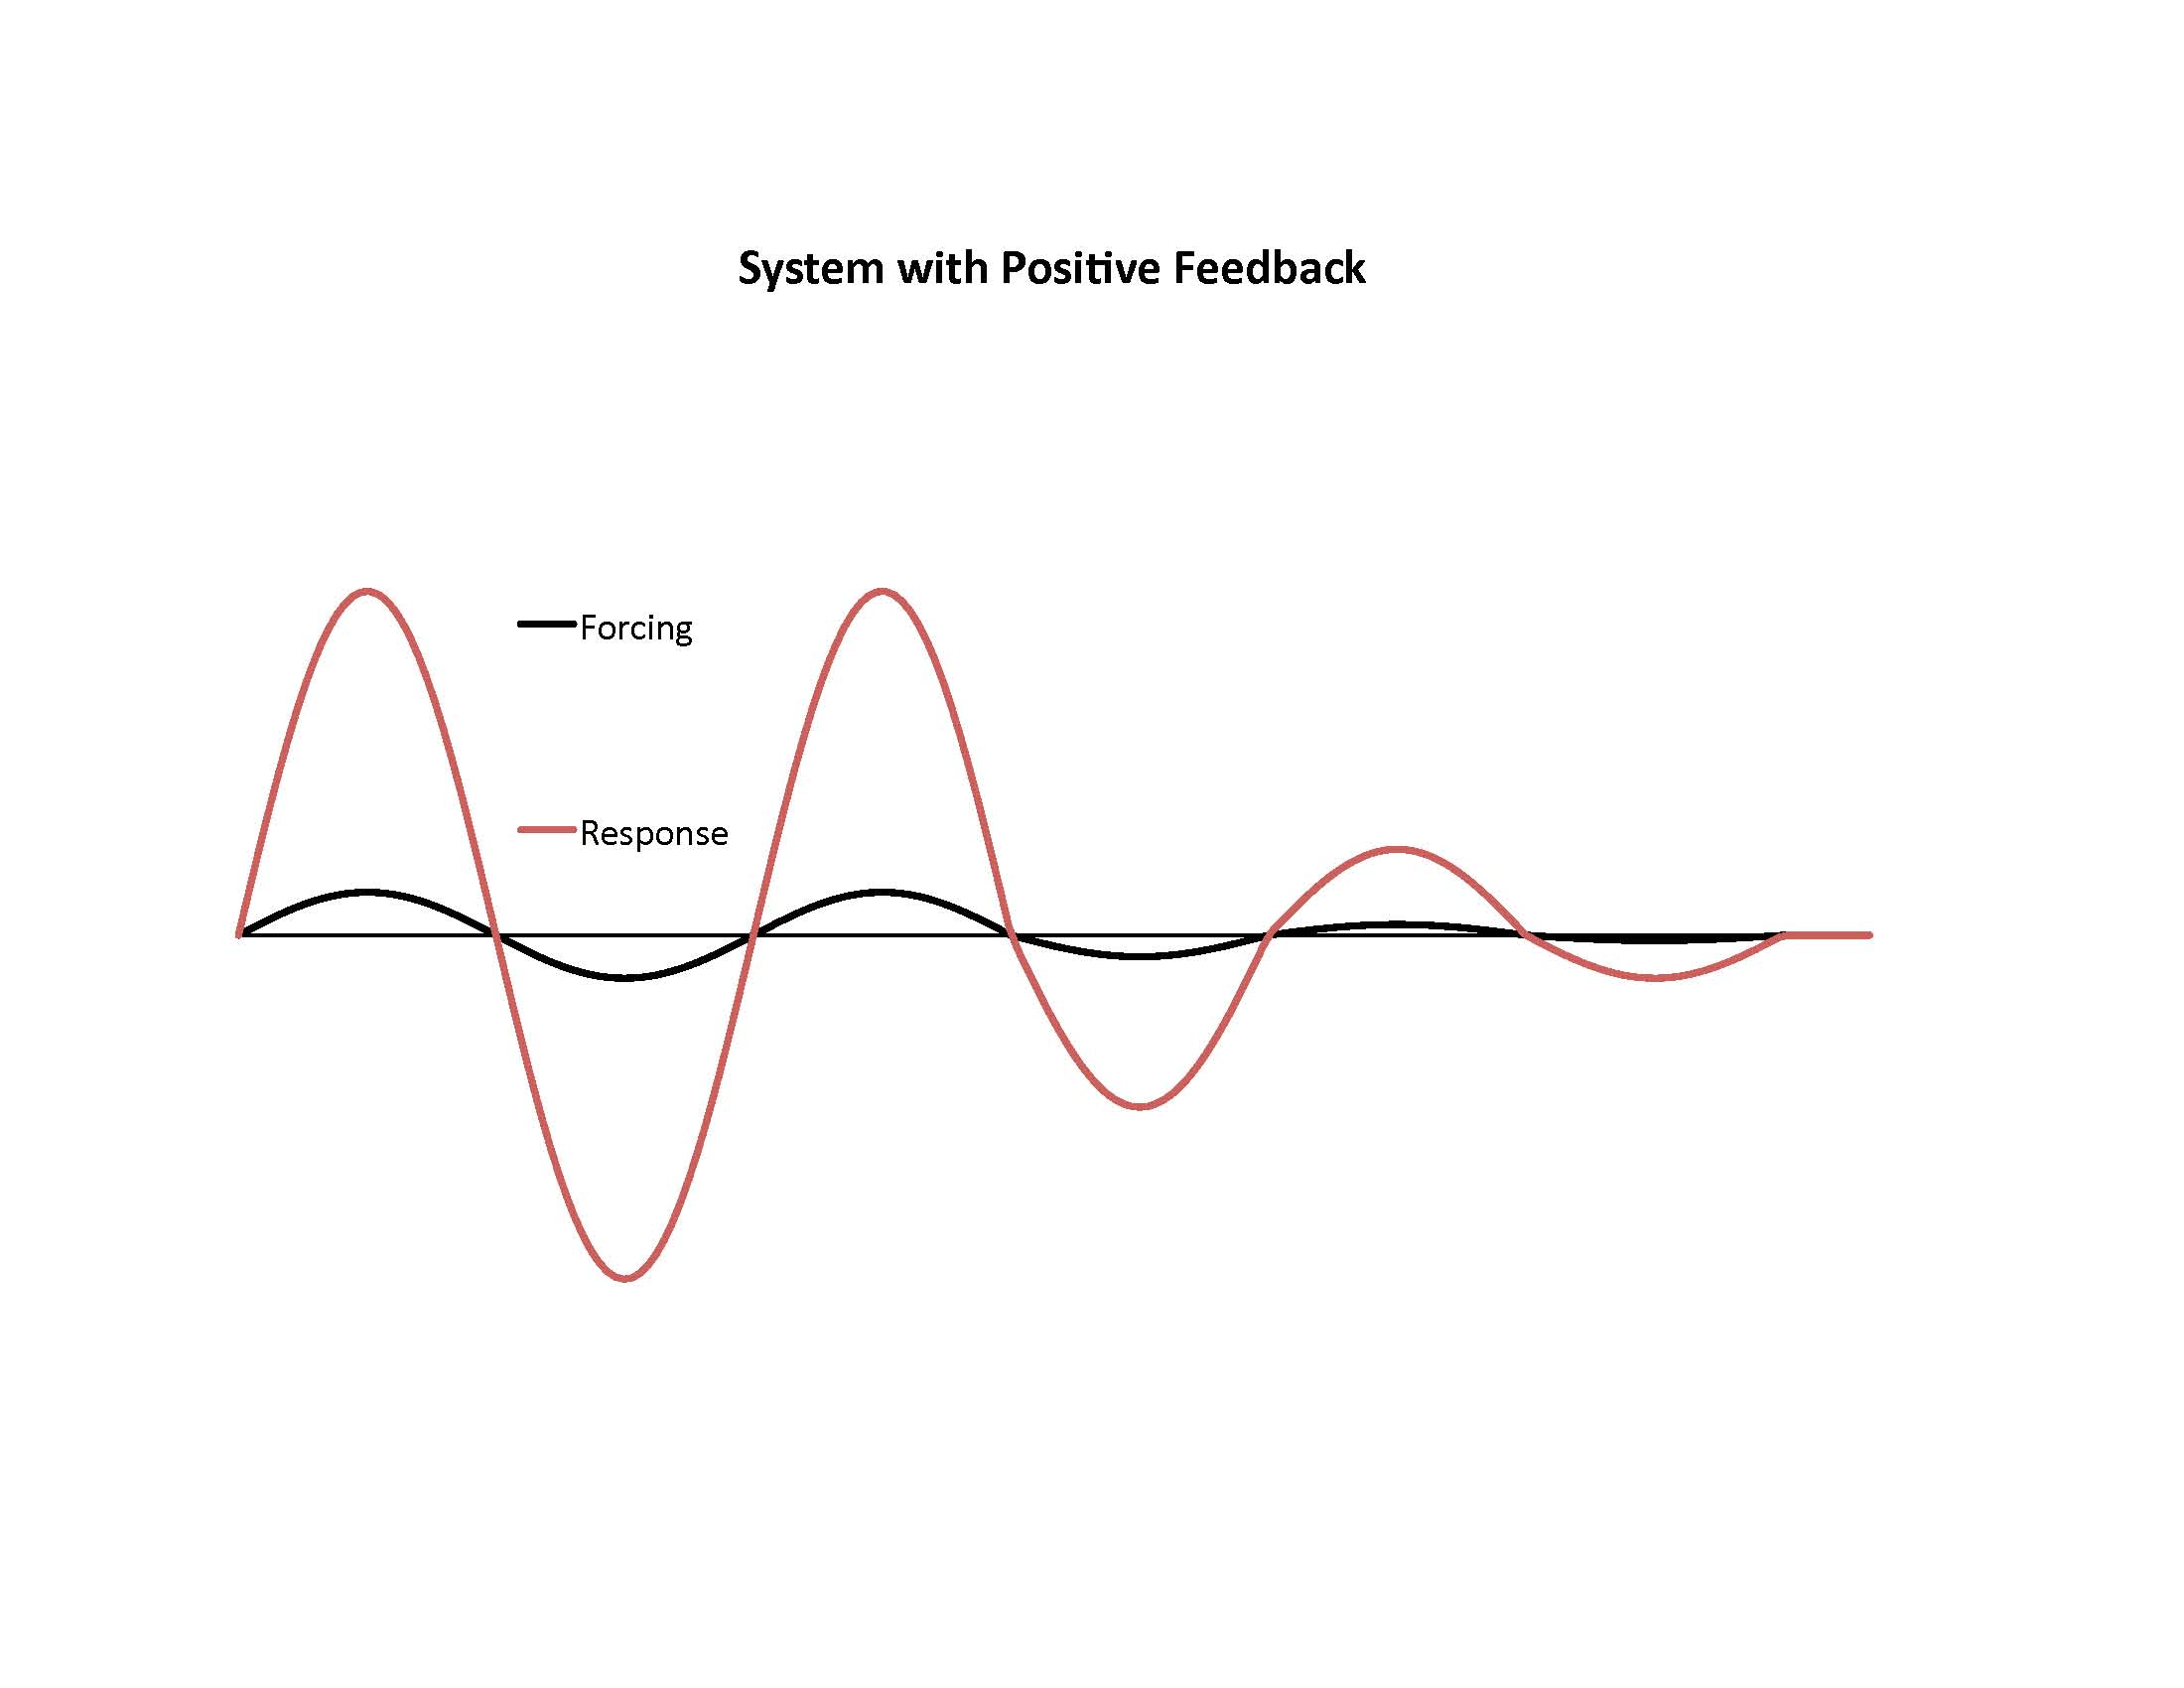
The above shows a climate system with a high sensitivity. On Earth, the ocean is responsible for a very large system memory; the only consequence of this enormous potential of energy in a system dominated by positive feedback, however, is to cause a system lag, which constrains the time it takes for the climate to change.
To summarise, the IPCC have largely ruled out internal climate change, and used physics to exaggerate processes that would normally have little impact on their own, to explain the origin of the climate. In the IPCC’s view, the ocean can store an enormous amount of energy, but at no time can that potential energy influence long term climate change under a dominate positive feedback. Ultimately, with or without a system lag, it all comes down to external forcing. Periods of hiatus /rapid warming, etc. cancel out in the long term. There is no doubt the attribution of 20th century warming has been simple and straight forward due to human emissions.
In contrast to a system depended on positive feedback, the impact of external forcing is reduced with a system based on a negative feedback, and the initial ‘cause’ or ‘origin’ of climate change is far more ambiguous. Unless a specific negative feedback mechanism is known, attribution is near impossible. Attribution is synonymous with positive feedback. As noted by climate researchers, attribution of warming to an internal process such as the ENSO cycle requires a highly sensitive climate with positive feedback to work!
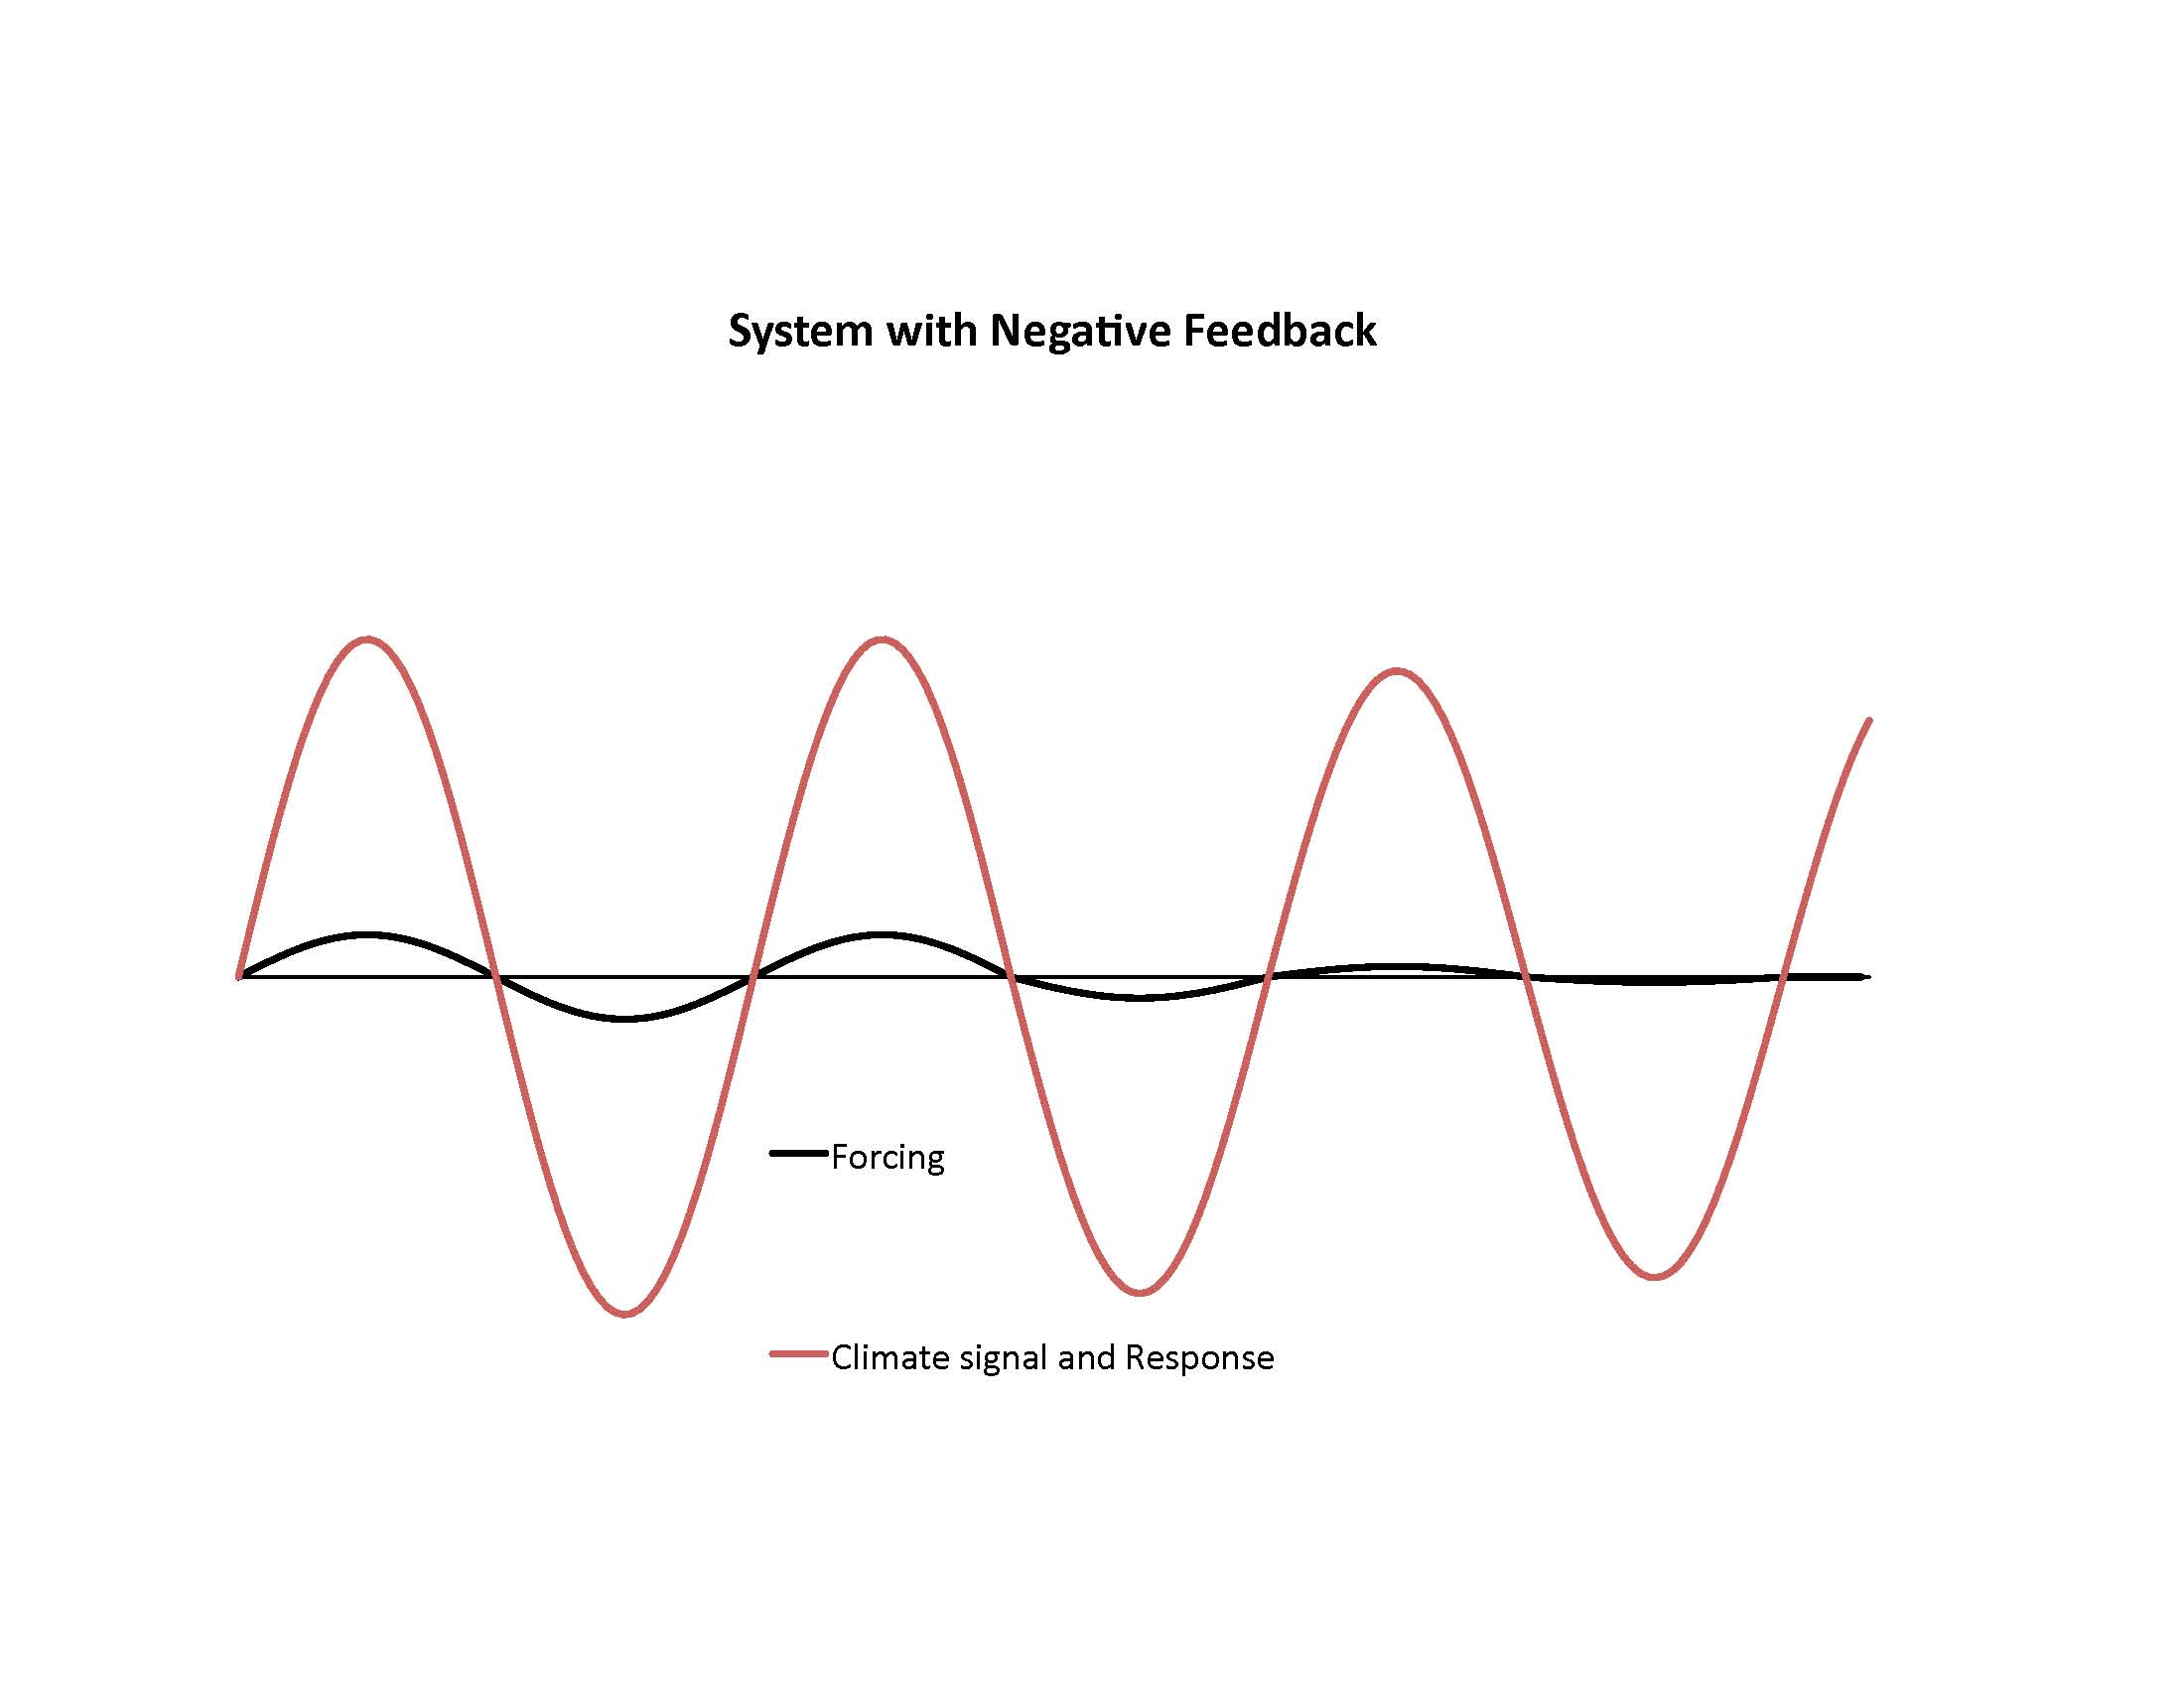
In this ‘negative feedback’ world, climate sensitivity is low. The system is hard to change with external forcing. In contrast to the previous ‘positive feedback’ example, the associated external forcing does not immediately explain the magnitude of the climate signal. By its own nature, a negative feedback system requires climate changes to be attributed (for the most part) to internal variability. External forcing therefore plays only a minor role, leaving the feedback as the dominate driver of change (‘the cause’). Attribution then requires knowledge of internal dynamics (are they random or deterministic?). A significant, dominate role for internal variability would be impossible without a system memory. A positive feedback does not require a system memory, yet we live in a world which has one.
The climate signal in the figure above may have been caused by the forcing, but only very slowly over time. It may have taken a million years. Since external forcing can only cause a small deviation from equilibrium (due to low climate sensitivity), such a forcing would need to be periodic in nature (such as orbital forcing), in order to change the system in the long term. In the absence of external forcing, the climate oscillation that has accumulated over a million year time period, will take another million years to stop oscillating completely and return to equilibrium. A million years of climate change with no external forcing is theoretically possible under a system with both a memory and negative feedback. Impossible under a positive system.
Attribution studies which claim that 20th century warming has no alternative explanation other than manmade greenhouse forcing are only credible in a hypothetical positive feedback world. In other words, there is no alternative explanation in these studies because they have only considered positive feedback mechanisms. Ruling out Internal variability as a driver of change inevitability means negative feedbacks are also ruled out, and vice versa.
Evidence of a negative feedback is found in climate records which exhibit characteristic of system memory, such as an accumulation of periodic energy:

This figure shows the climate record of Lisiecki and Raymo (2005) constructed by combining measurements from 57 globally distributed deep sea sediment cores. The measured quantity is oxygen isotope fractionation (δ18O) in benthic foraminifera, which serves as a proxy for the total global mass of glacial ice sheets. Source: Wikipedia
Until climate scientists consider internal variability in the context of both positive and negative feedback systems, it is unlikely the great mysteries of climate change will be solved.
JC comment: This essay landed in my inbox this morning, I have not communicated previously with the anonymous author. This essay speaks to a concern that I have had regarding the separability of natural internal variability from forced variability, particularly as we detrend a time series to identify the natural internal variability. I have suspected that all this may be convoluted and not easily separable, with external forcing projecting onto the modes of internal variability. And particularly since we are looking at a period of about 3 decades as being the main ‘signal’ from CO2 forcing, we don’t really know how to do the attribution problem on this time scale.
Moderation note: This is a technical thread, pls keep your comments relevant (and civil).

By X anonymous? I stopped reading.
Firstly, I think that is her real name. I met Miss Anonymous several years ago at a barbecue.
Secondly, what better way to look only at the person’s arguments and logic and not be influenced by their title, position, reputation, etc. Now if I start reading something and it is nonsense I am likely to quit reading sooner if it is from an unknown on the internet, but not reading it at all seems petty.
Especially in this case when X is such a lovely young woman. If I recall correctly, she was Columbian. :)
If only everyone reads what is written and not worry about who actually writes it we would have a genuine debate here for a change!
+1
I happily read the post, unencumbered by possible prejudices and biases that might have come from ‘information’ about its source. It also increased my critical thinking – had it been by Hansen or Lindzen, I’m sure I’d have filtered it one way or another – to some degree – by the sense that “I know what this guy is trying to sell me”
First reaction? Well written and interesting.
> If I recall correctly, she was Columbian.
When I met her, she told me she was Spanish.
Then we talked about David Mamet.
How do we know ENSO is internal and not partly or even largely influenced by external forcings?
The statement that ENSO is internal is narrative i.e. a just-so story. The fact of the matter is we can neither predict nor explain the timing and magnitude of ENSO events yet some idiot thinks he can say it’s internal. Climate science is a frickin’ circus and the practitioners are mostly clowns.
We can’t be absolutely certain “that ENSO is internal“, but there are many proxies that seem (with great probability IMO) to show ENSO cycles going back many millennia. ENSO appears to be stochastic in a similar fashion to a dripping faucet, and the possibility that external forcings are influencing its timing cannot (at this time) be ruled out. Not the same thing though.
David, “How do we know ENSO is internal and not partly or even largely influenced by external forcings?”
Because of the way it is defined. It is not called the El Nino Southern phenomenon of indefinite origin. The Wood’s Hole guys coined a new Pacific Centennial “oscillation” , but it is likely a weakly damped pseudo-cyclic recurrence related to solar forcing. Once climate science gets past weather mentality they will find the causes of the weather “oscillations”.
David, Being an “internal oscillation” says nothing at all about it’s affected by external forcings.
ENSO is actually well known to be influenced by external forcings, ENSO seasonal phase-locking being an easy demonstration of this (discussed e.g. here.)
David Springer | August 29, 2013 at 8:39 am | says:
“…we can neither predict nor explain the timing and magnitude of ENSO events…”
AK and captdallas plus/minus are equally puzzled. Goes to show that none of you guys have done your homework because the explanation has been in my book “What Warming?” all along. First, forget everything that people like Hansen, Trenberth, and others have said about ENSO. There are thousand’s of papers out there that have good data in it but no idea what to do with it. Reminds me of 15,000 blind men trying to describe an elephant. ENSO, or El Nino Southern Oscillation, is a harmonic oscillation of ocean water in the equatorial Pacific, driven by trade winds. If you blow across the end of a glass tube you get its fundamental note, determined by the dimensions of a tube. Trade winds are the equivalent of blowing across the tube and the ocean answers with its own fundamental note – about one ENSO wave every five years or so. Turnaround points of the oscillation are the Indo-Pacific Warm Pool and the South American coast at the equator. Trade winds push the two equatorial currents west until they are blocked from entering the Indian Ocean by New Guinea and the Philippines. There the water piles up to form the Indo-Pacific Warm Pool, the warmest water on earth. When its level is high enough gravity flow east begins along the equatorial counter-current. .An elongated El Nino wave forms, crosses the ocean, and runs ashore in South America. There its spreads our north and south along the coast and warms the air above it. Warm air rises, interferes with the trade winds, joins the westerlies, and we notice that an El Nino has started. The westerlies carry it across the world so that the El Nino peaks in America, Europe, and Japan are in register. But any wave that runs ashore must also retreat. As the El Nino wave retreats sea level behind it drops half a meter, cold water from below fills the vacuum, and a La Nina has started. As much as the El Nino warmed the air, La Nina will now cool it. This makes the global temperature record look like a wave train although it is not perfect because oceanic events can influence its frequency and amplitude. ENSO has existed as long as the present configuration of Pacific currents has existed, which is to say since the Panamanian Seaway closed. This happened a little under two million years ago and any claims of El Nino existing in the Pliocene are just plain nonsense. And don’t believe any stuff about an “El Nino like climate” because it is impossible for an El Nino wave to stay put or worse, to spread out to control the climate. What I described applies to the majority of El Nino waves. But not all El Nino waves make it across the ocean to south America. If The equatorial countercurrent is obstructed by, for example, a storm surge, its warm water will spread out in the middle of the ocean before reaching South America and produce an El Nino there on the spot. Such an oceanic El Nino is called an El Nino Modoki or CP El Nino (Central Pacific El Nino). This is one cause of irregularities of the ENSO phenomenon. It also changes the nature of the La Nina that follows. It is hard to get statistics but according to one source as many as thirty percent of El Ninos may be involved. The entire global temperature curve is a concatenation of El Nino peaks with La Nina valleys in between. According to satellite data the temperature differential between a typical El Nino peak and its adjacent La Nina valley is about half a degree Celsius. In ground-based data it is reduced to half of what the satellites can see. Since the entire global temperature curve is a concatenation of El Nino peaks and La Nina valleys global mean temperature is determined by putting a dot at the center of every line connecting an El Nino peak with its adjacent La Nina valley and connecting the dots. Computer smoothed curves are not acceptable because they treat ENSO as noise which it is not. It should be clear from this that ENSO just circulates energy and plays no part whatsowver in global warming.
Whoever it is is using the terms “positive feedback” and “negative feedback” exactly backward. Conceptually, it’s ok, but the terminology is wrong.
Harold, so you and webster think the diagrams are wrong?
All I’m saying is that negative feedback, as used by control systems and electrical engineers, is correcting (stabilizing), and positive feedback is destabilizing. The terminology is backward. That’s all. The diagrams are fine if you change the labels.
I make no comment on the larger argument.
So if you have a stable system, there would be negative or even no feedback to a forcing. With a less stable system, forcing could amplified possibly even causing the system to run away.
Madam/sir X shows an amplification of the forcing for the positive feedback situation and no response at all in the negative feedback situation, it just keeps oscillating.
Looks like feedback is just part of the puzzle.
http://hyperphysics.phy-astr.gsu.edu/hbase/images/oscda8.gif
It’s a little more complicated than that. If the forcing decays, as shown in the diagrams, a certain amount of positive feedback will still be stable, but take longer to relax. But above a certain point, it will be unstable, no matter what.
Yep, there is a bit to it, I think that may be why there is text along with pictures.
His first example is a system with high sensitivity which amplifies forcing, there is no mention of the stability of the system. The second is a system with low sensitivity to forcing. Looks to me like the examples match his text and the point would be to figure out the gain aka sensitivity.
Also a positive feedback system with a significant lag can actually appear more stable than a negative feedback system that has a very weak lag.
Look at night versus day in the desert which obviously has a strong negative Planck response feedback when the sun.sets. Very little lag there.
Contrast that to a slow albedo change with global warming as a positive feedback … oops, most people don’t want to hear about that one. Looks stable on a human time scale though.
Webster, “Also a positive feedback system with a significant lag can actually appear more stable than a negative feedback system that has a very weak lag.”
A positive feedback with enough lag can be a negative feedback, like a phase locked loop. Thermal mass can produce a lot of lag, doncha know. A negative feedback system with enough thermal inertia can just wander in a limited control range like +/- 1.5C with varying responses to forcings of the same magnitude. If a frog had wings….
May I ask why people think climate acts like an electrical process control system?
Or is the comparison simply used to illustrate certain properties.
“May I ask why people think climate acts like an electrical process control system?
Or is the comparison simply used to illustrate certain properties.”
It seems like a “natural” thing to do. Try to understand a system by applying terminology and tools that have worked for you in other disciplines. Like the nonsense of talking about detecting the “C02 signal” in the temperature series.
most of us succumb to this.
The terms ‘negative’ and ‘positive’ feedback are used by different people to mean quite different things. In most kinetics where we have
A->->->->B and if B can affect the rate A->->->->B.
If B increases the rate of A->->->->B than the feedback is positive.
The classical case is a chemical explosive where B is a gaseous degenerated state of A that gives rise to heat. The generation of heat increases the rate of A->->->->B and causes more heat generation.
If B decreases the rate of A->->->->B than the feedback is negative.
Polymerization reactions will spontaneously slow as the viscosity of the solution increases.
A cooling of the poles increases the size of the ice-pack, which increases the amount of reflected sunlight, which leads to more cooling, and is thus a positive feedback.
A warming of the poles decreases the size of the ice-pack, which decreases the amount of reflected sunlight, which leads to more warming, and is thus a positive feedback.
If one illuminates water one gets water vapor, a GHG, and so the heating of back-radiation resulting is a positive feedback, the formation of clouds block sunlight, negative feedback, and reflect back IR radiation, a positive feedback. One cannot say if an increase in water vapor causes an increase in (Tmax+Tmin)/2.
In climate science the increased in the radiance of a black body on heating is called a positive feedback, which I have never understood.
When the word “feedback” is used in climate science it used mostly referring to a static feedback, not to a dynamic one. Most people who participate in this discussion and, in particular, those who take their reference from electrical engineering have something totally different in mind than that typical for climate science.
There are certainly all kind of dynamics feebacks in the Earth system, but they represent such dynamics that other concepts might suit much better than the word “feedback”.
“Like the nonsense of talking about detecting the ‘C02 signal’ in the temperature series.
most of us succumb to this.”
Another Mosher Lucidity Moment. It’s like the “pause” in reported temps. We don’t know where all the obscurantism is, and it’s a travesty. But I suspect we are reaching a tipping point at which Mosher will lapse back into months of unrelenting obscurantism.
Reading Mosher is like listening to Schoenberg. Every once in a while, you think you heard some music, but upon reflection realize that you didn’t.
Harold: agreed. The feedback diagrams are mostly backwards, but overall just poor and confusing.
Positive feedback is amplification. Positive feedback can be less than linear and remain stable. But Positive feedback can exceed linearity and go unstable and peg or tip.
Negative feedback is a restoring force toward stability. Dampening forces, drag and friction are negative feedbacks.
The Positive feedback illustration is poor because it is implying that the amplification is reducing the later forcing. That is mixing effects and confusing, if not wrong.
The Negative feedback is just wrong. The response should be less than the force. If the force is tied to the response, then the force must diminish, as it does incorrectly in the positive feedback illustration.
The classic negative feedback is a pendulum, either frictionless with no decay, or in a viscous medium with resistance and decay. When it is over damped, it does not oscillate but returns to steady state gradually. Under damped is a decaying oscillation.
The classic positive feedback is a rod of finite diameter standing on end. You can push the rod off center so long as the center of gravity doesn’t cross the vertical of the edge of the base. It will return, oscillate and teeter. But once you push the centroid of the rod pass the vertical over the edge of the base, positive feedback exceeds the restoring forces and it falls over. Positive feedback gives rise to “tipping points”
They don’t do the hand gestures Moshpit like, but still:
Steven Ramsey, “Harold: agreed. The feedback diagrams are mostly backwards, but overall just poor and confusing.” I believe that is a product of Climate Science’s interpretation of control theory.
In the second graph he is showing a system in control, oscillating in a given range minding its own business when along comes a forcing. Not much happens because the system is controlled by regulating feedbacks. The drawing could be better, but it matches his text.
In the first graph, the sensitive system amplifies the forcing and decays with the forcing. No indication of system dampening, just for whatever reason the forcing appears to be damped. Maybe we run out of gas.
So if you consider the second graph, when you add CO2 it doesn’t amplify the range of oscillation it reduces the range of oscillation. CO2 reduces the diurnal temperature range. It doesn’t add energy to the system it just reduces the rate of energy loss from the system.
In “normal” control theory a forcing would cause a pulse and a positive feedback would amplify the pulse. In climate science the CO2 “forcing” is dampening an oscillation and a positive feedback is increasing the dampening of the oscillation. When all is said an done, Ein will still equal E out.
So I would stick with poor and confusing instead of backwards, but both apply to climate science.
@captdallas2 0.8 +/- 0.2
I think you are confusing issues.
A step change in CO2 could initiate a damped oscillation, either with positive or negative feedback.
A gradual rise in CO2 can only initiate a gradual rise in warming as a response. It is a convolution of an infinite number of step changes with their step change system responses.
What you are implying is that an increase in CO2 will somehow change the amplitude of unknown natural frequency source of oscillaiton. That could be possible if CO2 is changing the tuning parameters of a natural frequency feedback. I don’t think anyone proposes that.
Steven Ramsey, “What you are implying is that an increase in CO2 will somehow change the amplitude of unknown natural frequency source of oscillaiton. That could be possible if CO2 is changing the tuning parameters of a natural frequency feedback. I don’t think anyone proposes that.”
I believe that is what the author is proposing. Assuming that a CO2 pulse perturbation would have the same impact as a gradual increase is not a guarantee it will. CO2 and water vapor feedback are suppose to decrease diurnal temperature range which is a known oscillation that along with seasonal oscillations are likely creates other oscillations. A dynamic system versus a static system.
Cappy is getting flustered because he thought he held the job of chief confuser. Or was that the Chief?
Schoenberg?????
Tom waits..
now Im smoking cigarettes
and strive for purity,
and I slip just like the stars
into obscurity.
Webster, “Cappy is getting flustered ”
No, The impact of CO2, best estimate is 1C +/- all things remaining equal. Greater than that requires positive feedbacks to CO2. CO2 is not a “forcing” in the normal sense, it is an insulation improvement, it improves the efficiency of the system inside the boundaries of that insulation.
X is offering two views, the first is forcing drives everything there is zero internal variability, zero system memory. Second, the system has a lot of system memory a “forcing” has a small impact.
That gets lost because the two chart don’t look like what you expect. X can’t communicate his/her thoughts because you hit a stumbling block. That is a totally unique situation right?
You are correct about the nature of negative and positive feedback but I don’t know who is using it incorrectly.
But to get back to my point no one (including Arno) has explained how to predict timing and intensity of ENSO events. Ergo we don’t know what factors control said timing and intensity. If anyone thinks differently then please produce a 20-year schedule of upcoming ENSO events showing start dates, end dates, and magnitude. Thanks in advance.
The current thinking is that 1.2C is due to CO2 alone, another 1C is due to compounding (positive feedback) water vapor rise, and about 0.8C is due to other GHGs such as methane, n20 and also due to fast albedo feedbacks. That gets the fast feedback sensitivity to 3C for man-made GHG’s.
Anything beyond this is due to slow positive feedbacks such as long-term albedo changes and biotic activity changes.
Hansen describes the slow feedbacks here
J. Hansen, M. Sato, G. Russell, and P. Kharecha, “Climate Sensitivity, Sea Level, and Atmospheric CO2,” arXiv preprint arXiv:1211.4846, 2012.
Webster, The current thinking is that 1.2C is due to CO2 alone, another 1C is due to compounding (positive feedback) water vapor rise, and about 0.8C is due to other GHGs such as methane, n20 and also due to fast albedo feedbacks.”
Current thinking is changing. 1.6 C total is more current and once the longer term ocean transport lags are figured out it will be closer to 0.8C, because 334Wm-2 is the best estimate of “surface” DWLR which is opposed by the best estimate of “surface” average black body energy, the “average” energy of the oceans. You are living in the past. Try to catch up.
Only in the last quarter of the last century has CO2 rise been well correlated with temperature rise, and not before, and not since.
The grandest example yet of the Post Hoc, Ergo Propter Hoc logical fallacy.
=========================
According to Salby, we don’t even know what the CO2 signal was much prior to the last quarter century. And the way he was treated strongly suggests that the alarmists, or at least the socialists trying to use climate alarm as a stalking horse for their own agenda, know he’s right and are trying to suppress him. No wonder they feel such “urgency” about “doing something” about climate change.
Watt about Murray Salby?
http://wottsupwiththatblog.wordpress.com/2013/06/22/watt-about-murry-salby/
Murry. Damn tablet.
I was referring to the damping of the CO2 signal in ice cores: http://www.youtube.com/watch?v=2ROw_cDKwc0
willard audits the wrong set of books.
============================
I think Murry Salby felt some urgency to do something with regards to the predicament he was in. And that was to lash out on his way out the door.
If there is a nugget of wisdom buried in his videos it is certainly lost amongst the the rest of his lunatic theory, e.g. current temperature rise causing the rise in CO2.
I bet he thought he would fit right in, Australia and the land of the loony climate theories.
@whut…
Typical ad hominem nastiness. And no real effort to address the point of his talk. But at least, from the delay in responding, you tried to listen to it.
The fact is that his suggestion that pCO2 has been moving around quite a bit, including often being higher than 400ppm, fits right in with the suggestion that pCO2 tends to move as the integral of Global Average Temperature. Of course, it’s quite simplistic, but new paradigms often tend to be that way.
We’ll see. It’s certainly not lunacy, just against your religion.
> I was referring to the damping of the CO2 signal in ice cores […]
The sentence talking about the way Murry was treated, alarmists, or at least socialists, stalking horses, and agendas made that quite clear.
There speaks a conspiracy denialist.
Please tell us more about how alarmists feel and typical ad hominem, dear AK.
Very interesting.
An explicit guess about motivations is hardly an “ad hominem“. The latter is an effort to discredit somebody’s arguments based on their personal characteristics. What I was doing was guessing about the motivations for a certain disgusting act, part of a sequence of disgusting acts.
And to reiterate, the fact that those acts took place (if they did, I’ll admit I’m going on Salby’s word on the matter) strongly suggests that the people responsible knew, or at least strongly suspected, that he’s right. And were trying to suppress publication of his work.
Ha murry salby, you are wasting your time.
Go to 1:02:20 in the video where he shows a graph and falsely claims the CO2 increase is scaled to represent the warming rate predicted by models. But his graph is scaled to show 0.7C/decade warming in the 80s. I ask you, what model ever predicted that?
Then he switches to a different graph but the scale has been altered.
I am pretty sure I’ve seen that exact graph before on a denier site. I suspect Salby is a closet climate denier. Far too much strange material like this in his presentation.
The graph at 1:02:17, and its extensions at 1:02:37 and 1:02:47 represent the “real world temperature” on the same graph as CO2. The one for the model world is a different scale. The scale for the first graph has “been scaled to match the trend ??? as was obtained by models by the IPCC.” I don’t know what the word I’ve used ??? for is, but I can’t see the correspondence with your claim of deception.
Oh and quotes Richard Feynmann at the end of the video. Case closed.
AK
“suggests that the people responsible knew, or at least strongly suspected, that he’s right. And were trying to suppress publication of his work.”
It can also suggest that they knew he was a kook and needed a way to get rid of him.
Further, if if they thought he was right that doesnt make him right. They could be stupidier than he is.
Bottom line. Nothing of consequence, nothing of scientific consequence follows from what they did to him.
1. They let him go because he was right
2. they let him go because he was a loon
3. they let him go because they thought he was right and they are loons for thinking that.
Note: None of these is evidence FOR or AGAINST his scientific position.
@Steven Mosher…
4. they let him go because they thought he was a loon but he was right.
And I could probably think of others. The question is, how likely is it that he’s got hold of something. You can listen to his whole presentation and think about it, or you can read lackwit’s nonsense and dismiss him. By pointing out the possible reason for their treatment of him, I’m trying to persuade people to pay attention.
IMO, based on what I know of the fields involved, he has a very good point. Are his numbers right? I don’t know. I’d like to see his ideas published and subject to the usual peer-review. It seems likely that there are efforts to suppress publication of his work, of the sort heard of in Climategate. Calling attention to that apparent suppression might contribute to getting it published, and given proper scientific attention. Thus, I spend time on it I could be spending on other things.
“The scale for the first graph has “been scaled to match the trend ??? as was obtained by models by the IPCC”
The graph has been scaled to show 0.7C/decade warming.
It’s been scalded far higher than the IPCC models.
That’s the deception. It’s necessary for the graph to look like temperature started diverging from CO2 (even the BS about how it tracks up till 1997 is wrong, at 0.7C/decade it evidently doesn’t track 1980-1997 warming, just a feeble way to claim warming stopped post 1997 by claiming it tracked up till then)
It does seem to be scaled to that (actually 0.8C.decade). It close to matches the time from about 1984-1990, and post-Pinatubo 1991-1999, but a figure of 0.3 is better for 1980-1990, at least per his graph. A trend at roughly this slope is certainly present, from 1984-1999, interrupted by a single cooling dip from Pinatubo. I doubt this was intended as deliberate deception, but a better explanation is certainly necessary.
Of course, if his work were subjected to the standard process, or even published as a blog post, these questions could be addressed. If his research notes and other materials hadn’t been sequestere (or whatever) by his former employer, perhaps he could publish.
‘Soil respiration, RS, the flux of microbially and plant-respired carbon dioxide (CO2) from the soil surface to the atmosphere, is the second-largest terrestrial carbon flux. However, the dynamics of RS are not well understood and the global flux remains poorly constrained. Ecosystem warming experiments, modelling analyses and fundamental biokinetics all suggest that RS should change with climate.’ http://environmentportal.in/files/Temperature%20associated%20increases%20in%20the%20global%20soil.pdf
RS changes with temperature as do other aspects of biokinetics globally. This is in addition to simpler – but still quite complex – chemical changes. There is no doubt at all that a portion of CO2 increases are quite natural and responding to natural changes in global temperature. Salby is a convenient whipping boy – but he is far from alone in mainstream biology – the idea is essentially sound. Isn’t that what counts?
Webby’s attempts at turkey slapping, numbnuts scientifically unsophisticated gotchas and wee willie’s definitive blog science links notwithstanding.
AK
4. they let him go because they thought he was a loon but he was right.
Your #4 is not materially different from my #1.
####################################
And I could probably think of others. The question is, how likely is it that he’s got hold of something. You can listen to his whole presentation and think about it, or you can read lackwit’s nonsense and dismiss him
1. I listened to his presentation, long ago.
2. Some professor called me two weeks ago and begged me to listen to it again and bring it up the chain to the guys who have 3 initials after their names.
3. I watched again.
Bottom line. I will not recommend his work and wont waste the time of smart people by suggesting that they look at it.
################################################
. By pointing out the possible reason for their treatment of him, I’m trying to persuade people to pay attention.
Wow, that is a really bad and horrible way of promoting somebody.
you would do better to get me on the phone and try to convince me or to explain why you think he is correct.
################
IMO, based on what I know of the fields involved, he has a very good point. Are his numbers right? I don’t know. I’d like to see his ideas published and subject to the usual peer-review. It seems likely that there are efforts to suppress publication of his work, of the sort heard of in Climategate. Calling attention to that apparent suppression might contribute to getting it published, and given proper scientific attention. Thus, I spend time on it I could be spending on other things.
He can do what Hansen does and post his stuff online. Or he can go to low impact journals that are less dominated by politics.
The climarati should never be met head on, at least thats my experience.
One just has to watch the video of Salby and sense the clenched fury that is barely concealed below the surface.
It is a fascinating performance, the way he coordinates hand gestures with the word “quadrature”, for example.
And the way he is very deliberate and measured, filled with pregnant pauses.
We all have to be students of human nature, to figure out who is pulling a fast one and who is sincere.
Watching Salby in action, I have made up my mind. I have also done the homework on CO2 outgassing and can show it is not an integral response. It may be slightly lagged, which gives that impression, but it won’t build up to the amount that Salby claims.
As lolwot noticed, his last ref to Feynman places him on the denier team. That was the dog whistle.
This mini-brouhaha about whether to pay attention to what Salby wrote, or not, based on who he is, or how his former bosses treated him, kinda funny on a thread based on an anonymous post.
Maybe there should be a reversal in the climate science bidness. All papers should be published anonymously, and all reviewers should be named.
The science would rise or fall on its own merits, and the “reviewers” would have their own work, including attempts to push bad science or retard good science, trumpeted for all to see.
Oh what a world it would be.
> An explicit guess about motivations is hardly an “ad hominem“. The latter is an effort to discredit somebody’s arguments based on their personal characteristics.
Sure, and “guessing” personal motivations is not being done to discredit the arguments offered by whom are being called “alarmists” or worse.
What you’re doing is suboptimal, AK. But please do continue. How do you know that Murry’s right and that those who kicked him out of his tenure knew it?
> All papers should be published anonymously, and all reviewers should be named.
+1
willard,
AK has laid out the reason by his rhetoric. he wants to interest people in Murry. By telling a tale of suppression, he hopes that people will listen to Murry. The problem is those most intrigued by a tale of suppression are least able to judge the work.
by this time Ive pretty much adopted the rule that if somebody says
“listen to this guy, he disproves AGW” that I have more interest in a UFO video than the work they are recommending. At least those fakers learn some new tricks.
somewhere in there is an appeal to GE Moore.
CH, 20 years ago I used to hangout with a bunch of microbiologists and plant biologists who were studying the Rhizosphere.
Our lack of understanding about what goes on in the soil is mind boggling. The funny thing is that none of the Ph.D. students or young post-Doc’s had a hope in hell of getting a full time position as there was no funding in the area; most went off to the city or rode the dot-com boom.
AK,
Willard’s language skills are so poor he’s seldom able understand what you’ve written so his responses are seldom topical. I’d recommend just igorning him.
@David Springer
I don’t believe that. Like others here, on both sides, he deliberately misunderstands/misinterprets what people say for the sake of turning their arguments into straw men.
I’m familiar enough with rhetoric to see it happening, even when I pretend not to see it for purposes of argument.
@Steven Mosher…
That would be a foolish waste of time… mine and probably yours, although you might try to string me along.
Might was well call lackwit and try to convince him.
Maybe, but enough attention and perhaps somebody will try to address his real arguments someplace like RC. Then I’ll be able to judge whether they really have reasons his suggestions about the damped CO2 signal don’t make sense. If they go with the same sort of nonsense I’ve seen in this thread, that suggests even more strongly that he really has something. Presumably, if there were valid objections to his work, the folks at RC would make them, once there’s enough furor to motivate them.
Perhaps Douglas Walton can put things straight:
http://link.springer.com/content/pdf/10.1007/BF00136781.pdf
Appealing to motive is a special case of a circumstantial argument, which is special type of ad hominem. AK’s only way out would be to claim that he’s not using his guesses as an argument. I hope he understands as much rhetoric as he claims to do to realize this line of defence would have little merit.
***
But to return to Murry, here’s Mash’s network analysis of the Salby blogstorm:
http://www.desmogblog.com/2013/08/25/defamation-by-internet-part-1-murry-salbys-short-lived-blog-storm
Our emphasis.
Analyzing the content of these comments might deserve due diligence.
***
Yes, but alarmists, if not socialists.
@nevaudit…
Probably not, but what does deserve attention is this. I’ll spend some time studying it.
Your Grandma was a typical white alarmist.
===========
AK
“That would be a foolish waste of time… mine and probably yours, although you might try to string me along.
Might was well call lackwit and try to convince him.”
Really, well I’ve already told you that one person was persuasive enough to get me to view the video again. Funnily he did not note anything about supression of views.
I would say that you lack confidence in your own ability to convince.
That’s why you rely on a rhetorical slimeball trick.
Those tricks dont bother me as much as they bother willard.
In any case I find it interesting that you can form no judgment until somebody like RC takes it up. and the judgement you form from the absence of anybody discussing it is a paranoid reaction. That indicates that you will not be able to form any good judgement even if you are presented with a good argument.
Its one thing to say : I use a bad argument to try to get folks to have a good argument, its quite another to not realize that your bad argument is in fact bad.
I have no issue with you manipulating folks with bad arguments. I rather like it. but in the end what you want is the good argument.
@Steven Mosher…
I certainly don’t expect to convince you. It’s not really a slimeball trick; that stuff happens, not just in Climate Science, but in fields where (AFAIK) there’s no heavy economic/political motivation behind the paradigm. And others where there is. Offering the potential accusation is one way to shake things up.
I’m still reviewing the document I linked, but based on what I’ve seen so far I’d guess he’s not a common conman. Kook, visionary, or both. But he’s certainly challenging the paradigm, or trying to. No common conman would do that, since duplicate research that supports the paradigm would have a much better chance of sliding through the system unnoticed. I would like to know how often that sort of thing happens in academia, how often it gets investigated and slapped down, and the relative ratios of investigations where there was and was not a challenge to the paradigm.
The paranoid reaction stems from Salby’s accusation that he was left stranded without transportation by a cancellation of his ticket. Sure, there’s some sort of backstory, but I certainly won’t believe the people he’s accusing of never filing some sort of employment registration. I don’t know enough about how things work in Australia to judge without more access to more facts than I have. (Something similar has happened to me, so I have great sympathy. But I’m also aware that such sympathy can be played on.)
I’ve already judged his theory about the CO2 signal, based on what I’ve seen from his presentation and what I know. The fields involved aren’t ones I’m well studied in, and I’d like to see what “experts” say in response to his case. He makes a good point about damping of the CO2 signal in ice cores, but a few charts on presentations aren’t enough for me. I’d like to see him put it up on a web site, but I’m sure people like you have already urged that on him, and I doubt my voice would add to it.
As best I understand his case, he claims the detailed work has been sequestered by his former employer. That needs to be shaken loose, either from them or from him, and his case documented on-line.
This question has always been of interest because internal variability seems to be swept under the carpet in orthodox climate science. There seems to be a fixation on CO2 build-up to the exclusion of other exogenous forcings that impact on temperature and CO2 levels as given by the data.
In this context there seems no conclusive evidence of causation between either of the foregoing, and it may well turn out that there is autocrrelation from something else altogether that is affecting them both, but with lags working either way.
http://www.woodfortrees.org/plot/esrl-co2/isolate:60/mean:12/scale:0.2/plot/hadcrut3vgl/isolate:60/mean:12/from:1958
For so long as I have been looking into various aspects of the earth’s climate, I have yet to understand the use of the word ‘equilibrium’ when used in this context.
Equilibrium does not occur within any of the sub-systems that make up the earth’s climate system, and equilibrium between the sub-systems is not obtained, either. The gradients of driving potentials for mass, momentum, energy, chemical, and biological changes / exchanges are non-zero. Life depends on the existence of these potentials.
Maybe Professor Curry or X Anonymous will provide additional background on the meaning of equilibrium in this post.
Corrections of al incorrectos will be appreciated.
Dan
None are in equilibrium because equilibrium is an ideal state that is never perfectly attained in nature. So we call them equilibrium systems because they have a theoretical equilibrium state they move toward and around and beyond and back always seeking but never attaining. The most stable equilibrium systems are those constantly closing the distance but never quite getting there because the rate of approach decreases as the distance decreases. This puts practical bounds on how far out of equilibrium a system may become and there’s a lot of that happening in the earth’s climate. For instance there’s an equilbrium point for cloud cover somewhere in the neighborhood of 70%. More clouds than that shades the ocean too much which retards evaporation which retards cloud formation while less cloud cover exposes the ocean to more sunlight which accelerates cloud formation. Bazinga. A thermostat. The travel above and below the set point is its hysteresis. The third phase of water (ice) mucks things up because it’s a positive instead of negative feedback. Ice reflects sunlight so the more ice the colder it gets which promotes even more ice. This is the cause of ice ages. It thought the only thing that stops a death spiral to a snowball earth is millions of years of accumulation of volcanic soot on the frozen surface which darkens it and/or the accumulation of greenhouse gases in the atmosphere, also volcanic in origin, until the scale is tipped and melting ice, which is also a positive feedback effect, ends the ice age. At the present time the earth is in a no man’s land where ice waxes and wanes on a cycle lasting over 100,000 years.
Clouds good
Soot good.
Serfs against extreme whether..
H/t Goldi-locks-just-right.
Good summary David S even if it looked like Arno Arrack’s posting!
Tellin’ somwone ter close the venetian
blinds is one way of preventin’
yer home from over-heatin’,
but ‘clouds’, they’re somethin’
else! Differ fron venetian
blinds the way they operate …
[take note, Al-Gore ]
fer cloudian al-bido
is deflectin’ lots of energy
from the sun straight
back ter space.
bts
‘Nonlinear phenomena characterize all aspects of global change dynamics, from the Earth’s climate system to human decision-making (Gallagher and Appenzeller, 1999). Past records of climate change are perhaps the most frequently cited examples of nonlinear dynamics, especially where certain aspects of climate, e.g., the thermohaline circulation of the North Atlantic ocean, suggest the existence of thresholds, multiple equilibria, and other features that may result in episodes of rapid change (Stocker and Schmittner, 1997).’ http://www.unige.ch/climate/Publications/Beniston/CC2004.pdf
Close enough. What is needed – however – is a theory of abrupt departure from equilibrium to a different state. Orbits – say as a control variable – in a warm state with an open Arctic – more snow – more melt disrupting MOC – ice sheet feedbacks – abrupt cooling.
Cloud cover changes between 53% and 60% in the satellite record – http://s1114.photobucket.com/user/Chief_Hydrologist/media/cloud_humlum_zps93daeba7.png.html – the annual cycles follow atmospheric water vapour content. The decadal variability seems related to decadal changes in ocean and atmosphere circulation – especially sea surface temperature.
And I quite like Agulhas ring injection into the South Atlantic as a mechanism to juice up MOC and end glacials.
You can see them at about 3.12 – http://www.youtube.com/watch?v=87ObpUBm8BA – I find this totally mesmerising.
http://www.ocean-sci.net/4/223/2008/os-4-223-2008.pdf
http://www.clim-past-discuss.net/9/2095/2013/cpd-9-2095-2013.pdf
Whoops – 63% and 70%.
Chief
I don’t know about ‘abrupt departure from the equilibrium’, as that to me means instant. However if you mean ‘rapid’ you can do no worse than look at the rise and particularly the fall of past civilisations where a rapid change from, for example, a long period of wet to one of drought would fit the bill.
Some of the Ancient Civilisations such as the Harrapans and even the Ancient Greeks (prior to the Romans) seem to have been brought low by a noticeable climate change long enough to affect their previously settled way of life.
Some examples are given in ‘weathers greatest mysteries solved’ by Dr Randy Cerveney and even Al gore acknowledged this one of his books.
Of course, sometimes a decline was caused by factors other than climate but the great civilisations tend to be sufficiently well documented for us to ascertain the causes of their progress.
Incidentally, have you ever read up of the Hydrology of Petra? It is fascinating and explains their pre eminent position at the desert crossroads, as they harvested and stored water so efficiently that even the Romans had to pay to traverse through their kingdom and obtain water (Mind you it didn’t take long for the Romans to realise they could get water for free by taking over Petra!)
tonyb .
Looking at that awesome NASA animation of our oceans
covering so much of the globe, any wonder that oceans
( and clouds) have a major influence on our climate.
There’s enough animation to circulate the cerebrum at Leif’s latest @ WattsUp. The hemispheric asymmetry and the fading of the sunspots together is a Big Blue Clue.
=====================
Hi Tony
Abrupt climate change has a definition.
There are essentially two definitions of abrupt climate change:
– In terms of physics, it is a transition of the climate system into a different mode on a time scale that is faster than the responsible forcing.
– In terms of impacts, “an abrupt change is one that takes place so rapidly and unexpectedly that human or natural systems have difficulty adapting to it”.
You might like this one – http://www.clim-past.net/6/525/2010/cp-6-525-2010.pdf
They use the term ‘equilibrium’ to describe steady state kinetics because they like to use the equilibrium approximation in calculations; basically a Boeing 747 is a helium balloon in climate science.
A result of the changing Earth-Sun distance at perihelion relative to aphelion produces an increase in solar energy reaching the Earth of about 6.9%. This is four times the putative 3.4 W/m2 than 2x[CO2], which we are informed has a lag of decades.
They can call it equilibrium or steady state or stationary state, but none of these applies to the earth’s climate systems.
I think a precise nomenclature is a requirement. Additionally, trying to make a system into something that it clearly is not will lead to incorrect conclusions. Simplifications and analogies should have valid relationships to the target.
Not really. Perhaps variations in the “Thermohaline Circulation.”
This is a mistake many on both sides of the issue make: the energy is moving from the sun to interstellar space, via Earth. The amount of the flows are (AFAIK) far greater than the amount stored in the atmosphere, and the same is true for the oceans over a longer time scale. Internal variability represents changes to the amounts of different flows, which aren’t subject to the same sorts of conservations that energy is.
Should be “explain the origin of the climate changes.”
The weather, including such long-scale processes as discussed here, is a very complex non-linear system, and thus almost certainly has a great number of feedback loops, some positive and some negative.
Roughly true, but it might be better to say that when the system has substantial memory, as well as negative feedbacks, internal variability will always be present and ruling it out as the cause of a specific change will be very, very difficult.
Yes moving energy around can change the operating parameters of the climate system. For instance moving more energy into the Arctic will reduce ice extent. Sea ice is an insulator effectively preventing radiative and evaporative cooling of the water leaving only very inefficient conduction to move heat from the warmer water off the planet. So in this case the energy redistribution actually effects the speed at which the planet can dump heat to space. This is handily illustrated by the fact that as Arctic sea extent has shrunk in the past 15 years the rate of global warming reduced to essentially zero. Melting sea ice is a negative feedback. It’s not rocket science.
However, according to your same logic, the rate of thermal energy transfer did not reduce to zero. Melting is a latent heat transfer which only hides the temperature change but not the free energy change caused by GHGs.
I heard a nice turn of phrase last night where it was suggested that the goal is to illuminate not eliminate. In other words, it is always wise to tell the rest of the story.
Latent heat of fusion is nearly so large as latent heat of vaporization. The actual mass of the year-over-year reduction in ice mass doesn’t amount to much compared to earth’s heat budget. I did a rough calculation a few years ago for the 1998 El Nino and found the amount of energy in the anomaly was just about enough to account for the latent heat of fusion in about 10% of the summer Arctic sea ice. Not surprisingly beginning about 18 months after the El Nino Arctic sea ice started to reduce in the summer and after several years the reduction amounted to about 10%.
I thus tend to ignore latent heat of fusion because very little old ice disappears and for the most part what disappears at the north pole is negated by the increase at the south pole. There might be some interesting bits like the 1998 El Nino correlation with summer ice loss in the Arctic but I don’t think there’s any smoking guns associated with latent heat of fusion. Latent heat of vaporization is the big kahuna and, in the lower troposphere it dominates the energy budget especially pver the tropical & sub-tropical oceans where most of the earth’s heat gain/loss actually happens. Not much energy exchange actually happens at the poles. See here (and memorize it):
http://oceanworld.tamu.edu/resources/ocng_textbook/chapter05/chapter05_06.htm
“5.6 Geographic Distribution of Terms in the Heat Budget”
Correction:
Latent heat of fusion is nearly so large as latent heat of vaporization.
should read
Latent heat of fusion isn’t nearly so large as latent heat of vaporization.
Backpedal much?
You can buy a unicycle.
I didn’t backpedal at all. Please explain.
Fluid flow — even turbulent flow — conserves energy and mass (and momentum); thus aircraft flight paths are reliably predictable even when the flow over the airframe is turbulent, such that individual aerodynamical “buffets” are not predictable.
As with aerodynamics, so with climate dynamics. Short-term dynamical “climate buffets” occur unpredictably; long-term secular dynamics are reasonably predictable. That is the physical principle of Hansen-style strong climate science.
Is it any wonder that today’s young scientists overwhelmingly prefer Hansen-style strong climate science to Monckton-style flimsy climate science?
The only meaningful test is prediction ability. Aeronautical engineers have demonstrated ability to accurately predict future performance due to changes in inputs. Climate modelers? Not so much.
A lot of young scientists appreciate that, over the last three decades, Hansen-style global energy analysis has done pretty well at prediction.
*FAR* better than *ANY* skeptical competing theory, that’s for sure!
Assessed solely by the metric of demonstrated predictive capability, hasn’t Hansen-style climate-change science proven itself to be the “best available science” (by far)?
That’s plainly evident, eh Steve Fitzpatrick?
Plain as Wirth surreptitiously and corruptly opening windows in Congress, and Hansen claiming regional skill for his climate models, twenty-five years ago. Fan is out to lunch, but not paying the bill.
======================
Kim, does it feel better to just stop thinking about science? Because that’s plea of your post.
It’s doubtful that young scientists will heed *THAT* plea!
A fan of *MORE* discourse | August 29, 2013 at 10:40 am
I find it more than a bit puzzling that you want to frame the question as a comparison of “competing theorems”. Aside from the far-out fringes of Skydragon slayers and the like (‘CO2 warming violates the second law’), almost nobody you would consider a skeptic sees it that way. The key question is not ‘does GHG forcing warm the Earth?’ (of course it does!), the key questions are how much, how fast, and most of all, what are the likely consequences? Your link to Hansen’s early predictions shows that he substantially over-predicted the rate of warming…. something that climate models continue to do today. The ability to make accurate predictions really does matter… both for designing airplanes and making costly public policy choices with far reaching social and economic consequences. The fact that climate model projections for the last 15 years are so comically wrong ought to give pause to anyone when thinking about suitable public energy policy.
Why is the Earth’s energy imbalance relentlessly accelerating, Steve Fitzpatrick?
What the “Best Available Science” Tells Us We’ll know that global warming is over when the seas stop rising.
The key ideas of the “best available climate-change science” ain’t complicated, Steve Fitzpatrick!
Fan
You ask a genuinely interesting question about when will sea levels stop rising.
.
Glaciers reached a low point about 4/5000 years ago when water levels were higher than today (taking into account land movements and that not all the ocean basins conform to the global ‘average’ much beloved by those who don’t want to look at the regional situation)
They were then topped up again to pre Bronze age levels by the greatest inundation of snow/ice in the Holocene, during the LIA>
So that has to all melt which will presumably;
* A) require higher temperatures than today
* B) A period of sustained warmth longer than the Bronze age period.
* C) We then have the added complication of accounting for all the water than man has brought to the surface from underground reservoirs AND all the water suspended in the atmosphere. The former seems debatable whilst the latter corresponds to around 4cm of sea level increase.
A and B hasn’t yet happened so if the current modest warm period (in terms of length and degree of warmth) continues on its current path it will be hundreds of years before the sea levels stop rising at their current modest rate. If the cool period sets in they will stop rising when the glaciers go into stasis.
Here is a helpful guide to glacier movements I developed from Hundreds of references. Closed blue line at the top equals glacier retreat.
http://wattsupwiththat.files.wordpress.com/2013/08/clip_image010.jpg
As you can see I haven’t got back to the Bronze age period yet as I had to let my team of researchers go when the large cheques from Big Oil inexplicably stopped arriving. Sea levels will eventually be graphed on top, you will remember my piece on Historic sea levels?
http://judithcurry.com/2011/07/12/historic-variations-in-sea-levels-part-1-from-the-holocene-to-romans/
Perhaps you might ask DR Hansen if he would like a copy to help him with his own calculations on sea level rise which seem somewhat exaggerated don’t you think?
tonyb
Leave it to Fan to talk to himself until he’s completely off topic. At least Web’s on topic on this thread. Fan, have you ever tried Ritalin?
Fan,
“The key ideas of the “best available climate-change science” ain’t complicated, Steve Fitzpatrick!”
.
I do enjoy your generous use of exclamation points; the use of words like ‘ain’t’ is also a mildly amusing. What is not so amusing is that you will not address the substantive points I make. So once again: The important issues are how much warming, how fast, and what the consequences will be. Those things are not well understood, and further, predictions of extreme warming rates seem, well, not to be coming true. You can (and probably will) continue to avoid these substantive issues. That is OK with me, but I then will not be spending time addressing any of your future comments. A deus.
I would like to thank fan for the opportunity to repeat this truism:
Hansen was wronger in 1988, after 7 additional years of data, study and work on his model, that he was in 1981. The only time he was even close to right was when he had his 1988 model assume no affect from CO2.
And his predictions both times sucked. Is that the right technical term?
Those are terrific priorities Steve Fitzpatrick!
It’s clear that “the best available climate-change science” (in Judith Curry’s phrase!) is that science that most accurately, directly, and verifiably answers these questions and explains its answers!
By this measure it’s plain (to everyone!) that “the best available climate-change science” is Hansen’s multi-decade, multi-disciplinary, multi-author, multi-national arc of work that began in 1981:
The real lesson of the IPCC reports is that we can plausibly exclude climate-forcings that are *OUTSIDE* of Hansen’s 1981 range of 1.4°C – 5.6°C, accepting that (for the present) forcings within this span are more-or-less equally plausible outcomes.
Conclusion Today’s best available climate-change science accords with the most recent prediction of Hansen et al that “Burning all fossil fuels, we conclude, would make much of the planet uninhabitable by humans.”
That’s pure, plain common sense, eh Steve Fitzpatrick? Because common sense and “best available science” are natural partners, eh?
Lets have a look at Hansen style ‘strong’ science from 1981.
“Fig. 6. Projections of global temperature. The diffusion coefficient beneath the ocean mixed layer is 1.2 cm2 sec’, as required for best fit of the model and observations for the period 1880 to 1978. Estimated global mean warming in earlier warm periods is indicated on the right”
Here is Figure 6 with an overlay of HADCRU3 Global.
http://i179.photobucket.com/albums/w318/DocMartyn/Hansen1981modelvsHADCRU3_zpse858bce7.jpg
If we blow up the region of interest, Hansen appears of have feet of clay
http://i179.photobucket.com/albums/w318/DocMartyn/BlowupofHansen1981_zps6665f5a0.jpg
Note that the current temperatures fall between the curve that predicts an end to the burning of coal in 2000 and a maintenance of the level of [CO2] at 1981 levels; 340 ppm.
What about Figure 7?
“Fig. 7. Comparison of projected CO2 warming to standard deviation (σ) of observed global temperature and to 2σ. The standard deviation was computed for the observed global temperatures in Fig. 3. Carbon dioxide change is from the slow-growth scenario. The effect of other trace gases is not included.”
I calculated the detrended σ from 1851-1976 HADCRU3 and have 1 and 2 σ around the 1950-1976 mean.
http://i179.photobucket.com/albums/w318/DocMartyn/MoreHansen1981andHADCRU3_zpsf2456f0f.jpg
Currently the Climate Sensitivity, according to Hansen 1981, is about 6°C, red-line
So according to Hansen, the Earth is cooler than he expected it to be if we had decarbonized the world economy between 1980-2000.
As we didn’t, his Climate Sensitivity is about 6, rather than the 2.6°C’s that people are rushing to, or even he 1.6-1.8°C it probably is.
DocMartyn,
The Hansen 1981 plot you showed is essentially showing a 3C increase for doubling of CO2 at our current emmission levels. The year 2100 marks the doubling time given we continue to add 2 ppm per year.
The synfuel curve assumes that some breakthrough exists for turning low-grade fossil fuels into high grade at a great loss in fuel efficiency. In other words, much of the fuel is wasted during the bootstrapping production. He figured out that it would happen should we go after the oil shale of the west or start converting lignite coal to liquids, etc.
Raymond Pierrehumbert, a climatologist/geophysicist has.the same misgivings in a paper he wrote in the last year.
Hard to see how you get 6C for climate sensitivity out of this.
“Hard to see how you get 6C for climate sensitivity out of this”
LOOK AT FIGURE 7.
http://i179.photobucket.com/albums/w318/DocMartyn/MoreHansen1981andHADCRU3_zpsf2456f0f.jpg
CURRENT TEMPS AT OR ABOVE CLIMATE SENSITIVITY CALCULATED BY HANSEN OF 5.3 DEGREES.
Well, I guess you have a point. The 2.8 C looks about right but the 5.6 C graph is way too shallow a slope in comparison, assuming the CO2 growth is the same in both cases.
I screwed up that interpretation. In the text, Hansen gave different ocean thermal diffusivities to each of the sensitivities. So for 1.4C he set D=0, for 2.8C he set D=1.2 cm^2/sec and for 5.6C he set D=2.2 cm^2/sec.
What this does is push the slopes closer together, as the higher diffusivities sequester more of the excess heat deeper in the ocean, where it can’t be detected as a surface temperature rise.
It is also possible that the higher sensitivity is composed of more slow feedback modes where the temperature rise won’t kick in until later.
See this Hansen paper for a further explanation:
http://arxiv.org/ftp/arxiv/papers/1211/1211.4846.pdf
Remember, this was all back in 1981 and the interpretation has not changed that much since then. He knew that much of the excess heat would sequester, but did not yet have complete certainty on the parameter values.
I have experimented with the Hansen model here:
http://theoilconundrum.blogspot.com/2013/03/ocean-heat-content-model.html
Heat diffusing from the atmosphere to the oceans? That’s gunna work.
Are you that clueless Chief? This is excess heat caused by growing atmospheric GHG concentrations. The excess heat disperses wherever it can. Some stays in the atmosphere, where it will raise the temperature until the Planck response matches. Some of the heat radiates into the ocean surface layer where it can diffuse downward.
Now watch as the Chief makes up some convoluted contrarian explanation why that can’t happen, which is the expected response of a full-throttled denier.
The flow of energy is always from Sun to surface to atmosphere and back to space again. The theoretical mechanism in a warmer atmosphere is a reduction in temperature gradient across the skin layer.
http://www.realclimate.org/index.php/archives/2006/09/why-greenhouse-gases-heat-the-ocean/
In reality ocean heat content follows net toa flux – which peaked in 1998.
Why are you such a pathetic idiot?
Chef Waterboy links to this RealClimate web page
http://www.realclimate.org/index.php/archives/2006/09/why-greenhouse-gases-heat-the-ocean/
Which is titled “Why greenhouse gases heat the ocean”. Precisely.
The GHG effect heats the ocean surface first, and the thermal energy diffuses downward. Voila!
Could not have said it better.
WebHubTelescope (@WHUT) | August 30, 2013 at 1:58 am |
“Are you that clueless Chief? This is excess heat caused by growing atmospheric GHG concentrations. The excess heat disperses wherever it can. Some stays in the atmosphere, where it will raise the temperature until the Planck response matches. Some of the heat radiates into the ocean surface layer where it can diffuse downward.”
Let’s look at how heat might diffuse from air to water. The air has to be warmer than the water otherwise any difficusion of heat goes from the water to the air not from air to water. The skin layer of the ocean is cooler than the water below it. In order for heat to diffuse from the air, which is warmer than the skin layer and thence from the skin layer to the ocean bulk below it the skin layer must be warmer than the ocean below it otherwise any heat diffusion goes from ocean bulk to skin layer.
Chief is right and you’re a moron, Pukite.
Now watch as the Chief makes up some convoluted contrarian explanation why that can’t happen, which is the expected response of a full-throttled denier.
Springer, said, “Let’s look at how heat might diffuse from air to water. The air has to be warmer than the water otherwise any difficusion of heat goes from the water to the air not from air to water. The skin layer of the ocean is cooler than the water below it. In order for heat to diffuse from the air, which is warmer than the skin layer and thence from the skin layer to the ocean bulk below it the skin layer must be warmer than the ocean below it otherwise any heat diffusion goes from ocean bulk to skin layer.”
Right, what is the average temperature difference between the SST and air at the skin layer again? Isn’t it about 0.8C?
Cap’t Dallas
I use 1C for the average difference between SST and air above it. SST being the warmer by about 1C. This results in very little conduction and what little conduction happens goes from the warmer ocean to the cooler air.
See here (and memorize it):
http://oceanworld.tamu.edu/resources/ocng_textbook/chapter05/Images/Fig5-10A.htm
This is sensible heat flux across the globe. There’s very little of it anywhere and it’s mostly negative (transfer from surface to atmosphere) with some notable exceptions over Greenland and Antarctica where the transfer is in the opposite direction and on the order of 30W/m2. But the surfaces where this happens is a small fraction of the earth’s surface. I tend to ignore it. Latent transfer is about 60% of earth surface heat budget, radiative about 30%, and the remaining 10% conductive.
The following chart of zonal averages of budget components clearly shows how insignificant is sensible heat transfer:
http://oceanworld.tamu.edu/resources/ocng_textbook/chapter05/Images/Fig5-7.htm
Look at the area enclosed by the Qs curve. It’s next to nothing compared to Ql and not very significant compared to even Qsw
That is a good suggestion.
The mental gymnastics that goes on in the face of simple intuitive IR heating is astounding. Certainly some of the heat comes back out as evaporative cooling, but a fraction does diffuse downward.
The rule of thumb is that heat disperses. The thermal diffusion coefficient of vertical eddies is on the same scale as copper. Once an infrared photon enters the surface layer, it gets absorbed. From there, it can diffuse downward with some probability. There is also a probability that it can add enough energy to vaporize a water molecule.
Springer, “See here (and memorize it):” That is kind of a waste of time, staying current on it would be better. Like that 10% appears to be outdated. with ~165 Wm-2 SW absorbed at the surface, 24 Wm-2 would be ~14%. Trenberth and company did revise it down to 17Wm-2 (~10%), but that was during the search for the missing heat. That 7Wm-2 sensible difference and 8Wm-2 latent difference are a big part of the kerfuffle. It appears a lot has changed in only 8 years.
> The rule of thumb is that heat disperses.
Applied to Climate ball, this rule might be false.
Only love and light disperses Climateballers.
Webby, you really are clueless!
Heat cannot diffuse downwards from the skin layer because the latter is cooler than the water underneath. All reducing the thermal gradient of the skin layer does is to reduce heat loss from the underlying water – which, not to put too fine a point on it, already contains the heat.
You can’t just make up your own physics.
Phatboy,
Heat does not follow force fields like an electrical charge or a mass particle under gravity. The thermal gradient observed is a result of the dispersion of heat not the driving force. As the following link shows, the incoming excess photons can modify the gradient thus “mathematically” reducing the outgoing flux.
http://www.realclimate.org/index.php/archives/2006/09/why-greenhouse-gases-heat-the-ocean/
So thermal concentration is characterized as a density and the IR photons entering the surface layer convert to a thermal energy, and can quickly penetrate to below the surface due to eddy diffusion.
The denier reasoning is bizarre and hard to quell.
Webphut, are you deliberately missing the point?
Heat cannot diffuse into the source (the zone of highest temperature), only away from it. And the surface skin is not the source of the heat.
You’re the denier – a denier of physics.
Webby
“The thermal diffusion coefficient of vertical eddies is on the same scale as copper”
Stop smoking that stuff and get yourself into rehab.
‘Thus, if the absorption of the infrared emission from atmospheric greenhouse gases reduces the gradient through the skin layer, the flow of heat from the ocean beneath will be reduced, leaving more of the heat introduced into the bulk of the upper oceanic layer by the absorption of sunlight to remain there to increase water temperature.’
I link to realclimate and he still misunderstands. But in fact ocean heat content seems to follow closely top of atmosphere net flux – and to have peaked in 1998 along with surface temperature – with a minimum for cloud cover shortly after.
e.g. http://s1114.photobucket.com/user/Chief_Hydrologist/media/Wong2006figure7.gif.html?sort=3&o=131 – http://s1114.photobucket.com/user/Chief_Hydrologist/media/cloud_palleandlaken2013_zps3c92a9fc.png.html?sort=3&o=18
Infrared radiation can heat water.
Here is another post at the layman level:
http://scienceofdoom.com/2010/10/23/does-back-radiation-heat-the-ocean-part-two/
Whebby, when the only tool you have is a hammer, every problem looks like a nail.
You might know a little about diffusion, but you sure don’t know where it applies and where it doesn’t.
Read those articles you linked to again and note carefully the direction of heat flux.
Phatboy,
Deniers like to spin nuggets of physical truth into bizarre contortions.
As I said before, thermal gradient fields are not a driving force that electric field gradients or gravitational gradients act as. A thermal gradient is a result of a concentration distribution of thermal energy (heat) caused by whatever mechanism exists. Yes, a thermal gradient will show a flow of heat from warm to cool, no one is contradicting that. But when a thermal gradient changes from being very steep to less steep, it means that heat is being redistributed. This is so obvious in intuitive terms, as the number of infrared photons is increasing at the surface, and many do diffuse downward.
And this intuition extends to the mathematical model. Try solving the heat equation: place a stimulus at the surface, add some vaporization if needed. That’s what I did. What? You can’t lift a pencil and do the math yourself? Well, ain’t that special! Here, try some remedial learning by rote:
Repeat after me —
A thermal gradient is not a force field.
Heat does not respond to force fields.
A thermal gradient is not a force field.
Heat does not respond to force fields.
A thermal gradient is not a force field.
Heat does not respond to force fields.
Repeat.
This is just so ridiculous an assertion. The fundamental equation governing the dynamical flow of heat is called the heat equation. This is an equation that describes spatio-temporal continuity and the only real physical term that is in there is the diffusivity. That looks like a pretty phat hammer, eh Phatboy?
Diffusion is the outcome of a random walk and the thermal excitation of matter can randomly walk just like a particle can randomly walk. The random walk of large amounts of matter, such as a randomly moving eddy current can actually move the heat around as well. That is why oceanographers have this thing they call eddy diffusivity, which has been around for ages. An eddy can move horizontally or vertically in a turbulent fashion, and thus randomly move the heat at the surface downward.
As I was saying, vertical eddy diffusivities can be on the order of 1 cm^2/sec. You can look it up here http://oceanworld.tamu.edu/resources/ocng_textbook/chapter08/chapter08_05.htm
(BTW this is the same link that SpringyBoy likes to use, speaking of shoving it back in the face of denialism)
What is the thermal diffusivity of copper? http://en.wikipedia.org/wiki/Thermal_diffusivity
Copper at 25°C = 1.11 × 10⁻⁴ m^2/s
Average Vertical Eddy Diffusivity = 1.3 × 10⁻⁴ m^2/s
Same dimensional units, same value.
So, about the same. Stick to medicine, Doc.
Chief Hydro once more completely erroneously said:
“But in fact ocean heat content seems to follow closely top of atmosphere net flux – and to have peaked in 1998 along with surface temperature.”
—-
Except for the fact that ocean heat content did not peak in 1998, but has continued to rise sharply during this past decade and reach record levels in 2013.
Your notions are flawed Chief, and for you to come here and suggest ocean heat content peaked in 1998 is such a gross and outright fabrication that it needs to be called out every time you try and spread this falsehood.
Webfootinmouth, FFS, Nobody is talking about force fields etc except you! For once in your life, stop trying to set up straw men and start trying to understand what others are actually saying – you just might learn something.
I’ve got much better things to do with my time than to argue with someone who’s apparently intent on misrepresenting everything I write.
Where does the short term ends and long term begins? Longer term change (warming since LIA) could also be internal variability and shorter term variability (ENSO, AMO) could be forced change.
Yes, when does weather become climate? “Well, that depends…”, seems to be the most honest, and simultaneously the most dishonest, reply.
Internal Variability – Warming from Little Ice Age,
Milankovitch cycles & Hurst-Kolmogorov dynamics
Markonis, Y., and D. Koutsoyiannis, Climatic variability over time scales spanning nine orders of magnitude: Connecting Milankovitch cycles with Hurst–Kolmogorov dynamics, Surveys in Geophysics, 34 (2), 181–207, 2013.
For the long term trend from the Little Ice Age see:
Syun-Ichi Akasofu On the recovery from the Little Ice Age
Natural Science Vol.2, No.11, 1211-1224 (2010) doi:10.4236/ns.2010.211149 Copyright © 2010 SciRes. Openly accessible at http://www.scirp.org/journal/NS/
Edim
Thus “Short term” is less than one month and long term more than 500 million years.
Thanks David.
On first glance, the poster has his definitions bass-ackwards. A negative feedback system has a damped response to an external forcing. That is the first figure. In contrast, a positive feedback system hits the “rails” in its response to an external forcing. That is the second figure. He has the classical descriptions reversed.
I don’t know what discipline that X Anonymous comes from but he can’t be a controls engineer.
X-man also sayeth:
In signal processing circles and engineering in general, there is a specific lingo that is used when talking about separating signal from noise.
The words “pause” or “hiatus” are rarely, if ever, used when describing an oscillating component that temporarily obscures a rising trend. The signal analyst would usually say that the rising signal is either “masked” by the oscillating component or that the the signal is being “compensated” by a signal that has the opposite sign.
The climate scientists really need to assert their theories of isolating and removing the noise from the masked signal or of describing the situation instead as a compensating effect.
To say that it is a “pause” or “hiatus” is kind of odd when they obviously have a theory to explain it.
Here is an example. Say that you had a radio signal that you were listening to. Periodically, the signal fades out and some other garbled static comes out of the speaker. One does not call that a “pause” or “hiatus” in the signal, but that the real signal is being “masked” or “compensated” or “interfered” with by another signal or by environmental effects.
The enduring truth is that over time, since the AGW temperature signal is a secular rising trend, eventually the signal will emerge from the noise, and it will be harder to argue with the rhetorical wording alone. Time will tell.
One way to pull the signal out is to integrate the data, which cancels out the oscillatory compensation. Already, the OHC signal is doing this and we can see unmasked global heating effect more clearly.
A statement of religious belief, embedded in a bunch of scientific lingo. Still, it might be correct.
My overriding point is that it is hard to argue over anything if the definitions are constantly mutating.
Hard to believe that this is a science blog, when the owner digs out an incoming mail, and without any kind of proof-reading, posts it as is.
In my almost ten years of blogging, I have regretted posts that I have made without a full vetting.
But then again, posting stuff without vetting certainly adds to the FUD, and if that is your objective, it is probably a good plan.
Like I said, this isn’t really a science blog, it is no more than a gossipy twitter feed. I’ll save the good stuff for myself.
It’s actually more of a “tower of Babel”. As such, it reflects the state of modern science, where the jargon of different fields has diverged to the extent that people from different disciplines have trouble understanding one another.
Fossil fuel consumption by human industry is noise on a geologic timescale. Hoist by your own signal-to-noise petard. Heh.
SpringyBoy, Find me a petroleum engineering textbook that even discusses geological limits on a world-wide scale.
Cripes, it takes IEEE Spectrum, which is the trade magazine for electrical engineers to feature an article titled “How much recoverable oil do we have?” . This is in the latest issue
http://spectrum.IEEE.org
Ha ha ha, the deniers love to deny the reality and choose to concentrate on the rhetoric.
Our best estimate is a P10(low) – P90(high) range of 1800 – 4400 billion bbl with a mean of 2900 billion bbl. [for conventional oil] Because of some conservative assumptions in our analysis, we believe the uncertainty is actually greater than indicated above, and the additional uncertainty is in the upside, resulting in larger P90 and mean values.
SPE Economics & Management
Vol 3, Num 2, April 2011, pp. 79-92, SPE-130196-PA
Quantifying the Uncertainty in Estimates of Ultimately Recoverable World Conventional Oil Resources
Chih-Ming Tien, Texas A&M University
Duane McVay, Texas A&M University
Recoverable Unconventional Oil Resources are 3 to 8 times each of those estimates.
Thanks Stephen. Some unconventional sources.
http://www.eia.gov/analysis/studies/worldshalegas/
@ChiefH
That eia report shows shale oil going from 32 billion to 347 billion in just two years. It is going to grow a lot more before the decade is out! From what I’ve seen this year, we might have 347 just identified in the US. Pioneer Natural Resources expects 100 bbl eventually just from the Permian Basin. If California ever gets serious about allowing fracking in the Monterrey Shale, it might add another 200-600 billion bbls.
The worldwide potential of shale oil and enhanced recovery must be in the several thousand billion barrels over then next half century. Those will compete with the thousand billion bbls we know about at Athabasca and Orinoco.
We have 6600 TCF of proven conventional gas reserves.
We have at least as much estimated in prospective shale gas reserves.
And the USGS has an estimate (certainly conservative) of 33000 TCF in potential methane clathrates (which I don’t think I’ll ever see touched in my life time).
And lets not forget a potential 3000 billion tons of coal (EIA).
They give a mean URR of 2.9 trillion which is above the value of Jean Laherrere’s 2.2 trillion barrels for crude oil only. http://www.theoildrum.com/node/10009
The problem with high end estimates is that the majority of the discoveries have already been made and the estimates of how much reserve resides in these past discoveries is well known. There won’t be many surprises in other words.
What is left is the remaining discoveries and these can be estimated by extrapolating the cumulative discovery curve to an asymptotic value. The path to the asymptotic value is defined by a maximum entropy estimator.
This gives 2.2 trillion barrels.
http://img35.imageshack.us/img35/9232/0dbx.gif
Adding another 0.7 trillion barrels is not likely, unless they use different definitions of what constitutes crude oil, or start to open up very remote locations on the earth. We will watch what transpires.
WHT:
The problem with high end estimates is that the majority of the discoveries have already been made and the estimates of how much reserve resides in these past discoveries is well known. There won’t be many surprises in other words.
You couldn’t be more wrong. High end estimates come from real world uncertainty of estimated parameters. The High end is possible… unlikely, a 1 in 10 chance, but possible. But there is also a built in conservancy — you only estimate what you can see and estimate what you think you can get out with known technology and prices. The known Oil In Place is much higher than the high estimate, but we assume we cannot get it.
The Eagle Ford shale has been known for 100 years, but about 2006 no one knew how to make big money with it.
But big surprises happen. The entire industry was surprised by how well shale in over 30 plays has given up oil and gas to new techniques. Since 2008, the high estimates of recoverable oil from old fields have exploded by 100’s of billions of bbls. Even so, it assumes that only 3 or 4% of the oil in place can be extracted from the shale.
What if you could get another 2%? Suprise! Up go the high estimates again.
Twenty years from now hypothetically there might be a “bio-crack-frac” that will inject anaerobic bacteria and nutrients to crack some heavy organics oil-in-place into lighter movable hydrocarbons. Presto, another 1 to 5% of known oil-in-place becomes a trillion of bbls of new reserves.
“Oil is found in the minds of men.”
Don’t bet against the human mind.
Rasey, We are modeling what is available in terms of conventional crude. It is representative of reality because the price of oil is staying high while the consumption has been in a declining state amongst the OECD countries since the conventional crude oil started plateauing in 2005:
http://www.theoildrum.com/files/StuartFig5.jpg
This makes sense because this is also the point where the cumulative production hit the halfway point of the 2.2 trillion URR. When scarcity is detected prices increase and consumers can vote with their feet.
In parallel with this, all the other non-conventional liquid fuels are coming on-line to compensate for the needs of still-growing economies such as China.
All this is important to model from a GHG perspective since it is good to know where future carbon emissions are going to come from.
A typical Eagle Ford well profile that we are looking at:
http://imageshack.us/photo/my-images/163/i4m.gif/
Not too impressive for sustained flow. The point is that many of these new areas are scraping the bottom of the barrel to get anything than better than marginal returns. Sure, people can still make money, but the Red Queen will rule when they deplete this fast.
As usual Pukite fails to grasp the point i.e. human consumption of fossil fuel is noise on a geologic timescale.
Let me explain slowly with small words.
Humans have been consuming fossil fuels for a century or two. There’s enough left for perhaps a century or two more. That would make the fossil fuel era 400 years in length. That’s an eyeblink on geologic timescales. Less than an eyeblink. In a million years it will be like it never happened.
WHT, the issue was about high end estimates and the potential for surprises. In the past decade, there have been many surprises and high end estimates have gone up. Whether you accept that is not my problem.
To all others:
SPE 158207
Eagle Ford Shale – An Early Look at Ultimate Recovery
Gary S. Swindell, SPE
http://gswindell.com/sp158207.pdf
“The results show that for the 10 county trend, the average and median EUR per well were 206,779 barrels of oil equivalent
(BOE) and 160,519 BOE, respectively. Of the counties with more than 50 wells, the best are DeWitt (403,715 BOE) and
Karnes (210,801 BOE). Live Oak, with only 28 wells averages 248,818 BOE.” [Note the part about the problems with the production data he had. – comingled by lease.]
“The industry literature is full of articles about the Eagle Ford shale in South Texas, and for good reason as it is among the
most active plays in the US. Some of these mention estimates of per well ultimate recovery, often in barrels-of-oil-equivalent
(rarely stating what was used to convert gas to oil equivalent), but nearly all the quoted figures, which range up to [not mean] 850,000
BOE or 8.5 billion cubic feet, are from companies active in the trend. That certainly does not disqualify the figures given,
and in fact, these companies possess data not publically available.”
I point out this paper because of the wealth of cross plots available.
Remember: all shale plays are different. YMMV.
Rasey,
I just had a top-level post on The Oil Drum today, which describes the production statistics of Bakken formation wells
http://www.theoildrum.com/node/10221
The Eagle Ford wells do not appear that much different in single well production profile..
Go over to the Oil Drum if you want to get beat up for the cornucopian ideas that it sounds like you hold..
WHT, Congrats. You might have the, third to last(?)
The Oil Drum is shutting down after Aug. 31, 2013
They’re saying AGW is paused because the other choice of words is to say it has stopped. It isn’t happening at present. Choose between calling it a temporary or permanent respite but you can’t ignore the fact that GAT has not risen in some 15 years which is unreasonably long for noise and must now be reasonably considered as signal and a cause for the unexpected signal determined. Zealots aren’t reasonable and both camps have an unhealthy number of them. The formal science camp is supposed to be largely immune to zealots within it if they faithfully follow the scientific method. In experimental sciences this is usually the case but in certain sciences, evolutionary biology and climate science are the ugliest examples, there is no practical way of performing experiments so it tends to become what we affectionately called a huge clusterphuck in my beloved Marine Corps. A tangled web of first principles, isolated experiments, and observation tied together by just-so stories. Anybody can make a up a just-so story and both sides make them up aplenty. Narrative explanations are legion and it’s just a huge mess now where whatever science was there at one time is now hopelessly entangled with ideologies and politics.
Lenski at MSU has been doing real time evolution expirements.
http://myxo.css.msu.edu/ecoli/
http://en.wikipedia.org/wiki/Escherichia_coli_long-term_evolution_experiment
The problem is that it could be an inflection instead of a pause.
I wrote several articles about Lenski perhaps 4-5 years ago. I’m quite familiar with his work. It’s adaptation not evolution. Ring me up when one of his bacteria “evolve” a nucleus.
Me (fer instance) in 2008:
http://www.uncommondescent.com/intelligent-design/first-paragraph-of-lenski-paper-contains-an-error/
http://www.uncommondescent.com/intelligent-design/new-scientist-the-first-time-evolution-has-been-caught-in-the-act/
Citrate metabolism is common enough in prokaryotes. It’s already in the gene pool and bacteria do a lot of horse trading with useful genes via plasmids. Surely this is not news to you. Neither should the following. In critters with very high rates of reproduction and very small genomes, and especially prokaryotes with DNA replication error rates of 1 SPM per 10^8 replications. Eukaryotes of course have more advanced DNA repair mechanisms and through those lower their SPM rate to one per 10^9 replications.
At any rate something like Lenski’s e.coli can ‘test’ every possible SPM many times over in a single petri dish from innoculation to colonization. If any of the SPMs are advantageous, or even neutral, it may be retained. Usually however SPMs are disadvantageous. Disastrously so. So the vast majority of those 1-in-10^8 mutations simply dies because of it. But that’s affordable and in the big picture the juice is worth the squeeze because a great many genes are just one SPM-away from performing a modified function that was valuable in the past. So the genome is constantly experimenting with itself looking for better fits to an environment which may have changed.
The problem comes about when two or more SPMs are required. Every possible combination of two SPMs takes 10^16 replications to explore. If one SPM alone is neutral or advantageous it may be retained but if it isn’t then there’s practically no chance of it being retained. This drastically limits the exploration rate of multiple point mutations and the ones that do happen are usually ones that were found in the distant past so they’re easy to find again.
Now imagine the number of neutral or beneficial SPMs that must somehow happen to go from prokaryote to eukaryote. The numbers simply don’t add up. The earth is not infinite in time or space. There are a finite number of years and a finite number of replication events that could have happened on this third rock from the sun and it just isn’t anywhere near enough to have random DNA copy errors filtered by natural selection to have produced the sequence of change we see going from ancient prokaryotes (my favorite of course being the ubiquitous blue-green algae which evolution hasn’t improved upon in billions of years) to modern multi-cellular eukaryotes such as ourselves.
For something far more interesting than Lenski’s e.coli I suggest you take a look at p.falciparum for one because it’s a eukaryote and two because, other than humans, it is the most studied organism on the planet. Morever it has been subjected to extreme artificial selection pressures by various anti-malarial drugs and its response to said drugs are highly illuminating in regard to the extent to which evolution can produce useful genomic novelty. Some anti-malarial drugs require only a single SPM for resistance. In about 50% of malaria victims a resistant strain emerges because the number of parasite in a single victim allows for exploration of every possible SPM. Drugs which require two SPMs for resistance take about 10 years for p.falciparum to find. That’s hundreds of millions of individual human victims. Evidently the human sickle cell mutation requires more than two SPMs to overcome because p.falciparum hasn’t found a way to resist it in a million years of trying.
If you haven’t read Mike Behe’s book “The Edge of Evolution: The Search for the Limits of Darwinism” then you need to because his focus is on real world performance of Darwinian evolution using hard numbers and real results under an onslaught of artificial selection pressures mostly with P.falciparum but also with the HIV virus. Lenski’s little lab is many orders of magnitude less extensive than the evolutionary battle between and p.falciparum. Study it. Then get back to me when you’ve caught up.
P.S. Doc
I checked the wikipedia article on Lenski you pointed me at just to make sure nothing remarkable happened between 2008 and now that I wasn’t aware of. Nothing did. The most remarkable adapation he observed remains the aerobic citrate metabolism which is what was making headlines in 2008 so nothing has changed and so I’m still up-to-date on his results.
Mike Behe has been diligent in responding to Lenski over the last 5 years but I haven’t been following that discussion. You can find them by googling lenski site:uncommondescent.com
The reason I got out of the ID debate is because there’s very little chance of science or theology finding any definitive answers in my lifetime so while it was a wonderful learning experience for me it will never end. The neo-Darwinian narrative bandwagon will roll on and over my grave. The climate change narrative bandwagon, which I was peripherally involved with since around the year 2000 after I retired and could spend 24/7 reading whatever caught my interest, is different. Climate evolves faster than species and I figured there was a very good chance winners and losers in the debate would definitively emerge within my lifetime. So here I am and I appear to be on the winning side of it with each and every day “the pause” goes on making it more apparent who was right and who was wrong.
It could be an inflection point, saddle point, or local extremum.
Say one has a linear trend plus an oscillating component. This is expressed by the following time series:
f(t) = k*t + A*sin(w*t+phase) + C
When the first derivative goes to zero this creates an instantaneous plateau:
df/dt = k + A*w cos(w*t+phase) = 0
w*t+phase = arccos(-k/(A*w))
There is always a narrow time span where the plateau is apparent, as long as abs(k/(A*w)) < 1
So the linear trend can't be too steep, or the oscillating component can't have too slow a frequency or too small an amplitude.
That is the math behind a plateau. That could be what is happening.
Monsters, monsters, come and go;
Reign again and play some mo.
=================
Hi Web, I’m glad to see you are taken up by the Spirit of Climate Science. Might, may, could, should … and it could just be going on a three hundred year down-trend from which CO2 can’t save us. Just sayin’. Not that I won’t appreciated the 0.5 C per century warming that might help us a bit.
jim2 said:
Well you misinterpreted that badly. You said inflection point. An inflection point has a strict mathematical definition which is different than a saddle point or local extremum.
I was being charitable to you, because it could be any one of those things.
No wonder guys like you want global warming. You are in the oil business and you evidently read the last paragraph of your petroleum textbook where it suggested that we will go into an ice age unless we burned oil as fast as we can.
You seem to have jumped to your knee-jerk conclusions “On first glance, …blah…blah…blah”. This is a blog. And it ain’t your blog. If you do not like your gracious hostess…
On second glance, it looks as if the poster does have it bass-backwards.
This is a good review article in Physics Reports by A.Jenkins from last year.
http://arxiv.org/pdf/1109.6640.pdf
Negative feedback leads to damping in oscillations. Positive feedback leads to overshoot and then to limit cycles as the constraining rails are reached.
At the end of the article, Jenkins takes a shot at cranks who often insist that self-oscillation is a source of perpetual energy, not realizing that a forcing stimulus is always needed.
Thanks webby. nice link
“Jenkins takes a shot at cranks who often insist that self-oscillation is a source of perpetual energy, not realizing that a forcing stimulus is always needed.”
____
As indeed he should. Internal variabillity is not a source of energy to the system, but only modulates how it is moved around in the system. Actual energy increases (or decreases) to the system can only be caused by an external forcing to the system, such as changes in solar, volcanoes, changes to GH gas concentrations, etc.
WebHub would be interested to hear what you conceive as constraining rails that keep the positive feedback from leading to linear instability.
RGates
where did the (obviously silly!!) phrase ‘Human carbon volcano’ you like to use originally come from as I have just come across it in a mention from some years ago?
tonyb
tonyb
Hey webby, on second glance your gratuitous and petulant whining about how Judith runs her blog, still looks dumb and childish. I’m guessing that you are free to use your precious blog haunting time on a venue more suited to your temperament and inclinations. You may not have known that. Try realclimate. It’s apparently run by real government approved and funded climate scientists. Or how about that SKS joint? It even has science in the name of the blog. Those nimrods could use your help. You are almost as tiresome and humorless as joshie.
Tony,
I’ve got no idea where it might have originally came from. I honestly thought I made it up, but it is possible I came across it somewhere, or that several of us independently thought it up– it’s really that that unique.
Despite the fact that it does seem to upset certain people, Human Carbon Volcano perfectly describes the 24 hour a day, 7 days a week emission of carbon into the atmosphere that humans have been undertaking on an increasingly larger scale now for many centuries.
Last sentence in first paragraph should have read, “It’s really not that unique…”
Don,
Yes, I will kick my third blog called http://ContextEarth.com into high gear starting in September.
This is timed to the demise of The Oil Drum and will feature both climate, energy, and environmental.modeling topics.
Finally going to WordPress like this blog but will allow commenters to post images and all that good stuff that fosters good scientific discussion.
Thanks for the prodding.
We should expect climate trivia. Lapse rates that are derived incorrectly and of course bear no resemblance to real world environmental lapse rates, a laughably simplistic 2 compartment carbon ‘model’, ‘effective’ heat diffusion from the atmosphere to the oceans, one line of algebra to solve climate, etc.
webby misses the big picture entirely and gets the little things wrong. Bizarre blog science. I wouldn’t waste another moment on it.
Oh no, webby! We were not aware of the imminent demise of the oildrum (whatever that is). We will be interested to see if you have any better luck with the new venture. But not interested enough to look in.
I also drew the analogy to volcanoes in paleoclimate here a few months ago. Both release large amounts of previously sequestered CO2 into the atmosphere and led to measurable temperature increases. The term unifies related climate change mechanisms. It has all been seen before.
It’s all been seen before as through a glass darkly, reflected from the shadows on the wall of the cave.
==============
It will have all sorts of environmental models. From terrain models useful for vehicle simulations to sea-state models for estimating likelihood of wave height. It is all hosted within a triple-store database and served through a semantic web architecture.
The blog will describe various aspects of the model server.
Terrain is captured by various methodologies. In general it varies with relief, substrate and rainfall.
Here -http://vterrain.org/
Wave heights are a function of reach, wind speed and random wave interference. Wave heights can be recorded and projected over longer recurrence periods using statistical methods. There is no way of predicting wave heights at any point from first principles. Waves are projected across local bathymetry using St Venant’s equations.
e.g. http://en.wikipedia.org/wiki/Shallow_water_equations
All of your approaches use existing data and fit a curve to it. When it is not assuming a curve for a future that can’t be tested. It all makes very little sense at all.
So, Chief, is a rogue wave a Black Dragon or a Swan King, or perhaps a Hippo Gryph.
====================
Finally, a riddle I can answer. A rogue wave is a brigand in a hoveround.
Argh, a Girl of the Golden Waste.
=====================
kim @11.43, in the absence of a ? , I thought you were describing the Chief.
Steven’s reply made me think of rogue wabes:
“‘Twas brillig, and the slithy toves
Did gyre and gimble in the wabe;
All mimsy were the borogoves,
And the mome raths outgrabe.”
Such wabes probably occur with deep ocean woscillations, but whether in El Nino or La Nina, even Faustino cannot say.
‘Rogue waves, also called freak waves, begin with a deep trough followed by a wall of water reaching 25-30 meter high. They occur in deep water where a number of physical factors such as strong winds and fast currents converge, in the presence of different mechanisms that include interference effects and non-linear interactions and modulation resonance. We refer to Heller (2005) and in particular to Akhmediev and Pelinovsky (2010). This special volume reviews the evidence and possible mechanisms for rogue waves occurring in oceans, plasmas, nonlinear optical systems, and Bose-Einstein condensates. These studies suggest that rogue waves are indeed outliers compared with the rest of the fluctuations and result from specific initial conditions and/or particular amplifying mechanisms. Rogues waves are thus candidate dragon kings.’
http://arxiv.org/ftp/arxiv/papers/1205/1205.1002.pdf
So there we are – Bose-Einstein resonance modulation.
Well, F, I question why I oftentimes fail to mark the question. Perhaps it’s a remnant of questioning lucia rhetorically.
====================
Here’s a good one for you, Chief; I knew they were dragon kings, from what you’ve taught me.
=============
Dragon kings stomp black swans. Why do we never learn?
‘After the hippogryph has won such height,
That he is lessened to a point, he bends
His course for where the sun, with sinking light,
When he goes round the heavenly crab, descends;
And shoots through air, like well-greased bark and light,
Which through the sea a wind propitious sends.
Him leave we on his way, who well shall speed,
And turn we to Rinaldo in his need.’
http://omacl.org/Orlando/3-4canto.html
Chief:
“Rogues waves are thus candidate dragon kings..”
You mean they indicate a local regime change?
Wow, little Chief is going insane trying to keep up with the fact that MNFTIU.
He has got his fellow Aussie larrikins freaking out as well.
A significant point is that the semantic web server is a general architecture which I worked on with some folks at JPL, incorporating their earth and environmental ontology called SWEET. This is used to organize a knowledgebase which is then hooked dynamically into web-served models. Because many data sets follow stochastic laws, the models can reduce huge amounts of data into concise formuations.
So if you got some more ideas that I can add to the knowledgebase, keep then coming.
Ontologies in the IT sense are about organising metadata about data. ‘In theory, an ontology is a “formal, explicit specification of a shared conceptualisation”.[1] An ontology provides a shared vocabulary, which can be used to model a domain, that is, the type of objects and/or concepts that exist, and their properties and relations.[2]’ Wikipedia
In practice – there is the barest progress towards agreement on a specification let alone the co-operation across thousands of provinces that might make a reality of a semantic web server.
e.g. An example of a specification – http://sweet.jpl.nasa.gov/
In webby’s case it is may be more metadata about metacrap.
‘In the essay, Doctorow illustrates problems in relying on metadata for knowledge representation in online records or files by drawing humorous parallels to real-world systems, as well as showing examples of metadata collapse in online, web-based systems. The fragility of metadata is an important concern because much planning for improving the web (such as the semantic web) is predicated upon certain flavors of metadata becoming widely adopted and used with care—something which, according to Doctorow’s essay, will not and cannot happen.
Doctorow’s seven purportedly insurmountable obstacles to reliable metadata are:
People lie
People are lazy
People are stupid
Mission Impossible: know thyself
Schemas are not neutral
Metrics influence results
There’s more than one way to describe something
Other reasons that result in metadata becoming obsolete (crap) are:
Data may become irrelevant in time
Data may not be updated with new insights
This means search results can return outdated and incorrect data.’ Wikipedia
‘Metadata is “data about data” — information like keywords, page-length, title, word-count, abstract, location, SKU, ISBN, and so on. Explicit, human-generated metadata has enjoyed recent trendiness, especially in the world of XML. A typical scenario goes like this: a number of suppliers get together and agree on a metadata standard — a Document Type Definition or scheme — for a given subject area, say washing machines. They agree to a common vocabulary for describing washing machines: size, capacity, energy consumption, water consumption, price. They create machine-readable databases of their inventory, which are available in whole or part to search agents and other databases, so that a consumer can enter the parameters of the washing machine he’s seeking and query multiple sites simultaneously for an exhaustive list of the available washing machines that meet his criteria.
If everyone would subscribe to such a system and create good metadata for the purposes of describing their goods, services and information, it would be a trivial matter to search the Internet for highly qualified, context-sensitive results: a fan could find all the downloadable music in a given genre, a manufacturer could efficiently discover suppliers, travelers could easily choose a hotel room for an upcoming trip.
A world of exhaustive, reliable metadata would be a utopia. It’s also a pipe-dream, founded on self-delusion, nerd hubris and hysterically inflated market opportunities.’ http://www.well.com/~doctorow/metacrap.htm
Sounds like it was written for webby. Webby’s ‘modelling’ is still curve fitting in the worst possible way. Scientific knowledge can be systemised in textbooks and course curriculum. It can evolve best in the traditional context of publication. It relies on the individual human mind to make sense and build the big picture. This cannot be automated and packaged like washing machines.
Little Chef Waterboy doesn’t understand how to use first-order logic to create rules which can extract information from the triple-store graph database. A knowledgebase is a database combined with a rulebase. Very cool. The open source is all on GitHub, and easily hosted on a cloud server (Amazon).
Little Chef knows BS when he sees it. First order logic. Is that like ordering mains before desert?
A knowledge base involves having some to start with.
And you have some sort of open source software development project somewhere in GitHub – you say? But all you have to show for it is another loser blog with a couple of poorly written pdf’s and a link to your delusional peak oil obsession?
Very tedious, very boring and and very stupid.
It looks like Chief missed this link to the modeling server:
http://contextearth.com/entroplet-dcs-server/
This runs from an Amazon cloud site.
All of your approaches use existing data and fit a curve to it. When it is not assuming a curve for a future that can’t be tested. It all makes very little sense at all.
It is all trivia.
Are you dyslexic, Pukite? The opening illustration of positive feedback in the OP is quite correct. A sine wave with small peak-to-peak magnitude is labeled “forcing” and a much larger peak-to-peak sine wave overlayed in phase is labeled “response”. That is a perfect simple illustration of positive feeback. Swap the labels and it becomes a simple illustration of negative feedback. I think you must have swapped labels in your mind which is diagnostic of dyslexia.
In many non-linear systems, the “oscillation” is a natural aspect of the system.
[youtube http://www.youtube.com/watch?v=ReCt2AcydCg?feature=player_detailpage&w=640&h=360%5D
They don’t even have to be cyclical.
Newest from Lindzen:
http://www.jpands.org/vol18no3/lindzen.pdf
christ the man cannot read the current literature
“Almost all observational
approaches to this question have led to sensitivities less than
about 1°C.”
Wrong.
I stopped paying much attention to Lindzen after I studied his 1997 PNAS piece.
Damn right it is wrong.
The answer for climate sensitivity is …. wait for it… γ in the linked diagram.
http://s1114.photobucket.com/user/Chief_Hydrologist/media/Ghil_fig11_zpse58189d9.png.html?sort=3&o=0
http://www.atmos.ucla.edu/tcd/PREPRINTS/Math_clim-Taipei-M_Ghil_vf.pdf
Now we need 1000′s of times more computing power to find out what the question is.
You seem to be about a decade behind the leading edge Mosh.
Need lots of computing oomph?
http://www.kickstarter.com/projects/adapteva/parallella-a-supercomputer-for-everyone?ref=category
you realize that your post isnt even related to mine.
Mosh – you were saying that sensitivity of whatever was wrong. I agreed – sensitivity is gamma.
Lindzen has lost it. Figure 6 he compares daily temperature changes in boston with global average temperature changes over years. He isn’t joking either, he actually thinks that comparison makes a point.
You have lost it. He compares temperatures observed in Boston (actual, normal and record) with the global temperature anomaly (thickness of red line). The point is relativity, accuracy and alarmism (dizzy heights).
Edim, you have to first understand why Lindzen’s Boston comparison makes no sense.
Take the little ice age for example. Skeptics wail that we might return to the cold climate of the little ice age. How will we feed ourselves they ask? This sounds to me like..dare I say..alarmism.
So lets use Lindzen’s Boston trick to dismiss this alarmism. In England the depths of the little ice age was about 2C cooler than present. So plot that against Boston daily temperatures. The 16C difference in normal low and normal high dwarfs the 2C little ice age difference.
By Lindzen’s argument then a return to little ice age conditions would be unnoticeable. In fact global temperature could drop into another glacial (5-6C) and it would still have less impact than the daily temperature swing in Boston.
lolwot, I agree about that.
Richard S. Lindzen (Program in Atmospheres, Oceans, and Climate Massachusetts Institute of Technology Seminar at the House of Commons Committee Rooms Westminster, London), 22nd February 2012:
‘Global Warming’ refers to an obscure statistical quantity, globally averaged temperature anomaly, the small residue of far larger and mostly uncorrelated local anomalies. This quantity is highly uncertain, but may be on the order of 0.7C over the past 150 years. This quantity is always varying at this level and there have been periods of both warming and cooling on virtually all time scales. On the time scale of from 1 year to 100 years, there is no need for any externally specified forcing. The climate system is never in equilibrium because, among other things, the ocean transports heat between the surface and the depths. To be sure, however, there are other sources of internal variability as well.
Because the quantity we are speaking of is so small, and the error bars are so large, the quantity is easy to abuse in a variety of ways.
Judith
The notion of publishing anonymously is intriguing. Here is a link to a journal in a non related field that says anonymity of science papers should not be permitted.
http://publicationethics.org/case/can-scientific-paper-be-published-anonymously
Now, this submission under discussion here today is not a science paper as such that is intended for publication in a peer reviewed journal, so the criteria would surely be lower for anonymity on a blog such as this.
I found it interesting to read the information without the preconceptions that seeing a familiar name might bring, whether that is to immediately assume I will agree with the piece or that my immediate instinct might be that the name or organisation used on the byline might make me sceptical of the contents.
Hopefully I can overcome any initial prejudice I have if the content matter is compelling, however I do like the notion of coming to a paper without preconceptions.
I know of a number of bona fide scientists at the UK Met office and the UK Environment Agency who are sceptical of the official line on climate change, which is often driven by the imposition of the requirements of the Kyoto protocol or the diktats of the UK govt who appoint placemen to senior positions to promulgate the status quo. In this regard look no further than Lord Smith of the EA or Napier, Chief Executive of the Met Office board who has held more green and ideologically driven jobs than I have had hot dinners-such as Chief Exec of the WWF in the UK.
Might offering and promoting guaranteed anonymity encourage those fearful for their jobs to come out of the woodwork and submit interesting and relevant papers on CE?
Tonyb
I rather agree. I have stuck my head over the parapit with several posts on thios blog. I freely admit that I am not a climate scientist and in biography that JC requested I explained that I was a biomedical engineer (with EE background) and, even worse, a physician. I only commented on signal processing issues, which I know something about – I don’t know my ENSO from Arctic ICE.
However, I got well and truly hammered but at least I was up-front with what I do know and what I don’t!
TonyB
Judith may decide to respond to your comment separately, but let me add my two-cents worth.
Agree than an “anonymous” author to any paper or essay raises an initial feeling of mistrust (what’s the guy hiding?).
But the “climate change” field has become a politically driven multi-billion dollar (or pound) big business.
And IPCC has imposed a strict “consensus” process, whereby dissenting opinions (or data) are rejected, ignored and/or strongly denounced, in order to protect this business.
As I understand the situation today, climate scientists, who want to get continued funding have to be careful that they do not stray too far from the “consensus” party line (unless they have already worked themselves to the “top of the heap” like our hostess, and are more immune from political pressures).
So if the author is a scientist in a climate-related field, he/she may be hiding behind anonymity for protection from reprisals from the “powers that be”.
A second point. It is very difficult to subject an anonymous author to an “ad hominem” attack (an approach frequently used by supporters of the “consensus” against dissenters)..
Just my thoughts, tony.
Max
“anonymity of science papers should not be permitted”
Why do we call it Students T-Test and not William Gosset’s T-Test?
When, at a time when I had been seriously ill for 18 months but still worked as much as I could, the head of my department (Queensland Treasury) made two professionally damaging and totally false statements about me, my natural reaction was to respond with a polite rebuttal. I was warned by my superior officers, by Treasury HR and by an external counselling service that if I did so I would be destroyed by the “vicious” response, my health would be seriously damaged to an extent from which I might not recover. I learned of others in similar circumstances, seeking to do a good job for the public benefit but in doing so not playing the self-serving insider game for the benefit of the senior bureaucrats rather than the public, who had been driven to suicide. It was clear from many indications that “putting my head above the parapet” would lead to dirty tricks and character assassination.
Therefore when, after several years of serious illness and having retired as QT would not co-operate in assisting a return to work (refusing to accept the recommendations of their own medical specialists), I felt able to resume public debate, including criticising the Qld govt, I was prepared to do so only anonymously. I adopted the name “Faustino,” which only my brother in England would be able to connect to me.
I don’t know why X chose anonymity, but I can understand that he/she might have good and sufficient reasons. So just treat the head-post on its merits.
My online posts led to me being approached (via the blog-owner) by a former Commonwealth Treasury Deputy Secretary (Economics) and well-known economic commentator, to assist him with a paper on Queensland Govt economic policy and to write a separate critique of QG policy, both to be published by a significant body with a high public profile. With that support, I was happy to drop anonymity.
If X Anon or other anonymous poster feels able to “out” themselves, no doubt they will do so. Just don’t demand it.
(Apologies for repeating a tale I told long ago, but it’s pertinent to this case.)
… published in a nutjob journal.
Ouch. Lindzen won’t recruit too many bright young scientists publishing *THERE*, eh Edim?
… the reference being to the latest Lindzen/Watts/WUWT scientific train-wreck.
Ok, Fanny. Let’s see some of your research. Not Hanson’s, yours.
LOL … Team Hansen keeps beating me to it!
James Hansen’s oft-demonstrated talent for recruiting top-rank multi-national multi-disciplinary scientific collaborators is comparably impressive to Hansen’s top-rank record of predictive climate-change science, eh Harold?
1. Hansen’s predictive record is GREAT qualitatively.
He predicted more warming – it continued to warm for many years.
Duh!
2. Hansen’s predictive record is DISMAL quantitatively.
Back in 1988 he predicted 0.32C per decade warming with continued GHG emissions.
He predicted 0.16C “pipeline” warming, even if all GHG emissions were stopped.
(Despite unabated GHG emissions, it warmed by 0.15C per decade).
Ouch!
Max
And Hansen’s predictive record is pretty GREAT quantitatively too!
Gosh, doesn’t Hansen’s now-32-year-old prediction match today’s IPCC consensus with remarkable quantitative accuracy?
Conclusion Judged solely by the objective performance metric of “demonstrated long-term prediction accuracy”, James Hansen’s body of research qualifies by a wide margin as (what Judith Curry calls) “the best available climate-change science.”
That’s plainly evident, eh manacker?
Fan
The article you cited seems logical and rational.
Yet rather than commenting to the article, you simply refer to the publishing journal as a “nutjob journal”.
Should we read the contents of your comments or simply write you off as a “nutjob blogger”?
Max
Very few people (scientist or otherwise) trouble to cherry-pick single-author climate-change articles that are published in ideology-driven “fringe” journals.
Why do you think that is, manacker?
“The Journal of American Physicians and Surgeons (JPandS), until 2003 named the Medical Sentinel,[30][43] is the journal of the association. Its mission statement includes “… a commitment to publishing scholarly articles in defense of the practice of private medicine, the pursuit of integrity in medical research … Political correctness, dogmatism and orthodoxy will be challenged with logical reasoning, valid data and the scientific method.” The publication policy of the journal states that articles are subject to a double-blind peer-review process.[44]”
Sounds good to me. Better than a non-notjub journal, taken over by incompetents.
X Anonymous: I’m sure you’re aware of Driscoll et al (2012):
http://onlinelibrary.wiley.com/doi/10.1029/2012JD017607/abstract
They found, along with others, that climate model responses to volcanic eruptions were fatally flawed.
And I’m sure you’re aware of Stephens et al (2010):
http://www.aos.wisc.edu/~tristan/publications/2010_stephens_dreary_jgr.pdf
The title of Stephens et al (2010) “Dreary State of Precipitation in Climate Models” says it all.
You must also be aware of Ruiz-Barradas et al (2013) and the flaws they found in how models simulate the Atlantic Multidecadal Oscillation:
http://www.atmos.umd.edu/~nigam/Ruiz-Barradas.AMO.Climate.Dynamics.2013.pdf
And of course, climate models can’t simulate ENSO. In looking at Guilyardi et al (2009)…
http://www.knmi.nl/publications/fulltexts/guilyardi_al_bams09.pdf
…it’s hard to find any part of ENSO that climate models simulate properly.
Bellenger et al (2013) was an update of the findings on the climate model failings with their attempts to simulate ENSO:
http://www.euclipse.eu/Publications/Bellenger_etal_ENSO%20representation%20in%20climate%20models%20from%20CMIP3%20to%20CMIP5.pdf
In summary, the climate models used by the IPCC to support the hypothetical impacts of anthropogenic forcings can’t simulate ENSO, the AMO, precipitation, or responses to volcanic eruptions.
So when you, X Anonymous, write a blog post proclaiming the IPCC’s supposedly learned opinions about internal or natural variability, most will dismiss your opinions as unfounded.
Note: Those papers, and others, will be linked in my upcoming ebook about the many flaws in the models used by the IPCC. I’m sure you’ll be happy to know I’m ahead of schedule. I only have one more chapter to write. I expect that book will be published one week ahead of the release of the much-heralded IPCC’s AR5 next month.
Regards
Bob Tisdale
Looking forward to the release of your new book.
Timing is great!
Max
Tisdale do you even accept the greenhouse effect exists?
Or are you one of those strange folk who wrongly think greenhouse effect cannot warm the oceans?
On your site you claim global warming is caused by El Nino but all you do is . As far as I can tell you arrived at this conclusion through a method similar to looking at shapes in tea leaves, except you looked at sea surface temperature trends. Then confused cause and effect.
If you don’t factor in the driving forcing of human greenhouse gas emissions you are just going to end up immortalizing your error in blog and book form.
I’ve found Tisdale’s site to be quite useful. If you recall Fan, that recent paper featured here about the importance of equatorial Pacific surface cooling. Perhaps the authors had a look at his site. One interpretation of that paper is that, they found a key and Tisdale was in the neighborhood.
I am intrigued by what he says here, sorry for all the links:
http://bobtisdale.wordpress.com/2008/06/18/sst-by-latitude/
At least three charts are interesting there.
The synced equatorial latitudes:
http://i28.tinypic.com/wl4r41.jpg
The at odds with each other middle latitudes:
http://i25.tinypic.com/m8z5sg.jpg
The rogue polar latitudes:
http://i26.tinypic.com/opqtmc.jpg
With the six zones, do they sync at times keeping in mind about 1910, 1940, 1970, and 2000? (As in Tsonis 2009.)
Thanks Bob Tisdale for all your work.
Sorry. I meant to say ‘lol’. Really sorry about that Fan. Forgive me please.
Heh, Bob, glad to see you are having more and more fun, as usual.
=======
Dr. Lindzen’s testimony to the British House of Commons covers all this in a very accessible way, and also how feedbacks and sensitivity are tightly linked. Available at his MIT website. Best current estimates are weak positive feedback f~0.3 and S~1.7 to 1.9. AR4 and AR5 are f~0.6 and S~3.
IPCC has the water vapor feedback too high (‘constant UTrH’ isn’t, at least in part because of Lindzen’s adaptive iris hypothesis), and cloud feedback positive when it is likely zero to weakly negative. Details published previously.
The very large problem with this essay on internal variability is that it does not use the standard data of climate science. At this time in history, the data of climate science are expressed in terms of temperature. Yet the author of this essay chooses to talk about energy. In doing so, he/she has a very difficult time characterizing internal variability. If temperatures are taken as the data of climate science, there is no difficulty. ENSO is a natural process that includes a redistribution of temperatures across the Pacific Ocean. The several processes that make up ENSO are not known at this time and, for that reason, the causal complex underlying ENSO cannot be fully described at this time.
Climate science might be improved by expressing its data in terms of units of energy. However, that is another discussion that must be undertaken.
Trenberth has led the move away from a model of climate that treats radiation as the only natural process that must be considered. Trenberth holds that there is “missing heat” that can be found in the deep oceans. In making this claim, Trenberth asserts the existence of natural processes of mixing in the oceans that redistribute temperatures from the surface of the ocean to the deep ocean. Such processes are best studied as phenomena of the oceans rather than as a function of radiative processes between sun and earth.
Interestingly, the phenomena is that it is the existence of colder water on top of warmer water that causes the colder water to sink. If we had the mathematics — although it might take every computer in the world churning numbers day and night — and, if we knew what we were doing we could model the physical mechanisms and the product of their synchronizations and the effects of the swirling vortices of ocean currents and monsoons bringing on heat and cold waves around the globe as hurricanes spout heat to dark reaches of empty space and volcanoes shoot more pollution into the atmosphere than ever produced by every single car that that has ever been driven on the face of the Earth.
This happens every winter in the Mediterranean. During the summer he surface waters are hot and very salty, when they cool in the winter nights, they increase in density, to near bottom. At the bottom are layers of water, at different densities, corresponding to different years.
These brines eventually exit the Med via a syphen,
The whirlpools of sinking water are recorded in the sea monster Charybdis in the Odyssey.
The U-Boat in ‘Das Boot’ escaped Gibraltar using the Mediterranean-Atlantic syphen current.
DocMartyn | August 29, 2013 at 6:48 pm |
Thank you for the detailed information. By the way, “Das Boot” is one fine movie. Truthfully, they don’t make movies like that anymore.
I agree with WHT and others
The diagram labelled positive feedback would be more characteristic of an underdamped, or resonant system.
In systems terms, what he calls “positive feedback” is gain. As WHT points out, systems with positive feedback are unstable.
I think this raises very important points about feedback which need to be discussed if the concept of feedback is to be used in analysing climate.
1) All physical systems involve time delay and since this is usually not pure delay, this is better described through a phase response.
2) Feedback systems have a feed-foward and a feedback network. Both of these have a phase response because they are real systems*.
3) The nature of fedback systems are such that if the feed-foward and back networks have simple first order dynamics, the overall system equation will be as a minimum, a second order differential equation.
4) Second order systems may oscillate, particularly if there a delays in the feedback.
5) To see oscillatory behaviour in such a system is therefore not unexpected. This might well be characterised as “variability”, especially if the driving function is irregular.
6) Non-linear systems with feed-back can also oscillate, but they show different characteristics to linear systems. They can be entrained to oscillate in different modes.
Therefore, “internal variability” or oscillations is not necessarilry a hallmark of positive feedback but is completely compatible with negative (non-linear) feedback. Unless there is an absolutely constant perturbation of the system, one would not expect the system “to settle down to an equilibrium. The definintion of equilibrium is that the entropy is maximised and the entropy production is zero.
If this thread goes on can I please ask everyone not to mention operational amplifiers. Yes, an op-amp circuit can be constructed with feedback that mimics a first order system. This is because an op-amp has high foward gain and consumkes power in doing so.
* I wrote a post on this during the Dessler/Spenser spat. I felt that their mathematics was wrong in characterising dynamic feedback behaviour.
http://judithcurry.com/2011/10/10/climate-control-theory-feedback-does-it-make-sense/
R, “In systems terms, what he calls “positive feedback” is gain. As WHT points out, systems with positive feedback are unstable.”
Can be unstable. Systems with negative feedback can also be unstable. The object of control theory is just that, control.
Obviously – it depends on the phase reponse of the feedback
Right, and when you have large thermal mass with natural oscillations the phase can change. Webster tends to overly simplify and gloss over synchronization.
Cappy, How can I be glossing over the largest thermal lag in the system — the ocean, which is sucking up the excess heat and creating a large thermal inertia.
??
And talking about phase, the land temperature is leading the SST for the same reasons.
Cappy always misses the obvious first order explanation because his product is not scientific output, but FUD.
Webster, by not considering symmetry. You think the NH dominate land at altitudes over 500 meters is going to cause uniform diffusion into the oceans where the NH ocean is ~20C on average and the SH ocean is approximately 17C on average and separated by Coriolis forces. The asymmetry between to two hemispheres, N-S produces inconsistent lags and the asymmetry between the hemispheres E-W also produces inconsistent lags, which you have to completely ignore to eke our your Hansen idolization.
In the hypocritical model-world of global warming alarmists all of us Westerners are smashed together smelling each other gas — like children on a bed under a thick blanket — as we all cling to our clean water, sewage treatment, hot showers, plentiful food and all of the other indicia of modernity that the climatists say the rest of us should give up to save the Earth from our smelly footprint.
Very eloquent. But why is this a reply to my comment?
I believe that under the blanket is an operational amplifier, gas positively feeding back through the olfactory and gastrointestinal systems. At least that is my anecdotal experience.
===================
The op amp analogy may be inappropriate for other reasons, but the external supply of energy isn’t one of them. If a positive (what the author calls “negative”) physical feedback system is proposed, such as Clausius-Clapeyron, it gets its energy from the sun. All proposed mechanisms of feedback get their energy from the sun (or lose solar energy), one way or another.
They’re ok as spherical cows. They’re just not ok as real cows. I agree that linear control systems theory isn’t a very good fit for the climate system.
I agree with JC’s comments that we only have 30years of data and the difficulty of sorting out what is variability. Many statistical signal processing approaches depend on have an ensemble of inputs and outputs so that test for, say, linearity can be performed. The fact that we only have only a single, short climate record creates huge difficulties.
I found this to be an interesting and thought-provoking essay.
However, I think the IPCC’s fundamental definition of internal and external variability, which X Anonymous quoted at the beginning, is flawed in that it locates human activity in the “external” category instead of the “internal” one. This seems typical of the fallacious Western intellectual mindset that regards humanity as something separate and apart from the natural world instead of as an integral part of it. Terrestrial humanity has always been an integral part of planet Earth and human activity has always been integrally involved and entwined in the whole terrestrial ecology and the whole terrestrial climate system. Therefore it rightly belongs in the “internal” category, not the “external” one.
The effect of making this correction is subtle but its consequences are significant for climate science because it changes the general Null Hypothesis of the whole field. By its own definition the IPCC is assuming that human activity is an external source of forcing and then the IPCC’s only problem is that of measuring its magnitude. Its ways of doing this seem fraught with further crazy assumptions to me, but that is by the way. My point here is that defining human activity as external to the climate system assumes the untested proposition that human activity IS a significant external driver of climate change instead of treating that proposition as a hypothesis to be tested and actually testing it.
This calumny is worse than one of scientific laziness because their basic assumption of external human causation automatically becomes their Null Hypothesis against which all other propositions relating to the climate are to be tested inside their thought-system. And because it is their Null Hypothesis they cannot test it – not just because they have made it into an untouchable holy cow but also because it is logically impossible in principle to test the Null Hypothesis once it has been chosen anyway. To test it would negate the choice.
So what the IPCC’s climate scientists seem to me to have done is to build an edifice of thought on the foundation of a false assumption whose falseness cannot be detected from within the thought-system that has been built upon it. Its falseness can only be seen from outside the IPCC’s thought-system and thus its subscribers are mentally trapped inside a self-enclosed, self-confirming, self-referencing thought-system that has no doors marked “Exit”.
On the other hand if we define human activity as internal to the climate system, the IPCC’s problem does not arise. Defining it in this way implies that human activity is NOT a significant driver of long term climate change and so that idea automatically becomes our Null Hypothesis, against which the hypothesis that it IS a significant climate driver can be tested empirically.
+ 1
This is an excellent point about the problems that grow out of an internal versus external dichotomy. This whole question occurs because, as John Power noted, it resonates with a larger meme of Man versus Nature. In this dichotomy, man is held as something outside of and separate from nature. This of course has a strong Christian foundation and centuries ago become integral to the European mindset.
For science this presents a fundamental problem, if Man is outside of nature, than he is removed from the study of natural things. And, by definition, as such he can no more be a proper subject of scientific investigation than any other super natural being. If on the other hand he is a natural being, just as much as any other animal, it can be argued that his actions are natural and, by definition, not at odds with, but part of “Nature”. Science can then make him an object of study, but of no greater or lesser significance that other natural beings, and such a study would be a dispassionate one.
If he is extra natural or perhaps held as being over nature, and therefore super natural, he is outside of the normal framework and his influence can be portrayed as something greater than that of a mere natural being. Here enters the chance to cast Man’s whole relationship to “Nature” in moral terms and with it the opportunity to go on moral crusades whether extolling the value of Man and his works or the dangers of his pride and arrogance.
I ask you, does the tenor of climate science’s view of man seem dispassionate or more in the order of a moral crusade.
Nice comment, John. But, the inconsistency of the IPCC’s approach goes even further, as it includes things like animal flatulence (including wild camels in central Australia) as unnatural phenomena. I am not sure what they do about zebu farts when they do their sums.
OTOH, to the best of my knowledge they do not deduct CO2 absorbing human activity such as growing crops in irrigated areas (which would otherwise have much less vegetation) when making their calculations. It is conceptually a dog’s breakfast, and mathematically challenging, to put it mildly.
Thanks to Anonymous, and Dr Curry, for this thread. It has been very educational for me, a non-scientist, and mostly constructive.
+ more than 1 fer
‘The untouchable holy cow of the consensus.’
The question is, do we count flatulence from the untouchable holy cow of consensus in our greenhouse totals?
Say, Harold,
Mustn’t be unfairly selective here as that would be considered
as cherry picking.
bts
The diagrams do not make sense to me. One does not get an oscillation with one positive feedback. The forcing seems to oscillate around the center line, which means there are two forcings at least, acting in opposite directions. Likewise for the feedbacks. However you can get an oscillator if the forcing and feedback combination is chaotically non-linear, but that requires a negative feedback.
First of all, there’s a nomenclature issue. I’ll use the author’s nomenclature and say that negative feedback causes amplification. In that case, the underlying equations don’t result in stability, but divergence. As far as the underlying equations are concerned, it will keep growing cyclically forever.
No physical system works that way. Physical systems will diverge until they run out of something. In this way, a stable oscillation is possible, but what exactly it does depends on a lot of things that weren’t stated.
Again, using the author’s nomenclature, a positive feedback will always tend to dampen the forcing. But if the forcing keeps on changing, the feedback will always keep on responding.
Nothing ever comes to rest until the forcing stops changing.
If the system’s nonlinear, it may behave similarly, but then again, it may not. This all depends on a lot of things that weren’t stated.
In an endogenous system negative feedback never amplifies and positive feedback never dampens but entrohpy ensures that the rates of amplification and dampening will decline over time to the tipping point when they reverse – negative feedback becomes positive and vice versa. Then we have all the exogenous influences serving to nudge the system along as it goes.
Judith Curry
The essay by “X Anonymous” is interesting. The logic seems reasonable.
Your observations regarding this paper give cause for thought.
First of all, as I understand the logic, cyclical internal variability only becomes insignificant to long-term climate change a) when net overall feedbacks are positive and b) when these cycles are short in comparison with the time period of anthropogenic forcing.
Assumption a) is anything but sure. There is empirical evidence for both net overall positive as well as net overall negative feedback, so the data are inconclusive. Net water vapor feedback is generally assumed to be positive, but its magnitude is disputed, based on short-term observations (ex. Minschwaner & Dessler 2004). Cloud feedback is even more uncertain, with recent short-term observations (ex. Spencer & Braswell 2007) pointing to a strongly negative net cloud feedback. And IPCC states in AR4, ”cloud feedbacks remain the largest source of uncertainty”.
Assumption b) is even more uncertain. The period of warming that is generally attributed primarily to anthropogenic factors is the late 20th C warming cycle; as you write, this lasted about 30 years. We know of natural cyclical factors, which last much longer than this, and there are very likely others, which we do not fully understand today. Arguably, the longer the cycle time, the less we understand it.
IOW, as I understand you, it is not possible to resolve the attribution problem until these assumptions can be validated.
And, of course, if we cannot resolve the attribution of past climate change, we cannot make any meaningful projections of future climate change from AGW.
Will IPCC let this “uncertainty” dampen its confidence in the CAGW message as it outlined in AR4?
Let’s see.
Max
Oh dear, if we cannot make any meaningful projections of future climate change from AGW then we’ll have to plan for the worse.
Yeah, lolwot. Or simply trash the whole CAGW scare as unfounded panic.
Max
that’s the other option
Or address real and pressing problems.
Like fossils fuel subsidies and tax havens.
Write off 250k…
http://www.peruviantimes.com/28/peru-declares-state-of-emergency-in-puno-as-temperatures-drop/20080/
what a mother.
lolwot
Yeah. I’d call it the response to the “null hypothesis”.
Max
+ 1
” All internal variability can do is move energy around. There is no significant net change in energy consistent with the laws of thermodynamics, where energy cannot be created nor destroyed. The climate must be forced to change in the long term; internal variability is unforced and does not cause long term temperature trends.”
This is all part of the great game of logical trickery. Call anthropogenic “external” and everything else “internal” , then state ,without the need to justify, that all “internal” variation is necessarily net zero. Hence GW is AGW.
QED.
But it’s all intellectual slight of hand.
Internal variability is not a _source_ of energy but that does not mean it cannot affect the amount of the primary source of energy (solar) then is entering and retained by the system.
It is not even necessary to go further than that, it is incumbent on anyone saying “internal variability” cannot affect climate to show it cannot affect the energy budget.
So far the IPCC is skipping that requirement by just stating it as if it follows by definition from the simple fact of having called it “internal”.
Bob Tisdale has explained how El Nino/Nina is NOT simply two sides of a simple oscillation and how it can result in net (solar) energy gain or loss.
Yu Kosak & Shang-Ping Xie’s new paper covered here, seems to demonstrate the same thing (although they only want to talk about one half of it to explain the pause).
The IPCC’s position is either intellectually dishonest or naively ignorant. With 2500 climate scientists from 160 countries , or whatever they claim, it’s a little hard to think they are misinformed and ignorant.
“It is not even necessary to go further than that, it is incumbent on anyone saying “internal variability” cannot affect climate to show it cannot affect the energy budget.”
No-one says it cannot affect climate. The point is that internal variation cannot sustain a longterm trend. Only external forcing can (and indeed must).
By all means come up with a mechanism by which internal changes to the climate can cause the surface to warm 1 degree C over a century.
I mean we have climate skeptics actively poo pooing the idea that the deep oceans can be gaining heat while the upper oceans are not (they say “how can the heat get lower”)
But then they want us to believe the climate can shift heat around in a way that explains most of global warming.
lolwot
Only the sun really can.
Write that down.
Max
In disappearing inkspots.
=============
AK says:
re All internal variability can do is move energy around.
This is a mistake many on both sides of the issue make: the energy is moving from the sun to interstellar space, via Earth.
===
Succinctly put. And “internal variations” may determine how much of that energy is caught and how long it is retained.
What I don’t understand is why FOMD keeps coming back to the theme of bright “young scientists” being attracted to “strong climate science.”
First, FOMD’s categories are arbitrary and clearly not scientific, and his/her focus on the greatness of Hansen seems silly, as Hansen is clearly an ideologue with a record of both making mistakes that supposed non-experts like Steve McIntyre have to correct for him, and poor predictions of future temperatures, as not one of his predictions indicated the pause we are, by all accounts, experiencing.
Further, who cares what “young scientists” are “attracted” to? What does this have to do with the issue at hand? Is this just propaganda aimed at those young scientists, so that they will believe who the fan tells them to believe? It seems like an appeal to popularity argument with no purpose other than to agitate people and distract them, and clearly has nothing to do with any thread it is posted under, yet I have seen it repeated many times.
Fan, you are making ideological warmists look bad with your constant personal attacks and off-topic BS. Please, by all means…
keep on doing it.
What “mistakes” does Hansen have a record of making?
I should have added that most of the mistakes related to Hansen are actually the myriad of mistakes skeptics make when trying to deny his work
Well, for starters, this one: “Quantifying the Hansen Y2K Error”, found at http://climateaudit.org/2007/08/06/quantifying-the-hansen-y2k-error/
In which Hansen’s colleague, Reto A Ruedy responds to Steve McIntyre saying, among other things,
“I’d like to thank you for bringing this oversight to our attention.”
Of course, I’m sure that will not satisfy you, but you did ask, and so there.
Before you start with the personal attacks and
Is that the best you can come up with?
Lets put the mistake in context. Here’s the impact the error made on US temperatures:
http://4.bp.blogspot.com/_Hp_m9iJaNkA/RsU1bmwGBhI/AAAAAAAAACU/frCnE1nRs4E/s1600-h/corrected2.jpg
And on global you can’t even see it:
http://4.bp.blogspot.com/_Hp_m9iJaNkA/RsUzamwGBfI/AAAAAAAAACE/QthpnmDtMHI/s1600-h/corrected.jpg
Climate deniers are very keen to exaggerate and shout about such errors of course. McIntyre plays a very obvious game of drumming it up.
You yourself have implied that Hansen has made some kind of grave mistakes to set him apart from other scientists. Yet the example you provide is a thing of true irrelevance.
LOL … my replay to makacker demonstrates that, by the objective measures of demonstrated predictive capability, (what Judith Curry calls) “the best available climate-change science” is … James Hansen’s.
What is your next (objectively rational!) question, tomdesabla?
Fan
You just cited an article, which points out that Hansen’s predictions tally pretty well when compared with IPCC projections.
Duh!
When I drive around the countryside here in Switzerland and see two barns, each with a manure pile in front, and these about the same size, I guess I can conclude that the two farmers have about the same number of cows.
But the piles are all “BS”
Max
I have no more questions for you FOMD, because I’m here to learn.
X says “As noted by climate researchers, attribution of warming to an internal process such as the ENSO cycle requires a highly sensitive climate with positive feedback to work!”
Only if you mistake “internal process” for some trivial oscillation that cannot affect the energy budget.
La Nina captures solar energy into the ocean , El Nino dumps energy from the ocean into the atmosphere. These are not two phases of swinging pendulum.
Simply calling it “internal” does not mean it can not have an effect on _external_ energy sources and thus must have a neutral effect on climate.
Think about it though, if ENSO is influencing incoming solar, then how does that translate to global temperature change?
Climate sensitivity. Higher CS would result in the ENSO induced changes being higher.
If you have a simplistic theory based on hopelessly inadequate and poorly digested fragments of knowledge, your theory will seem far less clumsy and speculative if you can give it a name redolent of mechanistic precision. What about “external variability”? Sound good? No need to use such mock-clinical verbiage all the time, however. You might still indulge in some baby-talk like, say, “Frankenstorm”. Y’know, mix things up a bit.
QOTD
Andrew
He says that the IOCC says that climate variation at all time scales larger than a single weather event are internal variability. If that is true then then ther isn’t such a thing as climate change since you have no idea what time scale you are talking about. An Ice age and intergalcial is just internal variability at a time scale greater than a single weather event.
IPCC (dammit!)
Yes, many of us do.
It damns itself. It can’t help it. So tragic, and for the audience, too.
============
Its a pity I stoopped reading when I gots to ur spellin mistke
For Swanson and Tsonis — or anyone who takes as given that human CO2 causes global warming over the long haul — internal climate variability becomes the, apparent lack of a proximate cause behind any halt in warming–e.g., after 2001/02.
In other words, when looking at various modes of the climate system (e.g., events like the El Nino-Southern Oscillation), we do not understand the reason for the modes or how they are linked or why at various times they are longer or shorter, nor do we understand how any of these physically observable things impact temperatures globally. Accordingly, we will define all of these things we do not understand as, internal variability and move on, clutching hard to the notion that even when there is a shift in the climate — and possibly decades of future global cooling — we shall still believe disaster looms because humanity is heating the globe.
X Anonymous – Colombian? Spanish? No, Martian. Recent research reinforces the view that life came to Earth from Mars.
> The minerals most effective at templating RNA would have dissolved in the oceans of the early Earth, but would have been more abundant on Mars, according to Prof Benner, of the Westheimer Institute of Science and Technology in Gainesville, US. This could suggest that life started on the Red Planet before being transported to Earth on meteorites, argues Prof Benner, of the Westheimer Institute of Science and Technology in Gainesville, US.
http://www.bbc.co.uk/news/science-environment-23872765
The giant impact hypothesis is currently the best way to explain the Earth/Moon system; a smaller proto-Earth collided with a Mars sized planet called Theia and the debris of the collision become the Moon; about 4.53 bya.
Life seems to have appeared about 4 bya, which is awfully quick after such a hit. Life evolving on Mars, then being transferred makes a whole lot of sense.
sun (son)
n.
1. often Sun A star that’s 93 million miles away from Earth.
2. A star that is the center of a planetary system.
3. The radiant energy that is emitted by the sun—e.g., heat and visible light—i.e., sunshine.
4. A sunlike object, representation, or design.
5. That independent variable that somehow exerts its influence on everything else.
6. A mass of incandescent gas that doesn’t just cause different things to be related it accounts for it.
7. A place where no thing lives that we cannot live without.
8. A fearsome nuclear bomb.
9. A place so hot – the temperature is millions of degrees — even metals are gases.
10. Key independent variable responsible for global warming and cooling–nominally, it’s the Sun, stupid.
In economics, the term “exogenous” to refer to the parts of a model that are unexplained, brute facts and the term “endogenous” to refer to the parts that are determined by the causal behavior and structure of the model. These are epistemological terms rather than empirical classifications: One game played in economic theory is to “endogenize” what previously was “exogenous” in such a way as to make the model more plausible by having fewer, more-intuitive, or more-measurable exogenous variables. One way a model can be bad is if it treats as exogenous a variable that is in reality strongly affected by one or more of its endogenous variables (i.e. it is truly “internal”).
That epistemological distinction seems to be a useful adjunct to the putatively empirical, causal “internal” and “external” terms swirling around climate science. A volcanic eruption is quintessentially “exogenous” because climate models take these eruptions as unexplained data. It also is believed to be empirically “external” to the climate and weather because we don’t know about any plausible ways in which the number and size of eruptions would be affected by, say, the air temperature. So volcanic eruptions are a good clear case where exogenous and external coincide.
What about clouds? These are modeled endogenously and are usually thought of as “internal” phenomena. But then the cosmic ray enthusiasts come in and say that clouds are partly exogenous in the standard climate models without a Svensmark mechanism. Spencer argues that clouds may vary for unstated reasons distinct from temperature and aerosol fluctuations, reasons that might be “internal” and “endogenous” in a fully specified future model but are “exogenous” in the existing limited models. And so on.
Conclusion: Keep the epistemological status of “exogenous” and “endogenous” distinct from the causal categories of “internal” and “external.” You can say “Your model is bad because it treats as exogenous something that is strongly internal,” or “Your model is bad because it treats as wholly endogenous something that is largely external.” And responses to these critiques can be made on a number of bases, including tractability, plausibility, data availability, substantive unimportance, etc.
+1
+1
This should become a post.
WebHub: I love me some pedantry, but I think your comment missed the main point of what I was trying to say.
Exogeneity is a property of models, not reality. Externality and internality (the latter including the notion of compliance you mention) are properties of the actual system being modeled. Since we can have different models of the same system or of overlapping systems, it’s useful to distinguish between the epistemological and the empirical (causal) relations.
One criterion of evaluation for a model is the degree to which it properly endogenizes things that are truly internal. But there are other criteria out there, such as accuracy in short-term forecasting or tractability, that might conflict with proper endogenization.
Yes, it certainly would make a good post. But it is incomplete. The distinction between exogenous and external is fairly subtle, with exogenous indicating that the behavior originated from outside but now is part of the system. A GHG such as man-introduced CO2 is an exogenous factor. It was previously completely externalized, having been buried for eons underground as hydrocarbons, not having an effect on the climate. Once extracted, the hydrocarbons are combusted, which then turn into the exogenous CO2 and which in turn has significant impacts on the earth’s climate.
Just as critical is the idea of a compliant interface. That is an interface to an external entity whose characteristics change with contact. This is best illustrated by considering a vehicle in contact with a surface. A non-compliant interface would be if the vehicle interfaces with concrete. The concrete may budge slightly but can be considered static. A compliant interface would be a vehicle interacting with sand or mud or water. The model of the compliant surface becomes much more difficult to characterize simply.
In terms of modeling temperature, a hot or cold body is automatically compliant with an external thermal reservoir. On contact, two bodies at different temperatures will redistribute the heat according to laws of entropy. This is a very compliant interface that can be simplified only if the thermal heat capacity of the external object is large. This is significant in terms of OHC modeling, but simplifications are indeed possible since the ocean has an enormous heat capacity.
I have a more complete analysis under the Stochastic Analysis tab here http://contextearth.com/, and other documents as well.
This particular site is devoted to context modeling. A context model is a recently coined term to describe models of external interfaces that can be used to design systems that are used in a specific context — for example, an environmental context model of water is used to design a sea-worthy boat. It is a pedantic definition, but pedantic is good in this case as anything to enable separation of concerns is good. Separating the design & component models from context models fosters reuse.
Nice comment, webby. Informative, non-partisan and non-confrontational. More like Fred Molten and Pekka, than our little smarmy friends joshie et al. If you really want the unwashed denier masses to get your message, that is the way to do it. Even caused me to set aside my prejudices and take a look at your new blog. Looks interesting. Please stick to the technical stuff and leave out propagandizing and demonization of the unbelievers.
I agree with Don that WHT’s comment was remarkably free from snark. In this respect I must also compliment Don on his recent comments as making a good contribution to the threads. I dunno what’s happening but I like it!
This is BS. As an engineer, I understand positive feedback. The diagrams presented in this article do not represent positive feedback, they are carefully crafted visual lies. If there were positive feedback in the earth’s climate, then we would be either have frozen or fried several billion years ago.
Actually it would be more accurate to say that because you are an engineer, you DONT understand positive feedback. At least as to how it relates to climate.
right lolwot, The earth’s climate sits in a deep potential well that is bounded by rails that will revert the climate to a mean. On the high temperature side is the radiative Plank response. On the low temperature side is the sun and the GHG layer of CO2 which prevents the earth from going snowball. See Lacis’s paper on CO2 as the control knob.
Robert of Ottawa,
“This is BS. As an engineer, I understand positive feedback. The diagrams presented in this article do not represent positive feedback, they are carefully crafted visual lies. If there were positive feedback in the earth’s climate, then we would be either have frozen or fried several billion years ago.”
Right, the first is the IPCC carefully crafted lie and the second is the Sky Dragons carefully crafted lie, the truth is somewhere in the middle. What is it?
News flash from Switzerland
In its article entitled “A Glance at the Next IPCC Report”, the Neue Zürcher Zeitung quotes paleoclimatology professor, Heinz Wanner (Oeschger Center in Bern), who says that the report authors “are in a sandwich”.
http://www.nzz.ch/wissen/wissenschaft/ein-ausblick-auf-den-naechsten-ipcc-bericht-1.18139920
The “pause” in warming of the global surface temperature since 2001 has caused some reflection on the reliability of projections from GCMs.
Explaining why models have been unable to make correct projections will be the “major challenge”, according to the report.
Max
PS Seems to sort of fit in with this post.
Max
That will be a common theme during all of 2014. You can lay money on it. I just wonder how often the MSM will pick up on it. If past is prologue, then probably not much.
“A positive feedback does not require a system memory, yet we live in a world which has one.”
Your anobymous correspondent is wrong Positive feedback works because system feedbacks are in phase with remembered past values, thus reinforcing the past values and causing a build up in oscillations. So the system can destroy itself if left unchecked.. Nyquist theory has the best explanation of this.While positive feedback is possible without memory, that is only a mathematical possibility, not a physical system possibility.Incidently transport delays have different manifestations to inertial delays and can be recognised as such by experts in signal tracing.
I therefore suspect other deductions by your correspondent concerning feedback theory are suspect. Feedback theory is the very basis of Control Engineers and is well understood..
What would you describe as the ‘system memory’ in an action potential?
http://en.wikipedia.org/wiki/Action_potential
DocNartyn: I guess a spike train would have to have some sort of memory in order to produce a steady output, instead of just spikes.
Harold: Bitt an op amp on its own can only amplify power.Without memory it can’t integrate or filter a spectrum.
Johanna: Your computer has to have memory to execute a defined sequence of events. That would be impossible without memory containing a set of instructions..
JimD: Yes, the earth’s memory mostly resides in the oceans.
Steven: I agree.
Manckar: ““CO2 control knob” also doesn’t seem to work consistently”
Only the IPCC seem to think it does.
There are some feedback systems that come pretty close to being memoryless, such as
[ducks]
op amps.
System memory strikes me as conceptually absurd. A system is not only inanimate, it is not even a physical object. It only exists in the mind of the person who describes it as a system. That doesn’t mean that it doesn’t exist, but it does make the notion that it has a “memory” in the conventional sense of the term inexplicable to this plodding slave of fact.
Somebody help me out here. Is “system memory” part of the vocabulary of post-normal science?
The sun only has enough energy to keep the earth at a certain temperature. It can’t deviate much from that. Other factors also govern the temperature, such as albedo and GHGs. These also (usually) don’t vary much so there is a set point, like a thermostat determined by nature.
Perhaps the deep ocean currents.
Jim, I don’t understand what you are saying here, not to mention that it in no way addresses my question.
You said :”The sun only has enough energy to keep the earth at a certain temperature. It can’t deviate much from that.”
You make it sound as though the Sun is a radiator plugged into a power point. But surely it is more like a charcoal brazier? I thought that the laws of physics mean that eventually it will burn out.
Then you said: “Other factors also govern the temperature, such as albedo and GHGs. These also (usually) don’t vary much so there is a set point, like a thermostat determined by nature.”
I’m not a scientist, but AFAIK there have been very large swings in climate throughout the history of the planet. So, I find your reference to a “thermostat set by nature” a bit puzzling.
“Climate science” sure is confusing.
Is “system memory” part of the vocabulary of post-normal science?.
No its a part of everyday normal science and engineering.
http://www.scholarpedia.org/article/Volterra_and_Wiener_series
We also have “memoryless systems”
http://en.wikipedia.org/wiki/Markov_process
Jim D
The “thermostat” you describe doesn’t always work apparently.
There were several “snowball Earth” periods in our planet’s distant past, during most of which atmospheric CO2 concentrations were much higher than today (10 times as high or even higher).
The “CO2 control knob” also doesn’t seem to work consistently.
Max
“There were several “snowball Earth” periods in our planet’s distant past, during most of which atmospheric CO2 concentrations were much higher than today”
Can you give the precise date of one of these examples, and also how much fainter the sun was back then.
Johanna,
‘System memory’ is a poor jargon. In simple physical terms, when you say a system has memory, it means it does not produce instantaneously output when acted upon by external input. Example of no memory system, a long tube filled with water. Since water is (almost) incompressible, if you push one end of tube, water will come out of the other end. The push is the external input. The spill is the instantaneous output.
Example of system with memory. The same tube with water. Put a thermometer on one end of the tube. Heat the other end of tube with a lighter. You won’t detect a temperature change in the thermometer immediately. It will take long time for heat to flow to the end of tube. When you finally detect the output, we say the water has ‘memory’ because the input happened in the past. Silly jargon since water is not a brain or computer that stores information. It’s just a time lag between cause and effect.
“Silly jargon since water is not a brain or computer that stores information. It’s just a time lag between cause and effect.”
of course the water stores information.
also, you think human memory is non chemical? non physical?
Teachers do it better…
http://cnsnews.com/news/article/obama-sex-ed-kindergartners-right-thing-do
in school.
@Steven
Water can store information about its own physical properties. But in the example I gave, it is not information but the delay in heat transfer that is attributed to “memory.” That’s why it’s silly.
Metal fatigue is more appropriate to be called memory. Metal ‘remembers’ its past stresses and affects its present strength.
johanna, you were asking how there could be a memory, and I would argue there is no memory, but there is a temperature governed by such things as our distance from the sun and other physical factors I mentioned. So, I don’t call it a memory, and that was, as someone said, a poor and unscientific phrase for what happens. I agree with you, it is silly to say there is a memory. There may be an inertia, but that is different from a memory. The temperature is controlled by external factors, not internal ones like a memory. These factors I listed (sun, albedo, GHGs) do change, and so does temperature with them. There are examples of all of these in paleoclimate, and currently ongoing.
I think the IPCC definition if internal forcing is arbitrary and capricious – for that matter, so it the IPCC, but I digress.
Internal would be from the edge of the atmosphere down to the Earth’s core. Anything in that should be “internal.” That is just logical. Externals would be the Sun’s radiation, gravity waves, cosmic rays, meteors, and anything else that impinges on the Earth’s “system.”
Anyway, just one more stupid definition from the IPCC and climate science.
About Judith’s comment:
“since we are looking at a period of about 3 decades as being the main ‘signal’ from CO2 forcing, we don’t really know how to do the attribution problem on this time scale”
I agree. In fact I think that as climate “changes” every 30 years (the minimum statistical significant time), mankind would have statistical significant knowledge on this issue of CO2 attribution in the year 2850 (from 1950 and as 30·30 = 900).
I am writting an essay with this idea in it. Anyone (except trolls) wants to disscuss it?
Manacker, your rejection of Hansen’s “best available climate-change science” is neither rational nor respectful of our Climate Etc host Judith Curry!
Summary Judith Curry rationally quotes (to a reasonable approximation) James Hansen’s 1981 prediction as 2013’s best available climate-change science (to use Judith’s useful phrase).
Good on `yah, James Hansen and Judith Curry!
Manacker, why not boost yer politeness-and-rationality prescription?
Climate change alarmists are proposing that human carbon emissions are raising the global mean temperature of the earth by increasing the greenhouse effect. The debate about this proposition has hinged mainly on the question of feedbacks to the initial forcing from CO2 and insolation up to now and to what extent the effects of these proposed feedbacks can be discerned in the historical temperature records. But two significant areas of inquiry seem to me to have been neglected in this scientific debate up to now.
The first of these is the area of short term temperature variability. Traditionally the alarmists have regarded short term temperature variations – the fluctuations from season to season, year to year and decade to decade – as signal-noise which should be eliminated from the data in order to reveal the underlying long term warming trend that is caused, so they maintain, by man. The thought that short term temperature variability might itself contain significant information about the long term trend does not appear to have occurred to them. But I think it may.
The second neglected area is the basic greenhouse theory itself as the idea of a positive feedback mechanism that recycles a fraction of the power radiating from the planetary surface and thereby amplifies the surface temperature in accordance with the strength of the overall greenhouse effect. When we regard the greenhouse effect in this way we can see that this positive feedback principle should not just amplify the basic surface temperature but should also amplify any variations in the basic surface temperature that occur due to non-greenhouse effect sources. It can be shown from first principles that the amplification factor applying to the short term temperature variations is exactly the same as that which applies to the basic surface temperature. (Demonstration available upon request.)
If the alarmists’ proposition is correct then as human carbon emissions have increased the strength of the overall greenhouse effect over time, thereby amplifying the basic global mean surface temperature, the magnitudes of the short term temperature variations should have increased by a corresponding amount over the same time period. We should be able to detect this increased variability in the historical temperature records provided that they are sufficiently accurate and cover a sufficiently extensive period.
Having examined the short term temperature variability in HadCRUT4 covering the period 1850 – 2010, I must report that I can find no evidence there for the predicted increase in the magnitudes of global mean temperature variations. On the contrary, I found that the trend for them was negative and statistically highly significant, indicating that the magnitudes of temperature variations actually decreased over time in direct contradiction of the enhanced greenhouse theory of global warming.
How are we to understand this result? Possible reasons that occur to me are:
1. I did my sums wrong. (Ultimately I think you can only check that out by doing your own statistical analysis independently – a process known as ‘replication’.)
2. HadCRUT4 is not accurate. (This seems a realistic possibility to me in view of the amount of statistical massaging that has been done on the data prior to publication. However, for offended HadCRUT devotees I would remind them that they cannot have this both ways: if HadCRUT4 is sufficiently accurate to indicate a specific increase in the global mean temperature over the period 1850 – 2010 from the enhanced greenhouse effect, it must also be sufficiently accurate to indicate the same increase in the sizes of global mean temperature variations from the same source over the same period.)
3. HadCRUT4 faithfully reflects a true decrease in the global mean temperature variability that actually has happened over the period. (In this case the evidence from HadCRUT4 would seem to indicate either that the global warming that has occurred over the period was not caused by the enhanced greenhouse effect, or else that if it was so caused the warming has nevertheless occurred under the predominance of a negative feedback of some kind, since reduction of temperature variations is the characteristic ‘damping effect’ of a negative feedback.)
I dare say that different results might be obtainable from different data-sets but I have only looked at HadCRUT4 so far.
Most points on the Earths surface only sit at this ‘equilibrium’ temperature for a couple of minutes every day. Put your head in the freezer and feet in the oven and call yourself at ‘equilibrium’.
I don’t imagine that many points on the earth’s surface manage to do even that, Doc.
I often think that the theoretical idea of the Earth’s equilibrium temperature is like the equally theoretical concept of “sea-level”. Has anyone ever seen an actual level sea? Yet it is a practically useful concept nevertheless and we can measure heights quite easily on land and at sea by referring to it. Sea-level is sometimes called a “useful fiction” because although it is purely fictional it is nevertheless practically useful. Money is another useful fiction. It’s amazing to observe how many of these abstract creations that we treat as real physical entities have become commonplace in the human world and are holding up our whole civilization.
When discussing equilibrium states it is usually vital to specify which particular characteristic of the system one is talking about to avoid confusion. As in your example: if my head was in the freezer and my feet were in the oven then so long as the temperature-gradient from my head to my feet was constant, I could be said to be in a state of thermal equilibrium. However, if I was conscious I probably could not be said to be in a state of psychological equilibrium under those circumstances!
Settled clay at the feet of climate science, weather cascading climatically chaotically, nay, turbulently, at critical doubting heads.
================================
This article seems to have interpreted negative feedback as a restoring force rather than the climate science definition of a damping of a forcing. There is a negative feedback of this kind in the climate system, known as the Planck Response. This does restore the earth’s temperature to an equilibrium state when only internal variations are active. It is why El Nino warming declines quickly and does not persist, and is basically that anomalously warm surface water radiating its energy away. So, if the Planck Response was all there is with natural variability, you would have a climate where the only changes came from natural variability. Add a forcing change and the Planck Response now relaxes towards a new baseline. How far this baseline is from the previous one depends on the feedback to the forcing. However these feedbacks just amplify or damp the forcing. Few think it damps the CO2 no-feedback effect, but that would be the climate definition of a negative feedback.
One thing is for sure — Willis did not write this.
No thermostats for Miss X. No variability due to cloud cover reflecting energy before thermodynamics can get to it.
It occurs to me reading a lot of this that the electrical/control systems people and another group (statisticians, perhaps?) are speaking strange tongues past each other, but probably saying exactly the same thing.
Therefore, it is fair and reasonable to assume these short term influences on the climate are short term. It’s a zero sum game when it comes to the IPCC’s use of internal variability. As the figure above illustrates, internal variability is the slave and external forcing is the master. All internal variability can do is move energy around. There is no significant net change in energy consistent with the laws of thermodynamics, where energy cannot be created nor destroyed. The climate must be forced to change in the long term; internal variability is unforced and does not cause long term temperature trends.
Utter and unmitigated nonsense. It is bizarre that this nonsensical notion that is utterly contradicted by all of the evidence persists. The clearest example is glacials/interglacials where global energy dynamics are dominated by ice albedo changes.
I’d suggest on the basis of the simplistic exposition that anonymous is numbnut. I didn’t know he was Spanish.
I quote this quite often. It seems necessary for some.
‘ Climate forcing results in an imbalance in the TOA radiation budget that has direct implications for global climate, but the large natural variability in the Earth’s radiation budget due to fluctuations in atmospheric and ocean dynamics complicates this picture.’ http://meteora.ucsd.edu/~jnorris/reprints/Loeb_et_al_ISSI_Surv_Geophys_2012.pdf
Here’s a longer comment.
judithcurry.com/2013/08/28/pause-tied-to-equatorial-pacific-surface-cooling/#comment-371641
This is from webby’s reference – I have bookmarked it thanks webby – in general it concerns system that are resonant under certain circumstances. Wind vortex and the Tacoma Falls bridge for instance. Positive feedbacks proceeded in this case to destruction. Since then suspension bridges have incorporated – inter alia – torsional damping.
‘Evidently, energy from the environment may flow into the machine and cause it to do useful work. For instance, the water in a stream turns the wheel of a mill and heat from burning coal powers a steam engine. This article shall focus on self-oscillation, an important type of externally-powered motion. As we shall explain, self-oscillators are characterized by the fact that their own motion controls the phase with which the external power source drives them. They are therefore, in a certain sense, self-driven (although not, of course, self-powered).’ http://arxiv.org/pdf/1109.6640.pdf
The Earth system is powered by sunshine and planetary spin. It is a nonlinear, dissipative system – just like suspension bridges with torsional damping. With the proviso that climate is also chaotic and and can shift between a large number of states. You can take it as a given that energy is involved in all climate processes. Earth is a complex system. Defined as a system having control variables – orbits, sunshine, greenhouse gases – and multiple positive and negative feedbacks – snow, ice, cloud, dust, ocean and atmosphere circulation, biology. A system so defined can be expected to behave in ways consistent with that of the class of deterministically chaotic systems. Chief amongst these behaviours are dragon-kings and slowing down. Dragon-kings are extreme events as tremendous energies cascade through powerful subsystems at tipping points. Slowing down is just like it sounds – technically the local decay rates tend to zero as the system approaches bifurcation. The system fluctuates wildly before settling into a new climate mode in a damped oscillation.
http://sms.cam.ac.uk/media/872307
I wont bother repairing my formatting.
Hey Chief:
“…and the Tacoma Falls bridge for instance. Positive feedbacks proceeded in this case to destruction.”
Which made me think of positive feedbacks another way. Net longterm positive feedbacks destroy themselves. This is a very rough statement and I can’t include all the exceptions to it. My best example is a housing bubble. However, how about hurricanes and anvilhead thunderstorms? I assume positive feedback forms them, and then they destroy themselves. Is this consistent with chaos theory?
Now can we then say, we should not assume net positive feedbacks? But if we do, do I mean the climate with destroy itself? I think I mean the feedback will destroy itself. The CO2 will not destroy itself in time to offer any help, but will the other part destroy itself? The water vapor feedback? To put my statement another way, the steeper the net positive feedback slope is, more likely it is to destroy itself.
If this looks far out, can we have some examples of sustained net positive feedbacks? It is also interesting that while we are supposed to worry about that big tipping point, it seems these regime changes are tipping points, and they are already happening and being looked at by Climate Scientists.
“Chief amongst these behaviours are dragon-kings and slowing down. Dragon-kings are extreme events as tremendous energies cascade through powerful subsystems at tipping points. Slowing down is just like it sounds – technically the local decay rates tend to zero as the system approaches bifurcation. The system fluctuates wildly before settling into a new climate mode in a damped oscillation.”
I am having a hard time here seeing slowing down and wild fluctuations together. Are the local decay rates, the energy leaving the trough followed by the reorganization?
Perhaps some attention should also be paid to to feedback in the processes of science itself.
Feedback in science occurs when the current paradigm exerts influence on new developments. This happens via the gatekeeper roles of peer review and funding. Some feedback is actually a good thing and aids stability. Too much feedback however is likely to result in an unstable system.
What would too much feedback in science look like? I’d suggest an excessively rigid enforcement of consensus where new ideas have trouble getting a hearing. When conforming to the consensus starts to become more important than conforming to reality then that would be a danger sign that there was too much feedback and that science was therefore in danger of instability.
What would instability look like? When how well ideas conform to consensus becomes more important than anything else, then reality gets ejected from the driving seat and the consensus starts to drive itself. The bus of science then drives off the road into the wilderness with noone at the controls while all the passengers scream and shout at each other about the importance of consensus and conformity and nobody is looking out the windows at the approaching ravine.
Or seeing that the ravine is an ice crevasse.
=============
I believe the climate is dominated by negative feedback. Why? Because systems dominated by negative feedback are stable. A negative feedback system is like a spring. Introduce an external forcing by stretching it. The impact is oscillation. Because the system is stable, it will eventually return to equilibrium.
A positive feedback system is like a bridge under resonance. Introduce an external forcing by vibrating it. The impact is resonance. The system is unstable. The vibration will continuously magnify and eventually destroy the bridge. The positive feedback loop leads to a runaway effect that destroys the system itself. Look at earth’s climate history in past millions of years. Do you see a runaway effect? It looks pretty stable that diverse life evolved and flourished despite a few mass extinctions caused by external factors like meteor impact, supervolcano eruptions, galactic gamma ray bursts, etc.
The first graph is interesting. It depicts internal variability with and without forcing. If only the climate is as simple as that graph. The problem with the real climate is the wavelength and amplitude of the wave are highly variable. The amplitude can be larger the slope of the trend line. The wavelength can be decades long or many centuries long. So if you’re looking at a few decades of data, you cannot tell if you’re looking at the trend line or the amplitude of the wave.
In a feedback system, the trend line is the forcing while the wave is the oscillation. In the climate system, often the forcing and the oscillation look the same.
kim’s believe it or not: There is even negative feedback to the speaker frying echo chamber shattering hyper-amplified consensus in climate science. Else it would be unstable.
==================
I’m told sometimes that, as skeptic, I must be getting miseducated at a site called WUWT. I decided to wander over there today to see how things were varying…and found this interesting variable:
http://wattsupwiththat.com/2013/08/29/the-great-labor-day-hurricane-of-1935/
I’m used to stuff being worse than we thought, and can live with things being more variable than we thought. But now they say stuff used to be worse and more variable than we used to think! Could it be that stuff will be worse and more variable than we will think, or than we’re thinking now, or…?
Quick, find me an intellectual who can soothe me with some factoids, numbers and percentages. Peer reviewed, bien sur. 97% is always nice. Far enough from 100% not to seem unreal, close enough not to unsettle. Ahhhh, that’s better. A nice variability of 3% hits that perfect spot.
Looks like there are cold feet about cooling predictions.
http://scienceblogs.com/gregladen/2013/08/28/can-monckton-put-his-money-where-is-mouth-is/
$1000 this decade is cooler than the last. Yes?
no, I would have to break anonymity. But yes I do think the odds favor this decade being warmer than the last. We are already a third of the way in and so far it is warmer than the 00s.
However lets not let this detract from Monckton’s nonsense:
“A math geek with a track-record of getting stuff right tells me we are in for 0.5 Cº of global cooling. It could happen in two years, but is very likely by 2020.”
The idea of global temperature cooling 0.5C in 2020 is absurd enough. “it could happen in two years” is just balmy.
I ‘project’ a flat 30-year linear trend by 2020. By flat I mean no significant warming for 30 years.
Something like this:
http://www.woodfortrees.org/plot/hadcrut4gl/from:1920/plot/hadcrut4gl/from:1935/to:1965/trend/plot/hadcrut4gl/from:1990/trend
By linking to that video, The Chef is too chicken to reveal any peer-reviewed scholarly works he has created over the years.
Massive projection at work. Nothing to show for all your work. eh Chef?
That chicken is telling you about the fox that came out from the deeps of the sea in the night.
================
Kim’s scholarly works are written on post-it notes stuck to the fridge.
Hey, Guy, a Callendar.
=======
Edam, why not use 23 years for both plots?
http://www.woodfortrees.org/plot/hadcrut4gl/from:1920/plot/hadcrut4gl/from:1923/to:1946/trend/plot/hadcrut4gl/from:1990/trend
Not sure what it proves – there will always be a sucker?
The projections are based on increasing intensity of La Nina in the current cool Pacific mode during the next decade or so – plus a decline in solar intensity to 2020 in the 11 year cycle.
It is fairly obvious. Numbnut would be a fool to take the bet – but I’ll take his money. To rub it in – let’s make it a donation to the Australian Liberal National Party who are just about to abolish carbon taxes.
“The projections are based on increasing intensity of La Nina in the current cool Pacific mode during the next decade or so – plus a decline in solar intensity to 2020 in the 11 year cycle.”
Did an increasing intensity of La Nina and a decline in solar intensity cause the 00s to be cooler than the 90s? No.
I can only assume Monckton doesn’t want to take the offered bet out of fear. Ie deep down Monckton has doubts about his own global cooling propaganda and he doesn’t want to risk handing his nemesis John Abraham a victory (the money is not the issue).
I think Monckton’s counter reveals what he really believes:
“To make any such bet symmetrical, there would be no payout if the temperature fluctuated by less than 0.5 K in either direction by 2020 compared with today. The bedwetters would win if the temperature rose by 0.5 K; the army of light and truth would win if it fell by 0.5 K.”
Ie he isn’t confident of cooling at all, as he’s offering equal-odds of warming. Also this suggests to me that he knows full well that 0.5K change in 7 years is implausible and rather than back down he has engineered the bet to make the other side impossible to win too. He doesn’t care about winning, he just doesn’t want to lose.
I imagine if Abraham counter-offered to bring the bet down to 0.1K warming vs 0.1K cooling, Monckton would refuse as it would be too risky that Abraham would win.
Natural, large-scale climate patterns like the PDO and El Niño-La Niña are superimposed on global warming caused by increasing concentrations of greenhouse gases and landscape changes like deforestation. According to Josh Willis, JPL oceanographer and climate scientist, “These natural climate phenomena can sometimes hide global warming caused by human activities. Or they can have the opposite effect of accentuating it.”
What happened in the years 1976/77 and 1998/99 in the Pacific was so unusual that scientists spoke of abrupt climate changes. They referred to a sudden warming of the tropical Pacific in the mid-1970s and rapid cooling in the late 1990s. Both events turned the world’s climate topsy-turvy and are clearly reflected in the average temperature of Earth. http://www.sciencedaily.com/releases/2013/08/130822105042.htm
1977 to 1998 saw increasing heat in the system overwhelmingly overwhelmingly from reducing cloud cover.
http://s1114.photobucket.com/user/Chief_Hydrologist/media/cloud_palleandlaken2013_zps3c92a9fc.png.html?sort=3&o=17
Cloud cover increased in the 1998/2001 climate shift – remember that term – and has been fairly steady since. We are at the peak of the cycle but the Sun will cool.
You don’t really have a clue do you numbnut? Which is why you like to focus on targets instead of science.
You have a few articles on control systems and such like. Earth shattering contributions to the fine points of electrical engineering I am sure. This is complimented by monumental ignorance of Earth sciences and a fundamental inability to grasp central concepts of climate science. Even such simple concepts of flow of energy through the system. All leading to obscenely simplistic and misguided blog science.
I have been studying hydrology for decades – have written diversely on ENSO, modelling and environmental management and specialise in biogeochemical cycling of water and substances through the environment from uplands to the ocean. This forum gives me the incentive to read ever wider in climate science and to think more deeply. I read broadly on everything – inter alia – from the causes of glacials an interglacials, to chaos theory, ocean heat content, top of atmosphere radiant flux, ocean and atmosphere variability, paleohydrology, physics, biology and chemical cycling. I am an Environmental Scientist – trained and qualified – which means that I am not a specialist. I am a generalist with an interest in building a big picture – this is what I call natural philosophy. But I am also a writer with an interest in putting it into words.
Go right ahead and tell me how out experiences and knowledge of climate science compare – I am sure I can’t stop you. But your tedious whines are pathetic.
X Anonymous
Excellent article.
Thank you.
What is your name? Can not you reveal your name? Why?
How sad!
Raindrops come crashing on my head …
I might be, might in the best climate science fashion, that the ocean-water vapor-cloud system is chaotic and can account for the ocean cycles.
As the poster points out, it has a memory.
If “the ocean-water vapor-cloud system is chaotic“, then so is the ocean-water vapor-cloud biosphere system. Changes to forest growth in the Andes and Amazon rain forests could constitute a system memory with a time-scale up to centuries. And clear-cutting in the amazon might well represent a partial lobotomy of the prior climate-ecosystem.
All you need is a mechanism by which changes to Andean/Amazon vegetation could influence “the ocean-water vapor-cloud system“. Changes to extent and type of aerosol load (pollen and other spores) would probably do the trick. For that matter, IIRC there have been peer-reviewed papers about how changes to vegetation can influence the flow of water (vapor) and amount of convective heat transfer on a continental scale.
You are no doubt right about the biospheric influence, AK. (I’m certain you are right.) And land use changes have been fingered before. I’m not sure clearing land will lead to a catastrophe – and you didn’t say that it would. It is a fascinating system, the climate. I just wish climate scientists would try to identify the major parts and figure out how they work instead of telling everyone we are going to fry and burning energy trying to convince people they are right. The truth is that they don’t know. The model that used tropical SST as an input looks like a good start to me. I’m sure there are more good attempts out there, it would be nice to see them highlighted on CE.
Not just that: evolution of vegetation patterns under the influence of the PDO (for instance) could constitute a natural source of longer-term memory and variation. Century-scale at least. And prior to and/or without human intervention.
More climate alarmism:
“The canyon has never been seen by humans, who didn’t exist four million years ago. If the Greenland ice sheet melts completely it will raise global sea level by 7 metres and swamp many major cities, so hopefully this is one great geographical feature that won’t become a tourist destination. ”
http://www.bbc.co.uk/news/science-environment-23866810
“..since we are looking at a period of about 3 decades as being the main ‘signal’ from CO2 forcing, we don’t really know how to do the attribution problem on this time scale.” As usual, JC identifies the problem. People (and governments), however, want answers. It’s answers that sell papers, provide grants, give politicians (and pundits) their talking points. Hence the connection to religion, too. Religion gives answers to unanswerable questions. IPCC may be a one trick poney, but it gives the answers people demand. And that answer sells papers, provides grants, and gives politicians and pundits their talking points. It may even be correct, but we won’t know for a long, long time. Whatever the definition and nature of climate variability, periods of global warming (and cooling) occurred regularly before CO2 forcing played a role. Those periods of warming, statistically similar to the recent 1978-1998, and the generally similar 19th and 18th century warming compared to the 20th, make me doubt the confidence levels of the IPCC and others who attribute recent warming to AGW forcing because it also implies the same high confidence level that those unknown or poorly understood forcings responsible for earlier warming and cooling are no longer in play. I doubt that very much.
@ WebHubTelescope (@whut) | August 29, 2013 at 10:43 am |
SpringyBoy, Find me a petroleum engineering textbook that even discusses geological limits on a world-wide scale.
******************
Probably EVERY petroleum geology text book, and petroleum engineers take geology, discusses reserves. Here’s one:
http://www.amazon.com/Elements-Petroleum-Geology-Second-Edition/dp/0126363706#reader_0126363706
Another paper tiger bites the dust.
Reverse the cactus toads!
====================
Oops, that little fella hopped onto a thorny thread.
=============
Oh noes! A view contrary to the Climate Priests!
Witch! Witch! Witch!
Thanks for the reference to that textbook. No mention anywhere of “peak oil” or “Hubbert peak”, even though Hubbert is mentioned for his contributions to reservoir engineering.
The only mention to the finite nature of oil is made in the last couple of paragraphs of the book, where it says that the equivalent of the North Sea basin has to be discovered every year to maintain a production lead.
This is what the last paragraph says, which is quite an alarmist statement:
That is how the petroleum engineers are taught.
Every year, change in CO2 concentration in the atmosphere is proportional to the global mean temperature as shown in the following data:
http://www.woodfortrees.org/plot/rss/compress:12/normalise/plot/esrl-co2/compress:12/derivative/from:1979/normalise
When the global mean temperature is greater, the change in CO2 concentration in the atmosphere is also increases. During lower global mean temperature, the change in CO2 concentration is also lower.
The observed increase in CO2 in the atmosphere is the result of the warm oceans releasing more CO2 into the atmosphere.
Expose the dissolute carbon dioxide; shatter the carbon’s hydrogo bondage.
===================
The only real change over recent years is movement by the public away from the purveyors of global warming alarmmism. It was predicted a long time ago that next IPCC Report would be far more nuanced than previous Reports. Nothing since then makes AGW theory more credible. This winter is expected to be colder than most throughout most of North America. Most of Alaska is descending into an Ice Age. The Western economy is a dead man walking. And, there is one thing that will never change; the UN and the Left of dead and dying old Europe and the Eurocommies in the US will always hate everything America stands for.
Pingback: Why Did the Climatist Cross the Road? | evilincandescentbulb
Are temporal uniformity & spatial symmetry implicitly assumed by JC & “X Anonymous”? (It appears so…)
Thankyou JC. I’m here if anyone has questions.
A quick response to JC summery:
I agree, external and internal processes are difficult to separate. A few comments have mentioned ENSO. El Nino is a potential negative feedback for the following reasons:
1) Cyclical in nature (albeit imperfect, like the rest of the universe), so there is a counteracting force.
2) Very stable (Better luck next time Trentberth)
3)Represents a form of system memory, where energy is moved around.
4)Seasonal, as noted in the essay, periodic forcing is required to create / or pace such internal oscillations. That doesn’t happen in a positive feedback world.
Is warming part of a recovery, or long term cycle? Good question. My believe is that ENSO proves that a large negative feedback is likely, however, I would not go as far as to say ‘case closed’. System memory needs to be determined on longer time scales in order to prove that:
1) The climate sensitivity is low
2) Internal variability is very large
3) Global warming is just internal variability ‘throwing its weight around’.
System memory. Steven Schwartz with a simple two box model produced a pretty good estimate of the ocean time constant for radiant forcing, ~500 years, but to estimate the range of internal variability you would need to focus on which part of the variability is more important and actually convince quite a few that it exists. So instead of a question how about a suggestion?
http://redneckphysics.blogspot.com/2013/08/three-compartment-ocean.html
A simple three compartment model of the oceans?
Hi X anonymous.
You have given us an interesting post.
Please could you give a link to the source of the IPCC’s definition of “climate variability” which you quoted at the beginning of your essay?
Many thanks.
http://www.ipcc.ch/pdf/assessment-report/ar4/wg1/ar4-wg1-annexes.pdf
“Global warming is just internal variability ‘throwing its weight around’.”
—-
Of course proving such a thing would be quite difficult (a nasty problem as it were) under the environment of an external forcing that sometimes acts in concert or sometimes in opposition to internal variability. Further complications arise if it turns out to be the case that the external forcing actually affects modes of internal variability.
If internal variability was very large (in the context of significant climate change), then the probability that human emissions are causing most of the recent warming would be low.
proving that climate sensitivity is low will have nothing to do with current warming, why should it? I can’t see any negative feedback cycles in there (beyond year to year variability).
Of course you could always assume that the biggest change in the system is the leading cause of climate change.
http://s1114.photobucket.com/user/Chief_Hydrologist/media/cloud_palleandlaken2013_zps3c92a9fc.png.html?sort=3&o=19
Chief, the problem there is a very short record with significant errors, but even if it was longer, would it establish negative feedback? I’m sure the warmers would argue CO2 is to blame some how.
If humans emissions did not exist, but the warming trend over the last 100 years was still the same, could it be independently demonstrated that the world is dominated by negative feedback using those same 100 years of temperature data we have now?
I doubt it.
The post is too ambiguous for some of us laymen because it lacks mathematics. I see no reason why positive feedback–either of the engineering kind or the “climate science” kind–need result in instability or be inconsistent with system memory.
Consider first a memoryless system. Let’s say a system’s response y equals some no-feedback amplification A times the stimulus x, which in turn is made up of a before-feedback component x_in and a positive-feedback component f_p * y. Despite positive feedback, the system could still be stable if feedback f_p < 1 / A; the response y would assume the finite value A * x_in / (1 – A * f_p).
This is true a fortiori if we use “positive feedback'' f_p in the climate-science sense, which refers not to the feedback of the system as a whole but rather to something that simply reduces the negative feedback f_n inherent in, e.g., gray-body radiation. That is, instead of simply y = Ax with x = x_in + f_p * y, our (here, still memoryless) system becomes y = A * x – f_n * y, and the solution would be y = A * x_in / (1 – f), where f = A * f_p – f_n, if f is less than unity; that is, the system can be stable–the overall feedback is negative) even in some cases in which the positive feedback f_p exceeds the no-feedback amplification's reciprocal 1/A.
Of course, the climate system has memory, but stability can still result in the face of positive feedback at least of the climate-science type in "memoried" systems as well. Consider in this regard a first-order system dy/dt = A * x – f_n * y, where again there's positive feedback, i.e., where again x = x_in + f_p * y. (Here x_in can be considered the ground-received radiation before additional back radiation from increased water vapor, y is temperature deviation, and A / f is the steady-state ratio of temperature deviation to before-water-vapor-feedback downwelling radiation at the ground.) Such a system's response y equals the stimulus x convolved with the impulse response A * exp(f * t); again, the system is stable (i.e., the impulse response decays with time), despite the presence of the positive feedback f_p, so long as the overall feedback f = A * f_p – f_n – is negative. And I don't believe that proponents of catastrophic anthropogenic global warming in general deny that the overall feedback is negative; they only contend that there's also a positive component that reduces it from what it otherwise would be.
I may not be the only one who would appreciate the poster's including some mathematics to clarify the verbal exposition.
Pingback: CO2 ‘control knob’ fallacy (?) | Climate Etc.
I think ENSO is externally forced, behaving as a negative feedback, with a large overshoot. The correlation is El Nino conditions and episodes during lower solar plasma speeds:
http://snag.gy/UtqpX.jpg