
by Patrick Brown
How we interpret the current slow-down in the rate of global warming depends very much on the length of the ‘leash’ in the true climate system (i.e., how large internal variability is).
Some have claimed that despite a continual increase in global atmospheric CO2concentrations, the global average temperature has not increased in 16 years. This logic is used to advocate the idea that increases in greenhouse gasses do not cause global warming. The purpose of this article is to explain the science behind global temperature change and to discuss the implications that a long ‘warming pause’ might have on our understanding of the climate system
First, it’s important to note that it’s difficult to say if we are really experiencing a pause in global warming. It is true that if you fit a linear trend to the monthly global temperature progression from say, 2001-2012, you get a negative slope. However, if you fit a linear trend from 1975-2000 and then extend the trend through 2012 it is not obvious that recent temperatures have diverged significantly from the previous trend (Fig. 1). Nevertheless, the rate of warming has slowed in the 2000s relative to the 1990s. This article investigates why this might be the case.

Fig. 1 – Monthly global temperatures progression from 1975-2012
What Causes Global Temperature Change?
Before we delve into the specifics of recent temperature variation, we will cover some background on how the earth’s temperature changes in the first place.
Temperature is a measure of energy; therefore the most important factor influencing the mean temperature of the earth is the energy balance at the top of the atmosphere. The earth receives all of its energy from the sun, and reflects a certain amount of that energy into outer space. If more energy enters the climate system than leaves, the result will be an increase in global temperature. This particular cause of temperature variation is an example of an external forcing, and is usually called an “external radiative forcing”. Let’s break this phrase down:
External – Refers to the notion that the cause of temperature change is coming from something exogenous or external to the ocean-atmosphere system.
Radiative – Refers to the fact the change in temperature is being caused by a change in the net radiation balance at the top of the atmosphere.
Forcing – Refers to the notion that the climate is being forced to move in a direction of either warming or cooling by the aforementioned external cause.
The most well-known example of an external radiative forcing is the increase ofgreenhouse gasses produced from burning fossil fuels. Greenhouse gasses inhibit the earth’s ability to release energy to space, therefore, all else being equal, increases in greenhouse gasses cause a buildup of energy within the climate system and result in global warming.
Global temperature can also change due to “internally generated variability”; also known as “unforced variability”. This type of variability is due to the ocean-atmosphere system essentially changing itself through its own chaotic motion. The most well-known mode of unforced variability is called the El-Niño Southern Oscillation (often referred to as the El-Niño, La-Niña cycle). During La-Niña years, heat is buried in the deep Pacific Ocean more readily and thus the global mean temperature at the earth’s surface is a bit lower than it would be otherwise. During El-Niño years, this buried heat is released back to the surface and the global mean temperature tends to be a little warmer than it would be otherwise. In this situation, global mean temperature at the earth’s surface is changing because energy is being moved around the climate system (into and out of the deep ocean) not because there is a net change in the total amount of energy in the system.
However, unforced variability can also change the total amount of energy in the earth system by changing constituents of the surface or atmosphere that interact with the amount of solar energy coming in, or the amount of infrared energy leaving the earth (Herweijer et al., 2005). For example, if some internally generated change in an ocean circulation caused more heat to be distributed to polar latitudes; this could cause sea ice to melt. This melting sea ice would cause less solar energy to be reflected back to space (ice is much more reflective than open ocean) and thus this would increase the total amount of energy in the climate system.
One analogy that could be used to describe the interplay between externally forcedvariability (like increasing greenhouse gasses) and internally generated unforcedvariability (like El-Niño/La-Niña) is that of a man walking a dog (Fig. 2). In this analogy the movement of the man represents the externally forced variability and the movement of the dog, relative to the man, represents unforced variability. The man moves in a rather determinist, predictable path while the dog moves in a more random unpredictable path. Many with engineering backgrounds will recognize this as a signal-to-noise issue. Notice that the dog can only wander a certain distance away from the man before the leash pulls it back toward the general direction of the man. Because of this, the path of the dog ends up being the sum of the path of the man plus the movement of the dog. Analogously, the temperature progression that we can observe is the externally forced component of temperature change plus the internal unforced component of temperature change.

Fig. 2 – Man walking dog analogy for global surface temperature variation (full animation here). The Path of the man represents the component of temperature change that is externally forced. The path of the dog represents the actual observed temperature change which is a result of the addition of the externally forced (path of man) and the internal unforced (movement of dog) components of temperature change.
Notice that if the leash is short, the path of the dog will closely match the path of the man. However, if the leash is long, the path of the man is difficult to infer from the path of the dog.
Knowing how long the leash is in the true climate system is of critical importance for understanding decade-to-decade climate changes of the past and predicting climate change in the near future. For example, the temperature rose in decadal steps in the 20thcentury. It warmed relatively consistently from the 1910s to the 1940s, temperatures were steady from the 1940s to the 1970s, after which they rose from the 1970s to the end of the century and they have not risen much since. If the leash in the true climate system is very short (Fig. 3a), we must explain global temperature changes with changes in external radiative forcings (the path of the man) and for a given future greenhouse gas emissions scenario, we have a pretty narrow range in which temperature can progress. If the leash is long, however (Fig. 3b), then we do not need to evoke external radiative forcings as the cause of the decade-to-decade changes in temperature of the 20thcentury as that particular shape could be the random outcome of internally generated unforced variability (the movement of the dog). Additionally, this would mean that the temperature projections for a given amount of greenhouse gas emissions would be relatively uncertain.


Fig 3. Example of a short leash (a) and long leash (b) climate system. In these plots the length of the leash is represented by the width of the region between the red lines.
It is very important to notice that the length of the leash does not effect where the man will ultimately end up. It only effects how difficult it is to infer the path of the man from the path of the dog. We know from the fundamental physics of the greenhouse effect(known about for over 150 years) that the path of the man will continue on an upward trajectory as humans continue to increase greenhouse gas concentrations in the atmosphere. (where the man is ultimately headed depends on a metric called climate sensitivity).
The length of the leash, however, has vast implications for how we should interpret short-term (~10-30 year) pauses/accelerations in global warming. If the leash is very short than we know that a pause in global warming must have to do with a change in the direction of the man. Under this scenario, it would be possible to interpret a pause in warming as pointing to something fundamental about how the climate system reacts to external radiative forcings. Namely, if the leash is short and temperatures remain flat in spite of increases in external forcings (e.g., greenhouse gas concentrations), then the climate system may be less sensitive to external radiative forcings than we previously thought. If the leash is long, however, the man could be moving up in a constant trajectory but his path is simply masked by the dog moving in the opposite direction.
The Case for the Short-Leash Climate
Traditionally, many climate scientists have favored the short leash view of climate, seeking to explain decade-to-decade changes in temperature with external radiative forcings. As mentioned above, consistent warming was observed from the 1910s to the 1940s, steady or slightly cooling temperatures were seen from the 1940s to the 1970s and warming recommenced from the 1970s to at least the 2000s. It has been suggested that early twentieth century warming was at least partially attributable to an increase in energy produced by the sun (Stott et al., 2000, Stott et al., 2006). Additionally, the mid-century pause in warming has been attributed to increased concentrations of human-made aerosols (Stott et al., 2000, Stott et al., 2006, Meehl et al., 2004, Wild et a., 2009) while the late century acceleration in warming has been proposed to be due mostly to increases in greenhouse gasses in the atmosphere (e.g., Hansen et al., 2005). This short leash view of climate is best exemplified by Fig. 4.


Fig. 4 – Example of how temperature changes over the 20th century can be explained with a short leash model of climate (from Hansen, 2005, 2011). A) Progression of individual components of external radiative forcings. B) Progression of the total external radiative forcings (path of the man). C) Comparison of the observed temperature progression with that calculated from five different runs of a climate model that incorporated the external radiative forcings shown in B.
So does Fig. 4 prove that the leash in the true climate is short? Not necessarily. The radiative forcings produced from human-made aerosols (blue line in Fig. 4a) are actually extremely uncertain (as can be seen by their large error bar). If slightly different values had been chosen for this component, then the match between the climate model runs and observed temperature in Fig. 4c would not be nearly as good. This leaves open the possibility of a long leash climate system.
The Case for the Long-Leash Climate
Along with El-Niño/La-Niña, two other important ocean circulations that are essentiallyunforced are the Atlantic Multidecadal Oscillation (AMO) and the Pacific Decadal Oscillation (PDO) (Fig 5). It is already well established that El-Niño can effect global mean surface temperature on the year-to-year time scale (e.g., Neelin, 1998). But it has only recently been suggested that decade-to-decade ocean circulations like the AMO and PDO also can affect global mean surface temperature in a similar way (e.g., DelSole et al., 2011, Swanson et al., 2009, Meehl et al., 2013). If this is the case, then the leash might be much longer than previously thought.
Fig. 5 shows the global mean monthly surface temperature from 1900 to 2011 along with the AMO index and PDO index. The AMO, in particular, seems to mimic the decade-to-decade variability in the surface temperature.

Fig. 5 – Monthly time series of global surface temperature (top panel), the AMO index (middle panel) and the PDO index (bottom panel).
If we assume that the AMO and PDO can affect global surface temperatures in a similar way in which El-Niño/La-Niña do, then we can use a statistical technique called multiple linear regression to remove the influence of the AMO and PDO from the surface temperature record (similar analysis was performed by Zhou and Tung, 2013). The results of this are shown in Fig. 6.

Fig. 6 – Comparison between the observed surface temperature (black) and the surface temperature that would have occurred without the influence of the AMO and PDO (blue). The smoothed blue line can be thought of as an estimate of the temperature progression resulting from external radiative forcings alone (i.e., the path of the man).
Fig. 6 illustrates an estimate of the path of the man (thick blue line) and the path of the dog (black line). If we assume that the AMO and PDO can influence global temperature then we see that they account for most of the decade-to-decade variability in the rate of warming over the past 112 years. Times when the observed temperature was moving up faster than the externally forced temperature change (1900s to 1940s and 1970s to 2000s) were times when unforced internal variability was amplifying warming (the dog was on a steeper trajectory upwards than the man). On the other hand, times when the observed temperature was moving up slower than the externally forced temperature (1940s to 1970s) were times when unforced variability reduced the rate of global warming (the dog was moving downwards while the man was moving upwards). Notice that under this interpretation the rate of human-induced global warming over the past few decades has been cut approximately in half (similar conclusions have been reached by DelSole et al., 2011, Wu et al., 2011 and Toung and Zhou, 2013 among others). This is in contrast to the short leash view of Fig. 4 in which virtually 100% of warming over the past few decades has been due to external radiative forcings from human activities.
Does Fig. 6 prove that the leash is long, and that the true underlying rate of global warming is relatively slow? Not necessarily. The fundamental problem with analyses such as the one above (and in Zhou and Tung, 2013) is that the statistical method assumes that the AMO/PDO could cause global temperature change, yet that global temperature change could not cause variation of the AMO or PDO. This assumption is almost certainly violated because the AMO and PDO themselves are measures of temperature variability. Therefore, it is difficult to separate any temperature change that might be influencing the AMO or PDO from temperature change that they might be influencing.
When Will the Warming Recommence?
As mentioned previously, the fundamental physics of the greenhouse effect are beyond any reasonable doubt and therefore we expect warming to recommence in the future as we continue to emit greenhouse gasses. But when will the warming recommence? The answer to that question seems to rest heavily on the length of the leash in the true climate system.
If the leash is short, as is implied in Fig. 4, then we should expect warming to recommence in the very near future. This is because, in the short leash view, the linear trend from 1975 to the 2000s has been thought of as representative of the trend caused by external radiative forcings (Santer et al., 2011). Under this view, we should not expect temperatures to fall very much outside the shaded confidence interval in Fig. 7 (the size of the confidence interval equals approximately the length of the leash). Since we are currently approaching the lower limit of that confidence interval, we would expect temperatures to progress back up towards the long-term trend within a year or two.

Fig. 7 – Observed temperature progression from 1975-2012 with the trend and confidence interval associated with the 1975-2000 data extended to the year 2050.
If the leash is long, however, and the externally forced component of temperature change is in fact moving in a manner similar to the blue line in Fig. 5, then temperatures may not increase significantly for decades to come (Fig. 8). This would not necessarily mean that we expect any less warming from increases in greenhouse gasses in the long run but it would suggest that long-term temperature increases would be slower than previously suspected.
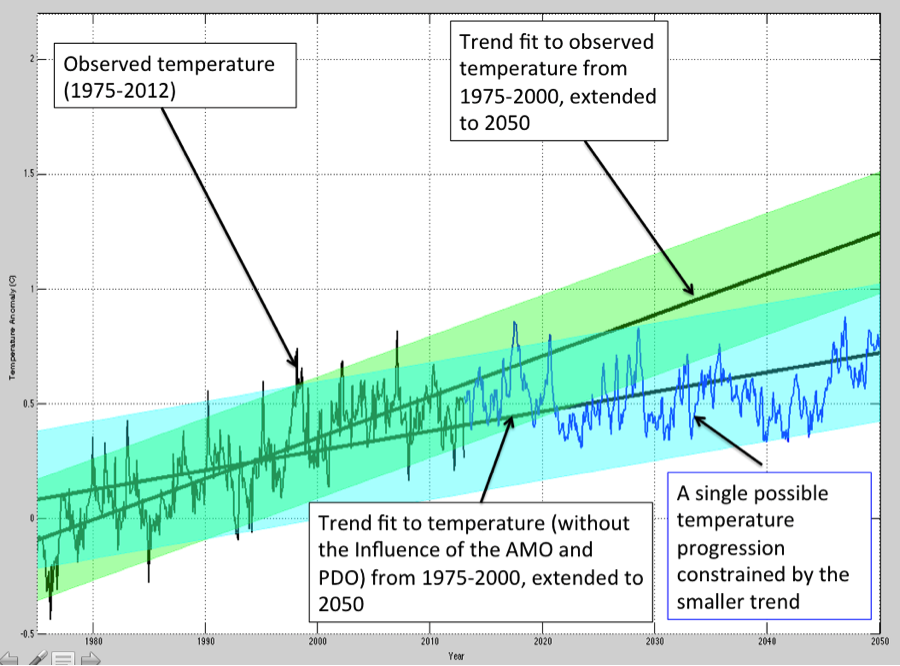
Fig. 8 – Illustration of a possible trajectory of temperature progression under the long leash scenario compared to that expected if the trend from 1975-2000 remained constant
In sum, how we interpret the current slow-down in the rate of global warming depends very much on the length of the leash in the true climate system (i.e., how large internal variability is). If the leash is short than we should expect warming to recommence quickly in conjunction with continued emissions of greenhouse gasses but if the leash is long, the future is much less certain. This is an area of active research and improved models and observation systems are helping to understand the issue. Hopefully, science can zero in on the leash length soon so that the public and policy makers have the best possible information to work with.
Biosketch: Patrick Brown is a PhD student in Earth and Ocean Sciences at Duke University.
JC comments: I received this post from Patrick via email. I like the dog-on-a-leash analogy. I applaud Patrick’s efforts in communication and engagement with the public on the topic of climate change, definitely something I would like to see more of in the new generation of climate scientists.
Moderation note: This is a guest post; comments will be moderated for relevance and civility.

“Temperature is a measure of energy;” Well, this is wrong right off the bat. Have you ever heard of heat capacity?
jim2: “Temperature is a measure of energy;” Well, this is wrong right off the bat. Have you ever heard of heat capacity?
Temperature is proportional to the average kinetic energy of the molecules in the near vicinity of the thermometer. Thus, it is “a measure of energy”. No claim was made that any particular temperature was a measure of the global energy. Getting global energy from spatio-temporally averaged temperature measurements is clearly an inference, as everyone understands.
I think few people understand that this is an inference. Most take it erroneously to be an observation.
“No claim was made that any particular temperature was a measure of the global energy.”
That claim may not have been made in this post, but it is the central claim of the whole CAGW debate. It is why the consensus first used the term “global warming,” before their reported (surface) temps stopped showing warming..
“sipping a Cortney Benham chardonnay that has been chilled and has an ice cube in it”
_______
GOOD GOD !
“Temperature is proportional to the average kinetic energy of the molecules”
In a gas, temperature is proportional to the average kinetic energy of the centre-of-mass motions of the molecules. The thermometer complicates things.
Temperature is a measure of motion. Kinetic energy. Tyndall. 1868. Heat: A Mode of Motion. http://books.google.com/books/about/Heat.html?id=MwwAAAAAQAAJ whole book is scanned & free to read. Good starting point.
What the heck are they teaching kids nowadays?
They taught me that a glass of water that contains melting ice gains energy but the temperature remains the same.
Lordy Jim
I’m sitting on patio deck sipping a Cortney Benham chardonnay that has been chilled and has an ice cube in it. The ice is to help keep thetemp from going up. One has to be retarded tothink the wine is not absorbing energy.
timg56,
Good choice for a “science” experiment. Of course, whether or not any given molecule of wine will absorb a bit of energy depends on many factors, far so many in fact that you’re better of just drinking the wine.
Gates,
Perhaps you are anal retentive enough to think of wine molecules. I see no reason to go smaller than a glass of the stuff.
jim2 “Temperature is a measure of energy;” Well, this is wrong right off the bat. Have you ever heard of heat capacity?
Temperature is a measure of energy if the mass of surface water engaged in the solar energy exchanged is the same. However, this mass is variable. Therefore, surface temperature is not a good measure of energy. Sea level rise is a better measurement of energy. More accurately both have to be considered. Sea level has been on the rise. The notion of global warming slow down is questionable.
Radiation, Water, Ice and More
Radiation cooling has bounded the temperature of the Earth Forever. It works, but the bounds are very large by modern standards. It has no set point.
Only Water changes state in our comfort zone with a set point. The Polar Ice Cycle developed and tightened the bounds of Earth Temperature.
Water Vapor accounts for ninety some percent of the Radiation Cooling.
Water was put on earth to regulate temperature and help living things. Water, Water Vapor, Ice, and Clouds, that is: Water, in all of its states, does control the temperature of earth.
CO2 was put on earth to help a trace amount with the cooling and to help a huge amount with the living things.
The drift of the continents and the evolution of the ocean currents and the development of the polar ice cycle perfected the bounding of earth temperature.
ICE and Water has a set point. When oceans get warm, sea ice melts and Huge Snowfalls Occur. This builds ice volume on land which advances after some many years of snowfall. When the Polar water gets cold and frozen the huge snowfalls stop. The ice volume is like a huge charged capacitor and the ice advance continues, but without snowfall, ice volume starts to decrease immediately. More ice melts every summer than gets replaced. The ice advance continues and runs out of capacity after a good number of years. Clouds are used in this process. When the ice is building it is protected by many clouds. When the ice is being removed, the clouds are not there.
The experts think the ice volume increases right up to the ice extent max, but it really cannot happen that way. They build ice because something external caused earth to get cold. They take away ice because something external caused earth to get hot. They start taking away the ice when earth is still cold. They don’t have an external forcing that has a set point. Their basic theory cannot work.
We need the Cycles. We do not have one fixed temperature that can be maintained. We have a cycle with powerful bounds. Ice and Water has a set point and does maintain the bounds.
Radiation can bound temperature in wide bounds with no set point and the bounds can change a lot with changes in external forcing. This is how earth was. Radiation Bounds have no Fixed Set Point.
Ice and Water have a fixed set point and the bounds stay the same with large changes in external forcing. This is where we have been for the 800k years of large cycles of ice age and warming. The modern ten thousand year cycle is even more tightly bounded. Earth evolved to this state and it will continue. This is how Earth is now:
The Sun melts Ice every Summer. The Sun melts Land Ice and Sea Ice every Summer. Snow falls and replaces Land Ice and the cold freezes Sea Ice every Winter. When there is more water exposed in the Summer, it Snows more in the Winter. When there is less water exposed in the Summer, it Snows less in the Winter. This is the SET POINT that puts the tight bounds on Temperature.
A trace of CO2 cannot kick us out of this modern paradise; it can only help green things grow better using less water.
Start in a warming phase, such as the past 130 years, since we had thermometers and could measure and record temperature. The land ice has been receding and the oceans have been warming and rising and sea ice has been receding. With the warming of the polar oceans, the snowfall has been increasing. The snow falls on bare ground and on glaciers and ice fields. The snow that falls on bare ground at the edges of ice fields and around the tails of glaciers mostly melts every summer. Much of the snow that falls on glaciers and ice fields becomes multi-year ice. This multi-year ice builds and gains weight and after some years the multi-year ice starts to advance. As the multi-year ice advances, earth cools and the oceans cool. Ice volume is still increasing. At some point the oceans get cold enough and the water freezes and the snowfall stops or greatly reduces and the ice volume stops increasing and starts decreasing. The Piled up ice is still heavy and continues to advance. The Piled up ice gradually runs out of capacity to continue pushing the ice and the advance stops. The cooling stops. The sun has been melting more ice than was replaced, but now the ice starts to recede and the earth starts to warm again. Land ice is receding and the edges of the sea ice start to recede. At this point you can go start at the beginning of his paragraph again, and again.
Consensus Theory uses orbit parameters and solar cycles and CO2 to make earth colder and then builds ice by letting the snow that fell on bare ground survive the summers and grow the ice at the tails of glaciers and edges of ice fields. There is no evidence that supports this method. The glaciers advance and drop stuff they picked up on the way. They do not develop at the edges and tails. They develop at the tops and then when they are big enough they advance.
Short leash, long leash, bah. There’s a back door to the doghouse and the horse is out of the barn.
=============
Oh, sorry Guest, relevant though cryptic, but decidedly uncivil. What if, dear Patrick, the millenial scale changes have turned to cooling?
====================
More like a wolf – never been on a leash and won’t take kindly to the attempt.
‘The climate system is an angry beast and we are poking it with sticks!’
Wally Broeker
.
Ah – Broecker
Phuck the climate. The great thing about being an engineer is knowing you can fix whatever you break. I doubt we’re breaking anything and if it does get broken we can fix it when it happens.
‘The argument from ignorance is characterized and shown to be sometimes persuasive but normally fallacious.’
http://philosophy.lander.edu/logic/ignorance.html
A bit of self-reflection from Chief Kangaroo Skippy Elison.
An encouraging sign. The first step in recovery is knowing you have a problem.
Nah nah – I aren’t you are. Worthy of a schoolyard.
The ignorance stems of course from the assertion that he doubts whether adding CO2 is a risk and that we can geoengineer if it turns out badly. So ignorance on 2 counts – first that we can understand the immense, complex, multiply coupled, nonlinear system with a few lines of narrative and secondly that we are capable of doing other than chasing our own tails in adapting to abrupt and nonlinear climate change – when it happens quite soon in the scheme of things.
Jabberwock is silliness run amuck and symptomatic of all that is increasingly anti-intellectual and anti-science on this site. Far from an eSalon which was the goal in the early days – it has descended into a maelstrom of juvenile posturing, insane non-science repeated ad nauseum at every opportunity and monomanias spewed forth with predictable regularity.
Yeah, whatever.
The thing about taking a dog for a walk on a leash is that you always end up where you started. The trend line of the walk is meaningless because it’s a circle.
Damn good point. The man/dog/climate analogy is comedic to start with and that’s the ultimate punchline for it! Bravo.
Combusting trillions of barrels of oil that was originally sequestered under ground is going around in a circle. Brilliant genius, roll my eyes.
To explain my comment. There has been much discussion about heat moving into the ocean rather than the atmosphere. The heat capacity of air is much, much less than water in the ocean. Therefore, if all the heat moves into the ocean, to consider an extreme, there will be little warming. If all is absorbed by the atmosphere, there will be a lot of warming.
You are right that you can get a global mean surface temperature change without a net global energy flux change (via the vertical redistribution of heat in the system). This is one of the main types of unforced variability that the article is discussing.
I appreciate the post. I almost alway learn something from someone for every post. I have a couple of questions, if you don’t mind.
WRT the Arctic ice cap. The major considerations (and I’m making this up as I go along, so if something is missing or something does not belong, jump on it) are 1) sea ice 2) cloud cover, 3) the radiation temperature of space.
Let’s take the two extreme circumstances. First polar Winter, no Sunlight. The cloud fraction is is 0.5. If there is less ice, the water is exposed to the radiation temperature of the Arctic atmosphere and secondarily to space. It seems there is ample opportunity for the Earth to shed heat given the temperature difference between the air temp and space.
Then, Arctic Summer. Cloud fraction is 0.8. Also, the Sunlight impinges at a very shallow angle. All of this conspires to minimize the heating due to the Sun’s radiation. The clouds have offset the loss of ice albedo. (See link below.)
So, what is the net effect of the Arctic over the year? Net cooling, or net heating?
“Kato quickly understood why: not only is the Arctic’s average cloud fraction on summer days large enough—on average 0.8, or 80 percent—to mask sea ice changes, but an increase in cloudiness between 2000 and 2004 further hid any impact that sea ice and snow losses might have had on the Arctic’s ability to reflect incoming light. According to the MODIS observations, cloud fraction had increased at a rate of 0.65 percent per year between 2000 and 2004. If the trend continues, it will amount to a relative increase of about 6.5 percent per decade. At least during this short time period, says Kato, increased cloudiness in the Arctic appears to have offset the expected decline in albedo from melting sea ice and snow.”
http://earthobservatory.nasa.gov/Features/ArcticReflector/arctic_reflector4.php
http://www.arctic.noaa.gov/detect/climate-clouds.shtml
One could consider ice caps to be capacitors of cold, in the sense that an electron missing from a crystal lattice is a “hole.” In colder climes they store cold, in warmer climes they release it. Kind of a moderator.
The ice also insulates the water underneath it. When the ice is gone, the water can equilibrate with the atmosphere and space – both of which are pretty cold at the poles.
jim2 | July 13, 2013 at 10:34 am |
Yay, verily, the ocean bottom. That is a neat place to hide that missing heat. Did you know that Trenberth and Fasullo at one time lost 80 percent of global energy somewhere in the ocean and nobody as yet has been able to find it?
Whatever is happening with the heat is the same thing that happened with the heat during the Roman and Medieval Periods when they had warmed to this stage. What happens next is another cool period like what followed those warm periods. We don’t need to know where the heat went. It went to the same place this time as it did in all the other times. What follows will be the same or very similar. This ten thousand year Paradise will continue until something major changes. Data shows that CO2 is just wandering off and not dragging temperature with it. CO2 is not driving anything or CO2 is driving something so small it can’t yet be measured. For warming, the influence of a Manmade fraction of CO2 is not supported by any data.
Again, we are trying to divine a few tenths of a degree from a very noisy system measured by an inadequate system of sensors.
Excellent post by Patrick. A few things to ponder:
Ocean cycles are one thing that may have a longer or shorter leash, but we also need to know what the sum of all external forcings are, to really understand how long or short a leash we have from internal variability, don’t we?
The idea that we can conceptually separate external forcings from internal unforced variability is fantastically wrong wrong wrong. Climate science won’t go anywhere until second-order effects are included (how internal variability affects and is affected by external forcings).
“Climate science won’t go anywhere until second-order effects are included (how internal variability affects and is affected by external forcings).”
Imagine that.
Climate scientists do consider the phenomena of external forcings feeding back on internal variability (see here for example: http://tinyurl.com/np9pg86). However, to a first approximation, it appears as though externally forced and internally generated variability can be separated linearly (e.g., http://tinyurl.com/ooayfdp)
Patrick, yes, they do consider internal variability but there are several ways to do that. Using “surface temperature” as a metric, variability and differences in smoothing can let you find about any answer you like.
https://lh5.googleusercontent.com/-yCVnY6nXIiQ/UZmVEhGt-oI/AAAAAAAAIJs/EozQSkgn614/s817/IPWP%2520spliced%2520with%2520cru4%2520shifted%2520anomaly%2520from%25200ad.png
If you focus more on heat capacity than “surface temperature” you get a different look. Since ENSO and PDO are known “unforced variations” it seems to me that regions that are highly related to ENSO/PDO would be better for determining past “unforced variability”.
That is Oppo 2009 which has a neat binning for splicing.
This is what I did,
http://redneckphysics.blogspot.com/2013/05/how-to-splice-instrumental-data-to.html
Budding scientists should stay away from the joke that The Cappy has become. Plenty of climate science research to review before one can appreciate the clown show.
Ocean cycles affect solar output?
Nah, no thanks….
No, but general tidal aka gravitational forcing can affect ocean cycles and solar output. If you only consider radiant forcing and not the mechanical, you miss the bigger picture.
‘The top-of-atmosphere (TOA) Earth radiation budget (ERB) is determined from the difference between how much energy is absorbed and emitted by the planet. Climate forcing results in an imbalance in the TOA radiation budget that has direct implications for global climate, but the large natural variability in the Earth’s radiation budget due to fluctuations in atmospheric and ocean dynamics complicates this picture.’ http://meteora.ucsd.edu/~jnorris/reprints/Loeb_et_al_ISSI_Surv_Geophys_2012.pdf
Yes ocean and atmospheric dynamics are driven by TSI in large part – and in turn result in changes in albedo. Simple hey?
Oh, this is quite to the point, bravo Patrick:
“The fundamental problem with analyses such as the one above (and in Zhou and Tung, 2013) is that the statistical method assumes that the AMO/PDO could cause global temperature change, yet that global temperature change could not cause variation of the AMO or PDO. This assumption is almost certainly violated because the AMO and PDO themselves are measures of temperature variability. Therefore, it is difficult to separate any temperature change that might be influencing the AMO or PDO from temperature change that they might be influencing.”
R. Gates, I agree that it was good of Patrick to have put that in. It is possible for a steady accumulation of heat, due to CO2, over the last decades, to have produced complicated but subtle changes in the observable oscillation, producing the appearance of all kinds of non-intuitive changes; these, as well as the apparent step change in global mean temp that followed the 1998 El Nino. This is especially true when you consider the spotty temperature record that we have available to us.
I mostly express skepticism that the hypothesized effect of CO2 has been demonstrated by this or that analysis. I also from time to time, like now, express skepticism that the hypothesized effect of CO2 can be ruled out by this or that analysis of extant data. I don’t know whether you, or anyone for that matter, has followed the exchanges between Vaughan Pratt and me, but when he first put up his model I wrote that he might have found the “Holy Grail” — the best estimate to date of the joint effects of increased CO2 and the natural variability independent of CO2. I also have written that it is “only one more model” and his results don’t rule out the possibility that CO2 is having no recent (past century and a half) effect on global spatio-temporally averaged temperature.
Climate sensitivity might be linear to the point where we no longer have any sea ice left to melt off. Until then we have a valve where insulation over the northern ocean is removed as warmer waters head up from the tropics. Climate models notably underestimated the loss rate of Arctic sea ice. This allows the northern ocean to dump heat a lot faster. The net effect is an unexpected feedback dampening climate sensitivity at least as long as there is sea ice to lose and there’s still plenty to lose, in the winter and in the southern ocean where it isn’t declining yet at all.
I second Gates and welcome this contribution. This is a very good summary of the state of knowledge as I would see it. I favor the short-leash view which is illustrated best with 30-year running climates. When you do this with the surface temperature records, you see the early 20th century acceleration (partially solar I would say), mid-century pause (aerosol forcing and global dimming), and late century acceleration that is not yet affected by the pause in the 30-year average. I have posted the plot several times and will spare people this time.
JimD
I favour the dog running in all directions off the lead whilst the master tries to bring him to heel.analogy
And I favour real world decadal variability rather than a theoretical 30 year running mean.
But it was a good article. Lets hope young Patrick doesn’t forget the need for humility unlike certain other scientists recently posting here.
tonyb
Unctuous sanctimony. Leave him be Tony B.
Students have research libraries and access to staff and fellow students that they can bounce ideas off of. As if suggesting humility is the key to research success. Climate science is just a research field just like any other.
If you spend decades proving that CO2 is, or is not, causing a dangerous problem. If you do not have data that shows temperature is outside the bounds of the past ten thousand years. If you spend decades and cannot prove that CO2 has any connection to recent temperature, it is well past time to say. something different is bounding Earth temperature and we really need to put CO2 aside and look for something different.
Earth temperature has a set point. Of all the things the have any influence on Earth Temperature, there is only one thing that has a set point and powerful influence when the set point is breached.
The temperature that Sea Ice Melts and Freezes is the set point for earth temperature.
When the oceans are warm and wet, it snows more and bounds the upper temperature of earth. When the oceans are cold and frozen, it snows less and bounds the lower temperature of earth.
The case fer the long leash say I think i read it. Curious
incident … Didn’t it feature a famous sleuth?
Lol. The temperature isn’t barking, though I suspect some climate alarmists are.
There’s a description I like, not to direct directly to anyone,
it’s ‘barking mad.’ )
One thing that would be quite interesting to me would be to see a multiple linear regression done as in figure 6 above, that includes both the PDO and AMO, but with the Gliessberg cycle included. We could really start to see the underlying forcing from GH gas additions. See:
http://www.newscientist.com/article/dn23865-suns-quiet-spell-not-the-start-of-a-mini-ice-age.html#.UeFlPsu9KK0
‘Abstract. Solar activity during the current sunspot minimum has fallen to levels unknown since the start of the 20th century. The Maunder minimum (about 1650–1700) was a prolonged episode of low solar activity which coincided with more severe winters in the United Kingdom and continental Europe. Motivated by recent relatively cold winters in the UK, we investigate the possible connection with solar activity. We identify regionally anomalous cold winters by detrending the Central England temperature (CET) record using reconstructions of the northern hemisphere mean temperature. We show that cold winter excursions from the hemispheric trend occur more commonly in the UK during low solar activity, consistent with the solar influence on the occurrence of persistent blocking events in the eastern Atlantic. We stress that this is a regional and seasonal effect relating to European winters and not a global effect. Average solar activity has declined rapidly since 1985 and cosmogenic isotopes suggest an 8% chance of a return to Maunder minimum conditions within the next 50 years (Lockwood 2010 Proc. R. Soc. A 466 303–29): the results presented here indicate that, despite hemispheric warming, the UK and Europe could experience more cold winters than during recent decades.’ http://iopscience.iop.org/1748-9326/5/2/024001/fulltext/
We might find that the AMO and PDO are not independent of solar activity.
‘As for when the next Maunder minimum may happen, DeToma will not even hazard a guess. “We still do not know how or why the Maunder minimum started, so we cannot predict the next one.”
That’s a pretty amusing article, in an ugly, dissonant sort of way. Concession that the LIA was down to the Maunder, and discussion of sunspots without mention of Livingston and Penn.
Maybe google doesn’t list ’em anymore.
==============
er, I meant RG’s link, in case you couldn’t tell.
Watch out for large, sparse, and primarily southern hemispheric sunspots, as during the Maunder Minimum. Why primarily southern hemispheric? Gee, I wish I knew.
==============
Large and sparse can be explained by L&P’s findings, but not the hemisphericality; that seems downright tidal. There, I said it.
=============
Chief Hydrologist | July 13, 2013 at 12:10 pm | Reply
“As for when the next Maunder minimum may happen, DeToma will not even hazard a guess. “We still do not know how or why the Maunder minimum started, so we cannot predict the next one.””
We don’t need to know how or why to make a good prediction. People didn’t used to know how or why the sun rose in the east and set in the west but they were pretty good at predicting it. Patterns tend to repeat and that’s what climatology and weather forecasting is all about.
Chief Hydrologist | July 13, 2013 at 12:10 pm
We might find that the AMO and PDO are not independent of solar activity.
AMO appears to be linked indirectly to the solar activity
http://www.vukcevic.talktalk.net/SSN_NAP.htm
for PDO ?
Well the other actual study – as opposed to a New Scientist article – gives it an 8% chance in the next 50 years.
Vuk – it is related to solar UV modulation of the Arctic Oscillation pushing more or less cold water down the Californian Current.
Chief
It is a puzzle that science will have to face one day, many places you look at you find geology and climate have an apparent relationship.
California Current is result of the Kuroshio (warm) – Oyashio (cold) currents balance http://www.vukcevic.talktalk.net/NoaaD.htm
I am not convinced that UV has sufficient energy content to do much, tectonics in critical places does.
It, erl Happens I’m inclined to UV rays and/or ozone but cosmic rays are so seductive; tectonics make me shudder, and, curiously, shiver.
====================
Yep..
Kim
it is a frightening elemental force, I have experienced its destructive power in 1979 but again some consider that Plate Tectonics Could be Essential for Life
Heh, thanks for that link. It seems obvious once imagined. I may be misreading, but he seems to have the plate/interior movement causation backward. Recycling of the nutrients sounds so wonderfully sustainable however. How did we get this best of all possible worlds?
=======================
The Californian Current is the western arm of the North Pacific gyre. The flow is dependent on the state of sea level pressure in high latitudes. This is influenced by solar UV interactions with ozone in the stratosphere.
Is not tectonics just a little slow?
Thanks JC and Patrick for this article.
If you want to save the CO2 nonsense, there are two very good options:
a) after controlling for all the natural variability you can think of, attribute what is left to CO2 (begging the question).
b) if what is left still doesn’t conform to your theory, invoke “stuff that just happens.” No need to investigate further.
pochas | July 13, 2013 at 11:35 am |
Except “begging the question” begins with words framed in the form, “If you want to save the CO2 nonsense..”
Everything after that becomes foregone conclusion supporting the false premise.
http://www.woodfortrees.org/plot/esrl-co2/normalise/offset:0.27/detrend:0.27/plot/esrl-co2/normalise/offset:0.45/detrend:0.27/plot/hadcrut4gl/last:108/mean:29/mean:31/plot/hadcrut4gl/from:1994/to:2003/mean:29/mean:31/plot/hadcrut4gl/from:1984/to:1993/mean:29/mean:31/plot/hadcrut4gl/from:1974/to:1983/mean:29/mean:31/plot/hadcrut4gl/from:1964/to:1973/mean:29/mean:31/plot/hadcrut4gl/from:1954/to:1963/mean:29/mean:31/plot/hadcrut4gl/mean:83/mean:89/from:1954/plot/hadcrut4gl/last:384/trend/plot/hadcrut4gl/last:96/trend
Isaac Newton, over 300 years ago, set out the Principia all Science uses to avoid this trap.
What is the most parsimonious, simple, and universal explanation for the observed data? That one we deem accurate or very nearly true, until such time as the data requires we amend or dispose of the explanation.
These words, reasoned by Isaac Newton’s cold logic three centuries ago, and tested by the great minds of Science of his time with whom he corresponded, and open to challenge by every philosopher of Science since, and never overthrown on reasoning or by any test, show your argument to be entirely wrongheaded.
Your narrative is untrue. We need hear no more of it. Which, sadly, we’ve learned we can expect we will be disappointed in.
I liked the clarity in this summary – thanks Patrick and JC.
It would be nice to see a list of possible negative feedbacks to CO2-based warming (eg: cloud cover, cloud height; distribution of water molecules in upper and lower atmosphere; increase in biota, endless etcs..) with how far they would need to change to obviate any warming, and any observations suggesting they are already doing so. This should help in establishing the ‘leash length’.
You beat me to it!
I didn’t read anything new to me in this post, but it was well and clearly written. I add my thanks to Patrick and Prof. Curry.
Matthew
The thing that is new is that he is saying IPCC’s “0.2 deg C/decade warming for the next two decades” could be wrong.
Girma: The thing that is new is that he is saying IPCC’s “0.2 deg C/decade warming for the next two decades” could be wrong.
For whom is that new? It isn’t new to me.
“During La-Niña years, heat is buried in the deep Pacific Ocean more readily and thus the global mean temperature at the earth’s surface is a bit lower than it would be otherwise. During El-Niño years, this buried heat is released back to the surface and the global mean temperature tends to be a little warmer than it would be otherwise.”
This is the first time I have seen this explanation of why el Ninos and la Ninas have such a dramatic effect on the supposedly “global” average temperature. And it differs greatly from the answers I have seen from other consensus types.
Here and at Real Climate, when I asked, I was told that the reason they have such an effect is the increase or decrease in clouds. If they are in fact merely the reflection of heat/energy that is concentrated, then released, but already in the global climate system, then they don’t really reflect any increase in global average temperature.
Not to mention most explanations of el Ninos I have seen reference a build up of warmer surface water in one part of the Pacific as the result of trade winds, not a release of any hidden heat.
So which is it?
And how precisely has heat “buried” in the “deep Pacific Ocean”, where temperatures are much lower than the sea surface or atmosphere, “released: into those warmer areas of the global climate system?
I recall reading something recently by Gavin Schmidt where he said the heat that may be accumulating in the deep ocean will not be released any time soon, and is no real present danger. That certainly doesn’t square with the “missing heat,” hiding in the “deep ocean,” being “released” during decadal oscillations.
The more discussion I see of these two phenomenon, by the consensus, the more I come to believe that they don’t even agree among themselves what is going on with these oscillations. Which is another way of saying they don’t understand. Which I do not find hard to believe at all.
If y’all can’t even agree on what is happening during el Nino’s, or why they have such a drastic effect on average temps, then why should anyone believe you understand the much more complex matter of the climate as a whole?
That people think Gavin changed his mind about deep-ocean heat coming back out is an indication some people have never paid any attention to what he says. He’s never believed it can come back out.
JCH,
Where did I say Schmidt changed his mind? I merely pointed out that his statements on the issue vary greatly from those of the guest poster.
Sorry, you didn’t. It was somebody else on other threads.
Buried is perhaps a bad term. But to think it means deep ocean here makes no sense. Perhaps the author will clarify.
El Nino is the significant lessening of the upwelling and downwelling exchanges with the deep ocean. El Nino begins a different exchange of water not included in the SST measurement. That’s likely what he means by buried. Its mounded hot water in the Western Pacific, much of which is not included in the SST measurement. A lot of it ends up on the Pacific surface.
JCH,
His claim is “heat is buried in the deep Pacific Ocean.” I didn’t infer “deep” ocean from the term “buried.” I quoted what he wrote.
I am beginning to wonder if there is a bigger dispute among the consensus than is apparent as of yet. I do not expect a PhD student to have the same scope of knowledge as a scientist who has been studying climate for decades. But I do expect he has been taught the latest state of knowledge on the topics he is raising.
This may have been a typo, or a “poorly chosen term.” But is seems quite straight forward to me. And seems more in line with Trenberth’s claims regarding “where the missing heat is” (it is a Trenberth paper he cites to for general info), and how soon we are likely to see it.
I do hope he responds, which is why I asked in another comment below. I would like to know whether this is a simple case of misstatement, or reflects a genuine difference of opinion among the consensus.
It seems to me it has to be one or the other, and I am curious as to which it is.
Lol. Well, I don’t think “deep” is an especially good term.
lurking deeply below that weird thing they call the SST measurement area
JCH,
Well, if by “deep” he meant 150m, that would probably be just a poor choice of words. (Although, were I to find myself 150m under the sea surface, I suspect I would consider that deep indeed.)
But there still seems to be a genuine split among the consensus on the issue of how much heat is being “hidden” in the oceans, and just how soon and how dangerous the release of that heat is. Not to mention how much of a problem for the consensus it would be if the “missing” heat weren’t there at all.
I don’t think there is a disagreement. That would require scientists think the 2nd law can be violated, and it can’t be. And I do not believe any of them believe it can be.
Words and sentences don’t deal very well with the precision needed to discuss the timescales and complexities.
CERES data show that clouds have a net radiative warming influence during La Niña conditions and a net cooling influence during El Niño, but the magnitude of the anomalies varies greatly from one ENSO event to another.’ http://meteora.ucsd.edu/~jnorris/reprints/Loeb_et_al_ISSI_Surv_Geophys_2012.pdf
So we seem to get planetary cooling in El Niño as fewer clouds and higher atmospheric temps increase IR losses to space more than offsetting the decrease in reflected SW. The reverse happens in La Niña.
ENSO (El Niño-Southern Oscillation) is the technical name given to the most prominent source of inter-annual variability in weather and climate around the world. Its ocean temperature signatures, the more widely-known La Niña and El Niño, corresponding to different phases of the oscillation, are officially defined as sustained sea surface temperature anomalies of magnitude greater than plus or minus 0.5°C across the central tropical Pacific Ocean. Technically in the Nino 3.4 region.
When ENSO is in the phase known as La Niña, the Pacific trade winds blow true and strong causing sun warmed surface water to pile up against Australia and Indonesia. Cold subsurface water rises in the east and propagates across the equatorial Pacific. .
In an El Niño, the trade winds falter and warm water spreads out eastwards across the Pacific Ocean. La Niña and El Niño are the poles of the El Niño Southern Oscillation (ENSO).
ENSO has a influence on global surface temperatures, Australian, American, Indian and African rainfall and Atlantic cyclones. ENSO varies between La Niña and El Niño states over 3 to 7 years but also over periods of decades to millennia. One mode of ENSO variation involves changes in both the frequency and intensity of La Niña and El Niño over at least a few decades.
On a decadal scale the PDO and ENSO are complementary parts of a system called the Pacific Decadal Variation. A cool PDO is associated with more frequent and intense La Niña and vice versa. This seems to be associated with cloud changes on decadal scales – e.g. Clements et al 2009 –
http://s1114.photobucket.com/user/Chief_Hydrologist/media/Clementetal2009.png.html?sort=3&o=58
Here’s a recent cloud graph from Enric Palle. The ISCCP-FD is compared to MODIS data in the overlapping period and both are validated using sea surface temperature.
http://s1114.photobucket.com/user/Chief_Hydrologist/media/cloud_palleandlaken2013_zps3c92a9fc.png.html?sort=3&o=13
So when do we start thinking we know something about cloud?
Chief,
I understand that is the standard explanation of the oscillations. I just find it interesting that a PhD student writes what I quoted above about heat being released from the deep ocean causing the rise in temps.
It is not unlike the varying claims being made as to what is meant by “heat in the pipeline.” (An issue on which Gavin Schmidt had originally joined in a paper using that term to describe imminent, and dangerous “release” of heat from the deep ocean.)
I actually think it is a good thing that there is some disagreement, on at least one topic, among the “consensus.”
The Pacific Ocean trade winds set up cloud and rainfall patterns globally with enormous energies transferred between ocean and atmosphere. La Niña conditions see colder water rising in the eastern Pacific and warm, moist air rising over Australia and Indonesia. El Niño conditions see warm water spread across the Pacific.
A simple process of heat transfer from the ocean to the atmosphere occurs. The heat transfer is enhanced in the El Niño state by the enormous area of warm water.
Conversely, heat is gained by the Pacific Ocean during cooler La Niña conditions and global surface temperatures dip.
This is one – the simplest – aspect of the global ENSO dynamic. Heat transport in the oceans seems to be determined by a balance between turbulent dissipation to depth and warm water buoyancy. Buoyancy is the dominant process by far. So most of the heat stays in the mixed layer at the surface. Does a little more or less turbulent mixing to depth matter all that much? I think it is neither here nor there in terms of heat transfer between the oceans and atmosphere. What matters is insolation, sea surface temperature, relative humidity and wind speed.
Although I agree – Brown’s statement is too simplistic to be of any interest. The decadal slowdown is the result of decadal changes mostly in the Pacific Ocean – although the global synchronous connections suggests that a broader perspective is appropriate.
To discuss the slowdown without this is futile.
‘We construct a network of observed climate indices in the period 1900–2000 and investigate their collective behavior. The results indicate that this network synchronized several times in this period. We find that in
those cases where the synchronous state was followed by a steady increase in the coupling strength between the indices, the synchronous state was destroyed, after which a new climate state emerged. These shifts are associated with significant changes in global temperature trend and in ENSO variability. The latest such event is known as the
great climate shift of the 1970s. We also find the evidence for such type of behavior in two climate simulations using a state-of-the-art model. This is the first time that this mechanism, which appears consistent with the theory of synchronized chaos, is discovered in a physical system of
the size and complexity of the climate system.’
http://heartland.org/sites/all/modules/custom/heartland_migration/files/pdfs/21743.pdf
“So we seem to get planetary cooling in El Niño as fewer clouds and higher atmospheric temps increase IR losses to space more than offsetting the decrease in reflected SW. The reverse happens in La Niña.”
The planet cools during el Ninos because of less clouds? And warms during la Ninas? I assume you have just flipped the terms in typing?
I have had it explained to me here and at Real Climate that el Ninos cause a rise in GAT because they increase clouds, and retain more heat that would otherwise be radiated. (Although I don’t see anything other than graphs showing correlation, no explanation of why those clouds retain more heat than they reflect.)
I am beginning to believe that everybody thinks these phenomena are well understood, but their opinions on just what that understanding is are all over the charts. Even among the consensus.
I am starting to think that the “understanding” of ENSO is just as clear as that of how ice ages are caused. The trade wind mechanism makes sense, but doesn’t explain the effect on global mean temps. The cloud explanation of how the mean is effected also makes sense. Except, in the words of Judy Collins, we don’t really know clouds…at all.
‘CERES data show that clouds have a net radiative warming influence during La Niña conditions and a net cooling influence during El Niño, but the magnitude of the anomalies varies greatly from one ENSO event to another.’
http://meteora.ucsd.edu/~jnorris/reprints/Loeb_et_al_ISSI_Surv_Geophys_2012.pdf
No flipping – it seems to be what the data says. By planetary you need to include the oceans gaining heat in La Nina and losing it in El Nino. Simply because of the change in surface temp. So I think there are probably three processes. Ocean atmosphere exchange, changing heat loss to space in clear skies from a warmer (El Nino) or cooler (La Nina) atmosphere, changes in cloud which are anticorrelated with SST modulating both IR loss and reflected SW.
Whoever your informant at realclimate is – they were undoubtedly wrong.
This might help – although the situation with cloud seems a lot more complex than I realized at the time. In ENSO clouds are dispersed globally – as reflected in the associated changing rainfall patterns. And there are other factors as I said.
http://judithcurry.com/2011/02/09/decadal-variability-of-clouds/
I believe this is the comment to which GaryM is referring.
Chief Hydrologist,
I got the same answer. albeit much more briefly, from Dr. Curry here.
JCH,
That was the one. He actually linked to graphs showing the correlation, which was decent of him.
Gary,
your criticisms of Patrick ‘s post sound like crotchety nit picking .
Tropical deserts have the highest mean annual temperature of any climate type. The facts on the ground don’t argue well for clouds having anything but a slight negative feedback. The biggest effect is minimizing diurnal temperature change. A very dry atmosphere in and near the tropics where the lion’s share of solar energy enters the system loses 20-30K overnight while a moist atmosphere only drops 5-10K.
In the general crotch area for sure.
This is the tropics from ERBS and CERES.
http://s1114.photobucket.com/user/Chief_Hydrologist/media/Loeb2011-Fig1.png.html?sort=3&o=51
Here’s the tropics and subtropics with the MEI shown in the tropics. Global lw is overlaid on the top graph.
http://s1114.photobucket.com/user/Chief_Hydrologist/media/Loeb2011-LWCERES.png.html?sort=3&o=70
From the Loeb et al reference. So it depends on where you are looking – but both the global and tropical IR up decreases in La Nina.
It seems pretty clear that global rainfall totals increase in La Nina and decrease in El Nino. It is just that convection and rainfall occurs in different places.
http://phys.org/news/2012-10-la-nina-global-sea.html
‘The above graph shows detrended GMSL (from the top graph) versus the Southern Oscillation (SOI) index, which is one of the common indexes of the El Niño/La Niña cycle.
Clearly (see, e.g. 1997/1998) sea level is higher during an El Niño event (SOI -ve) and lower (see, e.g. 1999/2000 and 2010/2011) during La Niña (SOI +ve).’
http://www.cmar.csiro.au/sealevel/sl_hist_last_15.html
timg56,
Not nit picking at all. There seems to be a debate among consensus scientists regarding the issue of retention of heat by the oceans. Trenberth arguing the “missing heat” has been “found” there, and represents global warming “in the pipeline” that poses a real risk in the not too distant future.
Gavin Schmidt and the Real Climate folks take the position now that the heat “in the pipeline” is just the future warming that will result from future solar radiation as a result of the anthro CO2 that has already been emitted. They are apparently not as concerned that deep ocean heat content is any real threat in any imminent time frame.
Although someone, I think it was David Springer, linked to a paper of some years ago on which Schmidt was a co-author that specifically referenced the heat supposedly retained by the oceans as the heat “in the pipeline” that we need to worry about now.
But this issue goes to the very foundation of the whole CAGW debate. If the consensus can’t even agree on how heat is being stored in, or going to be released by, the oceans, then that undermines the whole consensus. Which is why I ask whether there was merely a misstatement in the primary post, or the author meant what he wrote.
Gary, I think that “Clouds” was on the excellent “Wildflowers” album, which unfortunately appears to have never been re-released on CD. A great voice and a most pertinent observation.
GaryM | July 13, 2013 at 10:08 pm |
“Although someone, I think it was David Springer, linked to a paper of some years ago on which Schmidt was a co-author that specifically referenced the heat supposedly retained by the oceans as the heat “in the pipeline” that we need to worry about now.”
Schmidt disavowed Trenberth’s missing heat coming back to bite us. So did Curry. And so did I. That energy enters the system concentrated in surface waters and diffuses into the vastly greater, much colder bulk of the deeper ocean. The 2nd Law of Thermodynamics (which Curry specifically mentioned) prohibits the diffused energy from becoming concentrated at the surface again. It enters quickly and exits slowly in other words. I make it at about 20:1 based on Carnot’s Law and the temperatures involved using 25C for surface temperature and 3C for abyssal temperature and considering the ocean as a 100% efficient heat engine. Less than 100% efficiency just makes the ratio bigger and with it the coming back to bite us lesser.
The scary thing that needs to be kept in mind is the warm interglacial climate is dependent on a shallow layer of warm water floating on a deep almost ice-cold abyss. If anything comes along to accelerate the rate of mixing between the shallow surface and the frigid abyss much then you’d bone up on how to hunt wooly mammoths because it can get really cold really fast. The converse is not possible.
GaryM – You are right that ENSOs effect of global mean surface temperature is much more complicated than that single sentence suggests. I admit that I was sacrificing nuance for brevity as ENSO was not the main point of my article. A good review of all the details of the ENSO global temperature relationship can be found here: http://tinyurl.com/os3dcn9
Patrick Brown,
Thank you for the response. My comment was also intended to be about the cause of el Ninos, not just their effect on GAT.
It seems to me that your admittedly brief explanation is at odds with the generally accepted view, as noted by Chief Hydrologist at length immediately above. It doesn’t strike me as a matter of nuance on that issue, but rather an actual difference of opinion.
Or am I (as is always possible) missing something?
GaryM | July 13, 2013 at 12:11 pm | Reply
Apparently no climatist has bothered to read my book [1] where all about ENSO. is explained. ENSO is a periodic climate phenomenon generated by the Central Pacific current system that has a world-wide influence. It is a harmonic oscillation of ocean water from side to side involving the trade winds, equatorial currents, and the equatorial counter-current. If you blow across the end of a glass tube you get the fundamental tone determined by the dimensions of the tube. Trade winds are the equivalent of blowing across the tube and the ocean answers with its own fundamental tone – about one El Nino wave every five years or so. Start with trade winds. They push warm water west along the two equatorial currents until its way is blocked by the Philippines and New Guinea. This causes it to pile up and form the Indo-Pacific warm Pool, the warmest water on earth. When enough has piled up gravity flow east begins along the equatorial counter-current. It takes the form of an El Nino wave that crosses the ocean and runs ashore in South America. There it spreads out along the coast and warms the air above it, Warm air rises, interferes with trade winds, joins the westerlies,and we notice that an El Nino has started. But any wave that runs ashore must also retreat. As the El Nino wave retreats, water level behind it drops half a meter, cold water from below fills the vacancy, and a La Nina has started. As much as the El Nino raised the global temperature, the La Nina will now lower it. In the absence of other forcings this balance can be very precise. A common El Nino index is Nino3.4 that uses oceanic SST changes to predict an upcoming El Nino. It just happens to sit in the middle of the equatorial counter-current, the conduit of El Nino waves crossing the ocean. The observed time lag between the index and atmospheric warming that follows corresponds to the transit time of the El Nino wave from the middle of the ocean to South American coast. It is possible for oceanic conditions (cyclones etc) to block the progress of an El Nino wave crossing the ocean. If this happens its warm water spreads out on the spot and warms the atmosphere above it. This is called an El Nino Modoki or CP (Central Pacific) El Nino. One statistic I saw (which I cannot vouch for) is that this happens 30 percent of the time and accounts for irregularities in the observed El Nino phenomena. Since it is a periodic phenomenon it has nothing to do with global warming as some misguided authors have argued. It has existed as long as the Pacific equatorial current system has existed, which is to say since the Panamanian Seaway closed. That would be a little under two million years ago. Some people like Hansen have claimed that Pliocene had an “El Nino-like” climate. This is nonsense for two reasons. First, El Nino did not exist in the Pliocene and second, it is impossible for an oscillation to supply steady heat for an epoch.
[1] Arno Arrak “What Warming? Satellite view of global temperature change” (CreateSpace 2010)
Patrick
Here are my results similar to yours:
http://orssengo.com/GlobalWarming/GMSTpredictionUntil2030.png
Man => Black Curve
Dog => Red Line segments
Judith, this guy’s a joke. What he’s shown is that if you assume what is to be proven, you can “prove” what is only assumed … for example, he says:
No, we don’t know that at all. That’s what the whole debate is about, whether the temperature is a linear function of the forcing, and he is assuming it is proven … which makes it easy for him to prove whatever he wants to.
As I commented on the last guest poster … the level of guest posts appears to be dropping fast. But perhaps that’s just “unforced variability” …
w.
I agree Willis and was about to make the same point before I saw your comment. It is like Brown has no idea what the scientific debate is about. Moreover he conflates the supposed surface temperature change, which is a model based estimate not an observation, with the TOA energy balance. The two need have little to do with one another. Nor do the changes in TOA balance have to be forced. If the system decides to suck up some heat for awhile, or release some, neither is a forcing. Brown’s dog walking point may be interesting but he presents it against a simple background the assumes AGW. It is ruined thereby. The issue is where the man is going, not the dog.
Willis,
I thought it was well-written and in a non-argumentative or arrogant tone.
He is a graduate student. Give him a break. Good job Patrick. (By the way, what temp. record and ref. years are you using?)
I thought he had some excellent points and a good analogy with the dog on a leash. However I do agree with you that the assumption/statements regarding the greenhouse effect being well-known physics etc. and that if GHG go up we know the path of the man are over-simplifications.
The theoretical GHG effects are well understood. Not the GHG effect on climate.
We don’t necessarily know what all the GHGs are according to recent papers on Cl-F-Carbons I’ve seen. We also apparently can’t predict how methane conc.’s will evolve. And we don’t know the size (or in some cases direction) of most of the feedbacks or even if we know all the feedbacks. If soot and Cl-F-carbons are having bigger effects than predicted, the effects due to H2O, CO2 and CH4 on the actual climate must be smaller than thought in the models. I also don’t know of any experiments to actually measure the optical density of the atmosphere at multiple locations and determine whether there are any places where the (CO2 and H2O absorption bands) in the atmosphere are already saturated due to water vapor or Raman scattering, etc.
I would say we know average path of dog + man and we have a good idea of the length of the leash. But until we know the effect of GHG + soot + albedo + sun + all feedbacks we don’t really know the path of the man. As to the size of the leash, between 1985 and 1990, the temp. of the entire globe jumped about 0.8 C which is equivalent to the entire temp. change over a much longer time period. (The period varies according to which temp. record you use).
Bill, the mean of the surface statistical models is not a temp record. It is a model output. According to the satellite measurements, which actually are a record, the 1985-1990 jump you refer to did not occur. There was no warming 1978-1997. Much follows from this.
I see no reason why we should give a grad student credit for missing the point. He sounds like he studied at AGW U and came here to straighten us skeptics out. Fail.
UAH, 1978 through1997
Bill
You write:
This is correct.
But I would add to your list of uncertain or as yet non-quantified effects, “any presently known or unknown natural forcing components”.
IOW, until we can exclude natural factors, it is not necessarily the man who is setting the course.
Max
David Wojick writes:
“the mean of the surface statistical models is not a temp record. It is a model output. According to the satellite measurements, which actually are a record”
This is incorrect. Both are observational records, not statistical models. Both involve adjustments of raw instrumental records.
JCH | July 13, 2013 at 4:28 pm |
UAH, 1978 through1997
A rise of 0.1C over the course of 20 years. That’s statistically insignificant. Statistical significance begins at a rate over 0.1C/decade.
Wojick is right. Practically all the global average warming during the satellite record occurred in classic stairstep fashion over two to three years from 1994 to 1997.
http://www.woodfortrees.org/plot/rss/from:1978/mean:12/to:2013/plot/rss/from:1978/to:1994/trend/plot/rss/from:1997/to:2013/trend
In a longer record from 1880-present the stairstep period appears the be the transition in a sine wave from incline to peak. Years 2000-2010 appear to be the peak and subsequent to 2010 on the falling side of the sine wave.
There is an underlying increase in warming trend of about 0.06C/decade that appears to be new subsequent to about 1950. This is likely to be anthropogenic but isn’t just CO2 it’s also black carbon, methane, and land use changes with the latter three combined equal to or greater than CO2 forcing alone.
I believe the sine wave is the hysteresis inherent in Arctic sea decline (which eventually leads to global cooling) and Arctic sea ice increase (which eventually leads to global warming). Arctic sea ice is like a thermostat in an automotive water cooling system. It has a fair amount of hysteresis in it. About 30 years worth by my climatological reckoning.
Temperature has been falling like a stone since 2010, btw.
http://www.woodfortrees.org/plot/rss/from:2010/plot/rss/from:2010/trend
Down 0.3C in less than 4 years. A decade at that rate and all the global warming since 1850 vanishes. Better hope that doesn’t happen. NH winters were harsh then and growing seasons shorter. The 0.6-0.8C of warming since then has been great boon to agriculture.
Willis Eschenbach, you say the “whole debate is about whether the temperature is a linear function of forcing.” Absolutely nothing in this post relies upon such an idea, yet you claim the post assumes it is true. You’re criticizing a guest author by making things up about what he wrote.
If there’s a joke here, it’s you.
Brandon, he said:
I pointed out that no, we don’t know that, from the “fundamental physics” or from anything else. Sorry you don’t like that.
w.
Willis Eschenbach, you’re changing the subject. Nothing in that quote says anything about a “linear function of forcing” as you claimed. Even if the author were wrong about what he did say, the simple reality is he didn’t say what you claim he said.
Please don’t try to change the subject again. Either show the author said what you claim he said or admit you made it up.
I’m with Willis, the whole debate hinges on the presumption that there is linear warming, when there is not, the warming effect of CO2 is not linear, so how can the overall warming be linear.
StuL, if you’re “with Willis,” perhaps you could tell us what part of this post says assumes temperature is a “linear function of forcing.” Willis Eschenbach claims it happened. I say he’s just making it up. He’s refused to address the issue. Perhaps you can do it for him.
I doubt it though. The discussion here was about forcings, not CO2. A linear response function to forcings would not imply a linear response function to CO2. It would actually reject such. This means you’re misrepresenting things as much as Willis Eschebach. The difference is you seem to be doing it out of ignorance, not uncharitable/poor reading.
It seems clear to me from context that the author believes climate sensitivity is a constant and that it determines the straight line path of the man. That’s what Willis was talking about so I’m forced to agree with Willis.
Sensitivity would probably be a constant if the earth were an evenly illuminated plane but in reality it’s a very unevenly lit spinning sphere. Snow and ice comes and goes at different latitudes drastically changing albedo in where it matters much more in lower than higher latitudes. Thus sensitivity isn’t constant but changes with absolute temperature of the globe as it draws nearer to or further from the freezing temperature of water such the action in snow cover variation is occurring at different latitudes depending on absolute temperature.
Willis: If one takes the S-B eqn and differentiates, one gets: dW/dT = 4eoT^3. eoT^3 = W/T. Substitute and rearrange: dW/W = 4*(dT/T). In other words – before feedbacks – a small percentage change in radiation results after equilibrium in a four-fold smaller percentage change in temperature. This is linear.
When CO2 concentrations are roughly similar today’s, we know that dW for each doubling of CO2 is about 3.7 W/m2. For practical purposes, this is linear with respect to CO2 doubling and results in a no-feedbacks climate sensitivity (dT) of about 1 degK. (W = 240 W/m2 through the tropopause and absorbed, T = 255 degK, the blackbody equivalent temp for 240 W/m2).
Feedbacks are not necessarily linear, but this may not be a bad approximation for some feedbacks. From the C-C eqn, one can calculate that the change in absolute humidity at saturation is roughly linear with temperature (7% increase per degK). This approximation is only reasonable in regions that are roughly in equilibrium with water vapor (the boundary layer over the oceans and upward convective regions?). Whether these small increases in water vapor should have a linear effect on temperature isn’t clear. Cloud feedback is the big unknown, but whether cloud feedback is positive or negative, it seems reasonable to assume that it won’t change rapidly or erratically near current conditions. (ie if water vapor is negated by cloud feedback when CO2 is doubled once and temperature rises 1 degC; then, when CO2 is doubled a second time, they are likely to roughly negate each other again.)
More broadly, mean global temperature at equilibrium is a function of the radiation the planet receives. T = f(W). A Taylor expansion of this function around the current radiation (W0) and temperature (T0) will give T = T0 + k1*dW + K2*(dW)^2 + etc. For small changes in radiation (dW), only the linear term will be important. With GHGs, we are dealing with changes in W (and T) of only a few percent. The linear relationship will be a reasonable approximation, if the function is well-behaved near W0. Poorly behaved and chaotic functions are found in weather, but many locations on the planet experience two-fold seasonal differences (or more) in radiation and their monthly mean temperatures relatively smoothly change by more than 10 degC.
In one of your WUWT posts, you showed that tropical SSTs rarely exceed 30 degC, suggesting that convection provides a non-linear limit to how much T can rise with W. Freezing water at 0 degC is another obviously point of non-linearity, which may be responsible for the existence of the two recent long-term states (attractors?) for the planet, glacial and interglacial. However, these two phenomena effect only a modest fraction of the surface and GHGs are propelling us away from the glacial “attractor”. The global mean temperature can rise several degrees while these phenomena limit potential temperature change, but these limits only effect a modestly different fraction of the planet part of the year. These phenomena do cast doubt on those who assume climate sensitivity is roughly constant over a 10 degC temperature range, but reasonable linearity over 3 degC is enough climate change for serious concern.
With this much evidence (not proof) suggesting that it is reasonable to expect a linear equilibrium temperature response to increasing forcing, some might expect you to provide evidence that this Brown has made an unreasonable assumption.
Frank | July 13, 2013 at 5:53 pm | Reply
Yes, I understand all of that. But that is not evidence of anything but lab conditions. If you see that as “evidence” that a complex, chaotic constructal system like the climate, with five major subsystems (ocean, atmosphere, cryosphere, lithosphere, and the biosphere) has outputs that are a linear function of its inputs, I’m afraid you need professional help …
As an example. Measure the amount of energy striking a rock, and measure its core temperature. You’ll find a (lagged) linear relationship between the two.
Now try the same experiment with a complex system, say a rabbit. You’ll find NO relationship, linear or any other kind, between the incoming energy and the core temperature of the rabbit.
And that is why such claims of linearity are absurd even on the surface. I know of no other complex, chaotic natural system for which the outputs are a linear function of the inputs. Rivers don’t work that way. Nor do thunderstorms. Nor does life in any of its forms.
If climate were indeed a linear function of the forcings, the models would have been right over the last 15 years, and the temperatures would have continued to rise.
So no, Frank, actually you are the one short of evidence for your claims. I’ve given loads of evidence for the actions of the emergent phenomena in controlling the climate … and they are absolutely not linear.
See my post “The Details Are In The Devil” for a discussion of these issues.
w.
Willis: Thanks for the reply. You wrote: “Now try the same experiment with a complex system, say a rabbit. You’ll find NO relationship, linear or any other kind, between the incoming energy and the core temperature of the rabbit.”
If you look into the relationship between caloric consumption, heart rate and body mass, you’ll find that there are regularities. Animals with a smaller mass have a higher surface area to mass ratio. Metabolism produces heat in proportion to mass. Smaller animals need a faster heat rate to spread heat to maintain a ideal temperature (when caloric intake makes an ideal temperature possible). The same physics of heat transfer and conservation of energy controls the rabbit’s internal temperature and the earth’s surface temperature. When the rabbit’s fur thickens in winter or more GHGs are present in our atmosphere, the escape of heat to the environment or space is slowed. Unlike the earth, the rabbit can reduce its metabolism, eat fewer calories, store energy as fat, stay where it loses less heat to its environment, or its internal temperature will rise. Lacking these other alternatives, earth has to warm until energy balance is restored, but some energy may go into warming the deep ocean (which may be analogous to the rabbit’s fat).
Chaos certainly exists, but it doesn’t mean that scientists should abandon hope of understanding complicated phenomena. Massive seasonal changes in radiation produce fairly smooth changes in monthly mean temperatures. In the middle of continents, surface temperature changes lag radiation changes by about a month, but the lag is greater near oceans due to their larger heat capacity. The “climate sensitivity” associated with seasonal radiation changes shows no signs of chaotic behavior, even though weather itself is chaotic. If the massive changes accompanying the seasons are easy to understand, why should we anticipate impenetrable chaos with much smaller changes in radiation from GHGs?
Willis also wrote: “If climate were indeed a linear function of the forcings, the models would have been right over the last 15 years, and the temperatures would have continued to rise.” This is only true if no heat is transferred to or from the deep ocean. There is a huge amount of very cold water in the deep ocean. The miniscule 4 W/m2 forcing from 2X CO2 can’t appreciably change the temperature of the deep ocean for many centuries, but variable amounts of chaotic transport between the deep ocean and mixed layer can have a major impact on surface temperature. Lack of upwelling from the deep ocean during El Nino and strong upwelling during La Nina cause equatorial Eastern Pacific SSTs to vary by 10 degC and perturb global temps a few tenths of a degree. The AMO and/or PDO may influence surface temperature by similar mechanisms; the LIA and MWP could have been caused by similar phenomena. The “long-leash natural variability” discussed above is consistent with almost any value for ECS, but the climate models used by the IPCC to estimate ECS are NOT consistent (and therefore untrustworthy). Although I don’t know if Lindzen’s views have made it into a peer-reviewed publication, he wrote for the GWPF:
“For small changes in climate associated with tenths of a degree, there is no need for any external cause. The earth is never exactly in equilibrium. The motions of the massive oceans where heat is moved between deep layers and the surface provides variability on time scales from years to centuries. Recent work (Tsonis et al, 2007), suggests that this variability is enough to account for all climate change since the 19th Century.”
http://wattsupwiththat.com/2011/01/17/richard-lindzen-a-case-against-precipitous-climate-action/
Frank, do you know why small,non-flying, mammals run hotter than large ones?
The answer is dependent on the relative ease of heating and cooling the body. Small mammals are at risk of hypothermia and run hot, large non-aquatic mammals are at risk of hyperthermia and run cool.
Frank you need to pay more attention to albedo. Where, when, and why it changes.
For instance melting ice eventually leads to global cooling. As ice melts the surface area of the ocean becomes larger. Ocean has a much lower albedo than land so this at first leads to global warming. However the warmer ocean with greater surface area leads to more snowfall in the winter which builds up glaciers on the continents. As the glaciers build they simultaneously increase albedo by more snowcover and by decreased surface area of the ocean as water is taken up by land-locked ice.
The hysteresis in this process is critical and constrains the minimums and maximums. However cloud cover always limits ceiling temperature. This is evident in all interglacial beginnings when temperature shoots up like a rocket then hits an impenetrable ceiling temperature each and every time. The ceiling is determined by oceans generating clouds at a rate which balances the blockage of insolation. However, there’s not such a convenient limit on the cold side and when the right conditions conspire the cooling phase doesn’t reverse. I suspect the perfect storm that ends an interglacial is orbital mechanics gradually moving towards a favorable condition for southward snow/ice cover progression (which is cooler summers and warmer winters in the northern hemisphere i.e. classic Milankovich) plus a grand solar minimum plus a few closely spaced major volcanic eruptions. Over thousands of years all three will line up sooner or later and boo-yah the interglacial ends.
Dave: You are correct that I only discussed fast feedbacks. I said that a constant climate sensitivity for conditions near today’s temperature and a few degC of future warming was a reasonable approximation (for this post). I’m not sure if you are objecting or not.
Oh, c’mon Willis
The guest poster’s writing there is true and utterly uncontroversial, as you well know. Give the guy a break.
The controversy is about how much and what we should do about it.
“The purpose of this article is to explain the science behind global temperature change and to discuss the implications that a long ‘warming pause’ might have on our understanding of the climate system[.]”
I think this post is just another attempt to prepare for the possibility of continued cooling. If reported temps continue to “pause” or go down, then that will say nothing about CAGW. Man, through CO2 emissions, is still walking the dog of climate. The “long leash” just means that 15, 25 or 35 years of no discernible increase in reported temps is “consistent with global warming.”
There will probably be a lot more published research making this and similar arguments in the near future. We can’t have anyone thinking that the climate models might just be…well…wrong…can we?
But I do want to give the author some credit for originality. Anthropomorphization of the climate is old hat. But caninification?
And I thought there was nothing new in the climate debate.
Patrick
“Since we are currently approaching the lower limit of that confidence interval, we would expect temperatures to progress back up towards the long-term trend within a year or two.”
I don’t think it is correct to say the trend since 1975 in Fig 7 is the long-term trend. Why not the following:
http://www.woodfortrees.org/plot/hadcrut3vgl/compress:12/plot/gistemp/compress:12/offset:-0.08/detrend:0.04/plot/hadcrut4gl/compress:12/offset:-0.03/detrend:0.02/plot/hadcrut3vgl/mean:732/plot/hadcrut3vgl/mean:252/plot/hadcrut3vgl/mean:252/offset:0.2/plot/hadcrut3vgl/mean:252/offset:-0.2/plot/hadcrut3vgl/scale:0.000001/offset:2/plot/esrl-co2/scale:0.003/offset:-1.03/detrend:-0.22/from:1982/plot/hadcrut3vgl/mean:252/offset:0.015/plot/hadcrut3vgl/mean:732/offset:0.015/plot/esrl-co2/scale:0.003/offset:-1.03/detrend:-0.22/from:1982
I agree, my point is that we don’t actually know what the long term trend is, and it depends on the length of the leash.
No Patrick, the long term trend depends solely on the path of the man. The length of the leash just determines how hard it is to determine the long term trend, which is a different issue.
Patrick,
I think we should be careful to clearly define what we mean by “longer-term” when talking about trends. External forcing determines the path, and the path is then the sum of all forcings. We know that forcings act over different time frames and so it becomes difficult to talk about a trend when even the path is wiggly. What we have then is an undulating path whose long-term “trend” is determined by whatever external forcing is acting the strongest and the longest over the period in question. The best we can do then is what we do with internal variability– tease out each forcing by regression analysis, and then one by one identify the contribution of each forcing at any given point in time, to determine which forcing is acting the strongest and longest. In the end then we actually have a somewhat wiggly climate onna path path that may be trending up or down over some period from multiple forcings with an even more wiggly dog of internal variability following a very wiggly path of actual temperatures and weather being pulled along on a leash that may be like a bungee cord– somewhat stretchy– and so sometimes short and sometimes longer.
Of all the criticisms of Patrick s post, David W presents the best
I think your analogy might be strengthened by using a picture of a man walking a group of dogs… Which I saw on a daily basis on the Marina Green in San Francisco… the man (often woman) could easily get tied up in knots and be forced to sit down and untangle leashes for a goodly period. Which did not change his/her destination appreciably, although he/she might have been forced to forego the ritual stop at the coffee shop…
timg56, David W, the statement by David W, contrary to what he thinks, just supported the original post. The long-term trend does depend solely on the path of the man, and the path of the man depends, by definition, solely on external forcing. If everyone agrees to this, we made a step forwards just now.
Patrick
Excellent post. Though I don’t agree with you that global warming is caused by humans.
Maybe I have missed somethbing. The article states “The most well-known example of an external radiative forcing is the increase of greenhouse gasses”. It then seems to suggest that this is the ONLY example of external radiaitve forcing. So far as I could make out, it did not discuss ANY other external forcing; e.g. Svensmark, GCRs and clouds. Without a discussion of all external forcings, this paper is sadly lacking.
In the interest of brevity I did not individually discuss each external forcing, however, most of the major ones are shown in Fig. 4a, from Hansen et al., 2005
Patrick, you write “most of the major ones are shown in Fig. 4a, from Hansen et al., 2005”
I am sorry, but that paper is dated 2005. We have made enormous strides since then, in establishing the possiblilty that there are many, many external forcings which could have a major impact on the world’s climate. There are, for example, many possibilities of the amplification of small changes in solar output. And the big one is, of course, clouds, and the possible effects of GCRs. Project CLOUD is by no means complete.
If you are assuming that the numbers in the Hansen paper are correct, then you paper is not worth very much. You obviously assume that the major external forcing is the effect of GHGs. I suggest that this assumption is not well established. You need to establish the validity of the numbers in the Hansen table, beyond all reasonable doubt, with data measured between 2005 and 2013, before your conclusions have any merit
Jim C, GCRs can be folded in with solar forcing where irradiance appears to have a much bigger effect in the solar cycles, and clouds are an internal variability related to the internal ocean variability, but with an external part that is the modification due to aerosols. So what you have listed as missing, actually isn’t.
Patrick
First of all well done for communicating your thoughts so well.
A few weeks ago Climate Etc carried my post on noticeable climate change
http://judithcurry.com/2013/06/26/noticeable-climate-change/
In particular I would suggest you look at figure 4. I think a close analogy with your dog lead story is that sometimes the dog slips his lead and careers round all over the place moving far away from its master.
What also seems clear is that we have very long periods when the dog is moving in a different direction to its master and out of sight of him, which in climate terms equates to the reality that we can see short periods of warming and cooling but also much longer periods as well.
So the recent increase in temperature is matched throughout history with similar periods of warmth which seems to be compensated by short sharp periods of cold which takes us back to the bottom of the temperature range from which the temperature then climbs again.
We have-with great difficulty-recreated the iconic hockey stick (difficult because the raw data is not accessible) back to 1000AD. It is clear that it does not begin to capture natural variability (nor do the other paleos) and it therefore misses the great long term temperature changes be they warming or cooling which broadly occur as decadal movements.
So whilst your dog lead analogy may have some merit from 1880, a look further back in history will illustrate that the dog is frequently nowhere near its master. It perhaps also illustrates that using a composite global temperature has its disadvantages as it not related to a real world country but constructed in a complex manner. In fact, is the Global temperature as useless as a globally averaged telephone number or a globally averaged estimate of economic activity?
Discuss. Or write it down as Mosh or David Springer would say.
Tonyb
Patrick Brown, a few comments. First, ENSO is a process not an index. You cannot account for ENSO by describing wiggles with your short leash analogy. Your definitions of El Niños and La Niñas were for the most part correct, but you forgot to account for the warm water released to the surface by the El Niño after the El Niño has ended. That warm water really comes into play after large East Pacific El Niño events (that aren’t counteracted by volcanic eruptions). Where’d all that warm water go? It doesn’t just disappear! See my illustrated essay “The Manmade Global Warming Challenge” [42MB]:
http://bobtisdale.files.wordpress.com/2013/01/the-manmade-global-warming-challenge.pdf
Second, the AMO is the detrended sea surface temperature anomalies of the North Atlantic. You can attempt to remove the impacts of the AMO from the surface temperature record, but you cannot do the same with the PDO. The PDO is not the detrended sea surface temperature anomalies of the North Pacific. The PDO is actually inversely related to the sea surface temperatures of the North Pacific, which really puts a damper on your attempts. The PDO is the leading principal component of the sea surface temperature anomalies of the North Pacific, after the global sea surface temperature anomalies have been removed from each 5X5 grid. And then the PDO is standardized, raising its perceived significance by more than a factor of 5. Basically, the PDO represents the impacts of ENSO on the North Pacific. But the PDO (ENSO-like spatial pattern) is also dependent on the wind patterns (and interrelated sea level pressure patterns) of the North Pacific, which is why the PDO has a different multidecadal component than ENSO.
I’ve written a bunch of blog posts about the PDO: what it is, and more importantly, what it is not. See here for an example:
http://bobtisdale.wordpress.com/2010/09/03/an-introduction-to-enso-amo-and-pdo-part-3/
And here:
http://bobtisdale.wordpress.com/2010/09/14/an-inverse-relationship-between-the-pdo-and-north-pacific-sst-anomaly-residuals/
And here:
http://bobtisdale.wordpress.com/2011/06/30/yet-even-more-discussions-about-the-pacific-decadal-oscillation-pdo/
BTW, I liked Duke when I visited there—a long time ago. Great campus and people.
Regards
Hi Bob, thanks for the comment,
I understand that the PDO is defined differently than the AMO but im not sure why this means that you cannot try to statistically remove it. Multilinear regression doesn’t care about the magnitude of the values in the time series so I dont think it matters that the PDO is standardized/inflated. Also, it’s ok if the PDO is inversely related to SST in the north Pacific – all that means is that the regression coefficient will come back negative and when the influence is removed, its the negative of the PDO that gets removed.
I smell a stats moment and as usual, assume Bob is right.
===============
Both the PDO and the AMO have similar relationships in measuring an underlying influence on tropospheric temperatures. A positive PDO or a positive AMO means that more net energy will be moving from ocean to atmosphere versus their negative phases. Right now, with the PDO trending negative but the AMO trending positive we have a mixed situation, meaning if the AMO turned negative, we’d see an even cooler troposphere. Those both represent part of the “dog” of internal variability. To make it even more complex, we’ve got external forcings of a sun that seems to be at some Gleissberg minima or maybe something more significant, and have had a period of moderate volcanic activity with higher aerosols. It’s actually amazing the troposphere isn’t cooling even more.
Give it something more significant time. Heh.
==============
Patrick Brown: “I understand that the PDO is defined differently than the AMO but im not sure why this means that you cannot try to statistically remove it.”
The AMO represents sea surface temperature anomalies but the PDO does not. By attempting to remove the PDO, you’re simply removing an ENSO signal from the North Pacific that’s been modified by sea level pressure, but you’re also not accounting for the multidecadal variations in the sea surface temperatures of the North Pacific.
In other words, the AMO is detrended North Atlantic sea surface temperature anomalies. Why not also use detrended sea surface temperature anomalies of the North Pacific (north of 20N) to account for its actual impact on surface temperatures? The multidecadal variability of the North Pacific (north of 20N) is at times comparable to the variability in the North Atlantic:
http://bobtisdale.files.wordpress.com/2013/05/figure-24.png
But they can run in and out of synch with one another.
The graph is from the following post:
http://bobtisdale.wordpress.com/2013/05/14/multidecadal-variations-and-sea-surface-temperature-reconstructions/
Regards
R. Gates aka Skeptical Warmist says: “Both the PDO and the AMO have similar relationships in measuring an underlying influence on tropospheric temperatures. A positive PDO or a positive AMO means that more net energy will be moving from ocean to atmosphere versus their negative phases.”
Wrong. Data contradicts your claim about the PDO:
http://bobtisdale.files.wordpress.com/2013/07/fig-1-no-pac-tlt-v-pdo.png
The PDO does not represent the sea surface temperature of the North Pacific, and because the sea surface temperature anomalies of the North Pacific are inversely related to the PDO, what you’re proposing is not possible as the data show.
Do the North Atlantic sea surface temperature anomalies (and therefore the AMO) have a strong influence on the lower troposphere temperature anomalies of the North Atlantic with the land data masked? Of course they do:
http://bobtisdale.files.wordpress.com/2013/07/fig-2-no-atl-sst-v-tlt.png
Do the North Pacific sea surface temperature anomalies (not the PDO) have a strong influence on the lower troposphere temperature anomalies of the North Pacific with land data masked? Once again, of course they do:
http://bobtisdale.files.wordpress.com/2013/07/fig-3-no-pac-sst-v-tlt.png
But the sea surface temperature anomalies of the Kuroshio-Oyashio Extension (KOE) dominate the North Pacific, so they can at times have a very strong influence on the lower troposphere temperature anomalies of the North Pacific:
http://bobtisdale.files.wordpress.com/2013/07/fig-4-no-pac-tlt-v-koe-sst.png
In case you’re having trouble seeing the relationship, I’ve standardized both datasets here:
http://bobtisdale.files.wordpress.com/2013/07/fig-5-std-no-pac-tlt-v-koe-sst.png
And, of course, as everyone knows, the PDO is inversely related to the sea surface temperature anomalies of the KOE:
http://bobtisdale.files.wordpress.com/2013/07/fig-6-std-koe-sst-v-pdo.png
Ciao, R. Gates.
PS: Thanks for the idea for a blog post.
Regards
kim says: “I smell a stats moment and as usual, assume Bob is right.”
Good assumption. My reply to R. Gates confirms it, but it is presently awaiting moderation.
Glad to see you’re having fun…as usual.
Regards
From the sidelines, it’s BIG fun watching people come to your understanding, Bob. Gimme an ‘S’!
==============
Bob, glad to have given you an idea for a post, but unfortunately you seem to have missed my point about the PDO. You conflated the issue into “North Pacific tropospheric temperatures”, when I was addressing the larger issue of the relationship between ocean to atmosphere energy flux on a global scale that can be related to both PDO and the AMO as proxy metrics, not necessarily as direct causal factors, and in this regard they are perfectly appropriate for Patrick or anyone to use in regression studies. As the case is, the PDO in the positive phase is closely associated with more frequent El Niños, and this, if your looking for one, might get back to causal factors in the relationship, but your diatribe about N. Pacific sea surface temperatures and tropospheric temperatures, while interesting for other reasons, does not negate the very appropriate use of the PDO in the kind of analysis Patrick has done.
BTW Cooling Kim,
It’s rather sad when someone comes to Bob T’s kind of understanding, as it means there’s a little less room for real science in their minds.
R gates
What link would you provide for anyone that asked for an accurate record of ‘global’ land temperatures over the last 1000 years and over the last 2000 years?
tonyb
Tony,
Good question. For the general public, I’d probably send them here:
http://earthobservatory.nasa.gov/Features/GlobalWarming/page3.php
Or here:
http://www.ncdc.noaa.gov/paleo/pubs/mann2008/mann2008.html
Yes, we know there can be issues with proxies, and some worse than others, but the multiproxy approaches are all converging on telling a similar story for the past 2000 years. Uncertainty is far lower than it was 10 years ago.
Tony, just to follow up. I would hope any serious student of climate has the major ups and downs of these graphs memorized:
http://www.ncdc.noaa.gov/paleo/pubs/mann2008/fig3.jpg
Certainly you see some familiar wiggles in there yourself from your historical studies.
R. Gates aka Skeptical Warmist says: “Bob, glad to have given you an idea for a post, but unfortunately you seem to have missed my point about the PDO. You conflated the issue into ‘North Pacific tropospheric temperatures’, when I was addressing the larger issue of the relationship between ocean to atmosphere energy flux on a global scale that can be related to both PDO and the AMO as proxy metrics, not necessarily as direct causal factors, and in this regard they are perfectly appropriate for Patrick or anyone to use in regression studies…”
Nice try, R. Gates. I didn’t miss your point. You made a very clear statement with your original comment of “A positive PDO or a positive AMO means that more net energy will be moving from ocean to atmosphere versus their negative phases”.
There was a blatantly obvious relationship between the AMO and the TLT of the atmosphere directly above the North Atlantic, which would indicate your comment was realistic for it. But that is not true for the PDO. When shown the folly of your comment, you’re trying a little misdirection. There is no mechanism that would allow the PDO to bypass the lower troposphere of the North Pacific to interact with the temperatures of the rest of the globe.
R. Gates aka Skeptical Warmist says: “As the case is, the PDO in the positive phase is closely associated with more frequent El Niños, and this, if your looking for one, might get back to causal factors in the relationship, but your diatribe about N. Pacific sea surface temperatures and tropospheric temperatures, while interesting for other reasons, does not negate the very appropriate use of the PDO in the kind of analysis Patrick has done.”
If one was attempting to remove the effects of ENSO from the global temperature record, then one should use an ENSO index—not the PDO, which is not directly related to ENSO either. Keep in mind the PDO also reflects the impacts of sea level pressure on the spatial patterns of the sea surface temperatures of the North Pacific.
Bottom line: If Patrick wanted to determine the impact of the multidecadal variations in the sea surface temperatures of the North Pacific on global surface temperatures, then he should have used an index that represented the sea surface temperature of the North Pacific—not the PDO, which is an abstract form of it. Do the sea surface temperatures of the North Pacific have an impact on global temperatures? Yes. But you cannot use the PDO to determine those impacts. You have to use the sea surface temperatures of the North Pacific.
R. Gates aka Skeptical Warmist says: “It’s rather sad when someone comes to Bob T’s kind of understanding, as it means there’s a little less room for real science in their minds.”
My understandings of the PDO and its relationship with global temperatures are based on data, R. Gates. So there is nothing sad about that. Your understandings of the PDO, on the other hand, are based on conjecture. Therefore one might conclude that “real science” to you means data-free speculation.
Adios, R. Gates.
R. Gates, I don’t think you can fairly call yourself “sceptical” if your promote Mann 2008. The statistical methodology of that paper were atrocious to the point of being completely unjustifiable. You cannot possibly apply any critical analysis to that paper and still conclude it has meaning.
And that ignores the egregious data problems with the paper. We can ignore things like using modern temperature series as proxies, arbitrarily truncating data and using precipitation data as temperature data. The simple reality is a key conclusion of the paper (that one gets a hockey stick without tree ring data) is completely dependent upon using uncalibrateable data, upside down. This has even been acknowledged by Gavin Schmidt, close friend and constant defender of Michael Mann’s work.
If you support Mann 2008, you aren’t skeptical. The only reasons to support it are blind faith or the bias of liking it’s results.
Bob is absolutely right that North Pacific SST is the right metric, not PDO.
I can add: The multidecadal variations are not long leash “internal” “noise” (…but there may be some issues with cross-disciplinary semantics in sorting these issues out).
We have a responsibility to be infinitely more mindful of spatiotemporal aliasing into aggregates. We need to devote more attention to quantitative perception of circulatory manifold boundaries. I’ll aim to share new contrasting 23N-66N & 23S-66S solar-terrestrial illustrations sometime during the next month to clarify.
Meanwhile, here’s a crude reminder of half of the multidecadal picture:
http://tallbloke.files.wordpress.com/2013/03/scd_sst_q.png
This doesn’t really make any sense. I think you’re trying to imply that if the rate of growth is 1/3 what we thought it was, we’ll arrive at the same point as previously predicted for the year 2100, except it will take us until 2300 to get there. Problem is, those extra 200 years make a big difference in multiple ways!
This paper is an attempt to keep the CAGW story alive, even when the facts on the ground over the past 12 years or more are falsifying it.
Patrick Brown’s “dog on a leash” analogy is flawed, as it is based on the uncorroborated assumption that climate is essentially being “forced” only by human factors, i.e. GH gases (the man walking the dog on the leash, and determining the long-term path), while all other factors are simply regarded as “noise” (the dog’s short-term side tracks along the way). The analogy then discusses the impacts of a short or long leash.
This analogy is obviously oversimplified and skewed, as it ignores any known plus unknown longer-term natural forcing factors.
Interestingly, it falls into the same anthropocentric logic trap as the CAGW premise, itself (i.e. man, not nature, is setting the course).
Sorry. No sale.
Max
The dog on leash analogy does not ignore natural forcing factors. Natural radiative forcings (e.g., solar and volcanic forcing) are absorbed into the path of the man.
Patrick
You are assuming that natural forcing is limited to direct solar irradiance and volcanic forcing.
This is a BIG assumption.
Until you can say with certainty that there are no other natural forcing mechanisms (clouds, for example?), you cannot make this assumption.
That was my point.
Max
Patrick, you write “Natural radiative forcings (e.g., solar and volcanic forcing) are absorbed into the path of the man.”
Agreed. The issue is what are the magintudes of all the external forcings. You have used an out-of-date table from a paper by Hansen in 2005. The numbers quoted in this paper are, almost certainly, just plain wrong, as has been shown by numerous papers written since 2005. We do not know in detail the magnitudes of all the natural forcings. Since you have not included any discussion as to how accurate the external forcings you have used are, this paper is, basically, worthless.
Patrick
By ‘absorbed’ do you mean they are fairly trivial in the context of your analogy?
tonyb
I don’t think Patrick was assuming that at all Max about direct solar irradiance. He simply was showing solar influences (of whatever kind) were external forcings and therefore represent the man on the path.
Patrick Brown says: “The dog on leash analogy does not ignore natural forcing factors. Natural radiative forcings (e.g., solar and volcanic forcing) are absorbed into the path of the man.”
When you say solar, are you considering downward shortwave radiation at the surface? According to the NCEP/DOE Reanalysis-2, it shows a very strong positive trend globally since 1979 (approx. 0.2 watts/m^2/decade):
http://bobtisdale.files.wordpress.com/2013/04/figure-32.png
The graph is from this post:
http://bobtisdale.wordpress.com/2013/04/12/the-sun-was-in-my-eyes-was-it-more-likely-over-the-past-3-plus-decades/
Regards
William Herschell using Adam Snith Wealth of Nations as a source, singled out periods wheat prices went up because of poor harvests ,
and urged the Fellows of the Royal Society to investigate links with sunspots.William Stanley Jeeves, an English economist in the 1860’s also claimed a link between sunspot activity and the business cycle.
In 2012 scientists studying climate patterns in Central Europe
revealed an unusually close correlation between very cold winters
and low sun-spot activity.
Hmmmm, should’ve looked at this in me 2nd edishun of Serf
Under_ground on ‘Famine.’
Bts
There is a correlation between aurorae borealis and Nile River levels.
==============
+100
Jim
have you just given 100 points to yourself??
tonyb
Tony, you write “have you just given 100 points to yourself??”
No, I gave them to Max. Just after I did this, Patrick’s response to Max came up. I replied to that, so it looks looks like I did what you suggest. But I didn’t
Do I need ter remind yer Horatio that there are more things
in heaven and earth …
http://trs-new.jpl.nasa.gov/dspace/handle/2014/40231
Several people have now invoked clouds as an external forcing. I don’t know a mechanism by which this is possible. Clouds, like the ocean, are part of the internal variability, and even more so because they don’t have much of a lifetime or memory themselves, so they are on a very tight leash. The biggest cloud effect is that of aerosols, which can be considered forcing, but that was stated as part of the aerosol forcing, so no disagreement there with the main post either.
I just see trying to add things like clouds to the external forcing as an attempt to muddy the science, which clearly defines it separately from internal variability that includes the oceans, sea-ice and clouds.
Jim D
You wrote
Allow me to comment.
– Just because you “don’t know a mechanism by which this is possible”, does not mean very much. There are a whole bunch of things neither you nor anyone else knows about our climate. Our hostess calls it “uncertainty”.
– Palle et al. have shown that cloud cover decreased sharply over the period 1980s and 1990s, reducing overall albedo, and then increased again slightly in the 2000s, increasing albedo. This correlates well with late 20thC warming and early 21st C cooling, indicating that clouds could well be a separate forcing component, by some as yet unknown mechanism.
– Svensmark et al. have shown a longer-term correlation between solar activity (and cosmic rays) and global climate and the CLOUD experiment at CERN has validated a mechanism for cosmic rays to result in cloud nucleation in the presence of certain naturally occurring aerosols; further work is planned under controlled conditions simulating our planet’s atmosphere to see if this mechanism really could result in significant change in cloud cover (i.e. to corroborate and quantify or to falsify the Svensmark hypothesis).
– And finally, IPCC concedes that it’s “level of scientific understanding of natural (solar) forcing is low” and that clouds remain “the largest source of uncertainty”.
Sort of sums it up for me, Jim.
Max
manacker, none of those people have suggested clouds are a forcing. In each case it is a feedback to other things going on. The reason clouds aren’t a forcing is because they don’t last long by themselves, but reflect things going on in the atmosphere (condensation nuclei) or at the surface (temperature). Forcing versus feedback/response make a big difference when it comes to climate, because the sign of the forcing is what controls the direction of the climate change, and the feedbacks only modulate the response to the forcing. Albedo, which includes clouds, goes into the forcing, but variations in ice cover affect that much more because those do have lasting effects. What you need for clouds to be a forcing is a case where cloud changes by themselves cause climate change (not just self-canceling fluctuations), and I don’t see a mechanistic case being made for that unlike what we see for ice albedo and Milankovitch, for example. If you are thinking of GCRs, that is not cloud-forcing per se, but GCR forcing, and it has a mechanistic, if far-fetched, explanation.
Jim D
You are wrong.
Svensmark has indeed suggested that clouds could act as a separate forcing, driven by changes in cosmic rays resulting from changes in solar activity.
CERN has shown that the cloud nucleation mechanism itself works in the presence of certain naturally occurring aerosols, but more work is panned there to corroborate (and quantify) or falsify the Svensmark hypothesis, under controlled conditions simulating our atmosphere.
Palle et al. showed that cloud cover did change over the past several decades, thereby affecting our planet’s albedo and the net reflection of incoming solar energy.
So the jury is still out on whether or not changes in cloud cover are a separate forcing.
Max
From Erlykin 2013
“Our analysis shows that, although important in cloud physics the results do not lead to the conclusion that cosmic rays affect atmospheric clouds significantly, at least if H2SO4 is the dominant source of aerosols in the atmosphere. An analysis of the very recent studies of stratospheric aerosol changes following a giant solar energetic particles event shows a similar negligible effect. Recent measurements of the cosmic ray intensity show that a former decrease with time has been reversed. Thus, even if cosmic rays enhanced cloud production, there would be a small global cooling, not warming”
“Some have claimed that despite a continual increase in global atmospheric CO2concentrations, the global average temperature has not increased in 16 years. This logic is used to advocate the idea that increases in greenhouse gasses do not cause global warming. ”
Wrong crowd here buddy. This logic is used to show that increases in greenhouse gases are small enough to be masked by natural variation. How much masking even David Springer does not know.
Here’s a prediciton. Based on just the really boneheaded assertions in your first 100 words you’re going to get ripped to shreds here by the usual suspects.
I’m not sure I understand your criticism. Many commentators have indeed made that claim.
And of course natural variation is large enough to mask CO2 increase on short time scales. To take an extreme example, I dont expect tomorrow to be warmer than today just because there might be a little more CO2 in the atmosphere.
It’s all a matter of time scale, and how long natural factors can cancel CO2 depends on the length of the leash.
Patrick Brown
I am trying to envision the man walking from the Medieval Warming Period to the Little Ice Age and then walking to the present; indeed, walking the climate trail for the last 12,000 years. The changes in direction seem to be punctuated by abrupt climate changes in the Tsonis and Swanson paradigm.
The 1963 Edward Lorenz observations of the importance of initial model conditions suggests chaotic and non-linear behavior. The view for me is that both climate and weather are a bounded random walk.
I am sure you have considered some of these issues and I would be interested in your thoughts.
Mr. Brown, welcome to Climate Etc. I don’t know if you’re a frequent visitor. If not, I want to assure you that your treatment here is par for the course, both for good and ill.
Imagine walking into a bar late on a Saturday night where the patrons have been discussing the same sports team for more than a decade, for hours on end week after week. Which is what we’ve been doing here.
Your common sense analogy is apt and to the point. But it doesn’t change anybody’s opinion on who ‘our’ team should trade for to get to the playoffs this season….
“Some have claimed that despite a continual increase in global atmospheric CO2concentrations, the global average temperature has not increased in 16 years. This logic is used to advocate the idea that increases in greenhouse gasses do not cause global warming. ”
and
“Many commentators have indeed made that claim.”
That depends on how you use the term “global warming.” As the term is typically used in general policy discussions, the term means CAGW. The risk of catastrophic warming caused by anthropogenic CO2 is sufficiently great to justify decarbonizing the global energy economy.
But “global warming” is also used, particularly when consensus types debate skeptics, to mean the GHG effect itself. That all other things being equal, an increase in atmospheric CO2 will result in a rise in temperature.
The bait and switch that is common on blogs like this is for consensus types to use the term without definition. Which is why such a claim is met with, shall we say, skepticism here.
Patrick
You concede that “natural variation is large enough to mask CO2 increase on short time scales”.
Why limit this to “short time scales”?
How about “multi-decadal or even centennial time scales”?
Any valid reason why these should be excluded?
I cannot see that you have presented any logical reasoning to limit the “masking” by natural factors to “short time scales”.
Max
RiHo08
The “man walking the dog” has just imbibed five double-shots of whiskey chased down with five pints of stout.
His stumbling home from the pub is the “random walk” of a drunkard.
And the dog’s leash is a mile long and elastic.
Plus it’s not even his dog.
Max
Patrick Brown
You state
I’d go even a step further:
Do you?
Max
Has Richard Lindzen, Roger Pielke, or Roy Spencer for example claimed that GHGs don’t cause some amount of warming? Or, for a example closer to home, has Duke physics professor Rob Brown claimed such a thing? Any idiot can make a blog comment. If I want to know what range of opinions is at Duke University I don’t include the opinions of the pre-schoolers in the day care center. That wouldn’t be fair even though they are technically members of the community. ;-)
Natural variation runs the gamut between snowball (or at least slushball) earth and a planet with no polar icecaps green from pole to pole. Runaway cooling is possible and has happened. Runaway warming has not happened and that’s probably because it isn’t possible.
I believe that, rigorously speaking, the term “forcing” is misapplied to whatever temperature effects a change in atmospheric composition may bring. GHGs produce not an iota of energy; they merely absorb and re-emit radiation, resulting in a (largely vertical) redistribution of energy density. It is a capacative/storage effect. That should not be put on the same footing as changes in the energy supplied to the system by insolation, which constitutes true forcing.
Have a good weekend!
Patrick,
thanks for one of the clearest explanations I have seen to date.
AMO appears to be directly correlated to delayed tectonic activity to the north of Iceland
http://www.vukcevic.talktalk.net/AMO-NAO.htm
as demonstrated by area’s geomagnetic records and reflected in the global temperature reconstruction
http://www.vukcevic.talktalk.net/LLa.htm
>>As mentioned previously, the fundamental physics of the greenhouse effect are beyond any reasonable doubt <<
Why?
What if they aren't?
Or – more likely – what if the "sensitivity" has been grossly over-estimated, and the logarithmic CO2/temperature curve has already flattened to the extent that relatively large increase in CO2 will have a very small effect on the temperature? That would explain the parlous performance of the climate models, for a start.
Also, this begs the question of the apparent lack of any water vapour induced feedback, the NCAR data and especially the Solomon et al paper appear to indicate that atmospheric water vapour is decreasing, and without that, the whole high sensitivity water vapour driven positive feedback CAGW hypothesis is pretty much dead in the water.
So short leads, long leads, whatever. It all looks like clutching at straws to me.
Oh, and then there's the Grand Solar Minimum that we've all heard so much about…
“As mentioned previously, the fundamental physics of the greenhouse effect are beyond any reasonable doubt and therefore we expect warming to recommence in the future as we continue to emit greenhouse gasses. But when will the warming recommence?”
I see this all the time. Appeals to “the fundamental physics.” It sure sounds good. And yet climate sensitivity to Co2 is very much an open question. It might well be low enough that there’s no problem at all, or perhaps in a range that ultimately represents a net benefit in a slightly warmer world.
Someone help me, is my statement above somehow in violation of the laws of physics?
pokerguy, “Someone help me, is my statement above somehow in violation of the laws of physics?”
No, the fundamental physics considers an up/down radiant impact and not a three dimensional impact. That is where the models come in. Since the models appear to be missing quite a few things, up/down may not be the direction to look.
The statement is physically sound WRT radiational physics, but radiational is only part of the climate system – not the whole banana.
Pokerguy – I agree with you. Our two statements are not in conflict. Climate sensitivity to CO2 is an open question but the existence of some enhanced greenhouse effect to increases in CO2 is essentially a closed question.
Sorry, “laws.”
I agree with many here that the post was well written and clear. I think Patrick also appears to have a level head based on his neutral responses to many of the criticisms. If Patrick is representative of his peers, I see a better future for climate science communications compared to what we have witnessed in the past. Thanks for posting JC.
+1
“We know from the fundamental physics of the greenhouse effect”
Do we? Then why does no one explain the reason for the allegedly voracios appetite of CO2 for heat? We know that the specific heat of CO2 at 25C is not that greater than N2 or O2. It can only be the vibrational modes of CO2 that cause its appetite. But which vibrational modes? And since carbon has isotopes, there is no such thing as a standard CO2 molecule.. Fundamental physics yields no explanation of these factors. In fact quantum mechanics comes close to providing an answer and can provide a credinle reason for the ‘pause’, when you cosider the dynamics of any carbon molecule, and plumes of them, in the atmosphere. The dog on a leash analogy is good until you start to work out what motivates the dog, but how about a hot air ballon analogy for a plume of CO2 molecules?
Brown has not mentioned the sun spot’s 11 year cycle which is quite regular and so easily removable by a suitable filter. Of course a perfect filter would remove only the truely random components of the signal, but that is impossible, We do know that a human filter suitably steeped in the subject can sometimes do better. I have found that to be so when using automatic zero seeking algorithms. But science has to be reproducable.
”Nevertheless, the rate of warming has slowed in the 2000s relative to the 1990s”
CORRECTION: there wasn’t any warming in the 1990’s – there wasn’t any after. The only difference is: in the 90’s less people were scrutinizing = was easier to massage the numbers.EXTRA WARMING IS A MYTH!
Patrick: I liked the short leach-long leash analogy. Unfortunately, you didn’t follow up with some of the implications of your post.
You have correctly noted that our long-term direction is controlled by [equilibrium] climate sensitivity (ECS), but you don’t mention that confidence in our knowledge of ECS depends mostly on the short leash/long leash issue. Climate models are only consistent with a short leash; observations are suggesting a longer leash. If the short leash scenario is wrong, why should we have any faith in previous estimates of climate sensitivity from climate models?
When climate models have failed to alert us to the possibility of a long leash, there is no reason to assume that natural variability is only found on the multi-year (ENSO) and multi-decade (AMO/PDO?) time scale. The LIA, MWP and earlier periods suggest that multi-century natural variability also exists. Since this form of natural variability was discovered first, one might expect that the amplitude of these multi-century oscillations is larger than the shorter period ones. With so few candidate cycles of multi-decade and multi-century natural variability present in the historical record, we can’t have any significant confidence in estimates of the amplitude of these oscillations, assuming they are truly oscillations.
Why doesn’t the possibility of “long leash behavior” destroy all of the progress claimed since the IPCC’s first report?
“Climate models are only consistent with a short leash; observations are suggesting a longer leash.”
Some of the highest profile climate models (e.g., GISS Model-E, shown in my figure 4) are definitely short leash models. However, I am currently looking at all the CMIP5 models and there are several that do have large magnitude unforced variability (long leash). I hope that the spread of the magnitudes of unforced variability in these models is emphasized more in the future.
Patrick: Thanks for the reply. This might be an interesting subject for a second post.
Unfortunately, (as best I can tell) ensembles of perturbed physics show that all models rely on parameters whose values aren’t precisely known from lab studies and which can’t be uniquely determined by comparing model output to observation.
Excellent post Patrick!
Clarifies for me anyway, the difference between what we often hear about climate and what may actually be happening.
We shall not confuse planet Earth with a climate model. Even a terminology climatologists use seems to reflect models rather than underlying physical processes. Take a definition from the Wikipedia:
“The term “radiative forcing” has been used in the IPCC Assessments with a specific technical meaning, to denote an externally imposed perturbation in the radiative energy budget of Earth’s climate system, which may lead to changes in climate parameters.[1] The exact definition used is:
The radiative forcing of the surface-troposphere system due to the perturbation in or the introduction of an agent (say, a change in greenhouse gas concentrations) is the change in net (down minus up) irradiance (solar plus long-wave; in Wm-2) at the tropopause AFTER allowing for stratospheric temperatures to readjust to radiative equilibrium, but with surface and tropospheric temperatures and state held fixed at the unperturbed values.”.
Go and measure it. It is clearly a modeler’s definition, not a physicist’s definition.
Do we build climate castles on sand?
I think it is utter nonsense – tedious, pedestrian, uninspired, conventional thinking and totally wrong. It reminds me of a dutiful recitation of a dull lesson – with the inspirational addition of a clumsy metaphor.
I mentioned Wally Broecker earlier.
‘The climate system has jumped from one mode of operation to another in the past. We are trying to understand how the earth’s climate system is engineered, so we can understand what it takes to trigger mode switches. Until we do, we cannot make good predictions about future climate change… Over the last several hundred thousand years, climate change has come mainly in discrete jumps that appear to be related to changes in the mode of thermohaline circulation. We place strong emphasis on using isotopes as a means to understand physical mixing and chemical cycling in the ocean, and the climate history as recorded in marine sediments.’ http://www.earth.columbia.edu/articles/view/2246
Over the past hundred years climate has shifted repeatedly from warmer to cooler periods associated with abrupt changes in ocean and atmospheric indices and resultant changes in radiative feedbacks. Collectively the radiative feedbacks from coupled nonlinear processes in the climate system seem much more significant in the satellite era than CO2 forcing over the same period. Over several hundred thousand years temperature seems driven mainly by ice albedo feedbacks to thermohaline circulation.
The risk in poking Broecker’s angry beast – hardly a lap dog on a leash – with a stick is of course that changes in temperature of as much as 16 degrees C can occur in as little as a decade. So the thinking is entirely linear with a wiggle in the arse that was not contemplated a little time ago. The new climate paradigm is not linear at all – it is all ‘although fully deterministic, subject to abrupt and seemingly random change.’ http://rsta.royalsocietypublishing.org/content/369/1956/4751.full
It is very sad indeed to see a young man begin his scientific career as a scientific dinosaur.
On a very simple basis, the long leash is frightening. Why the bunnies ask? Because given the increase in ghg forcings, sooner or later the damn dog is going to wander way away from the path in the direction no one sane wants and global temperature will spike into the stratosphere.
It’s the same reason that you expect more records in the direction of a trending value such as global temperature, e.g. more record daily highs than lows, but with the added feature that the longer the leash the more so.
In short, young Patrick give us reason to fear
Oh no, it’s worse than we thought.
If Patrick is right (but see Chris Colose down below on why the leash extent is limited). Variability is no one’s friend. Ask any farmer
Josh (Eli),
Having been involved in farming all my life I, as usual, disagree with your comment. Variability has never been an issue, interference from so called “experts” in swaying policy is a far, far larger issue.
Talk about a dinosaur bunny. Surface temperatures are clearly in a cooler place.
Anastasios Tsonis, of the Atmospheric Sciences Group at University of Wisconsin, Milwaukee, and colleagues used a mathematical network approach to analyse abrupt climate change on decadal timescales. Ocean and atmospheric indices – in this case the El Niño Southern Oscillation, the Pacific Decadal Oscillation, the North Atlantic Oscillation and the North Pacific Oscillation – can be thought of as chaotic oscillators that capture the major modes of climate variability. Tsonis and colleagues calculated the ‘distance’ between the indices. It was found that they would synchronise at certain times and then shift into a new state.
It is no coincidence that shifts in ocean and atmospheric indices occur at the same time as changes in the trajectory of global surface temperature. Our ‘interest is to understand – first the natural variability of climate – and then take it from there. So we were very excited when we realized a lot of changes in the past century from warmer to cooler and then back to warmer were all natural,’ Tsonis said.
These chaotic modes associated with changes in the nature of ENSO tend to last 20 to 40 years in the proxy records – and there is really no guarantee that the pattern of warming to cooling to warming seen in the 20th century will repeat.
‘Figure 12 shows 2000 years of El Nino behaviour simulated by a state-of-the-art climate model forced with present day solar irradiance and greenhouse gas concentrations. The richness of the El Nino behaviour, decade by decade and century by century, testifies to the fundamentally chaotic nature of the system that we are attempting to predict. It challenges the way in which we evaluate models and emphasizes the importance of continuing to focus on observing and understanding processes and phenomena in the climate system. It is also a classic demonstration of the need for ensemble prediction systems on all time scales in order to sample the range of possible outcomes that even the real world could produce. Nothing is certain.’ http://rsta.royalsocietypublishing.org/content/369/1956/4751.full
‘Sometimes the convincing force is just time itself and the human toll it takes, Kuhn said, using a quote from Max Planck: “a new scientific truth does not triumph by convincing its opponents and making them see the light, but rather because its opponents eventually die, and a new generation grows up that is familiar with it.”‘
Not that I would not wish ill on the dinosaur bunny.
sooner or later the damn dog is going to wander way away from the path in the direction no one sane wants and global temperature will spike into the stratosphere.
Indeed, and as we know that the stratosphere is very cold eg Vostok. It is troublesome that we are poised for a catastrophic coldening eg Zalipin and Ghil
This S-shaped curve nevertheless reveals the existence of
sensitive dependence of Earth’s temperature on insolation
changes, or on other changes in Earth’s net radiation budget,
such as may be caused by increasing levels of greenhouse
gases, on the one hand, or of aerosols, on the other. This sen-
sitive dependence is quite different from the one advocated
by RB07. Namely, if the parameter u were to slightly decrease rather than increase, as it seems to have done since the mid-1970s, in the sense described in the last paragraphof Section 3.1 — then the climate system would be pushed past the bifurcation point at u≈0
The only way for the global temperature to go would be down, all the way to a deep-freeze Earth, with much lower temperatures than those
of recent, Quaternary ice ages
Two others who want to live on the knife’s edge. Anyone want to bet on a substantial decrease in the global temperature anomaly in the next 10-15 years?
I’ll see your seventeen year pause and raise you a Livingston and Penn, but you’ll have to declare what your ‘substantial decrease’ means.
============
Well Mak, you clearly have not seen the message of the puzzler. Even at 375 ppm, the q-branch of the CO2 spectrum is spiking up pretty high into the stratosphere.
OTOH, please guys, accept reality. If you have a random walk about a rising trend, the random walk is not your friend, and the longer the walk the worse your eventual outcome.
I pee on your dog standard.
=====
“If the CO2 mixing ratio is 37500 ppm then the absorption is so strong that to reach our detector at 70km, it has to be emitted from relatively high in the stratosphere, between 25 and 30 km where the temperature is above 240 K.”
Closer to 41km to 87 km, that rarefied air outside of most up/down models which is influenced by silly things like atmospheric tides, anisotropic refraction and adds 1.5 to 3 percent to the Energy budget not considered in flat Earth simplifications.
My wife has a rabbit and a chicken.
The leash is longer down than up.
There are more sources of variability that will give the false impression of cooling globally than there are that give false impression of warming globally.
An aerosol injection that disperses in half a decade doesn’t overall reset the global warming trend line to the bottom of the drop, or freeze time and reset the trend line as if the cooling removed the warming signal: the warming returns to the same point as if the aerosol cooling had never happened.
An ocean effect hiding the heat deeper below the surface? Well, besides us having a really poor understanding of the dynamics, is likeliest to last no longer than half the longest known overturning cycle, which is some seven decades, and is likely to redouble the heating in the latter half of the cycle.. if the oceans are simple conveyor belts, which they of course are not. And in the meantime, we don’t know what that heat does to ocean biochemistry in the deep, other than act as a disruption.
I’m very impressed by the analysis. I expect it to go far to bringing greater clarity to our understanding and explanations.
Thank you.
Climate seen as a tag-team wrestle between forcings. Trouble is, these forcings are not forces; they are rough, handy, but poorly understood observations sets. They can’t get in the ring, because they are merely abstractions representing our blurry understanding. They cannot work like buttons, levers and knobs on a console. They are a bunch of acronyms representing hopelessly incomplete sets of observations. Someone will find a new one soon, and add it to the shadow troupe of forcings. Maybe the latest observation set will have some value, maybe knowledge will be extended a fraction. Maybe it’ll just be a barbaric exercise in Publish-or-Perish, laid on for the climatariat and thin-air salesmen.
PDO can’t do anything, because it does not exist. Clouds, warmth, cool, winds do things. They exist and act, but in bewildering combination. PDO, AMO, ENSO are our rough shots at giving some shape to certain observed combinations. As for the notion of climate as the main event wrestle between naughty GHGs and naughty aerosols…guys, we have got to ease up on this self-loathing.
For people who know little about what lies under the oceans and under our feet, who have had satellites whizzing above for the tiniest fraction of time required to draw conclusions on the vast flux called climate, we are very confident in our small wits. Too confident.
If there is something you do not know, why then…you do not know it!
The PDO certainly does exist as a measure of nutrient rich and very cold upwelling.
http://www.nwfsc.noaa.gov/research/divisions/fe/estuarine/oeip/ca-pdo.cfm
Same deal with ENSO.
Chief, I’m not saying the upwellings etc do not occur. I’m certain they do. Nor am I objecting to observations sets with names like PDO. I’m just hoping the present cooler phase isn’t punctuated by an almighty drought in its middle, as happened in Oz, in between the drenchings of the early fifties and the storming 70s. And what about the current Qld drought? There was definitely a back-to-the-50s shift to oceanic winds, winter storms and higher rainfall around my region after 2007, but I doubt we can treat PDO as a neatly performing “mechanism”, anymore than we can treat ENSO that way. (The droughty and hot 1930s were our only decade without marked El Nino. Go figure.)
I admire the work of Mantua and the fisheries people who made the first PDO observations and studies. I’m fine with all that! But it’s time we told the kool kidz that finding some new buttons for their climate console and Game of Forcings is not going to make them scientists, even if they get published. Especially if they get published.
I find this post superb. If I’m understanding you correctly, we’re using what amounts to bunch of fuzzy-headed constructs in an attempt to fool ourselves into thinking we know what we’re talking about,
I’m reading a biography of n Einstein and I don’t think there’s much question he’d have been a howling skeptic on so-called global warming.
+1 moso^2
Before you start talking of global temperature change make sure that you know what global temperature is. The temperature graph you show has it wrong. In it is a temperature rise in the eighties and nineties that does not exist. I proved it was fake and demanded an investigation but nothing happened. Then, over two years later, GISTEMP. HadCRUT and NCDC all withdrew their fake warming and are now showing the equivalent of satellite data I used in exposing this fraud. But you are still showing their old, uncorrected version. And so are AR5 previews. Temperature history is not a trivial matter and can lead to wrong conclusions if distorted. I suggest you download the latest version of your dataset and work with it. Their fake late twentieth century warming has been used for years as an argument that man-made warming exists because no one could find a natural cause for it. Man-made it was, cooked up in the back rooms of global temperature guardians. Articles that refer to it as proof of warming should all be withdrawn. A second thing that irritates me about this graph is the abundance of electronic noise. In the process of secretly computer processing these data the masters of global temperature used software that had an unexpected consequence. Namely, it left high spikes in their temperature dataset at the beginnings of years. I count at least a dozen such spikes sticking up from your graph. They are pure noise, not signal. Someone should have taken the trouble to search them all out and eliminate them. Since this was not done, you are on your own. They have gone undetected at least for five years and those who did notice it thought it was just random noise, It is not. They infest all ground-based temperature curves. They are best detected if you overlay raw data with a semi-transparent band as I did in my book. Now about trends. The straight line you draw from lower left to upper right is phony. Get rid of it. The trend from 2001-2012 you show correctly. There is also another horizontal trend line from 1979 to early 1997 but on your graph it is wiped out by the phony late twentieth century warming. When you get the new version you should be able to see it. Best to use first a semi-transparent overlay, then mark center points of the oscillation with dots, connect the dots, and you have the global trend for that section. Finally, take a note of how much space is still left that is not covered by these two horizontal trend lines. Now back to work.
The leash analogy is a good one. I think that the current period of stable temperatures does proves that the idea of short leash tied to CO2 is false.
But if the leash is long enough, the temperature records of the twentieth century cannot show us any trends.
And I think the explanations “early warming from the sun, mid cooling from aerosols, late warming from man-made CO2” are just blatantly ad hoc.
Serfs’ love aphorisms, some of us bein’ illiterate. and
all of us bein’ too pressed fer time ter do lengthy readin’,
some livin’ , well existin’ more like it, in book free zones,
hence I ask: Say, how long is a piece of string?
Bts
Beth, string gotta be more long thn hounds tale and bod
Think yourself lucky – you’ve got a potato for dinner don’t you? If they told you how long it was it would be off to UNtopia Minnesota – again.
I cannot help but note how his Figure 8 is almost the same as my Figure 8
compare
http://patricktbrown.files.wordpress.com/2013/07/fig8.png
with
http://curryja.files.wordpress.com/2013/05/f8.jpg
It’s amazing what happens when you suspect there are ocean warm/cool cycles. Pity this wasn’t thought of 20 years ago.
JC says: “I like the dog-on-a-leash analogy.” I hope you mean that as in “it’s refreshing and it’s entertaining”. Rather than you like it because it’s so “scientific”. It toes the CAGW party line that climate is deterministic and weather is noise. Forget the length of the leash, if any. Show me how big the dog is and how small the child holding it is (or not). Maybe there is even a dog team or there are multiple dogs on leashes pulling in different directions. This analogy assumes too much. It’s hand-waving.
Hi Patrick, thanks for the post. I am also a PhD student in Atmos sci, nice to see others getting more engaged. I would suggest starting your own blog if you have the time to do this more consistently.
Your discussion of the leverage that natural variability has on global-mean temperature on decadal timescales is misguided, however. I’ll quote this old post from Andy Lacis at NASA GISS, with my own comments afterward:
…………..
“This is where it is important to understand that the natural variability of the climate system represents temperature fluctuations about a zero reference point. Moreover, these random-looking fluctuations most definitely are not random variations (as in random walk), such that given enough time, they could move the global temperature arbitrarily far from its equilibrium reference point. Climate GCMs (and the real world) must conserve energy, so arbitrarily large departures for the equilibrium reference point simply can not happen in the absence of external forcing being applied. Thus, given enough time, the unforced climate will approach its equilibrium point, and averaging over a time scale that is longer than the time scales of the fluctuations will serve to define the point of equilibrium.”
……………
The science is simply no longer at a point where we can permit arbitrarily large fluctuations in global mean temperature in an unforced setting, especially “warming spikes” as their is a lot more wiggle room to bring up cold water to the surface. There is no example of an unforced coupled ocean-atmosphere model, nor is their evidence in the Holocene, in which particular realizations abruptly generate changes as large as the observed trend. Any appeal to natural modes of variability- pick your favorite 3-4 letter acronym- must work within the physical constraints of the system and be consistent with signatures/fingerprints that are observably seen (e.g., both ocean heat content and surface temperatures have gone up in the long term). This is flatly incompatible with an ocean-sourced warming over the last century, and no physical mechanism has been proposed in which you can get some mode (e.g., AMO) to give 0.8 C of warming. Of all the proponents here on the large significance of natural variability- Willis, Bob, etc, none of them have any grasp of the physical constraints imposed by conservation of energy.
(Note: I’ll only respond to Patrick on this. I am aware of the reception this comment will get on this blog, and I’m really not interested in pseudo-science)
Somebody must have watched Gavin Schmidt on Stossel’s show a couple weeks ago.
Chris, how about pseudo-science published in AMS? The models do produce unforced variations on the centennial time scale. Enough variation to explain all of the warming for the last 150 years according to the authors of this paper:
http://www.ldeo.columbia.edu/~jsmerdon/papers/2012_jclim_karnauskasetal.pdf
I’ll reply to peer-reviewed sources like this. The Karnauskas paper is quite good, but doesn’t at all conclude what you say it does. Re-read it.
Chris, for some reason it won’t let me cut and paste from this paper but let me type out what they say and you can safely conclude any errors are mine
“If nature exhibits such a strong variability of tropical SSTs on centennial time scales, then assumptions that the observed trend over the past century to a century and a half is a response to radiative forcing are tenuous.”
Models are not climate and all models diverge.
‘The blue lines show the trajectories of the individual forecasts that diverge from each other owing to uncertainties in the initial conditions and in the representation of sub-gridscale processes in the model. ‘
http://rsta.royalsocietypublishing.org/content/369/1956/4751/F2.expansion.html
Julia Slingo and Tim Palmer said something similar.
Figure 12 shows 2000 years of El Nino behaviour simulated by a state-of-the-art climate model forced with present day solar irradiance and greenhouse gas concentrations. The richness of the El Nino behaviour, decade by decade and century by century, testifies to the fundamentally chaotic nature of the system that we are attempting to predict. It challenges the way in which we evaluate models and emphasizes the importance of continuing to focus on observing and understanding processes and phenomena in the climate system. It is also a classic demonstration of the need for ensemble prediction systems on all time scales in order to sample the range of possible outcomes that even the real world could produce. Nothing is certain.
Ghil 2008 is a very important paper for the understanding of natural variability with coupled systems eg.
The natural climate variability induced by the low-frequency variability of the ocean circulation is but one of the causes of uncertainties in climate projections. The range of these uncertainties has barely decreased, or even increased, over the last three decades. Another major cause of such uncertainties could reside in the structural instability – in the classical, topological sense – of the equations governing climate dynamics, including but not restricted to those of atmospheric and ocean dynamics.
There was a very important reference in the abstract that directly relates to the methodology
As a very first step in this direction, we study the behavior of the Arnol’d family of circle maps in the presence of noise. The maps’ fine-grained resonant landscape is smoothed by the noise, thus permitting their coarse-grained classification.
The relevance of the mathematical physics being in excess of Colose understanding.
‘Assumptions…..are tenuous’, and Chris and Patrick cling bitterly to them.
================
Chris, I know that global conservation of energy must be satisfied, but that’s a very weak constraint on the system. In chaotic nonlinear systems there are bifurcations and tipping points. Thus, you need a lot more to say much. I personally believe that this is the problem with GCM’s. There is too much dissipation so that the dynamics are damped and these modes of variability are damped out in time, just as Lacis describes. This tells us very little. I can get the same result for a much simpler fluid dynamical system and get an unphysical equilibrium flow that is very far from the real flow. One recent example is in the AIAA Journal by Darmofal et al. Of course, because of positive results bias, these results are not usually published but filed in the desk drawer as due to some other problem.
David- Models of varying complexity have bifurcations and tipping points, depending on the process you’re talking about. There’s no evidence this can occur for a planet’s temperatures unless you kick in to some radically different regime of e.g., sea ice. The top of the atmosphere radiation balance is a strong opposition to arbitrarily large changes. Moreover, very large fluctuations are not compatible with estimates of low climate sensitivity, as this is proportional to the time constant to come back to equilibrium
Conservation of energy is for closed systems. The Earth isn’t a closed system to energy. That is why models can increase the ocean heat transport poleward and change the amount of energy going into the system by changing the albedo.
What I mean is that all energy must go somewhere. You can’t have spontaneous internal sources of energy that starts heating everything up. And if you want to argue that the oceans are heating things up, then that needs to be shown in an attribution study which can reconcile the spatio-temporal structure of heating with observations. Non-linear and complex systems don’t mean free-for-alls.
Actually Chris, I’d love to see an attribution of how much warming the changes in ocean heat transport shown in this reconstruction of Gulf Stream transport caused both on the way down from the MWP and back up from the LIA. It doesn’t really appear to start at the highest point of transport in the beginning iof the reconstruction but it would still be interesting.
http://www.nature.com/ncomms/journal/v3/n6/fig_tab/ncomms1901_F5.html
No idea actually. I’ll do some research into it soon…
bifurcations and tipping points are not your friend, nor anyone else’s. Essentially you are advocating for driving the climate system far away from a stable point in which case anything can happen. The analogy is kicking a sleeping tiger. You tend to end up as dinner.
Tiger piss! Now that’ll scare off the dogs.
========
Rabbit, “bifurcations and tipping points are not your friend, nor anyone else’s. Essentially you are advocating for driving the climate system far away from a stable point in which case anything can happen. The analogy is kicking a sleeping tiger. You tend to end up as dinner.”
Perfect analogy for a timid rabbit. Every dynamic system that is control has bifurcations and tipping points. The more the better. If there are only one or two tipping points, boom.
http://en.wikipedia.org/wiki/Hyperbolic_equilibrium_point
The increasing GH gas concentrations mean the energy balance of the open system is being altered, such that each year more energy is being stored somewhere in the system. The balance and location of energy in the system at any given time will be a function of both internal variability plus external forcing, with general enhancement in the advection of energy from equator to pole to be expected driven by the net increase of energy in the system. Thus, enhancement of large scale advective processes such as the Brewer-Dobson circulation in the atmosphere and ocean currents bringing warmer water to the poles are to be expected, are seen in the models, and confirmed by observation.
R Gates, reference for OHT observations following forcings if you have any. If you are just going by the fact that the Arctic is warming that does not mean that OHT is currently increasing and the study using Argo data by Josh Willis states there is no increase although the time period of the study is limited. It could be that the Arctic is still adjusting to previous changes in OHT. I wouldn’t rule it out of course the data is simply too sparse. I don’t know might be a good answer for this one.
I agree that what is missing in the leash analogy is something related to the time scales. On short time-scales, the dog can get a long way from the man (witness El Nino 1998), but as you average over longer and longer spans, the dog’s mean position drops to perhaps 0.1 C from the man at 30 years. It is a bit like Heisenberg’s Uncertainty Principle where larger energy perturbations have shorter lifetimes. This is why I continually advocate looking at 30-year running means because that really gives a good idea where the man is within 0.1 C.
The leash is in some sense elastic. Strong perturbations are pulled back more strongly by energy conservation. Hotter ocean surfaces radiate faster.
Hi Chris,
Thanks for your comment.
You say that…
“Your discussion of the leverage that natural variability has on global-mean temperature on decadal timescales is misguided”
and that…
“There is no example of an unforced coupled ocean-atmosphere model, nor is their evidence in the Holocene, in which particular realizations abruptly generate changes as large as the observed trend.”
I am not sure where you are disagreeing with me because there could be large unforced multidecadal variability in global mean T that is still not large enough to account for the 0.8C warming. Nowhere in my post do I suggest that ALL the warming is unforced. In fact, the leash analogy agrees with the sentiment that global mean T is not a random walk as a random walk has no restoring force (no leash).
Also, as far as conservation of energy is concerned, be careful not to think of the climate system as unable to modulate its own energy balance through unforced variability. Quoting directly from the post:
“…unforced variability can also change the total amount of energy in the earth system by changing constituents of the surface or atmosphere that interact with the amount of solar energy coming in, or the amount of infrared energy leaving the earth (Herweijer et al., 2005). For example, if some internally generated change in an ocean circulation caused more heat to be distributed to polar latitudes; this could cause sea ice to melt. This melting sea ice would cause less solar energy to be reflected back to space (ice is much more reflective than open ocean) and thus this would increase the total amount of energy in the climate system.”
Sure, but that’s a pretty small term in the planetary energy balance and no evidence this is what happened. Attribution isn’t just about plausible bounds, but finding fingerprints that these things actually happened.
Chris, I’m sure you have a better handle on the Gulf Stream transport than I do since you said soon (haha) but here is what I have so far. The 2 estimates I have found were from an old RC post where they said the highest ssts would be 1C higher and the other estimate was from an old paper that approximated it at up to 2C higher (I believe Mann was a coauthor but I didn’t bother to save since you had probably located it by now anyway). The recent paper by Judith on the AMO shows a peek to trough variation of 0.8C in ssts. So now we have a starting point. Approimately 1 to 2 times more warming than from a change in the AMO from its most negative to its most positive phase. The approximations I have seen on global climate difference due to the AMO ranges from 0 (there is no such thing as the AMO despite all the papers done on it, deniers of the AMO I guess) to as high as 0.3C. So now we have a range between 0 and 0.6C. If a person were to take that long term trend at the 0.6C value and the short range trend also at the high end for another 0.3C you would have 0.9C warming globally. So, there we have it. The trend in temperatures from the changes in Atlantic SSTs ranges somewhere between 0C and 0.9C. In other words it could explain all or none of the warming since the LIA. I think it would be worth finding out out where in that range it is actually at.
Yes, but they are talking about zonal Pacific SST gradients, not global mean temp. No one thinks we know for sure how the former will change to slightly el nino-like or more la nina-like ish state (e.g., mid-Pliocene with weakened zonal gradients). It’s an interesting topic.
(in response to Steve above)
No, they aren’t really just talking about zonal Pacific SSTs as shown by this comment in the paper
“It should be noted that simulated centennial variability in the tropical Pacific Ocean is no stronger than in other parts of the world ocean and is actually weaker than in many high-latitude areas. The global implications of the variability, however, could be larger given the sensitivity of global atmospheric circulation to small changes in the warmest SSTs in the tropical Pacific.”
Yes, there’s global teleconnections to tropical pacific SST variability. I agree. This can translate into things like unforced variability on long timescales in things like drought occurrences in the Southwest in the last Millennium (Several of the group members in your paper did follow-up work on this, Jason Smerdon gave a talk not too long ago in my dept.). This is an interesting problem
‘The top-of-atmosphere (TOA) Earth radiation budget (ERB) is determined from the difference between how much energy is absorbed and emitted by the planet. Climate forcing results in an imbalance in the TOA radiation budget that has direct implications for global climate, but the large natural variability in the Earth’s radiation budget due to fluctuations in atmospheric and ocean dynamics complicates this picture.’
http://meteora.ucsd.edu/~jnorris/reprints/Loeb_et_al_ISSI_Surv_Geophys_2012.pdf
The energy budget Chris is talking about is:
d(W&H)/dt = power in – power out
Where W&H is work and heat – and power is in Joules/second
This is only transiently in equilibrium (d(W&H)/dt = 0) responding in large part to changes in radiative feedbacks to ocean and atmosphere dynamics. The feedbacks involve ice, snow, cloud, drier or wetter air, dust and vegetation. The radiative feedbacks change the radiant flux out component by reflecting more or less sunshine. The albedo is most often assumed to be constant – but it is not.
Overwhelmingly for instance – warming in CERES for instance was in SW.
http://s1114.photobucket.com/user/Chief_Hydrologist/media/CERES_MODIS.gif.html?sort=3&o=90
‘The global climate system is composed of a number of subsystems – atmosphere, biosphere, cryosphere, hydrosphere and lithosphere – each
of which has distinct characteristic times, from days and weeks to centuries and millennia. Each subsystem, moreover, has its own internal variability, all other things being constant, over a fairly broad range of time scales. These ranges overlap between one subsystem and another. The interactions between the subsystems thus give rise to climate variability on all time scales.’ http://www.atmos.ucla.edu/tcd/PREPRINTS/Math_clim-Taipei-M_Ghil_vf.pdf
‘Tropical variations in emitted outgoing longwave (LW) radiation are found to closely track changes in the El Nino-Southern Oscillation (ENSO). During positive ENSO phase (El Nino), outgoing LW radiation increases, and decreases during the negative ENSO phase (La Nina). The coldest
year during the last decade occurred in 2008, during which strong La Nina conditions persisted throughout most of the year. Atmospheric Infrared Sounder (AIRS) observations show that the lower temperatures extended throughout much of the troposphere for several months, resulting in a reduction in outgoing LW radiation and an increase in net incoming radiation. At the global scale, outgoing LW flux anomalies are partially compensated for by decreases in midlatitude cloud fraction and cloud height, as observed by Moderate Resolution Imaging Spectrometer and Multi-angle Imaging SpectroRadiometer, respectively. CERES data show that clouds have a net radiative warming influence during La Nina conditions and a net cooling influence during El Nin˜o, but the magnitude of the anomalies varies greatly from one ENSO event to another.’ Loeb et al op cit
The most reliable indicator of long term ocean and atmosphere variability are ENSO proxies.
Here’s a 1000 year proxy. More salt = La Nina
http://s1114.photobucket.com/user/Chief_Hydrologist/media/Vance2012-AntarticaLawDomeicecoresaltcontent.jpg.html?sort=3&o=68
Here’s an 11,000 year proxy.
http://s1114.photobucket.com/user/Chief_Hydrologist/media/ENSO11000.gif.html?sort=3&o=127
The temperature increase in the early part of last century was mostly natural presumably – or at least attribution is more problematic.
The warming at the end of the century is about 0.1 degrees C/decade after eliminating ENSO dragon-kings in 1976/1977 and 1998/2001. See for instance realclimate – http://www.realclimate.org/index.php/archives/2009/07/warminginterrupted-much-ado-about-natural-variability/
Most of that seems likely to be SW.
http://s1114.photobucket.com/user/Chief_Hydrologist/media/cloud_palleandlaken2013_zps3c92a9fc.png.html?sort=3&o=13
http://www.benlaken.com/documents/AIP_PL_13.pdf
I enter no correspondence with uppity little space cadets.
Again Chief, it seems you avoid the sticky problem of trying to remove the external forcing influences from the internal variability. As Patrick so nicely put it:
“The fundamental problem with analyses such as the one above (and in Zhou and Tung, 2013) is that the statistical method assumes that the AMO/PDO could cause global temperature change, yet that global temperature change could not cause variation of the AMO or PDO. This assumption is almost certainly violated because the AMO and PDO themselves are measures of temperature variability. Therefore, it is difficult to separate any temperature change that might be influencing the AMO or PDO from temperature change that they might be influencing.”
—–
Thus, you can’t fully separate how much the super El Niño of 97-98 may be influenced by some external forcing, whether it be GH gas concentration increases, the sun, or some combination. In Patrick’s terms, we can’t know how much the man tugging on the leash is influencing how the dog wanders around.
And yet it is clearly sufficient to offset surface warming – at least – for another decade to three.
‘David- Models of varying complexity have bifurcations and tipping points, depending on the process you’re talking about. There’s no evidence this can occur for a planet’s temperatures unless you kick in to some radically different regime of e.g., sea ice.’
I think that’s the point. I mentioned Wally Broecker earlier.
‘The climate system has jumped from one mode of operation to another in the past. We are trying to understand how the earth’s climate system is engineered, so we can understand what it takes to trigger mode switches. Until we do, we cannot make good predictions about future climate change… Over the last several hundred thousand years, climate change has come mainly in discrete jumps that appear to be related to changes in the mode of thermohaline circulation. We place strong emphasis on using isotopes as a means to understand physical mixing and chemical cycling in the ocean, and the climate history as recorded in marine sediments.’ http://www.earth.columbia.edu/articles/view/2246
We construct a network of observed climate indices in the period 1900–2000 and investigate their collective behavior. The results indicate that this network synchronized several times in this period. We find that in those cases where the synchronous state was followed by a steady increase in the coupling strength between the indices, the synchronous state was destroyed, after which a new climate state emerged. These shifts are associated with significant changes in global temperature trend and in
ENSO variability. The latest such event is known as the great climate shift of the 1970s. We also find the evidence for such type of behavior in two climate simulations using a state-of-the-art model. This is the first time that this mechanism, which appears consistent with the theory of synchronized chaos, is discovered in a physical system of the size and complexity of the climate system.’
Citation: Tsonis, A. A., K. Swanson, and S. Kravtsov (2007),
A new dynamical mechanism for major climate shifts, Geophys.
Res. Lett., 34, L13705, doi:10.1029/2007GL030288.
Seriously dinosaur behavior.
My flabbers are well and truly gasted!
A dog leash has proven utility.
Climatology has none.
The physical principles on which a dog leash is based can be experimentally demonstrated.
The physical principles on which the GHE is based cannot. The GHE remains on the shelf between Caloric and Luminiferous Ether.
A ten year old child, given a length of rope, can produce something something of benefit to humanity (a dog leash), in short order.
Ten thousand scientists, given ten thousand computers, billions of dollars, and several decades, can produce precisely nothing of benefit to humanity.
Wrapping the Earth with CO2 cannot halt 4,500,000,000 years of cooling, let alone reverse this process.
When hundreds, if not millions, of people share the common delusion that is global warming, it becomes a popular delusion, and may leads to the madness of crowds, with the usual consequences. The believers are worthy of our compassion, unlike their leaders who are afflicted with delusional psychosis.
History indicates that scientists can be gullible, and easily lead into believing the non-existent or ridiculous. Caloric, GHE, the Indivisibility of the Atom, Phlogiston, Phrenology – the list goes on.
Dog leashes and other analogies? Spare me, please. Feynman manages to explain quantum electro dynamics without analogy as I recollect. In general, if you understand your subject, you can explain it without resorting to analogies. If you assess your target audience as being really, really, stupid, you can dismiss them as idiots. If they don’t understand basic science, they will only become confused by all the talk of dogs and leashes!
I leave it to others to point out the assumptions passed off as fact, if they wish. Good luck.
Live well and prosper,
Mike Flynn.
ozzieostrich
I would not disagree with much of what you say. However ‘the assumptions passed off as fact’ are of crucial importance as they are driving the sort of policy that means that mostly cool cloudy Britain is building hundreds of solar farms and a carbon tax is seriously impeding the ability of business to compete in the global market. Therefore these ‘facts’ must be challenged.
tonyb
Wound old Nurses.
===============
Read Feynman’s “QED”. He provides an analogy involving a clock with hands rotating. If you read the book carefully, you will find Feynman is very unhappy because this analogy is the closest he can come to a conceptual explanation of quantum electrodynamics theory, and it infuriates him that he (or anyone else) cannot give a good causal explanation of QED.
I was walking round the park this morning and i saw a man with a dog out for a walk and he kept changing the length of the leash.
son of mulder,
Adjusting ter circumstances is kinda’ smart ain’t it, like
the maxim, ‘reform and make new?’ I reckon the earths
coupled system is kinda smart .
Bts
This is analogous to the heat sneakily diving into the deep ocean. :)
I thank Patrick Brown for his clear and concise presentation. His dog-on-a-leash analogy might be easier to understand than the stock-market analogy. However, Patrick may be interested to know that I meander as much as the dog.
Poor deluded Max just thinks he’s in control. Doesn’t he know the dog has a CO2 Control Collar? Those rabbits off to the side are electric, and may be safely left to their dreams of supercomputers leaping tall buildings in a single climate model run.
===============
I’m with Willis It is not a linear warming, he states the physics of CO2 have been known for150yrs also known for 150yrs is that the warming effect of CO2 logarithmically diminishes with concentration, so how can it be linear.
Because the growth in emissions has been exponential.
Yup, two curves make a straight line, sometimes.
====
Just had dinner. I am a bit bloated. Creamy mushroom sauce over a big T-bone with shoestring fries and streamed vegies. Maybe I should change careers – I could become a Chef.
I just have to laugh. It just seems such an enormous mish mash of error and rhetoric. The planet has been cooling for 4.5 billion years? It is almost as silly as HAP, Myrrh, Stefan, Jabberwocky or the Webster. Sure it is not linear. Linear is a straight line right? With few exceptions – it is all so magnificently deluded and I wonder how anything sensible can emerge in the next generation. We have it seems a policy of carbon taxes (sorry carbon dioxide taxes – for the pedantically challenged) or a policy of no taxes. And everyone is convinced that this is not a zero sum game. But it is all we have so we may as well fight it out to the bitter end.
I quote Wally Broecker – the ‘father of climate science’ – for one side it simply doesn’t register. In principle he is the father of consensus but in practice none of the space cadets stops to understand what it is he is saying about nonlinearity. Science in general that doesn’t seem to fit with the simple linear memes is simply passed over with as much haste as possible. The other side just makes it up as they go along. Both are utterly convinced that they are the bees knees of science and logic. Very little actual science – again with notable exceptions – seems to make it into the discourse.
I will leave you with a villanelle – an especially beautiful form.
‘I am just going outside and may be some time.’
The others nod, pretending not to know.
At the heart of the ridiculous, the sublime.
He leaves them reading and begins to climb,
Goading his ghost into the howling snow;
He is just going outside and may be some time.
The tent recedes beneath its crust of rime
And frostbite is replaced by vertigo:
At the heart of the ridiculous, the sublime.
Need we consider it some sort of crime,
This numb self-sacrifice of the weakest? No,
He is just going outside and may be some time —
In fact, for ever. Solitary enzyme,
Though the night yield no glimmer there will glow,
At the heart of the ridiculous, the sublime.
He takes leave of the earthly pantomime
Quietly, knowing it is time to go.
‘I am just going outside and may be some time.’
At the heart of the ridiculous, the sublime.’
Derek Mahon, Antarctica
Chief,
I assume it is me you are castigating about the planet having cooled for 4.5 billion years. If it was created 4.5 billion years ago with a molten surface, it sue as hell hasn’t warmed up since. The core and mantle still seem to be molten, but if you believe the Earth has stopped cooling, you might let me know when the cooling stopped.
I presume this means that the core and the mantle will retain their molten state forever. Maybe I’m stupid, but I find this a tad hard to believe.
Maybe I misunderstood you.
Live well and prosper,
Mike Flynn.
Chief,
Sorry. I meant to say “sure as hell” rather than “sue as hell”.
I can only assume my brain was diverted by your “streamed vegies”.
Internet food. And me saying a thousand computers can’t produce even a grain of rice!
Wrong again, Mike!
Live well and prosper,
Mike Flynn.
The gal at the ‘Shout and Sack’ said I could sign up for a carwash on the internet and I asked if I could get my money back if the internet didn’t get my car clean enough.
==============
At some point in time we can all benefit from using sight savers, for a change you can see now.
“During El-Niño years, this buried heat is released back to the surface and the global mean temperature tends to be a little warmer than it would be otherwise.”
Really? Keeping in mind “this buried heat” is diluted into a basin with an average temperature of 4C exactly how does it concentrate back into the much smaller volume of the surface layer? Does the phrase “law of entropy” appear anywhere in your curricula? I’m sure it must. Maybe you slept in that day.
Magic David, magic.
DS, is the part you don’t understand why the East Pacific warms by several degrees during an El Nino? Are you doubting El Nino can do that, or don’t you believe how it does it by spreading warm surface water from the deep west Pacific pool? It’s OK not to know, but don’t blame the poster for your own lack of knowledge. Phrasing it as a specific scientific question helps as always.
The correct answer is it’s not buried.
To some extent it is pushed aside by trade winds. The same trade winds that push it aside also cool the surface through evaporation just like blowing on a spoonful of very hot soup will help it cool faster. Fercrisakes it’s like I’m explaining this to a child. How old are you Jimbo? But I digress. The higher trade winds also cause deeper mixing of warm surface water into cooler water below. As well the warm water displaced by the trades still floats and must be replaced which causes an upwelling of colder water on the upwind side. This is how La Nina forms. It’s not energy neutral as the author states the basin has a net loss of energy due to increase in latent heat loss.
The flip side, an El Nino, is caused by slower than average trades. The calmer sea surface mixes less with cooler water below, latent heat loss slows, upwelling of colder water slows, and solar energy accumulates in a shallow top layer. This also is not energy neutral and the entire basin gains energy.
Thanks for playing. There’s a consolation prize waiting as you exit stage left.
The author’s premise that internal variability is a zero-sum game where total energy in the earth system does not change is fallacious. His entire argument is taken down by that false premise.
Internal variation includes changes in albedo. Changes in albedo involve loss or gain of energy from the system. It’s naive to overlook it. This article is utter dreck.
Since steven has gotten ocean transport into the mix, might as well get this all out:
Gavin, I agree completely with the standard picture that you describe, but I don’t agree with the claim that “… as surface temperatures and the ocean heat content are rising together, it almost certainly rules out intrinsic variability of the climate system as a major cause for the recent warming”. Suppose that there has been a multi-century increase in the poleward heat transport in the oceans due to internal variability, which warms the poles, reduces ice extent and albedos, and thereby warms the planet. The land surface and atmosphere go along for the ride, having little heat capacity. There is no evidence for anything of the sort, but I don’t see any logical inconsistency — we need to be careful not to claim too much, thereby creating an opportunity for a critique that is besides the point. The consensus picture that you paint is convincing because the estimated forcings, the models, and the observations are all consistent, not because of an argument that internal variability has to cool one part of the system in order to warm another. – Issac Held
Response: Isaac, I agree with your general point that a redistribution of heat in the system can alter feedbacks in a way that could affect the energy balance. The obvious example is collapse in the North Atlantic MOC, which leads to more sea ice etc. However, the impact on global (as opposed to local) temperatures of even large variations in the overturning is very small. Thus it doesn’t appear to be much of a practical effect. For the case at hand though, the distribution of heat anomalies in the ocean makes a redistribution+feedback effect very unlikely. -gavin
He ain’t seen no ‘large variations’ yet.
=======
JCH, there is at least one model out there that shows a 15% increase in OHT would cause a 2C increase in global temperatures. I have been linking a reconstruction that has an increase of 5-10% in the N Atlantic. To say there is no evidence of anything of the sort is incorrect. You could argue it is weak evidence since it is only one basin but I can’t find reconstructions of the other basins for OHT. Besides, the N Atlantic appears to be an influencial area if calculations of the effects of the AMO are towards the high end of the studies that claim 0.2 to 0.3 C just for that fluctuation.
JCH, “However, the impact on global (as opposed to local) temperatures of even large variations in the overturning is very small. Thus it doesn’t appear to be much of a practical effect. For the case at hand though, the distribution of heat anomalies in the ocean makes a redistribution+feedback effect very unlikely. -gavin”
That will be one of those haunting statements. Brierley et al. estimates that the shift in the meridional circulation (THC) ~ 12ma to have had ~3.2 C of global impact and zonal (ENSO like) to have had 0.6C of global impact. Considering the zonal,
https://lh5.googleusercontent.com/-yCVnY6nXIiQ/UZmVEhGt-oI/AAAAAAAAIJs/EozQSkgn614/s817/IPWP%2520spliced%2520with%2520cru4%2520shifted%2520anomaly%2520from%25200ad.png
The Oppo 2009 IPWP compared with tropical ocean temperatures indicates preindustrial variations in the range of +/- 0.7 C.
If you compare the Northern extra tropical SST to the southern, the “seesaw” pretty much generates Vaughan Pratt’s SAW and the AMO by itself, not detrended, should be pretty obvious evidence that OHT has a larger than 0.2 C net zero impact in periods longer than 60 years.
steven
Ocean heat transport is invariably correleted with cooling when it speeds up hot warming. That’s because the average basin temperature is 4C while the average surface temperature is about 10C higher. Any increase in transport mixes more warm surface water with the much colder, much larger volume of the cold abysss.
Could you provide a link to the “model” which you say shows the contrary?
steven
Ocean heat transport is invariably correleted with cooling when it speeds up
hotnot warming. That’s because the average basin temperature is 4C while the average surface temperature is about 10C higher. Any increase in transport mixes more warm surface water with the much colder, much larger volume of the cold abysss.Could you provide a link to the “model” which you say shows the contrary?
David, I’m not aware of any model that claims increases in OHT will cause cooling although there is certainly some disagreement as to how much warming it would cause. Perhaps you are thinking of upwelling.
http://onlinelibrary.wiley.com/doi/10.1029/91JD00009/abstract
Reduced Arctic ice cools the planet. A lot of bass ackward thinking going on here. Albedo increases as sun gets closer to the horizon so a polar ocean is already higher in albedo with ice or without. Moreover the sun is very weak due to low angle on the horizon and isn’t even visible for half the year. So albedo in the Arctic makes little difference. What makes a huge difference is water exposed to air where it can shed heat by evaporation and surface area greatly expanded for sensible heat transfer by wind and waves compared to being blocked from evaporating, insulated, and stilled by thick ice cover.
This is precisely why global average temperature took a pause IMO. As Arctic ice cover declined so did rate of global warming. You boys make some stuff a lot more complicated than it needs to be. You bury yourself in irrelevant details like a fraction of a percent increase in a trace gas while missing what the big kahuna (global ocean) is doing.
Poleward energy advection both in the atmosphere and ocean is the natural process for energy to balance on the planet. If the process is enhanced, it’s because there is more energy to be balanced, but you won’t see a cooling because of it. My air conditioner works harder on a warm day, but the temperature in my house stays right at 72 degrees.
David, changes in OHT could also affect the amount and location of cloud cover and models predict it affects the amount of water vapor in the atmosphere. It is a complicated problem.
David Springer said:
“Reduced Arctic ice cools the planet.”
—–
Nonsense. The change in state of the ice in and of itself adds not one bit nor removes one bit of energy to the Earth system. There are both positive and negative feedbacks when ice is reduced, with the overall weight given to the positive, thus the term “Arctic amplification”.
steven | July 14, 2013 at 9:17 am |
Not aware? Wow. Did you bother to look?
http://journals.ametsoc.org/doi/abs/10.1175/JCLI-D-10-05029.1
I’ve seen that one. It says increasing OHT warms the planet.
Steven, OHT and mixing efficiency are related. Upwelling/downwelling increases with increasing OHT which changes the mixing efficiency. Unfortunately, since there are quite a few temperature/density layers there are quite a few time frames and surface impact ranges to consider. Increased poleward OHT would increase “surface” temperature initially, but since that increase would change the average temperature of the downwelling polar water it would increase the rate of downwelling flow into a more middle density layer, increasing the chance of cooler upwelling. Kind of like now, 0-2000 meters appears to show more warming than 0-100 meters, because there is less downwelling going into the 2000-4000 meters, due to North Atlantic deep water formation temperature being a little warmer and a little stronger than South Atlantic deep water formation.
Makes for a marvelous puzzle.
The reason the GCM displays this non-linear behavior with OHT is because our climate has some exceedingly influential non-linear variables. The biggie is the fixed temperature where water changes phase from liquid to solid and vice versa. Here’s the deal. As I described all ice is not equal with regard to albedo. It’s less important with increasing latitude. So the extent and length of time that ice covers say 45N is much more influential than 75N. As the referenced article in Journal of Climate states when increasing OHT above present level instead of rising temperature we get falling temperature but when decreasing OHT below present level it also cools. That’s because decreasing OHT below present level is building up snow/ice cover at lower latitudes, over land where it’s easy to cover, and influential because there’s plenty of sunlight to reflect. Increasing above present level is melting mostly polar sea ice and melting of polar sea ice removes insulation from the ocean surface exposing it to the 3K cosmic background which sucks the heat out of the water like a mofo especially with wind and waves on the exposed surface doubling or trebling its effective radiating area.
Actually I’m a bit surprised the models get that right. I’m not surprised that you’re not familiar enough with the models to have known about that particular bit of non-linear behavior.
As always, write that down.
I believe steven is a dentist. So I tested my dentist, who is Swedish.
Who is Arrhenius? He’d never heard of him. Wrt climate discussion, I lost the dentist lottery.
Ocean Heat Transport and Water Vapor Greenhouse…
Dallas, I am sure increasing OHT affects the upwelling/downwelling situation but I am not at all sure you have the signs right. Increasing the temperature of the water and melting ice making it fresher would increase the boyancy gradient making downwelling more difficult. I admit I haven’t looked into this issue in any depth so a reference would be appreciated.
steven | July 14, 2013 at 9:35 am |
“I’ve seen that one. It says increasing OHT warms the planet.”
Maybe you should read it in addition to seeing it. (my emphasis to make your seeing less challenging)
Furthermore, whoever you are, the vaunted climate models got both the rate of global warming wrong (overestimated) and the rate of Arctic ice melt wrong (underestimated).
An objective person might welcome a coherent explanation for those errors such as the explanation I’ve just provided.
Steven, ” Increasing the temperature of the water and melting ice making it fresher would increase the boyancy gradient making downwelling more difficult. I admit I haven’t looked into this issue in any depth so a reference would be appreciated.”
Toggweiler et al has one paper where they deal with the fresh water impact being overly estimated, I just can’t remember which one at the moment. This is good though, http://sam.ucsd.edu/sio219/toggweiler_bjornsson.pdf
While it deals mainly with the Drake Passage surface winds would play the same role in the NH mixing fresh surface water with more saline sub surface water. The ADWF depends on surface mixing and base salinity. The north Atlantic is more saline since more precipitation falls on the Eurasian land mass. With higher salinity, the density of the ADWF can have a higher temperature.
David, yes I saw that. It is making the argument that the warming contributed by OHT is close to the maximum value. I believe there was even a post on this paper on Climate Ect. If not there was a similar one. They still state that previous OHT would have caused warming and we are discussing previous OHT.
Sorry David, I missed the rant at the end of your comment. I consider climate models of no value other than to formulate questions to be answered with observations. Hope that clears up the issue.
JCH, thanks for the quotes. Can you tell me where you located them? I’m interested in reading the discussion. Also, I’m sure your dentist has more constructive hobbies and you just have to figure out what they are to know what to ask :)
Planetary Energy Balance, 2005
Maybe you could take that over to Held’s blog for a revisit. Perhaps get him OT.
Thanks JCH. I’m suprised it was from so long ago.
steven | July 14, 2013 at 10:38 am |
“David, yes I saw that. It is making the argument that the warming contributed by OHT is close to the maximum value.”
It’s not really an argument it’s the result of GCM number crunching. It’s probably right. Greenhouse warming is largely a consequence of OHT not AHT. The ocean is the dog the atmosphere its tail.
“I believe there was even a post on this paper on Climate Ect. If not there was a similar one. They still state that previous OHT would have caused warming and we are discussing previous OHT.”
I thought we were discussing the future not the past. Past warming is water under the bridge. My point remains. An increase in OHT today should result in cooling as northern sea ice is lost allowing more efficient cooling. So far that relationship is supported by observation as reduction in Arctic sea ice has been accompanied in lockstep by the now infamous pause. I don’t know about you but I let facts interfere with my beliefs.
David, there are no models that show a net cooling from increased OHT from the present values. If you wish to discuss the future you still get a net warming according to the models. My own personal interest is that there be a good attribution of past warming in order to narrow the climate sensitivity for the modern age down.
You have your hypotheses and I have mine. I suspect the lack of warming is because there currently is no trend in OHT. I noticed after responding you were no longer refering to the models so my response is moot.
steven | July 14, 2013 at 7:50 pm |
“David, there are no models that show a net cooling from increased OHT from the present values.”
Yes, there are. I went so far as to highlight the sentence confirming it in the quoted the abstract a few comments above. The author thought it was a flaw in the model which produced an “unrealistic amount of equatorial cooling” but that doesn’t negate the fact that the model did indeed show net global cooling when OHT is cranked up enough.
I can spoonfeed this stuff to you steven if you’d just stop making faces and spitting it out.
David, you are right that model can cause cooling with enough prescribed OHT increase and you did point it out. They also point out that it is unrealistic to expect the tropics to tranfer heat to the, by then, warmer subtropics. Don’t forget that the OHT in this study is forced and can occur no matter how unphysical the situation gets. Hardly supportive of increases in OHT causing cooling, however.
Hi David,
I appears that you did not read the article carefully as I say:
“However, unforced variability can also change the total amount of energy in the earth system by changing constituents of the surface or atmosphere that interact with the amount of solar energy coming in, or the amount of infrared energy leaving the earth (Herweijer et al., 2005). For example, if some internally generated change in an ocean circulation caused more heat to be distributed to polar latitudes; this could cause sea ice to melt. This melting sea ice would cause less solar energy to be reflected back to space (ice is much more reflective than open ocean) and thus this would increase the total amount of energy in the climate system.”
http://earthobservatory.nasa.gov/Features/SeaIce/
What do you suppose happens, Patrick, when heat can no longer escape from the ocean due to polar ice cover?
I hope that’s a rhetorical question. When the heat picked up in the tropics and transported to the pole by the oceanic converyor belt cannot escape to the atmosphere because of insulating ice cover the polar atmosphere gets colder and the ocean basin temperature rises.
Moving along, as the ocean basin temperature rises it causes the ice to melt from below, reducing the insulation, and allowing the ocean to lose heat. Polar air temperature then rises and ocean basin temperature falls. This is a classic negative feedback. It’s how mechanical thermostats in automotive water cooling systems work.
As I said earlier albedo change becomes less a factor with increasing latitude for two reasons: 1) there is less solar energy to reflect as latitude increases and 2) the albedo of the ocean increases as the angle of incidence increases. Inside the polar circle albedo plays almost no role. However, inside the polar circle is where the ocean can give up heat the fastest because the air is very cold and very dry. But it can only give up heat quickly if it is not effectively isolated from the atmosphere by a thick covering of sea ice. You Patrick are cognizant of a small positive feedback due to albedo change and incognizant of a larger negative feedback due to insulation change.
The dogma is strong in you Patrick. The whole CAGW narrative is based upon recognizing positive feedbacks and ignoring the negatives that come along with them. Clouds are the classic example. If clouds have a net negative feedback, which they almost certainly do, then the water vapor amplification myth goes up in smoke, and the naked modtrans CO2 sensitivity of 1.1C per doubling is all we get and that’s not enough to cause alarm.
David, YES, the temperature has varied in the same bounds for ten thousand years. It is still in the same bounds. This flat temperature that the Climate models show without CO2 is a total fabrication. Temperature naturally goes up and down and repeats the up and the down. Temperature does not stay at one value. It cannot.
Increasing the temperature of the water and melting polar sea ice increases snowfall and clouds and leads to increase in Albedo. Earth will not get too hot because it will snow much too much.
Decreasing the temperature of the water and the freezing of polar sea water decreases snowfall and clouds the sun will decrease the Albedo and warm the Earth and keep it from getting too cold.
Herman
You said;
“David, YES, the temperature has varied in the same bounds for ten thousand years. It is still in the same bounds. This flat temperature that the Climate models show without CO2 is a total fabrication. Temperature naturally goes up and down and repeats the up and the down. ”
I would like to endorse your comment. This flat temperature is an artefact of the paleo climate reconstructions which are a different thing to real world annual and decadal variability. You can see this clearly in my graph here showing the Hockey stick, CET and glacier movements;
http://wattsupwiththat.files.wordpress.com/2013/08/clip_image010.jpg
tonyb
“As mentioned previously, the fundamental physics of the greenhouse effect are beyond any reasonable doubt”
This statement is way too strong, and therefore shows bias.
Without doubting the basic greenhouse effect, there is a lot of doubt as to it’s magnitude, and it’s feedback effects.
The total effect of the greenhouse “effect” on the climate might prove, in the end, to be small, and even negligible in magnitude (and it might also prove to be big). That is what the whole debate is about.
There is nothing “beyond reasonable doubt”.
So, Willis’ critique is correct. This posts assumes what needs to be proven.
I concur with too strong. It was one of many red flags that popped up as I was reading the article.
“As mentioned previously, the fundamental physics of the greenhouse effect are beyond any reasonable doubt”
Yes, IR does most of the cooling of the Earth. That is true beyond any reasonable doubt. It does not have a set point and cannot explain the extremely well bounded temperature of the past ten thousand years.
The Polar Sea Ice Cycles have a set point and turn snowfall on and off to adjust the Albedo for fine temperature control.
Look at historic temperatures for the time period we have had Ice Core Records, up to modern instrumented records. The Temperature became more tightly bounded and the Polar Ice Cycles Evolved and then Mutated during Younger Dryas.
It’s really a leash like this one with a non-linear chaotic finger on the button. The moving dog marks; and, having marked, moves on.
http://www.amazon.com/Flexi-Explore-Retractable-Supports-110-Pound/dp/B005NK5DEU/ref=zg_bs_2975343011_1
I appeal for a new ‘dog standard’.
========================
You want to teach them how to work off leash by just using hand signals.
We have descended into doggerel. Much like AGW. Walk I say, walk on, warmer ever warmer, they will not.
My daughter is a certified professional dog trainer. Agility training mostly which is all hand signals off leash. I got her started. We have six dogs at the moment. The newest addition is from a breeder in Fort Worth, a short-hair border collie pup whose bitch and sire compete in national agility competitions. Don’t get me started on dogs I could go on forever and then some! :-)
Sorry, proper name for a mother-dog is dam not bitch. All dams are bitches but not all bitches are dams. Note to self: Write that down!
Give her an old FM 20-20, to add to the library.
DS
I have a beautiful long hair border collie. He understands
the Gaelic:
“Se thu fhein a tha tapaidh” It is yerself that is smart.
Bts
Beth
Bad luck on the Test Match (Naw…I don’t really mean that at all)
tonyb
Probably already read it. Certification requires a two-year apprenticeship with hundreds of hours in hands-on care & training plus another couple hundred classroom hours followed by what might aptly be described as the bar exam for dog trainers. She’d completed the basic requirements before graduating high school but couldn’t sit for the exam (bi-annually administered) without a HS diploma. The apprenticeship is pretty much a full time job for two years so few if any high school students can do it. I home schooled my kids after 8th grade and was able to compress grades 9-12 into two years instead of four which frees up a couple years for something else. One child obtained computer network certifications and had a thriving computer business before age 18, another completed two-years of junior college before age 18, and the third became the youngest CPDT in the United States. Pretty cool. High schools are a huge waste of time. Probably elementary schools too but I couldn’t figure out how to teach the social skills you need to get along in institutions filled with intellectual inferiors which generally includes faculty as well as students in public schools. So I reluctantly believe elementary school is critical in teaching gifted kids how to deal with morons.
@beth
Border Collies rule at the national level in agility competitions. His name is Chuck. Chuck Norris Springer. Born to kick ass and take names.
Tony,
Yes yer do. Anyway I’m not inter cricket, been following Le Tour,
better scenery.
Beth
Smart daughter and smart dog, David.
My border collie is Lockie, Locksmith when we’re bein’ formal.
Beth
David,
Best line in the entire thread
“but I couldn’t figure out how to teach the social skills you need to get along in institutions filled with intellectual inferiors”
No surprise there, but still funny as hell.
Yes, the dog can move in chaotic fashion, inside the bounds of the leash, but it cannot go outside the bounds of the leash. Temperature has more restrictions. It can only go down when it is up and it can only go up when it is down. It travels back and forth across the Set Point with a lot of jiggles along the way.
taxing water ….. Don’t give them any ideas.
The “man walking the dog” image caught my eye. This metaphor is used to explain the econometric work for which Granger and Engle got a Nobel Prize. The idea is that statistical analysis of time-series data more often than not displays spurious regression. Co-integration analysis is an approach that aims to reveal spurious correlation by examining the variables to test for “Granger causality”. [Correlation of the wiggles instead of the trend.] Since there can be a “long leash” as explained in this article, auto-correlation must be accounted for, usually by lagging some variables.
Further information here:
http://www-stat.wharton.upenn.edu/~steele/Courses/434/434Context/Co-integration/Murray93DrunkAndDog.pdf
Granger causality and climate
An Israeli group carried out a Granger causality analysis of the inputs (GHG, temperature and solar irradiance data) and global temperature and concluded,
“We have shown that anthropogenic forcings do not polynomially cointegrate with global temperature and solar irradiance. Therefore, data for 1880–2007 do not support the anthropogenic interpretation of global warming during this period.”
Reference: Beenstock, Reingewertz, and Paldor, Polynomial cointegration tests of anthropogenic impact on global warming, Earth Syst. Dynam. Discuss., 3, 561–596, 2012. URL: http://www.earth-syst-dynam-discuss.net/3/561/2012/esdd-3-561-2012.html
The model used by Beenstock, Reingewertz, and Paldor took account of the long leash discussed in this blog.
Whohoo! And yet we go on.
Judith, a nice guest post. Even this mild exposition obviously appears to have offended the world views of some of the more extreme sceptics, as is evident from the above.
I would offer only two mild critiques. First, the net radiative forcing is not incoming minus reflected energy. It is received energy (incoming TOA minus reflected by albedo) minus reradiated energy). It is generally net received short wave minus net reradiated long wave. And the greenhouse effect of carbon dioxide works because it is more ‘opaque’ to long wave than shortwave. In my view, exact veracitude should not be sacrificed to simplicity–it opens up unnecessary avenues to counter argument.
Second, and more important, is the statement that ‘how much’ depends on climate sensitivity. This is the core if the uncertain science, because of provable but uncertain ( with respect to quantity, and in the case of clouds, even sign)feedbacks. Whether the green trend or the blue trend in the last graphic is correct matters greatly for mitigation or adaptation. It is not presently possible so say which is more correct because of the ‘dogs leash’. But it is possible to say which is likely to be more correct by going back and analyzing the fundamentals of these feedbacks. And that is precisely where AR4 and AR5 SOD have been most irresponsibly selection biased, even downright willfully ‘ignorant’ of contradictory observational science.
Mitigation or adaption depends on the sign of the economic impact from global warming which is really regional warming with the most warming happening in the higher latitudes at night and in the winter which is precisely when and where more warming is welcomed. Even IPCC admits that global warming is likely to be a net benefit until at least mid-century.
I don’t like to wish bad things on people but I’m tempted to wish for a few NH winters such as those that froze the Thames solid to remind people that warmer winters are a good thing for most people who live in temperate climate zones.
Hi Patrick,
Good job. I really appreciate you putting your analogy in front of a tough audience and hanging in with us and taking the hits. I also have minor quibbles with they way you constructed it. But I understand the broad thrust of where you are going and it is almost unarguable. The skeptic case has always been “we really do not know the error bars on natural variability” and you have summarized the skeptic and alarmist cases with an understandable analogy.
Now, if you take this analogy to a more alarmist oriented site and get their comments, then if you take this as a first draft AND you have more time to devote to this exercise, then I think you will have something that could get published in the mainstream press.
I know that inserting all of the caveats the commenters want will detract from the flow of the story, so maybe you can figure out a way to mark them and stick them at the bottom or on a extended post on a blog somewhere (as Chris suggests).
Irrespective of what you end up doing with this, thanks for stopping by Judy’s place.
Robert
Hi Chris,
Good to see your stopping by. I’ve read and appreciated much of what you have written. I am always surprised when a scientist says that the recent warming has been unprecedented with the certainty as if the GHCN had been in place throughout the Quaternary. Well it has not and we simply cannot make that statement. As a scientist, you should understand that at the instinctive gut level, Hansen’s pronouncements notwithstanding.
Offered without comment.
The leash analogy is interesting in light of the history of the climate change debate. Look at what Dr Mann’s principal component analysis did. It removed much of the variability from the paleo record and then tacked on instrumental measurements and use these to judge the accuracy of paleo records in the last 150 years. In other words Dr. Mann put the climate on a short leash. Patrick Brown is arguing that the leash may be longer which can also be expressed more simply that there is more natural variation in the system. But if you have a 100 ft. Leash in a 75 foot pen, the dog is going to go where it wants. In other words the forced part of the climate is within the natural variability of the system.
Interesting post and discussion. Of course, one does recall the “CO2 as Control Knob” metaphor of some years ago.
Perhaps this dog and leash metaphor can be improved. If the climate can be thought of as a dog on a leash, the “The Man” should the The Sun, and then CO2 can be a flea on the coat of the dog (going along for the ride.)
As Patrick himself says, the leash analogy is a description of a signal-with-noise situation. In electronics we usually know what the signal should be. In climate we don’t know. So the only question left is: what is the frequency of the signal? What noise we should remove? For example, shall we remove everything with a period of 8 years or shorter? (Similar to, but not the same, as taking an 8-year average).
Is a AGW (if any) a signal or noise? I don’t see how the “leash” approach could help answering this question. Maybe on geological time scales, but then the data becomes extravagantly uncertain.
There are a few excellent comments here, but on the whole I think we should all abandon climate science and become dog trainers. This reminds me of the arguments about how many angels can dance on the head of a pin. This dog don’t hunt. There will be no progress on climate change theory until we all go back to some basic point where we can all agree and build agreement from there. Imposing consensus from the desired political ends won’t work. “My speculation is better than yours!”
Diag | July 14, 2013 at 3:11 pm | says:
“There will be no progress on climate change theory until we all go back to some basic point where we can all agree and build agreement from there.”
I say that there will be no progress until those responsible for creating the false warming in the eighties and nineties are uprooted and punished.
The leash is around 0.2 deg C long and the dog is also around 0.2 deg long, but the dog is moving in a certain direction only for a couple of years so it’s length doesn’t matter in the long run.
http://virakkraft.com/Temp-future.png
Patrick Brown has now seen the 3%, which is not really 3% but 30 different 0.1% views. While we can be tempted to be dismissive of these views, they do hold sway with some influential people in the US Congress, so we can’t just ignore them. The debate at the climate-politics interface is a completely different animal from the pure science debates within the climate science community, which is where Patrick Brown comes from. We saw a previous post by Lovejoy attacked for its certainty in a similar way, even though that certainty is what you would find within climate science, and does express the uncertain areas where research is still needed. This blog is an eye-opener to those pure scientists unfamiliar with the climate/politics debate.
Jim D, can you state what the 97% position is with precision and provide a reference? I suspect most of the views he has seen fall within that 97% so you can’t actually say that he saw views from the 3%.
Andrew Neil has it. 35% of the papers are misattributed. Send to know for whom the bell tols.
============
Patrick
For the HadCRUT4, here is the pattern
http://orssengo.com/GlobalWarming/GMSTpredictionUntil2030.png
The path of the man:
-0.302032+0.0037848*(year-1910)+0.0000299514*(year-1910)2-0.117281*Cos[2p(year-1910)/64]
The path of the dog=> +/- 0.18 deg C (Two-sigma confidence interval)
With a confidence level of 95%.
The length of the dog leash is known. It is +/- 0.18 deg C as shown in the above diagram.
The path of the man:
-0.302032 + 0.0037848*(year-1910) + 0.0000299514*(year-1910)^2-0.117281*Cos[2*PI*(year-1910)/64]
I have asked Dr. R.J. Brown from Duke University for a comment, he has kindly replied here:
http://wattsupwiththat.com/2013/07/11/the-solar-cycle-is-still-slumping/#comment-1364072
I think it is well worth of your attention.
Second.
======
If there is one person who could get me to take another physics course, it is Dr Brown.
Vuk, thanks very much for contacting rgbatduke. As usual, Dr. Robert Brown is crystal clear, and his logic is undeniable. To repeat, the link is here, it’s well worth reading even if you disagree with him.
Regards,
w.
Hi Willis
I have once or twice (possibly wrongly) disagreed with Dr. Brown on a minor matter of the oceanic tidal mixing, nevertheless his analysis is always impeccable.
For my own ‘RGB’s back to reality’ reference I record all of his articles.
Patrick Brown,
I agree with Judith this is a great analogy for unforced variability, I think it clearly communicates how the process is explained and used in wider climate science discussion.
Here’s my problem. It’s just a residual. You know forced variability (the man’s path), remove this from the dog’s path and you are left with unforced variability. As it stands it explains nothing. It just gives you another fudge factor for keeping the theory in place when it appears to be challenged by the data (‘the pause’).
Undoubtedly unforced variability exists and is important. But if is going to be included for attribution then it needs to be measured independently not simply a residual. In the way it is used in your analogy Patrick I think unforced variability explains nothing other than as an acknowledgement that it exists, a step forward at least.
A side question Patrick. Let’s forget the pause for the moment what percentage of the warming of the 1980’s and 1990’s was due to unforced variability?
“Undoubtedly unforced variability exists and is important. But if is going to be included for attribution then it needs to be measured independently not simply a residual.”
All observed or reconstructed climate variability of the past contains both forced and unforced components. Therefore it is difficult to imagine a way to estimate unforced variability from observations without treating it as a residual.
One way to independently estimate the magnitude of unforced variability is to construct a Global Climate Model and let the unforced variability emerge from underlying physics/parameterizations. This is currently the strategy that seems to be used most often.
“A side question Patrick. Let’s forget the pause for the moment what percentage of the warming of the 1980′s and 1990′s was due to unforced variability?”
Great question. I don’t know but If we knew the length of the leash that would go a long way to helping us answer that question.
This whole thread is climate terrierism.
You win the blue ribbon!
Patrick whilst your analogy is apt for conceptualisation of annual variations I am not not sure why we continue to flog the dead horse of time series. For a start the physics of the greenhouse effect is supposed to relate to GHG concentration equivalents and not time.
If we have known the climate sensitivity for 150 years would it not be appropriate to put it to the test by now? That is what science is supposed to do.
The last 140 years and also the last 70 years both show that the climate sensitivity is about half the Hansen et al (1988) sensitivity based on the stated CO2 changes.
This would seem to clearly refute the basic hypothesis without really caring too much about annual variations. I’ll take Feynman’s view of a failed hypothesis in science anytime over dog leashes, cute as they may be.
When you leave out a crucial part of the physics, it doesn’t matter how well your part of the physics is understood. You start from the assumption that radiative physics describes the fundamental aspect of energy transfer in the atmosphere and ignore everything that has been learned about atmospheric dynamics (and what is still not fully understood). Putting radiative physics into GCMs does not get around this problem as GCMs do not well represent the actual vertical convective energy transfers in the atmosphere.
In your dog analogy, this is about like assuming that the man is walking his dog to the neighborhood park because he turned right after leaving his house, only to find out that he was headed to the pet store for dog shampoo instead. If you hypothesize a long enough leash, you can’t tell the difference!
Are we really so confident that the primary external forcing agent is nice and stable at all time scales? If UV or magnetic field variation actually does matter, then we need to imagine passers-by grabbing the leash and impeding the progress of our erstwhile dog-walker.
Interesting article. I think it is still missing a central point — that the climate is not, in fact, at all likely to be linear. That means that in addition to short leash and long leash fluctuations around a presumptive linear trend slaved to CO_2, there are at least two additional possibilities. One is that the dog is leading the dog walker — CO_2 may be trying to pull the temperature up but negative feedback from clouds and massive non-Markovian effects may overwhelm this and make it the small (but systematic, sure) perturbation. The natural variability of the climate might be a metaphorical Newfoundland pulling around a small child of CO_2 forcing, as opposed to the picture of CO_2 as a Sumo wrestler pulling around a Chihuahua (whatever the length of the leash).
Indeed, in this view the “long leash” merely means that for a while it may LOOK like the small child is in control as it gets to walk for a bit unpulled by the dog. But the instant the dog sees an interesting bush, or another dog — is the small child going to stop the dog from going where the dog wants?
The second possibility is wrapped up in the fact that the climate is really a dog on MANY leashes (if we must stick to the metaphor). CO_2 may be pulling it one way, but the poor mutt is also pulled by lots of other leashes, some long, some quite short. Perhaps we don’t really know all of the leashes that are important. That’s not that unlikely — as this article rather refreshingly acknowledges, we don’t really know even the LENGTH of the natural variability leashes, let alone just how powerful and weighty the being on the other end of them. We don’t really know if the dog is a Chihuahua or a Newfie or a Kodiak bear cub that is about to grow up and drag the entire planet wherever it wants. One big question that the top article clearly relates to is: Is solar state relevant? There is some reason to think that it might be, and that the magnitude of the natural variability associated with it might indeed be very large. There is also ample historical evidence that the real, observed range of natural variability is more than large enough to explain 100% of the observed warming if the proxy reconstructions of Holocene temperatures have any validity (they may, they may not — lots of disagreement, and a very hard problem) or if the ice core and other reconstructions of the Pliestocene are correct. Indeed, those reconstructions strongly suggest that if we did manage to stabilize the Earth’s temperatures back in pre-Pliestocene warm phase, it might be the luckiest catastrophe to ever befall us, because no warming scenario can compete with the nightmare of a rapid descent into an ice age, and the LIA (coldest temperatures in some 10,000 years) was evidence enough that the Earth is rather precariously balanced over a 6-10 C pit of extreme glaciation that will accompany the end of the current interglacial in this ice age that we live in.
All of human civilization has arisen in the Holocene. Not just in the Holocene, in the last half of the Holocene. Civilization itself has never had to withstand glaciation.
I am not, of course, suggesting (as some do, rather often on this site) that we are certain to descend now into a LIA and possibly end the Holocene if we have another prolong Maunder type minimum. As I said, if solar state is an important and incorrectly computed driver, it is possible, but it is far from proven and belief so far is based on numerology more than on stuff that can be measured and that is physically plausible. It is not ruled out — how can it be, as the only thing that will rule it out is it not happening in the future. At the moment we are just guessing, with more or less educated guesses.
The one good thing about the reposted article is that it indicates that a fair amount of energy is being expended on explaining why the climate is not apparently warming as predicted by the GCMs. If Brown’s article has a flaw, it is that he doesn’t go into the internal mechanics of the GCMs whose “physics” he blithely accepts and apply hypothesis testing to them, one at a time, he apparently accepts the concept of an average over many GCMs (and ability of one GCM in particular to be “tuned” to produce a good fit to at least some of the past climate) as predictions of the underlying trend, the “master” leading the climate dog by the leash of unknown proportions. This, as I’ve noted many times now, is a basic error. The length of the “leash” in a GCM is not an unknown quantity — it is inferred from the spread in model predictions when one does a Monte Carlo spread around its parameters and initial conditions. When the actual climate goes outside of the range of 99% of the runs in a given SINGLE GCM, that isn’t evidence of a long leash, it is fairly convincing evidence that that GCM is wrong, that its physics and computation are not valid representations of the actual climate.
One GCM at a time. One gains absolutely zero additional confidence by averaging over many GCMs that fail this simple test, one at a time, that somehow collectively they don’t fail where individually they do. One cannot solve this problem by simply lengthening the leash, so to speak — one has to go back to basics and rewrite the entire computation and adjust the parameters so that they describe and explain the lack of climate warming. Otherwise, how can one have any confidence in their future predictions? Perhaps the “leash” is hundreds of years long (full ocean turnover times), so that one will never see the linear signal of CO_2 warming before everything has changed beyond our ability to predict anyway. Or, as he notes, perhaps the very simplest of heuristics is sufficient, and the future climate will, as he suggests, fluctuate around the linearized CO_2 driven line with a “leash” of only a decade or two. Or four. Or eight.
D’ya see where our ignorance comes in here? What is it? A decade? A century? We have no friggin’ idea. The climate clearly varies by degrees centigrade over centuries, and worse, it doesn’t do so anything like consistently — the northern hemisphere can be warming while the southern hemisphere is cooling, for example. We don’t know why. We cannot explain the past. We cannot explain the present. How, then, can we accurately predict the future?
Above comment courtesy of:
Physics Professor Robert G. Brown @ Duke University
Read it again, read it again, louder, louder.
=====================
When physical comprehension gets tethered to unproven theoretical assumptions, one gets the sort of misleading narrative that the student author presents here. There is no persuasive empirical evidence unequivocally indicating that observed changes in CO2 concentration are causing the surface temperature variations of the last several decades. On the contrary, those variations either lead the nearly monotonically rising CO2 signal or are incoherent with it. There is much empirical evidence in radiosonde data that these concentration increases have not altered the effective optical depth of the atmosphere during the last 60 years. Nor should anything else be expected from a Lyapunov stable planetary system whose radiant emissions increase with increasing surface temperatures. The ”leash” explanation of climatic observables may impress uncritical minds, but scientifically it is nothing more than a prop for a dog and pony show.
Patrick Brown says: “During La-Niña years, heat is buried in the deep Pacific Ocean more readily and thus the global mean temperature at the earth’s surface is a bit lower than it would be otherwise. During El-Niño years, this buried heat is released back to the surface and the global mean temperature tends to be a little warmer than it would be otherwise. In this situation, global mean temperature at the earth’s surface is changing because energy is being moved around the climate system (into and out of the deep ocean) not because there is a net change in the total amount of energy in the system.“
The first two sentences above: Yes, that’s how ENSO works in principle. The last sentence: Yes … and NO!
From Trenberth et al. 2002: “The negative feedback between SST and surface fluxes can be interpreted as showing the importance of the discharge of heat during El Niño events and of the recharge of heat during La Niña events. Relatively clear skies in the central and eastern tropical Pacific allow solar radiation to enter the ocean, apparently offsetting the below normal SSTs, but the heat is carried away by Ekman drift, ocean currents, and adjustments through ocean Rossby and Kelvin waves, and the heat is stored in the western Pacific tropics. This is not simply a rearrangement of the ocean heat, but also a restoration of heat in the ocean. Similarly, during El Niño the loss of heat into the atmosphere, especially through evaporation, is a discharge of the heat content, and both contribute to the life cycle of ENSO.”
http://www.cgd.ucar.edu/cas/papers/2000JD000298.pdf
ENSO is the main process with which the Earth system can vary its total energy content over time. It is very simple: In times when La Niña stores more solar energy than what El Niño manages to release back out, you get an increase in total energy content -> global warming. And the other way around. This is not by necessity a symmetrical process. There is no law stating that the recharge and discharge phases of ENSO always must and do equal each other. There definitely seems to be a multidecadal cyclicity to it.
Perhaps multicentennial if not to say millenial.
=============
“In times when La Niña stores more solar energy than what El Niño manages to release back out”
That would be during times of more strong Ninas than Ninos, right? Like 1945 to 1977, the period of global wa… ehm..
Your are right it’s simple but it’s the opposite of your explanation. The tropical surface receives more solar energy when ENSO is positive.
http://virakkraft.com/Tropics-SW-Temp.png
In El Nino, what is the actual amount of OHC ending up in the atmospheric component of the surface air temperature instead of being retained in ocean storage component? My hunch, a small number.
As always, your understanding of the ENSO phenomenon is profound, lgl.
You’ve got quite a peculiar little theory going here. So in your world, the ocean stores energy during El Niños and releases it (loses energy) during La Niñas. You should inform the scientific community (maybe Trenberth directly) about your discovery. That they’ve got it all turned on its head. In reality, positive ENSO is the recharge phase while negative is the discharge phase. Funny …
I’ve shown you this figure before, lgl:
http://i1172.photobucket.com/albums/r565/Keyell/Pacificair-seaflux_zpsf8421585.png
You never responded. But here you are again … Total net air/sea flux BTW is solar radiation (SW) (positive) + thermal radiation (negative) + sensible heat (conduction/convection) (negative) + latent heat (evaporation) (negative). Add them all together and you’ll see if the ocean gains or loses energy. Looks like Trenberth was right after all …
“That would be during times of more strong Ninas than Ninos, right? Like 1945 to 1977, the period of global wa… ehm..”
No, it would be during those times when La Niñas store more solar energy than what El Ninos manage to release back out. Like I just said. The last period this happened is the one starting around ~1970.
Kristian – Your right, ENSO has a TOA net energy balance component. I am actually working on a paper at the moment that deals with this. I definitely oversimplified in that regard in the original post.
Kristian
More precisely rising and high ENSO is the recharge phase, falling and low the discharge phase. The +/-0.5 deg limits are man made and meaningless. The real change happens when ENSO switches from rising to falling and vice versa.
My graphs were made from the NOAA reanalysis data here, http://nomad3.ncep.noaa.gov/cgi-bin/pdisp_mf_r2.sh?ctlfile=flx.ctl&varlist=on&new_window=on&ptype=ts&dir=
It is of course your choice to trust it or not but remember it’s global tropics, not just equatorial pacific.
“More precisely rising and high ENSO is the recharge phase, falling and low the discharge phase.”
No, it’s the exact opposite. Everybody understands and agrees that El Niño is the phase when ocean heat is released into the atmosphere, thus warming it, and that La Niña is the phase when the ocean heat is restored again, thus cooling the atmosphere/surface. Did you read the Trenberth quote? That is what we see happening. In the tropical Pacific. The primary (oceanically connected) ENSO region. It is not some hypothesis. We see it happening. We observe it.
So why you keep insisting on this strange claim that the world operates upside down from observed reality is beyond me …
We observe La Nina mixing down the heat generated by the preceding positive ENSO.
lgl said:
“We observe La Nina mixing down the heat generated by the preceding positive ENSO.”
___
Oh, do please share the data and research that shows this.
Kristians generally it right and it seems your view of ocean to atmosphere heat flux timing is quite out of phase by 180 degrees.
R. Gates, “Kristians generally it right”
Generally right? Ocean heat transport and mixing efficiency make the atmospheric radiant effects look like tinker toys. It’s a water world. You start with the water.
It’s a water world. You start with the water
In water world where redistribution of mass is big (30 mk^2 in enso) you have a complex mechanical system transferring energy between the kinetic and potential reservoirs.
Being a dissipative dynamical structure it tends to minimize energy transfers as the system modelocks gravity being a constraint.
Maks, Mode-locked or phase-locked on multiple levels with solar having a larger impact on the strongest level. MODTRAN doesn’t even include the fun parts and the models treat the oceans like slabs.
R. Gates
La Nina > stronger trades > more mixing
La Nina > more upwelling in the eastern Pacific > more downwelling somewhere else > more mixing
Stronger La Ninas after 2000 ended the warming of the surface but OHC down to 2000 meters increased. http://www.nodc.noaa.gov/OC5/3M_HEAT_CONTENT/
“La Nina > stronger trades > more mixing
La Nina > more upwelling in the eastern Pacific > more downwelling somewhere else > more mixing”
How is mixing increasing the OHC, lgl? The OHC goes up during La Niñas, down during El Niños. Is this because of more or less mixing?
What happens is this (which is really quite self-evident and self-explanatory):
La Niña > stronger trades > cloud cover pushed further west > more solar enters the ocean > heated water transported to West Pacific Warm Pool (by the trades) and stored at depth there, neatly tucked away from the surface.
El Niño > weaker/reversed trades > cloud cover slides/spreads east > less solar enters the ocean > warm water stored at depth in the WPWP slides east as a result of reduced thermocline, to be spread out at shallow depths across the east tropical Pacific > the ‘hidden’ warm waters are brought back up to the surface to release the previously contained energy into the atmosphere.
It appears to everyone here, lgl, that in your mind, this sequence should progress the opposite way. El Niño doesn’t heat the surface and the troposphere, extracting the energy from the ocean depths. La Niña doesn’t cool the surface and the troposphere, rather keeping the solar energy locked up in the ocean.
Please tell us this is not how you picture reality.
“The OHC goes up during La Niñas, down during El Niños.”
As a matter of fact, this is only consistently occurring during strong La Niñas and strong El Ninos, overwhelming the noise from ‘the rest of the world’. But the strong events are the instances when big things can and do happen to the Earth system.
The thing is, the global ocean is divided into two parts, one following the East Pacific (ENSO East, NINO3.4) and one following the West Pacific (ENSO West, WPWP). Pacific ocean processes swing like a pendulum from east to west. This means these two parts are normally inversely related (normally, except at specific instances). When the West Pacific part warms, the East Pacific part cools. And conversely, when the West Pacific part cools, the East Pacific part warms. It is basically a matter of who comes out on top.
The West Pacific (WPWP) part warms during La Niña and cools during El Niño. The East Pacific part cools during La Niña (like NINO3.4) and warms during El Niño. The West Pacific part pretty much includes the extended Indo-Pacific Warm Pool, centered around the Indonesian archipelago, and that’s that. The East Pacific part for all intents and purposes constitutes the rest of the global ocean, that is everything outside the extended Indo-Pacific Warm Pool. This part is either atmospherically teleconnected to the central/eastern tropical Pacific (NINO3.4) or controlled by the Northern and Southern Annular Modes (AO and AAO), deciding how much tropical heat is to be allowed to enter north and south into the extratropics.
This distinct dvision is what complicates the global picture. If you only look at the global OHC curve, it is easy to dismiss any notion of a strong ENSO influence. It looks minor at most. If however you split the ocean into the two proper subsets, its overwhelming impact becomes evident right away. Like I said, what determines whether global OHC is to go up or down at any one time is the relative strength of the opposing (and inversely related) subsets, West vs. East.
“The OHC goes up during La Niñas, down during El Niños”
No, OHC increased a lot before 2003 down to 700 meters, very little after. When were the strong Ninos / weak Ninas? Before or after 2003?
Actually Willis proved my “180 degrees out of phase” view months ago at WUWT.
http://virakkraft.com/SST-SSST.png (where I’ve added the hadcrut tropics)
The global 0-100 m temps correlate well with ENSO and the surface temps of the tropics, and hopefully you know the ocean is heated from the top so the 100-700 m is delayed, around 2 years after the surface judging by Willis graphs.
Time for you to accept the Globe is more than the Pacific.
… and there’s a question for you further down.
“No, OHC increased a lot before 2003 down to 700 meters, very little after. When were the strong Ninos / weak Ninas? Before or after 2003?”
You are utterly confused, lgl. And it appears there is nothing I or anyone from the scientific community, or observational data or common knowledge of the natural processes of the climate system can do or say to make you see. But try and read this:
http://klimaforskning.com/forum/index.php/topic,989.0.html
Like I said, you need to split the global ocean into two inversely related subsets to see how ENSO drives global OHC evolution (as it does the global SSTs and tropospheric temperatures).
But you think NINO3.4 SSTa is ENSO, so I guess it’s utterly futile to try and explain anything to you about this phenomenon and how it impacts global climate. Yes, the Earth is more than the Pacific. But the Pacific effectively rules the rest of the world. So it doesn’t really matter.
Climb out of your bubble, lgl!
Kristian, why don’t you just answer the question? Why is there more global warming during times of strong Ninos and weak Ninas, if Ninas cause warming?
And, how can there be a net loss of energy from the global ocean during El Ninos when the temperature of the upper 100 meters so clearly correlates with ENSO (plus a trend)?
Your “But you think NINO3.4 SSTa is ENSO” is hilarious. Who told me to use ONI, which is Nino3.4 SST, instead of ENSO MEI, which is Nino3.4 SST and five other variables? Don’t argree with yourself?
‘CERES data show that clouds have a net radiative warming influence during La Niña conditions and a net cooling influence during El Niño, but the magnitude of the anomalies varies greatly from one ENSO event to another.’
http://meteora.ucsd.edu/~jnorris/reprints/Loeb_et_al_ISSI_Surv_Geophys_2012.pdf
It is a lot more complex.
Yes, solar is a lot more complex. When looking at the tropics at large. And even more so globally. But in the central and eastern tropical Pacific, the ‘control room’ of the global climate system (simply because the amount of energy handled here dwarfs that of all other regions of our planet), the pattern is very clear: The solar input is high during La Niñas and neutral/normal conditions and low during El Ninos. Because the ENSO processes (trades) move the cloud cover/convection centre back and forth. We’re talking 15-25 Watts per square metre from the depth of La Niña to the peak of El Niño across an area the size of Eurasia, over months on end. This will have an impact!
http://i1172.photobucket.com/albums/r565/Keyell/ierai_ssr_170-280E_-20-20N_na_zpsa783a887.png
(From KNMI Climate Explorer, ERA Interim)
http://i1172.photobucket.com/albums/r565/Keyell/eqs7d3_zps20ebf0b7.png
(From Pavlakis et al. 2008)
Trenberth once again (I know lgl in his bubble universe won’t listen, but this is what we observe happening): “The negative feedback between SST and surface fluxes can be interpreted as showing the importance of the discharge of heat during El Niño events and of the recharge of heat during La Niña events. Relatively clear skies in the central and eastern tropical Pacific allow solar radiation to enter the ocean, apparently offsetting the below normal SSTs, but the heat is carried away by Ekman drift, ocean currents, and adjustments through ocean Rossby and Kelvin waves, and the heat is stored in the western Pacific tropics. This is not simply a rearrangement of the ocean heat, but also a restoration of heat in the ocean. Similarly, during El Niño the loss of heat into the atmosphere, especially through evaporation, is a discharge of the heat content, and both contribute to the life cycle of ENSO.”
There are a couple of processes starting with upwelling in the east and coupling of the ocean/atmosphere. The immense area of warm water in an El Nino warms the atmosphere increasing IR losses to space. The reverse happens in La Nina.
http://s1114.photobucket.com/user/Chief_Hydrologist/media/Loeb2011-Fig1.png.html?sort=3&o=51
The location where clouds are formed and where rain falls changes radically between ENSO events – and ENSO varies in frequency and intensity on decadal to millennial scales at least. Cloud cover is different in different places.
http://s1114.photobucket.com/user/Chief_Hydrologist/media/Loeb2011-LWCERES.png.html?sort=3&o=70
There is however more rainfall in La Nina overall. This usually means something for cloud.
http://s1114.photobucket.com/user/Chief_Hydrologist/media/SOI_GMSL_zps6063be55.png.html?sort=3&o=12
MODIS shows a bit of a trend in cloud this century.
http://s1114.photobucket.com/user/Chief_Hydrologist/media/CERES_MODIS-1.gif.html?sort=3&o=84
Enric Palle and Ben Laken have combined the records.
http://s1114.photobucket.com/user/Chief_Hydrologist/media/cloud_palleandlaken2013_zps3c92a9fc.png.html?sort=3&o=13
http://s1114.photobucket.com/user/Chief_Hydrologist/media/cloud_palleandlaken2013_zps3c92a9fc.png.html?sort=3&o=13
ENSO is driven by more or less upwelling in the Humboldt Current. There are obviously wind, current and cloud feedbacks. You are not wrong but we are still incomplete. There are links for instance with the Southern Annular Mode – more salt in this Law Dome ice core proxy = La Nina.
http://s1114.photobucket.com/user/Chief_Hydrologist/media/Vance2012-AntarticaLawDomeicecoresaltcontent.jpg.html?sort=3&o=68
Here’s an 11,000 year proxy showing the drying of the Sahel starting 5,000 year ago, the demise of the Minoan civilization 3,550 years ago and mega drought and mega floods not seen except in Hollywood.
http://s1114.photobucket.com/user/Chief_Hydrologist/media/ENSO11000.gif.html?sort=3&o=127
Chief Hydro said:
“The immense area of warm water in an El Nino warms the atmosphere increasing IR losses to space. The reverse happens in La Nina.”
—–
This, as you have said, is “baby physics”, but in the case of discussing general ocean to atmosphere to space energy flows on this planet during an El Niño is also the most important. What should also be recognized is that the continual increase in GH gases reduces the efficiency of this process because of the alteration of the thermal gradient between ocean and space, such that, over the longer-term, OHC will rise. Thus, it is not so much that GH increases are storing or adding heat to the ocean, but they are reducing the efficiency whereby the ocean to atmosphere to space energy transfer process occurs.
There is this persistent phrasing that El Nino warms the atmosphere, which to some degree appears to be true on a net basis, but it also physically changes the makeup of the ocean water included in the surface air temperature anomaly, and it would appear that it does that with preexisting heat.
I would not call it hidden heat as it is included the ARGO OHC measurement.
Does Eastern Pacific cooling net out with the cooling of the SST in the Western Pacific in an El Nino?
Near the outset of the hottest/near hottest year in the record, 2010:
end of 2009 El Nino
Near the outset of what is said to the be the 2nd strongest La Nina in the record, 2011:
end of 2010 La Nina.
‘CERES data show that clouds have a net radiative warming influence during La Niña conditions and a net cooling influence during El Niño, but the magnitude of the anomalies varies greatly from one ENSO event to another.’
http://meteora.ucsd.edu/~jnorris/reprints/Loeb_et_al_ISSI_Surv_Geophys_2012.pdf
The most important aspect is TOA radiant flux. So while we seem to get net planetary cooling from El Nino – the ocean heat content follows net flux.
http://s1114.photobucket.com/user/Chief_Hydrologist/media/Wong2006figure7.gif.html?sort=3&o=126
Net flux seems mostly other than greenhouse gases. Cooling in IR and warming in SW.
http://s1114.photobucket.com/user/Chief_Hydrologist/media/WongFig2-1.jpg.html?sort=3&o=46
The top-of-atmosphere (TOA) Earth radiation budget (ERB) is determined from the difference between how much energy is absorbed and emitted by the planet. Climate forcing results in an imbalance in the TOA radiation budget that has direct implications for global climate, but the large natural variability in the Earth’s radiation budget due to fluctuations in atmospheric and ocean dynamics complicates this picture.’
‘The global climate system is composed of a number of subsystems -atmosphere, biosphere, cryosphere, hydrosphere and lithosphere – each of which has distinct characteristic times, from days and weeks to centuries and millennia. Each subsystem, moreover, has its own internal variability, all other things being constant, over a fairly broad range of time scales. These ranges overlap between one subsystem and another. The interactions between the subsystems thus give rise to climate variability on all time scales.’ http://www.atmos.ucla.edu/tcd/PREPRINTS/Math_clim-Taipei-M_Ghil_vf.pdf
ENSO is part of the coupled Earth system – it can’t be understood as anything other than part of the continuum of variability. The only way to get a simple handle on the system is at TOA.
Kristian
Your graphs show total net decreased ~8W/m2 from the 90s with high ENSO to the 00s with lower ENSO, just like I said.
If La Ninas are storing heat leading to global warming then periods of strong Ninas and weak Ninos should give more warming than weak Ninas and strong Ninos. We are observing the opposite.
Your theory implies weak Ninas store more heat than strong ones, and weak Ninos release more heat than strong ones. That’s what I call funny.
What weak and strong La Niñas/El Niños are you talking about?
You could of course try to explain these two graphs without ENSO being the driver of global OHC evolution. Help yourself:
http://i1172.photobucket.com/albums/r565/Keyell/OHCglhotcold_zpscd8c7d78.png
Map here:
http://i1172.photobucket.com/albums/r565/Keyell/world-map-2_zpsd5298cf2.png
Also, you have heard of the Great Pacific Climate Shift, haven’t you? It occurred in the 70s and commenced with an abrupt (and unexplained) fall in the mean pressure gradient between east and west in the tropical Pacific (SOI):
http://i1172.photobucket.com/albums/r565/Keyell/SOI_zps4a244c80.png
The coupled oceanic-atmospheric conditions in the Pacific basin were fundamentally different before and after that shift. It basically started the modern era of global warming. Now that era has most likely ended. There is no trace of any CO2 warming signal during this period. It is all ENSO.
I am talking about the strong Ninas / weak Ninos 1945 to 1976, when the ocean should have warmed according to your theory, and the weak Ninas / strong Ninos 1977 to 1998 when the ocean should have cooled. The opposite happened.
“I am talking about the strong Ninas / weak Ninos 1945 to 1976 (…)”
That’s not what I asked you. Specifically what strong La Niñas overwhelming weak El Niños are you referring to during the early times? And likewise, where are those weak La Niñas from the last 40 years not pulling their weight? We only have OHC data going back to 1955. Between 1955 and 1970, where do you see the definite dominance of strong La Niñas over weak El Ninos that you don’t see in the period following, 1970-2013? 1970 is when global OHC started its increase …
http://i1172.photobucket.com/albums/r565/Keyell/ihadisst1_190-240E_5–5N_n_1955_2013a_zps26321680.png
Here’s from 1945:
http://i1172.photobucket.com/albums/r565/Keyell/ihadisst1_190-240E_5–5N_n_1945_2013a_zpsba86ee9d.png
Specifically what strong La Niñas – Who are you tying to fool? There was only one strong Nina between 1976-1998, the 88-89 Nina. The others were barely Ninas at all. There were no strong Ninos between 1950 and 1976, or maybe one in 73.
http://www.esrl.noaa.gov/psd/enso/mei/ts.gif
Why wasn’t the ocean warming enormously 1955 to 1976 with all those strong Ninas?
Well, it’s obvious that you’re trying to fool someone. I showed you the SSTa of the NINO3.4 region from 1945 to 2013. No comment whatsoever. Simply countering with an index which is derived/computed. MEI does not represent the observed SSTa conditions in the tropical East Pacific, which is what defines a La Niña. The determination of the strength or depth of a La Niña (or an El Niño) is not based on MEI, but on the SSTa of the NINO regions or ONI.
There are plenty more strong La Niñas after 1970 than before, lgl. Live with it.
http://i1172.photobucket.com/albums/r565/Keyell/ihadisst1_190-240E_5–5N_n_1945_2013a_zpsba86ee9d.png
Do you notice the conspicuous increase in ENSO amplitude starting around 1970-73? That’s when the recurring sequence of ENSO events and states of the modern era starts:
http://i1172.photobucket.com/albums/r565/Keyell/NINO34vsSSN-syklus5_zpsf4e195ec.png
(Green pillar marks the final switch from ‘warm’ to ‘cool’ phase in the Pacific basin.)
No strong La Niñas? You’re funny!
Hehe, it’s getting late. Sorry: “the final switch from ‘warm’ to ‘cool’ phase in the Pacific basin” should of course be “from ‘cool’ to ‘warm’ phase”.
“The determination of the strength or depth of a La Niña (or an El Niño) is not based on MEI, but on the SSTa of the NINO regions or ONI.”
So one variable describes the phenomenon better than six variables. Even after you pointed out the importance of the climate shift in the 70s, where a change in SLP is important, which is included in the MEI but not in the ONI. Strange but so be it, we can have a look at the ONI as well, http://ggweather.com/enso/oni.htm
Now why didn’t the lower ENSO (stronger Ninas) after 2000 produce more warming than the higher ENSO (weaker Ninas) in the 80s and 90s?
Monthy global mean surface temperature is still a meaningless number. The same as erroneously calculating average speed as the average of spot measurements of speed along a journey.
If there could be a proper estimation of “global temperature” there should be terms for global heat energy, global mass and global specific heat. Comparing over land air temperatures with under water sea temperatures is also nonsense.
Cherry picking data since 1975 is still intellectually dishonest, when we have longer termp temperature data.
Can someone please tell me the value of random numbers in GISS ModelE apart from to give an illusion of modelling?
Has anybody tried running a climate model without any “forcings”?
By the way, the leash of surface temperature starts with temperature excursions over daily heating/cooling cycles at any single point. If we computed “global monthly means” from a global set of daily data, how much random statistical variability would there be on a graph????
What is the value of a “global monthly mean” over a “global annual mean” in measureing climate when a “climate” is a 30 year mean to start with?
Girma
Unless I read that wrong, the “man” is progressing in a straight line, from an anomaly of -.03C in 1910 to one of +0.4C in 2100.
Is that right?
(How about the “dog”?)
Max
Girma
Typo: should be -0.3C in 1910.
For what it’s worth, here’s another way of showing cyclical behavior in the global temperature record:
https://sites.google.com/site/climateadj/multiscale-trend-analysis—hadcrut4
Based on this, I tentatively favor the long leash paradigm.
The missing hotspot is the topic at climate dialog. It has Christy,Mears and Sherwood as the experts. Should be an interesting one.
According to Richard Muller’s BEST project, the ‘hockey stick’ analogy, based on more than a billion earth weather station temperature measurements, clearly shows that there has been no slow down in global warming.
Walter Carlson | July 17, 2013 at 3:08 pm
Citation? From the data I find:
Trend since Jan 1, 2000, 159 months, trend = 0.16°C/ decade, NOT statistically significant (p = 0.12)
Trend prior to Dec 31, 1999, 159 months, trend = 0.22°C/ decade, statistically significant (p = 0.03)
(significance adjusted for autocorrelation)
Me, I call that a slowdown.
w.
I refer you to the book ‘Energy for Future Presidents’ by Richard Muller. To my thinking, because he used temperature measurements from more than 36,000 sites, even though more than 12,000 showed temps below average, the 24,000 sites that were above average clearly show a rising global temperature.
the short leash – long lease analogy ignores the reality of chaotic systems. what you are modelling in effect is a system with a single dominant attractor (man), and ignoring the possibility of even large attractors with different period of orbit (for example, lunar orbital cycles, bond cycles, ice age cycles)
in effect, the man is also on a leash, determined by the city planners and his schedule. And the city planners are also on a leash, as are the people that set the man’s schedule. and so on and so on, out to infinity.
I reckon the dog is not on the lead at all.
The importance of C02 as a climate driver has been grossly overcooked
Cycle analysis indicates solar and planetary forces will invoke global cooling in the decades to come
ask the skeptic AGW scientists..
crikey…and, what if you are wrong about CO2?? Could not humanity be at risk through inactivity?? Muller’s ‘hockey stick’ analogy really, IHMO, shows that failure to begin corrective measures may doom all humanity. That CO2 emissioin in 2012 was about the same as US CO2 emissioin in 1992, shows some positive steps in the right direction. Also, China is moving to replace coal with natural gas-another step in the right direction. But, why shouldn’t advanced power sources such as modular nuclear power plants be cited and installed?? That would lower CO2, while insuring a more stable power source.
Walter Carlson | July 19, 2013 at 3:35 pm said: ”Also, China is moving to replace coal with natural gas-another step in the right direction’
you are ill informed Walter – China last year built 53 coal powered stations; about one a week. their increased demand for coal is tremedous
I don’t think I’m ill informed, Stefan. The IEA report states: “n 2007, China`s natural gas consumption increased by 23.8% and attained 69.5 billion cubic metres (bcm) (NBS 2008). Thanks to this rapid increase, China became one of the world’s top 10 countries in terms of natural gas consumption.Moreover, according to the IEA’s World Energy Outlook 2008.
China will become the top natural gas consuming country in the Asia-Pacific region, overtaking Japan by 2015.
And, where do you think they are using all that natural gas??
Walter Carlson | July 21, 2013 at 10:00 pm said: ”IEA report states: “n 2007, China`s natural gas consumption increased by 23.8% and attained 69.5 billion cubic metres (bcm) (NBS 2008)”
Hi Walter, i didn’t say that China doesn’t use gas. I leave in a state of Queensland / Australia – coal-mining state. – China increased coal import by 700% for the last 10years only from here… New coal-powered electric generators are popping up there like mushrooms / and they are NOT closing any.
they get gas cheap in bulk and only for economic reason are using it. lots of smelters for melting / processing minerals, they need coal
plus for all the new buildings needs concrete / limestone; which releases lots of CO2 from the limestone; which has being in for millions of years – now is released in the air
car, trucks on their rods increased also by 750% in the last 15years
we buy solar panels from them to produce the most expensive electricity – they use our coal for cheap electricity —- their household and factory pays only 8% for electricity per kilowatt than what we pay here
stefan…Thank you for educating me about coal from Australia. China is negotiating with a major mine in North Dakota which would have to build a railroad to a port in Oregon to ship coal to China. I know they use alot of coal. Here in the US, our CO2 emissions have been reduced back to 1992 levels. However, worldwide, CO2 emissions continue to grow. IF there is a ‘tipping point’, beyond which there may be global warming at in an accelerated way that cannot be stopped, our species may be doomed. I worry that my grandchildren may suffer horribly.
Walter
Since 1992 America has exported a lot of jobs and industry to china which took with it a lot of co2 emissions. Instead those jobs are now being done in dirtier factories thereby increasing co2 before the stuff is exported to America using dirty ships, so the reduction is somewhat theoretical.
This may change round again as industry relocates to the US because of cheap gas.
Tonyb
Tony..Yep, seems like things keep going round and round. IMHO, unless something is done, worldwide and soon, our bacon may be frying in a pan-outside in the sun. That 11 of the hottest years on record have occurred since 1998 seems lost on those unwilling to consider: ‘what if CO2 keeps rising, and methane also rises significantly’??
What if the temperature doesn’t go up and the Holocene ends?
==================
kim…I would be extremely happy that my grandkids would then be able to have long, healthy lives. However, I’ve not seen anything that convinces me that it is likely.
That 11 of the hottest years on record have occurred since 1998.
Every warm period in the past ten thousand years had a peak of warmest years that were just as warm and warmer than the most recent 11 years. The warm periods in the 870 thousand years before that got even warmer. That does not happen anymore.
We are well inside the same bounds and it will be back to Little Ice Age Temperatures in a few hundred years.
That will be colder and less comfortable for a lot of people than now, but we will get past this consensus alarmism in plenty of time to use Nuclear and Fossil Energy to keep us warm. Climate Change will be one thing that your grandchildren will take in stride while they wonder why their grandparents panicked over nothing bad.
Pingback: CO2 ‘control knob’ fallacy (?) | Climate Etc.
The problem as understood from polynomial cointegration tests is that the combined walk seems to be that of a drunkard and her dog.
In terms of this blog, the leash appears to exist, but appears to be damped in some way so that global warming requires acceleration of the external forcing. This means the production of greenhouse gases must accelerate not merely increase linearly.
Since the production of greenhouse gases is related to the growth of the world economy, there would have to be acceleration in rate of economic growth. However, as has been well established, economic growth accelerates at the takeoff stage of an economy and gradually slows in accordance with the phenomenon of diminishing returns.
China, Russia and India are the major economies where economic growth is expected to accelerate and then slow down. If Beenstock and colleagues are correct, external forcing may well cause the climate to warm for a couple of generations, say 50 years.
If the author of this blog is correct, the oceans will absorb most of the energy and the Earth’s temperature will settle down a fraction of a degree warmer than now. .
This suggests that the sky is not falling and there is no cause for alarm.
Polynomial cointegration tests of anthropogenic impact on global warming
M. Beenstock, Y. Reingewertz, and N. Paldor
http://www.earth-syst-dynam.net/3/173/2012/esd-3-173-2012.html