
by Judith Curry
During the 20th century, solar activity increased in magnitude to a so-called grand maximum. It is probable that this high level of solar activity is at or near its end. It is of great interest whether any future reduction in solar activity could have a significant impact on climate that could partially offset the projected anthropogenic warming. (Jones et al. 2012).
Two recent papers suggest that there will be little impact in the 21st century from a decrease in solar insolation similar to what was seen in the Maunder minimum.
What influence will future solar activity changes over the 21st century have on projected global near-surface temperature changes?
Gareth S. Jones, Mike Lockwood, and Peter A. Stott
During the 20th century, solar activity increased in magnitude to a so-called grand maximum. It is probable that this high level of solar activity is at or near its end. It is of great interest whether any future reduction in solar activity could have a significant impact on climate that could partially offset the projected anthropogenic warming. Observations and reconstructions of solar activity over the last 9000 years are used as a constraint on possible future variations to produce probability distributions of total solar irradiance over the next 100 years. Using this information, with a simple climate model, we present results of the potential implications for future projections of climate on decadal to multidecadal timescales. Using one of the most recent reconstructions of historic total solar irradiance, the likely reduction in the warming by 2100 is found to be between 0.06 and 0.1 K, a very small fraction of the projected anthropogenic warming. However, if past total solar irradiance variations are larger and climate models substantially underestimate the response to solar variations, then there is a potential for a reduction in solar activity to mitigate a small proportion of the future warming, a scenario we cannot totally rule out. While the Sun is not expected to provide substantial delays in the time to reach critical temperature thresholds, any small delays it might provide are likely to be greater for lower anthropogenic emissions scenarios than for higher-emissions scenarios.
Citation: Jones, G. S., M. Lockwood, and P. A. Stott (2012), What influence will future solar activity changes over the 21st century have on projected global near-surface temperature changes?, J. Geophys. Res., 117, D05103, doi:10.1029/2011JD017013. [Link]
On the effect of a new grand minimum of solar activity on the future climate on Earth
Georg Feulner and Stefan Rahmstorf
The current exceptionally long minimum of solar activity has led to the suggestion that the Sun might experience a new grand minimum in the next decades, a prolonged period of low activity similar to the Maunder minimum in the late 17th century. The Maunder minimum is connected to the Little Ice Age, a time of markedly lower temperatures, in particular in the Northern hemisphere. Here we use a coupled climate model to explore the effect of a 21st‐century grand minimum on future global temperatures, finding a moderate temperature offset of no more than −0.3°C in the year 2100 relative to a scenario with solar activity similar to recent decades. This temperature decrease is much smaller than the warming expected from anthropogenic greenhouse gas emissions by the end of the century.
Citation: Feulner, G., and S. Rahmstorf (2010), On the effect of a new grand minimum of solar activity on the future climate on Earth, Geophys. Res. Lett., 37, L05707, doi:10.1029/ 2010GL042710. [link]
Both of these papers generally come to the same conclusion: a small impact, nominally 0.1C, from an insolation change similar to a Maunder Minimum.
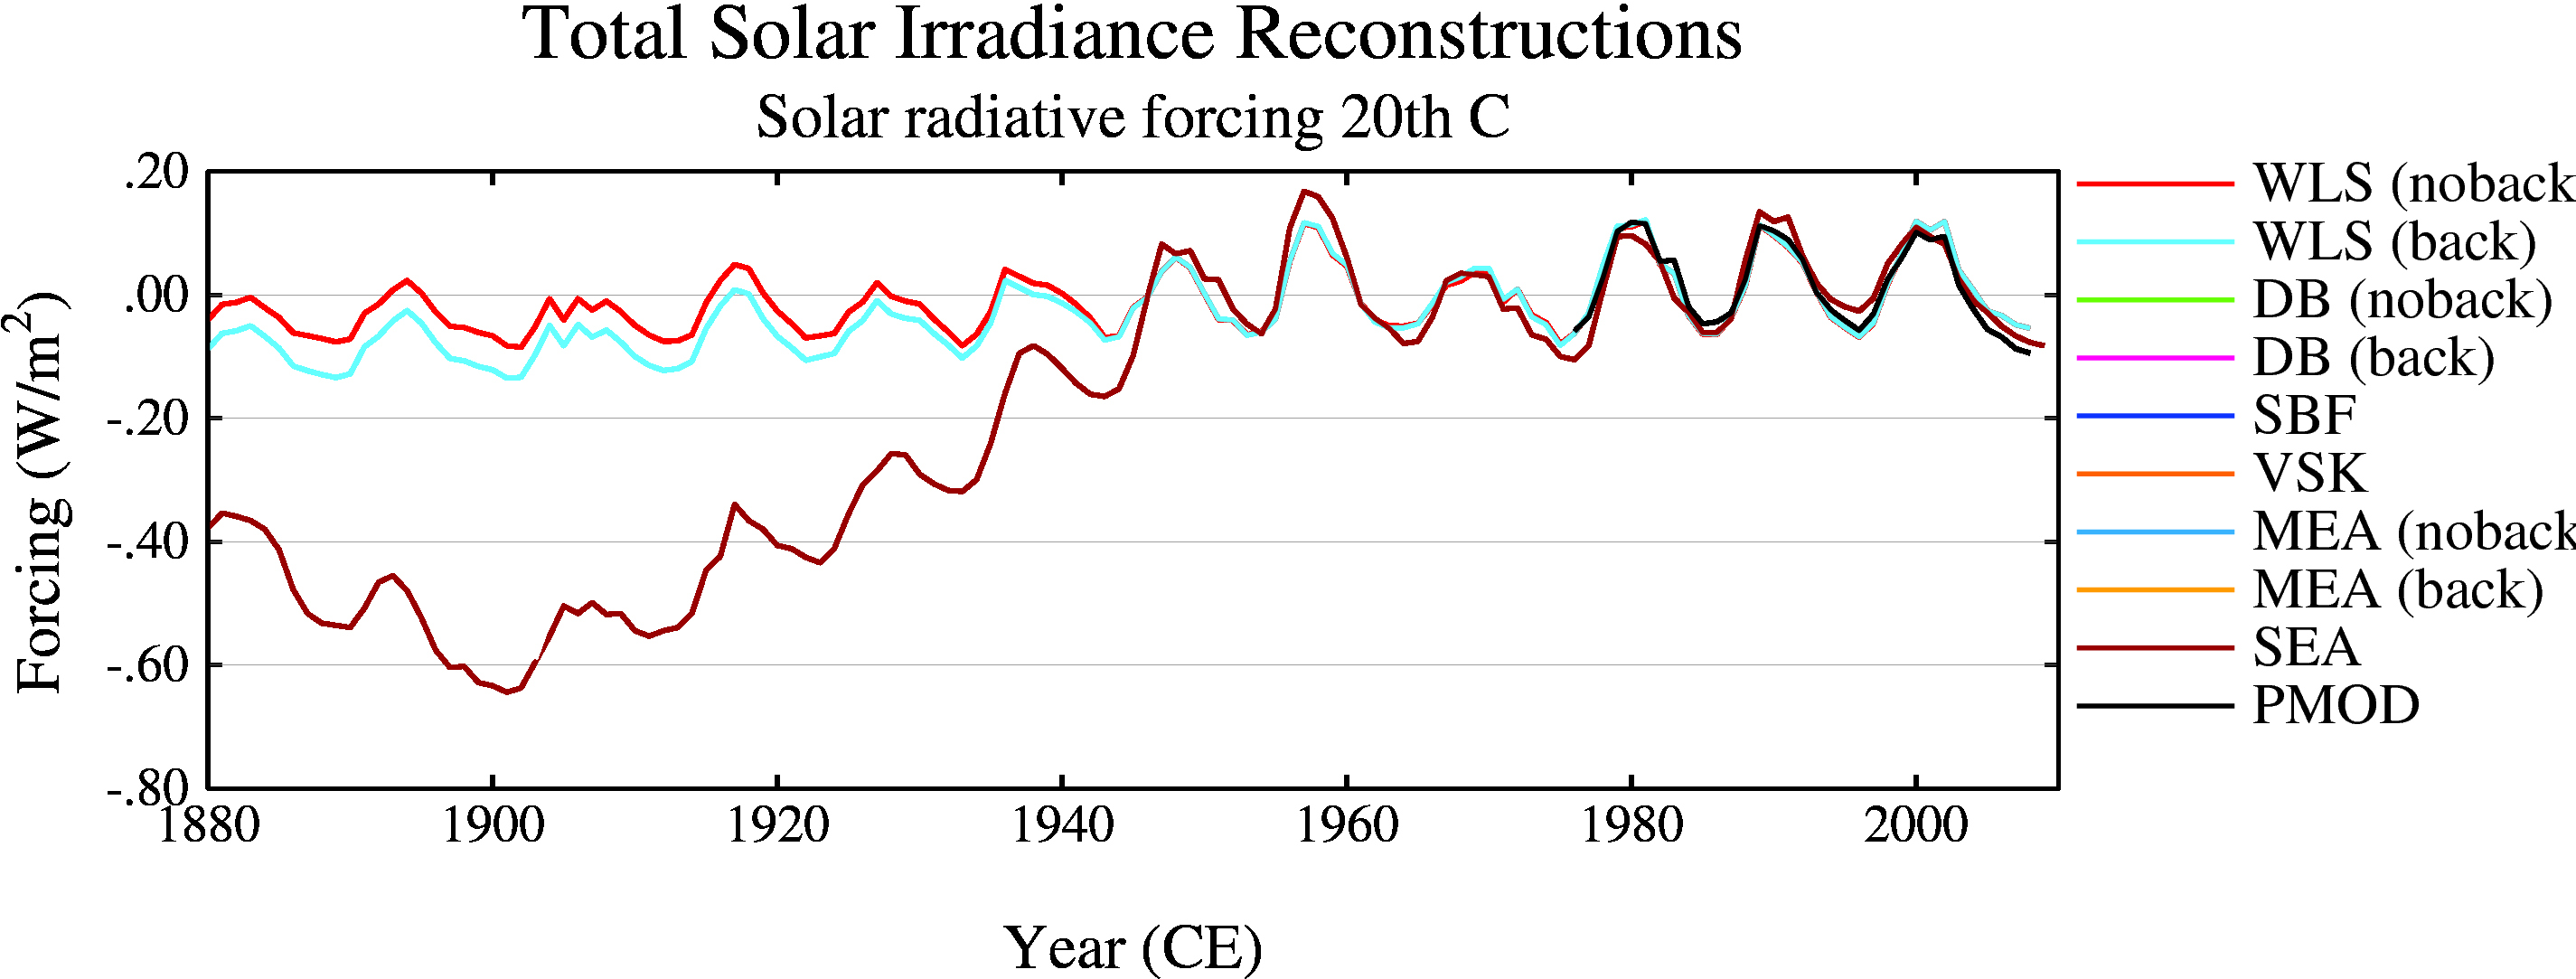
Feulner and Rahmstorf consider decreases in the solar constant determined from historic reconstructions of 0.08% and 0.25%. Whereas Jones et al. consider the reconstructions of Lean (2000), Krivova et al (2007) and Lean (2009). Referring also to the slide on Pending Maunder Minimum? of Judith Lean’s presentation discussed recently on the Solar Discussion II thread. For 21st projections, these different reconstructions imply the following insolation reductions (note the first threeeare my eyeball interpolations from Lean’s slide):
- Lean 2000: 2.2 W m-2
- Wang et al. 2005: 0.4 W m-2
- Krivova et al. 2007: 0.8 W m-2
- 0.25% reduction: 3.4 W m-2
- 0.08 reduction: 1.1 W m-2
Feulner and Rahmstorf select reconstructions with larger reductions in insolation than Jones et al.; however neither includes the recent reconstruction of Shapiro et al. (2012) that gives a 6 W m-2 reduction.
Fuelner and Rahmstorf use a low order coupled climate model, whereas Jones et al. use a simple energy balance climate model that is tuned to the Hadley AOGCM in terms of sensitivity and ocean heat diffusivity.
While I find the model and experimental design of Feulner and Rahmstorf to be preferable, I find the text of Jones et al. to be more interesting in terms of raising issues. Some points of interest from Jones et al.:
While the IPCC assessed research that investigated the impact of natural forcing factors on past climate, researchers have not methodically examined what impact future changes in natural external forcing factors may have.
JC comment: there has been an implicit assumption by the IPCC that natural forcings are of minor importance. IMO this has been to the great detriment of our understanding of the climate system. Little effort has been made to investigate the impacts of varying forcing reconstructions (e.g. Schmidt et al.) on attribution of past climate change and variability. It seems that this issue has been receiving attention only in the past few years.
Climate modeling and detection and attribution studies show that changes in TSI have a relatively small influence on global temperatures changes over the 20th century, with anthropogenic influences dominating the observed warming.
JC comment: I find this statement to be unsupported by what the IPCC reports, since none of these detection and attribution analyses have seriously addressed the warming in the early part of the 20th century and have not systematically addressed the impacts of different volcano and solar reconstructions and allowed for uncertainties in solar indirect effects.
In the last thousand years or so of the preindustrial era solar activity may have played a relatively important role influencing climate, competing with volcanic activity and human driven land use changes for a dominant influence. A number of studies suggest significant zonal/regional and seasonal impacts on surface climate and at all altitudes over the 11 year solar cycle.
JC comment: Bottom line is that we don’t really know, and IMO this substantially reduces the confidence with which we can say anything about attribution in the latter half of the 20th century.
In the calibration of the simple energy balance climate model to the AOGCM, they find a climate sensitivity parameter for CO2 to be 0.88 K W-1 m2, with values 0.49 for solar and 0.48 for volcanic forcing.
Low climate sensitivity parameters, or efficacies <1, have been noted before for solar and volcanic forcing factors in HadCM3 and in some other models. Differences in the spatial distribution of the radiative forcings can cause differences in efficacies.
JC comment: Lets speculate on the implications of this for solar forcing. The largest insolation occurs in the polar regions during summer ( see fig 12.3 in Lecture 12 at this link). The amount received at the top of the atmosphere during the polar summer is very much larger than the globally and seasonally averaged value that is obtained by dividing by 4. The significance of the much larger irradiance in polar summer (a substantial amount of which makes it to the surface) is associated with ice/snow melt, and its subsequent impact on atmospheric and ocean circulations. So inferring anything about solar sensitivity from a 1D energy balance climate model, such as that a perturbation to irradiance at the top of the atmosphere only implies a 10% change in surface forcing, is not very useful, IMO.
So, is a possible reason for the larger sensitivity to CO2 (relative to solar) an artifact of incorrect treatment of physical processes in the polar regions, e.g. related to cloud and water vapor feedback or sea ice processes? Climate models arguably underestimate the water vapor feedback in the polar regions owing to deficiencies in the treatment of the microphysics of mixed phase clouds and failure of most climate models to adequately treat the “dirty window” in the water vapor rotation band (too complicated here to go into the details of all these here). Not to even get started on the issue of clouds in the polar regions.
So are these model-based studies getting it right in terms of what we might see in the 21st century from an irradiance reduction comparable to the Maunder Minimum? I think we have barely scratched the surface of this problem, since these papers rely on alot of assumptions, many of which I haven’t even mentioned. And I suspect that, because of the seasonal and latitudinal asymmetries in insolation, that the direct solar response may be greatest in the polar regions.
And none of this discussion addresses the issues associated with magnetic fields, cosmic rays, and the latest results from SORCE on spectral variations of irradiance.
What do observational analyses tell us? Observational analyses can implicitly include the effects that are ignored by climate models. Here is one paper that suggests a significantly larger role for solar forcing:
Surface warming by the solar cycle as revealed by the composite mean difference projection
Charles D. Camp Ka Kit Tung
By projecting surface temperature data (1959–2004) onto the spatial structure obtained objectively from the composite mean difference between solar max and solar min years, we obtain a global warming signal of almost 0.2°K attributable to the 11-year solar cycle. The statistical significance of such a globally coherent solar response at the surface is established for the first time.
Citation: Camp, C. D., and K. K. Tung (2007), Surface warming by the solar cycle as revealed by the composite mean difference projection, Geophys. Res. Lett., 34, L14703, doi:10.1029/2007GL030207. [link]
JC summary question: So, how many people are convinced that a reduction of solar irradiance comparable to the Maunder Minimum would translate to a cooling of about 0.1C?

Sunspots during the Maunder Minimum were sparse, large and primarily southern hemispheric. I think there is a big clue there, particularly in the hemispheric distinction.
==============
Maybe it’s just that solar flares weren’t evenly distributed across earth’s orbital plane.
================
Yes, Earth’s heat source is the Sun!
But frightened world leaders tried to hide nature of the nuclear force that powers it, . . .
Because that same nuclear force vaporized Hiroshima on 6 Aug 1945 and threatened the world with mutual nuclear destruction in late Oct 1962:
http://dl.dropbox.com/u/10640850/Neutron_repulsion.pdf
That gave birth to the current global climatescandal:
http://dl.dropbox.com/u/10640850/Climategate_Roots.pdf
Need a mechanism for the variability not subject to runaway feedback.
===================
The Sun is a variable star to which Earth is tightly attached.
The cause of that variability had long been suspected [P.D. Jose, “Sun’s motion and sunspots”, Astron. J. 70 (1965) 193-200], but was difficult to decipher without honestly considering evidence of the Sun’s pulsar core [Peter Toth, “Is the Sun a pulsar?” Nature 270 (1977) 159-160] and its iron-rich mantle [Carl A. Rouse, “Evidence for a small, high-Z, iron-like solar core,” Astron. Astrophys. 149 (1985) 65-72].
The link between astronomy, climatology, nuclear and solar sciences only began to be recognized ten years ago [O.K. Manuel, Barry W. Ninham, and Stig E. Friberg, “Super-fluidity in the solar interior: Implications for solar eruptions and climate”, J. Fusion Energy 21 (2002) 193-198].
http://arxiv.org/ftp/astro-ph/papers/0501/0501441.pdf
The good news: There will be great opportunities for the next generation to rebuilt astronomy, climatology, nuclear and solar sciences on a better foundation and the whole world will be more secure, if we convince world leaders and leaders of the scientific community to honor and protect basic scientific principles!
When the sunspots assume a hemispheric difference, something which is ordinarily directed toward the earth is skewed.
=========================
OK, brainiacs, what’s the meaning of primarily southern hemispheric sunspots during the Maunder Minimum? Leif avoids this question also.
===============
The climate has no eyes. It doesnt count spots. You need to translate ‘spots’ into something that effects the climate. Not merely note correlations, but define a mechanism.. with numbers and units, you know physics
Yup, desperately seeking mechanism. Frankly, I think the spots and the climate respond to the same mechanism, so the correlation between spots and climate isn’t even directly causal.
======================
http://www.vukcevic.talktalk.net/CET-NAP-SSN.htm
You are right, Kim. Some powerful source of energy causes sunspots, solar flares, and coronal mass ejections. The historical record shows the same powerful source of energy influences Earth’s climate.
These events, caused by deep-seated magnetic fields, are unexplained by Bilderberg’s standard solar model (SSM). Magnetic fields are likely ejected by Bose-Einstein condensation of iron-rich material around the solar core or by instabilities in the pulsar core that might appear as an energetic “Gamma-ray burst” if not surrounded by so much insulating material.
Neutron repulsion, the most powerful energy source known [1], drives the events that sustain our lives. Earth’s climate and Earth’s heat source will not be understood by those that ignore the source of energy: http://tinyurl.com/7qvvg3w
1. “Neutron repulsion confirmed as energy source, ” J. Fusion Energy 20 (2002) 197-201.
http://www.springerlink.com/content/x1n87370x6685079/
http://www.omatumr.com/abstracts2003/jfe-neutronrep.pdf
Heh, now we need two mechanisms, one to change the spots and one to change the climate.
===============
Kim, I think the spots and the climate respond to the same mechanism.
Same causal phenomenon, but two different mechanisms causing the spots and the climate.
=========
CO2 affecting sun spots?
It is worst than we thought!
Mosher: “You need to translate ‘spots’ into something that effects the climate.”
You will just ignore it.
http://i40.tinypic.com/xgfyok.jpg
You’re not trying to suggest that sunshine has an effect on temperature are you? I thought we’d put all that behind us, the latest thinking is that sunshine is a bi-product of CO2 concentration in the atmosphere, causing temperatures to rise.
No, no, don’t be silly. It’s obvious that C02 drives UK sunshine hours recorded. How else can we explain the increase in sunshine hours since 1979? /sarc
S.M. – There is a difference between observation and theory. Sometimes, observations come first and then the struggle begins for a “mechanism” or theory. Consider the ultraviolet catastrophe.
“Sometimes, observations come first and then the struggle begins for a “mechanism” or theory.”
Not sometimes, try most of the time. Typically we make observations first and then seek to explain through theory. For instance, in developing new technologies, we often learn the one before the other. As an example, lets’s say we stumble on a material that has a certain property (good toughness). We may use the material with the property to our advantage (applications where we need strong yet ductile materials) far before we understand why the material has the property. Once learned, however, we are then able to create 2nd and 3rd generation new materials with that property included.
We have theories about how CO2 warms the climate, the question is how well do they match with observation? Mosher is pointing out there needs to be physical theory… a mechanism… that would explain how sunspots activity would affect the climate before we can make a claim or prediction… it works both ways.
The notion that we need a mechanism before we can make a prediction or claim is in fact incorrect.
We don’t have a mechanism to explain gravity, yet we can make very useful predictions about its effects.
We live in an infinite universe. As history shows, for every claim that “this is the cause”, eventually it will be discovered that underlying that cause is yet another cause, on to infinity.
S.M. – There is an observation floating around that the universe exists. Does the lack of mechanism imply it does not?
Not so! Newton was frustrated by not understanding the mechanism.
Principia Mathematicawas the result!
I don’t see why we should be held to a higher standard than natural climate change deniers.
So there may well be hemispheric warming/cooling or at least regional warming/cooling but to speak of any global trend could well be fallacious?
OMG thats what I have been thinking all along. I am not a climate scientist so I would have to have got this wrong!
The strong 61 year astronomic cycle (see some more comments
of mine in this post) applies both to the Northern and Southern Hem.
thus a global cycle and this cycle clearly shows that global temps
are heading down by 0,1 ‘C per decade to come in our lifetime……
For all of us, global warming has ENDED and all that is left for us to
do is give all Warmists the boot….why wait 10 years until the sparrows
sing that global warming has ended? We are ahead of our times…..boot
them now…..
JS
@ J. Seifert | March 10, 2012 at 7:27 pm
How good the accuracy is in your prediction of 0,1C GLOBAL warming per decade? Warmist crystal balls are of inferior quality (made in East Anglia) The accuracy in tea leafs reading increased by 30%. But if you want to be a ”climatologist” tarot cards are still the most reliable science.
I was explaining with real proofs somewhere here, that: ”in atom bomb explosion; oxygen + nitrogen can cool / get read of a MILLION DEGREES HEAT IN 6-8 MINUTES; by instantly expanding. If oxygen + nitrogen cannot cool 0,1C in a decade – you should return your crystal ball, and ask for money back; before the warranty expires; because you have being duped.
To Stefan:
Let me answer to crystal ball suggestions:
(1) If your are the donkey, looking at the grandmothers wall clock
then you can only guess about (climate) temp pendulum swings…….
(2) If you understand the mechanism of the clock, you know how
the system and the cycles (in climate: the 61 and the 790 year
cycles) work…..then your 21 Cty. forecasts will be accurate….give
or take a couple of minutes…..
this makes the difference; and all GCMs and Warmists are of
the first kind, because they do not understand the clocks
cycles ….. I hope you have not joined (1)
Cheers JS
@ J. Seifert | March 11, 2012 at 11:18 pm |
G’Day mate. Seifert, if you look at the donkey’s, and imagining that is a pendulum; you will be disappointed. Listen very carefully: there is NO warmer and colder year overall for the WHOLE planet. It does get warmer than normal in some parts – but instantly other part / parts get colder = that is NOT a GLOBAL warming; but big / small climatic changes. I know what’s in the book for brainwashing; your fairy-tale bible is WRONG!!!
For the last 100-200y, when they find some imprint of WARMER climate somewhere => they declare it as WARMER PLANET… Then it goes in a book and become official. Because for the ”founder” is better to declare warmer Planet; than the boring truth. They accumulated lots and lots of crap; as precursor for today’s phony GLOBAL warming; or ”the nuclear winter for year 2000” was predicted by the same shonks in the 70’s – early 80’s. Warmings are NEVER global / Ice Ages are NEVER GLOBAL. The laws of physics don’t permit that
After some phony ”discovering” other opportunist were onto it – needs explanation – same as the ”Roadrunner” stretches his arm out of the TV box, ACME the sun did it. Sun cycles started popping – when that was getting boring, or didn’t fit – galactic influence – St. Peter did it, you made him angry – it’s your fault!!! Pay for your sins!!
When the earth tilts, north’s poll is not on the same place – that means the equator and all the rest is not on same latitudes as they are today. that makes warmer imprints, or cooler than normal imprints, on most places, 1] When currents change directions (reasons they do that needs half a book). Apart off those things – everything else is, yes you guessed, destructive crap. Solar activity last for 1-3 weeks – sunlight comes to here in 8 minutes, no delay. When next solar activity happens – you will see that temperature doesn’t change. In the ”book for brainwashing” wetter climate was GLOBAL warming
Even by today’s data collection, dryer is ”hotter planet” . If this year is dryer week than same week last year, it shows as ”hotter planet” Easy to deceive any moron, because they don’t take in account the ”unwritten rule: when is cooler on the ground – upper atmosphere is warmer (as in Brazil) – when is hotter days on the ground – upper atmosphere is COLDER, (as in Sahara). Have you heard about: ”dimming effect”? Seifert, notice that donkey’s pendulum doesn’t swing at same intervals, you have being duped. Same always of physics that were in the past, are today, and will be same in 100years from today
For perspective, a doubling of CO2 has a forcing equivalent to a 1% solar increase.
My current thinking is that these is equivalent only in a 1D energy balance climate model, but not in the real climate because of latitudinal asymmetries (associated with different feedbacks) in solar relative to CO2 forcing
Judith,
You pointed to the high summertime maximum insolation in the polar region from Figure 12.3, but the next Figure 12.4 tells how small the amount of annual absorbed solar is in those regions. If I were asked, which observation is likely to be more important, I would pick the annual total.
The polar summer of high insolation lasts about two months and even then the sun never rises more than 23 degrees above the horizon (at the pole).
The issue during summer is ice and snow melt. the point is that solar is not like CO2 in the sense of having some sort of annually and areally averaged forcing number that is useful in context of its impact on the climate
Not really, Jim. The 1% solar increase is across the board. Even when CO2 is well mixed its forcing is conditioned by many regional factors. For instance CO2 has a sweet spot for absorption at 15 micrometers. That corresponds to a temperature of -70C. So it efficacy as a greenhouse gas gets better as the surface temperature drops and few if any places on the earth ever get cold enough to align perfectly with the sweet spot. As well water vapor overlaps CO2’s absorption bands so the more water vapor there is the less additional forcing you get from CO2. So the very best place in the world to test CO2 forcing theory is in Antarctica which is the coldest dryest place on the earth.
The there’s forcing over water. No one has yet explained to me how back-radiation from CO2 which is known to be almost completely extinguished inside the first millimeter of the ocean’s surface and which demonstrably raises the evaporation rate which makes the cool skin layer manages to insulate the ocean like it does over land. Where evaporation is essentially unlimited any restriction in radiative cooling (which is CO2’s physical modus operandi) will simply take another route. Evaporative cooling is responsible for a majority of the ocean’s cooling and the cool skin layer which averages a millimeter deep also averages about 1C cooler than the water below it. Over land radiative cooling is the dominant means and in an arid region is over 90%.
So you see CO2 forcing is just as variable as surface insolation. The 1.1C baseline CO2 sensitivity per doubling is an idealized maximum that holds pretty close to true (measured in fact) in Antarctica but is pretty dodgy anywhere else.
I find the fascination that people have with possible future TSI reduction peculiar. There’s no reason to be confident that it will happen, let alone that it will cause significant cooling.
So what does it mean for AGW? We can just go ahead and quadruple CO2 in the hope that the Sun will compensate?
Nick, we are desperately hoping that Anthro CO2 will compensate for the sun. We don’t see much evidence that it can.
===================
And please, lose TSI. It probably only varies by a half percent. The mechanism is something else, not hypersensitive, how, I don’t know.
========================
Hi kim
It is much simpler than many would imagine:
http://www.vukcevic.talktalk.net/CET-NAP-SSN.htm
Yeah, but how? Nobody’s gonna be happy ’til how gets nailed down. moshe told me so.
===========
Your intuition is good, no mysterious feedbacks, the rest in good time. In my view it is far better not to offer too many details or a hypotheses than to make a mess of it, and someone else runs away with the credit, smokescreen is very good camouflage. If a university is interested get in touch.
Well here are a few reasons for the “fascination”:
• it is possible that 20th century attribution studies are significantly in error
• it is possible that in the short term we will see level or cooling temperatures
• it is possible that paleo proxy analyses have effectively damped substantial variations in temperatures over the past millenium, some of which may be explained by solar variability
• model simulations when compared with observational analyses give substantially different measures of solar sensitivity, with the implication that we don’t really understand solar sensitivity.
Your last sentence provides the perfect explanation for why the defenders of the consensus don’t want climate science to be distracted by considering solar variations.
But three of those points don’t relate to future TSI reduction at all. And yes, it is possible that in the short term we will see level or cooling temperatures. Short term. But this isn’t a reliable counter to AGW.
Solar variation is a distraction, We can’t do anything about it. And we certainly can’t rely on it to keep things cool when we’ve upped the CO2 levels. Even if it was capable of cooling.
Nick, you still don’t get it. As a race, society, and culture, humanity needs something to rely on to stay warm. CO2 doesn’t seem big enough to fill those shoes, and the sun is going barefoot on us.
================================
It’s the CO2 level that’s a distraction to the understanding of climate variation. Solar is the knob.
CO2 – no signal
Solar – a very clear signal
It isn’t a knob. We can’t twiddle it.
Exactly, we can’t twiddle it. We can’t twiddle global climate, but it’s twiddled anyway.
Great Heavens, if we have any power at all we should twiddle warmer. Twiddling colder is awfully risky.
===================
Edim, the sun is main driver of climate, but it is an extremely small driver of climate change. No reconstruction or modern observations of solar changes support a significant link between the sun and climate change, and while the difference in the wiggles in various studies (see. Schmidt et al 2011) are interesting, they’re all significantly smaller than the changes due to greenhouse gases. See the Gray et al 2010 review for good introductory background.
We can twiddle lika Lisa Simpson drives the car.
Solar is not a knob. It is a slightly varying input. water is the capacitor, GHGs are variable filter knobs. The question is whats the gain on the C02 knob. we are turning it up without a good understanding of the effect, except that a higher setting will result, over time, in a reduced rate of planetary cooling.. that is, warming.
Analogies suck. but solar is not a knob.
Chris, what do you think about this paper:
http://arxiv.org/pdf/1202.1954v1.pdf
Nick, your lack of control knobs on the Sun
Doesn’t mean the Sun doesn’t control you !
Get over yourself. Avoid fear, accept reality.
http://dl.dropbox.com/u/10640850/Fear_Not.pdf
8% is not “slight” Mosher.
http://i40.tinypic.com/xgfyok.jpg
Msggie drives the car – sheesh – as Vaughan would say
Maggie! Sheesh!
http://www.doletown.com/simpsons/maggie/maggiedriving.gif
Nick,
I do agree with you about the use of possible futures. This all seems to be about closing the door on possible alternative explanations for climate change as quickly as possible than any real furthering of scientific understanding. It’s about clearing the way for policy, I guess it shouldn’t be in climate science journals.
Distraction! From understanding! That’s the most glaring anti-scientific statement I’ve seen in a while. Until we understand attribution, we have no idea what we can and can not do- and worse still, we’re likely to do a lot of things that have tragic consequencies, like our clear cutting tropical forests for palm oil biofuel!
“Your last sentence provides the perfect explanation for why the defenders of the consensus don’t want climate science to be distracted by considering solar variations.”
As an outsider it seems to me climate science concerns itself with how climate reacts to forcings. In that context focus on how a particular forcing will behave in the future would seem a distraction.
We have a pretty good idea what C02 will do and projects of that have been fairly reliable. It’s also a variable we’re controlling, however unintentionally.
We have little idea of what the sun will do and no way to control it in any event.
Solar variability could potentially affect many things not just climate. When giving medical advice about smoking I don’t think doctors should caveat it with “Well, unless the sun explodes”.
sharperoo: In that context focus on how a particular forcing will behave in the future would seem a distraction.
It will be the unfolding future that tests all the models.
“It will be the unfolding future that tests all the models.”
Only in the sense of whether the observed climate reacts to changes in forcings to the same degree as the models do, not whether the forcings acted as projected.
If you don’t smoke you don’t get lung cancer caused by smoking. You may get lung cancer caused by something else. That has no impact on whether smoking causes lung cancer.
But solar forcing is probably chaotic, non-linear, and not capable of prediction (see, I’m not using the E word!)
“We have little idea of what the sun will do and no way to control it in any event. ”
But we could recognize that during the 20th Century the sun activity was normal or higher than normal. And realize the during the Little Ice age the sun’s activity was lower than 20th century.
And there are ways to control how the energy of the sun effects earth.
In terms of affecting the entire planet, the cheapest way to do this is having capability to operate in the space environment.
What I mean having capability to operate in space environment is a matter of degree. We have some capability, but we could much more capability.
A measure of capability could be the ability to move asteroids. Being able to move asteroids, would allow us to divert dangerous impactor from hitting earth. We don’t “know” how to “best” do this. We will gain this ability by actually doing it, thereby learn how to best do this. It’s one thing to have ideas of how one could do this and another to actually do it.
In addition to safeguarding planet earth from potential impactors, we get benefits from move a space rock where we want there to be a space rock. If you get rock in Cislunar space, one use the material of the rock for various purposes.
And more exotic purpose of having the capability of moving space rocks is one can terraform a planet [such as Mars].
As to issue of controlling the sun, one could use the material from a space rock to make a solar shade. Or one could simply use a lot of rocks- not requiring processing and fabrication of the material- or use “natural space rocks”.
Moving space rocks could seen as “fairly advanced stuff” and could have political issues related to it [space rocks could more a powerful weapon then we currently have- and restraining this ability could similar to the desire to limit nuclear weapons [one can imagine them being secretly used, have deniable of causing it [it’s natural event] and one doesn’t have radioactive residue as one has in nuclear weapon. Such worries require unreasonable conspiracies theories but that isn’t unusual. And regardless if it were to happen “naturally” there could such blaming without any merit.]
A lessor degree of capability and something achievable, now, could be the ability to refuel spacecraft in orbit. And to have rocket fuel available to anyone in space. Or said differently, have a market for rocket fuel in space. This rather obvious and elementary ability, is something we have failed to do after decades of being engage in various space activities.
Once this market is developed, the next stage in terms of capability would be having the ability to make rocket fuel in space. Eliminating the need to ship rocket fuel from Earth.
One of the best rocket fuel in space is hydrogen and oxygen and can made easily from water. You use electrical power to split the water .
Space has loads of water- one theory is Earth ocean was largely caused by asteroids impacting earth. And many times more water in all the space rocks than the amount in Earth oceans.
But in near we don’t need that much water- one lake on earth could more than needed for decades or a century in terms of rocket fuel use.
The Moon as a world is as dry a tomb, but in it’s polar region there could be billions of tonnes of minable water. All that needed is tens of thousands of tonnes [a large swimming pool] of minable water- which would be worth billions of dollars.
So the next level of capability above a having rocket fuel market in space, would the capability to mine water space and make rocket fuel as commercial activity. And this would give the ability to use the Moon, go or get rocks, and go anywhere else in the solar system. And increase the capability of existing satellites we have in orbit.
And at level of ability we could choose to influence the affect of the sun on Earth.
Government cost: 50 billion
Private sector investment capital: 100 billion.
Though it really is matter of re-directing NASA activity- and it save future NASA costs, and of course for private sector they are making money, so it’s somewhere investment capital can go.
If you have several forcing variables and you don’t understand their relative power, you have NO context for model projecting any of the forcings contribution to warming/cooling. So don’t bother studying solar! Down the rabbit hole. Bleep.
Nick & curryja Re TSI & AGW, Fascination
Considering IPCC projections of 0.2C/decade, I fine it even more remarkable that there has been No Warming For 17 Years – Game, Set, Match
while CO2 has been increasing!
Roy Spencer finds that:
Could it be that the central dogma – that CO2 drives temperature – might be wrong?
Dr. Curry you say cooling is possible in the short term.
I will add cooling is nearly certain in intermediate term (next few thousand years) when the interglacial grace period expires.
So we have possible cooling in the near term and almost certain drastic cooling within a timespan shorter than recorded history.
Doesn’t it seem we should be worried about cooling instead of warming?
The primary producers in the food chain don’t produce well growing on ice. Ice is the enemy. Warmth is our friend. The world has gone insane in this regard and your colleagues are largely responsible. If my computer science colleagues were as wantonly ignorant I’d want to choose a more respectable, productive profession like driving a taxi or cleaning up after the elephants in the circus.
Given the
“So what does it mean for AGW? We can just go ahead and quadruple CO2 in the hope that the Sun will compensate?”
4 times 400 is 1600 ppm.
And 4 times 30 billion tonnes of human emission of CO2 is 120 billion.
Neither is possible within 50 years.
“Current projections show a continued increase in population (but a steady decline in the population growth rate), with the global population expected to reach between 7.5 and 10.5 billion by 2050.”
http://en.wikipedia.org/wiki/World_population
If you simply take US CO2 per captia and times by say 9 billion people
17 tonnes times 9 one would get 153 billion tonnes [exceeding 120].
A problem with this is that the major source of CO2 emission is related to coal use. The reason China has such high level CO2 emission is due to it’s high usage of coal. And is also the reason the US has high CO2 emission.
China: CO2 from coal: 3,809 million tonnes. Total CO2 from all fossil fuels:
4,707 million tonnes
“In 2001 the carbon emissions from coal use in China made up about 10% of the world total CO2 emissions at the time. By 2004 this fraction rose to 14%.It is believed that a continued increase in coal power in China may undermine international initiatives to decrease carbon emissions such as the Kyoto Protocol, which called for a decrease of 483 million tons by 2012. In the same time frame, it is expected that coal plants in China will have increased CO2 emissions by 1,926 million tons — over 4 times the proposed reduction.”
http://en.wikipedia.org/wiki/Coal_power_in_the_People%27s_Republic_of_China
China and US use a lot of coal because they have a lot to use- and the cost of coal dramatically increases if shipped long distances.
Unless there was no other available source of energy it is unlikely for one see global increase of coal.
US has huge coal reserve, China a lot has lot, but China has less years of coal supply than US. US has 22.6% of global. China has 12.6% and is currently using 3.2 billion metric tonnes per annum. US: 1 billion tonnes.
So US may have more hundred year supply, but China doesn’t. And if whole world would “somehow” use coal, coal supply would diminish rapidly. Another factor in China’s coal use is it is world supplier of steel- and steel production uses a lot of coal.
And China is moving towards more nuclear power electrical generation- by 2050 it will have easily more nuclear power plants than the US. So long term, China does not plan to consume as much coal [it won’t have it].
So rather think the world as having per captia of US, it would be wild to think the World would have per capita of Europe [which has little coal- Germany has 4.7% of world reserves]. Which about 8
So 8 time 9 billion people is 72 billion tonnes annual global. Which may be a lot CO2 emission but would also mean the end world poverty- it require
about 8 billion people being in the middle class in terms of wealth.
And that would amazing [unimaginable] if that could happen before
2050. A more reasonable hope is the global CO2 emission is doubled by 2050 [60 billion tonnes] and global CO2 is around 450 ppm.
“We can just go ahead and quadruple CO2 in the hope that the Sun will compensate?”
Nick that one statement describes perfectly the 1D view of the world taken by alarmists. Who are the “we”? Well one of the “we” isn’t China, another isn’t India, and others aren’t Brazil, South Africa and Mexico. All of them are dragging their populations out of grinding poverty, hunger, high infant mortality rates, low life expectancy, poor education and health care. And they are doing this with the use of fossil fuels, it’s how we did it and got ourselves in the position where millions of us have forgotten the reason we can pontificate on “climate change”. They, China et al, on the other hand know that for the bulk of their populations, the doom-mongering elite of Western Industrial Civilisations cannot forecast climate conditions in the future that make things worse for their peope today, so they have no reason to stop putting CO2 into the atmosphere. Especially based on the specious science coming out in the IPCC SPMs and being used to drive Western Industrial policies destined to destroy Western Industrial Civilisation.
@ GerryM | March 11, 2012 at 6:16 am |
+1
Many of the early readers of scientific thermometers attached to such places as universities were astronomers, so we shouldn’t be surprised that they often commented on celestial matters. The contemporary records of the 17th century are rife with comments about the aurora borealis and also,intriguingly, earthquakes.
Tonyb
21st century solar cooling is implied by number of data sets widely available, in past I have graphically presented some here and many more on WUWT, but often the discriminate readers would insist on precise definition of mechanism involved (btw mechanism of gravity attraction is still unresolved).
http://www.vukcevic.talktalk.net/GNAP.htm
If readers are inclined to give attribution to the solar system factors, this was produced in 2003 long before anyone suggested solar activity downturn or global cooling:
http://www.vukcevic.talktalk.net/NFC7a.htm
In there you will find a reference and a question to Dr. Lockwood, so if he happens to stop by, I hope that he may tell us a bit more and elaborate.
@ vukcevic | March 10, 2012 at 3:25 pm : if readers are inclined to give attribution to the solar system factors, this was produced in 2003 long before anyone suggested solar activity downturn or global cooling.
Vuk, can’t it get in your thick fanatic scull, that: Warmist are using the sun as smokescreen = to get themselves out of their lies; and you are preparing their ”BACK-DOOR EXIT”? Sun, NOT guilty!!!
They are not predicting that: nothing is going to slam into the sun for the next 100y and stir it up. What they are predicting is: ”it will be proven soon; that is no such a thing as GLOBAL warming – CO2 production is skyrocketing = if they blame the sun cooling = will no need to face admission that they have being lying all the time / justice… Didn’t you do enough damages with your misleading GLOBAL temp charts?! Unless you declare yourself as a horoscope person, leave the lies about solar / galactic influences. Oxygen + nitrogen regulate the temp. Look at the size of the sun, there are always activity there; but temperature here don’t go up and down as a yo-yo. It was a big sun-flare 3 days ago – if the GLOBAL temp doesn’t skyrocket in the next 7 -10 days = proven that the sun activity effects electronics / but doesn’t increase the overall temp. Doing the Warmist dirty job is reducing yourself to a …
I don’t believe that a TSI reduction though very small that lasts for 30-70 years or more would result in only 0.1C cooling. I suspect that over that time frame there may much more cooling and rebound in sea ice and glaciers resulting in more like a 1.0C cooling, maybe even tipped into the expected glacial that history tells us in our future..
I also suspect that the sole focus on TSI will some day be shown to have been a mistake. I’m thinking there are other factors in the Earth-Sun interface that are not now appreciated, like the interplay of the suns magnetic field with the earths or other planets, or even known.
There may even be quantum particles being created in the sun’s furnace at a greater or lesser rate we haven’t even considered. That may have an influence on our climate that’s not presently appreciated..
So what you’re saying is that, just like the common argument about CO2, sensitivity to TSI is important, and may be a much bigger factor than is usually acknowledged. Sounds reasonable to me, though of course, quantification from further research would be helpful.
To make the changes in solar irradiance over the 20th century competitive with CO2, you need to inflate the sensitivity at least 10-20x above what many skeptics already feel is an unreasonably high sensitivity. It’s rather silly, and watching people believe it or appeal to astrological theories would be a good exercise for a psychology class.
The thing is that there is a lot of really interesting solar-climate connections, interesting uncertainties associated solar reconstruction, and people don’t seem very interested in talking about that. That the sun can be made competitive with CO2 now or in the future when we double or triple or quadruple CO2 has no credibility amongst any real scientist studying this.
Real scientists already understand attribution and climate sensitivity. Come on Chris. Dig yourself out and look at the history of scientific discoveries and controversies.
I also find your implication that we have enough hydrocarbon fuel (or would use it if we did) to triple and quadruple CO2, another example of your bunker mentality. You make very thoughtful comments at times. Please try harder.
According to the IPCC the change in temperature for a doubling of CO2 forcing is ConstantxLn ([CO2]/280) K
We can calculate this if we know the temperature and [CO2].
We can get temperature from GISS and [CO2] from Keeling and Bordons estimates for human CO2 release.; top figure.
http://i179.photobucket.com/albums/w318/DocMartyn/LNCO2vstemp.jpg
If we plot temperature vs. LN[CO2], the the slope gives us the ‘CO2 forcing’, so we can deduce that 2x[CO2] is about 2.2 degrees. ASSUMING all post-1960 warming is due to CO2; middle figure.
We can then remove the ‘CO2 forcing’ from the record and see what the temperature would have been if CO2 was stabilized in 1880 at 290 ppm; bottom figure.
We do get a lovely flat 1960-2012 using a climate sensitivity of 2.2 degrees per doubling.
However, we still have to explain the rise in temperature rise of 1.2 degrees per century between 1910 and 1940, and the 1.2 degrees per century of cooling between 1940 and 1952.
So what ‘forcings’ caused all the heating between the two world wars and the cooling between 1940 and 1950?
Your ball.
climate scientists often wiggle out of this by saying that the are focusing on the period since the 1970’s when the data is best. Until I see convincing explanations for the pre 1970 temperature record, I have a hard time placing much confidence in the IPCC’s attribution statement for the latter half of the 20th century.
I would have used 2.5 degrees per doubling which puts us in a negative anomaly now relative to the beginning of the century. This would be aerosols that grew between 1940 and 1970 and then stayed fixed. The earlier rise was likely solar as proxies show.
Pixie Dust.
=======
CC,
You have to remember there are inquiring minds out here looking for convincing explanations. Crude parodies that avoid the issues don’t work so well.
HR,
The thing is that no one really seems to be interested in the right questions concerning the uncertain issues. The fact is that the evolution of the 20th century global temperature can be well accounted for by the evolution of well-mixed greenhouse gases (primarily CO2, methane, N2O) and ozone, anthropogenic (mostly tropospheric) and volcanic (stratospheric) aerosols, and changes in sunlight (with the trends becoming negligible for the last half century.
There’s a bit more uncertainty in the earlier part of the instrumental record because we didn’t have networks of instruments that measure ocean heat content; we didn’t have satellites, precise measurements of the spatial distribution of aerosols, etc, and there’s some uncertainty in solar reconstructions. As Gavin noted, it is not likely this will change much because we can’t reverse time and put 3000+ ARGO floats into the ocean in 1920. We actually have to work what we have, and following from what we have (especially since 1950-1960 or so) there a lot of things we can say with high confidence. And regardless of whether it meshes well with people’s pre-conceived notions, political or ethical ideals, or what they heard on WUWT, the attribution to a predominant anthropogenic signal is not in serious debate, despite a lot of people looking for signals elsewhere. But it isn’t even a process-by-elimination attribution either, since we know the spectroscopy of CO2, and we know the various fingerprints its leaves behind (like a cooling stratosphere, something else we also couldn’t measure in the early century). If someone wants to come up with a better model, they are more than able to try, but the fact that people need to work from astrology (like Nicola Scafetta) or invoke mysterious Phlogiston-type mechanisms to explain is a good hint they are not off to a good start and are probably grasping at straws.
Judith keeps insisting that we need to have very high confidence in the early 20th century to have confidence in the later 20th century, despite the later part of the record having much better measurements- it’s really a failure of elementary logic that is no better than saying we can’t attribute a house fire to arson because there’s been times in the past when we’re not sure what caused a fire. This is all supplemented by strawman attacks like “Their concern is with people that say “AGW does it all”” Even if we understood the early 20th century perfectly, she’d then say we need to understand every detail of the MWP to make attribution, then of the last deglaciation, then of the Pliocene, then of the Eocene, etc. It’s easy to continue this ad infinitum until someone needs to just point out that there’s a lot of interesting questions, but some are independent of each other.
It’s the typical sloppiness I’ve come to expect from arguments not at all thought out in order to dress up the “uncertainty monster”
Heh, Chris, you went off the rails there with your whining about what Judy would want for proof. She must have you against the ropes about attribution.
Chris, you don’t understand the sun, you don’t understand clouds, and you’ve mistaken water vapor feedback. This is why you’re going nuts with missing heat, models that can’t project or predict, and bodging aerosols.
Bottom line, I don’t believe you, and your rhetoric is only my latest clue.
===================================
Condensing Chris Colose,
1. We don’t know why what happened before happened.
2. We know why what is happening now is happening.
3. Even though what happened before is very much like what is happening now, we know it’s not the same thing, because we are sure we know why what is happening now is happening and we are sure it cannot be the same thing, because of a lot of stuff is different now than before, even though we don’t really know what is different, because we don’t know why what happened before happened, but it must be different…really.
“And regardless of whether it meshes well with people’s pre-conceived notions… the attribution to a predominant anthropogenic signal is not in serious debate”
Agreed. I haven’t seen anyone debate that one, and I’ve been looking everywhere.
Re: TSI. The following is a learning exercise about every satellite TSI measurement as of April 2009. It was not updated for SDO, because because Verizon stopped providing update capability (without warning, I might add).
http://mysite.verizon.net/cache.22/SET_EM_TSI_Coverage.jpg
The analysis is here (What is Total Solar Irradiance (Really)?), and covers 5 pages of investigation and forum discussion (and some sarcasm) between February and April 2009: http://solarcycle24com.proboards.com/index.cgi?board=globalwarming&action=display&thread=468
I love the solar discussion, everyone can switch chairs for a while. Skeptics can say ‘its simple physics’, and true believers can say ‘it is far too complex to understand so I’m going to ignore it’. Everyone then takes a forcing that suits them, and the computers confirm it all.
No skeptics make unfalsifiable claims about the sun.
Something, not TSI, really drives the climate. Something, magnetism, mysterium, drives the climate. we don’t know how, but we are sure that this something, is the real cause. You can eliminate there proposals one by one, but they will still claim, that “something” hitherto unknown about the sun, causes climate change. Or something known, acting in ways we dont know is surely causing the change.
its always something. something we dont know. something we know but dont understand that is “causing” the change. It’s their version of ‘gods will’
You are betting, moshe, both that skeptics won’t find a falsifiable mechanism and if they did, it would be falsified. I doubt Leif Svalgaard would bet thusly.
========================
Steven: (1) “SOMETHING SUN-related beside the TSI is driving the climate” and (2) its not the paradigm Warmist-CO2 and GCMs …….
……were then to look, where to lift the blanket?
A Hint: Get into the mechanism of Nick Scafettas astronomic HARMONIC CYCLE MODEL (a repeating cosmic cycle of 61 years) and you will
see how the cyclic power drives the climate and you can derive the
annual amount of global cooling for each consecutive year as well…..
No problem: My recent numbers: Global cooling of 0.1’C per coming
decade until 2040….
JS
Scafetta refuses to publish his code and data. He is worse than Mann or Jones. His model cannot hindcast. His model cannot predict SST in isolation. His model says nothing about precipitation, nothing about changes in ice, nothing about enso frequency, nothing about lower tropospheric temperature. His model is aphysical and cannot be reconciled with physics in its current functional form.
Simple question: with a GCM I can predict, with a measure of accuracy, the effect that a large volcano will have. Not perfectly of course. That is a consequence of modelling PHYSICAL LAWS that quantify over PHYSICAL FORCES and PHYSICAL OBJECTS. Scaffetas model will never be able to make such a prediction because it is aphysical. It is useless.
Was his simple model developed with taxpayer money? If it wasn’t why should he release the code?
So we don’t have to just take his word for it? Science is never having to say, ‘I trust you’.
Steven
There is no magic to be found up in the thin air, it’s all down to the ‘not so solid’ earth.
“its always something. something we dont know. something we know but dont understand that is ‘causing’ the change”
No doubt. The fact is that we can’t account for the something at the moment and it is a travesty that we can’t.
steven mosher
You are wrong.
It is not “god’s will”. It is something that we (all of us, including you) do not yet know.
Is it the cosmic ray / cloud mechanism being tested experimentally at CERN?
Or is it some other mechanism, which we cannot explain, but which we know must exist from the empirical data we have on past temperature change?
Who knows?
We do not.
Our computer models do not.
To deny that another solar-related mechanism exists just because we have not yet identified it is foolish as well as presumptuous.
Face it, Steven: we just do not know yet why climate has changed dramatically in the past without the impact of GHGs.
And, until we do know, we are fooling ourselves with the model projections.
Max
It is a huge mistake to lump skeptics together and say we make claims about the sun. We are Skeptics concerning the manmade CO2, but on our side, we do not all have consensus about the sun. If you want to say what the Skeptics believe, you cannot say it simple. Some of us think it is just a hoax, some think it is the sun, some think it is Ice Albedo controlled by the Arctic Sea Ice.
A true scientists is a skeptic. If you are not a skeptic, you are not a scientist.
It’s not l like you Mosh to make a generalised “…skeptics make unfalsifiable claims…” Some sceptics probably do, but they can point with plausibility at past increases in temperature, say 1910-1940, which could not possibly have been caused by increasing CO2 and ask, with plausibility, why the same increase in the late 20th century can be attributed to CO2. It can’t, not scientifically at least, it’s the absence of any other explanation that gives rise to the assumption that CO2 caused the warming. Are you suggesting we know everything there is to know on the effects the Sun has on our climate? I don’t believe you believe we come within a million miles of having all the science at our fingertips, and people who suggest we do are being disingenuous, or downright stupid. Not you of course Mosh, you were recently described by Richard Betts as “level- headed” which I take to mean you agree with his view that human emissions are the sole cause of most of the late 20th century rise in temperature.
I’ll come to moshe’s defense. He’s just talking about people like me.
===============
er, bots like me. Sorry, moshe, didn’t mean to get above myself there.
==============
GerryM
I called Mosh “level headed” because in his book with Tom Fuller they were able to distinguish between 2 issues: (1) the behaviour and attitudes of some scientists and (2) the overall scientific results of a huge field of research.
Cheers
Richard
Two separate issues, Richard, joined causally. It was the ‘behaviour and attitudes of some scientists’ which has led to the IPCC missing the boat with their ‘overall scientific results of a huge field of research’.
========================
“which I take to mean you agree with his view that human emissions are the sole cause of most of the late 20th century rise in temperature”
Wrong. Best reckoning would put more than 50% of the rise due to humans. Human emission are Not the sole cause. Nobody believes that.
WRT the 1910-1940 peak. Hint number one.. look at the distribution of stations reporting. A good portion of this is likely due to latitudinal bias in the station locations.
“WRT the 1910-1940 peak. Hint number one.. look at the distribution of stations reporting. A good portion of this is likely due to latitudinal bias in the station locations.”
So a model hindcast that matches GMT might be a little suspect?
Mosher, like Randy Jackson, is just keeping it real folks. If you want to win this contest… you still have to know how to sing.
Something, we don’t know what, caused the universe to come into existence. Nevertheless, the universe still exists.
Let us not forget that ‘space’, had to be created first for the universe to expand into. Now that was thinking ahead. Wasn’t it.
It seems to me that a finite amount of nothing would server the purpose.
“Something [insert speculation] drives the climate. we don’t know how, but we are sure that this something, is the real cause.”
Right, both the team and some skeptics are far too sure of themselves.
I wouldn’t be so sure there is any simple cause.
“its always something. something we dont know. something we know but dont understand that is “causing” the change. It’s their version of ‘gods will’ ”
Right, ‘gods will’ was an early and still popular cop-out, a way to slip in an easy answer which answers nothing. But when you don’t know, you don’t even know what you don’t know.
The team’s “it has to be CO2 because we can’t think of anything else” just shows lack of thinking. It’s a very weak argument.
Mosher it seems a little unfair to blame all this on skeptics.
Read any decent review of climate/solar and it becomes very clear that very little is ruled out. Take this from Lockwood, you can definitely identify were his disdain is directed but he actually doesn’t rule out any of the skeptics favorite ‘somethings’.
http://www.eiscat.rl.ac.uk/Members/mike/publications/pdfs/Sun_Climate_final.pdf
Take into account all his caveats and anybody who says we understand the solar/climate relation with certainty sits in the nutjob camp. That includes skeptics, alarmists, realists, denier, convinced, unconvinced or whatever other flavour of climate nerd you can identify. I hate to champion ignorance but we seem to still be in the dark ages on this subject.
Mosh, I’m not sure what you mean by unfalsifiable claims. The sceptics, at least the ones I know and read, to a person say that a doubling of CO2 from pre-industrial levels will give rise to 1C in temperature. No one, as far as I am aware, disputes this.The dispute is about the feedbacks, the alarmists say it’s positive, without proof, based on an assumption of increased water vapour in the atmosphere, for which, as far as I’m aware there is no sign else the glaciers wouldn’t be retreating. The sceptics say that the effect is a mild negative feedback and claim to have measured it in Lindzen and Choi 2011. Of the two hypotheses, to me at least, the sceptical one has more weight because systems prone to positive feedback tend to self-destroy without dampening factors. There may be natural dampening factors, well there are else the proposed 3.3C increase would itself cause positive feedback into an uncontrollable loop, but I’m not aware of what is proposed will stop runaway warming and stablise the planet at an increase of 3.3C. Do you know?
BTW if CO2 is a nob, the sun is the generator, water is the capacitor and clouds are the resistance, it is the effects of clouds that are downplayed in the models, hence the positive feedback due to water.
Oh Mr Mosher, you have jumped down off the “buy my book look how nasty climate science is” onto the mad side of the fence again I see.
So we have to accept that C02 is a driver of climate because we *know* it’s a greenhouse gas and it’s definitely going up.
But we can’t look at a graph of the UK sunshine hours and see exactly the same upwards trend and conclude anything from that?
So you are saying that increased sunshine hours being recorded (around 8% since 1979) is irrelevant.
Despite that fact it’s something we “know”, we must ignore more sunshine hours, even though their increase points to less cloud cover in that time period?
Another interesting paper on sunshine. The graph of bright sunshine hours looks remarkably like HADCRU or GISS.
http://sunshinehours.wordpress.com/2012/03/13/ebro-observatory-spain-and-bright-sunshine/
@ steven mosher | March 10, 2012 at 4:35 pm |
Mosher, blame NOT the ignorant. You the Warmist, intentionally confused the CONSTANT climatic changes with the phony GLOBAL warming. The ignorant fake Skeptics cannot see that HO2 is changing the climate – believe more in phony GLOBAL warmings than the Warmist; and are looking for that ”something” that doesn’t exist. If they had enough ”common sense and logic” to see that there isn’t any GLOBAL warming; they ”wouldn’t be looking” where is Santa’s factory on the north poll. Ignorance is for the born losers. Warmist are proving with lies that is global warming – Skeptics are on the side of the truth; but are using Warmist lies as factual = to prove that they are ”ignorant losers / not real skeptics”.
“…It is of great interest whether any future reduction in solar activity could have a significant impact on climate that could partially offset the projected anthropogenic warming.”
Translation: I have been spectacularly wrong and I am not going to admit it and the sun is about to make a monkey of me.
Translation No. 2: “No matter what happens in the future, my cherished AGW hypothesis will remain intact.” — Meaning, If an inactive sun cools the planet, it will only have done so by overriding the Anthro CO2 forcing.
Question:
What happens when an inactive sun lowers the CO2 ppm level?
Good question.
What happens when an inactive sun lowers the CO2 ppm level?
With human CO2 emissions for 2010 6% greater than for 2009, I reckon we have that under control, Jim. If you seriously think the Sun can undo what we’ve worked so hard to do over the past few decades by actually lowering atmospheric CO2, you have a pretty low opinion of our ability to increase our annual CO2 output. Dream on. ;)
One thing is certain: humanity’s effect on average temperature of the world cannot be fanned from a spark to the flame of dread by the fearmongers of global warming alarmism unless the witchdoctors of AGW concurrently undervalue the significance of solar variation.
stefanthedenier says, “Wagathon and Vaughan Pratt, listen very, very carefully: H2O + CO2 are a ”Shade-cloth effect gases”, NOT greenhouse effect. Put some H2O, or soot on the roof of a normal greenhouse – you will see that; inside gets much COLDER! 2] Oxygen + nitrogen are a the greenhouse gases.”
You’re a public schoolteacher ain’t ‘ya?
Wagathon | March 13, 2012 at 11:00 am: You’re a public schoolteacher ain’t ‘ya?
Hi Wagathon, no, I’m a theoretician. Mate, today’s teachers are into brainwashing the kids into the phony GLOBAL warming… it’s tragic!
6% of what? Our meager 3 or 4%?
Our meager 3 or 4%?
Interesting accounting method you’re using there, John. Is that the same one you use when doing your taxes? ;)
Here’s the ledger for the CO2 contributions to the atmosphere for 2010 by nature and humans, in GtC (gigatonnes of carbon). The 210 GtC IN figure may be a bit out of date—if it’s any different today, the OUT figure is still 5.3 GtC greater (so the NET column is the same), since nature is currently removing an estimated 53% of what humans add in addition to the 100% of what nature adds. Nature is going the extra mile, we humans aren’t. :(
————-IN—OUT—-NET
Nature…..210…215.3…..−5.3
Humans….10……..0……..+10
Summing the NET column, we see that CO2 is accumulating in the atmosphere at a rate of 4.7 GtC.
The atomic weight of carbon is 12 so CO2 is accumulating in the atmosphere at a rate of 4.7/12 = 0.39 petamoles of CO2 a year.
The atmosphere has a mass of about 5140 teratonnes and an average molecular weight of 28.97 and so contains 5140/28.97 = 177 examoles.
It follows that CO2 is increasing at 0.39/177 = .0022 parts per thousand by volume, or 2.2 parts per million (ppmv) per year.
Check my math in case I screwed up somewhere. Did you get the same numbers?
If my math checks out, John, you might want to consider switching accounting methods before the IRS catches up with you. ;)
Excuse me. Humans 10 divided by Nature 210 gives me 4.7%.
Net is for tax purposes.
Man’s contribution to all greenhouse gases: 0.28%
Wator Vapor accounts for 95% of all greenhouse gases.
CO2 accounts for just 3.5% of all greenhouse gases, most of which is Natural
99.72% of all greenhouse gases are … Natural
Based on concentrations
(ppb) adjusted for heat
retention characteristics……..% of All……% Natural….% Man-made
Water vapor……………………..95.000%…..94.999%……0.001%
Carbon Dioxide (CO2)………….3.618%…….3.502%…..0.117%
Methane (CH4)……………………0.360%…….0.294%…..0.066%
Nitrous Oxide (N2O)…………….0.950%……..0.903%…..0.047%
Misc. gases ( CFC’s, etc.)…….0.072%…….0.025%……0.047%
Total……………………………….100.00%……..99.72%……..0.28%
” There is no dispute at all about the fact that even if punctiliously observed, (the Kyoto Protocol) would have an imperceptible effect on future temperatures — one-twentieth of a degree by 2050. ”
Dr. S. Fred Singer, atmospheric physicist, Professor Emeritus of Environmental Sciences at the University of Virginia, and former director of the US Weather Satellite Service; in a Sept. 10, 2001 Letter to Editor, Wall Street Journal
@ Wagathon | March 12, 2012 at 11:17 am | + Vaughan Pratt
Wagathon and Vaughan Pratt, listen very, very carefully: H2O + CO2 are a ”Shade-cloth effect gases”, NOT greenhouse effect. Put some H2O, or soot on the roof of a normal greenhouse – you will see that; inside gets much COLDER! 2] Oxygen + nitrogen are a the greenhouse gases.
O+N as transparent, let the sunlight trough to the ground; SAME as GLASS ROOF of a normal greenhouse – then, O+N, as perfect insulators are SLOWING COOLING, same as roof of a normal greenhouse. The moon is on average cooler than the earth, because the unlimited coldness there is touching the ground – on the earth, that unlimited coldness is separated by 30km layer off O+N as BEST insulators / the troposphere. B] Inside the polystyrene, O+N are the insulators. Compare the amount of O+N in the troposphere V the amount of other gases.
Wagaton, it’s the ”mother of all stupidity” to blame water vapor as a bad gas for climate. If comparison of Brazil against Sahara cannot prove to you how wrong and BACK TO FRONT the propaganda is – proves that: ignorance is very harmful. For where is better climate, ask the trees: Sahara, or Brazil? C] around Kyoto city is 1000% more CO2, than in Australian desert; healthy trees around Kyoto, but not in the desert; what are the two reasons?!?!?!
Net is for tax purposes.
Are you saying capitalism without taxes is an impossibility, John? New one on me. My understanding was that net was for determining profit, and that tax was based on profit.
Besides capitalism you also have a very different understanding of the carbon cycle from me. As can be seen in the second (green) graph of this figure, the Vostok ice cores show CO2 as varying between 180 and 300 ppmv for the past 400,000 years, a range of 120 ppmv, with the highest reading throughout that whole period being 298.7 ppmv 323,000 years ago. In particular the last five readings were as follows. BP = Before Present (in years) = Before 1999.
BP….PPMV
8113 259.6
7327 254.6
6220 262.2
3833 268.1
3634 272.8
2342 284.7
Fitting a trend line to this, the rate of rise was 0.43 ppmv per century throughout those 6,000 years. This gives some idea of how fast CO2 changes when there are only a few million humans and only biofuel consumption (wood burning), with no significant use of fossil fuels.
Contrast that with the 53-year period 1958 to 2011, lasting a mere 0.013% of those 400,000 years. During that incredibly short period (by geological standards) CO2 rose from 314 ppmv to 394 ppmv, a rise of 80 ppmv. Furthermore in 1958 it was rising at a rate of 71 ppmv/century (0.71 ppmv/year) while today it is rising at a rate of 251 ppmv/century (2.51 ppmv/year).
During that period human population rose from 3 million to 7 million, while human emission of CO2 into the atmosphere increased from 2.5 to 10 GtC per year (and that’s without counting the additional CO2 attributable to how we’ve been changing land use over that period). Hence each human has almost doubled their consumption of energy as measured by CO2 emissions over that period.
It is as correct to say that humans are only adding 5% of what nature is adding to the atmosphere as it is to list only the income of a company without listing its expenses, when deciding which company to invest in. Tax is irrelevant in that consideration assuming all companies pay their fair share of taxes. But to neglect the fact that nature is removing 100% of what she adds plus 53% of what humans add is to fail to realize that only by removing more like 100% of what humans add can nature stop this astonishly rapid rise in CO2, which today is 251/0.43 = 583 times as fast as during the period 8113-2342 Before Present, and at the present rate of increase will be twice that in 30 years time!
Note that I’m not claiming this breakneck pace is catastrophic, merely that it is much faster than anything shown in the ice cores over the last 400,000 years. My expertise is limited to the quantitative, and I have no idea how to quantify catastrophes.
The Vostok data set holds all sorts of secrets, how true:
http://theoilconundrum.blogspot.com/2012/03/co2-outgassing-model.html
Isn’t it the case that there is a serious debate between the ice core and fossil stomata camps about the variability and level of paleo CO2?
So why not activate your brain and do like I do and try to advance the science?
http://theoilconundrum.blogspot.com/2012/03/co2-outgassing-model.html
BTW, the thing you are talking about is called the equable climate issue.
Google this guy Huber from Purdue and see what you can add to the discussion.
Web, it was a question. If you have a sharp opinion on it, I would be delighted to have your opinion.
Tch.
http://www.cgd.ucar.edu/cas/adai/papers/Dai_JC06-sfcHumidity.pdf
NW
To sum up the most oversimplified version: ice cores in the Antarctic are almost never downwind of known volcanic activity, or in low-lying swamps full of biota that generate CO2 at intense local levels, or deep in forests with like still-air CO2 effects, or affected by any of the dozen other things that change stomata number beside CO2 level.
Thus most stomata fossil samples require a lot of interpretation to establish faith in what they seem to tell.
The same goes for the Greenland ice sheets, and several other regional markers sometimes subject to contamination or alteration.
So while all data contributes to the overall picture, the data that sheds the cleanest light remains the Antarctic record.
Huh. I go away for a few weeks, I lose all ability to cut & paste.
The humidity thing is for the 95%ers, not the stomataists. Clearly.
So, I looked at Huber, Web, and a few other things.
As near as I can make out, this equable climate problem has to do with conditions during the Eocene, when (according to the Huber paper I looked at) CO2 levels varied from perhaps 550 ppm to 4500 ppm. There seems to be some kvetching about the stomata methods as applied to “high CO2” levels, I assume that means in that Eocene range, but not at the lower end of that range.
The fossil stomata inferences I was thinking of are for the Holocene…all well below the lower limits mentioned above by Huber for the Eocene, and so (given the discussion in Huber) I would guess there isn’t much controversy about those inferences over the Holocene range.
Anyway, I read a discussion of several papers that attempt to measure Holocene CO2 levels from plant stomata and compare them to ice core inferences for the same period, from Law Dome, and the inferences from the stomata reconstructions give higher mean and higher variance time series of CO2 levels than do the ice cores. This is what I was talking about, not the Eocene period during which CO2 levels were (apparently) so high that the stomatal count methodology becomes cardinally unreliable.
And Web… really and honestly, if I’m not getting it, then try to explain. I really am trying to understand. It is just that it seems clear to me that if the level and variance of holocene CO2 are understated, then sensitivity estimates based on that period will be overstated. So I am trying to sort out the different arguments. And, if there is a good reason I should think that the Holocene stonata reconstructions are sucky, tell me what it is, or at least where to look. The Huber discussions seem to be about a different period and a different issue.
OK, since you asked, here goes. I am always motivated to find simple relationships that expose the seeming complexity of the climate system. In this case it involves the subtly erratic behavior observed in paleoclimate temperature versus CO2 data. The salient trends are there, in that CO2 and Temperature track each other, but the uncertainties cause climate watchers some puzzlement. The following tries to put a model-based understanding to what I think is happening. As usual, this does not rely on detailed climate models but simply pragmatic physical considerations placed in a mathematical context.
Premise. A model of long-term global temperature and CO2 interactions would assume two primary contributions.
First, we have the forcing function due to the greenhouse gas properties of atmospheric CO2 concentrations, where c = [CO2] is in parts per million (PPM). The first-order paramater alpha, α, is known as the climate sensitivity and is logarithmic with increasing concentrations (log=natural log):
The second contributing factor is due to steady-state outgassing of CO2 from the ocean’s waters with temperature. A first-order approximation is given by the Arrhenius rate law to estimate gaseous partial pressure. The standard statistical mechanical interpretation is the invocation of a Boltzmann activation energy to model the increase of steady-state pressure with an increasing temperature bath.
To keep things simple we use the parameter beta, β, to represent the activation energy in Kelvins, where k is Boltzmann’s constant. The relation between Kelvins and electron volts is 11600 Kelvins/eV.
This works very well over a reasonable temperature range, and the activation energy Ea is anywhere between 0.2 eV to 0.35 eV. The uncertainty is mainly over the applicability of Henry’s law, which relates the partial pressure to the solubility of the gas. According to a Henry’s law table for common gases, the CO2 solubility activation energy is β = 2400 Kelvins. However, Takahashi et al state that the steady state partial pressure of CO2 above seawater doubles with every 16 celsius degree increase in temperature. That places the activation energy around 0.3 eV or a β of 3500 Kelvins. This uncertainty is not important for the moment and it may be cleared up if I run across a definitive number.
Next, we want to find the differential change of pressure to temperature changes. This will create a limited positive feedback to the atmospheric concentration and we can try to solve for the steady-state asymptotic relationship. The differential is:
In terms of a temperature differential, we invert this to get
Now we make the simple assertion that the differential changes in temperature will consist of one part of the delta change due to a GHG factor and another part due to the steady-state partial pressure.
We next cast this in terms of a differential equation where dc=d[CO2] and dT = dΔT.
The solution to this non-linear differential equation is closed-form.
The interpretation of this curve is essentially the original activation energy, β, modified by the GHG sensitivity, α. The constant K0 is used to calibrate the curve against an empirically determined data point. I will call this the αβ model.
Application. We can use the Vostok ice core data to evaluate the model.
My previous posts on Vostok introduced the CO2 outgassing concept
The latest is here which has the model evaluation.
http://theoilconundrum.blogspot.com/2012/03/co2-outgassing-model.html
I am more and more convinced that paleoclimate data is the best way to demonstrate a signature of CO2 on climate change, given the paucity of long time series data from the real-time telemetry and instrumentation era (view the CO2 control knob video by Richard Alley to gain an appreciation of this). I still won’t go close to applying current data for making any predictions, except to improve my understanding. Less than one hundred years of data is tough to demonstrate anything conclusively. The paleoclimate data is more fuzzy but makes up for it with the long time series.
So Web, here’s my takeaway:
1. alpha and beta are physical constants determined from other data/theory. There may be a little uncertainty in beta but not much.
2. The only “positive feedback” in the model is outgassing from the oceans.
3. The only parameter one needs to estimate in your model is K0 in the final equation for T(c).
How exactly does K0 get estimated? I’m not following that. Do you use a paleo time series of T and c to fit K0, say by ML or NLS or somesuch?
You can fit K0 to a median value so there are as many excursions above and below the model median as in the empirical data. It acts as the attractor or reversion to the mean point for a bounded random walk. I wanted to keep it simple on first pass and let the walk go unbounded and used the sample time periods to limit the excursions.
Btw, thanks for taking a look.
@ Vaughan Pratt | March 12, 2012 at 10:41 pm
Commissar Vaughn, I can’t point all your misleadings; but few will do: 1] ”researchers” say that is 600 000 years old ice on the polar caps, but they are wrong, as on most other subjects. Their presumption is because: no snow or rain on Antarctic / Greenland – almost same amount of ice is every year = the ice below must be 600 000 years old. WRONG!
Vaughn, buddy… ice on the polar caps is melting every day and night of the year; by the geothermal heat- from below. Is not much of that heat, but because in the topsoil is protected by the ice from the big coldness in the air. the thermal heat is constantly melting the ice from below. B] in the same time the ice is replenished on the top by freeze-drying the moisture from the air; same as the old fridges needed defrosting regularly – they build up ice without raining or snowing in the kitchen. Just by opening the freezer door occasionally – polar caps don’t have doors. When cold winds (Sirocco) blows from the polar cap south – to avoid vacuum – lots of low / moist winds go towards the polar cap – bingo. If is plenty moist air south to go towards the polar cap, ice increases = the fake Skeptics beating themselves in the chest that is ”getting colder” – when is LESS moisture going north = less ice -> Warmist declare WARMER PLANET. In reality, has nothing to do with the temperature, but on the amount of raw material available for renewal / replenishing the ice. (in permafrost temp is minus -50C, but no ice)
Back to the subject: the ice you Swindlers refer as 600-000years, might be less than 360years old. More than 1m of ice is melted from below, EVERY YEAR, similar amount replenished, every winter.
Listen buddy, if you believe that your politburo can tell precisely the temperature on the planet to a thousandth of a degree (0,009C) you better take an aspiring and go to bad; because you must have high-fever and are hallucinating… If the symptoms persist tomorrow – you should talk to your doctor – if he prescribe you a straight-jacket – should be paid by money from carbon rip-off… To one thousandth of a degree… are you sure that it wasn’t 0,008C instead 0,009C…?! If you know that you are lying, is OK; but if you genuinely believe in the mountain of Warmist trolls; you cannot pas the psychiatric test. Look after yourself Vaughn… but than again: ”Al is great, Al is one; there is no other god than Al Gore” For your martyrdom – the great Al will give you 8 virgin secretaries.
P.s. the ice on the north pol is melting because: Santa din a big extension on his toy factory -> releases much more CO2, plus Rudolf’s methane… It’s a vicious cycle; you children from both camps are demanding more and more small fire trucks and water pistols, to cool the planet…
@NW And Web… really and honestly, if I’m not getting it, then try to explain. I really am trying to understand. It is just that it seems clear to me that if the level and variance of holocene CO2 are understated, then sensitivity estimates based on that period will be overstated. So I am trying to sort out the different arguments.
I meant to post my reply to NW here but WordPress put it at the end of the page. Gist is that Antarctic CO2 is a more reliable indicator of atmospheric CO2 than stomata because it’s further from the CO2 sources.
The cooling will surprise many. Solar “forcing” is very weak at the moment and it seems it will stay low (sc24 long and also very weak by any other solar proxy).
however neither includes the recent reconstruction of Shapiro et al. (2012) that gives a 6 W m-2 reduction.
That led me to a paper by Schmidt et al 2011.
fixed, thx
I got it, but shouldn’t you call it Shapiro et al(2011)?
Dr Curry, that was a good post. Many possible good quotes, of which I’ll put just 1: So inferring anything about solar sensitivity from a 1D energy balance climate model, such as that a perturbation to irradiance at the top of the atmosphere only implies a 10% change in surface forcing, is not very useful, IMO.
“Apart from all other reasons, the parameters of the geoid depend on the distribution of water over the planetary surface.” — N.S. Sidorenkov
Column-integrated Water Vapor Flux with their Convergence:
http://i51.tinypic.com/126fc77.png
“The physicist Richard Feynman called Euler’s formula “our jewel” and “one of the most remarkable, almost astounding, formulas in all of mathematics.””
http://en.wikipedia.org/wiki/Euler%27s_formula
“The Cauchy distribution is an infinitely divisible probability distribution. It is also a strictly stable distribution.” / “Like all stable distributions, the location-scale family to which the Cauchy distribution belongs is closed under linear transformations with real coefficients. In addition, the Cauchy distribution is the only univariate distribution which is closed under linear fractional transformations with real coefficients.” // CD has no mean, no variance, & no higher moments.
http://en.wikipedia.org/wiki/Cauchy_distribution
http://en.wikipedia.org/wiki/Witch_of_Agnesi
http://en.wikipedia.org/wiki/Exponentiation#Computing_complex_powers
The Paul Wavelet – reparameterizable in terms of grain, extent, & sampling resolution – is a perfect marriage of these 2 beautiful concepts.
Mainstream climate narratives have been scythed by the real power of the complex arctangent integral of the wicked evaporative witch of the westerlies. All trust has been destroyed.
“We tried so long, now it’s done, I’m draggin’ you down.”
— Die Mannequin – Autumn Cannibalist
http://www.youtube.com/watch?v=KMl-Gjg6vMQ
1. ftp://ftp.iers.org/products/eop/long-term/c04_08/iau2000/eopc04_08_IAU2000.62-now
2. ftp://ftp.iers.org/products/geofluids/atmosphere/aam/GGFC2010/AER/
3. http://wattsupwiththat.files.wordpress.com/2011/10/vaughn1.png
4. http://wattsupwiththat.files.wordpress.com/2011/12/image10.png
5. http://wattsupwiththat.files.wordpress.com/2011/10/vaughn4.png
Doesn’t end there. Nature’s beauty stuns further – (no surprise to nature lovers with proper respect). Answered the question posed here:
http://wattsupwiththat.files.wordpress.com/2011/10/vaughn-sun-earth-moon-harmonies-beats-biases.pdf
Details when time’s right.
–
Supplementary material for those scrambling to catch up – see particularly figure 6 on p.12:
Lilly, J.M.; & Olhede, S.C. (2009). Higher-order properties of analytic wavelets. IEEE Transactions on Signal Processing 57(1), 146-160.
http://www.jmlilly.net/papers/lilly09-itsp-cp.pdf
Regards.
vaughan when I read you my mind goes here:
http://www.youtube.com/watch?v=bw9CALKOvAI
Or perhaps it calls for some translation. buffalaxing would help
Leif Svalgaard doesn’t understand (nor does anyone else in the online climate discussion, so far as I’m aware) the role of the Cauchy extent in measuring the average phase scatter of interannual variations about the decadal phase groove.
The EOP & AAM data show that Mother Earth isn’t always equally receptive to Father Sun’s advances. One cannot simply take anomalies and ignore the year as a conditioning variable. That is what the data say.
Who is listening to what the data are saying? The data also say the solar cycle seasonally affects key absolute (not anomaly) temperature gradients.
There’s a common stream of wind blasting the instrument, but the notes come out different for different geophysical fields due to the combination of timing, field geometry, field asymmetries, & field asymmetry stability. It’s analogous to knowing how to play a multi-layered shape-shifting instrument.
A bright individual with sufficient time & resources should be able to crack ENSO’s DNA. For a sufficiently bright individual, it might not even be difficult.
Will it be a climatologist? That may in part depend on whether there’s a climatologist who recognizes what a tremendously important clue the ~1930 Chandler wobble phase reversal is about the nature of solar-terrestrial relations.
The ~1940 temperature “bump” marks a solar-terrestrial climax. With proper attention to receptivity in Mother Earth’s dominant cycle (the year), this treasured insight can be illustrated very clearly. When time permits I’ll assemble an article that provokes further on this theme, but it won’t be terribly intelligible for readers who haven’t invested in at least a basic understanding of wavelets & EOP, nor will it be satisfying for those attracted more to dull answers than sharp questions.
Regards.
Correction:
I wrote:
“The Paul Wavelet – reparameterizable in terms of grain, extent, & sampling resolution – is a perfect marriage of these 2 beautiful concepts.”
I intended:
The Paul Wavelet – reparameterizable in terms of grain, extent, sampling rate, & support span – is a perfect marriage of these 2 beautiful concepts.
Elaboration:
As some of you know, I ran into hard narrow-extent utility limits of the Complex Morlet Wavelet while exploring superior quantification of the family of modulations shared by LOD’ & geomagnetic aa index. These constraints relate to what wavelet specialists call admissibility criteria. The strictly uncompromising obstacle necessitated theoretical work.
I’m pretty much in agreement with Nick concerning the odd fascination with solar changes, although Judith is way off the mark in describing the why “defenders of the consensus don’t want to be concerned with solar variations.” This is just conspiracy talk that is blind to the large literature on the subject. But a few facts have emerged from that large literature,
– The variations in TSI in various reconstructions are interesting, and a lot of people are looking at them. They’re of interest to not only 20th century climate change but also that of the last millennium. However, in virtually all cases, we’re talking about order-of-magnitude smaller changes than that of greenhouse gases.
– I agree that the variations in volcanic reconstructions should be probed, particularly for simulations of the last millennium. These appear to be more important than the differences between solar reconstructions.
– The reconstructions outlined in Schmidt et al (2011) indicate a Maunder Minimum to present RF of less than 0.2 W/m2. The Shapiro reconstruction does fall outside this range (although there seems to be reasons to doubt its validity, e.g., Feulner, 2011).
– In keeping long-term climate change in mind, the lifetime of CO2’s perturbation on the energy budget is much longer than durations of solar minima; solar cycle changes (or longer term secular changes) are thus more important for the decadal-scale prediction issue than equilibrium to Earth system timescales.
– The skill in attribution for the early 20th century does not compromise attribution for the late 20th century, where better constraints exist.
Hi Chris
Nature needs to be understood in order to interpret its behaviour, and you can’t get very far by observing the world through a keyhole, here is a view from my front door:
http://www.vukcevic.talktalk.net/CET-NVa.htm
Tell your mate Gavin, when he gets fed-up with defending the over-cooked global warming, to get in touch and do some worth while science (even incognito), which may mean something in the future; after all both of us spent some time at the same uni, granted his degree is one step above mine.
Chris, AGW at best explains the 20-25 years at the end of the 20th century. So AGW works for ~25 years, but then we are not to wonder why little warming since 1998, why substantial warming 1910-1940. Until we can better explain these periods, then AGW as an explanation for the last quarter of the 20th century isn’t all that convincing.
CO2 level correlates best with temperature only in the last quarter of the last century, and not before and not since. Attribution of late 20th Century temperature to Anthro CO2 may be grandest example yet of the Post Hoc, Ergo Propter Hoc logical fallacy.
=======================
Post-normal IPCC science.
Everything (droughts, floods, warming, cooling, no snow, excess snow, ice melting, ice thickening) is ‘consistent with CAGW’ i.e. no falsifiable hypothesis.
or
http://www.vukcevic.talktalk.net/CET1690-1960.htm
Vuk
I’m glad you mentioned that period as I was just about to.
Tonyb
Obviously unprecedented!
Judith-
As you well know, you need to consider the relationships between net forcing and temperature superimposed on internal variability. The early 20th century is not as well understood because of poorer observations, but it is very likely that it was caused in part by external forcing, with a strong component of solar and volcanic, and a smaller anthropogenic component. The spatial distribution of that warming also indicates an internal variability component, though the uncertainties preclude a very precise partitioning. The anthropogenic contribution dominates after mid-century or so (more than 20 years).
Your 1998 line ignore multiple studies that have looked the last decade and concluded that there is nothing unusual or inconsistent given the time-evolution of forcings and internal variability.
The early 20th century is not as well understood because of poorer observations
The late 20th century is not as well understood despite better observations.
http://www.vukcevic.talktalk.net/CET1690-1960.htm
Agreed. If this is correct, then arguing that 25 years at the end of the 20th century is AGW sounds pretty weak.
Of course it does:
let me go make my own amateur graph of some random variable (maybe the number of cows in Idaho), don’t really document my assumptions or label my axes in any meaningful way, don’t work out any physics or write down equations…then I’ll just link it and correlate it with global temperature, maybe make a linear regression, and watch in awe as a professional climate scientist makes the argument that decades of peer-reviewed literature are pretty weak.
And people wonder why “The Team” ignores stuff…
To Mr. Colose:
This is just a fantasy story of your mind, just sucked out of your pen…
The reality: If you announce a new paper having a anti-Warmist
touch…. it will NOT be read, not commented, not received, completely
ignored, not even acknowledged that they have been informed …
Warmist institutions do not even respond with a simple : “Thanks for your
paper, we will look at it some time….but dont call us, we call you”
As soon as they notice that the announced paper comes from a Skeptic,
then Warmists are 100% unavailable …… the one& only exception are the
English, but not (now I assume this) because they are scientifically
interested, but they will respond out of politeness, which is
not a typical feature of an entrenched obstinate Warmist….
…. I can prove this 100 times over….
Please stop sucking on your pen…..
JS
A. Lacis about Lindzen on another thread, and C. Colose above about Judy think they are persuasive, and I have to agree they are very much so.
==========================
@JC: If this is correct, then arguing that 25 years at the end of the 20th century is AGW sounds pretty weak.
@CC: And people wonder why “The Team” ignores stuff…
Sorry Chris but I’m on Judith’s side on this one. To paraphrase the saying about Las Vegas, what happened in the past 25 years stays in the next 25 years. What happened in the past 162 years stays in the next 162 years.
The next 162 years is far more relevant to concerns about future global warming than the next 25 years, much of which is predictable from the quite nontrivial but also quite predictable solar cycle. The solar cycle comes and goes on a 21-year time frame, making it irrelevant to forecasts for 2100.
If your views represent those of “The Team,” and the economy is in the grip of the team, god help us all. Hopefully your views aren’t representative.
The number of sunspots tripled between 1910 and 1940, and the Shapiro estimate has a 0.2% increase in solar TSI. This should be a big part of the early century increase. Skeptics seem to avoid this possibility completely because explaining it that way removes their argument that we don’t know why 1940 was so warm therefore we don’t know enough about AGW. It was especially warm in the Arctic, consistent with solar forcing, and (as I posted on a previous thread) a series of winters in Britain were unusually snowy around 1940, seemingly a parallel to the current situation with low sea ice.
@ Jim D | March 10, 2012 at 8:12 pm
Jim D, are you misleading for cash, or for ”feel good”? Who was counting the number of sunspots for you in 1912? At that time, people did know about some sun-flares (nobody was counting), but NOT about sunspots. You have being duped. At that time, without proper filters – everybody was seeing lots of sunspots, when looking at the sun. Try it without a filter tomorrow, look at the sun for 3-10 minutes – you will see after lots of black spots. That will convince to; grow up and stop lying.. hopefully…
Sunspot records go back to the 1700’s. Either there are a lot of blind people by now, or they figured out a way over 200 years ago that you haven’t yet figured out.
Jim D, if you can tell the difference between stefanthedenier and a troll you have a keener sense of smell for trolls than me.
But even if he isn’t a troll, why this urge to keep feeding him?
@ Vaughan Pratt | March 13, 2012 at 12:19 am
Vaughn, Jim D is telling a bit of truth – you are instantly criticizing him. The first filter, to see reliably sunspots was made in 2009. Vaughn, remember what you said: ”good intent”. If is pointed that the ”intent” was wrong; but continues to commit the crime = is a double crime. Same as every rapist has a ”good intent” but doesn’t wash hands in court of law. See, you just created a proof that your ”intent to save the planet from the phony GLOBAL warming” is very, very dishonorable, same as the rapist ”good intent” by blaming / criticizing Jim D.
Jim D should persist to discover; who was stating / writing records for sunspots from 1700’s; to warn people of that conman; and from Vaughn Pratt. Start getting used to truth Vaughn; you can’t run away from it. It only proves that you are suffering from the debilitating ”truth phobia”
Troll!
Vaughan, you saw my reply was not serious, which is the spirit of this part of the debate. Stefan also goes after skeptics for not being skeptical enough, which is interesting to watch. Those skeptic targets get a sense of how they might look to AGWers if they don’t make justified arguments.
See David Stockwell Solar Accumulation Theory.
Key evidence for the accumulative 1 model of high solar influence on 2 global temperature
He models and documents an 2.75 year lag (Pi/2 or 90 degrees) David Stockwell identified between ocean temperatures and the 11 year Schwab solar cycle. e.g. see Phase Shift in Spencer’s Data
@curryja: Chris, AGW at best explains the 20-25 years at the end of the 20th century.
Oh dear, Judith I’m not sure if you realize it but I’m afraid you’re contradicting Max Manacker here.
Max has been insisting that CO2 is on a steady 0.5% CAGR rise. Assuming the Arrhenius logarithmic law, this means that this steady exponential rate of increase in CO2, which Max is forecasting to hold up until at least 2100, has been responsible for the same annual increase in surface temperature for as long as we know. So according to Max, if it explains the fourth quarter of the century then it equally explains the other three quarters!
You’ll no doubt be aware that not all of us believe Max on this point, perhaps even you, though I see you contradicting Chris more often than Max FWIW. ;)
For example David Hofmann late of NCAR Boulder proposed in a 2009 AMU poster presentation that atmospheric CO2 consisted of a natural component of 280 ppmv and an anthropogenic component that has been doubling every 31.5 years. In conjunction with either endpoint of the Keeling curve one obtains a curve that is essentially independent of the choice of endpoint, and which when extrapolated back 3000 years is in excellent agreement with the Vostok ice cores (actually 285 ppmv gives an even better curve by Vostok standards).
No one so far has proposed a curve with better such agreement (though in a critique of Hofmann Craig Loehle was able to come up with several much worse ones from the standpoint of how they fared when extrapolated backwards in time, a point Steven Mosher often brings up).
When you take the log of the Hofmann curve, which is essentially the Keeling curve extrapolated back a few millennia, you get a function that while not quite Max’s perfectly linear increase is not that far from it.
So I’d be very interested to know why you believe AGW does not explain the anthropogenic component of the whole of the 20th century.
There is of course an obvious natural component whose downward swings most certainly can’t be explained by steadily rising CO2. But if you model the natural component as the 2nd and 3rd harmonics of an inverse sawtooth wave of period 151 years triggering in 1925 whose (missing) 1st harmonic has amplitude 0.18 C, then this completely accounts for those strange swings. What remains is then beautifully modeled by the Hofmann curve as seen through the temperature lens of Arrhenius’s logarithmic law.
Very sorry you couldn’t make it to my AGU presentation on this material in December, which was entirely my fault for not being able to get my poster posted earlier than the very start of that session—true to form I left no time for things to go wrong, in this case a balky 13″ wide printer.
I will join Procrastinators Anonymous when I get around to it.
Vaughan,
It’s probably true that CO2 had a secondary effect in the early 20th century, when concentrations had not risen enough to emerge from the noise of natural variability, as well as changes in solar activity/volcanoes which played a role in the earlier times. Where I disagree with Judith is after 1950 or so, where natural forcing are pretty much flat (or even slightly negative).
I do not think it is as simple as a=b.The uncertainties in accounting for FF Emissions are around 6% eg Marland,and we also have to include natural emission peturbation in the fold as a result of O3 depletion eg UNEP 2011 CHAPTER 4
The observation-based inversion studies are subject to uncertainties in sampling and in the winds prescribed from reanalysis (Baker et al., 2006; Law et al., 2008; Le Quéré et al., 2007). Nevertheless these different types of analyses, including both models and inversion methods,
support recent reductions in Southern Ocean carbon uptake.
Taken together, this body of work suggests that the changes in wind stress over about the past three decades have reduced the net Southern Ocean carbon uptake by about 0.6–5 Gt (about 0.02–0.16 GtC/yr) compared to the trend that should be expected due to increasing atmospheric CO2. One context for these numbers is provided by comparison to full compliance with the Kyoto Protocol, which corresponds to a reduction of global carbon emissions of about 0.5 GtC/yr by 2012 (see Velders et al., 2007, and Chapter 5 of this Assessment). The dominant mechanism for a reduction in carbon uptake is generally thought to be stronger upwelling and subsequent outgassing
of natural carbon from the deep ocean induced by the wind stress changes (Le Quéré et al., 2007; Lovenduski et al., 2008; Hall and Visbeck, 2002). Note that both natural and anthropogenic carbon fluxes must be considered in assessing changes in the net carbon flux. Lenton et al. (2009) emphasized the dominant role of ozone depletion in driving the change in net carbon uptake in model simulations that explicitly tested the role of ozone versus other greenhouse gas forcings. Khatiwala et al. (2009) noted that only a small change (about 5%) in the ocean carbon sink is required to explain the observations.
The SO productivity was about 80% more efficent in the little ice age and the potential of the sink is around (ie high nutriient low chloropyll) 40ppm in less then 100 yrs eg Sarmiento 2011.
Hence we have a number of conmittant mechanisms,of which we can add anthropogenic predation in the SO.
CO2 had a ZERO effect in the early 20th century, according to the consensus/IPCC:
http://www.ipcc.ch/publications_and_data/ar4/wg1/en/fig/figure-ts-23.jpeg
why don’t you actually consult the IPCC report rather than making up your own conclusion based on eyeballing a graph? In fact the AR4 said that it was ‘very likely’ that the early 20th century warming was due to external forcing and ‘likely’ had an anthropogenic component to it. Right now it’s difficult to quantify the precise roles of anthropogenic vs. natural external forcings as well as internal variability for the earlier times, but it was probably largely natural. Attribution studies have consistently shown that it is mostly greenhouse gases, heavily supplemented by aerosol changes, since mid-century.
“AR4 said that it was ‘very likely’ that the early 20th century warming was due to external forcing and ‘likely’ had an anthropogenic component to it.”
No, AR4 said nothing like that, at least that I can find. Here is what AR4 says about the early 20th century warming:
Modelling studies are also in moderately good agreement with observations during the first half of the 20th century when both anthropogenic and natural forcings are considered, although assessments of which forcings are important differ, with some studies finding that solar forcing is more important (Meehl et al., 2004) while other studies find that volcanic forcing (Broccoli et al., 2003) or internal variability (Delworth and Knutson, 2000) could be more important. Differences between simulations including greenhouse gas forcing only and those that also include the cooling effects of sulphate aerosols (e.g., Tett et al., 2002) indicate that the cooling effects of sulphate aerosols may account for some of the lack of observational warming between 1950 and 1970, despite increasing greenhouse gas concentrations, as was proposed by Schwartz (1993). In contrast, Nagashima et al. (2006) find that carbonaceous aerosols are required for the MIROC model to provide a statistically consistent representation of observed changes in near-surface temperature in the middle part of the 20th century. The mid-century cooling that the model simulates in some regions is also observed, and is caused in the model by regional negative surface forcing from organic and black carbon associated with biomass burning. Variations in the Atlantic Multi-decadal Oscillation could account for some of the evolution of global and hemispheric mean temperatures during the instrumental period (Schlesinger and Ramankutty, 1994; Andronova and Schlesinger, 2000; Delworth and Mann, 2000); Knight et al. (2005) estimate that variations in the Atlantic Multi-decadal Oscillation could account for up to 0.2°C peak-to-trough variability in NH mean decadal temperatures.
http://www.ipcc.ch/publications_and_data/ar4/wg1/en/ch9s9-4-1-2.html
What text from the IPCC were you looking at. If they said “very likely” regarding this stuff, their expert judgment calibrator is way off.
The assertion of Chris Colose’s post is not supported by a fulltext search of Climate Change 2007: Synthesis Report (IPCC/AR4) for the keywords “very likely”.
A total of 20 instances of “very likely” were found, which refer to anthropogenic warming as occurring “since the mid-20th century”, not in the “early 20th century” as Chris’ posts asserts.
Conclusion: Chris is welcome to provide citations that document his post’s assertions. However, the text of the AR4 Synthesis Report differs significantly from Chris’ description of it.
Uptwinkles for a phys. What, are you trying to gain credibility around here with some fact-checking rather than with demagoguery?
My take is that everyone is ignorant about attribution. Except me, of course; I know it’s the sun, but don’t know how.
======================
“No, AR4 said nothing like that, at least that I can find. ”
Yes, it did said that:
“It is very unlikely that climate changes of at least the seven centuries prior to 1950 were due to variability generated within the climate system alone. A significant fraction of the reconstructed Northern Hemisphere inter-decadal temperature variability over those centuries is very likely attributable to volcanic eruptions and changes in solar irradiance, and it is likely that anthropogenic forcing contributed to the early 20th-century warming evident in these records.”
http://www.ipcc.ch/publications_and_data/ar4/wg1/en/spmsspm-understanding-and.html
Please read your sources more carefully so as not to mislead your readers, again.
That is a very different statement from Chris’ original statement
ds, ‘a significant fraction’ is …. ‘very likely’.
Not quite what you seem to think it says, because it really isn’t saying anything at all. As I say, we, all but me that is, are ignorant.
===============
Frame that quote as it reflects 99% of the skeptical viewpoint, which is blatant projection leading to a fake bravado (everyone is ignorant but me). Admitting to know little about how science works, yet they have some innate ability to prognosticate. Like Mosh says, they are mostly a bunch of wannabe Nostradami.
Hmmmph, that piker. He wasn’t anywhere near vague enough.
===========
Google books allows a search of 66 instances of “very likely” in Climate Change 2007: The Physical Science Basis (IPCC/AR4), and that search affirms:
• Colose’ post’s summary of AR4 is incorrect.
• ds’ post’s quotation is irrelevant (as Judith noted).
Note: an effective remedy for quibbling, cherry-picking, out-of-context quotation, incorrect attribution, and nonfactual rumors regarding AR4 — all of which regrettably are widespread on internet forums — is to search in any of the AR4 documents for the phrase “very likely.”
…”Admitting to know little about how science works, yet they have some innate ability to prognosticate. Like Mosh says, they are mostly a bunch of wannabe Nostradami.”…
This, from AGW scientists, ‘The Practicers of Prestidigitation’.
@Chris Colose: It’s probably true that CO2 had a secondary effect in the early 20th century, when concentrations had not risen enough to emerge from the noise of natural variability,
That’s for sure.
as well as changes in solar activity/volcanoes which played a role in the earlier times.
Interesting, can you quantify that, Chris? I’ve been unable to come up with a model that fits the data well yet regards either of these two as significant (other than the solar cycle of course which obviously has a big impact).
Where I disagree with Judith is after 1950 or so, where natural forcing are pretty much flat (or even slightly negative).
The model I presented at AGU in December showed “natural forcing” to be very negative from 1940 to 1975, much more than enough to offset global warming, then positive until 1995. The latter warming period accounts for approximately one third of the total warming over those two decades; by then AGW was contributing two thirds of the warming.
YMMV (Your Model May Vary). ;) It’s interesting the wide range of models one can see here. They can’t all be right!
The skeptics are divided on this point. Lindzen has stated that increases in GHGs explain most of the warming for the last 150 years, which agrees with the IPCC in effect. Others still disagree with the IPCC about the ‘very likely most’ statement.
@ Jim D | March 11, 2012 at 12:54 am
Jim D, you are referring to ”fake Skeptics” they believe 101% in the phony GLOBAL warmings. Real skeptic doesn’t believe that was any GLOBAL warming for the last 150years. Talking about the phony warming as real – doesn’t make it real. Not enough extra warming has accumulated for the last 150y, to boil one chicken egg. The fakes are busy doing the Warmist’ dirty job; no time to use logic and common sense
http://www.ipcc.ch/publications_and_data/ar4/wg1/en/fig/figure-ts-23.jpeg
This is the consensus, right?
Edim-
I think it’s a one of several lines of evidence that differentiates the anthropogenic, natural, and anthropogenic+natural forcings, and you really need that third one to explain the time evolution of global temperature. In particular, the anthropogenic+natural is a predominant anthropogenic component in the second half of the 20th century.
But it’s important to note that the agreement between modeled global mean temperature and observations is not how formal attribution is done (which requires looking at more detailed spatial and temporal patterns), and indeed the amplitude of the modeled result may not match due to uncertainties in aerosol forcing, climate sensitivity, or the rate at which the ocean takes up the radiative imbalance..
Chris, I just want to make clear when the anthropogenic effect got significant. Before ~1960 it was basically zero, according to IPCC. That’s good to know.
More specifically it was within natural variability until 1975 or so, and expected to be so (Hansen, 1981).
@chris colose
‘the amplitude of the modeled result may not match due to uncertainties in aerosol forcing, climate sensitivity, or the rate at which the ocean takes up the radiative imbalance’
Seems to be a very long-winded weaselly way of saying that the models are no good at forecasting temperatures. And since it is temperature that (supposedly) brings on all the ills that we are threatened with, we can conclude that the models are not very good at fulfilling their primary purpose.
So there is no reason to believe any of their output as reliable forecasts of the future.
Good to hear it said.
More specifically it was within natural variability until 1975 or so, and expected to be so (Hansen, 1981).
Exactly so.
Vaughan
As everything will apparently be resolved by 2100 one way or the other, it only requires that denizens select one warmist and one sceptic to be cyrogenically frozen now and then unfrozen in 2100, so by proxy they can stick out their tongue at the other and shout ‘I told you so!’ on behalf of their respective group.
All we need are nominations and some cash :)
tonyb
I was wondering where Joshua had gone. Perhaps somebody has anticipated your idea already…………..
Latimer
Youve guessed my guilty secret, It’s true about Joshua, but due to very limited funds I had to rent some freezer space at our local londis for him.it’s not ideal and I’m praying there won’t be a power cut. Peas be with him. :)
Tonyb
it only requires that denizens select one warmist and one sceptic to be cyrogenically frozen now and then unfrozen in 2100
Well, don’t look at me for that job, tonyb. I’m neither a warmist (in the CAGW sense) nor a denier (though I’m extremely “sceptical” as you spell it of everything people say about climate). Instead I’ve been looking at the rapidly rising costs to John Q. Public of buying fossil fuels (even worse in your neck of the woods than mine!), and working on an energy source for road and air that is less expensive all round, adds less carbon to the atmosphere, and gets your car from point A to point B much much faster.
Those running around claiming that any change in the energy status quo will cost the public 47 trillion dollars are selling something (I’d guess carbon). A change should save the public money, not cost it.
Battery technology isn’t going to accomplish that, we need something new that isn’t on anyone’s menu yet. Too few people are working on coming up with something truly new.
Freeze the ones who are talking about nuclear fission or no peak oil before 2100. We’ve got ’em on the list, and they’ll none of them be missed.
Dr. Pratt
as we say in ‘MonteNegro’
past is behind, learn from it
present is here, understand it
future is ahead, prepare for it
Extrapolation from the existing CET record, based on reconstruction of three recurring periods
http://www.vukcevic.talktalk.net/CET-NVa.htm
assumes that all major periodic external forcing (solar, planetary etc) is in the 350 year long data record already.
Does good job on the TonyB’s archive (data back to 1550) too.
Vukcevic, Central England has an area of no more than about 50,000 sq.km, representing about 0.01% of the area of the globe. Isn’t taking the CET as the basis for predicting the next century of global temperature a bit like taking 0.01% of the HADCRUT3VGL temperature from 1850 to now? That would come to 0.0162 years or about one week.
Perhaps there’s an argument to the contrary but right now I’m having difficulty seeing it.
Vaughan Pratt | March 13, 2012 at 1:13 am said: Vukcevic, Central England has an area of no more than about 50,000 sq.km, representing about 0.01% of the area of the globe.
Vaughn, in your comment you talk as a full blooded, honest Skeptic; what happened, are you ready to repent? Some honesty from me must have rubbed on you. Leave Vukcevic alone, he is a ”Fake’ but I don’t think that he is lying for cash like you; instead he is lying for ”feel good”
P.s. Vaughan, I came back to copy your comment; criticizing Jim D ”for replying to me” and admitting the truth on that subject. I have finished writing half of my second book; your comment criticizing him, and his comment telling the honest truth, will be in the middle of the book. Will be about 15-20 pages on how you people are scared from the truth / to what extent you will go to silence the truth / different tactics used, by different con artist… Everything I say; must have real proofs that can be proven now, not in 88 years. Cheers
Food enough to be acknowledged as a troll, STD. (Love that acronym, BTW.) But you’re in luck, one more peanut in my bag:
Vaughn, in your comment you talk as a full blooded, honest Skeptic; what happened, are you ready to repent?
So far I haven’t even pented.
Vaughan-your 1.13
Like your idea of trying to find some new sources of energy
As regards CET, it is mentioned as a good (but not perfect) proxy for global temperatures through a great number of scientific studies from such as Lamb, Bliss, Barrow, Hulme, Jones and Mann. I cited them in my article ‘the long slow thaw.’ I discarded another 10 or so studies confirming this correlation due to lack of space, so Vuks work is interesting.
tonyb
Tony, I’ve been avoiding taking CET seriously for the reasons I gave, in particular that it didn’t seem adequately representative of global temperature. If the opposite has been demonstrated and generally accepted I’d be happy to take CET more seriously.
So far the most concrete numbers I saw in your December post were Hulme’s correlation coefficient of 0.4 for CET with NH rising to 0.75 for decadal temperatures. These sound perfectly plausible, but then how about global? On this you said,
Any attempt to construct a single global or even Northern Hemisphere temperature covering many centuries will encounter substantial difficulties, as incomplete information from novel proxies will probably not adequately represent the extremes that are experienced at either end of the temperature spectrum, so what is considered the ‘average’ is possibly representative of no climate state that actually ever existed
Would you consider this to be the case for a shorter period, such as the 162 years covered by HADCRUT3VGL? If so, what do you mean by a “climate state?” In what sense is an annually or decadally averaged global temperature not a “climate state?”
After analyzing this dataset at length I concluded that “global climate state” for periods greater than 22 years (the Hale cycle) could be a very reasonable notion.
Dr. Curry – & Others: The ~1976 shift was of solar-terrestrial origin. It has to do with an abrupt shift in the relative temporally-cumulative alignment of solar activity with the seasons of the terrestrial year. I will clearly demonstrate this empirically when time & resources permit. The pattern is so clear that if people want to shout it down (and bear in mind that this is based on observation) there will be nothing left to do but shout back: “naivety, ignorance, functional numeracy deficiency, deception, politics, no proper respect for the beauty of nature, fiction’s more popular than non-fiction”.
Paul, we look forward to your analysis
Dr. Curry, your statement of “little warming since 1998” is more than a little misleading. You are of course referring to tropospheric temperature, which have certainly flatlined over the past decade, but the relatively low heat capacity (compared to the oceans) of the troposphere makes it far more open to natural variations (solar, ENSO, aerosols) and is a poor metric on decadal scales for overall changes in Earth’s energy balance, which is of course the real non-negotiable part of AGW. Looking at the biggest reservoir of energy on the planet, the ocean, we have of course seen no let up in the accumulation of energy over the past 40+ years, with in fact some acceleration of this accumulation in the past decade. From this broadest perspective, the Earth as an energy system has continued warming this past decade, quite in line with what would be expected from the contined accumulation of GH gases.
Shhh, don’t say a thing about ‘missing heat’.
===========
The point is, at least part of it is not missing at all, but what is missing at times is an accurate portrayal of has really gone on with Earth’s energy system over the past decade. If one always hold up the tropospheric temperatures as an indication, then it is fair to ask they would ignore the much much larger energy reservoir of the ocean? And note– global climate models can be wrong (and are according even to Trenberth) but AGW still very much happening.
Blah, blah, blah. The globe is cooling, oceans and atmosphere, R. Gates; for how long even kim doesn’t know.
===============
You are very entertaining Kim, really. Except for the fact that I doubt you have any data to back up our contention, or, if you do, the end points of your time frame are carefully picked to say whatever you want them to.
We have debated the issue of ocean heat content several times at CE:
http://judithcurry.com/2012/01/24/missing-heat-isnt-missing-after-all/
http://judithcurry.com/2011/01/07/wheres-the-missing-heat/
I disagree with your portrayal of our understanding of ocean heat content.
Dr. Curry,
I know that ocean heat content has been discussed here and those were very interesting. I too have reservations about the extent of coverage of data for ocean heat content, so If you have some data that would indicate that ocean heat content has not risen pretty steadily over the past 40+ years, I’d love to see it. Yes, the data (especially below 1500-2000 meters) is not a large sample, (a real travesty which is slowly being corrected), but so far I’ve not seen any data that would cause me to question the general trend as indicated by what data we do have. Even at abyssal levels, there seems to be confirmation that ocean heat content has been rising. Overall, leaving ocean heat content out of the “little warming since 1998” meme is missing the biggest heat reservoir on the planet, and I think leads to misconceptions about Earth’s energy balances, or imbalance as the case may be.
In the short-term, I will be interested to see what AGW skeptics come up with as an explanation if we get the short-term forcings of ENSO and solar to align with the longer-term forcing of increased greenhouse gases in the next few years and have more instrumental record warmth, a possibility I see as very likely between this year and 2015 or so.
It’s not an odd facination. Because radiative physics is well understood your pals find it the formidable force. It may be. We are just beginning to study other forcings. Oh let’s not; CO2 is the formidable force.
11 out of 10 Doug
Another tour de force clear-out play:
http://theoilconundrum.blogspot.com/2012/03/co2-outgassing-model.html
It’s not about chasing phantoms, it’s about simplifying the physics to extract the essence of what is happening. What people normally do is build upon what others have accomplished, until it comes crashing down, thus contradicting its worth, or it keeps on propagating in wave after wave of substantiating evidence. Occasionally you come across a simplifying view that condenses some aspect of the theory.
AFAIAC, erratic solar forcings are only noise that stochastically resonate the underlying feedback systems, of which CO2 plays a large part, along with other gases and albedo changes.
‘These results show that climate models possess internal mechanisms of variability capable of reproducing the current slowdown in global temperature rise. Other factors, such as data biases and the effect of the solar cycle (Haigh 2003), may also have contributed, although these results show that it is not essential to invoke these explanations.’
http://www.metoffice.gov.uk/media/pdf/j/j/global_temperatures_09.pdf
Because the output of the models match what we expect then there is no need to look at anything else!
Excellent points Chris. I would only add to the point about the “defenders of the consensus” that even, for example, Mann has written several previous papers related to looking at solar variations as they relate to both the so- called MWP and the LIA and some hints reasonable linkage. It is not that the solar component is being ignored at all, and, as it can be quantified, it is being added to the GCM’s (EUV effects on the stratosphere for example). The point is, a funny thing happened on the way to increasing CO2, N20, and methane to 30 to 40% above their 1750 levels– as these have increased, the added forcing first are roughly equal to and then start to overwhelm the other natural forcings. It seems sometime in the latter part of the 20th century the anthropogenic greenhouse forcing became the dominant signal upon which natural variations now ride. If greenhouse gases continue to rise at current rates, expect at least another 2C rise in global tropospheric temps by 2100 at the minimum with any new Maunder-type cooling to be limited to about -0.3C at the maximum.
” So, how many people are convinced that a reduction of solar irradiance comparable to the Maunder Minimum would translate to a cooling of about 0.1C?”
probably all those who knows that the Camp and Tung result is overestimated because they didn’t removed volcanic effect:
http://www.agu.org/journals/gl/gl0818/2008GL034864/body.shtml
My global cooling figures fresh from latest calculations show a
cooling of 0.1 ‘C for each of the coming decades to 2040,
thus GMT in 2040 of 0.3’C below todays GMT.
The Sun’s output itself, spot numbers, magnetism etc are not the
drivers and therefore keep small in effect, below a one time 0.1’C
in total.
What has to be taken into account is Nic Scafetta’s astronomic
Harmonic Model as driver, prominently displayed at the right hand side
of Anthonys blog….
Based on causes for and mechanisms of this 61 year lasting harmonic cycle, is is unmisakenly cleas that global temps will fall 0.1 ‘C each decade…
JS.
Scaffeta’s model is aphysical. A model that cannot hindcast, as his cannot, has only luck on it’s side for forecasting.
A simple test is this. Use Scaffeta’s model to see what it says about temps back to 1701. The first records. See what it says about the MWP, about the holocene. Garbage. Not science, not physics. Curve fiting numerology.
Nostradamus on crack.
To Steven:
You are behind in reading…this was discussed in January, and
Scafetta is working now on the hindcast to satisfy this demand….
After all: The DRIVING FORCES are the astronomic cycles of
61 years, they drive the climate and not the MODEL does a
driving…. my complain: Scafetta still left some AGW-Warmismus to
remain, a clear mistake, he should have thrown all Warmisms
out of the model….he probably did not dare, who knows…..
Look at the detailed mechanism of this 61 year cycle, (interesting: it
is completely missing in IPCC Warmist crap) ….. better: see
how its brings about heating/cooling for the 21 Cty and then you may
respond again with more substance in comment instead of acting stupid…..
[no physics, no garbage, no science….]
JS
But is has been shown by several people that there are no significant physical phenomena related to the 61 year cycle. All mechanisms that have been proposed for the influence of such cycles have been shown to be extremely weak, so weak that they cannot affect climate by best imagination.
Some apparent motion can be shown in the motion around the center of gravity of the solar system but all forces and other physical phenomena that could affect either the sun or the Earth are practically zero. That includes also tidal effects.
Pekka
You just fell into a basic logic trap.
Just because we do not know what natural mechanism was involved does not mean that we can automatically write off natural factors as the cause.
This is an “argument from ignorance” (“our models can only explain it if…”).
As you know, one natural mechanism, which is being experimentally tested today at CERN is the Svensmark cosmic ray / cloud hypothesis.
While the basic nucleation mechanism has been validated experimentally, it is still too early to tell what the magnitude of the impact in our climate system will be, and more work is going on.
Max
To Pekka:
The 61 year cycle exists/persists and is clearly detected as a strong
cycle (at the rate of about 15 + for all 1,000 time spans over the
Holocene……[lit: In the WUWT Nordhaus reply blog, the Davis and Bohling
graph: GISP Holocene Power Spectrum…]
If it had minuscule effect, it would not show strong in power spectra…..
…….
If you refer now to “SOME” WARMISTS “people” who exist (who?) and
talk this cycle down in strength without putting its mechanism, its cause, its inherent driving power on the table…..this is weak of you and shows you fell for Warmist garbage……please check the literature on cause, power and the strong heating/cooling mechanism of the 61 year harmonic cycle….and we can talk again…..
JS
J. Seifert,
I’m not arguing the existence of variability of the climate, I’m telling that the reason for that cannot be in the effects that Scafetta is proposing, because they are almost totally only artifacts of erroneous physics calculations.
To Pekka:
Scafetta took the Harmonic astronomical cycle and presented it
in a way still leaving Warmist nonsense in it, which I fully reject….
Firstly: All Warmists would try to hide this 61 year cycle because
another high strength warming/cooling force besides AGW would be
undesireable…..Therefore, ask first: Warmist Yes? No? Then
other questions….
The high strength 61 year cycle: This is decisive for all 21 Cty temps
forecasts, not TSIs, sunspots, magnetic fields, auroras y what not…..
The 61-year cycle forces Global Temps down 0.1 ‘C this decade and 0.2’C thereafter until 2040….as good as Amen in Church…
Just a few points to the cycle: The driving force of this 61 year cycle
impacts a steady continuing pace of global warming since the
LIA 1650 from a smooth upward going line moulding it into a
staircase-step-like increase, step after step on an about 0.4 ‘C
higher step levels…..
(in other words: 40 year flat step surface without increase is followed
by 20 year step increase to the next higher 0.4’C higher step level….
and so on and forth…[not indefinitely, only to year 2000 where after
the present top staircase plateau, the steps will go down into the
downward direction after 2060….].
…….since the 61 cycle is capable of converting a smooth warming
increase ino a Staircase-shape…. [lets be Warmist just for the
argument: A smooth 2.09 ppm AGW CO2-increase with a an
immediate smooth forcing would not result into a smooth increasing
temp graph as Warmist TAR, SRES, AR4 suggest , …..but :
……..now we know: “A staircase/stepwise increase….”.
A statistical analysis see:
Akasofu, S.-I: ON THE RECOVERY FROM THE LITTLE ICE AGE
(2010) in Natural Science 2, p 1211-1224 (2010) where you can see
the staircase temp effect of the STRONG 61 year astronomic cycle very clearly…..
Greetings to Finland….(sorry no more warming “in the pipeline”,
-another Hansen lie……
better cut some more wood…..)
JS
Max,
Astrology is the field of explaining various things by irrelevant coincidences in the positions of planets and stars. There just are no plausible physical mechanisms related to the Scafetta “theory”. That means that we are looking at astrology.
Saturn has an important role in his periods, but Saturn is too far to have any real effect. It influences the position of sun relative to the center of gravity of the solar system, but this has no comparable physical effect on sun. Sun is in “free fall” in the space as are all planets. Relative position in comparison with the center of gravity is irrelevant. There’s clearly some confusion on this point due to lacking understanding of physics.
Pekka: See my forceful 61 cycle reply further up…
JS
The tidal effects may be the flapping of butterfly wings.
================
But is has been shown by several people that there are no significant physical phenomena related to the 61 year cycle. All mechanisms that have been proposed for the influence of such cycles have been shown to be extremely weak,
What is understood is the solar cycle should have an effect on SST.The inverse is that peturbations in SSR due to say volcanics is widely used to explain anomalous behaviour( delayed rebound) in sst eg Hansen 2011.
That studies are limited in the literature with oceanic response seems to be the case,however some have found said signal eg Ramos-Rodr´ıguez et al 2010
In this study, during the last 61 yr two shifts to different “temperature
regimes” were detected along the coast of the eastern Pacific. This was carried out through analysis of monthly SST anomalies and using statistical tools, such as the regime shift detector (RSD). We found that the SST regimes were
clearly related to the solar activity, particularly to the amount of TSI and length and intensity of sunspot cycle.
Noteworthy is the relationship observed between TSI and SST: more energy was received at the top of the atmosphere during the second SST regime -which was warmer, than in the cooler first SST regime. As stated, the difference between SST regimes is 3×10^8 Jm−2.
http://www.ocean-sci.net/8/81/2012/
J. Seifert
Here is a nice 62 year cycle or at least ½ of it.
http://www.vukcevic.talktalk.net/AEc.htm
I see you are right up to date on astrophysics Pekka.
Good to see. Never knew that “”Sun is in “free fall” in the space as are all planets.”” myself.
But then, given the the Newtonian laws, I’d say the post normal astrophysics you speak of falls right in line with post normal climate science as well.
Pekka
Thanks.
I understand very well what astrology is all about.
I also understand that climate models cannot explain the early 20th century warming using the assumed natural and anthropogenic forcings.
Nor can they explain earlier cold periods, such as the one during the Maunder Minimum.
And they are scrambling all around to try to explain the current lack of warming, grasping at various straws, such as Chinese aerosols, etc.
The point is we do not know everything about what makes our planet’s climate behave as it does.
In fact, we do not know enough to be able to say with any certainty that human GHGs have been responsible for most of the warming observed since 1950, as our host here has pointed out repeatedly.
So it has nothing to do with “astrology”.
It simply has to do with our limited scientific knowledge.
Max
Pekka Pirilä
Re: “All mechanisms that have been proposed for the influence of such cycles have been shown to be extremely weak, so weak that they cannot affect climate by best imagination.”
Physics is not limited by “best imagination”.
Others have shows physical basis for such cycles based on gravity by the motion of the sun around the barycenter driven by the Jovian planets.
See: Ed Fix. Ch.14. The relationship of sunspot cycles to gravitational stresses on the sun
(Search for <Barycenter”) in
Evidence Based Climate Science 2011 Don Easterbrook Ed. ISBN: 978-0-12-385956-3
See also: Archibald – climate forecast to 2050M
On first reading, that appears reasonable. WJR Alexander, Nicola Scafetta and others base models on similar arguments.
Numerous others address the sun motion barycenter
If you have evidence that Fix’s model is unsupportable, please provide evidence or links to the contrary.
What’s the relevance of the barycenter. It’s just a point in the space. It has no direct influence on the sun, all influences must be due to something that influences the sun. Sun as a whole is in a free fall. It doesn’t know anything about movement around the barycenter or even acceleration in relation to the barycenter. The planets may affect the sun by the tidal effect, but that’s strongly dependent on the distance from the planet. There are also some other influences but all appear to be very weak and highly dependent on the distance from the sun.
Saturn affects essentially the distance of the sun from the barycenter. It does so, because it’s so far. Because it’s so far it has a very weak, really minuscule, tidal influence on the sun. All other mechanisms that anybody has proposed for the influence of Saturn are equally weak to the point of negligible.
What we have is an astrological class argument that there’s a period of 61 years, but no plausible physical mechanisms for it to be of significance. That makes this proposal to be at equal ground with any other periodic phenomenon anywhere.
There’s a approximately 60 year oscillation that has been observed in the climate. These two numbers are close to each other, but finding the same number with a large uncertainty in accurate agreement in two phenomena that cannot be linked in any other way is totally insufficient for being considered support for otherwise unsupportable theory.
Pekka, the barycenter is the center of mass. Solar system’s barycenter is the center of mass of the solar system. All the solar system bodies (including the sun) orbit this barycenter. The individual bodies have their barycenters too and only at these barycenters, the gravitational forces equal the inertial ones (“free fall”). The forces at all the other points are not balanced (tidal forces).
http://upload.wikimedia.org/wikipedia/commons/5/59/Orbit3.gif
Edim,
Do you think that I didn’t know that. My point is that the barycenter is just some point in space and that the variations in the distance from the barycenter are of no consequence for the sun. The basic error of the Scafetta “theory” is to claim the opposite. To support such a claim specific physical mechanism of influence must be stated. Analysis of all proposed mechanisms show that nothing significant has a period of 61 years, only some numbers not related with a relevant strength to any proposed physical mechanism.
It’s the task of the promoters of the theory to present either real mechanisms or strong empirical support or preferably both. This theory fails dramatically on all requirements. It’s just imagination without support.
All mechanisms that have been proposed for the influence of such cycles have been shown to be extremely weak, so weak that they cannot affect climate by best imagination.
I was wondering about that, Pekka. I had been considering proposing oscillations in the magma bringing hot material near the core closer to the crust. In view of the relative transparency of the oceans into the magma compared to the land, combined with the term “ocean oscillation,” this mechanism struck me as so plausible that it must have been proposed already. Such oscillations would certainly be strong enough, unlike for example geomagnetic secular variation which is far too weak.
So if you’re right about your claim, then I should propose the magma-oscillation mechanism.
But are you sure it hasn’t been proposed already? It seems far too obvious to have been overlooked.
What’s the relevance of the barycenter. It’s just a point in the space
While I fully agree with Pekka on this, I don’t understand the relevance of the solar system’s barycenter in the first place. It never even goes outside the solar corona, so even if Pekka were wrong and there was some relevance, its position varies far too little to make any difference to anything!
Vaughan Pratt
Edmond Halley, based on the observations of Henry Gellibrand (1634), believed four distinct magnetic cores rotated within the Earth, with cyclic influences on, well, everything.
Not explicitly your idea, as Halley predated modern understanding of the Earth’s core, but a plausible forebearer.
Thanks, Bart. Actually I’d be a bit embarrassed to learn that magma oscillations as the cause of ocean oscillations was my idea since I’d then have to improvise a compelling argument beyond merely “what else could it possibly be?”
Vaughan
Oh. Well, merely refining and extending Halley’s work is old hat for you, but for some of us it’s pretty impressive.
“What else could it possibly be?”
I’d like to proffer the hypothesis of the loose fiber optic connection.
I understand that niki is working to fix his problem. However, we have what we have. failure to hindcast. When he finishes his hind cast, the next question will be simple: what’s his forecast for SST, independent of LST.
what’s his forecast for precipitation, etc.
A “model” that can only forecast a gross higher metric is useless as a substitute
and unless he releases his data and code, as used, then he is worse than mann or jones ever were. his actions set back accountability and reproduceability. He is part of of the problem
Pekka says:
“It influences the position of sun relative to the center of gravity of the solar system, but this has no comparable physical effect on sun. Sun is in “free fall” in the space as are all planets. Relative position in comparison with the center of gravity is irrelevant.”
Are you sure? I think only centers of gravity are in “free fall” (I don’t like this explanation/analogy), other points (of planets) are not.
steven mosher: Scaffeta’s model is aphysical.
This argument always surprises me. Lots of models in the history of science have been aphysical, such as Kepler’s laws, the first Bohr model, and the Dirac equation. The inverse square law for gravitation is aphysical (that is, there is no physical reason why it should work that way, it just does), as is the Einsteinian assertion that the measured speed of light is independent of the relative motions of the measuring instrument and the light source — it proves out in the calculations, but it is certainly not explained by anything. How these things happen is a mystery: why does every “action” produce an “equal and opposite reaction”? If his model proves to make accurate predictions, then eventually a physical basis may be found. All you have said is that you can’t imagine how it could be true.
It’s as useless as Rutherford’s critique of Wegener’s hypothesis, or the thermodynamic argument against the Hodgkin-Huxley model of neural spking..
IMO, the argument itself is aphysical.
look at the functional form. calculate the minimum and maximum and observe whether it is physically possible.
For the same reason the climate cannot be a random walk since such an underlying model doesnt preclude physically impossible results.
steven
re “cannot hindcast”
Scafetta says that his model is able to take the second half of the data and hindcast the first as well as vice versa.
N. Scafetta, “Testing an astronomically based decadal-scale empirical harmonic climate model versus the IPCC (2007) general circulation climate models” Journal of Atmospheric and Solar-Terrestrial Physics, in press. DOI: 10.1016/j.jastp.2011.12.005. PDF
Furthermore, Scafetta bases his models on natural cycles which have physical bases.
If you believe Scafetta’s evidence is not supported, show the evidence, don’t slander by ad hominem attacks.
Dope. put in numbers and see how well it hindcasts the MWP.
That is what tells you that it doesnt capture underlying physics.
Look at what it would suggest for the LIA.
Scaffetta failed to have truely out of sample test. When you look at it
out of sample, you see it produces nonsense. That’s because it has nothing whatsoever to do with physics.
steve mosher
See below: Nicola Scafetta | March 10, 2012 at 11:26 pm
This Moscher really is a mean Warmist troll, some people should
be cut out from the blog if they do ad hominem lies…JS
On the contrary, the proposed harmonic model (which herein uses cycles with 9.1, 10–10.5, 20–21, 60–62 year periods) is found to well reconstruct the observed climate oscillations from 1850 to 2011, and it is shown to be able to forecast the climate oscillations from 1950 to 2011 using the data covering the period 1850–1950, and vice versa.
I don’t understand what it means for a model to either forecast or hindcast. If your model is a good fit to the whole period, how could it be a bad fit to either the second half or the first half?
Now if instead of a model Scafetta had a methodology for producing models, which worked well on each half independently as well as the whole period, that would make sense. But merely to say that a model forecasts and hindcasts well makes no sense.
You assume we understand solar well enough to create a model at this point. No were’re not there yet. Maybe never will be. Let’s give up now and make fun of anybody who tries.
Mosh, you so often say there the one and only real question is climate sensitivity. You can never get close to understanding climate sensitivity without understanding attribution. Surely you believe that there were forcings that caused climate change before man’s AGW was a factor? What are they. Solar is one very good candidate.
Of course, the assumption is that all these other factors were noisy inputs to the natural positive feedback forcing behaviors such as GHGs and albedo. So the historically erratic solar variations have become a stimuli that would stochastically resonate climatic movements about the steady state. We have now entered an era whereby these erratic solar variations are fighting it out with the man-made ones, and given a few more years of time series data, it will be pretty obvious which one predominates.
You can never get close to understanding climate sensitivity without understanding attribution.
…and moreover without having a precise definition of climate sensitivity that everyone agrees on.
The fundamental reason why climate sensitivity numbers are all over the shop is that most people don’t even both with the definition, and those who do rarely have the same definition.
Until people sit down and come to some agreement as to what this vague term “climate sensitivity” actually means, it will continue to be a nonsense term like “the length of a piece of string.”
don’t even both with —> don’t even bother with
Judith, You have introduced a huge subject, with, IMHO, a few very shallow papers. As I see it, I have absolutely no doubt that the main driver of earth’s climate is the sun; probably the sun’s magentic effects. Precisely how the sun affetcs climate, no one knows. It is just that the empirical data over the centuries seems to show what a huge effect the sun has; cf The Chilling Stars. And since I am convinced that the effect of adding CO2 to the atmosphere has a negligible effect on climate, this puts me at odds with the thrust of your comments.
Let me just add a comment which I think are important, and illustrates just how little we know. During the Maunder minimum, sunspots started disappearing around 1645. The coldest temperatures seem to have been recorded around 1685, some 40 years later. If Livingston and Penn are right, then sunspots might disappear somewhere around 2020, or probably a few years later. This means that if the sun is a major driver, and that what happens emulates the Maunder minimum, we cannot expect the coldest temperatures to occur much before the 2060’s. I have seen nothing that anyone has suggested as to why these timings could be anywhere close to being correct.
Two other points. I understand that those important people on the “Team” to further the “Cause”, saw to it that any solar research was starved of funds, to try prevent much being found out as to how the sun affects climate. Specifically, Henrik Svensmark was denied funds, and funds were delayed for Project Cloud. Notice also that the CERN employees were forbidden to comment on the CLOUD results. They were only permitted to report the actual measurements. So, I suspect, we know less about how the sun influences climate, than had the sort of funds which have been squandered on CAGW, had been put into finding out how the sun affects climate.
The recent solar flare apparently produced a Forbus Decrease of 15%. It will be interesting to see what effects, if any, this had on clouds.
wow another person who accepts without a lick of scepticism or error bars, centuries old ‘records’ of temperatures from a few places, made with un calibrated sensors. priceless
Heh, who knows whether the LIA was colder than now?
====================
watch skeptics become unquestioning believers when you ask that question. The driving force behind their doubt is not intellectual curiousity or methodological. They swallow whole swaths of science without chewing.
You stereotype.
=========
of course, but with Joshua gone somebody needs to carry the flag
steven mosher
I’ll go for the “hard” evidence that fresh water freezes below 0 deg C.
Lamb, H.H. Climate: Present, past and future. Vol. II. Tables App. V. 6 and 7, pp. 568–70, (London: Methuen, 1977)
See also: And you think this is cold… the great chills of history left the Thames frozen and snow piled to the rooftops
If you have better “hard evidence” to the contrary, please provide it.
“The driving force behind their doubt is not intellectual curiousity or methodological.”
What is the driving force then?
Mosh,
Hello mirror! Your distain for understanding other forcings (like the ones that forced climate change for hundreds of millions of years before AGW) is as irrational, probably more so, than those you criticize. Prediction- there will be many shallow papers and false leads in the attempts to understand the other forcings. Feel free to criticize those, but not the quest to understand.
There certainly seems to be a lot of ‘cultural’ evidence from contemporary accounts that it was an unusually cold time. Those who claim it wasn’t have to explain that evidence.
it is at least as reliable as the Mannian torture of statistics to show that it wasn’t.
The vegetation being revealed by receding ice in the Antarctic Peninsula, northern Canada and Russia all seem to date back to the MWP (and we are still nowhere near the temp necessary for the reformation of such plant life). We also know that Sweden was able to march it’s army strait to Denmark during the LIA. But of course, the Hockey Stick tells me this simply could not have happened
It would be nice to know the exact temperature during these events but that number would not alter these facts.
Damn…… Straight!
As I see it, I have absolutely no doubt that the main driver of earth’s climate is the sun; probably the sun’s magentic effects
But Jim, those magnetic effects occur on a regular 21-year cycle. This can certainly have a major effect on periods that are half a cycle apart. But how can it have any influence at all on temperatures several cycles into the future???
The Vostok ice cores since 400,000 BP cover 20,000 magnetic cycles of the Sun, and in all that time the CO2 never ventured outside 180-300 ppmv. In the past 54 years CO2 has shot up from 314 ppmv to 394 ppmv. If you set the blade of a hockey stick at that angle it would be unusable!
The Sun’s magnetic effects are no more relevant to the temperature in 2100 than either the daily or annual temperature fluctuations.
Earth has entered and exited glacial periods for which there is little explanation.
Our hot sun, our wet earth are tugged and pulled by galactic and planetary orbits by means we can not describe.
Looking for climate change under the CO2 lamp post, when the key may be 93 million miles away seems to be the height of incredulousness.
Yet the ardent adherents of the trace gas radiative transfer model do so to their last gasp.
“Richard Cory” a poem by:
Edwin Arlington Robinson 1897
If global mean temp fell by at least 0.8 degC from the peak of the MWP to the trough of the LIA without any AGW to influence things surely that’s the starting point this time?
If the Sun’s influence / output falls by the same amount why, all other things being equal, wouldn’t global temps fall by the same next time around?
Other factors such as CO2 forcing can be added but my concern is that if we are headed for another LIA and temps fall by at least 0.8 degC from there current levels the world is going to be a much less hospitable place.
Also, given that solar cycles are much shorter than 500 or so years I’m concerned that whatever mechanism an inactive Sun uses to cool the planet will have a very abrupt impact – if the impact of the mechanism was 0.8 deg C over 500 years and it actually only affected a comparitively short period, the impact must have been massive and by implication brutal. All other things being equal, of course.
cause all things are not equal: volcanoes for one.
for another our understanding the the temps in the LIA isnt exactly perfect.
unless you believe every anecdote you read
steven mosher
Our understanding of the cruel winters during the 30-years war, the cold, wet summers, the crop failures and famines during this period is well documented historically – but isn’t any more perfect that our knowledge of global temperature prior to the 1980s.
NASA has estimated that temperatures during the Maunder Minimum were 0.5 to 0.7C colder than prior to or after this period (or about 1.3 to 2C colder than today). Other estimates put it slightly colder.
At any rate, these estimates show that the studies cited by Judith (0.1C to 0.3C colder than today) are most likely understating the potential impact of a new Maunder Minimum.
But you are right. We do not know.
Nor do we know what the impact of doubling CO2 would really be.
To paraphrase your quote:“unless you believe every model simulation you read”
Max
calibrate those stories mate.
how many stories? how many places? how were the measurements taken? man it was cold in my youth, we walked 40 miles to school in weather so cold that penguins froze.
and what was the distance between these “measurements” shorter than hansens 1200km? right.
we know to a first order that doubling C02 will get you about 1.2C.
paintings from the past, dubious un calibrated, sparse, un verifiable anecdotes, dont measure up epistemically speaking.
http://www.vukcevic.talktalk.net/CET1690-1960.htm
Is the ~1.2 °C from the radiative effect only steven?
Interesting point. If the LIA didn’t happen after all then finding something to caliberate to it is a wild goose chase.
Having said that, if it did happen and it was localised (Europe and parts of Asia) rather then truly global, for the impact to be so pronounced in the proxy records as well as art, anecdotes, stories, etc., then it must have been terrible.
Or maybe the proxies aren’t very good and the correlation to the contemporary evidence and solar minimum is accidental.
Steve, you think temperature reconstructions based on tree ring density are better then written records that document the loss of the orange groves in Jiang-Xi province or the Bishop of Geneva’s journey to Chamonix to performed a rite of exorcism on an advancing glacier?
+1 DocMartyn. +1 mate. The absurd attempts of warmist numpties to ignore documented history, to pass it all off as the work of amateurs, or mere anecdotes, is really pathetic.
Doc u miss the point.
What I am suggesting is that very few skeptics look at the LIA records skeptically. Look you have the village vuk suggesting that CET is a global record. You yourself suggesting records from one region. Hansen extrapolates 1200km and you guys throw a fit. When you get a chance you extrapolate the entire global from a painting, a thermoneter in a tiny island nation, and some uncalibrated un verifiable scriblings. I want those LIA stations photographed.
steven mosher
It appears that you are not particularly fond of historical data, referring to it as “anecdotal”.
There were no computers around back then (during the Maunder Minimum). But, in the civilized parts of the world at that time, there were people writing records.
Solar scientists have figured out that the sun was “unusually” inactive for an extended period of time.
And historical records from Europe tell us of cold, wet summers, harsh winters, crop failures and famines. Some even blame the 30 years war (also confirmed by historical records) on the effects of the cold climate.
Chinese history also tells us of a prolonged period of harsh weather leading to empty granaries, famines and pestilence, and finally to the Manchu invasion and the end of the Ming Dynasty.
Nope. There were no historical records from central Africa, from Australia or even from North or South America.
But we have no reason not to conclude that the colder climate across the civilized world did not also extend to the parts where there were no records being written, i.e. we are most likely talking about a global period of colder than normal climate, which coincided with a period of very low solar activity.
Correlation does not prove causation.
But that also holds for the premise that the increasing levels of GHGs since 1950 were the principal cause of the observed temperature increase since then.
We can conclude, however, with some degree of certainty, that if we were to have another extended period of extremely low solar activity, such as during the Maunder Minimum, that it would result in a significant global cooling, such as was experienced during the Maunder Minimum, right?
And that is what the topic of this thread is all about.
Max
Mosher you want the LIA stations photographed? My sides. Glib nonsense, mate. You mightn’t respect the weight of painted and written history but it’s there and it’s an accurate an unbiased record because it merely describes weather being experienced at certain times. That’s it. Cold, hot. Nothern hemisphere. Southern. Whatever. Trying to equate the historical record, an utterly unbiased record stretching back hundreds of years and written by disparate unaligned sources, with Hansen’s ridiculous 1200 km extrapolations is a desperate fail. Hansen makes stuff up on the fly to suit his ridiculous ‘we’re all going to die’ warmy beliefs. He is a walking definition of bias. The historical record has no such motivation to bias.
Mosh
You refer disparagingly to to ‘village vuk’ suggesting cet is a global record.
Can I refer you to section 6 of my study ‘the long slow thaw’ entitled
‘can cet represent a wider geographical area.’
You can dismiss thousands of contemporary records all you like and sneer at paintings but there is a huge archive of records telling us what it was like during the lia.
As for cet, lamb, who studied the records assiduously, said
‘…they provide a reasonable indication of the tendency of the global climate.’
Before you dismiss lamb, the same was said by bliss,Hulme, barrow,Lockwood, oldenburgh of knmi, Philip jones and michael Mann.
Cet is not perfect but pretty good as a global record, and to dismiss the studies that confirm this whilst airily dismissing anecdotal accounts when they are in context is hardly scientific is it?
Tonyb
The ancient vegetation being revealed by the receding ice in the Antarctic Peninsula, northern Canada and Russia is not anecdotal.
One of the astonishing ironies of this CO2 obsession is that warmists’ have implicit faith in their model-generated predictions of the ill-effects of CO2-induced climate change, but dismiss clear evidence of past climate change as ‘anecdote’.
@TomFP One of the astonishing ironies of this CO2 obsession is that warmists’ have implicit faith in their model-generated predictions of the ill-effects of CO2-induced climate change, but dismiss clear evidence of past climate change as ‘anecdote’.
This would be a fair criticism had Charles Keeling not had the foresight to set up a CO2 observatory on Mauna Loa. Climate skeptics can no longer credibly claim that reports of increasing CO2 since 1958 are merely “anecdotal.”
The positively vitriolic debate over “past climate change” over the past several years hardly bears out your claim of “clear evidence” unless you insist that everyone on McIntyre’s side is a brilliant scientist while everyone on Mann’s side is a liar and a cheat, which seems to be how “clear evidence” is understood by one side of this debate. Sorry but I don’t buy your concept of “clear evidence.”
we know to a first order that doubling C02 will get you about 1.2C.
Steven, is this completely independent of the time taken to double CO2? If so, why? If not, can you quantify even to within a factor of ten how climate sensitivity depends on that time?
Arrhenius based his doubling principle on geological data for which the doubling time was many thousands of years. It never occurred to him (so far as we can tell from what he wrote) that we might soon see a doubling time on the order of a century or less. All bets based on 19th century reasoning are off for the 21st century.
“Something” caused the planet to cool sharply during the LIA. By how much obviously can’t be known and how widespread the cooling was also up for discussion.
Are there any reliable records of what else, other than solar activity, altered so significantly during that period?
steven mosher: understanding the the temps in the LIA isnt exactly perfect.
Is “understanding” the main contention? I thought that the main contentions concerning the warming periods and the LIA was whether they were warmer/cooler than today, with “understanding” to come later.
Brian,
The sun is probably a minor player in explaining LIA coolness, see e.g., http://www.agu.org/pubs/crossref/2012/2011GL050168.shtml
Chris
Other studies do not concur with your opinion that
Max
They are not easily going to let go the meme of “the sun does it all”.
I don’t think too many skeptics say the sun does it all; volcanoes and natural internal variability are also considered to be important. Their concern is with people that say “AGW does it all.”
Can’t we please move on from strawman characterisations?
I am not aware of any mainstream scientist claiming that ‘AGW does it all’. Personally, I have published on volcanic, solar, the 8.2kyr event, the PETM, ozone, aerosols, orbital forcing and internal variability, and all of these are assessed in IPCC. From his 1981 paper to today, Hansen has always discussed solar and volcanic forcing. Thus if this was really the concern of the sceptics, you’d think they’d be happier with us. ;-)
Contrast that with Scafetta who thinks that there is no internal variability and no volcanic effects, and that, apart from a mysterious quadratic trend which disappears in 2000, planetary cycles ‘do it all’. Prior to that he thought that 11 and 22yr cycles ‘did it all’. Call me sceptical either way.
What is really needed is for the IPCC to more seriously look at 20th century attribution, and this would include looking at a range of volcanic and solar forcing reconstructions. “Most” is not a particularly useful concept in context of trying to understand the role of natural vs anthropogenic forcing. And the insistence that pretty much all of the 20th century variability is forced is not useful, with the almost complete dismissal of the possibility of the multidecadal ocean oscillations such as PDO in the attribution argument.
I think both represent the extremes, and certainly not consensus. But you are right to point out the contribution to the future climate uncertainty that must be factored in by our lack of understanding all the pieces related to solar effects, direct or indirect. Even Mann’s previous research into the Maunder minimum and LIA:
http://www.sciencemag.org/content/294/5549/2149.short
Would find some solar connection to the cooling, and combined with the more recent volcanic research and the LIA, we see that the solar effects are not the full story, i.e. the sun doesn’t do it all.
Interestingly, in that study cited above, Mann found that the global temperature effect from the LIA cooling was .3 to .4C. So if we assume some was from the reduced solar activity and some from volcanic activity, we could see how something in the range of 0.2C decrease for a new Maunder minimum is not an unreasonable estimate. Considering that an additional 2C rise by 2100 due to anthropogenic greenhouse gases is also not at all an unreasonable estimate (perhaps a tad low), then the perspective that the solar influence from a Maunder-type minimum in the 21st century will be a magnitude lower than AGW is also quite reasonable and would be my personal perspective.
Gavin, does it mean that CO2 is not the Knob?
No it means that everything else is noise. Yet noise is not to be dismissed. What people do not tend to understand is that noise is the driver in most models of natural variability. The noise, if large enough, will trigger the processes that can stochastically resonate. Taken together, all the various noise sources from volcanic to solar provide enough variety that the main positive feedbacks such as GHGs and albedo will show a significant signal at some point. In the natural world, this point will likely occur unpredictably as the various noise signals reinforce each other and then cause the positive feedback to take effect. That is the basis of the currently-in-vogue stochastic model of climate variability.
IMO, it is really chasing phantoms to ascribe it to any one cyclic activity, since as soon as several potential sources are involved, any remnants of periodicity will get lost in an acyclic apparition.
Maybe they had it wrong calling CO2 the control knob, as it more properly operates as the amplifier, while the pot-sliders on the mixer console control the strength and sources of the noise inputs.
“What is really needed is for the IPCC to more seriously look at 20th century attribution, and this would include looking at a range of volcanic and solar forcing reconstructions.”
IPCC assesses the literature that exists. That literature shows that it is hard to say very much that is clear about the the early 20th C because of the uncertainties in solar and aerosol forcing and lack of multiple lines of evidence related to internal variability (no ocean heat content data, poor data availability in southern hemisphere etc.). So I’m puzzled as to why you think something more exciting will emerge in AR5. I’m all for people trying different forcing histories (see Schmidt et al, 2011; 2012) – but it won’t change much in this case.
” ‘Most’ is not a particularly useful concept in context of trying to understand the role of natural vs anthropogenic forcing.”
‘Most’ isn’t a concept, it is simply a description that fit (and one that isn’t that obscure). The IPCC statement in question is not the only thing that could have been correctly said, and neither can you conclude that anything not said by IPCC necessarily incorrect.
“And the insistence that pretty much all of the 20th century variability is forced is not useful, with the almost complete dismissal of the possibility of the multidecadal ocean oscillations such as PDO in the attribution argument.”
No-one is insisting on this (except Scafetta, but I presume you are not talking about him). Instead, for long-term (ie. multidecadal variations), all of the evidence is that there aren’t large (>0.2 deg C) unforced trends in global mean temperature (though regionally there are bigger changes). If you think you have evidence to the contrary, present it. Your evocation of the PDO is strange though – that is specifically defined as the departure from the global mean, and so doesn’t play a role in defining the global mean changes.
Additionally, during the 1910-1940 period you have highlighted as being important to assess, the Pacific temperatures are neutral to cooling (at least in HadSST) – almost all the warming signal is in the Atlantic/Arctic regions.
And the CMIP experiments are not conducted for the IPCC? And in the absence of such experiments as I describe, the IPCC should not be providing “very likely” confidence assessments regarding 20th century attribution.
I don’t expect much more from the AR5, although I thought overall the design of the CMIP5 simulations was better than the CMIP3 simulations.
In terms of 20th century attribution, natural internal variability gets one sentence in Ch9 AR4: http://www.ipcc.ch/publications_and_data/ar4/wg1/en/ch9s9-4-1-2.html
“Variations in the Atlantic Multi-decadal Oscillation could account for some of the evolution of global and hemispheric mean temperatures during the instrumental period (Schlesinger and Ramankutty, 1994; Andronova and Schlesinger, 2000; Delworth and Mann, 2000); Knight et al. (2005) estimate that variations in the Atlantic Multi-decadal Oscillation could account for up to 0.2°C peak-to-trough variability in NH mean decadal temperatures.”
“Most” obscures the key scientific debate regarding the relative proportions of anthropogenic forcing vs natural variability.
And decision makers don’t seem to find it useful either:
“For the past 20 years, scientists have been content to ask simply whether most of the observed warming was caused by human activities. But is the percentage closer to 51 percent or to 99 percent? This question has not generated a great deal of discussion within the scientific community, perhaps because it is not critical to further progress in understanding the climate system. In the policy arena, however, this question is asked often and largely goes unanswered.”
http://www.cnas.org/files/documents/publications/Lost%20in%20Translation_Code406_Web_0.pdf
Gavin
You assert that pacific temperatures in that period are neutral to cooling. Did you link to the correct graph, I can’t see that at all. Anyway the amount of instrumental readings is rather small for much of the period
Tonyb
The “early global brightening” eg Ohmura 2009 is not consistent with climate model simulations of the IPCC 4AR (Romanou et al., 2007).
The common-sense reason for this question’s relative neglect is that three factors are steadily increasing the percentage of warming that is AGW:
• Ongoing increases in CO2, and
• Ongoing warming of the oceans, and
• Saturation of aerosol cooling.
The common-sense implication is this: however large the percentage of warming due to AGW has been in the last fifty years, that percentage will only become steadily in the next five hundred years.
Thus, few ask the question because most know the answer.
Elevator Answer: The percentage of warming due to AGW is destined to be far closer to 99 percent than to 50 percent.
This observation is irrelevant for the discussion of climate policy, because the likely main reason for that is the lack of persistent natural warming.
The question on the share in the past warming is, on the hand very relevant as it is another way of expressing the question on the strength of transient climate sensitivity.
“From his 1981 paper to today, Hansen has always discussed solar and volcanic forcing.”
Yes, Hansen discussed solar and volcanic forcings in the cited paper. And what was his conclusion?
From the abstract:
“Variations of volcanic aerosols and possibly solar luminosity appear to be primary causes of observed fluctuations about the mean trend of increasing temperature. It is shown that the anthropogenic carbon dioxide warming should emerge from the noise level of natural climate variability by the end of the century, and there is a high probability of warming in the 1980s.”
According to Hansen, solar, volcanic and other non-CO2 forcings cause “fluctuations about the mean,” and create “noise” from which the “anthropogenic carbon dioxide warming should emerge.”
Now I’m no climate scientist, but that sure looks like Hansen was claiming that CO2 causes the increase in the mean “global temperature” and that other forcings are incidental.
Sure enough, in figure 7 of the paper, Hansen showed a graph which compared projections based on “natural climate variability” – flat with error bars allowing for some warming or cooling, and with projections based on “CO2 warming” – a slightly flattened hockey stick of warming.
Hansen did indeed “discuss[] solar and volcanic forcing” in his paper, but only to dismiss them as a cause of long term “global warming.” In other words, the Hansen 1981 paper directly and explicitly supports Dr. Curry’s statement that “AGW does it all” as far as the long term warming trend predicted by the Hansen.
a physicist said:
“The common-sense reason for this question’s relative neglect is that three factors are steadily increasing the percentage of warming that is AGW:
• Ongoing increases in CO2, and
• Ongoing warming of the oceans, and
• Saturation of aerosol cooling.
The common-sense implication is this: however large the percentage of warming due to AGW has been in the last fifty years, that percentage will only become steadily in the next five hundred years.
Thus, few ask the question because most know the answer.
Elevator Answer: The percentage of warming due to AGW is destined to be far closer to 99 percent than to 50 percent.”
____
Excellent response, except your final line I would edit slightly in the non-Elevator answer to be:
“The percentage of longer-term Earth system warming due to direct and indirect effects (i.e. positive feedbacks) of anthropogenic greenhouse gas emissions is destined to be closer to 99% than 50%.”
I don’t think the IPCC or BEST or any other AGW promoter takes solar influence seriously.
They pretend to. And they never collect or present sunshine or solar data seriously. And meteorological organizations would collect more sunshine data, not less.
http://sunshinehours.wordpress.com/2012/03/11/sunshine-and-temperature-in-alberta-canada/
“And the CMIP experiments are not conducted for the IPCC?”
Yes and no. CMIP is organised directly by the climate modelling community (not IPCC) and while they hope to have some input into the next IPCC assessment, CMIP5 will continue as a live project for a number of years, well beyond any IPCC deadline.
“And in the absence of such experiments as I describe, the IPCC should not be providing “very likely” confidence assessments regarding 20th century attribution.”
I would suggest rather that an assessment should use the balance of evidence to decide whether these issues are relevant or not, and what impact they might have. It is simply not the case that attribution for recent decades is impacted by attribution of earlier events.
“In terms of 20th century attribution, natural internal variability gets one sentence in Ch9 AR4: http://www.ipcc.ch/publications_and_data/ar4/wg1/en/ch9s9-4-1-2.html“
This is simply not true. There are discussions in 9.1.1; section 9.1.2 is all about distinguishing internal from forced variability, and internal variability is discussed throughout Chapter 8. Even in 9.4.1.2 there is more than just the line you quoted (i.e related to ENSO-like decadal variability). Section 9.4.1.3 is dominated by internal variability too.
““Most” obscures the key scientific debate regarding the relative proportions of anthropogenic forcing vs natural variability.”
Not really.
“And decision makers don’t seem to find it useful either”
This is a completely separate issue. I find that policy makers are most interested in questions related to the effects of specific policies across whole swathes of impacts and that the science often needs to be honed to answer those kinds of questions more precisely – most successfully in the UNEP report on BC and tropospheric ozone. But one kind of question does not preclude the other.
Which brings us right back to the beginning – mainstream science is can’t be claiming that ‘AGW does it all’ if we spend our time writing papers about natural climate variability and multiple non-CO2 forcings….
@Gavin Can’t we please move on from strawman characterisations?
Great to see not just one but three comments here from Gavin, and all at once. If more “leftists” (“warmistas” if you prefer) post and comment on CE it could get quite respectable from the media’s perspective.
The biggest benefit I see of having a sort of DMZ of climate change here is that the “swing voters” who drop by get to assess the logic of the two sides of the debate from a more neutral standpoint than they can hope for from either either WUWT (which ridicules warmistas) or blogs like Gavin’s RC and Grant Foster’s ironically named “Open Mind” which delete comments judged too heretical. Props to JC for maintaining a spirit of open debate.
Personally I feel that climate denial rests on pretty fragile logic. Unfortunately (or fortunately depending on which side you’re on) so does a lot of “warmista” reasoning. The subject is proving to be very interesting in terms of how convincingly each side can make their case. The Stanford Law School has found it very interesting and they may have something to contribute in due course.
Fascinating to see how this debate is evolving, particularly given how one would be hard pressed to find a vocal climate skeptic at a geophysics or meteorological meeting like AGU FM or AMU.
I would say science has not been criminalized like this since Darwin’s day! The irony is that Apple just passed ExxonMobil in size, which for Greenpeace fanboys of Apple is like God wrestling the Devil to the ground. :)
ExxonMobil has committed $100M to us for our work on energy at Stanford, of which they’ve already given us half. So if you were to ask me to choose between the devil and the deep blue sea I’d say screw Greenpeace’s deep-blue-sea vision. ;)
Gavin
Since you happen to stop by, can you give your view on almost identical CET trends during two 50 year periods shown here:
http://www.vukcevic.talktalk.net/CET1690-1960.htm
Yes, the CET and the global temperatures do correlate well during the entire GISS record.
http://www.vukcevic.talktalk.net/CGNh.htm
I suspect you may not whish to respond publicly, but if you wish to know more about the NAP (lower graph in the second link) you got my email, and as you know from the past correspondence, the data I use are easily verifiable as correct.
I like that study, but it relies to a notable extent on what climate simulators say about the effect of volcanic eruptions (the Zhong paper).
If I go through the literature (studies on modelled responses to Pinatubo, the works by Timmreck and colleagues, the twitter discussions on Mike Mann’s latest NatureGeo paper), it appears that the simulators possibly overestimate the effect of the eruptions. Then, the question becomes: How cold was the LIA really (from a global or hemispheric point of view)? (If I assume, that the sun indeed was a minor player.)
See this earlier paper on the LIA by Mann for some interesting global temperture comparisons:
http://www.meteo.psu.edu/~mann/shared/articles/littleiceage.pdf
Meh, this is the Piltdown Mann not long after he got rid of the MWP trying to get rid of the LIA. He did so by claiming it was just regional.
=====================================
Kim, you seem to have not read the study, or others by Mann on the subject.
Your SuperMann is still trying to find his way out of the telephone booth.
=============
The northern hemisphere dominate reconstructions do more clearly show anthropogenic impact, but don’t seem appropriate to determine which anthropogenic impact is the greatest.
http://i122.photobucket.com/albums/o252/captdallas2/SSANuekumetal2010.png That is the Southern South American Reconstruction by Neukum et al. 2010. I would think it would provide more information on ocean heat uptake. There seems to be a lag of approximately 30 years which could appear to be the 60 to 61 year cycle some are trying to relate to solar.
The impact of solar and volcanoes should depend on how close the Earth is to equilibrium. With a lag between ocean and atmospheric equilibrium, it should be pretty easy to pin attribution on any of the regular suspects you desire.
Since the Antarctic mid-troposphere temperature is decreasing, the prolonged solar minimum should have a pronounced southern hemisphere influence. The minimum will amplify the southern hemisphere thermal inertia.
It will be interesting to see how the different groups interpret the events of the next decade or so.
However much you may hate the concept of peer review, kim, it’s here to stay. Not to say I don’t appreciate your cute epigrams, but science does not live by epigrams alone. You’re like the emperor with no clothes other than a really fine hatful of epigrams. See if you can get one of them past peer review.
cd There seems to be a lag of approximately 30 years which could appear to be the 60 to 61 year cycle some are trying to relate to solar.
Solar vs magma. I’m the magma guy, cd, happy to put my magma up against their solar, or any alternative you have. May the best model win. :)
WTF?
Is this conversation real?
“Using …. total solar irradiance, the likely reduction in the warming by 2100 is found to be between 0.06 and 0.1 K, ”
Two more papers stating the obvious?
I though most research/historical records agreed that it is unlikely TSI varied much and, if so, then these two papers (and most of this discussion) seem to be “gilding the lily”.
We now have a new, totally not understood mechanism/theory, with support from CERN, that directly impacts the little understood creation of clouds,
=> the vast “unaccounted for” in climate simulations.
Making any sort of statement about solar minimum without acknowledging Svensmark’s theory would definitely appear to be grant grubbing.
Susan
Agree100%.
CERN has experimentally demonstrated the cosmic ray cloud nucleation mechanism as was recently announced.
Work is now going on to determine the magnitude of the impact of this mechanism in our climate system.
This may well demonstrate, based on empirical data derived from actual reproducible experimentation, that the IPCC assumption is basically incorrect on the relative magnitude of solar versus anthropogenic forcing, because it only considers the forcing from direct solar irradiance alone.
If so, it would be a definite “game changer”, because it would falsify the IPCC claim that “most” of the warming since 1950 was from human GHGs, and hence all the IPCC projections for the future, which are based on this premise.
Nax
Judith Curry
Thanks for a very interesting summary of what’s new on the solar side.
You ask:
It appears to me that Jones et al. and Feulner & Rahmstorf both underestimate the impact of another “Maunder Minimum” at 0.1°C and 0.3°C, respectively. Both papers essentially follow the IPCC line of reasoning, considering only measurable direct solar irradiance and ignoring any other possible solar forcing, where we do not yet understand the mechanism (possibly related to clouds and/or ocean currents).
As you put it: ”there has been an implicit assumption by the IPCC that natural forcings are of minor importance”.
What empirical evidence do we have that the solar impact is greater than that one could estimate from changes in direct solar irradiance alone?
As you have mentioned, we have the early 20th century warming most recently. Even considering the unusually high level of 20th century solar activity (highest in several thousand years), this warming cannot be explained by anthropogenic forcing and total solar irradiance alone.
Then there is the Maunder Minimum, itself, a period during which global temperature dropped by an estimated 0.5°C to 0.7°C according to NASA (or 1.3°C to 1.5°C below today’s temperatures).
http://earthobservatory.nasa.gov/IOTD/view.php?id=7122
Historical evidence of crop failures, cold, wet summers and severe winters points to a larger global cooling, as much as 2°C to 3°C on average below 20th century average temperatures.
There have been a number of studies by solar scientists, which have concluded, on average, that around half of the warming we have seen since the 19th century can be attributed to the unusually high 20th century solar activity.
Stockwell (2011)
http://vixra.org/pdf/1108.0020v1.pdf
Shapiro et al. (2011)
http://arxiv.org/PS_cache/arxiv/pdf/1102/1102.4763v1.pdf
Scafetta (2010)
http://www.fel.duke.edu/~scafetta/pdf/scafetta-JSTP2.pdf
Stott et al. (2003)
http://climate.envsci.rutgers.edu/pdf/StottEtAl.pdf
Geerts and Linacre (1997)
http://www-das.uwyo.edu/~geerts/cwx/notes/chap02/sunspots.html
Lean et al. (1995)
http://www.geo.umass.edu/faculty/bradley/lean1995.pdf
Scafetta + West (2006)
http://www.scribd.com/doc/334163/Phenomenological-solar-contribution-to-the-19002000-global-surface-warming
Solanki et al. (2004)
http://cc.oulu.fi/~usoskin/personal/nature02995.pdf
http://www.ncdc.noaa.gov/paleo/pubs/solanki2004/solanki2004.html
This compares with an IPCC estimate that only 7% of the total forcing was caused by natural (i.e. solar) factors, with 93% attributable to anthropogenic forcing.
So back to your question:
Not me. I’d say that the overwhelming empirical evidence points to a much greater cooling (10 to 15 times the postulated 0.1°C) during the Maunder Minimum, which would repeat itself directly if there were a new comparable period of low solar activity.
Whether or not it would be slightly mitigated by the fractions of a degree of warming impact theoretically expected from anthropogenic GHGs is a moot question, which no one can answer. I would not count too much on it.
Max
I find it amusing that a possible 0.2K cooling due to a prolonged solar minimum is unbelievable, but greater that 4C of warming is expected for an additional 170ppm CO2 when the first 113ppm has likely increased GMT less than 0.4K.
The truth, whatever it is, will out.
This figure shows two things; on top is 1/10Be in the ice record.
http://i179.photobucket.com/albums/w318/DocMartyn/1over10BevsGavinTSI.jpg
At the bottom are reconstructions of including Gavins and the great and good; also the one one they all hate Shapiro.
The line shape of Shapiro matches 1/10Be very well. The 6.5% change in Earths position to the Sun in its orbit changes the 10Be flux rate by a factor of 2, which is the same as the magnitude of the max and min in the 10Be in the ice cores.
i don’t know who is correct. However, I love looking at line shapes.
Hey Captn, we not yet reached the total Earth system equilibrium response from the “first 113 ppm” so to suggest that it is only 0.4K is unsupported on any level of fact. Even if somehow we locked in 392 ppm, the total Earth system, involving slow feedbacks like biosphere and cryosphere, will continue to respond for many more decades, and these have an impact of the equilibrium temperature.
I doubt the Earth will ever reach a true thermodynamic equilibrium. With nearly 1000 years of what is likely lower than average temperatures for this period of history due to volcanic depression, I suspect we are closer to what should be near equilibrium.
The 0.4K is an estimate of the impact of the 113 after allowing for recovery from the volcanic depression of temperature. The change in the rate of warming should lend some support to that estimate. With less land use impact, the southern hemisphere showing little if any recent warming should also provide some support.
Since O’Donnell et al. 2010 indicates that there is little if any Antarctic warming, Satellite measurement indicate mid-tropspheric cooling in both the Antarctic and the Tropics, I feel even more comfortable with that estimate.
It is of course just an estimate :)
I find it ironic that the skipper, who fancies himself as a HVAC authority, does not understand the role of a gigantic heat sink attached to the climate system. This heat sink in the form of an ocean, coupled together with an elevated heat source that has an insanely long forcing persistence (i.e. elevated CO2 levels), will guarantee that whatever plays out will span the foreseeable future.
How tragic that there doesn’t seem to be enough hydrocarbons to burn to stave off the next Ice Age. Who planned this anyway?
================
Web, that gigantic heat sink has thermodynamic layers, each with its own time constant and impact on various time scales which can produce a variety of pseudo-cyclic oscillations. The Earth is a thermodynamic onion.
There is no generally accepted term as a “thermodynamic layer” and you have just made stuff up. I would suggest that there are heterogeneous layers that can be approximated as an effective mean value and one can work out the transients based on that. You are purposefully being obtuse and blowing smoke to deflect from the fact that you don’t know how to do this stuff.
Making it up? Thermodynamic boundary layers are the main issue. The ocean does not have a thermocline, but several depending on the presence or lack or turbulent mixing. The planetary boundary layer is yet another “layer”, the tropopause another. You can call them heterogeneous layers, thermodynamic boundary layers and in my opinion, simply thermodynamic layers.
You think you can approximate an effective mean, but without significantly more data for a much longer period of time, it is likely to be a poor approximation. I believe that looking at the change of the rate of change at the primary boundary layers gives a reasonable approximation, but without knowing what “average” is, that is all it will ever be. Since there is an apparent lag between the poles, the southern most pole has the least noise, anthropogenic and otherwise, that is were I focus my attention. That region also has a convergence of “layers” that is interesting.
BTW, while you are determining your mean values, you should note that the surface temperature record in the Antarctic appears to be considerable higher that actual due to inaccurate measurement of Tmin. That may impact your mean somewhat.
All of the Antarctic records leave the interpretation of the absolute temperature baseline as a parameter. I have this fact documented here:
http://theoilconundrum.blogspot.com/2012/03/co2-outgassing-model.html
Web, what was the average sea surface temperature required to produce the pre-industrial 280PPM and glacial 190PPM CO2 again? I only ask because some tropical temperature reconstructions indicate only about 1.5 to 3 degrees temperature difference between glacial and interglacial.
About 9 to 10 degrees for that spread in CO2 levels.
Here is smoothed GISTEMP global with an 11-year cycle of 0.1 degrees overlaid.
Note that the actual solar cycle is not exactly 11 years every time, and its phase is a little different from this sine curve (leading it by a little on average), but the average over the period was 11 years.
http://www.woodfortrees.org/plot/gistemp/from:1900/to:2010/mean:60/mean:36/plot/sine:10/from:1900/to:2010/scale:0.1
You can see a solar signal in there, as Camp and Tung did. It may be about 0.1 degrees (they say 0.2). From what we currently know about TSI variations in a solar cycle, the sensitivity comes out as a surprisingly high 0.5 K/(W/m2). This is about the expected CO2 effect, but applied to an oscillatory forcing which should underestimate sensitivity due to thermal inertia lag. I find this graph very interesting as a natural experiment in sensitivity.
I need to correct this. Woodfortrees only gives you a ten-year cycle whatever you try to do. Anyway the graph gives an idea of how solar variations would look compared to the actual record. I still think they are visible in the actual record implying a positive feedback.
Proverbs 18:17
The NIPCC Reports find evidence of substantially higher solar impacts than the IPCC finds. Cf 2.3. Solar Forcing of Climate in the 2011 preliminary review.
Mauri Timonen presented Past, Present & Future Climate from Tree-rings He assembled a 7642-yr timberline Scots pine chronology. From that he projects “Summer climate during the Holocene Optimum (9000 –5000 BP) was even 4-9 degrees warmer than today.” He predicts some warming followed by cooling of about – 1C.
Similarly, Humlum, O., Solheim, J.-K. and Stordahl, K. 2011. Identifying natural contributions to late Holocene climate change. Global and Planetary Change 79: 145-156.
Fig 8.
In Testing an astronomically-based decadal-scale
empirical harmonic climate model versus the IPCC(2007) general circulation climate models Nicola Scafetta predicts temperature varying predominently from natural cycles at a rate substantially lower than IPCC’s strong warming trends.
From such papers, I expect the solar variation to probably be larger than IPCC’s expectations, with global temperatures more likely to trend lower rather than higher.
We need to make good use of the fossil resources we have to bridge to cheaper solar fuels and power – as we head towards the next ice age. Remember the urgent needs of the poor today are much greater than worrying about warming that is not cost effective to mitigate.
“The urgent needs of the poor today are much greater than worrying about warming that is not cost effective to mitigate. ”
This cuts to the point of the entire issue. I could not agree more.
It doesn’t have to be a Maunder. A Dalton will do just fine, especially if goosed by major vulcanism. Memorable events of the Dalton include failure of the French wheat crop (precipitation), the French Revolution (no bread), expulsion of British troops from Washington DC and the Year Without a Summer (less margin for extremes).
Back to the Future? D’Aleo, CCM, Joseph. “Dalton Like Solar Minimum – Back to the Age of Dickens?” Scientific. Intellicast – This Week in Weather, November 9, 2009. http://www.intellicast.com/Community/Content.aspx?ref=rss&a=207
Indirect effects mentioned include: UV / Ozone warming, Geomagnetic Storms, galactic cosmic rays – ion mediated nucleation, and Livingston & Penn.
The possibility exists, quoting Hathaway (NASA): Archibald, David. “NASA Now Saying That a Dalton Minimum Repeat Is Possible.” Blog. Watts Up With That?, July 28, 2009. http://wattsupwiththat.com/2009/07/28/nasa-now-saying-that-a-dalton-minimum-repeat-is-possible/
Dr. Svalgaard does not think Livingston & Penn will lead to a Maunder re-run. So far as I know, however, he has not commented on a Dalton.
Mush of the hard radiation from the Sun, about 6% of the output, is absorbed by the upper atmosphere and heats the thermosphere.
The hot, though very low density, gas will radiate IR and about half of it should end up in the Earths energy budget. However, this always seems to be missing from the box diagrams and changes in hard uv solar output is ignored.
A drop in high energy UV is also going to change a lot of the upper atmospheric chemistry. I bet a significant amount of fine particulates are also oxidized away by the hard uv.
If the surface of the sun becomes less active, the magnetic storms which generate high temperature gas, and so high energy photons, are going to decline.
http://edro.files.wordpress.com/2007/11/earths-energy-budget.jpg
According to this, 16% of the incoming solar is absorbed by atmosphere. This flux is a bit larger than the net radiative surface flux, absorbed by atmosphere (15% of incoming solar).
Doc, I believe the 6% is just water vapor. 33PW is the average solar absorption by the atmosphere with is 27% of the total solar absorbed.
http://en.wikipedia.org/wiki/File:Breakdown_of_the_incoming_solar_energy.svg
Or about 16% of the TOA solar, 19% if you include clouds.
A theory I find more physically believable, is that intertropical convergence zone moves toward the equator during a long solar minimum and away with a grand maximum. Still is hard to tell with all the volcanic noise, but that tends to agree with what Dr. Roy Spencer was noticing as cloud forcing. Since solar UV and infrared do not change as much as expected during a prolonged minimum, it is possible that is can create a slight change in the atmosphere/surface solar absorption ratio.
We will find out in a decade or less, but that is where my money would be bet. :) The Sahel is liable to get a little more rain. Wonder if that would be a feedback?
The Jones Lockwwod et al paper is the usual UEA Met office IPCC garbage which uses a simple IPCC type climate model which has the same built in wrong answer as the rest of the GCM’s i.e it assumes the TSI is the proper measure of the solar effect on climate. It is now reasonably clear that changes in the solar magnetic field strength possibly modulated through the GCR – Cloud – Albedo effect is likely the most important solar driver superimposed on the changes in solar irradiance esp in the EUV range.
However here is what our warmist cardinals Schindell, Mann ,Schmidt et al say in a for them amazingly empirically based review of the Maunder temperature changes :
“We examine the climate response to solar irradiance changes between the late 17th century Maunder Minimum and the late 18th century. Global average temperature changes are small (about 0.3° to 0.4°C) in both a climate model and empirical reconstructions. However, regional temperature changes are quite large. In the model, these occur primarily through a forced shift towards the low index state of the Arctic Oscillation/North Atlantic Oscillation as solar irradiation decreases. This leads to colder temperatures over the Northern Hemisphere continents, especially in winter (1-2°C), in agreement with historical records and proxy data for surface temperatures.”
See Shindell, D.T., G.A. Schmidt, M.E. Mann, D. Rind, and A. Waple, 2001: Solar forcing of regional climate change during the Maunder Minimum. Science, 294, 2149-2152, doi:10.1126/science.1064363
A 1-2% NH cooling would severely impact growing seasons and food crop production in the NH
It is encouraging that our warmist friends are now at least thinking that their might be a Maunder minimum on the way and are now seeking comfort with the thought that although their models have been wrong over the last 15 years with CO2 up 7.9% and no net warming their tea leaves still predict what they programmed in to begin with.
In the above post please read 1-2 NH degree cooling not %
The post links to a paper by Shapiro et al that cites a greater solar irradiance variation during the Maunder minimum than estimated from several other reconstructions. The date cited was 2012, but the paper actually appeared in 2011. This is relevant because in 2011 it was subsequently discussed on RC in comparison with the various other reconstructions. There remain substantial uncertainties regarding these reconstructions, and therefore a possible repetition of an earlier solar minimum. None is likely to make the future solar consequences more than a relatively small fraction of anthropogenically driven warming for a continuation of the CO2 trajectory of the past decades, but the amount could certainly exceed 0.1 C.
The attribution issue is also confused by distinctions between the entire twentieth century, where the early century solar role is harder to estimate than the changes since mid-century. Most estimates suggest that early century solar forcing contributed to pre-1940 warming, but probably less than anthropogenic GHGs and even less than a trend of declining volcanism. The margins of error are large, though. After 1950, the dominance of GHGs is much better established, and its fractional contribution would not likely change dramatically even if solar contributions turned out to be underestimated simply on the basis of TSI measurements, unless a putative underestimate turns out to be extreme..
‘Changes in the Earth’s radiation budget are driven by changes in the balance between the thermal emission from the top of the atmosphere and the net sunlight absorbed. The shortwave radiation entering the climate system depends on the Sun’s irradiance and the Earth’s reflectance. Often, studies replace the net sunlight by proxy measures of solar irradiance, which is an oversimplification used in efforts to probe the Sun’s role in past climate change. With new helioseismic data and new measures of the Earth’s reflectance, we can usefully separate and constrain the relative roles of the net sunlight’s two components, while probing the degree of their linkage. First, this is possible because helioseismic data provide the most precise measure ever of the solar cycle, which ultimately yields more profound physical limits on past irradiance variations. Since irradiance variations are apparently minimal, changes in the Earth’s climate that seem to be associated with changes in the level of solar activity—the Maunder Minimum and the Little Ice age for example—would then seem to be due to terrestrial responses to more subtle changes in the Sun’s spectrum of radiative output. This leads naturally to a linkage with terrestrial reflectance, the second component of the net sunlight, as the carrier of the terrestrial amplification of the Sun’s varying output. Much progress has also been made in determining this difficult to measure, and not-so-well-known quantity. We review our understanding of these two closely linked, fundamental drivers of climate.’ (Measurements of the surface brightness of the earthshine with applications to calibrate lunar flashes, P. Montanes-Rodriguez, E. Palle, P.R. Goode, Astron.J, 2007, 134, 1145, 2007)
‘During the descent into the recent exceptionally low solar minimum, observations have revealed a larger change in solar UV emissions than seen at the same phase of previous solar cycles. This is particularly true at wavelengths responsible for stratospheric ozone production and heating. This implies that ‘top-down’ solar modulation could be a larger factor in long-term tropospheric change than previously believed, many climate models allowing only for the ‘bottom-up’ effect of the less-variable visible and infrared solar emissions. We present evidence for long-term drift in solar UV irradiance, which is not found in its commonly used proxies.’(http://iopscience.iop.org/1748-9326/5/3/034008/fulltext/)
Judith Lean (2008) commented that ‘ongoing studies are beginning to decipher the empirical Sun-climate connections as a combination of responses to direct solar heating of the surface and lower atmosphere, and indirect heating via solar UV irradiance impacts on the ozone layer and middle atmospheric, with subsequent communication to the surface and climate. The associated physical pathways appear to involve the modulation of existing dynamical and circulation atmosphere-ocean couplings, including the ENSO and the Quasi-Biennial Oscillation. Comparisons of the empirical results with model simulations suggest that models are deficient in accounting for these pathways.’
Captain Kangaroo’s comment – someone mentioned the multiple linear regression of Lean – http://www.agu.org/journals/gl/gl0818/2008GL034864/figures.shtml#fig02 . I would quibble about the ENSO regression. It seems a little light on.
The big problem, however, is the UV/ENSO connection and related albedo changes. This is unknown prior to satellites – and even then the satellite data says the wrong thing for warministas and so is largely ignored outside of specialist forums. I note Jim Hansen’s passionate disparagement of the satellite record in this respect – something incoherent about La Grange points. Lean’s simple multiple regression – for instance – doesn’t survive a significant change in cloud cover over the relevant period.
CERES and MODIS continue to say things about clouds –
http://s1114.photobucket.com/albums/k538/Chief_Hydrologist/?action=view¤t=CERES_MODIS.gif.
The big changes in cloud are ENSO related on an interannular scale and PDO influenced on a multi-decadal scale. So in the bottom graph we are looking at the cool La Niña in 2000/2001 to the El Niño of 2009/2010 and the La Niña since. The PDO and ENSO are related in that PDO modes are related to the intensity and frequency of ENSO event. La Niña are more intense and frequent in a cool PDO and vice versa. Before that there was a climatologically significant increase of a couple of W.m-2 in reflected short wave in the climate shift of 1998/2001.
The top down UV forcing is a significant clue. It manifests as changes in sea level pressure in both the Northern and Southern Annular Modes – and thus in transport in the Californian and Peruvian Currents. ENSO and the PDO involve significant feedbacks in wind, currents, biology and cloud – thus we have a control variable in solar UV and a non-linear climate response.
Best regards
Captain Kangaroo
I didn’t know those publications CK. Thanks.
Solar output does not quite follow a S-B plot of a black body at 5250 K, although that’s what they teach you at school.
It has too much uv and and visible. The magnetic storms cause ultra high temperature storms that kick out quite a lot of the hard stuff. The working figure for TSI was about 1366W/m², but since 2005 is officially 1361 W/m². So a change of 6 W/m2 is obviously nothing for all the models.
To Pekka: Your reply to Max about ASTROLOGY:
Please refrain from Warmist garbage… read my 61 year
astronomic cycle response some comments above, I
felt you deserve to be informed and that you do not follow 100% the
Warmist crap….
as Colose and Mosher with their 7th grade pupil knowledge, wanting
to feel important by trolling….
JS
whatever you say nostradamus
What we are discussing is a “theory” with extremely little empirical support, (i.e. rough agreement on one number), and no plausible physical mechanism.
The reasons for taking such a “theory” seriously are exactly at the level of astrology.
The issue with the sceptical climate clowns that crawl out of the woodwork on this site is that they each possess an individualistic “one-note” theory that deems to prove everything.
They actually know nothing about the scientific method, which in most cases amounts to plodding along and generating reinforcing arguments, all the while systematically eliminating dead-ends that reduce the viability of alternative theories.
The fake skeptics and poseurs are easy to spot because all they carry is a single argument, which is the equivalent ammunition level of a slingshot loaded with a single acorn. You get one shot and you miss, and then the dang squirrel goes and eats the acorn.
Pekka correctly referring to these ideas as astrology is the other side of the belief coin. First of all, they desperately need an alternate theory to make sense of what is happening around them and so attach themselves to some weird belief. Secondly their belief system becomes reinforced when they start to see patterns in data that are simply ghosts (see astrology, Tarot cards, etc.)
I would suggest that chasing phantoms is not the best way to proceed.
More one note clowns, please. The one knob clowns have been running the circus and all they have left is parrots nailed to perches.
=====================
There are a lot of “slides” on the equalizer board as Web said. Right now I am playing with the faders :)
Kim,
“More one note clowns, please. The one knob clowns have been running the circus and all they have left is parrots nailed to perches”. That sums it quite simply!
Well done
http://www.youtube.com/watch?v=IW5NCeLup14
I had been checking with anticipation of something ahead worth reading, every time I note a Mosher post – but he’s reducing my check frequency.
@ J. Seifert | March 10, 2012 at 6:58 pm |
J. Seifert, not disappointingly; your crap is much bigger than the Warmist crap. Warmist believe 90% possibility in a moderate GLOBAL warming, in 100y. You believe in the truckloads and truckloads of Ian Plimer’s phony GLOBAL warmings. The only reason the Warmist are still persisting is; thanks to Plimer’s zombies. Extra warmth in the planet’s atmosphere is not cumulative / laws of physics. They are lying that has gone warmer for the last 50y – you are believing in their crap – then intend to prove them wrong, with your bigger crap.
All those Paleocene / crapocene, LIA were not GLOBAL warmings, but big climatic changes. No need for bog / small climatic changes to have a phony GLOBAL warming / cooling pined on it. Seifert, oxygen + nitrogen get read of a million degrees heat from nuclear bomb in 6-7 minutes, otherwise those gases wouldn’t have shrunk after few minutes. Grow up, Leading Warmist know about the crap you fake Skeptics know, that’s why they don’t take you seriously. Grow out of Ian’s fairy-tales, you are a big boy now
A factor I have not heard mentioned is ultraviolet changes which have a strong polar effect. By ignoring this and magnetic/gravitational effects, and only considering TSI it is too easy to dismiss the sun.
I mentioned it twice, and the fact it is ignored.
There’s a number of papers that have looked at the ozone and dynamical responses to the solar cycle (see section 3 of the review paper by Gray et al 2010 for example). There’s ~2-4% changes in ozone, along with some temperature anomalies at high altitudes, along with some indirect effects on atmospheric circulation. They’re subtle but interesting, though it’s difficult to see what much of it has to do with climate change, particularly since the trends in solar irradiance are smaller than the solar cycle amplitude.
Utter nonsense if Lockood is correct – with major influnces on NH storm tracks. If Lean is correct about teleconnections to ENSO – there is a major link to climate there.
‘Many other relationships between proxies for solar activity and climate have been noted, including variations in ozone, temperatures, winds, clouds, precipitation, and modes of variability such as the monsoons and the North Atlantic Oscillation (NAO).’ Grey et al 2010
That the IPCC is all but dismissing natural drivers should give all but the most rabid warmists pause. Hack science at its best. Positively disgusting.
Dozens of attempts to predict climate change from solar activity have failed. No substantial theoretical reason has been advanced to suggest that future predictions will fare better. Thus, the weight of history suggests that the two articles that Judith cited most probably are correct to predict small future impacts of solar activity on climate.
This will not stop quibblers and demagogues from asserting cherry-picked associations.
“This will not stop quibblers and demagogues from asserting cherry-picked associations”
So situation normal for Climate Science then, cherry-picked associations is all you have. That’s why you pick the right trees and cut them off in 1960.
This was to be expected that “A physicista” who, of course, is not
a real, but a make- believe one, throws in his nonsense Warmists
comment, this was just a matter of time…..
20 century increased solar activity – 21 century decreasing solar activity; is EXACTLY the same as: when bank-robber is cornered in the bank safe; telling that he is there to return the money.
TRUTH: there wasn’t any GLOBAL warming – it was ALL LIES – now when more Skeptical people are analyzing the data + more of my proofs are circulating in public = ”PREDICTION’ of ”sun cooling” Sun doesn’t increase / decrease temp as a yo-yo. Sun not guilty. Using the sun as a smokescreen’ only works on Plimer’s zombies. Oxygen + nitrogen control overall the temperature to be the same every day of every year and millenia. Blaming the sun, is same as rapist blaming the darkness for his crimes. SUN NOT GUILTY!!!!!!!!!!!!!!!!!
Reason for ”PREDICTING” that the sun will be cooler. That prediction as EVERY other Warmist lie comes from low quality made Chinese crystal ball – with lots of thin air in from harvesting from. I suggest: accuracy in tea leafs reading has increased by 30%, much more reliable – alternative is for the shonky ”climatologists” in the name of science – should go back to reading tarot cards. Sun will not wash Swindler’s hands. Avoiding my proofs / facts / formulas is the best proof that they know that they have being lying from the beginning. Ignorance is not a crime – but in combination with the ”ostrich tactic” is a proof of a double crime.
Grandma used to say: the devil doesn’t have any other job, but to make idiots to make fools of themselves. 1] they were predicting droughts – floods increased. 2] the sun will have unusual big flares released – just to prove that: sunspots / sun -flares are not increasing / decreasing OVERALL the temp on the planet, not for one millionth of a degree!!!!!!!! Avoiding to acknowledge my formulas is a proof of guilt, from both camps. O+N control the temp, not CO2, not the sun, not galactic crap. All proven. already. SUN NOT GUILTY!!! (Using the sun/ is same as rapist using the dark)
JC asks ” So, how many people are convinced that a reduction of solar irradiance comparable to the Maunder Minimum would translate to a cooling of about 0.1C?”
I rather think that there would be other mechanisms at work that remain to be quantified in terms of their effect on climate The CERN study is currently assessing the effect of solar rays on cloud albedo but that seems to only be part of the picture..
It seems the there may well be several mechanisms working in tandem or even in conjunction that could cause abrupt climate change and climate science seems only to have scratched the surface.
I am more concerned about abrupt climate change than the normal trajectory that has been the case over the past 10,000 years. This trajectory is characterised by strong negative feedbacks keeping it within remarkably narrow error bands.
“Dozens of attempts to predict climate change from solar activity have failed. No substantial theoretical reason has been advanced to suggest that future predictions will fare better. Thus, the weight of history suggests that the two articles that Judith cited most probably are correct to predict small future impacts of solar activity on climate.
This will not stop quibblers and demagogues from asserting cherry-picked associations.”
This is so far out to lunch it’s literally nauseating. I honestly don’t understand how you guys can live with yourselves. Pot, kettle, black oh fake “a physicist.”
Pokerguy, you quoted four sentences:
Pokerguy, neither your comment nor any other comment has offered evidence to refute any of those statements … and thereby, these comments help to confirm (#4).
For which, this appreciation is given. :| :) :D
The numb-ers may change but the actors remain the same…
https://docs.google.com/viewer?url=http%3A%2F%2Fwww.real-science.com%2Fgoto%2Fhttp%3A%2F%2Fwww.climatemonitor.it%2Fwp-content%2Fuploads%2F2009%2F12%2F1974.pdf
Oh look, now they are all going back, back, back to the ice of 1974, and the old new world of fear, same as it ever was. See-Eye-Ay
I suggest it will be cooler in the SH within months. It is a truism that the Sun drives climate. This is seen in various elements of climate. ‘Many other relationships between proxies for solar activity and climate have been noted, including variations in ozone, temperatures, winds, clouds, precipitation, and modes of variability such as the monsoons and the North Atlantic Oscillation (NAO)’ (Grey et al 2010). These are major and interdependent modes of climate variability. There are UV effects that suggest cold NH winters over the next few decades (Lockwood et al 2010). The same effects extend to the SH.
All of the current peer reviewed science that deals with near term prediction is suggesting subdued warming over the next decade or three. This is focused on ocean variability and not solar to any great extent – but the question is to what extent these emerge as solar forced by one mechanism or another.
The extent to which I wish to answer A d_ckheads questions is negligible. He exhibits such little comprehansion, so little knowledge and so eggregious a tribalism that he is utterly contemptible. :roll:
You can take it to the bank that no warming for a decade or three more is going to be exploited to the full by sceptics and if that is cherry picking and demagogery – hmmm – cherries.
The time of the warminista is over – the time for an enlightenment liberal reformation is here.
Best regards
Captain Kangaroo
:
damn those typos – I must remember – edit first – post second
Is this the right time to point out the inconvenient truth that every attempt to predict climate change from CO2 activity has failed?
If you did, you’d be wrong. Some climate model runs, which are predictions, do in fact predict the “pause”. Some estimates have been on the high side.
But imperfection in predictions is the rule for all science.
Can you please point out the specific models and the specific, quantifiable predictions they made which came to pass? Thanks.
Are you actually interested?
‘Atmospheric and oceanic computational simulation models often successfully depict chaotic space–time patterns, flow phenomena, dynamical balances, and equilibrium distributions that mimic nature. This success is accomplished through necessary but nonunique choices for discrete algorithms, parameterizations, and coupled contributing processes that introduce structural instability into the model. Therefore, we should expect a degree of irreducible imprecision in quantitative correspondences with nature, even with plausibly formulated models and careful calibration (tuning) to several empirical measures. Where precision is an issue (e.g., in a climate forecast), only simulation ensembles made across systematically designed model families allow an estimate of the level of relevant irreducible imprecision.’ http://www.pnas.org/content/104/21/8709.full
Independent of processes in climate – the models are themselves chaotic systems by the essential nature of the underling mathematics. As a result of plausible differences in inputs the models diverge as a result of ‘structural instability’ and ‘sensitive dependence’. The models are intrinsically ill posed initial value problems – and that can’t change regardless of what is rationalised about the climate problem. The extent of possible divergence is unknown as systematic evaluation across model families has not been done. Chaotic divergence is shown in Figure 1 of McWilliams (2007). http://www.pnas.org/content/104/21/8709/F1.expansion.html
‘AOS models are therefore to be judged by their degree of plausibility, not whether they are correct or best. This perspective extends to the component discrete algorithms, parameterizations, and coupling breadth: There are better or worse choices (some seemingly satisfactory for their purpose or others needing repair) but not correct or best ones. The bases for judging are a priori formulation, representing the relevant natural processes and choosing the discrete algorithms, and a posteriori solution behavior. Plausibility criteria are qualitative and loosely quantitative, because there are many relevant measures of plausibility that cannot all be specified or fit precisely.’ Op.cit.
This is not anything to do with climate at all – it is simply the nature of the underlying mathematics of models. The movement of ocean and atmosphere is described by the Navier-Stokes partial differential equations that are intrinsically non-linear. They can only predict within the boundaries of irreducible imprecision – and that imprecision is an unknown quantity. There are many non-unique solutions possible within the range and combination of plausible inputs and a solution is chosen based an expectation of solution behavior. This is not prediction at all in any sense of the word.
These guys are second and third stringers busily defending something they don’t understand for reasons they are dimly unaware of. Hopeless muddle headedness.
Chris, I think everyone here would be interested in any climate models that have a track record of making specific, quantifiable predictions that have been proven accurate after the fact through empirical observation.
But none of them do.
Steven. You say: “Some climate model runs, which are predictions, do in fact predict the “pause””.
I’m sure that what you say is true – in a hindsight review. But the real issue is did we know at the time the models were run which of them we could rely on to “predict” the pause? And which we could discount as unrepresentative?
If you run a 1000 iteration Monte Carlo simulation on a model, there is no question that in hindsight you will see that there were models that were run that closely match reality. But that’s not useful unless you can show that you chose those models as the prescient ones at the time that the model was run. I doubt that was done.
Is it the case that the low frequency component of solar activities and CO2 accumulation have been virtually perfectly collinear over the period of time that we’ve had reasonably accurate measurements of them and global temperature? I would think that, if this is true, it would be hard to accurately separate climate sensitivity to CO2 and climate sensitivity to solar activity over that time period. I understand that there are occasional high-frequency shocks (e.g. volcanoes, world wars) that might provide auxiliary evidence about climate sensitivity to CO2 (if the variance of these kinds of shocks is big enough). Still.
I ask this because there’s a great deal of a priorism in many of the comments about solar vs CO2. That’s fine if model-building is a pure exercise in applied theory. It wouldn’t be anyone’s business how much, or how little, or what kind of sensitivity analysis and specification testing people in the model building community do, if the model building community was completely justified in defining its own epistemic rules for its own reasons. Most specifically, the complaint that “we know of no physical mechanism for such-and-such being big” is fine if the model-building community’s results have no interested consumer (or stakeholder, stupid word but there it is) outside of the model-building community.
To me, this is not the case here. I have a rational interest (and as a taxpayer supporting the work, a financial investment to boot) in the size of the forecasting errors of the models that emerge from the model-building community. If a corporation is unsatisfied with the forecasting record of some economic consulting firm, it can go somewhere else. This puts some pressure on the forecasters—some purely statistical pressure above and beyond the constraints on model specification suggested by theory. The elite macroeconomists still believe that DSGE (dynamic stochastic general equilibrium models) are the only macroeconomic models with theoretically well-understood mechanisms. But successful private sector economic forecasters will be on the lookout for anything that gives them an advantage in terms of forecast quality measures that matter to their clients—even if their model specifications and included variables don’t make sense to Tom Sargent and Chris Sims.
Therefore, I do not accept the frequently voiced complaint that “so-and-so has no well-understood mechanism.” I expect the modelers to be looking for specification errors in their models even if they have no firm understanding of the physical mechanisms whereby hints of the significance of vector Z belong in the model. If there is empirical evidence that Z matters, and Z does in fact matter, then estimated quantities like sensitivity will be biased by the exclusion of Z from the estimation—whether high theorists in climate science understand why Z matters or not. If sensitivity is not well-identified from past data, then the gain on that control knob has a pretty wide standard error and might be biased. (BTW has anyone computed a Birge ratio for different estimates of sensitivity?)
This is not an argument for abandoning well-understood theoretical constraints or quantities in favor of vector autoregressions of everything on everything. Rather, it is an argument for remembering that the models are, first and foremost, supposed to supply us with good forecasts under different policy regimes (not first and foremost to satisfy any theoretical community’s notions of beauty, goodness, parsimony and general scientific swellness). This calls for a mixture of theoretical constraint and statistical specification-testing.
Sorry in advance for the long post.
This paper shows the variation in solar uv output during the recent past and a reconstruction of the last three solar cycles.
http://ntrs.nasa.gov/archive/nasa/casi.ntrs.nasa.gov/20110023422_2011024608.pdf
DeLand & Cebula
Journal of Atmospheric and Solar-Terrestrial Physics
Volume 77, March 2012, Pages 225–234
Hard uv <250 nm has a variation of 10-15% in cycle 23. This paper also gives a good description of how damned difficult it is to design, build and use instruments that can accurately measure hard uv.
“Some estimates have been on the high side.”
Why say “some” when “most” is more accurate? And “on the high side” seems a distortion as well,
Judith,
This topic really pushes some hot buttons. My main theses is that there must be climate forcings that caused climate change during the hundreds of millions of years before AGW. Anyone disagree? I though not. We don’t have a very good understanding of what they are. Anyone disagree? I thought not. Solar is a good candidate as one of those poorly understood forcings. Anyone disagree? Oh, climate orthodoxy is at risk! We better not look into any of that.
I still have not seen a clear answer on this. This is a solar thread, and skeptics are talking about solar cooling by 0.2% for this upcoming few decades here. Are these same skeptics denying that the warming from 1910-1940 could have at least been half solar with a 0.2% increase which would explain the warming rate? The sun has been returning to the 1910 values. If it is cooling now, when was the warming seen?
I have seen that there exists some discussion about my past works above.
I would like to write a short comment.
1) Steven Mosher continuously states here and in numerous other blobs that I do not share data nor models. Unfortunately, Steven never acknowledges that I have repeatedly responded to him that the data that I use are freely available in the web and can be easily downloaded by anybody (for example I am using the global surface temperature from the CRU) and the equations of the models that I use are clearly explained in my papers. Everybody fairly reading my papers can understand which data I use, where they can be downloaded and which equations I use to do the calculations. So, I cannot that invite Steven Mosher to spend some time to read my papers.
2) Another reason why Steven Mosher may want to read my papers instead of continuously say no-senses is that by doing so he may actually realize that his additional criticism is baseless. For example, the harmonic model that I have proposed in my already published papers
[1] Nicola Scafetta, “Testing an astronomically based decadal-scale empirical harmonic climate model versus the IPCC (2007) general circulation climate models.” Journal of Atmospheric and Solar-Terrestrial Physics, (2012). DOI: 10.1016/j.jastp.2011.12.005
[2] Adriano Mazzarella and Nicola Scafetta, “Evidences for a quasi 60-year North Atlantic Oscillation since 1700 and its meaning for global climate change.” Theor. Appl. Climatol. (2011). DOI: 10.1007/s00704-011-0499-4
[3] Craig Loehle and Nicola Scafetta, “Climate Change Attribution Using Empirical Decomposition of Climatic Data.” The Open Atmospheric Science Journal 5, 74-86 (2011). DOI: 10.2174/1874282301105010074
[4] Nicola Scafetta, “A shared frequency set between the historical mid-latitude aurora records and the global surface temperature.” Journal of Atmospheric and Solar-Terrestrial Physics 74, 145-163 (2012). DOI: 10.1016/j.jastp.2011.10.013
[5] Nicola Scafetta, “Empirical evidence for a celestial origin of the climate oscillations and its implications.” Journal of Atmospheric and Solar-Terrestrial Physics 72, 951–970 (2010). DOI: 10.1016/j.jastp.2010.04.015
was clearly dealing only with the cycles that could be detected buy using the global surface temperature since 1850: that is cycles with period below 60-years.
In the papers it is clearly said that to explain the patterns occurring on larger time scales such as the Medieval Warming Period and Little Ice Age one needs to take into account longer cycles that were not included in the proposed models yet. Thus, Mosher’s criticism is baseless and it is just driven by his strong desire of not understanding the issues at all. Please, Steven, do not be so impatient and petulant! you may not need to wait long (but you still need to read my papers to understand what I am doing)!
If Steven is very impatient he may try to read my previous papers which already address the problem of LIA and solar impact on climate by using phenomenological models using alternative solar proxy reconstructions. For example
[6] N. Scafetta, “Empirical analysis of the solar contribution to global mean air surface temperature change,” Journal of Atmospheric and Solar-Terrestrial Physics 71 1916–1923 (2009), doi:10.1016/j.jastp.2009.07.007.
[7] Nicola Scafetta, and Bruce J. West, “Phenomenological reconstructions of the solar signature in the NH surface temperature records since 1600.” J. Geophys. Res., 112, D24S03, doi:10.1029/2007JD008437 (2007).
The above two papers also explicitly respond Curry’s question “So, how many people are convinced that a reduction of solar irradiance comparable to the Maunder Minimum would translate to a cooling of about 0.1C?”
The conclusion of the papers by Jones, Lockwood, and Stott (2012) that a reduction of the solar activity to the Maunder minimum would cause a 0.1 C of cooling and nothing more is no-sense.
Their conclusion (which is based on an energy balance model tested against a general circulation model, HadCM3, that is, the use a model to simulate another model!) is based on a climate model (theirs) that at most simulates the HadCM3, not the real climate!
The HadCM3 is one of the models used in the IPCC 2007 that have been explicitly proven in my recent paper [1] not to be able to properly reconstruct any of the cycles observed in the climate record since 1850. Thus, my paper would disprove also the Jones, Lockwood, and Stott’s EBM model that simply simulates the HadCM3!
HadCM3 very likely agrees only with the original Hochey Stick by Mann and Jones [2003], which does not show any significant preindustrial changes!
In any case, the HadCM3 model uses only and exclusively the TSI as solar forcing (no mention to cosmic ray, ozone etc). That model, by predicting only a 0.1 C warming/cooling due to the change of solar activity from the LIA to the current maximum proves only that it does not properly reconstructs the solar effect on climate and strongly underestimates it.
That is not the way how the calculations should be done. The right way to do the calculations was already described in my papers [6] and [7], above.
A discussion on my paper [6] is here
http://wattsupwiththat.com/2009/08/18/scafetta-on-tsi-and-surface-temperature/
where it is shown that he sun contributed a warming of between 0.5 C to 0.8 C from the Maunder period to 2000 (see figure 6).
http://wattsupwiththat.files.wordpress.com/2009/08/scafetta_fig6.png
(To Steven Mosher: Please Steve, note that in my paper [6] I am hindcasting both the Dalton and Maunder cooling periods with a model just calibrated on the last decades)
Thus, if the sun goes down to the Maunder minimum, the temperature would cool, because of it, around 0.5 C (at least).
The 0.1 C of Jones, Lockwood, and Stott is no sense. No way to explain the cooling from the MWP to LIA (which was between 0.5 and 1 C) with just a 0.1 C solar cooling effect!
In their paper Jones, Lockwood, and Stott have only proven, by using a model that simulates another model (!), that their model and, implicitly, the HadCM3 model do not work, which is already explicitly proven in my publication [1].
The real issue is: how long do we need to wait before that the “AGW establishment” will start to acknowledge the numerous publications that already rebut their models and their AGW?
Is it possible to try to move on,, or should we get stuck on papers describing models that simulates other models?
In any case, the Sun is not entering in a minimum so deep as the Maunder minimum. The sun is entering into a prolonged period of minimum, but it is still in its millennial maximum, while during the Maunder minimum it was in its millennial minimum.
A small addition.
If you look carefull at Figur 6 in Jones, Lockwood, and Stott, it is possible to realize that their modelled temperature in 2010 is about 0.2C above the observed temperature. And their model is trending up since 2000 despite the steady temperature.
Note also that they plot the temperature record up to 2010. However, in 2011 there was a furter cooling that further increases the discrepancy between the model and the temperature records.
Nicola
long elaborations may be appropriate for the university lecture theatre, but on the blogs, since most of us here are self opinionated bunch, only very few bother to endure the whole ordeal.
In the general clatter of the blog you may not noticed this:
http://www.vukcevic.talktalk.net/AEc.htm
@NS: if the sun goes down
and the tide goes out,
geophysicists assemble and they all begin to shout,
The sun is entering into a prolonged period of minimum.
And this is a safe bet for Nicola given that he has everything to gain if it does and nothing to lose if it doesn’t.
Nicola Scafetta provides an extensive discussion and update at:
Scafetta prediction widget update WUWT
See Figure including January 2012 data
If global average temperatures continue to trundle along more-or-less horizontally for another 10-15 years, then that will, I think, demand a bit more convincing explanation than unexplained ‘internal variability’. The measured drop in TSI does seem, by itself, insufficient to explain the very modest rate of recent warming. But that does not exclude the possibility of important secondary solar effects.
Independent of whether or not a plausible mechanism for a stronger solar effect can be identified, it seems to me unlikely that a continued lack of rapid warming will bring about a broad public consensus for rapid (and very costly) reductions in CO2 emissions. Only a reasonable concordance between modeled warming (0.2C – 0.25C per decade) and measured warming will do that. So far, the models don’t look very ‘skilled’, and this observation is not lost on people (or politicians).
Steve
“If global average temperatures continue to trundle along more-or-less horizontally for another 10-15 years..” then it is clear from comments, like that of R Gates, on this thread, that the AGW fanatics will simply change the rules again, and tell us that temperature anomaly is not the right metric for measuring the energy of the system (which skeptics have known all along) but which will be claimed by the AGW believers to be the next great enlightenment. We will be told that the missing heat is in the deep ocean. Or, more likely, like all bogeymen, hiding in the closet. And they wonder why they have no public credibility!
Commas and parenthesis courtesy of Gleik Industries Inc
“The lengths to which these individuals and groups will go to tie carbon dioxide to absolutely everything, even in the face of contradictory evidence, is something few of us will ever understand. Even a political agenda as a prime motive does not do justice to the fanaticism on display.” ~Mark Hladik
The lengths to which these individuals and groups will go to tie carbon dioxide to absolutely everything
I feel that way about oxygen every time I read yet another advertisement for antioxidants. Give us a break, will you? Without oxygen we’d all be dead.
So true as for anti-intellectuals. I just don’t understand why AGW True Believers are so skeptical of intellectuals.
Vaughan Pratt
Yep. And without that smidgen of CO2, we’d all be dead, as well.
Max
Quite right, Max. But too much oxygen OR too much CO2 can also be harmfil On CO2 the right question should be, just how harmful is each extra 100 ppmv. I have no idea, all I have is what I believe is a pretty good estimate of when we’ll hit 400, 500, 600, etc.
I must have missed the people trying to implement basic, very expensive changes to the economy because of oxygen. Not much of a similarity imo
The “very expensive changes” you talk about, Rob, impact only those exploiting the carbon cycle, as either producers or consumers of fossil fuel based products and services. Those with relatively minimal involvement with that arena should see only an impact in proportion to their involvement.
So what will the impact be on the producers and consumers? (This almost surely interests you, given that most of us are consumers to a greater or lesser degree, car owners to a greater degree.)
Well, currently the producers (oil companies etc.) have the upper hand and have rigged the system to force the consumers to bear all the costs. In case you don’t believe that, compare gas costs at the pump with the bottom line of the oil companies.
Yet the government continues to subsidize oil companies to the tune of billions of dollars.
The rationale for such subsidies is based on the crocodile tears shed by oil companies as they go hat in hand to the government. Their sob story is that they’re suffering the same sort of financial crisis that the banks and car companies went through recently, and lack the resources needed for oil exploration and development. “Unless the taxpayers pay for our oil exploration and development,” they say, “the taxpayers will have to go without. They will then have only themselves to blame for rising gas prices at the pump.”
That in a nutshell is the oil companies’ argument for the government subsidies.
The government “buys” the argument and shifts those costs to the consumer. I say “buy” in quotes because the real buying power resides in the oil companies, not in the government. As we’ve seen during these past few months, money buys votes, with the result that we end up with the best politicians money can buy.
What I find so strange, Rob, is that as a consumer you are actually advocating a system that costs you more when logically you should be protesting it. I take it you’re one of those people who want to make a small fortune by starting out with a relatively large one, namely your present income.
There are a lot of people out there who are easily parted from their money, as the oil subsidies nicely demonstrate. A little advertising money at election time is easily leveraged into a lot of money from a sympathetic government.
This system has been in place for as long as there have been democracies. Democracies exploit the proposition that half those of voting age are below average in intelligence. Unfortunately no one’s come up with a better system to date.
To be precise, to today’s date.
I propose that the vote be taken away from adults and given to teenagers. They’re the one’s who are going to inherit whatever mess this decade’s government leaves the next decade’s to clean up after.
The government of the world’s largest and to date strongest economy should not be placing itself in Greece’s predicament of having to worry about whether they’re going to go into default next quarter. It should be looking at least a decade ahead.
Those who believe teenagers don’t understand today’s increasingly high-tech world haven’t had the embarrassment of having to ask a teenager how to cope with it.
In today’s ever faster-paced world, government of the elders by the elders for the elders promotes irrelevance.
If democracies as presently constituted worked better I wouldn’t be proposing such a cockamamie system. But they don’t, and it’s been causing things to go downhill lately. Desperate times call for desperate measures. I can easily imagine more desperate measures than giving the vote to teenagers.
Democracy, n. A system of government permitting the rich to buy their ideas instead of selling them.
Here’s one source on subsidies as a fraction of spending (see in particular exhibits 28-7 and 28-8:
http://www.window.state.tx.us/specialrpt/energy/subsidies/
If someone finds this wildly inaccurate, and wants to present some alternative calculations, that would be interesting.
What is a breakdown on the oil company subsidies again?
Captain D, are you asking me? If so, go down that TX page to any of the “Detail:” sections for breakdowns. Exhibit 28:10 in the “Details: Oil and Gas” section for instance.
It’s important to note that ALL of the figures in exhibits 28:6,7,8 are missing the Accelerated Depreciation Allowance and Foreign Tax Provisions Credit amounts, which are economy-wide tax expenditures not specific to any particular energy source. See the section “Federal Business Tax Subsidies Available to the Oil and Gas Industry” to get the explanation. I think they could make a guestimate though. If you applied the “private study (that they mention” estimate that 13% of Accelerated Depreciation Allowance goes to the oil industry, and applied that to the $35B that OMB estimates for the whole economy, that would amount to an extra $4.5B. That would more than double the total estimated subsidy to oil and gas, for instance, but even then the total subsidy as a proportion of private spending would be very small.
NW, no I was asking Vaughan, but your link works. Personally, I have never seen anything outrageous with the oil, gas “subsidies” than it is with any other business. Every energy business I know of has gotten some type of subsidy in the US. Gas prices are high now, but this has about 30% of the price here.
http://finance.yahoo.com/echarts?s=eurusd=x#chart2:symbol=eurusd=x;range=my;indicator=volume;charttype=line;crosshair=on;ohlcvalues=0;logscale=off;source=undefined
I am all for simplifying the tax laws, but accelerated depreciation is not what I consider a subsidy for a high risk business.
No real argument from me Captain D. I’m trying to be generous to anyone who thinks nonrenewables subsidies are a huge big deal… Even being generous, it looks to me like 2% at best of total spending. Given the routine levels of variance of consumer energy prices, consumers would hardly notice if all of these subsidies went away. I don’t mean that as an argument for eliminating the subsidies; as George Stigler once quipped, we economists cannot hector the public about destroying lovely trees to make more books, but we can weigh the ashes. :)
I’d say my position was close to NW’s: the subsidies don’t seem to be needed, but eliminating them isn’t going to have a big impact. Returning $10B worth of subsidies to the taxpayer would at best pay for a tank of gas for each motorist in the country.
This incidentally was in the context of Rob Starkey’s comment about people trying to implement “basic, very expensive changes to the economy,” which I claimed would “impact only those exploiting the carbon cycle, as either producers or consumers of fossil fuel based products and services.” Taking the oil subsidies as a point of calibration, are those people who like Rob seem to be protesting the cost of these changes talking about more or less than the oil subsidies? And, since everyone’s loss is someone’s gain (after the lawyers and stockbrokers have taken their cut), cost to whom? And would the result if implemented be more or less equitable than the current system of subsidies (apart from the argument that “we’ve always done it that way”)?
Thank you, Dr. Curry, for the courage to state the truth. We don’t know. That is refreshing honesty.
We don’t know.
I never object to this sentiment except when the speaker seems to be extending “we” to those who do happen to know. But even then I keep my objections to myself, since to do otherwise is to project a socially unacceptable and no doubt misguided “know-more-than-thou” attitude.
Just because I happen to know where I buried that $100 bill in my garden last week, or the factors of
614151724980716755410413346544646313287,
is no reason to claim intellectual superiority over those who don’t.
One of the drawbacks of having a university degree in science is that 90% of the people you encounter at cocktail parties and on blogs don’t. When they say “we,” my experience has been that it’s counterproductive to exclude oneself. Instead I just think to myself that they are probably infinitely wiser than me in such nonscientific matters as baseball statistics or climate discussions on blogs like this one, where the “science” such as it is is “understood” by all participants including the moderator.
For me to pretend otherwise would be a grave lapse in manners that Judith Martin would have a sharp word or two about.
Just because I happen to know where I buried that $100 bill in my garden last week, or the factors of
614151724980716755410413346544646313287,
is no reason to claim intellectual superiority over those who don’t
Easier to say, “I don’t know.”
It is not impossible to misapply “We don’t know” for a variety of reasons. That has not happened here. The uncertainties and solid conflicting hypotheses keep us from honestly saying we do know. Not that some are unwilling to say as much dishonestly.
Why do I get the feeling boy scientist in training Chris Colose is about to have his okole handed to him again.
Seifert, have you committed yourself heart and soul to a mechanism for the 61-year cycle?
If so we can talk about next week’s weather instead of next decade’s climate.
But if not, are oscillations in the magma among your conceivable mechanisms for this cycle?
Vaughan Pratt
The observed 60-year cycle is there in the record (as Girma has shown us pretty clearly), so its existence cannot be denied.
We do not know the “mechanism” for that cycle (which does not mean, of course, that the observed cycle cannot exist – just that we don’t understand its mechanism)..
But we can be pretty sure that it is not human-caused atmospheric CO2, which has not gone through such cycles, but has increased at a fairly steady exponential rate.
All makes sense to me, Vaughan.
Max
Vaughan Pratt
Just to clarify, I was including you in that “we”.
Max
The observed 60-year cycle is there in the record (as Girma has shown us pretty clearly)
It’s telling that you feel you have to take Girma as the authority for a phenomenon that has been in the literature for at least a couple of decades, Max. I can understand quoting Girma’s faulty logic, but why his facts when they’re available in the literature?
From a global (as opposed to ocean-by-ocean) standpoint, the alleged 60-year cycle may be better understood as the second and third harmonics of a 151 year inverse sawtooth triggering in 1925, with respective amplitudes 0.09 and 0.06 °C as manifested in HADCRUT3VGL. The appearance of a 60-year periodicity results from the beats between the 75- and 60-year periods of the respective harmonics.
The fourth and fifth harmonics are also observable in HADCRUT3, albeit quite attenuated.
Hmm, the old ‘missing mechanism’ – trick.
( H/T Get Smart. )
Dern tootin, BC. They should have a law requiring full disclosure of missing mechanisms on Craigslist.
If the washing machine gets the clothes cleaned, I really don’t care whether it has a gonkulator.
Addressed to Chris Colose in a further reference to:
http://www.vukcevic.talktalk.net/CET1690-1960.htm
curryja: Agreed. If this is correct, then arguing that 25 years at the end of the 20th century is AGW sounds pretty weak.
Chris Colose: Of course it does: let me go make my own amateur graph of some random variable (maybe the number of cows in Idaho).
Chris
I do not know if you are amateur or professional in any field of science, but if you are in the climate science you taken whole of your profession one more step further on the down-escalator of respect.
Here are couple of points, without being disrespectful to the cows of Idaho:
-The CET is not any variable, it is the oldest and most accurately kept temperature record in the world
-As a ‘scientist’, your lack of knowledge of historical data is appalling: global temperatures have high degree of correlation with the CET for the entirety of the GT’s record
http://www.vukcevic.talktalk.net/CGNh.htm
So Mr Colose before you are exposed to a further ridicule, go and do your homework and take a good look at the data on which your science was initiated, learn and understand what the climatologists of the yesteryear Walker, Lamb, Eddy and many others have bequeathed to you.
-The CET is not any variable, it is the oldest and most accurately kept temperature record in the world
Also the one using the greatest proportion of primitive instruments (the mercury thermometer was not invented until 1714, by Daniel Fahrenheit) and covering the least proportion of the globe (on the order of 0.01%).
As an indicator of global temperature, Central England also suffers from the unknown vagaries of the Gulf Stream, which has a profound influence on its temperature, as well as some of the characteristics of an island such as the strong heat-sink effect of the surrounding sea. The latter will likely keep the CET temperature rise between now and 2100 to about half of what your homeland Montenegro will experience.
These factors combine to make CET a very poor indicator of future temperature relative to HADCRUT3. In particular the heat sink effect will result in a prediction of much less dire consequences of global warming.
Those seeking to minimize the likely impact of AGW could do worse than to tout the predictive virtues of CET.
Vaughan – old buddy – I think it something called cyclomania. There are probably not actually cycles as such but usually shifts to nearby, topologically speaking, phase spaces. As chaotic as the orbits of the planets around the centre of gravity of the solar system. I think it might have something to do with the solar magneto – but there is obviously solar variability on 11 year, 22 year and longer scales.
Can we talk about the weather now?
Atlantic Multi-decadal Oscillation (AMO) strongly positive –
http://ioc-goos-oopc.org/state_of_the_ocean/atm/amo.php
‘AMO is correlated to air temperatures and rainfall over much of the Northern Hemisphere… It is also associated with changes in the frequency of North American droughts and is reflected in the frequency of severe Atlantic hurricanes…
Research suggests that the AMO is related to the past occurrence of major droughts in the US Midwest and the Southwest. When the AMO is in its warm phase, these droughts tend to be more frequent or prolonged. Two of the most severe droughts of the 20th century occurred during the positive AMO between 1925 and 1965: The Dust Bowl of the 1930s and the 1950s drought. Florida and the Pacific Northwest tend to be the opposite—warm AMO, more rainfall.’ Cold NH winters, snow, temperature falling.
PDO strongly negative –
http://ioc-goos-oopc.org/state_of_the_ocean/atm/pdo.php
Associated with more intense and frequent La Niña. Cooler globally – wet summers in Australia and Indonesia – associated with the monsoon in India, Pakistan, flooding in China, rainfall in Central Africa and the Mediterranean. Drought in North and South America.
AO marginally positive
http://ioc-goos-oopc.org/state_of_the_ocean/atm/ao.php
Probably seasonal – tending negative since 1995 – covaries with the AMO and has similar effects. It involves the movement of atmospheric mass more or less southerly.
Sothern Oscillation Index marginally positive
http://www.bom.gov.au/climate/current/soi2.shtml
Entering the ENSO window of unpredictability – predicts ENSO 7 months ahead.
http://ioc-goos-oopc.org/state_of_the_ocean/all/
Southern Annular Mode currently negative and trending negative – early and wet start to the SH winter. Good snow season. Winter rain for southern Africa, Ostraya and South America
http://www.antarctica.ac.uk/met/gjma/sam.html
I call these patterns and others standing waves in the Earth’s climate system. There is persistence that allows qualitative prediction seasonally to decadally. The pattern of rainfall in Australia leads to the Central Pacific and thence to the polar vortices and we have a hint there of a response to UV variability. I always like mechs. and staying close to the data.
Best regards
Captain Kangaroo
JC – Jones et al is not an observational study. It is not even a climate modeling exercise. What they have done is use a model that models a model to model a model that models climate. Their results say nothing about expected climate in the 21st century. They only speak to expected model results.
The “climate scientists” conflation of models with reality is reaching absurd levels. They no longer feel the need to observe even their models. They just model the models.
And even at that, Jones’ “sensitivity analysis” only used a variation in solar effect of maximum 3X, despite explicitly acknowledging theories that purport to operate at order of magnitude levels. All they have done is told us that IPCC models which assume a very, very tiny solar effect are expected to show a very tiny solar effect if you make a small change in their solar sensitivity assumption.
Duh.
How many tens of thousands did that pointless exercise cost the taxpayers?
Been walking on the beach during Australia’s southern states Labour Day long week end. White sand, sea like blue silk, guess we westerners are lucky to have our special places,( a la the sacred Hayek.)
Happy though to be back at Judith’s E, ( neo ‘Enlightenment) Salon. What a great post challenging the IPCC’s ‘brief’ :
Kim ‘desperately hoping that the anthro co 2 mechanism can be found, though we don’t see much evidence that it can,’ :-) Tony b’s historic record bringing in the Four Horsemen of the Apocalypse, hard to argue with them so fergit callabrations, Max M concluding ‘we just don’t know what the mechanism is.’ Paul V thinking ‘a bright individual with time and resources, should be able to crack Enso’s DNA.’ Chief K finding that ‘observations show large changes in UV, implying a top down solar modulation mechanism, a UV/Enso connection,’ Judith Curry suggesting that ‘if the sun is a major driver, somewhere around 2020, it’s gonna get interesting.’
As an escapee from the humanities narrow paradigm, I’m findin’ it interesting now.
Beth
Welcome back to the site. (But I’ll admit I envy you walking the white sand beach – we’re still shoveling snow in Switzerland.)
Max
Re: http://judithcurry.com/2012/03/10/21st-century-solar-cooling/#comment-184269
(http://www.vukcevic.talktalk.net/CET1690-1960.htm)
Chris Colose said: Of course it does: let me go make my own amateur graph of some random variable (maybe the number of cows in Idaho).
Thousands of men and women in many locations across England since 1660 made a daily effort to take temperature readings, of which a 350 year long record was established. From the very early days to the present day, every true climate scientist has used it as a reference in expanding their knowledge.
And what do we have now is, regretfully from Chris Colose comparing this most valuable historical reference to the number of cows in Idaho.
Chris there is no need to apologise to those valiant people down the centuries, since it wouldn’t have any more value than your ’number of cows in Idaho’ does to the historical temperature records.
The history of solar-cycle modeling is well-documented:
In every decade, the people who are least inclined to cite this history, are the same people who are most included to repeat it.
henceforth
We shall institute new history which can not be ever repeated.
We shall call it: Anthropogenic Global warming!
A physicist
You write about failed forecasts made by solar scientists and cite a paper listing some early work in the 1930s.
Let me cite a more pertinent recent failed forecast made by IPCC (first in TAR then in AR4):
The forecast was that temperature in the first decades of the new century would increase by 0.2 deg C per decade under normal business as usual emission scenarios, and by 0.1 deg C per decade “even if the concentrations of all greenhouse gases and aerosols had been kept constant at year 2000 levels”.
CO2 rose as forecast, but not only did IPCC miss the magnitude, they even missed the sign of the temperature change!
It cooled slightly over the first 11 years of the new century.
Max
Please forgive me if I let off some steam. We all know what the “scientific method” is. The trouble with CAGW is we cannot use the scientific method because we cannot control the atmosphere. We are putting gigatonnes of CO2 into the atmopshere each year, and it ought to be affecting temperatures. But, after 30 years or so, no-one seems to be particularly interested in detecting a CO2 signal, and from this signal getting a direct measurement of climate sensitivity. Our hostess has a hypothesis about Arctic open ocean and snowfall. We cannot go out and clear the Arctic so that it is 56.445% free of ice, and then see what happens to snowfall. But next September Mother Nature will clear some of the Arctic Ocean, and we can measure this, and then predict what will happen to the snowfall. But, no, this is not a good idea.
In the case of solar effects, I mentioned the recent Forbush Decrease. I have not seen that anyone else has mentioned it here on Climate Etc. Sun spot 1429 recently put out 2 X flares a 5.4 and a 1.3 IIRC, together with a CME; all vagurely earth directed. As a result there was a massive 15% reduction of cosmic rays getting to the earth’s atmosphere. Now Svensmark has a hypothesis that the sun’s magnetic field controls GCRs, GCRs control clouds and clouds control climate. Here we have an opportunity to see what actually happens when the flux of GCRs is suddenly reduced by 15%. I try, from here in Ottawa, Canada to search the internet to find out what happened. I cannot find anything.
But on Climate Etc. the denizens do not seem to be the slightest bit interested. Am I somehow unique in thinking that this is an important event in trying to find out if Svnesmark is right? Am I somehow peculiar? Or is modelling models more important than measured data?
I am not sure whether to laugh or cry.
http://judithcurry.com/2012/03/09/week-in-review-3912/#comment-183676
Results in 3-2-1…….
================
vukcevik. Thanks. But where can I find what actaully happened?
I suspect that if the skies cleared we’ll hear about it soon. And I suspect that if they didn’t clear we’ll hear about it soon. And I expect the ensuing discussion to be as clear as a London fog in days of yore.
====================
“We all know what the “scientific method” is. The trouble with CAGW is we cannot use the scientific method because we cannot control the atmosphere.”
+1. We’d all do well to remember that climate science is, in large measure, heavily dependent on quasi-experimental methods, just like macroeconomics. It’s a very tough nut, empirically speaking. When certain people prattle on about how so-and-so can be explained largely by vector X, I invariably think “but what about omitted variable bias?” I really don’t care about how big your R-squared is: The coefficient on any included variable could be highly significant in “your model,” but its true value could be zero in the “true model” if your included variables are highly correlated with excluded variable X.
So let us cease this tiresome repetition of R-squared statistics, forever more.
We have a lot of people very certain the the climate is driven by CO2. Others certain that it is driven by the Sun, in some shape or form.
I’m not sure why it should be any single factor or even any small number of factors.
Chaos theory is way outside my areas of expertise, but if Climate is chaotic, why should we expect it to fit simple “if-then” logic.
Am I missing something fundamental?
My main question on everything solar is: What do we really no about past changes (TSI, UV, GCR …)?
Reading some paper’s on 10Be, I’d say less than many studies suggest (Svalgaard linked to one of them on wuwt the other day).
One also should probably think about the slides of Svalgaard and Lean at the Nagoya-Workshop (as linked to by wuwt here: http://wattsupwiththat.com/2012/02/08/interesting-presentations-from-the-nagoya-workshop-on-the-relationship-between-solar-activity-and-climate-changes/).
The above comments confirm the basic problem; Peter Gleick and a few other members of the NAS (US National Academy of Science and AGU (American Geophysical Union) suffer from an illusion of control that violates the very foundation of science:
Reality is controlled by cause-and-effect, not by knobs in the hands of world leaders, Peter Gleick, NAS or AGU. We are living (dynamic) parts of that great, dynamic Reality.
The universe is dynamic because of dynamic competition between the
a.) Weak, long-range force of gravitational attraction, and the
b.) Strong, short-range force of neutron repulsion that causes
Neutron-rich cores of galaxies, stars and heavy nuclei to fragment and release neutrons that become interstellar atoms (when the universe is expanding) and to become compressed neutrons again (when the universe again contracts).
The volume change when a neutron becomes an interstellar atom, or an interstellar atom becomes a neutron is about 10^39!
http://www.springerlink.com/content/x1n87370x6685079/
http://dl.dropbox.com/u/10640850/Neutron_repulsion.pdf
Stubborn refusal to accept Reality (the ancients called it God) is the root of the problem.
The sun is still on the main sequence, so the long term trend is to increased TSI.
Even if we do see a Maunder type minimum this century, the sun’s activity will return to active periods afterward, and we should find no panacea in short term periods of low solar activity.
http://climaterealists.com/index.php?id=6645
“How The Sun Could Control Earth’s Temperature”
A study of the Earth’s albedo (project “Earthshine”) shows that the amount of reflected sunlight does not vary with increases in greenhouse gases. The “Earthshine” data shows that the Earth’s albedo fell up to 1997 and rose after 2001.
What was learned is that climate change is related to albedo, as a result of the change in the amount of energy from the sun that is absorbed by the Earth. For example, fewer clouds means less reflectivity which results in a warmer Earth. And, this happened through about 1998. Conversely, more clouds means greater reflectivity which results in a cooler Earth. And this happened after 1998.
It is logical to presume that changes in Earth’s albedo are due to increases and decreases in low cloud cover, which in turn is related to the climate change that we have observed during the 20th Century, including the present global cooling. However, we see that climate variability over the same period is not related to changes in atmospheric greenhouse gases.
Obviously, the amount of `climate forcing’ that may be due to changes in atmospheric greenhouse gases is either overstated or countervailing forces are at work that GCMs simply ignore. GCMs fail to account for changes in the Earth’s albedo. Accordingly, GCMs do not account for the effect that the Earth’s albedo has on the amount of solar energy that is absorbed by the Earth.
I think this whole discussion is interesting because there seems to be a blind spot in climate science for solar influences, despite the Lord Gavin’s claim that to say this is a strawman.
Lets review: If you look at Muller’s book for example, there seems to be a concensus that orbital changes are correlated with the ice age interglacial cycle. We don’t know the exact mechanism even though it seems pausible to me that changes in distribution of solar forcing could initiate positive feedback loops with regard to ice albedo, ocean circulation, aerosols, CO2, etc. The exact mechanism seems to remain a mystery. One must say that these changes to climate are large and would be disasterous for human civilization were we to enter an ice age.
And this is the whole problem with simple energy balance models of climate. They are incapable of explaining the most significant feature of climate over the last 10 million years. I would be interested to know if GCM’s can reproduce similar changes. I am skeptical but open to further evidence.
What Judith is on to is that even our estimates of total solar irradiance seem pretty uncertain and our knowledge of its time history is even more uncertain. And then there is the CERN experiment which may shed light on aerosol interaction with clouds. Climate science seems to be stuck at the Lyell uniformitarianism stage with regard to both geological and solar influences.
The ice ages fit with the energy balance model in a simple way. Orbital changes affect the north polar summer albedo through changing the distribution of solar radiation through the year. Average albedo is a component of the energy balance model. It is not a variation in the solar flux part per se, only the albedo, which is the forcing in this case.
I agree with Jim D, and think the ice age data is very well understood and only has to be better articulated to wider audience.
I spent yesterday cleaning up a very concise model that I developed relating CO2 and temperature for the several hundred thousand year long Vostok paleoclimate record. One motivation is that it all has to fit together, including what some consider as anti-GHG evidence, such as the lag of CO2 outgassing due to ocean warming. By the same token we should include the even more critical lag of CO2 sequestering with ocean cooling.
So the climate sensitivity not only has to include the first-order GHG effect, but the additional terms due to the CO2 outgassing and the positive feedbacks associated with albedo changes and methane. Then there is the unknown effect due to water vapor.
Climate scientists have always said that the paleoclimate data is very useful to estimating the climate sensitivity and after going through the exercise, I agree with that. I can see a climate sensitivity of anywhere between 2.5 and 5 generating the excursions seen with the Vostok data.
This is the concise αβ model I came up with:
http://theoilconundrum.blogspot.com/2012/03/co2-outgassing-model.html
Re: CERN experiment aerosol interaction with clouds:
http://judithcurry.com/2012/03/09/week-in-review-3912/#comment-184027
‘I would be interested to know if GCM’s can reproduce similar changes.’
If your question is ‘If GCMs were perturbed solely by time-evolving orbital parameter changes, would they produce surface and atmospheric changes similar to those seen in paleoclimate data?’ I would suggest the answer is no. With the caveat that I’m not a climate modeller and have never used a GCM, I’ll try to explain my reasons for this belief.
As you note, the orbital changes manifest as an alteration of the annual distribution of solar energy on the Earth’s surface and not necessarily as a change in the total energy received from the Sun. At the beginning of the last deglaciation period this distribution was such that the giant ice sheets covering high latitudes in the Northern Hemisphere began to melt. This led to large regional albedo changes and subsequently to significant release of long-lived GHGs (mainly CO2, methane and N2O) into the atmosphere, which ‘globalised’ the changes. These changes fed back onto each other before terminating at our present epoch – the Holocene.
The thing to note here is that it is the albedo and GHG changes which are really the driver of global warming over this period rather than the orbital changes, in the sense that, without the changes of ice sheet mass balance, there probably wouldn’t be much of an effect on global temperatures due to orbital changes alone. One interesting point which is not often noted is that orbital parameters today are in a very similar configuration to how they were at the Last Glacial Maximum (LGM) – again, it’s the albedo and GHGs which make the difference.
GCMs are generally built to model ‘fast-feedback’ climate responses – e.g. water vapour and clouds. As noted in many discussions of sea level rise they are not good at dynamic changes in the cryosphere – ice sheets and glaciers in particular – and most don’t feature interactive vegetation or carbon cycle modules (note that recently ‘Earth System Models’ have been developed which do feature these things, though I would suggest it’s early days). As such I doubt GCMs could invoke the cryospheric and atmopsheric composition changes with enough accuracy to reproduce observed glacial cycles. If albedo and GHG concentration changes were prescribed from observations/external modelling I’ve no doubt GCMs could reproduce similar behaviour, but perhaps you’d regard that as cheating(?)
It’s a somewhat academic question though. Running a full resolution GCM from just the LGM (let alone through a few glacial cycles) to present-day would take several years on a supercomputer. What usually happens with GCMs for modelling these changes is that models are run under constant present-day / preindustrial conditions for a few hundred (model) years, then compared to a run under LGM conditions. See this PMIP2 paper for details.
Sorry, my response is at the bottom of the thread.
The sun is going to teach all of us a lot over this next minimum, the main thing being is that the sun drives our climate not CO2. Of course some folk are more open to learn new things than others…
Arrogant, Godless, self-centeredness is the root problem.
Reality (God) controls man. Man cannot control reality.
For decades the US NAS (US National Academy of Sciences), AGU (American Geophysical Union), the UK’s RS (Royal Society) and the UN (United Nations) vainly tried to control Reality (“What is”, “God”, etc.)
Failing that, they tried to control information:
“Al Gore, the UN, the EU, NAS, RS and world leaders are in control.”
“We will provide fusion reactors that operate like the Sun.”
“Hydrogen-fusion reactors will be available soon.”
“Industrial CO2 caused global warming.”
“Our economy is recovering.”
“Green jobs will save us.”
“Vote for us again!”
Reality:
http://www.weatheraction.com/docs/WANews12No12.pdf
http://www.springerlink.com/content/x1n87370x6685079/
http://dl.dropbox.com/u/10640850/Neutron_repulsion.pdf
http://www.youtube.com/watch?v=4xKRBkBBEP0
Looks like juniors (Colose, Gates) are not making much impact so watch out for further blast from the big gun Gavin.
„Observations and reconstructions of solar activity over the last 9000 years are used as a constraint on possible future variations to produce probability distributions of total solar irradiance over the next 100 years. Using this information, with a simple climate model, we present results of the potential implications for future projections of climate on decadal to multidecadal timescales. Using one of the most recent reconstructions of historic total solar irradiance, the likely reduction in the warming by 2100 is found to be
between 0.06 and 0.1 K, ..“
I assume that the reconstructions of the solar activity over the last 9000 years are taken from isotope data of samples like stalagmites. Consider proxy spectra of the last 9000 years (Bond et al.) one can find by a frequency analysis, that a frequency of about 2/1827 years have major magnitude. But also the proxies from China caves are in coincidence with this frequency. The frequency can be allocated to an astronomic function of a heliocentric tide function of the objects Quaoar and Pluto, especially from the solar tide profile.
http://www.volker-doormann.org/images/cycles_10ka.gif
It seems that to project future climate this astronomical method is superior to all other methods and models. This is shown in the next graph. It gives a function not only for multidecal timescales but until 3000 CE.
http://www.volker-doormann.org/images/cycles_10kb.gif
I have not seen any frequency analysis of the last 9000 years in the paper.
However, life goes on.
V.
Well it is now well accepted that solar forcing via Milankovitch cycles cause ice ages and recoveries from same. This acceptance was reached because the latest corrected correlation was far too good to ignore.
So all this blather about there being no mechanism or the amplification factor on tsi needing to be about x10 is utterly irrelevant since we already know on a macro scale that massive cooling and heating is possible from the sun alone and with no CO2 input whatsoever. So why not on a micro scale? Good grief, it isn’t even controversial; it used to be the old consensus position before unlimited funding was made available for demonising CO2.
Yes of course all scientists and activists who financially depend on the scare will tell you to be scared. Funding-alarmism-more funding-more alarmism is the only real positive feedback in this entire farrago.
And when the Earth starts cooling down again by another miniscule and irrelevant few tenths of a degree the new-old scare will be aerosols – also caused by fossil fuels. And we’ll be informed again by more faux “experts” that it’s already too late to avoid thermageddon – just like last time.
James: You made a good observation: Milankovitch dedicated
himself to the longest term cycles (21,400; 44,000, 100,000 years);
but there still remain the shorter term cycles, which he could not
tackle 80 years ago….. If he lived today, he would scrutinize the
shorter term cycles, as there is the 800 year and the 61 year
short term cycle of forceful strength….The Warmist propaganda
is hiding shorter astronomic cycles, because both astronomic
places JPL- DE 405 and Louvain (Belgium) -VSOP87
are breeding grounds of Warmism, hiding the cycles carefully…..
— no joke —pure truth…..
The purpose is that CO2 gets the warming force accredited instead
of natural cycles…. which is political, collusion for the “cause”…..
once again…..but they will loose, because they made a fundamental
mistake: The assumed, that CO2 would do the warming job since
the year 2000, although knowing, that the 61 year cycle is producing a flat
temp. plateau for 40 years (2000-2040)!
But the CO2 does nothing, and Hansen therefore
puts warming “into the pipeline” or hiding at the bottom of the sea (like at
Loch Ness, only Hansen has had a glimps of it…..
In a few years we will witness the end of Warmism: The natural
cycles will finish them off….wait and see….
JS
JS
“JC summary question: So, how many people are convinced that a reduction of solar irradiance comparable to the Maunder Minimum would translate to a cooling of about 0.1C?”
Personally, I haven’t the slightest clue. However, I have a few follow on questions:
How many people are convinced that the only mechanism via which the sun influences our climate is TSI?
Also, there is a great deal of discussion of ‘climate forcings’ and their relative influence on climate as determined by various climate models.
How many people are convinced that the climate modelers have available an exhaustive list of all climate forcings and understand the mechanism via which they influence climate well enough to incorporate them into their climate models effectively?
And, how many people, postulating the availability of an exhaustive list of climate forcings, could predict the future trends of those forcings accurately enough that climate models incorporating those forcings would be meaningful over century timeframes?
As I understand it, the above questions are meaningless because, as Dr. Curry pointed out above, the implicit assumption (axiom) of the IPCC is that anthropogenic CO2 is the dominate climate change forcing and the influence of any other forcings is negligible.
No, part of 1910-1940 could be solar, but skeptics are reluctant to accept this as an explanation even with several lines of evidence for it. This is a fairly biased behavior in my view.
?
Put it this way. I have yet to see a skeptic accept that the 1910-1940 bump was explained by the solar increase at that same time. They prefer to say they don’t understand it, so therefore we don’t understand everything, so therefore CO2 doesn’t explain the recent decades either. Isn’t that the logic they use?
I don’t know about other skeptics, but I think almost all variation in the instrumental record is solar caused. As far as I can say, many other skeptics think it’s mainly solar.
You would have a harder case with that during the period when TSI has been measured and hasn’t been varying so much, which is the last 40 years.
I don’t think it’s the TSI, but even the flat TSI can cause warming, depending on the previous variation (thermal inertia).
CO2 explains nothing.
Solar on the other hand explains all of the recent warming.
http://i40.tinypic.com/xgfyok.jpg
http://i51.tinypic.com/eb3pmb.jpg
If only people had theories about that it would be looked at. Look at GCRs, for example. People have looked at that, and some are serious about it, but nothing significant has been demonstrated yet.
Yes, sunshine, aerosol reduction could be another anthropogenic factor in warming. I think the IPCC have accepted that some formerly polluted regions may have that, including the two sites you picked.
More than 2 sites. Way more …
http://i55.tinypic.com/34qk01z.jpg
.5W/^m/year
Jim D
You write:
I think you have it backward.
Skeptics can very well accept the view of several solar scientists that around 50% of total 20th century warming can be attributed to the unusually high solar activity (highest in several thousand years). This breaks down to around two-thirds of the warming of the 1910-1940 warming cycle and one-third of the warming over the 1970-2000 warming cycle.
Following this logic and the IPCC estimate that all other anthropogenic factors (other GHGs, aerosols, etc.) cancelled one another out, we end up with a calculated 2xCO2 temperature response of 0.8 degC
IPCC (the “mainstream consensus” view) states that the cause of the that “most of the warming after 1950 was caused by human GHGs” and that “the observed warming can only be reproduced when models are forced with combinations of external forcings that include anthropogenic forcings”.
IPCC also concedes that “detection and attribution as well as modelling studies indicate more uncertainty regarding the causes of early 20th century warming than the recent warming”.
So the logic goes as follows:
1. Our models cannot explain the early 20th century warming.
2. We know that the statistically indistinguishable late 20th century warming was caused principally by human GHGs.
3. How do we know this?
4. Because our models cannot explain it any other way.
So the “logic trap” is not with the skeptics, Jim, it’s with IPCC.
Max
The thing about 1910-1940 being partly solar is that it is something that fits with scientific evidence and is plausibly explained by realistic solar changes even if solar fluxes not being measured at the time. More recently, solar flux observations act as an additional constraint.
Jim D said, “The thing about 1910-1940 being partly solar is that it is something that fits with scientific evidence and is plausibly explained by realistic solar changes even if solar fluxes not being measured at the time. More recently, solar flux observations act as an additional constraint.”
Playing the Schrodinger’s cat card? The observations just indicate that the direct effects of TSI are not sufficient to cause more than 0.1K change on their own. The stronger correlation with the Hale cycle would indicate a magnetic effect is involved. The difference in the Antarctic and Arctic responses to CO2 forcing (allowing for various sources of noise), would tend to confirm a magnetic influence of some magnitude.
Combined, “The data indicates that further research is warranted.”
The worst part of the political nature of this debate is it severely detracts from some interesting scientific discovery. It would be nice if more of that discovery was in the physical sciences instead of the social sciences :)
Max
2. We know that the statistically indistinguishable late 20th century warming was caused principally by human GHGs.
I have found the 30-years trend for 1915 to 1945 to be IDENTICAL to the recent trend for 1970 to 2000.
http://bit.ly/xBpREA
So you can replace your “statistically indistinguishable” with “identical”
We already know there is a correlation between solar activity and thunderstorms. Recent evidence indicates tropospheric over shooting affects the stratospheric composition much more than previously believed. The concentration of solar forcing attribution on just TSI seems to be poorly thought out.
No Judith. It is not just solar activity that affects long-term natural cycles. It also has to do with the mean distance from the Earth and many other factors such as the Jupiter/Saturn resonance cycle. See the Appendix of my paper radiated Energy and the Second Law of Thermodynamics.
tomorrow.
@ Doug Cotton | March 11, 2012 at 11:38 pm
Dough, in your horoscope, you are including even Jupiter / Saturn; good on you. The tea cup reads: there is NO such a thing as GLOBAL warming. Maybe Jupiter / Saturn make it to be day and night here – because nights are usually colder than during the day; for unknown reason. Is it maybe, Jupiter/ Saturn during the day are not up in the sky doing nothing, but are under our planet warming it?!
Doug, the only heavenly bodies that interferes with the sunlight, is the moon, Venus and Mercury. They reflect lots of sunlight not to come to here – when they go between the sun and the earth – but the temperature stays the same. Because oxygen + nitrogen shrink for the duration a bit – nobody even notices any difference. Your wild imaginations will bring you lots of disappointments and lots of wasted time. Don’t worry, there isn’t any GLOBAL warming, they are lying; don’t have any sleepless nights, because of the IPCC’s lies. Extra heat in planet’s atmosphere is not accumulative. They pretend to monitor the temperature on the WHOLE planet, but they don’t.
“how many people are convinced that a reduction of solar irradiance comparable to the Maunder Minimum would translate to a cooling of about 0.1C?”
I believe that the solar insolation isn’t the issue and that Svensmark is on the right track with albedo changes resulting from an increase in Galactic cosmic rays due to weaker solar magnetics resulting in greater cloud cover.
Irradiance changes by themselves are likely to result in negligible change. Changes due to a weakened magnetic field may greatly swamp any change in irradiance.
George
I tend to agree with you. Direct solar irradiance is not the primary solar forcing mechanism.
The GCR cloud hypothesis of Svensmark et al. is being tested at CERN today. A first preliminary report confirmed the GCR cloud nucleation effect under experimental conditions, but more work is being done to quantify the effect in our atmosphere.
Svensmark et al. showed earlier that the historical records of solar activity correlated very well with global temperature (actually much better than CO2 with temperature). They also showed a cosmic ray nucleation effect in a simple lab experiment, but this needed to be redone on a larger scale under controlled conditions, and hence the CLOUD project at CERN.
It will be very interesting to see the next report from CERN on this experiment.
If this work really does validate the Svensmark hypothesis with reproducible experimental results, it will be a major blow to the “mainstream consensus” CAGW paradigm, but a giant step for climate science.
Max
It is wasted time to write here.
bye.
V.
Max M @12/3 4.23am.
Thank you for your for kind message, Max
You and your family keep warm now.
Do you have a St Bernard dog? )
stefanthedenier says: March 12, 2012 at 2:19 am |
“ the only heavenly bodies that interferes with the sunlight, is the moon, Venus and Mercury. They reflect lots of sunlight not to come to here – when they go between the sun and the earth – but the temperature stays the same. “
That’s no true. If Mercury goes between Sun and Earth (or Sun goes between Mercury and Earth), the global temperature is increased:
http://www.volker-doormann.org/images/sea_level_vs_rst.gif
http://www.volker-doormann.org/Sea_level_vs_solar_tides1.htm
V.
From attending a Paclim meeting about a decade ago, I came away with the following impressions:
1. Weather/climate specialists essentially agreed with the IPCC that sensitivity to solar forcing is low, because of their understanding of the mechanisms
2. Geologists overwhelmingly disagreed because the evidence of 11 year cycles in rocks is almost everywhere they look, which told them that understanding of mechanisms must be missing something.
Svensmark’s cosmic ray hypothesis and UV are two possibilities for mechanisms. Perhaps there will be others.
I’m surprised there has been no mention on this thread of Nir Shaviv’s work on using the oceans as a calorimeter, which seems to be additional support for the geologists’ suspicions that understanding of solar forcing mechanisms is seriously deficient.
(And for perspective, I am not placing all or even most of my bets on solar forcing, as I have a healthy respect for internal variability.)
I’m somewhat surprised that Geologists are able to date rocks to a resolution where 11-year cycles can be observed. What exactly were they looking at?
A number of statistical methods have been used to discern a fairly clear ~0.1ºC influence from solar maximum to minimum using the good quality modern data available. Theoretically this relationship could be different at other times. For example, when Earth’s orbital configuration is such that Northern Hemisphere insolation is at a maximum, as was pretty much the case about 10,000 years ago, I would naively expect a greater amplitude.
Really though the question isn’t about the 11-year cycle, but rather the multidecadal to centennial scale changes in solar activity.
Sorry I can’t help further with the rocks, I’m not a geologist. This is just a tip if you’re interested.
I agree it’s not about the 11 year cycle per se; my impression was that the no-mechanism adherents believed the sensitivity is too small to produce 11 year cycles, hence too small to produce substantial centennial variability.
And I’m not saying the geologists thought solar forcing is significant on centennial time scales. I heard no such claim. They just didn’t think much of the no-mechanism argument.
USGS Fact Sheet FS-095-00
August 2000
discusses two examples of sediment cores with 11 year cycles
I know nothing from nothing, except that I am very sure the scientists in 100 years will know an incredible amount more than they do now. I saw a well known physicist say that they knew about 4% of what they could know about matter. I just wish they would hurry up.
What significant other worldly events took place between the 1940’s onward? Has anyone considered the impact of Tsar Bomba or the other 2006 nuclear blasts during that period? If we’re going to *guess* at anthropogenic causes why not that? Did we blow a few holes in our egg shell?
Jim, I’m not impressed by the albedo changes in simple energy balance models. The problem is that its the distribution of the albedo, not the average that determines the changes. What you can’t do in simple energy balance is the fact that the distribution is critical for feedbacks which are really huge influences, much more important than the doctrine of the “forced variation” idea we see all the time. The problem here is the way people switch between various lines of evidence. If you challenge GCM’s, people say, its really paleoclimate. It you point out that its highly unlikely that we have even an approximate handle on paleoclimate forcings and feedbacks, people say that its simple energy balance models that tell us the truth. If you point out the inconvenient facts about distribution of forcings and feedbacks, they call names and start to sound like Web. The simple fact of the matter is that we don’t have a good handle on these things and we need better methods and data.
I have pointed this out before and noone has a good response. Simple consevation of energy is a very weak constraint in fluid dynamics. Its the dynamics that are critical in virtually all situations. It’s the kind of calculation that’s easy to do and has little relevance except as a foil against which to test more complex mechanisms.
David Young
Re: “conservation of energy is a very weak constraint”
From basic physics in the normal process of nature*
1) Energy conservation is an ABSOLUTE LAW which ALWAYS rules.
2) Mass conservation is an ABSOLUTE LAW which ALWAYS rules
3) The second law ALWAYS rules.
If your models do not provide for energy conservation, mass conservation, and the 2nd law, you have nothing credible to say to any engineer or scientist!
*excluding creation and miracles. For those, see CS Lewis, Miracles
Re: “The problem is that its the distribution of the albedo, not the average that determines the changes.”
BOTH impact changes. The atmosphere and ocean circulate. The Average albedo impacts glaciers and ice ages. See Ice Age.
David,
Simple energy balance models offer a simplification. I’m not sure anyone is under the illusion that they can precisely predict all global temperature changes, but such a simplification can be very useful, and I think you underestimate their utility. Particularly in the present era where forcing is dominated by spatially very homogenous perturbations (Well-mixed GHGs) I would suggest that EBMs offer a good approximation. This is demonstrated by how easy it is to fit an EBM to match the instrumental temperature record. They also appear to do a pretty good job of the past thousand years when solar and volcanic forcings (also relatively spatially homogenous) were most important.
Like you I would suggest they are less useful for your example of glacial cycles. The shifting insolation patterns associated with orbital mechanics and the consequent regional albedo changes mean that forcing is, at least at some times, highly spatially heterogenous and this has potential consequences for feedbacks which EBMs can’t reproduce. Your point appears to echo the main criticism levelled at the Schmittner et al. 2011 paper. Schmittner et al used a model, which was effectively a simple 2D EBM, to compare the difference between the LGM and the preindustrial era. They fed it with prescribed spatially distributed forcings representing various factors such as ice sheet changes, GHGs etc. then fed it with a range of feedback parameters in order to obtain a range of sensitivities. They tested each sensitivity against the spatial patterns of the data and declared the closest one the winner. The model appears to do a reasonable job of matching the data but what James Annan and RC (probably mostly Ray Pierrehumbert) point out is that the lack of interactivity in the model atmosphere means it probably underestimates potential uncertainties related to nonlinearity in response to the mix of forcings. Annan puts the implications quite succinctly: ‘What this means is, that even though they may be able to accurately estimate the “sensitivity” at the LGM, in terms of the ratio of temperature response to net radiative forcing, we cannot be sure how this will translate into “sensitivity” for 2xCO2.’
The simple energy balance doesn’t require knowledge of the distribution to know that increased albedo has to cause net cooling for the energy balance to be satisfied. It does not predict the ice albedo feedback, but can incorporate it, just like any other feedback. If insolation’s distribution changes total albedo, it has a predictable direct effect on the average temperature even before feedbacks start to act.
That is not the assertion. The questionable assertion is whether a fluid in motion can continue to increase its temperature without the addition of external energy. The answer is NO.
Sorry to be pedantic but I want to point out that Heartland children are probably reading these comments.
The temperature is a result of the dynamics via the equation of state and energy sources/sinks and its distribution is strongly dependent on dynamics. But the dynamics are far more important than energy balance for example in determining whether your next airplane ride will end well or see you bending over and kissing your behind goodbye. Your life is totally dependent on people who realize how superficial energy balance is. This is true of most fluid dynamics systems that are interesting. Diffusion is of secondary importance in these problems, including climate, the earth’s boundary layer, clouds, convection, etc. etc. The time scale are much longer for dissipation than for dynamics which determine feedbacks.
Do you really think we are that stupid? That airplane does not have an infinite amount of energy on board, so it will not stay aloft forever. That is the analogy of energy balance. Try as you might to blow smoke, you won’t succeed.
Diffusion also is more important than you claim because that is what controls the slow processes of CO2 sequestration and of effective diffusion, i.e. dispersive random walk, which controls the slow uptake of thermal energy into the oceans.
Response to: Vaughan Pratt | March 13, 2012 at 1:13 am |
If you looked at the link you would see that there is very high correlation between the CET and the global temperature. Reason for it is that the CET is determined in main by the NAO and AMO (all generated the next door) which by affecting the polar jet stream trajectory have critical effect on whole of the northern hemisphere, and so are imbedded in the global data.
Here is a another comprehensive view:
http://www.vukcevic.talktalk.net//GTC.htm
Sorry, not much room left for the CO2 forcing.
JamesG says: March 11, 2012 at 8:37 pm
Well it is now well accepted that solar forcing via Milankovitch cycles cause ice ages and recoveries from same.
That may be, but it means nothing and is wrong.
The Milankovich cycles have sinusoid profiles, but the recoveries from ice ages are very quick in relation to the temperature decreasing time. The profile is a saw tooth profile.
(Time) cycles never cause increasing global temperatures of +8° C. in two or three years; there must be a heat source of Watts which holds the global temperature for some 10ky.
The frequencies known from Vostok and their power magnitudes can be used to simulate the Vostok specta using the photon diffusion time in the Sun.
http://volker-doormann.org/images/bolshakov_plot.gif
http://volker-doormann.org/images/bentic_f_graph.gif
V.
The tone gets set right away when the authors use the term “so-called Grand Maximum”. What do these so-called scientists not understand about sunspot counting in the 400 years since it began being recorded more or less regularly by astronomers? This has been standard astronomical recording akin to measuring temperature and rainfall. Or recording when certain flora and fauna bloom and die marking the seasons and stuff like there. There is no reason except a transparent prejudice to use “so-called” in front of “Modern Grand Maximum”. It is what it is.
As I suspected, the Jones paper is worthless. Not a single informed person argues that the small variance in TSI associated with solar minimums and maximums has any significant sway over climate change.
Change in cloud cover can easily overwhelm the TSI variation insofar as how much energy reaches the surface. The surface of the earth is the hot side of virtually all the heat engines the motions of which is so-called “weather”. How much energy the hot side gets means everything. Small variations at top of atmosphere mean nothing in comparison. TOA is the ultimate heat sink on the cold side of all the heat engines. All the action takes place between the hot and cold sides as the working fluids in the engines (liquid and vaporous H20 are the only fluids of consequence) move to and fro.
There are two things of interest in solar min/max periods. Throttling of galactic cosmic ray flux and TSI distribution across the entire spectrum.
Sunspot count is a proxy for solar magnetic activity not TSI and the solar magnetic field strength at 93 million miles out varies a helluva lot more than TSI. As well the redistribution of total energy into different frequency bins appears to be much larger than 1% of TSI. The high energy component of the solar spectrum can have a profound impact on high atmospheric physics just like GCR flux may have a similar impact. Very little is known about either of them. Raw TSI however is boring, well known, and non-controversial.
Rhamstorf is similarly deficient in meaningful content. NO ONE is concerned about or intested in TSI variation and that is all either paper explores. Unsurprisingly they find an insignificant amount of warming from an insignificant amount of change in total solar energy. No duh. Someone actually pays for these people to produce this pap? Amazing. Now wonder the global economy is going down the tubes if this kind of frivolous use of so-called brainpower.
David Young | March 13, 2012 at 1:52 am | Reply
“Jim, I’m not impressed by the albedo changes in simple energy balance models. The problem is that its the distribution of the albedo, not the average that determines the changes. ”
That seems particularly poorly informed. The albedo of the earth would be in single digits if it weren’t for clouds if everything else remained equal on the ground (ocean, rocks, ice, etc.). The effective albedo of the open ocean is close enough to zero to use zero for a first approximation.
You may have heard of “the faint sun paradox”. This is about the fact that the sun has increased in brightness about 10% over geologic time yet the earth’s climate remained relatively constant the whole time. A 10% change in cloud cover is of the same magnitude as the faint sun paradox.
Current attempts to measure global average albedo are not in satisfactory disagreement and no one even knows what that percentage with better than +-4% accuracy. That range is almost as much as the whole of TSI variation over geologic time called that inspires the name the faint sun paradox.
Maybe we should call albedo change due to cloud behavior the “albedo ignorance paradox” as in climate boffins think they know exactly what less than 1% change in surface energy absorption will or won’t do to the earth’s climate but they can’t determine within +-4% how much energy clouds are letting through. The misplaced hubris is mind boggling.
Excellent post. But the Faint Sun paradox is on the order of 40%, not 10%. http://www.icr.org/article/young-faint-sun-paradox-age-solar-system/
And I’m left wondering, what would it be like to be “in satisfactory disagreement“? Maybe not a bad description of the process of scientific discussion …
;)
“JC comment: there has been an implicit assumption by the IPCC that natural forcings are of minor importance.”
Well of course. This is implicit in the market-oriented rebranding of ‘global warming’ into climate change. If climate change is bad and is caused by humans then absent humans climate wouldn’t change. Therefore natural factors aren’t involved in climate change.
It’s painful to see logic that poor coming out of so-called scientists who somehow managed to get graduate degrees from so-called institutes of higher learning. This a real indictment on the quality of college education in the first place. Santorum is more right than he knows.
Paul S | March 12, 2012 at 12:40 pm | Reply
“I’m somewhat surprised that Geologists are able to date rocks to a resolution where 11-year cycles can be observed. What exactly were they looking at?”
That kind of proxy is usually an isotope ratio just not the carbon 13/14 ratio that many more people are familiar with and which is referred to as “carbon dating”. Not sure what the proxy is for solar cycles without looking but it’s probably some rare gas where isotope production takes place in the upper atmosphere and depends on high energy flux density from the sun. The critical attributes in the isotopes regarding which are useful for what purpose are half-life (too long or too short constrains time-frame and resolution) and rarity (too rare becomes impractical to measure). “Carbon dating” for instance is only good for something like 50,000 years into the past IIRC because C14 half-life is too short to go longer than that. Most dating, the traditional means, is done by simply identifying the rock strata and extrapolating to well known dated events. All kinds of direct and circumstantial evidence are behind the well known dates for different layers in the geologic column.
Much of the isotope dating is questionable, especially more ancient stuff that can’t be confirmed or calibrated by unrelated event dates. It all depends on consistency in production rates in the upper atmosphere. We can measure production rate today but have to assume it was the same in the distant past. This is another example of the weakness Dr. Curry pointed to in climate boffinry assuming that natural factors don’t have much influence on so-called climate change. It all hinges on an overarching paradigm in science called “constancy”. Its roots go to first principles in physics. For instance, we’ve actually only measured the speed of light in a tiny corner of the universe over an tinier window of time. It is assumed by the constancy tenet that the speed of light billions of years in the past at all remote places in the cosmos is exactly the same as it is in our vanishingly small experience. Same goes for gravitational constant, ratio of weight of proton to electron, radioactive decay times, and a giant raft of other things. There exists a plethora of observations that don’t make sense in light of constancy too but questioning constancy is pretty much a one-way ticket to crank science city for any who dare question it.
“There exists a plethora of observations that don’t make sense in light of constancy too but questioning constancy is pretty much a one-way ticket to crank science city for any who dare question it.”
That should be changing. The question is who is going to drop the shoe? I have noticed a few wikipedia changes and NASA has revised a few pages. With the net energy imbalance dropping to about .5 to .6Wm-2, there should be an announcement with some substance pretty soon. The one most past due is the Antarctic cooling.
Maybe Pierre will stop by?
I guess it depends on what you’re trying to do. If it’s to construct a misleading model and set of conclusions, it may be very useful indeed.
It seems to me that Jones et al. (2012) are violating fundamental mathematics when they assume that the climate responses from different forcings calculated from their EBM are additive.
The simplest EBM is described by the following linear differential equation where C and α are constants (the effective heat capacity and the climate feedback parameter =inverse of the climate sensitivity parameter):
CdT/dt = F – αT
If for one forcining F1(t) we get the solution T1(t) and for another forcing F2(t) the solution T2(t) we have
CdT1/dt=F1 – αT1
CdT2/dt=F2 – αT2
Addition of those equations shows that the sum of the solutions T1+T2 also is a solution of the same differential equation for the sum of the forcings F1+F2:
Cd(T1+T2)/dt=F1+F2 – α(T1+T2)
However, if the constant α is different for the two forcings this addition rule is no longer valid.
For the simplest EBM the rule that the temperature responses from different forcings may be added is only valid when the climate sensitivity parameter is the same for the different forcings.
Since this rule derives from the properties of linear differential equations with constant coefficients it should be valid under analogous circumstances for the more complicated EBM used by Jones et al. (2012).
However, they did use a case with different constant climate sensitivity parameters for the different forcings. Hence, they have a case with linear differential equations with varying coefficients and in principle the responses for the different forcings should not be additive.
It’s hard to find more arm-waving (both literal and figurative) or less scientific rigor than in Richard Alley’s AGU presentation on CO2 as the putative climate “control knob,” brought to our attention here by WebHub Telescope at 1:59am today. Academic paleoclimatology seems very vulnerable to a catastrophic reality check.
This is due, I believe to a hysteresis in the system that is caused by the Arctic ocean. For example: During a glacial period the arctic is frozen solid. Sea levels have fallen and there is a lot of land-fast ice. As the Milankovich cycle progresses, the insolation increases in the NH (SH doesn’t matter as it is glaciated all year during all parts of the cycle, it is the NH that drives things) but the albedo remains high because the North is still mostly frozen through the summer. Much of the energy is still being reflected to space. The sudden change, the sudden breakout of the glaciation, happens when suddenly we get a summer where the arctic ocean is ice-free or nearly so. This doesn’t happen until NH insolation is nearing maximum. Now the land surrounding the Arctic Ocean still may have thousands of feet of ice but the Arctic Ocean is being melted from bottom and top. We end up with an ice-free (or nearly so) Ocean surrounded by glaciers.
Once a large area of the Arctic Ocean is free of ice in summer, the entire albedo of the NH undergoes a significant change and things begin to warm quickly. This is the thing, I believe, that suddenly tips the system into a stable state in the opposite mode. It will remain that way until we get several summers where Arctic ice does not melt sufficiently during a period when the Milankovich cycle is headed in the opposite direction. At that point the system tips into the opposite stable mode and remains so until such time as the Arctic has enough ice-free area to change the system again.
Since ocean temperatures are a major factor in this, I believe that was why we came out of this at 40,000 year intervals at first and are now in 100,000 year intervals. The oceans are gradually cooling on a million year scale. It didn’t take as much when this cycle of glaciations started to make melt the Arctic ocean ice cap because the oceans were warmer. But over the past couple of million years the oceans have been cooling and it takes more insolation to melt that cap than it used to.
I believe that all it will take at this point is some event, or probably some conjunction of events such as a grand solar minimum with a high latitude volcano to create a situation where we maintain enough summer ice to flip us into the other stable state like a bi-stable multivibrator circuit in electronics.
I believe, high irradiance in polar summer does not necessarily translate into a large warming effect due to the low incidence angle. It is commonly assumed that water has low albedo (which creates potential for positive feedback when ice cover decreases). However at low angles water is highly reflective so the albedo doesn’t change by much.
You make fair points.
That’d have to be some smooth water for your angle of incidence to bear out completely.
I’m more familiar with oceans that have waves in them.
I agree that waves will effectively increase the angle. But they won’t make the water completely black.
I’m not at all convinced that the response will be that small.
All those “model based” projects are simply saying “Given these conclusions what assumptions can we draw?”. Models are like that.
They can tell us where to look when they diverge from reality (as they always will eventually do, to some degree); but must never ever be confused with reality. You can not do an “experiment” with a model, you can make a projection or prediction of the model, nothing more. Experiments are done in the real world.
With that said, the largest most glaring issue after that one, is the way the change in UV has been completely ignored. It’s not the TSI that matters, it’s the UV. We’ve already seen atmospheric height shorten. Think maybe less thickness is going to impact circulation patterns? Then we got a “loopy jet stream” (rather like I remember from back in the 1950s and 60s) as the Rossby waves deepened (perhaps due to that UV change?). The result has been warmer East Coast and West Coast snow near Mexico… Think that will make a difference?
The change in stratospheric heating from UV plunging has, IMHO, resulted in a very cold polar vortex. Cold levels are at lower elevations (how about snow on mountain tops? glaciers at altitude?) and the polar vortex cold has been very visible where it descends.
All those sorts of things are not in the models.
Then there is a more speculative point:
The Grand Minimums tend to come at times of particular orbital mechanics. These times correspond with particular lunar tidal events.that stir not only ocean currents, but also the crust itself. Even the circumpolar current around Antarctica picks up speed (and whacking into Drake Passage can’t all fit, so sends a cold shiver up the coat of Chile and out into the middle of the Pacific.) Think having such shifts of ocean currents are in the models? Nope.
To even mention the influence of tidal modulation via celestial bodies is to risk being dismissed as a crank. Yet “it moves!”… At least one paper has looked into it, retrospectively, and finds there is a clear effect:
http://www.pnas.org/content/97/8/3814.full
So, simply put, nature is running the forbidden experiment for us. Fairly soon we will know (by about 2020 it ought to be pretty clear that warming has turned to rapid cooling – or not.) We will find out if humanity has, once again, attributed far more power to itself than it deserves; and denigrated the nature around us too much.
Simply put: I trust the meteorologists of the world to look at the actual natural mechanics going on more than I trust the folks building a computer model “toy world” and playing with it. ( I say that as someone who is a professional in computer science with many decades of experience, including running a Cray site dedicated to computer modeling. It can be VERY useful, but is not reality… and even a model of a single well characterized fluid in a physically precise mold would occasionally ‘get it wrong’…)
@NW And Web… really and honestly, if I’m not getting it, then try to explain. I really am trying to understand. It is just that it seems clear to me that if the level and variance of holocene CO2 are understated, then sensitivity estimates based on that period will be overstated. So I am trying to sort out the different arguments.
NW, CO2 is pretty evenly distributed through more than 99% of the troposphere. This is because nature abhors a vacuum, not only for atmospheric pressure as a whole but for the partial pressures of its constituents. When the proportions are measured by volume rather than mass, the proportions also give the partial pressures.
For example CO2 at .04% by volume has a partial pressure of .0004 atmospheres or 40 Pascals (newtons/m2), or 0.4 mb (millibars) or 0.85 lbs per square foot. Although that’s only 1/15 of the 6 mb partial (95%) pressure of CO2 on Mars, that’s still sufficient to distribute CO2 evenly throughout the troposphere.
The only places CO2 is not evenly distributed are at the sources, where you can expect the concentration to be higher. Charles Keeling realized this in the 1950’s, prompting him to locate his CO2 observatory well away from all sources save those he could calibrate and compensate for easily.
The 200+ GtC per year of carbon nature is emitting has various sources, some stronger than others, but they’re all at the surface, not higher up, nor at the surface of the deserts and the ice caps. The ice cores sample the evenly distributed 99% of the atmosphere, the stomata are a proxy for the more variable 1% near the sources. You can therefore expect stomata to show higher and more variable values than the ice cores, and not to the same accuracy either.
Had the Keeling observatory been around in 2000 BC it would likely have registered values much closer to the CO2 trapped in air bubbles in ice at the poles than to what we try to infer from the stomata.
http://i122.photobucket.com/albums/o252/captdallas2/JubanyvMaunaLoaCO2.png
The distribution of the nearly well mixed gas is kind of interesting. Comparing Jubany station Antarctica to Muana Loa is interesting.
Too short a time period for much of any use. It is odd that the trend in the Jubany Station is lower, particularly from the start to about 2000, then it increases. It is almost like the Antarctic was cooling until 2000, kinda like the satellite data indicates. If that is the case, I wonder what kind of mechanism might cause that?
The 1998 period is a little odd too. :)
Hello there, I discovered your website by way of Bing when evaluating a comparable subject matter, your website came out, it’s like excellent. I’ve truly included with my own favorites|added onto book marking.