
Guest Post by Lüdecke, Link, and Ewert
Our two papers [1], hereafter LU, and [2], hereafter LL, were published almost simultaneous with the release of the BEST papers. The basic objective of all of these papers is the same – to document reliably the surface temperature of the Earth from the beginning of the 19th century until the present.
LU analyzes the period 2000 years before present (BP), whereas LL examines the 20th century only. The BEST analysis covers the period 1800-2010. Quite different methods are used in our work versus BEST. The BEST global temperature curve is a patchwork of more than 35,000 mostly short temperature series. LU analyzes five of the longest available instrumental series and two proxies (stalagmite and a tree ring stack). LL examines 2249 unadjusted local temperature surface records. Further, both LU and LL use a new method [3], [4] which combines detrended fluctuation analysis (DFA), synthetic records, and Monte-Carlo simulation. Using this new method, the exceedance probability of the naturality of an observed temperature change is evaluated. Finally, LL derives the basic overall probability that the global warming of the 20th century was a natural 100-year fluctuation. The instrumental records applied by LU and LL are monthly means because the DFA requires a minimum of about 600 data points.
The 19th century
The database for the instrumental temperatures used by LU consists of the following long-term series going back at least until the year 1791 AD: Hohenpeissenberg, Paris, Vienna, Munich, and Prague. During the 100 year period 1791-1890, all of these locations show an overall temperature decline with roughly the same magnitude and natural probability as their appropriate 20th century rise. Additional long-term instrumental records – not analyzed by LU – include Innsbruck, Kremsmünster, Stockholm, and Kopenhagen, which show consistently similar temperature declines. Finally, the 19th century cooling discussed by LU is confirmed by reconstructions [5]. However, the enlargement of the NH temperature decline as a global phenomenon is limited by the absence of appropriate instrumental temperature series of the SH. Note that the 19th century cooling is not present in the BEST curve.
The 20th century
LL takes the data from the GISS temperature pool that contains about 7500 series in total. From this number, 2249 reliable continuous records as monthly means were selected. Those are 1129 stations over the 100 year period 1906-2005, 427 stations over the 50 year period 1906-1955, and 693 stations over the 50 year period 1956-2005. As the criterion for the selection, no more than 10.5% voids are allowed in any record. This constriction ensures that the DFA analysis is still reliable.
Every record of the GISS pool following this condition was selected. It can be assumed that the GISS pool contains the most long-term records as monthly means worldwide. LL used only unadjusted raw data. In addition, no homogenisation, smoothing or grid-procedures are applied, except for the linear interpolation by filling voids in the records. Figure 1 depicts the frequencies of the station latitudes and the temperature changes for the 1129 records of 100 years length.

Fig. 1: Frequencies of station latitudes (left panel) and of the temperature change ∆ of linear regression lines.
The results from the first step of LL’s analysis are as follows:
- During the period 1906-2005, the 1129 stations of 100 year duration show a mean 0.58 °C warming. About one quarter of all these stations show cooling. The mean reduces to 0.52 °C if stations with less than 1000 population only are included, which documents the UHI. Further evidence of the UHI is given in Figure 2. After all, the mean value of global warming reduces further to 0.41 °C if stations below 800 m above sea level only are allowed. Figure 3 depicts this effect, of which the cause is not known.
- As the left panel of Figure 1 demonstrates, the available stations are concentrated between 20° and 70° latitude. In particular, the station density is sparse in the SH. However, the warming is feebler in the SH than in the NH.
- In the period 1906-1955 the mean of all 125 SH stations is actually negative (see in LL Table 1 and Table 2 for group B5). As a consequence, the global warming as the mean of all local stations worldwide for the first 50 years of the 20th century can be assumed to be somewhat feebler if it would be established from surface stations of equal density distributions over the Earth.
- A total of 1386 stations with no voids within the appropriate periods shows that the mean temperature change is -0.34 °C between 1998-2010 and -0.15 °C between 2000-2010.
The results of items 1. and 4. are not in accordance with BEST.

Fig. 2: UHI in 1129 records of the 100-year period 1906-2005

Fig. 3: Warming due to increasing station elevation in records of the 100-year period 1906-2005
Probability analysis for the 20th century
Temperature records are persistent (long-term correlated). This is well known since a warm day is more likely to be followed by another warm day than by a cold day, and vice versa. Short-term persistence of weather states on a time scale of days until several weeks is caused by general weather situations and meteorological blocking situations. However, the causes of long-term persistence over many years and even several decades are largely unknown. Persistence – a purely natural phenomenon – is measured by the HURST exponent α and is explicitly opposed to external trends like the UHI or warming by anthropogenic CO2.
Both autocorrelated real temperature records without external trends and autocorrelated synthetic temperature records that can be generated by special algorithms are denominated as ‘natural’. As the main feature of autocorrelated natural records, extremes arise that seem to be external trends. This poses a fundamental problem because without further effort, an external trend and an apparent ‘trend’ that is caused by persistence are not distinguishable. Figure 4 depicts this effect.

Fig. 4: A synthetic purely autocorrelated (natural) record that nevertheless seems to be determined by external trends.
The method of [3], [4] that tackles this problem is based on the assumption that an observed real record has the following two constituents: a natural part, which is governed by autocorrelation; and (possibly) an external trend. Next, the probability has to be determined for how much an observed real record is ‘natural’. To this end, only two authoritative parameters are needed: its relative temperature change ∆/σ and its HURST exponent α, whereas the DFA requires that α comes from the ‘natural’ part only. ∆ is the temperature difference of a linear regression line through the record and σ is the standard deviation around the line.
The analysis yields the exceedance probability W for the occurrence of the value ∆/σ, including all stronger values, in a natural record of a fixed α, which is the same as this of the observed real record evaluated by DFA. Next, (for warming) one has to check whether the value of W is below a defined confidence limit. If this is the case, the observed real record is gauged to be determined by an external trend. Otherwise it is assessed as ‘natural’. The method provides no information about the nature of the trend. In a final step, the overall natural probability of the stations in a group is basically evaluated from all W values. As a result, the probabilities of naturalness lay between 40% and 90%, depending on the stations characteristics and the periods considered (1906-2005, 1906-1955 or 1956-2995).
It is stressed that in general the applied procedures to establish global records from local ones result in unrealisticly small values of the standard deviation σ. This becomes in particular obvious regarding the BEST curve by eye. Therefore, in general, we assume that globally averaged records are not feasible for an autocorrelation analysis.
Conclusion
LL demonstrates that the 20th century’s global warming was predominantly a natural 100-year fluctuation. The leftovers are caused by UHI, the warming effect by increasing station elevation, changes to the screens and their environments in the 1970s, variations in the sun’s magnetic field that could influence the amount of clouds, warming caused by increasing anthropogenic CO2, and further unknown effects. However, the station density over the Earth is strongly irregular, which makes any global record but also the results given by LL disputable. The SH stations of the GISS data pool show less warming (resp. stronger cooling) than the NH ones. Since the available stations worldwide are concentrated in the NH, the real mean of the 20th century warming could be even somewhat smaller than LL have evaluated. LU and LL compared with BEST reveal differences in the following items:
- – the magnitude of the 20th century warming
- – the 19th century cooling (not present in BEST)
- – the exceptionally small standard deviation of BEST
[1] H.-J. Lüdecke, Long-Term Instrumental and Reconstructed Temperature Records Contradict Anthropogenic Global Warming, Energy & Environment, Vo. 22, No. 6 (2011),
[2] H.-J. Lüdecke, R. Link, and F.-K. Ewert, How Natural is the Recent Centennial Warming? An Analysis of 2249 Surface Temperature Records, International Journal of Modern Physics C, Vol. 22, No. 10 (2011),
[3] S. Lennartz and A. Bunde, Trend evaluation in Records with Long-term Memory, Application to Global Wariming, Geophys. Rev. Lett. 36, L16706, doi: 10.1029/2009GL039516 (2009)
[4] S. Lennartz, and A. Bunde, Distribution of natural trends in long-term correlated records: A scaling approach, Phys. Rev. E 84, 021129 (2011)
[5] T.J. Crowley et al., Causes of Climate Change Over the Past 1000 Years, Science 289, 270 (2000), doi: 10.1126/science.289.5477.270
Prof. Dr. H.-J. Lüdecke
Dr. R. Link
Prof. Dr. F.-K. Ewert

A very interesting couple of papers, what concerns me, is that no-one is listening in the world of politics, media and lobbyists. How to get the media to look at this and other areas of the science and discuss the science rationally seems to be impossible.
Climata Policies are all that seem to count now.. Kyoto, Durban and the run up to Rio 20 will means only the ‘worse’ than we thought scenarios get any mentions. and lots of pressure on scientists and others to lobby for support of a global deal post Kyoto..
Which seems to be impossible to me – politically, due to Emissions per Capita.
http://www.pbl.nl/en/publications/2011/long-term-trend-in-global-co2-emissions-2011-report
when: “Present CO2 emissions per person in China are now equal to those of Italy and higher than France,”
slightly off topic – Judy you are being deconstructed here..
https://twitter.com/#!/carbonbrief/status/133514251477327872
Unfortunately, John Q. Public and his family know more about the Science of Global Warming than they do about Global Politics. They seem to enjoy the Lemming-like games of “Follow The Leader”. Stupid, to say the least, but there it is. A Scientist is a poor substitute for Common Sense.
Judith,
Will it not take about thirty years before climate scientists…not finding a pattern of warming have to change as the data has been going down?
By then many will have suffered and climate science would be decimated.
So I guess you didn’t do any research on EIKE and chose to spread their disinformation. :-(
I’m hosting a guest post for the authors of two recently published papers, on a topic that everyone seems to want to discuss at the moment: the BEST data set and interpreting the temperature record. Critiques of their study are expected. Dismissing their work over an affiliation with EIKE is an ad hominem attack, which is not useful in science.
A source needs to be trustworthy. If it is repeatedly shown that it isn’t, I don’t see why anyone would want to spread its message. Especially if there’s a good reason to expect bias (again, investigate EIKE).
It could accidentally be right, but there’s a high probability it’s wrong, especially if claims are extraordinary. In the meantime, while this work is being debunked, the lie has again travelled halfway around the world.
I’m already picking up messages on blogs going: Dr Curry has more proof that there has actually been no or very little warming at all! It’s a 100 year natural fluctuation!
Why would you want this? I thought you wanted to build bridges. Giving dodgy quotes to the Daily Mail and giving EIKE a platform is the exact opposite. I can’t figure you out.
When can we expect guest posts from Christopher Monckton, Tim Ball, Don Easterbrook or Oliver K. Manuel?
I’ll leave the statistical debunking to the experts, but I’ve translated my ad hominem for you from that article in the Süddeutsche Zeitung from March 31st 2010:
“EIKE’s press secretary Horst-Joachim Lüdecke, a retired professor in fluid mechanics, says that “we don’t need climate scientists” because there is no scientific proof that CO2 warms up the atmosphere. And that’s why an advisory board can also consist of a materials scientist, a radiologist and an electronics expert.”
Dr. Curry, this lie will travel all around the world, with your stamp of approval on it. There’s nothing to be done about that. But I’ll ask this question in advance: how many times do you have to realize that these people to lie, distort and disinform before you stop giving them a platform? Because I do expect you to learn from this experience, once this paper is totally debunked.
Don’t worry flipper, the son of the old king is hiring, so easy with the special sauce. And have a nice day.
If and when the paper is debunked, then we no longer need to talk about it. Have at it, that is what this thread is for.
None of the guest posts here have my stamp of approval in terms my agreement with what is stated. The only approval implied by a guest post is that I think this is an interesting topic worth discussing.
It is exactly these kinds of comments that make me, as a non-scientist who is simply trying to find out the truth, to trust Dr Curry implicitly. You and Dr Curry could not be more polar opposites in their view of science and the scientific method.
Well said, Dennis.
Guilt by association. Debunk the analysis, not their affiliation. If that happens you can be secured your faith will survive a little longer. If not, be prepared to do what you are suppose to do in science. Change your views based on the evidence.
An argument is an argument. Given that Ludecke’s arguments got published in reputable scientific journals, their merit (or lack thereof) should be discussed.
I am not worried whether or not you or anyone else can figure me out. But its really very simple. I don’t play political games with the science. Dismissing someone and their published work because they belong to a certain political group is playing political games.
There aren’t too many climate blogs that don’t play political games with the science, which is why my not playing political games with the science seems like such a foreign concept in the climate blogosphere.
I’ve abandoned trying to build bridges with the climate dittoheads in the blogosphere. I’m trying to engage the thinking public to actually think, and challenge their understanding and prejudices.
Gonna be quoting you on that one, Judith. Book it.
probably wont make curryquotes tho
I do not dismiss them because they belong to a certain political group. I dismiss them because I have seen them lie and distort repeatedly, and never be right about anything, and never retract allegations, and never admit or correct mistakes.
As for reputable scientific journals: The first paper is a supplemented version of the article published in Energy & Environment. The second paper was published in International Journal of Modern Physics
C. I do not know this journal, except that it has previously accepted work by Gerlich and Tscheuschner.
These people do not deserve a platform, but you are giving it to them. Well, besides Marc Morano and a host of other dubious blogs and websites. So basically, it seems you are doing the same thing as Marc Morano. Why would you want that?
I gave the sky dragons a platform, several threads in fact, it didn’t go very well for them as their arguments were debunked. The sky dragon group has been severely marginalized by those threads, which wouldn’t have happened if we followed your strategy. If something is wrong, shine a light on it, don’t hide it in a corner. The jury is still out on Ludecke’s papers, they have not been adequately discussed and examined. Perhaps that will happen here.
If you don’t understand the difference between what goes on at Climate Etc. and Morano’s site, well that explains why your “side” seems to be losing the climate change “battle.” Battle is in quotes, since you see climate science and policy as a war against the skeptics/deniers.
Neven:
“I do not dismiss them because they belong to a certain political group. I dismiss them because I have seen them lie and distort repeatedly, and never be right about anything, and never retract allegations, and never admit or correct mistakes.”
And yet further upthread you wish to leave the debunking to the experts……
I’d never even heard of the ‘sky dragon’ group before those threads. ”
That would never have happended if you had followed Nevens strategy.
Doesn’t surprise me that you hadn’t previously heard of the sky dragons, but for awhile this was quite the sensation in certain skeptical circles.
Judith –
Does this statement mean that you don’t dismiss the validity of the IPCC’s findings on the basis of (or partially on the basis of) affiliation with the WWF?
The WWF arguments need to be considered on their merits. In the WG II report, an overabundance of WWF citations raises the issue of WGII objectivity. Papers written by members of an advocacy (on either side) require additional scrutiny/auditing.
“The sky dragon group has been severely marginalized by those threads”
How are you measuring this? Did any of the “SkyDragons” or their supporters concede they were debunked? Do people who used to believe “SkyDragon” theories now not do so?
Conversely how many who had not heard of their theories did so because you gave them a platform? How many who previously thought the greenhouse theory was unquestioned now think there are “issues” with it?
Basically: Do you have any evidence external to your own perception? Otherwise you’re saying “My judgement is that it’s a good idea to give these papers a platform because my judgement says giving the ‘SkyDragons’ a platform went well”. If the former did not go as well as you perceived you may simply be compounding mistakes with further mistakes.
Judith –
How is it that blog comments from your “denizens” can “marginalize” scientific theories yet at the same time you can dismiss overtly partisan comments from your “denizens” as irrelevant?
What objective standard to you use to distinguish between “denizen” comments of value and “denizen” comments that should be dismissed?
Judith –
I agree – and I see no problem with you posting this article.
However, there seems to be some inconsistency in your approach. It could just be me, but you seem to buy the theory that association with the WWF, in and of itself, undermines the credibility of the IPCC.
This relates to a larger inconsistency I see in your approach more generally. You tend to be dismissive of arguments on one side simply by virtue of an influence (potential or otherwise) from partisan affiliation – but you don’t seem to apply the standard universally.
Again – that is not to say that. IMO, you shouldn’t put up guest posts like this.
This reminds me of when you applied a double-standard to the validity of climate science analysis based on a selectively applied criterion related to the existence of an established background of expertise.
Can you show me where I state that IPCC “association” with the WWF undermines the credibility of the IPCC? It is the unquestioning and overreliance on WWF publications that has resulted in errors and a lack of balance in WGII.
Ignorance is bliss when it comes to this kind of nonsense. And from what I read of that thread, the lunatic fringe was pretty much unmoved by the counter-arguments.
Nice reply, and bang on.
Michael, I would like to introduce you to… Dr. Joel Shore,
who likes to say…
“Let’s limit the pseudo-scientific nonsense to one topic at a time.”
Let’s try to keep it, short, pithy & accurate. Thank you.
Dr. Curry’s statement is clear, direct, and to the point. One almost wants to say “plain spoken.” It is also true and expresses admirable goals. More halos for you, Saint Judith.
Dr. Curry has done and is doing marvelous work on this blog. If you have not yet recognized these facts, it is in your interest to try.
Judith,
“Pulbished in reputable scientific journals”? Really? The paleo paper was published in E&E. The temperature record paper was published in the “International Journal of Modern Physics C” a sister journal of the one which let the Gerlich and Tscheusner through. Not the highest recommendation.
In addition IJMPC seems a bit of an odd place to publish a paper on the observed temperature record since, according to Wiki::
Prof. Curry writes “Given that Ludecke’s arguments got published in reputable scientific journals, their merit (or lack thereof) should be discussed. ”
I am rather concerned about this statement. E&E is not a reputable scientific journal, it is a social sciences yournal (for instance it is indexed by ISI Social Sciences Citation Index), articles published in E&E are rarely cited outside its own pages (i.e. its impact factor is negligible) and even a cursory examination of some of the papers it has published show its peer vieview process is profoundly flawed. It is not diffiicult to find examples, for instance this one, doi:10.1260/0958-305X.21.8.953, has a factual error (the IPCC do not say “that time required for the atmosphere to adjust to a future equilibrium state [is in the] range of 5-200 years” they say it is of the order 75-200 years) and a misconception “a number of published data show a short lifetime of 5-15 years. ” (this refers to the residence time, which is not “time required for the atmosphere to adjust to a future equilibrium state”, which is instead the adjustment time). So the reviewers of this paper have demonstrated that they don’t understand the difference between residence time and adjustment time, which is carbon cycle 101, and hence they were not competent to review the paper.
The International Journal of Physics C may well be a reputable PHYSICS journal, but that does not mean that it can provide a competent review of statistical methods or of climatology. It is unreasonably to expect that the IJPC would be able to field reviewers with a good knowledge of climatology any more than the Int. J. Climatology should be expected to field reviewers with a solid grounding in quantum physics.
It is an oft used ply to get sub-standard work published to send it to a journal where the material is only tangentially relevant to the topic covered by the journal and play reviewer roulette. I am surprised that an experienced scientist would regard either of these journals as providing a sound peer-review of the material.
I forgot to mention that the two errors I pointed out in the E&E paper are in the FIRST LINE of the abstract!
Good find! That is a whopper of a lie and really would be caught if the paper had a proper peer review.
To be fair, it would only be a lie if the author knew it was untrue, it could just be that his understanding of the carbon cycle was very poor. One could understand it if this had been buried deep in the paper and the reviewers had simply missed it, but it was the first line of the abstract!!!!!!
Looks like the first could be a typo, the “7” was left off. Possibly by the typesetter and missed in proofs. Does this mistake reflect a deliberate attempt to twist the data? Did you look further to see if it is repeated in the paper itself?
Residence time could be the important factor if the CO2 is sequestered rather than just dissolved in ocean. Even so-so papers in so-so journals may contribute to the discussion. Again, why the hysterical reaction? Only if you believe the “catastrophic” part of AGW and that it will happen in the next 25 years could justify reactions like these. Calm down and grow up. If it’s a crappy paper it won’t pass the test of time. If we are indeed on the way to large rises in temperature, we will know soon enough. Wasting money on more Solyandra’s won’t help anyone.
Bill, thanks for that comment. I assumed that was as you mentioned, nothing more than a typo, but I forgot to make a comment to that effect.
Ultimately, I think this example says more about those discussing it than the paper (or journal) being discussed.
Bill, no it is unlikely to be a typo, the conflation of residence time and andjustment time is a fairly common skeptic canard (e.g. http://www.c3headlines.com/2009/09/the-liberal-attack-on-science-acorn-style-the-ipcc-fabrication-of-atmospheric-co2-residency-time.html). Having checked, the IPCC actually quote 50-200 years.
“Residence time could be the important factor if the CO2 is sequestered rather than just dissolved in ocean. ”
No, again that would be adjustment time, not residence time. The immediate take up of CO2 into the thermocline gives you the lower end of the IPCCs estimate of adjustment time (about 70 years). The process by which CO2 is sequestered permanently takes much longer.
“Calm down and grow up.”
why not try conducting a discussion in civil terms rather than insults?
“If it’s a crappy paper it won’t pass the test of time. ”
You are missing the point. Prof Curry implied that E&E is a reputable journal, quite clearly it isn’t if the peer review standards are so lax that a paper cen get published with two obvious errors in the first line of the abstract.
Dikran Marsupial, the first paragraph in your latest response makes no sense at all:
Bill never claimed “the conflation of residence time and [adjustment] time” was a typo. He said having the number 5 instead of 75 (or as you now say, 50) was a typo. There were two “errors” you pointed out. He said the first one was probably due to a typo. You disagreed and said the second was unlikely to be due to a typo…
I don’t know about calming down or growing up, but it certainly does seem you need to slow down and read more carefully.
Sorry Brandon, it did not ocurr to me that my meaning would be unclear. The IPCC put residence time at 5-15 years and adjustment time at 50-200 years, so the common skeptic carnard is to combine these two ranges to suggest that the IPCC claim that the residence time is 5-200 years, hence “conflation”. Whether you want to believe that a typo has been missed by the athors, the reviewers and the editor in the first line of the abstract (which all parties concerned would give the greatest scrutiny as it is the first part of the paper most will read) is up to you. However the confusion of residence time and adjustment time is a fundamental error that any competent reviewer ought to have picked up.
Like Bill, I suggest the discussion would be more productive if you could avoid rhetorical point scoring and stick to the substantive issue. E&E is not a reputable science journal, as this example shows, it isn’t difficult to find others.
Dikran Marsupial, I had no problem understanding what you meant. My problem was what you said was wrong. Bill referred to one specific thing as being a “typo.” You disagreed with him, said it was unlikely to be a “typo,” but actually talked about a different thing. This isn’t an issue of your meaning being unclear. It is an issue of you being wrong. Your response did not make sense given the words you choose to use.
As for the rest of what you said, I have no interest in discussing the subject. I was merely amused to see what was nothing more than a typo seemingly be labeled as a lie (WebHubTelescope referred to a singular error as a lie, but there were two errors, so it is unclear what he meant).
Of course, I find it amusing you called my sentence “rhetorical point scoring” but said nothing negative about him calling the error(s) “a whopper of a lie.” You pointed out he couldn’t know the motivation of the author, but that’s it. I wonder what you would have said if I had called you a liar for telling Bill that one error wasn’t likely to be a typo.
Right, it is obviously not a typo as the range 5-200 years is a clear combination of 5-15 years for a residence time and 75-200 years for an adjustment time. The mixing of these ranges is meant to convey uncertainty in science’s understanding of the physics involved. Unfortunately it is these authors that do not seem to understand the distinction, which is quite clear if one just thinks about how the carbon cycle works.
Brandon, life is to short for rhetorical games, I’m happy to discuss science, but it appears that perhaps this is not a good venue for that.
OK, then we can be left alone to discuss the technical issues of the paper and point out even more technical errors, without needing a referee to tell us that we aren’t obeying some fictional set of Marquess of Queensbury rules for correct argumentation style.
Yes indeed, these are all little rhetorical games, which loses out to the dialectic content.
Dikran Marsupial, if you want to discuss science on this blog, you might have better luck if you try discussing science which is relevant to the blog post you’re posting on. In my experience, that gets more insightful responses.
In the meantime, you made a mistake. It happens. It would be easy to say, “Oh yeah, I screwed up and used the wrong word.” That’s all I’d expect or want from you. If, for whatever reason, you’re unwilling to do that much, I think this is the wrong venue for you.
O.K. Brandon, you have convinced me that this is yet another blog where attempts to discuss substantive issues (such as whether these papers were published in journals likely to give a reliable peer review) are likely to be derailed by rhetorical games (you said yourself you have no interest in the actual subject of the discussion). Sorry I have better things to do.
@ Judith
Reputable? One Paper in E&E and the second paper in the journal, which published Gerlich&Tscheuschner.
Did you take a look into the papers before presenting here? If yes, what’s your impression?
Shaparoo, Here’s one that the skydragon light shining helped to understand how off they were. Always, i mean ALWAYS shine the light into the dark corners!
I believe what Dikran classifies as a ‘proper peer-review’ process is where either Kevin Trenberth, Jim Hansen or someone other from the team is the reviewer. Or that at least they should have been published in Nature or Science, which have both published whoppers like the hockey stick, Steig et al. etc, without ever checking the mathematics behind the conclusions and asking for the raw data. The peer-review -process in those what he calls ‘reputable journals’ isn’t any better since it is clearly biased towards one conclusion: CAGW.
So instead of attacking the arguments presented in those papers, he just made a typical ad-hom attack against the writers and journals. Why all these double standards, is it because you didn’t like the conclusions Dikran, isn’t it?
“A source needs to be trustworthy”
This is why I don’t usually read your comments, Neven.
Andrew
I’m not a source, Andrew.
“I’m not a source, Andrew.”
Yes you are. You are the source of partisan Warmer comments and blog.
Andrew
“EIKE (European Institute for Climate and Energy Society) is a union of an increasing number of natural, social and economic scientists, engineers, journalists and politicians, the assertion of a “man-made climate change” as scientifically not justified and therefore a fraud against the population . view EIKE consequently rejects any “political climate” as an excuse to patronize economy and population, and to charge the people with taxes.”
The above translated using Google Translate.
Why would anyone who wishes to engage in an honest debate about dangerous global warming have a problem with an organisation with the above aims. If the papers stand scrutiny it does not matter or does it only not matter when WWF Greenpeace and their fellow travellers sponsor and write papers?
Stacey, thanks for bringing up this point. Why is giving a platform to EIKE science unacceptable, when WWF science is ok?
Because it’s on the wrong ‘side’ Dr Curry, obviously…..
Maybe because repeatedly displaying untrustworthy behaviour destroys your credibility.
So, no guest posts from Mann, Jones, Briffa, Wahl etc. Seems a bit harsh after all they’ve been through.
What have they been through?
“What have they been through?”
A hell of a lot of taxpayers money, mostly. Athankyou.
James, i’m sure the invitation for one of them to post would be open. Dr Curry has stated on a few occasions that she’s asked prominent cAGW-ers to write guest posts. One can only summise that they don’t want to open their arguments up to public debate.
Prof Curry,
You ask: ” Why is giving a platform to EIKE science unacceptable, when WWF science is ok? ”
By their own account EIKE is claiming “fraud”. Once anyone uses those sort of terms their credibility is shot. They can’t possibly be considered impartial.
Can the WWF be considered impartial? Why not? It would be marvellous for polar bears, coral reefs and the world’s flora and fauna if CO2 emissions were shown to be as benign as some claim. Even then, they’d certainly have plenty to do on other fronts. They don’t need another battle to fight. It is definitely in their interests to want to know the true situation. Why would they, or anyone else for that matter, want to believe there was a problem, if it was really non-existent?
Personally, I don’t want to believe it either. But I do.
As a regular in EIKE I can tell why: The words you translated sound prettily, but in reality most of it is a distortion of science, their methods are really bad. One example:
They translated the WUWT article about Ridley. I tried to post Ridleys error in confusing transient climate sensitivity with normal climate sensitivity. I got censored, there’s no interest in discussion of the truth, it’s just about message bad things about the “IPCC-Mafia” (Ludecke).
And believe me, it’s not only when I try to write about Ridley.
by actually taking all views into account and comparing them against the verifiable facts and data we put to rest (falsification) the counter argument. isn’t that what science is all about?
I see posts in here that demand that the counter argument should not be given voice or explored. I say welcome to Pseudo-Science… those of you who think that just because its wrong by ‘YOUR PERCEPTION” should really take a look in the mirror…
The referenced article is a recitation of EIKE personalities and links. It also notes the Fred Singer has been a speaker at on of their presentations.
There is zip about any research or studies done by EIKE, but the tone is “see the unworthy skeptics”.
If EIKE is a problem, it will take something much more substantial than this tissue devoid of useful content.
“A source needs to be trustworthy”. Just like the IPCC isn’t trustworthy (see Donna).
If one actually applied Neven’s standard, some of the most prominent sources on the “AGW side” would have to be ignored. Of course, Neven would never accept that. The standard is nothing more than an excuse to reinforce biases.
“A source needs to be trustworthy. If it is repeatedly shown that it isn’t, I don’t see why anyone would want to spread its message. Especially if there’s a good reason to expect bias ”
Absolutely … which is why you should throw out anything produced by Phil Jones, Jim Hansen, Gavin Schmidt, Santer, Trenberth, Mann, Rutherford, et al. You should also throw out papers relying on these biased, untrustworthy sources. Not much left? Null hypothesis it is then.
WOW! $600,000 from Exxon-Mobile. Those devious Big Oil Guys!
They are even trying to corrupt the youth of America!
http://www.exxonmobil.com/Corporate/files/gcr_contributions_precollege08.pdf
How dare they donate 40 Billion to education!
Never mind, it was only 40 million. How dare they not care about education in America!
> I’m hosting a guest post for the authors of two recently published papers, on a topic that everyone seems to want to discuss at the moment
So instead of explaining what you meant when you described the BEST results as
“This is “hide the decline” stuff. Our data show the pause, just as the other sets of data do. Muller is hiding the decline,”
you’re trying to divert attention by starting another “discussion” thread about another nonsense paper.
Well speaking of nonsense, I would say your entire blog qualifies, it absolutely mystifies me. See the previous thread entitled “Pause(?)” which addresses the ambiguities associated with interpreting the recent temperature record. Also see my response to the Daily Mail article. The Daily Mail article lacks the context for my statements that were quoted.
Judith –
What is the full context for the assertion that Muller was “hiding the decline?” It would be helpful to have that full context provided, and I haven’t seen where you’ve done so. This seems to be the closest.
I have trouble seeing how that context explains why you said that Muller was “hiding the decline.”
Where did Muller “hide the decline” in stating that a long-term trend of warming is unambiguous?
The whole point of my remarks to David Rose of the Daily Mail is that the BEST data has very little to say about GLOBAL temperatures, since it is a land only data set that covers ~30% of the earth’s surface. That is the context for my statements to Rose.
“See the previous thread entitled “Pause(?)” which addresses the ambiguities associated with interpreting the recent temperature record” – JC.
Yeah, and wasn’t that a humdinger.
Rob —
My posts here are in direct response to Judith’s post where she discussed the context for her comments in the Mail article.
> See the previous thread entitled “Pause(?)” which addresses the ambiguities associated with interpreting the recent temperature record.
A quote (?) would be nice.
> Also see my response to the Daily Mail article.
A link (?) would be nice.
Re: curryquotes. Odd site. Qui bono? $$ involved??
Judith –
Did you discuss that distinction with the reporter? Was it that you didn’t contextualize your remarks, or was it that he lifted your comment (about global temperatures vs. land temps only) from a fuller context that you provided?
I think your remarks belong on another thread Joshua. You are OT as usual.
Rob – sorry:
http://judithcurry.com/2011/11/07/two-new-papers-vs-best/#comment-134258
Extra, Extra, read all about it… mad scientists want fuller context!
http://climategate.tv/2011/11/07/prosperity-or-suicide-a-tale-of-two-climate-policies/
Joshua, there is even room for a comment at the bottom.
I tend to think it common sense to take the arguments of The Discovery Institute regarding evolution with a grain of salt; ditto with those of Philip Morris regarding health effects of smoking (in the old days at least); ditto with Heartland, EIKE etc regarding climate change. (http://ourchangingclimate.wordpress.com/2009/02/08/who-to-believe/ )
It’s not ad hominem to get my plumber to repair the tap and my tax consultant to do my taxes rather than vice versa.
This one is taken on very effectively by skeptico: http://skeptico.blogs.com/skeptico/2009/02/global-warming-denial.html
There is a huge difference between taking things with a “grain of salt” and refusing to discuss them at all. Judith Curry is attempting to provoke a discussion of these papers. Such a discussion would necessarily involve skepticism of the conclusions.
Philip Morris has a financial stake in trying to keep their business alive. What financial stake does EIKE have? Oil? Please. World oil consumption isn’t going to be reduced by governments attempting to use more “alternative” sources of energy, because there isn’t any viable alternatives to oil. And the oil industry knows this.
You don’t like this because it challenges the faith in the same way religions don’t like atheists challenging their faith.
Bart, you are arguing that conflicts of interest must be taken into account when assessing information.
The mere presence of a conflict does not invalidate the work, but it does suggest that the work should be subjected to a higher degree of due diligence. Peer review does not do this. In fact, often times the “peer” have the same conflicts as the authors. So I think there is a substantive discussion that could be had about the quality of peer review.
Blog’s like this are an appropriate way of subjecting papers to additional evaluation.
Your comment also would imply that the IPCC MUST adopt a rigorous conflict of interest policy if their information is to be trusted. In this case, peer review is not enough because of the endemic conflicts of interest within the IPCC. Their refusal to do so should call all of their work into question per your thesis.
I recognized the poor quality of the research when I hit this section:
Has anyone seen any evidence that the Hurst effect has been solved, apart from it being a heuristic associated with fractal-like noise?
Besides the problem of identifying significance to the Hurst exponent, it is also difficult to derive the exponent unless you can accumulate very long time-series or can show behavior that has large dynamic range fluctuations. The classic case is of flood levels over a long time interval. Unfortunately, temperature doesn’t go through these orders-of-magnitude extremes.
The way I would think about it is that we likely have these long-term periodic effects, such as Milankovitch cycles and others that may exist at several different unrelated frequencies. Normally this would lead to effects such as beat frequencies, but if the strength of these signals is not too strong, the overall effect is to create quasi-periodic waveforms that can only be heuristically described, which is really the only use for a Hurst exponent. In other words it is purely a phenomenological description.
So what I don’t get is that the statement they make above, implying that persistence as measured by a Hurst exponent ” is explicitly opposed to external trends like the UHI or warming by anthropogenic CO2.”. That is quite the leap, as CO2 is a persistent GHG and the excess concentration can remain in the atmosphere for thousands of years. That is really the definition of persistence. Yet since the anthropogenic CO2 impulse has only been operational for 100 years and is clearly an artificial stimulus, I think that they are trying to suggest that AGW is not a natural Hurst related effect and so must be treated differently. So I would have reworded that statement to say that AGW is a persistent effect that may have no relation to the long-range temporal correlations described by a Hurst exponent.
You ought to read the papers and their cited references.
My professor of statistics used to curse microcomputers as they allowed anyone to do statistical analysis.
This is one of the worst mistakes: “The instrumental records applied by LU and LL are monthly means because the DFA requires a minimum of about 600 data points.” Increasing the resolution does increase the number of data points, but it does not increase the information on long-term trends, or rather, it simultaneously changes the definition of “long-term”: The authors seem to think that they’re analyzing multi-year trends, but they are in fact studying multi-month trends.
Read the paper, they know that. Besides, monthly trends is important. For example, in the temperature records for Canada one will see that summers are in fact cooling since the 1930s. There are 1/3 fewer heat wave days today than there was in the 1930’s. I would really like to know how CO2 emissions would do that, especially when the AGW faithful claim there will be more heatwaves in the future.
600 data points divided by 12 months per year gives 50 years of data and 50 data points. They have to do a 12 month box filter on this to remove the seasonal variations. That kind of demodulation is a no-brainer as it removes a known factor. You can ask yourself a hypothetical question of whether they would use hour-by-hour records if they had them available. Sure, but they would first filter over a 24 hour day to remove the daily fluctuations.
If someone wants to do this kind of correlation work themselves, try taking the data from WfT for both CO2 and Temperature and see how far you can get with the monthly numbers and no filtering. I will tell you it is hopeless as the seasonal CO2 variations swamp out the second-order effects linking the Arrhenius activation energy between CO2 and Temperature. But once you do a 12 month box filter, then the cross-correlation becomes very evident.
What Tol is saying about 600 data points as a phony inflated large number law is very relevant to what they are trying to show. You can see real cross-correlations out of 50 pairs of numbers, but doing autocorrelation and Hurst statistics over 50 individual points will show little significance. Whatever Hurst α exponent that they are seeing could easily be a value of 0.5, within which would make it a random walk within the margin of error for the limited statistical count they have to deal with. With that warming trend in there which they are trying to factor out, it is really hopeless. See the paper by Bhattacharya, “The Hurst effect under trends”.
Engaging in fractal explanations is tough subject matter when the data set is limited. Why aren’t they trying this with other historical data like the Vostok ice cores? Or have they?
Doesnt the problem of limited data work both ways? If the data is so limited, how can the AGW side make their claim?
AGW side uses just the average of the yearly means for all stations. Yet this masks what is actually happening within each season. Actually, only two seasons count, winter and summer, as fall and winter are just transisions to those seasons. A cold fall just means a longer winter.
The point is, if one wants to get an accurate measure of what is going on, then hourly temperatures is the only way to go. Yet that data is largely nonexistant. So all that is left is the means. However, that misses what is physically going on. And what is physically going on is in the summers, in Canada so far I have looked, is DROPPING in temperature. Summers are cooling since the 1930s. What is driving the yearly average of the mean higher is that winter temps are not getting as cold since the 1900s, and since the winter increasing trend is occuring faster than the summer decreasing trend, you get an increase in the average. The change in average does not tell us that summer and winter extremes is narrowing.
So I’d really like the AGW side to explain how more CO2 means cooling summers.
Oh, and when you do average the hourly daily temps you get a lower number than the simple daily TMax+TMin/2. Just think, the Tmax for the day may only happen for a brief minute, same with the TMin. 0.1C is mighty fine, it could fluctuate more than that over an hour. That mean value is too high. That means using the mean gives too much warming.
From a scientific viewpoint the AGW side has a model to deal with. CO2 was discovered to be a strong GHG about 100 years ago by Arrhenius. Atmospheric CO2 concentration was speculated to be rising about 50 years ago. The research for the last 50 years has been to try to verify the theory against empirical evidence.
This doesn’t work both ways because the skeptical side does not have a baseline model to build their case from, other than postulating natural variations will obscure the warming trend.
So the one-sided nature of the argument has nothing to do with the limited data (both sides are hamstrung by this) but in the asymmetry in the maturity of the models.
WHT, that reasoning:
“AGW side has a model to deal with. CO2 was discovered to be a strong GHG about 100 years ago by Arrhenius. Atmospheric CO2 concentration was speculated to be rising about 50 years ago. The research for the last 50 years has been to try to verify the theory against empirical evidence.”
reminds me of the story about a man looking for his keys under the street light because the light’s better.
AGW side model is not even close to describe climate change at any time scale. It’s assumptions are laughable.
So laughable that it can explain the temperature of Venus. You see, I have a bigger aperture than you do.
“From a scientific viewpoint the AGW side has a model to deal with”
Not one model, several conflicting models. It’s nice to see you admit that AGW is model based, not empirically based. Models mean nothing if they don’t match reality, which climate models dont. Models are not evidence.
Are you really this completely naive? Unless we have a model, we can’t make any prediction about the future outcome.
We aren’t doing this like we are watching the tides go in and out, sitting there dumbfounded at to why it’s happening.
Listen carefully: if we watch the evidence and it creeps up on us slowly, simultaneously building this huge inertia that we are unaware of, we won’t be able to do anything before it is too late. That is the rationale for why we want somebody to do climate science modeling
.
WebHubTelescope | November 7, 2011 at 9:31 pm |
are you really this naive?
when a model can not even reflect that last 7 days of weather how do you think it will do with long trends? if the output is garbage so is the policy you make from it… hence why AGW is GARBAGE
@WHT
You can’t do Vostok because the data are not equidistant, and CO2 and temperature proxies are not observed simultaneously.
Sure you can, I ran the Temperature data through an interpolator which generated intervals at the 1500 year interval, and this is what the autocorrelation function looks like:
http://img510.imageshack.us/img510/5402/vostockacf1500.gif
This is only showing what we know is there just by looking at the data, which suggests strong correlations in the interglacials at around 100,000 year intervals. And of course this will never show anything at a scale approaching the 1500 year sampling interval, but it sure picks out the important bits.
BTW, the temperature and CO2 cross-correlation looks like this:
http://img708.imageshack.us/img708/2825/vostockccf1500.gif
which is no different at long correlations, yet you can detect a small lag at short correlation times, which you can see here:
http://1.bp.blogspot.com/-OKesbsAmk28/TphIFVVfhbI/AAAAAAAAAkI/yHIzAXQBvzo/s1600/vostok_crosscorr.gif
@WHT
Let me rephrase: You can’t do Vostok unless you have an advanced knowledge of statistics. The quality of these results depend on the quality of the interpolator.
Also the temperature excursions on the Vostok data are not Gaussian, they are double-sided exponentials with some fat-tail behavior which identifies the fast very large interglacial swings.
http://4.bp.blogspot.com/-k1vYjQ8Qthk/TqdulOhrSEI/AAAAAAAAAko/0H9kUnzIcZs/s1600/vostok_temperature_changes.gif
The double-sided exponential will arise if the diffusion coefficient of the random walk parameter has a large spread in its value. The Gaussian in this case will smear into a double-sided exponential, also known as a Laplace distribution. This shouldn’t be surprising because who is to say that there is only one random walk coefficient, and realistically one can imagine a spread of these coefficients corresponding to different natural processes.
http://4.bp.blogspot.com/-k1vYjQ8Qthk/TqdulOhrSEI/AAAAAAAAAko/0H9kUnzIcZs/s1600/vostok_temperature_changes.gif
The bottom-line is that this is the kind of analysis that Ludecke should be doing as well. The data is available, but why they don’t look at it, I have no idea.
Richard, regardless of how the authors stated what might be considered their defense or reasoning for using monthlies, discounting what they say; why would it be inappropriate to use monthlies and so get long-term monthly of a hundred years ?
With 100 years of data, you have 10 decades. With 1200 months of data, you still have 10 decades only.
With 10 observed decades, you can say something about decadal trends.
Richard, so does that mean that in climate science, when you have 1000 yrs of data, you have ten centuries; you can say something about century trends – but not other trends ?
Have only looked at LL so far, but this is very interesting supplemental information to the preliminary BEST report (although it is getting far less ballyhoo).
– The early 19th century cooling shown by LL is not shown in BEST.
– The overall 20th century warming trend seems to agree pretty well with BEST.
– Contrary to BEST, which showed a net cooling impact of urbanization (!) LL shows a more plausible slight net warming effect of around 0.06C over the 20th century (all stations versus those with less than 1,000 population only).
– Interestingly, LL shows an unexplained effect of the altitude of the station, with those over 800m showing an additional 0.11C per decade less warming than all stations.
– The recent short term trends also seem to disagree with BEST
– The LL analysis goes a step further than BEST, in that it attempts to determine attribution for the 20th century warming, which it states “was predominantly a natural 100-year phenomenon”.
Like with medical diagnoses, it’s always good to get a “second opinion”.
Let’s see where this one goes…
Max
Max.
Latitude plays an important part in our planets circulation.
The different velocities generate movement. Water vapor for some reason is especially effected to latitude movement.
http://jonova.s3.amazonaws.com/guest/lalonde-joe/world-calculations.pdf
http://jonova.s3.amazonaws.com/guest/lalonde-joe/world-calculations-2.pdf
“The database for the instrumental temperatures used by LU consists of the following long-term series going back at least until the year 1791 AD: Hohenpeissenberg, Paris, Vienna, Munich, and Prague.”
My question to the authors would be why they did not include the Central England Record and the Irish Record?(Sorry the name of the series escapes me)
Regards
Stacey,
To be fair to the authors the Central England record is constructed from a patchwork of thermometer data from different sites. Not sure about the Irish one – Armagh, I think.
Regarding the Hohenpeissenberg data, this paper seems to be important. Were the biases detailed here taken into account? Were potential biases in the other stations investigated?
The linked abstract also mentions a bias with the Munich data – a change of averaging formula at the end of the 19th Century means recorded temperatures are ~0.5ºC too cool. It seems the changes over the 19th Century in at least Hohenpeissenberg and Munich are almost entirely due to biases in the record.
The long Irish record is indeed from Armagh, starting in 1790. The observatory is in a small park near the city centre. It’s not a large town (15, 000), but there will have been some change in population in 200 years. The record has some breaks, during some of which the nearest station for comparison was in Dublin. Not perfect, but what land site is?
@ Paul S
Thank you for your comment amd I take your point however my understanding is that the record is buildt up from individual weather stations across central England. PDF’s of Professor Manley’s work can be obtained from
http://en.wikipedia.org/wiki/Central_England_temperature
In one of his papers interestingly he discusses UHI.
Yes, that’s right, but the authors’ criteria appears to be single weather stations with records going back to 1800. The CET record itself doesn’t fit this bill since it is built from numerous stations which drop in and out of use over the centuries.
Whether this is reasonable criteria is another matter. The idea would be to obtain homogenous data but, from what I’ve found, these long records which are nominally ‘the same station’ are usually subject to several important changes over time, which introduce biases.
But doesn’t that work both ways then? How can the AGW faithful rely on the same data and claim the temperature is increasing? Biased data hampers everyone.
That’s why you use lots of stations to check against each other and make adjustments for known biases. Some of the key biases are known, as shown in the link in my post above – why didn’t the authors correct for these before running the analysis?
Are the biases justified to be corrected? We have some questions about that being done too. Including the methedology of filling gaps, “massaging” the data, etc. I see no problem with what they did in the paper. The test will be if someone else does the same thing and finds the same thing. Isn’t that how science is done?
The rationale is in the link I posted: http://meetingorganizer.copernicus.org/EGU2009/EGU2009-3117.pdf.
If Lüdecke, Link, and Ewert want to use this temperature data to prove something – ‘Instrumental records going back a maximum of up to about 250 years from present show the temperature declines in the 19th century and the rises in the 20th to be of similar magnitudes’ – they have to show why the adjustments are unnecessary or perform a sensitivity study to demonstrate they don’t affect the conclusions. It took me all of five seconds to find the linked abstract so I don’t know how the authors and the peer review missed it.
I found the raw Hohenpeissenberg data and added in the prescribed adjustments. The 19th Century trend is flat and 20th Century unchanged. Obviously this has a major effect on their conclusions.
Maybe the authors didn’t want to affect their conclusions.
Not very professional behaviour? Blinded by thoughts of ‘political motivations’? This is the problem in ‘climate science’ everything is wrapped up with who i people are, what they represent, not whether it has any merit…
https://twitter.com/#!/rjtklein/status/133543155583811584
https://twitter.com/#!/RichardTol/status/133540153196158976
https://twitter.com/#!/Realclim8gate/status/133540329516302336
https://twitter.com/#!/RichardTol/status/133541108750888960
This is all very unprofessional to me. especially assuming motivations (bad ones?) just by who/what associated with, should I assume the same of ALL IPCC scientists?
I think this show’s the current state of ‘play’ wrt climate science.
The very second something is out that MAY contradict the cannon, it is attacked from the off along with anyone deemed foolish enough to present it.
These papers may turn out to be wrong, but i laud people for looking at different statistical approaches and metholodiges for looking at what is, essentially, exceptionally important data (in this context).
For me, i’m heartened by the fact that they used, raw, an adjusted, un homogensied data. This already puts them 1 step ahead of most papers in my opinion. Whether the rest stands to scrutiny, only time will tell- but it’s very sad that the dogs have already been let loose.
Things like this make me sad and angry in equal measures.
Another ‘heartening’ fact is that they used only sites with long periods of data (whereas BEST used everything they could find and then chopped it into smaller pieces).
Note that Klein refers to the authors’ motivation. I did not.
I think that the statistic analysis is sloppy. The papers were published in minor journals, so that these papers had best been ignored.
The difference in tone between your remarks made here and those about Dr Curry made elsewhere betray your duplicity, I’m afraid. Your credibility is now shot to pieces.
Please don’t confuse me with Klein.
Richard S.J. Tol, I think you need to reconsider your remarks. You:
On your Twitter account, you said:
When someone pointed out the seriousness of your comment, you responded:
By calling it “disinformation,” you claim it is the intentional distribution of inaccurate information. Now then, it may be true you aren’t referring to the authors’ motives, but you must be referring to somebody’s motives. You are certainly accusing someone of dishonesty,
If it isn’t the authors, I have to assume you’re accusing Curry of it. Is that really your intent?
As a follow-up, here is what you said in another “tweet”:
It sounds like you’re calling Judith Curry dishonest.
Let’s be clear, Tol et al’s faith is being seriously challenged here. I have for years been demanding that these people, the AGW faithful, show calculations on how much our emissions of CO2 contribute to the climate changes we see. They are quick to point to any given heatwave, like the recent Russian heatwave, and the 2003 Paris heatwave (where they claim it was all of Europe, when it wasn’t) as being because of AGW. Yet when pressed they will not provide anything that shows BY HOW MUCH those heatwaves were made worse because of our CO2. They won’t because they can’t. To keep their faith alive they must maintain ambiguity at all costs, including attemps to discredit this paper with guilt by association and any smear they can think of. This is typical of those who have to defend their faith. It’s actually quite comical to watch them contort.
The paper may indeed turn out to be wrong, but it also may be confirmed right. 90% of the warming is natural. But the AGW faithful miss something so important in science. Challenging theory is a REQUIREMENT of good science. Without that, there is no science, but dogma.
Richard Wakefield, I’m not sure how most of what you said is relevant to my comments. I’m also not sure how you could conclude anyone’s “faith is being seriously challenged.” Perhaps their faith should be challenged, but we cannot look into people’s hearts and see whether or not it is.
With that said, I accept his remarks may have been made partially because of a biased caused the conclusions of the paper. There’s no shame in that if so, but he should clarify his intention. As it stands now, the only interpretation I see is he is calling Judith Curry dishonest.
If he had said “misinformation,” I wouldn’t have bothered remarking on the issue. However, “disinformation” requires dishonesty, and that’s a serious accusation.
The relivance is that the paper challenges the faith, so they will do anything to maintain the faith, including throwing out insults and misinformation themselves. Including the serious charge of claiming Judith is dishonest. It’s a common tactic I see all the time in political circles.
I have a post coming up on critical thinking, here is a quote:
“Many pseudo critical thinking approaches present all judgments as falling into two exclusive and exhaustive categories: fact and opinion. Actually, the kind of judgment most important to educated people and the kind we most want to foster falls into a third, very important, and now almost totally ignored category, that of reasoned judgment. A judge in a court of law is expected to engage in reasoned judgment; that is, the judge is expected not only to render a judgment, but also to base that judgment on sound, relevant evidence and valid legal reasoning. A judge is not expected to base his judgments on his subjective preferences, on his personal opinions, as such. You might put it this way, judgment based on sound reasoning goes beyond, and is never to be equated with, fact alone or mere opinion alone.”
This whole ‘disinformation’ thing is a joke. There are very few undebatable ‘facts’ in all this. Interpretation of the surface temperature record is not one of them.
Judith Curry, it may be worth your time to look at this essay. It has a lot to say about psuedo-critical thinking, though it sounds like you might have heard (or thought) of most of it already.
Brandon, that was linked to a few days ago. Spect it’s covered in the upcoming post…
Ah, good to hear BillC. Now that I think about it, it may be that I first saw the link on this site.
Judith: Statistics is a branch of mathematics. Right and wrong are strictly defined. These papers are wrong in the mathematical sense of the word. I think you have done a disservice by lending your credibility to these papers.
@Richard Tol.
I agree that statistics is a branch of mathematics but this does not preclude debate. There are some followers of this blog, and of course our hostess, who have studied maths since leaving high school.
Perhaps you would like to explain to us your objections to the mathametics, as opposed to the assumptions, involved?
Richard S.J. Tol, seeing as your comment here is in a fork stemming from one of my comments, I’ll ask you again about what you said before. In your Twitter account, you claimed disinformation was being spread. You also claimed not to be referring to the author’s motivations. Given this, the most sensible interpretation is you’re claiming Judith Curry is knowingly and deliberately spreading inaccurate information. This would mean you are accusing her of being dishonest.
Is this a correct interpretation of your remarks?
Judith –
Hopefully you also read this article from the same source on critical thinking:
http://www.hr-matters.info/feat2011/2011.jul.BecomingACriticOfYourOwnThinking.htm
Tell me, does the viewpoint expressed in that article seem familiar to you at all?
Thanks for the link, similar to another one that I was using, i will include this one also
“4. Damn Truth
John Tukey taught that Statistics is more a science than it is a branch of Mathematics. For a mathematics
theorem to be elegant, it is sufficient that it be beautiful and true. But Statistics is held to the additional
standard imposed by science”
http://www.amstat.org/publications/jse/v16n2/velleman.pdf
Richard S. J. Tol: Statistics is a branch of mathematics. Right and wrong are strictly defined.
The fundamental issue in applied mathematics is “accuracy”, not right and wrong. If the fundamental assumptions (all approximations) are accurate enough, then the results are accurate enough.
Does a sigma-algebra or Borel field exist in the real world? Of course not. How about a sequence of iid random variables? No again. Are there any stationary or ergodic sequences? No. For a given data set and a given problem, is there a mathematical/statistical approach whose assumptions are perfectly matched by nature? Not that anyone has ever displayed.
So, …, tell us specifically where the problems lie, and how you know that they are large problems.
Richard, you are seemingly entirely dismissing the role of judgment ?
From what I can google, it all says that reasoned judgement ( as Dr. Curry was mentioning) is very important, as it’s real-world study..
Surely reasoned judgement is the process by which the intellectually honest form opinions?
No dr. Tol, JC is not wrong to post these papers. Look at how much critisism of the work has happened in such a short period. Because JC puts these types of articles up, do not think that us of the great unwashed think that she is putting her stamp of approval on. That is not what this blog is about. It is about shining light on the good, the bad and the ugly, and allowing us to use our critical capacities and decide for ourselvs. If you think that I cannot read your statements of contestation and then make an informed decision, then you really do not understand who the denizens are!
Once again, score one for Dr. Curry.
Richard S.J.Toll you say” The papers were published in minor journals, so that these papers had best been ignored.” I have seen over the past few years some of the major journals behaviour quite extraordinary to say the least . When you look at the likes of M.& M. trying to get published, any contrary view gets published where it can. I bow to your expertise in statistics. Help them. Tell them where they are wrong.
Peter: M&M are fine statisticians. Their treatment at the hand of the climatological community is an embarrassment.
When you consider the costs of that treatment, it goes beyond embarrassment.
=================
Their treatment at the hand of the climatological community is an embarrassment.
A proper response is for authors such as Luedecke to submit their papers to the journal Energy and Environment.
Mainstream climate science has in general committed fraud in their representation of the work of M&M. We see the same going on in the Climategate emails.
Fool me once, shame on you. Fool me twice, nope.
Fred Berple, that is one of the most evidenced of cases, isn’t it ?
Clearly fraudulent, and clearly intended, misrepresentations concocted, in order to further their own gain.
From the perspective of science the question is strictly whether changes to incoming energy or outgoing energy are shifting the equilibrium resulting in global temperature change.
From the political perspective the question is strictly should we still be wasting money and effort on reducing CO2 emissions to stop global warming when global warming has already appeared to have stopped and no one is willing to make a prediction of when or if it will return and if it does will it be to the catastrophic levels predicted by the IPCC 2001 and 2007 reports which were both produced after the IPCC’s own data shows global warming had already ended.
Unprofessional is a rather mild term to use for what is essentially a complete violation of science protocol and ethics
Barry,
To quote a line from a TV show I like, it often seems as if a number of the commentors (whom I believe are involved in the sciences and/or engineering and are male) here act “like a bunch of bitchy little girls” and leave it to the women to act like adults.
It is therefore nice to see that some, like yourself, can refrain from stooping to such childishness.
this is my definition of Pseudo Scientists.. any scientist who attacks the differing point of view rather than looking at it and using science to show why it is wrong is nothing more than a hack… IPCC and many others who do not want scenic just their political goals are of more danger to humanity that all others combined… the blind control ambition will kill millions…
this is a sad time for true science…
I saw two quotes upthread which I feel deserve highlighting:
I’m somewhat inclined to agree with the former, but that would have me say nobody should spread the message from a number of pro-AGW groups and individuals, ones I’m sure the quote’s author would say are trustworthy sources. That shows the standard is really nothing more than a way to reinforce biases. People won’t agree on who is “trustworthy” in the global warming debate, even on indisputable examples.
As for the latter quote, I agree with it wholeheartedly, though I don’t think “political” needs to be in it. Science is science, no matter who it is from. It doesn’t matter if the science comes from a teenager living in his mother’s basement or a scientist who has lied repeatedly. The quality and substance of their work is what matters.
I am surprised that this work has merited a guest post, both on the basis of its content and the fact that much of it was already discussed here just recently. Most of the post addresses the conclusions of the authors’ paper comparing their analysis of twentieth century data with the BEST conclusions. Their conclusions were shown a week ago to be unsupportable on the basis of abundant evidence – here is a link to extensive discussion. One excerpt is requoted below:
“The paper’s conclusions are completely untenable, but that is not because of the mathematics but rather the physics. For the data between 1956 and 2005, the authors claimed that a non-deterministic fluctuation was the most probable explanation for the observed warming rather than a long term trend driven by a radiative forcing at the top of the atmosphere. (TOA). They cite greenhouse gases as the forcing of interest – however their analysis doesn’t tell us anything about what would cause the forced trend they claim to have rejected, but rather asks whether such a trend existed.
The ocean data show that the answer is yes. Ocean heat content and temperature increased in a consistent fashion over that interval, with short term ups and downs as punctuation. This can only be the result of net heating of the climate system from a forced imbalance at the TOA. The alternative would have been a fluctuating redistribution of heat within the climate system that happened by chance to end up in the warmer rather than cooler direction. Such a redistribution, however, would require the ocean to have lost heat content to the surface from within itself, and to have cooled over the specified interval because there is no other source of climate heat sufficient to warm the surface. Whether this process fluctuated or was monotonic is beside the point – the end result would have been substantial heat loss rather than the heat gain observed.
The non-deterministic fluctuation they infer can be conclusively excluded on this basis as a major factor although a very minor contribution is not excluded. Their results don’t tell us that the trend responsible for their data was anthropogenic, but we can infer that it was mostly anthropogenic by comparing the strength of the known forcings during the interval. Of those mediating warming (ghgs, solar, and black carbon changes), anthropogenic ghgs exhibited substantially greater forcing potency than the others combined…
I don’t think this paper would have passed peer review by reviewers who were objective but also familiar with climate dynamics, which is perhaps one reason it didn’t appear in a reputable climate-related journal. I have never heard of the journal it actually appeared in, so I can’t say whether or not it has a reputation for scientific quality outside of the climatology arena. I’m also somewhat troubled that the authors have apparently attempted to use the blogosphere to call attention to work that would be seen as incompetent within science itself.”
The earlier thread has additional details.
Fred, your comment on the other thread stated that you couldn’t agree with their conclusion, it was not a critique of their arguments or methods.
Judy – My comment was not a “disagreement” but an explanation of why their conclusions were wrong. Regarding methods, any method that leads to a violation of the first law of thermodynamics can be assumed to be invalid. This is true even if they report mathematical treatments that are consistent with erroneous conclusions – their methods can at best be said to do that, but are equally consistent with conclusions contradicting theirs that don’t violate physical laws.
What troubles me is that the invalidity of their conclusions should be seen as clear from a thorough scrutiny of the paper, and is a reason why the work will properly be dismissed as worthless within the realm of climate science. I think the blogosphere is more effectively used for addressing work that has some merit to start with.
Fred Moolten, your “explanation” is extremely weak. It effectively amounts to saying the papers contradict “what we know,” therefore they must be wrong. You offer no explanation of any error in how they reached their conclusions. You just say their conclusions are unacceptable. It’s possible you’re right, but that in no way justifies saying the papers shouldn’t be discussed.
Then again, you’re so vague your “explanation” isn’t really an explanation at all. It’s more like hand-waving. You didn’t offer any analysis to support what you said. You didn’t offer facts or even references. You’re so dismissive of their work you basically ensure anyone who doubts your position will continue to doubt it. Assuming the work is as untenable as you claim, the correct response is not what you’ve offered.
Carrick offer’s a comment you ought to read.
I don’t see why they condradict known physics. It is an approach that has been used to elucidate a lot of things in some branches of physics.
Would you be so kind to explain why you think this, rather than adopting your usual approach of telling us that if we knew as much about the subject as you did, we would come round to your point of view?
Fred,
Lately much of your defense of AGW has become obviously circular.
I hope you willconsider the implications of this.
Yes, you’re right. You are surrounded.
JCH,
Nice dodge, JCH.
Good luck with being able to keep that up.
Dr. Curry,
looking at the possible ways in which enough energy to heat the surface to the tune of the warming we’ve measured seems like a completely reasonable way to assess the arguments being made by this group. If the warming truly was a fluctuation, then every joule has to be accounted for as flowing from one part of the system to another.
That’s the main point Fred is making. Since we’ve seen heat increases in both the surface and the ocean, it seems highly unlikely that heat could have flowed from the ocean to the surface to create the warming we’re measured.
That is a physical argument.
Now, it seems some others claim that other physical processes, specifically albedo, could cause an internal change in the heat contained in both the ocean and the surface, but I have yet to find a physical mechanism that causes a 100 year or longer cycle in cloud or other albedo changes. I’d argue no one has either.
Greenhouse gas forced warming, however, has an explicit physical mechanism that can explain the warming.
So all of this is an argument. Unfortunately, we still do not have the data or necessary theoretical predictions to rigorously test HOW MUCH of the warming can be attributed to each change, internal and external, of climate forcings over the last century. We might never have that type of data.
But making a claim that a fluctuation without a physical mechanism to provide such a fluctuation can account for the warming is what seems to be lacking the argument in this instance.
Would you ever try to publish a physics paper without a physical mechanism?
I don’t think this is what they are saying. What they are saying is that the variability of the temperature record conforms to a certain statistical. Either it does or it doesn’t. If it does, then it probably conforms to known physics, if it doesn’t, then there is something wrong with their argument. However, to say that this must be wrong because it doesn’t conform to known physics does raise the possibilty that the physics may not becorrectly applied.
Richard,
Are you saying that you think their statistical analysis could disprove the utility of the first law of thermodynamics in this context?
Because that is the ‘known physics’ we’re talking about here.
Also, without an explicit physical model on which their statistical analysis is based, ie a physical mechanism for this 100 year fluctuation, it’s really hard to say what their statistical analysis says.
@ Fred Moolton
“Their conclusions were shown a week ago to be unsupportable on the basis of abundant evidence – here is a link to extensive discussion. One excerpt is requoted below:”
Please do us all a favour and don’t waste our time by providing a link to an earlier blog post by yourself which is just your own opinion? If you do then make it clear the link is to your opinion and not a reliable source.
Fred, it wouldn’t pass climate scientists who would have peer reviewed the paper for the same reason that little that does not conform to the faith gets past them. Soon as governments realize that what we are seeing is largely natural and beyond our control and not only does funding for AGW dry up, but carriers are destoyed (government to climate sciensts: “You lied to us to get money?). The stakes are much higher on the AGW side.
So the claim that this paper has affiliation to EIKE because of oil insterests is falacious because EVERYONE has a monitary bias. AGW scientists are not immune to the money forcings.
Fred,
I think these paper illustrate that Climate science’s understanding of the physics is in question. Thermodynamically, everything in the paper makes sense. The higher impact at higher altitude would be due to the CO2 impact being above the latent and conductive region of the lower atmosphere. Temperature can be equated to radiant energy, but radiant energy due to CO2 emission is in the upper regions where it has less competition from water vapor. 330Wm-2 DWLR due to GHGs is just wrong. Conductive, convective and latent flux will exist without GHGs.
A home insulation contractor can explain heat flow better than the IPCC.
http://redneckphysics.blogspot.com/2011/11/atmospheric-r-values.html
Still cleaning this up, but think about it.
It’s the same journal, that printed Gerlich&Tscheuschner.
Richard basically you said publically that Judith Curry was spreading ‘disinformation’ !
original tweet…
https://twitter.com/#!/RichardTol/status/133526155654475776
How many in the media/scientist/politicians will have seen that?
Had an opportunity to with draw:
https://twitter.com/#!/Realclim8gate/status/133540329516302336
But no.
https://twitter.com/#!/RichardTol/status/133540153196158976
Is Richard Tol really a credible source to determine disinformation from information, much less something that is incorrect?
The record would indicate a firm, “no” to that question.
By that logic, she also lent her credibility to Claes Johnson.
They’re acting like bunch of teenagers. “I’m not going to talk to Debbie, because she talked to Susie.”
Wrong last tweet, reinforced ‘disinformation’
https://twitter.com/#!/RichardTol/status/133541108750888960
Dr Curry –
You certainly have set the cat among the pigeons with this one!
I tend to agree with the example of the Skydragon people. Shining some serious lights on their work has had the effect of nullifying their strident claims. Perhaps/probably the same will happen with the above papers.
What concerns me is the paranoid idea that because ‘lies’ can travel half way round the world, there should be no examination of ideas SOLELY because of their origin. It’s one more aspect to the demonisation of dissenters and the politicisation of messages.
My feeling is that at Climate etc there is enough grown-up objectivity to distinguish between interesting perspectives and cranky rubbish. And the process of finding out is a learning one.
I don’t think your giving airtime to these two papers is significantly going to alter the stance of Richard Black at the BBC… :)
How can the observed warming be merely a natural fluctuation?
The earth’s energy imbalance as measured from space and as deduced from adding up atmospheric and ocean heat content is positive: More energy is coming in than radiating back into space. This directly contradicts that the increase in global average temperature would be random (since in that case we would expect a negative energy imbalance).
Conservation of energy precludes the climate to wonder off too far in any direction without being “forced” to by changing boundary conditions. Unless of course the energy is merely being redistributed within the system. Which it isn’t, since all other compartments of the climate system are gaining energy.
The paper’s conclusion that the observed warming is “predominantly a natural 100-year fluctuation” is at odds with conservation of energy.
http://ourchangingclimate.wordpress.com/2010/03/08/is-the-increase-in-global-average-temperature-just-a-random-walk/
http://ourchangingclimate.wordpress.com/2011/04/12/harry-potter-theory-of-climate-boating/
Thanks for stating your opinion. How about reading the papers? Especially the bit where they explain what they mean by ‘natural’.
Bart,
I would assume, if they’ve thought this far, that the idea would be natural fluctuations driving the TOA imbalance through cloud changes, ice cover changes etc. Of course, that would necessitate very high climate sensitivity.
Also if you claim that you know that the energy balance is positive, you have the problem of explaining the lack of warming of the air and sea discussed three threads back.
Particularly the sea, this is a very important point.
Care to look deeper than 700 metres? http://www.atmos-chem-phys-discuss.net/11/27031/2011/acpd-11-27031-2011.pdf
Depends, can you show me data for it or are you just going to model it??
Incidentally, to claim, as hansen does in that paper that the imbalance in the enrgy budget MUST be down to CO2, is as far as i can see unsupported*.
*note, he may well be right, but i didn’t see anything in that paper to conclusively prove that this is the case.
Bart hasn’t replied, but some of data comes from ARGO. Those pesky little robots figured out the oceans are deeper than 700 meters.
Bart Verheggen: You ask how can the 20th Century observed warming be merely a natural fluctuation? VS on your blog March 2010 did the time series analysis and demonstrated natural fluctuation. At the time, you did not agree because his calculation was not “physical”; i.e., did not account for the “known” physics. Fred Moolton also states that the Ludecke, Link, Ewert time series can not be correct because the analysis does not account for the known physics. Is it possible, that the known physics currently applied to the trace gas radiative transfer model may be correct calculations but just not be that important to global climate? Assuming equilibrium where there is none? Assuming linearity where there is non-linearity? We have rapidly increasing global emissions of CO2 over the past decade or more, a 6% increase year over year 2009 to 2010 according to the US Dept. of Energy. Yet, calculated global temperatures have certainly not kept pace and maybe even paused. Observations are important, especially when they don’t confirm a speculation/hypothesis. Does this paper by Ludecke, Link, & Ewert add to the complexities of climate change? I think so.
Bart,
The warming could have come through that pipeline from the deep oceans, where you guys store your missing heat.
Why does it make you people so angry that Judith won’t play that gatekeeper crap that you consensus zombies play?
Do,
You remind me that zombies are generally unhappy.
Imagine being a zombie to a faux science consensus and how bad that would make a zombie feel…..
Bart, are you claiming that climate scientists understand everything about how the climate systems work? Just because we do not have the defacto natural mechanism pinned down does not mean there isn’t one. Your statement is classic god-of-the-gaps. If we cannot find a natural cause then god (ergo humans) must be the cause. This is the very mistake that Trenberth is making, and why he wants the null hypothesis changed.
This is not religion works, not science.
Change: This is HOW religions work, not science.
They have models that show them the way.
Oh, Yeah!!! LOL. The Bible of the AGW faithful. The models say so so it must be reality. Geeze, the state of science these days. Well, climate science anyway.
Richard Wakefield asks “Bart, are you claiming that climate scientists understand everything about how the climate systems work? ”
No.
Sure sounds like the AGW faithful are. So you have to admit there is much more to find out, and a natural mechanism is likely to be found to explain the changes we see in the climate, right? Seems to me AGW scientists close the door to the very real posibility.
strawman
Bart V,
Your fingers type “no”, but you and your pals’ actions say, “yes.”
Bart V,
You ask: “How can the observed warming be merely a natural fluctuation?”
The implications of how narrow and, well, uninformed your views on climate are from that one question are profound, and even more so from an academic.
Bart Verheggen
The same way that all warming and cooling periods were natural fluctuations.
Since humans have only been putting significant amounts of CO2 into the atmosphere since the mid-20th century, all the warming/cooling cycles prior to then were “natural fluctuations”.
Max
How can the observed warming be merely a natural fluctuation?
How? It could be the same mechanism(s) that produced previous unexplained warming.
That you can’t answer the “How question” now is of no relevance to anything.
The paper’s conclusion that the observed warming is “predominantly a natural 100-year fluctuation” is at odds with conservation of energy.
Unless there are some natural fluctuations in the mechanisms that control energy input and output. Fluctuations in cloud cover, ocean currents, etc. for a brief introduction to this sort of thing in dissipative systems with input, consider the book “Modern Thermodynamics” by Kondepudi and Prigogine, chapters 18 and 19. Fluctuations are the natural result even with constant input, and the Earth climate system does not even have constant energy input.
Large changes in past climate were not just because of Harry Potter like variability, but rather due to a radiative forcing acting on the system, more often than not with CO2 involved (not always as initiator, but also as feedback).
http://ourchangingclimate.wordpress.com/2010/04/01/a-rooty-solution-to-my-weight-gain-problem/
http://ourchangingclimate.wordpress.com/2011/04/12/harry-potter-theory-of-climate-boating/
So you agree that the post I responded to was basically misleading? Natural mechanisms exist and the laws of thermodynamics do not prevent them from occurring.
No, you apparently misunderstood what I meant.
It’s exactly right that the laws of physics apply to past climate changes as well as current climate change.
In that case, I repeat my recommendation that you read the final chapters in Kondepudi and Prigogine. Clearly the laws of thermodynamics permit huge variations in temperature measurements in particular locations — even with constant input.
“In particular locations” perhaps, but the global mean temperature is being kept in check as correctly explained by Fred Moolten. Unless boundary conditions change that exert a forcing on the system.
You gain weight if you eat more than your body expends; you lose weight if you eat less than your body expends. There’s a lot of complicating factors involved that are only imprecisely understood, but the basic picture of conservation of energy is a pretty strong constraint. Statistical wizardry notwithstanding.
The conservation of energy arguments forgot the 2nd law of thermodynamics. Heat mixed into the deep ocean is not going to return to the surface.
Whatever happens to the heat in the deep ocean does not negate the fact that global avg temp is bounded by the global energy balance and the negative Planck feedback (which acts to restore random fluctuations in temperature back to its equilibrium value). Since deep ocean heat is increasing rather than decreasing, it is a further indication that surface temps didn’t just wonder off in the positive direction by taking up heat coming from the (deep) ocean.
Bart V, “Particular locations” The Earth Climate system have several thermal boundry layers with different time constants, sources and changing sinks. Three major climate zones exists just in the lower tropopause. CO2 change should amount to approximately a 1% change. We are using only the larger more easily measured energy fluxes to predict the impact of a 1% change in a complex fluid dynamic system with only recently discovering that solar spectral variation is greater than anticipatied. One percent. Deep ocean absorption of shorter short wave solar is approximately 8% of the total solar absorbed in the oceans. Cloud impact uncertainty is on the order of 3% and as you noted, the Planck response tends to dampen more rapid Surface temperature changes. The Tropopause stability tends to indicate that that dampening via the Planck response in more evident at and above the tropopause.
The climate system would appear to be as predictable as patterns in a LAVA lamp using the heavily radiant reliant approach used by the IPCC. Perhaps the reading recommended by Mattstat should be distributed to more IPCC authors.
Oh, and what is the excuse of the day for the Antarctic again?
.
Correction: that should be 0.8 percent below 100m, ~8% below 10m.
“The conservation of energy arguments forgot the 2nd law of thermodynamics. Heat mixed into the deep ocean is not going to return to the surface.”
Judy – That is an incorrect inference from a correct statement about the deep ocean. The argument is reinforced, not weakened, by the deep ocean heat transfer and the Second Law. The energy balance argument invalidates the paper on the basis of the First Law with the use of upper ocean heat (to 700 m) alone, but the deep ocean was also gaining heat (as it must during a warming interval because it has the longest lag, and in accordance with the Second Law). That makes the situation even worse for claiming that unforced fluctuations could have accounted for more than a very small fraction of the surface temperature change.
Some of these concepts have been treated quantitatively by Isaac Held in Heat Uptake and Internal Variability, which gives a sense of how little unforced variability could have contributed to warming during the second half of the twentieth century.
Bart
How about you coming up with a factual explanation of why you believe a somewhat warmer world is dangerous for humanity to the degree that it warrants the actions recommended by the IPCC. Do you believe that the IPCCs recomendations make sense?
Bart V,
Oddly enough it is the AGW promoters who come across as relying Harry Potter physics in this.
It is the AGW community that attributes grave peril to things that only the intiated can see and despises the muggles so much.
Bart, I appreciated the weight blog post. That provides a very good explanation for the random walk envelope.
“The earth’s energy imbalance as measured from space and as deduced from adding up atmospheric and ocean heat content is positive….”
This comment suggests we actually have measurements “from space” of the earth’s total outgoing and incoming energy budget.
If that’s the case, then why is Johns Hopkins seeking NASA funds for “communications satellites to shed light on the imbalance between incoming solar energy and the Earth’s thermal energy reflected back into space[?]”
“‘If you want to measure outgoing radiation with the accuracy necessary to understand global climate change, you have to make measurements everywhere, all the time,’ said Lars Dyrud, APL’s ERIS principal investigator.”
http://www.spacenews.com/civil/111007-jhu-seeks-nasa-funds-sensors.html
Why are we funding expensive research to learn what we already know? Or do we perhaps not really know it?
Climate scientists “infer” temperatures in the inland Arctic from temperatures measured on the costs and peninsula; they “infer” global average temperature from sparse measurements of the land, sea and atmosphere; they “infer” historical global average temperature from tree rings, ice cores, (lord only knows where they “infer” historical atmospheric and deep ocean temperatures from).
And from this chain of statistically enhanced inferences from poor data sources about a wide range of unmeasured phenomenon, we are expected to move on to a debate about “How can the observed warming be merely a natural fluctuation?”
Well, well, well, well, well,
Well, well, well, well, well, well, well.
Hmmm, hmmm, hmmm, hmmm, hmmm.
======================
Sweet and succinct seventeen! :)
Aha, right. The only thing I see, please forgive me, is AGW being a potential threat to the generation of my daughter, and generations after that. I don’t see how endlessly regurgitating debunked disinformation from angry old chauvinists (EIKE, dragon slayers) is going to help with that.
In fact, I’m not seeing one positive aspect of what you are trying to achieve. Because, to be frank, it all seems to revolve around Judith Curry getting a huge kick out of carving out a niche in the climate debate, sucking up to dominant old men and getting hailed by fake skeptics.
I hope for you the consequences of AGW turn out to be insignificant, because your role in making sure this experiment is conducted to the very end isn’t. Good luck with basking in all the attention, checking your blog stats and feeling important. Keep that battle going.
I would very kindly ask you to remove the links to my Arctic Sea Ice blog and graphs page from your blogroll, because I don’t think I want to be associated with this whole enterprise in any way.
Wee humunculi,
Suckle them all so sweetly.
Guilt pales in the chill.
===============
Not the “think of the grandchildren” again!
“Storms of my Grandchildren”…
You must lead a strangely sheltered life not to see the direct effects of anti-carbon legislation and taxes on your livelihood, let alone your children’s and grandchildren’s
Compound it. Your descendant’s lives have already been significantly diminished by this carbon misjudgment, Neven, and the world is cooling.
=======================
Peter317, I disagree because …
1.Tax money doesn’t disappear from the economy.
2.Tax policy that encourages energy efficiency and curbs pollution is good for me and my descendants.
@M. Carey
1. Of course it doesn’t – it just gets used to pay for a raft of white elephants, aka wind farms etc
But my point is that it disappears from my pocket, and raises the cost of other goods and services, emptying my pockets even more.
2) Fine if you can afford to pay for it. Part of the exorbitant rate I’m forced to pay for keeping my house warm is used to subsidise other people who have been conned into installing solar panels and wind generators. A year or two ago, and at considerable expense, I replaced my car (which I really need to commute to work) with a more economical model. In that time the price of fuel (diesel in my case) has gone up so much that it’s now costing me far more than it was before.
And I haven’t seen a pay increase in years.
Peter317, a carbon tax of X percent doesn’t increase the costs of all other goods and services by the same X percent. It triggers efforts to use fuels more efficiently and shift consumption to goods and services least effected by the tax.
It’s unfortunate you haven’t seen a pay increase in years. If it’s any consolation, inflation in the past several years, is low by historical standards. You attribute part of your heating bills to subsidies to encourage energy dependence. So you are in affect paying for something that is not benefitting you directly. Welcome to the club. I too pay taxes that are spent on lots of things that don’t benefit me directly(e.g., the invasion and occupation of Iraq).
I suspect the rising price of diesel fuel is the result of increasing demand from a growing and economic developing global population. Blame foreigners for wanting to be like us.
@M Carey
There’s a big difference between theory and what actually happens in the real world. What part of the world do you live in if you think inflation isn’t affected by fuel costs?
And it’s all very well saying that fuels will be used more efficiently, but how practical that is depends on where you’re starting from. Efficiency levels have increased enormously over the decades, and we’re now well into the region of diminishing returns. Besides which, it’s getting increasingly expensive. For instance, the cost of replacing a car which does, say, 20mpg with one which does 40mpg will take in the order of the lifetime of the car to pay for itself in terms of money saved on fuel. Taking that further, most people will simply not fork out to replace a car which does 50mpg with one which does 55mpg. As for increased costs to businesses, well they simply pass those costs on to the consumer. There’s a limit to what they can absorb.
As for the huge cost of fuel, it wouldn’t have anything to do with the 200%+ tax (in the UK), would it now? The ‘imported’ increase would be far less damaging without all that tax.
Peter317, if you read my post carefully, I think you will agree I never said inflation isn’t affected by fuel costs. If what I said wasn’t clear, I’ll try to to put it another way. An increase of X percent in the cost of fuel doesn’t result in an increase of X percent in the total cost of all goods and services. That’s because fuel costs are only one of many kinds of costs that go into producing goods and services.
Of course in the long run, whether a carbon tax on fuel is inflationary depends on how the carbon tax is used. Use it to pay down the national debt, and it may be inflation neutral.
“Welcome to the club. I too pay taxes that are spent on lots of things that don’t benefit me directly(e.g., the invasion and occupation of Iraq). ”
And that is what all taxes in whatever form do- have your effort support
that which don’t benefit you directly.
Having carbon tax doesn’t increase efficiency, though rising prices will lower demand. It’s as likely the more demand [more consumption] will cause increase in efficiency as compared to lower demand.
Taxes generally increases work productive- one has to work more to
make a living.
A carbon tax may force people to find ways of making more money or working longer hours.
Technology in general enables a person to be more productive- and technology is largely tied to having cheap energy- making energy less cheap will result in less productivity.
Things like mandating a 6 hour day and increasing energy prices do similar things.
Increased productivity due to used cheap energy and the technology that uses this has allowed governments to tax more. Conversely lessening
the supply of cheap energy will result in governments being able to tax
and will result requiring more labor to generate wealth.
But main aspect of carbon tax will be give more power to government which will allow this government to doing things you don’t want- e,g Iraq war. [Or what I don’t like corporate welfare.]
An Iraq war wouldn’t possible without government having the available wealth from tax revenues. [Though a government could raise the revenue as it did in the case of WWII.]
Having a powerful government that can conduct war and maintain global security is something shared among Dem and Reps politicians- as both sides voting for this war indicates.
gbaikie, stronger government is the price we pay for growing population density. I do not want a weak U.S. government.
Tax revenues always will be spent for some things I like and some things I don’t like. I am resigned to it.
And the award for understatement of the year goes to:
M.carey for
“I do not want a weak U.S. government.”
“gbaikie, stronger government is the price we pay for growing population density. I do not want a weak U.S. government.
Tax revenues always will be spent for some things I like and some things I don’t like. I am resigned to it.”
population density like technology- it increases efficiency therefore it also does allows more wealth/resources to be used by government.
If price we pay means we will always have politicians telling us [and people believing them] that politicians will improve everyone’s life if they pay more taxes [and this amount of taxes doesn’t cause economic collapse] then yes, taxes like death are unavoidable.
Lately higher and higher percentage of taxes are being spent on interest from past government borrowing. And due to the government’s ability to print money- such arrangement is good for people who wish save their money rather invest in a private sector. Though it seems that at some point the public may choose bankruptcy rather than be forced to pay this debt.
Whenever this occurs it’s best to hold real assets- some gold is a good idea.
The rational choice would be not have govt [particularly a superpower]
declare bankruptcy regardless the insane level of debt- and so one merely gets inflation of the currency [gold useful for that also].
“1.Tax money doesn’t disappear from the economy.”
No but the deadweight costs of taxes do disappear from the economy and, for something like fossil fuels, get a lot bigger in the long run since the demand for fossil fuels is quite a bit more elastic in the long run than the short run.
NW, a carbon tax would result in deadweight costs if the tax was in addition to the taxes we already pay. Compensating for the deadweight costs, however, would be a reduction of carbon’s external or social costs.
A carbon tax, which essentially a sales tax, would not result in deadweight costs if it took the place of other sales taxes. The resulting reduction of carbon’s external costs would be almost like a free lunch, except for the fossil fuel industry and foreign oil producers.
With all due respect,,,
1. TAXES by definition are TAKEN FROM THE ECONOMY. thus they are not available for job growth or products and goods
2. TAX POLICY which DEPRIVES EVERYONE OF MONEY AND ABILITY.. I call bull shit on your “Curbs pollution and energy efficiency” as one simply looks to china and other third world countries and sees that the only ones being penalized are the achievers…
Communism is a disease equal to liberalism… both need to be cut out and destroyed for the cancers they are.. .
“Quote by Ottmar Edenhoffer, high level UN-IPCC official: “We redistribute de facto the world’s wealth by climate policy…Basically it’s a big mistake to discuss climate policy separately from the major themes of globalization…One has to free oneself from the illusion that international climate policy is environmental policy. This has almost nothing to do with environmental policy anymore.”
Neven leaves us with some real zingers as he slams the door on the way out! Threat to my daughter! Angry old chauvinists! Sucking up to dominant old men! Getting hailed by fake skeptics! Remove the links to my Arctic Sea Ice blog! (I liked that one best, Neven–kinda conveys a sense of high dudgeon and all that sort of good stuff).
And to think that Neven is a guy who aspires to rule the roost as one of our philosopher-kings and cull-masters. Oh my goodness gracious.
But we know the score, Neven. Despite your pathetic and inept best efforts, your little CAGW hustle has failed to lay its golden egg and that puts its money-bags, brave-new-dystopia backers in peril of loosing their greenshirts. And that means, in turn, your generous, chicken-feed allowance is in jeopardy, as well. I guess the sky really is falling for you useless-pecker capon-littles.
Robert and Neven–birds of a feather.
Go Baby Ice, Go.
============
Ah, if AGW was the only problem…
Good luck with promoting violence, mike. You will get your way. Kill ’em all.
We try and leave the killing to windmills and the promoters like you. Millions of birds and bats slaughtered every year. Billions of mosquito’s left alive to kill us by spreading disease.
Windmills kill flying insects as well as birds and bats. However, only small percentages of the populations are killed by windmills and other man-made machines such as cars and airplanes. Not a big deal unless you are a bat hugger or bug hugger.
“most bats in North America are insect eaters (called insectivorous) and are the only serious nighttime foragers on mosquitoes and many species of agricultural pests that cause millions of dollars of damage each year. A single little brown bat can eat up to 600 mosquitoes in an hour.”
You may have no problem with the slaughter of bats and the billions of mosquitoes left alive … but I do.
I also hate that wind turbines slaughter raptors all so rich maggots can make money off of subsidies.
Bruce, it sounds like you want to kiss a bat. Don’t do it. Bats are known for rabies.
Where did mike promote violence?
This is about where you start to feel sorry for some. The dissonance is proportional to the previous passion.
===============
Neven,
Nothing pooints out how bizarely disconnected from reality an AGW true beleiver is than when they ignore the calls to violence from leading AGW promoters and claim that skeptics are violent.
Do you want to think a wee bit more about what you are falsely claiming or do weneed to go and re-post the 10:10 stuff, the recent global initiative video, or links to “Time’s Up!” and the other books on why AGW justifies committing xenocide?
You know, Neven, you are a real piece of work. At a minimum, I’d note the indecent haste with which you revisited us after your very recent twit-snit, booger-flipping, “I’m outta here!”, dramatic exit. Sorry, Neven, not a class act. But does this mean Dr. Curry can put the link to your stupid blog back up? Oh, I do so hope so!
“Good luck with promoting violence, mike” you say. C’mon, Neven, this isn’t the first time you’ve pulled this sort of chicken-sh*t, play-the-victim stunt, is it? And in your circles, I suspect such low-life ploys are routinely and successfully employed to shut down unwelcome points-of-view. Right, Neven?
Look, Neven, my prior comment did implicitly suggest that you just might be deprived of the taxpayer tit in the near future, with the further implication that you might even be forced to work at a real job–you know, just like normal people. But that’s not violence, Neven, even though it probably suggests a fate worse than death from your point of view. Sorry, you’re not a victim, Neven. Better luck next time.
Neven,
Rot toch een eind op zeikerd.
Neven
Some advice: if you don’t like it here, don’t come here. Spread your stuff elsewhere. Maybe it will make the grass grow green there.
Max
“Some advice: if you don’t like it here, don’t come here.”
It isn’t your blog to be giving such advice on.
Oh let’s not worry about all the Millions dying NOW because so much money and time is going in to Green and Climate research.
It could be much better spent on today’s problems of lack of Clean Water and Power for the poor, instead of a hypothetical problem in 50 or 100 years time.
Dramatic……….and wholly welcome….bye bye.
Bart:
It doesn’t necessarily violate conversation of energy.
Global atmospheric-ocean fluctuations affect cloud albedo, cloud albedo affects energy balance, energy balance affects temperature. Ergo, you can get a 100-year swing in temperature without violation of energy conservation.
There are certainly physics bounds on how much variability you can get, but since the Sun acts as a power supply, but we’re nowhere close to reaching the limits over the last 100 years.
The stronger argument would be to show that the net energy balance, which you include all factors including albedo change over time, presumably all well measured, demands anthropogenic forcing in order to conserve energy. The issue there is we don’t have a complete energy budget yet, let alone have one for the last 100 years, so there are still a lot of loopholes in that argument.
There is a strong restoring force to equilibrium. This is seen immediately after El Ninos or volcanic effects where even a 0.5 degree perturbation takes only about a year to mostly disappear. The larger the perturbation, the shorter-lived it is. This is because of how effective the Planck response is at damping out perturbations.
Jim your ‘restoring force’ may act swiftly on the atmosphere, but I’m sure oceanic changes occur much more slowly.
Carrick – the authors set up a false dichotomy between “deterministic” and “natural”, which makes no sense in climatologic terms, because the two are not antithetical. That aside, if they had simply claimed that some “non-deterministic” fluctuations, perhaps of a random walk variety, might have played a role in the 1956-2005 temperature trend, that would have been unarguable, and is in fact a generally held view. However, to claim that such fluctuations played a major role is incompatible with observed data, which found that the ocean warmed progressively during that interval, with some peaks and dips, to the point of adding about 10^23 joules of heat (more if the deep oceans are included). There is no plausible physical mechanism starting with random fluctuations that can do this without postulating a “runaway climate” type of feedback that would be associated with impossibly high climate sensitivity values. As Jim D pointed out, fluctuations induce a restorative force that would preclude anything like the progressive addition of 10^23 joules over 50 years, and in fact, the restorative force is what is routinely observed with attempts to estimate climate sensitivity from TOA flux changes. If the authors or others wished to argue otherwise, they should the calculations that would enable the observed values to occur “non-deterministically” in the face of anything like the normal restorative processes.
These principles, based on fundamental thermodynamics invalidate their quantitative argument, while still allowing for the possibility of minor effects.
There are other serious flaws with the paper, but the aforementioned ones should suffice to exclude it from serious attention in the realm of climate science itself.
The blogosphere raises a different issue. Above, the question was raised as to whether the paper was worth discussing. Unlike the laws of thermodynamics, this is a matter of opinion, because even papers of no merit can be informative as a foundation for refining our understanding of important principles. My own opinion is that if each day were 48 hours long, many papers deserving little attention might warrant more. However, the WCRP Program discussed in the past few days included several papers of substantial interest and value in advancing our understanding of climate change, including all its uncertainties. If we were to choose something worth attention, any one of these would deserve a high priority in my view. The current paper would be very far down on the list.
But that wouldn’t have resulted in the huge amount of hits and comments this EIKE paper has produced.
Fred Moolten, you say:
Could you point to where the authors do this? I did not see anything which did so. In fact, that seems to directly contradict what the papers conclude.
Perhaps a couple quotes will help demonstrate the reason for my confusion. From one paper:
This definition certainly does not rule out the possibility of a deterministic cause. Indeed, when taken with the other paper, it seems to suggest one. This is shown by a quote from its conclusion:
This is obviously a deterministic cause (a point made even clearer in the preceding paragraph). It is also a natural cause, both by their definition, and the fact they offer it as a possible alternative to a large anthropogenic contribution.
I cannot see any way to justify the claim “the authors set up a false dichotomy between ‘deterministic’ and ‘natural.'” Perhaps Fred Moolten can offer some sort of clarification, but at the moment, it seems he has interpreted the papers exactly backwards on this point.
From the paper – “However, the most important characteristic of long-term correlated temperature records is that they include fluctuations that appear to be deterministic trends, but are actually quite natural”
Their paper is invalid for other reasons, but this is an example of how they have confused the issue in the paper, and perhaps in their own minds.
the most important characteristic of long-term correlated temperature records is that they include fluctuations that appear to be deterministic trends, but are actually quite natura
That is indeed infelicitous wording, but most people tie themselves in verbal knots talking about “random”, “deterministic” and “natural.” The author’s fundamental contrast is between a process that can be deterministically related to CO2 (or something else specific) versus a process not reliably related to CO2 (or other stuff concomitantly recorded during the 20th century.)
Lots of processes are known to be deterministic in principle but empirically random. I mentioned the gunk that accumulates in HPLC columns; every measurement device has some such perversion that is deterministic if studied in sufficient detail but empirically random in application. Sometimes people will assert that “chaos” applies in such cases, as in predicting the track of a tornado, but in most cases that I know of a showing of chaotic determinism can’t be made. It is sometimes claimed (e.g. by subjective probabilists) that all apparent random variability is caused by incomplete knowledge of mechanisms, but that can’t be shown; all that can be shown is that there is always empirically random variation.
Fred Moolten, I don’t think your answer supports your claim. The quote you offered conflates “natural” with “natural fluctuations.” Contrast this to a similar quote found in the other paper:
You’ll notice this wording does not support your claim, at all. To see this is not just a fluke, here’s another quote from the same paper:
I understand confusion on this issue, and the paper you quoted from does have a poorly worded paragraph, but when both papers are examined together, there can be no doubt “natural” and “deterministic” are not considered mutually exclusive. The fact there is one incorrectly worded paragraph does not mean we should ignore the repeated and accurate usages found elsewhere in their work.
MattStat, you are certainly right about that wording. It was inaccurate. However, if you read the other paper, the intended meaning is made much more clear.
OK, so do these “natural fluctuations that appear to be trends caused by external impacts” have any positive feedback mechanisms that can act strongly over the span of decades and have persistence over centuries or longer?
I am curious, aren’t you?
WebHubTelescope, in the context of this particular exchange, not at all. I don’t see it as being relevant to the point being discussed. Namely, Fred Moolten said:
But the only support for that statements appears to be a single, poorly worded paragraph that is contradicted by many specific paragraphs in these papers, as well as the primary conclusions of the papers. Given this, I’d like to hear whether or not there is any justification for the statement I’ve missed, or failing that, I’d like for the exchange to be resolved by all parties acknowledging that statement was incorrect (and that the mistake was quite understandable).
Outside the context of this exchange, such as in another fork, I might be curious about the issue you mention. You’re welcome to discuss the issue in another fork, but in the meantime, I’ll ask you to focus on the single issue being discussed in this exchange,
Here is the deal. Ludecke are trying to map the process as a kind of a random walk, with potentially fractal hops, that generate an envelope of maximum temperature excursions over time.
From the nature of random processes, we all know that we can get what are called “runs” of reinforcing moves that tend to push the envelope farther away from the starting point. In a purely random walk, this envelope will go as the square root of time. So over a really long time span, we would expect that these fluctuating excursions in temperature can occasionally get really large. Yet , where is the evidence for this? Why aren’t they doing this DFA analysis against something like the Vostok ice core data? My impression is that they won’t because the Vostok data looks much less random and has these strong delta Temperature boundaries that the “runs” never go beyond. This indicates that the natural random variations have some constraints that prevent that kind of envelope from being followed.
The other point with the DFA is that I would expect the papers’ to indicate what the “residual” of their analysis is. By residual, I would suggest that this is the original trend line that they detrended out when they performed the DFA analysis. They are clearly trying to push the fact that what is observed is all natural random walk or fractionally random walk which can create the trend simply by chance, without actually producing an alternate hypothesis that this is a real trend governed by a strong physical cause.
I suggest what we do instead of this DFA analysis is perform a real dispersion-based analysis. In this case, the dispersion is in the rate of AGW warming. So what we do is take the nominal rate of increase and place delta variations about this rate, and then we find out what the trending rate is. I looked at the method for DFA on the wikipedia site (http://en.wikipedia.org/wiki/Detrended_fluctuation_analysis) and I think the answer for the missing trend is sitting right there. It is the value of a (not alpha) that is used in the sum. If this bit latex doesn’t show up, go to the wiki article.
![F(L) = [\frac{1}{L}\sum_{j = 1}^L \left( Y_j - aj - b)^2]^{\frac{1}{2}}](https://s0.wp.com/latex.php?latex=F%28L%29+%3D+%5B%5Cfrac%7B1%7D%7BL%7D%5Csum_%7Bj+%3D+1%7D%5EL+%5Cleft%28+Y_j+-+aj+-+b%29%5E2%5D%5E%7B%5Cfrac%7B1%7D%7B2%7D%7D+&bg=ffffff&fg=333333&s=0&c=20201002)
The value of a is the trend that Ludecke doesn’t really bring up. They simply talk about the natural fluctuations.
Is there anybody out there that wants to pursue this line of thinking? There are probably only a few people on this list, including MattStat that could help out here, but I think there might be something to this idea.
This is the formula that wouldn’t parse:
http://www.texify.com/img/%5CHuge%5C%21F%28L%29%20%3D%20%5B%5Cfrac%7B1%7D%7BL%7D%5Csum_%7Bj%20%3D%201%7D%5EL%20%28%20Y_j%20-%20aj%20-%20b%29%5E2%5D%5E%7B%5Cfrac%7B1%7D%7B2%7D%7D.gif
the normal restorative processes.
Do these processes affect the hypothesized accumulation of heat induced by increased CO2? Do they include the changes in cloud cover, and if so at what altitudes?
Random processes and events do not have to occur ““non-deterministically”” to be empirically random and to be accurately modelled by probability theory and monte carlo methods. It is sufficient in many cases that the complete causal mechanism be too complicated to be completely known, as in the molecular motions underlying Brownian motion and other drift, or the detailed dynamics inside HPLC columns.
You seem to be saying that the authors need to characterize “natural variability” completely before it can be shown that the 20th century variability is within the range of natural variability absent anthropogenic CO2.
Way too little is known about the quantitative heat flows into, through, and from the atmosphere for the thermodynamic laws to imply much. Sure energy can be neither created nor destroyed, but in the atmosphere most energy flow is never measured. It can be reflected, it can be stored where there are no thermometers, it can change the flows of the Gulf Stream and Japan Current, and cause hurricanes and evaporation.
“Way too little is known about the quantitative heat flows into, through, and from the atmosphere for the thermodynamic laws to imply much”
My response, Matt, to that and similar statements in your comment is that in your own field of knowledge, statistics, there are things you know well that would be foolish of me to challenge. The same principle applies in reverse to climate physics. I don’t want to dissect your comments in more detail, but they imply serious lack of understanding about what is known and not known about climate physics.
I’ve given reasons in this thread why the paper can’t be taken seriously as a climate paper. However, I would sincerely be interested in your views as to whether, climate aside, you think its methods are sound enough to perform the attempted analysis in the paper from a mathematical perspective.
The same principle applies in reverse to climate physics. I don’t want to dissect your comments in more detail, but they imply serious lack of understanding about what is known and not known about climate physics.
Surely you are not claiming that heat flows are well known? According to Trenberth there is a lot unaccounted for. Marcel Leroux in “Dynamic Analysis of Weather and Climate” documents lots of energy flows where the energy in the flow is not measured. You don’t even know in much detail how the clouds fit into the “restorative mechanism” that you wrote about, and that I asked about.
Consider the following quote from the second paper: ‘Natural’ means that we do not have within a de ned con dence interval a de nitely positive anthropogenic contribution and, therefore, only a marginal anthropogenic contribution can not be excluded. How would you formulate a distribution for “natural” temperature trends so that you could test the observed temperature trend for its statistical significance? This question must be answered before it can be concluded that the human signature in 20th century warming is “unequivocal”. Richard Tol in this thread said that you need at least 1,000 years of data; if he is correct (he can make a good case!) then no test of the statistical significance of the human component of observed warming has yet been done. Full Stop .
If this paper prompts enough people like Dr Tol to admit that no one knows what natural background variation is actually like, then it will have fully justified its publication.
Lüdecke et al took the approach of developing a model for the natural variability of 100-year long curves by studying some of the observed statistics of the chosen records. Probably, that is the best effort yet undertaken to develop a sampling distribution (for 100-year long temperature records) to test the hypothesis that there is no human signal present (or a tiny one only) vs the hypothesis that there is a non-negligible human signal. Having formulated a way to generate a population of random paths (subject to all the paths having observed statistics matching those in the climate record), they used monte carlo simulation to determine whether the observed records displayed more warming than would be expected according to the model of natural variation; using the usual 5% significance level, they showed that the obtained record is not statistically significantly different from the expectation under the null hypothesis. They showed more: that the observed record is well within the limits expected from natural variation. It is very good work.
Now: is their model for natural variation accurate? As Richard Tol notes, there isn’t a sufficient amount of data for us to know. However, it is the best available to date. Did they select the best station data to use? I expect replications with other stations to follow, and we’ll find out how much difference is made when different stations are analyzed. Did it limit their analysis that they used univariate modeling? Well, for a multivariate test, they would have to develop a multivariate model for natural variation — which could then not be used as definitive because we don’t have 10 centuries of multivariate data. I expect empirical Bayes methods will be used in future, but still we will not be able to say that we know the sampling distribution for sure.
It’s no wonder Trenberth wants the null hypothesis changed. Had this study been available for comparison when Hansen gave his 1988 Congressional testimony, it would have been obvious that the null hypothesis of no human influence could not be rejected at that time. Nor has it been rejected by a proper test yet.
Is this analysis definitive? Of course not: I expect that it will have impact, and that many other scientists besides these authors will elaborate their method.
I noticed too late that the ligature “fi” was removed from the quoted text. “Defined” was turned into “dened”, and so on.
I don’t want to dissect your comments in more detail, but they imply serious lack of understanding about what is known and not known about climate physics.
what I wrote was: but in the atmosphere most energy flow is never measured.
What I wrote is a true statement. Even the measuring of surface temperature is known to be sparse. Even more sparse is the measurement of wind, humidity, long and short wave radiation, etc.
You turn my statements about quantitative limitations (“way too little is known about the quantitative heat flows”) into statements about other knowledge and understanding.
So, a simple question: the sun rises over an atoll that is about 95% water in a 1kmX1km area, in December, at the Equator, and shines with no cloud cover from 6am until noon: how much energy is transferred from the surface to the upper troposphere? Now it’s followup: How much will that change if the atmospheric CO2 concentration doubles?
Matt – The question you asked can be answered, but additional data would be needed for a good estimate, and the answers can’t come from back of the envelope calculations. It’s also irrelevant to the paper under discussion, which can be shown invalid for reasons given above and others. What we don’t yet know about atmospheric radiative fluxes can’t rescue this particular paper – it’s unsalvageable..
It seems to me that you could offer some informative comments on how the authors addressed the statistical issues, and those would be worth reading.
It’s also irrelevant to the paper under discussion, which can be shown invalid for reasons given above and others.
My comment was relevant to a false claim that you made: namely that thermodynamic arguments are sufficient to show that the natural variability modeled by the authors can’t occur naturally. On this I’ll direct your attention to Chapters 18 and 19 of “Modern Thermodynamics” by Kondepudi and Prigogine that show how tremendous natural variability can occur in dissipative systems even with constant input. Take a system like the Earth’s climate that does not even have constant input, and natural variations as great as those observed are to be expected without human CO2 ever having been input.
From a statistical perspective, one of the hard parts of testing a statistical hypothesis that is formulated after looking at data is how to formulate the proper sampling distribution for the test statistics. The authors do a good job of that, and then test the hypothesis that the CO2 raised the temperature of the late 20th century more than could be expected by chance — using a monte carlo method. It is for sure more reliable than the statistical “tests” performed and announced ca. 1988. If for some reason anybody feels a need to enact a policy now, this is more informative than the IPCC reports.
It doesn’t, as you note, actually tell you anything about “climate”; it only tells you that the temperature fluctuation observed and commented on by Hansen in 1988 and many others since then isn’t anything unusual. Authors should release their code and the exact data set that they used; other people should try out the method with other temperature records, etc. We should have a good few years reading papers inspired by these papers. Unless they are lying, which so far no one has claimed, and which I mention only because it sometimes happens.
Thermodynamic principles show the authors’ conclusions to be untenable. The details were described above by me and others in this thread, as well as the previous thread. Anyone interested can review this to make their own judgments. If they disagree, they should show the calculations that allow those conclusions to be reconciled with the data.
Fred: Thermodynamic principles show the authors’ conclusions to be untenable. The details were described above by me and others in this thread, as well as the previous thread.
If you think that, then I repeat my recommendation that you study the chapters on non-equilibrium thermodynamics and dissipative systems in the book by Kondepudi and Prigogine. You are behind.
Interesting exchange, Matt and Fred, thanks very much.
Now Fred, I must ask the question I asked on the previous thread. Their definition of natural variation includes solar forcings and everything else that is not due to man. So your fundamental argument about thermodynamics is just not correct. By the way Fred, what caused the warming of the oceans and the atmosphere from say 1600 to 1970? Are you saying that natural variability couldn’t cause it because the “heat had to come from somewhere?” You have got to do better than that.
But leaving aside the attribution, what do you think of the data itself? That’s more interesting to me. It is indeed nice to see the 2000 year paper which does NOT use “Mike’s Nature trick.” But perhaps to you that trick is justified.
I keep getting the impression that you have an encyclodic mind much like Francis Bacon. It just turns out that Bacon was totally wrong about science and died of a cold contracted when stuffing a chicken with snow trying to verify that freezing preserves meat.
Fred, I would like one reference to the literature where Mike’s Nature trick was not used. You know if Toll’s idea that paleoclimate data has little useful information, it kind of calls into question one of the pillars of global warming, namely, that we can estimate sensitivity from paleoclimate and that is really its basis, not the models which are acknowledged to be questionable.
Mann’s proxy data relate mainly to the past two millennia, while paleoclimatologic data extend far earlier than that and do not depend on Mann’s proxies. Those data are useful for climate sensitivity estimates (mainly via “inverse modeling” – see for example AR4 WG1 Chapter 9 as well as the Knutti and Hegerl review article), but sensitivity can be derived independently of those data, and to some extent without recourse to GCMs. That’s a huge topic, and can’t really be covered in a few comments here.
David – If they had correctly attributed almost all the 1956-2005 warming to forcings, they would have written a different paper, but they appear to have attributed most to non-deterministic fluctuations. The question of which forcings dominated that interval is at least thermodynamically sensible, and can be resolved from observational data, which show most of the forcing to be anthropogenic. However,none of that seems to be addressed in their paper – at least not in a manner that distinguishes forced change from their ambiguous “natural variability” concept. If that is due to ambiguous writing, then perhaps they intended to describe forcings all along. In either case, they would be wrong, but if they had acknowledged the forcing part, they would simply be wrong on the forcing data and not on basic thermodynamics, which renders their conclusions incompatible with the ocean data showing the addition of about 10^23 joules of heat.
Many factors operated between 1600 and 1970, including changes in solar output, volcanoes, and CO2 and other ghgs since the mid to late 1800s, with significant ghg temperature effects starting in the early twentieth century and dominating the second half of the century. I don’t know to what extent unforced variation played a role during some of the earlier times, but I believe we can conclude it was minor at most from about 1950 on, since we have ocean heat data to show that the warming was almost entirely forced. Isaac Held’s blog had an analysis of this principle recently that you might be interested in reading.
I don’t think “Mike’s Nature trick” is the right way to do science.
In our house, we have generally been able to preserve meat by freezing it, just like Bacon thought. Was he wrong? Didn’t someone recover some edible mastodon steaks from Siberia or other such frozen climate, or is that a myth?
Fred, beyond repeated assertion, I do not feel that you have demonstrated to the layman that natural variability was unable to cause the historical heating mentioned by David Young. It seems to me that if it could have caused warming in the past then it could equally have played a role more recently.
Rob – Before humans strongly influenced the climate, global temperatures rose and fell on the basis of natural variability. I don’t think that is controversial. My comments in this thread have focused on the claim in the paper that unforced natural fluctuations could have accounted for most of the twentieth century trend, with specific reference to the 1956-2005 interval. We can exclude that possibility for that interval because we have ocean heat data for the interval, whereas we don’t for earlier intervals. A huge quantity of heat was added to the oceans – about 10^23 joules. There is no physical mechanism consistent with either observed or theoretized climate behavior that could accomplish that except via a sustained forcing whereby more heat entered than left the climate system over a period of 50 years. (In a response to Dr. Curry, I also linked to a quantitative treatment of this issue – see Isaac Held’s blog article at Heat Uptake and Internal Variability).
There have been comments in this thread to the effect that the laws of thermodynamics are consistent with unforced natural variability. That is certainly true, but an important role for the particular interval of 1956-2005 can be evaluated from the ocean heat data, and is found to be minor at most.
Richard Tol’s twitter followers include journalists. Andy Revkin and Keith Kloor… Keith has already expressed an interest (contacting Richard via twitter)
Twitter is public!!
Heh, wait’ll someone suggests that thermometers are as poor a proxy for temperature as tree rings are.
==================
kim
Haven’t you gotten the word?
[Wind shear.]
Works every time when the thermometers are spooking.
Max
Why is it that every single time Dr Curry posts an article in any way challenging the orthodoxy then the same people wade in with remarks about why she did it rather than addressing the scientific substance of the article. I for one would be interested to hear a technical explanation for why these 2 papers should be debunked but I suspect that most of the posters attacking Dr Curry’s motives lack the scientific knowledge to make any kind of critique based on anything other than politics and their own bias.
RobB, this is a good question, though it’s important to remember there have been comments regarding the “scientific substance.” You can see one from Fred Moolten, and another from Bart Verheggen. Neither disproves the papers, but both do offer reason to doubt the conclusions.
With that said, neither comment deals with the papers in any conclusive way. Indeed, they both ignore significant points from the papers. Look at the last three lines (bullet points) from the blog post:
At most, those two comments only deal with the first bullet point. The other two remain completely unaddressed. Despite this, at least one of the authors of those comments would tell you the papers aren’t worth discussing. Indeed, he would tell us the papers are:
I rather agree with you. There are some flatulent denizens of this blog who appear to think that they are the fount of all knowledge and everybody else is an ignorant prole. I would be much more impressed if stopped pontificating and they actually did some calculations.
Rob – I have rarely complained about the choice of articles, and despite my reservations, I’ve rarely complained the choice of guest posters. More often, I have defended Dr. Curry’s choices. However, this particular article is so unequivocally bad that it raises questions as to why its author was invited to guest post here. Even then, these are choices are hostess has the prerogative to make, and I would not have commented on the question of choice except for the fact that the article itself was discussed in detail one week ago and its flaws exposed. At that time, I didn’t complain that the article should not have been cited. Now, though, in the wake of that discussion, I can’t agree that there was any value in inviting the author to make a guest post.
I also see this as different from the SkyDragon threads. They went on too long, but because their views were already widely held in the blogosphere, it was important to discredit them – at least in the eyes of objective readers. This article, however, had no prominence, and is not going to gain any, and I therefore didn’t see a need to expose it as opposed to simply ignoring it.
This is still a matter of judgment, and I don’t want to complain too much about a process that has generally been useful, even if I disagree on this occasion.
“Further, both LU and LL use a new method [3], [4] which combines detrended fluctuation analysis (DFA), synthetic records, and Monte-Carlo simulation. Using this new method, the exceedance probability of the naturality of an observed temperature change is evaluated. Finally, LL derives the basic overall probability that the global warming of the 20th century was a natural 100-year fluctuation. The instrumental records applied by LU and LL are monthly means because the DFA requires a minimum of about 600 data points.”
That’s a lot of ‘new’ methods to absorb all at once. As with BEST and its intensive use of statistical manipulations, willing to wait a couple of years to hear out all the reviewers and critics.
Unlike BEST, however, find disturbingly little reason to place stock in a very tiny paleo study and a really small instrumental study whose claims to fame are hand-picked datasets and new ways of manipulating them that for both produce the same conclusion as the opinion of the patrons of the study.
BEST just uses bad data to confirm Mullers opinion.
Bruce
Looking at the record of Muller’s opinion as publicly stated before and after BEST, it appears BEST improved bad data to disconfirm Muller’s opinion, and he changed his opinion when faced with fact.
You should try it sometime.
Muller was never a skeptic and his data is bad.
http://climateaudit.org/2011/11/06/best-data-quality/
Bruce
Sounds like Muller gored your ox.
Our data is bad, of course. Muller’s. Mine. Yours. Everyone’s.
The instrumental record was never intended for climatology; it’s a haphazard lot of weather station accounting books improvised for the purpose by people who couldn’t afford to invent time travel and populate the planet with enough high quality climatology sites to provide purpose-built data back centuries.
And yet, the improvised dataset hacked together does meet the requirements of fit for some purposes in climate.
This can be seen in the statistical results obtained.
True, there are glitches, it would be impossible for there not to be on almost 40,000 sites over two centuries.
And heck, if you’ve never spent time in Colorado, you might find it unexpected to see a 50-degree one day temperature swing. I’ve heard a report once of a fellow saying the word “Clinton” in a bar in Colorado and the room plummeted by at least that much in a cold second. ;) Or was that Texas?
I’m glad people are finding questionable stations for BEST and making recommendations for ways to improve on BEST’s work, and think this crowdsourcing exercise worthwhile.
Doesn’t support your claims, however, that Muller’s warpaint doesn’t make him part of your tribe enough. If anything, Muller’s more of a skeptic than you come across as, Bruce.
He was never a skeptic. Ever.
“It is ironic if some people treat me as a traitor, since I was never a skeptic — only a scientific skeptic,” he said in a recent email exchange with The Huffington Post. “Some people called me a skeptic because in my best-seller ‘Physics for Future Presidents’ I had drawn attention to the numerous scientific errors in the movie ‘An Inconvenient Truth.’ But I never felt that pointing out mistakes qualified me to be called a climate skeptic.”
http://www.huffingtonpost.com/2011/11/03/its-science-not-skepticis_n_1072419.html
I don’t buy the plot Steve posted for Longmont/Boulder here. If you go to NNDC and look at the data for Boulder, CO you find that the minimum for the 1931 to 2009 period in the fall is -8 set in November 1993. This doesn’t square well with what Steve is saying in this post.
But his is typical of the McIntyre approach. Find something odd report it, and don’t investigate any further to see if possibly he is mistaken. BTW, I was unable to find a station called or similar to “Longmont” in the GHCN database or the USHCN database. Maybe it is in GSOD.
Found it, it is a Co op station, It shows 99.6% data coverage for the period in question (SON). Nothing seems odd about the reported temperature in the data summaries on the net. I don’t have time to download the data and look for problems. Something is fishy about this plot.
Been a station since 1893.
LONGMONT MUNI
http://www.ncdc.noaa.gov/oa/climate/rcsg/cdrom/ismcs/alphanum.html
Login is guest: https://mi3.ncdc.noaa.gov//mi3qry/search.cfm
Bruce
He’s a scientific skeptic, so he’s not good enough?
Wrong end of the telescope there.
He claims to be a scientific skeptic. But the BEST fiasco proves otherwise.
Rattus Norvegicus, your comment makes no sense. Steve McIntyre did not comment on the original data series. He commented on the data series found in the file BEST released to the public, pointing out it didn’t make sense. He used this example to indicate BEST’s process has a problem.
That he says there is a problem in BEST’s process is not contradicted by the fact the problem can be found in BEST’s data file, but not the original data. Indeed, that is the entire point. I don’t see what issue you could possibly be having with what he said.
But hey, feel free to make derogatory remarks rather than do something like, plot the same data and see if he got it right.
OK, I looked at the data in the BEST file and there are indeed some weird values in there. Unfortunately, the flags for the data are in another file which is corrupted in the archive (CRC check failed on extract) so I could not see what any flags associated with the data might be.
The sources file is also corrupt so I can’t trace where the data for this station came from, but the data does seem to differ from the monthly summaries I have been able to find on the internet.
One other thing. I strongly suspect that bad data such as this would not be used in the analysis if it differed strongly from nearby stations. The people who did this work are not dumb.
Bruce
You can’t possibly imagine I’m unfamiliar with fiasco, up close and personal.
BEST doesn’t rank in that category, I’m pretty sure.
It doesn’t even make the level of “a bit of a fiasco”.
It’s a really well done statistical project with a remarkably low detected error rate that’s been thrown open to the whole world to examine.
Sure, it uses a shoddy and ramshackle collection of raw data as its source, because that’s the data that exists.
Sure, it has huge holes for much of it, and huge holes of a different type for all of it, because for the most part that’s all the data allows; and also, BEST produces ten times more questions than it answers.. which counts in its favor as good science.
There are fifty other things a qualified serious team with infinite resources and time could meaningfully do on the dataset, some of them arguably more important or better than what BEST elected to do.
But Team BEST chose what it chose, supported its proposal to people willing to invest in the science, and produced results.
In America, if you have an issue with someone else’s results, you show it by going them one better with your own thing.
Anything on the scale of 1.5 billion distinct observations with a 95% CI related to climate, I’d love to see from you, Bruce. Go to it.
If one does a simple random walk experiment, using a monthly normal variate with SD 0.75 and a persistance time constant of beteen 24 and 50 months (both compatible with observed climate records), it surprising how many 40 year “trends” occur in a 200 year record (between 0.07 and 0.19). If a 1 degree/200 years is added, one can produce numerous “upticks” in the record.
I amnot saying that this is the full explanation of the temperature rise, but statistically, it is a reasonable model to explain some of the variability in the the temperature record. It could be argued that the whole approach of using Monte Carlo methods to model a purely determinstic(?) system is wrong, but if the some of the variabilty of the temperature record can be shown to be indistinguishable from a random walk, can we be certain of:
a) The accuracy of temperature estimation by other models
b) The attribution of relatively short term trends to anthropogenic forcings?
It is a pretty simple exercise. I suggest that the correspondents on this thread stop banging on about “credibity” and “motives” and do the sums themselves.
I am not entirely convinced by the arguments in these papers, but I don’t think that they should be dismissed out of hand.
Thanks for this comment. It basically summarizes my reaction to the papers. I don’t think they are correct to say there has been no global warming, but their approach deserves consideration. It makes no sense to dismiss the papers out-of-hand because they couldn’t be a 100% correct if them being 50% correct would be significant.
But random walk models violate the third law of thermodynamics, eventually anyway, with 100% certainty.
The third law of Thermodynamics, about absolute zero? This one:
“The entropy of a perfect crystal approaches zero as temperature approaches absolute zero.” ?
I think you mean the first: “The law states that energy can be transformed, i.e. changed from one form to another, but cannot be created nor destroyed. It is usually formulated by stating that the change in the internal energy of a system is equal to the amount of heat supplied to the system, minus the amount of work performed by the system on its surroundings.”
No, I meant the third, in that a random walk will eventually reach a negative value.
Bob has a good point.
I think this relates to the theory of martingale processes. Every random walk without some constraining behavior will eventually hit some limit if one waits long enough. The classic analogy is that every gambler will eventually go bankrupt. Another case is that every spatial random walker could eventually travel to an infinitely distant location, which would be a perpetual motion machine, and thus violate the 3rd Law.
In this case that Bob mentioned, the temperature excursions can go to zero or below, which is the concern of a purely statistical model with no awareness of constraints.
I agree with WHT, that there have to be constraints on the system and it depends on whether the system is closed or not. For example, modelling diffusion by a random walk does result in a physically sensible answer.
Ride the tornado,
Into the swirling maelstrom;
Shollenberger shows.
==============
I think this is the first time I’ve been the subject of one of your… pieces of work kim. I have no idea how to feel.
You’ve been”Haiku’d”. You should feel very spiritual.
The problem is I have no idea what it “means.” It looks like it should have some obvious meaning, but no matter how many times I read it, I come away puzzled.
I guess that’s kind of “spiritual.”
I believe you could liveblog a cat and dog fight.
=============
Oddly enough, I’ve actually never seen a cat and dog fight. Every time I’ve seen members of the two species around each other, they got along.
I think you’re right though. Growing up, one of my idols was the great (and now late) Andy Rooney. He convinced me there is no subject unworthy of attention. Because of that, I’ve long striven to be able to talk about anything, even if it means saying nothing at all.
“Ride the tornado into the swirling maelstrom” means “read and evaluate the papers technically.”
At least, that’s what it means to me.
MattStat, I like your interpretation.
Brandon –
With all due respect to the Kimster, what it may ‘mean’ is that your surname has four syllables.
If you look too closely, you will not see what’s there.
It amuses me how easily I could draw parallels between your comment here and religious arguments I’ve seen. I’m starting to think Richard Saumarez’s comment was quite apt.
Well usually it makes sense to keep the mystical in one place and reason in another. Methinks Kim sometimes finds a third.
If it’s troubling – move on!
Nothing gained and nothing lost?
Rose into the correanage.
=============
Take a shower. Use plenty of soap.
I sincerely thank Lüdecke, Link, and Ewert for the guest post here at Climate Etc.
Judith Curry posting it here provides the fundamentally real process of science to be engaged; an unobstructed open discourse. It is precious and should be expanded widely.
If there is a so-called climate science establishment, then it has definitely been engaged.
Now cut the ideological maneuvering and let’s actually look closely at the paper.
John
Well said John.
It isn’t complicated is it?
Good post, absolutely. But you won’t get it from the AGW faithful I’m afraid.
Barry Woods,
I see you’ve become the Twitter Monitor. I’d also welcome hearing Judith’s response to Richard Tol’s first comment, which as Barry kindly reports, has a blunter edge to it as a tweet.
Keith, this issue feeds into a blog post I was planning for this evening, stay tuned.
Why don’t you read the thread, you dope:
curryja | November 7, 2011 at 8:58 am |
If and when the paper is debunked, then we no longer need to talk about it. Have at it, that is what this thread is for.
None of the guest posts here have my stamp of approval in terms my agreement with what is stated. The only approval implied by a guest post is that I think this is an interesting topic worth discussing.
Well, maybe you need to add a prominent stamp.
Wait, is that a double-negative stamp?
Keith.. comments like ‘twitter monitor’ are not very helpful are they?
I was party to the conversation and involved in it, hardly monitoring it..
Richard made a public statement about Judith Curry, to all his followers. A conversation I was party to.. I gave the opportunity to say otherwise, that was a bit strong and ‘loaded’, he came back too reinforce it..
It perked your interest (as a journalist), Judith being accused of disinformation..
It was tweeted publically to many followers including journalists like yourself..
Why the snark to me? I would, believe it or not defend you in similar circumstances. As I have defended Richard Black at the BBC, against Joe Romm You may think of me as part of a ‘tribe’ but your own comments would seem to indicate you are unaware that you are in a ‘tribe’ as well.
Richard was also commenting here, less harshly..
Barry,
I’m shocked! Surely it has not escaped your notice that the rules of the game are quite different in Kloorland!
maybe i’m getting too sensitive – ‘twitter monitor’ and ‘kindly’..
or blogs are a poor means of communication.. and I’m just totally oversensitive to percieved slights’. I’m just getting really annoyed with the behaviour of so called professional adults (not this thread in itself, but generally) I have tried to engage with many people on all sides, most have been civil, polite, etc. the only problem is those who see thing through political tribal eyes and motivations, imho..
It is not about whose politics you support,. I would like to know more about climate science, I count a number of climate scientists as friends, and greens. I’m just fed up to death with the pettyness publically
It is important, so are climate policies, which are not a one wayy bet.. Alloverhyped, I do not know.. but I do know we could save 5 million children a year form dyeing from diseases of poverty. Maybe ‘Climate Change’ is more importatnt than that. I just want to be very sure.
Probably said to much in irritation now. Time to practice some reading with my seven year old.
Keith,
As a journalist do you feel threatened by mere civilians following what opinion leaders and promoters do and reporting on it?
Should there be something to prevent this kind of freelance communication?
I assume you are still OK with non-technical people following science and technical issues.
1. I think that the editor of a blog has the duty to check guest posts for quality.
2. The IJMP paper uses detrended fluctuation analysis to study trends, it uses the Hurst exponent to study trends, it uses a 100 year record to study centennial trends, and it uses a univariate analysis to test internal v external forcing. Those are four basic mistakes.
3. The E&E paper is not quite as bad: It uses 2000 years of data. This is still only 20 observations on centennial trends. DFA and Hurst are still the wrong methods. The paper shows that the statistical properties of the proxy record do not match those of the instrumental record; it can therefore not be used as a temperature proxy.
…….the statistical properties of the proxy record do not match those of the instrumental record; it can therefore not be used as a temperature proxy…….
You mean much like Briffa’s tree ring data?
Indeed. See McShane and Wyner. The proxy record does not contain much useful information.
Richard S. J. Tol,
Indeed, McShane and Wyner broadened the prospective on the problems of some papers on paleo temp reconstructions. But M&W did not, explicitly acknowledged by the authors themselves, have physical mechanisms evaluated.
With the 2 Lüdecke et al papers we have some interweaving of physical mechanisms and statistics. That is a very positive step forward in my view.
John
Richard, I’d be interested on your opinion of the whole hockey stick, “Mike’s Nature trick” genre of paleoclimate reconstructions. It seems as if you are saying Mann should be not taken seriously. I happen to agree with this.
The more serious question is if the proxy record does not contain much useful information, what does this say about the current Schmidt doctrine that the real authoritative source of high climate sensitivity is paleoclimate. It seems to me it implies that climate sensitivity is much less certain than usually asserted.
Funny post. Yet the AGW faithful use a puny warming period from 1975 to 1998 as the defacto indicator that the world is going into runnaway human caused global warming over the next 100 years. Hypocracy at it’s best, thanks Tol.
It’s even more ironic than that. The current AGW catastrophism emerged in about 1988, and was based on just 9 years of apparent warming. The most prominent clarion call was Hansen’s 1988 Congressional testimony.
AGW proponents do not actually disapprove of the use of short records, they disapprove of the use of records of any duration that do not show warming.
Richard S.J. Tol, you say the paper mistakenly “uses a 100 year record to study centennial trends.” Could you clarify this comment, especially in regards to how the methodology used does not support the conclusions reached?
If you want to know what is a typical change in temperature over a century, you need to observe at least 10 centuries but preferably more.
The IJMP paper has one data point only, one observation on centennial trends.
If I understand you correctly, you’re saying it is impossible to do attribution studies based upon temperature records of the last century. I assume this is not what you mean, yet I fail to see how this paper is any different in this regard than any other paper looking at warming in the last century.
@Brandon
These papers do not do attribution. They estimate long-term natural variability.
Richard S.J. Tol, apparently you and I are using different meanings for the word “attribution.” The paper’s abstract begins with:
To me, determining whether a rise in temperature is due to an actual trend or due to a natural fluctuation would qualify as “attribution.” However, if that is not the correct word, you are welcome to replace it with whatever word would be appropriate. In the meantime, would you answer a simple question:
If a century is too short a period for this paper to seek to determine whether the rise in temperatures over the last 100 years is due to a trend or natural fluctuations, how can other papers conclude the rise in temperature is too quick to be due to natural fluctuations?
@Brandon
From the 100 year record, one cannot conclude that the 100 year record is special or not. There is simply no information.
You can use the 100 year record to study the statistical relationship between greenhouse gases and temperatures. Most of these studies conclude that CO2 etc are an adequate explanation, but there are methodological doubts.
However, you cannot directly test CO2 against natural variability — at least not without a reasonable description of what that natural variability might be.
You need long-term proxies to estimate long-term natural variability, but unfortunately the proxies are not very good — although they do suggest that the observed warming is rare (but perhaps not exceptional). You could use models, but the models have been calibrated and biases may have been introduced — although there are plenty of check and balances that suggest that this is unlikely.
So, we have one hypothesis (CO2 etc) that cannot be rejected, and one hypothesis (natural variability) that seems implausible but cannot be tested. (We also have a number of hypotheses that were rejected).
I think that it is worse to wrongly assume natural variability than it is to wrongly assume the enhanced greenhouse effect. Others disagree.
Richard S.J. Tol, I’m content with that position. You’ve just said the rise in temperature over the last century could be due to natural variability, and we cannot show otherwise. This directly contradicts the IPCC, and the “consensus” in general. If you want to say the uncertainties are large enough one can justly believe global warming is not an issue one needs to take any actions over, I won’t argue with you.
Though for the record, given your position, the answer to my question was simple. All you had to say was, “Those other papers can’t do it either.”
If you want to predict the future 100 years of temperature, don’t you think you would need more than a mere 25 years we have any warming you can attribute to our CO2? Works both ways. Oh, but you have MODELS! Yeah, right…
The AGW is mostly based on a temperature record of about 30 years, and a partial mechanism. To complain of others that 100 years is too short is absurd.
The univariate problem you highlight is also shared by most AGW catastrophists. It will be addressed in subsequent publications now that these two have been published.
That is an interesting comment. The direct implication is that there is no way to determine whether an apparent 100 year warming trend is statistically significant. That implication has most often been stated by skeptics of AGW. You seem to be asserting that it confirms AGW.
my comment below belongs here.
That is an interesting comment. The direct implication is that there is no way to determine whether an apparent 100 year warming trend is statistically significant. That implication has most often been stated by skeptics of AGW. You seem to be asserting that it confirms AGW.
sorry everyone, I have unravelled.
My commentis suppose to follow
The Ludecke paper uses Monte Carlo statistics to demonstrate that if you use a 1st order lag in temperature simulations (which is the physical interpretation of the Hurst Exponent), you get trends in the reconstruction where no trends are present. This is well known and the values for the lag coefficient do not seem unreasonable.
Have I misunderstood this? Is any of the variability of the temperature record be attributed to this effect?
@Richard S
You are mixing up autocorrelation and long term memory. More importantly, you can’t estimate long term variability from short term data.
Yet we are told at every weather extreme occurrance that this is *proof* of AGW.
Your argument is rather self-defeating.
I think it’s even worse. Taken at face value, Richard S.J. Tol is saying we cannot speak to how large natural variability over the last century may have been based upon the modern temperature record because we don’t have enough data. He also says:
Perhaps I’ve missed something, but his position seems to require us accept basically the position of the very papers he’s criticizing, namely, that there isn’t evidence to show a significant anthropogenic contribution to the rise in temperatures over the last century.
Brandon,
I think the entire AGW social mania is running out of room in the corner they have painted themselves into.
Notice that they are making greater and greater hysteria over less and less significant data.
The standard MO is a declaration of authority, as the good Prof. Tol offers (check out his website, btw- this guy is the definition of connected), then to talk about how wicked those with whom they disagree are, and then we see, more and more, circular reasoning, a la Fred, or self defeating defenses, like Richard’s. and they do not even seem to to notice it.
I spar with creationists who have better arguments than the AGW believers posting here.
hunter, I don’t think your criticisms are appropriate in this case. Just look at Richard S.J. Tol’s comment here. He clearly states natural variability cannot be ruled out as the (main) explanation for the rise in temperatures over the last 100 years. That’s a far different position than most people on the “consensus side” advance.
The follow-up point he raises is also a valid point. He basically says he believes it would be better to reduce emissions than not because if humans are causing warming, not reducing emissions would be worse than if we do reduce emissions and find out global warming wasn’t such a big threat. It’s a debatable position involving various cost benefit analyses, but it’s one you can’t fault someone much for holding. It’s basically saying, “Maybe we aren’t causing this problem, but in case we are, we should address that possibility.”
“Yet we are told at every weather extreme occurrance that this is *proof* of AGW.”
I think you’ll find that the observed physical phenomena increasingly matching the predicted effects of AGW, with little to no natural observed forcings to explain them, are what are put forward as evidence of AGW. And no, you don’t need a tropospheric “hotspot” for that.
J. Bowers,
So what was the forcing for all the extreme weather events which occurred (long) before the industrial era?
I most certainly am not. Equation [2] defines the autocorrelation in terms of the Hurst exponent. The physical interpretation is quite clear in terms of autocorrelation and its interpretation either in the Z, s or complex frequency domains.
I agree that that if you are dealing with a periodic signal, you need a period longer than the fundamental frequency to estimate its components. If you describe a trend as linear, then quite clearly you cannot draw conclusions about its long term behaviour from a limited record.
The results are obtained by simulations of arbitrary length; the parameters are estimated from records of defined length.
@Richard S
Autocorrelation is exponential, long term memory is hyperbolic.
Classical estimators of autocorrelation yield misleading results for time series exhibiting the Hurst phenomenon with high H (approaching 1). From Koutsoyiannis 2003:
From “Climate change, the Hurst phenomenon, and hydrologic statistics”, Koutsoyiannis, Hydrological Sciences Journal 2003.
It would be informative to know which tests Dr Tol has applied to the autocorrelation to determine which type of persistence is appropriate, and whether it is possible he has fallen into the trap described above.
I think that we may be talking at cross purposes. The Hurst effect is a time scaling and is classically used to describe processes with different time scales. I think that the auto correlation function is a red herring in this although it is described in these terms. Personally I wouldn’t, but the the issue is, does lag produce trends?
What is important is the processes that transform the data. One can certainly postulate that there are short and long term process that have an influence on the the current observation. How one wishes to model this is somewhat arbitrary and if one is dealing with a number of processes, the ACF will not be an exponential. The time scaling transformation in the Hurst method is one way of expressing this but one can model the overall process with a distribution of first order processes, i.e. an ARMA model with a set of coefficients that reflect the time courses of the different processes.
Given real data, it is extremely difficult to identify the processes, because any parameter fitting exercise is extremely ill-conditioned. Nevertheless, we can obviously simulate the behaviour of the process and as the lags increase, trends occur, loosely speaking because the return of the observation to its mean or its overall trend is constrained by its past history. This can be interpreted in terms of the the effect on the power spectrum, which has been derived by Koutsoyiannis.
I do not believe that that the entire variability of the temperature record is due to this effect, but it may well contribute to it. It does however affect the statistical analysis since it decreases the number of degrees of freedom in the record, which cannot be estimated, naively, from the ACF.
Here is a very relevant example of an autocorrelation.
First of all, an autocorrelation in time can be considered as the probability that a certain event which occurs at time=0 will still be in effect at time=t.
So we take the case of a molecule of CO2 that has entered into the carbon cycle from a fossil fuel emission source. For small times, that probability will remain close to 1. At longer times that will reduce from 1, asymptotically trending toward a probability of 0 for long times. A value of 0 will indicate that the CO2 molecule has finally been sequestered.
Because the sequestering process is a random walk of a CO2 molecule to a sequestering site, the solution to the master equation will generate a 1/sqrt(t) profile. It actually looks like this
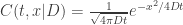
which from observation gives a Hurst exponent of 1/2, which is an ordinary (non-fractional) random walk.
This equation can be reduced (see http://theoilconundrum.blogspot.com/2011/09/derivation-of-maxent-diffusion-applied.html) to:

where you can see the autocorrelation fall-off more clearly.
This is essentially how one derives the adjustment time of CO2 within the carbon cycle, which matches the expected behavior from an organic geochemistry textbook:
http://1.bp.blogspot.com/-ygMmpK0ZK78/TrS7f0wvXsI/AAAAAAAAAlM/q200Zy40Ky0/s1600/IntroductionToOrganicGeochemistry.gif
Now one can see the difference between a power law autocorrelation and an exponentially damped autocorrelation. A good example of an exponentially damped aoutocorrelation is the residence time of methane in the atmosphere. This shows a constant probability of decomposition or breakdown of the molecule per unit of time, which leads to a thin-tail damped exponential. This is not a random walk but a first-order reaction law, with a Markovian correlation .
What does this have to do with the paper by Ludeke? I think quite a bit. I don’t see any kind of model for their interpretation of the data. They really should have some sort of model, even if it is a range of possible periodic movements in the temperature over time. They can then have a probability distribution which they can calculate an autocorrelation from and which will represent the natural variability. Without that they are groping in the dark, because a proposed model of AWG increase in temperature is available to evaluate against, and that model is the one that needs to be falsified. Unfortunately there are untold random movements that can match the 50 point data series we are dealing with and that is not enough to falsify the AGW trend that is probably there.
This is exactly the right discussion that should be happening but we need longer time series, as Professor Tol says, to dig out the true autocorrelations and the long-range order.
.
@WebHubbleTelescope.
I Agree.
I am not very interested in the autocorrelation, which is not a particularly useful measure in my view. There is no doubt that it is an incomplete measure to define what is going on. Modelling by a Hurst process is only one approach.
What we should be concentrating on is physical processes that underlie the observations, as you point out.
@Richard Tol
Thank you greatly for engaging here so civilly (genuine thanks). Yourself and an earlier poster (Chief Hydrologist CH, who sadly has now gone missing) have made reading this blog most worthwhile. I appreciate your honest succinctness – it is understandable, non-evasive and with ambiguities clearly pointed out
You are saying here that CO2 etc as the prime suspect cannot be rejected, but natural variability (however defined) cannot be tested – and both for the same reason, ie. lack of reliable long-term data
CH convinced me 70% that the inherent, non-linear random chaos of climate characteristics precludes reliable prediction
So we can’t figure out the why of what went before, or the why of what may be to come
At last, this has become truly interesting
The problem with all climatics from a statistical point of view is that we are dealing with one record only of a relatively short period and with questionable data in the early portion of the record. This confounds almost all techniques used to model the the process.
Brandon,
You make some good points and I thank you.
Here is the challenge:
If we obsess on CO2, the net impact on emissions as we see from the german example will be minimal.
If we put the same effort into cleaning coal, building nukes and developing gas we would be farther along than the we will ever get following the AGW policy demands.
I didn’t notice this comment earlier (I think it’s out of place), so sorry for the delayed response. However, my interest was only in making sure you didn’t give false criticisms, so discussing the validity of the various positions isn’t something I’m overly inclined to do.
With that said, I don’t necessarily disagree with you. I’m not convinced you are right about which “approach” would be better, but there does certainly seem to be sense in your position. As one example, I’ve stated elsewhere I think the world ought to be developing more nuclear reactors, and I don’t see any logical reason it isn’t. So while I’m not willing to say you’re right on everything about these approaches (I don’t know enough to judge), I think the approach you discuss deserves serious consideration.
It is much easier to demonstrate that heat ( from all our energy sources) is responsible for human impact on climate change than CO2.In 2008 50x10E16 BTUs was added to our environment whose atmosphere has a mass of 5.3x10E18 kilograms,resulting in a potential increase of 0.04*F per year. This heat was supplied mostly from fossil fuels, but nuclear and geothermal contribute also. The former emit CO2 which we measure and obsess over, the latter two are CO2 free. The Kyoto protocol did not address the impact of the heat generated by the fossil fuels (or any other power sources) and saddled us with a useful but totally inadequate criterion for stopping “climate change”. Because of this we have proposals for CO2 sequestration. The only worthwhile method of sequestration is through photosynthesis, which removes heat as well as CO2. It is not just the removal of CO2 as is being proposed by governments (such as ours) and private businesses, that will benefit the climate. Nor will advanced nuclear power, as advocated by Bill Gates and some physicists be a solution. Nuclear and geothermal actually add twice as much total heat as their electrical output. Further evidence that CO2 does not cause global warming can be found in examining the five temperature/CO2 cycles in the past 500,000 years. Temperature and CO2 rose together but temperature fell much faster, by decades and centuries, CO2 at those levels had no effect on maintaining higher temperatures. The heat source was “natural change” without human impact. The relation then was 0.20*F for each ppm change. That is five times what we experience now with the potential of 0.04*F per ppm CO2.
Wrong, this is a one shot deal and it does not accumulate like CO2 does. So it will only increase the next year by a percentage increase of our energy usage for the current year and not by the number you quote. It looks like you have corrected your mistake from earlier, but now you are trying to cover for it by doing this little trick. Pretty disgusting.
Richard Tol,
If and when AGW beleivers start weeding out the hyped and worse reports and papers so prevalent in the AGW community, and you are amongst those actively doing this, you do not need to pretend that you are some sort of authority in quality control.
@hunter
I’m a professor and an editor. I am an authority in quality control.
Then why aren’t you complaining about the abysmal Quality Control in the BEST data?
I am not a professor, but a Quality Engineer of over 30 years. Those results would not cut it for more than 20 seconds in Engineering.
I have yet to look at the BEST data. I read one paper, which is basically sound.
God you are arrogant!
I noticed your comments about the hoi polloi having access to computers and using packages they don’t understand. While I can sympathise with your point of view, I am not convinced that economists are authorities on signal processing.
Richard,
Just check out his the link his name will take you to.
How do you judge an authority of subject matter, then?
Richard
Care to comment on quality control in the use of GCM’s? What is the ability of the different models to forecast the different characteristics? As a person responsible for the quality of reports, isn’t it critical to know within what limits the models can perdict? Is it good quality or science to use models beyond their ability to estimate future conditions?
I see that my remark “I’m a professor and an editor. I am an authority in quality control.” is being misread. It should be taken literally: I have been authorized to judge the quality of my students (examination and qualification), the quality of other people’s students (qualification), the quality of my peers (promotion), and the quality of the papers (publication).
Many people think I’m arrogant, but this was just a statement of fact.
Richard S. J. Tol,
Respectfully, I suggest it just does not matter. What does matter are your very specific arguments against the two ‘Lüdecke et al’ papers (LL & LU).
Because you are indeed highly respected . . . . it is very important to not rely on any ‘authority’.
John
Richard S J Tol,
The only person who is misundertanding what you said is you.
And God have mercy on your students.
Richard,
I knew that.
Perhaps your reliance on claims of authority is another area worth a review?
Thank you for adding unintended irony to this thread.
With all due respect, Richard, a blog is not the same as a journal (as you know, no less an authority than the IPCC has recently decreed that blogposts are barred from being considered as acceptable source material!)
Personally, I think it’s rather bad form for anyone to tell someone else how they should be running their blog – but rest assured you are not the first to have done so!
In my view, here at Climate Etc., Judith has chosen the role of “publisher” rather than that of “editor”.
All of that being said, to the extent that all who comment here are also, in effect, “guest posters”, I believe that your suggested “duty” would place an very heavy – if not unworkable and intolerable – burden on our hostess.
What I don’t understand is why you would choose to broadcast – as you did via twitter – such a loaded and denigrating comment, rather than simply posting your critique of the papers here.
There has been a somewhat similar discussion over at Bishop Hill regarding the fallout from another (IMHO) ill-considered “tweet”. One commenter had observed [Nov 7, 2011 at 12:14 PM]:
I’m inclined to agree with him :-)
1. I think a blog is not a peer reviewed journal, and a good blog has regular turnover but few staff; quality control cannot be of the same order. IMHO I think you are too harsh here.
2. Whilst DFA and trend analysis would not be my first choice, why the big deal? Also, what is wrong with using the Hurst phenomenon as a model for background variability? A similar approach was adopted in Cohn and Lins 2005 (ref 1), do you share a similar view on this? It seems to me that Hurst-Kolmogorov dynamics provides a model that fits over multiple scales far better than any other model. A physical justification for the Hurst phenomenon can be found in Dr Koutsoyiannis’ recent paper published in Phisyca A (ref 2).
3. I agree with this – Hurst statistics from paleo proxies do not overlap with the instrumental record (and often do not overlap between reconstructions). This was discussed in Halley 2009 (ref 3). It shows the inadequacy of paleo reconstructions, although sadly Halley tried to argue the non-overlapping confidence intervals were evidence of AGW (hmmm).
Refs.
1. “Naturally Trendy”, Cohn and Lins, Geophysical Researtch Letters Vol. 32, L23402, 2005 doi:10.1029/2005GL024476
2. “Hurst-Kolmogorov dynamics as a result of extremal entropy production”, Koutsoyiannis, D., Physica A: Statistical Mechanics and its Applications, 390 (8), 1424–1432, 2011.
3. “Using models with long-term persistence to interpret the rapid increase of Earth’s temperature”, Halley JM, Physica A: Statistical Mechanics and its Applications 388 (12), 2492-2502, 2009. 2492-2502
Interesting at the beginning of the comments how the first instinct of so many was to shut the papers up rather than debunk them. It sure looks like a clash of paradigms; the paradigm of standing v.s. the paradigm of facts.
There’s an analog to this in law, and while the procedural issues are settled in most countries individually, the intellectual issue isn’t.
For LL paper they clearly wish to take the naked raw data as their basis to exclude all added value artifacts introduced by anyone.
For LL paper I suggest they are looking for what I will define as a set of all highly reliable long lived station records. I evaluate that they are looking to benchmark broader global average temp analyses against their set.
Their expectation appears reasonable to me for the LL paper.
John
So, they selected a set of records which are likely to be influenced by a UHI effect, made no attempt to filter it out, and, lo and behold, detected an effect. Stunning.
What does that say about temperature constructions where there is an attempt to filter out UHI and other changes in measurement conditions? Nothing.
Chris G,
I enjoy your engagement with me. Thank you.
I do not think you are correct about what the LL paper by Lüdecke et al says.
John
Chris –
But that IS interesting. You at least have to buy into others’ methods to “attempt to filter out UHI and other changes in measurement conditions” as correct, in order to dismiss the Mr. Obvious statement above without further analysis.
It’s been said by some commenters that studies like BEST show definitively that UHI doesn’t contaminate the temperature record. Yet in the core analysis they don’t attempt to filter it out, AFAIK. They did a side analysis that purports to show its insignificance, and maybe that will prove to be correct – but it seems odd: How does a known phenomenon – UHI – disappear in a record that should be long enough for it to show up, without adjustment?
Different sets of records, and different weighting.
For instance, it was said that they performed no gridding. OK, what do you think, are there more thermometers in an urban area or in a rural one? I’m going to guess a higher density per surface area in an urban area. If so, and if you don’t grid, you get a lot more measurements per square mile in an urban area than you do in a rural area. That weights the urban square miles more heavily than the rural square miles. That would amplify any UHI effect.
If you use gridding to weight the surface areas evenly, and you examine anomalies from a baseline rather than absolute temperature, the UHI disappears from a trend analysis.
Chris,
Thanks, I’m still not sure I understand your point.
I understand your gridding example above. Sure – there are more thermometers in urban areas, and if all we did was average out all the datapoints, without checking for spatial coverage, it seems we would spuriously amplify the UHI.
I don’t see that the reverse is necessarily true. If we have a long enough record in any area that has urbanized over time, we should see UHI in the trend at that location. In an area that has remained rural, we should not see it and the trend should be as “true” as it can be. With respect to the whole land surface of the earth, if we had a long enough temperature record with uniform spatial coverage, we would get UHI contamination of the magnitude % contaminated area * % of trend that is UHI in those areas.
Now, what % of the earth’s surface suffers from UHI? Maybe this is where the effect disappears, I don’t know.
I dont understand the use of gridding and then applying a temperature to an area. It can be 25C where I live, it’s half an hours drive to the closest station, London Airport. Yet when I see the temp on the news they are often either lower or higher than my location by several degrees.
Temperature at a station is just that, at that station. Extrapolating that to a wide geographic grid and expecting it to be a model of reality is unrealistic.
BillC, the temperature data is biased more to cites than country side. In Canada atleast. There used to be some 3500 station in Canada, peaking in the 1980s. Today there is a small percent of that many, mostly in or near cities. Open land temperature data is rare today.
@ Richard Wakefield,
I agree that temperature at the station is just that. The application to a grid, or kriging or whatever spatial interpolation is used, is the best we can do with what we’ve got, whether or not it is good enough is a different question.
However with respect to clustering of stations in urban areas, Chris was right and gridding, or kriging or whaterver – as long as there is a method of spatial interpolation – a surface-area weighted average, then the UHI problem is reduced to understanding the actual influence on trends at each station, and does not overrepresent the urban areas simply because there are more stations there.
Richard Wakefield,
IRT to the uselessness of the gridding format- you raise a very valid point:
The assumption that a single station can well represent an area of many sq. kilometers is one worth challenging.
Which raises the logical follow on question: are the highly processed largely synthesized numbers claimed to represent ‘global temperature’ accurate or informative to any extent?
BillC, it may be the best we’ve got, but inventing data out of an algorithm, aka thin air, seems to me to be unique in all the other sciences. The only way to know if such an extrapolation of temperatures is even close to accurate would need to be tested. Say an area 100km in size, with thermometers every sqr kilometer and let it run for a day, for every day of the year. One would also have to make sure the exact same hieght be maintained between them all (certain low areas can get below freezing at night, where as 100 meters away, and a few meters higher doesn’t freeze). One would also have to ensure there is nothing to impede the temperature, alter any breezes, etc. So they all measure the same thing at exactly the same time.
Has that been done? Would be interesting to see how much the temperature varies over the course of the days of each year inside a grid like that.
Then maybe some algorithm could be derived and applied to SOME areas. Of course a process like that done in the flat mid-west US could not be applied to the mountainous west coast.
Unique, eh? Do you realize that a GPS essentially generates a position from the indirect measure of the velocities of several satellites, initially completely buried in noise? This is an interpolation-based geoscience application conceived by scientists and engineers that are really no different in analytical skill level than the group of climate scientists.
You can keep making up all sorts of fanciful rationalizations as to why climate science is not up to some standard of your choosing, but you will fail each time. Bizarre.
BillC,
(Not sure if this will appear in sequence correctly; responding to your 1:09.)
The UHI signal would show up in those stations which changed from rural to urban over the course of the measurement time. What percentage that is, I don’t know either. But, I’ll take the separate works of NASA, BEST, and Watts that do not detect a UHI effect on the trend to mean that either they did a reasonably good job of filtering out stations where the conditions changed, or the effect was small enough to get lost in the wash.
Yeah my 1:09 is at the threading limit I think and thanks.
It seems the consensus even among the lukewarmers on this blog that the UHI effect is overall small. I haven’t seen it explicitly stated that “the effect was small enough to get lost in the wash” but that would have to be the conclusion, since BEST in particular does not filter out stations where the conditions changed, unless they were moved. It’s my understanding of the methods in BEST that a station which was not moved and did not show obvious trend breaks (such as might result from an undocumented move or a change in site microclimate such as a building built nextdoor) would go through the analysis unadjusted.
Sorry, to the point of the papers above: They used a method which is likely to amplify the UHI; so, saying they found one does not effectively counter the trends found by other groups which choose methods which do not amplify it.
By now you should be getting around to the reason why their paper would not likely have made it through a rigorous review.
Well, yes and no Chris.
Re-reading the post, they say: “During the period 1906-2005, the 1129 stations of 100 year duration show a mean 0.58 °C warming. About one quarter of all these stations show cooling. The mean reduces to 0.52 °C if stations with less than 1000 population only are included, which documents the UHI. Further evidence of the UHI is given in Figure 2. After all, the mean value of global warming reduces further to 0.41 °C if stations below 800 m above sea level only are allowed. Figure 3 depicts this effect, of which the cause is not known. ”
I’ll buy their own stipulation that UHI contributed on average about 10% of the warming trend to the stations they looked at. That’s related to the 20th century, during which possibly large amounts of the UHI in a lot of locations had already been established.
The attempt by some commenters on this thread to apply external gatekeeping on Judith’s e-salon is to me, personally, highly reminiscent of some publically revealed pre-AR4 attempts at gatekeeping.
John
So, at the executive level, what these papers are saying is that recent warming is part of a natural cycle, and CO2 has no appreciable effect on IR radiation. They have put out an estimate with a low amount of warming and attributed the bulk of it to some natural cycle. That doesn’t leave much warming to attribute to CO2; so, it is saying that CO2 has negligible effect. Given the general information available, that is an extraordinary claim, and…
Couple of quesitons:
a) Just one item from the real world, loss of arctic ice has made it possible to travel through an ice-free NW passage more often than not in recent years. If there is such a 100-year cycle that explains the bulk of recent warming, there should have been similar periods in the last 400 years. Is there any evidence of that?
In reality, there are cold water species showing up in the Atlantic just recently that have only existed if the Pacific for a long time. Less ice cover in the Arctic has made that possible.
b) Do the authors have access to a physics lab where they can demonstrate what Tyndale got so fundamentally wrong?
John W,
Get a clue; the global warming debate has been going on since Arrenhius published his work. The concept has ill-received at first, but has become the mainsteam. The debate has taken place in peer-reviewed and published works. A blog is not a way to engage in scientific debate in any meaningful way. It can be useful for education, but there are no checks to ensure that what appears on a blog has any relationship with the physical world. That makes it ill-suited for any meaningful debate on science.
Chris G, in regards to your point b), the authors seem to be saying only a marginal anthropogenic contribution cannot be ruled out. Could you describe how small “marginal” would have to be to justified your b)?
Sure. Using MODTRAN or the like, you can get a good estimate of what effect a doubling of CO2 should have, just counting it in isolation. That is in the range of 1.0 – 1.2 K. If you attribute less than that amount of warming to CO2, then you are below that threshold. Then the question becomes, are there feedbacks, and are they positive or negative on the whole.
The paleo record indicates they are positive.
Climate models that are any good at hindcasting indicate they are positive.
The globe has warmed by ~0.9 K during the same period that CO2 has increased by ~40%. That would also indicate that feedbacks are positive because most of the isolated effect of a doubling has already been observed with less than half of the in-isolation amount required to produce it.
If you will permit me to not get out a calculator and precisely say how much warming (in-isolation) is expected at this much CO2 increase on a logarithmic curve, I will not point out that the ice sheets and oceans take a while to warm up.
Chris G, I’m afraid you did not answer my question. I asked how small their “marginal” would have to be to justify your b). You said what the lowest limit for warming one could reasonably expect for a doubling of CO2, but this does not answer my question. An answer to my question would necessarily have been a fraction of the value you gave as I asked about the value for what we could expect now, not with a doubling of CO2. I’ll try again:
How small would “marginal” have to be to justified your b)? Please note we have only seen ~40% of a doubling of CO2, so you cannot simply give the minimum warming for a doubling of it.. Please also note it is commonly believed there is warming “in the pipeline,” so this would decrease the value you should give. Finally, please remember there are other greenhouse gases, so you are being extremely misleading when you say:
Not only is this misleading, it also grossly distorts the numbers. If one converts the strength of increase of the other greenhouse gases to the same scale as CO2, the increase in forcing is no longer ~40%. Instead, it is much higher. Given all these factors, how small could “marginal” be before the authors would need to “demonstrate what Tyndale got so fundamentally wrong”?
As for everything else you said, I’m well aware of that line of argument, and it has no relevance to what I asked.
Chris, Richard Toll disagrees and says that paleoclimate reconstructions offer minimal information. This throws into doubt the highly questionable estimates of sensitivity based on paleoclimate estimates.
Chris G,
Thank you for your comment.
The authority for your restrictive position on the value of this blog and its participants must be very pleased to hear your impassioned disclaimer. Or are you that authority?
Meanwhile, us lessor sentient creatures will quite independently persist and make up our own minds with or without your authorities; assuming the authorities can actually exist in the broader modern scientific process.
NOTE: I suggest your response is an illogical argument known as ‘begging the question’
John
a) Just one item from the real world, loss of arctic ice has made it possible to travel through an ice-free NW passage more often than not in recent years. If there is such a 100-year cycle that explains the bulk of recent warming, there should have been similar periods in the last 400 years.
b) Do the authors have access to a physics lab where they can demonstrate what Tyndale got so fundamentally wrong?
a. Not really. The previous 400 years had temperature records from the same distribution that the last 100 years was drawn from. The authors’ monte carlo study showed that 60% or so of such records have less warming than observed in the 20th century, only 40% had more.
b. Tyndale did not know how the atmosphere actually works: clouds, thermals, etc.
For Neven and anyone else who has a problem with discussing peer-reviewed papers before you dismiss them. All of the central cAGW folks now agree (although they all have their own pet theories) that there is a pause in the warming. Some say it was Chinese aerosols, some that it was ocean decadal oscillations, some just that 13 years is not enough, you need 17 years and that the heat is now going into the deep ocean. Much like Hansen a few years back magically declared that there had been a 50 year lag before the warming as the CO2 built up. Why is it that you believe this nonsense implicitly and are not more skeptical? It has only been a few months since a new phenomenon was observed by the folks at CERN that was previously unknown and scientists who said it might exist were ridiculed. Science is never settled. Look at the error bars in the IPCC reports on what is known about direct and indirect aerosol effects. And these are based only on known unknowns (before CERN). Why is it that now that there is a pause (one serious enough to be part of the Climategate discussions) we can’t take another 15 years and study this before we make up our minds? Why do people feel the need to publish papers within days of a skeptical one to try to contradict it? Is this how good science is done. Stop worrying so much about the planet being destroyed in 80 years. It’s not realistic.
From my own field of protein structure and folding kinetics, I have seen how different camps form, and how fads show up in the literature as everyone tries desperately to get grants and how political some of it gets. In this field where it really is right in the middle of major political issues, why would you just follow the standard fear-mongering methods and get drawn into the politics. Take a step back, take a deep breath, and look honestly at the error bars and then think about whether these error analyses even cover half the known sources of error. Let’s see what happens over the next 10-15 years and then, we will still have plenty of time to worry and take drastic action if it is really necessary.
Good comment
“Why is it that you believe this nonsense implicitly and are not more skeptical?”
Because I know enough about statistics to see the correctness of the argument, because I know enough about physics to see that both explanations are more plausible than some unnamed, undescribed force which would cause CO2 to change its physical characteristics.
“Why do people feel the need to publish papers within days of a skeptical one to try to contradict it? Is this how good science is done. ”
Well, a response time of days might be difficult to manage, but yes, publishing a counter to a paper that you feel has reached erroneous conclusions, and letting your peers decide, is how good science has been done for a some time. The scientific literature is littered with the debris of sometimes heated debates between conflicting models of how things work.
The world is full of plausible explanations for a millions of things that puzzle us. Most of them are wrong. Plausibility is not evidence.
The meta argument against CO2 is quite simple.
It got really warm during the MWP with no provable change in CO2.
It got really cold during the LIA with no provable change in CO2.
Currents temps (even contaminated with UHI) are well within the natural fluctuations of no-Co2 changes.
Bruce, it sounds like you are trying to enhance the stale old “if nature can cause warming, man can’t” logical fallacy.
That’s a strawman logical fallacy. It’s actually the stale old “if nature can cause warming, it can cause warming even if human emit CO2”. Yours is only brought up by the believers in CO2GW.
The only proven “made made” warming is the adjustments made by GISS et al to the data.
CO2-less warming and cooling has provably occurred.
Edim says:
“if nature can cause warming, it can cause warming even if human emit CO2″
If you mean “natural” and “man-made” global warming aren’t mutually exclusive, I would agree. But skeptics of “man-made” lack convincing explanations of how “natural” could have caused the warming that occurred in the latter part of the 20th Century.
“But skeptics of “man-made” lack convincing explanations of how “natural” could have caused the warming that occurred in the latter part of the 20th Century.”
We just assume it was the same mechanism as 1909 to 1943.
The slope was longer and steeper.
http://www.woodfortrees.org/plot/hadcrut3vgl/from:1909/to:2011/plot/hadcrut3vgl/from:1909/to:1943/trend/plot/hadcrut3vgl/from:1977/to:1998/trend/plot/hadcrut3vgl/from:1998/trend/plot/hadcrut3vgl/from:1943/to:1977/trend
Bruce, re your 7:17 post, after assuming the mechanisms were the same, the next step is finding evidence they were the same. That evidence, if it exists, is keeping itself well hidden.
“That evidence, if it exists, is keeping itself well hidden.”
Evidence? For natural variability? We don’t need evidence for the fact climate varies without man.
The patterns are identical. Slope. Flat. Repeat. Natural recovery from the LIA.
Chris G. Thanks for your response.
I too have a good understanding of physics, chemistry, biochemistry, kinetics and statistics. And I look at the uncertainties in this field and think it is too soon to say that we understand climate well and I urge caution lest we over-interpret any results in this field. Since most of the amplification comes from water vapor and is affected by clouds and other aerosols, I think we need to have a much better understanding of these before we panic. (Not that I think that you personally are urging us to panic). My comments were not so much about these two papers but about the attitude of both sides in general and the rush to judgement. I can understand it from some bloggers who are not scientists. But I don’t understand why scientists let themselves be drawn into such behavior. And rarely in the past has there been this rush to get something published the next week or call the newspapers the same afternoon. Let the scientific method work. This is not a mathematical proof that two groups have been working on for years. If one publishes and has a mistake, then of course the other will publish very quickly to show the error in the proof. This is not mathematics and I think that better science would result by waiting a few weeks. But that’s me.
Right there, in a nutshell, is the whole controversy. Two ostensibly qualified people look at the same evidence and see two completely different things. That alone should cause people to question whether it’s really as straightforward as the “it’s straightforward” side says it is.
Well, yes, but no.
Yes, if two sides of a debate are equally well represented.
But, the two sides of this debate are not equally well represented.
Arrennhius was, as far as I know, practically alone when he proposed that man could alter the climate with his CO2 emissions. There is no question of which side has become predominant in the last 100 years. To me, 100 years of research with one side starting as a tiny minority and becoming held by the vast majority is enough information to start making some decisions.
As I’ve said before, there is no such thing as absolute certainty when it comes to future events. Nevertheless, you are better off playing the long odds rather than the short.
It always comes back to Pascal’s betting, doesn’t it?
I think it is very telling when the 2 papers get the results that they do using GISS’s Mangled data.
What would they get with the Raw data.
Very Very Funny.
I see almost no mention of the fact that fossil fuels produce heat as well as CO2. It is my belief that the heat released from the energy sources we consume annually (nuclear and geothermal also) is much more significant than the CO2 in contributing to our share of temperature rise. In 2008 we added 50x10E16 BTUs to an environment whose atmosphere has a mass of 5.3 kilograms, enough to potentially raise the temperature by 0.17 *F. That the rise was only about 0.04*F was due to thermal lag and cooling effects from photosynthesis (which absorbs energy as it converts CO2 to trees), and from melting glaciers. In the previous 500,000 years, through five cycles of temperature/CO2 cycles, temperature fell faster than CO2, leading bu decades and centuries. Obviously CO2is not causing the temperature to rise.
This oughtta be interesting…
http://www.skepticalscience.com/waste-heat-global-warming.htm
Philip Haddad said:
I already crushed this cretin’s analysis when he posted it a few days ago:
http://judithcurry.com/2011/10/30/discussion-with-rich-muller/#comment-133157
From BillC’s reference, someone else already calculated this effect and they find :
I got 0.034 watts/m^2 as a global average by feeding in Haddad’s numbers and shoving it back in his face.
Where do these people come from?
WHT,
“Nearly all energy used for human purposes is dissipated as heat within Earth’s land–atmosphere system. Thermal energy released from non-renewable sources is therefore a climate forcing term.”
Why did terms being used switch in mid-paragraph – from “all energy used for human purposes, to “non-renewables”?
I don’t know, ask the guy who wrote it. I do know that fossil fuels account for the vast majority of energy used.
Nuclear+Hydro+Wind+Solar = about 15% in the US.
Fine, no problem.
BTW, renewables with nuclear are the future, we should probably get used to it.
Coal is the present and the future. That is the legacy of environmentalists who hate all fossil fuels and nuclear pretty much equally. Therefore the logical result for China and India was to burn coal – the cheapest form of energy.
China burns 48% of the coal consumed (as of 2010) and more like 50% by now. Over 3.5x times as much as the USA.
Environmentalists condemned 100 million plus to death by banning DDT and now they are encouraging China and India and others to burn coal to get the biggest competitive advantage against their competitors.
And all the while the stupid greens fight to keep shale gas int he ground and fight to keep nuclear plants from even being planned.
So Bruce, you are angry about some mythical DDT ban that you claim killed 100 million people, but you are eager to push shale gas fracking which will poison drinking water and probably kill many people. Not consistent.
Correction: the future is low-grade coal, with very little anthracite coal, some bituminous, and lots of lignite, and perhaps peat moss when that depletes. And then we have to resort to The Olive Garden.
Anthracite is the highest grade and it is mainly found in Pennsylvania. This is what the production profile looks like:
http://1.bp.blogspot.com/-lUb_SCB9mLA/TcU83zC9-cI/AAAAAAAADY0/FMS-jJ6vvk8/s1600/coalPennsylvania.png
Can’t squeeze blood from a turnip.
Alaska has deposits according to http://theoildrum.com but we shall see.
Holly,
Are you merely ignorant about DDT or are you deliberately trying to mislead people?
http://en.wikipedia.org/wiki/DDT
And the same question needs to be answered regarding frakking?
Are you ignorant or lying?
http://www.popularmechanics.com/science/energy/coal-oil-gas/top-10-myths-about-natural-gas-drilling-6386593#fbIndex4
China’s coal consumption is running at 10% per annum increases. A doubling in 6 years or so. They have a lot of their own coal. And lots of countries to supply them with imports.
Holly, shale gas already produces 10% or more of US NG production.
Can you name one “victim” of fracking?
Hunter, read this part very carefully where it is called a myth:
http://en.wikipedia.org/wiki/DDT#Criticism_of_restrictions_on_DDT_use
See also these: http://scienceblogs.com/deltoid/ddt/
Deaths of people at fracking sites:
http://stateimpact.npr.org/texas/2011/10/31/the-hidden-danger-of-fracking/
deaths of cows from poisoned water:
http://www.water-contamination-from-shale.com/louisiana/louisiana-fracking-operations-suspect-in-cow-deaths/
hazards:
http://environment.about.com/od/healthenvironment/f/What-Is-Fracking-Hydrofracking-Or-Hydraulic-Fracturing.htm
Holly … yes, if you light fires near oil storage tanks, it is dangerous. But I asked for a specific case of death because of fracking.
And DDT was banned by the US. Which means any aid agency active in Africa would have followed that ban or it would have lost US funding.
http://en.wikipedia.org/wiki/DDT#Silent_Spring_and_the_U.S._ban
And that is just the tip of the iceberg. DDT controls malaria. Period. Banning it was genocide against Africans. I’m sure if it had benefited white people it wouldn’t have been banned.
Bruce,
Read you own source:
Indeed IRS (indoor residual spraying) for vector control continues to be used to this day. Widespread use of DDT for outdoor spraying gradually lost it’s effectiveness because of adaptation of mosquitoes to it, an all too predictable result.
Rattus, DDT is still grossly underused in Africa despite attempts to resurrect it.
100 million dead is not acceptable to normal people. Yet it is to fanatical greens.
One of the great lies of the IPCC is that malaria would move into the US and Europe becauseof global warming. In reality malaria used to be quite common until DDT came along.
“U.S. President Franklin D. Roosevelt signed a bill that created the TVA on May 18, 1933. The law gave the federal government a centralized body to control the Tennessee River’s potential for hydroelectric power and improve the land and waterways for development of the region. An organized and effective malaria control program stemmed from this new authority in the Tennessee River valley. Malaria affected 30 percent of the population in the region when the TVA was incorporated in 1933.“
Elimination of Malaria in the United States (1947 — 1951)
“The National Malaria Eradication Program was a cooperative undertaking by state and local health agencies of 13 southeastern states and the Communicable Disease Center of the U. S. Public Health Service, originally proposed by Dr. L. L. Williams. The program commenced operations on July 1, 1947. It consisted primarily of DDT application to the interior surfaces of rural homes or entire premises in counties where malaria was reported to have been prevalent in recent years. By the end of 1949, more than 4,650,000 house spray applications had been made. It also included drainage, removal of mosquito breeding sites, and spraying (occasionally from aircrafts) of insecticides. Total elimination of transmission was slowly achieved. In 1949, the country was declared free of malaria as a significant public health problem.”
http://www.cdc.gov/malaria/about/history/elimination_us.html
Speaking of disinformation:
There are countries where DDT continued to be used for agricultural purposes as well as vector control, and where malaria increased regardless. Proper use of DDT requires carefully-controlled and well-funded systematic approach – attributes lacking in the countries where people are blaming a lack of usage of DDT for deaths due to malaria.
Please provide a well-resourced analysis that shows that a widespread indiscriminate usage of DDT for agricultural purposes (it was not banned for vector control) would not have had have deleterious effects due to increasing resistance (which was already noted prior to bans for agricultural usage). I’d absolutely love to read it.
http://www.malariasite.com/malaria/history_control.htm
http://www.malariapolicycenter.org/index.php/resources/a_history_of_malaria_in_the_united_states
Bruce,
You own quote shows that in the US the application of DDT was primarily via IRS.
They stopped doing IRS in Africa because of the ban. They killed 100 million people.
An effective ban because of “international pressure”, code words for environmentalists.
“DDT for disease vector control was never banned but international pressure restricted its implementation in malarious countries.”
“However, it was the development of Anopheline resistance to DDT that was primarily responsible for the dwindling political and financial support for the global campaign. The eradication period ended in 1969, and the eradication strategy was replaced by a longer-term disease control strategy as part of the growing primary healthcare movement of the 1970s.”
http://www.ajtmh.org/content/77/6_Suppl/249.full
Ya’ seriously gotta love this logic. First, Bruce speciously tries to over-emphasize the role of DDT in irradiation of malaria in the U.S.. Then, he ignores that there are counties that continued to over-use DDT for agricultural purposes (as well as for vector control), where prevalence rates for malaria remained high. He also ignores the implications of a spread of resistance had DDT usage continued in the highly irresponsible way that it had been used for agricultural purposes more widely. He also ignores the logistical difficulties inherent to proper DDT usage that would have made it impossible for the countries with increased malaria to use DDT properly without significant external involvement. Of course, he also ignores the availability of other effective measures for malaria control which were not utilized in lieu of DDT because a lack of funding (that would have been required to use DDT effectively).
I read Bruce make seemingly sophisticated arguments in the debate about climate science. Makes one wonder if they are similarly based on motivated reasoning as his arguments about DDT – whereby he uses a weak logic to point the finger at environmentalists for the death of millions.
How many bullet points of disinformation has Bruce managed to knock off in this thread along?
Joshua: “He also ignores the logistical difficulties inherent to proper DDT usage that would have made it impossible for the countries with increased malaria to use DDT properly without significant external involvement.”
Incorrect. I did not ignore it. In fact, it is my central point.
When non-African countries stopped supporting the use of DDT in Africa it condemned 100 million people to death.
“Malaria was effectively suppressed in subtropical and tropical areas of Asia, Latin America, and the Middle East.17 Notable among those efforts was the near eradication of malaria in India, where the annual number of malaria cases was reduced from an estimated 75 million to about 100,000 in the early 1960s.18 These reductions were not sustained after the eradication period because limited resources were devoted to malaria control.”
And why were resources limited? Because of the DDT ban. And because environmentalists wanted to kill people.
But look where the heat is created:
http://www.cgd.ucar.edu/tss/ahf/
This may explain why the weather stations in the NH are showing warming and SH is not.
And Keith Kloor feels obliged to ‘kindly’ spread Richard Tol’s opinion to all and sundry on twitter.. call me a ‘twitter monitor’ if you will..
https://twitter.com/#!/keithkloor/status/133598022587260928
Why would you do this… just to ‘innocently’ pass information on… who knows…
The Skydragons stuff was completely dissectected here, so why all the fuss about this.. maybe Richard is totally correct about these papers, we should let that be discussed and pulled to pieces.. it is only a blog which 99.9999% of the world have never heard of.. what irritates me is the behaviour of those.. just because it got mentioned on a blog of a climate scientist, to be discussed.
Keith isn’t Kloorious.
================
Thank you, JC, for bringing EIKE to my attention. I sent in a donation in support of their mission.
As I have lost my ability to type, and or produce gramaticaly correct sentence.. I’ll thing I’ll get a ‘non climate life’ for a little while..
Kyoto has failed, so will Durban, Rio had to get its dates changed otherwise world leaders would fail to show up, because it clashed with the Queens jubilee..
They still won’t show up..
China and India have been shown to have massivley increased their emissions, and will continue to do so, predominantly by burning lots of coal..
So, I do think the great catastrophic version of AGW is really on its last legs.. Hopefully the majority of climate scientists can get on with working out what might happen in the next 50 years, and a few advocates of catastrophy, rtire or get sidelined by embarrasment of their peers.. Bit of a rant… sorry Judy.
You cannot prove a negative, especially by statistics. LLE transparently claim to be able to do so: “Otherwise it is assessed as ‘natural’.” Enough time wasted.
A bit quick on the draw, Dr. N-G.
Dr. John N-G,
I have no doubt that the conclusions of the papers are over reaches. There is an interesting look at the data though being used. To me that more noticeable impact at higher altitude should be expected. More noticable CO2 impact should be noticeable in the minimum Tmin, temperatures than the mean of the Tmax. The ocean data should be more indicative of CO2 forcing that land.
As far as I can tell, no one or group has gotten the relationships right yet, So as long as data is accurate, question the methods and conclusion, but never overlook relationships that may reduce uncertainty, regardless of the source.
Dallas,
I interpret your 2nd through 4th sentences above as referring to 3 different effects you would expect to see w/r/t CO2 warming.
If that is correct, why is the more noticeable effect at higher altitude not noteworthy? 800m above sea level doesn’t get you into the upper troposphere by a long shot. So we shouldn’t be talking tropospheric amplification here – should we?
-Bill
When CO2 is mixed with a higher density of gases at temperature collisional transfer of energy reduces radiant transfer via emission to near zero. The air has a temperature, not a major radiant impact. As temperature and pressure decrease, the probability of CO2 emission increases. With decreasing competition with the radiant properties of water vapor, the probability increases as well. That is the reason that the poles, deserts and upper troposphere should show the greatest impacts due to a doubling of CO2.
As you may have noticed, only the northern hemisphere is following that game plan.
Since a Doubling of CO2 should interact mainly with outgoing long wave radiation, Tmin. would filter solar impacts of atmospheric change leaving the clearest signal of the impact of CO2 as a radiant feedback. So deciphering CO2 amidst solar fluctuation, conductive/convective and latent flux noise, is nearly an exercise in futility.
Yeah, I’m with you for the most part, however you say “That is the reason that the poles, deserts and upper troposphere should show the greatest impacts due to a doubling of CO2”. I have heard that explanation and I buy it as at least a partial mechanism.
Let’s take the upper tropospheric amplification. An increase in CO2 here, will absorb and re-radiate more longwave radiation than at the surface, because 1) less dense air means fewer collisions, giving the CO2 molecule a chance to spontaneously re-emit before it hits something and some of that vibrational energy is translated into kinetic energy or vibrational energy of some other molecule which can’t radiate at similar frequencies, and 2) there is less water vapor around to compete in the portions of the absorption spectrum which overlap.
So the increase in absorption and re-radiation is greater in the upper4 troposphere. With ya. See part 2 immediately below.
Part 2 – However, the additional absorption and re-radiation by CO2 doesn’t by itself mean that the upper troposphere will warm faster than the lower troposphere (my bald statement). To show that, you’d have to show that the net result of (absorption + collisions – re-emission) in the upper troposphere was greater than the net result of (less absorption + more collisions – less re-emission) in the lower troposphere. Is this in fact the case?
Fred Moolten has told me that the the upper tropospheric hot spot is due solely to latent heat release by condensing water vapor which is lofted higher than previously under warmer conditions below, tending to move the lapse rate away from the dry adiabat and closer to the moist adiabat.
So, I wonder – which is it?
The upper troposphere warming appears to be a bit more complex. CO2 emits isotropically, So CO2 and water vapor above the altitude of emission would amplify the downward component.
Water in the clouds tends to allow CO2 to become carbonic acid in an aquious solution. This changes the radiant properties and also cause rain out. So CO2 is not as well mixed as it would be otherwise due to water.
CO2 above lower level clouds tends to warm the water droplets creating additional upper layer convection which in general cool below and warm above as Fred mentioned. Unfortunately, convection is accompanied by cooler more dense air replacing the warmer rising air. This can create a latent loop similar to a heat pipe.
So there are a variety of effects in play. Since the sun also warms the clouds, Tmin just helps sort out the net of the combined effects.
I am excellent at starting things and never finishing,
http://ourhydrogeneconomy.blogspot.com/2011/10/another-shot-at-explaining-atmospheric.html
But that may be readable.
I tend to forget clouds. Anyway I bookmarked your page. This is connected to your thread over at Lucia’s right? Any resolution there?
Not at Lucia’s, though Dewitt Payne is playing with an experiment that may bring him around. The issue there is they don’t like the Kimoto equation, so I am doing the same thing with R and U values with nearly the same results. The modified Kimoto is much more powerful though because I can isolate Radiant into spectra, which is interesting.
Um make that 3rd-5th sentences.
Richard Tol tweeted that Dr. Curry is lending her authority to the articles she discusses on this blog. A moment’s reflection will reveal that Tol’s tweet is false. Dr. Curry has posted many an article to watch them torn to shreds. Dr. Curry always pursues her goal of promoting serious analysis and criticism of the articles she posts.
Let’s face it we’re all one comment away from embracing fascism and censorship. Some do it for the glory of Rome, others to protect the young and feeble, others to defend the purity of their science. Our best and only hope is to fight back by spreading information and especially when it is.marked as “disinformation”. It only has to be reasonable and if somebody deems it dangerous it’s his problem.
The LL paper has this gem:
“The method of [3], [4] that tackles this problem is based on the assumption that an observed real record has the following two constituents: a natural part, which is governed by autocorrelation; …”
I don’t think global temperature is “governed by autocorrelation”, it needs to be modeled based on physical processes.
In order to answer the question, how much of the latest warming is natural and how much is anthropogenic, we need an acceptable model of natural forcings and an acceptable model of antropogenic forcing for comparison.
The lack of attention paid to physical processes in some “pure statistical” analysis as well as the poor use of statistics in some physical analyses is interesting.
bob droege
Yeah. And we don’t have either one (as our host has pointed out).
Max
bob droege, I cannot make sense of your comment:
Presumably this would be a disagreement with the paper, but the paper never claims global temperature is “governed by autocorrelation.” It merely states one component of global temperature is “governed by autocorrelation,” a point I do not think is controversial. Autocorrelation in temperature records is well-established, and it can be demonstrated with very little effort.
Am I missing something about your comment?
I think that is exactly what the paper claims, in that it assumes x is the result of a + b, and then shows b to be false, thus concluding a.
What is the physical basis for the autocorrelation in the temperature record?
Newton’s law of cooling?
Well established but not the governing principle for global temperature, which must have a physical basis. Or a combination of many physical factors.
bob droege, this seems to be purely an issue of semantics, and if it is, I’ll step out after this comment. The paper said temperature has “a natural part, which is governed by autocorrelation.” You seem to be arguing this is wrong because autocorrelation is a mathematical idea, not a physical basis. That is a nonsensical argument. That one discusses autocorrelation as “governing” a trend does not mean one claims a mathematical construct is having physical influence on the world. Instead, it means there is some physical force (component, law, whatever) which is causing the trend to have a pattern described by autocorrelation. This is akin to me saying in a discussion of crime, “People are governed by laws.” Obviously the laws themselves do not govern anything; the enforcement of said laws does.
If I’ve misunderstood you, I apologize. If I haven’t misunderstood you, it seems you’re just being pedantic.
The physical basis for autocorrelation is the ocean.
Richard S.J. Tol “My professor of statistics used to curse microcomputers as they allowed anyone to do statistical analysis.”
Nice ad hom!
Martin A,
I see his confession as more of something to pity and see as a cautionary tale than as something of any importance.
Fred Moolten
You wrote: “Ocean heat content and temperature increased in a consistent fashion over that interval, with short term ups and downs as punctuation. This can only be the result of net heating of the climate system from a forced imbalance at the TOA.”
Two comments:
1) I think you will find that the measured ocean heat content decreased in the 1980s. Not that short a period, and greenhouse gas forcing was increasing over the period. See, eg, Levitus’s papers. On your arguments, shouldn’t that have been impossible?
2) Long unforced pre-industrial AO-GCM control runs show substantial long run changes in ocean heat content. One I looked at (mean temperature for 0-3000m depth) trends down for over five thousand years with the ‘trend’ fluctuating substantially on a centennial scale, before stabilising.
Nic – The progressive rise in http://www.nodc.noaa.gov/OC5/3M_HEAT_CONTENT/ ocean heat content was punctuated by bumps and dips, but its long term upward trajectory to add 10^23 joules is clear, and is inconsistent in a quantitative sense with unforced “non-deterministic” fluctuations described in the paper. The bumps and dips don’t contradict a long term greenhouse gas effect, because other short term factors are always operating over these time intervals.
However, you’ve suggested that AO-GCM control runs could do something similar in the absence of any forcing, if I understand you correctly. If you provide a source of information on that point, I would like to review it. The issue is not fluctuation per se, but an unforced progressive addition of 10^23 joules over a 50 year interval.
With the proviso that no paper is perfect, these two papers look solid. Sadly, I won’t have time to master them before this thread goes moribund.
Thank you Dr. Curry for supporting this guest post, and thanks to the authors for their work, and for providing links to the papers.
There are all sorts of weaknesses in this paper. Three major things leap out though:
1) their station selection is heavily biased towards a very narrow latitude zone. How representative therefore is their sample? It would be good to see a map of the stations colour coded according to their later breakdown in the tables (A1-A7 etc).
2) The statistical analysis produces an entirely unsurprising result. If you select individual station records you are almost certain to see a larger proportion of natural variability relative to a more modest (at the local level) anthropogenic trend. Detection and attribution is not often attempted at the gridbox level for that very reason. All they have shown is that the probability of getting a particular trend predicated upon a particular statistical model is greater than some threshold. This is not the same as the probability that their model is correct or any other interesting truth about the world.
3) their ‘urban’ classification scheme lacks finesse and they haven’t controlled for the varying geographical coverage of the stations (or even shown it) so it’s impossible to evaluate their analysis on this count.
The level of anger on the part of the warmists is telling. “Spreading disinformation?” How silly that is. You’ve watched too many spy thrillers. The word in this context is laughable.
dis·in·for·ma·tion (ds-nfr-mshn)
n. “Deliberately misleading information announced publicly or leaked by a government or especially by an intelligence agency in order to influence public opinion or the government in another nation.”
And what part of Judith’s statement to the effect that the appearance of a guest post on this in no way implies her endorsement, is unclear?
Meanwhile, in between these paroxysms of paranoid righteous indignation, it’s perfectly fine for you guys to attribute every weather even imaginable to CO2… without the slightest bit of actual proof.
An interesting debate here.
Compare & contrast with debate over at Climate Audit.
Steve Mc, puts up a post, shows his staistical interpretation of something.
Loads of formulae (Of which I understand little), others contribute with other formulae, to support/object to what he’s posted.
I am pleased to see that Dr Tol, is prepared to condemn the treatment of McIntyre & McKitrick at the hands of his fellow climateers.
Here, we get the objectors, come up with at best (Dr Tol) comments that the stats aren’t right, no attempt to show where they’re wrong.
You say they’re erroneous, show us where, support your allegations with evidence.
We then get objections to the paper based upon the authors, the journals, anything apart from a demonstration of where they are going wrong.
Let’s look at these types of objections in more depth and cross-reference to the Climategate e-mails, where applicable.
With stats, I believe that anything is provable. Looking at Wm Brigg’s blog, shows a different interpretation of the stats from BEST, compared to Grant Foster’s over at “Open Mind”.
The journals.
Climategate opened a lovely window into the way heresies are dealt with when there’s a chance they’ll appear in print. The gatekeepers leap into action, threats to blacklist journals are made, efforts to ensure that “on-message” revuers are appointed to block publication are made.
Some journals cave in, these are then promoted as paragons of virtue and anything appearing in other journals, is denounced as being so sub standard, that these virtuous journals won’t publish it.
Instructions go out to the faithful, that such and such a paper is being published, all must state that it’s without merit, completely false, erroneous and positively fefamatory.
The authors.
They are funded by some nefarious organisation or other, are politically biased, I’m quite surprised that they’ve not been denounced as homophobic, racist peaedophiles.
The attitude of the government supported climate industry is clear. Prevent anything that questions the CAGW hypothesis from being published, if it is published, immediately try to marginalise it, prevent it from appearing in IPCC publications, certainly their Summary for Policy Makers, the Lead Authors can just scribble “Noted” against it, they can threaten to bar any contributors from further participation if they persists in asking awkward questions.
Now, tell me again, why I should trust you Dr Tol?
You should not trust me or anyone.
My critique is given above: Wrong methods, wrong data.
Richard,
And we don’t.
Dr Curry, when can we expect you to give EIKE the skydragon treatment? I saw that when you published the first part of the Greenhouse Dragon series you wrote in your intro that you had a rebuttal in mind, which already sets the tone as to the validity of the dragonslayer’s arguments.
This time with EIKE, however, you just place the guest blog as is without any commentary whatsoever. I don’t think it would’ve taken long for top notch scientist like you to read through the papers and immediately notice some of the glaring errors that have already been brought up by several commenters on this thread.
I would have minded much less if you had written some sort of an intro stating that this was coming from EIKE (a European think tank affiliated with Marc Morano’s CFACT), that it hadn’t been published in reputable journals, had a few errors, but was still interesting to discuss. That would have made you look less complicit in spreading disinformation.
And I say complicit because I had already warned you about EIKE and Frank Moolten explained why the paper was weak in a previous thread. But you published it anyway, without any commentary.
The only thing I can hope for is that you publicly give EIKE the skydragon treatment, but given the way you’ve been bobbing and weaving after the Daily Mail misrepresentation(?)…
I thought you were storming out , having thrown you toys out of the pram , what’s the problem can’t find the door?
Neven,
Would you like some brie with that whine?
You really don’t like it when someone questions your mistress, do you? Protect your princess, dragonslayers!
I’m sure JC would be quick to affirm she’s no friend to the sky dragon slayers.
Neven,
You really are not up to speed.
I have never supported the dragonslayers. I think the book is crap, and that they have distracted from the actual skeptic critique.
But if I was crashing and burning like you are, and could not admit to being a wee bit wound up, I would flail around for something else to talk about as well.
As to your mistress innuendo, if this was not a virtual party you would be gently and politely invited to leave right about now.
Neven,
You know , Neven, ol’ buddy I’ve been trying to figure you out. For a while there I was thinking your game was to toss out provocative comments in the hopes someone would take a verbal swing at you and provide you with the pretext you needed to then launch one of your famous, hair-trigger, leg-humping, twitter-twit, victim-act routines.
But, Neven, as I’ve considered further your doofus clownishness on this thread, I’ve arrived at a different opinion. I mean, there’s your highly-charged, vaguely sexual words and images aimed at Dr. Curry. And then there’s your “Delinquent Teenager” beef with old, chauvinistic, dominant men (hey! that’s between you are your Dad, Neven–I don’t even want to go there). And, of course, we can’t overlook your compulsive need to play the victim. So putting all that together, my current estimate of you, Neven, is that you are sincerely and without guile a seriously disturbed, unwholesome weirdo. Which means you fit right in with those other greenshirt creeps you hang out with–right, Neven?
I’m really tempted to insert some utoobage of Nevin R. Johnson. Nevin, Navin, whatever.
Professor Tol writes: “I’m a professor and an editor. I am an authority in quality control.”
I’m not an authority on anything much, but I can surely recognize arrogance when I see it.
Pokerguy
I used to play full time high stakes and had a place at the Jockey Club in Vegas. Do you play in Vegas much? In Bobby’s Room?
Hey Rob,
Don’t get out to Vegas much. Last time happened to be over 9/11. I’d planned on 7 days which morphed into 2 weeks when they shut down the airports. Lack of flights notwithstanding, after a few days the strip became just about deserted…positively eerie to see that… but there were plenty of poker players at the Bellagio every night. Living in the Boston area, Foxwoods more my speed. Though these days I settle for a few hours online every morning. Getting old.
pokerguy, maybe RIchard was reaching for “committing high treason”, but settled for “spreading disinformation”.
Before I sign off for an early night:
Worth mentioning Andrew Montford’s update?
“Has the irony of Judith being criticised for posting a critique of a paper on which she is a co-author struck anyone?
It’s a mad, mad, mad, mad world.”
http://bishophill.squarespace.com/blog/2011/11/7/ludecke-et-al.html#comments
I am not overly well-read on science papers lately.
Especially, I am not deeply acquainted with recent papers on climatology.
Can anyone explain why I find these two papers so familiar-seeming, especially as they say they use new methods?
Aren’t there similar papers out there?
Whatever happened to Mosher?
C.M. “pokerguy, maybe RIchard was reaching for “committing high treason”, but settled for “spreading disinformation”.
Whatever the word C.M., it’s clear that having the temerity to post a peer reviewed paper for discussion qualifies as a grievous offense against humanity. I vote life in prison without the possibility for parole :-)
The warmista trolls have really climbed in (piled on?), haven’t they?
It must be, Dr Curry, that you’ve got under their skin. Purely by being fair (is that the right word?).
I thought a technical discussion was specifically requested. Do you want to contribute?
Seeing as most of the contributions by the said ‘warmista trolls’ (to coin a phrase) are singularly lacking in technical content, that request seems not to have been observed.
Somebody (over at Bishop Hill, IIRC) has noted that only 2 (maybe 3) comments on this thread contribute technically.
Oh, what a surprise! I studied the papers some time ago when the authors reported about them on their German skeptic blog EIKE. I had some questions, most of them being censored on their blog. One argument was, that the paper is peer reviewed, so there’s no need for any discussion. Regarding that their results are given without uncertainties or error margins, I would like to do some data analysis for myself. But take a look in paper #2: There’s no list of stations used. I made a request for the data, up to now no data, not even an answer.
So I ask here: Are values like transparancy, respecting other opinions and showing uncertainties only values for “AGW-science”? I admit, I’m a little disappointed to meet these guys just here at Judith’s blog.
Capo,
This does stink, don’t it. It’s part of the deniers’ big coordinated, well-funded effort to derail Durban. Well, with the exposure that Judith has given this trash and the piling on of the crap by smart boys like yourself, these crap papers won’t have any effect at all on the policy makers mindset as they enjoy their little well-funded junket. We have known for some time that Durban will be another fiasco. When are all of you good and very intelligent people going to start doing something about all this CO2? Are you going to let the Koch bros. stop you?
Durban, Koch brothers? You are sure, you intended to leave a reply on my post??
Capo,
Are you talking to me? Why do you ask that? Am I supposed to reply to your post in some particular way? You are taking reply literally. I just had a generic point to make and you happened to serve the purpose as an example of a generic impotent whining hypocrite.
“Warmista Trolls”??
If we have genuine scientific discussion that’s fine. But EIKE aren’t just claiming that the scientific case for dangerous AGW is exaggerated or even wrong. They say it is a “fraud”.
Fraud implies hoaxes and conspiracies. Any reputable scientist shouldn’t be giving a platform to those who pedal this sort of nonsense.
Temp, Overconfidence in the theory and emphatically calling for action now in the face of known uncertainty could be considered fraud. I doubt there is any true fraud as in falsifying data, but Stieg et al creating data where there was none, then being found out to be basically incompetent in creating the data could be construed as fraudulent, agenda driven, pick a suitable term.
As some other observers have noted, such behavior would not be tolerated in financial circles.
You are making libellous accusations against Stieg. Do you have evidence of this? Does Dr. Curry condone this kind of false accusation by dallas or any other commenter here?
Dallas,
EIKE are just a German version of the Heartland Institute. Their motivation in opposing the scientific consensus is political – driven by far right agenda.
“Today’s debate about global warming is essentially a debate about freedom. The environmentalists want to control every possible (and impossible) aspect of our lives.”
These are their words not mine.
We’ve all heard this sort of nonsense many times over. I’d just ask why would an environmentalist want to restrict CO2 emissions just for the sake it? There are lots of environmental battles to fight. Deforestation, pollution of all kinds. Why would it make any sense to just make up a new one?
Anyone who thinks like this must have rocks in their head. Any attempt at a rational scientific discussion is just a waste of time.
Judith used to know all this when she was in a previous personality a few years ago. Its a pity she can’t talk to her old self.
Temp,
From what I heard in Germany they were seriously considering suspending democracy to combat climate change. Totally different world over there. If were German I would be pulling the gloves off too.
That doesn’t mean that the papers are without merit. They may have more merit because of the authors perceived urgency.
I will let the stats guys figure out if the paper is seriously flawed, but more regional and altitude sensitive studies I am all for.
In fact, UHI should be used to evaluate local CO2 feedback. There is a lot of relevant data smoothed and adjusted away which should really be better clues to the total anthropogenic impact.
tt
You berate our host here with:
I did not see any mention of “fraud” in either of the two papers posted here.
Did you? (Or are you simply bloviating?)
If so, where was this?
Max
Judith,
Since it was pointed out that these papers were NOT published in what would normally be considered reputable papers for climate science, and that there are obvious errors (Dikran Marsupial http://judithcurry.com/2011/11/07/two-new-papers-vs-best/#comment-134473) that bring into question the author’s basic understanding of the carbon cycle, shouldn’t these points be added to your introduction?
Is there a reason you would want readers to be misled into thinking this is sound science? Did you read the papers yourself and did you catch the errors?
Kevin O’Neill, you need to read more carefully. You just conflated two totally disparate issues. The “obvious errors” you reference Dikran Marsupial pointing out are not errors in either paper by the authors of this guest post. Dikran Marsupial was talking about some completely other paper. The paper he discussed was only brought up to be an example of what one can find in that particular journal.
You have, effectively, just made up an issue out of thin air. Given this, the questions you ask of our blog host are just silly.
Leaving aside attribution, I thought the data was interesting. Particularly the proxy paper that avoids “Mike’s nature trick.”.
By the way, Richard Toll, would it be disinformation to allow Mike Mann a guest post here or on Real Climate?
I know jack about all this stuff and don’t ever comment because I’m way out of my depth, but I wish y’all’d respond to the arguments these two nutters made rather than attack Ms. Curry for letting them post. I’m ignorant and need to be helped with argument. So, please do so.
Ludecke mentions exceedance probabilities in the paper. I have recently been doing this against the Vostok data. Look at the bottom of the page: http://theoilconundrum.blogspot.com/2011/10/vostok-ice-cores.html and this figure:
http://4.bp.blogspot.com/-k1vYjQ8Qthk/TqdulOhrSEI/AAAAAAAAAko/0H9kUnzIcZs/s1600/vostok_temperature_changes.gif
Ludecke hasn’t come close to evaluating large temperature changes and how they can determine the probability of a temperature change exceeding the historical record, as for example is available from the Vostok data. If it is not a random walk change, then that change is model specific. I think what needs to be done is generate exceedance plots (or my cumulative plots) for various time scales.
The Vostok shows multi-scale effects in that the probability plots look different at different time scales. For example, at the 1500 year scale, an asymmetry clearly shows up:
http://4.bp.blogspot.com/-4M-c3jfB5Ng/TqdukApaX6I/AAAAAAAAAkY/P4yhIc6ZaDA/s1600/vostock_ice_temp_change.gif
which describes a preference for faster warming than cooling, with an average zero temperature change over several hundred thousand years.
My suggestion is that Ludecke apply their analysis on other longer term historical records. The effects on the Vostok are big so they should be able to explain this if their approach holds some generality. If it can’t they should be able to explain why not.
The authors are being critical of global records as a tool for global temp study and offering that using global records yields unrealistically small standard deviations.
Then the paper discusses a physical characteristic of earth surface temp data, persistence.
Coupled with the author’s target of using raw data, I think we have some refreshing new perspective to think about.
John
The problem with using raw data for stations going back 250 years is that it’s almost certainly wrong: http://meetingorganizer.copernicus.org/EGU2009/EGU2009-3117.pdf.
Paul S,
Appreciate your comment.
If using raw data is a problem, where does ‘non-raw’ data come from; people aren’t just making ‘non-raw’ data up are they? One should critically look at the raw data to see what it is telling you in all respects. Appears like a good approach for a novel view.
Another thing about the papers, they are relatively readable.
Look forward to continue our dialog as I take pieces of LL at a time to comment on. Then the same with LU paper.
John
John,
‘Non-raw’ data is produced by taking raw data and applying corrections to account for known sources of change or flux which aren’t relevant in the context. Whether you want to account for certain biases is of course dependent on what you want to investigate.
As an example from a different field of observational data, sea level changes are generally corrected for glacial rebound: land gradually ‘popping’ up after being pushed down when they were covered with glaciers. This correction is applied because what we generally want to know is the change in the volume of the oceans, rather than it’s relative height compared to land. If, however, you want to know the change in relative sea level of an area then you wouldn’t apply the correction.
Likewise, if you simply want a time series which shows the effect of changing the time of day when measurements are taken you don’t need to apply all the corrections in the link. If you want your time series to be representative of real temperature changes in the local area then making such corrections is important.
Paul S,
LL paper by ‘Lüdecke et al’ taking the raw data as a starting point is a great concept from a qualitiy control point of view.
John
Paul S
Yeah. But that’s also true for the SST record in general, the later land record when stations have been shifted, when stations are poorly sited or shut down, when urbanization occurs around stations and when blanks are arbitrarily filled in. All this prior to homogenization and ex post facto re-adjustments.
But, hey, it’s the BEST we have.
Max
No, in this case it’s not the best we have. The link I provided clearly refers to specific technical biases in the records and a quantitative means of correction. The authors have completely ignored this even though it would fundamentally affect their key conclusions.
Paul S
The “BEST” we have was intended as a pun.
But, seriously, it is clear that ALL of the temperature data suffer from some problems, many of which have been specifically identified (as you did for the pre-1850 record used in the cited study) and others, which are still of unknown impact.
Once we start using “expert judgment” to “adjust” raw data we are entering a new world of virtual data. This can be a slippery slope. If we carry this far enough we end up in a wholly virtual world, which no longer has much to do with the actual physical observations.
That was my point.
Max
I realise it was a pun, but clearly it was also your point.
Once we start using “expert judgment” to “adjust” raw data we are entering a new world of virtual data.
The corrections I linked are the result of experimentation to determine the bias introduced by changes in technology and methodology. Making corrections where there are clear errors introduced by measurement is an important part of dealing with observational data. Indeed, without these corrections the trends in the time series don’t have any connection to the temperature evolution at the site – it’s simply documentation of administrative and technological change at a weather station.
Bart V,
Just in case you get down this far, “REPLY: We identify and find support for a heretofore unrecognized mechanism that explains the growing divergence of trends in surface and lower tropospheric temperatures. We believe that our explanation is more parsimonious that the overlapping error bars approach of the CCSP accepted by the IPCC.”
From, http://rogerpielkejr.blogspot.com/2009/08/exchange-with-gavin-schmidt-on.html
This is also being hashed out at Climateaudit. These observations are surprisingly similar to my silly thermodynamics approach using a surface frame of reference and simple Atmospheric R and U values.
http://redneckphysics.blogspot.com/2011/11/atmospheric-r-values.html
You may note the similarity of R values, which include all thermal flux, to Planck response values with various assumptions applied.
M. carey, At least, cars and aeroplanes serve a more useful purpose than to generate derisory amounts of power.
As for killing people, why don’t you check the stats for preventable deaths caused by accidents in the home, as well as those caused by lack of hygiene etc in hospitals.
Or, more to the point, premature deaths brought on by cold weather and insufficient heating in winter.
Climate history seems to be repeating itself, once there was science, then came climate gate and like this furphy, now taking its Tol in terms of tarnished authority and loss of respect. Best to take careful aim and avoid shooting oneself in the foot!
The LL paper by ‘Lüdecke et al’ uses an approach that has a reasonable basis and respect in hydrology. It looks applicable to climate temperature times series under the conditions (constraints) that the authors of LL have applied.
John
Can anyone convince me that these two statements are not contradictory?
From the first paper:
“In the instrumental records, the steepest 100-year temperature fall
happened in the 19th century and the steepest rise in the 20th century,
both events being of about the same magnitude.
Evaluation by the detrended fluctuation analysis (DFA) yields Hurst exponents that are in good agreement with the literature. DFA, Monte Carlo simulations, and
synthetic records reveal that both 100-year events have too small probabilities
to be natural fluctuations and, therefore, were caused by external
trends.”
And in the second paper:
“We evaluated – with a con dence interval of 95% – the probability
that the observed global warming from 1906 to 2005 was a natural
fluctuation as lying between 40% and 70%, depending on the station’s characteristics.
For the period of 1906 to 1955 the probabilities are arranged between 80%
and 90% and for 1956 to 2005 between 60% and 70%.”
So, does Ludecke contradict himself?
In the first paper (LU), “Long-Term Instrumental and Reconstructed Temperature Records Contradict Anthropogenic Global Warming”, a cooling is observed in the 1800’s, followed by a warming in the 1900’s. Along with the small number of stations presented, I am concerned with the readings shown from the late 1700’s through the 1800’s. Following citations mentioned in comments made earlier, I read “Revision and necessary correction of the long-term temperature series of Hohenpeissenberg, 1781-2006” by P. Winker (Theor. Appl. Climatol (2009) 98:259-268) doi://10.1007/s00704-009-0108-y.
This paper goes into great detail as to the known errors inherent in this data set (+0.5 R until at least 1878). The discussion raises reasonable questions as to the usefulness of uncorrected data from the Hohenpeissenberg observatory as well as other similar observatories, as I would assume they also used similar instruments which would be subject to similar error sources.
I do not see that Ludecke removed this bias from the datasets before analysis. It would be useful if this problem was addressed before any great stock was put on the records shown in the 1800’s. Has anyone found any papers detailing the thermometers and observational methods and practices at the other stations included in this paper?
Is it reasonable to look at the ending portions of Figure 2. shown in LU and ask if the slope of the temperature plots for all four stations show greater increases than the 100 year regressions? That is, if one applies 30 yr regressions, the similarity with the 1800’s would not be as clear.
Regarding Figure 3, please correct me if I am wrong in my interpretation, but it seems to indicate that the 100 year trends are increasing as time increases, while this figure tells little about more recent, short term (less than 100 year trend) changes. Particularly, I was looking at the portion of the curves above the zero line versus the portions below, rather than the number touching 2.
The mean reduces to 0.52 °C if stations with less than 1000 population only are included, which documents the UHI. Further evidence of the UHI is given in Figure 2.
This kind of analysis of UHI effects on mean temperature trends does not make sense at all.
To acquire any reliable information on the subject, you should plot temperature trends against log population density trends. If it is done, why not do it properly?
Interesting that LL paper finds a marked decrease in temperature rise if only stations below 800m msl are chosen. Even more interesting is they say the reason is unknown.
As I’ve said before when you find the right solution to something all the observations start making sense.
In a different thread on this blog not long ago I pointed out that the ocean surface does not don’t cool the same way the land surface does. Ocean surface cools primarily via evaporation whereas land cools by radiation. Greenhouse gases operate by absorbing upwelling radiation and reemitting a portion downward to the source. Latent heat of vaporization carried in evaporated water molecules is uneffected by greenhouse gases.
So we arrive at the tentative position that greenhouse effect is much greater over land surfaces than water surfaces. Then we consider the observations in light of this to determine if it makes sense or not.
In this case we consider what is different about stations above and below 800m mean sea level. One primary difference that leaps out immediately is that the closer a station is to sea level the closer it is likely to be to an ocean as continental interiors are generally at higher elevations than the coasts. So if greenhouse gases have markedly less effect over the ocean we would expect that land surfaces adjacent to ocean surfaces would experience some amelioration of the greenhouse effect due to this proximity.
See… everything makes sense once you hit on what’s really happening.
The paper also notes that southern hemisphere warming is markedly less than northern. Once again, if we examine this in consideration of GH effect being less over ocean surfaces and the fact that there is twice as much land in the northern hemisphere as in the southern, then once again we find rhyme and reason.
Thank you Dr. Curry for your consideration and grace in allowing people like me who lack appropriate credentials to speak and be heard.
Thanks for posting this. As a scientist and engineer, I appreciate the vital importance of maintaining a skeptical attitude towards interpreting data or accepting the conclusions (even results) of a study. Let a paper be tested, to see if it can withstand the test of time. Try to debunk it, etc. I only wish that the pundits calling for the debunking of this work here were equally discriminating with their own research (political agenda).
Heya i am for the primary time here. I found this board and I find It really helpful & it helped me out a lot. I’m hoping to present one thing again and help others such as you helped me.
It’s a shame you don’t have a donate button! I’d without a doubt donate to this brilliant blog! I guess for now i’ll settle
for book-marking and adding your RSS feed to my
Google account. I look forward to fresh updates and will share
this site with my Facebook group. Chat soon!
Pretty nice post. I just stumbled upon your blog and wanted to say that I have truly
enjoyed surfing around your blog posts. After all I will be subscribing to your
rss feed and I hope you write again very soon!
Neven | November 7, 2011 at 8:42 am |
“EIKE’s press secretary Horst-Joachim Lüdecke, a retired professor in fluid mechanics, …..”
This is notably incorrect. Horst-Joachim Lüdecke is a retired professor for informatics and operations research at the Hochschule fuer Technik und Wirtschaft of the German state Saarland. I found this information in an online notice of the HTW Saarland regarding the cooperation between the HTW and the Technical University Dresden, Germany (HTW-Online Ausgabe 32, Ausgabe November 2006). The information reads (in German):
Zum HTW-Autor Prof. Dr. H.-J. Lüdecke (Dipl.-Physiker):
Erstellung und Anwendung eines der ersten deutschen Druckstoßprogramme während seiner Industrietätigkeit in der BASF Ludwigshafen. Zahlreiche Fachveröffentlichungen über stationäre und
instationäre Rohrströmung und chemische Technik.
Seit 1975 Professor für Informatik und Operations Research an der Fachhochschule des Saarlandes, zuerst im Fachbereich GIS, später im Fachbereich WI.
Mitglied im Arbeitsausschuss “Druckstoßprobleme” des DVGW (Deutsche Vereinigung des Gas- und Wasserfaches e.V.) und Mitarbeit am DVGW-Regelwerk W 303 “Dynamische Druckänderungen in
Wasserversorgungsanlagen”.
Im Jahr 2005 Berufung als externes Gutachter-Mitglied in die Promotionskommission der technischen Universität Dresden (FB Bauingenieurwesen).
The HTW Saarland is a so-called Fachhochschule, comparable the best with four-years institutions
It is stated that he published numerous articles about stationary and non-stationary pipe flows, but, according to Anne-Wil Harzing’s Publish-or-Perish, his number of articles is really low, even in his original profession. The h-index amounts to h = 4, and the g-index to g = 8. The number of citations is 65.